An Analysis of Dairy Farmer Participation in Co-operatives ... · An Analysis of Dairy Farmer...
17
25 An Analysis of Dairy Farmer Participation in Co-operatives in the Northeast United States Sanjib Bhuyan Agricultural co-operatives play an important role in the economy of the United States. Some of the most well-known consumer brands are owned by farmer co-operatives, eg, Ocean Spray, Welch’s. Dairy production is a major agricultural enterprise in the Northeast US and most dairy farmers in this region rely on dairy co-operatives to market their milk. This study examines why some dairy farmers decide to sell their milk through co-operatives (this group is defined as ‘participants’) while some do not do so (this group is defined as ‘non-participants’). We also examine these groups to understand their key differences in terms of various characteristics, such as farm operation and management as well as farmers’ education and age. Finally, we identify and analyse the factors that impact dairy farm profitability for all dairy farmers and co-operative participants in the region. The study objectives were fulfilled by conducting various statistical and econometric analyses using the farm financial and operations data obtained from the United States Department of Agriculture (USDA). The results of this study are expected to benefit dairy producers, agricultural extension agents, co-operative management, educators and practitioners. 1. Introduction Dairy farming is an integral part of the farming community and economy in the Northeast, 1 once a bastion of dairy production in the country and now the most urbanised region boasting such cities as New York, Boston, Philadelphia, among others. Many dairy farms in this region are small (less than 50 cows in herd) and mid-size dairy farms (less than 100 cows in herd). 2 Depending on farm size and the price of raw milk, dairy farmers’ annual income may range from slightly above $30,000 to almost $500,000 (Samuelson, 2008). Given the high cost of land, labour, feed and pasture in the Northeast, many of the dairy farms in the Northeast are financially not viable and thus, are in a precarious position. Not surprisingly, the number of dairy farms has been declining gradually over the years while the average herd size, productivity, and production have been steadily increasing. Such decline is most prevalent in the dairy producing states in the Northeast (Miller and Blayney, 2006). In this context, dairy co-operatives in the region may play an important role in providing some solutions to the problem of the survival and prosperity of dairy farms in the Northeast. Solutions could be in the form of dairy co-operatives providing market access to dairy farmers in the region for both raw and value-added dairy products and by bargaining with milk processors in the region for a better fluid milk price, among others. Agricultural co-operatives may be able to play a vital role in the survival and prosperity of dairy farms in the Northeast because they play an important role in the agricultural economy of the United States. According to the latest co-operative statistics, there were 2,310 agricultural co-operatives (includes farmer, rancher, and fishery co-operatives) in 2010 in the US and these co-operatives showed a net business volume of $146.1 billion with a net income of $4.0 billion (USDA, 2011). According to this source, dairy co-operatives ranked third in terms of the number of co-operatives, fourth in terms of memberships (p3) and second in terms of gross revenue (p5-6) in 2010. The Northeast has a large share of dairy co-operatives (42 or over 30% of total dairy co-operatives in the US) with a membership of 7,200 and a gross business volume of $3.5 billion. 3 Some of the well-known dairy co-operatives in the region include the Dairylea Coop of Syracuse, New York, and the Central PA Milk Marketing Cooperative of Reedsville, Pennsylvania. Organic Valley, a nationally well-known organic dairy marketer out of LaFarge, Wisconsin, is a major player in the organic dairy sector in the Northeast and uses local dairy co-operatives as its agents. For farmer co-operatives to succeed in playing a key role in the food production-marketing chain, active participation by members and non-members is vital and integral (Hakelius, 1996; Journal of Co-operative Studies, 45:2, Autumn 2012: 25-41 ISSN 0961 5784
Transcript of An Analysis of Dairy Farmer Participation in Co-operatives ... · An Analysis of Dairy Farmer...

25
An Analysis of Dairy Farmer Participation in Co-operatives in the Northeast United StatesSanjib Bhuyan
Agricultural co-operatives play an important role in the economy of the United States. Some of the most well-known consumer brands are owned by farmer co-operatives, eg, Ocean Spray, Welch’s. Dairy production is a major agricultural enterprise in the Northeast US and most dairy farmers in this region rely on dairy co-operatives to market their milk. This study examines why some dairy farmers decide to sell their milk through co-operatives (this group is defined as ‘participants’) while some do not do so (this group is defined as ‘non-participants’). We also examine these groups to understand their key differences in terms of various characteristics, such as farm operation and management as well as farmers’ education and age. Finally, we identify and analyse the factors that impact dairy farm profitability for all dairy farmers and co-operative participants in the region. The study objectives were fulfilled by conducting various statistical and econometric analyses using the farm financial and operations data obtained from the United States Department of Agriculture (USDA). The results of this study are expected to benefit dairy producers, agricultural extension agents, co-operative management, educators and practitioners.
1. IntroductionDairy farming is an integral part of the farming community and economy in the Northeast,1 once a bastion of dairy production in the country and now the most urbanised region boasting such cities as New York, Boston, Philadelphia, among others. Many dairy farms in this region are small (less than 50 cows in herd) and mid-size dairy farms (less than 100 cows in herd).2 Depending on farm size and the price of raw milk, dairy farmers’ annual income may range from slightly above $30,000 to almost $500,000 (Samuelson, 2008). Given the high cost of land, labour, feed and pasture in the Northeast, many of the dairy farms in the Northeast are financially not viable and thus, are in a precarious position. Not surprisingly, the number of dairy farms has been declining gradually over the years while the average herd size, productivity, and production have been steadily increasing. Such decline is most prevalent in the dairy producing states in the Northeast (Miller and Blayney, 2006). In this context, dairy co-operatives in the region may play an important role in providing some solutions to the problem of the survival and prosperity of dairy farms in the Northeast. Solutions could be in the form of dairy co-operatives providing market access to dairy farmers in the region for both raw and value-added dairy products and by bargaining with milk processors in the region for a better fluid milk price, among others.
Agricultural co-operatives may be able to play a vital role in the survival and prosperity of dairy farms in the Northeast because they play an important role in the agricultural economy of the United States. According to the latest co-operative statistics, there were 2,310 agricultural co-operatives (includes farmer, rancher, and fishery co-operatives) in 2010 in the US and these co-operatives showed a net business volume of $146.1 billion with a net income of $4.0 billion (USDA, 2011). According to this source, dairy co-operatives ranked third in terms of the number of co-operatives, fourth in terms of memberships (p3) and second in terms of gross revenue (p5-6) in 2010. The Northeast has a large share of dairy co-operatives (42 or over 30% of total dairy co-operatives in the US) with a membership of 7,200 and a gross business volume of $3.5 billion.3 Some of the well-known dairy co-operatives in the region include the Dairylea Coop of Syracuse, New York, and the Central PA Milk Marketing Cooperative of Reedsville, Pennsylvania. Organic Valley, a nationally well-known organic dairy marketer out of LaFarge, Wisconsin, is a major player in the organic dairy sector in the Northeast and uses local dairy co-operatives as its agents.
For farmer co-operatives to succeed in playing a key role in the food production-marketing chain, active participation by members and non-members is vital and integral (Hakelius, 1996;
Journal of Co-operative Studies, 45:2, Autumn 2012: 25-41 ISSN 0961 5784

26
Bhuyan, 2007). Such participation by farmers may occur in various ways and is likely to be highly variable among farmers. For instance, some farmers who patronise a co-operative may not be members, some farmers may commit a large portion of their product to the co-operatives regardless of their membership, and patronage may vary by farm size. In addition, some farmer members may be active in holding offices and serving in various committees while others may stay away from such participation in their co-operative’s affairs.4 Past studies have established the necessity of farmer (member and non-member) participation for a co-operative’s success, however, it is not always clear whether participation in co-operatives benefits farmers. For instance, compared to non-participants (ie, those farmers who do not sell their products to co-operatives), do participants (ie, those farmers who sell their products to co-operatives) receive better price, are their farm operations more profitable, or do they make better farm management decisions compared to non-participants? What does influence farmers’ decisions to participate in co-operatives? These are some of the questions we want to examine here using the dairy sector in the Northeast United States.
The purpose of the study, therefore, is to: (i) examine if the characteristics of the Northeast dairy farmers who participate in dairy co-operatives to market their milk are different from the non-participants, (ii) to identify and analyse factors that influence dairy farmers’ decisions to participate, and (iii) to identify and analyse factors affecting the profitability of dairy farms in the Northeast United States, particularly those of the participants. Here we define participation in co-operatives narrowly as dairy farmers selling their raw milk to co-operatives. Various statistical techniques, such as means difference tests and multivariate regression analysis, including discrete choice modelling, are used to fulfill the study objectives.
We use farm level data from the 2005 Agricultural Resource Management Survey (ARMS) conducted by the Economic Research Service (ERS) and the National Agricultural Statistics Service (NASS) of the United States Department of Agriculture (USDA).5 This study is expected to provide a useful comparison between dairy co-operative participants and non-participants in the region. In addition, it is expected to identify factors that influence dairy farmers’ decisions to participate in co-operatives. Finally, this study will also provide information on the performance of dairy farms in the Northeast United States. Such information would benefit dairy farmers and co-operative managers in their decision making. In addition, such information will benefit agricultural extension agents in the region, as well as researchers and practitioners of co-operatives and dairy farming.
2. The Dairy Sector in the Northeast United StatesThe dairy sector is a major component of agricultural production in the Northeast. It accounted for slightly over 37% of total farm receipts for the region or $5.01 billion in 2007 (USDA, 2009a). Dairy farming ranked as the top source of farm income for New York (49.7% of total farm receipts), Pennsylvania (33.9%), Vermont (70.7%) and was the second most important source of farm income in Maine (17.6%), Connecticut (11.5%), New Hampshire (27.4%), and Rhode Island (5%). The Northeast had 16,709 dairy operations (defined as those operations with one or more milk cows) in 2007, representing about 24% of dairy operations in the country. The region was second only to the Lake States (Minnesota, Wisconsin, and Michigan) in terms of the number of dairy operations. Although there has been a “shift” of milk production from the Northeast and Midwest to the Western states, New York and Pennsylvania are still respectively ranked as third and fifth nationally in milk production (United States Census Bureau, 2010).
Following the national trend, the number of dairy farms and dairy cows has declined in this region. The number of dairy farms in the Northeast decreased from about 18,498 in 2002 to 16,709 in 2007, while the number of dairy cows declined from about 1.7 million in 2002 to slightly over 1.4 million during the same period (USDA, 2009a). While the number of farms and cows has decreased, Northeast dairy farm productivity has shown a marked increase over the years. Per-cow output increased substantially over the decade from 2000 to 2010 in the milk producing States in the region. For example, compared to 2000, milk production per milk cow
Journal of Co-operative Studies, 45:2, Autumn 2012: 25-41 ISSN 0961 5784
27
in 2011 averaged 20,071 pounds in New York (16.45% increase over 2000), 19,360 pounds in Pennsylvania (9.10% increase), 18,289 pounds in Vermont (8% increase), and 18,061 pounds in Maine (7% increase) (USDA, 2011a). Vermont and Maine numbers are believed to be lower due to relatively more organic cows in their dairy herds.
In terms of dairy pricing and policies, farmer advocacy groups contend that the federally determined base price for Class I milk does not reflect regional differences (NESAWG, 2007). Additionally, dairy farmers in the Northeast have a higher cost of production and are relatively small in size due to resource constraints, such as land availability, stricter environmental regulations, and other factors. In terms of the cost of production, the West enjoys a $4 per cwt cost advantage over the Northeast (McNew, 2000).6 On the revenue side, dairy farmers have experienced extremely volatile markets since 1990 due to the lowering of support prices. Since 2002, dairy prices have gone from extremely low prices in 2002-03 (Class III price of $8.57/cwt) to nearly $20/cwt in 2004, again dipping in 2006, soaring over $20/cwt in 2008 due to world milk powder prices and then dropping below $11/cwt in 2009, a level which is less than what farmers received 30 years ago (nominal price) (USDA, 2011a).
Similar to other parts of the country, the organic dairy sector has been growing steadily in the Northeast. According to the most recent data, in 2008 there were 249,766 certified organic milk cows in the country (235% rise since 2003) of which 63,279 (or 25.34%) were in the Northeast (USDA, 2011b). In the major dairy states of the Northeast, New York and Pennsylvania, each are estimated to have approximately 300-320 organic dairy farms, Vermont has approximately 200, and Maine has approximately 60 organic dairy farms (Pennsylvania Certified Organic, 2009; NOFA-NY, 2009; NOFA-VT, 2009).7
3. Research DesignUsing secondary data (details in a later section), we use both the means test and regression analysis to fulfill the study objectives. The means test is a common statistical test used to compare characteristics of two or more groups (Warner, 2007). In this study, one of the groups is the co-operative participants and the other is the non-participants. Regression analysis is used to identify the factors that influence dairy farmers’ participation in co-operatives as well as those factors that determine dairy farm profitability of participants in the Northeast United States.
3.1. Means TestIn order to examine the difference between the participant dairy farms and the non-participants, we compare them by their respective farm and farm operator characteristics, their risk management behaviour, and their financial solvency. We examine the structural and financial performance of participants and non-participants, and hypothesise that co-operative participants are better at managing their dairy farms compared to their non-participant counterparts. We use the non-parametric means test to compare participants and non-participants. This test uses the principle of the ‘independent sample t-test’ which assumes that these two groups of farmers are normally distributed and their respective variances are homogenous in nature.8
3.2. Farmers’ Choice of Co-operatives as their Milk Marketing Outlet Most dairy farmers in the United States sell their milk to dairy co-operatives, ie, they participate in these co-operatives’ marketing functions either as members or as non-member patrons. There are numerous reasons why farmers may use co-operatives to market their products, some of which may be economic (eg, to receive a better price, or due to a lack of other alternatives outlets), others may be non-economic (eg, to support a farmer-owned agribusiness). Here we make an attempt to explain the economic and demographic factors that may be contributing to such choices made by the dairy farmers in the Northeast US Following the empirical models of Alexander, et al (2007), Wiersinga, van Wijk, and Luyen (2007), and Tsourgiannis, Eddison and Warren (2008), here we model dairy farmers’ outlet choice as a function of various farm and farmer characteristics, such as the number of cows, debt level, etc.
Journal of Co-operative Studies, 45:2, Autumn 2012: 25-41 ISSN 0961 5784

28
The dependent variable (SELLCOOP) is a binomial variable where SELLCOOP=1 implies a farmer is a participant, ie, sells his or her milk to a dairy co-operative, and 0 implies the farmer is not a participant. We hypothesise that some of the factors that will influence dairy farmers’ decisions to participate in co-operatives would include the price of milk, farm size, the farm operator’s age and the level of education. For example, Mishra and Morehart (2001) found that higher education of dairy operators was correlated with higher levels of profitability and according to the authors, education may measure one’s ability to process new and complex information. Deciding to participate in co-operatives may require dairy farmers to process a complex set of information and we assume that education will have a positive impact on farmers’ decisions to participate in co-operatives.
The binomial logistic model assumes that an individual dairy farmer’s probability of selling milk to a co-operative depends on a vector of independent variables (Xij) associated with farmer i and variable j, and a vector of unknown parameters β:
Pi = F (Zi) = F (βXij) = 1/ [1+exp (-Zj)] (1)
where, F(Zi) equals the value of the logistic cumulative density function associated with each possible value of the underlying index Zi and Pi equals the probability that a farmer sells milk to a co-operative given the independent variables Xij. In the above equation, βXij is a linear combination of the independent variables so that,
Zi = β0 + β1Xi1 + β2 Xi2 + ............ + βk Xik + ei (2)
where, Zi = unobserved index level or the log odds of the ith observation; Xij = jth attribute of the ith respondent and j =1, 2, 3 ... k; β = parameters to be estimated; and e = random error or disturbance term.
3.3. Explaining Dairy Farm ProfitabilityThere is misperception regarding the objectivity of measuring the financial performance of agricultural producers, or more precisely whether such objectivity exists. As Mishra and Morehart (2001) admit, financial performance is ultimately a subjective measure dependent upon the individual researcher’s objectives and assumptions. It comes as no surprise that researchers have used several different indicators to measure the financial performance of agricultural operations in previous studies.9 For example, El-Osta and Johnson (1998) employ two accounting measures in analysing the financial performance of US commercial dairy farms: net farm income (NFI) and net returns per unit (cwt) of milk sold (NRU). In another instance, however, El-Osta with his colleagues at the USDA use a farm’s operating margin (FOM) (McBride et al, 2004). Following the Farm Financial Standards Council’s (FFSC) guideline, we use the Net Farm Income (NFI) as the measure of dairy farm profitability. The FFSC defines NFI as follows: NFI={(farm operating revenues – farm operating expenses) ± (changes in inventories) – (depreciation) – (interest ± interest accrued)} – real estate and property taxes. The NFI, thus, is interpreted as “the return to the farmer for unpaid labour, management, and owner equity” (Farm Financial Standards Council 1997, III-16).
We conduct a multivariate regression analysis to determine the factors that influenced dairy farm profitability. To obtain estimated statistics that are representative of population parameters, a weight recommended by the data gathering agency (NASS/USDA) was used.10 To compare the profitability of the co-operative participants to dairy farmers in the region in general, the dairy farm sample was divided into two groups, (i) the aggregate sample representing all dairy farmers in the Northeast and (ii) the sub-sample representing the co-operative participants. Two separate profitability functions were estimated and analysed. Profitability, measured by the NFI is modeled as a function of input and output prices and a production constraint, which is dependent upon farm and farm operator characteristics. The conceptual model, explained below, borrows heavily from McBride and Greene (2007), Mishra and Morehart (2001), El-Osta and Johnson (1998), and Short (2000). Following these earlier works, we assume that the following profit function represents a profit-maximising, price-taking representative dairy farm:
Journal of Co-operative Studies, 45:2, Autumn 2012: 25-41 ISSN 0961 5784

29
p (Pi, , Pm , k, d) = S Pi Qi (Pi, k, d) - S TCM (PM, QM, h, g), (3)
where Pl is a vector of output prices, Q1 is a vector of quantities of various outputs produced, is a vector of farm operator characteristics, d is a vector of farm characteristics, TCM is a vector of costs, Pm is a vector of input prices, Qm is a vector of inputs, h is a vector of farm operator characteristics, g is a vector of farm characteristics. We hypothesise that farm and farm operator characteristics, additional farm income, and dairy farmers’ risk management practices would influence the profitability of the dairy farms of co-operative participants as well as all dairy farms in the Northeast. For example, previous studies have shown that various risk management strategies, such as contracts increased profitability (Mishra and Morehart 2001); our dairy farm profitability function (equation 3) is designed to include such variables.
We use a semi-log functional form to estimate the dairy farm profitability equation presented in equation (3).11 The dairy farm profitability model can be specified as follows:
1n p = a + a X + e, i = 1, 2, ... k, (4)
where X is a vector of k number of explanatory variables consisting of farm characteristics, farm operator characteristics, dairy farm technology indicators, efficiency measures, risk management measures, and financial efficiency measures, and is an error term. For example, integrating modern technology into the dairy production system is hypothesised to have a significant and positive impact on profitability. Such technologies may include technologically advanced milking parlour system, automatic takeoff of milk by a machine (as opposed to milking by hand), etc. Technology adoption has been found to have a positive impact on dairy farm financial performance (El-Osta and Johnson 1998; Short 2000) and we expect a similar outcome here. Short (2000) found that dairy farms with higher profitability were more likely to have milking equipment with automatic takeoffs and udder washers. Similarly, in terms of profitability of financially efficient farms, earlier studies show that higher debt-to-asset ratios were negatively correlated with profitability (Short, 2000; El-Osta and Johnson, 1998).
In the regression models, NFI represents p in Equation (4). Thus, dairy farm profitability is hypothesised to be a function of input and output prices, farm characteristics, extra income, farm operator characteristics, technology, efficiency measures, risk management decisions, and financial efficiency. Assuming competitive markets for both input and output, all organic dairy farms are assumed to be price takers and all of them face the same market conditions.
3.4. Data Data used in this analysis was obtained from the dairy panel of the 2005 Agricultural Resource Management Survey (ARMS) of the United States. This survey is conducted every 5 years by the National Agricultural Statistics Service (NASS) and the Economic Research Service (ERS) of the United States Department of Agriculture (USDA). The ARMS survey is a multi-frame, probability-based survey, and it is designed to collect detailed financial data about farm financial performance (USDA, 2009b). The ARMS financial data can be used to construct various measures of financial performance, such as profitability, liquidity, and solvency. The survey also collects data on farm operator and farm characteristics, as well as on various production management decisions. The ARMS data are weighted according to their probability of occurring, which is based on certain farm characteristics and a known number of farms with those similar characteristics (McBride and Greene 2007), that is, each observation in the dataset is weighed so that population estimates could be made using the sample data. The stratified sample and the subsequent probability-weighted data allow each farm to represent several similar farms and adjust for the over-sampled, organic population. The USDA provides further details online (USDA, 2009b). All data points in the 2005 ARMS survey refer to the calendar year 2004.
The ARMS data used here consists of a representative sample of milk producers from the Northeast United States. More specifically, the samples are drawn from the milk producing states of Pennsylvania, New York, Vermont, and Maine, which together produce over 90% of
Journal of Co-operative Studies, 45:2, Autumn 2012: 25-41 ISSN 0961 5784
30
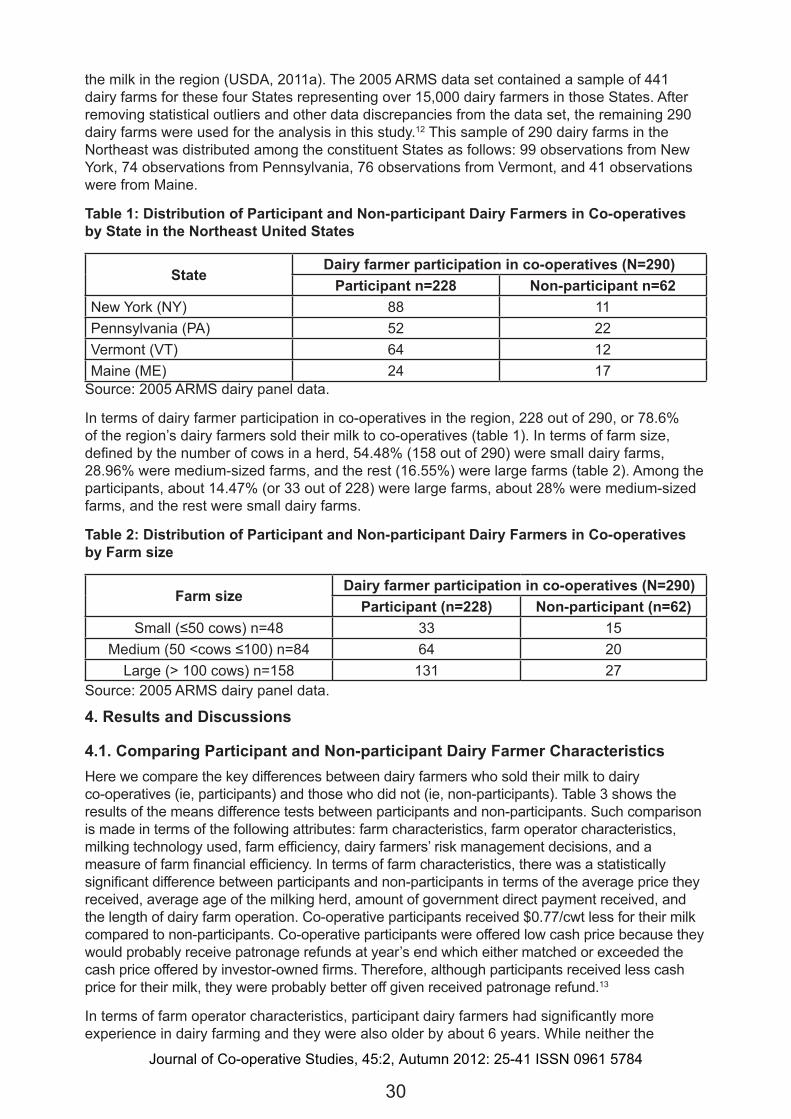
the milk in the region (USDA, 2011a). The 2005 ARMS data set contained a sample of 441 dairy farms for these four States representing over 15,000 dairy farmers in those States. After removing statistical outliers and other data discrepancies from the data set, the remaining 290 dairy farms were used for the analysis in this study.12 This sample of 290 dairy farms in the Northeast was distributed among the constituent States as follows: 99 observations from New York, 74 observations from Pennsylvania, 76 observations from Vermont, and 41 observations were from Maine.
Table 1: Distribution of Participant and Non-participant Dairy Farmers in Co-operatives by State in the Northeast United States
StateDairy farmer participation in co-operatives (N=290)
Participant n=228 Non-participant n=62New York (NY) 88 11Pennsylvania (PA) 52 22Vermont (VT) 64 12Maine (ME) 24 17
Source: 2005 ARMS dairy panel data.
In terms of dairy farmer participation in co-operatives in the region, 228 out of 290, or 78.6% of the region’s dairy farmers sold their milk to co-operatives (table 1). In terms of farm size, defined by the number of cows in a herd, 54.48% (158 out of 290) were small dairy farms, 28.96% were medium-sized farms, and the rest (16.55%) were large farms (table 2). Among the participants, about 14.47% (or 33 out of 228) were large farms, about 28% were medium-sized farms, and the rest were small dairy farms.
Table 2: Distribution of Participant and Non-participant Dairy Farmers in Co-operatives by Farm size
Farm sizeDairy farmer participation in co-operatives (N=290)
Participant (n=228) Non-participant (n=62)Small (≤50 cows) n=48 33 15
Medium (50 <cows ≤100) n=84 64 20Large (> 100 cows) n=158 131 27
Source: 2005 ARMS dairy panel data.
4. Results and Discussions
4.1. Comparing Participant and Non-participant Dairy Farmer CharacteristicsHere we compare the key differences between dairy farmers who sold their milk to dairy co-operatives (ie, participants) and those who did not (ie, non-participants). Table 3 shows the results of the means difference tests between participants and non-participants. Such comparison is made in terms of the following attributes: farm characteristics, farm operator characteristics, milking technology used, farm efficiency, dairy farmers’ risk management decisions, and a measure of farm financial efficiency. In terms of farm characteristics, there was a statistically significant difference between participants and non-participants in terms of the average price they received, average age of the milking herd, amount of government direct payment received, and the length of dairy farm operation. Co-operative participants received $0.77/cwt less for their milk compared to non-participants. Co-operative participants were offered low cash price because they would probably receive patronage refunds at year’s end which either matched or exceeded the cash price offered by investor-owned firms. Therefore, although participants received less cash price for their milk, they were probably better off given received patronage refund.13
In terms of farm operator characteristics, participant dairy farmers had significantly more experience in dairy farming and they were also older by about 6 years. While neither the
Journal of Co-operative Studies, 45:2, Autumn 2012: 25-41 ISSN 0961 5784

31
participant group nor the non-participant group used any computerised data gathering system in their dairy farms, they differed in terms of the milking facility used – participant group typically had a more modern milking facility, including an auto takeoff system. In terms of operational efficiency, participants and non-participants were almost alike, eg, there was no significant difference between these two groups in terms of milk production per cow, or feed used per cow. However, they – differed in terms of labour cost, land available for grazing and death rate for milk cows (or cull rate) – co-operative participants had more land per cow for grazing and a lower cull rate but had higher labour cost compared to the non-participants. Higher labour is probably due to the fact that many of these participants were operating organic dairy farms which generally have higher labour costs.
Table 3: Farm and Farm Operator Characteristics of Participant and Non-participant Dairy Farmers in Co-operatives in the Northeast USA
Variables Participant n=228
Non-participant n=62
Mean difference
Farm Characteristic:Net Farm Income ($), NFI 82,015.10 65,669.10 16,346.00Average number of milk cows in milking herd, MILKCOWS 137 108 29
Total milk sold (cwt), CWTSOLD 26444.8 20198.5 6246.3Average price received ($/cwt), AVEPRICE 15.75 16.51 -0.77 **Acres of pasture for grazing, ACGFEED 35.74 23.84 11.90 *Average age of milking herd (yrs), COWAGE 4.55 4.52 0.03Govt direct payments received, average ($), GOVTYES 5934.3 2566.1 3368.1 **
Age of the dairy operation (ie, number of years the farm has been producing milk), DAIRYAGE 26.03 20.71 5.31 **
Off-farm income exist (Yes/No), OFFARM No@ No@ --Dry off cows seasonally (Yes/No), DRYOFF No@ No@ --Farm Operator Characteristics:Operator’s farming experience (yrs), FARMYRS 28.52 22.16 6.36 ***Primary operator’s age (yrs), OPEAGE 53.21 47.22 5.99 ***Primary operator’s highest level of education, OPEEDU
High school, and some college@
High school and some college@ --
Technology:Milking facility Used, MLKFCLTY Herringbone
parlour@Barn with around
the barn pipeline@ --
Milking system uses computerised data gathering (Yes/No), COMPDATA No@ No@ --
Has milking system with automatic takeoffs (Yes/No), AUTTAKOF Yes@ No@ --
Efficiency Measures:Milk production per cow (cwt/cow), MLKPRDCW 185.3 180.5 4.81Feed per cow (cwt/cow), FEEDCOW 852.8 428.6 424.2Purchased feed cost per cow ($/cow), PFEEDCOW 272.1 307.6 -35.57
Purchased feed cost as a percentage of total operating cost (%), FEEDCOST 0.331 0.316 0.015
Journal of Co-operative Studies, 45:2, Autumn 2012: 25-41 ISSN 0961 5784

32
Acres of pasture for grazing per cow (acres/cow), ACRESCOW 0.575 0.403 0.172 *
Farm labour expenses per cow ($/cow), LABCOW 279.1 159.0 120.1 **
Death rate of cows, or cull rate (occurrence per 1,000 cows), CULLRATE 0.0521 0.0688 -0.0617***
Risk Management Decisions:Keep individual cow production records (Yes/No), PRRECORD Yes@ Yes@ --
Lock in input prices (Yes/No), PRICLOCK No@ No@ --Negotiate input price discounts on inputs (Yes/No), PDISCOUN Yes@ Yes@ --
Receive volume premiums (Yes/No), VOLPREM Yes@ No@ --
Written contract for milk handling payments (Yes/No), WRITTCON Yes@ Yes@ --
Use forward contracts to sell milk (Yes/No), FWARDCON No@ No@ --
Process milk on site (Yes/No), ONSITPRO No@ No@ --Use a nutrition plan to manage herd (Yes/No), NUTPLAN Yes@ Yes@ --
Use veterinary services regularly (Yes/No), VETSERVC Yes@ Yes@ --
Financial Efficiency:Debt-to-asset ratio, DEBT2AST 0.172 0.119 0.053 **
Note: Statistically significant means are as follows: *** p ≤ .01, ** p ≤ .05, * p ≤ .10, @ denotes the use of mode for discrete variables.
In terms of their risk management decisions, both participant group and the non-participant group exercised similar management practices, for example, neither group locked in input prices, or used forward contracts to sell milk. The participant group, however, received volume premium from their co-operatives, probably due to their contractual relationship with their co-operatives. Non-participants were financially better off by a small but significant amount. This is likely due to participant dairy farmers investing in improved but expensive milking facilities, such as installing a Herringbone parlour.
4.2. Factors Affecting Dairy Farmers’ Choice of Co-operatives as their Marketing outlet The aim here is to identify the factors that make a dairy farmer more likely to sell his milk to a dairy co-operative. As explained in Section 3.2, we used a binomial logit model to determine such factors. We divide the potential factors into three separate groups – first group (termed as “co-operatives’ offer”) contains factors that the co-operatives control and may use to entice dairy farmer participation; the second group (“dairy farmer characteristics”) includes factors that profile participant dairy farmers using demographic variables, and the last group (“dairy farming characteristics”) contains variables that profile participating dairy farming operations. While the first group contained external factors that a dairy farmer could not control, the latter two groups contained factors that were internal to the dairy farming operation. As explained in Section 3.3, these factors were hypothesised to influence a dairy farmer’s decision to participate in co-operatives. Logistic regression results are presented in table 4 along with the marginal effects of the statistically significant variables. The logit model was statistically robust as evident from its Likelihood ratio test statistic. In terms of its predictive ability, the model was able to correctly predict almost 79% of the outcomes.
Journal of Co-operative Studies, 45:2, Autumn 2012: 25-41 ISSN 0961 5784
33
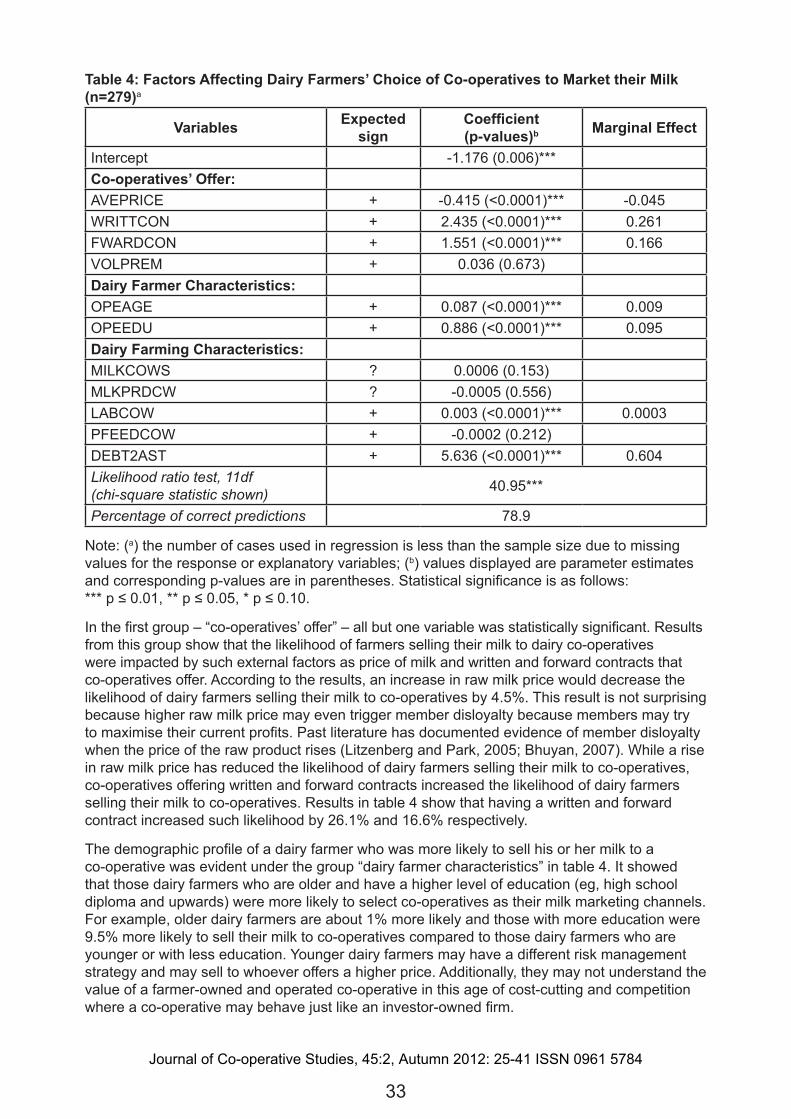
Table 4: Factors Affecting Dairy Farmers’ Choice of Co-operatives to Market their Milk (n=279)a
Variables Expected sign
Coefficient (p-values)b Marginal Effect
Intercept -1.176 (0.006)***Co-operatives’ Offer:AVEPRICE + -0.415 (<0.0001)*** -0.045WRITTCON + 2.435 (<0.0001)*** 0.261FWARDCON + 1.551 (<0.0001)*** 0.166VOLPREM + 0.036 (0.673)Dairy Farmer Characteristics:OPEAGE + 0.087 (<0.0001)*** 0.009OPEEDU + 0.886 (<0.0001)*** 0.095Dairy Farming Characteristics:MILKCOWS ? 0.0006 (0.153)MLKPRDCW ? -0.0005 (0.556)LABCOW + 0.003 (<0.0001)*** 0.0003PFEEDCOW + -0.0002 (0.212)DEBT2AST + 5.636 (<0.0001)*** 0.604Likelihood ratio test, 11df (chi-square statistic shown) 40.95***
Percentage of correct predictions 78.9
Note: (a) the number of cases used in regression is less than the sample size due to missing values for the response or explanatory variables; (b) values displayed are parameter estimates and corresponding p-values are in parentheses. Statistical significance is as follows: *** p ≤ 0.01, ** p ≤ 0.05, * p ≤ 0.10.
In the first group – “co-operatives’ offer” – all but one variable was statistically significant. Results from this group show that the likelihood of farmers selling their milk to dairy co-operatives were impacted by such external factors as price of milk and written and forward contracts that co-operatives offer. According to the results, an increase in raw milk price would decrease the likelihood of dairy farmers selling their milk to co-operatives by 4.5%. This result is not surprising because higher raw milk price may even trigger member disloyalty because members may try to maximise their current profits. Past literature has documented evidence of member disloyalty when the price of the raw product rises (Litzenberg and Park, 2005; Bhuyan, 2007). While a rise in raw milk price has reduced the likelihood of dairy farmers selling their milk to co-operatives, co-operatives offering written and forward contracts increased the likelihood of dairy farmers selling their milk to co-operatives. Results in table 4 show that having a written and forward contract increased such likelihood by 26.1% and 16.6% respectively.
The demographic profile of a dairy farmer who was more likely to sell his or her milk to a co-operative was evident under the group “dairy farmer characteristics” in table 4. It showed that those dairy farmers who are older and have a higher level of education (eg, high school diploma and upwards) were more likely to select co-operatives as their milk marketing channels. For example, older dairy farmers are about 1% more likely and those with more education were 9.5% more likely to sell their milk to co-operatives compared to those dairy farmers who are younger or with less education. Younger dairy farmers may have a different risk management strategy and may sell to whoever offers a higher price. Additionally, they may not understand the value of a farmer-owned and operated co-operative in this age of cost-cutting and competition where a co-operative may behave just like an investor-owned firm.
Journal of Co-operative Studies, 45:2, Autumn 2012: 25-41 ISSN 0961 5784

34
The two statistically significant variables in the last group – “dairy farming characteristics” – tell us that those dairy farmers who have higher labour cost or high debt are more likely to choose co-operatives as their marketing outlet, ie, these farmers participate in co-operatives. Those with higher labour costs were 0.03% more likely and those with higher debt were 60.4% more likely to choose dairy co-operatives to market their milk. Many dairy farmers in the Northeast practice organic dairy farming which is known to have higher labour costs. Most of these farmers are also members of dairy co-operatives in the region, eg, Organic Valley. Following the national trend to reduce cost through economies of scale, many dairy farmers in this region were also expanding, which required leveraging and thereby increasing their debt level. Because co-operatives offer forward contracts to sell milk, farmers with higher cost and higher debt may prefer to sell to co-operatives because a forward contract is a valuable risk-management tool for them.
4.3. What Factors Impacts Dairy Farms Profitability in the Northeast United States?In an effort to determine the factors that influence dairy farm profitability in the Northeast United States, we conducted a multivariate regression analysis using dairy farm profitability (defined as net farm income or NFI) as the dependent variable. Details of the model were presented in Section 3.3. A weighted least square (WLS) technique was used to estimate the profitability equation (eq 4). Two separate profitability equations were estimated – one focusing on the aggregate sample representing all dairy farmers of the region (N=222) and the other representing the region’s co-operative participants only (N=177). Both regression models performed well as shown by their respective Goodness of Fit statistics measures (table 5).
Table 5: Regression Results of the Factors Determining Profitability of Co-operative Participants in the Northeast US
Variables Expected Sign
All dairy farmers (n=222)a
Co-operative participants (n=177)a
Coefficient (p-value)b Coefficient (p-value)b
Intercept 11.675*** (0.0001) 7.616 *** (0.0001)Farm Characteristics:AVEPRICE + -0.043 (0.285) 0.0824 *** (0.029)MILKCOWS + 0.0037*** (0.0001) 0.0027 *** (0.0001)COWAGE - -0.1750*** (0.046) -0.1621 *** (0.0395)DRYOFF - -0.4332** (0.064) -0.1792 (0.375)Farm Operator Characteristics:OPEAGE - 0.0134 (0.315) 0.0104 (0.336)OPEEDU + -0.274 ** (0.064) 0.0692 (0.591)FARMYRS + -0.0103 (0.381) -0.015 (0.121)Extra Income:OFFARM + 0.5036** *(0.0054) 0.0641 (0.676)GOVTYES + 0.4087 (0.1493) 0.5865 *** (0.019)Technology:MLKFCLTY ? -0.5301*** (0.003) 0.0744 (0.6459)AUTTAKOF + 0.432 *** (0.0165) 0.428 *** (0.0044)Efficiency Measures:MLKPRDCW + 0.0130 *** (0.0001) 0.0115 *** (0.0001)PFEEDCOW - -0.0060 **** (0.0001) -0.0021 *** (0.0012)LABCOW - 0.00006 *** (0.037) -0.0003 (0.266)CULLRATE - -13.702 *** (0.0001) -0.7422 (0.723)
Journal of Co-operative Studies, 45:2, Autumn 2012: 25-41 ISSN 0961 5784
35
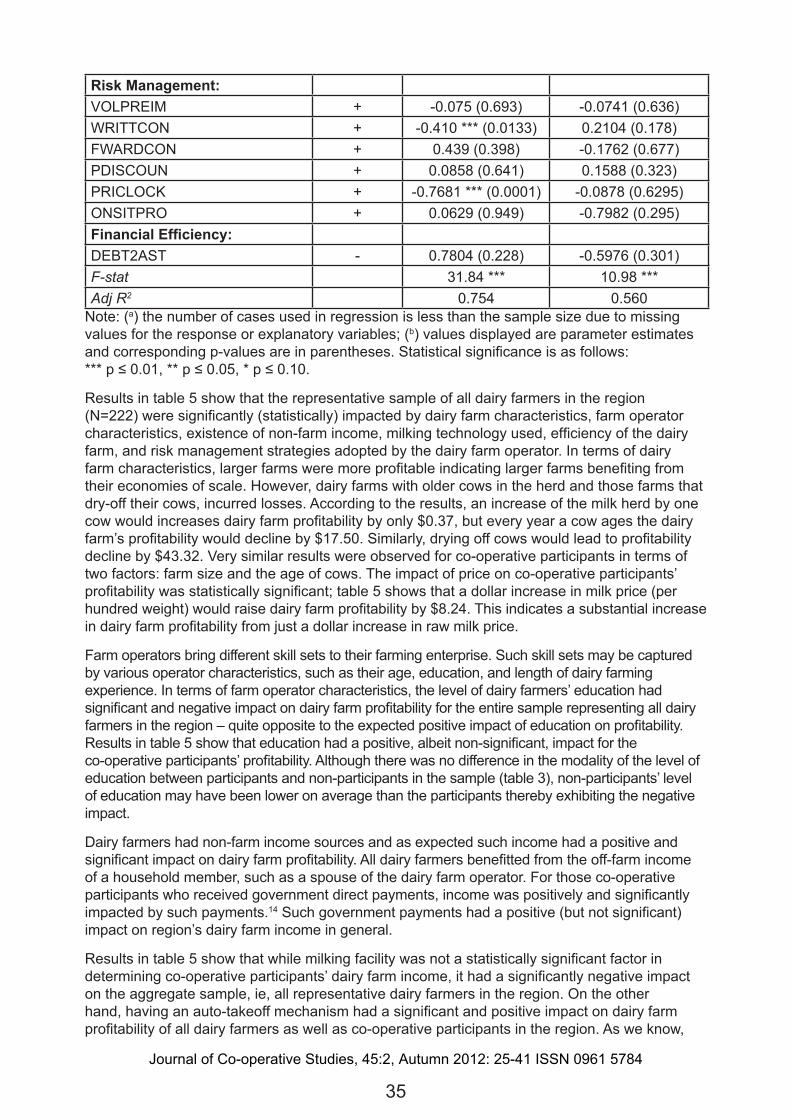
Risk Management:VOLPREIM + -0.075 (0.693) -0.0741 (0.636)WRITTCON + -0.410 *** (0.0133) 0.2104 (0.178)FWARDCON + 0.439 (0.398) -0.1762 (0.677)PDISCOUN + 0.0858 (0.641) 0.1588 (0.323)PRICLOCK + -0.7681 *** (0.0001) -0.0878 (0.6295)ONSITPRO + 0.0629 (0.949) -0.7982 (0.295)Financial Efficiency:DEBT2AST - 0.7804 (0.228) -0.5976 (0.301)F-stat 31.84 *** 10.98 ***Adj R2 0.754 0.560
Note: (a) the number of cases used in regression is less than the sample size due to missing values for the response or explanatory variables; (b) values displayed are parameter estimates and corresponding p-values are in parentheses. Statistical significance is as follows: *** p ≤ 0.01, ** p ≤ 0.05, * p ≤ 0.10.
Results in table 5 show that the representative sample of all dairy farmers in the region (N=222) were significantly (statistically) impacted by dairy farm characteristics, farm operator characteristics, existence of non-farm income, milking technology used, efficiency of the dairy farm, and risk management strategies adopted by the dairy farm operator. In terms of dairy farm characteristics, larger farms were more profitable indicating larger farms benefiting from their economies of scale. However, dairy farms with older cows in the herd and those farms that dry-off their cows, incurred losses. According to the results, an increase of the milk herd by one cow would increases dairy farm profitability by only $0.37, but every year a cow ages the dairy farm’s profitability would decline by $17.50. Similarly, drying off cows would lead to profitability decline by $43.32. Very similar results were observed for co-operative participants in terms of two factors: farm size and the age of cows. The impact of price on co-operative participants’ profitability was statistically significant; table 5 shows that a dollar increase in milk price (per hundred weight) would raise dairy farm profitability by $8.24. This indicates a substantial increase in dairy farm profitability from just a dollar increase in raw milk price.
Farm operators bring different skill sets to their farming enterprise. Such skill sets may be captured by various operator characteristics, such as their age, education, and length of dairy farming experience. In terms of farm operator characteristics, the level of dairy farmers’ education had significant and negative impact on dairy farm profitability for the entire sample representing all dairy farmers in the region – quite opposite to the expected positive impact of education on profitability. Results in table 5 show that education had a positive, albeit non-significant, impact for the co-operative participants’ profitability. Although there was no difference in the modality of the level of education between participants and non-participants in the sample (table 3), non-participants’ level of education may have been lower on average than the participants thereby exhibiting the negative impact.
Dairy farmers had non-farm income sources and as expected such income had a positive and significant impact on dairy farm profitability. All dairy farmers benefitted from the off-farm income of a household member, such as a spouse of the dairy farm operator. For those co-operative participants who received government direct payments, income was positively and significantly impacted by such payments.14 Such government payments had a positive (but not significant) impact on region’s dairy farm income in general.
Results in table 5 show that while milking facility was not a statistically significant factor in determining co-operative participants’ dairy farm income, it had a significantly negative impact on the aggregate sample, ie, all representative dairy farmers in the region. On the other hand, having an auto-takeoff mechanism had a significant and positive impact on dairy farm profitability of all dairy farmers as well as co-operative participants in the region. As we know,
Journal of Co-operative Studies, 45:2, Autumn 2012: 25-41 ISSN 0961 5784
36
appropriate use of production technology is key to lowering cost and increasing profit. So, from the results it is clear that while an auto-takeoff facility was beneficial for all representative dairy farmers, having an advanced milking parlour, such as the Herringbone parlour, was not beneficial for everyone.
Economic theory predicts that higher efficiency leads to higher profits. Except for one aberration, that was true for the aggregate sample and the sub-sample, or the co-operative participants. Dairy farm profitability was significantly impacted by higher per cow milk production rate, lower cull rate, and lower feed use per cow. For example, for every hundredweight increase in raw milk production per cow, dairy farm profitability will increase by $1.30 for all dairy farmers and by $1.10 for co-operative participants. Similarly, for every dollar increase (decrease) in purchased feed per cow, profitability falls (rises) for all dairy farmers by $0.60; the same rate is $0.21 for co-operative participants. Among all efficiency measures, cull rate had the most impact – results show that lowering the cull rate would dramatically raise dairy farm profitability, eg, for every 1% drop in cull rate, dairy farm profitability increases by 137%.
All farm operators used different mechanisms to manage the risk associated with fluctuations in the prices of inputs and output, and the risk involved with ensuring a market for their product. Dairy farmers in the Northeast United States were no exception and they used several risk management strategies. Such strategies included having a written contract for milk handling payments, receiving favorable milk prices via forward contracts, negotiating input price discounts, locking in low input prices, and having on-site processing, such as making cheese to sell. Results in table 5 shows that none of these risk management strategies had any significant impact on co-operative participants’ dairy farm profitability. However, contrary to the expected results, our results show that having a written contract and locking in low input prices had a negative impact on the dairy farms in the region. Those farmers who used these two strategies would have not benefited if the cash price of milk at the time of sale was above the contract price, or the price of inputs was below the locked-in price. That is what may have happened to the dairy farmers in the region thereby explaining the unexpected results. Finally, according to our results, financial efficiency was not a significant factor in determining dairy farm profitability in the Northeast United States.
5. ConclusionsParticipation in any activity must somehow be beneficial to the participants. Assuming dairy farmers in the Northeast United States are rational, we made an attempt here to examine their participation in dairy co-operatives. For the purpose of this study, co-operative participation was defined narrowly as dairy farmers selling their raw milk to co-operatives. We compared those dairy farmers who sold their raw milk to dairy co-operatives (identified as “participants”) to those who did not (identified as “non-participants”). We also examined the factors that influenced dairy farmers’ decisions to participate in co-operatives. Finally, we analysed the factors impacting all dairy farmers’ profitability in the region, including the co-operative participants.
The majority of the dairy farmers in the sample were participants (78.6%), ie, they sold their raw milk to co-operatives. This shows excellent market penetration by dairy co-operatives in the region. In terms of their size distributions, most of the participant dairy farmers were large farmers, ie, they had 100 or more cows in their herd. Less than 15% of the participants were small dairy farmers, ie, those with less than 50 cows in their herd. Such diverging structural characteristics of co-operative participants may pose some issues to the co-operative management. This is because while large farmers may expect special treatment in the form of premiums and discounts, small farmers may consider such special treatments as attempted domination or control of the co-operative by large farmers.
In terms of the differences in their characteristics between co-operative participants and non-participants, there were only a few statistically significant differences between these two groups, ie, both groups of farmers were very similar. Then the question is – why do some participate in co-operatives and some do not? The answer lies in the logistic analysis presented in an earlier
Journal of Co-operative Studies, 45:2, Autumn 2012: 25-41 ISSN 0961 5784

37
section. We found that the following factors significantly impacted a dairy farmer’s decision to participate in a dairy co-operative: while a higher milk price reduced participation while the following increased participation – availability of written and forward contracts, age and education of the dairy farm operator, higher labour cost, and level of debt. Dairy farmers who were looking for an immediate gain and were not bounded by contracts or waiting to receive patronage refund, preferred to sell their milk to whoever offered a higher price in the market. Those dairy farmers who were older and more educated, perhaps making them more knowledgeable about the value of selling to co-operatives, preferred to sell their milk to co-operatives. This group also understood the need for a co-operative to have a contract with its suppliers of raw milk and thus, availability of such contracts made selling their milk to co-operatives more appealing to them. It is clear that it would be more prudent for co-operatives to offer both written and forward contracts to attract both member and non-member participation.
In terms of the differences between the two groups, non-participants received a slightly higher milk cash price but unlike the participants, these non-participants would not have received patronage refund at the end of the year. Additional increase in the cash price differential, however, may reduce participation unless co-operatives are able to provide services to the participants (eg, advice on better dairy farming) which will add value to participants’ relation with their co-operatives. Considering that over 78% of the sample was co-operative participants despite receiving lower raw milk price, it is an indication that dairy co-operatives in the Northeast United States were successfully retaining their patronage base.
Participant dairy farmers were older than non-participants, had more farming experience than the non-participants, and had been operating their dairy operations for longer than the non-participants. Besides influencing dairy farmers’ decisions to sell their raw milk to co-operatives, such factors may have also contributed to participants’ relatively higher levels of profit compared to non-participants (such differences were not statistically significant). In terms of farm efficiency measures, participants and non-participants were almost alike except for the following: participant dairy farmers had significantly more acres for grazing as well as lower cull rate while non-participants had lower labour costs. A lower cull rate should improve profitability since it reduces replacement cost. The labour cost in the region is relatively high which would push the labour cost up for dairy farmers in the region, particularly for those participants who practiced organic agriculture. In terms of their risk management decisions, both participants and non-participants commonly practiced similar strategies, eg, using a written contract for milk handling payments.
An examination of the factors affecting the profitability of dairy farmers in general and co-operative participants in particular showed that both groups were influenced by almost the same factors (this was not unexpected given participants were a sub-set of the overall sample). For example, as economic theory predicts, having economies of scale, particularly in commodities (and raw milk is a commodity), would increase profit – this study confirms this for all dairy farmers in the region as well as for the participants. Similarly, dairy farmers with older the cows which would typically produce less milk had lower profits. Similarly, while drying off cows was having a negative impact, such a practice had no statistically significant impact on participants. Use of an appropriate milking technology, such as auto-takeoff, also showed a positive impact on the region’s dairy farm profitability. Therefore, keeping younger cows in the herd, not drying off cows, and using appropriate and cost-effective technology would benefit the profitability of dairy farmers in the region including the participants. Proper farm management and animal husbandry practices are also crucial to a dairy farm’s profitability. Impact of price was different on the general population compared to the participants – higher prices indicated a significant increase in profits among participants while no such impact was observed for the general population of dairy farmers.
The analyses and conclusions presented here are useful to dairy farmers and dairy co-operatives in the Northeast. By targeting factors that influence dairy farmers’ decisions to become co-operative participants and taking steps that would augment such likelihood,
Journal of Co-operative Studies, 45:2, Autumn 2012: 25-41 ISSN 0961 5784

38
co-operative management could improve the odds of dairy farmers becoming participants. For dairy farmers in the region, participants or otherwise, understanding the factors that influence their dairy farm profitability should help them better manage their farm operations, eg, practice better animal husbandry so that the cull rate declines. Agricultural extension agents could convey such messages through education and training of dairy farmers in the region.
In terms of the shortcomings of this study, it utilises cross-sectional data that represents only one year of dairy farming in the study area. Milk prices and input prices, however, vary from season to season and such variation would impact the dairy farm profitability and may impact participation. Additionally, profitability is only one measure of financial performance. Future studies of this kind may want to expand the definition of profitability beyond the NFI used here. Finally, due to the lack of an adequate sample size, we were not able to make a comparison between members and non-members. Addressing such data-related shortcomings could lead to additional research in future.
The AuthorSanjib Bhuyan is Associate Professor at the Department of Agricultural, Food & Resource Economics, Rutgers University, New Brunswick, USA. This article contributes to the NJAES project no 02601. The data used in this study was made available through a co-operative agreement between Rutgers University and the USDA (ERS and NASS). The author is grateful to Drs Bob Dubman and Bill McBride of the USDA for their help with data access and explanation. The author thanks the participants of the workshop, Rural Cooperation in the 21st Century: Lessons from the Past, Pathways to the Future, held in Rehovot, Israel, June 15-17, 2009 for their valuable comments on an earlier version of this article. The author also gratefully acknowledges constructive comments from the Editor and anonymous reviewers of this Journal and thanks his wife, Susan Bhuyan, for her editorial input.
ReferencesAlexander, C, Balagtas, J V, Mayen, C & Green, C (2007) Marketing organic milk in United States:
findings from the Agricultural Resource Management Survey of 2005. Paper presented at the 2007 AAEA meetings, 27 July – 1 August, Portland, OR.
Bhuyan, S (2007) “The ‘people’ factor in cooperatives: The effect of attitudes on member participation and commitment.” Canadian Journal of Agricultural Economics, 55: 275-298.
El-Osta, H S and Johnson, J D (1998) Determinants of Financial Performance of Commercial Dairy Farms. Technical Bulletin No 1859. Economic Research Service (ERS), USDA, Washington, DC, July.
Farm Financial Standards Council (FFSC) (1997) Financial Guidelines for Agricultural Producers. Monomonee Falls, WI: Farm Financial Standards Council. Available at: http://www.ffsc.org/html/guidelin.htm
Hakelius, K (1996) Cooperative Values: Farmers’ Cooperatives in the Minds of the Farmers. Swedish University of Agricultural Sciences, Department of Economics, Uppsala, Sweden.
Kennedy, P (1998) A Guide to Econometrics. Fourth edition. Cambridge, MA: The MIT Press.Litzenberg, K and Park, J (2005) Member Loyalty … Alive and Well? Cooperative Management Letter,
Texas A&M University, September.Medina, S and Ward, R W (undated) “A Multinomial Logit Model of Retail Outlet Selection for Beef.” Florida
Agricultural Experiment Station Journal Series R-19990605, University of Florida. McBride, W D and Greene, C (2007) A Comparison of conventional and organic milk production systems
in the US. Paper presented to the American Agricultural Economics Association Annual Meeting, Portland, OR, 29 July-1 August.
McBride, W D (2009) Personal Communication via email exchange.McBride, W D, Short, S and El-Osta, H (2004) “The adoption and impact of Bovine Somatropin on US
dairy farms.” Review of Agricultural Economics 26(4): 472-488.McNew, K (2000) “Dairy farming in 2000: productivity, prices and politics.” Maryland Dairy Talk, Spring
(available at www.agnr.umd.edu/AGNRNews). Miller, J J and Blayney, D P (2006) Dairy Backgrounder. Outlook report No LDP-M-145-01. ERS, USDA,
Washington, DC, July.
Journal of Co-operative Studies, 45:2, Autumn 2012: 25-41 ISSN 0961 5784

39
Mishra, A K and Morehart, M J (2001) “Factors affecting returns to labor and management on US dairy farms.” Agricultural Finance Review, Fall, 123-140.
NESAWG (undated) A Northeast farm bill agenda: priority 3: support the Northeast dairy industry. Available at www.nesawg.org (accessed on 8 May 2007).
NOFA-NY (2009) Northeast Organic Farming Association-New York. Cobleskill, NY 12043-0880. http://nofany.org/dbapplet/certfarms.html. 18 May.
NOFA-VT (2009) Northeast Organic Farming Association-Vermont. Richmond, VT 05477 http://www.nofavt.org/find-organic-farms.php 18 May 18.
Pennsylvania Certified Organic (PCO) (2009) Spring Mills, PA 16875. Personal Communication. 18 MaySamuelson, J (2008) 2007 Northeast Dairy Farm Summary. Prepared for the First Pioneer Farm Credit,
Enfield, CT, May.Short, S D (2000) Structure, Management, and Performance Characteristics of Specialized Dairy Farm
Businesses in the United States. Agricultural Handbook No 720, ERS, USDA, Washington, DC, September.
Tsourgiannis, L, Eddison, J and Warren, M (2008) “Factors affecting the marketing channel choice of sheep and goat farmers in the region of east Macedonia in Greece regarding the distribution of their milk production.” Small Ruminant Research, 79 (1), September: 87-97.
United States Census Bureau (2010) Statistical Abstract of the United States: 2011, Section 17. 130th Edition. Washington, DC.
United States Department of Agriculture (USDA) (2011a) Milk Production, Disposition, and Income, various year summaries, latest was for 2010. National Agricultural Statistics Service (NASS), Washington, DC. Available at http://usda.mannlib.cornell.edu/MannUsda/viewDocumentInfo.do?documentID=1105 (accessed in May 2011)
United States Department of Agriculture (USDA) (2011b) US Certified Organic Livestock by State, various years. Economic Research Service (ERS). Washington, DC. Available at http://www.ers.usda.gov/Data/Organic/. Accessed in May 2011.
United States Department of Agriculture (USDA) (2011) Cooperative Statistics, 2010. Rural Development, USDA, Washington, DC, November.
United States Department of Agriculture (USDA) (2009a) 2007 Census of Agriculture, Vol 1, Geographic Area Series, Part 51 (Table 1, State Summary Highlights), NASS, Washington, DC, December.
United States Department of Agriculture (USDA) (2009b) Agricultural Resource Management Survey (AMRS), Briefing Rooms, ERS, Washington, DC. Available at http://www.ers.usda.gov/Briefing/ARMS/. Accessed May 2011.
Warner, R M (2007) Applied Statistics: From Bivariate Through Multivariate Techniques. Thousand Oaks, CA: Sage Publications.
Wiersinga, R C, van Wijk, M S and Luyen, C H (2007) Marketing Channel Choice and Marketing Timing of Peri-urban Vegetable Growers in Vietnam. Acta Hort. (ISHS), 762:373-380.
Woods, N, Halbrendt, C, Liang, K and Wang, Q (2000) Interdependence of Agriculture and Tourism: Quantifying the Value of the Agricultural Working Landscape in Vermont. Paper presented at AAEA annual meeting, 30 July–2 August, Tampa, FL.
Notes1 The Northeast United States is defined here as the six New England states (Massachusetts, Maine,
New Hampshire, Rhode Island, Connecticut, and Vermont) and the five Mid-Atlantic states (New York, Pennsylvania, New Jersey, Delaware and Maryland).
2 While they account for less than 25% nationally, small and mid size farmers make a far greater contribution in the Northeast agriculture, and therefore, are crucial to local economies. These farms also serve as buffers to urban encroachment, help preserve open spaces, and contribute toward tourism, which are of high importance in the Northeast states (Woods et al, 2000).
3 States with less than three co-operatives were not mentioned in the co-operative statistics report (USDA, 2011).
4 Farmers are more likely to become members when they see benefits, such as access to the market, better price, better services, etc. Unless there are restrictions, non-members are allowed to sell through co-operatives, ie, allowed to participate, and enjoy similar benefits except patronage refund.
5 The ARMS data are collected every five years and at the time of writing this article, the 2010 ARMS data was not available.
6 One cwt or hundredweight is a unit of weight in the US Customary System equal to 100 pounds (45.36 kilograms).
7 Most states do not collect data on the number of organic dairy farms. Therefore, numbers have to be drawn from reports from certifiers. Farms do not have to be certified from an in-state certifier so no single certifier knows all the organic dairy farms in one state.
Journal of Co-operative Studies, 45:2, Autumn 2012: 25-41 ISSN 0961 5784

40
8 Details on the theory behind the independent sample t-test can be found in any standard text on applied statistics, eg Warner, 2007.
9 To address the apparent subjectivity and variability in financial performance measurement, there have been two efforts to establish standard measures of financial performance. The Agricultural and Applied Economics Association (AAEA) guidelines and the Farm Financial Standards Council’s (FFSC) guidelines are the products of those efforts. To simplify, in measuring profitability, which is a type of financial performance measure, the AAEA guidelines tend to isolate the costs and returns of producing individual commodities and include the opportunity costs of commodity production. The FFSC guidelines, in contrast, tend to reflect the revenues earned and expenses incurred to earn those revenues for the whole farm enterprise while adjusting for revenues and expenses that may have accrued, though not yet received/paid, during the time frame under study.
10 As suggested by the NASS/USDA (McBride, 2009), the weight used is P3MKWT0. According to McBride, using the weights corrects for the imbalances in the sample. For example, organic farms will have very small weights because each farm represents very few farms in the population. The weight has been calibrated using two data sources. The weight for conventional dairies has been calibrated with the estimate of average milk cow inventory during 2004 in each state less the estimate of organic milk cows in each state. The weight for organic dairies has been calibrated with the estimate of organic milk cows in each state.
11 A scatter plot between the residuals and predicted values showed that residuals were not homoscedastic establishing non-linearity as well as possible multi-colinearity. Using a semi-log functional form is one of the most common methods of addressing these issues. See Kennedy (1998) for more details.
12 Any case in the 2005 ARMS dataset for the selected States was considered an outlier or assumed to have data discrepancy if it did not have information on some key variables, such as labour expenses, years of farming experience, feed expenses, etc.
13 Non-participants (member or non-member) do not receive patronage refunds. Because the ARMS data does not provide information on patronage refunds, we are unable to add any more insight here.
14 There is no direct payment programme for milk, so these farmers must have received direct payment for non-dairy related programmes, such as land conservation.
AppendixAppendix table: Summary Statistics of Variables Used in the Regression Models
Variables Number of obs Mean Std Dev Min Max
ProfitabilityNFI 290 77542.73 933261.12 -1341684.73 1954351.64Farm Characteristics:AVEPRICE 290 15.96 9.64 11.62 31.58MILKCOWS 290 129 761.51 21 2525COWAGE 289 4.54 5.01 2 10DRYOFF 290 No@ 1.892 0 1Farm Operator Characteristics:OPEAGE 290 51.57 57.80 27 85OPEEDU
290High School and some college @
3.052 1 3
FARMYRS 290 26.79 59.15 1 60Extra Income:OFFARM 290 No@ 2.241 0 1GOVTYES 290 Yes@ 1.551 0 1
Journal of Co-operative Studies, 45:2, Autumn 2012: 25-41 ISSN 0961 5784

41
Technology:MLKFCLTY 290 No@ 2.213 0 1AUTTAKOF 290 Yes@ 2.514 0 1Efficiency Measures:MLKPRDCW 290 183.99 268.188 41.56 377.42LABCOW 290 246.229 1412.15 0.80 1582.19PFEEDCOW 290 281.797 1030.65 0 2141.88CULLRATE 288 0.057 0.196 0.007 0.185Risk Management:SELLCOOP 290 Yes@ 2.247 0 1VOLPREIM 289 Yes@ 2.452 0 1WRITTCON 289 Yes@ 2.377 0 1 FWARDCON 290 No@ 0.689 0 1PDISCOUNT 290 Yes@ 2.059 0 1PRICELOCK 290 No@ 2.426 0 1ONSITPRO 289 No@ 0.917 0 1Financial Efficiency:DEBT2ASST 281 0.157 0.744 0.00019 1.0173
Note: @ denotes use of mode. Source: 2005 ARMS data.
Journal of Co-operative Studies, 45:2, Autumn 2012: 25-41 ISSN 0961 5784