An Analysis of Assessor Behavior in Crowdsourced Preference Judgments Dongqing Zhu and Ben...
26
An Analysis of Assessor Behavior in Crowdsourced Preference Judgments Dongqing Zhu and Ben Carterette University of Delaware
-
Upload
eric-briggs -
Category
Documents
-
view
215 -
download
0
Transcript of An Analysis of Assessor Behavior in Crowdsourced Preference Judgments Dongqing Zhu and Ben...

An Analysis of Assessor Behavior in Crowdsourced Preference Judgments
Dongqing Zhu and Ben CarteretteUniversity of Delaware

Description of Our Pilot Study
• Objective: determine the optimal placement of images among search results
• Objects to be assessed: full page layouts consisting of both ranked results and results from image search verticals

Description of Our Pilot Study
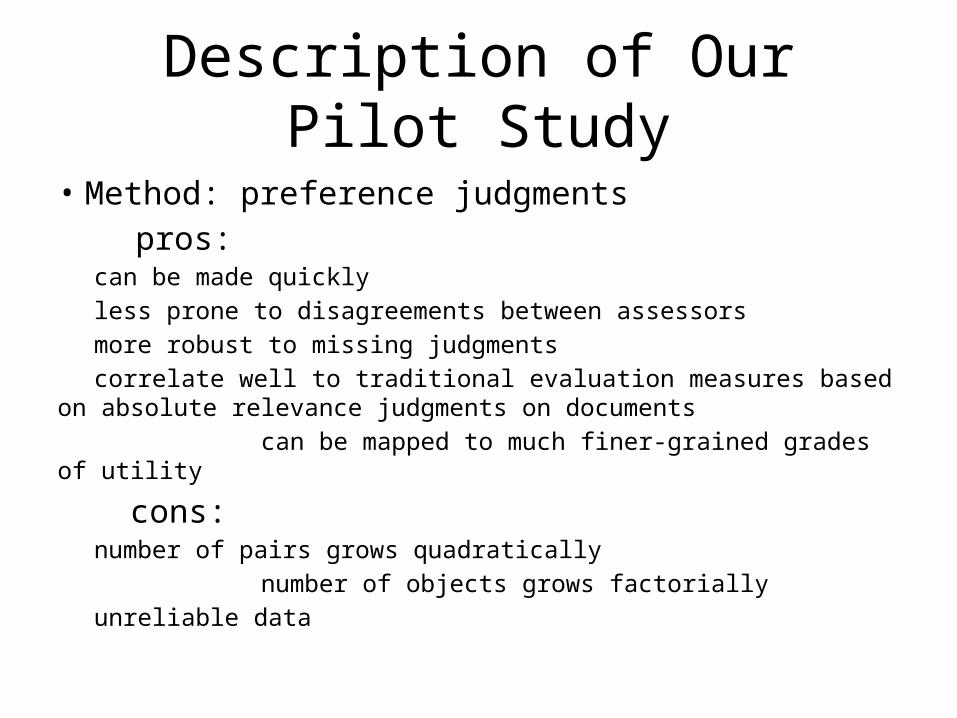
• Method: preference judgments pros:
can be made quicklyless prone to disagreements between assessorsmore robust to missing judgmentscorrelate well to traditional evaluation measures based on absolute
relevance judgments on documents can be mapped to much finer-grained grades of utility
cons: number of pairs grows quadratically
number of objects grows factoriallyunreliable data
Experimental Design
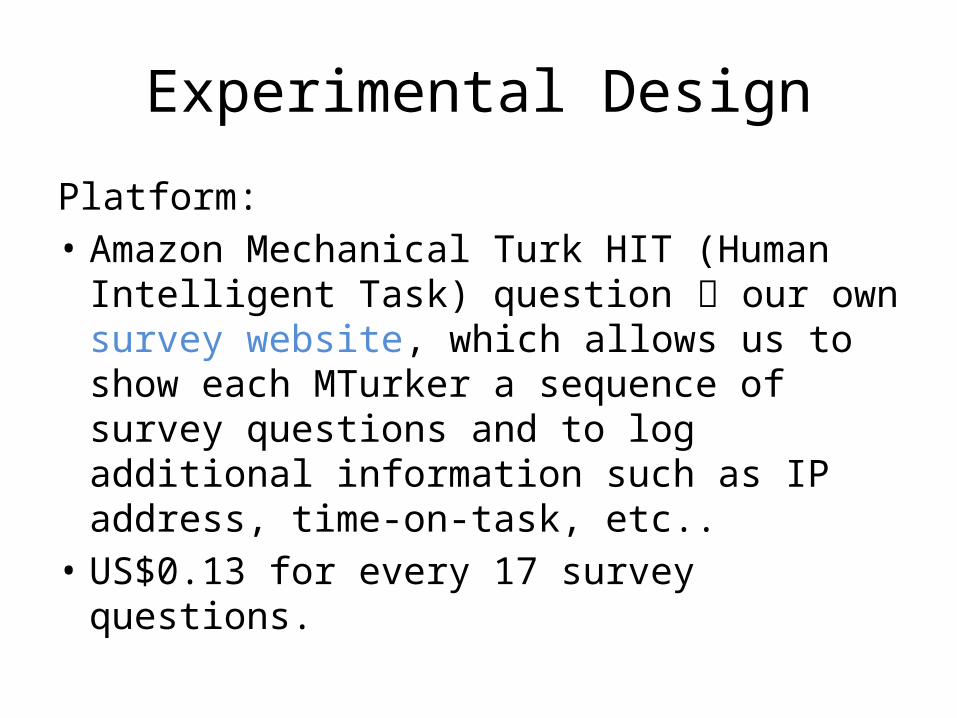
Platform: • Amazon Mechanical Turk HIT (Human
Intelligent Task) question our own survey website, which allows us to show each MTurker a sequence of survey questions and to log additional information such as IP address, time-on-task, etc..
• US$0.13 for every 17 survey questions.
Experimental Design
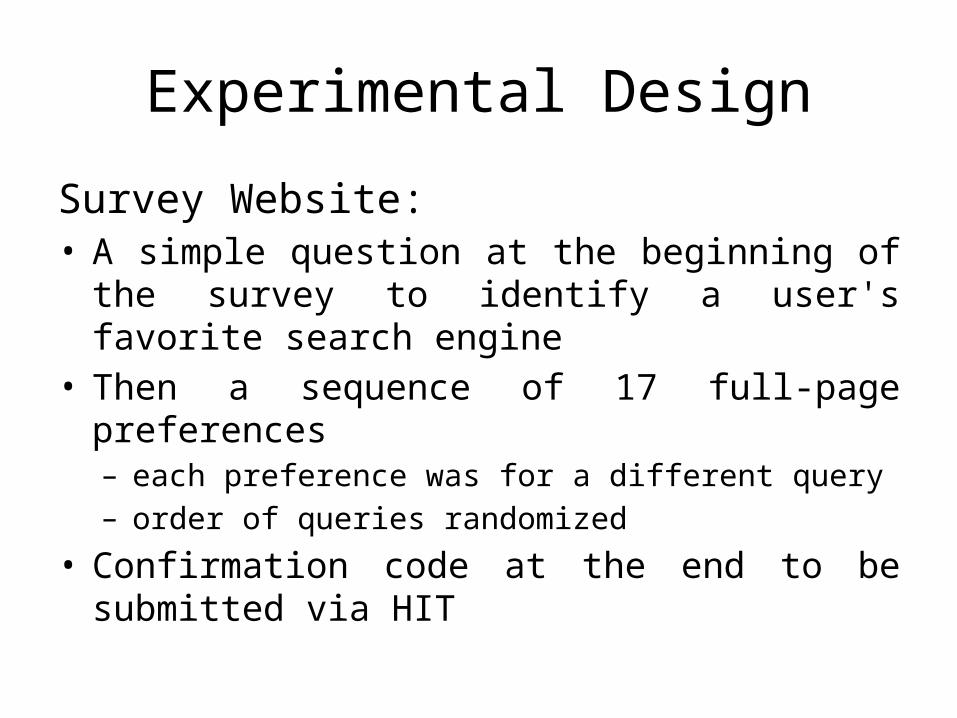
Survey Website: • A simple question at the beginning of the survey to
identify a user's favorite search engine• Then a sequence of 17 full-page preferences– each preference was for a different query– order of queries randomized
• Confirmation code at the end to be submitted via HIT
Experimental Design
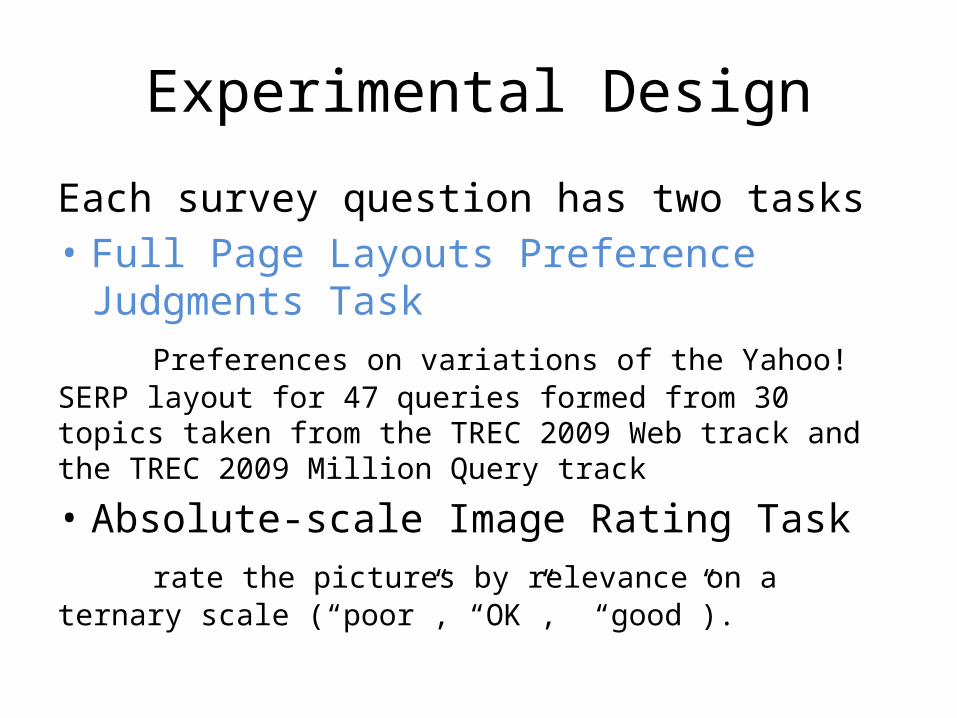
Each survey question has two tasks• Full Page Layouts Preference Judgments Task Preferences on variations of the Yahoo! SERP layout for 47 queries formed from 30 topics taken from the TREC 2009 Web track and the TREC 2009 Million Query track
• Absolute-scale Image Rating Task rate the pictures by relevance on a ternary scale (“poor”, “OK”, “good”).
Experimental Design
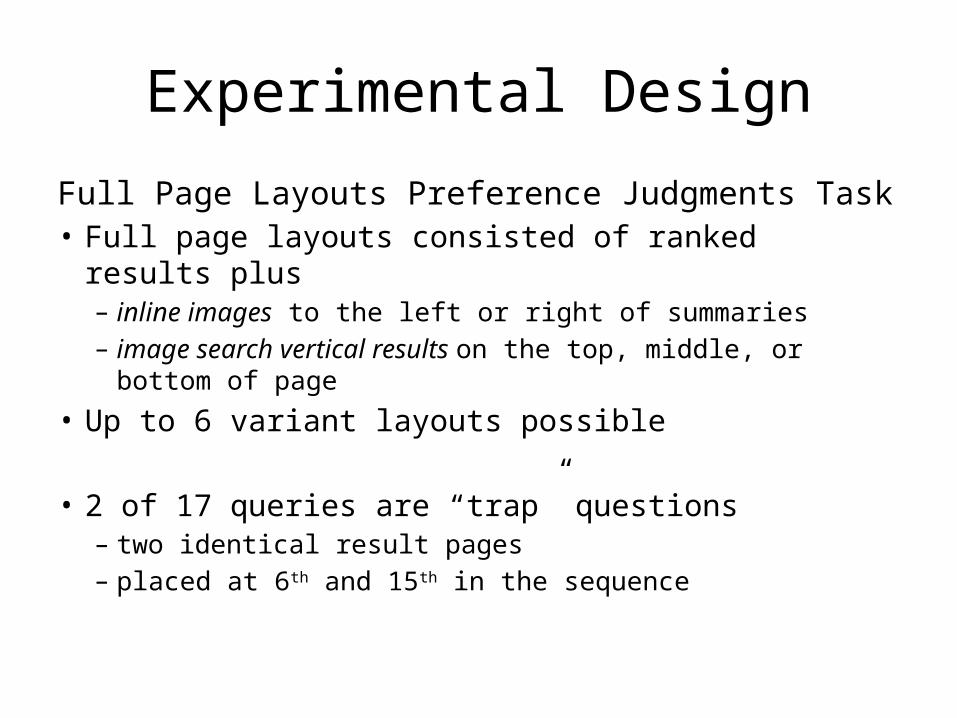
Full Page Layouts Preference Judgments Task• Full page layouts consisted of ranked results plus– inline images to the left or right of summaries– image search vertical results on the top, middle, or
bottom of page • Up to 6 variant layouts possible
• 2 of 17 queries are “trap” questions – two identical result pages– placed at 6th and 15th in the sequence
Data Analysis
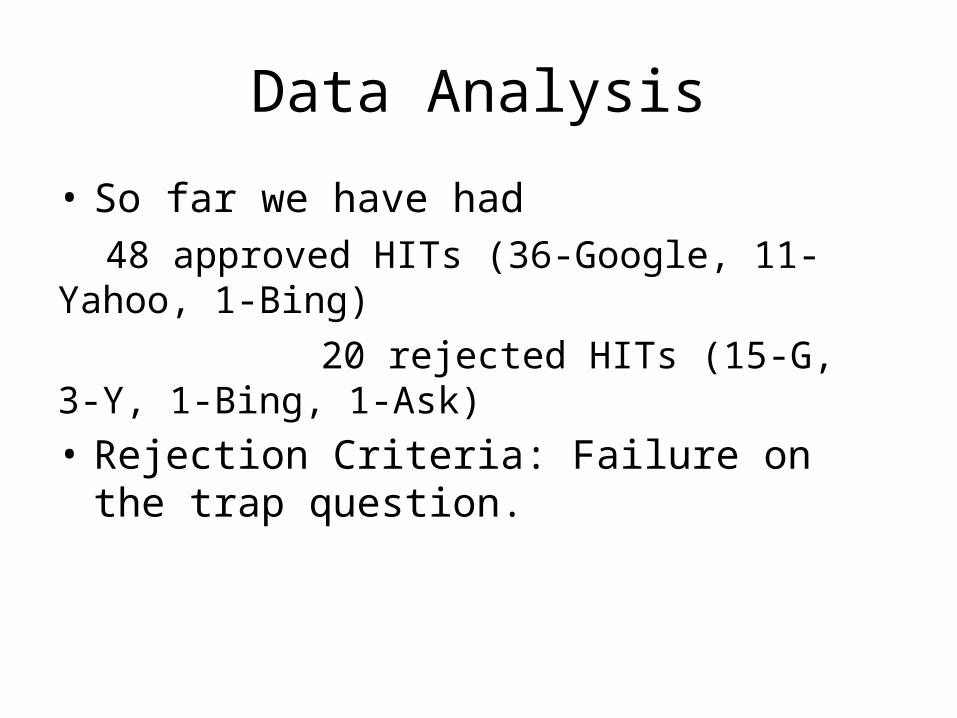
• So far we have had 48 approved HITs (36-Google, 11-Yahoo, 1-Bing)
20 rejected HITs (15-G, 3-Y, 1-Bing, 1-Ask)• Rejection Criteria: Failure on the trap question.
Analysis of Approved Data
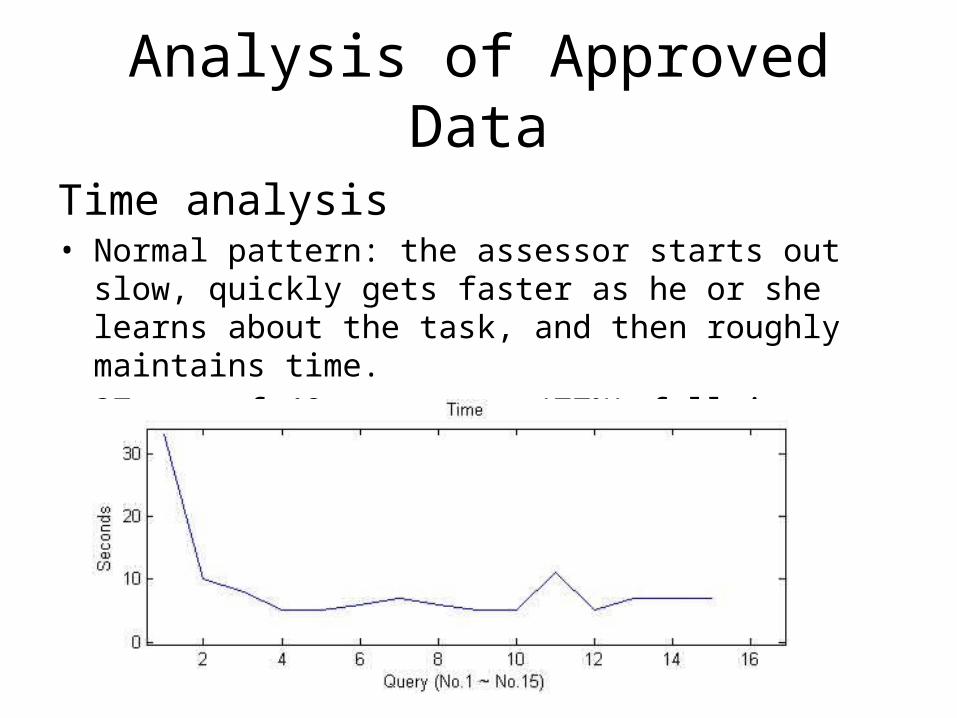
Time analysis• Normal pattern: the assessor starts out slow, quickly gets
faster as he or she learns about the task, and then roughly maintains time.
• 37 out of 48 assessors (77%) fall into this category
Analysis of Approved Data
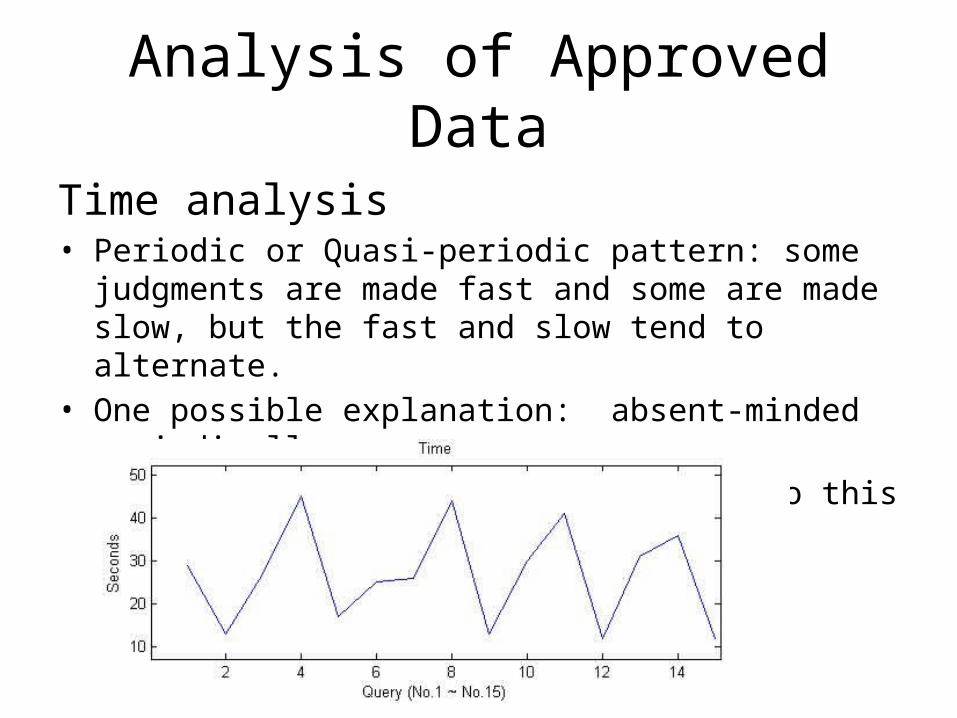
Time analysis• Periodic or Quasi-periodic pattern: some judgments are made
fast and some are made slow, but the fast and slow tend to alternate.
• One possible explanation: absent-minded periodically• 7 out of 48 assessors (15%) fall into this category
Analysis of Approved Data
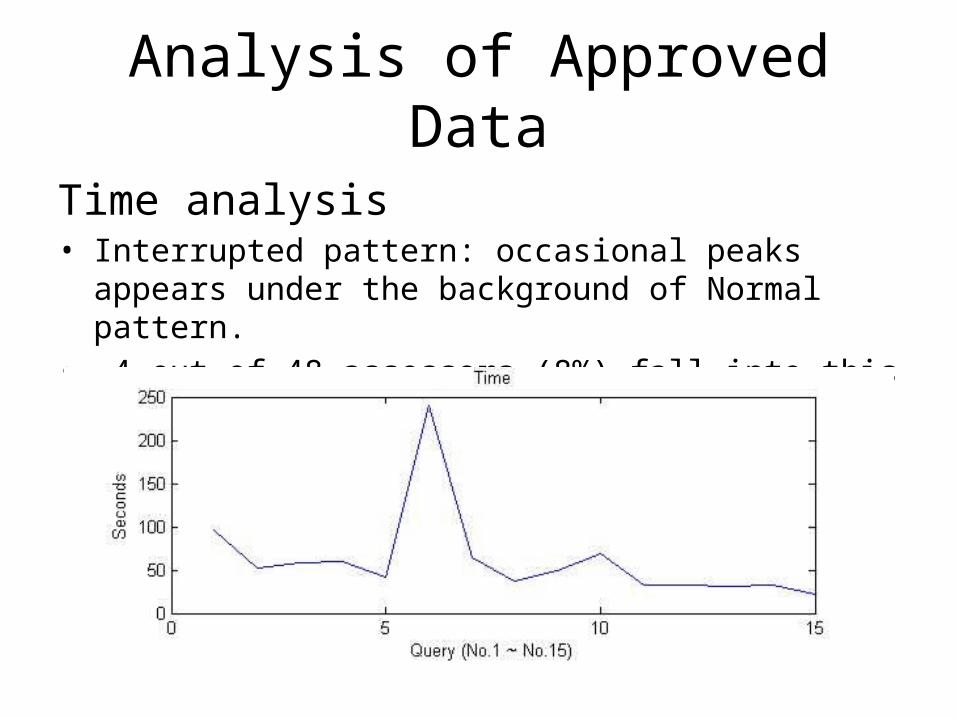
Time analysis• Interrupted pattern: occasional peaks appears under the
background of Normal pattern.• 4 out of 48 assessors (8%) fall into this category

Analysis of Approved Data
Image rating analysis• Normal pattern: Users give rating 2 or 3 most often and give
rating 1 occasionally.• 34 out of 48 assessors (71%) fall into this category
Analysis of Approved Data
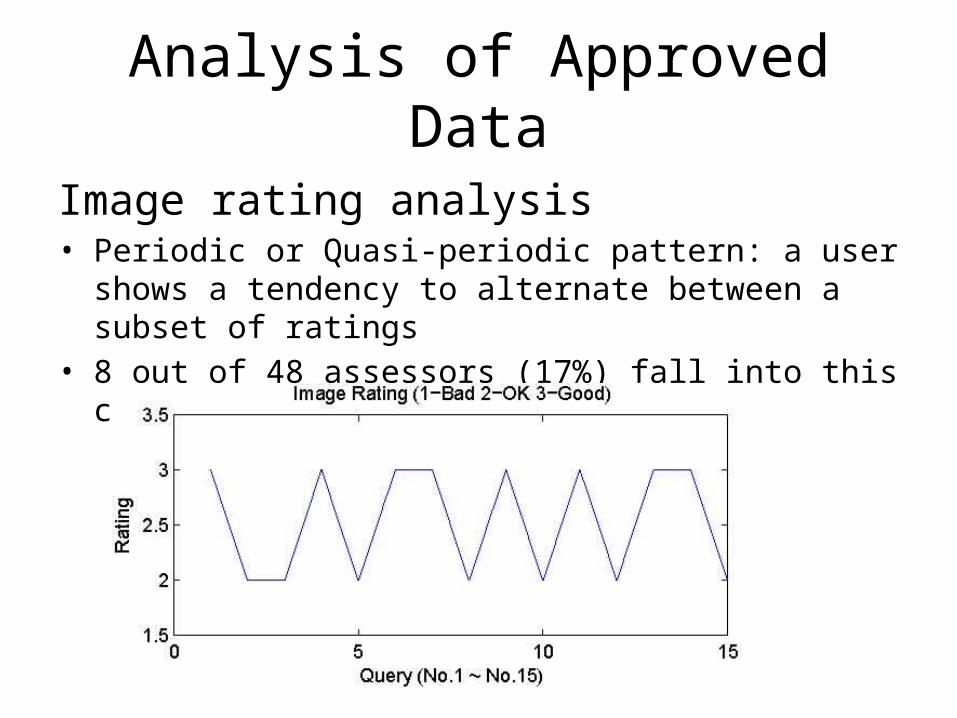
Image rating analysis• Periodic or Quasi-periodic pattern: a user shows a tendency to
alternate between a subset of ratings• 8 out of 48 assessors (17%) fall into this category

Analysis of Approved Data
Image rating analysis• Fixed pattern: all or most of the images rating are the same.• 6 out of 48 assessors (12%) fall into this category
Analysis of Approved Data
Preference judgment analysis• We analyze preference judgments for the mixed set
(both inline and vertical image results) to determine whether we can identify one or the other as the primary factor in the assessor's preference.
Analysis of Approved Data
Preference judgment analysis• We separately analyzed the inline placement and vertical
placement preferences for the time being. We assign TMB (top/middle/bottom vertical variants) and LR (left/right inline variants) scores to indicate the layout preferences according to the following method:
Given a T-B pair, if the user prefers T, we assign 1.5 as TMB score of that pair. Otherwise, we assign -1.5. Given an M-B pair, if the user prefers M, we assign 1 as TMB score of that pair. Otherwise, we assign -1. Given a T-M pair, if the user prefers T, we assign 1 as TMB score of that pair. Otherwise, we assign -1. Given an L-R pair, if the user prefers L, we assign 1 as LR score of that pair. Otherwise, we assign -1.

Analysis of Approved Data
Preference judgment analysis• Layout preference curves: moving averages of the
TMB and LR scores (red and blue lines, respectively) against query number. Window size equals to 5.
• There are roughly two patterns of layout preference curves: either only one of the scores changes over time, or both do.

Analysis of Approved Data
Preference judgment analysis• Only one of the scores changes over time. We infer from this that it is the layout
preference associated with the varying curve that is the leading factor in making preferences. 21/48 (44%) assessors showed this pattern.
•

Analysis of Approved Data
Preference judgment analysis• Both TMB and LR curves vary over time. We may need to look at each SERP pair
individually to determine if TMB and LR positions have a combinational effect on layout preference. 27/48 (56%) assessors showed this pattern.
Analysis of Rejected Data
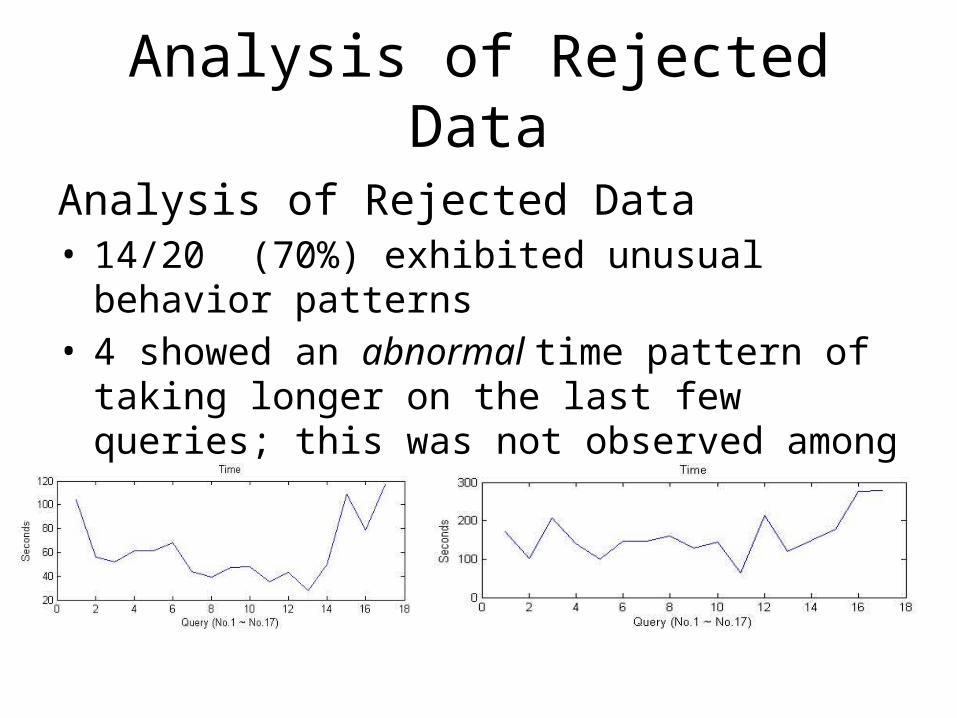
Analysis of Rejected Data• 14/20 (70%) exhibited unusual behavior patterns • 4 showed an abnormal time pattern of taking longer
on the last few queries; this was not observed among assessors that passed the trap questions.
Analysis of Rejected Data
Analysis of Rejected Data• 2 showed an interrupted time • 4 showed a fixed image rating pattern, 1 of them also
showed an interrupted time pattern• 4 showed a quasi-periodic image rating pattern, 1 of
them also showed a quasi-periodic time pattern
Conclusion
• Turkers prefer – vertical image results near the top of the page – inline image results on the left

Conclusions
• Unreliable assessors detectable– periodic timings– abnormal timings– periodic ratings– fixed ratings
• Assessors may be reliable on one task but unreliable for another
• Trap questions are useful• Trap questions in conjunction with timings/ratings filters best• MTurkers learning how to avoid being detected when
cheating

Acknowledgements
Q&A