An Additional Marker of Ventricular Dyssynchrony - CinCcinc.org/archives/2015/pdf/0077.pdf · An...
4
An Additional Marker of Ventricular Dyssynchrony Pavel Jurak 1 , Josef Halamek 1 , Filip Plesinger 1 , Tereza Reichlova 2 , Jolana Lipoldova 2 , Miroslav Novak 2 , Katerina Jurakova 1 , Pavel Leinveber 2 1 Institute of Scientific Instruments, Czech Academy of Sciences, Brno, Czech Republic 2 International Clinical Research Center – Center of Biomedical Engineering, St. Anne’s University Hospital, Brno, Czech Republic Abstract Patients suffering from heart failure with left bundle branch block (LBBB) can be effectively treated by resynchronization therapy (CRT). The ejection fraction, QRS duration (QRSd) and QRS morphology are the main selection criteria. Unfortunately, approximately one-third of CRT recipients are non-responders. Here we introduce an additional marker capable of distinguishing ventricular dyssynchrony more accurately. Methods: Ultra-high-frequency (UHF, sampling 25 kHz) 12-lead ECG, resting supine position, was measured. We analyzed 21 LBBB patients selected for CRT; the QRSd min/mean/max was 130/163/190 ms. Amplitude envelopes in the 500–1,000 Hz passband were computed and averaged with an R-wave trigger for each patient in the V1 and V6 leads. V1-V6 dyssynchrony (DYS) was computed as the time difference between UHF amplitude maximums in the V1 and V6 QRS complex region. Results: The DYS parameter min/mean/max was 1/68/115 ms. Patients with a small value of the DYS parameter, in spite of the fact that their QRS duration meets CRT criteria (>120 ms), are not expected CRT responders. The DYS parameter indicates ventricular dyssynchrony and can potentially increase the percentage of CRT responders. 1. Introduction The main clinical criteria presently used for left ventricle (LV) dyssynchrony diagnosis are based on the duration and morphology of the QRS complex. Unfortunately, the QRS descriptors still do not represent an effective tool for diagnosing LV dyssynchrony [1]. This is possibly because there has been no change of body surface ECG acquisition and interpretation for more than one hundred years. An additional source of information about cardiac electrical activity may be high-frequency (HF, 150-250 Hz) ECG [2, 3]. HF potentials amplitude rapidly decreases with increasing frequency, and signal-to-noise ratio also decreases simultaneously. The high dynamic range of the acquisition system, capable of measuring weak high frequency signals in the presence of a strong low frequency, is an essential condition to the acquisition of signals in frequency bands up to 2 kHz. This is perhaps the reason why 250 Hz represents the upper limit even though there is no physiological justification for this. An innovative technique that provides an ultra-high- frequency (UHF up to 2,000 Hz), high-dynamic-range electrocardiogram can offer new insight into ECG diagnostics. Pilot results were presented [4] on comparison of QRS width and UHF-ECG amplitude width of V leads in healthy and ischemic subjects. The results demonstrated the possibility of distinguishing ischemic patients with narrow QRS similar to normal. Here we introduce an innovative parameter derived from UHF-ECG able to measure ventricular dyssynchrony. 2. Methods 2.1. UHF-ECG acquisition An acquisition system from M&I Prague, CZ was used to sample ECG signals at 25 kHz with a dynamic range of 24 bits (10 nV resolution). Most measurements were performed in an electromagnetically shielded room (Faraday cabin – FC, MR-Schutztechnik, Dieburg, Germany, 2013) located at the International Clinical Research Center at St. Anne’s University Hospital, Brno, Czech Republic. The M&I acquisition unit is fully battery-powered, preventing any electromagnetic radiation. The digitized data were transmitted via an optic cable outside the shielded area. This technological solution eliminates the influence of external interference sources, including the 50/60 Hz electrical network and noise from telecommunications signals. 77 ISSN 2325-8861 Computing in Cardiology 2015; 42:77-80.
Transcript of An Additional Marker of Ventricular Dyssynchrony - CinCcinc.org/archives/2015/pdf/0077.pdf · An...

An Additional Marker of Ventricular Dyssynchrony
Pavel Jurak1, Josef Halamek1, Filip Plesinger1, Tereza Reichlova2, Jolana Lipoldova2, Miroslav Novak2, Katerina Jurakova1, Pavel Leinveber2
1 Institute of Scientific Instruments, Czech Academy of Sciences, Brno, Czech Republic 2
International Clinical Research Center – Center of Biomedical Engineering, St. Anne’s University Hospital, Brno, Czech Republic
Abstract
Patients suffering from heart failure with left bundle branch block (LBBB) can be effectively treated by resynchronization therapy (CRT). The ejection fraction, QRS duration (QRSd) and QRS morphology are the main selection criteria. Unfortunately, approximately one-third of CRT recipients are non-responders. Here we introduce an additional marker capable of distinguishing ventricular dyssynchrony more accurately.
Methods: Ultra-high-frequency (UHF, sampling 25 kHz) 12-lead ECG, resting supine position, was measured. We analyzed 21 LBBB patients selected for CRT; the QRSd min/mean/max was 130/163/190 ms. Amplitude envelopes in the 500–1,000 Hz passband were computed and averaged with an R-wave trigger for each patient in the V1 and V6 leads. V1-V6 dyssynchrony (DYS) was computed as the time difference between UHF amplitude maximums in the V1 and V6 QRS complex region.
Results: The DYS parameter min/mean/max was 1/68/115 ms. Patients with a small value of the DYS parameter, in spite of the fact that their QRS duration meets CRT criteria (>120 ms), are not expected CRT responders. The DYS parameter indicates ventricular dyssynchrony and can potentially increase the percentage of CRT responders.
1. Introduction
The main clinical criteria presently used for left ventricle (LV) dyssynchrony diagnosis are based on the duration and morphology of the QRS complex. Unfortunately, the QRS descriptors still do not represent an effective tool for diagnosing LV dyssynchrony [1]. This is possibly because there has been no change of body surface ECG acquisition and interpretation for more than one hundred years.
An additional source of information about cardiac electrical activity may be high-frequency (HF, 150-250 Hz) ECG [2, 3]. HF potentials amplitude rapidly decreases with increasing frequency, and signal-to-noise ratio also decreases simultaneously. The high dynamic range of the acquisition system, capable of measuring weak high frequency signals in the presence of a strong low frequency, is an essential condition to the acquisition of signals in frequency bands up to 2 kHz. This is perhaps the reason why 250 Hz represents the upper limit even though there is no physiological justification for this.
An innovative technique that provides an ultra-high-frequency (UHF up to 2,000 Hz), high-dynamic-range electrocardiogram can offer new insight into ECG diagnostics. Pilot results were presented [4] on comparison of QRS width and UHF-ECG amplitude width of V leads in healthy and ischemic subjects. The results demonstrated the possibility of distinguishing ischemic patients with narrow QRS similar to normal. Here we introduce an innovative parameter derived from UHF-ECG able to measure ventricular dyssynchrony.
2. Methods
2.1. UHF-ECG acquisition
An acquisition system from M&I Prague, CZ was used to sample ECG signals at 25 kHz with a dynamic range of 24 bits (10 nV resolution). Most measurements were performed in an electromagnetically shielded room (Faraday cabin – FC, MR-Schutztechnik, Dieburg, Germany, 2013) located at the International Clinical Research Center at St. Anne’s University Hospital, Brno, Czech Republic. The M&I acquisition unit is fully battery-powered, preventing any electromagnetic radiation. The digitized data were transmitted via an optic cable outside the shielded area. This technological solution eliminates the influence of external interference sources, including the 50/60 Hz electrical network and noise from telecommunications signals.
77ISSN 2325-8861 Computing in Cardiology 2015; 42:77-80.
2.2. Protocol and subjects
We measured and analyzed 21 left bundle branch block (LBBB) patients referred for cardiac resynchronization therapy (CRT). The UHF-ECG data were collected during 8–15 minutes in the resting supine position with a standard 12-lead electrode set-up. 25-kHz sampled raw data were filtered and down-sampled to 5 kHz with a passband of 2 kHz. UHF Solver (ISI AVCR, Brno, CZ) software was developed specifically for UHF-ECG data processing.
Figure 1. UHF-ECG processing, the output of the UHF Solver program – grouped and averaged QRS complexes and UHF envelopes of V1 and V6 leads. Top left: the result of QRS categorization, two major groups, G1 – sinus (57 %), G2 (19 %) are demonstrated. Top right – ECG of V1 and V6, group G1. Middle – averaged QRS complexes. Bottom – UHF envelopes in two frequency bands 500–1,000 Hz and 1,000–2,000 Hz. Blue colour – V1 lead, predominantly right ventricle and septum, green colour – V6 lead, left ventricle lateral wall.
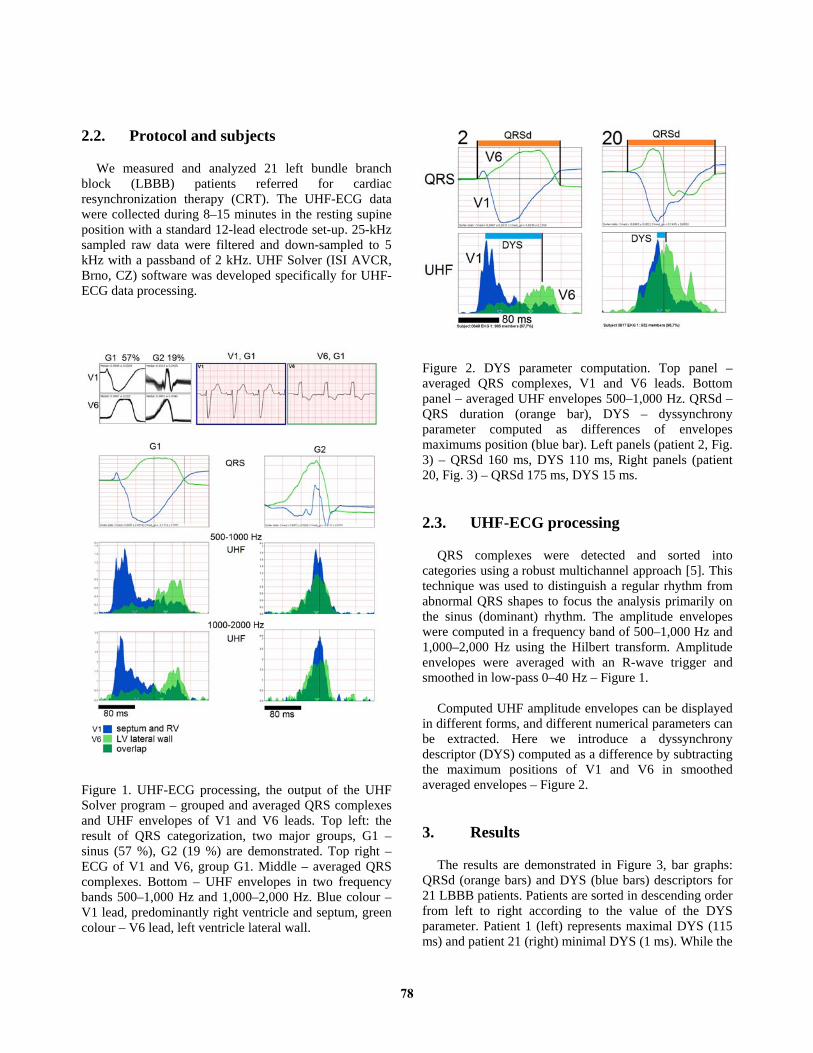
Figure 2. DYS parameter computation. Top panel – averaged QRS complexes, V1 and V6 leads. Bottom panel – averaged UHF envelopes 500–1,000 Hz. QRSd – QRS duration (orange bar), DYS – dyssynchrony parameter computed as differences of envelopes maximums position (blue bar). Left panels (patient 2, Fig. 3) – QRSd 160 ms, DYS 110 ms, Right panels (patient 20, Fig. 3) – QRSd 175 ms, DYS 15 ms.
2.3. UHF-ECG processing
QRS complexes were detected and sorted into categories using a robust multichannel approach [5]. This technique was used to distinguish a regular rhythm from abnormal QRS shapes to focus the analysis primarily on the sinus (dominant) rhythm. The amplitude envelopes were computed in a frequency band of 500–1,000 Hz and 1,000–2,000 Hz using the Hilbert transform. Amplitude envelopes were averaged with an R-wave trigger and smoothed in low-pass 0–40 Hz – Figure 1.
Computed UHF amplitude envelopes can be displayed in different forms, and different numerical parameters can be extracted. Here we introduce a dyssynchrony descriptor (DYS) computed as a difference by subtracting the maximum positions of V1 and V6 in smoothed averaged envelopes – Figure 2.
3. Results
The results are demonstrated in Figure 3, bar graphs: QRSd (orange bars) and DYS (blue bars) descriptors for 21 LBBB patients. Patients are sorted in descending order from left to right according to the value of the DYS parameter. Patient 1 (left) represents maximal DYS (115 ms) and patient 21 (right) minimal DYS (1 ms). While the
78

DYS parameter decreases continually to zero, the QRSd remains nearly the same and the decrease is minimal. Patients with a small value of the DYS parameter are not expected CRT responders [6] in spite of the fact that the QRS duration meets CRT implementation criteria (QRS >120 ms, LBBB).
Figure 3. V1-V6 dyssynchrony (DYS, blue bar) and QRS duration (QRSd, orange bar), 21 LBBB patients. A –patients with large DYS, B – mild DYS, C – minimal DYS. QRSd min/mean±SD/max was 130/163±14/190 ms. DYS min/mean±SD/max was 1/68±31/115 ms.
Figure 4 demonstrates examples of three types of patients grouped according to ventricular dyssynchrony. Group A introduces patients with great splitting of the blue and green colour – V1 and V6 envelopes. This means different timing of depolarization of the septum and LV lateral wall and large LV dyssynchrony. Patients within this group are expected to be CRT responders. Group B includes patients with different depolarization morphology and mild dyssynchrony. The CRT effect in this group can be either positive or negative. Group C introduces patients with overlapping colours. This means synchronous depolarization activation of ventricles and, therefore, minimal dyssynchrony. A positive CRT effect cannot be expected in C group.
4. Discussion
4.1. UHF-ECG origin
The ultra-high-frequency nature of the heart’s electrical activity can be found in the rapid depolarization phase of contractile cell action potentials during the opening of sodium channels. This rapid change contains a wide spectrum of oscillations and can be interpreted as a
UHF broadband transmitter. Electrical depolarization of the myocardium represents the initiation of tension in contractile cells and subsequent mechanical myocardial activity, for which reason the electrical and initiation of the mechanical activity of the ventricles can be reflected in UHF-ECG measurements.
Figure 4. Examples of averaged QRS complexes and UHF amplitudes for different QRS duration (QRSd, orange horizontal bar) and dyssynchrony (DYS, blue horizontal bar). A – patients with large DYS, B – patients with mild DYS, C – patients with minimal DYS. In each patient: top panel – averaged standard QRS complexes of V1 and V6 leads, bottom panel – averaged UHF envelopes 500–1,000 Hz (the same as Figure 2).
4.2. UHF-ECG validation
Currently, there is no available complementary technology able to measure the ventricular mechanical properties with the same time resolution as UHF-ECG. This greatly complicates direct verification of the UHF-ECG method by means of echocardiography or MRI.
Here we demonstrated a limited data set comparing QRS duration and dyssynchrony descriptors in LBBB patients. Effective indirect validation of the DYS parameter might be provided by comparing large data sets of UHF-ECG descriptors with QRS characteristic shapes in LBBB-like patients and consequently considering the positive/negative reaction of DYS and QRS duration on CRT. The study [6] presents a preliminary comparison of
79

DYS and QRSd descriptors before and during biventricular pacing and outlines a possible DYS limit of 30 ms for CRT responder identification.
4.3. Negatives and positives
UHF-ECG measures and evaluates very weak voltage potentials far below the level of microvolts sensitive to external interference sources. The lower signal-to-noise ratio can be eliminated by the prolongation of the measurement time to obtain more QRS patterns to average. Even in adverse conditions, a 10-minute measurement can provide good results.
The main positives of UHF-ECG are high temporal resolution simultaneously with simple interpretation of the results. The single-lead amplitude shape and multi-lead amplitude overlap can be easily identified, unlike the morphology of the QRS complex – see Figure 4 A. The UHF amplitude morphology is often distinct to the shape of the QRS.
An advantage of the UHF-ECG method is simplicity in implementation. There is no need to increase the number of electrodes or arrange a complicated measurement procedure. Standard 12-lead ECG electrode placement can be used to obtain UHF-ECG information about electrical activation of the myocardium.
4.4. DYS – additional marker for CRT
General studies claim that the best criteria for CRT candidate selection are a QRS duration of > 150 ms and true LBBB morphology of the QRS complex [1,8]. These guidelines state a limit QRS duration of 120 ms. However, easier and more robust tools are still required [7, 9]. Limit determinations for QRS duration are generally accepted as a questionable and inaccurate procedure. The DYS parameter might meet the desired requirements for more precise ventricular dyssynchrony estimation.
5. Conclusion
The DYS parameter, computed from UHF-ECG, provides new information about ventricular dyssynchrony and can potentially increase the percentage of cardiac resynchronization therapy responders.
Acknowledgements
The research was supported by project no. P102/12/2034 from the Grant Agency of the Czech Republic and by MEYS CR (LO1212), its infrastructure by MEYS CR and EC (CZ.1.05/2.1.00/01.0017) and by
ASCR (RVO:68081731); European Regional Development Fund – Project FNUSA-ICRC CZ.1.05/1.1.00/02.0123.
References
[1] Surawicz B. et al. AHA/ACCF/HRS recommendations for the standardization and interpretation of the electrocardiogram: part III: intraventricular conduction disturbances: a scientific statement from the American Heart Association Electrocardiography and Arrhythmias Committee, Council on Clinical Cardiology; the American College of Cardiology Foundation; and the Heart Rhythm Society: endorsed by the International Society for Computerized Electrocardiology. Circulation. 119, 235–e240 (2009).
[2] Amit G, Granot Y, Abboud S. Quantifying QRS changes during myocardial ischemia: Insights from high frequency electrocardiography. J Electrocardiol. 47, 505-11 (2014).
[3] Goldberg AL, Bhargava V, Froelicher V, Covell J. Effect of myocardial infarction on high-frequency QRS potentials. Circulation 64, 34-42 (1981)
[4] Jurak P, Halamek J, Leinveber P, Vondra V, Soukup L, Vesely P, Sumbera J, Zeman K, Martinakova L, Jurakova T, Novak M. Ultra-High-Frequency ECG Measurement. Computing in Cardiology Conference (CinC) 2013. 783-786. ISBN: 978-1-4799-0886-
[5] Plesinger F, Jurco J, Jurak P, Halamek J. Robust multichannel QRS detection. Computing in Cardiology Conference (CinC) 2014. 557–560. ISBN: 978-1-4799-4346-3.
[6] Reichlova T, Jurak P, Halamek J, Plesinger F, Lipoldova J, Novak M, Leinveber P. Cardiac Resynchronization Efficiency Estimation by New Ultra-High-Frequency ECG Dyssynchrony Descriptor Measurement. Computing in Cardiology Conference (CinC) 2015.
[7] Vernooy K, Van Deursen C, Strik M, Prinzen W. Strategies to improve cardiac resynchronization therapy. Nat. Rev. Cardiol. 11, 481–493 (2014).
[8] Turagam MK, Velagapudi P, Kocheril AG. Standardization of QRS Duration Measurement and LBBB Criteria in CRT Trials and Clinical Practice. Current Cardiology Reviews. 9, 20-23 (2013).
[9] Strauss DG, Selvester RH, Wagner GS. Defining Left Bundle Branch Block in the Era of Cardiac Resynchronization Therapy. Am J Cardiol. 107, 927–934 (2011).
Address for correspondence.
Pavel Jurak Institute of Scientific Instruments of the CAS, Kralovopolska 147, 61264 Brno, Czech Republic [email protected]
80