
Adaptive Systems Ezequiel Di Paolo Informatics A framework for adaptive behaviour.
An Adaptive Water Resources ManagementFramework With Combined Policies to ConfrontAdverse Effects and Risks Due to Population-industry Transformation Into a Floodplain AreaXueting Zeng ( [email protected] )
Capital University of Economics and BusinessJunlong Zhang
Qingdao UniversityJia Liu
Capital University of Economics and Business
Research Article
Keywords: location-entropy based PVRA model, coupla-risk analysis, stochastic-fuzzy method,population-industry transformation, scenario analysis, �oodplain
Posted Date: November 5th, 2021
DOI: https://doi.org/10.21203/rs.3.rs-890947/v1
License: This work is licensed under a Creative Commons Attribution 4.0 International License. Read Full License
1
An adaptive water resources management framework with combined policies to confront 1
adverse effects and risks due to population-industry transformation into a floodplain area 2
3
Xueting Zeng1*, Junlong Zhang2, Jia Liu3 4
5
1 Ph.D. and Professor, Capital University of Economics and Business, Beijing 10070, China; University of Regina, Regina, 6
Saskatchewan, Canada S4S 0A2; 7
2 Ph.D. and Associate Professor, Qingdao University, Qingdao 266071, China 8
3 Ph.D. and Assistant Professor, Capital University of Economics and Business, Beijing 10070, China; 9
10
Abstract In this study, an adaptive water resource management framework with combined 11
policies (AWFP) is developed for mitigating adverse effects on water resource in a floodplain 12
area due to population-industry transformation in context of coordinative development of urban 13
agglomeration. A location-entropy based PVRA model (LE-PCRA) and coupla-risk analysis 14
(CRA) can be introduced to reflect the adverse effects of industrial information and driven 15
population on water resources; meanwhile risks (including water shortage, soil loss and flood 16
control) and corresponding correlations have been shown in the risk maps. Moreover, an 17
adaptive scenario analysis based stochastic-fuzzy method (ASSF) can be embedded into an 18
AWFP to deal with multiple uncertainties and their interactions due to subjective and artificial 19
factors. The proposed AWFP is applied to a practical case study of Yongding river floodplain 20
region for confronting adverse effects on water resources due to population-industry 21
transformation in the context of coordinative development of Beijing-Tianjin-Hebei urban 22
agglomeration, China. The results were obtained to reflect the negative effects of 23
population-industry transformation and corresponding water allocation patterns in floodplain, 24
which is effective to confront natural and artificial damages (such as water deficit, water and soil 25
loss, and flood damage), risks and function degradation of floodplain contemporarily. Meanwhile, 26
2
various policy scenarios (such as farmland returning to wetland, improvement of water resource 1
utilization efficiency, water diversion and flood control) can be analyzed to support adjusting 2
current population-economy strategies and water management patterns to accommodate source 3
function of floodplain with a risk-averse and sustainable manner. 4
5
Keywords: location-entropy based PVRA model; coupla-risk analysis; stochastic-fuzzy method; 6
population-industry transformation; scenario analysis; floodplain; 7
8
3
1
1. Introduction 2
3
In the process of urban agglomeration development, the new function design of each cities based 4
on a comprehensive function for a cross-reginal collaborated goal can accelerate industrial 5
relayout and population movement. Central cities can distribute labor intensive industries to 6
backward areas for optimizing their industrial structure and release resource-environment 7
stresses, but which would bring about new ecological challenges for some backward areas. 8
Particular in some special function location areas (e.g., water source region, store floodwater 9
district, and ecological function zone) of backward areas, excessive human activities due to 10
mitigation of population and industry from core area can damage the source function to reduce 11
resource-environment carrying capacity, leading various negative effects. For instance, Yongding 12
river floodplain in Hebei province has been undertaken the responsibility of protecting the flood 13
control safety of Beijing, Tianjin and Hebei areas. However, in the context of coordinative 14
development of Beijing-Tianjin-Hebei urban agglomeration, intensive development and 15
construction due to population-industry transformation (into floodplain) can increases the risk of 16
disaster potential loss and flood control investment. Meanwhile, the urbanization process can 17
seriously damag the capacity of soil storage, and changes the surface circulation characteristics 18
of precipitation. In addition, the excessive exploitation and utilization of water resources will 19
easily lead toincreased water shortages, lower groundwater levels, serious soil erosions and other 20
ecological problems in floodplain areas (Rong et al., 2019). Therefore, how to identify the 21
adverse influence on floodplain in response to excessive human activities (due to 22
population-industry transformation) becomes an important issue for constructing an adaptive 23
4
water resources management framework urban agglomeration development. 1
2
Previously, various research works have addressed the negative effects from excessive human 3
activities in a floodplain area. For instance, Olsen et al., (2000) analyzed the impacts of human 4
activities (including land-use changes, channel modifications, and economic development) on 5
flood storage and detention areas, where all above nonstationary conditions, variability and risk 6
can be handled by a dynamic floodplain management model. Knox (2006) used historical data 7
over long periods to reflect the effects of agricultural land use exploitation on floodplain 8
sedimentation, hydrologic alteration and geomorphic changes, which would increase flood risk. 9
Horta et al., (2016) developed an enhanced stochastic frontier panel model and location-entropy 10
method to reflect the negative correlation between population development and natural resources 11
supply in the processes of urbanization. Zeng et al., (2021) explored a GIS and PSR evolution 12
method to identify various risk (water shortage, flooding, soil erosion and pollution) caused by 13
population growth and economic development in a floodplain. In general, previous research 14
works have focused on simulation method, GIS, risk assessment system and statistic analysis 15
model to reflect the effect of human activities on water stress in a floodplain, which indicated 16
that population-economy development would bring about great challengea for human-water 17
relationship. Therefore, numbers of effective manners (e.g., optimization method, adaptive 18
management mode and policy analysis) have been proposed to balance the relationship between 19
human activities and water resource management. For example, Simmons (2007) developed the 20
concept of living with water as a complex entity to reflect the interaction between two natural 21
cycles (including human economy the earth's hydrological system) with three levels (individual, 22
social, and ecological), which would attest technical means (capture, storage, and irrigation) 23
5
reducing water deficit, but leading greater uncertainty. Sanon et al., (2012) proposed a multi 1
criteria decision method to address trade-offs between the stakeholder's objectives related to 2
management options for the restoration of an urban floodplain in the context of urban expansion, 3
which can support for generating useful management cost and flood risk control. Zeng et al., 4
(2017) have developed wetland trading mechanism and withdrawn farmland project to reduce the 5
damage of excessive human activities in a floodplain, which can reduce water shortage in 6
drought season. Zhang and Zhang (2020) have used a multi-objective optimization with swarm 7
intelligence approach to predict water demand and water utilization, with aim to generate an 8
effective regulation (policy) for economic, social and ecological water consumption patterns in 9
the future. 10
11
However, there are numbers of uncertainties and their interactions between human activities and 12
water resouces management, which would increase the difficulty of generating effective and 13
adaptive policies in floodplain. For example, random precipitation caused by climate change can 14
result in spatial and temporal variations (such as extreme rainfall) in water availability, which 15
can be deemed as the stochastic factors to drive floods and droughts, making net system benefits 16
fluctuation. Meanwhile, population-industry transformation into floodplain can bring about new 17
water utilization structures, which would lead varieties in water demands. Moreover, the process 18
of urbanization can damage the source function of floodplain (e.g., the capacity of soil storage, 19
the surface circulation characteristics of precipitation), which would increase the risks of flood 20
control and water shortage. Under these situations, multiple uncertainties and their interactions 21
can enhance the complexity of water resources management in a floodplain area, which requires 22
more robust manners. Therefore, a two-stage stochastic programming (TSP) has been introduced 23
6
to reflect tradeoff between dynamic water demand and random water flow in a floodplain, which 1
can built a linkage between regulated policies and economic penalties based on recourse actions 2
if the pre-regulated targets are violated (Guo and Huang, 2009; Zeng et al., 2018). However, TSP 3
has difficulty in dealing with fuzzy information due to data deficit or error data acquirement. 4
Thus, a fuzzy programming (FP) can be joined to handle these fuzziness to increase the 5
expression of ambiguity (Freeze, et al., 1990; Huang and Loucks, 2000; Inuiguchi, 2012; Zeng, 6
et al., 2019). Moreover, a scenario analysis can be introduced to reflect the potential future 7
outcomes directly, which is effective to support generating effective and adaptive policies in a 8
floodplain area (Peterson , et al., 2003; Swarta, et al., 2004; Pingale, et al., 2014; Kumar et al., 9
2016; Rong et al., 2019). Nevertheless, previous research works have few paid attention to 10
hybrid methods (e.g., TDSP, FCP and SA) into an adaptive water resource management 11
framework to deal with uncertain information for confronting adverse effects on a floodplain 12
due to population-industry transformation in Beijing-Tianjin-Hebei urban agglomeration, China 13
14
Therefore, the objective of this study is developing an adaptive water resource management 15
framework with combined policies (AWFP) for mitigating adverse effects and risks on a 16
floodplain due to population-industry transformation in an urban agglomeration. A 17
location-entropy based PVRA model (LE-PVRA) can be introduced to reflect the adverse effects 18
of industrial information and driven population on water resources and risks (including water 19
shortage, soil loss and flood control) into floodplain in the processes of urban agglomeration. 20
Meanwhile, a coupla-risk analysis method can be joined to reflect risks (including water shortage, 21
soil loss and flood control risks) and corrresponding correlations in risk maps. Moreover, an 22
adaptive scenario analysis based stochastic-fuzzy method (ASSF) can be embedded into an 23
7
AWMF to deal with multiple uncertainties. The proposed AWFP is applied to a practical case 1
study of Yongding river floodplain region, China. The results were obtained to reflect the 2
negative effects of population-industry transformation in the context of coordination of 3
Beijing-Tianjin-Hebei urban agglomeration and corresponding damages and function 4
degradation of floodplain contemporarily. Meanwhile, the obtained results under various policy 5
scenarios (such as farmland returning to wetland, improvement of water resource utilization 6
efficiency, water diversion and flood control) can be designed to recover source function of 7
floodplain, which is effective to adjust current population-economy strategies and water 8
management patterns with a risk-averse and sustainable manner. 9
10
2. Materials and methods 11
12
2.1 Case study 13
14
Yongding river floodplain, with the total area of 522.65km2 , is located in the boundary of Hebei 15
province, near to Beijing and Tianjin cities, which has been undertaken the responsibility of 16
protecting the flood control safety of Beijing, Tianjin and Hebei areas. In half past century, it has 17
always been considered as an effective measure to enhance the flood storage capacity of water 18
conservancy projects and reduce the flood disaster in Beijing-Tianjin-Hebei region (BTH). 19
Meanwhile, since it is seated in semi-arid climate zone and warm temperate zone, the weather 20
condition is suitable for irrigation. Thus, more land resources have been exploited as irrigative 21
land in recent decades, which can support the pillar position of agriculture in Hebei province. 22
23

8
However, in context of coordination of Beijing-Tianjin-Hebei urban agglomeration (BTHUA), 1
numbers of backward industries have been transferred to Hebei province due to new function 2
design of BTHUA. Under these situations, more population can be driven by industrial 3
transformation, which would bring about negative impacts on Yongding river floodplain as 4
follows (Men, et al., 2017): (a) industrial transformation and driven population to Yongding river 5
floodplain can increase water demand, which would fortify water stress particular in dry season. 6
Meanwhile, changed water use pattern due to population- industry transformation can accelerate 7
excessive water utilization and exploitation, which would make more ecological water being 8
occupied, leading the capacity of water resource conservation reduced. (b) persistent high 9
population density and dense economic distribution in flood storage and detention areas can 10
damage the function of floodplain, which would increases the risk of disaster potential loss and 11
flood control investment. Meanwhile, the urbanization process leads to the weakening of the 12
permeability of the underlying surface in the flood storage and detention areas, which seriously 13
destroyed the capacity of soil storage and storage. (c) irrational irrigative scheme and excessive 14
exploitation of water resources can lead soil erosion as the rain washed away, which would 15
generate degeneration of source function of floodplain, leading increased water shortages, lower 16
groundwater levels and other problems. (d) the disturbance of climate change can also increases 17
the risk of disaster in a floodplain area, which would increase the randomness of rainfall and 18
available water resources, leading difficulty of water resources management. Therefore, how to 19
confront new challenges due to population-industry transformation (PIT) into floodplain would 20
be an import issue for policymakers as follows: Firstly, how to identify the negative effects on 21
water resource and corresponding risks based on PIT in Yongding river floodplain would be the 22
first step for realization of damages and analysis of causes due to to excessive human activities. 23
9
Secondly, how to balance the relationship between human-water in Yongding river floodplain 1
should be reconsidered, where numbers of engineering techniques (such as withdrawn farmland 2
project, wetland construction and water diversion) and policy regulations (such as 3
population-economy policy and water management pattern) would be the effective manners for 4
mitigating the damage to source function of floodplain due to PIT. Thirdly, how to deal with 5
objective and subjective uncertainties in water resource management would be a key to improve 6
the currency of water resource management with a risk-averse and robust manner. 7
8
2.2 Method development 9
10
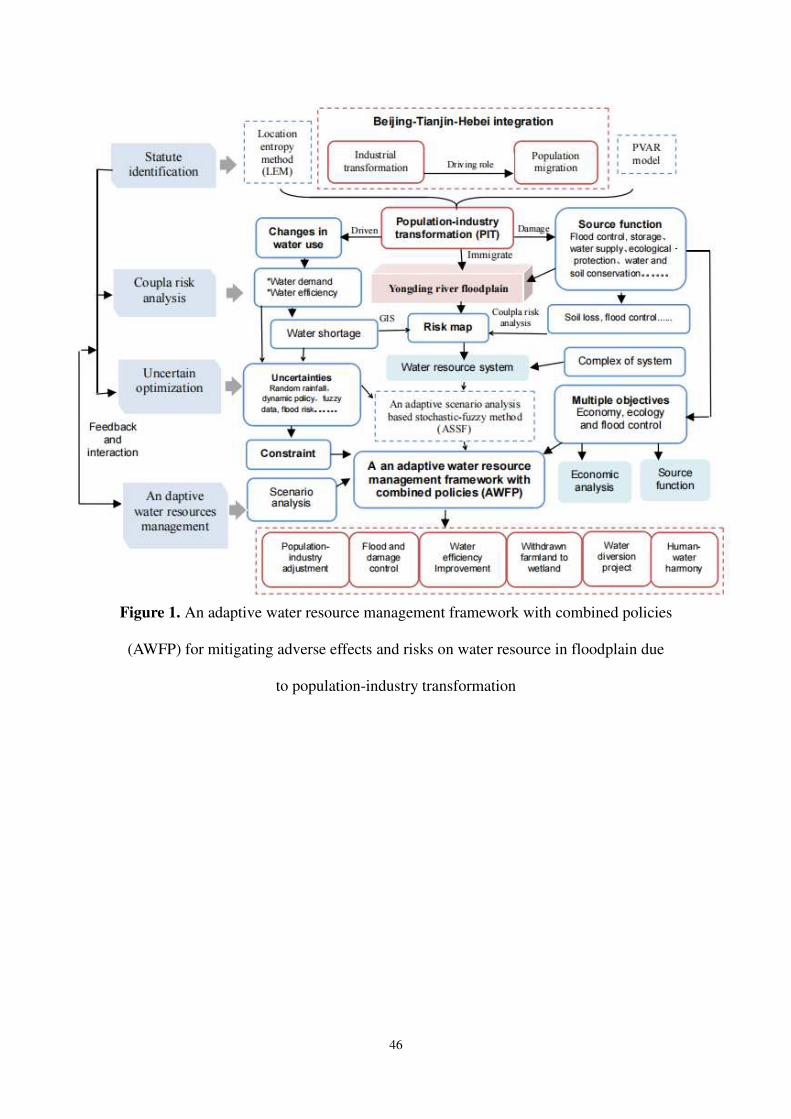
In this study, an adaptive water resource management framework with combined policies (AWFP) 11
has been developed for balancing human-water relationship in floodplain in the context of 12
coordinative development of Beijing-Tianjin-Hebei urban agglomeration (CD-BTH) (as shown 13
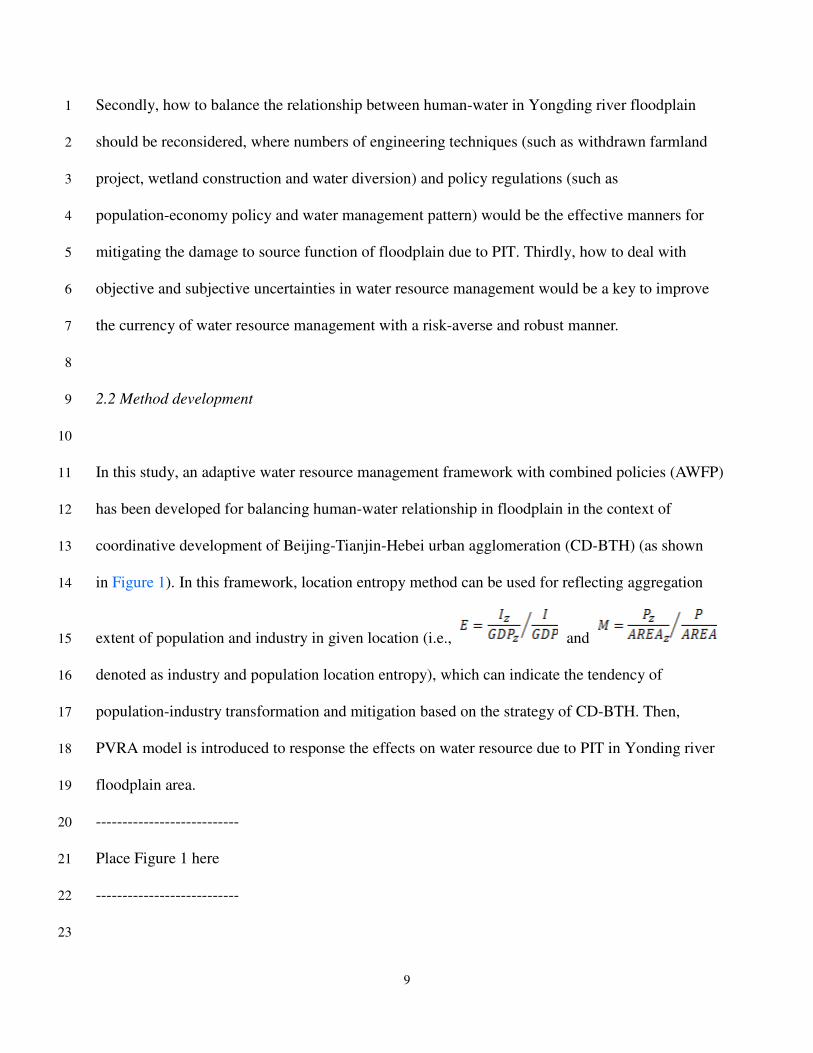
in Figure 1). In this framework, location entropy method can be used for reflecting aggregation 14
extent of population and industry in given location (i.e., and 15
denoted as industry and population location entropy), which can indicate the tendency of 16
population-industry transformation and mitigation based on the strategy of CD-BTH. Then, 17
PVRA model is introduced to response the effects on water resource due to PIT in Yonding river 18
floodplain area. 19
--------------------------- 20
Place Figure 1 here 21
--------------------------- 22
23
10
Under these situations, water use pattern has been changed by industrial transformation and 1
driven population in Yonding river floodplain, which would consumed more water resource, 2
damage the capacity of soil conservation and increase the potential flood loss, enhancing various 3
risk levels in a long term (Johannes and Leeuwen, 2017). Therefore, according to current 4
population-economy scale in study region, a risk caculation system conbiming Geographic 5
Information System (GIS) can be used for reflecting various risks, which would includes various 6
indicators associated with water and soil erosion, flooding risk and water shortage. In this risk 7
caculation system, the risk of soil loss can be assessed based empirical model RUSLE (Revised 8
Universal Soil Loss Equation) based on different land use types in the Yongding River basin (e.g., 9
PCSLKRA ) (Liu et al., 2011). Moreover, risk of water shortage can be analyzed on 10
water use patterns and land use types. However, all of these indivual risks can be influnced by 11
different objective and subjective factors, which would express as respective uncertainties. 12
Meanwhile, the traditional risk caculation system can not reflect the correlation of two risks, 13
which require an effective manner to response the correlation between different risks and 14
indicators. Thus, a Coupla function can be introduced into GIS to calculate the dependence of 15
multidimensional variables (or indicators) as following steps: 16
17
Step 1: Selecting the relevant indcators within different risk types, then classifying the damage 18
and risk levels as m levels. 19
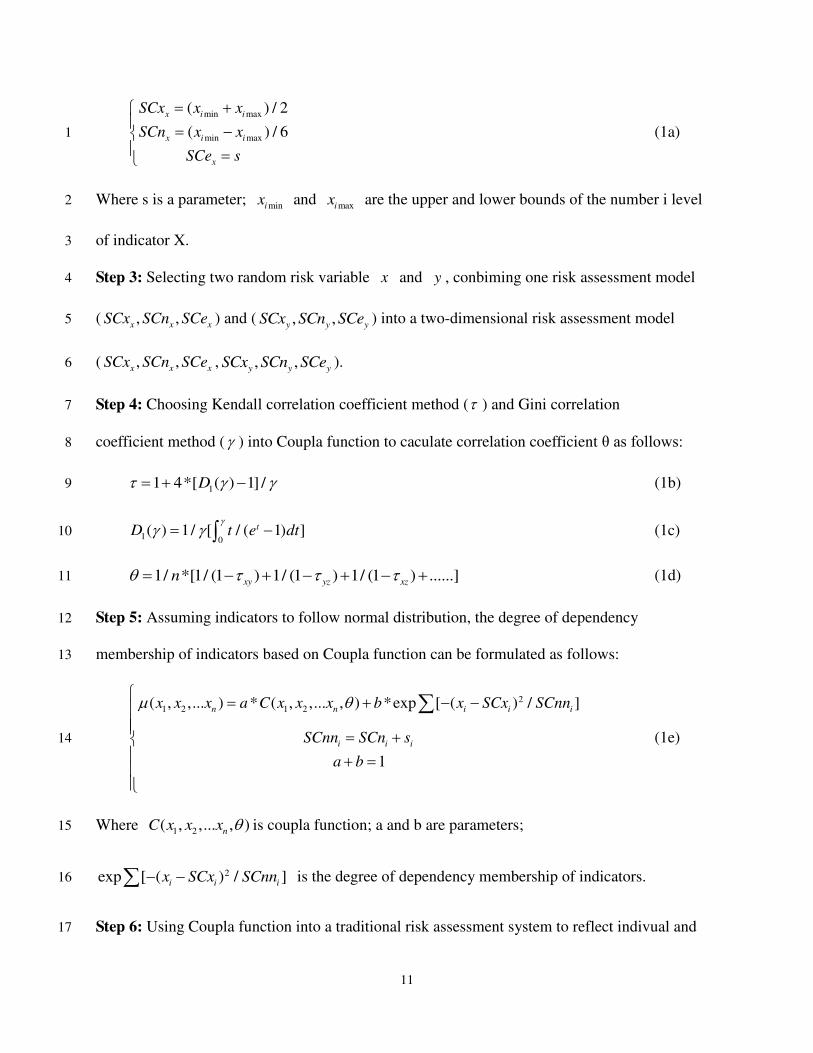
Step 2: Based on n damage levels in m selected indicators, constructing one risk assessment 20
model according to characteristic value ( , ,x x x
SCx SCn SCe ), which includes assumption of the 21
upper and lower bounds of the number i level of indicator X as ( min max,i i
x x ) as follows: 22
11
min max
min max
( ) / 2
( ) / 6
x i i
x i i
x
SCx x x
SCn x x
SCe s
(1a) 1
Where s is a parameter; mini
x and maxi
x are the upper and lower bounds of the number i level 2
of indicator X. 3
Step 3: Selecting two random risk variable x and y , conbiming one risk assessment model 4
( , ,x x x
SCx SCn SCe ) and ( , ,y y y
SCx SCn SCe ) into a two-dimensional risk assessment model 5
( , ,x x x
SCx SCn SCe , , ,y y y
SCx SCn SCe ). 6
Step 4: Choosing Kendall correlation coefficient method ( ) and Gini correlation 7
coefficient method ( ) into Coupla function to caculate correlation coefficient θ as follows: 8
11 4*[ ( ) 1] /D (1b) 9
1 0( ) 1/ [ / ( 1) ]tD t e dt
(1c) 10
1/ *[1/ (1 ) 1/ (1 ) 1/ (1 ) ......]xy yz xz
n (1d) 11
Step 5: Assuming indicators to follow normal distribution, the degree of dependency 12
membership of indicators based on Coupla function can be formulated as follows: 13
21 2 1 2( , ,... ) * ( , ,... , ) *exp [ ( ) / ]
1
n n i i i
i i i
x x x a C x x x b x SCx SCnn
SCnn SCn s
a b
(1e) 14
Where 1 2( , ,... , )n
C x x x is coupla function; a and b are parameters; 15
2exp [ ( ) / ]i i ix SCx SCnn is the degree of dependency membership of indicators. 16
Step 6: Using Coupla function into a traditional risk assessment system to reflect indivual and 17
12
correlative risks, then draw a risk map. 1
2
Based on various risks (coulpla risk analysis) due to population-industry transformation (PIT) in 3
Yonding river floodplain, a comprenhensive plan with various policy scenarios should be 4
considered to achevie sustainability of human activities and water resource management. 5
However, in the processes of making policy decision, numbers of uncertainties (such as random 6
precipitation due to climate change, mutative water utilization demand due to population- 7
industry transformation, dynamic policy due to the coordination of BTH and fuzzy engineering 8
effects and benefits) can fortify the complexity of an AWFP issue. All above reasons can 9
increase the difficulty of generation of adaptive policies to confront the conflict between 10
population-economy development and water resource management in study region. Therefore, an 11
adaptive scenario analysis based stochastic-fuzzy method (ASSF) has been developed to handle 12
these uncertainties (as shown in Appendix 1). 13
----------------------------- 14
Place Appendix 1 here 15
----------------------------- 16
17
2.3 Modeling formulation 18
19
In study region, policymakers of floodplain are responsible for allocating water resources to 20
satisfy the demands for population-economy development in dry season; meanwhile they take 21
charge of minimizing the flood damage in flooding season. In the context of the coordination of 22
BTH, population-industry transformation into floodplain can increase expected water demand, 23
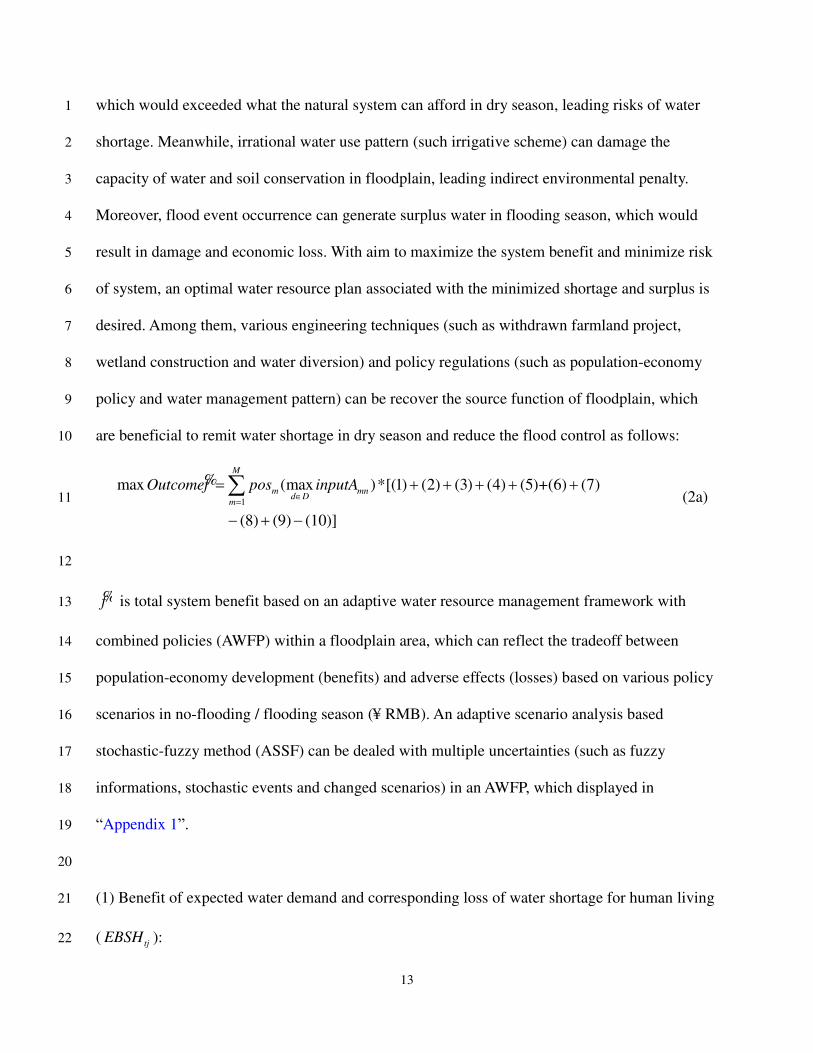
13
which would exceeded what the natural system can afford in dry season, leading risks of water 1
shortage. Meanwhile, irrational water use pattern (such irrigative scheme) can damage the 2
capacity of water and soil conservation in floodplain, leading indirect environmental penalty. 3
Moreover, flood event occurrence can generate surplus water in flooding season, which would 4
result in damage and economic loss. With aim to maximize the system benefit and minimize risk 5
of system, an optimal water resource plan associated with the minimized shortage and surplus is 6
desired. Among them, various engineering techniques (such as withdrawn farmland project, 7
wetland construction and water diversion) and policy regulations (such as population-economy 8
policy and water management pattern) can be recover the source function of floodplain, which 9
are beneficial to remit water shortage in dry season and reduce the flood control as follows: 10
1
max (max )*[(1) (2) (3) (4) (5)+(6) (7)
(8) (9) (10)]
M
m mnd D
m
Outcomef pos inputA
% (2a) 11
12
f% is total system benefit based on an adaptive water resource management framework with 13
combined policies (AWFP) within a floodplain area, which can reflect the tradeoff between 14
population-economy development (benefits) and adverse effects (losses) based on various policy 15
scenarios in no-flooding / flooding season (¥ RMB). An adaptive scenario analysis based 16
stochastic-fuzzy method (ASSF) can be dealed with multiple uncertainties (such as fuzzy 17
informations, stochastic events and changed scenarios) in an AWFP, which displayed in 18
“Appendix 1”. 19
20
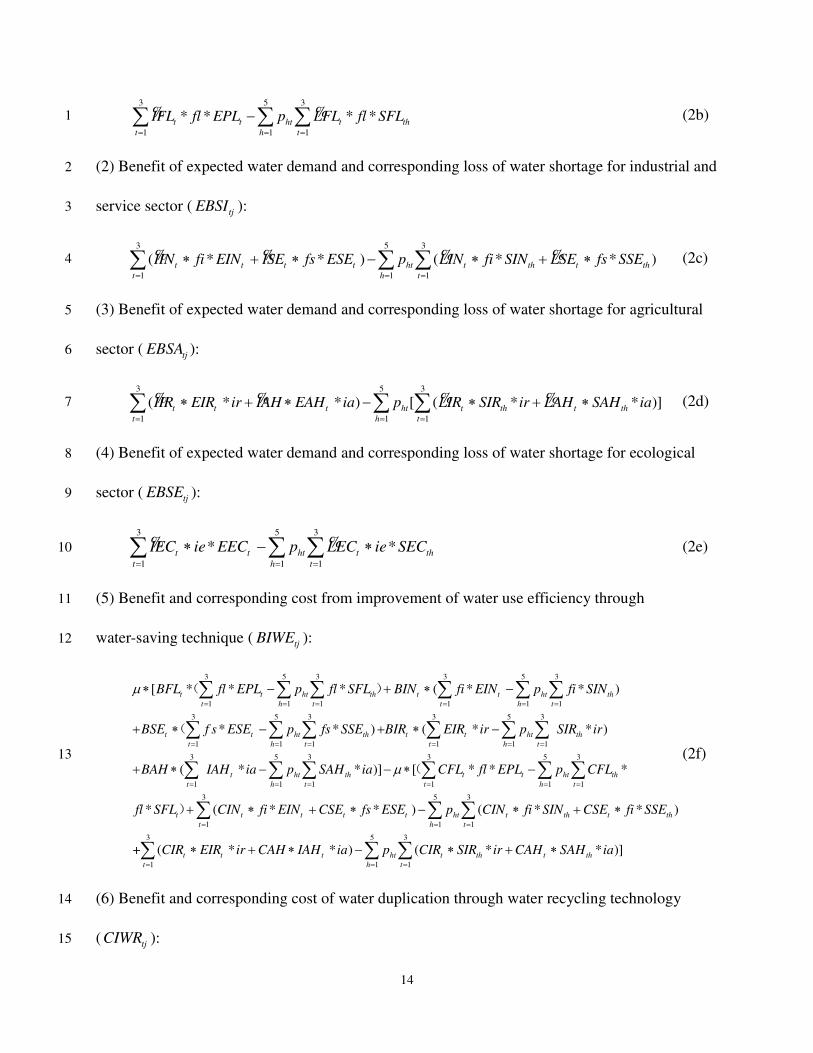
(1) Benefit of expected water demand and corresponding loss of water shortage for human living 21
( tjEBSH ): 22
14
3 5 3
1 1 1
* * * *t t ht t th
t h t
IFL fl EPL p LFL fl SFL
% % (2b) 1
(2) Benefit of expected water demand and corresponding loss of water shortage for industrial and 2
service sector ( tjEBSI ): 3
3 5 3
1 1 1
( * * ) ( * * )t t t t ht t th t th
t h t
IIN fi EIN ISE fs ESE p LIN fi SIN LSE fs SSE
% % % % (2c) 4
(3) Benefit of expected water demand and corresponding loss of water shortage for agricultural 5
sector ( tjEBSA ): 6
3 5 3
1 1 1
( * * ) [ ( * * )]t t t ht t th t th
t h t
IIR EIR ir IAH EAH ia p LIR SIR ir LAH SAH ia
% % % % (2d) 7
(4) Benefit of expected water demand and corresponding loss of water shortage for ecological 8
sector ( tjEBSE ): 9
3 5 3
1 1 1
* *t t ht t th
t h t
IEC ie EEC p LEC ie SEC
% % (2e) 10
(5) Benefit and corresponding cost from improvement of water use efficiency through 11
water-saving technique ( tjBIWE ): 12
3 5 3 3 5 3
1 1 1 1 1 1
3 5 3 3 5 3
1 1 1 1 1 1
3
1
[ * * * ( * * )
* * ) ( * * )
( * *
t t ht th t t ht th
t h t t h t
t t ht th t t ht th
t h t t h t
t ht th
t
BFL fl EPL p fl SFL BIN fi EIN p fi SIN
BSE f s ESE p fs SSE BIR EIR ir p SIR ir
BAH IAH ia p SAH ia
( )
(
5 3 3 5 3
1 1 1 1 1
3 5 3
1 1 1
3 5
1 1
)] [ * * *
* ( * * ) ( * * )
+ ( * * ) ( *
t t ht th
h t t h t
t t t t t ht t th t th
t h t
t t t ht t th t
t h
CFL fl EPL p CFL
fl SFL CIN fi EIN CSE fs ESE p CIN fi SIN CSE fi SSE
CIR EIR ir CAH IAH ia p CIR SIR ir CAH S
(
)
3
1
* )]th
t
AH ia
(2f) 13
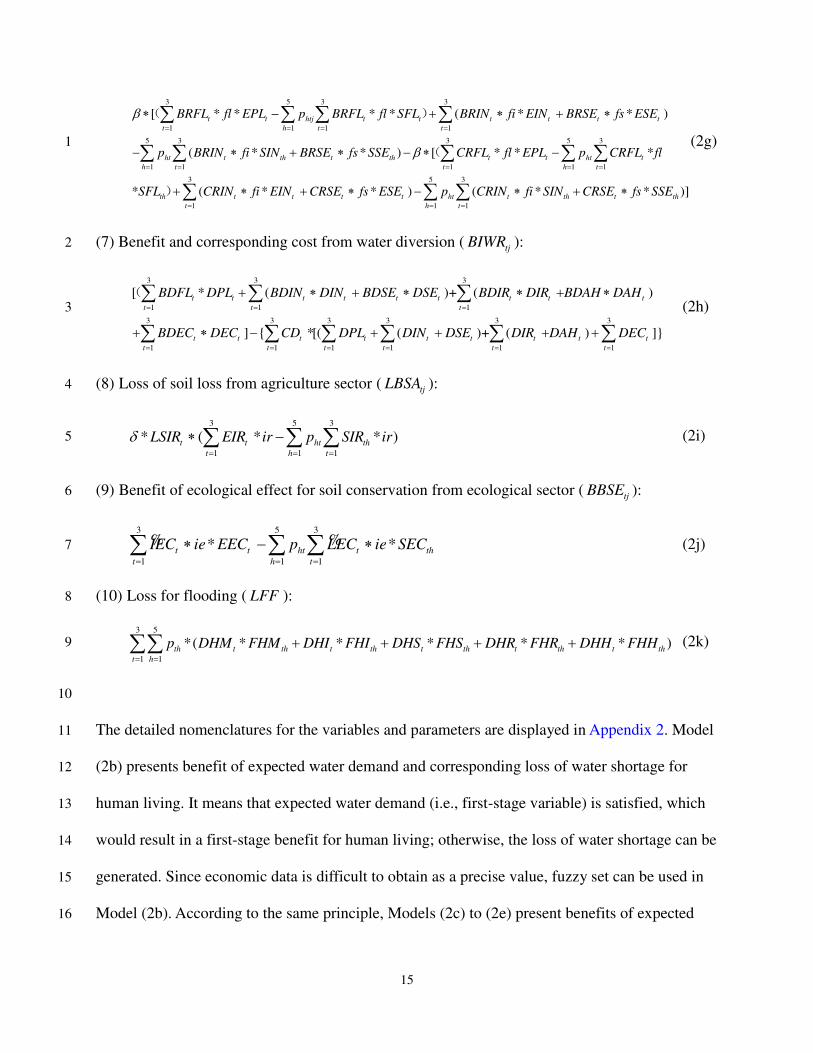
(6) Benefit and corresponding cost of water duplication through water recycling technology 14
( tjCIWR ): 15
15
3 5 3 3
1 1 1 1
5 3 3 5 3
1 1 1 1 1
[ * * * * ( * * )
( * * ) [ * * *
* ( *
t t htj t t t t t t
t h t t
ht t th t th t t ht t
h t t h t
th t t
BRFL fl EPL p BRFL fl SFL BRIN fi EIN BRSE fs ESE
p BRIN fi SIN BRSE fs SSE CRFL fl EPL p CRFL fl
SFL CRIN fi EIN C
( )
(
)3 5 3
1 1 1
* ) ( * * )]t t ht t th t th
t h t
RSE fs ESE p CRIN fi SIN CRSE fs SSE
(2g) 1
(7) Benefit and corresponding cost from water diversion ( tjBIWR ): 2
3 3 3
1 1 1
3 3 3 3 3 3
1 1 1 1 1 1
[ * ( )+ ( )
] { *[( ( )+ ( ) ]}
t t t t t t t t t
t t t
t t t t t t t t t
t t t t t t
BDFL DPL BDIN DIN BDSE DSE BDIR DIR BDAH DAH
BDEC DEC CD DPL DIN DSE DIR DAH DEC
( (2h) 3
(8) Loss of soil loss from agriculture sector ( tjLBSA ): 4
3 5 3
1 1 1
* ( * * )t t ht th
t h t
LSIR EIR ir p SIR ir
(2i) 5
(9) Benefit of ecological effect for soil conservation from ecological sector ( tjBBSE ): 6
3 5 3
1 1 1
* *t t ht t th
t h t
IEC ie EEC p LEC ie SEC
% % (2j) 7
(10) Loss for flooding ( LFF ): 8
3 5
1 1
*( * * * * * )th t th t th t th t th t th
t h
p DHM FHM DHI FHI DHS FHS DHR FHR DHH FHH
(2k) 9
10
The detailed nomenclatures for the variables and parameters are displayed in Appendix 2. Model 11
(2b) presents benefit of expected water demand and corresponding loss of water shortage for 12
human living. It means that expected water demand (i.e., first-stage variable) is satisfied, which 13
would result in a first-stage benefit for human living; otherwise, the loss of water shortage can be 14
generated. Since economic data is difficult to obtain as a precise value, fuzzy set can be used in 15
Model (2b). According to the same principle, Models (2c) to (2e) present benefits of expected 16
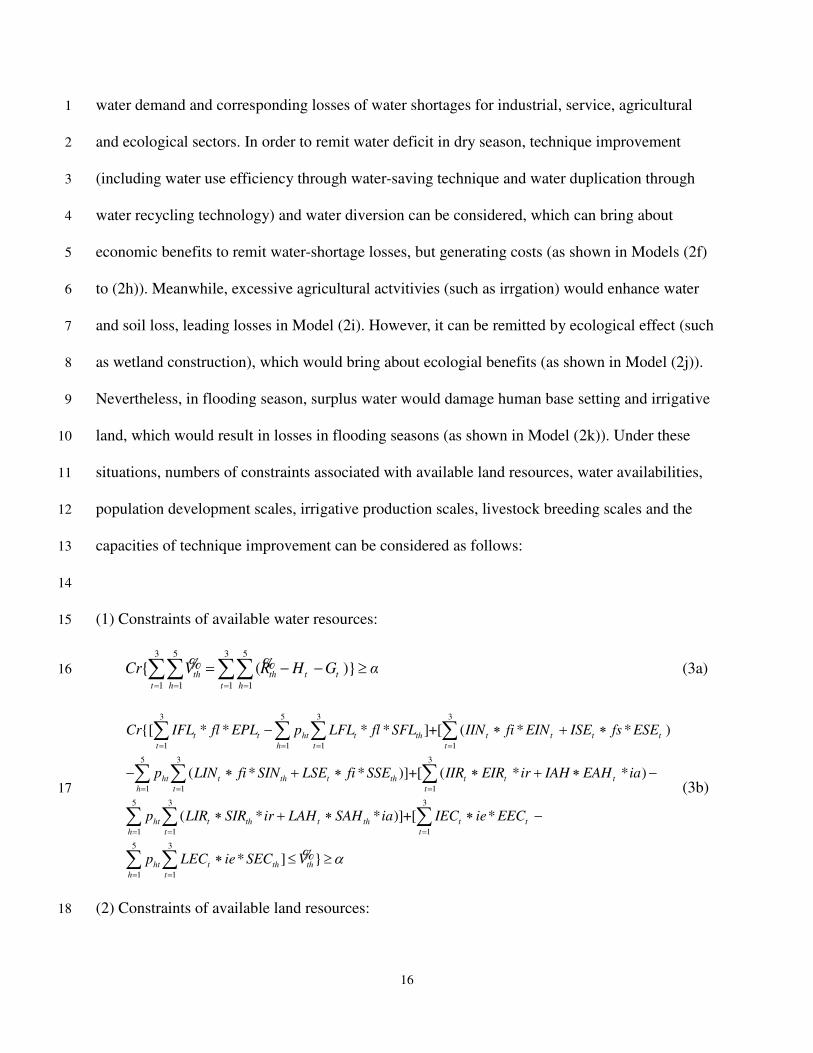
16
water demand and corresponding losses of water shortages for industrial, service, agricultural 1
and ecological sectors. In order to remit water deficit in dry season, technique improvement 2
(including water use efficiency through water-saving technique and water duplication through 3
water recycling technology) and water diversion can be considered, which can bring about 4
economic benefits to remit water-shortage losses, but generating costs (as shown in Models (2f) 5
to (2h)). Meanwhile, excessive agricultural actvitivies (such as irrgation) would enhance water 6
and soil loss, leading losses in Model (2i). However, it can be remitted by ecological effect (such 7
as wetland construction), which would bring about ecologial benefits (as shown in Model (2j)). 8
Nevertheless, in flooding season, surplus water would damage human base setting and irrigative 9
land, which would result in losses in flooding seasons (as shown in Model (2k)). Under these 10
situations, numbers of constraints associated with available land resources, water availabilities, 11
population development scales, irrigative production scales, livestock breeding scales and the 12
capacities of technique improvement can be considered as follows: 13
14
(1) Constraints of available water resources: 15
3 5 3 5
1 1 1 1
{ ( )}th th t t
t h t h
Cr V R H G α
% % (3a) 16
3 5 3 3
1 1 1 1
5 3 3
1 1 1
5
1
{[ * * * * ]+[ ( * * )
( * * )]+[ ( * * )
( * * )]
t t ht t th t t t t
t h t t
ht t th t th t t t
h t t
ht t th t th
h t
Cr IFL fl EPL p LFL fl SFL IIN fi EIN ISE fs ESE
p LIN fi SIN LSE fi SSE IIR EIR ir IAH EAH ia
p LIR SIR ir LAH SAH ia
3 3
1 1
5 3
1 1
+[ *
* ] }
t t
t
ht t th th
h t
IEC ie EEC
p LEC ie SEC V
%
(3b) 17
(2) Constraints of available land resources: 18
17
3 5 3 3 5 3
1 1 1 1 1 1
[ ( ) [ ( )] ( )t t ht th th t ht th t
t h t t h t
EIR EAH p SIR SAH EEC p SEC LR
(3c) 1
(3) Constraints of population development scales: 2
3min max
1
+ +t t t t t
t
SM EPL EIN ESE SM
( ) (3d) 3
(4) Constraints of irrigative production scales: 4
3min max
1
t t t
t
SD EIR SD
(3e) 5
(5) Constraints of livestock breeding scales: 6
3min max
1
t t t
t
SI EAH SI
(3f) 7
(6) Constraints of capacity of water recycling: 8
3 3max
1 1
[ * ( * * )]t t t t
t t
fl EPL fi EIN fs ESE SC
(3g) 9
(7) Constraints of capacity of water-saving: 10
3 3 3max
1 1 1
[ * ( * * )+ ( * * )]t t t t t t
t t t
fl EPL fi EIN fs ESE EIR ir IAH ia CP
( (3h) 11
(8) Constraints of economic benefits and losses: 12
, , , , ,t t t t t t t t t t t t
IFL LFL IIN ISE LIN LSE IIR LIR IAH LAH IEC LEC (3i) 13
(9) Non-negative constraints: 14
, , , , , , , , , , , 0t t t t t t t t t t t t
IFL LFL IIN ISE LIN LSE IIR LIR IAH LAH IEC LEC (3j) 15
, , , , , , , , , , , 0t th t t th th t t th th t th
EPL SFL EIN ESE SIN SSE EIR EAH SIR SAH EEC SEC (3k) 16
17
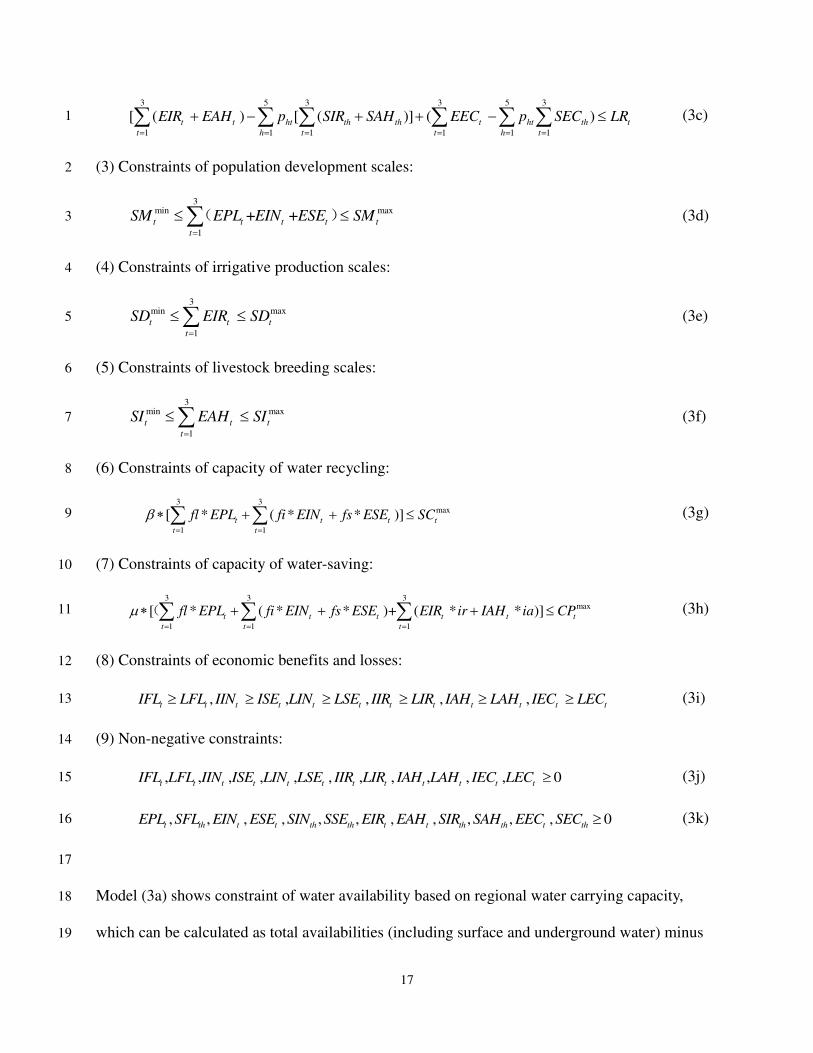
Model (3a) shows constraint of water availability based on regional water carrying capacity, 18
which can be calculated as total availabilities (including surface and underground water) minus 19
18
evaporation / infiltration loss of water from river, normal water requirement of watercourse (m3) 1
(Zeng et al., 2019). Water avilability can be impacted by rainfall strongly in dry and wet seasons, 2
which presents as stochastice chararcters. Model (3b) presents water shortage based on recourse 3
actions to expected demands when random water availibility occur in flooding and non-flooding 4
seaseons. Model (3c) displays allocated land area based on farmland returning to wetland, where 5
the transferred land resources should not be greater than total land scale minus living and 6
industrial land (equal tot
LR ). Models (3d) to (3f) demonstrate constraint of current 7
population-economy development scale due to population-industry transformation into 8
floodplain in context of coordination of BTH. Models (3g) to (3h) demonstrate the capacity of 9
water-saving technique and water retreatment technology. Models (3i) to (3k) present the 10
relationship between economic benefit and loss relationships; meanwhile, non-negative 11
restrictions have displayed at end of constraints. 12
13
2.4 Data acquirement 14
15
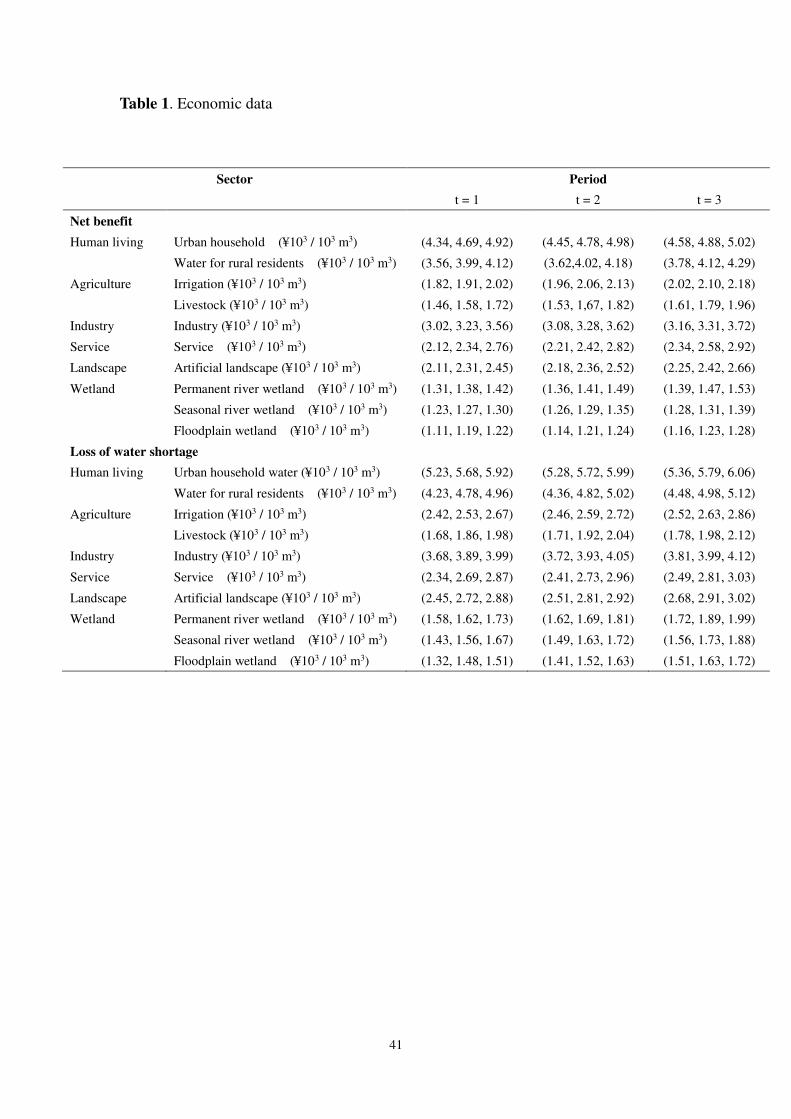
Table 1 shows the economic data as fuzzy sets, which is calculated by expert evaluation method 16
according to regional statistical yearbooks, with consideration of social-economic development 17
(SYH, 2006-2016; WRH, 2006-2016). Meanwhile, various water availability levels due to 18
random rainfall can be divided into five levels (i.e., very low, low, medium, high and very high 19
levels), which corresponding probabilities would be 0.1, 0.2, 0.4, 0.2 and 0.1 simulated by 20
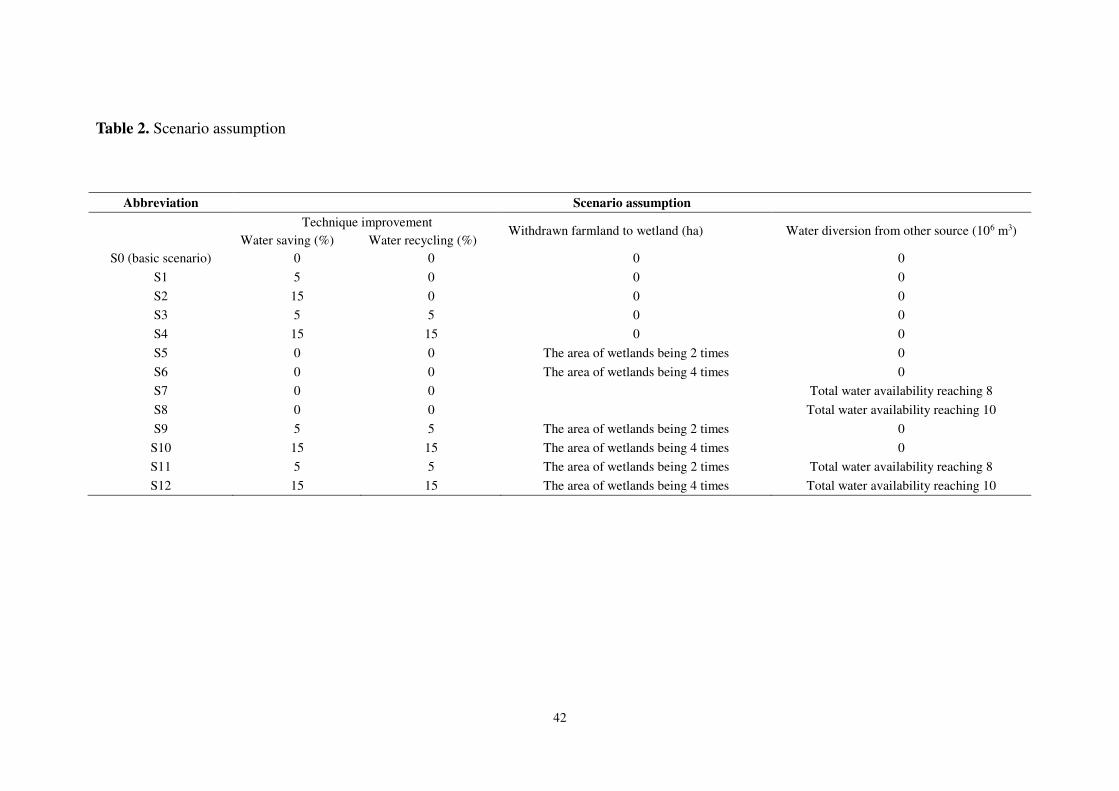
previous precipitation from 2005 to 2018 (SYH, 2006-2016; WRH, 2006-2016). In addition, in 21
order to reduce water shortage in dry season and flood risk in flooding season, various policy 22
scenarios can be designed in Table 2 as follows: (a) scenario 0 (S0) is the basic scenario present 23
19
current population-industry development and water resources management. (b) various 1
individual policies (including improvement of water resource utilization efficiency, water 2
diversion, farmland returning to wetland) can be considered. Among them, scenario 1 to 4 (S1 to 3
S4) display the policies with improvement of water use efficiency by prompting water saving 4
and recycling ratio (0%, 5% and 15%). Scenario 5 to 6 (S5 to S6) show that farmland returning 5
to wetland, where the constructed wetland would be 2 and 4 times than the area under S0. 6
Scenarios 7 to 8 (S7 to S8) present policies associated with water diversion to remit water 7
shortages. (c) scenarios 9 to 12 present mixed policies based on S1 to S8. 8
------------------------------- 9
Place Tables 1 to 2 here 10
------------------------------- 11
12
3. Result and discussion 13
3.1 Adverse effects and risks of floodplain due to population-industry transformation under basic 14
scenario (S0) 15
3.1.1 Adverse effects on water resources in Yongding river floodplain due to population-industry 16
transformation 17
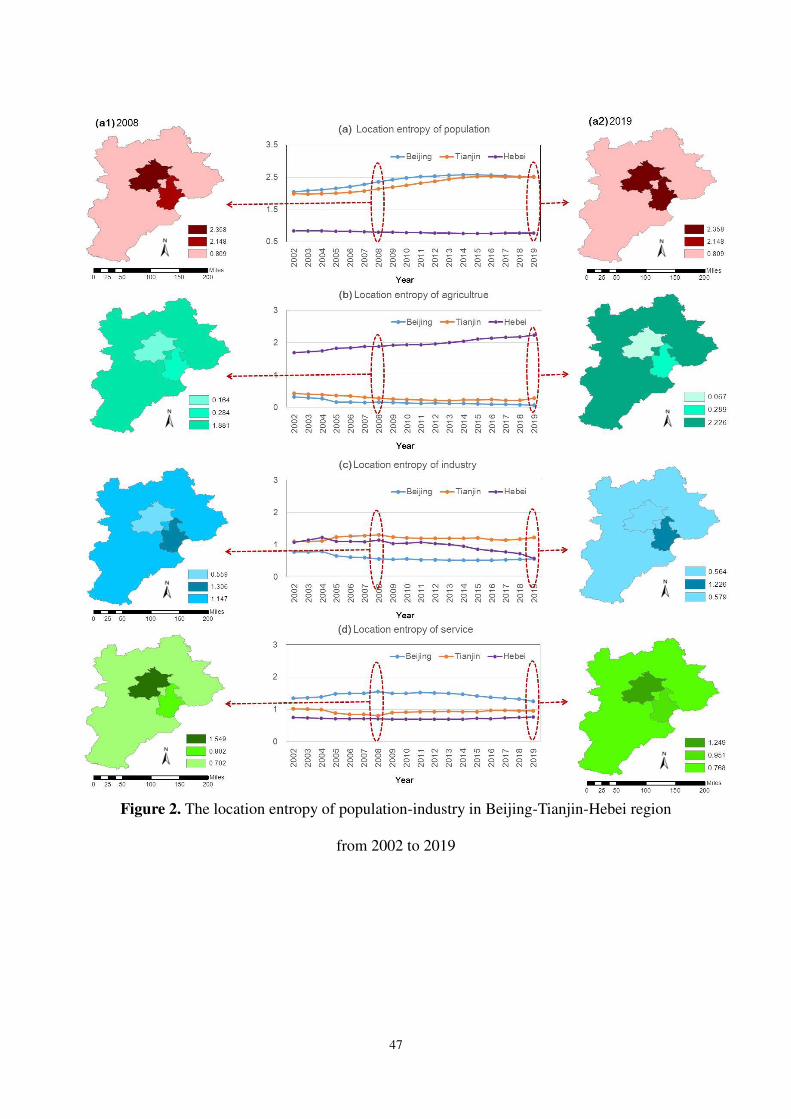
Figure 2 presents the location entropy of population-industry in Beijing-Tianjin-Hebei region 18
from 2002 to 2019, which can reflect the tendency of population-industry transformation and 19
mitigation based on the strategy of coordinative development of Beijing-Tianjin-Hebei urban 20
agglomeration. The results present that the location entropy of agriculture in Beijing and Tianjin 21
is decreasing, but increasing in Hebei. Meanwhile, the location entropy of industry in Tianjin and 22
Hebei province would increase. Based on industrial transformation, the population concentration 23
20
in Beijing and Tianjin would be higher than Hebei province from 2002 to 2014. However, the 1
entropy of population in Hebei province would increase from 2015, which indicate that the 2
driven effect of industrial transformation would increase population concentration in Hebei 3
province. Under these population-industry transformation situations, the effects of 4
population-industry transformation on water resource management in Yongding river floodplain 5
of Hebei province have been obtained through PVRA model (as shown in Tables 3 to 4). Before 6
analyzing the time series variables, the stability of the data has been checked by ADF test (in 7
Table 3), which indicated that all the indicators are stationary time series data, meeting the 8
preconditions of model estimation, impulse response and variance decomposition. Meanwhile, 9
according to the test results of AIC, SBIC and HQIC under different lag orders, the result 10
indicate that the optimal lag period of the model is determined as 3 periods. Table 4 displays that 11
the transfer of the industry in floodplain can significantly promote the growth of the gross 12
regional product (GDP) and average GDP per person, both at the level of 5%, but at the same 13
time, it will also lead to the increase of water demand, which is at the level of 1%. From the 14
point of parameter selection, in the case of other conditions unchanged, the industry in floodplain 15
city transfer, each additional unit can promote regional GDP rose 0.019 unit, increase water 16
demand 0.046 units, which should attract attention to water saving technology improvement. 17
However, service industry transformation has a positive impact on regional economic growth, 18
but increase more water demand than industry. 19
------------------------------------------------ 20
Place Figure 2 and Tables 3 to 4 here 21
------------------------------------------------ 22
23
21
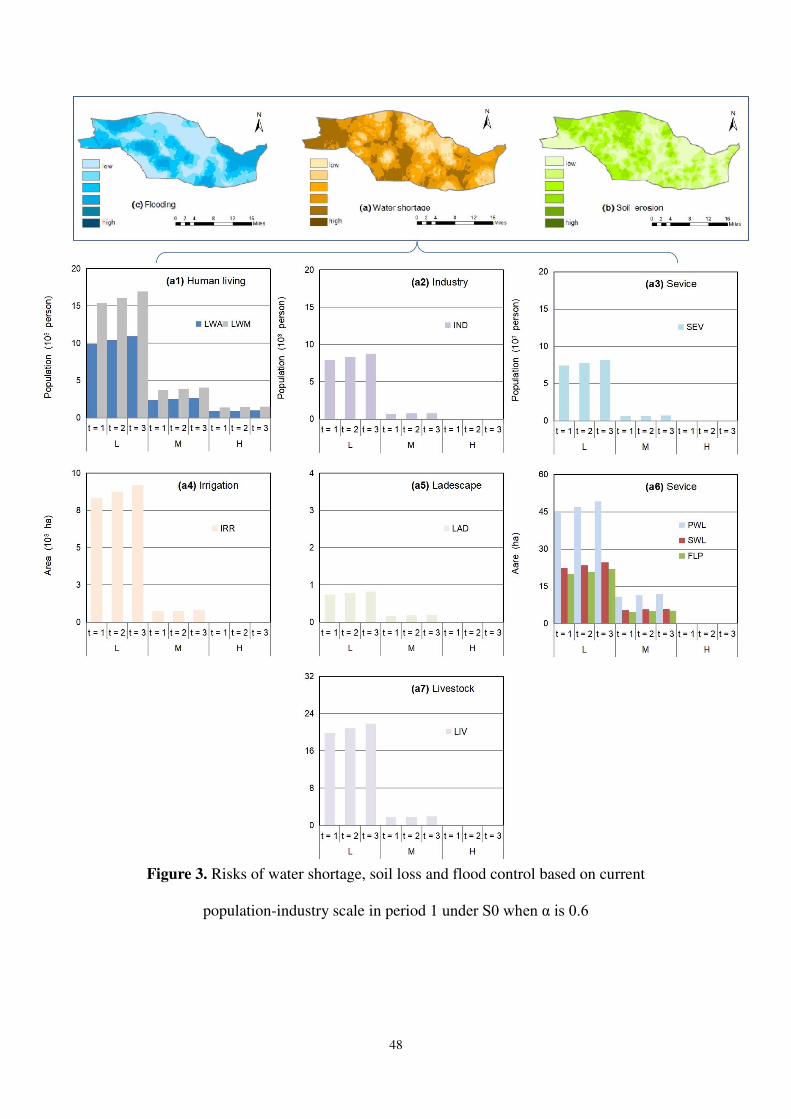
3.1.2 Risks due to population-industry transformation into a floodplain under basic scenario (S0) 1
Figure 3 presents risks of water shortage, soil loss and flood control based on current 2
population-industry scale in period 1 under S0 when α is 0.6. Based on current 3
population-industry scale (under S0) in Yonding river floodplain, various water shortages would 4
occur when α is 0.6, which indicates that the water demand for current population-industry scale 5
can be met hardly in dry seasons, leading higher water shortages; vice versa. Meanwhile, the 6
irrigation would be the highest water shortage sector, which results in a highest water-shortage 7
area than the area in landscape and wetland protection. Moreover, in comparison of water 8
shortages for various human activities, the highest water shortage for population is human living 9
(denoted as “HL”) comparing to industrial and service population. 10
-------------------------- 11
Place Figure 3 here 12
-------------------------- 13
14
3.2 Adaptive water resources management under various policy scenarios 15
3.2.1 Water shortages and allocations under individual policy scenarios (S1 to S8) 16
3.2.2.1 Improvement of water resource utilization efficiency (S1 to S4) 17
In order to remit water shortage in human activities, technique improvement (improvement of 18
water saving and recycling) can considered in S1 to S4, which can displays total water shortages 19
among various water use sectors when α is 0.6 (as shown in Figure 4). The results present that 20
improvement of water saving could prompt water utilization efficiencies, which can generate 21
lower water shortages particular in wet season (when water flow is low). As the same principle, 22
water shortages could be reduced by improvement of water recycling ratio. For example, the 23
22
water shortage would be 77.23 103 m3 and 48.34 103 m3 under S1 and S4 when water flow 1
is low. Although improvement of water saving and recycling can be deemed as effective manners 2
to reduce water shortage, high cost of generalization would be a big challenge for policymaker in 3
Yonding river floodplain. 4
-------------------------- 5
Place Figure 4 here 6
-------------------------- 7
8
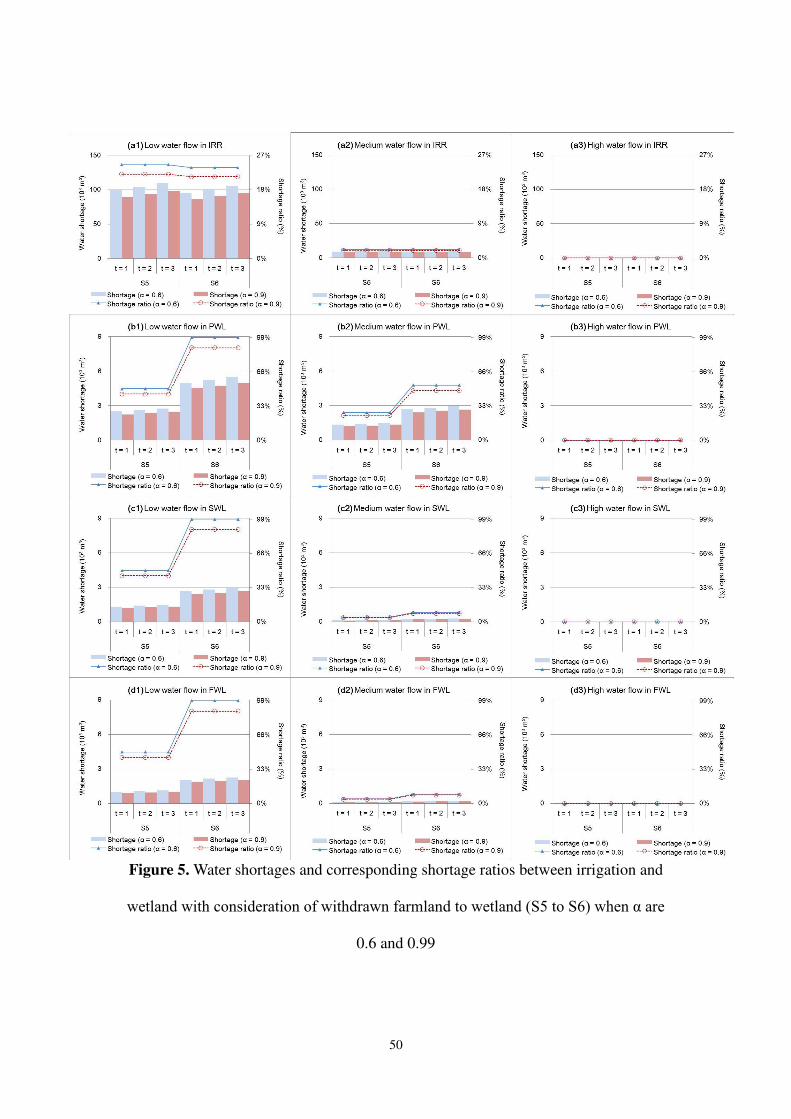
3.2.2.2 Farmland returning to wetland (S5 to S6) 9
In order to reduce the greatest water shortage in irrigation and improve the water / soil 10
conservation in study region, the farmland returning to wetland (CFW) project can be 11
encouraged to improve source functions of floodplain due to overdeveloped irrigation. Figure 5 12
presents water shortages and corresponding shortage ratios between irrigation and wetland with 13
consideration of withdrawn farmland to wetland (S5 to S6) when α are 0.6 and 0.99. In this 14
region, the CFW can reduce water demand for irrigation, which can drop its shortage ratio in the 15
long run. However, wetland construction require water resources, thus, the reduction of water 16
shortage by CFW is limited. For instance, CFW can reduce shortage ratio of irrigation would be 17
7.23% at highest when water flow is low in period 1. Meanwhile, CFW can improve source 18
function of floodplain due to wetland construction, which would prompt the risk control in 19
flooding season. Thus, CFW can be deemed as an effective manner to remit water shortage and 20
control flood risk contemporarily, but which would reduce direct economic income of irrigation 21
in the short run. 22
-------------------------- 23
23
Place Figure 5 here 1
-------------------------- 2
3
3.2.2.3 Water diversion (S7 to S8) 4
5
Figure 6 shows optimal water allocations with consideration of water diversion (S7 to S8) when 6
α are 0.6 and 0.9. In comparison of various water use sectors, irrigation would be allocated 7
greatest water resources, which indicated that the agricultural sector would be the key industry in 8
study region. However, backward irrigative scheme would low efficiency in agricultural, which 9
would result in a higher water deficit when water flow is low. Water diversion (e.g. South-North 10
water transfer project) can be considered to remit water deficit in study region, which would 11
improve the satisfaction rate of optimal water allocation. For example, the optimal water 12
allocation would be 315.43 103 m3 and 378.25 103 m3 under S7 and S8 when water flow is 13
low in period 1, which would be better than the situation under S1. 14
------------------------- 15
Place Figure 6 here 16
-------------------------- 17
18
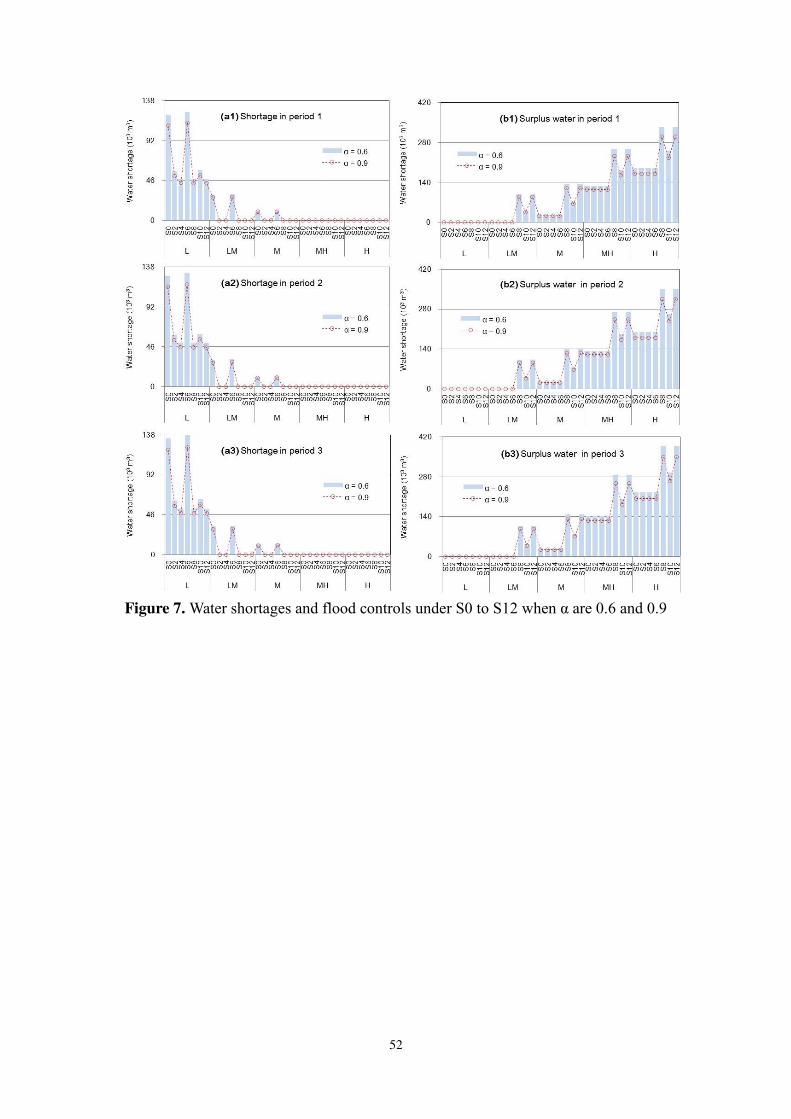
3.2.2 Water shortages and flood controls under combined scenarios (S0 to S12) 19
20
Figure 7 shows water shortages and flood controls under S0 to S12 when α are 0.6 and 0.9. The 21
results display that the effect of mixed policies would be better than individual one. For instance, 22
the water shortage under S0, S2, S4, S6 and S8 (individual policies) would be greater than that 23
24
under S10 and S12 (mixed policies); meanwhile, surplus water under S8 (individual policies) 1
would be bigger than that under S10 and S12 (mixed policies). In addition, in comparison of 2
various scenarios, S6 has an advantage of flood control, but which has little ability to reduce 3
water shortage. The effect of water shortage reduction under S4 and S8 would be best among 4
various scenarios. 5
------------------------- 6
Place Figure 7 here 7
-------------------------- 8
9
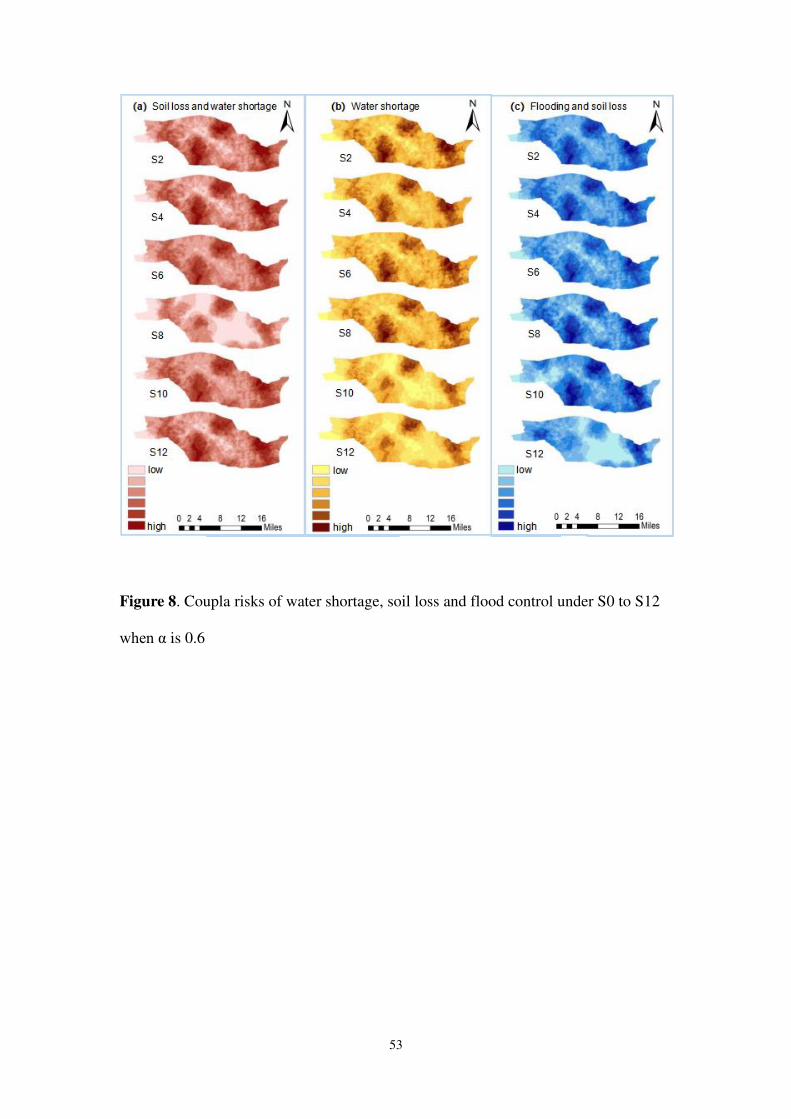
3.2.3 Coupla risks of water shortage, soil loss and flood control under various scenarios (S0 to 10
S12) 11
12
Figure 8 displays coupla risks of water shortage, soil loss and flood control under S0 to S12 13
when α is 0.6. The results present that technique improvement (S2 and S4) would decrease risks 14
of water shortage to a extent, but which would hardly reduce risks of soil loss and flood control. 15
Meanwhile, water diversion (S8) would reduce risk of water shotage at a highest level, but which 16
would increase risks of soil loss and flood control. Morvere, withdrawn farmland to wetland (S6) 17
is effective to reduce risks of soil loss and flood control, but which requires more water resources, 18
leading a raised water-shortage risk. In comparision, the combined policy (S12) has advantage of 19
reducing risk of water shortage and corresponding (or coupla) risks soil loss and flood control 20
than other individual policies (S2, S4, S6 and S8). 21
-------------------------- 22
Place Figure 8 here 23
25
--------------------------- 1
2
3.3 System benefit under S0 to S12 3
4
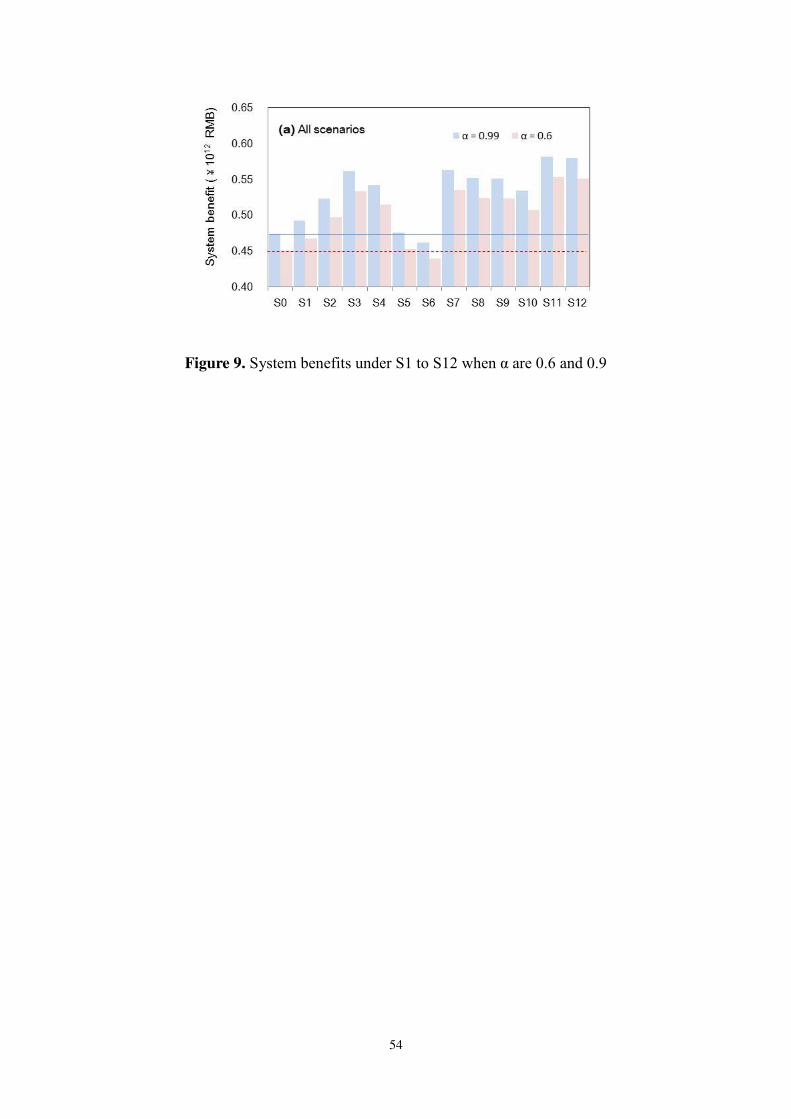
Figure 9 displays system benefits under S1 to S12 when α are 0.6 and 0.9. The results present as 5
follows: (a) based on population-industry transformation from Beijing or Tianjin to Hebei, the 6
water resource carrying capacity can not afford current water use pattern, which can increase the 7
loss of water shortages, leading a lower system benefit (S1). (b) The current technical level can 8
only support water-saving and recycling techniques increased by 9% at highest (under S3), 9
which would bring about an increased system benefit; otherwise, it would generate a dropped 10
benefit (under S4) due to excessive cost of technical improvement and popularization. (c) 11
although CFW can bring about a higher benefit in a long run, lower direct economic incomes 12
from wetland construction would generate lower benefits in the short run (S5 and S6). (d) Since 13
the cost of water diversion is relative low for floodplain in the context of the south-to-north water 14
diversion project funded by the state, it can remit the losses of water shortage for current 15
population-economy pattern in the mass, which would bring about higher benefits (S7 and S8). 16
(e) a comprehensive combined policy (including improvement of technique, CFW, water 17
diversion) would bring about better results for water shortage reduction, which can lead higher 18
benefits (S9 to S12). (f) The results show that system benefit would decrease by a raised α level, 19
which indicates that a lower reliability level would lead a higher benefit. 20
-------------------------- 21
Place Figure 9 here 22
-------------------------- 23
26
1
4. Conclusions 2
3
Therefore, this study can be expressed as follows: (a) an adaptive water resource management 4
framework with combined policies (AWFP) is developed for mitigating adverse effects on water 5
stress in floodplain due to population-industry transformation (PIT) in the process of urban 6
agglomeration. (b) A location-entropy based PVRA model and coupla-risk analysis can be 7
introduced to reflect the adverse effects of industrial information and driven population on water 8
resources and corresponding risks (including water shortage, soil loss and flood control) and 9
their correlations in a floodplain area in the processes of urban agglomeration. (c) an adaptive 10
scenario analysis based stochastic-fuzzy method (ASSF) can be embedded into an AWMF to deal 11
with multiple uncertainties. (d) The proposed AWMF is applied to a practical case study of 12
Yongding river floodplain region for confronting adverse effects due to population-industry 13
transformation into floodplain in the context of coordination of Beijing-Tianjin-Hebei urban 14
agglomeration, China. 15
16
With the aid of the AWMF in Yongding river floodplain, numbers of discoveries can be 17
displayed as follows: (a) “strategy of Beijing-Tianjin-Hebei coordinated development” (from 18
2013) has accelerated the population-industry transformation (PIT) into floodplain. Although PIT 19
can support economic development in Yonding river floodplain, excessive exploitation and 20
construction would destroy the source function of floodplain, increasing the risk of water 21
shortage, soil loss and flood control. Ecological protection project (such as farmland returning to 22
wetland) is effective manner to recover the source function of floodplain, but which has been not 23
27
attached importance in study region. (b) backward irrigative scheme and low water utilization 1
efficiency are not accommodate to regional water carrying capacity (i.e., shrunk water 2
availability and uneven rainfall) in Yonding river floodplain, which would require a more 3
effective and adaptive water resource use pattern to remit current water crisis. (c) individual 4
policies (such as improvement of water resource utilization efficiency, water diversion, farmland 5
returning to wetland) have their own advantages of water shortage reduction or flood risk control 6
respectively, but which have limitations of the high cost of generalization and direct income 7
reduction in a short-term. Thus, how to balance the tradeoff between benefit and cost in a long 8
run can be challenges for regional policymakers. 9
10
Therefore, various specific suggestions can be summarized as follows: Firstly, regulation of PIT 11
into floodplain according to source function of floodplain should be considered to reduce its 12
negative effects and risks of water shortage, soil loss and flood control. Meanwhile, limitation of 13
land overexploitation and excessive construction should be advocated for releasing the conflict 14
between human activities and water stress in Yongding river floodplain. Secondly, more cleaner 15
production mode and water-saving pattern should be introduced into water resources 16
management in floodplain, which can remit water crisis from water-use side. Thirdly, 17
policymakers should analyze the tradeoff between economic benefits and costs of various policy 18
scenarios not just in the short term, but in the long term, with aim to generate combination of 19
mixed policies to maximize positive effects due to PIT, minimizing risks to the great extent. 20
Meanwhile, the policymakers should step up guidance to technique improvement, increase 21
investment to water diversion project, and strengthen population and industrial planning, which 22
could support the adjustment of regional strategies associated with population growth, industrial 23
28
layout, water resource use pattern and floodplain function protection sustainably. 1
2
Ethical Approval: There is no Ethical Approval in this paper (Not applicable). 3
4
Author Contributions: Xueting Zeng has constructed the idea of paper and formulated the 5
framework of AWFP; Junlong zhang has formulated models and designed scenarios; Jia Liu has 6
drawn the risk maps in this paper. 7
8
Consent to Participate and publish: All authors have agreed to participate and publish this 9
paper after acceptance. 10
11
Funding: This research was supported by the National Natural Science Foundation of China 12
(42007412), National Science and Technology Major Project of China (Grant No. 13
2018ZX07105-002) and National Natural Science Foundation of China (51809145). 14
15
Competing Interest: The authors declare no conflict of interest. 16
17
Availability of data and materials: The data sources have been put into Mendeley Data (DOI: 18
10.17632/c45776hm2w.1). 19
20
21
29
1
References 2
3
Freer, J.E., Mcmillan, H., Mcdonnell, J.J., Beven, K.J., 2004. Constraining dynamic 4
TOPMODEL responses for imprecise water table information using fuzzy rule based 5
performance measures. J Hydro 291: 254-277. http://doi.org/10.1016/j.jhydrol.2003.12.037. 6
Guo, P., Huang, G.H., 2009. Two-stage fuzzy chance-constrained programming: application to 7
water resources management under dual uncertainties. Stoch Env Res Risk A 23: 349-359. 8
http://doi.org/10.1007/s00477-008-0221-y. 9
Horta, I.M., Camanho, A.S., Dias, T.G., 2016. Residential building resource consumption: A 10
comparison of Portuguese municipalities' performance. Cities 50: 54-61. 11
http://doi.org/10.1016/j.cities.2015.08.009. 12
Huang, G.H., Loucks, D.P., 2000. An inexact two-stage stochastic programming model for water 13
resources management under uncertainty. Civ Eng Environ Syst 17: 95-118. 14
http://doi.org/10.1080/02630250008970277. 15
Inuiguchi, M., 2012. Robust optimization by fuzzy linear programming. Lect Note in Econ Math 16
Syst 658: 219-239. http://doi.org/10.1007/978-3-642-22884-1_11. 17
Johannes, C., Leeuwen, V., 2017. Water governance and the quality of water services in the city 18
of Melbourne. Urban Water J 14: 247-254. https://doi.org/10.1080/1573062X.2015.1086008. 19
Knox, J.C., 2006. Floodplain Sedimentation in the Upper Mississippi Valley: Natural Versus 20
Human Accelerated. Geomorphology 79: 286-310. 21
https://doi.org/10.1016/j.geomorph.2006.06.031 22
Kumar, V., Vasto-Terrientes, L.D., Valls, A., Schuhmacher, M., 2016. Adaptation strategies for 23
30
water supply management in a drought prone Mediterranean river basin: Application of 1
outranking method. Sci Total Environ 540: 344-357. 2
http://doi.org/10.1016/j.scitotenv.2015.06.062. 3
Liu, C.M., 2003. An analysis of the relationship between water resources and 4
population-economy-society-environment. J Nat Res 18: 635-644. 5
https://doi.org/10.11849/zrzyxb.2003.05.017. 6
Liu, W., Xu Y., Huang Y., 2011. Effects of global warming on precipitation and run- off volume 7
in Xinjiang. Arid. Geog., 34, 419-428, https://doi.org/10.1007/s10409-004-0010-x. 8
Men, B., Liu, H., Tian, W., Liu, H., 2017. Evaluation of sustainable use of water resources in 9
Beijing based on rough set and fuzzy theory. Water 9: 852. http://doi.org/10.3390/w9110852. 10
Olsen, J.R., Beling, P.A., Lambert, J.H., 2000. Dynamic models for floodplain management. J 11
Water. Res Pl ASCE 126: 167–171. 12
https://doi.org/10.1061/(ASCE)0733-9496(2000)126:3(167). 13
Peterson, G.D., Graeme, S.C., Stephen, R.C., 2003. Scenario planning: a tool for conservation in 14
an uncertain world. Conserv Biol 17: 358-366. 15
https://doi.org/10.1046/j.1523-1739.2003.01491.x. 16
Pingale, S.M., Jat, M.K., Khare, D., 2014. Integrated urban water management modelling under 17
climate change scenarios. Res Conserv Recy 83: 176-189. 18
https://doi.org/10.1016/j.resconrec.2013.10.006. 19
Rong, Q., Cai, Y., Su, M., Yang, Z., 2019. Identification of the optimal agricultural structure and 20
population size in a reservoir watershed based on the water ecological carrying capacity 21
under uncertainty. J Clean Prod 234: 335-343. https://doi.org/10.1016/j.jclepro.2019.06.179 22
Simmons, B., Woog, R., Dimitrov, V., 2007. Living on the edge: a complexity-infomed 23
31
exploration of the human-water relationship. World Fut 63: 275-285. 1
https://doi.org/10.1080/02604020601174927. 2
Sanon, S., Hein, T., Douven, W., Winkler, P., 2012. Quantifying ecosystem service trade-offs: the 3
case of an urban floodplain in Vienna, Austria. J Environ Manag 111: 159-172. 4
https://doi.org/10.1016/j.jenvman.2012.06.008. 5
Swarta, R.J., Raskinb, P., Robinsonc, J., 2004. The problem of the future: sustainability science 6
and scenario analysis. Global Environ Chang 14:137-146. 7
https://doi.org/10.1016/j.gloenvcha.2003.10.002. 8
The statistical yearbook of Hebei province (SYH) 2006-2016. China. 2007-2017. 9
The water resources report of Hebei Province (WRH) 2006-2016. China. 2007-2017. 10
Zeng, X.T., Li, Y.P., Huang, W., Bao, A.M., Chen, X., 2014. Two-stage credibility-constrained 11
programming with Hurwicz criterion (TCP-CH) for planning water resources management. 12
Eng Appl Artif Intell 35: 164-175. https://doi.org/10.1016/j.engappai.2014.06.021. 13
Zeng, X.T., Yang, X.L., Yu, L.Y., Chen, H.L., 2015. A mix inexact-quadratic fuzzy water 14
resources management model of floodplain (IQT-WMMF) for regional sustainable 15
development of Dahuangbaowa, China. Water 7: 2771-2795. 16
http://doi.org/10.3390/w7062771. 17
Zeng, X.T., Zhao, J.Y., Yang, X.L., Wang, X., Xu, C.W., Cui, L., Zhou, Y., 2017. A 18
land-indicator-based optimization model with trading mechanism in wetland ecosystem 19
under uncertainties. Ecol Indic. 74: 279-299. http://doi.org/10.1016/j.ecolind.2016.11.011. 20
Zeng, X.T., Li, Y.P., Huang, G., 2019. Scenario analysis of a water-food nexus optimization with 21
consideration of population-economy regulation in Beijing-Tianjin-Hebei region. J Clean 22
Prod 228: 927-940. 23

32
Zhang, F., Zhang, Y., 2021. A multi-objective optimization prediction approach for water 1
resources based on swarm intelligence. Earth Sci Inform 14: 1-12. 2
http://doi.org/10.1007/s12145-020-00521-1. 3
4
33
Appendix 1 1
2
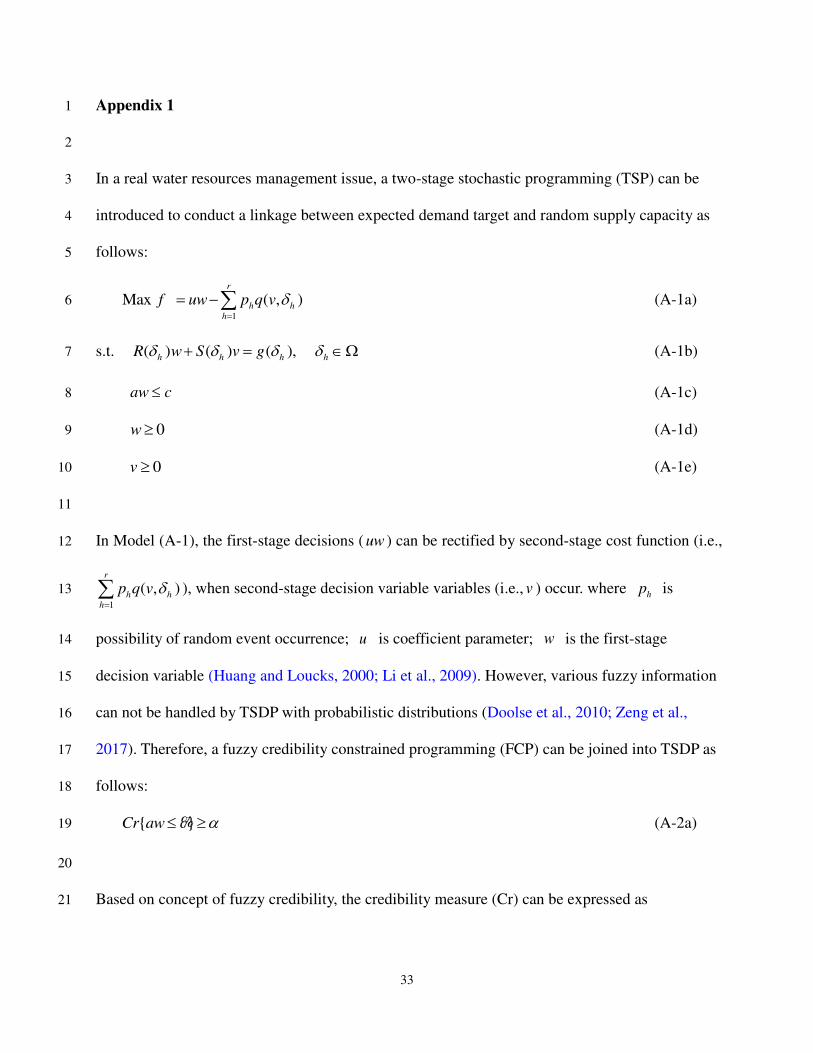
In a real water resources management issue, a two-stage stochastic programming (TSP) can be 3
introduced to conduct a linkage between expected demand target and random supply capacity as 4
follows: 5
1
Max ( , )r
h h
h
f uw p q v
(A-1a) 6
s.t. ( ) ( ) ( ), h h h h
R w S v g (A-1b) 7
aw c (A-1c) 8
0w (A-1d) 9
0v (A-1e) 10
11
In Model (A-1), the first-stage decisions (uw ) can be rectified by second-stage cost function (i.e., 12
1
( , )r
h h
h
p q v ), when second-stage decision variable variables (i.e., v ) occur. where h
p is 13
possibility of random event occurrence; u is coefficient parameter; w is the first-stage 14
decision variable (Huang and Loucks, 2000; Li et al., 2009). However, various fuzzy information 15
can not be handled by TSDP with probabilistic distributions (Doolse et al., 2010; Zeng et al., 16
2017). Therefore, a fuzzy credibility constrained programming (FCP) can be joined into TSDP as 17
follows: 18
{ }Cr aw c % (A-2a) 19
20
Based on concept of fuzzy credibility, the credibility measure (Cr) can be expressed as 21
34
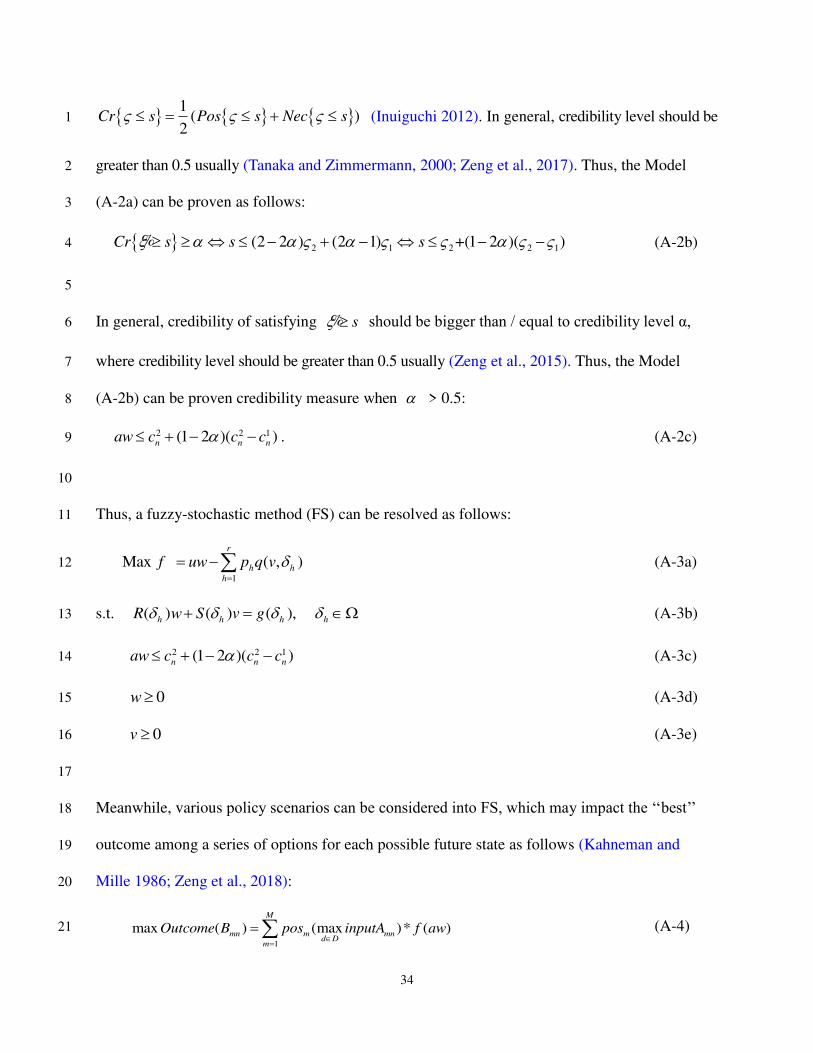
1( )
2Cr s Pos s Nec s (Inuiguchi 2012). In general, credibility level should be 1
greater than 0.5 usually (Tanaka and Zimmermann, 2000; Zeng et al., 2017). Thus, the Model 2
(A-2a) can be proven as follows: 3
2 1 2 2 1(2 2 ) (2 1) +(1 2 )( )Cr s s s % (A-2b) 4
5
In general, credibility of satisfying s % should be bigger than / equal to credibility level α, 6
where credibility level should be greater than 0.5 usually (Zeng et al., 2015). Thus, the Model 7
(A-2b) can be proven credibility measure when > 0.5: 8
2 2 1(1 2 )( )n n n
aw c c c . (A-2c) 9
10
Thus, a fuzzy-stochastic method (FS) can be resolved as follows: 11
1
Max ( , )r
h h
h
f uw p q v
(A-3a) 12
s.t. ( ) ( ) ( ), h h h h
R w S v g (A-3b) 13
2 2 1(1 2 )( )n n n
aw c c c (A-3c) 14
0w (A-3d) 15
0v (A-3e) 16
17
Meanwhile, various policy scenarios can be considered into FS, which may impact the ‘‘best’’ 18
outcome among a series of options for each possible future state as follows (Kahneman and 19
Mille 1986; Zeng et al., 2018): 20
1
max ( ) (max )* ( )M
mn m mnd D
m
Outcome B pos inputA f aw
(A-4) 21
35
1
Where ( )mn
Outcome B is the decision outcome;; m
pos is probability of each scenario 2
occurrence; d is the option, D is the options area, mn
A ( , 1,2,...,n
A A n N ) is the overall 3
performance of various policy scenarios, which means that expected target with different 4
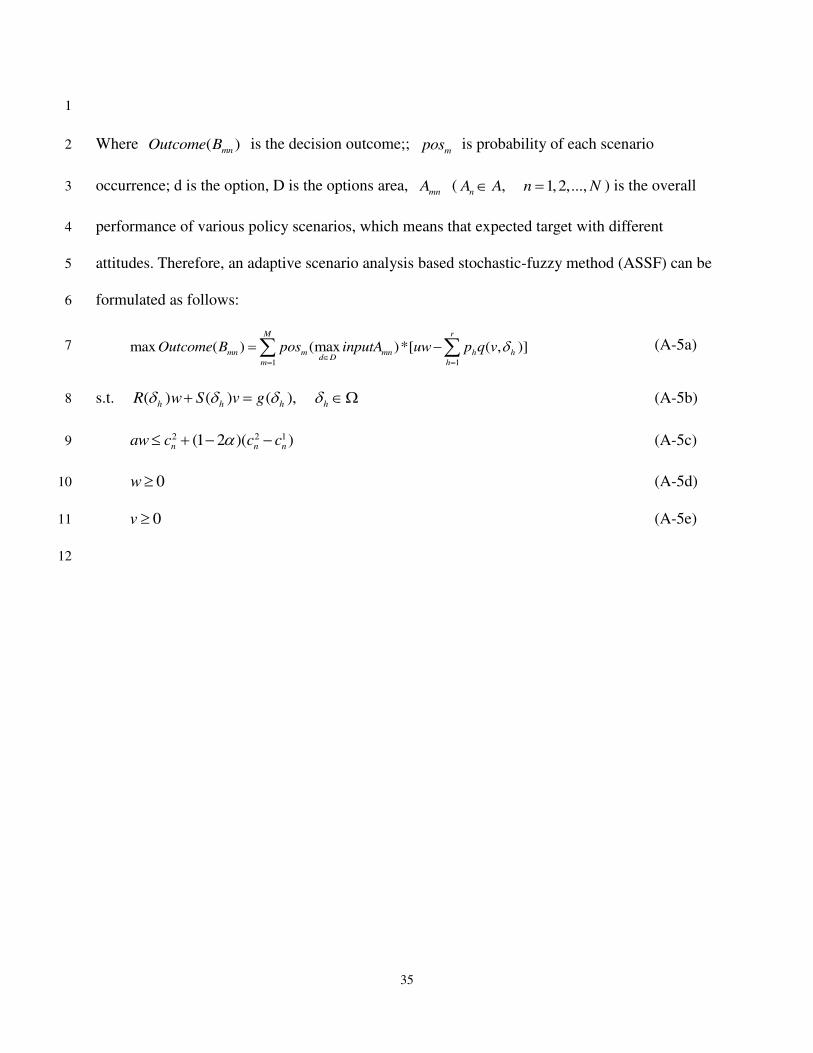
attitudes. Therefore, an adaptive scenario analysis based stochastic-fuzzy method (ASSF) can be 5
formulated as follows: 6
1 1
max ( ) (max )*[ ( , )]M r
mn m mn h hd D
m h
Outcome B pos inputA uw p q v
(A-5a) 7
s.t. ( ) ( ) ( ), h h h h
R w S v g (A-5b) 8
2 2 1(1 2 )( )n n n
aw c c c (A-5c) 9
0w (A-5d) 10
0v (A-5e) 11
12
36
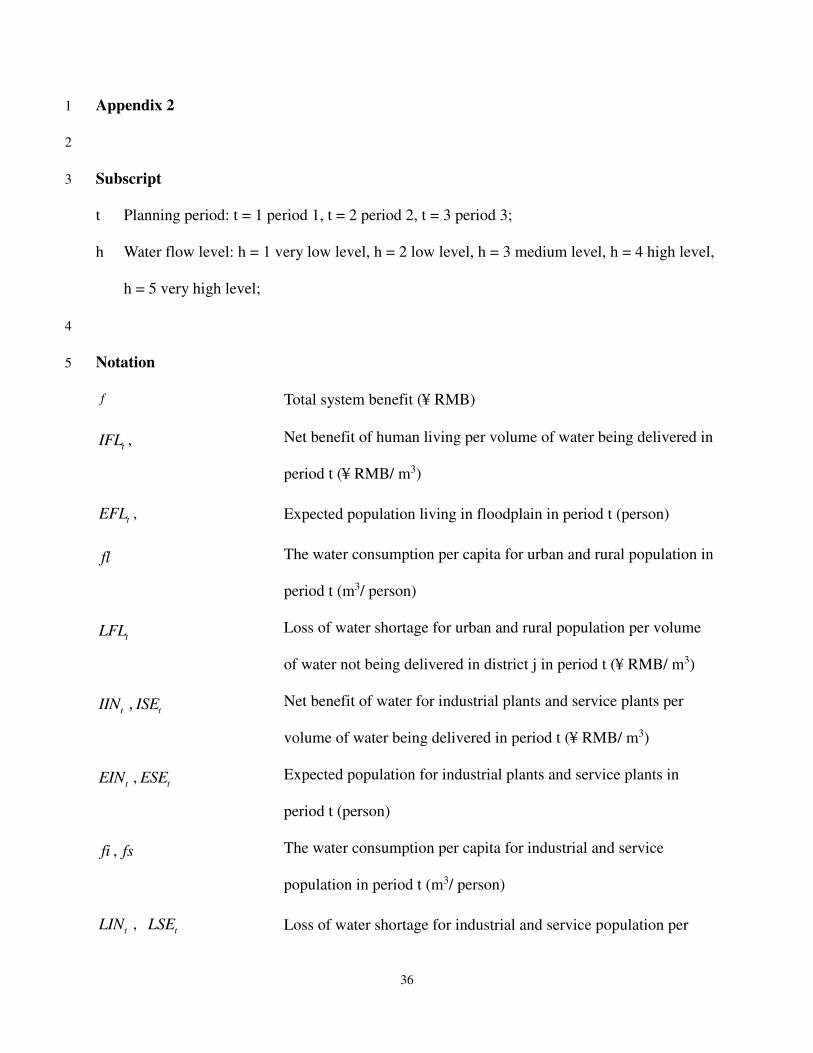
Appendix 2 1
2
Subscript 3
t Planning period: t = 1 period 1, t = 2 period 2, t = 3 period 3;
h Water flow level: h = 1 very low level, h = 2 low level, h = 3 medium level, h = 4 high level,
h = 5 very high level;
4
Notation 5
f Total system benefit (¥ RMB)
tIFL , Net benefit of human living per volume of water being delivered in
period t (¥ RMB/ m3)
tEFL , Expected population living in floodplain in period t (person)
fl The water consumption per capita for urban and rural population in
period t (m3/ person)
tLFL Loss of water shortage for urban and rural population per volume
of water not being delivered in district j in period t (¥ RMB/ m3)
tIIN ,
tISE Net benefit of water for industrial plants and service plants per
volume of water being delivered in period t (¥ RMB/ m3)
tEIN ,
tESE Expected population for industrial plants and service plants in
period t (person)
fi , fs The water consumption per capita for industrial and service
population in period t (m3/ person)
tLIN ,
tLSE Loss of water shortage for industrial and service population per
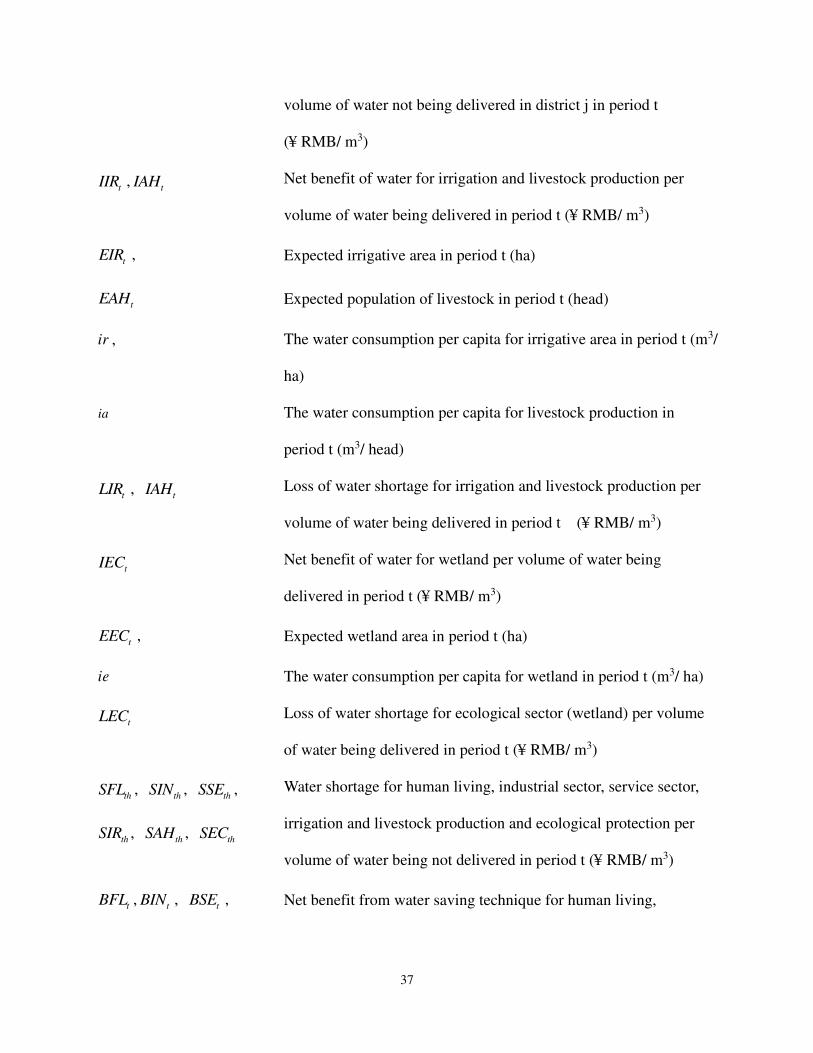
37
volume of water not being delivered in district j in period t
(¥ RMB/ m3)
tIIR ,
tIAH Net benefit of water for irrigation and livestock production per
volume of water being delivered in period t (¥ RMB/ m3)
tEIR , Expected irrigative area in period t (ha)
tEAH Expected population of livestock in period t (head)
ir , The water consumption per capita for irrigative area in period t (m3/
ha)
ia The water consumption per capita for livestock production in
period t (m3/ head)
tLIR ,
tIAH Loss of water shortage for irrigation and livestock production per
volume of water being delivered in period t (¥ RMB/ m3)
tIEC Net benefit of water for wetland per volume of water being
delivered in period t (¥ RMB/ m3)
tEEC , Expected wetland area in period t (ha)
ie The water consumption per capita for wetland in period t (m3/ ha)
tLEC Loss of water shortage for ecological sector (wetland) per volume
of water being delivered in period t (¥ RMB/ m3)
thSFL ,
thSIN ,
thSSE ,
thSIR ,
thSAH ,
thSEC
Water shortage for human living, industrial sector, service sector,
irrigation and livestock production and ecological protection per
volume of water being not delivered in period t (¥ RMB/ m3)
tBFL ,
tBIN ,
tBSE , Net benefit from water saving technique for human living,
38
tBIR ,
tBAH industrial sector, service sector, irrigation and livestock production
in period t (¥ RMB/ m3)
tBRFL ,
tBRIN ,
tBRSE , Net benefit from water recycling technique for human living,
industrial sector and service sector in period t (¥ RMB/ m3)
μ The improvement ratio of saving technique
β The recycling ratio of water duplication
tBDFL ,
tBDIN ,
tBDSE ,
tBDIR ,
tBDAH ,
tBDEC
Net benefit from water diversion for human living, industrial sector,
service sector, irrigation, livestock production and ecological
protection in period t (¥ RMB/ m3)
tDFL ,
tDIN ,
tDSE ,
tDIR ,
tDAH ,
tDEC
Amount of water diversion of floodplain in period t (m3)
tCD The cost of water diversion of floodplain in period t (¥ RMB/ m3)
tLSIR
Loss of soil loss from agriculture sector per volume of water being
delivered in period t (¥ RMB/ m3)
The ratio of soil loss of agriculture sector
max
tCP The maximal capacity of water saving technique
max
tSC The maximal capacity of retreatment technology
tCFL ,
tCIN ,
tCSE ,
tCIR ,
tCAH
The cost of water saving technique for human living, industrial
sector, service sector, irrigation and livestock production in period t
(¥ RMB/ m3)
tCRFL ,
tCRIN ,
tCRSE The cost of water recycling technique for human living, industrial

39
sector and service sector in period t (¥ RMB/ m3)
tDHM ,
tDHI ,
tDHS ,
tDHR ,
tDHA
Loss of flood per volume of surplus water being occured in period t
(¥ RMB/ m3)
thFHM ,
thFHI ,
thFHS ,
thFHR ,
thFHA
Surplas water (flood water) for human living, industrial sector,
service sector, irrigation and livestock production in period t ( m3)
α Credible measure
thV Water avaliability under probability
thp in period t (m3)
thR Water inflow under probability
thp in period t (m3)
tH Normal water requirement of watercourse in period t (m3)
tG Evaporation and infiltration loss of water in period t (m3)
thp Probability of random water availability
thV under level h (%)
min
tSM , max
tSM Maximum population growth scale in floodplain in period t
(person)
min
tSA , max
tSA Maximum irrigative area and wetland arear in floodplain in period t
(tone)
min
tSI , max
tSI Maximum water demand for livestock breeding scale (tone)
1
40
List of Table Captions: 1
2
Table 1. Economic data 3
Table 2. Scenario assumption 4
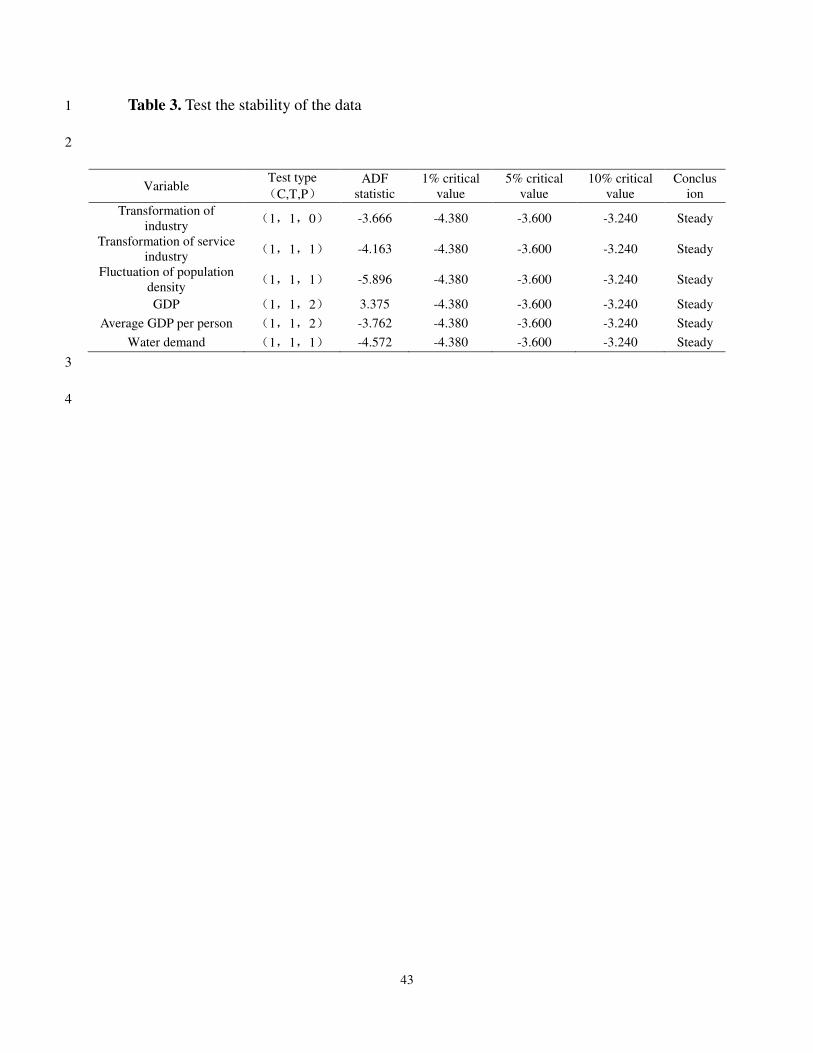
Table 3. Test the stability of the data 5
Table 4. Impact of population-industry transformation on water resources 6
41
Table 1. Economic data
Sector Period
t = 1 t = 2 t = 3
Net benefit
Human living Urban household (¥103 / 103 m3) (4.34, 4.69, 4.92) (4.45, 4.78, 4.98) (4.58, 4.88, 5.02)
Water for rural residents (¥103 / 103 m3) (3.56, 3.99, 4.12) (3.62,4.02, 4.18) (3.78, 4.12, 4.29)
Agriculture Irrigation (¥103 / 103 m3) (1.82, 1.91, 2.02) (1.96, 2.06, 2.13) (2.02, 2.10, 2.18)
Livestock (¥103 / 103 m3) (1.46, 1.58, 1.72) (1.53, 1,67, 1.82) (1.61, 1.79, 1.96)
Industry Industry (¥103 / 103 m3) (3.02, 3.23, 3.56) (3.08, 3.28, 3.62) (3.16, 3.31, 3.72)
Service Service (¥103 / 103 m3) (2.12, 2.34, 2.76) (2.21, 2.42, 2.82) (2.34, 2.58, 2.92)
Landscape Artificial landscape (¥103 / 103 m3) (2.11, 2.31, 2.45) (2.18, 2.36, 2.52) (2.25, 2.42, 2.66)
Wetland Permanent river wetland (¥103 / 103 m3) (1.31, 1.38, 1.42) (1.36, 1.41, 1.49) (1.39, 1.47, 1.53)
Seasonal river wetland (¥103 / 103 m3) (1.23, 1.27, 1.30) (1.26, 1.29, 1.35) (1.28, 1.31, 1.39)
Floodplain wetland (¥103 / 103 m3) (1.11, 1.19, 1.22) (1.14, 1.21, 1.24) (1.16, 1.23, 1.28)
Loss of water shortage
Human living Urban household water (¥103 / 103 m3) (5.23, 5.68, 5.92) (5.28, 5.72, 5.99) (5.36, 5.79, 6.06)
Water for rural residents (¥103 / 103 m3) (4.23, 4.78, 4.96) (4.36, 4.82, 5.02) (4.48, 4.98, 5.12)
Agriculture Irrigation (¥103 / 103 m3) (2.42, 2.53, 2.67) (2.46, 2.59, 2.72) (2.52, 2.63, 2.86)
Livestock (¥103 / 103 m3) (1.68, 1.86, 1.98) (1.71, 1.92, 2.04) (1.78, 1.98, 2.12)
Industry Industry (¥103 / 103 m3) (3.68, 3.89, 3.99) (3.72, 3.93, 4.05) (3.81, 3.99, 4.12)
Service Service (¥103 / 103 m3) (2.34, 2.69, 2.87) (2.41, 2.73, 2.96) (2.49, 2.81, 3.03)
Landscape Artificial landscape (¥103 / 103 m3) (2.45, 2.72, 2.88) (2.51, 2.81, 2.92) (2.68, 2.91, 3.02)
Wetland Permanent river wetland (¥103 / 103 m3) (1.58, 1.62, 1.73) (1.62, 1.69, 1.81) (1.72, 1.89, 1.99)
Seasonal river wetland (¥103 / 103 m3) (1.43, 1.56, 1.67) (1.49, 1.63, 1.72) (1.56, 1.73, 1.88)
Floodplain wetland (¥103 / 103 m3) (1.32, 1.48, 1.51) (1.41, 1.52, 1.63) (1.51, 1.63, 1.72)
42
Table 2. Scenario assumption
Abbreviation Scenario assumption
Technique improvement Withdrawn farmland to wetland (ha) Water diversion from other source (106 m3)
Water saving (%) Water recycling (%)
S0 (basic scenario) 0 0 0 0
S1 5 0 0 0
S2 15 0 0 0
S3 5 5 0 0
S4 15 15 0 0
S5 0 0 The area of wetlands being 2 times 0
S6 0 0 The area of wetlands being 4 times 0
S7 0 0 Total water availability reaching 8
S8 0 0 Total water availability reaching 10
S9 5 5 The area of wetlands being 2 times 0
S10 15 15 The area of wetlands being 4 times 0
S11 5 5 The area of wetlands being 2 times Total water availability reaching 8
S12 15 15 The area of wetlands being 4 times Total water availability reaching 10
43
Table 3. Test the stability of the data 1
2
Variable Test type
(C,T,P)
ADF
statistic
1% critical
value
5% critical
value
10% critical
value
Conclus
ion
Transformation of
industry (1,1,0) -3.666 -4.380 -3.600 -3.240 Steady
Transformation of service
industry (1,1,1) -4.163 -4.380 -3.600 -3.240 Steady
Fluctuation of population
density (1,1,1) -5.896 -4.380 -3.600 -3.240 Steady
GDP (1,1,2) 3.375 -4.380 -3.600 -3.240 Steady
Average GDP per person (1,1,2) -3.762 -4.380 -3.600 -3.240 Steady
Water demand (1,1,1) -4.572 -4.380 -3.600 -3.240 Steady
3
4

44
Table 4. Impact of population-industry transformation on water resources 1
2
Y-dependent variable
X- independent variable
ln GDP ln average GDP per person Ln water demand
Transformation of
industry 0.019**
(2.49)
0.017**
(2.21)
0.039
(1.61)
Transformation of service
industry 0.011
(0.70)
0.010
(0.68)
0.063**
(2.42)
Fluctuation of population
density
0.003
(1.12)
0.001
(0.27)
-0.008*
(-1.77)
45
List of Figure Captions:
Figure 1. An adaptive water resource management framework with combined policies
(AWFP) for mitigating adverse effects and risks on water resource in floodplain due
to population-industry transformation
Figure 2. The location entropy of population-industry in Beijing-Tianjin-Hebei region
from 2002 to 2019
Figure 3. Risks of water shortage, soil loss and flood control based on current
population-industry scale in period 1 under S0 when α is 0.6
Figure 4. Total water shortages among various industrial sectors with consideration of
technique improvement (S1 to S4) when α is 0.6
Figure 5. Water shortages and corresponding shortage ratios between irrigation and
wetland with consideration of withdrawn farmland to wetland (S5 to S6) when α are
0.6 and 0.99
Figure 6. Optimal water allocations with consideration of water diversion (S7 to S8)
when α are 0.6 and 0.9
Figure 7. Water shortages and flood controls under S0 to S12 when α are 0.6 and 0.9
Figure 8. Coupla risks of water shortage, soil loss and flood control under S0 to S12
when α is 0.6
Figure 9. System benefits under S1 to S12 when α are 0.6 and 0.9
46
Figure 1. An adaptive water resource management framework with combined policies
(AWFP) for mitigating adverse effects and risks on water resource in floodplain due
to population-industry transformation
47
Figure 2. The location entropy of population-industry in Beijing-Tianjin-Hebei region
from 2002 to 2019
48
Figure 3. Risks of water shortage, soil loss and flood control based on current
population-industry scale in period 1 under S0 when α is 0.6

49
Figure 4. Total water shortages among various industrial sectors with consideration of
technique improvement (S1 to S4) when α is 0.6
50
Figure 5. Water shortages and corresponding shortage ratios between irrigation and
wetland with consideration of withdrawn farmland to wetland (S5 to S6) when α are
0.6 and 0.99

51
Figure 6. Optimal water allocations with consideration of water diversion (S7 to S8)
when α are 0.6 and 0.9
52
Figure 7. Water shortages and flood controls under S0 to S12 when α are 0.6 and 0.9
53
Figure 8. Coupla risks of water shortage, soil loss and flood control under S0 to S12
when α is 0.6
54
Figure 9. System benefits under S1 to S12 when α are 0.6 and 0.9