Basic study on active acoustic shielding (Improving noise ...

University of South FloridaScholar Commons
Graduate Theses and Dissertations Graduate School
January 2013
An Acoustic-based Microfluidic Platform for ActiveSeparation and MixingMyeong Chan JoUniversity of South Florida, [email protected]
Follow this and additional works at: http://scholarcommons.usf.edu/etd
Part of the Biomedical Engineering and Bioengineering Commons, and the MechanicalEngineering Commons
This Dissertation is brought to you for free and open access by the Graduate School at Scholar Commons. It has been accepted for inclusion inGraduate Theses and Dissertations by an authorized administrator of Scholar Commons. For more information, please [email protected].
Scholar Commons CitationJo, Myeong Chan, "An Acoustic-based Microfluidic Platform for Active Separation and Mixing" (2013). Graduate Theses andDissertations.http://scholarcommons.usf.edu/etd/4697

An Acoustic-based Microfluidic Platform for Active Separation and Mixing
by
Myeong Chan Jo
A dissertation submitted in partial fulfillment
of the requirements of the degree of
Doctor of Philosophy
Department of Mechanical Engineering
College of Engineering
University of South Florida
Major Professor: Rasim Guldiken, Ph.D.
Nathan Crane, Ph.D.
Nathan Gallant, Ph.D.
Garrett Matthews, Ph.D.
Jing Wang, Ph.D.
Date of Approval:
June 13, 2013
Keywords: Surface acoustic wave, Interdigital transducer, Microfluidics,
Polydimethylsiloxane (PDMS), Acoustic streaming, Acoustic radiation force
Copyright © 2013, Myeong Chan Jo

DEDICATION
I would like to dedicate this dissertation to my parents, Pyeong Jong Jo and
Kyeong Ja Im. This study would not have been possible without their support, prayers
and confidence in me throughout the years. I would also like to dedicate it to my wife, Ho
Jin Lee and my daughter, Se Eun (Ashley) Jo who have motivated and inspired me to be
my best in everything I do.

ACKNOWLEDGMENTS
First and foremost, I would like to express my sincere appreciation to my advisor,
Dr. Rasim Guldiken, for his guidance, support and encouragement throughout the course
of this study at the University of South Florida. The motivating discussions I had with
him over the years were essential in completing this work. The educational experience
received from him and serious attitude toward work learned from him have undoubtedly
contributed to my academic career development. I would also like to thank the members
in my dissertation committee: Dr. Nathan Crane, Dr. Nathan Gallant, Dr. Garrett
Matthews and Dr. Jing Wang for their time, suggestions and guidance. I would also like
to thank my current and former mates of Acoustic Transducers Laboratory: Onursal Onen,
Tao Wang, Joel Cooper, Jairo Martinez, Greeshma Manohar and Rafael Rodriguez for
their help, friendship and technical discussions.
My thanks also go to my wife, Ho Jin Lee and my daughter, Se Eun (Ashley) Jo
for their endless love and patience and for giving me the courage to make it. Special
thanks go to my parents for their faithful support and encouragement. Their unconditional
support and concern helped me go through all the process.

i
TABLE OF CONTENTS
LIST OF TABLES ............................................................................................................. iii
LIST OF FIGURES ........................................................................................................... iv
ABSTRACT ..................................................................................................................... viii
CHAPTER 1. INTRODUCTION ........................................................................................1
CHAPTER 2. MICROFLUIDICS .......................................................................................4 2.1. Theory of Microfluidics ....................................................................................4
2.2. Microfluidic Channel Materials ........................................................................7
CHAPTER 3. ACOUSTICS ..............................................................................................11 3.1. Piezoelectricity ................................................................................................12
3.2. Piezoelectric Materials ....................................................................................14
3.3. Surface Acoustic Wave ...................................................................................17 3.4. Acoustic Radiation Force and Acoustic Streaming .......................................21
CHAPTER 4. SURFACE ACOUSTIC WAVE-BASED SEPARATION ........................23
Note to Reader .......................................................................................................23 4.1. Introduction .....................................................................................................23
4.2. Materials and Methods ....................................................................................26
4.2.1. Working Principle ............................................................................26 4.2.2. Theoretical Analysis ........................................................................30
4.2.3. Device Design and Fabrication .......................................................35
4.2.4. Experimental Setup .........................................................................42 4.3. Results and Discussion ...................................................................................44
4.3.1. Size-based Particle Separation .........................................................44 4.3.2. Density-based Particle Separation ...................................................52
4.3.3. Application for Cell Separation .......................................................60
CHAPTER 5. SURFACE ACOUSTIC WAVE-BASED MIXING ..................................63
Note to Reader .......................................................................................................63 5.1. Introduction .....................................................................................................63
5.2. Materials and Methods ....................................................................................65 5.2.1. Working Principle ............................................................................65 5.2.2. Device Design and Fabrication ........................................................68 5.2.3. Experimental Setup ..........................................................................70
5.3. Results and Discussion ...................................................................................73

ii
CHAPTER 6. EFFECTS OF PDMS MICROCHANNELS ON SURFACE
ACOUSTIC WAVE-BASED MICROFLUIDIC DEVICES ....................81 6.1. Introduction .....................................................................................................81 6.2. Materials and Methods ....................................................................................82
6.2.1. Working Principle ............................................................................82 6.2.2. Device Design and Fabrication ........................................................84 6.2.3. Experimental Setup ..........................................................................84
6.3. Results and Discussion ...................................................................................85 6.3.1. Insertion Loss ...................................................................................85
6.3.2. Particle Migration to Pressure Nodes ..............................................89
CHAPTER 7. PARTICLE MANIPULATION BY PHASE-SHIFTING OF
SURFACE ACOUSTIC WAVES .............................................................95
7.1. Introduction .....................................................................................................95 7.2. Materials and Methods ....................................................................................96
7.3. Results and Discussion ...................................................................................99
CHAPTER 8. CONCLUSIONS ......................................................................................102 8.1. Summary and Contributions .........................................................................102 8.2. Future Work ..................................................................................................106
REFERENCES ................................................................................................................108
APPENDICES .................................................................................................................123
Appendix A. Copyright Permissions ...................................................................124

iii
LIST OF TABLES
Table 1. Properties of commonly used piezoelectric materials for generating SAW ....... 17
Table 2. Design parameters used for two stages SAW-based microfluidic device
for size-dependent particle separation ................................................................. 36
Table 3. The operation conditions used for SAW-based active mixing experiments ....... 72

iv
LIST OF FIGURES
Figure 1. Scanning electron microscopy (SEM) images showing the cross section
of the silicon channel anisotropically etched ....................................................... 8
Figure 2. Scanning electron microscopy (SEM) images showing the cross section
of the glass (borosilicate) channel isotropiclly etched ......................................... 9
Figure 3. Scanning electron microscopy (SEM) images showing the cross section
of the PDMS channel after curing on a replication master ................................ 10
Figure 4. Ultrasound frequencies used for biological and medical applications .............. 12
Figure 5. Relations among mechanical and electrical variables for a crystal ................... 13
Figure 6. The travel of surface acoustic wave (Rayleigh wave) through a medium ........ 18
Figure 7. Top view of a single-electrode-type interdigital transducer .............................. 19
Figure 8. Working mechanism of SAW-based sheathless size-dependent particle
separation. .......................................................................................................... 28
Figure 9. Concept view of sheathless density-based particle separation using
SAW ................................................................................................................... 30
Figure 10. A schematic diagram showing all forces acting on a particle when
a particle suspended in a medium is subjected to an acoustic field. ............... 31
Figure 11. Theoretical analysis of forces acting on a particle as a function of
particle size ..................................................................................................... 32
Figure 12. The distribution of acoustic radiation forces within the microchannel. .......... 33
Figure 13. Time required for the particle migration toward the pressure node as
a function of particle size ................................................................................ 35
Figure 14. Fabrication process flow of sheathless acoustic particle separator
using SAW ...................................................................................................... 39

v
Figure 15. (a) Fabricated IDTs patterned on a lithium niobate wafer; (b) Fabricated
SU-8 microfluidic channel mold; (c) Completed sheathless two stage
acoustic particle separator for size-dependent separation. .............................. 40
Figure 16. (a) Fabricated IDTs patterned on a lithium niobate wafer; (b) Fabricated
SU-8 microfluidic channel mold with constant-width; (c) Completed
sheathless acoustic particle separator using SAW for density-dependent
separation ........................................................................................................ 41
Figure 17. Photograph of the experimental set-up for operating and observing
the device ........................................................................................................ 43
Figure 18. (a) The chosen location (I–III) in the test section for recording the
fluorescent images of the each particle stream; (b) Fluorescent images
of 10 μm (green) and 3 μm (red) particles distribution; (c) Fluorescent
images of 5 μm (green) and 3 μm (red) particles distribution ........................ 45
Figure 19. Distribution of each of the two particle sizes (3 and 5 μm) over the two
outlets .............................................................................................................. 47
Figure 20. Separation efficiency as a function of input power for 3 and 10 μm
particles ........................................................................................................... 48
Figure 21. Separation efficiency as a function of flow rate for 3 and 10 μm
particles ........................................................................................................... 49
Figure 22. Separation efficiency as a function of particle concentration for 3 and
10 μm particles ................................................................................................ 50
Figure 23. Fluorescent images of the 10 μm PS particles distribution ............................. 53
Figure 24. Fluorescent images of the particle distribution during the density-based
separation (green = 10μm PS; red = 10μm melamine) at the chosen
location (a)–(c) in the test section ................................................................... 55
Figure 25. Analytical (solid and dotted lines) and experimental (triangle and circle
symbols) trajectories of the melamine and PS particles tracked in the
second SAW field where the separation process occurred ............................. 56
Figure 26. Experimental separation efficiency as a function of input power. .................. 58
Figure 27. Experimental separation efficiency as a function of flow rate ........................ 59
Figure 28. Bright field images of the RBCs distribution during the size-based
separation (chicken = 9.7 μm; goat = 3.2 μm) at the chosen location
(a)–(c) in the test section. ................................................................................ 62

vi
Figure 29. Schematic diagram illustrating working concept of the dual SAW-
based active mixing......................................................................................... 66
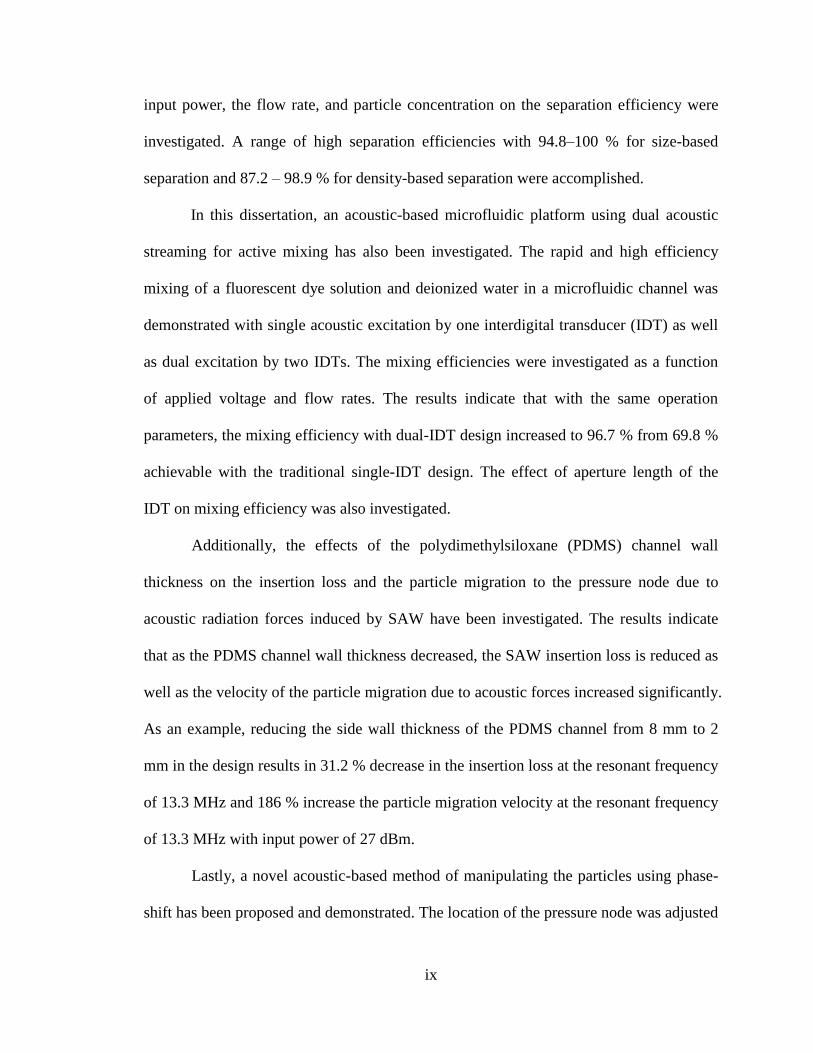
Figure 30. Schematic diagram of the two different SAW-based active micro-
mixers used in this study. ................................................................................ 67
Figure 31. Close-up views illustrating (a) the IDT fabricated on the lithium
niobate substrate and (b) Y-type microfluidic channel mold.......................... 69
Figure 32. Photographic illustration of the experimental setup used for
investigating SAW-based mixer. .................................................................... 71
Figure 33. The fluorescent images (a) at the inlet region and (b-d) at the outside
of the active mixing region. ............................................................................ 74
Figure 34. Plots of intensity profiles across the microfluidic channel width for
different applied voltages at the flow rate of 10 μl/min for (a) the
single excitation by one IDT and (b) the dual excitation by two IDTs........... 76
Figure 35. Mixing efficiency as function of applied voltages for different flow
rates; (a) the single excitation by one IDT, (b) the dual excitation by
two IDTs. ........................................................................................................ 79
Figure 36. Mixing efficiency as function of applied voltages for different flow
rates; (a) the dual excitation by the short-aperture (4 mm) two IDTs,
(b) the dual excitation by the long-aperture (9 mm) two IDTs.. ..................... 80
Figure 37. Schematic illustration of working concept of a typical SAW-based
PDMS microfluidic device ............................................................................. 83
Figure 38. Schematic illustration of the experimental setup for (a) the insertion
loss measurements and (b) particles migration to the pressure node .............. 85
Figure 39. The insertion loss with varying PDMS side wall thickness for a
constant PDMS top wall thickness of 8mm .................................................... 86
Figure 40. The insertion loss as a function of the PDMS side wall thickness for
varying PDMS top wall thickness at the resonant frequency
of 13.3 MHz .................................................................................................... 88
Figure 41. The insertion loss as a function of the PDMS top wall thickness for
varying PDMS side wall thickness at the resonant frequency
of 13.3 MHz .................................................................................................... 88
Figure 42. Fluorescent images of the 10 μm PS particles subjected to the SAW
field within the PDMS channel with the side wall thickness of 2 mm ........... 90

vii
Figure 43. Fluorescent images of the 10 μm PS particles subjected to the SAW
field within the PDMS channel with the side wall thickness of 6 mm ........... 91
Figure 44. Fluorescent images of the 10 μm PS particles subjected to the SAW
field within the PDMS channel with the side wall thickness of 8 mm ........... 92
Figure 45. The transverse distance of the selected particles from the initial
position as a function of time for the different side wall thickness of
the PDMS channel .......................................................................................... 94
Figure 46. Schematic diagram showing working mechanism of particle
manipulation using phase-shift of SAW: (a) no phase-shift, (b) 90°
phase-shift, (c) -90° phase-shift ....................................................................... 97
Figure 47. A composite fluorescent image showing the trajectories of 5 μm PS
particle streams induced by five different phase-shifts of SAW .................. 100
Figure 48. Experimental particle displacement data as a function of phase-shift
applied and theoretical displacements calculated from Equation (22) ......... 101
Figure A. The permission for reuse of author’s own manuscript [102] for
Chapter 4 from Sensors MDPI journal ........................................................... 124
Figure B. The permission for reuse of author’s own manuscript [103] for
Chapter 4 from Sensors and Actuators A: Physical journal ........................... 125
Figure C. The permission for reuse of author’s own manuscript [146] for
Chapter 5 from Sensors and Actuators A: Physical journal ........................... 126
Figure D. The permission for use of the previously published Figure 1 and 2............... 127
Figure E. The permission for use of the previously published Figure 3 ......................... 128
Figure F. The permission for use of the previously published Figure 4 ......................... 129
Figure G. The permission for use of the previously published Figure 5 ........................ 130
Figure H. The permission for use of the previously published Figure 6 ........................ 131

viii
ABSTRACT
Particle separation is of great interest to many biological and biomedical
applications. Flow-based methods have been used to sort particles and cells. However,
the main challenge with flow based particle separation systems is the need for a sheath
flow for successful operation. Existence of the sheath liquid dilutes the analyte,
necessitates precise flow control between sample and sheath flow, requires a complicated
design to create sheath flow and separation efficiency depends on the sheath liquid
composition. In addition, current gold standard active separation techniques are only
capable of separation based on particle size; hence, separation cannot be achieved for
same-size particles with different densities. In this dissertation, a sheathless acoustic-
based microfluidic platform using surface acoustic wave for not only size-dependent but
also density-dependent particle separation has been investigated. In this platform, two
different functions were incorporated within a single microfluidic channel with varying
the number of pressure node and position. The first function was to align particles on the
center of the microfluidic channel without adding any external sheath flow. The second
function was to separate particles according to their size or density. Two different size-
pairs of polystyrene particles with different diameters (3 µm and 10 µm for general size-
resolution, 3 µm and 5 µm for higher size-resolution) were successfully separated. Also,
the separation of two 10 μm diameter, different-density particle streams (polystyrene:
1.05 g/cm3, melamine: 1.71 g/cm
3) was successfully demonstrated. The effects of the
ix
input power, the flow rate, and particle concentration on the separation efficiency were
investigated. A range of high separation efficiencies with 94.8–100 % for size-based
separation and 87.2 – 98.9 % for density-based separation were accomplished.
In this dissertation, an acoustic-based microfluidic platform using dual acoustic
streaming for active mixing has also been investigated. The rapid and high efficiency
mixing of a fluorescent dye solution and deionized water in a microfluidic channel was
demonstrated with single acoustic excitation by one interdigital transducer (IDT) as well
as dual excitation by two IDTs. The mixing efficiencies were investigated as a function
of applied voltage and flow rates. The results indicate that with the same operation
parameters, the mixing efficiency with dual-IDT design increased to 96.7 % from 69.8 %
achievable with the traditional single-IDT design. The effect of aperture length of the
IDT on mixing efficiency was also investigated.
Additionally, the effects of the polydimethylsiloxane (PDMS) channel wall
thickness on the insertion loss and the particle migration to the pressure node due to
acoustic radiation forces induced by SAW have been investigated. The results indicate
that as the PDMS channel wall thickness decreased, the SAW insertion loss is reduced as
well as the velocity of the particle migration due to acoustic forces increased significantly.
As an example, reducing the side wall thickness of the PDMS channel from 8 mm to 2
mm in the design results in 31.2 % decrease in the insertion loss at the resonant frequency
of 13.3 MHz and 186 % increase the particle migration velocity at the resonant frequency
of 13.3 MHz with input power of 27 dBm.
Lastly, a novel acoustic-based method of manipulating the particles using phase-
shift has been proposed and demonstrated. The location of the pressure node was adjusted

x
simply by modulating the relative phase difference (phase-shift) between two IDTs. As a
result, polystyrene particles of 5 μm diameter trapped in the pressure node were
manipulated laterally across the microfluidic channel. The lateral displacements of the
particles from -72.5 μm to 73.1 μm along the x-direction were accomplished by varying
the phase-shift with a range of -180° to 180°. The relationship between the particle
displacement and the phase-shift of SAW was obtained experimentally and shown to
agree with theoretical prediction of the particle position.

1
CHAPTER 1. INTRODUCTION
Lab-on-a-chip (LOC) technology has been developed to carry out chemical,
biological, and biomedical processes on a microchip [1–3]. There are many advantages of
scaling down the laboratory setups below sub-millimeter range, such as faster reaction
rates due to the larger surface to volume ratio, smaller sample volume, high throughput,
potentially low cost by utilizing mass production, and capability for compact and portable
analysis systems [4, 5]. LOC integrates various functionalities of analytical processes in a
miniaturized flow system, such as sample preparation, transportation, mixing, separation,
sorting, and detection.
Especially, the separation of particles or cells is critical for many biological and
biomedical applications, including cell biology, diagnostics, and therapeutics, because
samples contain various types of particles or cells with different abundance levels. For
instance, efficient separation and quantification of human T-lymphocytes (CD4+) from
whole blood is necessary for the monitoring and treatment of HIV [6, 7]. Separation of
neuronal cells is used in cell replacement therapy of neurodegenerative disorders such as
Parkinson’s disease and Alzheimer’s [8, 9]. Also, the diagnostic test for malaria depends
on the separation of parasite infected red blood cells from uninfected cells [10, 11]. Most
gold standard separation techniques are only capable of separation based on particle size;
hence, separation cannot be achieved for same-size particles with different densities.
However, density-based separation is required for many chemical and biological

2
applications, such as white blood cell classification [12], stem cell isolation [13], fetal
cell collection from maternal blood [14], and specific bacterium sorting [15]. As a result,
the development of technique to separate particles or cells efficiently based on not only
size difference but also density difference is highly required because it is as important as
essential preparatory step in many biological and biomedical assays.
The mixing of the sample and reagent is also critical function for biological and
chemical applications including genetic analysis, drug screening, and chemical synthesis
and reactions [16–18]. Typically, LOC system is incorporating microfluidics, which is
the technology of handling fluids on sub-millimeter scales, because most of the
applications are performed in fluids within a microchannel. Since the flow in a
microfluidic channel is highly laminar due to low Reynolds number, the fluid mixing
depends on only molecular diffusion. However, the diffusion mixing is inherently very
slow and needs very long channel designs. Thus, development of fast and highly efficient
mixing techniques within the microfluidic channel is critical to reduce the analysis time
and improve analysis throughput in LOC systems.
To date, the combination of microfluidic system and external forces has been
developed for separation and mixing methods, based on different mechanisms including
optics [19, 20], electrokinetics [21, 22], dielectrophoretics [23, 24], and magnetophoretics
[25, 26]. Especially, acoustofluidics, which refer to the use of acoustic-based external
force in microfluidics, has attracted a high interest because of less power consumption,
non-invasive nature, low manufacturing cost, and fast response time [27, 28]. This
dissertation is focused on exploiting this acoustofluidics to develop highly efficient,
capability, and throughput active separation and mixing techniques.

3
In this dissertation, Chapters 2 and 3 present detailed descriptions of microfluidics
and acoustics, respectively, which are main physical mechanisms of acoustofluidics. The
theory concerning the motions of microfluidics and common materials for microfluidics
are discussed in Chapter 2. The classification of acoustic waves, principle of
piezoelectricity, piezoelectric materials, distinctive characteristics of surface acoustic
wave, and two key parameters including acoustic radiation force and acoustic streaming
are presented in Chapter 3. In Chapter 4, the design, theoretical analysis, fabrication, and
experimental characterization of novel acoustic-based microfluidic devices for size and
density-dependent particles separation are reported. The development of active mixing
microfluidic devices using acoustic streaming is introduced with detailed experimental
data confirming the design principle in Chapter 5. The investigation of effects of
polydimethylsiloxane (PDMS), most widely used polymer material for microfluidic
channel, on acoustofluidics is reported in Chapter 6. In Chapter 7, a precise acoustic-
based particles manipulation technique by using relative phase difference of surface
acoustic waves is presented. Finally, Chapter 8 contains conclusions and suggested future
work.

4
CHAPTER 2. MICROFLUIDICS
Microfluidics is a multidisciplinary science and technology of systems including
engineering, biotechnology, physics, and chemistry. It deals with the behavior of fluids
and suspensions in channels with dimensions of tens to hundreds of micrometers for the
development of miniaturized systems. Since most of biological and chemical analyses are
performed with the flow of liquids and suspensions, microfluidics has emerged as a
critical technology in a variety of miniaturized analysis systems for chemical, biological,
and biomedical applications including drug delivery [29, 30], DNA sequencing [31, 32],
clinical and veterinary diagnostics [33, 34], point of care testing [35, 36], and chemical
synthesis [37, 38]. Microfluidics offers numerous advantages as compared to the
traditional analysis techniques. It leads to a significant reduction in the quantity of
samples and reagent needed for analysis processes, a decrease in analysis and response
time, an improvement of resolution and sensitivity, and enhancement of functionality by
integrating different components, such as LOC or micro total analysis systems (μ-TAS).
2.1. Theory of Microfluidics
The Reynolds number (Re) is the most critical factor to characterize the fluid flow
structure within a channel. The Reynolds number represents the ratio of inertial forces to
viscous forces:

5
hUDRe
(1)
where U , hD , and are the mean flow velocity, the hydraulic diameter of the channel,
and the kinematic viscosity, respectively. Based on the Reynolds number, the fluid flow
can be classified as laminar and turbulent flow. In the laminar flow regime, the fluid
travels smoothly in parallel layers without disruption between the layers. The properties
of fluid flow, such as the velocity and pressure, are constant in time and space. Also, the
transport processes of mass, momentum, and heat occurs very slowly because the laminar
flow regime is characterized by high momentum diffusion and low momentum
convection. On the other hand, in the turbulent flow regime, the fluid moves with
irregular velocity fluctuations, resulting in fast transport processes. It is characterized by
low momentum diffusion, high momentum convection, and variations of velocity and
pressure of the fluid flow in time and space [39, 40].
The flow within microfluidic system is highly laminar due to small dimensions of
the channel. Due to the large surface to volume ratio, the viscous forces are dominant
over inertial forces in the microfluidic channel. For instance, based on the typical
hydraulic diameter of microfluidic channel, 100 μm, mean flow velocity with the order of
1 cm/s, and aqueous medium with density of 1,000 kg/m3 and viscosity of 0.001 Pa·s, the
Reynolds number of the typical flow within microfluidic channel approaches 1. This
highly laminar characteristic of the fluid flow is critical for the efficient design of
microfluidic platforms because laminar microflow patterns can be predicted much more
reliably as opposed to a turbulent flow [41]. The behaviors of fluids and suspensions in
microfluidic systems, such as product distribution of chemical reactions and particles

6
trajectories due to external force field, can be analyzed theoretically or simulated
numerically with a high degree of accuracy. It offers great prospects for evaluating the
performance of the integrated microfluidic systems.
Microfluidics is based on the continuum hypothesis, in which a fluid is not treated
as individual molecules due to very large fluctuation. Instead large numbers of molecules
are blocked together to form a fluid particle. Typically, the fluid particle is cubic with a
side length of about 10 nm and contains about approximately 4×10⁴
molecules [42]. The
continuum hypothesis fails when the fluid system approaches molecular scale, resulting
in nanofluidics such as liquid transport through nano-pores within cell membranes.
The Navier-Stokes equation is important governing equation, which is derived
from Newton’s second law:
m a F (2)
This equation can be expressed with the time-derivative of the velocity and the sum of
several different external forces:
j
j
dm
dtv F= (3)
It is divided by the volume of the fluid particle because the equation is used for the fluid
particle, not the individual molecule based on continuum hypothesis. This leaves the
density, ρ instead of the mass, m, and the force densities, fj instead of the force, Fj as
following:
j
j
df
dt v = (4)
Since Eulerian velocity field, v(r, t) used in Newton’s second law is not for the velocity
of any particular fluid particle, the material time-derivative, ( )t tD v based on

7
Lagrangian description is introduced to Equation (4) for a physically correct equation of
motion:
( ) j
j
ft
v v v = (5)
Typically, three external forces are taken into account including the gravitational force
density ( g ), the pressure force density ( p ), and the viscous force density ( 2 v ).
As a result, the Navier-Stokes equation for incompressible fluids such as watery solutions
becomes:
2( ) pt
v v v g v= (6)
The left term refers to the inertial acceleration and the right term includes viscous forces.
When the inertial forces are very small compared to the viscous forces in microfluidics,
for instance Re << 1, the inertial term can be neglected resulting in the Stokes equation:
20 p g v= (7)
The extensive derivation of the governing equations in microfluidics has been discussed
in the reference [42].
2.2. Microfluidic Channel Materials
The choice of materials is critical for microfluidic devices and systems. Silicon is
typical material used for fabrication of microfluidic channels because it is very common
material in MEMS industry due to its compatibility with complementary metal oxide
semiconductor (CMOS) technology. In addition, silicon has excellent chemical resistance
and good mechanical properties [43]. However, silicon is a relatively expensive material,
needs high-cost manufacturing processes and is not transparent conflicting with optical

8
characterization. The silicon-based microfluidic channel is fabricated using anisotropic
wet etching or deep reactive ion etching (DRIE), resulting in vertical flat sidewalls as
shown in Figure 1. Further information on anisotropic wet etching and DRIE on silicon
substrate can be found in the literature [44, 45].
Figure 1. Scanning electron microscopy (SEM) images showing the cross section of the
silicon channel anisotropically etched [46].
Glass is an alternative material for microfluidic channel as it has several attractive
properties including hydrophilic surface properties, transparency in the visual range, and
electrical insulation [46]. However, glass has disadvantages such as high-cost, opacity in
UV range, and limited integration capability with other materials. Isotropic wet etching is
commonly used to fabricate the glass-based microfluidic channel as shown in Figure 2.
Isotropic wet etching techniques on glass substrate have been widely reported [47, 48].
Recently, polymers have been investigated as popular and promising materials for
microfluidic channels because the use of polymer materials has many advantages over

9
silicon and glass. Polymers can be used for mass production using soft lithography, hot
embossing, and injection-molding techniques. This capability of mass production could
lead the commercialization of LOC systems. In addition, polymers feature inexpensive,
transparent in visible/UV ranges, easily molded, and modified easily to surface properties
[49, 50]. However, it has low thermal stability and low thermal/electrical conductivity.
Different kinds of polymers have been used as microfluidic channel materials including
polystyrene [51], polyimides [52], polycarbonate [53], polymethymethacrylate (PMMA)
[54, 55] and polydimethylsiloxane (PDMS) [56–58]. Among them, PDMS is the most
widely used and popular polymer material for microfluidic channel. PDMS microfluidic
channel can be fabricated using soft lithography replica molding technique as shown in
Figure 3. A more detail studies of PDMS materials in acoustic-based microfluidics will
be discussed in Chapter 6.
Figure 2. Scanning electron microscopy (SEM) images showing the cross section of the
glass (borosilicate) channel isotropiclly etched [46].

10
Figure 3. Scanning electron microscopy (SEM) images showing the cross section of the
PDMS channel after curing on a replication master [59].

11
CHAPTER 3. ACOUSTICS
Acoustics is the interdisciplinary science that deals with the generation,
propagation, and reception of waves in solids, liquids and gases. The scope of acoustics
has extended from sound which can be detected by the human ear to infrasound and
ultrasound which have very lower and higher frequencies, respectively. Thus, acoustics
covers a wide range of fields, such as structural vibration, seismology, underwater sound,
psychoacoustics, music, noise control, bioacoustics, medical imaging, and electroacoustic
communication [60].
There is a wide range of frequencies in acoustics. The most important frequency
range for the acoustic-based devices is the ultrasound, which is defined as above 20 kHz.
It expands to several GHz called the hypersonic regime. Many applications of the
ultrasonic waves have been developed for acoustic sensors, nondestructive evaluation
(NDE), acoustic microscopy, and medical imaging. Generally, most of the applications in
acoustofluidics take place in the range of 1 to 100 MHz, corresponding to wavelengths of
the order of 3 mm to 30 μm with 1500 m/s of the sound velocity in water [61, 62]. Also,
the frequency ranges with 20 kHz to 20 MHz are used for biological and medical
applications including drug delivery, cell and tissue engineering, and diagnostics as can
be seen in Figure 4.

12
Figure 4. Ultrasound frequencies used for biological and medical applications [63].
3.1. Piezoelectricity
There are many different methods for generating ultrasonic waves, such as
piezoelectricity, magnetostriction, electrostriction, electromagnetic, and laser generation
[64]. The piezoelectricity is most widely used in the excitation of ultrasonic waves in
acoustic-based microfluidic devices because of its advantages, such as the highly
repeatable production of complex shape and frequency content waves, the availability of
programmable signal generators, and excitation of different modes of waves. Also,
piezoelectric transduction offers large forces with small strain rates for actuation as well
as relatively large voltages and small currents for sensing, compared to other methods [61,
65].

13
The piezoelectricity is the coupling between mechanical variables and electrical
variables in crystals as shown in Figure 5. There are two types of piezoelectric effects.
The direct piezoelectric effect is the generation of electric displacement by applying a
mechanical stress to a crystal, while the converse piezoelectric effect is the production of
mechanical strain in the crystal induced by applying an electric field. These piezoelectric
effects are mainly connected to the crystal structure of a material. The crystal must lack a
center of symmetry (inversion center) to be piezoelectric; therefore piezoelectric
materials exhibit strong anisotropy in mechanical and electrical properties [66]. The
piezoelectric materials will be discussed in detail in the next section.
Figure 5. Relations among mechanical and electrical variables for a crystal [67].
The coupling between two mechanical variables (strain (S) and stress (T) shown
in Figure 5) and two electric variables (displacement (D) and field (E) shown in Figure 5)

14
can be accounted for by an appropriate modification to the elastic relation and the
electromagnetic relation [44, 61],
E
ij ijkl kl kij kT c S e E (8)
S
i ikl kl ik kD e S E (9)
where E
ijklc are the elastic stiffness constants at a constant electric field, kije are the
components of the piezoelectric stress tensor, and S
ik are the relative permittivity
constant, formerly called the dielectric constant, at constant strain. These equations are
known as the piezoelectric constitutive relations. Equation (8) is an extension of Hooke’s
law which illustrates the relation between stress and strain in a material. The electric field
generates an additional mechanical stress as indicated with an additional term in the
equation. Similarly, the converse effect also produces an additional term in the electric
displacement relation as shown in Equation (9).
3.2. Piezoelectric Materials
As discussed in the previous section, all piezoelectric materials are anisotropic
and non-centrosymmetric. Crystals are optically isotropic, but they are anisotropic with
respect to elasticity. Among 32 crystal classes corresponding to the crystallographic point
groups, 11 classes are centrosymmetric, and accordingly non-piezoelectric. In the
remaining 21 non-centrosymmetric crystal classes, 20 are piezoelectric, including single
crystals, polycrystalline ceramics, and polymers [68].
The traditional piezoelectric materials for generating mechanical energy are
tourmaline, quartz, lithium niobate, zinc oxide, and PZT (Lead zirconate titanate). Of

15
these materials, PZT was the commonly and widely used as functional ceramics in sensor,
transducers and actuators, because it has high dielectric constant, which offers strong
mechanical energy output. However, as biological and biomedical applications of
piezoelectric materials emerged, the use of lead-containing piezoelectric materials, such
as PZT and PMN-PT are gradually being restricted due to the toxicity of lead [69]. Thus,
various lead-free piezoelectric materials are being investigated for biological and
biomedical applications. Especially, lead-free piezoelectric materials including lithium
niobate, lithium tantalite, zinc oxide, polypyrrole, and polyvinylidene fluoride are used in
microfluidics due to their fast response and large force transmission [61].
The selection of piezoelectric materials based on the application field should
consider specific material properties including electromechanical coupling coefficient,
acoustic velocity, and temperature coefficient of delay. The electromechanical coefficient
(k2) describes how much of the electrical energy applied is converted into mechanical
energy:
22
E T
dk
s (10)
where d is the piezoelectric strain coefficient, s is the mechanical compliance, and ε is the
dielectric constant. A high electromechanical coupling coefficient is advantageous for
high acoustic reflection, resulting in decrease of the insertion loss of device. The low
coupling coefficient limits the relative bandwidth [70]. Acoustic wave velocity (Vw) of
piezoelectric materials is determined by the mechanical properties, such as shear modulus,
density, and conductivity [71]. A higher acoustic velocity of piezoelectric substrate
causes a higher frequency operation. The operation of high frequency is critical for higher
mass sensitivity. All piezoelectric materials expand and contract due to heat. These

16
behaviors often cause the changes of other properties, such as shear modulus and density.
This temperature effect is connected to the temperature coefficient of delay (TCD),
indicating the change in acoustic velocity due to temperature variation. TCD properties
should be minimized for sensing application [72].
The type of acoustic wave generated in a piezoelectric material is mainly
determined by the acoustic wave guiding process, the substrate material properties, and
the crystal cut. Generally, acoustic wave can be classified into three types based on the
acoustic wave guiding process; bulk acoustic wave (BAW), surface acoustic wave
(SAW), and acoustic plate mode (APM) [73]. BAW propagates unguided through the
volume of the substrate, SAW travels guided or unguided along the surface of the
substrate, and APM is guided by reflection from two surfaces of the surfaces. Of these
acoustic waves, SAW-based devices have been widely used for applications of
acoustofluidics because BAW is limited to the use of high frequency and APM is difficult
to operate in a standard oscillator circuit [74]. The extensive types of acoustic waves
based on the substrate material properties and the crystal cut have been reported in
references [75–77].
The piezoelectric materials commonly used for generating SAW are quartz (SiO2),
lithium niobate (LiNbO3), and lithium tantalite (LiTaO3). Table 1 shows the properties of
these material cuts. Quartz has great temperature stability due to zero temperature
coefficient of delay (TCD), but very low electromechanical coefficient (k2). This low k
2
of quartz limits the relative bandwidth due to low acoustic reflection. The k2 values of
lithium niobate and lithium tantalite are much larger than that of quartz, hence these
materials are applicable for low loss and wide band applications. Since lithium niobate

17
and lithium tantalite have very large TCD, they are thermally quite fragile, but can be
used exceptionally well as temperature sensors.
Table 1. Properties of commonly used piezoelectric materials for generating SAW; (Cut
orientation indicates the crystal orientation of the substrate surface to normal, Prop
orientation indicates the crystal orientation of the wave propagation direction).
Material
Orientation Vw
(m/s) k
2
(%) TCD
(ppm/oC)
Cut Prop
Quartz
ST X 3158 0.1 0
37o rot Y 90
o rot X 5094 0.1 0
LiNbO3
Y Z 3488 4.1 94
41o rot Y X 4750 15.8 69
128o rot Y X 3980 5.5 75
LiTaO3
36o rot Y X 4220 6.6 30
X 112o rot Y 3301 0.88 18
3.3. Surface Acoustic Wave
Surface acoustic wave (SAW) was first introduced by Lord Rayleigh at the end of
the 19th century who treated the problem of acoustic wave propagation along the surface
of a semi-infinite isotropic medium [78]. SAWs are also called and known as Rayleigh
waves. Surface acoustic wave is a coupled wave of the longitudinal wave and the shear
wave which has normal displacement component to a boundary. Figure 6 shows the
travel of surface acoustic wave through a medium. Small cubes in the figure represent
particles in a medium. The surface acoustic waves travel along the surface with elliptical

18
particle motion in the plane in planes normal to the surface and parallel to the
propagation direction. The amplitude of the particle displacement decreases exponentially
with depth below the material surface, resulting in hardly any motion at deeper than one
acoustic wavelength. As most acoustic wave energy is strongly confined within one
wavelength normal to the substrate surface, the energy density of SAW is very high and
SAW devices are highly sensitive to changes in the surface and environment [79, 80].
Figure 6. The travel of surface acoustic wave (Rayleigh wave) through a medium [79].
Surface acoustic wave is more widely applied for acoustic-based microfluidic
devices as compared to bulk acoustic wave (BAW) due to many advantages: SAW-based
devices dissipate less energy in the microfluidic structure because the SAW energy is

19
inherently confined to the substrate surface before reaching into the chamber. Also, SAW
is capable of very high frequency content and does not need high resonance chamber for
providing acoustic forces [81].
There are many methods for producing surface acoustic wave including wedge
coupling transducer [82], periodic transducer array [83], and interdigital transducer [84,
85]. Of these methods, the interdigital transducer (IDT) is most commonly used for
excitation and detection of surface acoustic waves. The IDT is composed of a pair of
metal comb-shaped electrodes patterned onto the piezoelectric substrate. Figure 7
illustrates the top view of a single-electrode-type IDT.
Figure 7. Top view of a single-electrode-type interdigital transducer.
A voltage applied between the pair of electrodes generates an electric field in the
piezoelectric substrate, and then it excites a strain of the substrate by piezoelectric effect.
The spatial periodic pattern of the electrodes generates travelling acoustic waves along

20
the surface of the substrate due to the periodic strain field, resulting in the surface
acoustic wave. The response is most efficient when the period of the electrodes is equal
to the acoustic wavelength (λ) in the substrate as seen in Figure 7. The electrode finger
width is the same as the finger spacing in the most commonly used single-electrode-type
IDT. Thus, the acoustic wavelength is four times the electrode finger width.
There are important design parameters of IDT for SAW-based devices including
operating frequency, metal thickness of electrode fingers, number of electrode fingers,
and acoustic aperture. The operating frequency, f of the IDT is determined by the acoustic
wavelength (λ) and the SAW velocity on the selected piezoelectric substrate (VSAW):
SAWVf
(11)
When the operating frequency is increased, the sensitivity of the device also increases
[66]. To accomplish higher operating frequency, the piezoelectric substrate having larger
SAW velocity is selected or the acoustic wavelength is decreased by reducing the
periodicity of the IDT fingers.
The deposited metal thickness of IDT fingers could affect the SAW-based device
operation. Thicker IDT fingers offer an excellent electrical contact with lower resistance,
while thinner IDT fingers cause large circuit loading and insertion loss due to higher
resistance [86]. However, if the IDT fingers are too thick, the impedance to the
transmission of the acoustic wave increases, resulting in reduction of the operating
frequency due to decrease of SAW velocity below the IDT fingers. Typically, a deposited
metal thickness of 500–2000 Å is recommended [86, 66].
The number of electrode fingers in the IDT influences the quality factor of the
resulting oscillator. The amplitude of the frequency response increases with the number

21
of electrode fingers, resulting in the aid to circuit oscillation with higher stability and
lower oscillator noise [66]. However, as increasing the number of electrode fingers, the
negative effects of the mass loading and increased reflectivity are also emerged. Previous
studies have suggested the number of electrode finger in the IDT of the range of 50–100
for efficient performance of SAW devices [87–89].
The acoustic aperture is the length of overlap of the IDT finger pairs. It has a
similar function as in optical lenses. Typically, longer acoustic aperture in relation to
acoustic wavelength (λ) leads to more focused wave travel. The only requirement is that
the acoustic aperture should be at least 30 λ to ensure parallel wavefronts [66]. A wide
range of acoustic apertures from 30 to 100 λ are used in the previous studies [90–93].
3.4. Acoustic Radiation Force and Acoustic Streaming
In the field of acoustofluidics, there are two key parameters for the use of
acoustics in fluids, namely the acoustic radiation force and the acoustic streaming. The
acoustic radiation force depends on momentum transfer from the acoustic wave to the
suspended particle, resulting in a translational movement of the particle relative to the
fluid. On the other hand, the acoustic streaming depends on momentum transfer from the
acoustic wave to the fluid.
Acoustic radiation force was described first in 1866 by Kundt and Lehman [94],
and studied for incompressible particles in 1934 by King [95] and for compressible
particles in 1955 by Yosioka and Kawasima [96]. The acoustic radiation force is time-
averaged force acting on particles or cells suspended in a fluid when they are subjected to
an acoustic wave field. The acoustic radiation force originates from the non-linearity of

22
the scattering acoustic wave on the particles. An acoustic discontinuity causes a local
distortion, resulting in a time averaged pressure difference on the surface of the particle
that governs the motion of the particle in the fluid. Thus, the acoustic radiation force is
commonly used for acoustic particle and cell handling in microfluidic systems. A more
detail studies of the acoustic radiation force for particle and cell separation will be
presented in Chapter 4.
Acoustic streaming was analyzed with theoretical model first in 1884 by Rayleigh
[97]. Acoustic streaming is time-averaged motion of the entire carrier fluid due to the
oscillatory acoustic field in the medium, and originates either from bulk attenuation of a
traveling acoustic wave or by interaction between an acoustic wave and a solid boundary.
The magnitude and pattern of acoustic streaming is affected by the geometry of
resonance cavity, such as a microchannel or microchamber [98]. The tip of the sharp
structure causes localized streaming vortices. Sharp edges should be avoided in
microfluidic systems as streaming is minimized. The acoustic streaming offers distinct
benefits in microfluidic applications, such as trapping of small particles [99], micro-
pumps for liquids [100], and the active mixing in highly laminar fluid flow [101]. The
application of the acoustic streaming for fluid mixing in microfluidic systems will be
discussed in detail at Chapter 5.

23
CHAPTER 4. SURFACE ACOUSTIC WAVE-BASED SEPARATION
Note to Reader
The manuscript and the results presented in this chapter have been previously
published [102, 103] and are utilized with permission of the publisher.
4.1. Introduction
To date various techniques for particle or cell separation have been studied.
Particle or cell separation techniques can be classified as active and passive separation
based on the fundamental separation principles. Active techniques rely on an external
force field for functionality, such as magnetic field [104, 105], dielectric field [106, 107],
acoustic field [108, 109], and optical field [110, 111]. On the other hand, passive
techniques depend entirely on the channel geometry and inherent hydrodynamic forces
for functionality, such as hydrodynamic filtration [112, 113], deterministic lateral
displacement [114, 115], pinched flow fractionation [116, 117], and inertial [118, 119].
However, the separation criteria for most these techniques is particle size, thus
separation of same-size particles with different densities cannot be accomplished. There
have been some density-based separation studies using passive techniques [120–122].
However, they require the use of the medium with density gradient, very accurate flow
rate control, relatively long time, and complex channel configuration. Thus, a simple,
versatile, and high throughput system achieving continuous density-based separation is

24
needed. Among the active separation techniques, only the acoustic-based method can
separate particles based on not only density differences but also size differences, as the
acoustic radiation force depends on the volume of particle as well as the relative density
of particle and medium.
When particles in a medium are subjected to an acoustic wave field, they
experience pressure gradients. These pressure gradients can be used to manipulate
suspended particles [123–125]. The acoustic-based method is an ideal particle or cell
manipulation method for lab-on-a-chip devices, since this label-free method features low
manufacturing cost, non-invasive nature, ability to separate a vast number of particles,
and fast response time. Recent studies demonstrated the separation and manipulation of
particles in microchannels using bulk acoustic waves (BAW) generated by substrate-
bonded bulk transducers [126, 127]. However, the generation of bulk acoustic waves
requires a high acoustic reflection coefficient of the microfluidic channel material. This
requirement makes the bulk acoustic wave approach not applicable to many microfluidic
devices that utilize commonly used materials with poor acoustic reflection such as
polydimethylsiloxane (PDMS) [128]. Furthermore, since bulky commercial transducers
are employed to generate acoustic waves, it conflicts with miniaturization and integration
efforts.
To alleviate these shortcomings, surface acoustic wave (SAW) based techniques
have been investigated owing to their low propagation loss, high sensitivity to the surface
modification, low power consumption, and facile integration into microfluidic networks.
One concern about the acoustic based separation technology is that the mechanical forces
generated by the acoustic waves may potentially damage cells. However, since the

25
operating frequencies of SAW separation devices (tens of MHz) correspond to time
scales smaller than the molecular relaxation time and certainly any relaxation time of the
cellular structures, there is no shear damage with these high frequency devices [129, 130].
SAW devices have been investigated in wide variety of applications including
fluid-mixing [131, 132], fluid-pumping [133, 134], particle focusing [135, 136], and
particle sorting/collection [137, 138] in microchannels. Recently, standing SAW,
generated by a pair of interdigitated microelectrodes on a piezoelectric substrate, have
been demonstrated to separate polystyrene microparticles [139, 140]. The technique of
using SAW that travel along the substrate surface works with any microchannel material
and can be incorporated easily into a multi-functional device design due to its simplicity.
However, current state-of-the-art SAW based particle separation platform
employs two external sheath flows to divide particle mixture streams as well as to prevent
trapping and aggregating along the sidewall of the channel [139–141]. Introducing sheath
flow to a microchannel has several fundamental disadvantages, such as dilution of the
analyte by the sheath liquid, need for accurate flow control between sample and sheath
flow, complicated structure in order to create sheath flow, and separation efficiency
strongly depending on the sheath liquid composition [142]. Previous studies have
investigated sheathless 3D particle focusing [136] and pattering acting as acoustic
tweezers [143] using SSAW without any particle/cell separation capability. As a result,
currently there is no report of SAW based particle separation technique without using any
external sheath flow as well as of density-dependent particle separation using SAW. In
this chapter, the sheathless microfluidic platform for size-based and density-based
particle separation using SAW is presented.

26
4.2. Materials and Methods
4.2.1. Working Principle
When a particle suspended in a medium is subjected to an acoustic field, the
acoustic force acting on the particle can be expressed as [144],
2( )( , )sin(2 )
2
p m
r
P VF kx
(12)
5 2
,2
p m p
mp m
(13)
where P, Vp, λ, ρ, β, k, x are the acoustic pressure amplitude, particle volume, wavelength,
density, compressibility, wave number, and the distance from the pressure node
respectively. The subscripts of p and m denote particle and liquid medium, respectively.
When particles are subjected to the acoustic forces, the direction of the particle
movement in the SAW field is determined by acoustic contrast factor (ϕ): If ϕ > 0, the
particles will be attracted to the pressure node; if ϕ < 0, particles will move to the
pressure anti-node. In general, most solid particles including cells suspended in an
aqueous medium have positive acoustic contrast factor and they move towards pressure
nodes [128].
Figure 8 shows the design concept and working mechanism of the SAW-based
microfluidic platform for size-dependent particle separation. Two identical interdigital
transducers (IDTs) are fabricated on a piezoelectric substrate, and a microfluidic channel
is aligned between the IDTs. When the two IDTs are stimulated with RF signals of equal
amplitude, two series of surface acoustic waves (SAWs) propagate in opposite directions
toward the particle solution inside the microfluidic channel. The constructive interference
of the two SAWs forms a standing SAW that generates a periodic distribution of pressure

27
nodes (minimum pressure amplitude) and anti-nodes (maximum pressure amplitude)
inside the microfluidic channel. When the SAW reach the liquid medium inside the
microfluidic channel, they are converted to leakage waves causing pressure fluctuations
in the medium. These pressure fluctuations result in acoustic forces that act laterally on
the particles. As a result, the suspended particles inside the microfluidic channel will be
forced toward the pressure nodes in the SAW field.
The first stage uses a relatively narrow microfluidic channel to align particles at
the center of the channel without introducing any external sheath flow. In the first stage,
the width of the microfluidic channel (W1) is chosen to be the half-wavelength (λ1/2) of
the SAW so that the microfluidic channel contains only one pressure node located in the
center of the channel. Thus, particles will aggregate at the center-line of the microfluidic
channel by the time they reach the end of the first stage microchannel.
In the second stage, a wider channel (W2) that has a width of one-wavelength of
the SAW (λ2), so that two off-center pressure nodes exist in the channel. Suspended
particles enter the second stage channel at the anti-node. Thus the acoustic forces will
move particles towards the pressure nodes. As shown in the equation (12), since the
strength of the acoustic force on a particle is proportional to its volume, bigger particles
are subjected to larger acoustic forces. That means the lateral displacements of the
particles induced by the acoustic forces are strongly dependent on the particle size. The
bigger particles will move to the pressure nodes located near side walls with larger lateral
displacement along the x-direction, whereas smaller particles remain in the near center
stream during a given relatively short SAW exposure time due to the difference in
magnitude of acoustic forces. Therefore the particles can be separated by their sizes. It is

28
important note that the SAW exposure time can be adjusted by changing the flow rate
and the applied power.
Figure 8. Working mechanism of SAW-based sheathless size-dependent particle
separation (Note that the figure is not drawn to scale). The first stage aligns the particles
on the center line of the microfluidic channel, while the second stage separates them
according to their sizes.

29
For the investigation of density-based separation capability of the sheathless
microfluidic platform, two separate functions are incorporated in a single constant-width
microfluidic channel for a simpler and more efficient integrated device with judiciously
shifting the location of IDT pairs (along x-direction in Figure 9) by quarter of the
operation wavelength with respect to each other. As similar to size-based separation work,
the first function is to align particles at the center of the microfluidic channel without
adding any sheath flow. The second is to separate particles according to their densities.
The microchannel width, SAW wavelength, and position of the IDTs pairs are designed
so that only one pressure node occurs at the center of the channel in the first SAW field,
while the two pressure nodes are located at the side walls of the channel in the second
SAW field. The strength of the acoustic radiation force depends on the relative density of
particle and medium as described in Eq. (12) and (13); thus, higher density particles are
subjected to larger acoustic forces.
When entering the first SAW field, all particles are collected at the pressure node
in the center of the channel through relatively long SAW exposure time. After aligned in
the first SAW field, the high-density particles move towards pressure nodes located at the
two side walls with larger lateral displacement along the x-direction, whereas low-density
particles remain in the near center stream during a given relatively short SAW exposure
time due to the difference in magnitude of acoustic forces. The particles stay in the
defined positions even after the acoustic force field is removed as the flow is laminar in
the microfluidic channel. As a result, different-density particles accumulate into multiple
collection outlets, as illustrated schematically in Figure 9.

30
Figure 9. Concept view of sheathless density-based particle separation using SAW (Note
that the figure is not drawn to scale). The first SAW field aligns the particles at the center
of the microchannel, while the second SAW field separates them according to their
densities (red color = high-density particles [two side outlets], green color = low-density
particles [center outlet]).
4.2.2. Theoretical Analysis
As shown in Figure 10, when a particle suspended in a medium is subjected to an
acoustic field, four different forces act on a particle: lateral acoustic force (along the X-
axis), viscous drag force (opposite to the direction of particles’ velocity relative to fluid
flow), gravity force (along the Z-axis downward), and buoyant force (along the Z-axis
upward). The theoretically calculated magnitude of these forces as a function of particle
size at the present experimental parameters (ρ=1.05 g/cm3 and β=2.46×10
−10 Pa
−1 for

31
polystyrene particles, ρ=1.0 g/cm3 and β=4.58×10
−10 Pa
−1 for DI-water medium, SAW
wavelength: 300 μm, input power: 0.5 W, flow rate: 0.5 μl/min) is illustrated in Figure 11.
Based on the Stokes’ law, the particle velocity relative to the fluid was used with the
reference value of 1 μm/s for calculating the viscous drag force for a very small Reynolds
number flow [143]. It can be observed that the gravitational and buoyant forces are
balanced with similar magnitudes and opposite directions. Since the viscous force is
proportional to the radius of the particles (r) while the acoustic force is proportional to
the volume (r3) of the particles, the acoustic forces are generally dominant in the case of
larger particles. However, when the diameter of the particles is less than about 0.3 μm,
the acoustic forces are smaller than the viscous forces. In this case, the size-dependent
separation may not be achieved by acoustic radiation forces.
Figure 10. A schematic diagram showing all forces acting on a particle when a particle
suspended in a medium is subjected to an acoustic field. Note that acoustic force is only
shown along lateral direction (along the X-axis) in the figure although acoustic force may
act on a particle in three-dimensional direction.

32
Figure 11. Theoretical analysis of forces acting on a particle as a function of particle size.
Figure 12 shows the acoustic force distribution as a function of particle size
within the microfluidic channel. The acoustic forces were represented by Equations (12)
and (13) under the one of real experiment conditions (ρ=1.05 g/cm3 and β=2.46×10
−10
Pa−1
for polystyrene particles, ρ=1.0 g/cm3 and β=4.58×10
−10 Pa
−1 for DI-water medium,
SAW wavelength: 300 μm, input power: 1 W). The results show that the acoustic forces
change sinusoidally and are equal to zero at the wave crest, wave trough and nodal plane.
Especially, as the particle diameter is reduced, the acoustic force decreases very rapidly.
The peak value of the acoustic force of 10 μm particle is 191 pN, while that of 3 μm
particle is only 5 pN. Since the particle displacements induced by acoustic forces are

33
strongly dependent on the particle size, the larger particles are moved to the pressure
nodes, whereas smaller particles remain in the center stream at a given SAW working
time.
Figure 12. The distribution of acoustic radiation forces within the microchannel.
The time required for the particle migration toward the pressure node can be
theoretically predicted by using the balance between the acoustic radiation force and the
viscous drag force acting on a particle [139, 143]:
2
06 , sin(2 )
2
p mP Vrv kx
(14)

34
where μ, r, v, P0, Vp, λ, ρ, βm, k, x are the viscosity of the medium, particle radius, relative
velocity between the particle and the medium, acoustic pressure amplitude, particle
volume, wavelength, density, compressibility, wave number, and the distance from the
pressure node respectively. Based on equation (14), the relative velocity can be expressed
as following:
2
0 4, sin
12
p mP V xv
r
(15)
By rewriting with v = -dx/dt and separation variables,
2
04cos ,
12
p mP Vxec dx dt
r
(16)
From the equation (16), the time required for a particle to reach the pressure node was
derived as following:
2
1
2
0
2
2ln(tan )
3
,
x
x
p m
x
rt
VP
(17)
where, x1 and x2 are the initial position and the final position of the particle, respectively.
The acoustic pressure amplitude (P0) was determined from
0 /P PZ A (18)
where P, A, and Z (= ρ×c) are the input power, SAW working area, acoustic impedance,
density of the substrate , and wave propagation velocity of the substrate, respectively.
Figure 13 shows the time required for the particle migration toward the pressure
node with varying the diameters of the particles. As expected, the larger particle moves to
the pressure node faster than the smaller particle (for instance, 3μm: 1.81 s, 5μm: 0.65 s,
10μm: 0.16 s). Based on these predictions, the length of the microchannel in each stage

35
can be determined. The channel length of the first stage should be long enough so that all
particles can reach the pressure node at the center of the channel, while the channel
length of the second stage should be relatively short so that only larger particle move to
the pressure nodes. It is important to note that the actual migration time of the particles
toward the pressure node can also be readily adjusted by tuning the input power and the
flow rate during the experiments.
Figure 13. Time required for the particle migration toward the pressure node as a function
of particle size.
4.2.3. Device Design and Fabrication
The design parameters of the two stages SAW-based microfluidic device for size-
dependent particle separation are presented in Table 2. The SAW wavelength, the IDT

36
finger pitch, and finger width were chosen as 300 μm, 300 μm, and 75 μm, respectively.
The channel width of the first stage was 150 μm, half of the SAW wavelength, to contain
only one pressure node in the center of the channel. On the other hand, the second stage
width was 300 μm, the same as SAW wavelength, to have two pressure nodes in the
channel. The operating frequency of the SAW is determined by the ratio of the SAW
velocity (VSAW) on the substrate and SAW wavelength (λ); f = VSAW/λ. With the SAW
velocity 3,970 m/s for the chosen SAW direction on the substrate, the operating
frequency is 13.2 MHz.
Table 2. Design parameters used for two stages SAW-based microfluidic device for size-
dependent particle separation.
Wavelength (λ) 300 μm First stage
channel width 150 μm
IDT finger width 75 μm Second stage
channel width 300 μm
IDT finger pitch 150 μm Channel height 100 μm
IDT finger pairs 20 pairs Operating frequency 13.2 MHz
Nam et al. have reported that the pressure nodes would appear in the two-
dimensional plane along the axial flow in a microchannel as the direction of SAW is
perpendicular to the axial flow direction [140]. Such two-dimensional particle
distribution would be dependent on the channel height or aspect ratio (H/W) of channel.
For a channel with low aspect ratio, the flow velocity is practically uniform over the
channel width except near the edges, while having a parabolic profile over the shorter

37
dimension [145]. Thus, thin rectangular channel would be more efficient for applying
SAWs on particles. As a result, the microchannel height is chosen as 100 μm ensuring a
low aspect ratio (1st stage: H/W = 0.66, 2nd stage: H/W = 0.33) for increased separation
efficiency.
The sheathless SAW-based particle separator was realized by three consecutive
fabrication steps: the fabrication of IDTs on a substrate, the fabrication of the PDMS
microfluidic channel, and the bonding of the PDMS microchannel to the substrate
containing IDTs. Figure 14 shows the fabrication process flow of the present sheathless
SAW-based particle separator. For the fabrication of the IDT substrate, a two-side
polished Y + 128° X-propagation lithium niobate (LiNbO3) wafer was used due to its
excellent optical properties in the visible spectrum and its high electromechanical
coupling coefficients. The wafer was first pre-cleaned by rinsing with acetone, methanol
and de-ionized water. A 100 nm thick chrome layer was then deposited on the lithium
niobate wafer using CRC sputtering system (Torr International, New Windsor, NY, USA).
The lithium niobate wafer was then spun with 1.6 μm-thick photoresist (S1813, Shipley,
Marlborough, MA, USA) at 3,000 rpm for 40 s, and soft baking of the photoresist was
performed on a hot plate at 100 °C for 1 min. The wafer was patterned with a UV light
source with an exposure dose of 125 mJ/cm2 and developed in a photoresist developer
(MF 319, Shipley) for 70 s. After hard baking was performed on a hot plate at 115 °C for
5 min, the chrome layer was etched using chrome etchant (CR-7S, Cyantek, Fremont, CA,
USA). Finally, the photoresist was removed by the photoresist remover. Each IDT
consisted of 20 finger pairs with 150 μm finger pitch and 75 μm finger width. The
fabricated IDTs on the lithium niobate substrate are shown in Figure 15(a).

38
The microfluidic channel was fabricated using soft lithography replica molding
technique. To obtain 100 μm thick mold layer, negative photoresist (SU-8 2075,
MicroChem, Newton, MA, USA) was spun onto the silicon wafer at 500 rpm for 10 s
with acceleration of 100 rpm/s to spread out the photoresist, then at 2,000 rpm for 30 s
with acceleration of 300 rpm/s. The wafer was then soft baked for 5 min at 65 °C and 20
min at 95 °C. The wafer was then patterned with a UV light source with an exposure dose
of 240 mJ/cm2 and post exposure baking was performed directly after exposure for 5 min
at 65 °C and 10 min at 95 °C. After developed in the SU-8 developer for 10 min, the
wafer was hard baked for 5 min at 150 °C. The uniformity of the SU-8 mold height was
confirmed using a surface profilometer. The PDMS oligomer and crosslinking
prepolymer of the PDMS agent from a Sylgard™ 184 kit (Dow Corning, Midland, MI,
USA) was mixed in a weight ratio of 10:1, poured onto the SU-8 mold, and then cured at
room temperature for 24 h to prevent PDMS shrinking due to heat. After the PDMS
replica was peeled off from the mold, the inlets and outlets were generated using 20-
gauge needle. The fabricated microchannel mold is shown in Figure 15(b). For bonding
the PDMS microchannel to the substrate containing IDTs, oxygen plasma (1 min at 20
sccm oxygen flow rate, 500 mTorr chamber pressure, and 100 W power) was used to
activate both surfaces. After ethanol, acting as a lubricant, was dropped on the surface of
IDT substrate, alignment of the PDMS microchannel and IDT substrate was conducted.
Figure 15(c) shows a complete sheathless two stage acoustic particle separator for size-
dependent separation including the PDMS microchannel and IDT substrate.

39
Figure 14. Fabrication process flow of sheathless acoustic particle separator using SAW.

40
Figure 15. (a) Fabricated IDTs patterned on a lithium niobate wafer; (b) Fabricated SU-8
microfluidic channel mold; (c) Completed sheathless two stage acoustic particle separator
for size-dependent separation.
As discussed in Chapter 4.2.1, new sheathless acoustic particle separator with
constant-width microchannel for a simpler and more efficient integrated device as
opposed to the two-stage microchannel was designed and fabricated for density-based
particle separation. The detailed fabrication steps of the device are same as the previous
description for two-stage acoustic particle separator. The fabricated IDTs on the LiNbO3
substrate for density-based particle separation are shown in Figure 16(a). Each IDT
consisted of 20 finger pairs with 300μm finger pitch and 75μm finger width. The position
of the each IDTs pairs was shifted by 75μm as shown in Figure 16(a), corresponding to a

41
quarter of the SAW wavelength, on the substrate so that the pressure nodes are located at
the center of the channel in the first SAW field and at the two side walls in the second
SAW field. The patterned SU-8 microfluidic channel mold with constant-width is shown
in Figure 16(b). The width and height of the microfluidic channel fabricated were 150μm
and 80μm, respectively. Figure 16(c) shows a complete the sheathless acoustic particle
separator using SAW for density-dependent separation.
Figure 16. (a) Fabricated IDTs patterned on a lithium niobate wafer; (b) Fabricated SU-8
microfluidic channel mold with constant-width; (c) Completed sheathless acoustic
particle separator using SAW for density-dependent separation.

42
4.2.4. Experimental Setup
For the size-based particle separation, first a signal generator (AFG3022B,
Tektronix) was used to generate the low-amplitude AC signal. To increase the efficiency
of the wave generation, then the AC signal was fed into a RF power amplifier (325LA,
ENI) to obtain sufficient signal voltage amplitude. The amplified signal was split two
ways to provide identical signals to the IDTs and generate SAWs propagating on the
substrate surface. The integrated device was placed on the stage of an inverted
microscope (IX-51, Olympus) for visualization. A mixture solution of polystyrene
fluorescent particles (Thermo Scientific, Waltham, MA, USA) with diameters of 3 μm
(red) and 10 μm diameter (green) was injected into the microfluidic channel by a syringe
pump (KDS200, KD Scientific, Holliston, MA, USA). Also, for high-resolution particle
separation experiments, a mixture solution of polystyrene fluorescent particles with
diameters of 3 μm (red) and 5 μm (green) diameters was introduced. The high speed
fluorescent images in the microchannel were obtained with a CCD camera (XM-10,
Olympus) and image acquisition software (cellSens, Olympus). Each image was captured
by using two color filter cubes—FITC-3540B (482 nm / 536 nm) and U-MWG2 (530
nm/590 nm) —to filter a specific excitation and emission wavelength of the fluorescent
particles. A complete experimental setup is shown in Figure 17.
To study the effect various parameters on the separation efficiency, the input
power range applied to the IDTs was from 250 mW to 1 W, the flow rate ranged from 0.5
μl/min to 5 μl/min, and the concentration of each of the particles in the sample
suspension ranged from 1% to 4% by volume. The PDMS microfluidic channel was
responsible for the range of the power applied in the present experiments. The net power

43
applied to the IDTs to achieve particle focusing and separation depends on the SAW
wavelength, particle size, and flow speed. Prior studies of SAW induced by IDT have
applied similar power values to PDMS microfluidic channel for particle manipulation
[123,135,140].
Figure 17. Photograph of the experimental set-up for operating and observing the device.
For the density-based particle separation, a mixture solution of fluorescent
polystyrene (PS) particles (Thermo Scientific, Waltham, MA) and fluorescent melamine
particles (Sigma-Aldrich, St. Louis, MO) with the same diameter (PS: 10μm ± 0.21μm,
melamine: 10μm ± 0.15μm) and different density (PS: 1.05 g/cm3, melamine: 1.71 g/cm
3)
was introduced to the microfluidic channel by a syringe pump (KDS200, KD Scientific).

44
The concentration of the particles in the sample suspension was 1% by volume. To study
the effect of the parameters on the separation efficiency, the net power applied to the
IDTs varied from 0.32 W to 1.28 W and the flow rate from 0.2 μl/min to 2 μl/min.
4.3. Results and Discussion
4.3.1. Size-based Particle Separation
At three different locations marked as (I), (II) and (III) in Figure 18(a), the
distribution of 3 μm and 10 μm PS particle streams was captured during the separation
process as shown in Figure 18(b). During the experiment, the frequency, the input power,
the flow rate, and the concentration were set to 13.2 MHz, 1 W, 0.5 μl/min, and 1% by
volume, respectively.
Location (I) was before the particles entered the first stage. One can clearly
observe that both sizes of particles were randomly scattered in the channel. When
particles entered the first stage (location (II)), the acoustic forces acting on the particles
aligned them at the center of the channel where pressure nodes existed. Location (III)
coincided with the second stage of the device. As can be observed from the figure of the
location (III), the 10 μm particles moved to the pressure nodes while the 3 μm particles
remained in the center of the channel because the acoustic forces exerted on the 3 μm
particles were insufficient to push them into the pressure nodes during a given short SAW
exposure time. As a result, the larger particles were separated to the side channels and the
smaller particles were directed to the center channel.

45
Figure 18. (a) The chosen location (I–III) in the test section for recording the fluorescent
images of the each particle stream; (b) Fluorescent images of 10 μm (green) and 3 μm
(red) particles distribution; (c) Fluorescent images of 5 μm (green) and 3 μm (red)
particles distribution. Constant operating frequency of 13.2 MHz, input power of 1 W,
flow rate of 0.5 μl/min, and particle concentration of 1% by volume were applied for (b)
and constant operating frequency of 13.2 MHz, input power of 1.45 W, flow rate of 0.2
μl/min, and particle concentration of 1% by volume were applied for (c).

46
Figure 18(c) shows the distribution of 3 μm and 5 μm polystyrene particle streams
during the separation process at the same locations as illustrated in Figure 18(a). Since
the acoustic forces were not applied to the inlet region, expectedly both particle sizes
were randomly distributed in the channel (location (I)). As the particles entered the first
stage, they were accumulated and aligned by the acoustic forces to the center of the
channel where the pressure node existed (location (II)). When the particles traveled to the
second stage (location (III)), 5 μm particles did not migrate completely to the pressure
nodes located near side walls and remained in the center stream due to insufficient
acoustic forces during short SAW exposure time. On the other hand, when the input
power was significantly increased even 3 μm particles are driven to the pressure nodes,
conflicting with our separation efforts. As a result, an optimization study has been
conducted to determine the appropriate input power and the flow rate parameters to
accomplish high-resolution separation with small size difference particle streams. As
illustrated in Figure 18(c) location III, with the optimized input power parameter of 1.45
W and flow rate of 0.2 μl/min, 5 μm particles were separated to the side channels while 3
μm particles were collected to the center channel. These experiments show that the
present device is capable of separating high-resolution different-size particles without
introducing any external sheath flow to the microfluidic channel.
To quantitatively determine the separation efficiency, the images were acquired
from each outlet at 20 frames per second using CCD camera. The acquired images (600
frames) were analyzed with image processing software (ImageJ®
, National Institutes of
Health, Bethesda, MD, USA) to count the number of particles collected from each outlet.
First, the images were converted to grayscale and then the threshold was set for each

47
image. The thresholded images were then converted to binary images. Since some of
particles were agglomerated, automatic thresholding method recognized them as a single
object. Thus, a watershed segmentation process was performed to accurately count such
cases. Finally, the number of particles was quantified using the menu command Analyze
particles with the specific parameters. Figure 19 shows the percentage of each of the two
size particles (3 μm and 5 μm) collected from center outlet (yellow) and side outlets (pink)
at high-resolution separation experiments. The graph demonstrates that 97.5 % of the 5
μm particles were separated to the side outlets after passing through the second stage,
while 2.5 % of 5 μm particles were collected to the center outlet. Also, 87.9 % of 3 μm
particles were collected to the center outlet, whereas 12.1% of 3 μm particles were driven
to the side outlets.
Figure 19. Distribution of each of the two particle sizes (3 and 5 μm) over the two outlets.

48
The acoustic separation efficiency depends on the applied power, flow rate,
wavelength of the SAW, channel geometry and particle concentration. Among these
parameters, we investigated the effects of the input power, the flow rate, and particle
concentration on the separation efficiency between 3 μm and 10 μm as illustrated in
Figures 20, 21, and 22 respectively. The separation efficiency was defined as A/(A + B)
for the 3 μm particles and B/(A + B) for the 10 μm particles, where A is the number of
the target particles collected from the center outlet and B is the number of the target
particles collected from the side outlets.
Figure 20. Separation efficiency as a function of input power for 3 and 10 μm particles
(driving frequency: 13.2 MHz, flow rate: 0.5 μl/min, particle concentration: 1 % by
volume).

49
As a result of the particle counting analysis, the separation efficiency for both
particle sizes as a function of power applied to IDTs is shown in Figure 20. The driving
frequency was 13.2 MHz, the particle concentration was 1% by volume, and the flow rate
was fixed at 0.5 μl/min. As can be observed from this figure, the separation efficiency of
the 3 μm and the 10 μm particles were measured in the range of 89.5–94.8 % and 93.7–
100 %, respectively, at the applied power range of 0.25 to 1 W. The separation efficiency
increased as the input power increased because the acoustic radiation force is
proportional to the acoustic pressure amplitude which is determined by the input power
and acoustic impedance.
Figure 21. Separation efficiency as a function of flow rate for 3 and 10 μm particles
(driving frequency: 13.2 MHz, input power: 1 W, particle concentration: 1 % by volume).

50
The effect of the flow rate on the particle separation efficiency is also investigated
in Figure 21. The driving frequency, particle concentration, and the applied power were
kept constant at 13.2 MHz, 1% by volume, and 1 W, respectively. The separation
efficiencies of the 3 μm and the 10 μm particles were obtained in the range of 84.6–
94.8 % and 91.7–100 %, respectively, at the flow rate range of 0.5 to 5 μl/min. The
results show that lower flow rates provide higher separation efficiency since the particles
were exposed to the SAW field for a longer time period allowing higher number of
particles moving to the pressure nodes.
Figure 22. Separation efficiency as a function of particle concentration for 3 and 10 μm
particles (driving frequency: 13.2 MHz, input power: 1 W, flow rate: 0.5 μl/min).

51
Experimental efficiency results with different particle concentrations were also
shown in Figure 22. Constant driving frequency of 13.2 MHz, input power of 1 W, and a
flow rate of 0.5 μl/min were used during these experiments. The separation efficiencies of
the 3 μm and the 10 μm particles were achieved in the range of 87.4–94.8% and 94.6–
100%, respectively, at the particle concentration range of 1 to 4 %. The higher particle
concentration yielded lower separation efficiency because the width of the aligned
particles band at the first stage increased and existence of the thicker 3 μm particle band
slowed down the displacement of the 10 μm particles across the microchannel in the
second stage. As a result, the separation of very high concentration bioparticles such as
whole blood with this platform may be more involved and may require additional power
input or lower flow rate with the wider channel outlets to achieve high separation
efficiency.
As expected, the separation efficiency of the 3 μm particles was lower than that of
the 10 μm particles for all cases. The fundamental reason for this behavior was that the
number of the misaligned 3 μm particles at the first stage was more than that of the 10
μm particles due to the relatively low acoustic forces exerted on the 3 μm particles. In the
separation procedure of this platform, the alignment of the particle is one of the most
important tasks directly affecting the efficiency of the separation. If the particles don’t
line up at the center of the channel before entering the second stage, this can negatively
impact the separation efficiency, as illustrated by our own experiments. It is worth
commenting here that this particular design is only capable of separating two different
size particle streams. However, as shown in Figure 12, the peak values of the acoustic
force on 3 μm, 5 μm, 7 μm, and 10 μm particles are 5 pN, 24 pN, 66 pN, and 191 pN,

52
respectively. This force magnitude difference is sufficient to achieve three or more
different size particle separation. Hence by modifying the working wavelength, the IDT
configuration, the width of the channel, and the number of the channel outlets separation
of three or more different size particle streams can be achieved with this platform.
4.3.2. Density-based Particle Separation
To investigate the response of the particles and precise locations of the pressure
nodes in the constant-width microfluidic channel designed newly, fluorescent images of
the 10 μm PS particles that were subjected to the acoustic radiation force were recorded.
The operation frequency, input power, and flow rate were set to 13.3 MHz, 1.42 W, and
0.1 μl/min, respectively. Figure 23 shows the different time snapshots to track the
distribution of the particles at the first SAW field, where a single pressure node occurs at
the center of the channel (Figure 23(a)), and the second SAW field, where pressure nodes
coincide with the side channel walls (Figure 23(b)).
At t=0, the particles were randomly distributed in the microchannel, as they were
not being exposed to SAW field. When the acoustic field is initiated (t=0.2 s), the
particles started to move towards the center of the channel (Figure 23(a)) and side
channel walls (Figure 23(b)). The dash-lined circles and rectangles illustrate the time
snapshots to track the distribution of the selected particles. One can observe that the
particles were driven to the pressure nodes of the SAW by the acoustic radiation forces.
The time required for particle migration towards the pressure node was less than 2
seconds with the experimental conditions. It is important to note that the migration time

53
of each particle toward the pressure node can readily be adjusted by tuning the input
power and flow rate during the experiments.
Figure 23. Fluorescent images of the 10 μm PS particles distribution (operating frequency:
13.3 MHz, input power: 1.42 W, flow rate: 0.1 μl/min). (a) at the first SAW field where a
single pressure node exists in the center of the channel, and (b) at the second SAW field
where pressure nodes occur at the two side channel walls.

54
Figure 24 illustrates the distribution of PS 10 μm (ρ=1.05 g/cm3) and melamine
10 μm (ρ=1.71 g/cm3) particles during the density-based separation process at three
different locations, marked as (a), (b), and (c) in the microfluidic channel. During the
experiments, a constant operating frequency of 13.3 MHz, an input power of 1.28 W, and
a flow rate of 0.5 μl/min were applied. Since no acoustic forces were applied to the
location (a), different density particle streams were randomly distributed in the channel.
As illustrated in Figure 24(b), when the particles were exposed the first SAW field, they
were accumulated and aligned by the acoustic forces at the center of the channel where
the pressure node existed without adding any sheath flow. The aligned particles moved
along the defined positions even after passing the first SAW field due laminar flow
behavior in the microfluidic channel. Then, density-based separation occurred when the
particle streams were exposed to the second SAW field (Figure 24(c)). The melamine
particles (high-density) moved to the pressure nodes located along the two side walls of
the channel immediately. Although the PS particles (low-density) started to be driven to
the pressure nodes, the lateral displacements of the PS particles were minimal because the
acoustic forces exerted on the particles were insufficient to drive them completely to the
pressure nodes during the relatively short SAW exposure time. As a result, the high-
density particles were separated to the two side outlets, while the low-density particles
were collected at the center outlet. It is important to note that even though the
concentration of the particles in the sample suspension is constant (1% by volume), there
may be difference in the number of the distributed particles between the images of each
location (Figure 24). The fundamental reason for this issue was that there was time

55
interval between the each image recorded at three different locations due to the limitation
with the field of view of the microscope.
Figure 24. Fluorescent images of the particle distribution during the density-based
separation (green = 10μm PS; red = 10μm melamine) at the chosen location (a)–(c) in the
test section. A constant operating frequency of 13.3 MHz, an input power of 1.28 W, and
a flow rate of 0.5 μl/min were applied during the experiments.

56
The experimental and analytical trajectories of the melamine and PS particles
tracked during the second SAW field where the separation process occurred were
investigated as shown in Figure 25. The theoretical analysis of the trajectory of each
particle was analyzed by using the balance between the acoustic radiation force and the
viscous drag force acting on a particle as discussed previously in Chapter 4.2.2. To
determine the actual trajectories of the particles, the positions of the selected particles at
different times were tracked continuously using the image analysis software (cellSens,
Olympus) at the second SAW field.
Figure 25. Analytical (solid and dotted lines) and experimental (triangle and circle
symbols) trajectories of the melamine and PS particles tracked in the second SAW field
where the separation process occurred.

57
Figure 25 illustrates both the theoretical and experimental trajectories of the
particles during their travel in the microfluidic channel. As can be observed from this
figure, the patterns of the experimental trajectories of the particles had good agreement
with the analytical trajectories. After all the particles were aligned at the center of the
microchannel (the position of near ‘0’ at the y-axis), the melamine (high-density)
particles reached to the pressure nodes located along the two side channel walls (the
position of near ‘75’ and ‘-75’ at the y-axis) during SAW working time. On the other
hand, the PS (low-density) particles were not able to reach to the pressure nodes during
SAW working time because of the shorter lateral displacement. They moved only 13.5
μm and -15.0 μm from the initial aligned positions due to the relatively small acoustic
forces. After the SAW working region, the particles stayed in the separated defined
positions due to laminar flow behavior in the microfluidic channel.
The separation efficiency was also determined quantitatively with the images
obtained from each outlet at 20 frames per second using a CCD camera. To estimate the
number of particles collected at each outlet, the images were analyzed with image
processing software (ImageJ®
, National Institutes of Health). The detailed image
processing steps were presented in previous Chapter 4.2.2. The separation efficiency was
defined as A/(A+B), where A is the relative particle fraction of the sample collected from
the side outlets and B is the relative particle fraction of the sample collected from the
center outlet. To study the effect of the parameters on the separation efficiency, the net
power applied to the IDTs varied from 0.32 W to 1.28 W and the flow rate from 0.2
μl/min to 2 μl/min. The separation efficiency as a function of input power is shown in
Figure 26. The operating frequency was 13.3 MHz, and the flow rate was kept constant at

58
0.2 μl/min. The separation efficiencies were measured in the range of 87.2–98.8 % at the
applied power range of 0.32–1.28 W. Since the acoustic radiation force is proportional to
the acoustic pressure amplitude and the input power, the separation efficiency increased
as the power increased.
Figure 26. Experimental separation efficiency as a function of input power (operating
frequency: 13.3 MHz, flow rate: 0.2 μl/min).
The dependence of the flow rate on the separation efficiency is also illustrated in
Figure 27. During these tests, the operation frequency and the input power were kept
constant at 13.3 MHz and 1.28 W, respectively. The separation efficiencies obtained were
in the range of 98.8–89.4 % for flow rates ranging from 0.2 μl/min to 2.0 μl/min. As the
flow rate was decreased, the particles were exposed to the SAW field for a longer time

59
period and, hence, the particles were subjected to larger lateral displacement. Thus, the
lower flow rate yielded higher separation efficiency.
Figure 27. Experimental separation efficiency as a function of flow rate (operating
frequency: 13.3 MHz, input power: 1.28 W).
It is important to note that solutions containing high concentration particles such
as whole blood may potentially yield to low separation efficiency due to increased width
of the aligned particle band at the first SAW field. Thus, for applications requiring high
particle concentration, this sheathless microfluidic platform design needs to be modified
with wider channel outlets with optimized the SAW wavelength, IDT configuration, flow
rate, and input power to address the needs of the separation of high concentration
particles. These results demonstrate that the presented device is capable of separating

60
same-size different density particles in a microfluidic channel without employing sheath
flow.
4.3.3. Application for Cell Separation
To verify the application of this sheathless acoustic-based separation technique to
biological cells, the separation of animals’ red blood cells (RBCs) with two different
diameters was performed. A mixture solution of chicken RBCs (~9.7 μm) and goat RBCs
(~3.2 μm) was introduced into the sheathless acoustic-based separator. Both cells were
purchased from Innovative Research (Novi, MI, USA). These RBCs have been produced
when whole blood was washed to remove the platelet rich plasma, buffy coat layer, and
white blood cells (leukocytes). Both RBCs were supplied as a 5% suspension in
phosphate buffered saline (PBS). For the separation studies, these cells were diluted to
2 % with PBS immediately before use.
Figure 28 shows the distribution of chicken RBCs and goat RBCs during the size-
based separation process at three different locations, marked as (a), (b), and (c) in the
microfluidic channel. During the experiments, an operating frequency of 13.3 MHz an
input power of 1.41 W, and a flow rate of 1.0 μl/min were applied. Both cells were
randomly scattered in the inlet region as shown in Figure 28(a). When both cells entered
the first SAW field, the acoustic forces acting on the theses cells aligned them at the
center of the microfluidic channel where pressure nodes existed. (Figure 28(b)). Once the
IDTs of second SWA field were activated, larger RBCs (chicken) were pushed to the two
side walls while smaller RBCs (goat) kept flowing in the center steam. Subsequently, the

61
larger RBCs were separated to the two side outlets and the smaller RBCs were collected
to the center outlet (Figure 28(c)).
In this experiment, the higher input power (1.41 W) was required to separate the
cells as compared to the separation of polystyrene particles with similar sizes (3 μm and
10 μm) as discussed in Chapter 4.3.1. The reason could be that the acoustic force is
smaller on these RBCs than on polystyrene particles because the acoustic force action on
an object strongly depends on the properties of the object such as density and
compressibility as shown in equations (12) and (13). These results confirm that this
sheathless acoustic-based separator is capable of separation of not only microparticles but
also biological cells.

62
Figure 28. Bright field images of the RBCs distribution during the size-based separation
(chicken = 9.7 μm; goat = 3.2 μm) at the chosen location (a)–(c) in the test section. A
constant operating frequency of 13.3 MHz, an input power of 1.41 W, and a flow rate of
1 μl/min were applied during the experiments.

63
CHAPTER 5. SURFACE ACOUSTIC WAVE-BASED MIXING
Note to Reader
The manuscript and the results presented in this chapter have been previously
published [146] and are utilized with permission of the publisher.
5.1. Introduction
Microfluidic systems are employed in variety of bio and chemical applications
including cell separation and detection, genetic analysis, drug screening, and chemical
synthesis and reactions. These applications need fast and efficient mixing of the sample
and reagent with high throughput. Since the flow in a microfluidic channel is laminar due
to low Reynolds number, obtaining efficient mixing is a formidable task. The inherently
slow molecular diffusion mixing in a microfluidic channel requires very long channel
design which conflicts with miniaturization and integration needs. To address these
requirements, various techniques for efficient mixing have been studied. In general, the
mixing techniques are classified into two types according to the actuation and control
mechanism, such as passive and active mixing.
Passive mixing methods rely completely on the geometry of the microfluidic
channel to increase the contact surface and decrease diffusion path between adjacent fluid
streams, such as wedged shaped inlets [147], zigzag channels [148], folding structure
[149], creeping structure [150], stacked shim structure [151], embedded barriers [152,

64
153], and twisted channels [154]. On the other hand, active mixing methods employ
external force fields including dielectrophoretics [155], electrokinetics [156, 157],
electrohydrodynamics [158, 159], magnetics [160], and acoustics [161]. Although
integration of active mixers with microfluidic system is more challenging due to the
requirement of external power sources, it has been shown that active mixers perform
better than passive ones in terms of efficiency and mixing time [162].
Acoustic-based active mixing technique has been studied as acoustic actuation
causes a pressure variation within the fluids. Acoustic-based mixing has been
demonstrated by using acoustic streaming with piezoelectric zinc oxide thin film [163],
lead zirconate titanate membrane [164] and acoustically driven sidewall-trapped air
bubble [165]. Recently, the acoustic streaming induced by surface acoustic wave (SAW)
has been investigated as SAW-based method features low propagation loss, low power
consumption, and ease of integration [61]. SAW-based mixing studies have been
conducted in two different fluidic conditions; in a droplet [101, 166–170] and in a
confined microchannel [131, 171–173]. Highly efficient mixing inside a droplet has been
demonstrated using internal streaming induced by SAW.
On the other hand, there are only few reports of the SAW-based mixing in a
microfluidic channel. Tan et al. [131] have reported the phenomena of vortical flow for
mixing in a microchannel fabricated directly onto a piezoelectric substrate with high
frequency SAW transducers. Sritharan et al. [171] has conducted SAW-based mixing
between water and microbeads solution in a Y-shape microfluidic channel. The
interdigital transducer was directly located below the channel inlets. Luong et al. [172]
has demonstrated SAW-based mixing with a solution of fluorescent dye and deionized

65
water in a T-shape microfluidic channel at high flow rates. The effects of two different
interdigial electrode configurations (parallel and focused) and the applied voltages with
different flow rates on the mixing efficiency were reported. Zeng et al. [173] have
investigated fast mixing with DI-water and quantum dots solution using focused SAW.
The solutions were mixed in milliseconds by concentrated acoustic radiation in a Y-shape
microfluidic channel. However, these previous studies used a single interdigital
transducer to generate a single acoustic steaming in a microfluidic channel. In this
Chapter, a dual SAW-based active mixer design using dual acoustic streaming generated
by two interdigital transducers is introduced. The comparison mixing performance
obtained with dual SAW-based mixing to the traditional single interdigital transducer
design is discussed. In addition, effect of aperture length of the IDT on mixing efficiency
is also reported.
5.2. Materials and Methods
5.2.1. Working Principle
The working mechanism of the proposed dual SAW-based active mixer is shown
in Figure 29. The dual SAW-based active mixer consists of a pair of interdigital
transducers (IDTs) patterned on a piezoelectric substrate and polydimethyl-siloxane
(PDMS) microfluidic channel. Two series of SAWs are generated when AC signals with
same amplitude are applied to both IDTs. When the SAWs propagating in opposite
directions reach the sample fluid inside the microfluidic channel, the SAWs are
transformed to leakage waves inducing pressure fluctuations, and then the longitudinal

66
pressure waves are radiated into the sample fluid at the reflection angle (called the
Rayleigh angle [172]). This reflection angle of the radiated wave is determined as:
1sin ( / )R f sC C (19)
where Cf and Cs are the speed of sound in the fluid and on the substrate, respectively.
Acoustic streaming is generated inside the sample liquid by longitudinal pressure waves,
resulting in internal net flow circulation. This acoustic streaming effect causes the active
fluid mixing in the microfluidic channel.
Figure 29. Schematic diagram illustrating working concept of the dual SAW-based active
mixing. The acoustic energy is radiated into the sample liquid at the refraction angle,
leading to acoustic streaming inside the sample liquid.
67
Figure 30. Schematic diagram of the two different SAW-based active micromixers used
in this study (note the figure is not to scale). (a) a single acoustic excitation by one IDT,
(b) double acoustic excitation by two IDTs.

68
Based on this working mechanism, a single acoustic excitation by one IDT design
as a reference (Figure 30(a)) and dual excitation by two IDTs (Figure 30(b)) were used to
investigate the effect of excitation type/configuration on the mixing efficiency. In
addition, the effect of the IDT aperture length of the dual SAW-based active mixer
(shown in Figure 30(b)) on the mixing efficiency was investigated. As illustrated in
Figure 30, the region of interest (ROI) was selected 2 mm downstream from the end of
the SAW working region defined by IDT aperture for all experiments to quantitatively
determine the mixing efficiency.
5.2.2. Device Design and Fabrication
The dual SAW-based active mixing device consists of two parts: IDTs fabricated
on a piezoelectric substrate to generate SAWs and Y-shape PDMS microfluidic channel
for transporting the sample fluid. A 128° YX lithium niobate (LiNbO3) was selected for
the substrate of the device due to its good optical transparency and a larger
electromechanical coupling coefficient as compared to other piezoelectric substrates
which generate SAW. The IDTs was fabricated with photolithography process. A chrome
layer of 100nm thickness was first deposited on a double-side polished 128° YX LiNbO3
wafer with DC sputter (Torr International, New Windsor, NY). The LiNbO3 wafer was
then coated with S1813 photoresist of 1.6μm-thick (Shipley, Marlborough, MA),
patterned using a UV light source, and developed in MF 319 developer (Shipley,
Marlborough, MA). The chrome layer was then etched with CR-7S chrome etchant
(Cyantek, Fremont, CA). Lastly, the photoresist was removed with AZ-400T photoresist
stripper (AZ Electronic Materials, Somerville, NJ). The fabricated IDTs have 25 pairs of

69
fingers with pitch of 300 μm and width/gap of 75 μm. Since the wavelength of SAW
generated by the IDT is equal to the IDT finger pitch, wavelength is 300 μm for the
selected design. The operating frequency of the IDT is defined by the ratio the speed of
sound on the substrate to the wavelength of SAW. The operating frequency of the IDT
used for this study is 13.3 MHz based on the speed of sound on the 128° YX LiNbO3
substrate of 3,990 m/s and the SAW wavelength of 300 μm. The IDT patterned on a 128°
LiNbO3 substrate are shown in Figure 31(a).
Figure 31. Close-up views illustrating (a) the IDT fabricated on the lithium niobate
substrate and (b) Y-type microfluidic channel mold.
The soft lithography and replica molding techniques were used to fabricate the Y-
shape microfluidic channel. The mold of the microfluidic channel was fabricated on a
silicon wafer with SU-8 negative photoresist of 80 μm-thick (MicroChem, Newton, MA).
The PDMS pre-polymer base was cross-linked with the curing agent (Sylgard™ 184 kit,
Dow Corning, Midland, MI) in a weight ratio of 10:1, poured onto the fabricated SU-8
microfluidic channel mold, and then cured at 80° C for 30 min. Once PDMS replica was
peeled off from the microfluidic channel mold, the inlet and outlet holes were generated

70
using 0.75 mm biopsy punch. The surfaces of PDMS replica and the substrate including
IDTs were then treated with oxygen plasma for 30 seconds with 20 sccm oxygen flow
rate, 500 mTorr chamber pressure, and 50 W power to increase the bonding strength.
Lastly, the PDMS replica of the microfluidic channel was boned to the substrate
including IDTs. The fabricated microfluidic channel had a width of 150 μm, a height of
80 μm, and a length of 9 mm (for 4 mm aperture IDTs) and 14 mm (for 9 mm aperture
IDTs). The Y-shape microfluidic channel mold fabricated is shown in Figure 31(b).
5.2.3. Experimental Setup
For experimental characterization studies, the fabricated mixer was positioned on
top of the stage of an inverted microscope (IX-51, Olympus), and PTFE tubing (Cole-
Parmer, Vernon Hills, IL) and two glass syringes (Hamilton, Reno, NV) were connected
to the two inlets of the Y-shape microfluidic channel. Two fluid streams were introduced
and controlled by a syringe pump (KD Scientific, Holliston, MA). One inlet fluid stream
contained DI-water and the other stream was a solution of fluorescent dye (Fluorescein
sodium salt, Sigma-Aldrich, St. Louis, MO). To generate SAWs propagating towards the
microfluidic channel, a sinusoidal signal was produced by arbitrary function generator
(AFG3022B, Tektronix), amplified by a RF power amplifier (325LA, ENI), and provided
to the IDTs. A charge-coupled device camera (XM-10, Olympus) was used to acquire the
high speed fluorescent images in the microfluidic channel with image acquisition
program (cellSens, Olympus). The FITC-3540B color filter (excitation: 482 nm, emission:
536 nm) was used for capturing the florescent images with filtering the specific excitation
(490 nm) and emission (514 nm) wavelength of the fluorescent dye. A photographic

71
illustration of the experimental setup is shown in Figure 32. During active mixing
experiments, the peak-to-peak voltage fed to the IDTs was varied from 28 Vp-p to 85 Vp-p
and three different flow rates of 10, 50, and 100 μl/min were applied to investigate the
effect of the working parameters on the mixing efficiency.
Figure 32. Photographic illustration of the experimental setup used for investigating
SAW-based mixer.
The operation conditions based on the three different flow rates applied for the
experiments can be represented by the characteristic non-dimensional numbers, the
Reynolds number (Re) and the Peclet number (Pe). The Reynolds number represents the
ratio of advective mass transport to momentum transport as shown at equation (1) in

72
Chapter 2.1. The Peclet number is the ratio of advective mass transport to diffusive mass
transport:
ULPe
D (20)
where L is the mixing path, which is represented with the channel width, and the D is the
diffusion coefficient. The diffusion coefficient of the fluorescent dye (Fluorescein sodium
salt) injected for this study is 3.310-10
m2/s [174]. In a microfluidic system, the mixing
path is close to the value of the hydraulic diameter. The operation conditions based on the
three different flow rates applied for this study are shown in Table 3.
Table 3. The operation conditions used for SAW-based active mixing experiments.
Flow rate
(μl/min)
Flow velocity
(mm/s) Re Pe
10 13.92 2.61 6,327
50 69.60 13.05 31,636
100 139.20 26.10 63,273
The diffusive mixing is dominant if the Peclet number is less than 1,000 [135]. A
higher flow rate implies a larger Peclet number. In this study, the Peclet number ranged
from 6,327 to 63,273 so that the diffusion effect can be negligible for the proposed SAW-
based mixing. The review paper of micromixers by N. Nguyen and Z. Wu [136] reported
the active miromixers by using pressure, electrohydrodynamic, dielectrophoretic, and
electrokinetic disturbances worked with the Peclet number on the order of 10 to 103.
Especially, acoustic-based (including SAW) active mixers worked with the Peclet

73
number on the order of 10 (30 in [164], 11 in [172]), 102 (300 in [177], 614 in [173]), 10
3
(1600 in [36], 1500 in [178]), and 104 (14800, 37200 and 74400 in [179]). Thus, the
Peclet numbers of the SAW-based mixer used in this study are normally much higher
than other active mixers. It is important note that the proposed SAW-based mixer with
high Peclet number corresponding to high flow rate can be applied for high-throughput
systems.
5.3. Results and Discussion
To investigate the mixing effect induced by SAW-based acoustic steaming, DI
water and a solution of fluorescent dye were injected into the microfluidic channel from
each inlet at flow rate of 10 μl/min. Figures 33 (a)–(d) show the fluorescent images in the
microfluidic channel during active mixing process of the two fluid streams. The images
were acquired with a CCD camera at 20 frames per second. It is noted that the images
shown in Figure 33 (a)–(d) were filtered with the image acquisition software (cellSens,
Olympus) to clarify the interface between DI-water and the fluorescent dye solution.
Figure 33(a) shows the image of the inlet region in the Y-shape microfluidic
channel. As expected, two fluid streams were separated across the microfluidic channel
with equal widths due to the same flow rate used. To observe the mixing behavior of the
fluids, the images (Figure 33(b)–(d)) were captured at ROI which was placed 2 mm
downstream from the end of the SAW working region defined by IDT aperture as
illustrated in Figure 30. Initially, no mixing was observed without any power input due to
the absence of acoustic streaming as shown in Figure 33 (b). When the voltage of 85 Vp-p
was applied to one IDT with an aperture of 4mm for single excitation (Figure 33(c)) and

74
two IDTs with an aperture of 4mm for dual excitation (Figure 33(d)), active homogenized
mixing behaviors of the two fluid streams induced by SAW-based acoustic streaming
were observed. The homogenous mixing implies that the two fluid streams were mixed
very rapidly when the acoustic excitation was applied. From Figure 33, one can clearly
observe that the dual excitation with two IDTs caused superior mixing result than that of
single IDT case at the same applied voltage.
Figure 33. The fluorescent images (a) at the inlet region and (b-d) at the outside of the
active mixing region (2 mm downstream from the end of the SAW working region
defined by IDT aperture). (a) two fluid streams were injected from each inlet at flow rate
of 10 μl/min, (b) no mixing effect was observed with no power input, (c) active mixing
with 85 Vp-p applied to single IDT for single excitation, (d) active mixing with 85 Vp-p
applied to two IDTs for dual excitation.
Figure 34 shows the intensity profile of the obtained fluorescent images across the
microfluidic channel width (150 μm) with a flow rate of 10 μl/min for the single IDT
excitation (Figure 34(a)) and the dual IDT excitation (Figure 34(b)) with both same

75
apertures of 4 mm. The significance of this figure is that the intensity of the image
indicates the fluorescent dye concentration and, hence gives a direct indication for the
mixing performance. The intensity values across the microfluidic channel width were
averaged over the region of interest (ROI) as indicated by the red dotted rectangle in
Figure 33. Since the obtained images were filtered to clarify the interface between DI-
water and the fluorescent dye solution as shown in Figure 33, the slopes of the intensity
values in Figure 34 were stiff. However, as all acquired images were filtered with same
algorism, this filtering process didn’t affect the mixing efficiency analysis. As the applied
voltage increased, expectedly, a uniform peak intensity distribution increased for both
cases. One can observe from this figure that the higher voltages applied to the IDT caused
higher mixing performance. As can be observed from the comparison between Figure
34(a) and (b), the dual excitation with two IDTs caused significantly more mixing
performance than that of single IDT at any of the identical voltage conditions.
The mixing efficiency was determined by the ratio between the mixing index of
mixed streams and unmixed streams over a region of interest (ROI) obtained from the
fluorescent images [172],
2
1
2
,0
1
1
11
N
i
i
N
i
i
I IN
I IN
(21)
where N is the number of pixels, iI is the normalized average intensity of pixel i at the
mixed state, ,0iI is the normalized average intensity of pixel i at the initial unmixed state,
and I indicates the expected normalized intensity at completely mixed state (0.5 in this
study as identical flow rates were applied to each fluid stream).

76
Figure 34. Plots of intensity profiles across the microfluidic channel width for different
applied voltages at the flow rate of 10 μl/min for (a) the single excitation by one IDT and
(b) the dual excitation by two IDTs. The value ‘0’ of the x-axis indicates the middle of
the microfluidic channel across the microfluidic channel width.
The effects of the voltage applied and the flow rate on the mixing efficiency for
single IDT excitation and dual IDT excitation with both same apertures of 4 mm were
investigated as illustrated in Figure 35. For all the experiments, the operating frequency
was kept constant at 13.3 MHz, the peak-to-peak voltage fed to the IDTs varied from 28

77
V to 85 V, and three different flow rates of 10, 50, and 100 μl/min were applied. The
detailed mixing efficiency in this study indicates that as the applied voltage increased, the
mixing efficiency increased because acoustic streaming velocity is directly related with
the applied voltage. Nguyen and White [180] reported that the velocity of the acoustic
streaming is a second-order function with the applied voltage. This implies that mixing
efficiency, which is proportional to the velocity of the acoustic streaming, is a second-
order function of the applied voltage. Also, previous study experimentally demonstrated
that the relation curve of mixing efficiency versus the applied voltage was a parabolic
shape [172]. However, these quadratic relations between the velocity of the acoustic
streaming and the applied voltage were induced by the single SAW with one IDT. In this
study, the mixing efficiency of the single SAW by one IDT for lower flow rate showed
the quadratic relation with the applied voltage as shown in Figure 35(a). However, the
dual SAW cases did not show this relationship as shown in Figure 35(b) and Figure 36.
The main reason of these results might be the standing acoustic wave effect
induced by two IDTs. When a pair of SAWs propagates in opposite directions toward the
microfluidic channel, the interference of these SAWs forms a standing SAW, resulting in
a periodic distribution of pressure nodes and anti-nodes inside sample solution in the
microfluidic channel. Previous study investigated that this acoustic standing wave force
with a periodic distribution of pressure nodes can affect to the mixing effectiveness in the
microfluidic channel [131]. In addition, the type of SAW could affect the quadratic
relation between the mixing efficiency and the applied voltage. The active mixer using a
focused single SAW induced by concentric circular type focused IDT didn’t show the
quadratic relation between the mixing efficiency and the applied voltage [173].

78
The presented mixing efficiency studies also shows that higher mixing efficiency
was also obtained with a lower flow rate as the fluid streams were applied to the active
mixing region for a longer time which was defined by the aperture of the IDT. One can
also clearly infer that the mixing efficiency of dual IDT excitation case was higher than
that of single IDT excitation for all of the applied voltage and flow rate conditions. When
the voltage of 85 Vp-p and the flow rate of 10 μl/min were applied, the mixing efficiencies
of dual excitation with two IDTs and single excitation with one IDT were 96.7 % and
69.8 %, respectively.
The effect of the IDT aperture length on the mixing efficiency was also
investigated with dual acoustic excitation with shorter aperture (4 mm) and longer
aperture (9 mm) IDTs under identical operating conditions as shown in Figure 36. The
long-aperture IDTs caused slightly higher mixing efficiency than the short-aperture IDTs
for all flow rates and voltages given. When the voltage of 85 Vp-p and the flow rates of 10,
50, and 100 μl/min were applied, the mixing efficiencies of shorter aperture two IDTs
case were 96.7, 43.9, and 25.1 %, respectively. On the other hand, the mixing efficiencies
of longer aperture two IDTs case were 99.1, 53.9, and 27.7 %, respectively. The reason
for this result is that the long-aperture reduces the resonant insertion loss of IDT.
However, if the aperture length of IDT is very long (larger than 100 times of wavelength),
the IDT impedance and the signal are affected significantly due to the mass loading of the
IDT fingers [181]. Thus, the aperture length should be optimized with SAW wavelength.
Generally, an acoustic aperture length of between 30 and 50 times of wavelength is
optimal for 50Ω IDT impedance [182].

79
Figure 35. Mixing efficiency as function of applied voltages for different flow rates; (a)
the single excitation by one IDT, (b) the dual excitation by two IDTs.

80
Figure 36. Mixing efficiency as function of applied voltages for different flow rates; (a)
the dual excitation by the short-aperture (4 mm) two IDTs, (b) the dual excitation by the
long-aperture (9 mm) two IDTs.

81
CHAPTER 6. EFFECTS OF PDMS MICROCHANNELS ON
SURFACE ACOUSTIC WAVE-BASED MICROFLUIDIC DEVICES
6.1. Introduction
To date, three materials (namely silicon, glass, and polymers) have been used in
microfluidic device designs. Recent studies reported the comparison of these materials
for chemical and physical operation in a microfluidic device [183, 184]. The properties of
silicon are well-established and the fabrication techniques in silicone are well-developed.
However, as silicon is not transparent, it conflicts with optical detection in most
bioanalysis. Moreover, the silicon-based fabrication process is expensive, is limited to
planar surfaces, and needs specialized facilities. Glass has a good chemical resistance and
excellent optical transparency. However, it has disadvantages such as high-cost, complex
fabrication process and limited integration capability with other materials used in the
design. Compared to silicon and glass, polymers are more attractive materials for
microfluidic channels due to the ease of fabrication such as replica molding and rapid
prototyping which are simple, low cost, time saving, and highly reproducible. In addition,
polymers feature a good chemical resistance, optical transparency, and no UV absorption
[184].
Of polymers, PDMS is the most widely used as well as actively developed
polymer for the microfluidics because it has prominent features compared to other
polymers, including very low electromagnetic energy dissipation, high dielectric strength,

82
wide temperature range of use, elastomeric properties, biocompatibility, non-toxicity,
high optical transparency, gas permeability, reversible and irreversible bonding, easy
molding, and low chemical reactivity [185–187].
Recently, PDMS-based microfluidic channels have been integrated with surface
acoustic wave devices for wide variety of applications including focusing [135, 136] and
separation [102, 139, 103] of particles/cells as well as pumping [133, 134, 188] and
mixing [172, 173, 189] of fluids in the microfluidic channel. However, elastomer
materials, such as PDMS, severely attenuate the SAW propagation, thus the transmission
of the acoustic energy is reduced by the channel wall thickness when the SAW
propagates toward the sample liquid inside the microfluidic channel [190]. As this
acoustic energy loss affects the capabilities and efficiencies of the SAW-based
microfluidic devices, there is a need to investigate the effects of PDMS channel wall
thicknesses on the SAW-based microfluidic device design. In this chapter, the effects of
the side and top wall microfluidic channel thicknesses on the insertion loss of SAW and
the particle migration to the pressure nodes due to acoustic radiation forces induced by
SAW.
6.2. Materials and Methods
6.2.1. Working Principle
Figure 37 shows a schematic illustration of a typical SAW-based PDMS
microfluidic device. It consists of interdigital transducer (IDT) fabricated on a
piezoelectric substrate and PDMS microfluidic channel. As presented in the previous
chapters, when the IDT is excited with an RF signals, SAW propagates toward the PDMS

83
microfluidic channel. When the SAW reach the sample fluid inside the PDMS
microfluidic channel, it is converted to leakage wave resulting in pressure fluctuations
and the acoustic energy radiates longitudinal pressure waves into the fluid. The pressure
fluctuations induce acoustic streaming and acoustic radiation forces [28, 34]. These
forces have been used for many applications such as pumping, mixing, focusing, and
separation. However, a portion of the acoustic energy is absorbed by the PDMS channel
walls when the SAW reach the sample fluid inside the PDMS microfluidic channel. The
capability and efficiency of the device are affected by this acoustic energy loss. Thus, in
this study the effects of the side and top wall thicknesses (as shown in Figures 37) of the
PDMS microchannel on the transmission characteristic of SAW and the particle
trajectories due to acoustic radiation forces were investigated experimentally.
Figure 37. Schematic illustration of working concept of a typical SAW-based PDMS
microfluidic device.

84
6.2.2. Device Design and Fabrication
The detailed fabrication process of the SAW-based microfluidic devices used in
this study is same as the previous description of Chapter 4.2.3. The IDT was designed to
operate at a resonance frequency of 13.3 MHz, corresponding SAW wavelength of 300
μm. The width and period of the IDT finger were 75 μm and 300 μm, respectively. The
width and depth of the fabricated PDMS microfluidic channel were 250 μm and 100 μm,
respectively. To investigate the effects of the PDMS microfluidic channel wall, the side
and top wall thicknesses (shown in Figure 37) varied from 2 to 8 mm for each wall.
6.2.3. Experimental Setup
For the insertion loss measurements, the fabricated integrated device was
connected to a RF network analyzer (E5061A, Agilent), and the insertion losses (S21) due
to the existence of PDMS microchannel in the design were measured (Figure 38(a)). For
the investigation of particle migration to the pressure node due to acoustic radiation
forces induced by SAW, a solution of fluorescent polystyrene (PS) particles with 10 μm
diameter (Bangs Laboratories, Fishers, IN) was injected to the PDMS microfluidic
channel using the microliter syringe (Hamilton, Reno, Nevada) and the syringe pump
(KD Scientific, Holliston, MA). The concentration of the polystyrene particles in the
sample solution was 1% by volume. For the propagation of the SAW toward the sample
solution in the PDMS microfluidic channel, AC signal generated by an arbitrary signal
generator (AFG3022B, Tektronix) at the resonance frequency was amplified using a RF
power amplifier (325LA, ENI), and then the signal was supplied to the IDT. The paths of
the particles migration induced by SAW were tracked continuously using a fluorescence

85
microscope (IX-51, Olympus), a CCD camera (XM-10, Olympus), and an image
acquisition software (cellSens, Olympus). A schematic illustration of the experimental
setup is shown in Figure 38(b).
Figure 38. Schematic illustration of the experimental setup for (a) the insertion loss
measurements and (b) particles migration to the pressure node.
6.3. Results and Discussion
6.3.1. Insertion Loss
Figure 39 illustrates the insertion loss with varying PDMS side wall thicknesses
for a constant PDMS top wall thickness of 8mm. The insertion loss is the loss in signal

86
power, resulting from the insertion of a component or a device in a transmission line of
IDT [191]. The low insertion loss enhances acoustic energy transmission so that the
capabilities and efficiencies of the devices are improved. The results for the resonance
frequency (13.3 MHz) illustrate that the insertion loss is increased with increasing PDMS
side wall thickness as compared to no PDMS channel case. In the relatively thin side wall
cases, such as 2 mm and 4 mm, the increase of the insertion losses were not significant.
On the other hand, the insertion losses for relatively thick side wall thicknesses, such as 6
mm and 8 mm, increased by 26.1% and 43.5% as compared to no PDMS channel case,
respectively.
Figure 39. The insertion loss with varying PDMS side wall thickness for a constant
PDMS top wall thickness of 8mm.

87
Figure 40 and 41 show the effect of the PDMS side and top wall thicknesses on
the insertion loss at the resonance frequency of the device. The insertion loss of no
PDMS channel in the design case was -23.66 dB. One can observe from these figures that
as both the side and top wall thicknesses increased, the insertion losses were increased.
As shown in Figure 40, in the relatively thin side wall cases (2 mm and 4mm), the
insertion loss values increased very slightly with increasing top wall thickness. For
example, the insertion losses of 2, 4, 6, and 8 mm top wall cases with 2mm side wall
thickness were -24.1, -24.29, -24.37, and 24.48 dB, respectively. On the other hand, the
increases of the insertion losses with increasing top wall thickness for the relatively thick
side wall cases (6 mm and 8mm) were significant. For example, the insertion losses of 2,
4, 6, and 8 mm top wall cases at the side wall thickness of 8 mm were -29.13, -30.16, -
32.34, and -33.77 dB, respectively.
However, as shown in Figure 41, even for thin top wall thicknesses cases (2 mm
and 4 mm), the insertion losses increased significantly with increasing side wall
thicknesses. For example, the insertion losses of 2, 4, 6, and 8 mm side wall cases with
2mm top wall thickness were -24.2, -25.78, -27.59, and -29.13 dB, respectively. These
results imply that the thickness of the side wall in the PDMS microfluidic channel is
more critical than top wall thickness to reduce the insertion loss of the SAW-based
microfluidic devices. Especially, reducing the side wall PDMS thickness from 8 mm to 2
mm with 8 mm top wall thickness decreased the insertion loss by 31.2 %. On the other
hand, the return loss (S11) was affected very slightly by the side wall thickness. For
example reducing the side wall thickness from 8 mm to 2 mm with 8 mm top wall
thickness decreased the return loss by 1.58 % only.

88
Figure 40. The insertion loss as a function of the PDMS side wall thickness for varying
PDMS top wall thickness at the resonant frequency of 13.3 MHz.
Figure 41. The insertion loss as a function of the PDMS top wall thickness for varying
PDMS side wall thickness at the resonant frequency of 13.3 MHz.

89
6.3.2. Particle Migration to Pressure Nodes
The acoustic radiation forces induced by standing SAWs move solid particles
including cells suspended in an aqueous medium toward the pressure node. To
investigate the effect of the PDMS channel wall thickness on the particles trajectories
exerted by the acoustic radiation forces, fluorescent images of the 10 μm polystyrene
particles subjected to the SAW field in the PDMS microfluidic channel with different
side wall thickness were recorded. A constant operating frequency of 13.3 MHz and an
input power of 27 dBm were applied to generate SAW during the experiments. The
sample solution within the PDMS microfluidic channel was stationary. The PDMS
microfluidic channel and the IDT were designed so that the pressure nodes were located
at the two side walls of the channel.
Figure 42, 43, and 44 show the fluorescent images tracking the particle
trajectories in the PDMS channel with the side wall thicknesses of 2 mm, 6 mm, and 8
mm, respectively. At t = 0, the particles were randomly distributed because the particles
were not yet exposed to the SAW field (Figure 42(a), 43(a), 44(a)). When the SAW
propagates to the particles in the PDMS microfluidic channel, the particles began to move
towards the channel walls as the pressure nodes were placed at the channel walls (Figures
42(b), 43(b), 44(b)). All particles were then finally driven to the pressure nodes by the
acoustic radiation forces induced by the SAW (Figure 42(c), 43(c), 44(c)). However, the
migration time required for all particles to fully move to the pressure nodes and the
particle trajectories were significantly different for different side wall thicknesses. When
the side wall thickness is decreased, the migration time of the particles toward the
pressure nodes decreased because the acoustic radiation forces acting on the particles

90
become larger due to minimal acoustic energy loss. It should also be pointed out that the
particle trajectories for thinner side wall cases were almost a straight line. On the other
hand, the trajectories of the particles for thicker side wall were parabolic.
Figure 42. Fluorescent images of the 10 μm PS particles subjected to the SAW field
within the PDMS channel with the side wall thickness of 2 mm (operating frequency:
13.3 MHz, input power: 27 dBm). (a) the initial position of the particles at t=0, (b)
tracking of the paths of the particles (the images obtained from 0.05 to 0.55 seconds were
combined), and (c) the final position at the time (t=0.6 s) for all particles fully move to
the pressure nodes located in the channel wall.

91
Figure 43. Fluorescent images of the 10 μm PS particles subjected to the SAW field
within the PDMS channel with the side wall thickness of 6 mm (operating frequency:
13.3 MHz, input power: 27 dBm). (a) the initial position of the particles at t = 0, (b)
tracking of the paths of the particles (the images obtained from 0.05 to 1.65 seconds were
combined), and (c) the final position at the time (t=1.7 s) for all particles fully move to
the pressure nodes located in the channel wall.

92
Figure 44. Fluorescent images of the 10 μm PS particles subjected to the SAW field
within the PDMS channel with the side wall thickness of 8 mm (operating frequency:
13.3 MHz, input power: 27 dBm). (a) the initial position of the particles at t=0, (b)
tracking of the paths of the particles (the images obtained from 0.05 to 3.05 seconds were
combined), and (c) the final position at the time (t=3.1 s) for all particles fully move to
the pressure nodes located in the channel wall.
Figure 45 illustrates the transverse distance of the selected particles during their
migrations as a function of time for the different side wall thickness. The positions of the

93
selected particles at different times were tracked continuously using the image acquisition
software (cellSens, Olympus). The effect of the PDMS side channel wall thickness on the
transverse path of the particles was observed more clearly. Based on these results, the
average migration velocities of the selected particles were determined to be 115.3 μm/s
for 2 mm side wall thickness, 56.7 μm/s for 6 mm side wall thickness, and 40.3 μm/s for
8 mm side wall thickness. The migration velocity of the particle exerted by the acoustic
radiation forces induced by SAW increased as the side wall thickness of the PDMS
channel decreased. For example, the decreasing side wall thickness of the PDMS channel
from 8 mm to 2 mm results in 186% increase in the average migration velocity of the
particles.
As fast response of the particles is required for many high-throughput applications,
the thinner side wall thickness of the PDMS channel is more suitable for the SAW-based
high-throughput system. As a result of this study, the PDMS microfluidic channel wall
thicknesses should be minimized in the design to enhance SAW transmission and reduce
acoustic energy loss. However, very thin side wall of PDMS microfluidic channel may
reduce the bonding strength of the PDMS microfluidic channel to the substrate, and it
may potentially yield a leakage of sample solution from the interface between the PDMS
channel and the substrate at the high flow rate case or the use of high viscosity medium.
Therefore, adequate bonding and sealing integrity of the PDMS microfluidic channel to
the substrate should be considered to optimize the side channel wall thickness. It should
be pointed out that even for 2mm top and side wall PDMS microchannel thicknesses, no
leakage or any other negative effects were observed in this study.

94
Figure 45. The transverse distance of the selected particles from the initial position as a
function of time for the different side wall thickness of the PDMS channel.

95
CHAPTER 7. PARTICLE MANIPULATION BY PHASE-SHIFTING
OF SURFACE ACOUSTIC WAVES
7.1. Introduction
The ability of precise manipulation of particles in fluids is critical in biosciences,
such as molecular biology [192], biochemistry [193], and biophysics [194]. To date,
various techniques have been studied to manipulate particles in a microfluidic channel
including optoelectronic, electrokinetic, and magnetic methods [195–197]. However,
these methods have drawbacks, such as the need for a complicated optical setup, damage
to biological particles due to high heating, and the requirement of labeling of particles.
Consequently, the development of precise, easy, biocompatible, and label-free
manipulation technique is needed.
Recently, the bulk acoustic wave (BAW)-based particle manipulation techniques
have been investigated [198–200]. These techniques are capable of particle transportation
by using the resonance frequency change, mode switching, and controllable phase.
However, these BAW-based methods are not preferred choice for small (few microns)
particle manipulation due to inherent low frequency of BAW and high attenuation of
BAW. In addition, using BAW is not applicable to very common channel materials, such
as PDMS, because of the requirement of high acoustic refection coefficient material for
microfluidic channel as discussed in Chapter 4.1. Also, it has difficulties in

96
miniaturization and integration for microfluidic systems due to the use of bulky
transducers.
Very recently, an acoustic-based particle manipulation technique using tunable
SAW has been investigated [201]. The tunable SAW was generated by chirped IDT, in
which the pitch of the IDT electrodes ranges linearly. The gradient in the chirped IDT
pitch leads to a wide range of working frequencies of SAWs. Thus, the position of the
pressure node induced by SAW in the microfluidic channel was changed precisely by
tuning the frequency of SAW so that the suspended particles were manipulated toward
target outlet. However, the accurate fabrication of the chirped IDT with small pitch
ranged linearly is one of drawbacks of this technique. In this Chapter, the SAW-based
particle manipulation using phase-shift with conventional single-electrode- type IDTs is
investigated. The single-electrode-type IDT is widely used because of its structural
simplicity and relatively wide strip width (a quarter of wavelength) which offers the ease
of fabrication.
7.2. Materials and Methods
Figure 46 shows the working mechanism of particle manipulation using phase-
shift of SAW. The principles of SAW generation by IDT and the appearance of the
pressure node by SAWs within the microfluidic channel were already discussed in
Chapter 4.2.1. Most solid particles including cells suspended in an aqueous medium
move towards pressure nodes when they are subjected to the acoustic field. The position
of the pressure node within the microfluidic channel can be adjusted by varying the
relative phase difference (phase-shift) of the signal voltages applied to IDTs.

97
Figure 46. Schematic diagram showing working mechanism of particle manipulation
using phase-shift of SAW: (a) no phase-shift, (b) 90° phase-shift, (c) -90
° phase-shift.
As seen in Figure 46(a), a pressure node is located initially in the center of
microfluidic channel with no phase-shift (reference position in x-direction). If the phase
shift of 90° is applied by changing the phase of one of the SAWs (red solid line in Figure
46), the pressure node is moved in the positive x-direction, and the particle moves toward

98
the new pressure node location (Figure 46(b)). If the phase shift of -90° is applied, the
pressure node moves along negative x-direction, and the particle is manipulated to the
new pressure node location (Figure 46(c)). By modulating the relative phase difference
between two IDTs, the position of pressure node of the SAW in the microfluidic channel
changes linearly, resulting in the manipulation of a particle trapped to the pressure node.
There is a theoretical linear relation between the displacement of particle manipulated
and the phase-shift [202]:
1
2 720x
k
(22)
where Δx, Δφ, k, and λ are displacement of particle, phase-shift, wave number, and
wavelength, respectively.
The single-electrode-type IDTs were fabricated by deposition of chrome layer
with 100 nm thick on a 128° Y-rotated, X-propagating lithium niobate (LiNbO3)
piezoelectric substrate using photolithography procedures. The width and period of the
IDT finger were 75 μm and 300 μm, respectively, resulting in a wavelength of 300 μm
and an operating frequency of 13.3 MHz. PDMS microfluidic channel was fabricated
using soft lithography replica molding technique. The width and depth of the fabricated
PDMS microfluidic channel were 150 μm and 100 μm, respectively. The detailed
fabrication process of the SAW-based microfluidic devices used in this study can be
found in Chapter 4.2.3. For investigation of particle manipulation using phase-shift of
SAW, a solution of fluorescent polystyrene particles with 5 μm diameter (Bangs
Laboratories, Fishers, IN) was injected to the PDMS microfluidic channel by the
microliter syringe (Hamilton, Reno, Nevada) and the syringe pump (KD Scientific,
Holliston, MA). The concentration of the particles in the sample solution was 1% by

99
volume. The phase-shift was induced by the arbitrary function generator (AFG3022B,
Tektronix), whose phase and amplitude can be controlled independently, is connected to
the IDTs for generating SAW. The trajectories of the particles streams manipulated by
phase-shift were obtained continuously using a fluorescence microscope (IX-51,
Olympus), a CCD camera (XM-10, Olympus), and an image acquisition software
(cellSens, Olympus).
7.3. Results and Discussion
The composited trajectories of 5 μm fluorescent polystyrene particles streams at
five different phase-shift applied (-180°, -90°, 0°, 90°, 180°) were shown in Figure 47.
Initially, the particles were aligned at the center of the microfluidic channel where the
pressure node was located in the first SAW field. Note that this center position of the
pressure node induced by first IDT pair was fixed during experiments, and therefore is
referred as reference position. To demonstrate particle manipulation using the phase-
shifting, the phase of one of second IDT pair was modulated, resulting in applying phase-
shift of -180°, -90°, 0°, 90°, and 180°. The particles were manipulated with different
lateral displacement by changing the pressure node position due to each phase-shift.
Without phase-shift, the particles were continuously flowing at the center of the channel.
When positive phase-shifts (90°, 180°) were applied, the pressure node moved along
positive x-direction in the microfluidic channel and the particles were directed to the
below center of the microfluidic channel. On the other hand, when negative phase-shifts
(-90°, -180°) were applied, the pressure node was re-located along negative x-direction
and the particle were manipulated to the above center of the microfluidic channel. The

100
lateral displacements of the particles from -72.5 μm to 73.1 μm along the x-direction
were accomplished by varying phase-shift with a range of -180° to 180° at the second
SAW field.
Figure 47. A composite fluorescent image showing the trajectories of 5 μm PS particle
streams induced by five different phase-shifts of SAW. A constant operating frequency of
13.3 MHz, an input power of 1 W, and a flow rate of 1 μl/min were applied during the
experiments.
Figure 48 shows the experimental particle displacement data as a function of
phase-shift applied and the theoretical variation of particle position calculated from
Equation (22) over a range of -180° to 180°. It can be observed that the relationship
between the particle displacement and the phase-shift was almost linear experimentally,
and the experimental data had good agreement with the theoretical prediction of the
displacement. Since this technique can precisely define and transport the pressure node of

101
SAW, the particles can be manipulated over a predetermined displacement continuously
until they reach the targeted locations.
Figure 48. Experimental particle displacement data as a function of phase-shift applied
and the theoretical displacements calculated from Equation (22).

102
CHAPTER 8. CONCLUSIONS
8.1. Summary and Contributions
In this dissertation, an acoustic-based microfluidic platform using surface acoustic
waves for active particle separation and fluid mixing has been investigated. The general
background and theory of microfluidics and acoustics, main physical mechanisms of
acoustofluidics were presented first in detail. Continuum hypothesis, Reynolds number,
Navier-Stokes equation, and microfluidic channel materials in microfluidics were
discussed. In acoustics, the definition and features of piezoelectricity, piezoelectric
materials, surface acoustic wave, acoustic radiation force, and acoustic streaming were
discussed.
A novel sheathless surface acoustic wave-based particle separation was
demonstrated. Two fluorescent polystyrene particles with different diameters (3 µm and
10 µm for general size-resolution, 3 µm and 5 µm for higher size-resolution) were
successfully separated with high efficiency. In addition, the density-based sheathless
particle separation using surface acoustic wave was also demonstrated. Fluorescent
polystyrene and melamine particles with the same size (10μm), and different density
(polystyrene: ρ=1.05 g/cm3, melamine: ρ=1.71 g/cm
3) were successfully separated with
high efficiency. The separation efficiency was increased by increasing power, decreasing
flow rate, and decreasing particle concentration.

103
The prominent feature of this acoustic-based particle separator is that the device
does not require the use of the sheath flow for positioning and aligning of particles in
order to separate particles. The sheathless flow focusing and separation are integrated
within a single microfluidic channel and accomplished simultaneously. This device sets
the first demonstration of acoustic separation to eliminate sheath flows as well as the first
demonstration of density dependent separation using acoustic forces. This acoustic-based
separation technique has great potential to be used as a component in lab-on-a-chip or
micro total analysis systems for integrated biological or biomedical applications. In
addition, this acoustic-based particle separator is ideal for the microparticle sensor
because (1) it is applicable to all types of solid particles regardless of their size, shape,
density and electrical/magnetic/optical properties; (2) it is a non-invasive method and
requires low power intensity; (3) it allows the use of a relatively large microfluidic
channel in comparison to particle separation using pinched flow fractionation and
deterministic lateral displacement, which will allow for high throughput and cause less
problems with clogging, and most importantly; (4) it does not require the use of sheath
flow, which usually change the composition and concentration of the analyte.
Active mixing in a microfluidic channel using acoustic streaming induced by dual
surface acoustic wave was demonstrated. Two fluids streams of DI-water and a solution
of fluorescent dye (Fluorescein sodium salt) were mixed homogeneously with high
efficiency. The higher mixing efficiency was achieved with larger voltage applied to
interdigital transducer and a lower flow rate. Especially, active mixing performance with
dual excitation by two interdigital transducers is much higher than that of single
excitation by one interdigital transducer at the same applied voltages and flow rates. For

104
example with 85 Vp-p applied voltage, 10 μl/min flow rate and 4 mm aperture length, the
mixing efficiency with dual interdigital transducer design increased to 96.7% from 69.8%
achievable with single interdigital transducer design. Also, the results indicated that the
longer-aperture interdigital transducer designed caused slightly higher mixing efficiency.
This rapid homogenous and efficient surface acoustic wave-based active mixing
technique in a microfluidic channel could be a critical potential for high-throughput
chemical, biological, and biomedical analysis systems.
Polydimethylsiloxane (PDMS) is the most widely used polymer materials to
fabricate the microfluidic channel as it has prominent features compared to other
polymers. The effects of PDMS microfluidic channel wall on the surface acoustic wave
insertion loss and the particle migration to the pressure nodes due to acoustic radiation
forces induced by the surface acoustic wave were investigated. It was observed that the
insertion losses decreased as the side and top wall thicknesses of the PDMS channel
reduced. For example, reducing the side wall thickness from 8 mm to 2 mm with 8 mm
top wall thickness decreased the insertion loss by 31.2%. The side wall thickness of the
PDMS channel affects the transmission of the surface acoustic wave more significantly
than the top wall thickness. Also, the migration velocity of the particle exerted by the
acoustic radiation forces induced by SAW increased as the side wall thickness of the
PDMS channel decreased. Reducing side wall thickness of the PDMS channel from 8
mm to 2 mm induced 186% increase in the particle migration velocity. As the acoustic
energy is attenuated more with the thicker wall cases, the PDMS microfluidic channel
wall should be as thin as possible to enhance the capability and efficiency of the surface
105
acoustic wave-based microfluidic device while ensuring adequate bonding and sealing
integrity.
The novel acoustic-based particle manipulation method using phase-shift was
proposed and demonstrated experimentally. The suspended polystyrene particles of 5 μm
diameter were driven and trapped to the pressure node by acoustic radiation force at the
center of microfluidic channel. By modulating relative phase between voltages applied to
two IDTs, the location of the pressure node of SAW was moved and this caused the
polystyrene particles trapped in the pressure node were manipulated precisely. The lateral
displacements of the particles from -72.5 μm to 73.1 μm from the center of the
microfluidic channel were accomplished by varying phase-shift with a range of -180° to
180°. The relationship between the particle displacement and the phase-shift of SAW was
obtained experimentally and shown to agree with theoretical prediction of the particle
position. This acoustic-based particle manipulation technique is simple, precise, label-
free, biocompatible, and highly controllable method.
The mixing, separation, and manipulation techniques presented in this study could
be integrated together in a LOC system or micro total analysis system (µ-TAS) for
biological or biomedical applications. For example, the injected reagent and sample
biological particles solution in the system can be mixed by acoustic streaming due to dual
excitation, and then they can be separated based on size or density difference using
sheathless SAW-based separation method. Then, the separated particles can be
manipulated precisely by phase-shifting of SAW toward the targeted locations for
detecting function in the system.

106
8.2. Future Work
The future efforts could be aimed at using this sheathless acoustic-based separator
to detect and sort of rare cells for cell biology and biomedical applications. The detection
and analysis of circulating tumor cells (CTCs), is important for fundamental
understanding of the process of metastasis, disease staging, predicting prognosis,
monitoring patients during therapy, and improving therapy design. CTCs are not easily
detected because a quantity of these cells in whole blood is very small [203]. However,
the isolation of CTCs from whole blood can be performed based on cell size because
CTCs commonly are larger than blood components such as plasma, red blood cells
(erythrocyte), white blood cells (leukocytes), and platelets. The separation of neural stem
cells is of critical importance to understanding the specific and unique functions. These
cells play a significant role in the central nervous system (CNS), and potential
applications in cell replacement therapy in many neurodegenerative disorders (such as
Parkinson’s, Alzheimer’s, or Multiple sclerosis) and cancer [204, 205]. The separation of
neural stem cells from progenitor cells can be accomplished based on the size of these
cells. This sheathless acoustic-based separator can greatly reduce the amount of time
required for cell purification and preparation for transplantation compared to the use of
typical method, fluorescence-activated cell sorting (FACS), for the purification of
hematopoietic stem cells which can take 1–17 hours [206]. This acoustic-based
separation method does not require the specific labeling of cells, and therefore offers the
possibility of cell purification of mixtures of cells where distinct cell surface markers for
the different types of cells in the population are not available, or when cell labeling with
antibodies or other cell markers is not desired.

107
To date, a large number of experimental demonstrations and investigations of
particle separation using acoustic radiation force have been studied. However, there are
very few theoretical or numerical demonstrations of acoustic-based particle separation.
Thus, the acoustic finite element and theoretical models coupled with the microfluidic
channel, the medium fluid, the fluid-structure interface, and the absorbing boundary are
required to investigate how acoustic waves interact with particles or cells in the
microfluidic channel and to optimize IDT design with the propagation characteristics of
surface acoustic waves. In addition, the development of computational techniques to
analyze the non-linear acoustic streaming in microfluidic channel is also needed to
improve understanding of the acoustic-based mixing phenomena.
The current acoustic-based microfluidic platform design has limited the
manipulation of sub-micron objects such as single DNA or protein molecules due to
insufficient acoustic force acting on the object. For instance, if the diameter of the
particle is less than about 0.3 μm, the acoustic forces acting on the particle are smaller
than the viscous forces as shown in Figure 13. Thus, the comprehensive study for
generating a stronger acoustic force on nano-objects should be introduced to overcome
this limitation, such as the effects of increasing operation frequency and the investigation
of different design IDT including the focused IDT, chirped IDT, and slanted-finger IDT.

108
REFERENCES
[1] J. Do, C.H. Ahn, A polymer lab-on-a-chip for magnetic immunoassay with on-
chip sampling and detection capabilities, Lab Chip, 8(2008) 542-9.
[2] B.L. Ziober, M.G. Mauk, E.M. Falls, Z. Chen, A.F. Ziober, H.H. Bau, Lab-on-a-
chip for oral cancer screening and diagnosis, Head Neck-J Sci Spec, 30(2008)
111-21.
[3] C.D. Chin, V. Linder, S.K. Sia, Commercialization of microfluidic point-of-care
diagnostic devices, Lab Chip, 12(2012) 2118-34.
[4] C.D. Chin, V. Linder, S.K. Sia, Lab-on-a-chip devices for global health: Past
studies and future opportunities, Lab Chip, 7(2007) 41-57.
[5] P. Yager, T. Edwards, E. Fu, K. Helton, K. Nelson, M.R. Tam, et al., Microfluidic
diagnostic technologies for global public health, Nature, 442(2006) 412-8.
[6] S. Moon, U.A. Gurkan, J. Blander, W.W. Fawzi, S. Aboud, F. Mugusi, et al.,
Enumeration of CD4(+) T-Cells Using a Portable Microchip Count Platform in
Tanzanian HIV-Infected Patients, Plos One, 6(2011).
[7] X. Cheng, D. Irimia, M. Dixon, K. Sekine, U. Demirci, L. Zamir, et al., A
microfluidic device for practical label-free CD4(+) T cell counting of HIV-
infected subjects, Lab Chip, 7(2007) 170-8.
[8] J.A. Korecka, J. Verhaagen, E.M. Hol, Cell-replacement and gene-therapy
strategies for Parkinson's and Alzheimer's disease, Regen Med, 2(2007) 425-46.
[9] Z. Wu, K. Hjort, G. Wicher, A. Fex Svenningsen, Microfluidic high viability
neural cell separation using viscoelastically tuned hydrodynamic spreading,
Biomed Microdevices, 10(2008) 631-8.
[10] P. Gascoyne, J. Satayavivad, M. Ruchirawat, Microfluidic approaches to malaria
detection, Acta Trop, 89(2004) 357-69.
[11] P. Gascoyne, C. Mahidol, M. Ruchirawat, J. Satayavivad, P. Watcharasit, F.F.
Becker, Microsample preparation by dielectrophoresis: isolation of malaria, Lab
Chip, 2(2002) 70-5.
[12] D. English, B.R. Andersen, Single-Step Separation of Red Blood-Cells,
Granulocytes and Mononuclear Leukocytes on Discontinuous Density Gradients
of Ficoll-Hypaque, J Immunol Methods, 5(1974) 249-52.

109
[13] A. Rambaldi, G. Borleri, G. Dotti, P. Bellavita, R. Amaru, A. Biondi, et al.,
Innovative two-step negative selection of granulocyte colony-stimulating factor-
mobilized circulating progenitor cells: Adequacy for autologous and allogeneic
transplantation, Blood, 91(1998) 2189-96.
[14] O. Samura, A. Sekizawa, D.K. Zhen, V.M. Falco, D.W. Bianchi, Comparison of
fetal cell recovery from maternal blood using a high density gradient for the initial
separation step: 1.090 versus 1.119 g/ml, Prenatal Diag, 20(2000) 281-6.
[15] T. Chesnot, J. Schwartzbrod, Quantitative and qualitative comparison of density-
based purification methods for detection of Cryptosporidium oocysts in turbid
environmental matrices, J Microbiol Meth, 58(2004) 375-86.
[16] G. Giaever, A.M. Chu, L. Ni, C. Connelly, L. Riles, S. Veronneau, et al.,
Functional profiling of the Saccharomyces cerevisiae genome, Nature, 418(2002)
387-91.
[17] J.S. Mattick, The functional genomics of noncoding RNA, Science, 309(2005)
1527-8.
[18] D. Eisenberg, E.M. Marcotte, I. Xenarios, T.O. Yeates, Protein function in the
post-genomic era, Nature, 405(2000) 823-6.
[19] M. Xiaoyu, B. Wilson, L.Y. Lin, Low Power Laser Induced Microfluidic Mixing
Through Localized Surface Plasmon, Engineering in Medicine and Biology
Society, 2007 EMBS 2007 29th Annual International Conference of the
IEEE2007, pp. 6306-9.
[20] M. Murata, Y. Okamoto, Y.S. Park, N. Kaji, M. Tokeshi, Y. Baba, Cell separation
by the combination of microfluidics and optical trapping force on a microchip,
Anal Bioanal Chem, 394(2009) 277-83.
[21] L. Renaud, P. Kleimann, Electrokinetic Microfluidic Mixing, Sensor Lett, 9(2011)
2207-10.
[22] L.C. Jellema, T. Mey, S. Koster, E. Verpoorte, Charge-based particle separation
in microfluidic devices using combined hydrodynamic and electrokinetic effects,
Lab Chip, 9(2009) 1914-25.
[23] J. Deval, P. Tabeling, H. Chih-Ming, A dielectrophoretic chaotic mixer, Micro
Electro Mechanical Systems, 2002 The Fifteenth IEEE International Conference
on2002, pp. 36-9.
[24] M.S. Pommer, Y.T. Zhang, N. Keerthi, D. Chen, J.A. Thomson, C.D. Meinhart, et
al., Dielectrophoretic separation of platelets from diluted whole blood in
microfluidic channels, Electrophoresis, 29(2008) 1213-8.
[25] R. Ganguly, T. Hahn, S. Hardt, Magnetophoretic mixing for in situ
immunochemical binding on magnetic beads in a microfluidic channel,
Microfluid Nanofluid, 8(2010) 739-53.

110
[26] C. Iliescu, G.L. Xu, E. Barbarini, M. Avram, A. Avram, Microfluidic device for
continuous magnetophoretic separation of white blood cells, Microsyst Technol,
15(2009) 1157-62.
[27] A. Lenshof, C. Magnusson, T. Laurell, Acoustofluidics 8: Applications of
acoustophoresis in continuous flow microsystems, Lab Chip, 12(2012) 1210-23.
[28] M. Wiklund, S. Radel, J.J. Hawkes, Acoustofluidics 21: ultrasound-enhanced
immunoassays and particle sensors, Lab Chip, 13(2013) 25-39.
[29] A. Nisar, N. AftuIpurkar, B. Mahaisavariya, A. Tuantranont, MEMS-based
micropumps in drug delivery and biomedical applications, Sensor Actuat B-Chem,
130(2008) 917-42.
[30] A.J. Chung, D. Kim, D. Erickson, Electrokinetic microfluidic devices for rapid,
low power drug delivery in autonomous microsystems, Lab Chip, 8(2008) 330-8.
[31] R.G. Blazej, P. Kumaresan, R.A. Mathies, Microfabricated bioprocessor for
integrated nanoliter-scale Sanger DNA sequencing, Proceedings of the National
Academy of Sciences, 103(2006) 7240-5.
[32] Y. Sun, Y.C. Kwok, Polymeric microfluidic system for DNA analysis, Anal Chim
Acta, 556(2006) 80-96.
[33] J.E. Riviere, New technologies for application to veterinary therapeutics,
Handbook of experimental pharmacology, (2010) 191-210.
[34] C.-H. Chen, M.A. Miller, A. Sarkar, M.T. Beste, K.B. Isaacson, D.A.
Lauffenburger, et al., Multiplexed Protease Activity Assay for Low-Volume
Clinical Samples Using Droplet-Based Microfluidics and Its Application to
Endometriosis, Journal of the American Chemical Society, 135(2012) 1645-8.
[35] F.B. Myers, L.P. Lee, Innovations in optical microfluidic technologies for point-
of-care diagnostics, Lab Chip, 8(2008) 2015-31.
[36] L. Gervais, N. de Rooij, E. Delamarche, Microfluidic chips for point-of-care
immunodiagnostics, Adv Mater, 23(2011) H151-76.
[37] A. Gunther, K.F. Jensen, Multiphase microfluidics: from flow characteristics to
chemical and materials synthesis, Lab Chip, 6(2006) 1487-503.
[38] P.Y. Keng, S. Chen, H. Ding, S. Sadeghi, G.J. Shah, A. Dooraghi, et al., Micro-
chemical synthesis of molecular probes on an electronic microfluidic device,
Proceedings of the National Academy of Sciences, 109(2012) 690-5.
[39] G. Wu, Assay development : fundamentals and practices, Hoboken, N.J.: Wiley;
2010.
[40] T.M. Squires, S.R. Quake, Microfluidics: Fluid physics at the nanoliter scale, Rev
Mod Phys, 77(2005) 977-1026.

111
[41] S. Hardt, F. Schönfeld, Microfluidics: Fundamentals and Engineering Concepts,
in: S. Hardt, F. Schönfeld (Eds.), Microfluidic Technologies for Miniaturized
Analysis Systems, Springer US2007, pp. 1-58.
[42] H. Bruus, Theoretical microfluidics, Oxford: Oxford University Press; 2008.
[43] A. Chandrasekaran, A. Acharya, J.L. You, K.Y. Soo, M. Packirisamy, I. Stiharu,
et al., Hybrid integrated silicon microfluidic platform for fluorescence based
biodetection, Sensors, 7(2007) 1901-15.
[44] J.W. Gardner, V.K. Varadan, O.O. Awadelkarim, Microsensors, MEMS, and
smart devices, Chichester ; New York: J. Wiley; 2001.
[45] M. Esashi, M. Takanami, Y. Wakabayashi, K. Minami, High-Rate Directional
Deep Dry-Etching for Bulk Silicon Micromachining, J Micromech Microeng,
5(1995) 5-10.
[46] M. Evander, A. Lenshof, T. Laurell, J. Nilsson, Acoustophoresis in wet-etched
glass chips, Anal Chem, 80(2008) 5178-85.
[47] D.J. Harrison, A. Manz, Z.H. Fan, H. Ludi, H.M. Widmer, Capillary
Electrophoresis and Sample Injection Systems Integrated on a Planar Glass Chip,
Anal Chem, 64(1992) 1926-32.
[48] C.K. Malek, L. Robert, J.J. Boy, P. Blind, Deep microstructuring in glass for
microfluidic applications, Microsyst Technol, 13(2007) 447-53.
[49] L. Johansson, Acoustic manipulation of particles and fluids in microfluidic
systems: Uppsala University; 2009.
[50] C. Ahn, J.-W. Choi, Microfluidic Devices and Their Applications to Lab-on-a-
Chip, in: B. Bhushan (Ed.) Springer Handbook of Nanotechnology, Springer
Berlin Heidelberg2010, pp. 503-30.
[51] L.E. Locascio, C.E. Perso, C.S. Lee, Measurement of electroosmotic flow in
plastic imprinted microfluid devices and the effect of protein adsorption on flow
rate, J Chromatogr A, 857(1999) 275-84.
[52] S. Metz, R. Holzer, P. Renaud, Polyimide-based microfluidic devices, Lab Chip,
1(2001) 29-34.
[53] J. Gamby, A. Rudolf, M. Abid, H.H. Girault, C. Deslouis, B. Tribollet,
Polycarbonate microchannel network with carpet of gold nanowires as SERS-
active device, Lab Chip, 9(2009) 1806-8.
[54] S. Wang, D. Sarenac, M.H. Chen, S.H. Huang, F.F. Giguel, D.R. Kuritzkes, et al.,
Simple filter microchip for rapid separation of plasma and viruses from whole
blood, International journal of nanomedicine, 7(2012) 5019-28.

112
[55] H.X. Wang, S. Meng, K. Guo, Y. Liu, P.Y. Yang, W. Zhong, et al., Microfluidic
immunosensor based on stable antibody-patterned surface in PMMA microchip,
Electrochem Commun, 10(2008) 447-50.
[56] Q. Zeng, H.W.L. Chan, X.Z. Zhao, Y. Chen, Enhanced particle focusing in
microfluidic channels with standing surface acoustic waves, Microelectron Eng,
87(2010) 1204-6.
[57] B.S. Hardy, K. Uechi, J. Zhen, H.P. Kavehpour, The deformation of flexible
PDMS microchannels under a pressure driven flow, Lab Chip, 9(2009) 935-8.
[58] L. Johansson, J. Enlund, S. Johansson, I. Katardjiev, V. Yantchev, Surface
acoustic wave induced particle manipulation in a PDMS channel-principle
concepts for continuous flow applications, Biomed Microdevices, 14(2012) 279-
89.
[59] T. Fujii, PDMS-based microfluidic devices for biomedical applications,
Microelectron Eng, 61-2(2002) 907-14.
[60] D.I. Havelock, S. Kuwano, M. Vorländer, Handbook of signal processing in
acoustics, Springer, New York, NY, 2008, p. v.
[61] J. Friend, L.Y. Yeo, Microscale acoustofluidics: Microfluidics driven via
acoustics and ultrasonics, Rev Mod Phys, 83(2011) 647-704.
[62] R.M. White, Introductory lecture - Acoustic interactions from Faraday's
crispations to MEMS, Faraday Discuss, 107(1997) 1-13.
[63] S. Mitragotri, Innovation - Healing sound: the use of ultrasound in drug delivery
and other therapeutic applications, Nat Rev Drug Discov, 4(2005) 255-60.
[64] J.D.N. Cheeke, Fundamentals and applications of ultrasonic waves, Boca Raton:
CRC Press; 2002.
[65] J. Dual, D. Moller, Acoustofluidics 4: Piezoelectricity and application in the
excitation of acoustic fields for ultrasonic particle manipulation, Lab Chip,
12(2012) 506-14.
[66] D.S. Ballantine, Acoustic wave sensors : theory, design, and physico-chemical
applications, San Diego: Academic Press; 1997.
[67] J.F. Nye, Physical properties of crystals : their representation by tensors and
matrices, 1st published in pbk. with corrections, 1985. ed., Oxford Oxfordshire
[68] A. Safari, E.K. Akdo*gan, Piezoelectric and acoustic materials for transducer
applications, Springer, New York, NY, 2008, pp. xiv, 481 p.
[69] R.J. Xie, Y. Akimune, Lead-free piezoelectric ceramics in the (1-
x)Sr2NaNb5O15-xCa(2)NaNb(5)O(15) (0.05 <= x <= 0.35) system, J Mater
Chem, 12(2002) 3156-61.
113
[70] D.S. Ballantine, ScienceDirect (Online service), Acoustic wave sensors theory,
design, and physico-chemical applications, Applications of modern acoustics,
Academic Press, San Diego, 1997, pp. xii, 436 p.
[71] D.K. Pandey, S. Pandey, Ultrasonics: A technique of material characterization,
Acoustic Vaves, 397-430.
[72] M. Hoummady, A. Campitelli, W. Wlodarski, Acoustic wave sensors: design,
sensing mechanisms and applications, Smart Mater Struct, 6(1997) 647-57.
[73] A. Arnau, Piezoelectric transducers and applications, 2nd ed., Springer, Berlin,
2008, pp. xxvi, 532 p.
[74] K. Lange, B.E. Rapp, M. Rapp, Surface acoustic wave biosensors: a review, Anal
Bioanal Chem, 391(2008) 1509-19.
[75] K.-y. Hashimoto, Surface acoustic wave devices in telecommunications :
modelling and simulation, Berlin ; New York: Springer; 2000.
[76] T.o. Ikeda, Fundamentals of piezoelectricity, Corrected pbk. ed., Oxford ; New
York: Oxford University Press; 1996.
[77] E. Mackensen, L. Reindl, Wireless Passive SAW Identification Marks and
Sensors, in: S. Yurish, M.R. Gomes (Eds.), Smart Sensors and MEMS, Springer
Netherlands2004, pp. 155-202.
[78] L. Rayleigh, On Waves Propagated along the Plane Surface of an Elastic Solid,
Proceedings of the London Mathematical Society, s1-17(1885) 4-11.
[79] L.W. Braile, Seismic waves and the slinky: A guide for teachers, 2006.
[80] J.W. Gardner, V.K. Varadan, O.O. Awadelkarim, Knovel (Firm), Microsensors,
MEMS, and smart devices, J. Wiley, Chichester ; New York, 2001, pp. xvi, 503 p.
[81] M. Gedge, M. Hill, Acoustofluidics 17: Theory and applications of surface
acoustic wave devices for particle manipulation, Lab Chip, 12(2012) 2998-3007.
[82] H.L. Bertoni, Coupling layers for efficient wedge transducers, Sonics and
Ultrasonics, IEEE Transactions on, 22(1975) 421-30.
[83] F.G. Marshall, C. Newton, E. Paige, Theory and design of the surface acoustic
wave multistrip coupler, Microwave Theory and Techniques, IEEE Transactions
on, 21(1973) 206-15.
[84] M. Lewis, SAW filters employing interdigitated interdigital transducers, IIDT,
1982 Ultrasonics Symposium, IEEE1982, pp. 12-7.
[85] C. Flory, R. Baer, Surface transverse wave mode analysis and coupling to
interdigital transducers, IEEE 1987 Ultrasonics Symposium, IEEE1987, pp. 313-
8.

114
[86] C. Campbell, Surface Acoustic Wave Devices for Mobile and Wireless
Communications, Four-Volume Set: San Diego; Toronto: Academic Press; 1998.
[87] D.D. Stubbs, S.H. Lee, W.D. Hunt, Vapor phase detection of a narcotic using
surface acoustic wave immunoassay sensors, Ieee Sens J, 5(2005) 335-9.
[88] W. Wen, S.T. He, S.Z. Li, M.H. Liu, P. Yong, Enhanced sensitivity of SAW gas
sensor coated molecularly imprinted polymer incorporating high frequency
stability oscillator, Sensor Actuat B-Chem, 125(2007) 422-7.
[89] W.D. Hunt, D.D. Stubbs, S.H. Lee, Time-dependent signatures of acoustic wave
biosensors, P Ieee, 91(2003) 890-901.
[90] O.K. Varghese, D.W. Gong, W.R. Dreschel, K.G. Ong, C.A. Grimes, Ammonia
detection using nanoporous alumina resistive and surface acoustic wave sensors,
Sensor Actuat B-Chem, 94(2003) 27-35.
[91] M.C. Horrillo, M.J. Fernandez, J.L. Fontecha, I. Sayago, M. Garcia, M.
Aleixandre, et al., Detection of volatile organic compounds using surface acoustic
wave sensors with different polymer coatings, Thin Solid Films, 467(2004) 234-8.
[92] Y. Bourquin, J. Reboud, R. Wilson, J.M. Cooper, Tuneable surface acoustic
waves for fluid and particle manipulations on disposable chips, Lab Chip,
10(2010) 1898-901.
[93] V. Yantchev, J. Enlund, I. Katardjiev, L. Johansson, A micromachined Stoneley
acoustic wave system for continuous flow particle manipulation in microfluidic
channels, J Micromech Microeng, 20(2010).
[94] A. Kundt, O. Lehmann, Longitudinal vibrations and acoustic figures in cylindrical
columns of liquids, Annalen der Physik und Chemie (Poggendorff’s Annalen),
53(1874).
[95] L.V. King, On the acoustic radiation pressure on spheres, Proceedings of the
Royal Society of London Series A-Mathematical and Physical Sciences, 147(1934)
212-40.
[96] K. Yosioka, Acoustic radiation pressure on a compressible sphere, Acustica,
5(1955) 167-73.
[97] L. Rayleigh, On the circulation of air observed in Kundt's tubes, and on some
allied acoustical problems, Philosophical Transactions of the Royal Society of
London, 175(1884) 1-21.
[98] M. Wiklund, R. Green, M. Ohlin, Acoustofluidics 14: Applications of acoustic
streaming in microfluidic devices, Lab Chip, 12(2012) 2438-51.
[99] J. Spengler, W. Coakley, K. Christensen, Microstreaming effects on particle
concentration in an ultrasonic standing wave, Aiche J, 49(2003) 2773-82.

115
[100] K. Ryu, S.K. Chung, S.K. Cho, Micropumping by an acoustically excited
oscillating bubble for automated implantable microfluidic devices, Journal of the
Association for Laboratory Automation, 15(2010) 163-71.
[101] A. Wixforth, Acoustically driven programmable microfluidics for biological and
chemical applications, Journal of the Association for Laboratory Automation,
11(2006) 399-405.
[102] R. Guldiken, M.C. Jo, N.D. Gallant, U. Demirci, J. Zhe, Sheathless Size-Based
Acoustic Particle Separation, Sensors, 12(2012) 905-22.
[103] M.C. Jo, R. Guldiken, Active density-based separation using standing surface
acoustic waves, Sensor Actuat a-Phys, 187(2012) 22-8.
[104] J. Jung, K.H. Han, Lateral-driven continuous magnetophoretic separation of blood
cells, Appl Phys Lett, 93(2008).
[105] K.H. Han, A.B. Frazier, Paramagnetic capture mode magnetophoretic
microseparator for high efficiency blood cell separations, Lab Chip, 6(2006) 265-
73.
[106] D.F. Chen, H. Du, W.H. Li, Bioparticle separation and manipulation using
dielectrophoresis, Sensor Actuat a-Phys, 133(2007) 329-34.
[107] P.R.C. Gascoyne, J. Vykoukal, Particle separation by dielectrophoresis,
Electrophoresis, 23(2002) 1973-83.
[108] S. Kapishnikov, V. Kantsler, V. Steinberg, Continuous particle size separation
and size sorting using ultrasound in a microchannel, J Stat Mech-Theory E,
(2006).
[109] S.M. Woodside, J.M. Piret, M. Groschl, E. Benes, B.D. Bowen, Acoustic force
distribution in resonators for ultrasonic particle separation, Aiche J, 44(1998)
1976-84.
[110] G.J. Shah, A.T. Ohta, E.P.Y. Chiou, M.C. Wu, C.J. Kim, EWOD-driven droplet
microfluidic device integrated with optoelectronic tweezers as an automated
platform for cellular isolation and analysis, Lab Chip, 9(2009) 1732-9.
[111] M.P. MacDonald, G.C. Spalding, K. Dholakia, Microfluidic sorting in an optical
lattice, Nature, 426(2003) 421-4.
[112] M. Yamada, M. Seki, Hydrodynamic filtration for on-chip particle concentration
and classification utilizing microfluidics, Lab Chip, 5(2005) 1233-9.
[113] M. Yamada, K. Kano, Y. Tsuda, J. Kobayashi, M. Yamato, M. Seki, et al.,
Microfluidic devices for size-dependent separation of liver cells, Biomed
Microdevices, 9(2007) 637-45.

116
[114] L.R. Huang, E.C. Cox, R.H. Austin, J.C. Sturm, Continuous particle separation
through deterministic lateral displacement, Science, 304(2004) 987-90.
[115] B.R. Long, M. Heller, J.P. Beech, H. Linke, H. Bruus, J.O. Tegenfeldt,
Multidirectional sorting modes in deterministic lateral displacement devices, Phys
Rev E, 78(2008).
[116] A.V. Larsen, L. Poulsen, H. Birgens, M. Dufva, A. Kristensen, Pinched flow
fractionation devices for detection of single nucleotide polymorphisms, Lab Chip,
8(2008) 818-21.
[117] M. Yamada, M. Nakashima, M. Seki, Pinched flow fractionation: Continuous size
separation of particles utilizing a laminar flow profile in a pinched microchannel,
Anal Chem, 76(2004) 5465-71.
[118] D. Di Carlo, Inertial microfluidics, Lab Chip, 9(2009) 3038-46.
[119] S.S. Kuntaegowdanahalli, A.A.S. Bhagat, G. Kumar, I. Papautsky, Inertial
microfluidics for continuous particle separation in spiral microchannels, Lab Chip,
9(2009) 2973-80.
[120] T. Morijiri, S. Sunahiro, M. Senaha, M. Yamada, M. Seki, Sedimentation
pinched-flow fractionation for size- and density-based particle sorting in
microchannels, Microfluid Nanofluid, 11(2011) 105-10.
[121] C.H. Hsu, D. Di Carlo, C.C. Chen, D. Irimia, M. Toner, Microvortex for focusing,
guiding and sorting of particles, Lab Chip, 8(2008) 2128-34.
[122] O. Ae Gyoung, L. Dong Woo, C. Young-Ho, A continuous cell separator based
on buoyant force in dissimilar density fluid flows, Micro Electro Mechanical
Systems (MEMS), 2010 IEEE 23rd International Conference on2010, pp. 1023-6.
[123] M.K. Tan, R. Tjeung, H. Ervin, L.Y. Yeo, J. Friend, Double aperture focusing
transducer for controlling microparticle motions in trapezoidal microchannels
with surface acoustic waves, Appl Phys Lett, 95(2009).
[124] A. Nilsson, F. Petersson, H. Jonsson, T. Laurell, Acoustic control of suspended
particles in micro fluidic chips, Lab Chip, 4(2004) 131-5.
[125] M. Wiklund, C. Gunther, R. Lemor, M. Jager, G. Fuhr, H.M. Hertz, Ultrasonic
standing wave manipulation technology integrated into a dielectrophoretic chip,
Lab Chip, 6(2006) 1537-44.
[126] H. Jonsson, C. Holm, A. Nilsson, F. Petersson, P. Johnsson, T. Laurell, Particle
separation using ultrasound can radically reduce embolic load to brain after
cardiac surgery, Ann Thorac Surg, 78(2004) 1572-8.
[127] F. Petersson, L. Aberg, A.M. Sward-Nilsson, T. Laurell, Free flow
acoustophoresis: Microfluidic-based mode of particle and cell separation, Anal
Chem, 79(2007) 5117-23.

117
[128] T. Laurell, F. Petersson, A. Nilsson, Chip integrated strategies for acoustic
separation and manipulation of cells and particles, Chem Soc Rev, 36(2007) 492-
506.
[129] U. Demirci, G. Montesano, Single cell epitaxy by acoustic picolitre droplets, Lab
Chip, 7(2007) 1139-45.
[130] P.C.H. Li, W.J. Wang, M. Parameswaran, An acoustic wave sensor incorporated
with a microfluidic chip for analyzing muscle cell contraction, Analyst, 128(2003)
225-31.
[131] M.K. Tan, L.Y. Yeo, J.R. Friend, Rapid fluid flow and mixing induced in
microchannels using surface acoustic waves, Epl-Europhys Lett, 87(2009).
[132] W.K. Tseng, J.L. Lin, W.C. Sung, S.H. Chen, G.B. Lee, Active micro-mixers
using surface acoustic waves on Y-cut 128 degrees LiNbO(3), J Micromech
Microeng, 16(2006) 539-48.
[133] M. Cecchini, S. Girardo, D. Pisignano, R. Cingolani, F. Beltram, Acoustic-
counterflow microfluidics by surface acoustic waves, Appl Phys Lett, 92(2008).
[134] S. Girardo, M. Cecchini, F. Beltram, R. Cingolani, D. Pisignano,
Polydimethylsiloxane-LiNbO(3) surface acoustic wave micropump devices for
fluid control into microchannels, Lab Chip, 8(2008) 1557-63.
[135] J.J. Shi, X.L. Mao, D. Ahmed, A. Colletti, T.J. Huang, Focusing microparticles in
a microfluidic channel with standing surface acoustic waves (SSAW), Lab Chip,
8(2008) 221-3.
[136] J.J. Shi, S. Yazdi, S.C.S. Lin, X.Y. Ding, I.K. Chiang, K. Sharp, et al., Three-
dimensional continuous particle focusing in a microfluidic channel via standing
surface acoustic waves (SSAW), Lab Chip, 11(2011) 2319-24.
[137] T. Franke, S. Braunmuller, L. Schmid, A. Wixforth, D.A. Weitz, Surface acoustic
wave actuated cell sorting (SAWACS), Lab Chip, 10(2010) 789-94.
[138] M.K. Tan, L.Y. Yeo, J.R. Friend, Unique flow transitions and particle collection
switching phenomena in a microchannel induced by surface acoustic waves, Appl
Phys Lett, 97(2010).
[139] J.J. Shi, H. Huang, Z. Stratton, Y.P. Huang, T.J. Huang, Continuous particle
separation in a microfluidic channel via standing surface acoustic waves (SSAW),
Lab Chip, 9(2009) 3354-9.
[140] J. Nam, Y. Lee, S. Shin, Size-dependent microparticles separation through
standing surface acoustic waves, Microfluid Nanofluid, 11(2011) 317-26.
[141] J. Nam, H. Lim, D. Kim, S. Shin, Separation of platelets from whole blood using
standing surface acoustic waves in a microchannel, Lab Chip, 11(2011) 3361-4.

118
[142] M.A. Strege, A.L. Lagu, Capillary electrophoresis of proteins and peptides,
Totowa, N.J.: Humana Press; 2004.
[143] J.J. Shi, D. Ahmed, X. Mao, S.C.S. Lin, A. Lawit, T.J. Huang, Acoustic tweezers:
patterning cells and microparticles using standing surface acoustic waves
(SSAW), Lab Chip, 9(2009) 2890-5.
[144] Y.K. K. Yosioka, Acoustic radiation pressure on a compressible sphere, Acustica,
5(1955) 167-73.
[145] T. Stiles, R. Fallon, T. Vestad, J. Oakey, D.W.M. Marr, J. Squier, et al.,
Hydrodynamic focusing for vacuum-pumped microfluidics, Microfluid Nanofluid,
1(2005) 280-3.
[146] M.C. Jo, R. Guldiken, Dual surface acoustic wave-based active mixing in a
microfluidic channel, Sensors and Actuators A: Physical, 196(2013) 1-7.
[147] W. Buchegger, C. Wagner, B. Lendl, M. Kraft, M.J. Vellekoop, A highly uniform
lamination micromixer with wedge shaped inlet channels for time resolved
infrared spectroscopy, Microfluid Nanofluid, 10(2011) 889-97.
[148] C.Y. Lee, C.F. Lin, M.F. Hung, R.H. Ma, C.H. Tsai, C.H. Lin, et al.,
Experimental and numerical investigation into mixing efficiency of micromixers
with different geometric barriers, Mater Sci Forum, 505-507(2006) 391-6.
[149] Z. Chen, M. Bown, B. O’Sullivan, J. MacInnes, R. Allen, M. Mulder, et al.,
Performance analysis of a folding flow micromixer, Microfluid Nanofluid, 6(2009)
763-74.
[150] T.G. Kang, M.K. Singh, P.D. Anderson, H.E.H. Meijer, A chaotic serpentine
mixer efficient in the creeping flow regime: from design concept to optimization,
Microfluid Nanofluid, 7(2009) 783-94.
[151] D. Moon, K.B. Migler, Forced assembly and mixing of melts via planar polymer
micro-mixing, Polymer, 51(2010) 3147-55.
[152] M.K. Singh, P.D. Anderson, H.E.H. Meijer, Understanding and Optimizing the
SMX Static Mixer, Macromol Rapid Comm, 30(2009) 362-76.
[153] R.T. Tsai, C.Y. Wu, An efficient micromixer based on multidirectional vortices
due to baffles and channel curvature, Biomicrofluidics, 5(2011).
[154] S. Hardt, H. Pennemann, F. Schonfeld, Theoretical and experimental
characterization of a low-Reynolds number split-and-recombine mixer,
Microfluid Nanofluid, 2(2006) 237-48.
[155] M. Campisi, D. Accoto, F. Damiani, P. Dario, A soft-lithographed chaotic
electrokinetic micromixer for efficient chemical reactions in lab-on-chips, Journal
of Micro - Nano Mechatronics, 5(2009) 69-76.

119
[156] C.K. Chen, C.C. Cho, Electrokinetically driven flow mixing utilizing chaotic
electric fields, Microfluid Nanofluid, 5(2008) 785-93.
[157] C.Y. Lim, Y.C. Lam, C. Yang, Mixing enhancement in microfluidic channel with
a constriction under periodic electro-osmotic flow, Biomicrofluidics, 4(2010).
[158] Y. Du, Z.Y. Zhang, C. Yim, M. Lin, X.D. Cao, A simplified design of the
staggered herringbone micromixer for practical applications, Biomicrofluidics,
4(2010).
[159] Z.Y. Zhang, C.H. Yim, M. Lin, X.D. Cao, Quantitative characterization of
micromixing simulation, Biomicrofluidics, 2(2008).
[160] Y. Wang, J. Zhe, B.T.F. Chung, P. Dutta, A rapid magnetic particle driven
micromixer, Microfluid Nanofluid, 4(2008) 375-89.
[161] D. Ahmed, X.L. Mao, J.J. Shi, B.K. Juluri, T.J. Huang, A millisecond micromixer
via single-bubble-based acoustic streaming, Lab Chip, 9(2009) 2738-41.
[162] C.Y. Lee, C.L. Chang, Y.N. Wang, L.M. Fu, Microfluidic Mixing: A Review, Int
J Mol Sci, 12(2011) 3263-87.
[163] K. Yasuda, Non-destructive, non-contact handling method for biomaterials in
micro-chamber by ultrasound, Sensor Actuat B-Chem, 64(2000) 128-35.
[164] Z. Yang, H. Goto, M. Matsumoto, R. Maeda, Active micromixer for microfluidic
systems using lead-zirconate-titanate(PZT)-generated ultrasonic vibration,
Electrophoresis, 21(2000) 116-9.
[165] D. Ahmed, X.L. Mao, B.K. Juluri, T.J. Huang, A fast microfluidic mixer based on
acoustically driven sidewall-trapped microbubbles, Microfluid Nanofluid, 7(2009)
727-31.
[166] R. Shilton, M.K. Tan, L.Y. Yeo, J.R. Friend, Particle concentration and mixing in
microdrops driven by focused surface acoustic waves, J Appl Phys, 104(2008).
[167] P. Paik, V.K. Pamula, R.B. Fair, Rapid droplet mixers for digital microfluidic
systems, Lab Chip, 3(2003) 253-9.
[168] T. Frommelt, M. Kostur, M. Wenzel-Schafer, P. Talkner, P. Hanggi, A. Wixforth,
Microfluidic mixing via acoustically driven chaotic advection, Phys Rev Lett,
100(2008).
[169] Y.Q. Fu, J.K. Luo, X.Y. Du, A.J. Flewitt, Y. Li, G.H. Markx, et al., Recent
developments on ZnO films for acoustic wave based bio-sensing and microfluidic
applications: a review, Sensor Actuat B-Chem, 143(2010) 606-19.
[170] R.V. Raghavan, J.R. Friend, L.Y. Yeo, Particle concentration via acoustically
driven microcentrifugation: microPIV flow visualization and numerical modelling
studies, Microfluid Nanofluid, 8(2010) 73-84.

120
[171] K. Sritharan, C.J. Strobl, M.F. Schneider, A. Wixforth, Z. Guttenberg, Acoustic
mixing at low Reynold's numbers, Appl Phys Lett, 88(2006).
[172] T.D. Luong, V.N. Phan, N.T. Nguyen, High-throughput micromixers based on
acoustic streaming induced by surface acoustic wave, Microfluid Nanofluid,
10(2011) 619-25.
[173] Q. Zeng, F. Guo, L. Yao, H.W. Zhu, L. Zheng, Z.X. Guo, et al., Milliseconds
mixing in microfluidic channel using focused surface acoustic wave, Sensor
Actuat B-Chem, 160(2011) 1552-6.
[174] C. Xu, Y.K. Poh, I. Roes, E.D. O'Cearbhaill, M.E. Matthiesen, L. Mu, et al., A
portable chemotaxis platform for short and long term analysis, Plos One, 7(2012)
e44995.
[175] R.R. Pethig, S. Smith, Introductory Bioelectronics: For Engineers and Physical
Scientists: Wiley; 2012.
[176] N.T. Nguyen, Z.G. Wu, Micromixers - a review, J Micromech Microeng,
15(2005) R1-R16.
[177] G.G. Yaralioglu, I.O. Wygant, T.C. Marentis, B.T. Khuri-Yakub, Ultrasonic
mixing in microfluidic channels using integrated transducers, Anal Chem,
76(2004) 3694-8.
[178] J.C. Rife, M.I. Bell, J.S. Horwitz, M.N. Kabler, R.C.Y. Auyeung, W.J. Kim,
Miniature valveless ultrasonic pumps and mixers, Sensor Actuat a-Phys, 86(2000)
135-40.
[179] Z. Yang, S. Matsumoto, H. Goto, M. Matsumoto, R. Maeda, Ultrasonic
micromixer for microfluidic systems, Sensor Actuat a-Phys, 93(2001) 266-72.
[180] N. Nam-Trung Nguyen Nam-Trung, R.M. White, Acoustic streaming in
micromachined flexural plate wave devices: numerical simulation and
experimental verification, IEEE Trans Ultrason Ferroelectr Freq Control, 47(2000)
1463-71.
[181] Y.C. Hsu, N.B. Le, Coupling coefficient determination based on simulation and
experiment for ST-Cut quartz saw delay-line response, Microsyst Technol,
14(2008) 615-22.
[182] D.S. Ballantine, Acoustic wave sensors : theory, design, and physico-chemical a
pplications, San Diego: Academic Press; 1997.
[183] T.G. Henares, F. Mizutani, H. Hisamoto, Current development in microfluidic
immunosensing chip, Anal Chim Acta, 611(2008) 17-30.
[184] J. Zhou, A.V. Ellis, N.H. Voelcker, Recent developments in PDMS surface
modification for microfluidic devices, Electrophoresis, 31(2010) 2-16.

121
[185] Y. Xia, G.M. Whitesides, Soft Lithography, Angewandte Chemie International
Edition, 37(1998) 550-75.
[186] E. Meng, X. Zhang, W. Benard, Additive Processes for Polymeric Materials, in:
R. Ghodssi, P. Lin (Eds.), MEMS Materials and Processes Handbook, Springer
US2011, pp. 193-271.
[187] X.Q. Gong, W.J. Wen, Polydimethylsiloxane-based conducting composites and
their applications in microfluidic chip fabrication, Biomicrofluidics, 3(2009).
[188] L. Masini, M. Cecchini, S. Girardo, R. Cingolani, D. Pisignano, F. Beltram,
Surface-acoustic-wave counterflow micropumps for on-chip liquid motion control
in two-dimensional microchannel arrays, Lab Chip, 10(2010) 1997-2000.
[189] M.C. Jo, R. Guldiken, Dual Surface Acoustic Wave-based Active Mixing in a
Microfluidic Channel, Sensors and Actuators A: Physical.
[190] S.M. Langelier, L.Y. Yeo, J. Friend, UV epoxy bonding for enhanced SAW
transmission and microscale acoustofluidic integration, Lab Chip, 12(2012) 2970-
6.
[191] D.M. Pozar, Microwave engineering, 4th ed., Hoboken, NJ: Wiley; 2012.
[192] K. Schutze, G. Lahr, Identification of expressed genes by laser-mediated
manipulation of single cells, Nature biotechnology, 16(1998) 737-42.
[193] C. Yi, C.-W. Li, S. Ji, M. Yang, Microfluidics technology for manipulation and
analysis of biological cells, Anal Chim Acta, 560(2006) 1-23.
[194] J. Gimsa, T. Müller, T. Schnelle, G. Fuhr, Dielectric spectroscopy of single
human erythrocytes at physiological ionic strength: dispersion of the cytoplasm,
Biophysical journal, 71(1996) 495-506.
[195] M. Grad, A.W. Bigelow, G. Garty, D. Attinger, D.J. Brenner, Optofluidic cell
manipulation for a biological microbeam, Rev Sci Instrum, 84(2013) 014301.
[196] J. Voldman, Electrical forces for microscale cell manipulation, Annual review of
biomedical engineering, 8(2006) 425-54.
[197] Y. Zhang, M. DaSilva, B. Ashall, G. Doyle, D. Zerulla, T.D. Sands, et al.,
Magnetic manipulation and optical imaging of an active plasmonic single-particle
Fe-Au nanorod, Langmuir, 27(2011) 15292-8.
[198] O. Manneberg, B. Vanherberghen, B. Onfelt, M. Wiklund, Flow-free transport of
cells in microchannels by frequency-modulated ultrasound, Lab Chip, 9(2009)
833-7.
[199] P. Glynne-Jones, R.J. Boltryk, N.R. Harris, A.W. Cranny, M. Hill, Mode-
switching: a new technique for electronically varying the agglomeration position
in an acoustic particle manipulator, Ultrasonics, 50(2010) 68-75.

122
[200] C. Courtney, C.-K. Ong, B. Drinkwater, A. Bernassau, P. Wilcox, D. Cumming,
Manipulation of particles in two dimensions using phase controllable ultrasonic
standing waves, Proceedings of the Royal Society A: Mathematical, Physical and
Engineering Science, 468(2012) 337-60.
[201] X. Ding, S.C. Lin, M.I. Lapsley, S. Li, X. Guo, C.Y. Chan, et al., Standing surface
acoustic wave (SSAW) based multichannel cell sorting, Lab Chip, 12(2012)
4228-31.
[202] L. Meng, F. Cai, Z. Zhang, L. Niu, Q. Jin, F. Yan, et al., Transportation of single
cell and microbubbles by phase-shift introduced to standing leaky surface acoustic
waves, Biomicrofluidics, 5(2011) 44104-4410410.
[203] M. Cristofanilli, G.T. Budd, M.J. Ellis, A. Stopeck, J. Matera, M.C. Miller, et al.,
Circulating tumor cells, disease progression, and survival in metastatic breast
cancer, New Engl J Med, 351(2004) 781-91.
[204] E. Hedlund, J. Pruszak, A. Ferree, A. Vinuela, S.H. Hong, O. Isacson, et al.,
Selection of embryonic stem cell-derived enhanced green fluorescent protein-
positive dopamine neurons using the tyrosine hydroxylase promoter is
confounded by reporter gene expression in immature cell populations, Stem Cells,
25(2007) 1126-35.
[205] J.A. Korecka, J. Verhaagen, E.M. Hol, Cell-replacement and gene-therapy
strategies for Parkinson's and Alzheimer's disease, Regenerative Medicine,
2(2007) 425-46.
[206] C. Reading, D. Sasaki, T. Leemhuis, E. Tichenor, B. Chen, M. Tsao, et al.,
Clinical-Scale Purification of Cd34+Thy-1+Lin-Stem Cells from Mobilized
Peripheral-Blood by High-Speed Fluorescence-Activated Cell Sorting for Use as
an Autograft for Multiple-Myeloma Patients, Blood, 84(1994) A399-A.

123
APPENDICES

124
Appendix A. Copyright Permissions
The manuscript and the results presented in Chapter 4 and 5 have been previously
published in journals “Sensors MDPI” and “Sensors and Actuators A: Physical”. Since
“Sensors MDPI” is open access journal, the authorization of reproduction of author’s
own manuscript is granted by terms of use as stated in “3. Open Access License” of
Figure A. In addition, the permissions for reuse of author’s own manuscript in a
dissertation have been obtained from “Sensors and Actuators A: Physical” as shown in
Figure B and C. Other previously published figures have been referenced, and the
permissions for the use of them have been granted through the publisher as shown in
Figure D–H.
Figure A. The permission for reuse of author’s own manuscript [102] for Chapter 4 from
Sensors MDPI journal.

125
Appendix A (continued)
Figure B. The permission for reuse of author’s own manuscript [103] for Chapter 4 from
Sensors and Actuators A: Physical journal.

126
Appendix A (continued)
Figure C. The permission for reuse of author’s own manuscript [146] for Chapter 5 from
Sensors and Actuators A: Physical journal.

127
Appendix A (continued)
Figure D. The permission for use of the previously published Figure 1 and 2.

128
Appendix A (continued)
Figure E. The permission for use of the previously published Figure 3.

129
Appendix A (continued)
Figure F. The permission for use of the previously published Figure 4.

130
Appendix A (continued)
Figure G. The permission for use of the previously published Figure 5.

131
Appendix A (continued)
Figure H. The permission for use of the previously published Figure 6.