AN A SSESSMENT OF FISCAL POLICY Rosario G Manasan · AN A/SSESSMENT OF FISCAL POLICY IN THE...
94
AN A/SSESSMENT OF FISCAL POLICY IN THE PHILIPPINES, 1986-1988 Rosario G. Manasan WORKING PAPER SERIES NO. 90-06 January 1990 Philippine Institute forDevelopmentStudies
Transcript of AN A SSESSMENT OF FISCAL POLICY Rosario G Manasan · AN A/SSESSMENT OF FISCAL POLICY IN THE...

AN A/SSESSMENT OF FISCAL POLICY
IN THE PHILIPPINES, 1986-1988
Rosario G. Manasan
WORKING PAPER SERIES NO. 90-06
January 1990
Philippine Institute for DevelopmentStudies
TABLE OF CONTENTS
I I troduction ' 1
/_I. The Fiscal Deficit and its Financing ................... 2
A. The Size of the Government Resource Gap .......... ,. 2S, The Fi[_ancing of the Fiscal Deficit ................ 5
C. The Thrust of Fiscal Policy ................... ..... 10
III. Tax Policy ............................................. 14
A. Tax Elasticity ..................................... 14B. Tax Structure ....................................... 16
di id 16i. The In v ual Income Tax ......................
2. Tax on Passive :Incom@ . ................ ......... 19
3 The po Ta 21. Cor rate Income x .......................
4. The Sales Tax and _he Value Added Tax ............ 22
5. Excise Taxes .. ...... ,.. ........................ 25
6. Export Taxes ..................................... 28iscal Incentives " _ ' 30o F oo_ot._t..,.t_6_go_o.ooo_...o
8. Tax.....on Real Property ........................... 37
t_:..
I_V. Government Expenditure Policy. ........ .................. 39
A. Oistribution of Government E×penditures Acrosssectors ................................................ 42
B. Distribution of Government Expenditures ACROSS
Economic Categ i 47or es ............ ,..._...._.,....,.,.., ,,
V. The Govern_nent Corporate Sector and the Privatization
Program ................................................ 48
A. Rationalization of the Government Corporate Sector.. 51B. The Privatization Program ........................ •..... 55
VI. Conclusion .............................................. 59
Bibliography 87

LIST OF ,I'ABLES
i. Fiscal Operations of National Government on a CashBasis 198H-_988 ...... 3
2. Sources of Finance of the National Government Deficit,
1980 8_ 6
3. Consolidated Public Sector Deficit• 1986-1988 ............ 84. = Cash Balances of the National Government as a Ratio
to GNP and Total Disbursements, 1976-1988 ....... " 9
5. Comparison of Obligatioq and Cash Disbursement Program :of the National Government . ii
6. Net Fiscal Impulse as a Proportion of GNP, 1986-1988 .... 137. Effective Tax Rates of the Individual Income Tax Across
Income Deciles Under the Pre-1986 Tax Reform Package .... 188. Effective Tax Rates Of the Individual Income Tax Across
Income Decile Under the 1986 Tax Reform Package .. ....... 20
9. Nominal and Marginal Effective Tax Rate on CorporateIncome in ASEA_ Countries ................................ 23
10. Effective Tax Rate, Cumulative Distribution of Income
and Tax Burden Across Inco,ae Decile, Before andAfter VAT .... 26
ii. Effective Tax Rate, Cumulative Distribution of Income
and Tax Burden Across IncomeoDecile, Bef0re and After0i ....° Removal of Excise Ta× on Fuel 1 ........... , ...... .. 29
i_2. Comparison Of q ncentiveS Udder 8P391 add E0226. ......... 3f13. Internal Rate of Return of a Hypothetical Firm Under
Selected incen'tive Schemes:'i'h ASEAN CounEriesi,_ ;1988 ..'... 32,
14. *'_Change 'in the Internal Rat4"of _Return _of [Hypothetical
BOI Registered* Fir_s Under _BP391 ......._ .K...............__ _'; 35
f5. Change in: _the _Intefna2 Rat'e'Of Return of Hyp0thetical
BOI Registered Firms Under E0226 ........................ 3616. Selected Statistics On N'ew_and_Expansion PrOjects _ ='
* _' Approved by the BOI (Wi'_h °Incentives), "1981_1988 _':........ 38
17. Nominal Growth Rate of National Government Expenditures_"by Sector, on Obli ation Bas_s; 1975-_988 *................ 48, , , ,
i8. National Government *Expenditures by Sector, on an L
Obligation Basis as a Proportion of GNP, 1975-1988 ...... 4!:
19. Percentage Distributfon of TOtal National GovernmenE
Expenditures by Sector, on an Obligation Basis, :. :_,1975-1988 .......... • .... .'.;.'.'._..'*............ ". .... 43
20. _evels of National Government Expenditures by Sector
on an Obligation and Real Per Capita Basis, 1975-1988 ... 44
21. National Government Expenditures by Economic Classi-
fication, on an Obligation Basis as Proportion of GNP,1975-1988 .................................... , .......... 49
22. Status of Disposition Action on GOCCs (July 30, 1989) ... 53
23. Financial Operationls of the •Major NonfinancialCorpo£ations, 1987-1988 ................................. 56
24. Disposition of Transferred Assets ....................... 58
25. Sales/Disposition of GOCCs '.............................. 60
Annex Table 1 Sources of Change in Reserve Money, 1984-1988.. 69
2 Balances of the National Government by
Depository, 1984-1988 ........................ 70
3 91-Day Treasury Bill Rates, 1985-1989 ......... 714 Sources of Change in Net Domestic Credits,
1984-1988 .o.... _. ............................ . 72
5 Growth Rate of Government Revenues, 1975-1988.. 73
6 Government Revenues as .a- Proportion of GNP .... 747 Cumulative Distribution of Income and Indi-
vidual Income Tax Burden Before and After
form ' 75Tax Re ....................................
8 Nominal Tax Rates, Effective Tax Rates and
Taxation of Inputs Implied by the Sales TaX
System of 1987 and VAT of 1988 ................ 769 Tax on Petroleum Products, 1986-1988 .......... 78
10 Effective Tax Rates and Taxation of Inputs
Implied by the Excise Tax on Fuel Oil, 1987 ... 81
ii Percentage Distribution of National Government
Expenditures Net of Debt Service by Sector,
On an Obligation Basis, 1975-1988 ............. 8312 Nominal Growth Rate of National Government
Expenditures by Economic Classification, On an
Obligation Basis, 1975-1988 .............. •.... 8413 Real Growth Rate of National Government Expend-
itures by Economic Classification, On an Oblig-
ation Basis, 1975-1988 ........................ 85
14 Incentive Availments by Type of Incentive ..... 86

AN ASSESSMENT OF FISCAL POLICY IN THE PHILIPPINES,1986-1988"
Rosario •G. Manasan**
I. INTRODUCTION
One of the most robust conclusions of the numerous studies
analyzing the roots of the 1983-1985 Philippine economic crisisis the deleterlous role played by profligate flscal policy. It
will be recalled that the period 1978-1982 witnessed the Lrapid
expansion of public investments at a time when government revenue
performance was deteriorating. This resulted in massive fiscal
deficlts that were largely financed by foreign borrowings. It
cannot De denied that the nigh levels of government debt in the
past pose severe constraints on the government budget in the
current period.
Agains_ this backdrop, it is not surpr.ising to find that the
adjustment policies undertaken in Jfesp0nse_ to the economic crisisassigned a ma3or role to fiscal policy. The effective management0f:_']'the size of the fiscal deficit and __ its financing_ is an
imp_rtan_ feature 0f any_attempt to effect a correction of _-theeaternal/internal disequilibria thah __persistently hound' the
Country's economic managers. At the same time, the imperatives _
of_turnlng the economy around and providing the prerequisites _bfsustained economic growth dictate that the structure Of the' tax
system De reformed and the composition of the _government
*This is Chapter V of a bigger study entitled "An Assessment
of the Performance of the Aquino Government in Selected Policy
Areas, 1986-1988."
**Researc_ Fellow, Philippine Institute for Development
Studies (PIOS) .
2
j expenditures be realigned to minimize, if not eliminate, the
existing distortions in the prevailing framework of economicincentives.
The purpose of t_is paper is to review the conduct of fiscal
policy in the Philippines in 1986-1988, the first three years of
the Aquino administration. The approach tnat is followed in this
study is to examine how well the policy actions undertaken in the
period under study fit into the policy pronouncements that are
embodied in t_e Medium-Term Development Plan (1987-1992).Section 2 examines the variations in the broad fiscal aggregates:
government revenues, expenditures, the fiscal balance and its
financing. It also attempts to evaluate the thrust of fiscal
policy in terms of its impact on aggregate demand. Section 3
fpcuses on the tax reform initiatives while Section 4 examinestne changing size and composition of the government budget. The
public enterprise sector -- its rationalization as well as
privatization issues -- meanwhile, is the subject of Section 5.
Finally, Section 6 summarizes and highlights the ma3or findings
of the preceding sections.
II. THE FISCAL DEFICIT AND ITS FINANCING
The Medium-Term Development Plan states that one of the
primary oD3ectives of the fiscal sector is "to manage the deficit
and minimize its negative impact On the economy." This section
will not only review the size of the fiscal deficit but also itsfinancing. In addition, the role of fiscal policy in the area of
demand management in 1986-1988 is also appraised.
A. The Size of t_eGovernment Resource Ggp
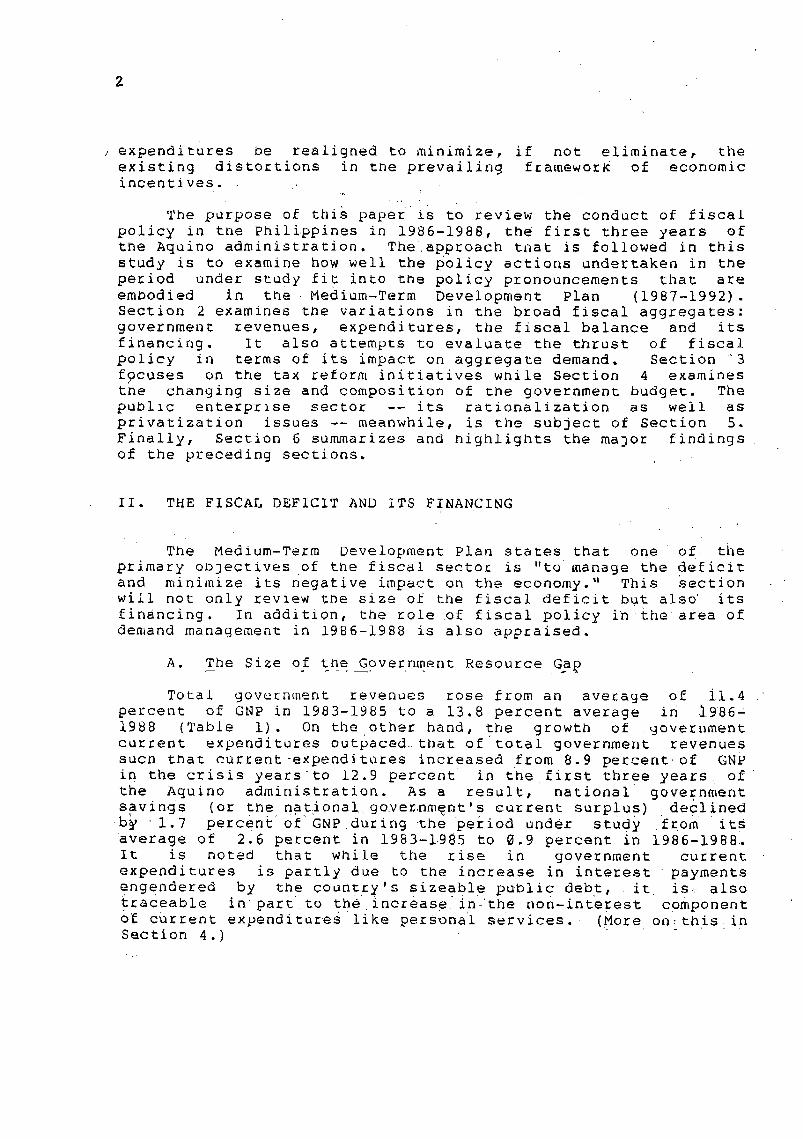
Total government reven_es rose from an average of 11.4
percent of GNP in 1983-1985 to a 13.8 percent average in 1986 _
1988 (Table i). On the other hand, the growth of governmentcurrent expenditures outpaced that of total government revenues
such that current expenditures increased from 8.9 percent of GNP
in thecrisis years to 12.9 percent in the first three years of
the Aquino administration. As a result, national government
savings (or the nationa! go_ernmqnt's current surplus) declinedb_ 1.7 percent of GNP during the period under study fro_ its
average of 2.6 percent in 1983-1985 to 0.9 percent in 1986-1988.
It is noted that while the rise in government current
expenditures is partly due to the increase in interest payments
engendered by the country's sizeable puD!ic debt, it is: also
traceable in part to the increase in the non-interest componento_ current expenditures like personal services. (More on,this insection 4.)

Levels(In_) Per;entof
{987 1988
1980-82{983-85{986-881986 {987 {988 1986-88{986 PlannedActualPlannedActua{
Tota_Revenues {08870,17145429532019245103214ii2BBl 12,0 H.4 {3.B {2.9 14,5 }4,1 15.9 13.1
_Tax 95756{512t924i7666549$ 85923 90352 .7 {2,5 I2.2 {2.5 li.O
:Nontax 13114 20235 53554 13754l 1729l 22509 iN,5 ,2 2,0' 2.5 3.4 2.7
penditur_8 f3880820009{36660A{10497{1990f136100 _Or.4 0 17,3 17.0 18,6 16,5n
CurrentExpendigures 82652 132670276024 66921 95503.}.13600 9;{ , 9 13,6 13.8•; .. •0 ""
o ofwhich:
' InterestPayments 8285 3005T1044562i8i2 36905 45939 0_9 _.2_( 5 5,2 5.6
)italOutlays 52333 58927 63355" 28428 I132l ,I1600 5.8 , 3.9 6 2.5 2,1
_uLendin9 7077 4900 0,4 :0:6 5 {.0 0,6
CurrentSurplus/(i)eficit.)262{8 38/84 19296 {2324 77)I -739 2.9 ,) 1,{ -0,{
7' . .Overall8urplus/(Deflcit)-2993B-28637-T1184-31252-16693-23239 -3,3 ... ( -2.6 -2.4 -2.1 -2.8
Pri_rysurplus/Oleficit)I -21615 1420 332f?-,..-9640 202{2-22700 -2,4 0, I ) ,_2'9 2,8
Primary_urplus/(l)eficit)II -11380 99{4 60397" 5508 27289 27600 -2.0 2 } 3.9 3'.("
'.'.
Sourceof 8asfcOz_: Bureauof Treasury,NSCB,andNE[}A.
4
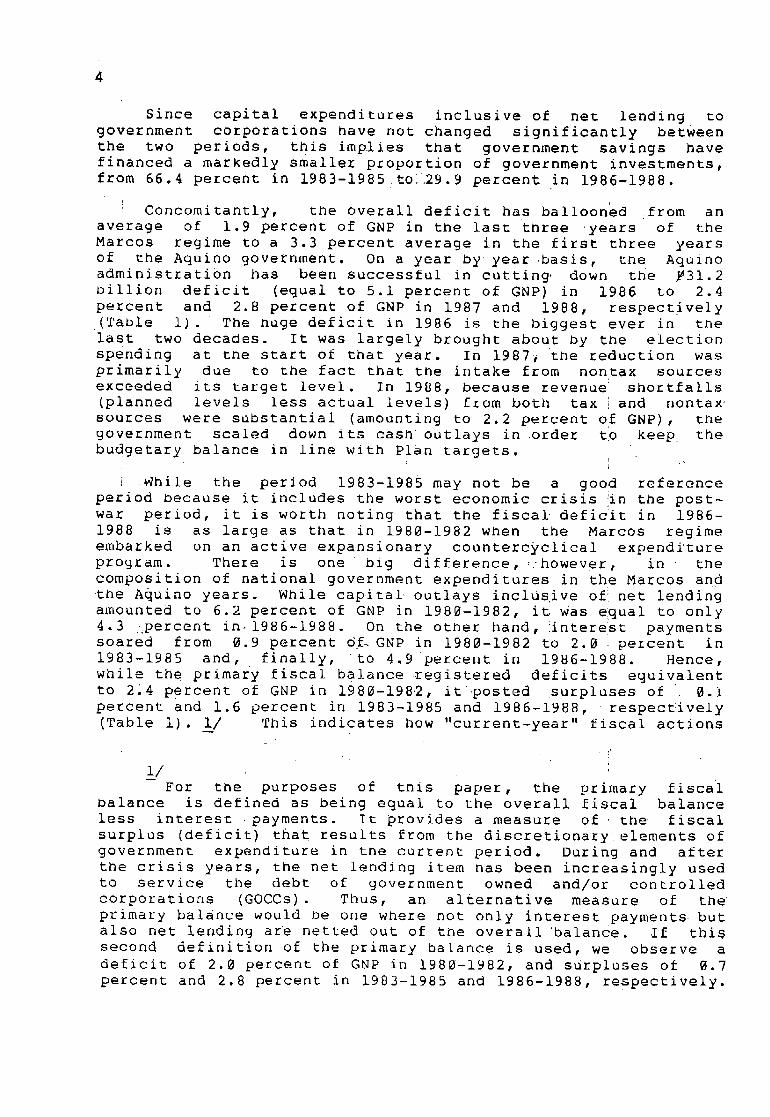
Since capital expenditures inclusive of net lending to
government corporations nave not changed significantly between
the two periods, this implies that government savings havefinanced a markedly smaller proportion of government investments,
from 66.4 percent in 1983-1985 toi/29.9 percent in 1986-1988.
Concomitantly, the overall deficit has ballooned from an
average of 1.9 percent of GNP in the last three years of theMarcos regime to a 3.3 percent average in the first three years
of the Aquino government. On a year by year basis, the Aquinoadministration has been successful in cutting down the _31.2
billion deficit (equal to 5.1 percent of GNP) in 1986 to 2.4
percent and 2.8 percent of GNP in 1987 and 1988, respectively
(Table i) . The huge deficit in 1986 is the biggest ever in the
last two decades. It was largely brought about by the electionspending at the start of that year. In 1987i the reduction was
primarily due to the fact that the intake from nontax sources
exceeded its target level. In 1988, because revenue shortfalls
(planned levels less actual levels) from both tax i and nontax
sources were substantial (amounting to 2.2 percent of GNP), the
government scaled down its cash outlays in order to keep the
budgetary balance in line with Plan targets.[
i While the period 1983-1985 may not be a good referenceperiod Decause it includes the worst economic crisis in the post-war period, it is worth noting that the fiscal defic_it in 1986-
1988 is as large as that in 1980-1982 when the Marcos regime
embarked on an active expansionary countercyclical expenditure
program. There is one Dig difference, : however, in the
composition of national government expenditures in the Marcos ahdthe Aquino years. While capital outlays inclusive of i net lending
amounted to 6.2 percent of GNP in 1980-1982, it Was elqual to only4.3 _percent in 1986-1988. On the other hand, !interest payments
soared from 0.9 percent of-GNP in 1980-1982 to 2.0 percent in
1983-1985 and, finally, to 4.9 percent in 1986-1988. Hence,
while the primary fiscal balance registered deficits equivalent
to 2.4 Percent of GNP in 1980-1982, it posted surpluses of 0.I
percent and 1.6 percent in 1983-1985 and 1986-1988, respectively
(Table 1). i_/ This indicates how "current-year" fiscal actions
i/__ L
For the purposes of this paper, the primary fiscalbalance is defined as being equal to the overall fiscal balance
less interest payments. It provides a measure of ; the fiscal
surplus (deficit) that results from the discretionary elements of
government expenditure in the current period. During and after
the crisis years, the net lending item has been increasingly used
to service the debt of government owned and/or controlledcorporations (GOCCs). Thus, an alternative measure of the
primary balance would be one where not only interest payments butalso net lending are netted out of the overall balance. If this
second definition of the primary balance is used, we observe a
deficit of 2.0 percent of GNP in 1980-1982, and surpluses o_ 0.7
percent and 2.8 percent in 1983-1985 and 1986-1988, respectively.
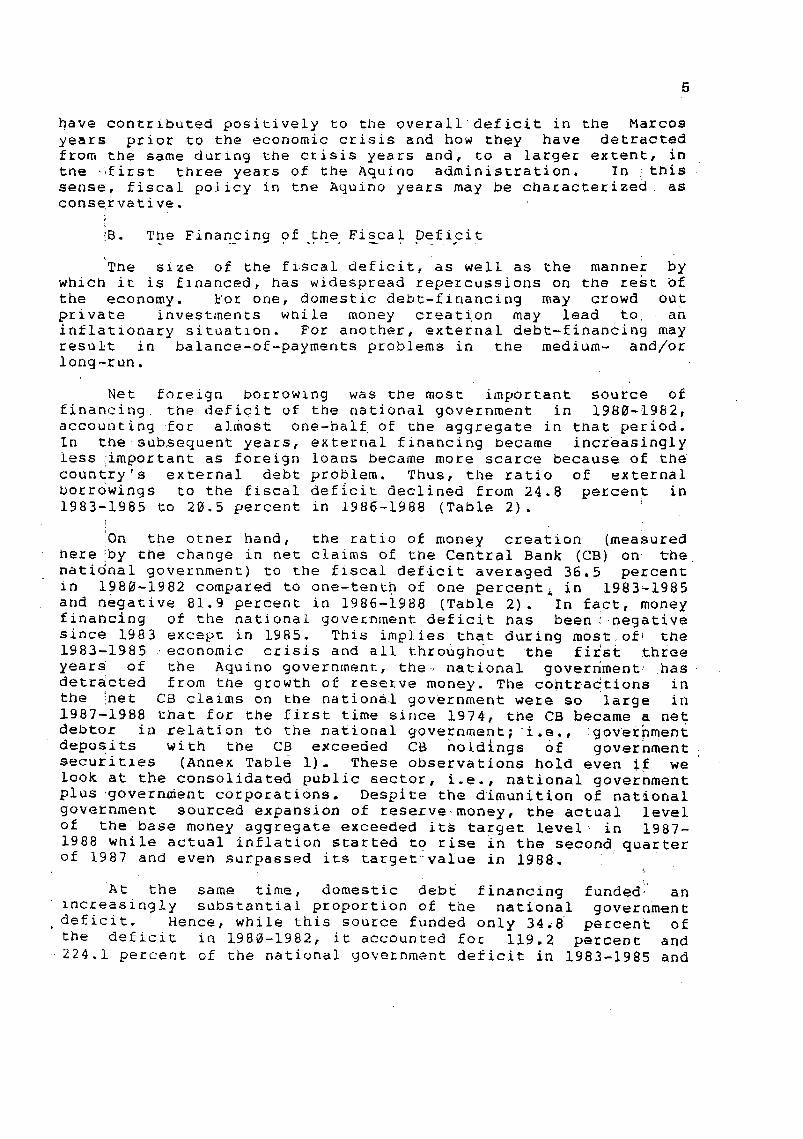
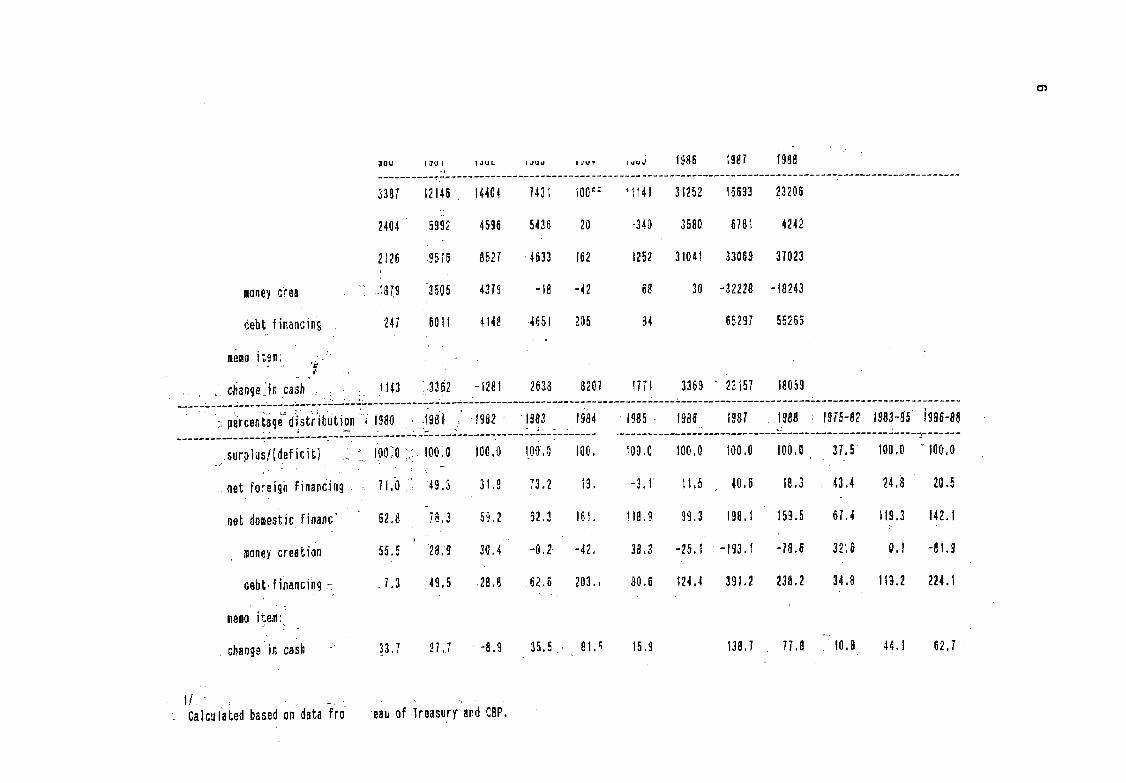
have contributed positively to the overall deficit in the Marcos
years prior to the economic crisis and how they have detracted
from the same during the crisis years and, to a larger extent, in
the ifirst three years of _he Aquino administration. In .this
sense, fiscal policy in the Aquino years may be characterized asconservative.
IB. The Financing of the Fiscal Deficit
The size of the fiscal deficit, as well as the manner by
which it is flnanced, has widespread repercussions on the rest Of
the economy. For one, domestic debt-financing may crowd out
private investments while money creation may lead to an
inflationary situatlon. For another, external debt-rfinancing mayresult in balance-of-payments problems in the medium- and/or
long-run.
Net foreign bor_owlng was the most important source of
financing the deficit of the national government in 1980-1982,
accounting for almost one-half of the aggregate in that period.
In tl%e subsequent years, external financing became increasingly
less _iimportant as foreign loans became more scarce because of the
country's external debt problem. Thus, the ratio of external
borrowings to the fiscal deficit declined from 24.8 percent in1983-1985 to 20.5 percent in 1986-1988 (Table 2).
iOn the other hand, the ratio of money creation (measuredHere !by the change in net claims of the Central Bank (CB) on the
national government) to the fiscal deficit averaged 36.5 percent
in 1980-1982 compared to one-tenth of one percent_ in 1983-1985and negative 81.9 percent in 1986-1988 (Table 2). In fact, money
financing of the national government deficit has been : negative
since 1983 except in 1985. This implies that during most of! the1983_1985 ;economic crisis and all throughout the fi_s6 three
years of the Aquino government, the national goverhment: has
detracted from the growth of reserve money. The contractions inthe !net CB claims on the national government were so large in
1987-1988 that for the first time since 1974, the CB became a net
debtor in relation to the national government; i.e., goverhmentdeposits with the CB exceeded CB holdings of government
securities (Annex Table i). These observations hold even if welook at the consolidated public sector, i.e., national governmentplus government corporations. Despi_e the dimunition of national
government sourced expansion of reserve money, the actual level
of the base money aggregate exceeded its target level _ in 1987-
1988 while actual inflation s_arted _o rise in the second quarterof 1987 and even surpassed its target_value in 1988.
iAt the same time, domestic debt financing funded an
increasingly substantial proportion of the national government
deficit. Hence, while this source funded only 34_8 percent of
the deficit in 1980-1982, it accounted for i19.2 percent and224.1 percent of the national government deficit in 1983-1985 and
03
i988_ou ,_o, ,.............. u 1986 I987
3387 12145 14404 7431 I00c: '114l 3$252 18693 23200
2404 5992 4596 5436 20 "340 3580 678t 4242
2t26 95IB 852? 4533 [02 t252 31044 33069 37023i
moneycrea _i I819 3605 43Fg -18 -42 68 30 -32228 -18243
debt fiflancin_ 247 50_1 4148 465l 205 84 65297 5526_
meeO )te_; 'r'
.... c_angeilinlCaSh "l l :l l :. 7143 i•3362 -128_ 2038 8207 I77i 3369 " 23157 18059.___._ .... : ..... _ .... _.... -_-.':-I_ ............. __-_-i ............................... i .... : ...... : ................ : ..........................
•'. _.. ..
::p_rceni_9_diSLr_bUtion_ 1980 .)98_ t982 1983 1984 •1985. f988 I987 1988 , i975-82 1983-85')985-98.............. :_:._:__..... :..:;_______._L____........... ..... :___.__::................................. __................. .: .... _.......
: lOO_O'-I00:0 I00,0 qO0,O 100 IO0,O ]00,0 lO0,O I00,0 37.5 I00.0 _I00,0....surplus/IdeficiL) : .....
neLforei�n financJn9 . Tl,O " 49.3 31,9 73.2 t9, -3.1 $1,5 40.5 18.3 43.4 24,8 20.5
neLdomesLicFinanc _2,8 78,3 59,z _2,3 ]6t. ]18,9 99.3 198,$ I59.5 67.4 119.3 t42.1
_oneycreaLion 55.5 28,9 3G._ -0.2 -42, 38.3 -25._ -193.I °78.6 32',6 O,l -81.9
debt.financihg._ . ?.3 49,5 28,8 62.6 203., 80.6 I24,4 391.2 238.2 34.8 1_t.2 224.I
memoitem:
chanfeJ_cas_ 33,7 27.7 --8,9 35.5.. 8_._ 15,9 138,7 77,8 -t0.8 44.] 62,7
Ca]culaLedbasedondaLa-fro 'eauof Treasur)_?andCSP.

1986-1988, respectively (Table 2). Note that the ratios
exceeded unity in 1987-1988 because in these years, the
national government has chosen to build up its cash reserves byamounts that are substantial relative to the deficit. Most of
the increase in the national government's cash reserves in these
years were deposited with the CB and gave rise to the negative
net CB claims to the national government' that was cited earlier.
_The increase in the national government's cash balances with
the CB and the simultaneous issuance of national government
domestic debt instruments to cover the same may be viewed inseveral ways: (i) it is reflective of a perceived need to
maintain a desired cash balance for the national government; (2)
the _new disbursement scheme instituted by the national government
effectively increased the liquidity of the financial system and
the national government increased its: deposits with the CB to
counteract the implied expansionary monetary impact of the former
action; (3) the combined deficit of the national government and
the government corporations is: not truly reflective of the
deficit of the public sector because the Central Bank undertakes
quasi-fiscal activities, for and in behalf of the national
government, that results in the big CB deficits that'are recorded
for the period (Table 3); and (4) the said action is nothing buta stabilization measure for the purpose of meeting target levels
of monetary base. The data belie the first and the second
possibilities since they show that (i) the cash reserves of thenational government expressed as a ratio of either GNP or total
disbursements have risen considerably in the period (Table 4);and (ii) there is no significant increase in the national
government cash balances held outside the Treasury and the
Central Bank during the years_under study (Annex Table 2). Onthe other hand, it is not clear from the data that are available
whether the CB deficits that were actually posted in the period
were the result of quasi-fiscal activities or not. If they are
not, then government domestic borrowing in excess of the
conventionally measured deficit in 1986-1988 may be interpretedas being reflective of the government's reliance on said fiscal
instrument to perform the monetary objective of mopping up excessliquidity in the system .....
Regardless of theinterpretation that is adopted, _the factremains that there has been a substantial increase in the issue
of government securities that are left in private sector hands.
The findings of earlier studies on the significant crowding out
effects of changes in privately held domestic government debt and
innovations in government expenditures (Gochoco 1988) indicate
that such practice tends to exert undue pressures on the interestrate and consequently, on the level of private investment and
growth. An examination of the movement in interest rates and the
public/private sector allocation of net domestic credits in 1986-
19.88 suggests that substantial crowding out of private sectorinvestment may have occurred in the period. Note that while the
91-day Treasury Bill rates were high on the average, in 1986 they

Table 3
CONSOLIDATED PUBLIC SECTOR DEFICIT, 1986-1988
(Levels in Billion,Pesos)
Particul ars
i_;86 1987 1988
i. National Government Deficit -31._ -20.1 -z3.2_•
• 4'
=. Monit_]red Corporation Defici-t -6.8, -2.2' 2.1
3,,_ National Government Financing
of Monitored Corporation ii.7 8.4 5.4
4, _ National Government Transfersto PNOC • -I. 5
}i "
5. Public Sector Borrowing Require ....-26.3 -1.4.9 -19 5_ ment (PSBR) ' , -
6. Local Government (LGs) surplus 0,3 _.3 0.5'
7. central Bank Deficit -18.2 -10.9 -16.9
8. Government Financial Institutions'
(GFIs) Surplus -12.0 1.3 .2.1
9. SSS/GSIS Surplu_ 5.5 5.1 4,7
10. National Government Financing toLGUs and GFIs 21.0 0.3 1.4
CONSOLIDATED PUBLIC SECTOR DEFICIT .-29.7 -18.8 -25.4
Source_ ••Department of Budget and Management (DBM).

9
Table4CASH BALANCES OF THE NATIONAL GOVERNMENT
AS A RATIO TO GNP AND TOTAL DISBURSEMENTS,1976-1988
1976-1982 Ratio of Ratio ofCash Balance National Government
to GNP Cash Balance(%) to Total
Disbursement
(%)
1978-1982 5.2 34_5"'_ 7"' _ ' . -
1983_1985 4.9 36.4• ._._ ,• _.,
1986_1988 7.4 43.5
ource of Basic Data: Bureau of Treasury and NSCB.

10
were on the downtrend for most of the year. From 1987 onwards,
interest rates were on the uptrend as the national government
consistently over-borrowed in the domestic credit market (Annex
Table 3). On the other hand, the private sector's share in netdomestic credit expansiondeclined significantly in 1986 and
1987. This occurred as the total public sector ate up huge
portions of the change in net domestic credit in the period
despite the contraction in the national government's s_are (Annex
Table 4).
Furthermore, the resultant pressure on the fiscal deficit
itself from the aforementioned reliance on the issuance of
domestic securities is not negligible. The incremental interest
payment attributable to the national government's "over-
borrowing" is equivalent to 18.1 percent (_3.0 billion) and 12.2
percent (_2.8 billion), respectively, of the national governmentdeficit in 1987 and 1988. 2/
On another level, a comparison of the obligation and the
cash disbursement program of the government shows that there has
been a shift in the cash management style of the government
starting in 1987. While the difference in the cash disbursementand the national government obligation program net of
amortization payments averaged 0.6 percent of GNP in 1975-1984
(exceeding the 1.0 percent level only once) this measure reached
i.i percent and 1.7 percent, respectively, in 1988 and 1989(Table 5). This suggests that the government is increasingly
financing its obligation program by means of building up itsarrears. It should be pointed that such a behavior might lead to
(i) an increase in the cost of government purchases as government
suppliers adjust their prices to reflect the additional cost of
money arising from delayed payments on the part of the
government; and (2) some crowding out as this effectivelywithdraws financial resources from the private sector.
C. The Thrust of Fiscal Policyi
While the actual budget surplus (deficit) is the most
commonly used summary indicator of the overall impact of fiscal
policy, it is severely limited by the fact that it does not
distinguish the effects of changes in the government budget on
aggregate income and the effects of changes in aggregate incomeon the budget. In fact, the fiscal budget and aggregate income
are simultaneously determined. An alternative measure of theoverall thrust of fiscal policy that has been proposed in the
literature is the net fiscal impulse measure. This measure
estimates the "net s£imulative/restrictive effects of the
2/-- The additional interest payments were computed by
multiplying the change in the cash balances of the national
government by the average T-Bill rate in the period.

1i
Table 5
COMPARISON OF OBLIGATION AND CASH DISBURSEMENT PROGRAMOF THE NATIONALGOVERNMENT
(Percent of GNP)
Casn Obligation
Outlays Program* Difference
1986 18.0 17.7 0.3
1987 17.2 17.4 -0.2
1988 17.2 16.1 -i.i
1989 18.9 17.2 -1.7
1990 18.3 16.9 -1.4
ne_ of loan repayments
Source: Department of Budget and-Ma0agement (DBM) and Bureauof Treasury .....
12
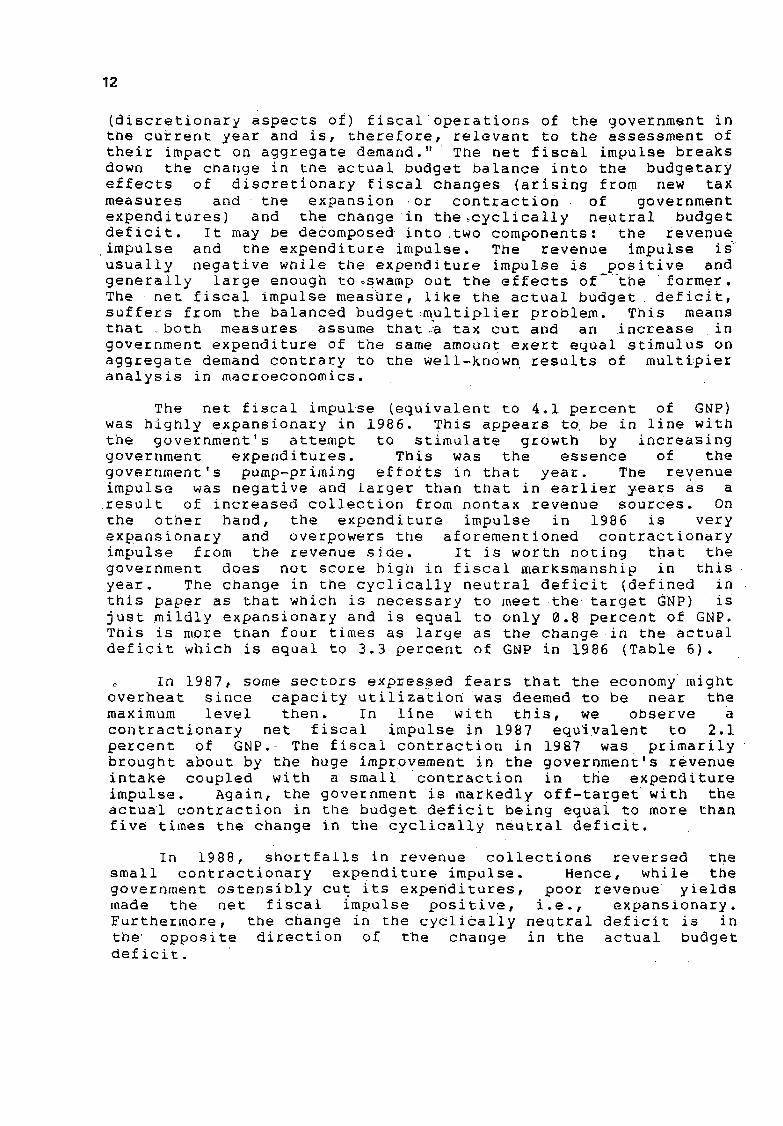
(discretionary aspects of) fiscal_operations of the government intne current year and is, therefore, relevant to the assessment of
their impact on aggregate demand." The net fiscal impulse breaks
down the change in the actual budget balance into the budgetary
effects of discretionary fiscal changes (arising from new tax
measures and the expansion or contraction of government
expenditures) and the change in the_cyclically neutral budget
deficit. It may De decomposed into :two components: the revenue
impulse and the expenditure impulse. The revenue impulse is
usually negative while the expenditure impulse is positive andgenerally large enough to.swam p out the effects of the former.
The net fiscal impulse meashre, like the actual budget deficit,
suffers from the balanced budget multiplier problem. This meansthat both measures assume that a tax cut and an increase in
government expenditure of the same amount exert equal stimulus on
aggregate demand contrary to the well-known results of multi;pier
analysis in macroeconomics.
The net fiscal impulse (equivalent to 4.1 percent of GNP)
was highly expansionary in 1986. This appears to be in line with
the government's attempt to stimulate growth by increasing
government expenditures. This was the essence of the
government's pump-priming efforts in that year. The revenue
impulse was negative and larger than that in earlier sears as aresult of increased collection from nontax revenue sources. On
the other hand, the expenditure impulse in 1986 is very
expansionary and overpowers the aforementioned contractionary
impulse from the revenue side. It is worth noting that the
government does not score high in fiscal marksmanship in this
year. The change in the cyclically neutral deficit (defined in
this paper as that which is necessary to meet the target GNP) is
just Mildly expansionary and is equal to only 0.8 percent of GNP.
This is more than four times as large as the change in the actual
deficit which is equal to 3.3 percent of GNP in 1986 (Table 6).
o In 1987, some sectors expressed fears that the economy mightoverheat since capacity utilizationwas deemed to be near the
maximum level then. In line with this, we observe a
contractionary net fiscal impulse in 1987 equivalent to 2.1
percent of GNP. The fiscal contraction in 1987 was primarily
brought about by the huge improvement in the government's revenue
intake coupled with a small contraction in the e_penditureimpulse. Again, the government is markedly off-target with theactual contraction in the budget deficit being equal to more than
five times the change in the cyclically neutral deficit.
In 1988, shortfalls in revenue collections reversed the
small contractionary expenditure impulse. Hence, while the
government ostensibly cut its expenditures, poor revenue yields
made the net fiscal impulse positive, i.e., expansionary.
Furthermore, the change in the cyclically neutral deficit is in
the opposite direction of the change in the actual budgetdeficit.


14
III. TAX POLICY
The Medium-Term Development Plan states that one of the
ob3ectives of fiscal policy is "to improve the efficiency,
equity and elasticity of the revenue system." Specifically, it
asserts that "the tax reform shall De directed at improving the
elasticity of the tax system; ensuring that similarly situated
individuals and entities bear the same tax burden; withdrawing or
modifying taxes that impair incentives to production, exports and
growth; and simplifying" the tax structure to improve tax
administration and compliance. Thus, the design of tax measures
shall not be solely dictated by the need for government revenues.The equity and efficiency objectives of the tax system shall begiven considerable weight."
Against this backdrop, the 1986 Tax Reform Program was
initiated by the government via the issuance of a series of
Executive Orders (EOs). These measures represented the first
attempt at a comprehensive reform of the tax system in the
country. While numerous tax changes were introduced almost
annually prior to 1986, they were mostly addressed to revenuecreation ob3ectives and are generally piecemeal in,nature.
The ma3or components of the 1986 Tax Reform Package are:
(1) a movement from a schedular to a global approach to the
taxation of individual income from compensation, business, trade
and exercise of profession; separate taxation of incomes _ of
spouses; and an increase in the levels of personal exemption;
(2) an increase in the final withholding tax rate on interest
income and royalties from 17.5 percent and 15 percent,
respectively, to a uniform 20 percent and the phasing out of the
final withholding tax heretofore levied on dividends; (3) the
unificatibn of the earlier dual tax rate (of 25 percent and 35
percent) on corporate income at 35 percent; (4) the
introduction of the value added tax in place of the s_les/
turnover tax and a host of other taxes; (5) the conversion of
the unit rates previously used for excise taxes to ad valorem
rates; (6) the abolition of export taxes except that on logs;
and (7) the general revision in the valuation of real property
for tax purposes. In 1987, the government also enacted a new
investment incentives code replacing the one promulgated in1983. _
In what follows, an attempt is made to evaluate selected
aspects of the reform program using asyardsticks the professed
policy goals of the said program.
A. Tax Elas6_cihyi'
While some improvement in total revenue performance is
registered in 1986-1988, the bulk of this came from nontaxrevenues rather than from tax sources. This resulted as nontax
15
income grew at an unprecedented 42.6 percent average annualgrowth rate in 1986-1988 due to the •proceeds of the Presidential
Commission on Good Government (PCGG)-sequestered assets and the
privatization of government-owned and/or controlled corporations(GOCCs) , their subsidiaries and acquired assets. On the other
hand, tax collections increased by only 13.9 percent annually inthe same period (Annex Table 5). Thus, tax revenues rose from
10.6 percent of GNP in the decade immediately preceding the_eriod _under study to 11.3 percent in 1986-1988 while nontax
revenues increased from 1.6 percent to 2.5 percent of GNP (AnnexTable 6).
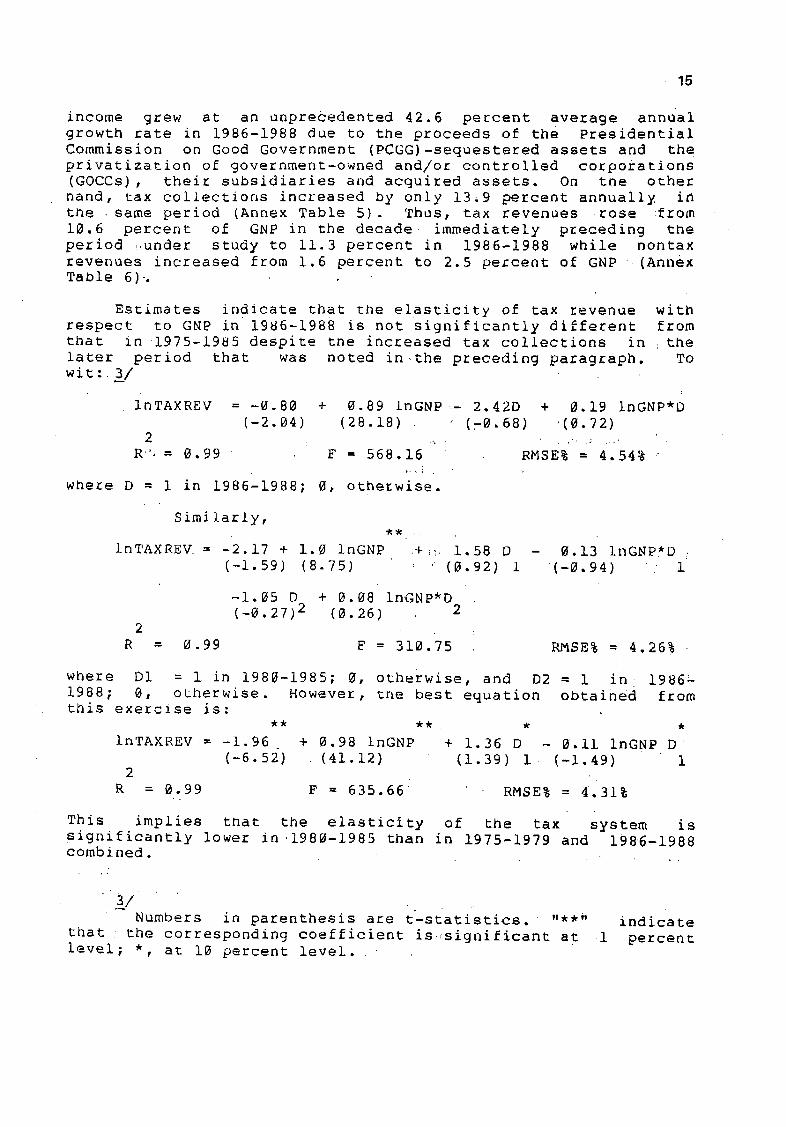
Estimates indicate that the elasticity of tax revenue wit_
respect to GNP in 1986-1988 is not significantly different from
that in 1975-1985 despite the increased tax collections in _the
later period that was noted in.the preceding paragraph. To
wit : 3_/
InTAXREV = -0.80 + 0.89 InGNP - 2.42D + 0.19 InGNP*D
(-2.04) (28.18) (r0.68) (0.72)
R _ = 0.99 F = 568.16 RMSE% = 4.54%
where D = 1 in 1986-1988; 0, otherwise.
Similarly,
InTAXREV = -2.17 + 1.0 InGNP +_ 1.58 D - 0.13 InGNP*D :
(-1.59) (8.75) (0.92) 1 (-0.94) 1
-1.05 D + 0.08 InGNP*D
(-0.27) 2 (0.26) 22
R = 0.99 F = 310.75 RMSE% = 4.26%
where D1 = 1 in 1980-1985; 0, otherwise, and D2 = 1 in 1986 u
1988; 0, otherwise. However, the best equation obtained fromthis exercise is:
** ** W ,
InTAXREV = -1.96 + 0.98 InGNP + 1.36 D - 0.11 InGNP D _
(-6.52) (41.12) (1.39) i• (-1.49) 12
R = 0.99 F = 635.66 RMSE% = 4.31%
This implies that the elasticity of the tax system issignificantly lower in 1980-1985 than in 1975-1979 and 1986-1988combined. L
!/Numbers in parenthesis are t--statistics. ,,**" indicate
t_at the corresponding coefficient is •significant at 1 percentlevel; *, at 10 percent level.
16
B. The Tax Structure[
i. The Individual Income Tax
The tax reform package for the individual income tax is
embodied in Executive Order (EO) 37. It' provides for the
application of a uniform (i percent to 35 percent) graduatedrate schedule to the sum of compensation, business, trade and
professional income in contrast to tBe previous system's one
percent to 35 percent rate schedule for compensation income and
five percent to 6H percent rate schedule for business, trade andprofessional income. The differentiation in the definition of
the taxable base of these two types of income that was
characteristic of the old regime _ was retained, Thus,
compensation income is taxed on a modified gross income basis
(i.e., gross income less personal exemptions) while
business/trade and professional income is taxed on a net income
basis (i.e., gross income less personal exemptions less
deductions for business expense). Spouses, while still required
to file their income tax returns jointly, are now given the
option to compute tneir taxes separately. Furthermore, personal
exemption was increased from _4,000 to _6,000 and _8,500 to
_12,000 for single and married taxpayers, respectively.
The upward adjustment in personal exemptions effectively
exempts from tax a typical family of six earning less than
_26,500 per annum. In contrast, prior to 1986, the same family
would be taxed if it has an income of _20,000 or more. 4--/ Thisimplies that if our typical family had an income that is equal to
the poverty threshold, it is exempt to the extent of 50 percentof its income in 1985 and °66 percent of its income in 1986. Thus,
the pre-reform situation connotes a wider tax base and a greater
potential revenue at the expense of taxing people well below the
subsistence level. Note, however, that because the adjustment in
personal exemptions in i986 is a once-and-for-all change,
inflation will have completely eroded by 1989 the relief grantedto families in the vicinity of the poverty threshold.
The move to allow spouses to compute taxes separately was
designed to mitigate the efficiency losses that arise when the
secondary earner in a family (usually the wife) is subjected to a
nigher marginal tax rate than the single individual.. This
consideration is particularly important given the increasing
participation of women in the labor force in the Philippines.
There is also some evidence (in other countries) that the
elasticity of the labor supply of married women is higher thanthat of other groups. Furthermore, note that the imputed income
from housework of the nonworking wife is untaxed while work-
4/The poverty threshold for a family of six is _39,384 and
_39,924 in 1985 and 1986, respectively.

17
related costs incurred by the working wife is not tax deductible.
All these suggest that this reform measure is sound from both the
efficiency and the equity perspective.
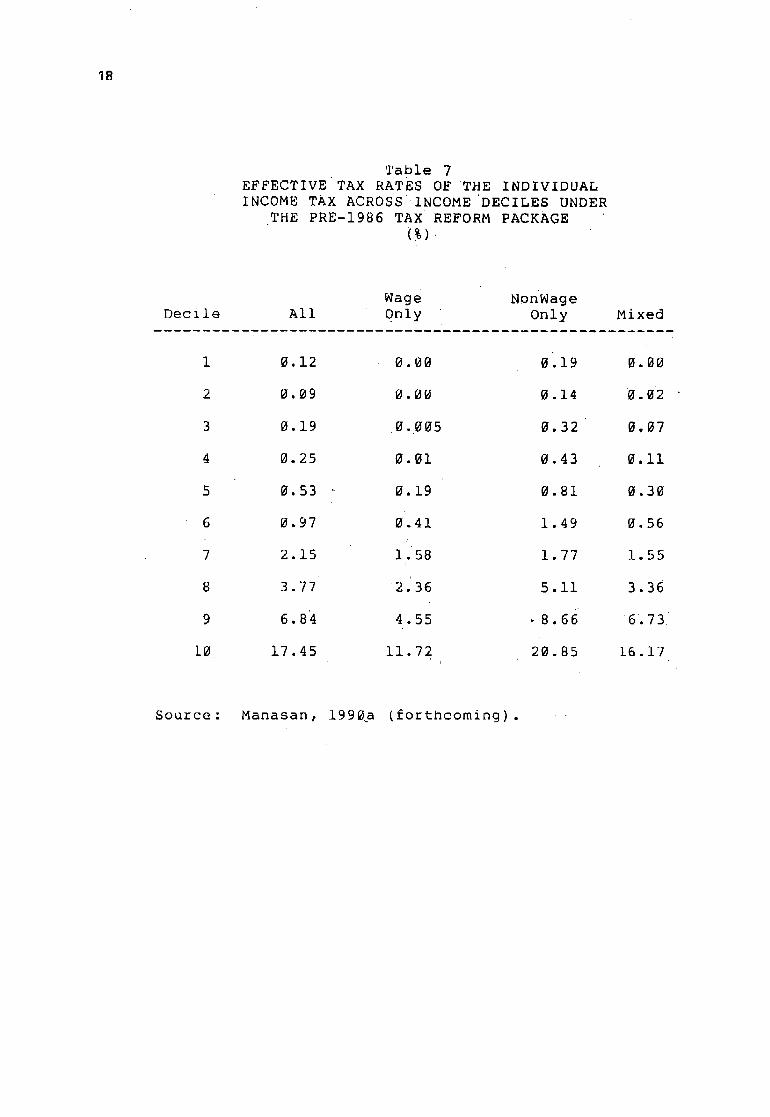
The dual rate schedule of the previous system violates the
horizontal equity principle in income taxation. Specifically,
taxpayers in the same income bracket (or decile)_ were subjected
to varying effective tax rates depending on the source of theirincome. 5/ Nonwage earners bore the highest effective ta_
rates (_TRs) while wage earners had the lowest. The mixedincome earners were situated in between. The within-income group
variance in the ETRs was largest for the first five income
deciles with ETRs of the nonwage earners being at least four
times as large as those of wage earners. At the upper end ofthe income distribution, the variation in ETRs was somewhat
smaller but still high such that the ETR of nonwage earners inthe tenth decile is almost twice that of wage earners (Table 7).
The earlier regime is not'only detrimental to the attainment
of horizontal equity between wage and nonwage earners but alsoinhibited the efficient allocation of resources. The
differential tax wedge on the incomes received by salaried andnonsalaried individuals may have distorted the incentive
structure affecting the behavior of these economic agents.
It has been shown elsewhere that there is a wide variance in
the deductions actually claimed against gross income by nonwage
earners (NTRC 1986). This indicates that evasion via excessive
deductions had also jeopardized the "equal treatment of equals"
principle even within the group of nonsalaried taxpayers. 6/
In sharp contrast, the 1986_Tax Reform Package treats all
taxpayers in the same income bracket equally regardless of theirsource of income (in principle, at least). Thus, Table 8. snows
that the ETRs for wage, nonwage and mixed.income earners are to a
large extent uniform within each income grouping, Whatever kinks
5_/The estimation of the effective tax rates across income
deciles are explained in-detail in Manasan 1990a (forthcoming).
6_/Some writers have averred that nonwage earners have to be
taxed at a higher rate precisely because they have .' the
opportunity to evade taxes while wage earners do not. While this
may De a valih_ solution from the revenue generation point ofview, it does not necessarily address the equity and efficiency
issues raised above. Not all taxpayers evade taxes and not all
evaders do so with the same intensity. Because of this, it is
" unlikely that under the old system, evasion will somehow equalize
_ ETRs between wage and nonwage earners in the same income decile
and within the group of taxpayers who obtain their income from
nonwage sources.
18
Table 7
EFFECTIVETAX RATES OF THE INDIVIDUAL
INCOME TAX ACROSS INCOME DECILES UNDER
THE PRE-1986 TAX REFORM PACKAGE
Wage NonWage
Decile All 0nly Only Mixed
1 0.12 0.00 0.19 0.00
2 H.09 0.00 0.14 0.02
3 0.19 0.005 0.32 0.07
4 0.25 0.01 0.43 0.11
5 0.53 0.19 0.81 0.30
6 0.97 0.41 1.49 0.56
7 2.15 1.58 1.77 1.55
8 3.77 2.r36 5.11 3-36
9 6.84 4.55 -8.66 6.73/
[0 17.45 11.72 20.85 16.17
Source: Manasan, 19909 (forthcoming).

Ig
were left are due to the special exemption of _4,000 given t_
those earning wages of less than _20,000 a year. _/ Thismodification, as we have already pointed out, should improve both
horizontal equity and efficiency properties of the tax.
A _priori, it is_not clear'what _he impact of these reformsis:_iSn the overall progresSivity 0f the individual income tax.
However, the estimates in this assessment of the Suit's index of
progressivity indicates that, abstracting from evasion, vertical
equity has, in fact, been enhanced (Annex Table 7).
b In_ principle, _ then, the 1986 tax measures promote _,' (i)
horizontal equity, (2) vertical equity,-and (3) efficiency. Inpractice, however, tax evasion problems complicate the situation.
It should be pointed out that the 1986 Tax Reform Package
originally included a provision for imposing ceilings on certaintypes of _business deductions, primarily tO deter excessive claims
for tax deductions. Unfortunately, tllis proviso was never
implemented. Again, it is difficult to simulate the impact of
tax evasion on the estimates of ETRs and the tax progressivity
index; in this paper because _of lack of data at the micro level.
What is clea_, _owever, is that tax evasion drives a wedge in the
ETRs of wage and nonwage earners in the: same income bracket.
This implies that the potential gains in horizontal equity and
efficiency cited above are< not fully realized. Tbe effect on
vertical equity is indeterminate but it is likely to De negative
if evasion rates in higher income levels are, in fact, greater
than those in lower income levels. 8/ In addition, the revenuepotential is eroded not only because of evasion but also becauseof the lower ETRs across all income deciles after the reform
(Tables 7 and 8]_ _ .......
To sum up, the 1986 reform of %he individual income tax is
an excellent reform on paper, as far as the tax structure is
concerned. Sad to say, it is sorely=.deficient in providing the
administrative support to all the good intentions providedtherein.
2. Tax on Passive Incom
Before 1986, the so-called passive income which consists
mostly of capital income was taxed at differential rates: 17.5
percent on interest income, 15 _ercent on dividends and
royalties, and five percent (based on gross selling price) on
!/It is not clear what this special exemption aims to
achieve. In fact, it represents a loophole that may be used Dytax evaders.
Tnis hypothesis has both theoretical and empirical support(Allingham and Sandmo 1972 and NTRC 1986).

2O
Table 8EFFECTIVE TAX RATES OF THE INDIVIDUALINCOMETAX ACROSS INCOME DECILE UNDER
THE 1986 TAX REFORM PACKAGE
Wage NonWageDecile. All only. , Only Mixed-
1 0.0 _._ 0.0 0.0
2 0.0 0.0 0.0 0,0
3 0.007 , ,0.01 0_012 0,0005
4 0:008 _0_003 ', 0.013 0.003i
5 0.03 _ 0. 008 0. 043 0. 008
8 0.09 0.10 0.10 0.03
7 0.30 0.30 0 _31 0.24
8 1.01 1_.12 i. 12 0.57( .
9 3.10 3.10 3.10 _ 3.10
"10 9.48 9.48 - 9.45 9.40
Source: Manasan, 1990a (forthcoming).

21
sales of real property, 0.25 percent (based on gross selling
price) on sales of stock listed arld traded tnrough a local stock
exchange and a 10-20 percent tax on net capital gain from sale ofstocks that are not traded tnroogh the local stock exchange. The
1986 Tax Reform Package instituted the phasing out of the tax on
dividends such that by January i, 1989, the tax rate on thisincome source was down to zero. At the same time, the tax reform
scheme also increasedtheinterest income, royalties and winnings
to 20 percent. No changes were introduced in the taxation of
Capital gains from stock or real property transactions.
The elimination of the tax on dividends may be viewed as an
attempt to eliminate_the dodbie tax_tfon of corporate income thatis inherent in the practise of taxing dividends and corporate
income at the same time. :The earlier_taa regime was t_us seen as
being biased in favor of noncorporate_J_relative to corporatecapital. This is so because ssch a_system implicitly levied a
hi_gher _ tax rate on income froth Capitai from corporate :sourcesrelative to other forms of capitai _income. It also 'effectively
provided a disincentive to the distribution of dividends and,
consequently, posed a hindrance to the development of the
equities market. From this'perspective, the removal of the taxon_dfvidends is deemed to promote the_deve£opment of the' capital
market as well as greater efficiency in'the allocation of capita'i
resources and greater incentive _to increased investmei_t.
On ' the other lland,'tne imposition of a final tax of 20
percent on interest income, royalties andwinnings results inunequal effective tax rates, on income from said sources vis-a-vis
labor income. In particular, low income taxpayers earning • Solne
interest income would be taxed at higher rate than those in the
same bracket who do not have any interest income because of _thefinal c_aracter of the tax. Also, the ta_ on capital gains
appears _to be relatively low, particularly for stocks tl]at aretraded in the local stock exchange. Meanwhile, •the practise of
taxing :_'_•capital gains on. real :Property and other stocktransacfions based on gross selling price will result in non-
discriminatory rates on various fOrm_of capital income only by
accident. The present system is thus nonneutral with respect tothe allocation of sav_ngs into alterna£ive forms. In this sense_ _-
th_is practise is not only inefficien_Jbut also inequi'table. '"
3. The Corporate Income Tax
Prior to 1986, the corporate income tax was levied on a
graduated basis: 25 percent on the first slao of _100,.00Z of net
income and 35 percent on net income in-excess Of said amoun6:_'The 1986 Tax Reform_Program imposesla _ uniform r35_percent _ tax •6n
corporate net income
There is no economic basis for_ _taxing _corporate income a_
progressive rates. Graduatio_in"rates'_]asa builtlin b:ias
against large and/or profitable enterprises. While the promot'ion

22
of small/medlum enterprises may be desirable, the corporateincome tax is. not the proper instrument to address this
.. • . _ ' ,ob]ective _
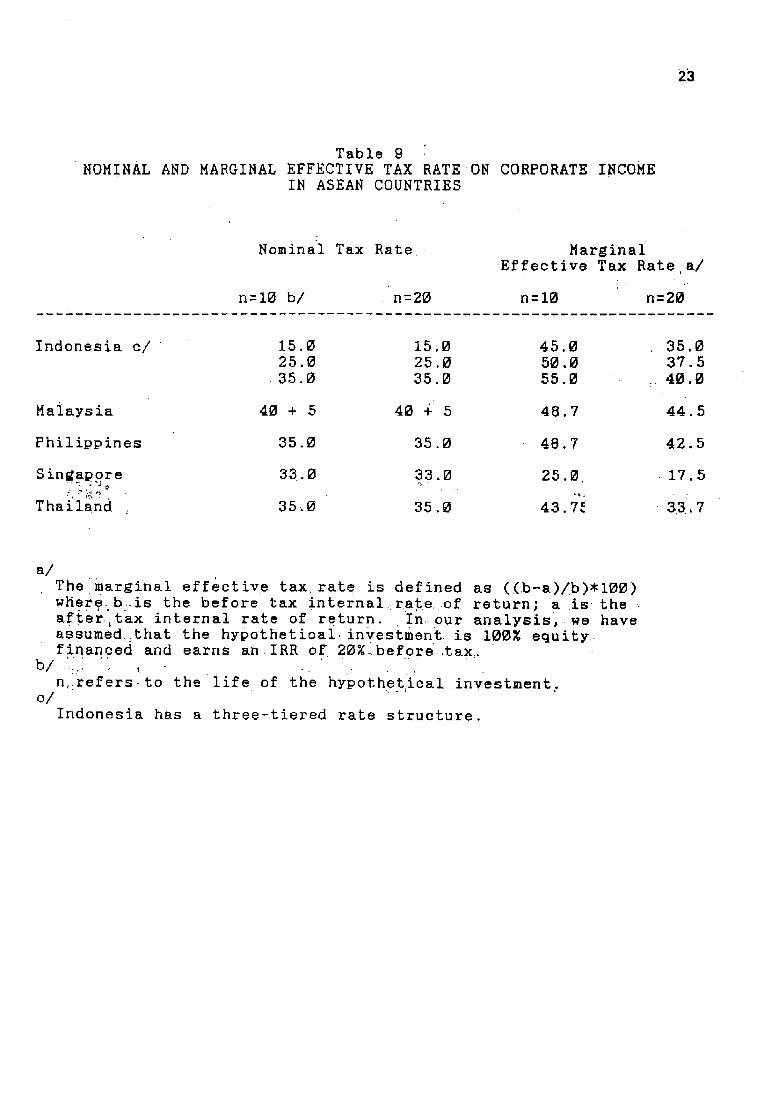
At the same time, the 35 percent ra_e used is in line with
that o_ the other ASEAN countries. Thus, the Philippines remains
competitive with the other ASEAN capitals in attracting foreign
capital •(Table 9). While a low_r rate might be desirable from
the point of view of stimulating domestic as well as foreigninvestments, the revenue needs of the government are, perhaps r of
more immediate importance at this point.
4. The Sales Tax and the Value Added Tax
The value added tax (VAT) was formally introduced in the
Philippines with the signing of Executive Order 273 in June 1987.
It actually took effect on January 1,1988. In addition to the
,manufacturer's ,sales tax ,(with° VAT-like features) and the• ,., ,
turnover tax, the VAT replaced the miller',s tax, ! the
Contractor's tax, the broker's tax, the tax on lessors of
p@rsonal property and a host of fixed •taxes. The VAT imposes a
uniform 10 percent tax ,on the saleand:importationof most _goods
an d i_ services. Exports are zero-rated _ while agricultural
products, ma]o_r,inputs to agriculture wlth,no alternative uses,e.g., ferti!.izers, pesticides, animal feeds, etc., most petroleum
products, books and other printed materials, utilities,
financial, medical, educational, transport, communication and
other services and sales and/or services rendered by entities
whose gross annuai_turnover is less than _200,000 are exempt. 9/Furthermore, the VAT is complimented by the imposition of excise .
taxes ranging from 15 percent to_ 100 percent on automobiiles and
20 percent on jewelries, perfumes and yachts. 10/
On the bther hand, t_e manufacturer's sales tax that was in
place before the VAT had a four-pronged rate structure. Then,the tax rates were differentiated according •to the essentiality
of the goods; 0, 10, 20,, and _ 30 percent, respectively, foragricultural products, essentials, ordinary, and non-essential
goods. In addition, a 1.5 Percent turnover tax based on gross
selling price was levied on each subsequent sale. Taxes on
certain inputs may be credited• against outputs taxes. However,the earlier tax credit _ystem is more limited than the one under
_9/Zero-rated and exempt goods do not pay taxes on their
outputs. ••However, zero-rated goods are _iven a rebate on •t_e
taxes paid on their inputs while e_empt goods_,are., . not. , ._. ,:,,
Unlike petroleum products, alcoholic*and tobacco products
are covered by the VAT so that the e×cise taxes_,levi_d on the
latter are •over and above the VAT,and may be viewed in the same
light as the aforementioned sumptuar:y taxes.
23
Table 9
NOMINAL AND MARGINAL EFFECTIVE TAX RATE ON CORPORATE INCOMEIN ASEAN COUNTRIES
Nominal Tax Rate_ MarginalEffective Tax Rate a/
n=lO b/ n=20 n=lO n=20
Indonesia o/ 15.0 15.0 45.0 35.025.0 25 _0 50.0 37.535.0 35.0 55.0 ; 40.0
Malaysia 40 + 5 40 + 5 48.7 44.5
Philippines 35.0 35.0 48.7 42,5
Singapore 33.0 33.0 25.0_ 17.5•._: _,_ • o
Thailand , 35_0 35.0 43.7_ 3,3,7
a/The marginal effective tax rate is defined as ((b-a)/b)*100)where_b,,is the before tax internal_rate,of, return; a is theafter, itax internal rate of return_ In, our analysis, we haveassumed_;that the hypothetioai_investment is ,100% equityfiqanoed and earns an IRR of 20%.befgre tax_.
n_ireferslto the life of the hyPothet_ical investment.o/
Indonesia has a three-tiered rate structure.

24
VAT. In particular, under the previous system, only taxes on
inputs that physically form part of the finished product may becredited against output taxes. Under VAT, tax credits are
.. . r ..... the c,_ATallowed for taxes on all iDputs_which,, are within _.,, _,,.amDit_qil2 i_,_- ....._ ::;5_ ..... .,.__ . _ .... ,_,._._._._,_l_,_
In evaluating the VAT, it should De emphasized that. like the
sales-tax, the--intended base o_--the-VAT is consumption..From, an-
efficiency perspective, the question then is: bow successful is
the VATLI:in-:eliminating the tak&£ibh of '_ih£ermediate inpsts? 12/Equity considerations, on the other hand, prod us to ask: How
does the implied distribution of the tax burden of VAT compare
Withitnat of the"_taxes it repl&ced? ' : '"
To answer these queries, Stern's (1987) approach to the-'"Ehfsestimation of ETRs on Sectoral consumption was used in--,
study 13/ Essentially "wha.t is involved in this procedure isthe addi--ng up of the successive layers of taxes on output, taxes
. viaon inputs into outputs, taxes on inputs into inputs, etc , _ .:the use of the inverse matrix of the input'ioutput tables, glven
the statutory tax rates and the legal provisions on the rebate or
"creditability" of input taxes, so as to arrive at some estimate
of the effective tax rate on the consumption of the different
commodity 9roopings. The VAT, in principle, ensures that inpdts '_are not taxed. In practice, because of the exemption of certain
ggods from"vAT, tne taxation of intermediate goods is _not
Qompletely eliminated.
In this paper's analysis,, excise taxes on automobiles and"nSn-essential goods are included because they are an integral.
part of_ _ the 'VAT..' pacKage, especiaily .iin_ ''terms'_''_'_of-"_qdity'r ...... •....... he""consider&.tions. : Annex iTable'_8_preSents;"t estlma£ed _n6mfSai _'
ra:es,' T; effectlvetaxrateS, E_ and thei_r_Sdifference,;"_"(EZT). ;The nominat _ r:ates_':are equal-_to_-the i l_gai ,! #ates".adjSst6d__fo£-:;_taxcredit allowances. (E_T)_iS a'_mea-sure of(the extent__ to' whzch
inputs are taxed and, hence, is indicative of the distortions
arising therefromv In'general'_"ETRS_'are:hi'gher:befbre 'VAT_ 'than
i!/ ......This implies that since petroleum products .are exempt
from VAT, no credit may beclaimed when petroleum products are
used as inputs into the production of other goods.
12/There is a consensus in the economic literature that the
taxation of inputs "may lead to inefficiencies in that different
industries will face different relative prices so tha_ the
marginal rate o£ transformation between inputs or between an
input and an output would be unequal across industries" (Anmad_nd Stern 1987).
13__/Mennodological details are contained in Manasan 1990b
(forthcoming).

Z5
a_ter VAT. Also, the variation in the ETRs is greater before the
implementation of the the VAT. The average ETR prior to the VAT
system is 14.4 percent compared to the 6.5 percent average ETR
after VAT. In 1987, ETRs ran'ged from 1.3 percent to 34.6
p_cent. !" ; In 1988, they varied from,_0.;4 percent, _0 13_._3 percent _
only. These arise not only becahse 6f:i _the geherally higher
statutory rates but also Oecause of the greater degree of _ax
cascading implied in the old regime. The latter is alsor_f_ected__in the_higher (E-T) estimates for 1987_ _relative to
those of 1988: 7.2 percent average before VAT against 3.3
percent average after' VAT. _DeSpite_ _he improved system ofrebating input taxes under: VAT,_(E-T) remains high in 1988, very
ofte_ accounting for more than 50 percent 0f ETR _estimates _ This
may be attributed to the large number!_of goods exempted under the
Philippine VAT. To sum up, the VAT _i_' the Philippine setting has
resulted in a lower taxation of inputs and, consequently, in some _
improvement in production efficiency but some distortions inproduction incentives still remain.
_ The ETRs in Annex Table 8 were combined with the 1985 FIES
data on the distribution of income and expenditures to arrive atthe implied tax burden estimates per income decile. Estimates of
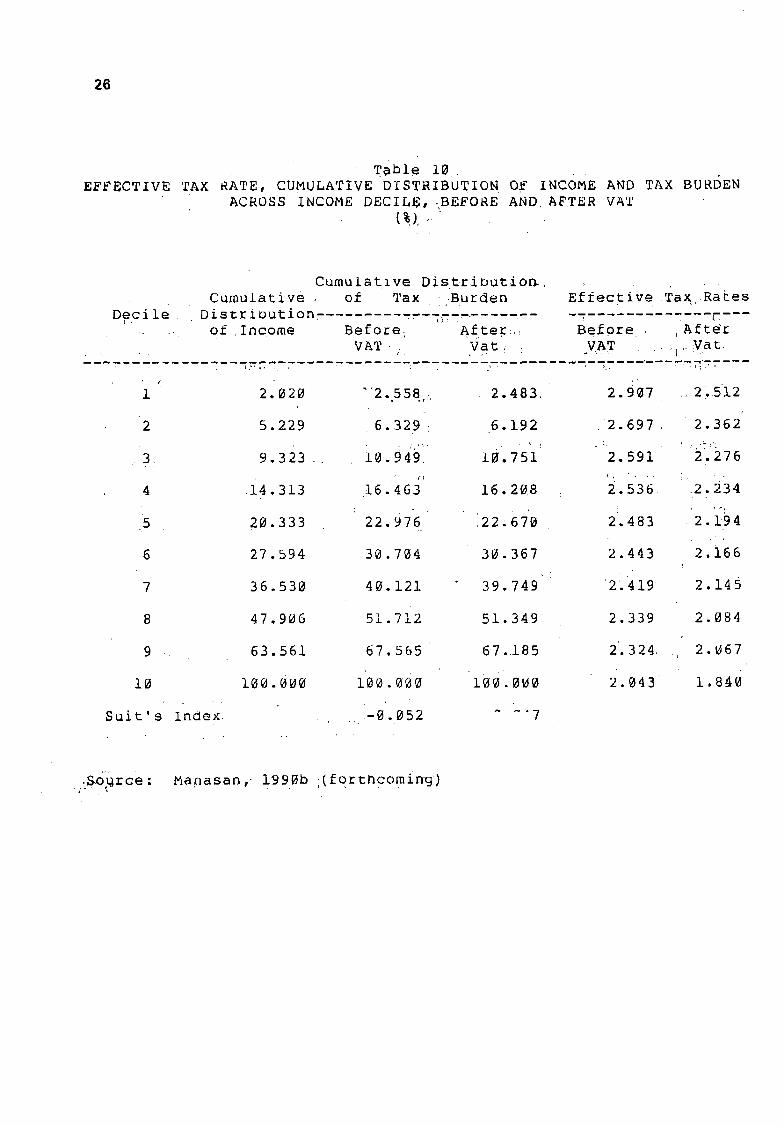
the distributional impact of the VAT, and introduction of excisetaxes on non-essentials are shown in Table 10. Suit's index' of
progressivity has increased marginally from -0.052 to -0.047.This implies that the VAT system is slightly more progressivethan the system it replaced.
5. Excise Taxes
Before 1986, excise taxes on alcoholic, tobacco andpetroleum products were levied in the form of unit taxes based on
volume of production combined with an ad valorem component. The
Tax Reform Package completely eliminated the unit tax such that
now these excises are on an ad valorem basis only.
_", Yoingco (1986) showed that the 'effective tax rates ontobacco and alcoholic products 'are essentially unchanged by / thereform. This implies that the changes introduced in the excise
.tax_'_on_alcoholic. and ,tbbacco_products.,would have a_:neutral impact.
on_,_ the distribution of after-tax,, .inc°me'_,_, _ __14/_;:_What the reformmeasure has achieved is to introduce an elemen_ of " automatfci£y _
in the revenue response of these taxes with respect to changes ineconomic activity. A comparison of the rate of growth of excise
taxes relative to GNP shows that in 1986-1988, the rate of growthof the sum total of all excise taxes have, in fact, outpaced GNP
.-!A4/This statement does not imply that excise taxes on these
two products are not regressive but rather it avers that the new
taxes are not any more regressive than what they used to be.
2B
Table10EFFECTIVE TAX RATE, CUMULATIVE DISTRIBUTION OF INCOME AND TAX BURDEN
ACROSS INCOME DECILE,-BEFORE AND AFTER VAT
Cumulatlve Dis tr_ioution,
Cumulative , of Tax .Burden Effective _Ta_ Rates
Decil Distribution. -r---B._ of ,Income Before_ -After:, efore _After
VAT. Vat_ : VAT , :Vat
1 2.020 2.558F, 2.483 2.907 _,,21.512
2 5.229 6.329 i 6.1.92 2.697 2.362
3 9.323 10.949 10.751 2.591 2.276
4 i4 313 16. _• . • 63 16.2_8 2.536 ,2.234! r,-!
5 20.333 22.976 22.678 2.483 2.194
6 27.594 30.704 30.367 2.443 2.166
7 36.530 40.121 39.749 2_419 2.145
8 47.986 51.712 51.349 2.339 2.084
9 63.561 67.565 67..185 2.324 _ 2.H67
10 100.0_0 100._0 100.0_ 2._43 1.8_
Suit's Index• •-0.052 _ _'7
.S,01grce: Manasan, 1990b i(forthcoming);'' . . .
27
despite the reduction in the excises on petroleum products and a
constant rate structure for the other excises since 1986 (AnnexTable 5).
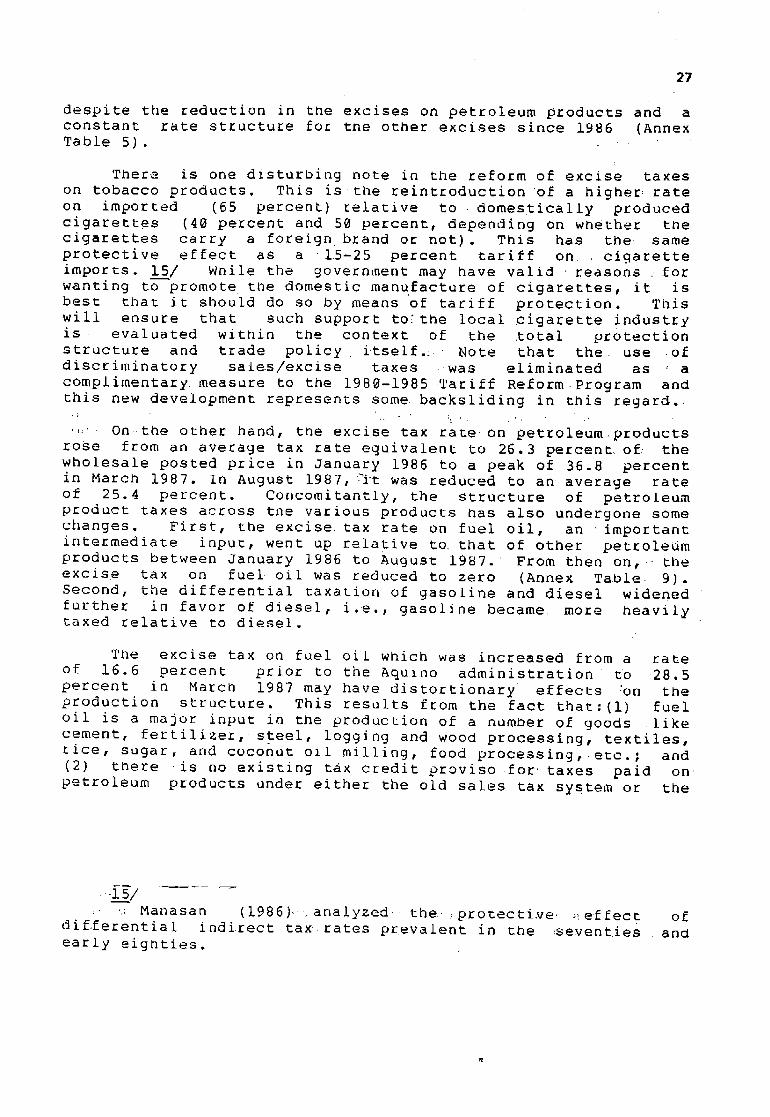
There is one disturbing note in the reform of excise taxes
on tobacco products. This is the reintroduction of a higher rate
on imported (65 percent) relative to domestically produced
cigarettes (40 percent and 50 percent, depending on whether thecigarettes carry a foreign brand or not). This has the same
protective effect as a L5-25 percent tariff on cigaretteimports. 15/ While the government may nave valid reasons for
wanting to promote the domestic manufacture of cigarettes, it is
best that it should do so by means of tariff protection. This
will ensure that such support to, the local cigarette industry
is evaluated wlthin the context of the total protectionstructure and trade policy itself._ Note that the use of
discriminatory sales/excise taxes was eliminated as a
complimentary measure to the 1980-1985 Tariff Reform Program and
this new development represents some backsliding in this regard.
_ On-the other hand, the excise tax _ rate on petroleum products
rose from an average tax rate equivalent to 26.3 percent of the
wholesale posted price in January 1986 to a peak of 36.8 percent
in March 1987. In August 1987, _Tt was reduced to an average rateof 25.4 percent. Concomitantly, the structure of petroleum
product taxes across tne various products _as also undergone some
changes. First, the excise tax rate on fuel oil, an important
intermediate input, went up relative to that of other petroleumproducts between January 1986 to August 1987. ' From then on, the
excise tax on fuel oil was reduced to zero (Annex Table 9).Second, the differential taxation of gasoline and diesel widened
further in favor of diesel, i.e., gasoline became more heavilytaxed relative to diesel.
T_e excise tax on fuel oil which was increased from a rate
of 16.6 percent prior to the Aquino administration tlo 28.5
percent in March 1987 may have distortionary effects :on the
production structure. This results from the fact that:(1) fuel
oil is a major input in the production of a numDer of goods like
cement, fertilizer, steel, logging and wood processing, textiles,
rice, sugar, and coconut oil milling, food processing, etc.; and
(2) there is no existing tax credit proviso for , taxes paid on
petroleum products under either the old sales tax system or t_e
15/
: _ Manasan (1986)_ analyzed the _protective _effect of
difZerential indirect tax rates prevalent in the seventies andearly eighties.

28
present value'added tax. 16___/ Followlng=tne approach used in theestimation of'the effectlve:tax rates on sectoral consumption f,in
the preceding sup-section, the ETRs on the consumption_ ofdifferent commodities and services as well as the implied
taxation of inputs arising from :tne taxation of fuel oil. wereestimated. Annex_TaDle 10 snows that the (E-T) estimates range
from 0.3 percent to 10.8 percent. This wide variability in the
(E-T) estimates is indicative of the production dlstortions
introduced Oy the taxation of_fuel oil. This nighlignts the
positive impact of the elimination of the excise tax on fuel oil
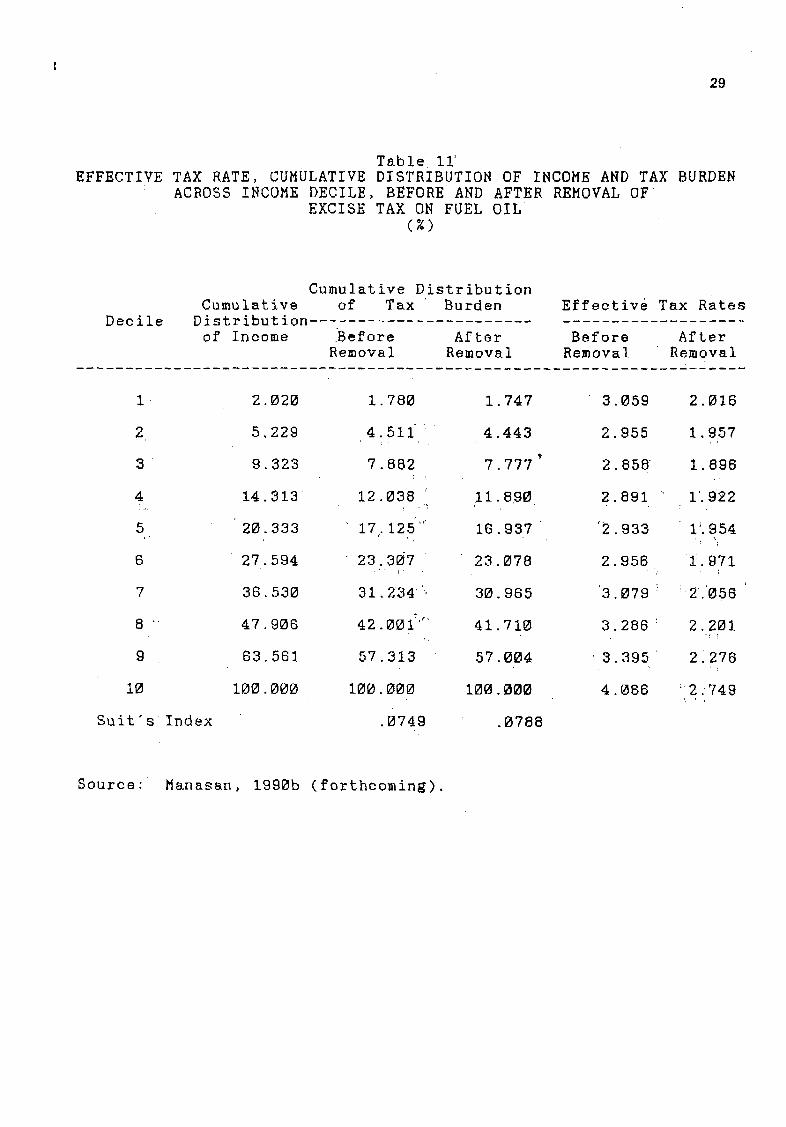
in August 1987. On the other hand, estimates of the Suit's index
of progressivity suggest that the changes in the taxation of
petroleum products under the Aquino government are, in fact,
slightly progressive (Table ll). 17/ Finally, it is worth notingthat the increase in the average tax _ on petroleum products
between January 1986 and March 1987 exacerbated the Philippines'
tendency to price petroleum products nigher than its Asian
neighbors in the first half of=_the eighties (Habito and _ Intal1987'). The reduction in the average tax on petroleum products in
August 1987 effectively brought it Pack to its pre-Aquino
government level which is still_ higher than that of the _otherAsian,countries.!r'
6. Export Taxes
The export tax is an ad valorem tax levied:: on the gross
f.o.b, value of certain exports. :_Prior to the'formulatlon of the
1986,:Tax Reform _ Package, exports of logs were_ taxed at !2_
percent, copra at 15 percen_ coconut 0il at nine percent, _coprameal/caKe and desiccated coconut at eight percent, abaca,lumber
and veneer, _ and pineapple and pi_neapple 3uice at _four percent;
and banana at two percent. "° ..........
Under the old sales tax system, taxes on petroleum
products are not creditable against the sales tax on the output
because petroleum.products do not physically form part of the end
product. On the other hand, under £he value added system that iscurrently in place, taxes on petroleum products are not _ credit-
able against output taxes because petroleum products are exemptedfrom the VAT,
1_/7/T_is ' oPservation abstracts from the increase in the tax
on fuel oil in the first one-and-a-half years of the Aquino
administration. A more accurate description of the
distributional impact of the modifications in the petroleum
product taxes would show that there has been a deterloration in
the progressivity of these taxes from the start of the presen_
administration up to August 1987_ _:From tnen Oh, there is _ some
improvement in the same.O
29
Table ll_EFFECTIVE TAX RATE, CUMULATIVE DISTRIBUTION OF INCOME AND TAX BURDEN
ACROSS INCOME DECILE, BEFORE AND AFTER REMOVAL OFEXCISE TAX ON FUEL OIL
(%)
Cumulative DistributionCumulative of Tax Burden Effective Tax Rates
Decile Distribution ...........of Income Before After Before After
Removal Removal Removal Removal
1 2.020 1.780 1.747 3 059 2.016
2 5.229 4.511-" 4.443 2 955 1.9.57
3 9. 323 7.882 7. 777 2 858" 1.896
4 14.313 12.038 _ 11.890 2 891 I'.922
5 20.333 17. 125 "'_" 16 937 2.933 1_954, I , _ "II
6 27.594 23.3_7 23 078 2 956 i.971,I F II
7 36. 530 31.234"". 30 985 3 079 2'.058
8 47.906 42.00i' .... 41 710 3.286 2.201
9 63.581 57. 313 57 004 3. 395 2 278' i
IZ 100. 000 100.000 100 00_ 4.(_86 2.749
Suit's Index .0749 .0788
Source: Manasan, 1990b (forthcoming).
3Q
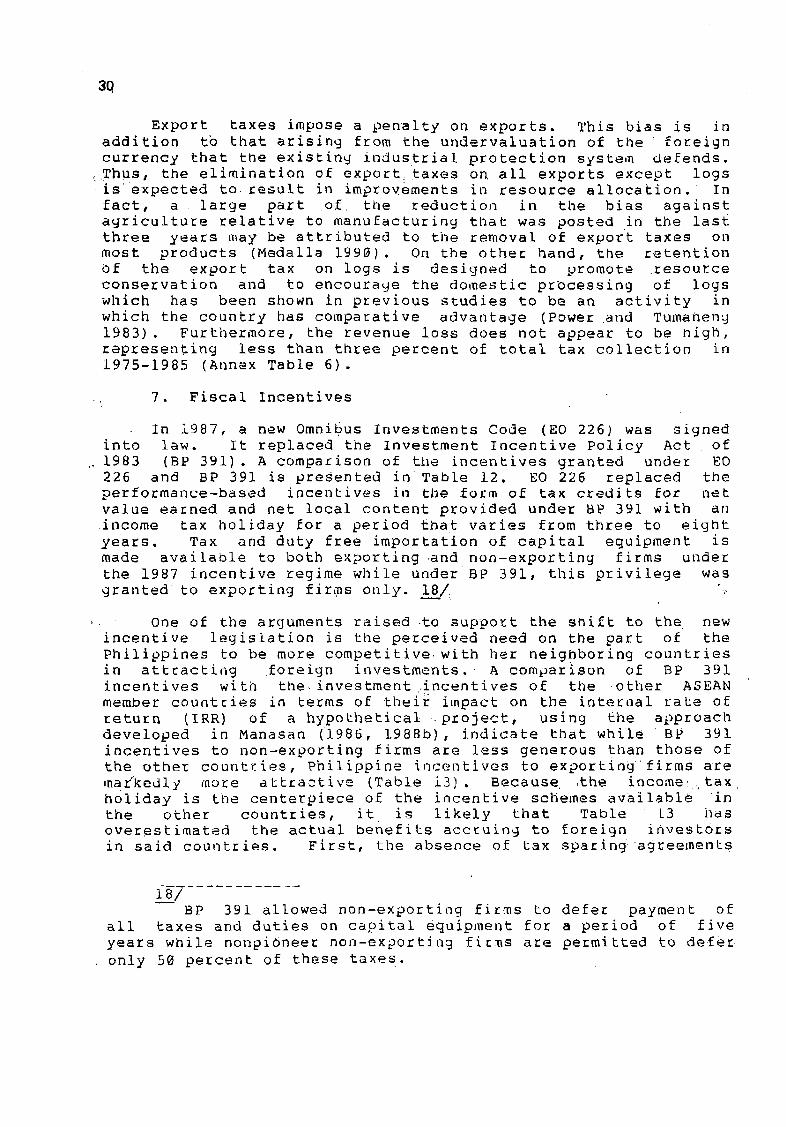
Export taxes impose a penalty on exports. This bias is inaddition to that arising from the undervaluation of t_]e : _oreign
currency that the existing industrial protection system defends.
<Thus, the elimination of export_taxes on all exports except logsis expected to result in improvements in resource allocation. In
fact, a large part of t_e reduction in the bias against
agriculture relative to manufacturing tl%at was posted in the last
three years may be attributed to the removal of export taxes on
most products (Medalla 1990). On the other hand, the retention
Of the export tax on logs is designed to promote resource
conservation and to encourage the domestic processing of logs
which has been shown in previous studies to be an activity in
which the country has comparative advat]tage (Power and Tumaneng
1983). Furthermore, the revenue loss does not appear to be nigh,
representing less than three percent of total tax collection in
1975-1985 (Annex Table 6).
7. Fiscal Incentives
In 1987, a new OmniSus Investments Code (EO 226) was signed
into law. It replaced the Investment Incentive Policy Act of
..1983 (BP 391). A comparison of the incentives granted under EO
226 and BP 391 is presented in Table 12. EO 226 replaced theperformance-based incentives in tl_e form of tax credits for net
value earned and net local content provided under BP 391 with an
income tax holiday for a period _hat varies from three to eight
years. Tax and duty free importation of capital equipment is
made available to both exporting and non-exporting firms under
the 1987 incentive regime while under BP 391, this privilege was
granted to exporting firms only..18/ "
, One of the arguments raised _to support the shift to the new
incentive legislation is the perceived need on the part of the
Philippines to be more competitive with her neighboring countries
in attracting foreign investments. A comparison of BP 391incentives with the investment _incentives of the other ASEAN
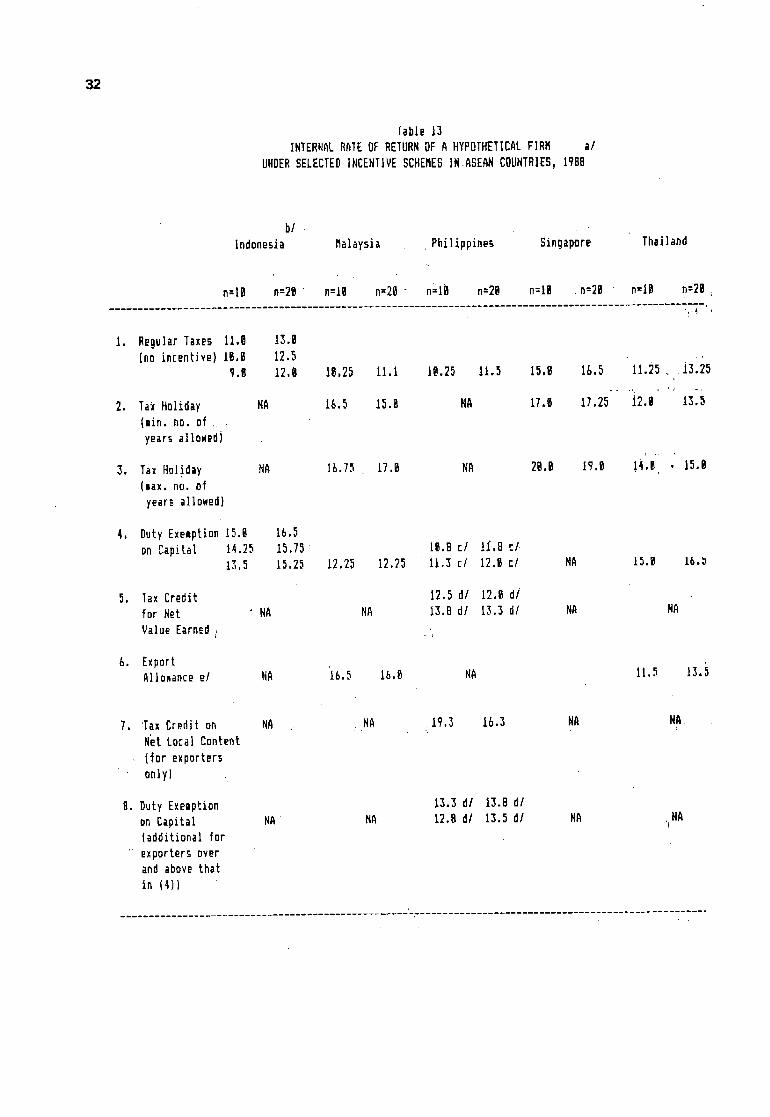
member countries in terms of their impact on the internal rate of
return (IRR) of a hypothetical _ project, using the approachdeveloped in Manasan (1986, 1988b), indicate that whfle BP 391
incentives to non-exporting firms are less generous than those of
the other countries, Philippine i,_centives to exporting firms are
,nar'kedly more attractive (Table i3) . Because .the income_ taxholiday is the centerpiece of the incentive schemes available in
the other countries, it is likely that Table L3 has
overestimated the actual benefits accruing to foreign investors
in said countries. First, the absence of tax sparing agreements
BP 391 allowed non-exporting firms to defer payment of
all taxes and duties on capital equipment for a period of five
years while nonpi0neer non-exporting firms are permitted to defer
only 50 percent of these taxes.

Table i2 31COMPARISONOF INCENTIVESUNDERBP3?IANDE0226
BP391 EO226
entire OoaesLic Export ,Domestic ExportProducer Producer Producer Producer
Pioneer Non-Pioneer Pioneer Non-Pioneer Pioneer Non-Pioneer Pioneer Non-Pioneer
. Exemption!tom duties L_8_ _eeZ r lee_ _eez le_z _eez
and taxe_ on importedcapital equipment
• Defermentof duties 1BgX 5gX N/A N/A N/_ N/A N/A N/A
andtaxes on impor!edcapita] eqbipeent, Lobe repaid within 5 year5
r( _ ;
Tax credit on domestic IBSX IBBX 188_ iU_ I_B_ IBm%
capital equipment
equivalent to dutiesand taxes on'_imil_r_oreign equipment
Tax credit on domestic I_X Je_% N/A N/_ N/A N/A NiP Ni_capital equipmentto ,,
• be repaid within 5 years
Tax credit on net value IB$ SX 1_ 5% N/A N/R N/_ N/Aearned for five. years
Tax credit on net IB_ IB% Nth N/A NiA N/Alocal content for
five_ears
Tax holiday N/A NIA N/A N/A 6-8years 4-7year_ _-8years 4-7years
ope at o V'e* Yes' Yes No'" ,N.,:_ ."9,: ,oloss carry over
b/ _''b/ .... b/ blDeduction_roe Ho No No. No Yes Yes Yes Yestaxable incomeof 5_of incremental labor
expensefor 5:'years
Theseare applicable to nee projects. Expandingfirms are eniitled to _ year tax holiday._istin_ fires are not enLitled to the Laxholidayat All.
Redundantforfirm_enjoyingtaxholiday.Z
:ce: Hanasan, 198% (unpuOii_hed).
32
Table13
INTERRALRATEOF RETURNOF A HYPOTHETICALFIRM a/
UHDERSELECTEDINCENTIVESCHEMEBINASEANCDUNTRIES,1988
bi
Indonesia Malaysia ,Philippines SinQapore ThaJ]and
n--IB n=2B" n=lB n=2B- n_-lB n:2B n=lg . n=2B n=lB n'2{{ .
I. RegularTaxes ll.g 13.8
[no incentive) 18.B 12.99.8 12,g 18.25 11,1 18,25 11,5 15,8 lb.5 il.25 , i3.25
2. TaxHoliday HA 16.5 15.8 NA 17.8 17.25 12.8 13.5(min.no.of
yearsallowed)
_, ,-.
3. TaxHoliday HA 1b.75 17,B HA 28.8 19.8 J4.B • 15.B(max.no.of
year_allowed]
4, DutyExemption15.g 1b.5
on Capital 14.25 15.7_ I_.Bc/ I_.8cl13.5 15.2S 12.25 12.25 11.3El 12.@cl NA 15.B I_._
5. TaxCredit 12.5d/ 12.@di
forNet NA NA 13.Bdl 13.3dl HA NA
ValueEarned,
&. ExportAiIoNancee/ NA '16.5 I6,B HA II,5 13,5
7. Tax Crediton NA NA 19.3 16.3 NA NAr , •
NetLoca]Content
(for exportersonly)
B. DutyExemption 13._d/ 13.8dl
onCapital NA HA 12.8dl 13.5dl NA .(HA(additionalfor
exporter_overandabovethat
in (4))

33
Table13 (toni'd}
DI
Indonesia Malaysia Philippines Singapore _ Thailand
n=IB n:2D n=Ig n:28 n=10 n=20 , n:lll, n--21 n:18 n=28
9. All Incentives 15.8 16,5{for non- 14.25 15.75
exporters - 13.5 15.25 19.35 17.35 14.8 13.3 17.8 17.25 16.5 17.8, nin.allowed)
16._AIIIncentives,15.9 _,.5
(for non- 14.25 15.75 :exporters , 13.5 15.25 28.6 19,25 15,8 ;( I4.B 28,8: l?.B 19.9 18.5max, allowed)
'i1,All IncenLives.15,B 16,5
(for exporters 14.25 15.75 ,Din. allowed) 13.3 13.25 29.6 19.5 26.8 20.3 17,8 17.25 17.9 17.5
i2',:All Incentives 15,8 lb,5
(for non- 14.25 15.75exporters 13.5 15.25 20.8 26,9 27,3 28.5 26,8 19.D 17.5 1%8max.allowed)
MemoItem
tariff on
capital , ,,
equipment 8.25 0.12 _.2 D B.2corporateLaxD.151_.2518._59,4+6.85 B.35 6.3_ |._5rate
a!For the Philippinest Weu_edBP391 iocentives to find out howit compareswith those of
other_SEANcountries,TheassumedincomesLreamUsedin these ,calculationsis thatwhichyieldsas beforetax IRRo_.,2|,:,b/
For corporate tax rate of ,15j 25, 35%_ i:respectively. /E/ ,.
First figurerefers to non exporting non pioneer f!ri_ _hile thesecondrefers to non exporting pioneer_fiFms.:::
d!
First figure refers to non pioneer, firms while the.second,refers,:to pioneerfirms.
e/i_For 166XexporLHrm.
34
between the ASEAN countrles_.i_._-or capital exporting countrieslike the United States, Japan _d the OECD, that tax income on a
global basis, negates the potential benefit to the" _indiv'fddal
investor, of the _income. tax.holiday. Second, .for .firms that incur
losses in the early years of their operations, the income tax
holiday, may not be as valuable an incentive:_as our colnputationssi]ow _ slnce oor_'_i]ypotheticai firm_'_s_issumed_"_h_6 be uniformly
profitable over .--i.ts life. span.. Thus, contrary to official
PrOnouncements, the set of inceutives granted by BP 391 is likelyto be as-generous as t]lat of:!£he Other _SEAN cou,_hries.
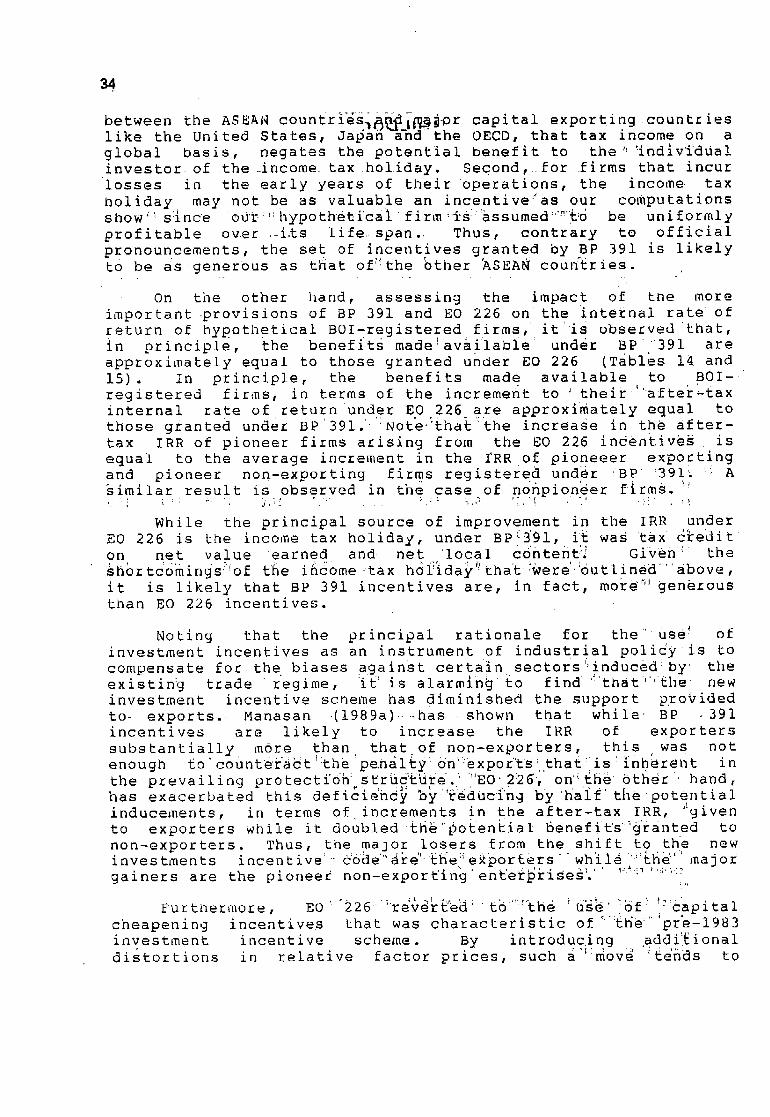
On the other hand, assess ing the ilnpac t of the moreimportant provisions of BP 391 and EO 226 on the internal rate of
return of hypothetical BOI-registered firms, it is observed that,in principle, the benefiti made!avaiiabie ; under BP' 391 are
approximately equal to those granted under EO 226 (Tables 14 and
15). In principle, the benefits made available to BOI-
registered firms, in terms of the increment to _ thelr '"afterL£axinternal rate of return under EO 226 are approximately equal to
those granted under BP'391._'_Note_that':the increase in the after-
tax IRR of pioneer firms arising from the EO 226 in6entives is
equal to the average increment in the rRR of pioneeer exporting
and pioneer non-exporting firms registered under :BP _391". _: Asimilar result is observed in the case of nonpion_er firms. _!,' :: " :: ,_. ": 'j,:_ _ :" . . :_:_ :_:,_' '.:,'_ ,:,l_ -_[ _!
While the principal source of improvement in the IRR under
EO 226 is the income tax holiday, under BP_91, it was 'tax_ 6_editon net value earned and. net local content"."'_ Gfven _:I the
shor tcomings:iof the income-tax ho '_' _ ' "...... llday.that-i#ere';6utlined _ above,
it is likely that BP 391 incentives are, in fact, more '_jgenerousthan EO 226 incentives.
Noting that the principal rationale for the" Use ! ofinvestment incentives as an instrument of industrial policy_is to
compensate for the biases against certain sectors"iinduced_by ' the"_ _'t "existin:g trade regime, :it' is alarmzng to find: hat"'"Ehe new
investment incentive scheme has diminished the support progided
to-exports.- Manasan- .(198.9a)....has-. show|] that while- BP. .391incentives are likely to increase the IRR of exporters
substantially more than that of non-exporters, this was not
enough £o'c0unt_r"act_:the'pe.nalt_ 6n_:expor"ts_.that:is_inh_rel_t in
the prevailing protectf0n: s£rhd_£_re.: :'EO226 , on'_£he 'other, hand,
has exacerbated this deficiency ny-reduclng by'ha"if the potential
inducements, in terms of increments i.n the after-tax IRR, "_given
to exporters while it doubled:th_"potential 5enefit's"glrlnted to
non-exporters Thus, the ma3or losers from the shift to the newinvestments incentiveS ¢:0de"'ire'_:£_e:_ekpor:£ers_wh'ile"!_£he__ major
gainers are the pioneer non-expor_ihg_en_e_r'ise '_'_s." _'_:" _':;'"':_
Furthermore, EO 226 re_erted _£0_'_:_th4 __' :of _ _:tgpitalcheapening incentives that was characteristic of <':£He_ 'pre-1983
investment incentive scheme. By introducing .add i_£ionaldistortions in relative factor prices, such i":iov_ _tends to


36
Table 15CHANGE IN _THE INTERNAL RATE OF RETURN OF HYPOTHETICAL
BOI REGISTERED FIRMS UNDER EO 226 a/_(In Percentage Points) :_
N0n-Pioneer i_Pioneer
n=lO n=20 , n=lO n=20
I. Tax holiday 2.5 1.75 3.5 2.5
without extension '
2. Tax holiday 3.75 2.75 4.0 3.0with maximumextension
3. Duty Exemption 3.5 2.5 3.5 2.5on Capital b/
4. 1+3 7.25 4.9 8.25 5.75
5. 2+3 8.75 6.0 9.0 6.5
a/Change _n iRR is comPuted relative to IRRo = 10%.
b/Computed based on t .=.2 and VAT, 'where t is tariff
k _ k
_ on capital equipment.
Source: Mana§an, 1989a (unpublished).
7_ -:"......
...._

37
result in a sub-optimal relative factor ratio in production. The
impact of this change on relative factor prices and consequently,on relative factor use may be appraised by looking at its effect
on the user cost of capital. Manasan (1986) showed that the user
cost of capital is reduced by 7.8 to 23.7 percent _ under BP 391
incentives while the decline in the_:user cost of capital due to
EO 226 incentive was estimated (Manasan 1988b) to vary from 26.2to 35.5 percent. Thus, EO 226 incentives have resulted in a
lower user cost of capital relative to BP 391 incentives implying
that the former tends to be more bias in favor of Capital use
relative to the latter. Data on the capital-labor ratio of BOI-
registered firms from 1981-1988 confirm this expectation (Table
16). The capital-labor ratio of firms registered with the BOiafter the enactment of EO 226 is almost double that of firms
_egistered under :the previous incentive legislation.
tY'8. Tax on Real Proper
The real property tax is an ad valorem tax based on the
assessed value of real property including land, buildings,
machinery and other improvements. The assessed value is computedas the product of the market value and the assessment levels,i.e., the percentage applied to market value to determine the
taxable value of the real property. The assessment levels vary
from 30 to 4_ percent for land, from 60 to 70 percent for
machinery, and from 15 to 8H percent for buildings depending On
the "actual use" of the property, e.g., for lands, residential,
commercial, agricultural , etc. The tax rate is set by the
provincial board or city council at a rate anywhere between 0.5to 2.0 percent.
The 1986 Tax Reform Package called for the general revisionin the taxable values of real property based on the 1981-1984
market value in 1986 but this provision was suspended until July1987 due to political pressures. Note that while the Real _
Property Tax Code provides that such a general revision be
undertaken once every three years, such a move was also suspendedby the Marcos government in 1984.
The real property tax accounts for more than 50 percent of
the_ total revenues collected by loc_l governments. No_tingtheu rgeht need for finances by local governments under a real
decentralization scheme it then becomes apparent that a thoroughreview of the real property tax is imperative. First, the
tendency to postpone the general revision of property values
mandated under the existing law should be avoided as it engendersthe use of outdated taxable values. Second, the adherence to the
"actual use" as the basis of the taxable values tends to retard
the socially optimal shift to alternative uses (Paderanga 1984).Third, the differential _ates that are currently" imposed onvarious forms of real property and improvements also tend to be
bias against buildings and machinery relative to land and may not
be a desirable arrangement from the resource allocation point of

38
•Table ,16SELECTED STATISTICS'ON NEW AND EXPANSION PROJECTS
APPROVED BY,THE BOI (WITH INCENTIVES)(In Thousan_ Pesos)
(1981-1988)
Project a/ Project b/ c/No. of Cost Employ- K/L Cost _ K/L _
Year Firms (nominal) merit ' (nominal) (real) (real) _
(1) (2) (3) _ (4) _(5) • (6) _
1981 193 11364366 53110. 213.98 11364.366 213.981982 143 14497342 28274 ' 512.74 ,13371779 472.941983 "143 7437044 27980 '265.80 '6142534 219:531984 : 121:7203588 37830',""190.42 3970816 104,961985' 136 2742089 23961 t 114.44 '1278566 53.36
1986 114 2191961 '_" 26201', 83.66 '1005223 :38_37
1987 .
BP 391 230 5369942 48782 110.08 2283490 46.81EO 226 181 44,74199 33319 134.28 1902588 57:10
1988 616 28720161 128052 224.29 11187537 87_37
a/col (20 : col (3).
b/Deflated by GNP deflator (1981=100).
c/col (5) / col (3).
Source:" Department of Trade and Industry
3g •
view. Fourth, a nationwide tax mapping activity should alsoprovide more accurate information on the characteristics of
individual properties and constitute a necessary input in thereform of t_e present property values (World Bank 1988). Fifth,
the valuation system that is currently in place allows theindividual assessor a great deal of discretion in determining the ,
market Value of real property for tax purposes and provides a lot _
of opportunity for graft and corruption. Sixth, the real
property tax is subject to a high delinquency rate; hence, an
improved tax administration would go a long way in increasing the
revenue yields of the tax. Finally, given the uneven
distribution of wealth in the country, a more efficient real
property tax system would also greatly enhance the
redistributional characteristics of the tax regime.
IV. GOVERNMENT EXPENDITURE_POLICY
The Medium Term Development Planstates that the fiscal
sector shall address, among others, the following objectives:_
"(i) to increase the flow of budgetary resources_ to _activitiessupportive of employment generating rural-based activities and to'
social services; and (2) to improve the cost effectiveness of
government operations." Against this backdrop, the distribution
of government expenditures across sectors and across different
economic_ categories _ is reviewed. The discussion that follows
presents a macro view of the allocation of fiscal resources. No_
attempt is made to describe governmen£ expenditures, at the_
program level, much less to evaluate the economic, impact of ! the _same. .....
Total government expenditures, on an obligation basis, has
grown very rapidly during the Aquino years such that its average
rate of growth in 1986-1988 is 29.1 percent compared to the 1975-
1985 average of 16.6 percent (Table 17). Consequently, as aproportion of GNP, the government budget has increased from its _
15._ _ percent average in 1975-1985 to 21.5 percent in 1986-1988.
In fact, programmed government expenditure in 1988 is equal to
23._9 percent of GNP, its highest level _n the last 20 years(.Table 18).
These figures, however, are rather misleading indicators ofthe growth and size of the government during the period. This is
because of the explosive growth of the debt service in the
government budget. 19/ Debt service on account of both thenational government and government-owned and/or -controlled
corporations (via the net lending category) is equal to 3.5percent of GNP in 1975-1985 as against almost three times that
amount (or 9.7 percent of GNP) in 1986-1988. At present, debt
More precisely, debt service started to balloon in 1982.
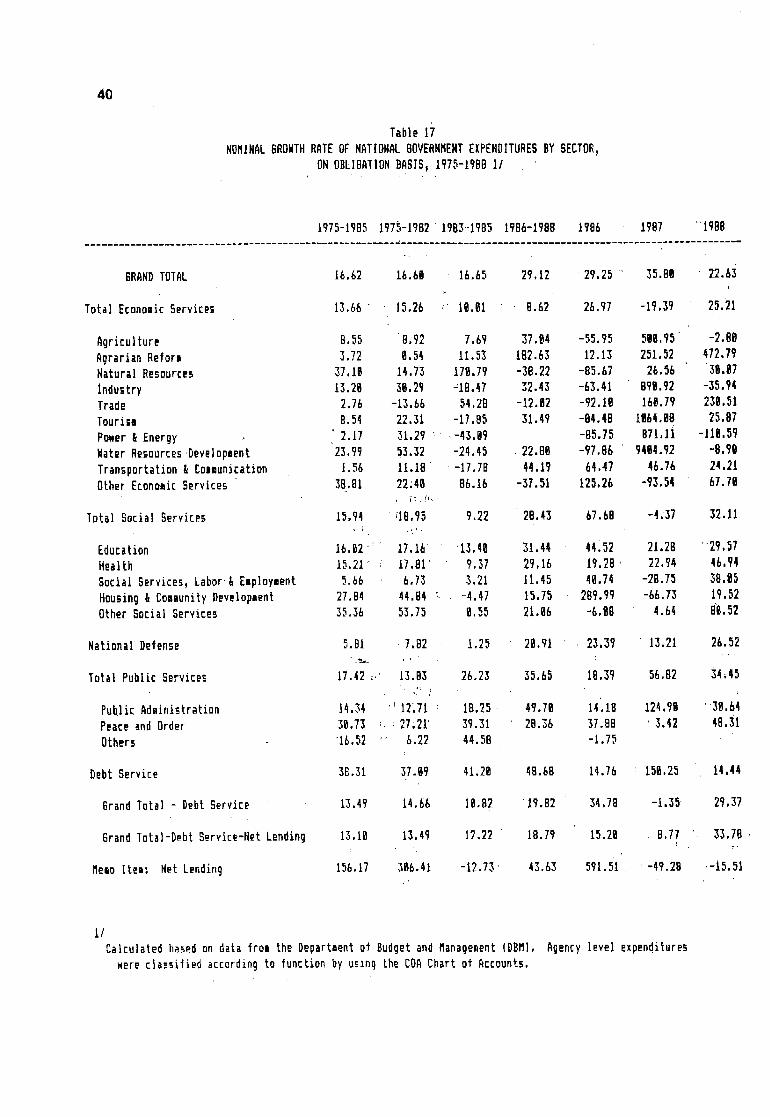
4O
Table 17
NOM]NALGRONTHRATEOFNATIONALGOVERNMENTEXPENDITURESBYSECTOR,ON-OBLIGATIONBASIS_1975-1988 1/
1975-1985 .1975-19821983'-1985 1986-1988 1986 1987 "lgBB
SRANDTOTAL 16.62 16.61 i&.65 29.12 29.25 35.88 22.63
TotalEconomicServices 13.66 15.26 IQ.61 8.62 26.97 -19,39 25.21
Agriculture 8.55 8.92 7.69 37.84 -55.95 511.95 -2.88Agrarian Reform 3.72 8.54 11.53 182.63 12.13 251,52 472.79Natural Resources 37.18 14.73 178.79 -38.22 -85.67 26.56 38.87
industry 13.28 3B.29 :18.47 32.43 -63.41 898.92 -35.94Trade 2,76 -13.66 54.2B -12.82 -92.18 160.79 230,51Tourism 8.54 22.31 -17.85 31.49 -84.48 1864.g8 25.87
Power_ Energy ,' 2.17 31,29 : -43.89 -85.75 B71,1i -118.59WaterResourcesDevelopment 23.99 53.32 -24.45 22.88 -97.86 9484.92 -8.98Transportation & Communication 1.56 11.18 -17.78 44.19 64.47 46,76 24.21Other EconomicServices 38.81 22.48 86.16 -37.51 125.26 -93,54 67.78
; _: :ft, ,
Total Social Services 15.94 _18,95 9.22 26.43 67.68 -4;37 32.11
Education 16.82 _ 17.16 13.48 31.44 44.52 21.28 ' 29.57Health 15,21" _ 17.81 9.37 29.16 19.28 22.94 46.94Social Services, Labor"&Employment 5,66 6.73 3.21 11.45 48.74 -28.75 38.95Housing& CommunityDevelopment 27.84 44.84 , -4.47 15.75 289.99 -66.73 19.52Other Social Services 35.36 53.75 8.55 21.06 -6,00 4.64 8_.52
National Defense 5.B1 7.82 1.25 28.91 23.39 13.21 26,52
Total Public Services 17.42 _ 13.83 26.23 35.65 18.39 56.82 34_45
Public Administration 14.34 _ 12_71 19.25 49.78 14,18 124,9B 38.64PeaceandOrder 38.73 ....: 27;21' 39.31 28.36 37.88 ' 3.42 48.31Others 16.52 "" 6.22 44.58 -1.75
I)ebt Service 38,31 37._9 41.28 49.68 14.76 : 15_.25 14.44
6rand Total - Debt Service 13.49 14._6 18,82 19.82 34.78 -1.35 29°37
GrandToLal-Debt Service-Net Lending 13.18 13,49 12,22 18.79 15.28 8,77 33.78 -. r.
l_emoItem: Net Lending 156.17 386.41 -12.73 43.63 591.51 L49.28 ,-15.51
1/Calculated basedon data from the Departmentof Budget andManagement(DBM), Agency level expenditures_ereclassifiedaccordingto functionbyusingtheCOAChartof_ccounts.

41
Table IB
#ATION_LGO_EBK_EKTEXPENOITURE5BY6ECTOB_ONANOBLIGATIONBASISA_A PROPORTIONOF6NP, 1975-19881/
1975-198T_1975-1982 1993-1995i 1996-1999 i996 1987 , L_a
• BRAN9TOTAL 15.92 15.61 _16.27 21.ha 18.63 22.11 23o13
Total EconozicServices 6.43 7.12 5.64 r 5"_4 b'7_ _'74 5'Bb
Agr!cu)ture D.74 9.82 9.65 _ E.B9 6.24 1;27 i.66Agrarian Before 8.BB B.IB 6.15 6.46 6.6_ B.17 B.85Natural Resources m._4 9.29 1.93 6.21 i.19 9.21 |.23Industry 9.25 9.34 B.15 6,22 6,65 B.39 6.22Trade _,|_ B._5 i._$ B.B1 B,H 6.00 B,OLTourise B.S_ D.S4 9.B2 B.B2 6.6.9 6.62 6.i2Pn,er i Energy 9.81 1.1_ 6.44 6.66 9.12 8.19 -9.i2Kater ResourcesOeve_puent S.16 B.19 B.11 0.95 6.BB B.9B 6.96Transportation _ Conunication 2.71 3.b4 1.66 2.B5 J.67 2.14 2.27Other Econolic Services B.97 9.5_ 1.48 1.51 4.56 0.25 1.36
Total Gocia] Services 3.Bl 3.26 2.72 3.79 4.10 3.42 ].66
Education 1.76 1.99 1.66 2.47 2.27 2.41 2.66Health 6.54 6.58 9.49 9,62 6.5_ 6.57 _.72
Social _ervices, Labor & Eaployeent 6.28 6.24 9.15 8.13 6.16 6.1l 6.12Housing t CoeaunityDeve)opeent 6.48 6.51 0.45 6.55 1.11 6._2 B.33OtherSocialServices 9.63 0.93 6.63 0.6_ 9.62 1.62 6,93
[
National Defense 1.67 2.B7 1.22 1.28 1.25 1.24 1.33
Total Public Services 1.8L 1.85 1.75 2.67 1.99 2.72 _.12
Public Adeinistration 1.11 I.IB 1.92 1.93 1.69 _ 2.14 2,38Peaceand Order " 6.59 _,56 B:.51 _ 9.66 B.&5 '_0.59 B,74Others 0.28 6.16 9.22 6.97 6.25 ; B,6B 6.69
_ebt Service _.61 1,_9 _.9_ 834 4.56 9,98 7175
BrandTotal - _ebt Service 12.91 14._1 11.3_ 1_.16 14.66 12.12 13._6
BrandTotal-Debt flervice-HeL Lending : 12.¢2 14.05 19.57 11.86 11.61 11.94 12.6|
_emo Item: Net Lending B.hB 9.2_ 6.7_ 1.3_ 2.45 1.69 6.76
Calculited based on data froa the Departeentof Budgetand HanageeenL(DBH)andNational StaListical CoordinationBoard(NS_B). Agencyleve] expenditures_ere classified according to function by usinu LheCOAChart of Account_.


43
+
Table 19
PERCENTABEDISTRIBUTIONOFTOTALNATIONAL6OVERNRENTEXPENDITURESBYSECTOR_ONANOBLIGATIONBh81B,I1975-19B811
J975-1985 1975"1982 1983-1985 1986-1988 " 1986 1987 1988
GRANO4OTAL 100.08 188.88 108.88 108.80 100.80 I_B.B8 IBB,_
Total EconomicServices 48.37 45.63 34.64 25.28 36,12 21.44 21.89
hgrJculture 4.64 5.22 4,88 4,15 1.38 5.76 4.56hgrarian Reform B.50 0.65 0.34 1.86 0.30 e.78 3.67
• Natural Resources 4.08 1.85 6.33 0.99 1,02 0.95 1.80
Industry _- 1.57 2.17 8.9_ 1,85 8.24 1.78 0.93Trade 0.27 0.32 B.21 0.B] 0.81 B.02 0.86Tourism' [.19 0.27 B.IB 0.B8 0.Bi 0.10 e.IB
Power& Energy 5.07 7,22 2.73 8.29 D.12 B.86 -B,B7Water ResourcesOevelopment 8.98 1.24 [.69 _.23 0;81 ., a.36 , 8.27Transportation _ Communication 17.84 23.31 1_.21 9.55 8,96 9+68 9.8JOtherEconomicServices _.11 3,37 9.1_ 7.04 24+15 1_15 1.57
To:tEi _oc]al Services' 18.98 28:91 16.71 17.6_ 22.08 15.49 16.69
Education 11.07 12,20 9.85 11.46 i2.19 l_.Bfl:! 11.50Health " 3.39 3.72 3.83 2.86 2.86 2.58 3.1!8ocia]Sefvjce_,Labor_ Employment 1.24 1.52 0.93 "-6.59 + 8,88 _.46 1.52Housing & CommunityDevelopment 3o83 3.29 2.74 ' 2,55' 5.94 - 1645 1.42Other Social Service_ '+ B.17 0,18 8.16 B.13 0.13 8;[_ _.[5
National Defense 10.51 13,26 7.52 5.94 6.71 5.59 _; 5.77
Total Public Services 11o35 i187 10.78 12.40 18.67 12.32 13,51'
PublicAdministration 6.95 7.56 6.29 8.98 5.84 9,67 10.30Peaceand Order 3.17 3,19 3.15 3.89 3.48 2.65 3,21Others , 1.25 1.12 1.35 0.34 1.35 , :
DebtService 18.88 B.34 "38.34 38.78 24.51 45.16 , 42.14
6randTotaI-DebtService 81,12 91.66 69.b6 b1.22 _ 75.49 54.84+ 57.86
8rand Total-Debt Service-Net Lendinq 78.01 89.97 _4._? 54.89 b2.34 49.93 54.47
HemoItem: NetLending 3.11 1.69 4.67 6.3_ 13.1b 4.91 3.39
II
CalculatedbasedondatafromtheDepartmentofBudgetand_anagement(DBM)andNationalStatisticalCoordination
Board(NSCBI.Agency•level expenditureswereclassifiedaccordingto functionby usingtheCOAChartof Accounts.

44
Table 28LEVELSOFNATIONALGOVERNMENTEXPEHDITURESBYSECTOR
ONANOBLIGATIONANDREALPERCAPITABASIS, 1975-198811
%.1975 1979:; 1981 , 1985 1986 1987 19BB
GRAMSTOTAL 268.86 282.66 3g6.84 2]9.23 297,76 365.4g ]98.88
Total EconoaicServices 127.83 128.64 148,58 87,97 1g7.54 78.35 97,31
Agriculture ' 21.82 7,05 14.52 %13 3,87 21.93 lB.19
.Agrarian Refora 3.93 2.85 1.T5 8,84 , 8.98 2.87 14.52Natural Resources 4,BB 5,44 S.4b 21.92 3.92 3.4b 4.gDIndustry 3.12 2.38 15.81 2.86 8.73 b.5g 3.71lrade 1.73 1.52 8.28 8.43 9.83 B.98 9.23TourisJ 9.54 1.33 9.b9 g.23 8,83 9,37 9.4|
Po_er & Energy 11.86 25,32 19.79 2.62 g,]b 3,J5 -8.38Mater ResourcesDevelopment _,45 3.57 5.57 8.74 9.92 1.31 I.g6Transportation & Communication 75.47 74,42 69,26: 1&,84 2_,67 _5,38 39.11Other EconoaicServices _.53 5.57 16.&5 33.15 71.96 4,28 6.27
: Total Social Services 48,32 63.2_ _7.86 48.56 &5.48 5b,b8 bb.55
Education 39,87 34.38 37.87 2b.g8 ]b.2B 39.77 45.87Health 9,39 1B.43 ii.11 7._ 8.56 9,45 12.35
Social Services, Labor _ Ezployaent 5.83 4.29 4.47 1.94 2,b2' 1.69 : 2,98Housing& CommunityDevelopment 2,11 '13,99 12.84 4.71 17,b8 5,]2 5.65,-Other Social Services 8,11 9.35 R.77 9,44 8.39 9.37 8.68
National Defense 49.97 ]b,7b 29,71 Ib.B8 19.96 29.43 23.69
Total Publir Services 29,2b 37.85 48.b2_ 27.67 _l.7b 45.82 ,5].67 :
Public Administration 21.b4 22.b8 27.26 15.81 17.38 35,34 : 41.89PeaceandOrder 2,89 11.58 11,43 7.81 19,3b 9.b9 12,79Others 4,8i l ; 12.b9 1_98 4.25 4.92 0.88 9.98
Debt Service _ 13._9 _1b,97 20.88 bb.g] 72,9b 165,81 168.67
GrandTotal-Debt Service-Net Lending 255,]8 261.92 281,79 167.32 185.58, 1182,44 217.23
Ca]cu]ated basedon data _rna theDepartmentof Bu_et and_anagezent(DBM)and National StatisticalCoordinationBoard(NSC8). Agencylevel expenditureswere classified accoFdingLo functionby usingthe COAChartof Accounts, I"
45
that if one looks at the total budget inclusive of debt _ serVice_
the proportional share of all sectors_except debt 'service_' and
general public administration contracted, with the economicsectors suffering deeper cuts than _tne ' social sectors _ (Table ,'
19). _When expressed in terms of GNP/_similar trends_are 'observed
with ._regards to government expenditures_'_on the _social sectors
Vis-a-vis the economic sectors. Government outlays on:the social
sectors' rose to 3_8 pertent._of_GNP_(4.2 percent with agrarian
reform); in 1986-1988, up from the: '1975-1985 average of 3°0
percent (.3.1 percent with agrarian ireform). On the other hand, _
expenditures on the economic sectors dropped from 6.4 percent of
GNP (6.3 percent net of agrarian reform) in 1975-1985 to 5.4
percent (5.8 percent net of agrarian_reform) in 1986-1988 _(Table
18).
Education expenditures, in nominal, realand real per capita
terms, exhibited a well defined upward trend during the Aquino
years. During these years, its average annual nominal _'rate of
growth is almost twice that in 1975-1985. in real per Capita
terms, it has grown by 20.7 percent annually in the latek period_
Compare this with the 2.9 percent average rate of increase in
1975-1983 and the -11.7 percent growth in 1983-1985. As a
result, by 1987, per capita government expenditures in education
has recovered from the sharp decline during the crisis years to
yield the highest level attained in the last 15 years (Table
20).
Furthermore, education's share in the total budget has
increased to 11.5 percent in 1988 from the 9.9 percent average in
1983-1985 making itthe single most importantsectoroutside of
debt service in terms of budgetary allocation (Table 19).
Needless to say, if one looks at the sector's'share relative' to
the_ total budget net of debt service, then the picture looks even
better with education's share in 1988 reaching 19.9 percent fromthe_13i7 percent average in 1975-1985,/i(Anne× Tablef,ll)._ ....:
_ :Expressed as a proportion of_G P_government expenditures on
education :am0unted to_2.7[percent_in 1988_as, against_othe-'_li_8
_percent_ average in the Marcos years; : iThus, this is one example
where_the government has'put its money where its,mouth_is. This
development is definitely in line_wi:th official_policy_statementsand_the _constitutional provision?i_iOn_the other_ hand, 'this ,share
is ''_still slightly smaller than ithe allocation received by theeducation sector in the other Asian countries. For instance,
government education outlays in Thailand was 4.0 percent of GNPin 1975-1985.
The health sector is one.of:the professed priority areas of
the. present administration. In 1986-1988, the growth rate:_ of '
expenditures _ on the health sector was 29.2 percent,_,_justaboutequal _to that of the average sector; Thus, there_is an almost
imperceptible upward movement in _health expenditures in terms of
GNP (8_6 perCent in 1986-1988 versus 0.5 percen_ in 1975-1985) or

4BI
in terms of real per capita levels (_12.35 in 1988 against _12.00
in 1982 (Tables 18 and 20). ....
Both the social welfare and_the housing sectors • suffered
severe reductions in budgetary allocations ;during the _,crisis
years. Although some improvement-is registered in 1986, _it was
almost wiped out•by 1987. LThis is_true whether one: looks ::atnominal, real, real per capita _or _GNP !terms. The positive
nominal growth posted in 1988 in these _sectors was:not enough ....:to
bring the real per capita levels _at par with. the pre-crisislevels.
In terms _of _ the share in the total budget ',and' as, a
percentage of GNP, agriculture is the most important sector_in
the agriculture/agrarian reform/natural resource group in the
Aquino as well as in the Marcos_vyears. On,the other hand, the
agraria_orm sector garnered the big_@st i_!_@/_eJht_s_ig_ 1986__988 (with an--a-vera_ annual growth irate of 182.6opercent)_ 66chthat government expenditures in agrarian ref0rm as a proportion
of GNP increased by almost tenfold from O_l•percent in 1975-1985to 0.9 percent in 1988 (Table 18). Despite Considerable
adjustments in government expenditures on,the" natural resource
sector ......in 1987 and 1988, it has not reached the pre-crisislevels. • .....
The infrastructure/utilities sector was the hardest .hit
_ector during the 1983-1985 crisis. Although some increase in
government outlays on this sector was posted in 1986-1988, it has
yet to fully recover from earlier expenditure cuts. Expressed asa proportion of GNP, government expenditures in the
infrastructure/utilities sector stood at a low 2.3 percent in
1988 as against the 5.0 percent average in the pre-crisis years(Table 18). :
Viewed,•any which way, defense expenditures exhibitedadefinite downtrend in 1975-1985. Between 1985 and 1988, however,
it grew faster than the averag e sector so that the reverse is
evident in the trend for this periodl This observation holds'whether one includes: outlays for _peace and ordeE under .....the
defense category: _or not.: In spite 0f this marked increase _ in
defense/peace and order • expenditures in recent :years, ! the
P_hilzippines' expendituresI in:this_sIector (equal to 2.1 percent_of
GNR in 1988) is lower than that of,its Asian _neighbors. __ For
instancei Thailand spent_4.0_percent'of its GNP on defense in thelast decade._ • : =•i ••• ;• •........
Public administration expenditurewas the second fastest
growing item,in the government's budget_ in_1986-1988. Coupled
With the fact that it'was:practically spared the belt-tightening
measures_ imposed in 1983-1985_it rose -consistently from ,;:l.1
percent of GNP is 1975-!985_to 1.9 percent _in 1986-1988. _;:It
reached 2.4 percent of GNP in 1988, the highest level attained _in
the c last 15 years. This is rather surprising considering the
present government's vow to trim the bureaucracy (Table 18).

47
B. Distribution.... of Government Expenditures Across Economic
_Cate_o<ie _ i .....
Government expenditures on personal,services grew by 32_8
percent nominally in 1986-1988. This is almost twice:as .fast asthat in 1975-1985 (Annex Table 12). Even after adjusting f.or
inflation, personal services expenses rose by 24.9 percent during
the Aquino years compared, tO 1.4;percent in the earlier period.
Thus, the_ratio _of personal service expenditures to GNP was5.1percent in 1986-1988 in contrast to:3.8 percent in the p_evious
decade (Annex Table 13). ....
If one considers or takes in the salary ad3ustments ko
government workers actually granted by the Aquino administration,one would not be able to fully account for the_hefty growhh inthis abovementioned expense item. : This implies that there has
beeh an increase in , the bureaucracy in terms of number of
personnel during_the present government.
Tie findingsof earlier studies show that there is a wide
disparity in the compensation scales of employees in the public
and private sectors_ The P0ssibility that this may adverselyaffect the quality of public services has also been raised.
Thus, a pay hike for government wor_kers appears to be 3ustified.
Significant increases in the salaries of government workers !in
the education and the defense/peace and order sectors are hi,ghfypublicized and are generally perceived to be well deserved,_
However, the incidence of salary adtustments is highly _uneven
across sectors, with some sectors being able tonegotiate to becovered by the "Office of the President, pay plan while others
are not. Thus, a salary standardization scheme is urgentlyneeded to rationalize the g0vernment:pay scale and to take the
place of the piece-meal approach that has been implemented sofar.
In relation to the second point, there are some anecdotal
stories of certain agencies increasing their personnel complement
for turf-building reasons. The circumstantial evidence that has
been presented here tends to validate these stories. This stands
in sharp contrast to-official p_onouncements of trimming the fatoff the government.
Maintenance and_other operating expenditures exclusive of
interest payments, transfers and loan repayments suffered severe
cuts in the crisis years. It has been pointed out that these
reductions may result in:the p_emature deterioration of the
ekls_ting - stock of government capital assets. The 1988 level of
maintenance and operating •expenditures indicates,, that • this
problem has not _been:, adeqtately _addressed,lby the_ ; preseht_
administration _ In nominal• _as wellias_ in :real terms, _this
expensei_ item has not_ quite caught,up-yet_in the :Aquinp_,_yearssuch that as a proportion of GNP,_ its 1988 level is equal to only
2_5:_pe_cent, :still be!ow the 3.2 _percent average in the pre-crisis years (Table 21).

•Capital outlays exclusive _of '; net '_ lending likewiseexperienced the brunt of the cost cutting measures instituted
during the crisis years and as a consequence of the heavy debtburden that is•particularly severe in the Aquino years Thus,
this ' expenditure category has'contracted significantly' in realterms since 1983. in•fact, it declined nominally even in 1987
and _ i988. - AS a proportion of GNP/ it decreased from an average
of 5.2 percent in 1975_1982 tO a low of 2_9percent in 1988
(Table • 21). Its share in total •government • expendi_tures alsodeclined from an average of 34 _percent in the period before1982
to less than nine percent in 1988. This contraction • in ,•publicinvestments is worrisome given the well established theoretical
and empirical!link between investment and economic growth.
Transfers from the national_government to GOCCs ini£he form
of -_ subsidies, equity and net lending used to be rather •.•high in
the Marcos years _when ' it averaged 3.4 percent of GNP_ _ In: fact,
earlier studies (Amatong 1986) _age shown that this was a serious
cause of the leakage in the government budget in 197•5-1985. The
present government has been successful in trimming down this itemt0 _1.0 percent • of GNP in 1988_reflective of its _efforts . t0
rationalize the government corp0rate sector_(Table 21). _• [
_ _ Finally, it is noted that the national government ! budget_
given I_present accounting conventi6ns _idoes_n0t account_ ;for _:£ ax_
expenditures _ granted by such_ _agencies I_ i fke_the Board _, of
Investments in the formal of tax exemptions/deducti0ns/credits to
specific private and:government corporationsl _Annex Table _14reveals that these tax'expenditures are not insignificant&
These • . figures reflect !the_revenues foregone and'by' implication,
expended by the government. ::The_question is: Should itheseexpenditures be allowed t0 _bypass the budgetary allocation
process? , . '_ , ..-,_ ,:,. ._ T_
Vj THE GOVERNMENT CORPORATE SECTOR!AND THE PRIVATIZATION PROGRAM
The government corporate sector expanded very rapidly in:the
seventies" and the early eighties. GOCCs numbered_ Only:'_70 _ in
1973. In just over a decade, this figure has more than " tripled.In 1985, the Presidential Commission on Reorganization (PCR) made
an inventory of governmentcorporations and counted 303 such
entities: 93 parent corporations, 153 subsidiaries and 57
acquired assets.
As a result of this Unrivaled •surge in the number_0f_ publio
sector enterprises (PSEs), the public sector began to play 'amajor _role in activities prevlously dominated by the private
sector like petroleum refining and trading, sugar trading,;siandtransportation, hotel operation'; rubber and '_coffee _:plantati0n,
etc. It _ has also led to• the duplication of functions _of_ Somegovernment corporations_ Furthermore, certain anomalous
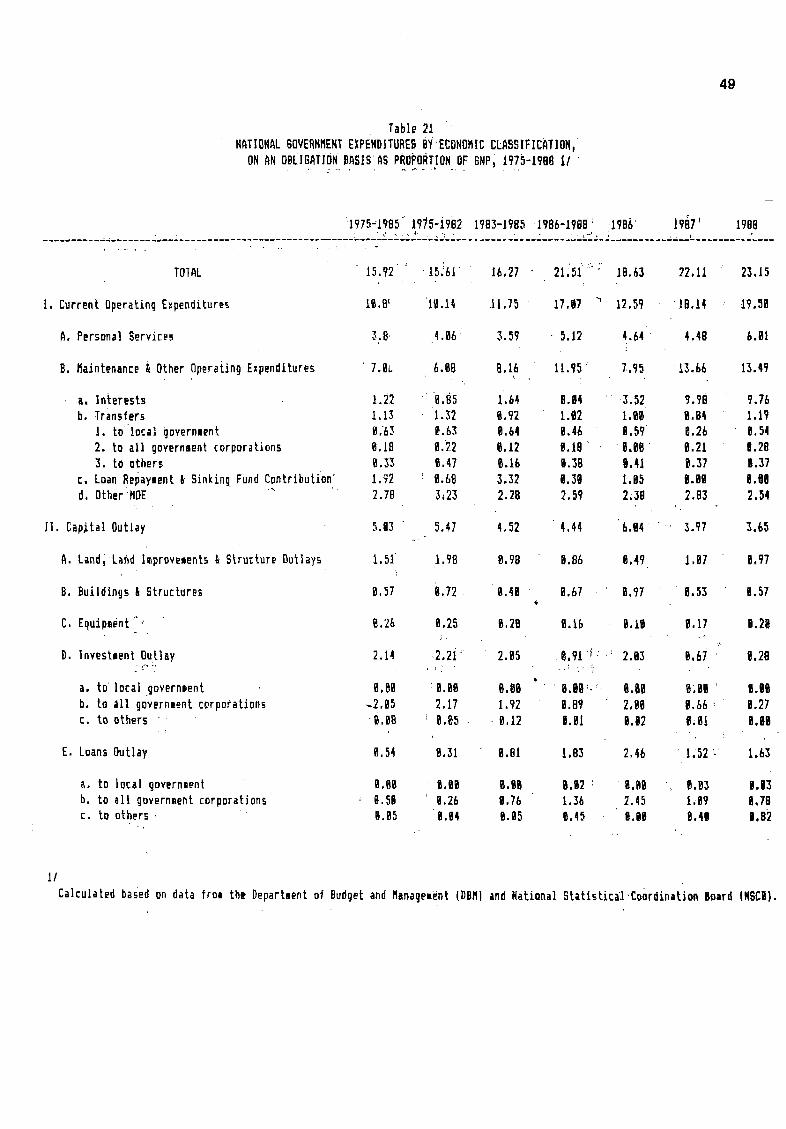
49
Table 21 "
NATIONALSOVERNHEMTEXPENDITURESBY_ECDNOMIC,CLASSIFICATION,'ON AN OBLIGATIONBASISASPROPORTIONOF GNP,1975-1988II
_1975_19fl5""1975-i9i_2 1983-i985 19B&-1981t"_ 17B6 |987 + I?BB
TOTAL J5.92 _ ' 15_61+ 16,27 21_51'_:' : JB,63 22.11 23.15
I. CurrentOperatingExpenditures 18.9_ 11.14 .11.75 17,87 _ 12.59 '1B.14 19.5B
A. Personal Services 3.8 4.B6 3,59 - 5.12 4./,4 + 4.4B 6.11
B. Maintenancei OtherOperatingExpenditures 7.8_ 6.88 8.16 11.95_ 7.95 13.b6 13.49;
a. |nLerests 1.22 " B.85 1.64 B.84 r"-3.52 9.98 9.76b. Transfers 1.13 1._2 i.92 1,12 I.Sl i.B4 1.19
I,to localgovernment 8.63 e.63 e,64 8,46 E.59 0,2b 1.542. to allgovernmentcorporations B.18 1.22 1.12 8.18' I,_8 1,21 i,2B3. toothers _,33 8.47 _.16 1.38 t.41 1.37 8.37
c, LoanRepaYmentI SinkingFundContribution 1.92 0,68 3.32 1.3m 1,B5 B,88 8,Hd. OtherHOE .... 2.7B 3+23 2.28 2,59 2,38 2.8;3 2.54
II.CapitalOutlay 5.13 5.47 4.52 4.44 6,14 3,97 3.65
A.Land,Land Improvement5& StructureOutlays 1.51 1.9B B.98 B,86 8.49 1,87 B.97
B. Buildings& StrucLure_ 8,57 1.72 1.41 8.67 1.97 B.53 8,57
C, Equipment<'+ _.26 1.25 8,2B 8,Ib l.lg B,17 B,2g_. .+
D. Investment Outlay 2.14 2.2i + 2.B5 8.91 f ;: 2.93 II,b7 g.2O._-_-j , =! ,.: ..-..._.
a, to' local .government B,Bi I,g8 8,gO " i,ll <.+, I,B! I_;ill l,IIb, toallgovernmentcorporations ,.2.g5 2.17 1.92 1,89 + 2.li 1.66 1,27c, to others .... 1,88 i B,85 g,12 il,gl g,12 I_gl 8,g8
E. LoansOutlay t_,54 1,31 I.Bt 1.83 2.46 l,S2 " 1.6;l
a, to local government g,gll 8,gl 8,8g I;87 _ 8,B! " I,B3 8,13b. to allgovernmentcorporations ' 1,51 ' g.26 1.76 1,36 2.45 I;g9 g,78
c, to others . " g.B5 B,g4 g.g5 e.45 g,88 B.411 O,B2
1/
Calculatedbasedon datafromtheDepartmentofBudgetandNanagement(OBH)andNationalStatistical.CoordinationBoard[NSCB).
50
practices arose, signals perhaps of the government's inabilityto
cope with the unprecedented growth of the i government corporate
sector. It was observed that _some government corporations areregulating their competitors from the private sector while some
government nonfinancial corporations are behaving like financial
corporations. At the same time,_6ther PSEs Collected taxes like
regular government bureaus (Manasan, Amatong and Beltran 1988).Moreover, interlocking directorates became prevalent as
government Ministers assumed multiple directorships in Various
GOCCs. In 1984, for example, the Commission on Audit (COA)observed that one Minister was in the Board of Directors of 43
government corporations while another was in 40 .....
Despite the tremendous growth in the number of PSEs in the
last decade, gross value added of the sector lagged behind that
of the total economy. Their share in Gross Domestic Rroduct is
also low relative to that in other countries (Short 1984). At
its peak in 1983, gross value added of public enterprises,accounted _for 3.3 percent of GDP but averaged a low 2.0 percent-
of GDP for the rest of the period between 1975-1984 (Manasan .and
Buenaventura 1986). _ _ ......_ ....._ _E _ i
_ At the same time, estimates_gf the,factor producgiqitYratios as_well as the financial profitability rstlos confirm_the_
widespread perception that public enterprises are, in general,
less efficient _ than ,their private_ sector counterpart. Total
factor productivity of the whole economy was 5.5 times that of
government corporations in the last half of the seventies ands,
roughly nine times in the first two years of the eighties
(Manasan, Amatong and Beltran 1988). ....._
Poor financial performance coupled with the unsustainably
high levels of capital expenditures has led PSEs to eat up a
disproportionately huge chunk (about 29 percent) of the national_
government's budgetary resources. They also account for a
significant portion" (over 50 percent)of the external ....debt of_
the consolidated public sector (Manasan and Buenaventural986).
Consequently, the failure of- the public enterprise sector is_generally seen as having been a major contributory factor in the
economic crisis of 1983.1985. _
_:_ Against this backdrop, : Letter of Instructions 1454 was
issued in April 198.5 directing ....the Special _ presidential
Reorganization ,Committee (SPRC) to conduct studies aimed at
rationalizing the government corporate sector. Among other
things, this Committee recommended the limiting of the use of thegovernment corporate form tO _certain areas/activities, £heinstitutionalization of effective supervision, the coordination
and .....control of governmen_{corporatilons hand,ino hand withi_ the_
provision of adequate operational flexibility to the said
enterprises, and the abolition, merger, retention or
privatization of specific corporations. These efforts, however,
were overtaken by the change in administration in February 1986.
51
T,he.:[)change,_:in[:governmen_in._1986:_usheked_ in breforms_'that
assign _the pivotal role:,in ecOhomiclde_elopment_to : the_iprivat@Sector_,_These, ,ref:orms_:!which:were)succintly enunciated, in_<_i_the
:1987-1992J_ Medium Term_Development!:,_P_l_an_ call for:_,a program_,Ithat
will: (i) limit the use of the government corporate _ form :,to
those activities that are usually considered to be natural
monopolies;_those:that:require :large and physically _indivisible
capital i nvestmentS/_,7'those tha£::.are;characterized-,by i long_ _and
uncertain,_ge_tati'on -periods,:_and/or,_,those _that_,:_are _-deemed
essential from the_point of, view.of national welfare_ security, 6r
defense;_22/_,_!(2) _dispose_of -existing _ government :corporation sthat_c_do • notl ;meett _,the Criteria outlined- _in (I)_ above;; . ,(3)
establfshJ.an integrated system of_:performance evaluation ,for _the
remaining government corporations;_ and ,-(4) {mprove the system
of supervision and_control: of_ government corporations_ _These
general_ statements, of policies are_,very much in line -with., the
pre-Aquino_government pronouncements of the SPRC.
A., Rationalization of the Government Corporate Sector
With regard to :the_ first[and second objectives of! the
government corporate sector _rationalization program in_ the Medium
Term_ Development .Plan, it should be pointed,out that: possiblegovernment action! on this may_come at two _levels.:
_6_ First, _the government may promulgate an_issuance (perhaps-inthe form of_-a_Government'Coxporate_Code) •that would provide the
framework ,for'_the_ operat_ion.and_administrati.on of ,GOCCs. I<_:The
Plan suggests that. such_an_issuance 'should "among others,-_,,define
'the role ofl the government_horporate sector;in _ the 'development
process;- : identLfy_the _areas where _[the corporate i....form_ _'of
0rg&nization•_/may 'be utilized by _the:government,_,including_,ithe
cri:teria and-the' guidelines _on the luse-Of the corporate_,,Iorm ,,_in
gogernment_ _ determine, the_ manner_ _:by!_ which_ _the_<i_i_government
corporations ; may,: be:_:created;_and_'estlablish a_ uniform set of
guidelines, to ....delineate more:clearl_!_he :relationships_ at _thed,ifferent levels of _corporate .supervisions.and Control_" _ Note
that such: a code would have'been a useful_instrument :in _he-,,long
protracted , policy_ discussions on.the cdisposition of_ existin_
GOCCS._:_, Furthermore,. it would have ensured, _ _if, steadfastly
implemented,_, a more rational,g0vernment_corporate sector_ in_ :thefuture. Thus, it is unfortunate that no such issuance was made
by the President before Congress was convened or by thelegislative branch of government afterwards despite the existence
of various versions of a draft Government Corporate Code as
formulated by different agencies like the Government Corporate
The Plan proposes the following_,criter_ia.tO _overn_.,the
use of the goveEnment corporate form: (i) flexibility and
autonomy in:_ operati0ns;! :(ii) :_uxfinancial:_ Viability; (iii)
limited liability of the national government;,! :and,.:_:_!:_(i_)
-possibility of private sector participation.
52
Monitoring and Coordinating Committee:_;(GCMCC):_and the_ Commission
on._,Audit (COA) as early asblate ¢1986 and>the introduction of :_a
number_ of bills in Congress: (sponsored_by Senators Guingona_and
Romulo_!:in the Senate, and Congressmah_9_natonq'_ am0ng>'others_._iln
the House).
Second, the government ,_ even in ,the _absence ",of_such a , code_
could _,undertake a_review_of the'existingcGOCCs_with_the end:_ in
view of formulating policy actions_on their disposition%: :This
is,. _in fact, what the government[:'did. _._After' reviewing .....the
proposals_ of the 'Presidential Commission one! Reorganization and
the Government Corporate Monitoring_and Coordinating Committee
(GCMCC) } the [_ Department of_ Budge t and Management I (DBM)
recommended the privatization of_121:GOCCs, 23___/the retention of33 in their present _form, the abolition ',of 58,/ and the
conversion/regular.ization or consolidation with other':-GOCCs_ of
the remaining 88 Since then, ,numerous reshufflings i:haveoccurred as to the disposition of these GOCCs. For some time, it
was difficult to have a Sense of what the government dispositive
action is with regard to specific-GOCCs because the fate of a
great number of the GOCCs was classified under "pending with the
President (of the Philippines)" for quite a whi,le. For instance,
decision on the dispositive action on 35 of the 121. corporationsoriginally recommended for privatization was still uncertain asof December 1987. No decision on 25 of these GOCCs has been
reached as of February 1988. It was only on July- 28, 1989 that
all 121 GOCCs finally got the Presidential seal of approval forprivatization. Similarly, as late as June 30, 1989, the decision
on the disposition of 30 other corporations _ which were
recommended for conversion, regularization and abolition by the
DBM was still pending with the President.-Table_ 22 presents the
status of government disposition_a_tion on the GOCCs_as of July_30, 1989. Despite the length _of time it_ took to!arrive at ....some
flrm decision on the disposition Of most GOCCs, a,'cursory review
of the list of:retained government corporations _:indicates that
quite'a number of them would not _ satisfy the.criteria outlined_In
the_official:policy pronouncements,_e.g;,_Marcos_Golfl Foundation,
Gintong Alay _,Foundation,'i Sugar Regulatory Administration_: etc_
Eurthermore, the necessary legislative action with regard:_to_the
charters governing the GOCCs : that are _up for _ • abolition,regularization _._and _r •consolidation _has not been undertaken_,t0
date. 2__4/ ' 'i ,
2_/3/Four of these were already privatized even be f0re _ the
issuance of Proclamation 50.
-24/ 'The privatization program Will be reviewed in:a separate
sub-section in this paper. '....: ....

Table 22
STATUS OF DISPOSITION, ACTION ON GOCCs
(July 3,
Approved ; ...4-Pending w/ the _. No need for _.F.,otfurther.
.iI , the'_'President President Presfdential:. approval _ Review " ,TOTAL
"" • I2 . ii_ iI.
Priva.tization I. 121 - ..- _ 127-
Conversion . 5.. .._ i - 5-I ["
Reg uia r-iza ti on -17 - u 3 20z .. .:_]
. iZ.... II
Retention 38 " •'34 ,- 72
on,.-.. :.,.v - '- " _oi
J.K)
Abolition 0 "8 - ' : ', - ., _, _ -., _o
,] i ; I
total i 249 .... • 8 '34 9 300".
Source:- Department ofl Budget and Management (DBM).
L_

54
The rati!onal e for i•tems (3) and ,(4)'0f • t_e Medium _ Term
Development Plan objectives for the government c0rporate sectoris to •instill fiscal discipline and )_o strengthen the
accountability of public enterprise managers I through theeffective monitoring and supervision : of ithe retained
corporations, i The progress of government efforts in _ this area
has also beenl painfully slow as evidenced by failure to comply
with the timetable set i_ £he Medium Term DeveLopment Plan.•
Contrary : to earlier recommendations and_ the _spirit of the
public enterprise sector reform program_ !_!6he _ membership of
Department Secretaries/Undersecretaries in hhei:Board of Directors
of various GOCCs has not been limited to hwo. 2•5/i This has been
detrimental to the quality of decisionmaking since many "Board
meetings are attended not by official members I but by minorfunctionaries.."
Moreover, in 1988, the GCMCC had oversight{ responsibility
over 14 nonfinancial government•corporations.!onl_.•:• This numberwas increased! to 18 in 1989 and willl _:reach 25 i:in 1990.
Furthermore,, ithe inclusion of the Departments of Agriculture,
Environment a'nd Natural ResOurces, 'Pub'lic'WOrksl and _uHighways," '" ' communication,Trade and Industry, and Transportationl ,and i
(agencies which are heavily involved in• theloperation_:.of the bigGOCCs) in the GCMCC in lieu of the DBM 'and CB has!i!•further '
exacerbated • the incentive incompatibilihy, I problem _i_that isinherent when I the heads of the various line agencies[{iSit_•in the
Board of Directors of the GOCCs that they are supposed tosupervise. 26/ Thus, the move may be viewed_.as a weakening of
the system of supra-ministerial superv{sion Iof '"_overnmentcorporations. ' .... .
Also, aperformance,evaluation system_consisting of .the
formulation'i of quantifiable performance cri£eria, the deter-
mination of sectoral and firm level norms, Dr! target values
against which the corporations' actual performance, will beappraised, and the institution of an incentive mechanism that
will ensure reinforced "good" behavior ,and sanction "poor"
performance, has yet to be put in place for!the retained govern-ment corporations._ The experience of other.countries in this
area suggest i that the benefits that can be. derived from the
institution&lization of a .performance, evaluation system for
public enterprises can be maximized if theses: firms are given
operational autonomy as well (World Developmen _ Report 1988). In
At present the ceiling of two is appliedlto memberships'w
in the Board o_ Directors on non-_x-off_cioibasis.26/ :.... _-_ _-,- _ )
The GCMCC was_ original_y ':> _' ' '.composed of the ExecutiveSecretary and, the heads o£ the followlhg service agencies: CB,Department Of Finance (DOF)., DBM,_and NEDA.:
m

55
this regard, it should be noted that there are some bills pending
in Congress that would tend to emasculate public enterprisemanagers in the name of ensuringcentral government control overtheir actions.
To be fair, as of the end of 1988, the GCMCC has piloted
corporate planning programs, including the development of _
performance criteria and the setting of targets, in five
corporations, namely, the National Power Corporation, the
National Irrigation Administration, the Philippine Ports
Authority, the National Housing Authority, and the National
Electrification Administration. Together with the Government
Corporate Affairs Office of the Department of Finance, it has
worked on the improvement .of the monitoring system of the
GOCC_ under its wing. Consequently, as pointed out earlier in
Section 4, the budgetary burden of GOCCs has been put under
control under the present administration. For instance, the sum
of national government subsidy, equity and net lending
contributions' has declined to 1.6 percent of GNP in 1987-1988
from its 3.1 percent average in 1981-1985o The self-financing
ratio (i.e., the ratio of savings to investments) of the major
nonfinancial GOCCs averaged 100 percent for .• 1986-1987 27/
compared to a low 13.4 percent average for some 60 GOCCs in
1975-1984 (Manasan, Amatong and Beltran 1988). This developmentis partly due to an improvement in the economic performance •of
the GOCCs and partly to the scaling down of the plannedinvestments of these corporations. Note that the ratio of actual
to planned GOCC investment is......52 and .65 in 1987 and 1988,
respectively. On the other hand, the ratio of actual receipts to.
actual current expenditures is 1.16 and 1.25 compared to the
planned ratios of 1.13 and 1.07 in 1987 and 1988, respectively(Table 23).
B. The Privatization Prograla
In December 1986, President Aquino issued Proclamation 50
creating the Committee on Privatization (COP) and the Asset
Privatization Trust (APT) as the implementing arm of the COP.
The COP is vested with comprehensive policymaking •functionsrelatingto the rehabilitation, conservation, take-over and the
disposition of government corporations and acquired assets of
government financial institutions. It is headed by the Secretaryof Finance and is composed of the Secretaries of Budget and
Management, Trade and Industry, Justice, and Economic Planning.
On • the other hand, the APTwas initially tasked with thedivestiture of the nonperforming assets (NPAs) earlier
£ransferred to the national government by the Philippine National
Bank (PNB) and the Development Bank of the Philippines (DBP) aspart of the rehabilitation programs of said government financial
•This is based on •data furnished by the GCMCC.
:2" . =

Table 23
FINANCIAL OPERATIONS oF THE
MAJOR NON-FINANCIAL CORPORATIONS, • 1987-1988
(In _B)
1985 1986 1 9 8 7 1 9 8 8
A c t u a 1 Ta[get Actual Target Actual
Total Receipts 56.5 38.7 47.7 49.8 59.5 59.8
Current Expenditures 52.0 38.4 42.2 43.1 55.4 47.8
i Capital Expenditures 12.5 5.9 15.1 7.8 13.8 9.0
Capital Transfers 0.0 1.2 0.0 -1.4 0.0 0.0_ Internal Cash Generatlon 4.4 0.3 5.5 6.7 4.2 12.0 _
Overall Surplus (Deficit) -8.0 _-6•.8 -9.6 0.2 -9.7 2.9
Total Receipts -'.Current Expenditures 1.087 1.808 1.130 1.155 1.074 1.251
iCG .'-Capital Expenditures 0.352 0.051 0.364 0.859 0.•304 " 1.333
Source: Actual data from GCMCC; Plan Targets from NEDA Medium-Term Development Plan,1987-1992.

57
institutions. Ten out of the 86 GOCCs that were originally
approved by the President for privatization were also assigned to
the ,A_T. The disposition of the remaining GOCCs was given to llgovernment agencies to which these corporations are attached. 28/
The COP privatization guidelines call for the disposition
enti:ties to prepare a privatization plan within 60 days from date
of designation. Such plans should include the following aspects:extent of privatization (whether total! or partial);, mode of
privatization (whether it will involve sale of assets or sale of
shares); method of privatization (whether it will take the form
of public offering stocks, sealed bidding of stocks or assets or
negotiated sale of stocks or assets); identification of potential
investors; valuation of assets or Stocks; and timing. With
regard to the method of privatization, the COP has a stated
preference for public offering of shares with the end in view of
widening the ownership base of enterprises. On the other hand,
negotiated sale is viewedas a last resort th&t should be
approached with the outmost transparency. Furthermore, cash
offers are preferred over sale on installment basis, other
things being equal, Filipino investors are preferred over others.I
The nonperforming assets of the PNB and the DBP that were
put on the block represent a total of 399 accounts, with total
booked exposure amounting to _108 billion plus contingent
exposure of _33.8 billion. As of the end of 1988, some 104 NPAs
had been liquidated in full while 48 accounts had been the
subject of partial sale. The gross recovery on the full sale
using various modes of disposal was _6,992.6 million as against a
total exposure of _i6,149.6 million, reflecting a gross recovery
factor of 43 percent. Note that_the PNB and the DBPhad :
estimated the gross recovery factor for the 399 accounts to be in_
the vicinity of 17 percent only. 'The difference between _this _
estimate and the actual APT figures as of December 1988 might be _due to the fact that the more attractive assets tend to be sold
earlier because of demand considerations. In fact, the gross
recovery _ rate for 1987 is 49.1 percent compared to 38.0 percent
in 1988 (Table 24). If this hypothesis is correct, then a
considerably lower _recovery rate £elative to that achieved '_ in
1987-1988 should be expected in the_ future. _
In general, the divestment via the KPT yielded a higherrecovery rate than through non-APT means. The direct-debt-buy-out
scheme of the "transfer price" variety posted the highest_
recovery rate of all the disposition modes used. Contrary to a
These agencies are the Department of Agriculture,
Department of Transportation and Communica£ion, Department of
Tourism, Government Service Insurance System, Home Insurance and
Guaranty Corporation, National Development Company, Philippine
National Bank, Philippine National Oil Company, Philippine
Management Staff and the Development Bank of the Philippines.
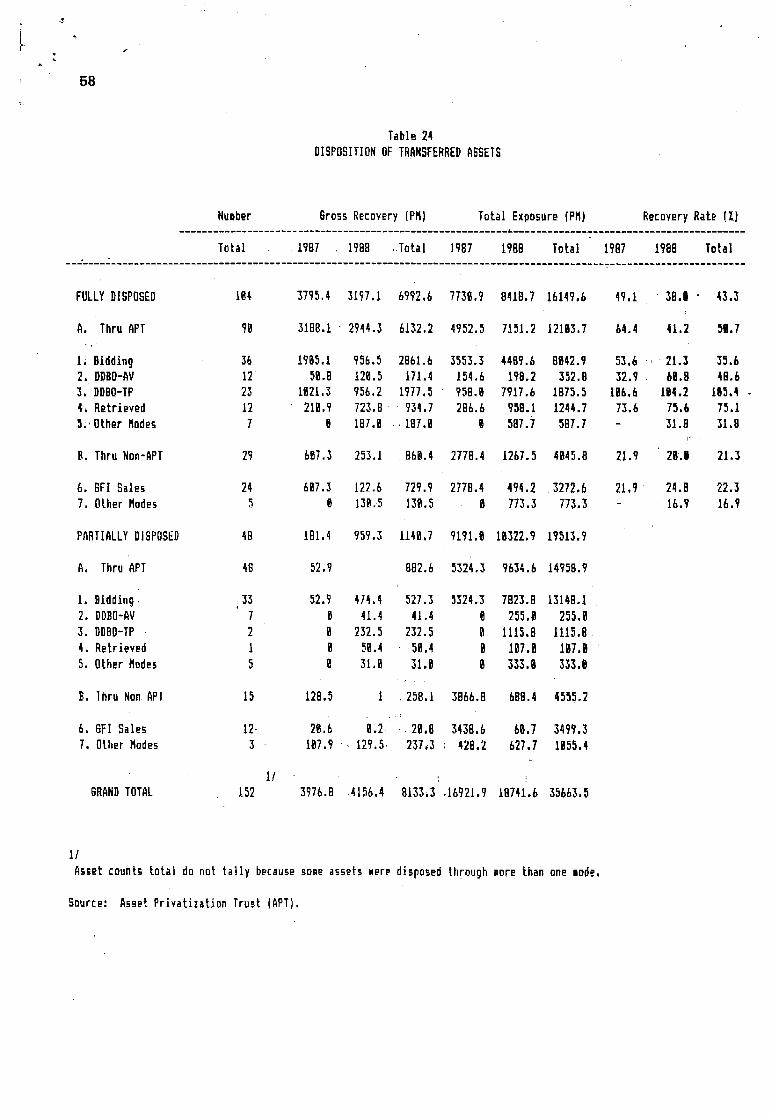
__e.
58
Table 24OISPOSITIOHOFTRANSFERREDASSETS
HuRber GrossRecovery(PM) ToLal Exposure(PH) RecoveryRate (_)
Total 1987 1988 Total 1987 198G Total 1987 1988 Total
FULLYDISPOSED 184 3795,4 5197.1 6992,6 7736.9 B416,7 16149.b 49,1 36.| , 43.5
h. ThruAPT 9_ 31BB,1 2944.3 6132.2 4952.5 7151.2 121|3,7 b4.4 41,2 5a,7
1_ Bidding 3_ 1985,1 956.5 2861.6 355_,3 4489,6 8[42.9 53.6 , 21.3 _5.62, DDBO-AV 12 56,B 120,5 171.4 154,6 196,2 352,B +2.9 66.6 46.6_, DDBO-TP 2_ IB21,3 956.2 1977.5 95B,_ 7917.6 1675,5 166,6 194.2 165o4 -4, Retrieved 12 21B.9 723.B 934.7 :2B6,6 95B.1 1244.7 73,6 75,6 75.15;Other Hades 7 g 167.B + 187,6 6 587,7 587.7 31,6 _t.B
B, ThruNon-APT 29 6B7._ 253,1 BGB,4 2778,4 1267.5 4645.B 21.9 2B.g 21,_
6. GFI Sates 24 607,_ 122.6 729,9 277B.4 494,2 3272.6 21.9 24.6 22,37, OLherHades 5 B 139,5 13_.5 B 77_,3 773._ - 16.9 16,9
PARTIALLYDISPOSED 46 161.4 959.3 114_.7 9191,+ IB322.9 19513,9
A. ThruAPT 4B 52.9 882,6 5324,3 9634,b 14958.9
1. Biddingl 33 52.Y 474.4 527.3 5324.3 7823.6 1314B.12. DBBO-_V 7 6 41,4 41,4 6 255.B 255,B3, DDBO-TP 2 6 232,5 232.5 6 1115,8 1115.84. Retrieved 1 6 56.4 58,4 g 167.6 JB7.g5. Other Hades 5 6 31._ TI.g 6 333.B _3.B
., .
B. Thru NonAPT 15 126,5 1 25B,1 3B66,8 bOB.4 4555.2
6. 6F1 Sales 12- 2B,b 6.2 :I 2_.fi 3436.b b_.7 3499,37, Other Hades 3 167,9 ' 129.5 237+3 _ 426.2 627,7 ig55.4
1/GRANDTOTAL 152 3976.B 415b.4 81333 ,16921.9 18741.6 _5663.5
II
AssetcountstotaldonottallybecausesameassetsweredisposedLhFa_ghmorethanonemode,
Source:AssetPrEvatizationTrust(APT).

59
priori expectation, sealed bidding scored the lowest recoveryrate (35.6 percent) of all the APT modes (Table 24).
Contrary to COP pronouncements, public offering of shares
has not been utilized at all as a divestment instrument prior tothe offering of PNB shares in early 1989. This has serious
distributional implications on the government's privatization
program. Forty-one percent of total sales were made through
sealed bids, making it the most favored mode of disposition. An
incohsistency of sorts arises here as this implies that asignlficant proportion of government assets was sold via the mode
that_has registered the lowest recovery date.
On the other hand, a total of 12 GOCCs were sold in full in
1987-1988 while seven were the subject of partial sales._ The
government grossed a total of _4352.2 million from thesetransactions (Table 25).
The divestiture of the NPAs assigned to the APT has sufferedconsiderable delays because about 300 of such assets are not in
physical form assets, i.e., they are financial form assets, and
therefore, not conveyable. In fact, even some of the physicalform assets are not conveyable because they are still under
litigation. This problem might be approached from threedirections: legislative action that will facilitate the
conversion of the financial claims against debtors to foreclosed
assets; judicial reform that will involve the designation of aspecial Court to try collection cases with the end in view of
speeding up the foreclosure proceedings; and the pragmatic
approach that is currently being pursued by the APT whereby itessentially tries to come up with compromise foreclosures outside
of the judicial system via such measures as direct-debt-buy-out,bid-out of financial form assets with escrow provisions, etc.
Note that normal judicial foreclosure proceedings are verycostly in terms of both time and money. On the other hand, the
legal issues that have to be considered are: constitutional non-_
impairment Of contracts, _re-emptive rights of stockholders,rights of debtors under the Civil Code and other laws relating to
foreclosures, nationality laws and related policies and
accounting and auditing haws related to valuation and pricing of
assets. Given that the APT is operating on a five year timeframe
(which implies that it has more than two years to go), the other
two approaches cited above migbt still 9ost significant returnsif explored. .... _ ....
VI. CONCLUSION
This part of the paper highlights the major findingsdiscussed in greater detail in the preceding sections. In
addition, it spells out the policy directions that emerge.

6O
Table 25SALES/DISPOSITION OF GOCCs
(Gross Recovery in i'll)
1987 1988 Total
FULL SALE 617.7 2,436.7 3,054.4
1 _ Asia Industries, Inc.) 130.5 130.5_2'__' Beta ElectriC Corp. )3 "_ Commercial Bank of Manila 510.0 " 510.04. Hotel Ent. of the Phil., Inc. 325.0 325.05. Marina Properties 1,777.8 1,777.86_ Maunlad Savings & Loan Asso. 14_i. 14.17_ Mindanao Textile Corp. 238 _ 23 .'6
8. National Marine corP 18810 188_09' "Nat'l Precision_Cutting Tools 21_3 21 310 ' Pilipinas Bank _ 38.6 38_'6ii. Tacoma BayShipping Co. 10.0 "i0_012. Usiphil, Inc. 35.5 35.5
PARTIAL SALE 579.2 716.8 1,297.8
i. International Corporate Bank: 297 6_* 297.82. Nat'l Shipping Corp. of the ' 141.4 132_2 273.8
- Philippines : :'3. National Stevedoring 36.0 _ :38"04. Negros Occidental Copperfields 101.9 80.2 162.15. The Energy Corp. 2.3 .... 2.36.' Union. Bank of the Phils. _518.6 518.67. Woodwaste Utilization & Dev Corp_ 7.6 7.6
t ?
GRAND TOTAL 1,198.9_ 3,155.3 4,352.2
*Includes sale of shares made by National Development Company (NDC)in July 1986.
Source: Committee on Privatization (COP).
61
First, there has been a deterioration in the overall _ fiscal
position of the national government in 1986_1988 relative _ to
1993_1985 _. In fact, the fiscal deficit in-{he first three years_f the Aquino administr_ation is comparable in size to that _ in1980-1982 when the Marcos government embarked on an expansionary
eountercyclical expenditure program. However, if one loo_s at
the primary fiscal balance (a measure of how fiscal actions in
the current period contribute to the government's net
indebtedness) rather than the overall fiscal deficit, the shift£o a more conservative fiscal stance in 1986-1988 _can be
observed. In particular, there has been a dramatic improvement
in the primary balance in 1987 and 1988.
What appears to be worrisome, though, is the downward trend
in government savings. While total reyenues- have increasedsomewhat in the last three years, it has not kep__pace_wi_th -th_
growth in current expenditures of the national government so that.
the current balance has consistently declined. In 1988, thenational government registered a deficit in its current account
for the first time in the last 15 years_ For the most part, theincrease in current ....expenditures may be attributed to the
ba!!9o_ing Qf interest_payments as a result of the unprecedentedaccretlon in the outstanding stock of government debt under the
pre_Lo_s regime. To some extent, however, this development -may5e_tr_c_d _o the increase in non-interest current expenditures,
particularly personal services expenditures. Inturn, this is
partly, due to the government's_ failure to trim the fat from the
bureaucracy. These developments point _,to the government's
increasing inability to finance the already depressed level ofmaintenance and operating as well as _capital expenditures that
characterized most of the crisis years_ It is expected that
these shortcomings will pose severe constraints on the country's
growth prospects in the near future, i
In this regard, it is noted that there is a need (i) to
increase the public sector's revenue effort, (ii) to exercise
greater control over government expenditures, and (iii) to
explore more innovative ways by which to relieve the debt service
burden on the government budget. The Philippine revenue effortratio (tax as well as nontax) is the lowest in the ASEAN region
(Manasan 1989b) and is lower than the average ratio of middle-
income countries (World Bank 1988). Thus, the expected rewards
from a more vigorous revenue collection effort appear to be high.
At the same time, the analysis in this study indicates that there
still exist some potential gains from cost cutting measures inthe government. In the final analysis, though, the magnitude of
the debt service and its impact on the government budget is
simply too enormous to be ignored:and is almost impossible to be
overemphasized as it effectively strangulatesthegovernment's
capabilityto provide basic public services.
Second, the period witnessed the increasing reliance on
3omestic borrowings to finance the government deficit. Without
62
doubt, this is a direct consequence! of the dimunition of foreign
sourced finance since the Philippines joined the ranks of highly
indebted countries in 1984. But what is unexpected is [the
paradoxical observation that if one looks at the combined
accounts of the nationalgovernmentand the government corporate
sector alone, the government seemed to have "overborrowed"_ from
the domestic private sector. _ This arose because I the national
government, on its own account;: has consistently built up itscash balances with the Central Bank in 1986-1988as _:it
simultaneously resorted to the new issue of domestic debtinstruments to cover the same. Thus, while economic theory
suggests that there is some room for non-inflationary money
financing of the fiscal deficit, it can be observed that the
national government and the government corporate sector had, infact, detracted from the growth of reserve money during the three
year period under review even as the inflation rate started to
rise in the second quarter of 1987 and the Plantarget exceededin 1988.
Concomitantly, there has been a substantial increase in the
amount of new issue of government securities left in private
sector hands. Earlier studies point to the significant crowding
out effects of increases in privately-held domestic government
debt and suggest that such a practice tends to exert undue
pressure on the interest rate with the concomitant adverse impacton the level of private investment and economic growth. On the
other hand, a closer examination of the data reveals the fact
that the excess of national government domestic borrowing over
the conventionally measured fiscal deficit isl 'linked • to the
massive deficits of tile Central Bank that may have resulted from
itsk quasi-fiscal activities. Given 'the amount of external
financing available, the size of the combined fiscal and quasi-
fiscal deficit, i.e., the consolidated public sectdr deficit, ' in
1987-1988 appears to be inconsistent with other macroeconomic
targets as reflected in the upward pressure on _both theinflation rate and the interest rate. This is contrary to the
s of a truly prudent fiscal.policy. What is manifested,re, is a need for (i) a closer examination and firmer
control of the consolidated public sector deficit over and _above
the concern for the conventionally defined fiscal deficit,_ and
(ii) a review and a re-delineation of the appropriate role of the
Central Bank in carrying out so-called quasi-fiscal activities.
Third, the government's record with regard# to fiscalmarksmanship in its demand management program in 1986-1988 is not
very encouraging since it has exhibited a marked tendency to
overestimate the expansion or contraction in the fiscal impulse
necessary to achieve its growth targets. This experience shows
that the government should exercise greater circumspection in the
use of fiscal policy to actively influence aggregate de_,a_d and
overall economic growth.

B3
Fourth, this review reiterates its earlier observation that
there is a need to improve the revenue performance of the
government. While the elasticity ef the tax system has recovered
from _ the slump it_suffered in 1980-1985, it has_ not improved
enough to surpass its pre-1980 . level which is. low _ by
international standards. At the_same time, other studies (NTRC
1986,,: Manasan 1988a} indicate that the amount of-_ potential
government revenue_ _foregone _because.;of_ tax_ _ evasion , is
substantial. Furthermore, the present paper also stressed that
tax evasion weakens the tax system in terms of both horizontal
equity and economic efficiency_considerations. Thus, at this
point,_improvements in tax compliancesand tax administration hold
greater promise than increasing tax rates ; or introducing new
Fifth; in principle, the 1986 tax refg_Dackage scores high
with regard_ to both resource_al-loca_T6n and equity goals. Theefficiency gains are large specifically in the_shift towards a
more global approach to individual income taxation_ the separate
taxation of married_ couplesr the elimination of the double
£akation of dividend _ncome_ t_e application of a Single rate 0n
dorppra£e income, the introduction of the VAT, the elimination of'the export tax, and the abolition of the excise tax on fuel oil.
Similarly, the potential impact on the redistributionalcharacteristic of the tax system of the new tax measures like the
modifications in the individual income tax, the excise tax onfuel oil, and the VAT, is positive.
Some problem areas still exist in the tax arena.
(i) It is unfortunate that the proposal to impose ceilings
on allowable income tax deductionswas not implemented. The
failure to _ plug what could be one of the principal sources of
leakage in the tax collection machinery" jeopardized the potential
gains: from the modifications in theo structure of individual
income tax under the 1986 tax package. At presentl a bill
regar_ding this matter is_pending in Congress. The enactment oflegislation or the issuance of an administrative order_that will
effectively deter excessive claims _for business expense for tax
purposes will not only yield positive results in _ revenuemobilization but will also enhance the realization of the
envisioned improvements in equity and economic efficiency of thetax package.
(ii) Because the Philippine version of the VAT exempts moretransactions, it has a narrower base than that of other countries
like Indonesia and New Zealand. This has resulted in the
incomplete elimination of the distortionary effects of inputtaxation, contrary to the underlying philosophy of the VAT, _and
64
the lower than projected revenue yield of the .VAT in its first
year of implementation. 29/
:, (iii) The present system of' taxes on passive income and
capital income yields highly unequal effective tax rates and is,
thus, nOnneutral with respect to;the allocation of savings into
alternative forms. This is.::Ja'-'rather: complex area" with_ .no
straightforward solutions. (Further' study is, therefore,recommended ' '
i,
(iv) Historically and.prospectively, the government' has
shown.,atendency_to rely heavily on excise taxes. 30___/ While saidtaxesL,r-_are easy_to:collecti they_are, highly regressive_ In'this '
" light, it would perhaps be wiser to concentrate on improving the
revenue yield of the VAT, a confirmed money maker in other
countries,: than to continue this.dependence on excise taxes.__ : _ _ •
(v) The shift to pre-1983 type:investment incentives _andthe
introduction of the tax holiday_i_bseen as a retrogression_in- the
industrial promotion strategy. ,This is because of the capital
bias _of the 1987 Omnibus Investment Code, its perverse effect
of benefiting the -national,coffers of ,the _ capital exporting
countries rather:than the foreign investors Jr'seeks to..:attract.;
and'the deterioration in its ability to counteract the' .'biasagainst exports that is inherent in the prevailing structure,' 'of
protection. It is recognized that, at thispoint, it is not
possible to simply revert back tothe'1983 incentives because of
the Philippine accession to the GATT. The new challenge is the
design of innovative performance-based incentives that-do not
invite countervailing measures from our trading partners.
(vi) Given the limited financial resources available to
local governments units, it is imperative that they harness the
full potential of the real property tax as a revenue source.
This can be achieved through the regular updating of assess'ed
values- of real properties to reflect changes in ._ the cu'rrent
market value and increased efforts in the area of .tax mapping.
While existing legislation=provides that a general reVision;,of
property values be undertaken once in three years,' it is _truly
unfortunate that .the political will to implement this has not
29/'UndoUbtedly, inadequate prior preparation fO_ the
implementation, of_the VAT also_contributed'.significantly to _the
VAT's underperformance with respect to revenue generation.
30/There is a pending legislative proposal to increase
excise taxes on certain alcoholic and tobacco products in 1990.
B5
been evident in the last decade. 31___/ Furthermore, the presentpractice of using "actual use" as the basis of the assessed
value, the imposition of differential rates on different forms of
real property, the highly discretionary system of establishing
property values for tax,purposes and the ropts of the poor
•compliance should be re-examined to improve the resource
allocation effects and the revenue yield of the real propertytax. . ' _:
Sixth, the years 1986-1988 witnessed an unprecedented growth
in the size of the national government budget in •nominal terms
and relative to GNP. In fact, in 1988) total government
expenditures, on an obligation basis, reached 23.1 percent_ ofGNP, its highest level in the last twenty years or so. These are
rather misleading indicators ••of the size and growth of the
government in the period and illustrates very well ,,the
observation that it is not only the s_iz__but also the co__m_Qs_iQn
of government expenditures that is _important in defining its
overall economic impact. In this light, several observationsdeserve special interest." :...... _:_
(i)' An analysis of the sectora! ......distributioD of thel_ !
national govern_d-Sudget, furthe_ highlights an earlier pointi Imade in tSis study _ tha_- debt service accounts for _ _a'_!
disproportionate share of total government outlay in :the lasti
three years. It is beyond doubt-_hat, this huge debt burden hasihampered_the government's capacity to provide adequate servicecto,i
the people. In 1987-1988, interest payments and principal 'amortization _combined accounted for close to 50 percent of the
national_ budget. Thus, relative_ito GNP aggregate governmentexpenditures net of debt service and net lending in 1986-19_8
contracted reiative to that in previous decade. : _ ,
(ii) Abstracting from the constraints posed by thegovernment's debt burden, the Aquino administration has favored _,
in terms of budget allocation, the social service •Sg_tqrsrelative to the other sectors in contrast to the previous
•regime's tendency to pour more resources into the economic
sectors. This tendency is particularly pronounced in educaEibnwhich-r%ceived substantial increments in its budget share in the
last three years.
(iii) The government expenditures on defense and peace and
order was on an uptrend in 1986-1988 following a persistent
decline in the Marcos years. Despite this development, the
..... ,The Marcos government suspended the revision scheduled in
1984 while the Aquino administration .likewise,, suspended the
implementation of EO 73 (issued in•_1986) which provides for_ what
could have been the first general revision of assessed values of
real properties since 1979.
66
Philippine defense budget, in[GNP terms, is one of the lowest inAsia 1
(iv) Expenditures on public administration proved to be the
most resilient item in the:government budget. It was practically
spared the belt-tightening measures imposed during the crisis
years. Furthermore, expressed as a proportion of GNP, publicadministration expenditures rose in an unabated fashion in ,the
last three years such that in 1988, its level reached its highestin the last 15 years. At the same time, it is noted that the
record-breaking rate of growth in government _ expenditures onpersonal services in the last three years is attributable not
only to the salary adjustment granted government workers butalso
to an increase in the number of personnel. This is rather
surprising given the government's promise to c0meup with aleaner bureauracy. , :
(v) Government expenditures On the infrastructure utilities/
sectors in 1986-1988 has hardly risen above the levels set by thecost-cutting measures of the crisis years. _ In a related
development, capital outlays exclusive of net lending havecontinuously declined since 1983, relative tO GNP and fn _ real
terms• This protracted contraction in _ __public investments
particularly in infrastructure_ and utilities is alarming _ giventhe well-established theoreticaL and empirical link _ between
investment and economic growth_ Furthermore_ outlays on
maintenance and other operating _exPenditu_es in ,1986_1988_do_:nO_
appear to have recovered _ from the expendfture,cuts imposed duringthe: crisis years_ This would _have an adverselY'effect _ on -_the
government's ability to prevent the premature de{eribrati0n of
its existing stock of capital:aSsets • and may exert addifional
pressure on the future demand _ fo_ public capital !formation. _;_"
(vi) The remarkable reduction in national governmenttransfers to GOCCs under the Aquino government is cOmmendab!el
While this development may_ partly be explained by the scaling
down _of the investment programs of most government corporations,'it may also be attributed to some improvement in _ the _ financialperformance of £be same and may be reflective of some succesS in
the_ government's efforts to rationalize the government corporatesector.
Seventh, under present accounting conventions/ _ tax
expenditures like tax exemptions/deductions/credits granted :by
agencies like the Board of Investments tospecific private andgovernment corporations are not included in the national
government budget. There is some evidence that the amount
involved here is sizeable. Since the revenues foregone in this
manner are in essence spent by the government, it isbut properthat tax expenditures be _included in bot_ the revenue and _the
expenditure side of the government budget and thus, should n0t be
spared of the budgetary allocation process. It is hoped that in
enhancing the transparency of the government account'ing : system,fiscal discipline will also be promoted.

67
Eighth, in the first half of the eighties, the government
corporate sector experienced an unprecedented growth in terms of
both number and assets that was accompanied by a great deal of
inefficiency that has resulted in a huge outflow of resources
from the national treasury. The first three years of the Aquinoadministration saw the fruition of earlier efforts to rationalize
the public enterprise sector. TheMedium Term Development Plan
enunciates a four-point program that seeks to limit the use of
the government corporate form, dispose existing governmentcorporations which do not meet certain criteria, establish an
integrated system of performance evaluation, and improv e thesystem of supervision and control of government corporations.
Soon after it assumed power, the Aquino government, underthe aegis of the Presidential commission and Reorganization,
embarked on a review of existing GOCCs for the purpose of
recommending government dispositive action on said corporations.
After its creation, the Committee on Privatization, together with
the Department of Budget and Management, subjected the above-mentioned recommendations to further study. The slowness of the
decisionmaking process regarding the disposition of some 249
GOCCs bordered on feet-dragging (as of the end of July 1989, no
final decision has yet been reached on the fate of eight GOCCs
facing abolition). What is even more disappointing, however, is
that the final list of retained corporations included a number of
corporations that do not satisfy the requirements outlined in
official policy statements. Also, the requisite legislative
action with regards to the charters of the GOCCs that are up for
abolition, regularization or consolidation is still sorelymissing to date.
While the GCMCC has improved the monitoring of GOCCs under
its wing, thereby promoting some fiscal discipline in the conduct
of these GOCCs, the oversight responsibility of the GCMCC islimited to only 14 corporations. Furthermore, no incentive-based
performance evaluation system that defines the quantifiable
performance criteria and sectoral norms or standards has been put
in place to date. It is also noteworthy that DepartmentSecretaries and Undersecretaries continue to hold seats on the
Board of numerous government corporations. In this regard, this
paper concurs with the recommendation made earlier by some groupsthat a Government Corporate Code that embodies the framework for
the operation and administration of GOCCs be enacted. Care
should be exercised that said code should promote accountability
in the context of greater operational autonomy. Such a codeshould be a useful instrument in the further rationalization of
the government corporate sector and should help prevent theundeterred growth of GOCCS in the future.
Ninth, the government's privatization program that coversthe divestment of government ownership of some GOCCs and of the
nonperforming assets of government financial institutions, has
been hampered by legal impediments in the disposition of these
68
assets. Possible solutions to this problem include: (I)legislative action that will facilitate the conversion of
financial claims to physical form assets, (2) the creation of aspecial Court to try collection cases with the end in view of
_speeding up foreclosure proceedings, and (3) the use of
compromise foreclosures, e.g., via the direct-debt-buy-out, bid-
out with escrow provisions, etc., outside the existing judicialsystem. Although the evidence to date indicates that the direct-
debt-buy-out does not suffer from lower the average recovery
rates, the other alternatives are still worth exploring in the
interest of greater transparency in the disposition of government
assets. Finally, the government seems to have given very littleconsideration to the distributional implications of the various
methods of privatization that are available. Thus, publicoffering of shares has been utilized to a rather limited extent.
In this regard, the government should study the different modesin countries like Jamaica and South Korea that seeks to allocate
more shares to small buyers.

69
AnnexTable 1'SOURCE6OFCHAN6EIN RESERVEBONEY,1984-19881/
(In PM)
CHANGEIN LEVELS 1983-84 1984-85 1985-86 1986-87 1987-1_
ReserveBoney 5722 4541 11997 6881 9682
Net Foreign Assets -16838 -_2888 -14516 -7875 9761Net DomesticAssets 22568 _7421 26513 13949 -73
Net Claims on Deposit HoneyBanks(OHB) -7596 -18228 1924 18225 2585Net Claimson Public Sector (PS) -5B86 9195 -8314 -31939 -66|23
Net Claimson NaLiona[Government(HG) -4235 4268 :7838 -32228 -18243Net Claims on Other8overnment -851 4927 -4B& 289 -47788
Net Claims on Other Financial 3128 -374 -7722 -754 2253Net Other Items 32114 38828 4g625 28413 12671
e
PERCENTOISTRIBUTIONOFCHANGE 1903-84 198.4-85 1985-8k 1986-87 1987-88
t
Reserve]_oney 1B8,gg lgB.g8 " l_g.Bg : IBg.gB lgg.ll8
Net Foreign kssets -294,27 -724.87 -121.gB -182.83' lgg,B2Net DomesticAssets 394.27 824,87 221.08 2g2.75 -8.75
Net Claims on O_B -1_2.75 -225.06 16.84 264.98 26.78
Net Claims on PS -88.09 282.49 -69.38 -464,23 -681,91Net Claims on N6 -74.8[ 93.99 -65.27 -468.43 -188.42Net Claimson OtherGovernment -14.87 I_8.5g -4,_3 4.28 -493.49
NetClaimson OtherFinancial 54.67 -8.24 -64.37 -18.96 23.27
NetOtherItems 561.24 854.88 33fi,63 412.98, 138.87
1t
Calculated basedon data from the Central Bankof the Philippines.

Annex Table 2 O
BALANCES OF THE NATIONAL GOVERNMENT BY DEPOSITORY, 1984-1988
(Levels: _M)
End of Period Levels Percent Dis_rioution
Grand Central Others Grand Central Others
Year Total Bank , Treasury Total Bank Treasury
1978 9301 2164 7 7130 100.00 23.27 0.08 76.66
1979 12557 2204 40 10313 100.00 17.55 0.32 82.13
1980 13994 1642 10 12342 100.00 11.73 0.07 88.19
1981 17315 2644 29 14642 100.00 15.27 0.17 84.56
1982 15423 2203 117 13103 100.00 14.28 0.76 84.96
1983 18061 3214 101 14746 100.00 17.80 0.56 81.65
1984 27382 10652 930 15800 100.00 38.90 3.40 57.70
1985 28196 7616 572 20008 100.00 27.01 _ 2.03 70.96
1986 27731 14403 318 13010 100.00 51.94 1.15 46.92
1987 5,3052 43636 281 9135 100.00 82.25 0.53 17.22
1988 70432 61687 270 8475 100.00 87.58 0.38 12.03
Source of Basic Data: Bureau of Treasury.

71
Annex Table 3
91-DAY TREASURY BILL RATES, 1985-1989(In %)
Nominal Real _
1985 26.7 5.8Q1 33.9 -8.5Q2 34.7 1.6Q3 21.5 5.8Q4 16.6 16.8
1986 15.8 13.2Q1 22.0 18.3Q2 17.-0 15.9Q3 13.0 14.4Q4 10.7 3.31987 11.5 7.7QI 9.5 10.1Q2 11.5 8.8Q3 11.7 ' 5.4Q4 13.2 8 31988 14.7 5 9Ql 13.0 4 1Q2 14.8 5 5Q3 14.6 8 4Q4 18.2 7 6
Source: Central Bank of the Philippines.
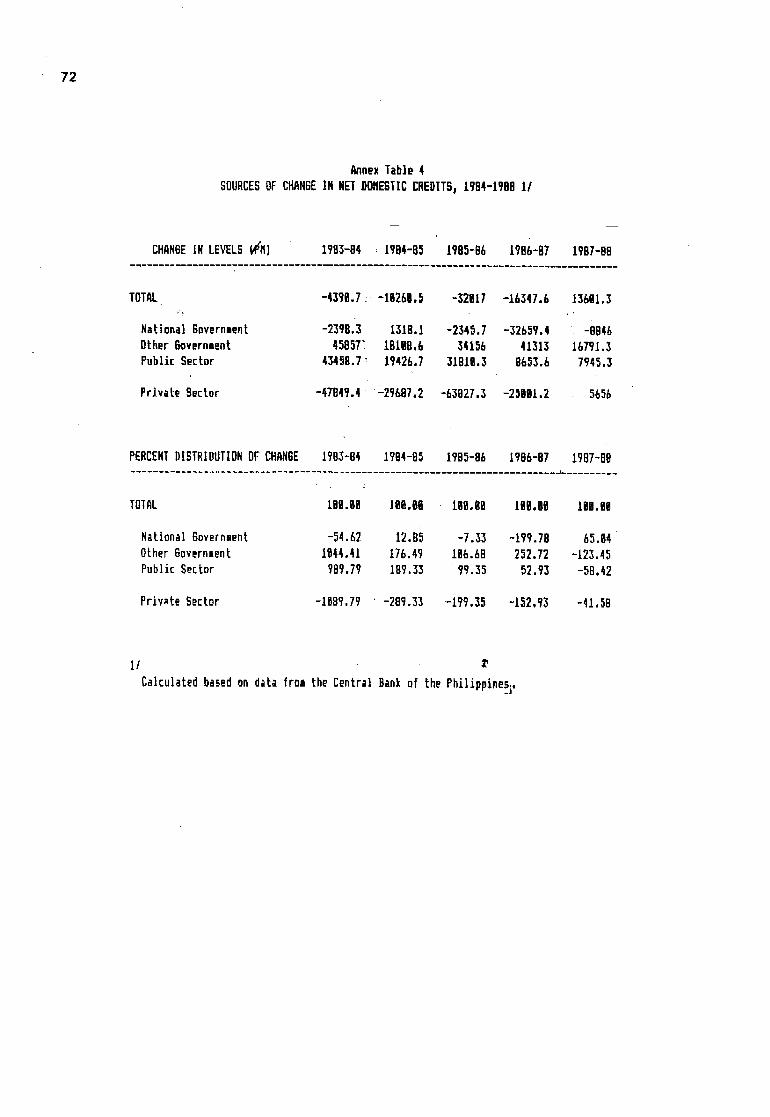
72
AnnexTab]e 4SOURCESOFCHAH6EIN NET9OflESTICCREOITS_19B4-19BB11
CHANOEIN LEVELS_M) 1963-04 _ 19B4-85 1985-86 1786-87 1967-80
TOTAL -419g.7 :. -19269.5 -_2917 -16347.6 13691o3
National Government -2398,3 131B.1 -2345.7 -32659.4 -6046Other 6overneent 45857; 1BLB8,6 34156 41313 16791.3Public Sector 43458.7_ 19426°7 31016,3 0653.6 7945.3
PrivaLe Sector -47047.4 "-2%87.2 -63827.3 -25691,2 5656
PERCENTDISTRIBUTIONOFCHAH6E 17B_-84 1994-85 1985-86 1996-B7 1987-69
TOTAL iBO.Og 196,06 166.06 199o00 lOB.DO
National Government -54,62 12.B5 -7.33 -199,70 65,64Other 6overnlent 1844.41 176.49 18_.6B 252.72 -123.45Public Sector 989.79 189.33 99.35 5233 -58,42
PriYate Sector -1689,79 -209.3_ -199.35 -152,93 -41.50
Calculated basedon dale froa the Central Dankof LhePhi]ippine_].

73
AnnexTable 5
8RONTHRATEOFGOVERHBENTREVENUES,1975-1988 1/(InZ)
1975-1985 1975-1982 1983-1985 1986-L988 1986 1987
I, TOTALREVENUES 15.17 12.44 21.8B 17,71 14.51 38.25
TAXREVENUES 16,16 11.75 21.97 13.68 6.5i ]1.28
Bureauof Internal Revenue 21.36 18.22 2%81 14.83 9.41 25.21
DomesticBased 2_.88 18.18 27,4N 16.35 12.97 25.55Income & Profits 19.77 15.47 38.44 13.68 2,b4 13,84ExEise 22.3a 18.8_ 32.89 1_.27 21.5Q 38,28Sales Tax and Licenses 19.38 2Z.94 15.81 19.51 2B.96 3i.23
Tax on FropertyOther Dom_stiETaxes 19.83 47.93 25,32 4.29
International Trade 2B7.68 -78698 -28,57
Bureauof Customs 9.51 B,55 11.79 13.h9 2.78 48.5b
ImportDutiesandTaxes 11.51 11.97 IB,45 15.99 5,28 54.88
Export laxe_ -3.81 -28.74 Dl,lB -8i.5b -36.11 -97.65
OtherOffices 8.9_ _ 13.83 -1.78 -38.57 -29.57 II,75)
NON-TAXREVENUES 9,53 5.14 2_.49 42.93 78,44 25,72
HeadItem: GNP 17.91 16,61 21.82 II,48 ),41 14,42
1/Calculated based on data from the Bureauof Treasury (BT).

,,LI
GOVE_I_NTREVENUESASAP_fIOM OF_:_ II "
1975 1976 1977 1978 1979 I900 t881 1982 1983 J984 t985 1986 1987 1988---- r
I. TOTALREYENUES 14.I29 13.479 I3.023 I3,599 [3.5t0 13,I29 11,835 tl.390 12,048 10.804 fl.599 t2.892 14.874 13.10t
TAXREYEHUES 12.018 11.421 t].063 _1,541 11,905 1],542 10,349 t0.016 10.521 9,523 10.303 [0.654 12.215 10.968
Bureauof I_LernalRevenue 11.390 6,500 0.584 6.137 6.733 6.566 8.040 5,940 5.621 5.873 7.I96 7.814 8.331 t0.908
Oor'_tJcBased 5,393 6.500 6,584 8.731 5.733 6.550 6,034 5.923 5,6[2 5,764 5,917 7,551 8,292 7.863[ncoret ProfiLs 2.684 2.718 2.658 3.092 2,041 2.148 2.555 2,500 2.391 2.306 3.I38 3.115 3.099 3,327Excise t.574 1,887 1,918 2.015 1.923 1,029 1,676 1,713 1.676 _,975 _.268 2._65 3.219 2,379SalesTaxandLicenses I,t35 1,177 1,473 1,307 1,747 1,770 1,561 1,467 1,301 1.249 1,286 1,504 1,725 1,584TaxonProperLy 0,000 0.000 0.000 0.000 0.000 O,O00 0.000 -0.000 0,000 0,000 0.000 0.000 0.000 0.046OtherOoiesLicTaxes 0.000 0,718 0,525 0.323 0.223 0,204 0.241 0,237 0.244 0,233 0,225 0,273 0.249 0,526
[nLernaLJonalTrade 5,996 0.000 0;000 0,000 0.000 0,015. 0.014 0,017 0.009 0.108 0.279 0,057 0,040 3.[05Trave_Tax 4.TIf 0,000 0.000 0.000 0.000 0.015 0.014 0.017 0.009 0.037 0.243- 0.053 0.040 0.000ForeJBnExchan9eTax 1.285 0.000 0,000 0.000 0,000 0.000 0,000 0.000 0.000 _.071 0.036 0,004 0.000 0,000
Bureauof CusLo_s 0,000 4,598 4,100 4.424 4.348 4,382 3,666 3,006 4.353 3.265 2.823 2.846 3,695 0.000
lmporLOuLiesandTaxes 0,000 4,179 3.7t0 4,176 4.0]0 4.22t 3,562 3.521 4.284 _,935 2.855 2,743 3,093 0,000ExporCTaxes 0,000 0.420 0.390 0.248 0,338 0,161 0.104 0,086 0.069 0.330 0.168 0.104 0,002 0.000
OLherOffices 0,620 0.323 0,379 0.306 0.824 0,595 0,836 0.531 0.547 0,385 0.284 0,194 0,189 0,000
NO_XREVERES 2.7|2 2.058 1,960 2.052 1,512 _,587 1.485 1.3t4 1.527 1.281 !.297 2,238 2.458 2.732
1/CatculaLedbasedondaLafro_theBureauof Troasury(BT]andNational$LatiSLicalCoordinaLionBoard(HSCB).
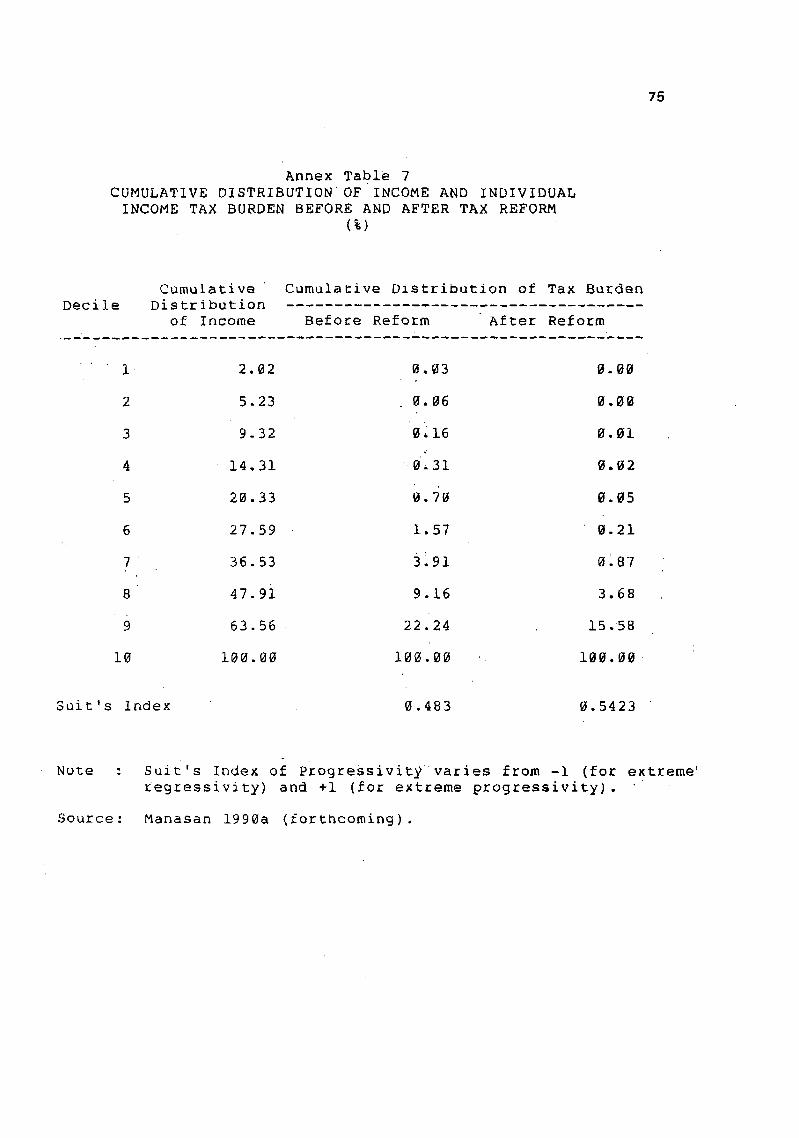
75
Annex Table 7
CUMULATIVE DISTRIBUTION OF INCOME AND INDIVIDUAL
INCOME TAX BURDEN BEFORE AND AFTER TAX REFORM
(%)
Cumulative Cumulative DistriDution of Tax Burden
Decile Distribution
of Income Before Reform After Reform
1 2.02 0.03 0.00
2 5.23 0.06 0.00
3 9.32 0.16 0.01
4 14.31 0.31 0._2
5 20.33 0.70 0.05
6 27.59 1.57 0.21
7 36.53 3.91 0.87
8 47.9i 9.16 3.68
9 63.56 22.24 15.'58
10 100.00 100.00 100.00
Suit's Index 0.483 0.5423
Note : Suit's Index of Progressivity varies from -1 (for extreme
regressivity) and +i (for extreme progressivity).
Source: Manasan 1990a (forthcoming).

AnnexTable B
NOMINALTAXRATES,EFFECTIVETAXRATESANDTAXATIONOFINPUTS[NPLIEOBY THESALESTAXSTSTEHOF1987 ANDVAT OF1908
t :: _ 1988 L 9 6 7:Code] D E 5 C R ] P T ] O N E T E-T E T E-T
i :Palay 6.612266446 6,681638965 6.611167535 6.846247775 6.614114678 8.8321328962 _Corn' ',g.668582591 8.668445696 6.969136785 9_633675982 6.669972651 9.6231632313 ICoconut ',6.663847476 6.666279266 6.663568266 D.611767225 g.662569057 6,6691373674 ',Sugarcane 19.616447426 6.96634641[ 6+616161614 6.639675662 6,611169676 6.6287659925 ',Banana ]8,613561164 6,962457445 8.811193719 6o643J46775 6.6|2491813 6.636654962
6 ',Other crops incl. aerie, services :0.68416I_96 6.6n528914 6.663572476 0.613143112 6.663664236 6.6694796D17 ILlvestoc_ and its products :6.613263549 8.666937764 6.912325844 6.129356417 9.644499736 |.664856687S [Poultry and its products ',6._14445_73 0.691494834 6.612951139 9,115677619 6.646369649 6.0755679709 _Fishery _6.616873366 6.602866967 6.614066492 6.636363596 6.687185693 6.629176497
iB ',Forestry and logging _6.916699676 6.666966_91 0.699114276 6.626449509 6,66215_766 6.61929574911 ifletaIlic aining ',6.i6%5247B 6.691511._47 6.6231411_1 6.291155546 6,154212DIJ 6.64694353512 INoneeta]lic eining and quarrying :6.163973213 6.684486534 6.619S66679 6.198515267 6.159656564 6.6398647621_ _Rice and corn tilling ',6.61217_114 8.666665681 8.612J67432 6°637713998 6.D66616939 6.63776366714 ',SugarnHiing and refining _6.613767193 6.606216126 6.613486967 6.669463913 6.638597217 |.63687659615 :Hi]k and other dairy produrLs :8.972417967 6.633266266 6.B36131787 6.195166289 6,965134584 9,19997376416 ',Coconutoil, cake and eeal _8.183457_77 8.976826654 8.626637322 6.693691949 6.644567996 6.0491239_917 ',RefinedcookinU oi1 end eargarine _6.1651594% 8.639663137 6.665295._59 6.244766395 6.154696265 6.666684196J8 ',fleet and neat product5 ',6.|57649966 6.644694051 6.61276461_ 6.173546549 0.683677666 6.969962949
19 ',FLour and other 9r_in a/L1 products ',0.69962316! 6.672319795 6.627363365 6.266692266 9.146796326 6.85999506026 ',Anieal feed_ :8.621371783 8.664698375 6.687273327 6.269916771 _.1_5997855 6.654626915
21 luther processedfood 16,182948459 8.6681986_5 6.834749624 H.227599923 6.146443766 6.681156135
22 [Beverage industries ',6.1_76165_ 6.6_1894966 6.636966766 6o229_88511 6.1414233?5 6+68695711623 ',Tobaccoeanufactures 16.699115323 8.656266898 6.642915224 6.667222163 6o6L9149579 _.646673594
24 ]]extiZes and textile goods :6.165594872 6.650813327 8.646781545 6.266576229 B.i12647_36 6.99452869325 ',HearJn9 apparel and foot_ear ',6,699771466 _.65218916_ 6.6475822_9 6.192396765 6.694336681 6.6986_962326 ILueber, ply.nod andveneer :6,168356278 6.685992526 6.622357758 6.266916934 6.161713132 6.64516_70127 _Other _ood_ cork and cane pro_cts _6.19189971._ 8,669165444 6.D3_734266 6.266917_14 6.i41365986 6,96561153426 _Furniture and fixture_ ',6.163126777 _._44525469 6.6586_1368 6.224465156 6,116484464 6.11396674529 _Paper and paper products ',6,116111B55 6,854525236 6.D_5586618 9.346293716 8.195664298 6.15862941736 _P_biishing and printing ',6,677794271 g.925322564 0.652461766 6.24]349639 6,693824917:6.149S24721_1 :Leather and leather products :0.699773472 6.659693_36 6.639886141 0.275627_59 0.1651453_9 6.11669262132 _Rubberandplastic products 18,i62928_31 8.651367416 6.651561615 6.212176263 6.16_276117 6_160966686
33 ',Drugsand aedicines ',6,164496_B- 6.655D16765 6.649485363 6.286456999 6.1644144?9 6.12236956634 IBasic industrial chat!tale ',g,166742453 6.654362566, 6.652379947 6.246826156 6.156635722 6,69618443335 :Fertilizer :8,686175177 0.621455381 6.856719795 9.255654176 6.12922515B 6.12662962636 ',Other chemical products ',6,1_2966194 6.6493727B6 6.954433494 6.236922719 6,149936915 6.686965814
37 ',Pairs]nun products :6.999995666 8.642875193 6.657126473 6.192647211 6.661676644 6,116_76]_T_6 _CeaenLlanufacture ',6,133266767 6.676596567 6.656686199 6.262764669 6.149696357 6.11291425!39 ]Other nonaeLallic eineral products ',_,169._66959 6.666467_6 6.649613279 6.2465574_5 6,142119812 6,69643768_46 ',Basic metal indusLries :6,116269198 0,642473976 _.667915217 6.21!665198 6.666129572 6.131536625
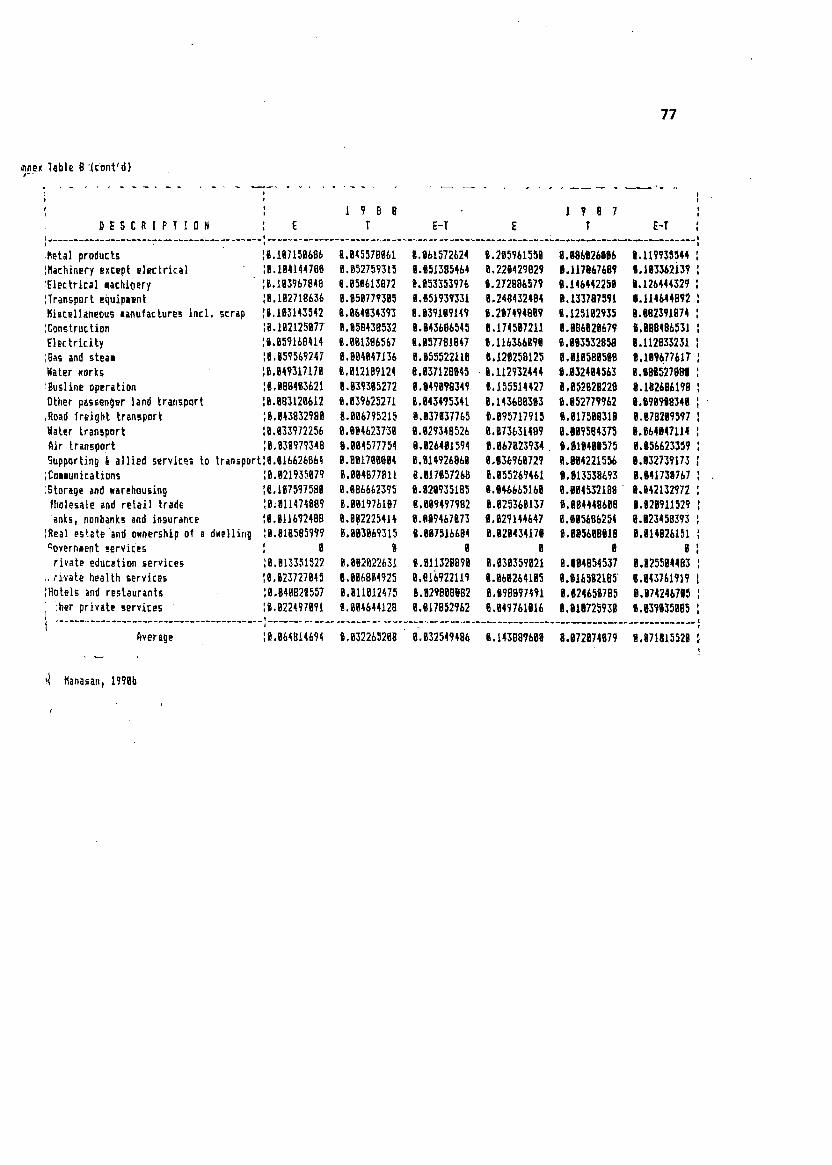
77
innex]able B _cont'd)r,,,
I _ ]98B 1787
I DESCR I PT [ ON : E T E-T E T E-T
;Beta] producLs I!,187159686 8,845576861 8,i61572624 8.285961558 8.186626D06 6,119935544IHachinery except electrical _8.184144788 8,852759315 8.8513854_4 8,228429629 |,117g67689 8.16_36213?IEIectrica| lachLoery _8.18_967848 g.95661_672 8.85335_976 8.272886579 6.14644225g L126444_29ITransport equipeent :8.182718636 8.858779385 0,851939331 8.248432494 0,1337675_L 0.1]4644092iMiscellaneous manufactures lncl, scrap 10,16_143542 8,66483439_ 8.83?189149 8.2074?4889 8.1251029_5 8,862_91874IConetruction :B.162125077 [.8584385_2 8.843686545 6,174567211 8.886826679 B.8894865_JElectricity :8.8591_84L4 g.881386567 8.857761667 8.116366696 6.66_532858 g.11283_231;Gasand steam _B.859569247 _.8648471_6 8,855522116 8.128258125 g,gIBhBg506 0o187677617Hater ,arks ]6._49317178 8.81218912q 8.g_7129645 6.1129_2444 B.63240456_ g.686527888
:Beeline operation ]8.86946362L 8.639_85272 8.949698349 8.1555]4427 8.052826229 6.Lg2_86198Other passenger land transport :6.88_L26682 _,6_962527L 8.643495_41 8,143666_6_ _,952777%2 6,676968346,Roadfreight transport _8,8_38_2988 6.666775215 8.8_78_7765 6.89_717915 _.8175B8319 8.678269597:Hater transport _0.83_972256 6.904623738 8.6293_8526 g.87_|497 6.067584_75 6.6640471]4_Jr transport 18.8_8977348 6.86457775_ g.626461_94 6.66762_9_4 6.61646a575 6.65662_359_upporting _ aJlied _ervices to transport:g.81_26864 g.86178g664 8,614726866 8,6_6%6727 6.604221556 6,632737L7_
;Communications :8.021735879 8.664877Bll 6.617057268 6.955269461 6.61_538_93 6.04173i767
;Storage and warehou_in9 _6,i67597588 8,8866_2_95 6.829935185 6.6%_65J_8 6,6645_2199 6.642t_2_72fholesale and retail trade 18_8]1474669 B,661976J67 6.669497982 8.625_68l_7 6.664448666 6.826911529
oaks, nonbanksend insurance _8.81J692498 8,6_22254J4 6.66746767_ 6.6271q4_47 8,6656662_ 6.623458_9_IReal aerate'and o_nership of a d,e|]ing _8.8]8565999 8.66_fi69315 6.6675J66B4 6.6264_4176 8.665698616 6.6J_826151%vernaent serViceS [ 6 9 8 g 6 6
rivate education service_ _8.8133_1522 B._82622631 6.91J329698 6.836_5982! 6.094854537 6.925594483,.ri_ate health service_ T8.823727945 6.886884925 8.816722119 6.666264LB5 8.616582L85 6.643761919
IHotel_ and restaurants _8.648826557 8.8LL812475 8.829868682 8.696977471 6.624656785 6.674246765
i .................Average 16.864_14_94 8.632265288 6.832547q96 6.[4568%68 8.672674679 6.671815528 _
_1. _anasan_19765
f

78
AnnexTable 9
TAXONPETROLEUflPRODUCT5_1986-i988
Whole- PerrenLof Tax to WPP................... "_.... Gale .........................
Ad Posted AdSperifirValorem Prjre Specifir Valorem
Date Product TOTAL Tax Tax (WPP} TOTAL Tax Tax
Jan.25, 1986 AVERAGE 1.4258 8.6498 8°7768 5.419826,2964Ii,976414.3281Premlum 2,617B 1,4988 1.127_ 7.1268 36.724728.989,_15,8153
Diesel 1.2848 8.2698 8.9358 5.454_22.8755 4,932217.1434
FuelOil B.&848 8.4438 |.241[ 4,1228Ib.5939I_.7472 5.8467
Mar.20,1986 AVERAGE 1.3618 B,6498 @,712g 4.919827.6682 13.193714.4745Premium 2.5678 1.4988 1,8778 6.8768_7.332821.bG% 15,b632
Die_el 1,1218 g,2698 8.8528 4,9948 22,4469 5.38_5 17,86_5Fuel Oil 8.6418 8.4438 8,1988 3.4728 18.462g 12.7592 5.7828
May 22,1986 AVERAGE 1.5368 1.8368 g.Sg@B 4.375835,1886 23,688_II.4286Premium 3.276@ 2.4898 8.7878 6.6868 49,5913 37,6779 11.9134Diesel 1,121B 8.5238 8.59B8 4.474825.8559 11.689813;3661
Fuel Oil 8.6418 8.5118 0.13B8 2.8158 22.7789 18,1528 4.6181Aug. !, 1986 AVERAGE 1.3158 8.9198 B,3968 4.8488 32.5495 22.7475 _.8828
Premium 3.2398 2.4898 8.7588 6,6868 49.8312 37.6779 11.3533Diesel 1.8868 8,5238 g.Sb3g 4.474B24.2736 11.689812.5838
Fuel Oil 8.6418 B.511B 8.1388 2,5838 25.6893 28,4155 5.1938GeL.15,1986 AVERAGE 1,2558 B.9198 8.3368 4.848831.8644,22,7475 8.3168
Premium 3.2118 2.4890 8,7228 6,615848.535,x37.622118.9133
Oie_el 8.9728 _.52_8 8.449_ 4.4.83821.6788 11.664210.8138
FuelOil 8.6148 8.5118 8.1838 2,5845 24.5159 28.4833 4,1126
Nov.I_ 1986 AVERAGE 1._78 %.978_ _,3378 4.853832.247723.9329 8.3148Premium 3.2118 2.4898 8.7228 6,615848.535_37.622118.9133
Diesel 8.9728 8.52_B 8.4498 4.4B3B21.67B8II,664218.8138
Fuel Oil 8.6148 8.5118 8.1838 2.5845 24.5159 28,4833 4.1126

79
AnnexTable 9 (cont'd)
Whale- Percent of Tax to WPP........................ Sale ........................
Ad Posted Ad_pecJfi¢ V_loree Price Specific Valorem
DaLe Product TOTAL_ Tax Tax (WPP) TOTAL Tax Tax
Jen. I, 1987 AVERAGE 1.3938B,9278 6,466g 4,g53B34.369622.8719 11.q977
PremiuD 3.42_8 2.4B98 _.9318 6,bI5B 51.6944 37.6221 14.8724Diesel 1.1558 8.5238 8.6328 4.4038 25.7594 11.6642 14.8952Fuel Oil 8.6658 _.5118. 8.1548:2.5845 26.5522 2g.4E33 6.1489
Mar. 1, 1967 AVERAGE 1.6738 1.8268 B.b458 4.2918 3B.98B6 23.9571 15.g315Premium 3.4568 2.4898 8.9678 6.6158 52.2386 37.6221 14.6165Oiesel 1.31BB _.5238 8.7878 4.4831 29.2163 11,6642 17.5521Fuel Oil 8.7138 8.5118 _.2_28 2.5845 28.4688 28.4833 8.8655
Jul.14,1987 AVERAGE 1.4398 1.439g 4.291B33.5353 B.8ggg 33.5353
Premium 3.5712 3.5712 6.615G 53.9799 8o8888 53.9799Oiesei 1.129G 1.1298 4.4B38 25.1974 8.8888 25.1974Fuel 05] 8.8888 2.5845 8.8888 8.8888 8.8888
Aug. 15_ 1987 AVERAGE 1.4458 J.4458 5.6B38 28.4281 0.g_88 28.4281Premlua 3.5B97 3.5897 7.9158 45.3485 _.BBBB 45.3485Oie_e] 1.1551 1.1551 5._628 21.5_91 _._888 21,_391
FuelOil B.GBgB 2.8225 8.8888 8.ggB_ 8,8ff8@
Aug, 26_ 19B7 AVERAGE 1.1758 1.1758 4,621825,44_7 8,gBBB 25.4447Premium 3.4636 _.4636 7.2156 4G,8882 8.8888 48.8882Di_se} I.g9i9 1.8919 4.9728 21,9574 g,BgBg21.9574
FuelOil 8.8@88 2.B225 g.8888 8,8888 8.8888Sept.!, 1967 AVERAGE 1.2287 1.2287 4.b21426.4141 g.888g 26.4141
PFeeium 3.5374 _.5_74 :7.2150 49.8238 B.8BBB 49.8238Diesel 1,1171 1.1171 4.972822.4642 g.8888 22.4642
Fuel Oil 8.8888 2,6225 8.8888 8.88B_ 8.8888Sept.IB,1987AVERAGE. 1.2287 1,2287 4.599226.5416 8.8gBg26.5416
Premium T.5374 3.5374 7,1B46 49.2359 8.8BBg 49,2359
Diesel 1._171 J.1171 4.9416 22.b@68 B.8888 22.6868Fue] 6i! 8,888_ 2.8225 B.SBgB 8.8888 8,1B88
fiov, I_ 1967 AVERAGE 1.2825 1.2_25 4,59932&,1453 8.88S8 2&.1453
Premiua 3.4765 3,4785 7.I84648,4161 g,GggB 48,4161
Die_el 1.8978 1,8978 4_9416 22.1993 8.8888 22.199_Fuel Oil 8.8888 2.6225 8.88_8 B.BgBg 8,8888
Nov. 19, 1987 AVERAGE 1.1657 _ 1.1657 4.5993 25._452 8.gggg 25.3452Premium 3.3598 3.3_9B 7J1646 46.7639 1.886fl 46.7639Diesel 1.8564 1.8564 4.9416 21.3777 E.8gEg 21.3777FuelOil _.8888 2.8225 8.88gg 8.0888 B._888

8O
AnnexTable9 (cont.'d)
ghole- Percent of Tax to HPP......................... Sale ........................
Ad Posted AdSpecificValorem Price SpecificValorem
Dale Product TOTAL Tax Tax (HPP) TOTAL Tax Tax
Jan. 1_ 1988 AVERAGE 1.8416 1.6416 4.4156 23.592_ g,gg66 23.5923Premium 3.2683 3.2683 7,1846 44,6552 B,Bggm44.6552Diesel L.6761 I_6761 4.9416 21,6549 6.6g66 21.6549Fuel 0i1 B.GHB 2.8225 6.mEg 6.8666 6,680
Kar.I, 1998 AVERAGE 1.|269 i.6299 4.2583 24.1622 6.6666 24.L622Premium 3.I599 _.1599 7.]846 43.9616 6.6669 43,9816Diesel 1.6694 1.6694 4.9416 21.6469 6.6666 21,6409Fuel Oil 6.0666 2.8225 6.6666 6.9666 6,6006
Kay3_ 1988 AVERAGE 1.0584 1.6594 4.5218 2_.4666 6.SOU_2_.4666Premium 3.6421 _.9421 7,1846 42._426 0.6666 42.3426Diesel 1.65L0 1.6516 4.9416 21.2684 6.6666 21.2684FuelOil 8.6666 2,8225 6.6666 6.6696 6.6666
Kay3, 1988 AVERAGE i.0584 1.9594 4.3569 24.2925 6.6g66 24.2925Premium _.6421 3.6421 6.6846 45.5691 6.6866 45.5691Diesel 1.9519 i.6518 4.6916 22.4617 6,8696 22.4617Fuel0il 6.6666 2.8225 6.6666 6;6666 g.GDD6
Jul, li 1988 AVERAGE 6.9633 B.9633 4.2368 22.7355 6.6966 22,7365Premium 3.1066 3,1686 6.6846 46.3942 6.6660 46.3842Oiesel 1,646i 1.8461 4.6915 22,1694 8,8666 22.1694Fuel Oil 6.6660 2.8225 6.6606 0.6866 9.6660
Aug, 18, 1988 AVERAGE 9.9633 6,96_3 4.1625 23,4868 6.8666 23.4868Premium 3.16B6 3.1866 6.4846 47.8149 6,6666 47,8148OieseI 1,8491 1.6461 4,3916 23.6939 0,6666 23.6839Fuel Oil B.DGDD 2.8225 B,6U6 6.0666 6.6660
Sept, I, 1988 AVERAGE 6.8963 0.0963 4.1242 21,7_27 6.9660 21.7327Premium 2,.8742 2,8742 :6.4846 44,32_5 U.DggB44.3235Oies+l + 6,_9258 6,9258 4.3916 2t.6612 6.6666 21.8812Fuel Oil 6.6666 2.8225 6.6666 6.6968 D.8gg6
Hov.lj 1988 AVERAGE 6,8044 6.8644 4;1599 19,3789 6.6666 _19.3789Premium 2,5261 2.5261 6.4S46 38.95_4 6._66_ _8.9554Diesel 6.7932 8.7932 4.3916 18.8618 6.6666 18.6613Fuel 0il 6.606_ 2.8225 6.6660 0,6669 6,0666
Nov, 8_ 1988 AVERAGE 6,6644 6.864.4 _.3852 23.762_ ,6.6666 23.7623' Premium _' 2;5261 2.5261 5.4846 46.6591: 6.6866 46.8581
Oiesel 6.7932 6.7932 3.3916 23.3672 6.6666 23.3872Fuel Oil _ 6.9666 2.3225 g,DOD6 O,D666 _,POO6
Source: Annex26 of the Final Report of the Ad Hoc lnter-A�ency CoamilLeenn Petr_,_zProductYa_Structure(July26,19_),
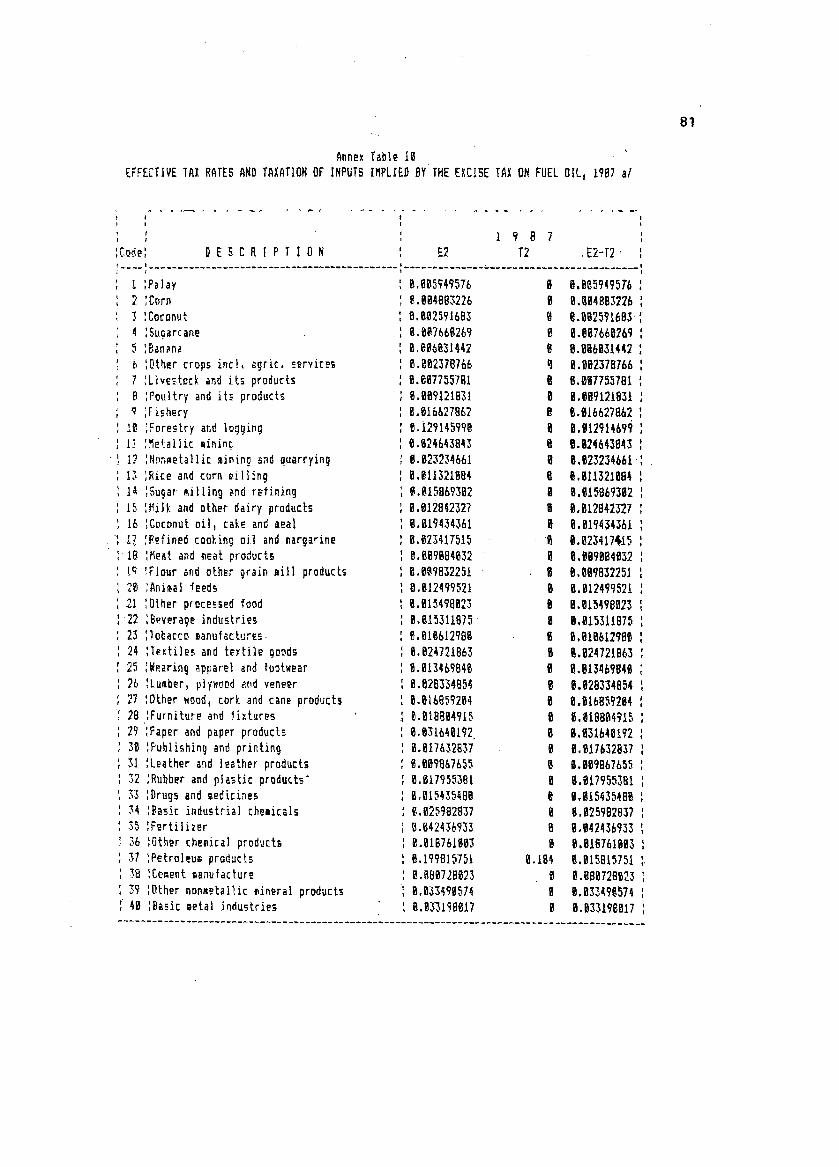
81
AnnexTable19
EFFECTIVETAXRATESANDTAXATIONOF INPUTSIMPLIEDBY THEEXCISETAXON FUELOIL,1987a/
I I+87 tICode: D E _ C R I P T I 0 N E2 T2 ,E2-T2. I
I :Palay B,995Y49576 6 6,695949576
2 ICorn 9.684B93226 B 9,89489322_3 ICoconut 6.0025916B3 O 6.692991683
4 :Sugarcane 9.997669269 @ 6,96766626g9 :Banana 9,_969_J442 @ 8,9969_1442lOthercropsinc],_gric,_ervi_es 9.662_78766 _ 9,992378766
7 IL]v_stockanditsproduc_ 6,6677_578! 6 6,66775_781
8 :Poultryandi_sproducts 9,9671219_! e 9.989121831
g ;Fishery B.916627862 D 6._16627862
IB iForestryandlogging B.i27145976 6 B._129146??11 l_tallicminin_ 6.92464394_ 6 6,62464384_
12 IN_nmetal]icminino_ndquarrying 6.623234661 _ 6,9232_4661
13 :Riceandcornmilling 6.611321684 0 9,BI1321664
l+ ISugarmillingandre_ining B,615869362 @ B.915869362
I_ IHJIk andotherdairyproducts 6.612842327 6 B.912842327
16 :Coconutoil,cakeandmeal 6.6194_4361 6 9,919434361
l_ IR_finedcookingoil andmargarine 6.623417515 '6 0.623417_15'18 :Heatandm_at products B.6696846_2 9 9,6DgDB4932
lg!Flourandothergrainmillproducts 6.6998_2251 6 8,B99852251_6 :Animal4eeds 6.612499521 B 9.@12499521
21 :Otherpro_es_edfood 6,61_498923 6 6.91549862_22 :Beverageindu_trie_ 6,61531187_ 9 0,81_31197523 :Tobaccomanufactures. B.619612999 9 6,919612g8_
24 :textilesandt_xtileQoods B.92472186_ 9 B,624721963
25 _Wearingapparelandfootwear 9.91_4696_9 9 @,61_46794_
26 :Lumber,p_ywoodandveneer 9,628334854 6 6.6283348_4
27 :Other_ood,Eorkandcaneproducts 9,616857264 6 6,61685_294
28 :Furnitureand_ixtures _,91689491_ 6 6,6188P491_
29 :Paperandpaperproducts 6.631_49172 9 6.631_4_!?236 :Publishingandprinting 9.617632837 6 6.917632837
31 ILeatherandleatherproducts B.6698_76_5 9 9.69986T655
32 :Rubberandplasticproducts" 9,61795538! 9 6.61795538!
$3 :Drug_andmedicines 6,915439489 9 9,B1543_469_4 :Basitindustrial_hemicals 6,925982837 6 6,625962837
3_ :Fertilizer B.942436933 6 _._424_693_
36 lOtherchemicalproducts 9.619761963 9 B,019761663
_7 :Petroleu_products 6.19981_791 6.164 B,615B15751
38 :C_mentmanufacture 8.886716623 _ 6.686728623
_9 :Othernon_etallic_ineralproduct_ 6,933_99574 B 6,6_347957446 ]Basicmetalindustries 6,933198B17 B 6,633178617

AnnexTaMe IB (cont'd)
I: I 1981
ICo_e: O E 8C R I P T ! 0 N I ,E2 T2 E2-T2'--_-:............................................:.........................................
41 IMetalproducts ..... I B.B26561393 B 8.B26561393
42 IMachineryexceptelectrical : IB.BZIBB25IB B B.B21B251BI
43 IElectricalmachinery ] B.BIB942B36 @ B.BIB942B36
44 ITransportequipment IB.BI625BB67 B BoBI625BB67
45 _Miscellanenusmanufacturesincl.scrap I B,9172BI44B 9 B.9172BI44B
46 IConstruction : B,91B633443 9 9.018633443
47 IElectricity I9.iB77B4226 9 B..IB77B42634B IGasand steam : B.B927396BB 9 9.Bg273B6BB
49 IWater_orks I B.8281716B8 B B.B281716BB
59 :Buslineoperation I 9.BM857192 B B.96i857192
51 IOtherpassengerlandtransport I9.B4873956! 9 B.B48739561
52 _Roadfreighttransport : B.B46911497 9 9.946911497I'
53 IWatertransport I B,B42861581 9 B.B42BhlSBII
54 :Airtransport I B.927953349 9 9,92795334YI
55 :Supporting& alliedservicesto transport I9.8147827BB B B.91478278BI
56 :Communications I 6.999811748 B 8,99991174BI
57 iStorageandNarehousing IB.92B&B9457 9 B.9284894571
5B :Wholesaleand rPtai]trade I 9.B962@9197 9 B.B8629BI971
59 iBanks_nonbanksandinsurance I9.BB3915742 B 9.B@_9157_2
6B _REBIestateandoRnershipof a dNel|ing : B,gB5_39482 B 8.BB59394821
61 IGovernmentservices : " 0 B B.99989009BI
62 :Privateeducationservices IB.B1996442B B B.919Bh442BI
63 :PrivatehealthserviEes I @.9BYB29551 9 9.BBgB29551I
64 IHotelsandrestaurants I B,818949782 9 9.918949782I
65 ]Otherprivateservkees I B.BI2423165 9 8.812423165I
.....I............................................I.........................................
: Average I B.B2466126B. B.B218_499I
I
TheNeightedaveragetaxrateon fueloilin 1987is 18.4pmrcent,.ThetaxrateNas26.5
percentfromJanuaryI toMarchI, 19B7;28.5percentfromMarchI toJuly14_19B7andzerothereafter.

83
AnnexTableII
PERCENTAGEDISTRIBUTIONOF NATIONALBDVERNMENTEXPENDITURESNET OFDEBTSERVICE
BY SECTOR_ONAN OBLIBATIOHBASlSi'I975-19BB1/
1975-19851975-198219B3-19B519B6-19B8 19B& 19B7 19BB
TotalEconomicServices 49,7b 49.78 49.73 41,29 47.B5 39.18 37,84
Agriculture 5,72 5,7@ 5.75 6.79 1.72 IB.49 I 7,B9"
AgrarianReform Bo62 B,TI B,49 _,@3 B,4B I,43 6,3&
NaturalResources 4.91 2.B2 9.B9 1,61 L,35 1.73I II,7_
Industry 1.94 2.37 1.33 1.71 B.32 3.24 1,61
Trade B,33 _.35 B.3B _.@6 i.Bl B._4 _,I_
Tourism B,23 B.29 B.14 _,13 _.B2 B.IB |.IB
Powert EnBrgy @,25 7,88 3,93 B.47 _.16 1.57 .-_,13
WaterResourcesDevelopment 1,2B 1.35 B,99 S,3B g._I B.66 " :B._6
Transportation& Communication 21,_B 25.43 14.66 I_.61 [I,B7 17.&6 16,95OtherEcono_i_Services 7,54 3.6B 13,B6 11,5m 31.99 2,_ -_ 2,72
TotalSocialBervire_ 23,3B 22.81 2:3.99 2B.75 29.1_ 28.24 2B_B4
Education i,X,65 l_,,Xl 14,14 18,7] 16.14 19.85 19,BB
Health 4.1B 4"B5 4,36 4,6B 3,7B 4.7[ 5,35Soc_a_" "ooerv]r,s_Labor_ E_pioyment I . 5 2 I" & & _ I 3 3 _ , _ 6 I . l 7 _ I . B _ _ . _ _Housing_ Co._uniLyDeYelop_ont 3.73 3.59 3,93 4.17 7.B7 2;65 2.45
OtherBo_ia!_ervices @,21 @.2B B,23 B,21 B,IB B.19 _,2&
HationaID_fen_. 12,95 I_._6 £B.79 9,7B B,BB IB,19 %?7
iota}PublicService_ 13.99 12._5 15.48 2B.26 14.13 22,47 23,3_
Pub]i_(_dainisLration 8,57 B.25 _.B_ 14.67 7.75 17,63 17.B]
P_ace_ndOrder 3.91 3.48 4.52 5,B4 4L61 4.B_ _,_4I
OLhers L,52 1,23 1.93 _.55 1,79 %.B_ B.BB
D_btServic_ 23.27 Y,I_ 4,_.56 63.34 32,4& 82.34 72,B4
BrandTotal-O_btServire IBB._O I,_B.BB I_,_ IG_,BB I?,B,_ JB_.B_ IB_,_%
I!
Ca1[ulatedbasedon datafromtheD_part_entof Budgetand_anagement(PBM).Agencylevelexpenditureswere_lassifiedaccordingtofunctBnbyusingtheCOAChartof Accounts,
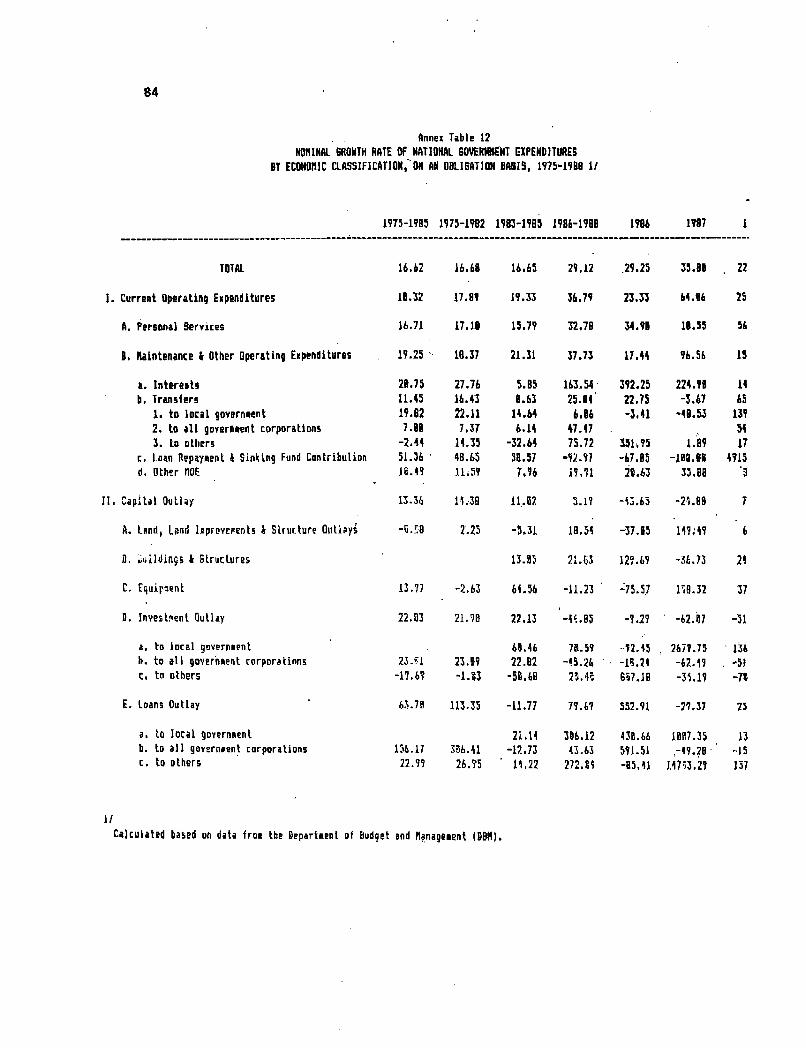

85
AnnexTable 13REAL6RDNTHRATEGFN_TiDNALGOVERNMENTEXPENDITURES
8YECONOMICCLASSJFICAT]ONjONAN OBLIaAT]ON8ASISp1975-1988II
I775-19B5IY75-19821983-19851986-198B 1986 19B7 19B8
TOTAL 1,42 5.22 -b.94 21.43 27.48 25.7B 11.74
I,CurrentOperatingExpenditures 2,98 6,3? -4,0_ 28,64 21,64 _2,G_ 14.7B
A. Persona]SerYices 1,49 5.67 -7.63 24,88 33.86 ,2.33 43,62
B,Haintenance_ OtherOperatingExpenditure_ 3.78 6.B2 -3.23 3_.&8 13.83 8l.?_ 5.4_
a. Interests 5.81 15,27 -I_.56 147,85 385.51 2_B.74 4,28
b.Transfers ~3.B8 5.B7 ,-19,72 [7,_9 2J,B7 _:_IB,83 58._3
I..toIocaJgovernsent 4.28 IB,19; -8,35 °g,25 -4.73 -52.36 118,63
2, to all governmentcorporations -6.95 -3,ti -15,33 38,71 -r 41,85a. to financia! governmentcorps. " 81.67
b. tononfinanci_lgovernmentcorps., -8._4 -3.32 -1_.3b •3. toothers -1_,J6 3.19_ -46,27 65,2& _45,7_ -5.68 7.33
c, LoanRepayment& _inkingFundContribution 31.8_ 34.I_ 26,5_ -93.39 -&B:2_ _47_.3_d, OtherMOE -3.91 E,7_ -13.88 12,7T, 18.;8 2_.78 -4.17
'CapitalOutlay -i,42 3.21 -iI,_4 -I,_7 4].6Y -3_._ -J.,81
• Land,LandImprow_ents_ StructureOutlay_ -13,It -7,73 -24,46 11,48 -37._1 13B,g_ -3.37
8._uildings& 5Cructures -_.82 14,_8 12_._ -41.43 13,37r
Equipment -_.BB -12,13 31.28 -lG,_l -7_,?B _2.B3 2_,23
investment Outlay 6.12 l_,_B -2,37 -_8,13 -I_._ -64,89 -55,5B
_. to ]oc_l government 28,_ bg,_ -Y2.5_ 2_73.B2 1_5,4_b, toall_overn_ntcorporations 6,97 ll._B -2,_2 -4B,52 -11,_7 -65.2B -_5,61
c. to others =SB.lb -Jr,6? -6_,b6 13.24 794.77 -3?,gB -73.3bL
Z. Lo_n_Outlay 42._6 72.5_ -2?.62 6Y,B_ _,77 -34.62 14.64
;a, to Joc_]_overnm_nt -3,36 281.95_. 423._8 ?25.B8 3.87b.to allgovernmentcorporations 122.78 266.75 -3B.38 35,_3 582,_& -53,_5 -23.|I
c, tooth_rs _,% 1&,Ob _8,88 24%8? -8_.61 13639.4g 116,71
_ated basedon datafromtheDep_rtmentof BudgetandBana_ment(08_)andNationalSt_%i_ical Coordination8oard(N5C8).
=!_!ii.___. ...... _._,_=_=_ . . . .........

86
AnnexTable14
INCENTIVEAVAILflENTSBY TYPEOF INCENTIVE
1978 1979 19BB 1981 1982 1983 1984 19B5
TOTAL I_13b I,B43 1,539 I,q75 2_66 1,91B 3,553 4,581
Tax Deductions 754 _GI 734 54B 675 599 IsB7B 2I,a33
Organizationalexpenses .34 _ @ B B @ 'g BAccelerateddepreciation 153 @ B B @ @ ,B
Losscarryoveral 62 35 IBg 9B J19 7 298 375
Expansioninvestmentallowance 153 9S 175 B_ I_9 172 236 649Labortraining 2 l l 4 4 2 3 3LaborandlateriaIcost 172 B @ 0 @ _ B
Investmentallowance 7B 163 51 39 27 ,82 B l_
_educedIncomeLax 4 iTS 4B7 _22 37& 2B6 532 1,299
Exporttrader 4 B B B B @ _ B
Service e_.porLer 9B _ _ B B B BHeebrandnaae B @ B B B _ _
_ater treatment B B B B " _ B B B
HationaldeY.fundallowance B _ _ B _ 5B I
iiof i_icree_ntalsale_ 0 S B @ _ B l 7
•Otherd_ductiDns I _ _ _ _ _ _
'TakExemptions 206 _ql 637 70_ "l,15@ 1,187 2,172 1,5_2
Dulyand Laxon _achJ.n_ryal lq2 3@I 5B8 546 841 622 1,482 .1_371.,Aalestax a/ 111 9B I_ 16_ 2B_ _23 59B _l
C.:pitalgain_Lax 33 " ' 5 26 38 _l 33 77 75
Bre_dingstocksal D ,. 37 I I 9 II 32 @Percentage_ax £. _ _ @ _ _ 3 3_
ExportLax al _ _ _. _ _ _ @
Otherexemptions _ _ B B _ _ @. ..
Tax Credits Y5 I_ 168 170 2_I 13B 282 : 6_b
BalesLaxonra__aterialsa/ 57 B2 61 BG IB[ _8 B_ 2[G
Oo_eBLicequipmental B 3B _3 5B 19B 4? 78 .67Infrastructure_orks I B B B B _ B . B
_iLholdingLBxon interesta/ 29 2_ _4 33 32 23 2_ " I_Ne_ valueearnedal D " _ B B B B 44 133
Net localcontental Q B B B _ [ 49 174
al
Availab]_underP,D.1789asamendedbyB.P.391andE.O.1945.
Note : Datasho_nareforavailaentsapprovedby theBoardof Inve_tment_(BOI).Notallapprovedincentivesareactuallyused.
Source:Boardof InvestmentsIBOI),As citedbyWorldBank,IgBT.
•' ...- .............._ ..........................._' ................,_-_._'_._T_B_m
BIBLIOGRAPHY 87
Ahmad Ehtisham and Nicholas Stern. "Alternative Sources of
Government Revenues: Illustrations from India, 1979-1980."
The Theory of Taxation for Developing Countries. Eds.'Nemberry, David "and Nicholas Stern. New " York: Oxford
University Press, 1987.
Allingham, Michael and :Agnor Sandmo. "Income Tax Evasion: A
Theoretical Analysis." Journal of Public Economies 3 & 4
(Novembe_ 1972): 323-338.
Amatong, Juanita. "Explicit Budgetary Contributions of National
Government to Government Corporations." Philippine Institutefor Development Studies, 1986. Unpublished.
Gochoco, Ma. Socorro. "Financing the Budget Deficit in a small
Open Economy: The Case of the Philippines, 1981-1986." PIDS
Working _ Paper Series No. 88-10. Makati: PhilippineInstitute for Development Studies,'1988.
Habito, Cielito and Ponciano Intal. "Some Observations on
Petroleum Pricing and Taxation Policy in the Philippines."Paper presented at the Philippine Economic Society Annual
Meeting, Manila Hotel, December 10, 1987.
Heller, Peter, Richard Haas and Ahsan Mansur. "A Review of the
Fiscal Impulse Measure." Washington, D.C.: International
Monetary Fund, 1986,
Manasan, Rosario. "Impact of BOI Incentives on Rate of Return,
Factor Prices and Relative. Factor Use: A Comparative
Analysis of Incentives Under PD 1789 and BP 391." PIDS Staff
P_r_.- Series No. 86-_i. Makahi'. Philippine Inst_6ute "'fo_Development_Stud_es ", 1986
' ' r
_. _ "Tax Evasion in the Pl]iiippines, 1981-1985:" Journal
of Philip_pin_ Development XVr :No. 2 (1988m): 167-i89_
"A Review of Invests{lent Incentives • in ASEAN
CouDt'ries_" PIDS Working Paper Series No. 88-27. Makati:
Philippine Ins6_thte for Development Studies, 19._8b. ,
"A Review of Export Incentives in the Phliippines."
- Pb i_Iippine Institute for Development Studies, 1989_,
Unpublished. :. • ..{
"A Review of Fiscal Policy Reforms in ;_SEAN_Countries in the 1980s." Paper presented at the 14th ,FAEA
Conference, Manila, Philippines, November 16-18, 1989b.
"A Review of the 1986 Reform of the Individual
Income Tax." PIDS Work_ing Paper Series No. 90-ii. Makati:Philippine Ins£itute for Development Stud_ies7 _90a.
. "An Analysis of the Value Added Tax in the Phili'p-
pin_." PIDS' Working_ Pa_erSeries No. 90-12. Makati:Philippine fnst-it'ute for Development Stu_es _, 199gb.
88
and Corazon Buenaventura. "Macroeconomic Overview of
the Public Enterprise Sector in the Philippines." PhilippineEconomic Journal XXV, Nos. 1 & 2"(1986).
. Juanita Amatong and Gil Beltran. "The Public
Enterprise Sector in the Philippines - Economic Contribution
and Performance 1975-1984." Public Enterprise 8, No. 4(December 1988).
Medalla, Erlinda. "An Assessment of Trade and Industrial Policy
in the Philippines, 1986-1988." PIDS Working Paper Series
No. 90-07. Makati: Philippine Institute for Development
Stud{es_ _990o
_ational Economic and Development AUthority (NEDA). Medium Term
Development Plan 1987-1992. Pasig, Philippines, 1987.
National Tax Research Center (NTRC). "Prescription of Ceiling onCertain Business Deductions and Standard Deduction Ratios."
Unpublished, 1986.
. "Measurement of Tax Evasion." NTRC. Unpublished,1986. _ _
Paderanga, Cayetano. "Real Property Taxation in the Philippines_
Issues add Research Directions." PIDS Staff • Paper Series
NOo 84-Z]_ Makati: Philippine Instltute for Deveiopment
Studies_ 1984.
Republic of the Philippines. "Final Report to the }.louse
Committee on Ways and Means of the Ad Hoc !nteragency
-_ " July 26,Committee on Fetroleum Product Tax Structure,
1988 Unpublished.
Short, R. "The Role of Public Enterprises: An International
•Statistical Comparison." Public Enterprise in Mixed Economies.Eds. Fl0yd_ Robert: Cline Gray and R.Po Sh_r6. Washington,
D.C. : International Monetary Fund, 1984 ....
Stern, Nicholas. '_Aspects of _the General Theory of Tax Reform."
The Theorl, of Taxation' _for Developing Countries. Eds.Nemberry, David and Nicholas Stern. New _ork_-- Oxford
University Press, 1987 _ r _ '• i
Suits, Daniel. " Ame,_icanMeasurement of Tax Progressivity."Economic Review 67, No. 4 (19771.b ......
World Bank. The Philippines: Issue 9 and Policies in theIndustrial_Sector, July 30, 198--7.
World Development Report 1988. Washington, D.C.:
-- Oxford University Press, 1988. -
Yoingco, Angel. "The 1986 Tax Reform in the Philippines.,, Paper
presented in APTIRC's 4th Asian Pacific Tax Conference ,Singapore, November 1986.
8g
List of PIDS Working Papers Comprising the Study on
"An Assessment of the Performance of, the Aquino Governmentin Selected Policy Areas, 1986-1988"
WP No. 90-02 An Assessment of the Performance of the Aquino
Government in Selected Policy Areas, 1986-1988: An
Overview and Summary
by Erlinda M. Medalla
WP No. 9_-03 An Assessment of Public Administration in
the Philippines, 1986-1988
by Ledivina V. Cari_o
WP No. 90-04 An Assessment of the External Debt Management in
the Philippines, 1986-1988
by Josef T. Yap:
_'[P NO. 9_-05 An Assessment of Policies Affecting the Financial_ Sector, 1986-1988
_ _ by Mar io B_ Lamberte and Julius P. Relampagos
WP No. 90-_6 A_ Assessme_t of Fiscal Policy in the •Philippines,1986-1988
by Rosario G_ Manasan
WP No 90-07 An Assessment of _ --_. _r__ and Industrial Policy,1986-1988 :
by Erlinda _-i.Medalla
WP No. 98-08 A Review of Philippine Natural Resource andEnvironmental Management: 1986-1988
by Mari_n $. delos Angeles and Noela Lasmarias
WP No. 9_]-[_9 An Assessment of Labor and Employment Policies in
the philippines, i985-1988
by Edna A. Reyes and Ma. Teresa C. Sanchez
WP No_ 90-10 An Assessment of Population, Health and Education
_'olicies in the Philippines: 1986-1988 ;
• by Alejandro [_- Herrin
WP No. 90-.].1 A Review of the 1986 Reform of the Individual
Income Tax
by Rosario G. Manasan
WP No. 90-12 An Analysis of the Value Added Tax in the
Philippines
by Rosario G. Manasan
90
•PIDS WORKING PAPERS
Wl', Noi 139-01 Tke Pi'tflippk'ae;: Recent W.P No. 89-10 Integra.tive Report on the W.P. No. 90-02 An Assesa'nent of the Per-Performance, Prospects for Informal Credit Markets in fotmance of the Aquino1989-'90, and Policy and tile Philippines Meliza H. Government i I SelectedDevelopment Issues. dosef Agabin, MarioB. Lamberte, Policy Areas, 1986-I988:T. Yap and Marie B. Mahar K. Mangahas and AnOverviewandSummary.Lamberte (P28.00) Ma. Alcesris A. Mangahas Erlinda M. Medalla
(P35.0_W,P.No. 89-02 Linkages in Development: , W.P.No. 90-03 An Assessment of Philip.
A PhiLippine Case Study. W.P. No. 89-ll _"-_"Response to New Market pine PublicAdministzation,Gustav Ranis, Frances Sre- Opportunities: The Case of 1986-1988. L, divina V.wart and Edna A. Reyes the Overseas Employment Cari_o (P30.00)(P48.00) Sector. Ma. A lcestis Abrera.
Mangahas W.P. No. 90-04 An Assessment of. theW.P. No. 89-03 Employment, Productivity . External Debt Management
and Wages in the Philippine W.P. No. 89-12 A Study of the Export in the Philippines, 1986-Labor Market: An Analysis Financing System in the 1988. dose/ 7". ,Yapof Trends and Policies Philippines. Marie B. Lam. (P13 00)Edna A. Re),es, Edwin berre, Rosario G. Manasan,Milan and Ma. Teresa C. Erlinda M. Medalla, Jose/ W.P. No. 90-05 An Assessment of.PoliciesSanchez (P34.00) 7". )rap and Teodoro S. Affecting the Financial
Untalan (P73.00) '_ Sector, 1986-1988. MarieW.P. No. 89-04 Employment Effects of B. Lamberte and Julius P.
Selected Structural Adjust- W.P. No. 89.-13 Case Studies on the Monl- Relampagos (P35.00)sent Policies in the Philip- toting of Informal Credit _ :phaes. Rosario G. Manasan Markets. Aida Lava, Rosa. W.P. No. 90-06 An Assess-m_nt of Fiscal(F22.00) rio de Guzman, doselette Policy in tile Philippines.
de 1o_ Santos arm Dennis 1986-1988. RC_rlo G.W.P+No. 89-03 ASEAN-US initiative: The Arroyo Manasan (P34.00)
Phil• ppine Expetietiee.Erllnda 3I. Mcd_,'la and W+P. No. _9-14 The Health Impact of W.P. No. 90-07 An Assessment o.f TradeJG._zari"o G. Matla_'an ...... Urbav Poor Housing and and Industrial Policy,(P4_J.O0) : : ; .... Envir6nmental Condition_. 198(>-1988. Erlfnda M.
Orville Solon . 3tedalla (1'27.00)oW.P. i%. ,_9-96 _.'h'_ar.z:;a! L ibera!_ation
_lld ill •crest Rate Deter- W P. No. _9-15 Cost Comparisons of W.P. Do. 90-08 A Review of Philippineruination: TI_e Case of the Selected Metro Manila Hoe- Natural Resources andP).fiiipp inc_ !gel-t985. pjtals. R ub,.'n Caragay Environmental Manage-Ma. Socor;'o H. Gochoco mcnt, 1986-1988. Ma_an(P2.7.00) S. delos Angeles and Noela
" Lasmarias (P34.00)'#.i _.No. 89-07 Japanese and US' Deve]ol> W.P. No. 89-16 Towards Appropriating
merit Assi:,tane_ to the Eeouomie ReDt from the W.P. No. 90-09 An Assessment' of LaborPIfiJjppines: A Philippine- "Philippine Logging b_dus- and. Employment PoliciesPerspective. I;_loiogoPanre, try. Marian S. delozAngeles in the Philippines, 1986-
• 1988. Edna A. Reyes andJr. and I{omeo A.. f.:o,e_ w.P. No. 89-17 Recent Policy-Oriented 3¢a. Teresa C. Sancltez
W.P. No. 98-08 Employment Slxategies for Re.arch and Current (i'30.00)Accelerated" Economic Policy Issues: A Cu_rsoly :.Growth: The Philippine Review. ffilologo Panrc, Jr. W.P. No. 90-10 An Assesmaent of Popu-Experience. Edna A. Re),er and._rario B. Lomberte lation, Health and Eduea-.. . , . ,
- ' tion Policies in the PhiL,-and Edwin Milan (P30.00) W.P. No. 90-01 The Philippines: Recent pines, 1986-1988. Ale]an.
W.P.. No. 89-09 PhUjppine Trade l'olicy Performance, Prospects for . droN. He rrit_Options. Filologo Pante, 1990-1991, anti Policy andJr., Florian A. Alburo and Development I_mes..rose/ W.P. No. 90-11 A Review of tl'm 1986Erlinda iff. Medalla 7". Yap (FI6.00) Reform of the Individual
Income Tax. 2_osario G.Manasan
W.P. No. 90-12 An Analysis of the ValueCopies may be obtained at the: Added Tax in the Philip-
pines. Rosario G. Manasan
RESEARCH INFORMATION STAFF (RIS)
PHILIPPINE INSTITUTE FOR=:D_¥ELOPMENT STUDIES (PIDS)t2,OOM307, NEDA: SA M#,K,AT_;/BUILDiNG
s Ri:? AisPi ..KA'I i 120O4MET_O MANILA, PHII__PPiNES
"-'LS: 86-5 7_05 ;_8--¢@5 9-