
AmRest Holdings SE to download from Investor Relations section at: ... Backup slides . AmRest...
23
AmRest Holdings SE 2012 Q3 Presentation for Investors November 9th 2012
Transcript of AmRest Holdings SE to download from Investor Relations section at: ... Backup slides . AmRest...

AmRest Holdings SE
2012 Q3 Presentation for Investors
November 9th 2012

Teleconference Details
•AmRest Q3 2012 results are included in the Q3 2012 Financial Report which is
available to download from Investor Relations section at: http://www.amrest.eu
• The recording of this Teleconference will be available at our website within 24 hours
2
The AmRest participants:
Henry McGovern Chairman of the Supervisory Board
Mark Chandler Management Board Member, Chief Financial Officer
Wojciech Mroczyński Management Board Member, Chief Strategy Officer
Krzysztof Piechna Group Controller
Maciej Mausch IR, M&A Manager

Executive Summary Q3 2012
•Q3 sales increased by 13.0% to PLN 602.7 mil
•EBITDA at PLN 83.6 mil, margin at 13.9%
• First La Tagliatella opened in China! Initial performance very strong
– New openings were the biggest driver of sales growth with 87 [1] new stores added to the
porfolio since Q3 2011
•Positive SSS performance across most regions
– Spanish SSS negative as the country continues to struggle given the challenging economy
• Finalization of the sale of the majority of assets of AmRest LLC
3 [1]incl. 8 stores operated by franchisees
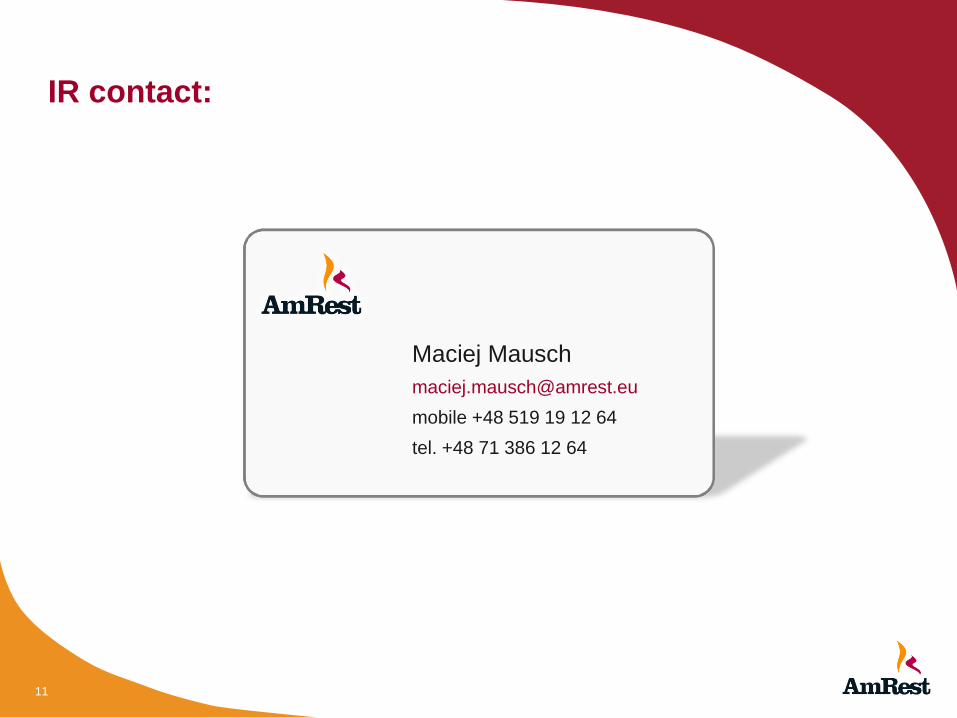
Our Restaurants
4
*
*
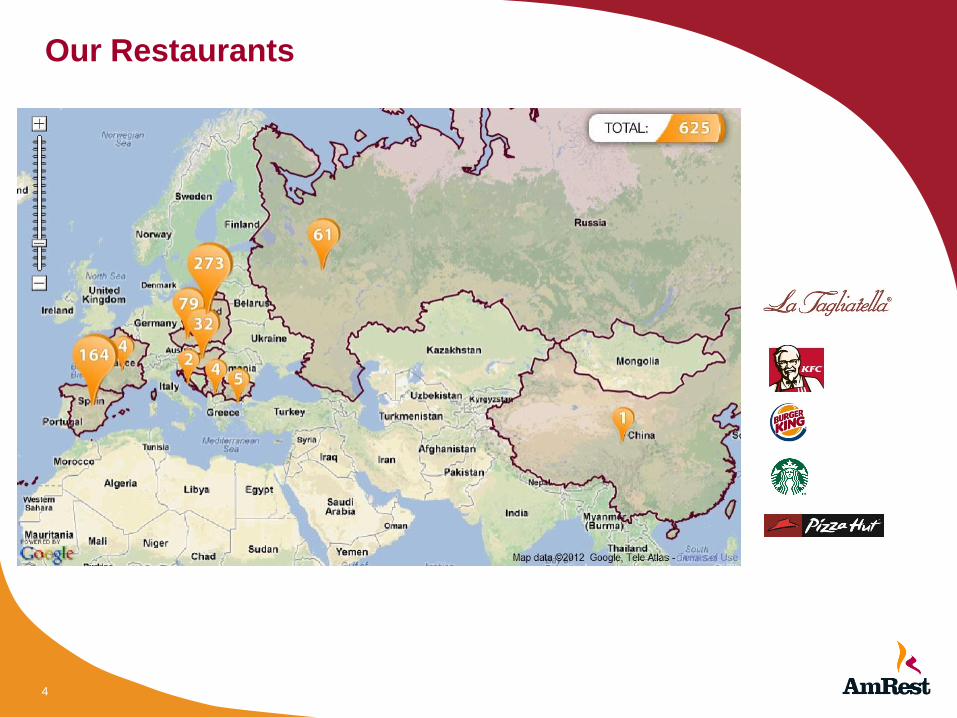
New Restaurant Openings
• 60 stores opened YTD (33 CEE, 7 Russia, 20 TAG)
– First opening in China
– First equity store in France
• 9 since the last call (6 CEE, 3 TAG)
• Pipeline on track; 15 more stores due to be opened in remainder of the
year
•New markets development as planned:
– First La Tagliatella to be launched in Germany in November
– US and India expected in December
5

Continued growth in the number of restaurants
6 • Countries of operation include Poland, the Czech Republic, Hungary, Russia, Serbia, Bulgaria, Spain, Croatia, France and USA.
• [1] Including franchisee operated stores
64 77 79 77 70 70 69
8 13 24 39 51 4
12 21 27 35 37 127
166
202 223
239
310 331
122
137
2006 2007 2008 2009 2010 2011 09.11.2012
[+18%]
360 334
301
247
191
567
625
# of Restaurants
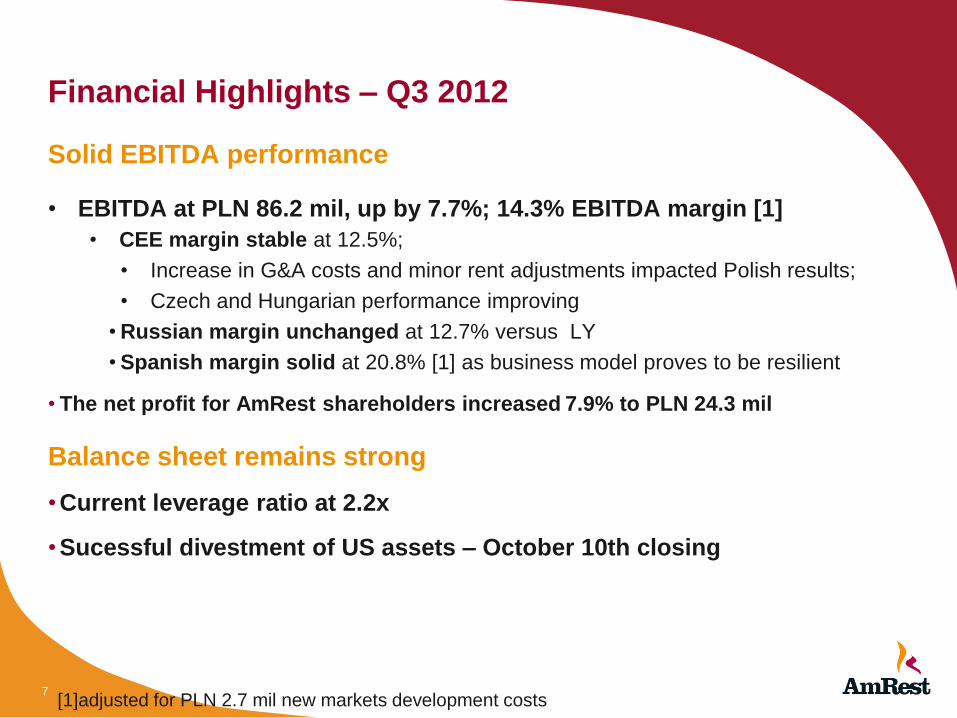
Financial Highlights – Q3 2012
Solid EBITDA performance
• EBITDA at PLN 86.2 mil, up by 7.7%; 14.3% EBITDA margin [1]
• CEE margin stable at 12.5%;
• Increase in G&A costs and minor rent adjustments impacted Polish results;
• Czech and Hungarian performance improving
•Russian margin unchanged at 12.7% versus LY
•Spanish margin solid at 20.8% [1] as business model proves to be resilient
• The net profit for AmRest shareholders increased 7.9% to PLN 24.3 mil
Balance sheet remains strong
•Current leverage ratio at 2.2x
•Sucessful divestment of US assets – October 10th closing
7 [1]adjusted for PLN 2.7 mil new markets development costs

[1] The growth vs. corresponding period in the previous year ,[2] trailing 12 months, [3] Attributable to AmRest shareholders and adjusted for the Put Option
valuation
Seasonality of sales:
The seasonality of sales and inventories of the AmRest Group is not significant which is typical for the whole restaurant industry. On Central and East
European markets. restaurants have lower sales in the first half of the year which is mainly the result of a smaller number of days of sale in February and
lower number of customers in the restaurants. The United States market is characterized by stronger first half versus second half sales performance. After a
period of lower sales in the summer months and a slight revival related to the Christmas season, the first half of the year is a period of increased activity in
connection with the use of holiday vouchers promotional coupons and a high number of holidays.
Q3 2012 Financials – Key Figures
8
Thousand PLN Q3 2011 Q4 2011 Q1 2012 Q2 2012 Q3 2012 TTM [2]
Sales 533 607 602 146 544 891 567 875 602 735 2 317 647
Sales growth [1] 19.5% 12.8% -9.5% 4.2% 13.0% -
EBITDA 80 036 77 843 70 140 70 626 83 553 302 162
EBITDA (%) 15.0% 12.9% 12.9% 12.4% 13.9% 13.1%
EBIT 42 227 14 390 28 427 24 977 40 099 107 893
EBIT (%) 7.9% 2.4% 5.2% 4.4% 6.7% 4.7%
Profit for the period [3] 28 475 19 654 14 903 9 676 27 718 71 951
Profit for the period% 5.3% 3.3% 2.7% 1.7% 4.6% 3.1%
Net debt 783 252 776 623 773 057 806 177 756 299 756 299
Net debt/EBITDA 2.6 2.4 2.3 2.4 2.2 2.2
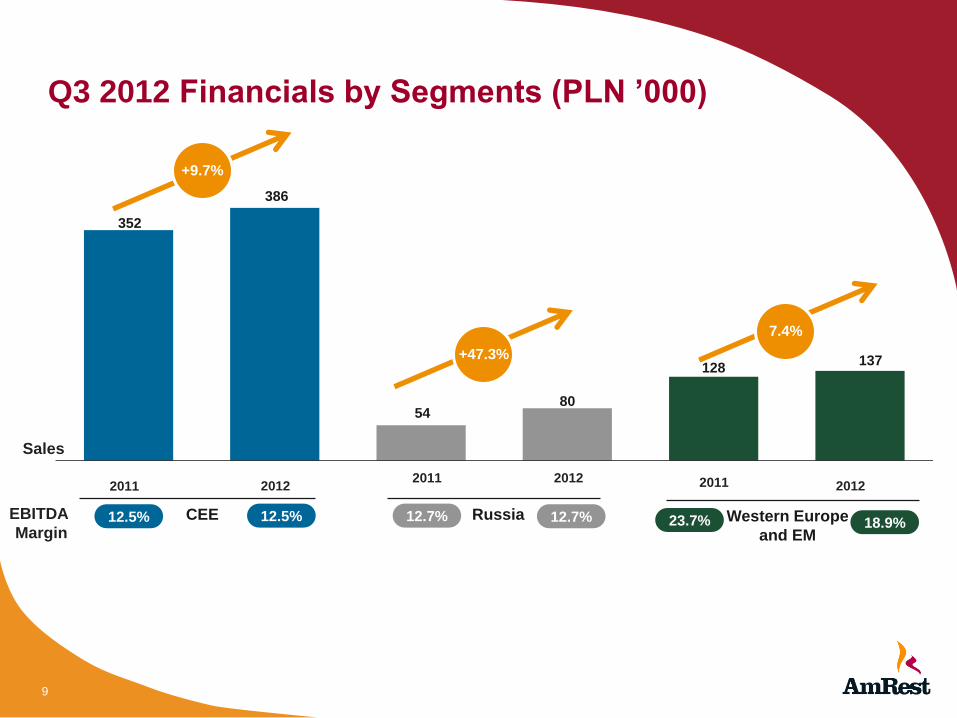
Q3 2012 Financials by Segments (PLN ’000)
9
352
386
54 80
128 137
6 7 8 5 2
+9.7%
+47.3%
CEE Russia Western Europe
and EM
12.5% 12.5% 12.7% 12.7% 23.7% 18.9% EBITDA
Margin
2011 2012
7.4%
2011 2012 2011 2012
Sales
Outlook
•Recent sales trends to continue in coming months
•Food costs expected to impact margins
•Opening of the 3 remaining test markets for La Tagliatella: Germany, US
and India
•Solid pipeline with 15 restaurants to be opened until year end
•Total of over 80 stores to be opened in 2013; more than 60 coming from
CEE and Russia
•Continued focus on cost control and opportunities to improve ROIC
•M&A activities to focus on developing existing business portfolio
10

Backup slides

AmRest Strategy
13
Leverage our WJM culture, international capability, and superior brand
portfolio to grow scalable, highly profitable restaurants globally.
Through our WJM culture we will deliver delicious taste
and exceptional service at affordable prices.
Scope
Our unique value proposition
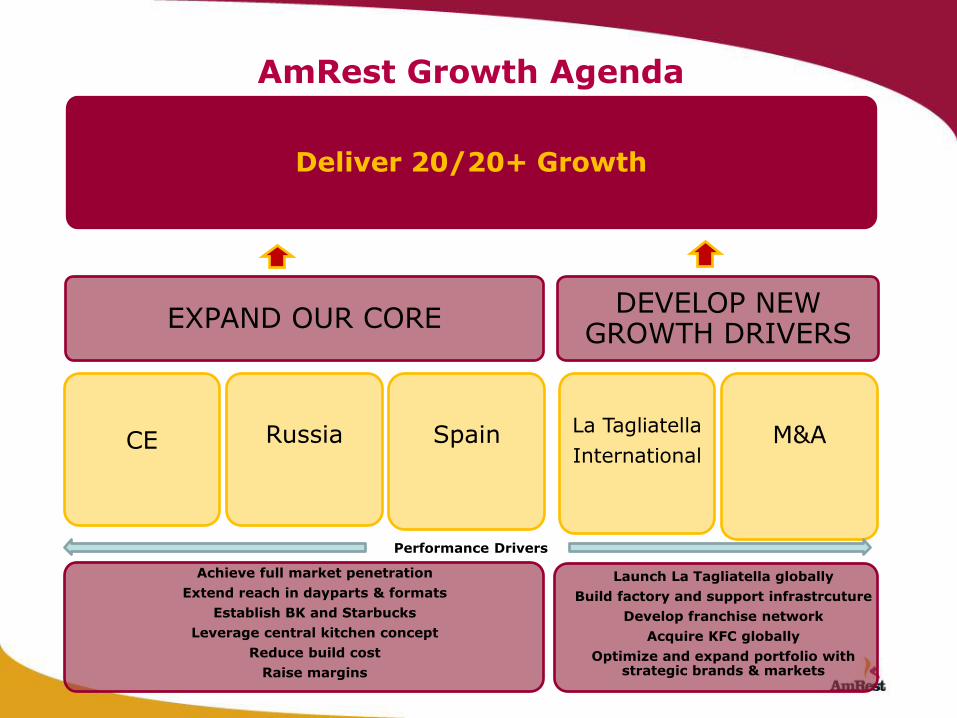
Deliver 20/20+ Growth
EXPAND OUR CORE
CE
Russia
Spain
DEVELOP NEW GROWTH DRIVERS
La Tagliatella
International
M&A
Achieve full market penetration
Extend reach in dayparts & formats
Establish BK and Starbucks
Leverage central kitchen concept
Reduce build cost
Raise margins
Performance Drivers
Launch La Tagliatella globally
Build factory and support infrastrcuture
Develop franchise network
Acquire KFC globally
Optimize and expand portfolio with strategic brands & markets
AmRest Growth Agenda
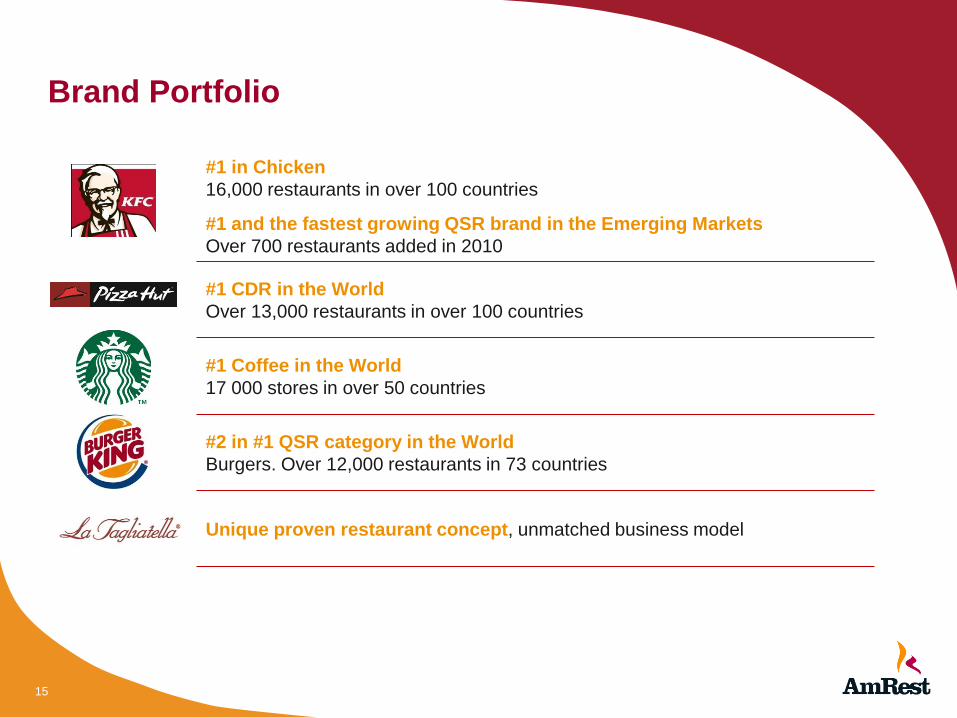
Brand Portfolio
15
#1 in Chicken
16,000 restaurants in over 100 countries
#1 and the fastest growing QSR brand in the Emerging Markets
Over 700 restaurants added in 2010
#1 CDR in the World
Over 13,000 restaurants in over 100 countries
#1 Coffee in the World
17 000 stores in over 50 countries
#2 in #1 QSR category in the World
Burgers. Over 12,000 restaurants in 73 countries
Unique proven restaurant concept, unmatched business model

Long Runway For Growth
16
KFCs per 1M people
Early Stage; significant growth opportunities still being evaluated
Spain: Potential to reach 200 stores
International: Early stage; significant growth opportunity still being evaluated
Note: Number of KFC restaurants shown for REM is total country. AmRest operates 55 of these. Store count as of Q1 2012; macro data from EIU 2011.
Population
(m)
Nominal GDP
per Capita ($)
# of KFC
Stores [1]
Australia 23 65,908 610
Canada 34 50,596 700
US 312 48,409 4,750
UK 63 38,739 752
Total DM Benchmarks 431 48,091 6,812
Poland 38 13,450 152
Czech 11 20,416 56
Hungary 10 13,986 21
Total CEE 59 14,792 229
Russia 143 12,991 165
Bulgaria 7 7,284 16
Serbia 7 6,086 4
Slovenia 2 24,183 –
Croatia 4 14,197 1
Total REM 164 12,601 186
27,1
20,4
15,2
12,0
15,8
4,0
5,3
2,1
3,9
1,2
2,2
0,6
0,0
0,2
1,1
Long-term
potential for
doubling the
current number of
KFCs in CEE and
REM markets
[1] As of August 2012

CEE and REM Snapshot [1]
17
EOP
Restaurants
Poland
Market
Split
Macro Statistics LTM AmRest Sales
Population GDP / capita ($) PLN y/y growth SSS Growth
Poland 38 13,450 997,608 18.9%
Czech 11 20,416 337,593 11.5%
Hungary 10 13,986 91,180 34.2%
Total CEE 59 14,792 1,426,381 17.9% ~ +3-5 %
REM 164 12,601 266,357 44.4% ~ +20%
182 195 227 235
77 70 71 73 13 21
39 50 21 27
35
2009 2010 2011 01-Aug-12
395 372
313 293
157
293 37 50 105
+59 +23
+20
41 44 51 55
14 11 11 11 2 3
3 2
2009 2010 2011 01-Aug-12
37
+7 +3
+1 68 65
58 57
CEE REM
Market
Overview
Note: Costa Coffee includes Coffee Heaven Note: Macro data from EIU 2011.
[1] As of August 2012
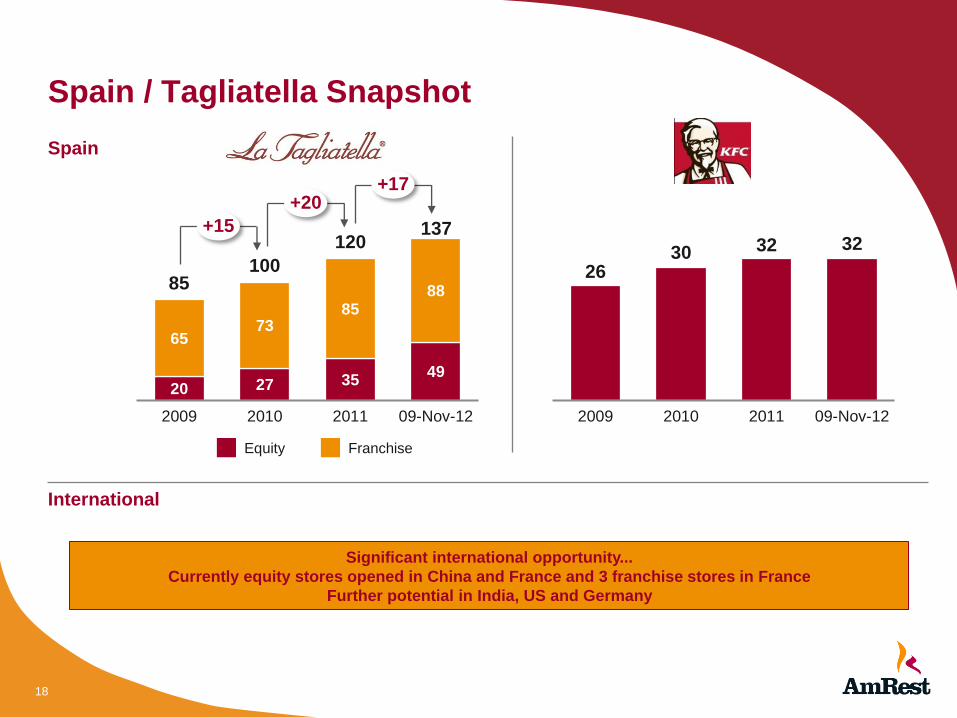
26 30 32 32
2009 2010 2011 09-Nov-12
Spain / Tagliatella Snapshot
18
International
Spain
20 27 35 49
65 73
85 88
2009 2010 2011 09-Nov-12
+20
137 120
100 85
+17
+15
Equity Franchise
Significant international opportunity...
Currently equity stores opened in China and France and 3 franchise stores in France
Further potential in India, US and Germany

Guidance next 3 years
11/9/2012 19
Sales growth
•Organic growth 20% CAGR
• Potential M&A activity
EBITDA
• 15% margin
CAPEX
• Average capex per store below PLN 3 million
• 80 restaurants p.a + PLN 50 million maintenance capex
NET Debt
•Bank covenants at 3.5x EBITDA
• Target of 2.5-3.0x EBITDA
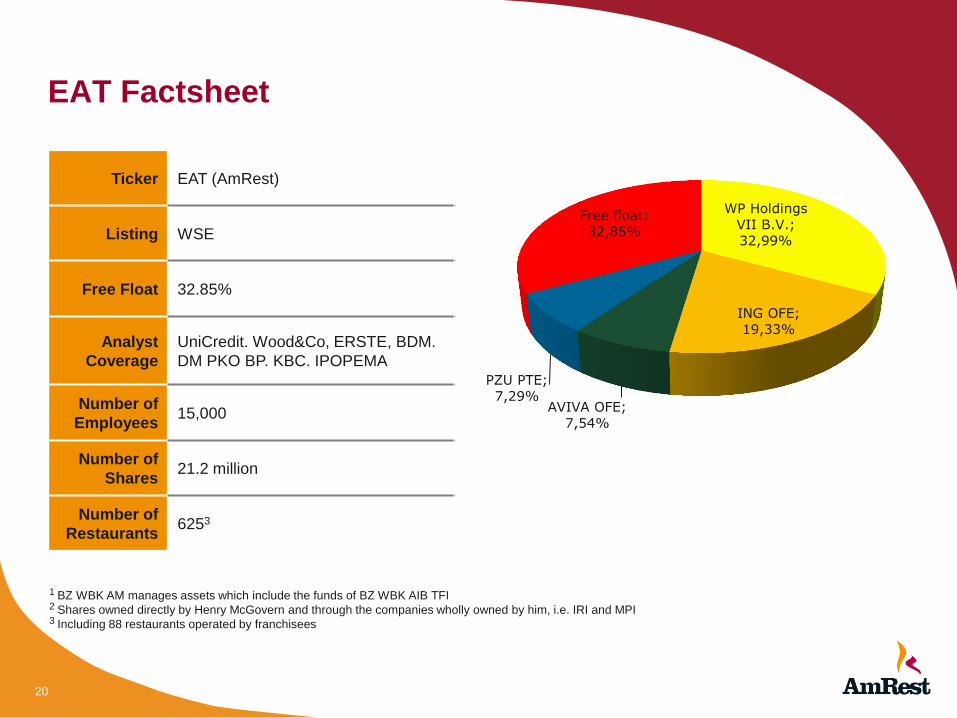
EAT Factsheet
20
Ticker EAT (AmRest)
Listing WSE
Free Float 32.85%
Analyst
Coverage
UniCredit. Wood&Co, ERSTE, BDM.
DM PKO BP. KBC. IPOPEMA
Number of
Employees 15,000
Number of
Shares 21.2 million
Number of
Restaurants 6253
1 BZ WBK AM manages assets which include the funds of BZ WBK AIB TFI 2 Shares owned directly by Henry McGovern and through the companies wholly owned by him, i.e. IRI and MPI 3 Including 88 restaurants operated by franchisees
WP Holdings
VII B.V.;
32,99%
ING OFE;
19,33%
AVIVA OFE;
7,54%
PZU PTE;
7,29%
Free float;
32,85%
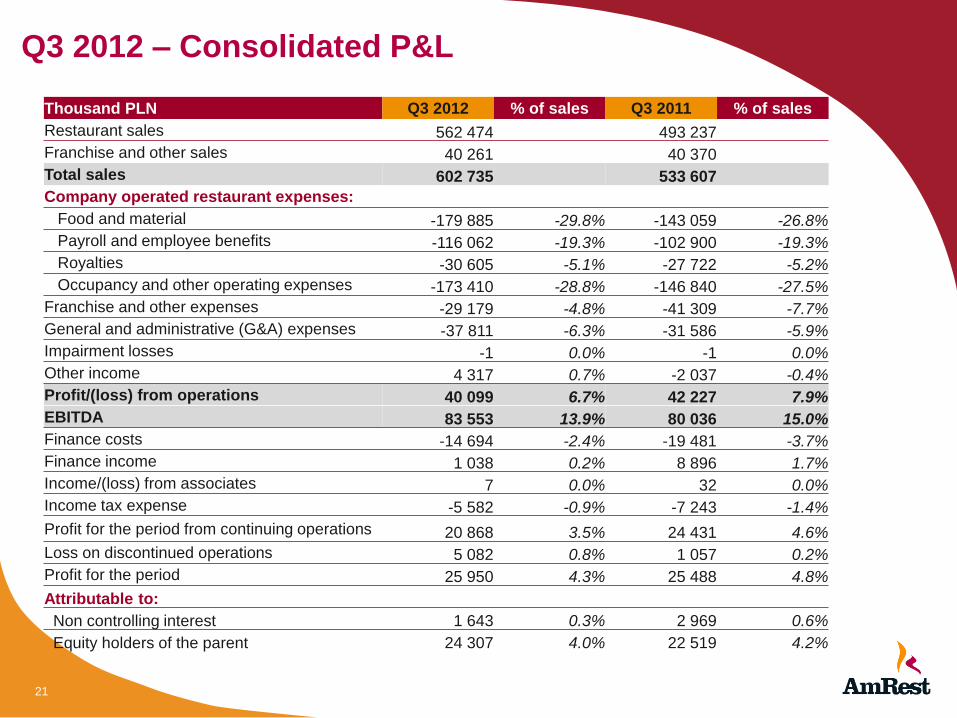
Q3 2012 – Consolidated P&L
21
Thousand PLN Q3 2012 % of sales Q3 2011 % of sales
Restaurant sales 562 474 493 237
Franchise and other sales 40 261 40 370
Total sales 602 735 533 607
Company operated restaurant expenses:
Food and material -179 885 -29.8% -143 059 -26.8%
Payroll and employee benefits -116 062 -19.3% -102 900 -19.3%
Royalties -30 605 -5.1% -27 722 -5.2%
Occupancy and other operating expenses -173 410 -28.8% -146 840 -27.5%
Franchise and other expenses -29 179 -4.8% -41 309 -7.7%
General and administrative (G&A) expenses -37 811 -6.3% -31 586 -5.9%
Impairment losses -1 0.0% -1 0.0%
Other income 4 317 0.7% -2 037 -0.4%
Profit/(loss) from operations 40 099 6.7% 42 227 7.9%
EBITDA 83 553 13.9% 80 036 15.0%
Finance costs -14 694 -2.4% -19 481 -3.7%
Finance income 1 038 0.2% 8 896 1.7%
Income/(loss) from associates 7 0.0% 32 0.0%
Income tax expense -5 582 -0.9% -7 243 -1.4%
Profit for the period from continuing operations 20 868 3.5% 24 431 4.6%
Loss on discontinued operations 5 082 0.8% 1 057 0.2%
Profit for the period 25 950 4.3% 25 488 4.8%
Attributable to:
Non controlling interest 1 643 0.3% 2 969 0.6%
Equity holders of the parent 24 307 4.0% 22 519 4.2%
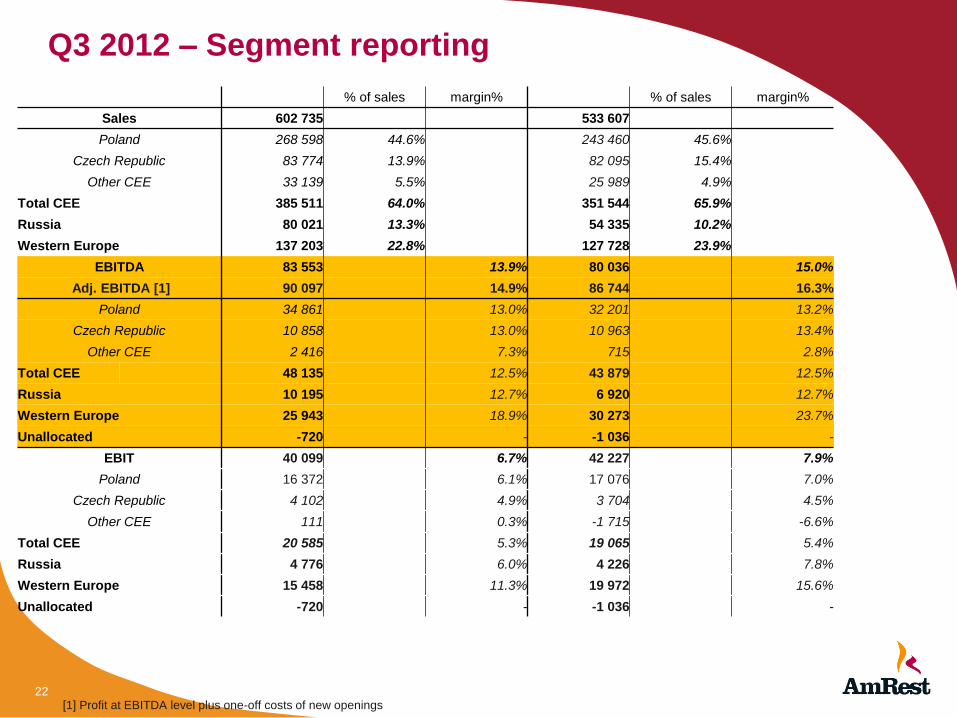
Q3 2012 – Segment reporting
22 [1] Profit at EBITDA level plus one-off costs of new openings
% of sales margin% % of sales margin%
Sales 602 735 533 607
Poland 268 598 44.6% 243 460 45.6%
Czech Republic 83 774 13.9% 82 095 15.4%
Other CEE 33 139 5.5% 25 989 4.9%
Total CEE 385 511 64.0% 351 544 65.9%
Russia 80 021 13.3% 54 335 10.2%
Western Europe 137 203 22.8% 127 728 23.9%
EBITDA 83 553 13.9% 80 036 15.0%
Adj. EBITDA [1] 90 097 14.9% 86 744 16.3%
Poland 34 861 13.0% 32 201 13.2%
Czech Republic 10 858 13.0% 10 963 13.4%
Other CEE 2 416 7.3% 715 2.8%
Total CEE 48 135 12.5% 43 879 12.5%
Russia 10 195 12.7% 6 920 12.7%
Western Europe 25 943 18.9% 30 273 23.7%
Unallocated -720 - -1 036 -
EBIT 40 099 6.7% 42 227 7.9%
Poland 16 372 6.1% 17 076 7.0%
Czech Republic 4 102 4.9% 3 704 4.5%
Other CEE 111 0.3% -1 715 -6.6%
Total CEE 20 585 5.3% 19 065 5.4%
Russia 4 776 6.0% 4 226 7.8%
Western Europe 15 458 11.3% 19 972 15.6%
Unallocated -720 - -1 036 -
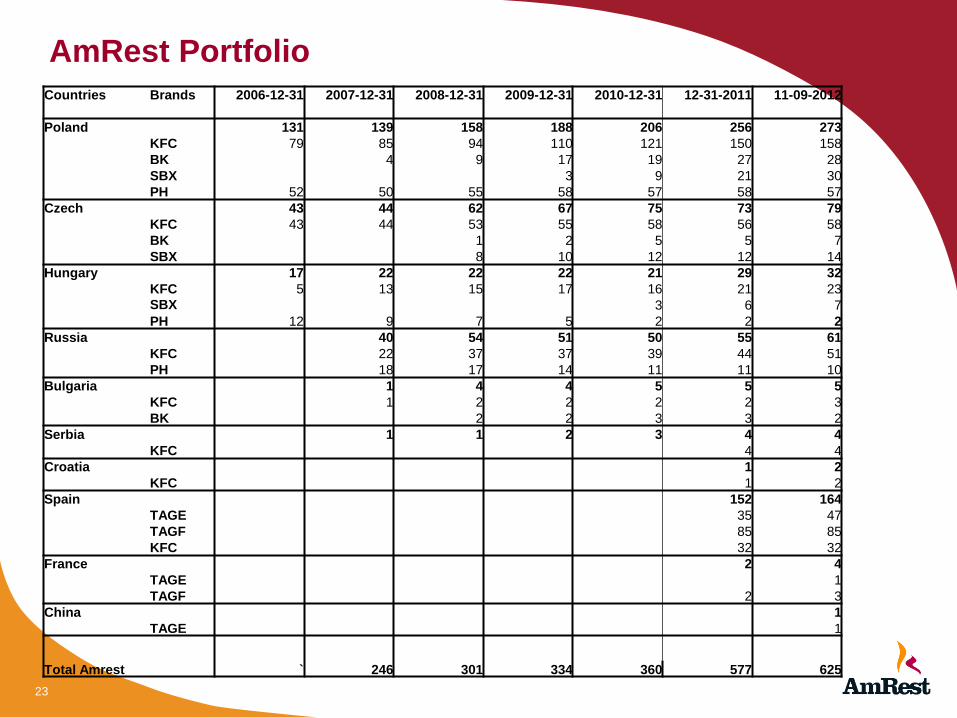
AmRest Portfolio
23
Countries Brands 2006-12-31 2007-12-31 2008-12-31 2009-12-31 2010-12-31 12-31-2011 11-09-2012
Poland 131 139 158 188 206 256 273
KFC 79 85 94 110 121 150 158
BK 4 9 17 19 27 28
SBX 3 9 21 30
PH 52 50 55 58 57 58 57
Czech 43 44 62 67 75 73 79
KFC 43 44 53 55 58 56 58
BK 1 2 5 5 7
SBX 8 10 12 12 14
Hungary 17 22 22 22 21 29 32
KFC 5 13 15 17 16 21 23
SBX 3 6 7
PH 12 9 7 5 2 2 2
Russia 40 54 51 50 55 61
KFC 22 37 37 39 44 51
PH 18 17 14 11 11 10
Bulgaria 1 4 4 5 5 5
KFC 1 2 2 2 2 3
BK 2 2 3 3 2
Serbia 1 1 2 3 4 4
KFC 4 4
Croatia 1 2
KFC 1 2
Spain 152 164
TAGE 35 47
TAGF 85 85
KFC 32 32
France 2 4
TAGE 1
TAGF 2 3
China 1
TAGE 1
Total Amrest ` 246 301 334 360 577 625