AMPLE SPECTRUM OF VASCULAR HEPATIC DISEASE - Colegio Interamericano de ... · AMPLE SPECTRUM OF...
17
AMPLE SPECTRUM OF LIVER VASCULAR DISEASES Juan Camilo Camacho1 Adriana Márquez2 Javier Romero3 Diego Aguirre4 ABSTRACT Liver vascular disease (LVD) is a broad spectrum of entities of low prevalence but with a variety of clinical manifestations that may even lead to death. Early detection and timely treatment change prognosis. Diagnostic imaging plays a key role, but it is important to take into account a wide range of differential diagnoses. Computed tomography (CT) of the abdomen is one of the most useful tools for the diagnosis of LVD, although the role of other imaging methods such as Doppler Ultrasound and Magnetic Resonance Imaging (MRI) must not be disregarded. LVD can be classified according to the compromised vascular structure and, therefore, for practical purposes it may be divided into venous, portal, arterial, sinusoidal and others disorders. The objective of this review is to describe the most common presentations of LVD and the most important findings and differential diagnoses, recognizing their correlation with the physiopathological mechanisms. KEY WORDS (MESH) Vascular diseases Diagnostic imaging Liver diseases 1 Second-year resident of Radiology and Diagnostic Imaging, Fundación Santa Fe de Bogotá,u El Bosque University, Bogotá, Colombia 2 Third-year resident of Radiology and Diagnostic Imaging, CES University, Medellín, Colombia. 3Radiologist, Body Imaging Section, Fundación Santa Fe de Bogotá, Bogotá, Colombia 4Radiologist, Body Imaging Section, Chief of Radiology and Diagnostic Imaging, Fundación Santa Fe de Bogotá, Bogotá, Colombia Introduction The liver accounts for 2.5% of the total body weight and receives 25% of cardiac output. Blood supply to the liver is a dual system consisting of the hepatic artery – responsible of one third of the liver’s blood flow (oxygen-rich blood supply) - and the portal venous system, responsible of the remaining two-thirds of the liver circulation, transporting blood with the necessary nutrients for metabolism.(1-3) Doctor Kiernan in 1833 was the first to introduce the concept of acute central necrosis based on the histological findings in a patient with heart failure. Later, in 1951, doctor Sherlock described the clinical and biochemical characteristics of necrosis in Rappaport’s zone 3 (Figs. 1a and 1b); and in 1954, the usefulness of measuring aminotransferase concentrations in assessing liver disease was discovered.(2,3) The liver’s functional unit is the acinus, consisting of hepatocytes arranged around the arteriole and the portal venule. Blood flows through the sinusoid vessels and are responsible for clearing toxins and metabolizing nutrients. This process occurs through fenestrations located in the basement membrane allowing the exchange of substances into Disse’s space. For its appropriate metabolic function, the liver has a self-regulated vascular system, based on the production of adenosine, a powerful vasodilator that prevents organ hypoperfusion.(2,4)
-
Upload
truongdang -
Category
Documents
-
view
219 -
download
0
Transcript of AMPLE SPECTRUM OF VASCULAR HEPATIC DISEASE - Colegio Interamericano de ... · AMPLE SPECTRUM OF...

AMPLE SPECTRUM OF LIVER VASCULAR DISEASES
Juan Camilo Camacho1 Adriana Márquez2 Javier Romero3 Diego Aguirre4
ABSTRACTLiver vascular disease (LVD) is a broad spectrum of entities of low prevalence but with a variety of clinical manifestations that may even lead to death. Early detection and timely treatment change prognosis. Diagnostic imaging plays a key role, but it is important to take into account a wide range of differential diagnoses. Computed tomography (CT) of the abdomen is one of the most useful tools for the diagnosis of LVD, although the role of other imaging methods such as Doppler Ultrasound and Magnetic Resonance Imaging (MRI) must not be disregarded. LVD can be classified according to the compromised vascular structure and, therefore, for practical purposes it may be divided into venous, portal, arterial, sinusoidal and others disorders. The objective of this review is to describe the most common presentations of LVD and the most important findings and differential diagnoses, recognizing their correlation with the physiopathological mechanisms.
KEY WORDS (MESH) Vascular diseases Diagnostic imaging Liver diseases 1 Secondyear resident of Radiology and Diagnostic Imaging, Fundación Santa Fe de Bogotá,u El Bosque University, Bogotá, Colombia2 Thirdyear resident of Radiology and Diagnostic Imaging, CES University, Medellín, Colombia.3Radiologist, Body Imaging Section, Fundación Santa Fe de Bogotá, Bogotá, Colombia4Radiologist, Body Imaging Section, Chief of Radiology and Diagnostic Imaging, Fundación Santa Fe de Bogotá, Bogotá, Colombia
IntroductionThe liver accounts for 2.5% of the total body weight and receives 25% of cardiac output.
Blood supply to the liver is a dual system consisting of the hepatic artery – responsible of one third of the liver’s blood flow (oxygenrich blood supply) and the portal venous system, responsible of the remaining twothirds of the liver circulation, transporting blood with the necessary nutrients for metabolism.(13)
Doctor Kiernan in 1833 was the first to introduce the concept of acute central necrosis based on the histological findings in a patient with heart failure. Later, in 1951, doctor Sherlock described the clinical and biochemical characteristics of necrosis in Rappaport’s zone 3 (Figs. 1a and 1b); and in 1954, the usefulness of measuring aminotransferase concentrations in assessing liver disease was discovered.(2,3)
The liver’s functional unit is the acinus, consisting of hepatocytes arranged around the arteriole and the portal venule. Blood flows through the sinusoid vessels and are responsible for clearing toxins and metabolizing nutrients. This process occurs through fenestrations located in the basement membrane allowing the exchange of substances into Disse’s space. For its appropriate metabolic function, the liver has a selfregulated vascular system, based on the production of adenosine, a powerful vasodilator that prevents organ hypoperfusion.(2,4)

Considering the physiology of the liver, vascular alterations can be divided according to the site of the disease or their repercussions in venous disorders, portal vein disorders, sinusoidal disorders, transient hepatic attenuation differences (THAD), and other nonclassifiable disorders.
Figs. 1a and b. Rappaport zones and normal liver histology.a.Introducción – IntroductionZonas de Rappaport – Rappaport zonesZona 1 – Zone 1Mayor resistencia a hipoxia, mejor perfundida – Greater resistance to hypoxia, perfusionZona 2 – Zone 2Zona 3 – Zone 3
b.Introducción: anatomía histológica – Introduction: histological anatomyTejido conectivo periportal – Periportal connective tissueLobulillo hepático – Hepatic lobuleSinusoides – SinusoidsVena centrolobulillar – Central lobular veinVía biliar interlobulillar – Interlobular biliary ductsArteria hepática – Hepatic arteryVena porta – Portal VeinTriada de Glisson o Portal – Glisson’s or Portal triad
Venous disorders
Passive hepatic congestionIncidence and prevalence are unknown. It presents secondary to various disorders such
as congestive heart failure (CHF), constrictive pericarditis, tricuspid regurgitation, cardiomyopathies, and mitral or aortic valve disease. These entities cause hepatic vascular congestion, reduction in hepatic blood flow and oxygen saturation, increasing central venous pressure. In more advanced cases, there is hepatocyte atrophy and fibrosis in Rappaport´s zone 3. Patients present with hepatomegaly, ascites, right lower quadrant pain, jaundice and, in some cases, asymptomatic aminotrasferase elevation.(2,4)
The characteristic imaging appearance includes inferior vena cava and hepatic vein dilatations (between 9 to 13 mm), early contrast reflux in the inferior vena cava in arterial phases of dynamic studies, and heterogeneous or “mosaic” parenchyma enhancement. There is also periportal and gallbladder edema. Likewise, it is possible to find hepatomegaly, ascites and pleural effusions. Doppler ultrasound imaging shows increased pulsatility index in the portal vein with diminished peak velocities in the inferior vena cava and suprahepatic veins, or even inverse (hepatofugal) flow in main portal vein (Figs. 2 and 3).(2,4,5)
BuddChiari SyndromeBuddChiari syndrome is defined as an obstruction of the suprahepatic veins or inferior
vena cava outflow resulting in central hepatic congestion, ischemia and eventual necrosis (Fig 4). Its etiology may be primary or secondary (6,7) as depicted in Table 1.
Table 1. BuddChiari Syndrome etiologyEtiology
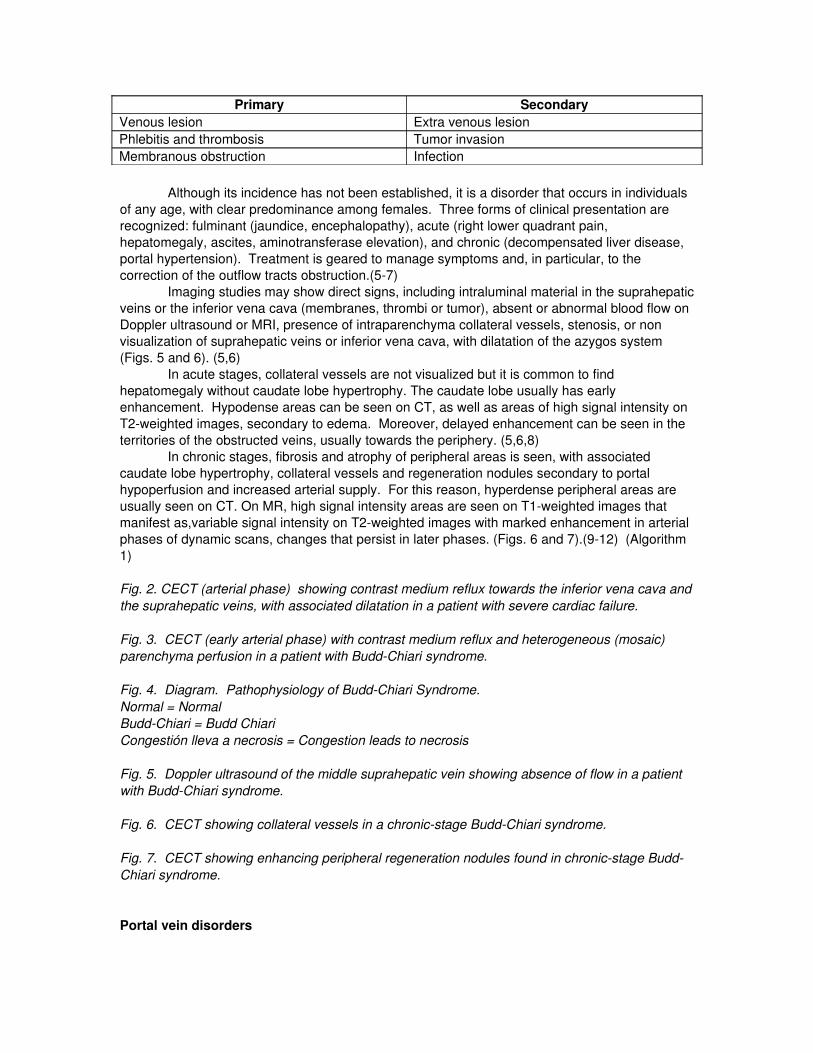
Primary SecondaryVenous lesion Extra venous lesionPhlebitis and thrombosis Tumor invasionMembranous obstruction Infection
Although its incidence has not been established, it is a disorder that occurs in individuals of any age, with clear predominance among females. Three forms of clinical presentation are recognized: fulminant (jaundice, encephalopathy), acute (right lower quadrant pain, hepatomegaly, ascites, aminotransferase elevation), and chronic (decompensated liver disease, portal hypertension). Treatment is geared to manage symptoms and, in particular, to the correction of the outflow tracts obstruction.(57)
Imaging studies may show direct signs, including intraluminal material in the suprahepatic veins or the inferior vena cava (membranes, thrombi or tumor), absent or abnormal blood flow on Doppler ultrasound or MRI, presence of intraparenchyma collateral vessels, stenosis, or non visualization of suprahepatic veins or inferior vena cava, with dilatation of the azygos system (Figs. 5 and 6). (5,6)
In acute stages, collateral vessels are not visualized but it is common to find hepatomegaly without caudate lobe hypertrophy. The caudate lobe usually has early enhancement. Hypodense areas can be seen on CT, as well as areas of high signal intensity on T2weighted images, secondary to edema. Moreover, delayed enhancement can be seen in the territories of the obstructed veins, usually towards the periphery. (5,6,8)
In chronic stages, fibrosis and atrophy of peripheral areas is seen, with associated caudate lobe hypertrophy, collateral vessels and regeneration nodules secondary to portal hypoperfusion and increased arterial supply. For this reason, hyperdense peripheral areas are usually seen on CT. On MR, high signal intensity areas are seen on T1weighted images that manifest as,variable signal intensity on T2weighted images with marked enhancement in arterial phases of dynamic scans, changes that persist in later phases. (Figs. 6 and 7).(912) (Algorithm 1)
Fig. 2. CECT (arterial phase) showing contrast medium reflux towards the inferior vena cava and the suprahepatic veins, with associated dilatation in a patient with severe cardiac failure.
Fig. 3. CECT (early arterial phase) with contrast medium reflux and heterogeneous (mosaic) parenchyma perfusion in a patient with BuddChiari syndrome.
Fig. 4. Diagram. Pathophysiology of BuddChiari Syndrome.Normal = NormalBuddChiari = Budd ChiariCongestión lleva a necrosis = Congestion leads to necrosis
Fig. 5. Doppler ultrasound of the middle suprahepatic vein showing absence of flow in a patient with BuddChiari syndrome.
Fig. 6. CECT showing collateral vessels in a chronicstage BuddChiari syndrome.
Fig. 7. CECT showing enhancing peripheral regeneration nodules found in chronicstage BuddChiari syndrome.
Portal vein disorders

Portal vein thrombosis
Portal vein thrombosis may be secondary to local or systemic causes and may be triggered by hereditary thrombogenic factors (such as protein S deficiency), or acquired factors (such as myeloproliferative diseases). Likewise, inflammatory abdominal diseases (including appendicitis, diverticulitis and pancreatitis) may also lead to portal vein thrombosis. Locally, a direct portal lesion or portal stasis in patients with portal hypertension may act as risk factors. (13,14)
It is also possible to find tumoral thrombosis secondary to several neoplasm’s such as pancreatic carcinoma, metastatic disease and, mainly, hepatocellular carcinoma (HCC). (13) Imaging findings vary depending on the time of evolution, presence of hemoglobin breakdown products and hemodynamic repercussions of clots within the vessels lumen.
Acute thrombus usually appears echogenic on ultrasound (US) and may show high attenuation coefficients on CT. The portal vein also appears dilated as a result of the initial expansive effect (which is clotrelated), while in more chronic stages, thrombi may appear hypoechoic on US and may present with low attenuation coefficients on CT, with evidence of linear calcifications inside the thrombus and enhancement of vessel wall. To avoid false positive results, it is important to bear in mind pseudo thrombotic findings that may appear during arterial phases of dynamic CT scans, secondary to visualization of contrast enhanced and noncontrast enhanced blood (Figs. 8 and 9). (1416)
Additionally, it is important to know the typical appearances of soft thrombi and tumoral thrombi, because in CECT a soft thrombus does not enhance, whereas the tumoral thrombus may show a typical appearance of heterogeneous or striated enhancement (Figs. 9, 10 and 11). (4,9,10)
Portal vein thrombosis may be accompanied by other secondary signs, including cavernomatous transformation (a defense mechanism that attempts to maintain hepatopetal flow). Usually, it develops within 6 to 20 days. Other findings include portosystemic or arterioportal shunting and transient hepatic attenuation differences or THAD (Figs. 12 and 13). (4,911)
Portal vein aneurysm
Portal vein aneurysms are a very rare condition accounting for 3 per cent of venous aneurysms (12) and usually found in the splenomesenteric confluence. They appear as tubular or fusiform dilatations with a diameter greater than 2 cm. The general treatment is observation, although rupture or even thromboses are possible complications. In 40 per cent of cases its etiology is congenital, and the remaining percentage of cases its secondary to portal hypertension, necrotizing pancreatitis, trauma or surgical procedures. (4,9)
Portosystemic shunts
This form of vascular shunting is rare and may have a different appearance depending on the affected vessels. It may be congenital in 0.02 per cent of cases or acquired in the context of portal hypertension or trauma. It occurs most frequently between the right portal vein and the inferior vena cava. Low flow is characteristic. In the portal phase of CECT, shunting can be identified by prompt and asymmetrical enhancement of the affected suprahepatic vein. (Fig.14) (4,9,12)
Arterial hepatic disorders
Hepatic artery aneurysms

Trauma and iatrogenic causes such as percutaneous biopsies or a history of liver transplant are recognized as the main etiologic factors in hepatic artery aneurysms, although there are other etiologic factors such as infectious diseases (tuberculosis, syphilis or pancreatitis) or systemic connective tissue disorders (Marfan’s syndrome or EhrlerDanlos disease).
Aneurysms may be true aneurysms or pseudo aneurysms, mainly of fungal origin; they usually rupture into the biliary tract, portal vein, liver parenchyma or into the peritoneal cavity. In general, aneurysms less than 2 cm in diameter have a low risk of rupture, but the risk increases proportionally to the diameter and/or the number of aneurysms found. Aneurysms are usually surgically treated, although in selected cases, interventional radiology and therefore stents may have a role (Figs. 15a and 15b). (1316)
Arterioportal shunts
Arterioportal shunting may occur anywhere from the hilum to the most peripheral vessel branches. They may be secondary to trauma and iatrogenic injury, although they are common in patients with cirrhosis and hypervascular neoplasm’s (such as hemangiomas or in HCC`s) where arterioportal shunts are found in up to 63 per cent of cases. (13,14)
On CECT arterial phase , typical findings include early enhancement of portal branches before the main portal vein . It is associated with small areas of enhancement in the parenchyma which homogenize in portal phase CECT (THAD). Treatment may be accomplished with selective embolization or surgery. (Figs. 16 and 17) (4,8,9,12,1618)
Thrombosis and stenosisThrombosis and stenosis are rare events more commonly found in the context of liver
transplant. It is generally believed that they do not create hemodynamic consequences, considering the dual blood supply to the liver; however, in transplant patients, infarcts and secondary biliary ischemia are often found since the biliary tract is supplied by the arterial system. (16,19, 20)
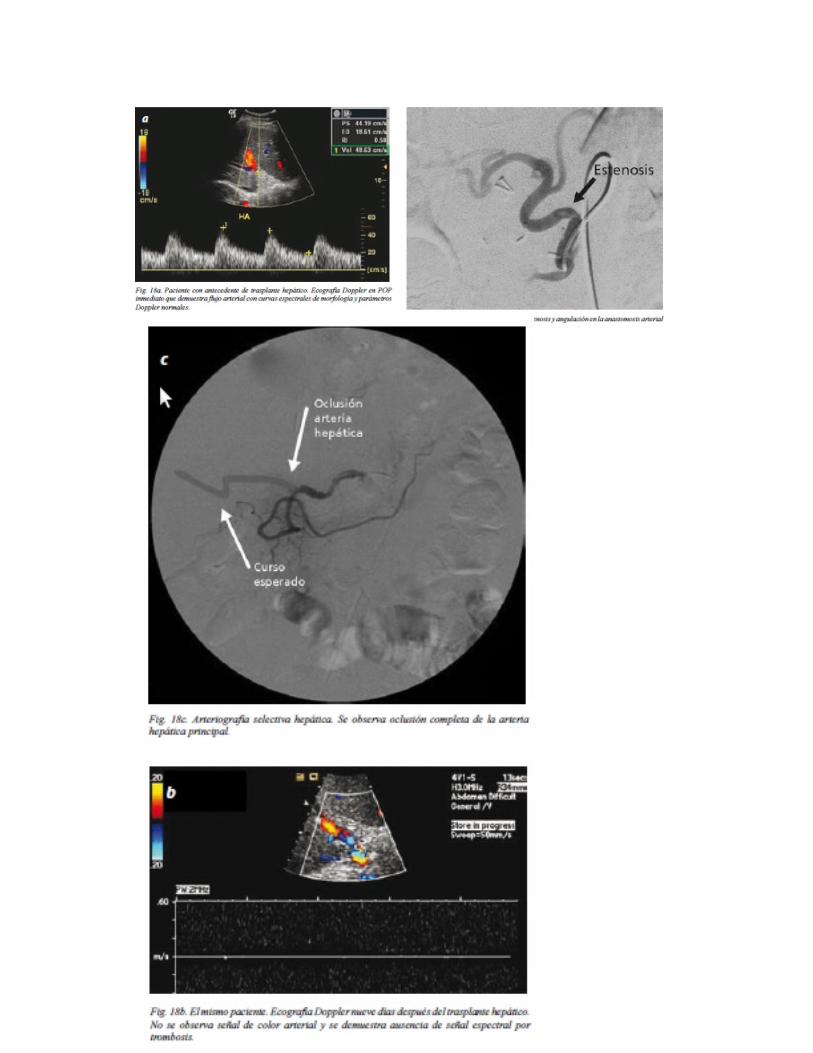
On Doppler Ultrasound studies several pitfalls give rise to false positive results: acceleration time greater than 80 mseg and resistance index lower than 0.5. This findings can be explained by profuse liver edema, systemic hypotension or technically challenging studies because of patient’s condition (Figs. 18a, 18b and 18c). (19,20)
In highgrade stenosis of the hepatic artery, another finding aside from the Doppler parameters already mentioned is a peak systolic velocity greater than 200 cm/seg. A tardusparvus curve is far more common finding in patients with thrombosis (Fig. 19). (19,20)
Fig. 8. Ultrasound showing echogenic material inside main portal vein with absent flow on Doppler scan, secondary to thrombosis.
Fig. 9. CECT (Portal phase) showing a hypodense portal vein with no enhancement due to a soft thrombus.
Figs. 10 and 11. CECT (Arterial phase) showing a large mass with heterogenous enhancement involving the right lobe, associated with a filling defect of the portosplenic confluence and in the main portal vein explained by a thrombus with heterogeneous enhancement related to tumoral etiology.
Figs. 12 and 13. CECT (Arterial and portal phase). Abnormal perfusion with hyperdenseappearing left lobe in arterial phase that becomes isodense in late portal phase (THAD), secondary to portal vein thrombosis.

Fig. 14. CECT (Portal phase) showing splenorenal shunting secondary to portal hypertension. Increased size of these vascular structures and multiple collateral vessels is seen.
Figs. 15a and 15 b. Gadolinium enhanced T1W MR image and selective hepatic angiography showing hepatic artery aneurysm.
Figs. 16 and 17. CECT (Arterial phase). Enhancement of small shunting distal branches of portal circulation with associated THAD.
Fig. 18a. Patient with a past medical history of liver transplant. Doppler ultrasound in the immediate postoperative period shows arterial flow with normal spectral morphology.
Fig. 18b. Same patient nine days after liver transplantation. There is no arterial color signal and there is evidence of absent flow and spectral wave due to arterial thrombosis.
Fig. 18c. Selective hepatic arteriography shows complete occlusion of the main hepatic artery.Oclusión arteria hepática = hepatic artery occlusionCurso esperado = expected course
Fig. 19. Selective hepatic arteriography. Stenosis and kinking of the arterial anastomosis in a patient with liver transplantation.Estenosis = stenosis
Hereditary hemorrhagic telangiectasia (OslerWeberRendu)Hereditary hemorrhagic telangiectasia is an autosomal dominant disease that leads to
fibromuscular dysplasia and arteriovenous malformations or telangiectasias. Clinically, patients present hemorrhages due to systemic involvement. Liver involvement is diagnosed between second to third decades of life, when hyperdynamic secondary circulation is created secondary to arterioportal and portosystemic shunting. This situation triggers congestive heart failure, portal hypertension, encephalopathy, biliary ischemia and even liver failure. Supportive treatment is usually offered; however, embolization, surgery or liver transplantation may be required.(21,22)
CT shows vascular dilatation and tortuosity due to shunting, associated to heterogeneous (mosaic) parenchyma enhancement during arterial phase or THAD´s (65%), telangiectasias (63%) and hypervascular masses (25%). (Algorithm 2.) (14,21,23).
Sinusoidal disorders
PeliosisPeliosis is a disorder most commonly associated with other debilitating diseases,
substance abuse, immune disorders specifically AIDS and concomitant Bartonella infection. However, in 20 to 50 per cent of cases there is no apparent cause.(24) It is characterized by sinusoidal dilatation that manifests as “blood pools” of variable size.(25)
Fig. 20a. Cystic vascularized mass, with lowlevel echos due to blood content inside.
Figs. 20b and c. CECT (coronal MIP reconstruction) and axial FSE T2W MR image . Cystic mass that enhances after contrast administration creating a “blood pool”.
Fig. 21. Axial CECT. Peripheral welldefined hypodense area with segmental geographic pattern of distribution and heterogeneous enhancement, secondary to liver infarction.

Fig. 22. Axial CECT. Liver abscess with gas content (differential diagnosis for infarction in necrotic stage).
Patients may be generally asymptomatic and there may be regression of lesions once the triggering factor is controlled; however, some patients progress to liver failure, portal hypertension cholestasis and/or hemoperitoneum.(26)
On nonenhanced (NE) CT, the lesion shows low attenuation coefficients, with progressive enhancement during CECT (in arterial and portal phases. The enhancement pattern may be centrifugal or centripetal. No mass effect is seen and if small lesions are present, they may not be visualized. If cavities are filled with thrombus, they may be mistaken for abscesses, hypervascular metastases and hemangiomas (Figs. 20a, 20b and 20c). (2427)
OthersLiver infarction
Liver infarction is a rare disorder, considering the liver´s dual blood supply system. It is most frequently iatrogenic or secondary to trauma, although it can occur in cases of coagulation disorders, vasculitis or sepsis. These lesions are localized in the periphery of the liver parenchyma, are well defined and appear hypodense on NECT. There may be gas content. (28) On CECT, these lesions remain hypodense, showing a geographic segmented pattern, although there may be heterogeneous enhancement on later phases. Differential diagnoses include focal steatosis or liver abscess (Figs. 21 and 22).(1,14,28)
Transient hepatic attenuation differences (THAD)Transient hepatic attenuation differences correspond to an attenuation abnormality that
becomes apparent in dynamic studies and is not consistent with a mass. (29) Generally, it appears like a portal segment that enhances in the arterial phases with an area of early attenuation reduction. Isoattenuation when compared to the rest of the liver parenchyma is observed during the late portal phase.(30) THAD is associated to several pathological processes such as tumors, hemangiomas, focal nodular hyperplasia, liver abscesses or vascular abnormalities such as arterioportal shunting or portal thrombosis, particularly in cirrhotic patients.(31) It can mimic liver masses; however, contours are usually well defined and the edges appear smooth and straight (Figs. 12 and 13).(2931)
ConclusionLiver vascular diseases may present with typical manifestations and common imaging
patterns, but typical findings represent a wide spectrum of differential diagnoses. Computed tomography and other imaging modalities play a key role in proper patient management, guiding therapy and surgical assessment in critically ill patients. Consequently, adequate knowledge of liver vascular diseases and common imaging pittfalls is critical to guide patient intervention.
References
1. Boll D, Merkle E. Diffuse liver disease: strategies for hepatic CT and MR imaging. Radiographics. 2009;29(6):15911614. 2. Giallourakis CC, Rosenberg PM, Friedman LS. The liver in heart failure. Clin Li ver Dis. 2002;6(4):94767. 3. Catalano OA, Singh AH, Uppot RN, Hahn PF, Ferrone CR, Sahani DV. Vascular and biliary variants in the liver: implications for liver surgery. Radiographics. 2008;28(8):35978. 4. Gore RM, Mathieu DG, White EM, Ghahremani GG, Panella JS, Rochester D. Pas

sive hepatic congestion. AJR. 1994;162(1):715. 5. Tanaka M, Wanless IR. Pathology of the liver in BuddChiari syndrome: portal vein thrombosis and the histogenesis of venocentric cirrhosis, venoportal cirrhosis, and large regenerative nodules. Hepatology. 1998;27(2):48896. 6. Erden A. BuddChiari syndrome: a review of imaging findings. Eur J Radiol. 2007;61(1):4456. 7. Torabi M, Hosseinzadeh K, Federle M. CT of nonneoplastic hepatic vascular and perfusion disorders. Radiographics. 2008;28(7):196782. 8. Valla DC. The diagnosis and management of the BuddChiari syndrome: consensus and controversies. Hepatology. 2003;38(4):793803. 9. Brancatelli G, Vilgrain V, Federle MP, Hakime A, Lagalla R, Iannaccone R, et al. BuddChiari syndrome: spectrum of imaging findings. AJR Am J Roentgenol. 2007;188(2):W16876. 10. Cura M, Haskal, Z, Lopera J. Diagnostic and interventional radiology for Budd Chiari syndrome. Radiographics. 2009;29(3):66981. 11. Menon K, Shah V, Kamath P. The BuddChiari syndrome. N Engl J Med. 2004;350(6):57885. 12. Gallego C, Velasco M, Marcuello P, Tejedor D, De Campo L, Friera A. Con genital and acquired anomalies of the portal venous system. Radiographics. 2002;22(1):14159. 13. Brancatelli G, Vilgrain V, Federle MP, Hakime A, Lagalla R, Iannaccone R, et al. Budd Chiari syndrome: spectrum of imaging findings. AJR: 2007;188(2):16876. 14. Hussain S. Liver MRI correlation with other imaging modalities and histopatholo gy. New York: Springer; 2007. 15. Federle MP. Diagnostic imaging: abdomen. Salt Lake: Amirsys; 2004. 16. Quiroga S, Sebastià MC, Margarit C, Castells L, Boye R, AlvarezCastells A. Com plications of orthotopic liver transplantation: spectrum of findings with helical CT. Radiographics. 2001;21(5):10851102. 17. Danet IM, Semelka RC, Braga L. MR imaging of diffuse liver disease. Radiol Clin N Am. 2003;41(1):6787. 18. Silva AC, Evans JM, McCullough AE, Jatoi MA, Vargas HE, Hara AK. MR ima ging of hypervascular liver masses: a review of current techniques. Radiographics. 2009;29(2):385402. 19. Crossin JD, Muradali D, Wilson SR. US of liver transplants: normal and abnormal. Radiographics. 2003;23(5):1093114. 20. Ackerman SJ, Irshad A. The role of sonography in liver transplantation. Ultrasound Clin. 2007;2(3):37790. 21. Gallego C, Miralles M, Marín C, Muyor P, González G, GarcíaHidalgo E. Conge nital hepatic shunts. Radiographics. 2004;24(3):75572. 22. GarciaTsao G. Liver involvement in hereditary hemorrhagic telangiectasia (HHT). J Hepatol 2007;46(3):499507. 23. Ianora AA, Memeo M, Sabba C, Cirulli A, Rotondo A, Angelelli G. Hereditary hemorrhagic telangiectasia: multidetector row helical CT assessment of hepatic involvement. Radiology. 2004;230(1):2509. 24. Tessier DJ, Fowl RJ, Stone WM, McKusick MA, Abbas M, Sarr M, et al. Iatro genic hepatic artery pseudoaneurysms: an uncommon complication after hepatic, biliary, and pancreatic procedures. Ann Vasc Surg. 2003;17(6):6639. 25. Kim HC, Kim TK, Sung KB, Yoon HK, Kim PN, Ha HK, et al. CT during hepatic arteriography and portography: an illustrative review. Radiographics. 2002;22(5):104151. 26. Iannaccone R, Federle MP, Brancatelli G, Matsui O, Fishman EK, Narra VR, et al. Peliosis hepatis: spectrum of imaging findings. AJR Am J Roentgenol.

2006;187(1):W4352. 27. Gouya H, Vignaux O, Legmann P, de Pigneaux G, Bonnin A. Peliosis he patis: triphasic helical CT and dynamic MRI findings. Abdom Imaging. 2001;26(5):5079. 28. LevToaff AS, Friedman AC, Cohen LM, Radecki PD, Caroline DF. Hepa tic infarcts: new observations by CT and sonography. AJR Am J Roentgenol. 1987;149(1):8790. 29. Kim HJ, Kim AY, Kim TK, Byun JH, Won HJ, Kim KW, et al. Transient hepa tic attenuation differences in focal hepatic lesions: dynamic CT features. AJR. 2005;184(1):8390. 30. Colagrande S, Centi N, Galdiero R, Ragozzino A. Transient hepatic intensity di fferences. Part 2, those not associated with focal lesions. AJR Am J Roentgenol. 2007;188(1):1606. 31. Colagrande S, Centi N, Galdiero R, Ragozzino A. Transient hepatic intensity differences. Part 1, those associated with focal lesions. AJR Am J Roentgenol. 2007;188(1):1549.
CorrespondenceDiego AguirreDepartamento de Radiología e Imágenes Diagnósticas Fundación Santa Fe de Bogotá Calle 119 No. 775 Bogotá, Colombia [email protected]
Received for review: January 14, 2010 Accepted for publication: February 18, 2010