Amphetamines In Urine by LC-MS/MS - HPLChplc.eu/Downloads/ACE_apps_lcms-v1.pdf · Amphetamines In...
29
ACE ® HPLC / UHPLC Columns Amphetamines In Urine by LC-MS/MS 1 TIC 1 2 3 4 5 6 7 ACE Excel SuperC18, 3um, 75 x 2.1 mm Gradient analysis MP A: 5mM Ammonium Hydroxide, pH 10.8. MP B: 5mM Ammomnium Hydroxide, pH 10.8 in 1:9 v/v H2O:MeOH. 0.6mL/min T %B 0 30 8 95 60C, 2uL. Varian 320 Triple Quadrupole MS Electrospray voltage: +5 kV Inlet capillary voltage: 30 V CID with argon at 1.5 mTorr; Collision cell potential ranges from 5 to 17 V Drying gas (nitrogen) temperature: 325 C Nebulizing gas (nitrogen) pressure: 35 psi Extended Dynamic Range 1. Phenylpropanolamine 2. (l)-Ephedrine 3. (dl)-3,4-MDA 4. (d)-Amphetamine 5. (dl)-3,4-MDMA 6. 4-methylthioamphetamine 7, (±)-MDEA © Advanced Chromatography Technologies Ltd. www.ace-hplc.com
Transcript of Amphetamines In Urine by LC-MS/MS - HPLChplc.eu/Downloads/ACE_apps_lcms-v1.pdf · Amphetamines In...

ACE®
HPLC / UHPLC Columns
Amphetamines In Urine by LC-MS/MS
1
TIC
1
2
3
4
5
6
7
ACE Excel SuperC18, 3um, 75 x 2.1 mm Gradient analysis MP A: 5mM Ammonium Hydroxide, pH 10.8. MP B: 5mM Ammomnium Hydroxide, pH 10.8 in 1:9 v/v H2O:MeOH. 0.6mL/min T %B 0 30 8 95 60C, 2uL. Varian 320 Triple Quadrupole MS Electrospray voltage: +5 kV Inlet capillary voltage: 30 V CID with argon at 1.5 mTorr; Collision cell potential ranges from 5 to 17 V Drying gas (nitrogen) temperature: 325 C Nebulizing gas (nitrogen) pressure: 35 psi Extended Dynamic Range
1. Phenylpropanolamine 2. (l)-Ephedrine 3. (dl)-3,4-MDA 4. (d)-Amphetamine 5. (dl)-3,4-MDMA 6. 4-methylthioamphetamine 7, (±)-MDEA
© Advanced Chromatography Technologies Ltd. www.ace-hplc.com

ACE®
HPLC / UHPLC Columns
Opiates In Urine by LC-MS/MS
2
ACE Excel SuperC18, 3um, 75 x 2.1 mm + guard Gradient analysis MP A: 5mM Ammonium Hydroxide, pH 10.8. MP B: 5mM Ammomnium Hydroxide, pH 10.8 in 1:9 v/v H2O:MeOH. 0.6mL/min T %B 0 5 5 95 60C, 2uL. Varian 320 Triple Quadrupole MS Electrospray voltage: +5 kV Inlet capillary voltage: 30 V CID with argon at 1.5 mTorr; Collision cell potential ranges from 5 to 17 V Drying gas (nitrogen) temperature: 325 C Nebulizing gas (nitrogen) pressure: 35 psi Extended Dynamic Range
TIC
1. Morphine 3-b-D-glucuronide 2. Normorphine 3. Morphine 6-b-D-glucuronide 4. Morphine 5. 6-Acetylmorphine
1
2
3
4
5
© Advanced Chromatography Technologies Ltd. www.ace-hplc.com
ACE®
HPLC / UHPLC Columns
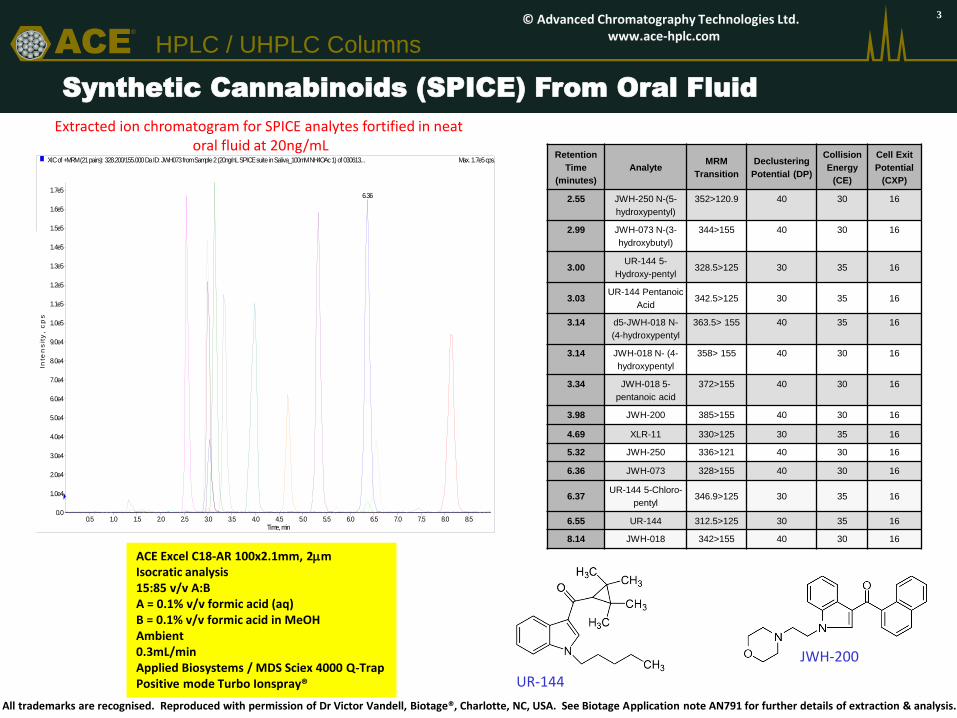
Extracted ion chromatogram for SPICE analytes fortified in neat oral fluid at 20ng/mL
Synthetic Cannabinoids (SPICE) From Oral Fluid
ACE Excel C18-AR 100x2.1mm, 2mm Isocratic analysis 15:85 v/v A:B A = 0.1% v/v formic acid (aq) B = 0.1% v/v formic acid in MeOH Ambient 0.3mL/min Applied Biosystems / MDS Sciex 4000 Q-Trap Positive mode Turbo Ionspray®
XIC of +MRM (21 pairs): 328.200/155.000 Da ID: JWH073 from Sample 2 (20ng/nL SPICE suite in Saliva_100mM NH4OAc 1) of 030613... Max. 1.7e5 cps.
0.5 1.0 1.5 2.0 2.5 3.0 3.5 4.0 4.5 5.0 5.5 6.0 6.5 7.0 7.5 8.0 8.5Time, min
0.0
1.0e4
2.0e4
3.0e4
4.0e4
5.0e4
6.0e4
7.0e4
8.0e4
9.0e4
1.0e5
1.1e5
1.2e5
1.3e5
1.4e5
1.5e5
1.6e5
1.7e5
Inte
ns
ity
, c
ps
6.36
All trademarks are recognised. Reproduced with permission of Dr Victor Vandell, Biotage®, Charlotte, NC, USA. See Biotage Application note AN791 for further details of extraction & analysis.
UR-144
JWH-200
Retention
Time
(minutes)
Analyte MRM
Transition
Declustering
Potential (DP)
Collision
Energy
(CE)
Cell Exit
Potential
(CXP)
2.55 JWH-250 N-(5-
hydroxypentyl)
352>120.9 40 30 16
2.99 JWH-073 N-(3-
hydroxybutyl)
344>155 40 30 16
3.00 UR-144 5-
Hydroxy-pentyl 328.5>125 30 35 16
3.03 UR-144 Pentanoic
Acid 342.5>125 30 35 16
3.14 d5-JWH-018 N-
(4-hydroxypentyl
363.5> 155 40 35 16
3.14 JWH-018 N- (4-
hydroxypentyl
358> 155 40 30 16
3.34 JWH-018 5-
pentanoic acid
372>155 40 30 16
3.98 JWH-200 385>155 40 30 16
4.69 XLR-11 330>125 30 35 16
5.32 JWH-250 336>121 40 30 16
6.36 JWH-073 328>155 40 30 16
6.37 UR-144 5-Chloro-
pentyl 346.9>125 30 35 16
6.55 UR-144 312.5>125 30 35 16
8.14 JWH-018 342>155 40 30 16
3 © Advanced Chromatography Technologies Ltd. www.ace-hplc.com

ACE®
HPLC / UHPLC Columns
LC-MS/MS of Acylcarnitines
0 1 2 3 4 5 6 7 8
Time (min)
0
50
100
0
50
100
0
50
100
Rela
tive
Ab
un
da
nce
0
50
100
0
50
100
RT: 0.99
RT: 3.19
RT: 4.06
RT: 4.88
RT: 4.79
RT: 5.75
RT: 5.61
:
6 7 8 9 10 11 12 13
Time (min)
0
20
40
60
80
100
0
20
40
60
80
100
0
20
40
60
80
100
Rela
tive
Ab
un
da
nce
0
20
40
60
80
100
RT: 6.83 Carnitine
Propionylcarnitine
ACE Excel C18-PFP
2μm, 100 x 2.1mm
Gradient analysis
A = 0.1% formic acid in water
B = 0.1% formic acid in
methanol
Time (Mins) %B
0 0.5
0.5 0.5
9.0 90
13.0 90
Flow rate: 0.3ml/min
Positive mode ESI
Sample: Dried serum extract
RT: 8.53
RT: 11.03
RT: 11.73
Myristylcarnitine
Palmitoylcarnitine
Hexanoylcarnitine
Isovalerylcarnitine
2-Methylbutyrylcarnitine
Transition
218.13→85.25-85.35
Acetylcarnitine
Transition 204.13→85.25-85.35
Transition
288.20→85.25-85.35
Transition 260.20→85.25-85.35
Transition
246.20→85.25-85.35
Transition 400.30→85.25-85.35
Transition 372.30→85.25-85.35
Octanoylcarnitine
Reproduced with permission of Dr Timothy Garrett, Department of Pathology, Immunology and Laboratory Medicine, University of Florida, USA
Butyrylcarnitine
Isobutyrylcarnitine
Transition
232.15→85.25-85.35
Transition
162.16→85.25-85.35
4 © Advanced Chromatography Technologies Ltd. www.ace-hplc.com

ACE®
HPLC / UHPLC Columns
Corticosteroids by LC-MS/MS
1. Triamcinolone
2. Prednisolone
3. Fluoroprednisolone
4. Methylprednisolone
5. Betamethasone
6. Dexamethasone
7. Flumethasone
ACE C18-PFP, 3μm, 150 x 2.1mm
Gradient analysis
A: 0.1% formic acid in water
B: CH3CN – 0.1% formic acid in
water
Time (mins) %B
0 30
14 50
17 95
20 30
Flow rate: 0.3ml/min
Column temperature: 15°C
Injection volume: 25μl
Turbospray, MRM
1
4
3
2
7
6
5
Reproduced with permission of Inmaculada Garcia Lomillo, Laboratorio Salud Publica de Burgos, Spain
5 © Advanced Chromatography Technologies Ltd. www.ace-hplc.com
ACE®
HPLC / UHPLC Columns
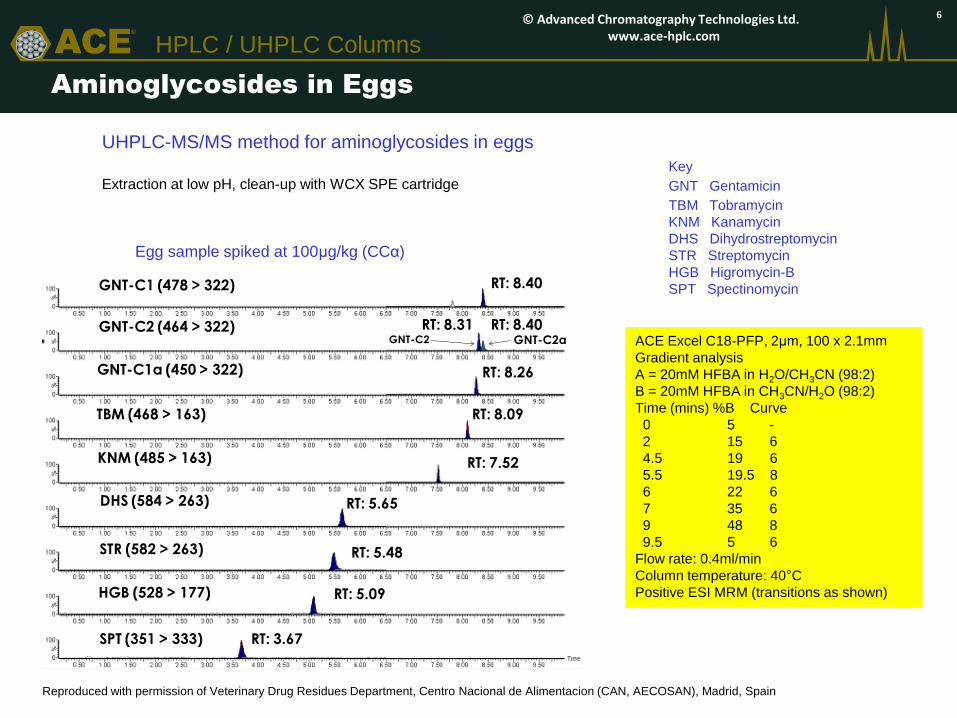
Aminoglycosides in Eggs
Egg sample spiked at 100 mg/kg (CCa)
GNT-C1 (478 > 322)
GNT-C2 (464 > 322)
GNT-C1a (450 > 322)
TBM (468 > 163)
KNM (485 > 163)
DHS (584 > 263)
STR (582 > 263)
HGB (528 > 177)
SPT (351 > 333)
RT: 8.40
RT: 8.40RT: 8.31
RT: 8.26
RT: 8.09
RT: 5.65
RT: 5.48
RT: 5.09
RT: 3.67
RT: 7.52
GNT-C2 GNT-C2a
Key
GNT Gentamicin
TBM Tobramycin
KNM Kanamycin
DHS Dihydrostreptomycin
STR Streptomycin
HGB Higromycin-B
SPT Spectinomycin
Egg sample spiked at 100μg/kg (CCα)
ACE Excel C18-PFP, 2μm, 100 x 2.1mm
Gradient analysis
A = 20mM HFBA in H2O/CH3CN (98:2)
B = 20mM HFBA in CH3CN/H2O (98:2)
Time (mins) %B Curve
0 5 -
2 15 6
4.5 19 6
5.5 19.5 8
6 22 6
7 35 6
9 48 8
9.5 5 6
Flow rate: 0.4ml/min
Column temperature: 40°C
Positive ESI MRM (transitions as shown)
Reproduced with permission of Veterinary Drug Residues Department, Centro Nacional de Alimentacion (CAN, AECOSAN), Madrid, Spain
UHPLC-MS/MS method for aminoglycosides in eggs
Extraction at low pH, clean-up with WCX SPE cartridge
6 © Advanced Chromatography Technologies Ltd. www.ace-hplc.com

ACE®
HPLC / UHPLC Columns
Pesticides by LC-MS/MS
ACE UltraCore SuperC18, 2.5μm, 50 x 2.1mm
Gradient analysis
A = 0.1% HCOOH + 5mM NH4CO2H in 9:1 v/v H2O: MeOH
B = 0.1% HCOOH + 5mM NH4CO2H in 1:9 v/v H2O: MeOH
Flow Rate: 0.4ml/min
Temperature: 40°C
Injection volume: 20μl
Agilent 6420 Triple Quadrupole MS, +ve mode ESI
Dynamic MRM
Reproduced with permission of Barry Whatmore, Kent Scientific Services
Also analysed under same conditions:
Acephate Hexaconazole
Acetamiprid Hexaflumuron
Aldicarb Imidacloprid
Aldicarb sulphone Indoxacarb
Aldicarb sulphoxide Mandipropamid
Benomyl Methamidophos
Carbendazim Methomyl
Carbofuran Monocrotophos
Clofentezine Nicotine
Clothianidin Omethoate
Cyfluthrin Oxamyl
Demeton S-methylsulphone Pencycuron
Demeton S-methylsulphoxide Prochloraz
Dicrotophos Propargite
Dimethoate Thiabendazole
Dinotefuran Thiacloprid
DMA Thiamethoxam
DMPF Thiodicarb
Flubendiamide Thiophanate methyl
Folpet Triforine
Formetanate
Carbaryl
Dimethomorphs
Cyproconazoles
Fenbuconazole
Transition 202.10 145.10
Transition 388.10 301.10
Transition 292.10 70.00
Transition 337.10 70.00
Gradient conditions
Time (mins) 0 1 15 18 18.05 20
%B 0 0 100 100 0 0
7 © Advanced Chromatography Technologies Ltd. www.ace-hplc.com
ACE®
HPLC / UHPLC Columns
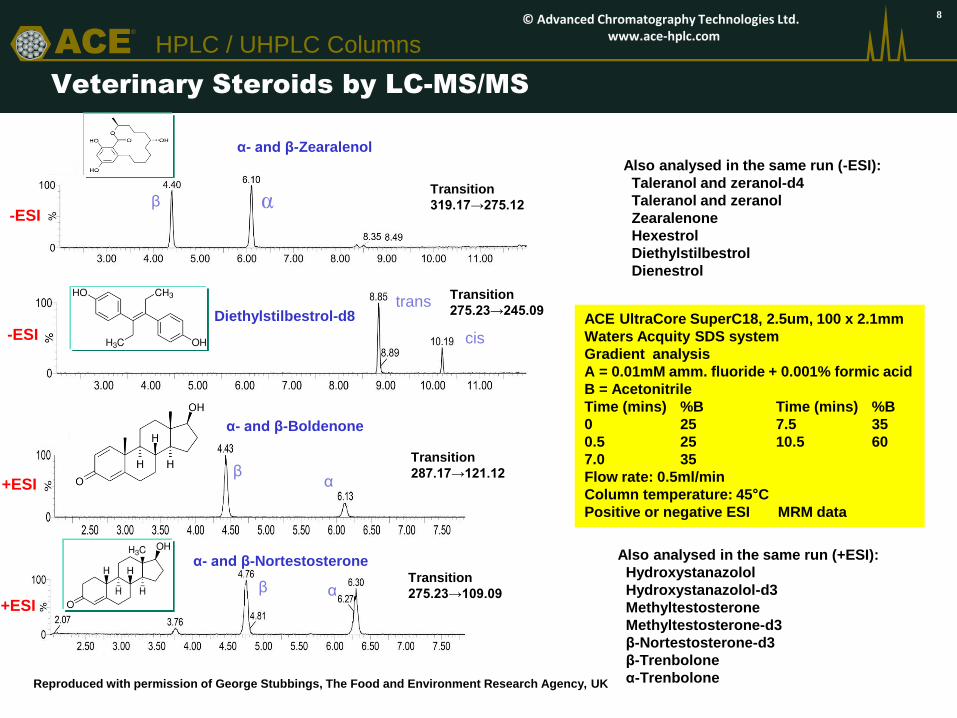
Veterinary Steroids by LC-MS/MS
ACE UltraCore SuperC18, 2.5um, 100 x 2.1mm
Waters Acquity SDS system
Gradient analysis
A = 0.01mM amm. fluoride + 0.001% formic acid
B = Acetonitrile
Time (mins) %B Time (mins) %B
0 25 7.5 35
0.5 25 10.5 60
7.0 35
Flow rate: 0.5ml/min
Column temperature: 45°C
Positive or negative ESI MRM data
Reproduced with permission of George Stubbings, The Food and Environment Research Agency, UK
Also analysed in the same run (-ESI):
Taleranol and zeranol-d4
Taleranol and zeranol
Zearalenone
Hexestrol
Diethylstilbestrol
Dienestrol
Also analysed in the same run (+ESI):
Hydroxystanazolol
Hydroxystanazolol-d3
Methyltestosterone
Methyltestosterone-d3
β-Nortestosterone-d3
β-Trenbolone
α-Trenbolone
α- and β-Zearalenol
+ESI
Diethylstilbestrol-d8
β α
trans
cis
β
α
β α
+ESI
-ESI
-ESI
Transition
319.17→275.12
Transition
275.23→245.09
α- and β-Nortestosterone Transition
275.23→109.09
Transition
287.17→121.12
α- and β-Boldenone
8 © Advanced Chromatography Technologies Ltd. www.ace-hplc.com
ACE®
HPLC / UHPLC Columns
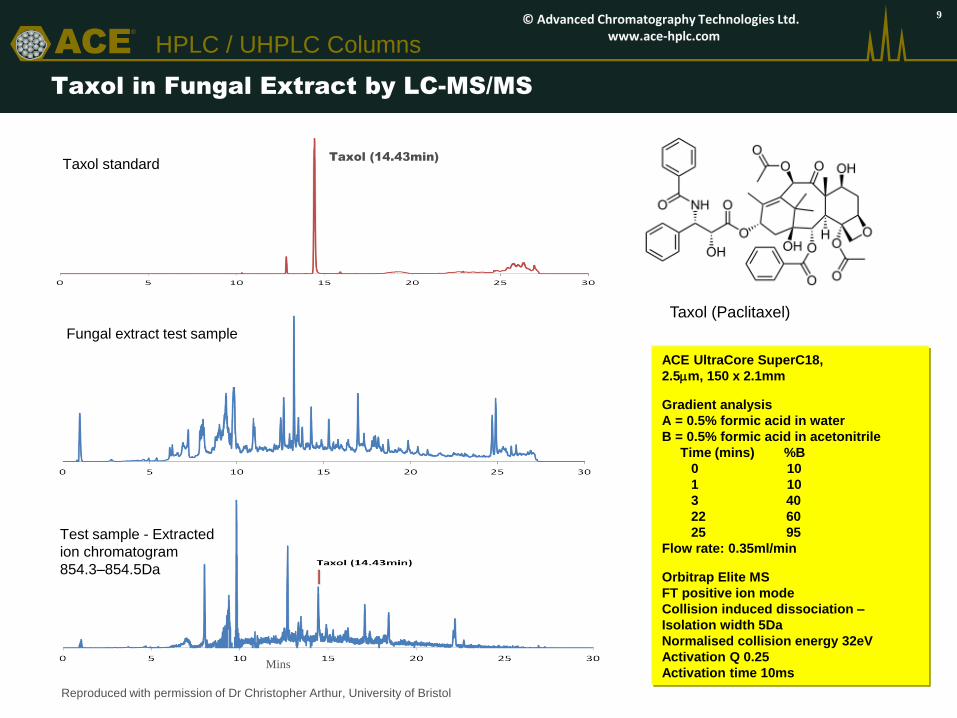
Taxol in Fungal Extract by LC-MS/MS
Taxol (14.43min)
ACE UltraCore SuperC18,
2.5mm, 150 x 2.1mm
Gradient analysis
A = 0.5% formic acid in water
B = 0.5% formic acid in acetonitrile
Time (mins) %B
0 10
1 10
3 40
22 60
25 95
Flow rate: 0.35ml/min
Orbitrap Elite MS
FT positive ion mode
Collision induced dissociation –
Isolation width 5Da
Normalised collision energy 32eV
Activation Q 0.25
Activation time 10ms
Reproduced with permission of Dr Christopher Arthur, University of Bristol
Taxol (Paclitaxel)
Fungal extract test sample
Taxol standard
Test sample - Extracted
ion chromatogram
854.3–854.5Da
Mins
9 © Advanced Chromatography Technologies Ltd. www.ace-hplc.com

ACE®
HPLC / UHPLC Columns
Microbial Extract by LC-MS
Reproduced with permission of Dr Lijiang Song, Department of Chemistry, University of Warwick, UK
Dionex 3000RS UHPLC system coupled with
Bruker MaXis Q-TOF MS
UltraCore SuperC18 2.5um, 150 x 2.1mm
Gradient analysis
A = 0.1% formic acid in water
B = 0.1% formic acid in acetonitrile
Time (mins) %B Time (mins) %B
0 5 20 100
5 5 25 100
Flow rate: 0.2ml/min
Electrospray MS (positive mode)
Source: End plate offset: -500V,
Capillary: -4500V
Nebuliser gas (N2) at 1.6 bar
Drying gas (N2) temp.: 180°C
Collision energy: 5.0eV
Collision RF: 600Vpp
1. Dinactin R1 = R3 = CH2CH3, R2 = R4 = CH3
2. Trinactin R1 = R2 = R3 = CH2CH3, R4 = CH3
3. Tetranactin R1 = R2 = R3 = R4 = CH2CH3
R1
R2
R3
R4
Macrotetralides
1
2
3
Dinactin
Tetranactin
Trinactin
Marine Streptomyces extract
10 © Advanced Chromatography Technologies Ltd. www.ace-hplc.com

ACE®
HPLC / UHPLC Columns
Cytotoxic Agents by UHPLC-MS/MS
RT: 0.00 - 8.00 SM: 7B
0.0 0.5 1.0 1.5 2.0 2.5 3.0 3.5 4.0 4.5 5.0 5.5 6.0 6.5 7.0 7.5 8.0
Time (min)
0
20
40
60
80
100
0
20
40
60
80
100
0
20
40
60
80
100
Re
lativ
e A
bu
nd
an
ce
0
20
40
60
80
100RT: 0.94
RT: 3.92
RT: 3.76
RT: 4.08
NL: 3.12E8
TIC F: + p ESI SRM
ms2 244.089
[111.899-112.399]
MS
Rachel_seq00181
NL: 2.40E8
TIC F: + p ESI SRM
ms2 310.212
[265.259-265.309]
MS
Rachel_seq00181
NL: 1.94E8
TIC F: + p ESI SRM
ms2 544.155
[360.933-361.433,
396.969-397.469]
MS
Rachel_seq00181
NL: 3.95E7
TIC F: + p ESI SRM
ms2 589.159
[184.891-185.391,
228.896-229.396]
MS
Rachel_seq00181
Reproduced with permission of Dr Essam Ghazaly, Barts Cancer Institute, Queen Mary University of London
Thermo Scientific Accela UHPLC
ACE UltraCore SuperC18, 2.5mm, 100
x 2.1mm
Gradient analysis
A = 0.1% formic acid in water
B = 0.1% formic acid in acetonitrile
Time (mins) %B
0 2
1 2
3 80
5 80
5.1 2
8 2
Flow rate: 0.25ml/min
Thermo Vantage triple quadrupole MS
MRM +ve ESI mode
Spray voltage: 3500V
Nitrogen sheath and auxiliary gas
CID with argon at 1.5 mTorr
AraC
Transition 244.1 112.2
Methadone
Transition 310.2 265.3
Doxorubicin
Transition 544.2 361.2
Etoposide
Transition 589.2 185.1
11 © Advanced Chromatography Technologies Ltd. www.ace-hplc.com

ACE®
HPLC / UHPLC Columns
Peptides in saliva
Reproduced with permission of Birthe Nielsen, School of Science, University of Greenwich, UK
Extracted ion current chromatograms
(sum of multiply protonated ions [M+3H]3+,
[M+4H]4+ and [M+5H]5+)
Mass spectra
Sample preparation: SPE on C18
ACE UltraCore SuperC18
2.5μm, 50 x 3mm
Gradient analysis
A: 0.1% formic acid in water
B: 0.1% formic acid in CH3CN
Time (mins) %B
0 2
2 2
17 50
19 95
20 95
Flow rate: 0.6ml/min
Synapt G1 QToF +ESI MS
Sampling cone voltage: 40V
Source temperature: 150°C
Capillary voltages: 4.8kV
Extraction cone voltages: 41kV
Desolvation temperature: 500°C
Acquisition: 100-2000 m/z
Total ion current
chromatogram Defensin Human Neutrophil Peptides
HNP-1 30 amino acid residues
HNP-2 29 amino acid residues
HNP-3 30 amino acid residues
Detection limit ~ 2.1ng/μl
Area of
interest
HNP-1
HNP-3
HNP-2
HNP-3
HNP-1
HNP-2
12 © Advanced Chromatography Technologies Ltd. www.ace-hplc.com
ACE®
HPLC / UHPLC Columns
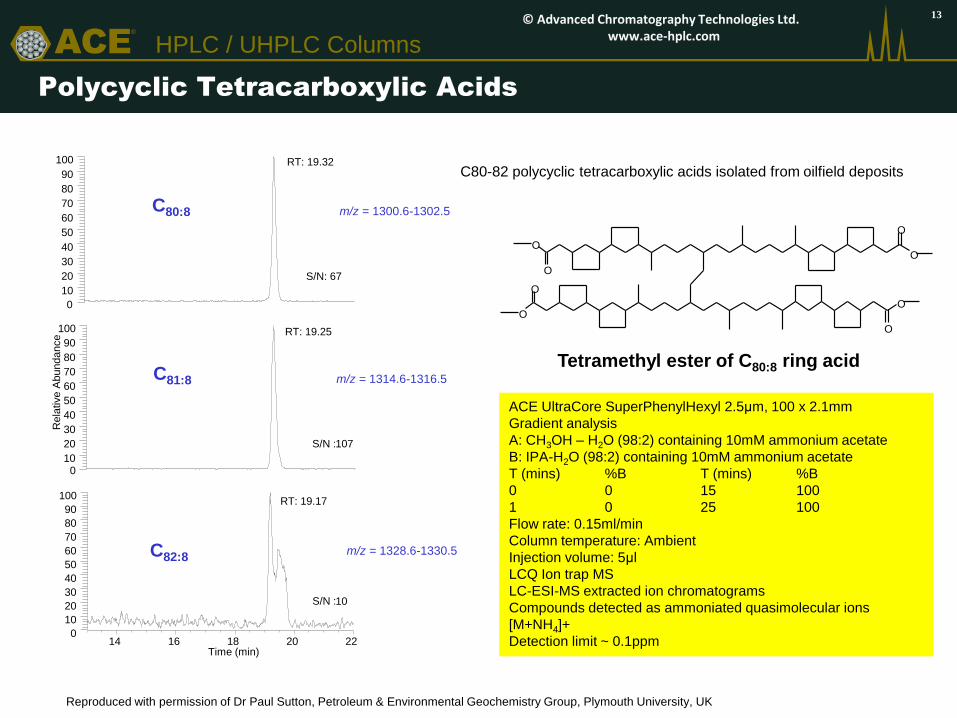
Polycyclic Tetracarboxylic Acids
0
0
10
20
30
40
50
60
70
80
90
100
10
20
30
40
50
60
70
80
90
100
Rela
tive A
bundance
14 16 18 20 22 Time (min)
0
10
20
30
40
50
60
70
80
90
100
RT: 19.32
S/N : 67
RT: 19.25
S/N :
107
RT: 19.17
S/N :
10
m/z = 1300.6-1302.5
m/z = 1314.6-1316.5
m/z = 1328.6-1330.5 C82:8
ACE UltraCore SuperPhenylHexyl 2.5μm, 100 x 2.1mm
Gradient analysis
A: CH3OH – H2O (98:2) containing 10mM ammonium acetate
B: IPA-H2O (98:2) containing 10mM ammonium acetate
T (mins) %B T (mins) %B
0 0 15 100
1 0 25 100
Flow rate: 0.15ml/min
Column temperature: Ambient
Injection volume: 5μl
LCQ Ion trap MS
LC-ESI-MS extracted ion chromatograms
Compounds detected as ammoniated quasimolecular ions
[M+NH4]+
Detection limit ~ 0.1ppm
C80:8
C81:8
O
O
O
O
O
O
O
O
Tetramethyl ester of C80:8 ring acid
Reproduced with permission of Dr Paul Sutton, Petroleum & Environmental Geochemistry Group, Plymouth University, UK
C80-82 polycyclic tetracarboxylic acids isolated from oilfield deposits
13 © Advanced Chromatography Technologies Ltd. www.ace-hplc.com

ACE®
HPLC / UHPLC Columns
Microcystins From Blue/Green Algae In Drinking Water
Reproduced with permission of Bruker UK Ltd
Bruker Advance UHPLC system
ACE Excel 2μm C18, 100 x 2.1mm
Gradient elution
A = 0.1% formic acid in water
B = Acetonitrile
T (mins) %B T (mins) %B
0 30 7.1 30
1 30 10 30
7 95
Flow rate: 0.4mL/min
Column temperature: 40°C
Injection volume: 50μL
Concentration each microcystin: 0.05ppb
Bruker EVOQ Elite triple quad MS
VIP heated-ESI temperature: 350°C
Cone gas temperature: 200°C
Spray voltage: 4500V (+)
Collision gas: argon 1.5mTorr
Variants R L
MC-LR Leucine Arginine
MC-RR Arginine Arginine
MC-YR Tyrosine Arginine
YR
LR
ACE Excel 2 mm C18, 100 x 2.1 mm
Microcystin RR (MW 1038)
Transition 520 → 135
Microcystin LR (MW 995)
Transition 498 → 135
Microcystin YR (MW 1045)
Transition 523 → 135
TIC
0.05 ppb each
14 © Advanced Chromatography Technologies Ltd. www.ace-hplc.com
ACE®
HPLC / UHPLC Columns
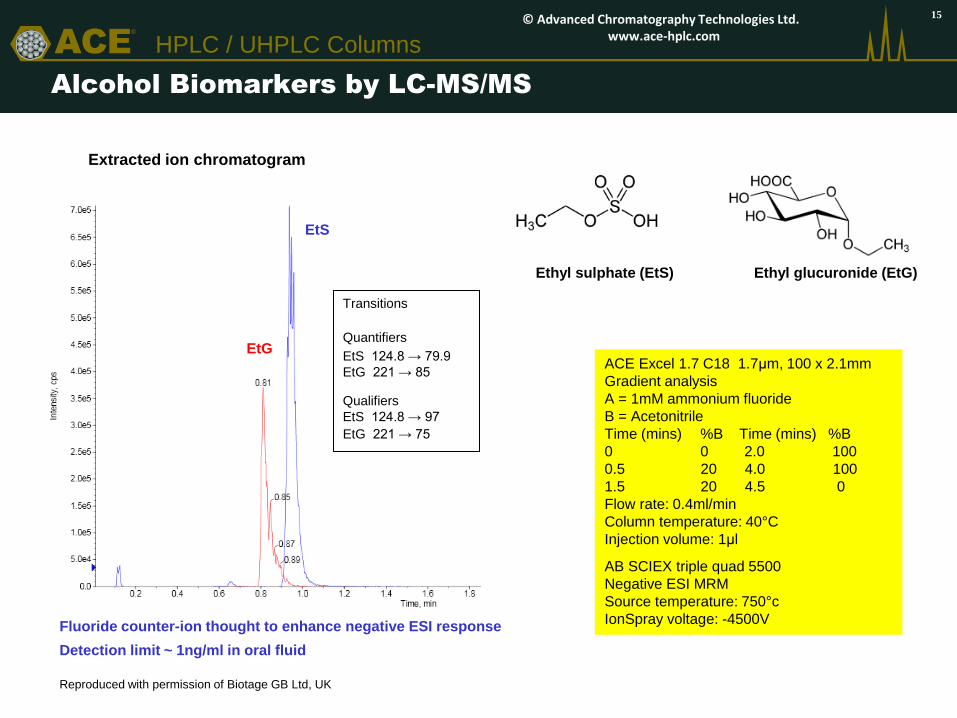
Alcohol Biomarkers by LC-MS/MS
ACE Excel 1.7 C18 1.7μm, 100 x 2.1mm
Gradient analysis
A = 1mM ammonium fluoride
B = Acetonitrile
Time (mins) %B Time (mins) %B
0 0 2.0 100
0.5 20 4.0 100
1.5 20 4.5 0
Flow rate: 0.4ml/min
Column temperature: 40°C
Injection volume: 1μl
AB SCIEX triple quad 5500
Negative ESI MRM
Source temperature: 750°c
IonSpray voltage: -4500V
Reproduced with permission of Biotage GB Ltd, UK
Transitions
Quantifiers
EtS 124.8 → 79.9
EtG 221 → 85
Qualifiers
EtS 124.8 → 97
EtG 221 → 75
Extracted ion chromatogram
Ethyl sulphate (EtS) Ethyl glucuronide (EtG)
Fluoride counter-ion thought to enhance negative ESI response
Detection limit ~ 1ng/ml in oral fluid
EtG
EtS
15 © Advanced Chromatography Technologies Ltd. www.ace-hplc.com

ACE®
HPLC / UHPLC Columns
Perfluoro acids by LC-MS/MS
Peak ID Analyte
1 Heptafluorobutyric acid
2 Perfluorohexanoic acid
3 Perfluorobutylsulphonic acid
4 Perfluoroheptanoic acid
5 Perfluorooctanoic acid
6 Perfluorohexylsulphonic acid
7 Perfluorononanoic acid
8 Perfluorodecanoic acid
9 Perfluorooctanesulphonic acid
ACE Excel 2 C18 2μm, 50 x 2.1mm
Gradient analysis
A = 2mM NH4OAc, 0.1% acetic acid/CH3CN (95:5)
B = 2mM NH4OAc, 0.1% acetic acid/CH3CN (5:95)
T (mins) % B T (mins) %B
0 25 7.5 95
0.5 25 8.0 25
5.5 95 10.0 25
Flow rate: 0.5ml/min
Column temperature: 40°C
Injection volume: 20μl
AB SCIEX triple quad 5500
Negative ESI MRM
Source temperature: 450°C
IonSpray voltage: -2400V
Reproduced with permission of Biotage GB Ltd, UK
Transitions
Peak
1 212.9 → 168.9
2 313 → 268.9
3 299 → 79.9
4 363 → 319
5 413 → 368.9
6 399 → 80
7 463 → 419
8 513 → 469
9 499 → 80
1
2
4
5
7
8
6 9 3
16 © Advanced Chromatography Technologies Ltd. www.ace-hplc.com

ACE®
HPLC / UHPLC Columns
Pristinamycin components in plasma by LC-MS/MS
Reproduced with permission of inVentiv Health Clinical, Quebec, Canada
ACE 3 C18 3μm, 30 x 3.0mm
Gradient analysis
A = 1mM NH4CO2H + 0.1%
HCO2H in 65:35 H2O:CH3CN
B = CH3CN T (mins) %B T (mins) %B
0 0 1.61 100
0.3 0 2.6 100
0.31 10 2.61 0
1.6 10 4 0
Flow rate: 1ml/min
Column temperature: 25°C
Injection volume: 10μl
MDS Sciex API 4000
TurboIonSpray positive mode
Low calibration standard containing
2.5ng/ml each of pristinamycin lA and llA
in human NaF/K2C2O4 plasma
Transitions monitored:
Pristinamycin lA 867.5 → 134.2
Pristinamycin llA 526.3 → 355.1
I.S. (Virginiamycin) 824.6 → 134.0
Processed study sample containing
pristinamycin lA and llA
Pristinamycin antibiotic is a mixture of 2 components –
pristinamycin lA and llA
Virginiamycin used as internal standard
Pristinamycin llA Pristinamycin lA
17 © Advanced Chromatography Technologies Ltd. www.ace-hplc.com

ACE®
HPLC / UHPLC Columns
15-Hydroxy Lubiprostone in Human Plasma
ACE Excel 2 C18 2μm, 50 x 3.0mm
Isocratic analysis
A = 0.1% formic acid in water
B = Acetonitrile
Flow rate: 0.65ml/min
Column temperature: 35°C
Injection volume: 15μl
MDS Sciex API 5000
TurboIonSpray negative mode
IonSpray voltage: -4500V
Source temperature: 450°C
15-Hydroxy lubiprostone
MW 392.5
Reproduced with permission of inVentiv Health Clinical, Quebec, Canada
Lubiprostone, a fatty acid derived from prostaglandin E1, is rapidly
metabolised to 15-hydroxy lubiprostone.
Quantitation is based on 15-hydroxy lubiprostone, with the d4 analogue
as internal standard
Transitions monitored:
15-Hydroxy lubiprostone
391.2 → 373.2
I.S. (15-Hydroxy lubiprostone-d4)
395.2 → 377.2
Lowest calibration standard sample containing 2.0pg/ml in human
EDTA K3 plasma
15-Hydroxy
lubiprostone I.S.
18 © Advanced Chromatography Technologies Ltd. www.ace-hplc.com

ACE®
HPLC / UHPLC Columns
Dermorphin in Equine Urine by LC-MS/MS
Reproduced with permission of Bruker UK Ltd (Bruker Application Note #704423)
ACE 3 C18 (3μm, 100 x 2.1mm)
Gradient analysis
A = 0.2% formic acid in water
B = 0.2% formic acid in acetonitrile
T (mins) %B T (mins) %B
0 5 8.5 95
0.2 5 8.51 5
8 95 12.5 5
Flow rate: 0.4ml/min
Injection volume: 40μl
Bruker EVOQ Elite triple quad MS
VIP heated-ESI temperature: 350°C
Cone gas temperature: 250°C
Spray voltage: +4000V
Dermorphin
Deltorphin-ll
Transitions
Dermorphin:
m/z 803.4 → 602 (quantifier ion)
m/z 803.4 → 202 (qualifier ion)
Deltorphin:
m/z 783 → 277
Accurate quantification of dermorphin in equine
urine in range 0.05 – 100ng/ml
LLOQ = 0.05ng/ml
Deltorphin-ll
(Internal Standard)
Dermorphin
MRM chromatogram of 0.05ng/ml dermorphin in equine urine
19 © Advanced Chromatography Technologies Ltd. www.ace-hplc.com

ACE®
HPLC / UHPLC Columns
Clenbuterol in Equine Plasma by LC-MS/MS
Reproduced with permission of Bruker UK Ltd (Bruker Application Note #704055)
ACE 3 C18 (3μm, 100 x 2.1mm)
Gradient analysis
A = 0.2% formic acid in water
B = 0.2% formic acid in acetonitrile
T (mins) %B T (mins) %B
0 10 2.8 10
0.3 10 4.5 10
2.5 95
Flow rate: 0.45ml/min
Injection volume: 30μl
Bruker EVOQ Elite triple quad MS
VIP heated-ESI temperature: 300°C
Cone gas temperature: 300°C
Spray voltage: +3500V
Clenbuterol
Transitions:
Clenbuterol m/z 277.1 → 168
d9-Clenbuterol m/z 286.1 → 204
(Internal Standard)
Sustained high sensitivity performance under repeated exposure
to horse plasma samples. Clenbuterol in crashed horse plasma
injected by dilute and shoot method.
Representative MRM chromatograms of 5 ppt
clenbuterol (150 fg on-column)
20 © Advanced Chromatography Technologies Ltd. www.ace-hplc.com
ACE®
HPLC / UHPLC Columns
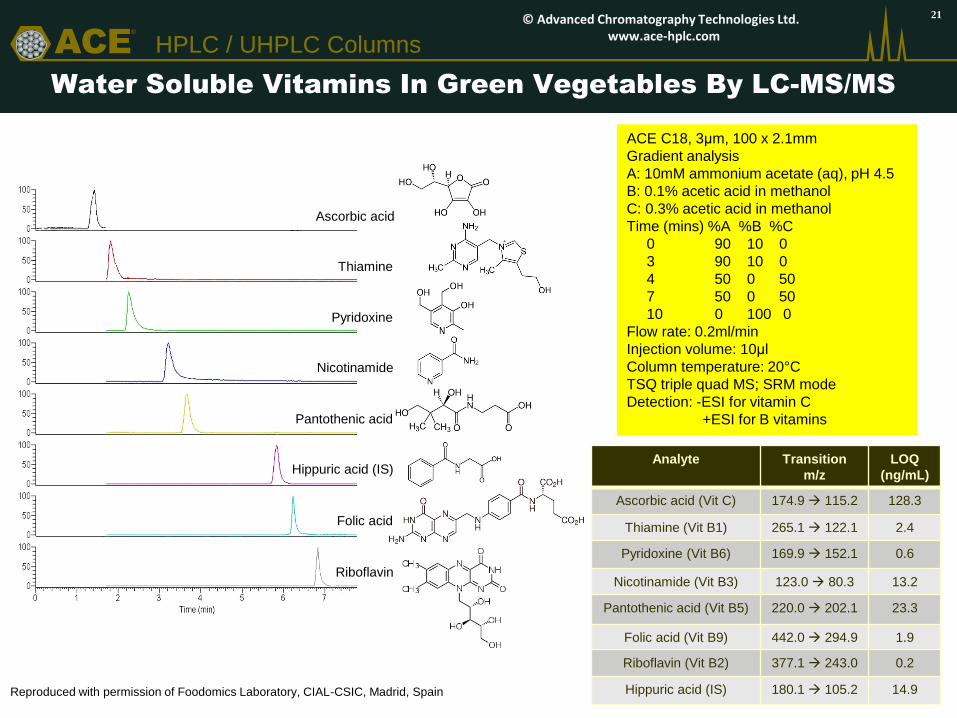
Water Soluble Vitamins In Green Vegetables By LC-MS/MS
ACE C18, 3μm, 100 x 2.1mm
Gradient analysis
A: 10mM ammonium acetate (aq), pH 4.5
B: 0.1% acetic acid in methanol
C: 0.3% acetic acid in methanol
Time (mins) %A %B %C
0 90 10 0
3 90 10 0
4 50 0 50
7 50 0 50
10 0 100 0
Flow rate: 0.2ml/min
Injection volume: 10μl
Column temperature: 20°C
TSQ triple quad MS; SRM mode
Detection: -ESI for vitamin C
+ESI for B vitamins
Reproduced with permission of Foodomics Laboratory, CIAL-CSIC, Madrid, Spain
Analyte Transition
m/z
LOQ
(ng/mL)
Ascorbic acid (Vit C) 174.9 115.2 128.3
Thiamine (Vit B1) 265.1 122.1 2.4
Pyridoxine (Vit B6) 169.9 152.1 0.6
Nicotinamide (Vit B3) 123.0 80.3 13.2
Pantothenic acid (Vit B5) 220.0 202.1 23.3
Folic acid (Vit B9) 442.0 294.9 1.9
Riboflavin (Vit B2) 377.1 243.0 0.2
Hippuric acid (IS) 180.1 105.2 14.9
Ascorbic acid
Thiamine
Pyridoxine
Nicotinamide
Pantothenic acid
Hippuric acid (IS)
Folic acid
Riboflavin
21 © Advanced Chromatography Technologies Ltd. www.ace-hplc.com
ACE®
HPLC / UHPLC Columns
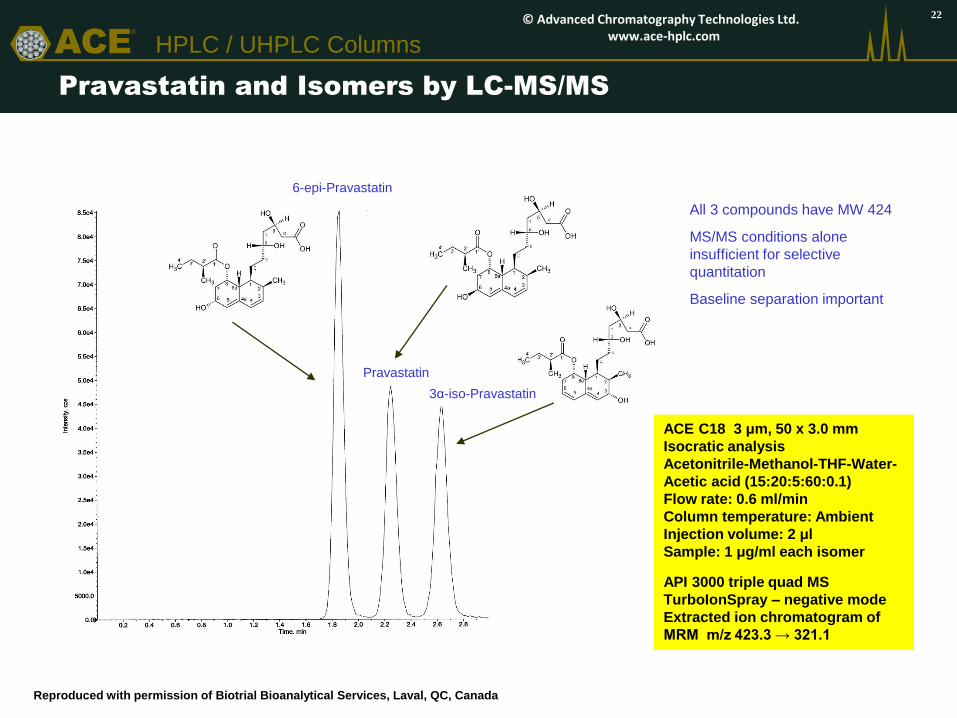
Pravastatin and Isomers by LC-MS/MS
ACE C18 3 μm, 50 x 3.0 mm
Isocratic analysis
Acetonitrile-Methanol-THF-Water-
Acetic acid (15:20:5:60:0.1)
Flow rate: 0.6 ml/min
Column temperature: Ambient
Injection volume: 2 μl
Sample: 1 μg/ml each isomer
API 3000 triple quad MS
TurboIonSpray – negative mode
Extracted ion chromatogram of
MRM m/z 423.3 → 321.1
Reproduced with permission of Biotrial Bioanalytical Services, Laval, QC, Canada
All 3 compounds have MW 424
MS/MS conditions alone
insufficient for selective
quantitation
Baseline separation important
6-epi-Pravastatin
3α-iso-Pravastatin
Pravastatin
© Advanced Chromatography Technologies Ltd. www.ace-hplc.com
22

ACE®
HPLC / UHPLC Columns
Cytarabine Analogues by Ion-Pairing LC-MS/MS
Reproduced with permission of Agilux Laboratories, USA
ACE 3 C18 3μm, 50 x 2.1 mm
Gradient analysis
A = 0.1% perfluoropentanoic acid +
0.1% formic acid in water
B = 0.1% perfluoropentanoic acid
+ 0.1% formic acid in acetonitrile
T (mins) %B
0 0
0.5 0
3.0 13
4.0 90
5.0 0
Flow rate: 0.7 ml/min
API 4000 MS
TurboIonSpray, positive mode
Source temperature: 550°C
Cytarabine and cytidine are
isobaric.
Robust method with good
separation achieved.
LLOQ = 1 ng/ml human plasma
© Advanced Chromatography Technologies Ltd. www.ace-hplc.com
23

ACE®
HPLC / UHPLC Columns
LC-MS/MS of phytoestrogens from hop extracts
Reproduced with permission of Institute of Food Science Research, University of Madrid, Spain
ACE C18-AR, 3μm, 150 x 4.6mm
Gradient analysis
A: 1% formic acid in acetonitrile
B: 1% formic acid in methanol
C: 1% formic acid in water
D: Methanol
Time (mins) %A %B %C %D
0 56 0 44 0
8 51 5 44 0
10 51 5 44 0
17 95 5 0 0
22 95 0 0 5
Flow rate: 0.6ml/min
TSQ-Quantum triple quad ESI
Spray voltage: -4500V
Precursor ion: 355.4 [M+H]+
MRM transition ions: 179 and 299
Collision energy: 28 and 16V
Isoxanthohumol
Xanthohumol
Hop extracts obtained by
pressurised liquid extraction using
ASE 200 system
LOQ isoxanthohumol : 0.07μg/ml
LOQ: xanthohumol: 0.01μg/ml 2 4 6 8 10 12 14 16
Time (min)
0
2e+5
4e+5
6e+5
8e+5
10e+5
12e+5
14e+5
16e+5
18e+5
Inte
nsi
ty
20e+5
22e+5
24e+5
26e+5
28e+5
© Advanced Chromatography Technologies Ltd. www.ace-hplc.com
24

ACE®
HPLC / UHPLC Columns
Ethyl Glucuronide in Water by LC-MS/MS
0.00 0.25 0.50 0.75 1.00 1.25 1.50 1.75 2.00 2.25 min
0.00
0.25
0.50
0.75
1.00
1.25
1.50
1.75
2.00
2.25
2.50
(x100,000)
1:EtG 221.20>113.00(-) CE: 14.01:EtG 221.20>57.00(-) CE: 22.01:EtG 221.20>75.00(-) CE: 15.01:EtG 221.20>84.90(-) CE: 15.0
0.25 0.50 0.75 1.00 1.25 1.50 1.75 2.00 2.25 min
0.00
0.25
0.50
0.75
1.00
1.25
1.50
1.75
2.00
2.25
2.50
(x100,000)
2:EtG-d5 226.10>112.90(-) CE: 14.02:EtG-d5 225.80>57.10(-) CE: 24.02:EtG-d5 226.30>74.90(-) CE: 16.02:EtG-d5 226.30>85.00(-) CE: 16.0
0.0 0.5 1.0 1.5 2.0 2.5 3.0
0.00
0.25
0.50
0.75
1.00
1.25
1.50
1.75
2.00
2.25
(x100)
1:221.20>84.90(-)1:221.20>75.00(-)
0.5 1.0 1.5 2.0 2.5 3.0
0.00
0.25
0.50
0.75
1.00
1.25
1.50
1.75
2.00
2.25
2.50
(x100)
2:226.30>85.00(-)2:226.30>74.90(-)
ACE Excel 2 C18-PFP
2μm, 100 x 2.1 mm
Gradient analysis
A = 0.05% formic acid in water
B = Methanol
T (mins) %B T (mins) %B
4 70 7 95
6 95 7.01 5
Flow rate: 0.4 ml/min
Injection volume: 3 μl
Column temperature: 40°C
Shimadzu LCMS-8050
ESI voltage: -3kV
Desolvation line: 250°C
Interface heater: 380°C
Nebulizing gas: 3 l/min
Heat block: 400°C
Ethyl glucuronide
Ethyl glucuronide (EtG)
Ethyl glucuronide-d5 (EtG-d5)
EtG 100pg/ml
EtG-d5 100pg/ml
m/z 221.2 → 75.0
m/z 221.2 → 84.9
m/z 226.3 → 74.9
m/z 226.3 → 85.0
LOQ for EtG in water
= 300fg on-column
m/z 221.2 → 84.9
m/z 221.2 → 75.0
m/z 221.2 → 57.0
m/z 221.2 → 113.0
m/z 226.3 → 85.0
m/z 226.3 → 74.9
m/z 225.8 → 57.1
m/z 226.1 → 112.9
Reproduced with permission of Shimadzu Europa GmbH. Analysed on Shimadzu Nexera X2.
© Advanced Chromatography Technologies Ltd. www.ace-hplc.com
25

ACE®
HPLC / UHPLC Columns
Arsenolipids from Edible Seaweed by LC-ICP-MS and LC-ESI-MS
0
1000000
2000000
3000000
4000000
5000000
6000000
7000000
8000000
9000000
10000000
-1.E+07
-5.E+06
0.E+00
5.E+06
1.E+07
2.E+07
0 5 10 15 20 25 30 35 40 45 50
rela
tive
in
tensity IC
P-M
S
rela
tive
in
tensity (E
S-M
S)
retention time (min)
389
959
987
1015
As
ACE C18, 3μm 150 x 4.6mm
Gradient analysis
A = 0.1% formic acid in H2O
B = 0.1% formic acid in CH3OH
Time (mins) %B
0 0
20 100
45 100
Flow rate: 1ml/min
Injection volume: 100μl
Split ratio: 75% ESI-MS: 25% ICP-MS
Thermo Scientific Element 2 ICP-MS
Mode: Organic mode
Medium resolution
Thermo Scientific Orbitrap Discovery
Positive ESI mode
Spray voltage: 4.5kV
Capillary temperature: 320°C
Capillary voltage: 42V
Separation of arsenic species from methanolic extract of the edible seaweed Alaria esculenta
ICP-MS
m/z 75
ESI-MS
Reproduced with permission of Dr Andrea Raab, Trace Element Speciation Laboratory, University of Aberdeen, UK
Arsenic-containing hydrocarbon: Arsenic-containing phospholipids:
m/z 389 [M + H]+ for C21H46AsO m/z 959 [M + H]+ for C45H89AsO14P (C16:0/C16:0)
m/z 987 [M + H]+ for C47H93AsO14P (C18:0/C16:0)
m/z 1015 [M + H]+ for C49H97AsO14P (C20:0/C16:0)
© Advanced Chromatography Technologies Ltd. www.ace-hplc.com
26

ACE®
HPLC / UHPLC Columns
Chloramphenicol in Milk by LC-MS/MS
ACE C18 3μm, 50 x 2.1mm
Gradient analysis
A = Water
B = Methanol
T (mins) %B T (mins) %B
0 10 3.0 95
0.05 10 3.1 95
2.5 95 4.5 10
Flow rate: 0.5ml/min
Injection volume: 10μl
Bruker EVOQ Elite triple quad MS
VIP heated-ESI temperature: 400°C
Cone gas temperature: 350°C
Spray voltage: -4500V
Reproduced with permission of Bruker UK Ltd
Chloramphenicol
Transitions:
m/z 320.9 → 152 Quantification
m/z 320.9 → 257 Qualification
m/z 320.9 → 194 Qualification
TIC of 3 MRMs of 0.02 ppb chloramphenicol spiked
in milk matrix
LOQ Chloramphenicol = 0.02 ppb
m/z 320.9 → 152
m/z 320.9 → 257
m/z 320.9 → 194
MRM chromatograms of 0.05 ppb
chloramphenicol in milk
© Advanced Chromatography Technologies Ltd. www.ace-hplc.com
27

ACE®
HPLC / UHPLC Columns
Organophosphorus Flame Retardants in Water by LC-MS/MS
ACE C18 3μm, 100 x 2.1mm
Gradient analysis
A = 0.05mM NH4CO2H + 0.005%
HCO2H in water
B = CH3OH/CH3CN (95:5)
Time (mins) %B Curve
0.1 50 -3
12.0 90
13.0 100
15.0 100
15.1 50
20.0 50
Flow rate: 0.25ml/min
Column temperature: 25°C
Sample volume: 80μl
Detection: MS/MS
Reproduced with permission of Ontario Ministry of the Environment and Climate Change, Canada
Symbol Compound Name Q1 Mass Q3 Mass
TMP tri-methyl phosphate 141 109
TEP tri-ethyl phosphate 183 127
TiPP tri-iso-propyl phosphate 225 99
TPrP tri-n-propyl phosphate 225 99
TBP tri-n-butyl phosphate 267 211
TCEP tris(2-chloroethyl) phosphate 285 223
TCPP tris((2R)-1-chloro-2-propyl)
phosphate 327 99
TDCPP tris(1,3-dichloro-2-propyl) phosphate 431 99
BDCP bis(1,3-dichloro-2-propyl) phosphate 321 99
TPP triphenyl phosphate 327 215
TBEP tris(2-butoxyethyl) phosphate 399 299
BEHP bis(2-ethylhexyl) phosphate 323 99
© Advanced Chromatography Technologies Ltd. www.ace-hplc.com
28

ACE®
HPLC / UHPLC Columns
ACE UltraCore SuperC18: Impurity Profile of a Herbicide
ACE UltraCore SuperC18, 2.5μm, 150 x 4.6mm
Gradient analysis
A = CH3CN – H2O – TFA (5:95:0.05 v/v/v)
B = CH3CN – TFA (99.9:0.05 v/v/v)
Time (mins) %B Time (mins) %B
0 10 55 100
3 10 56 10
35 100 60 10
Flow rate: 0.60ml/min
Column temperature: 25°C
Injection volume: 10μl
Detection: UV, 240nm
Sample: Technical Grade Herbicide
Active
component
© Advanced Chromatography Technologies Ltd. www.ace-hplc.com
29