AMN Healthcare FCP Deck PDF
21
AMN Healthcare (AHS) Fall Conference Pitch Lucas Oliveira September 30, 2016
-
Upload
lucas-oliveira -
Category
Documents
-
view
47 -
download
3
Transcript of AMN Healthcare FCP Deck PDF
AMN Healthcare (AHS)Fall Conference Pitch
Lucas OliveiraSeptember 30, 2016
Table of Contents
I) Company Overview
II) Investment Thesis
III) Valuation
IV) Risks and Catalysts
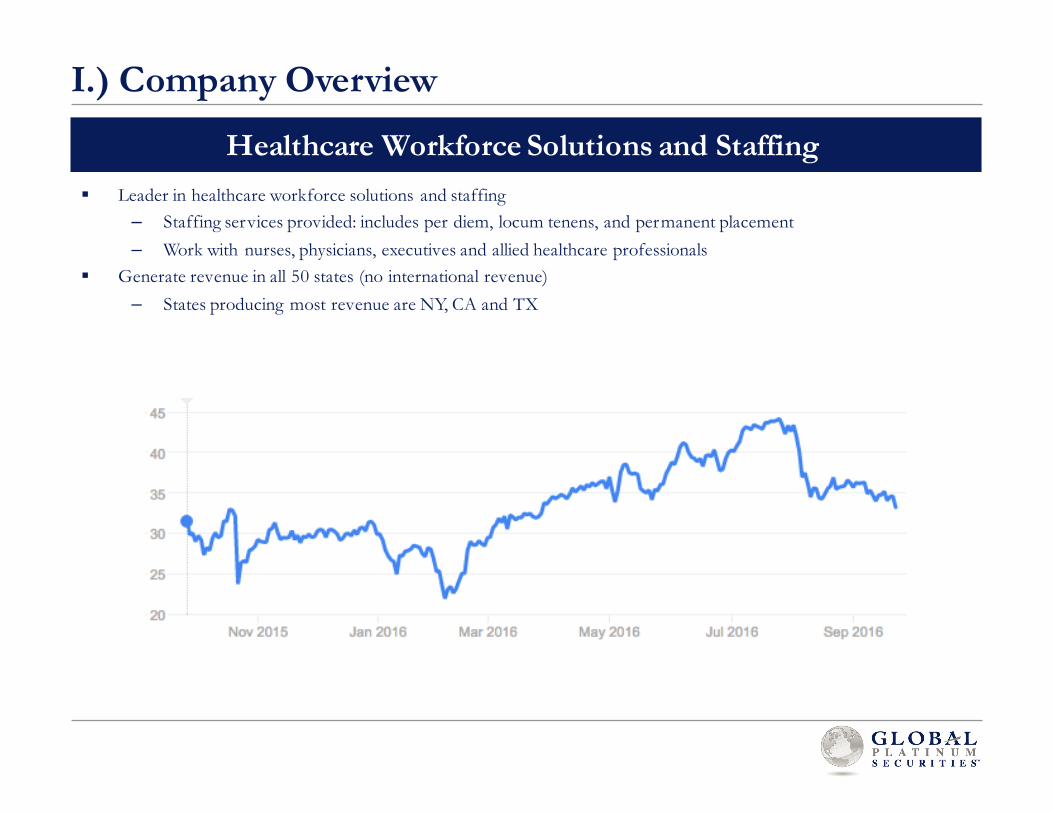
§ Leader in healthcare workforce solutions and staffing– Staffing services provided: includes per diem, locum tenens, and permanent placement– Work with nurses, physicians, executives and allied healthcare professionals
§ Generate revenue in all 50 states (no international revenue)– States producing most revenue are NY, CA and TX
I.) Company Overview
Healthcare Workforce Solutions and Staffing
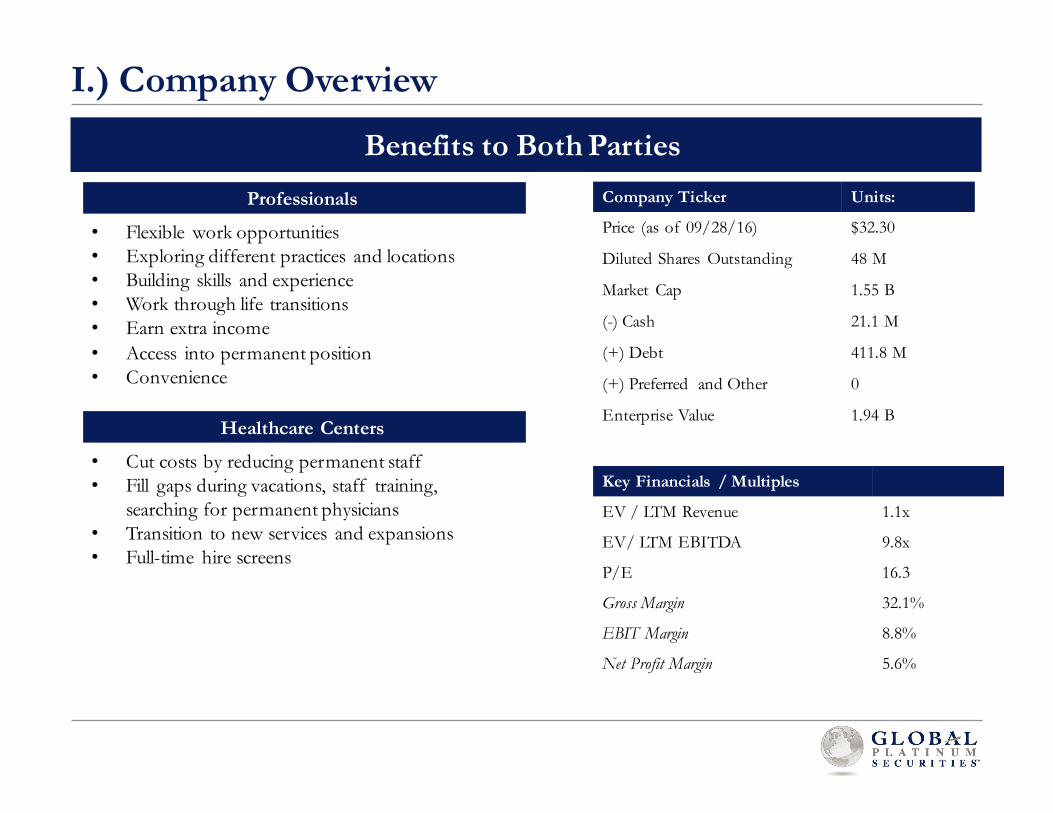
Benefits to Both PartiesCompany Ticker Units:
Price (as of 09/28/16) $32.30
Diluted Shares Outstanding 48 M
Market Cap 1.55 B
(-) Cash 21.1 M
(+) Debt 411.8 M
(+) Preferred and Other 0
Enterprise Value 1.94 B
I.) Company Overview
Key Financials / Multiples
EV / LTM Revenue 1.1x
EV/ LTM EBITDA 9.8x
P/E 16.3
Gross Margin 32.1%
EBIT Margin 8.8%
Net Profit Margin 5.6%
Professionals
• Flexible work opportunities• Exploring different practices and locations• Building skills and experience• Work through life transitions• Earn extra income• Access into permanent position• Convenience
Healthcare Centers
• Cut costs by reducing permanent staff• Fill gaps during vacations, staff training,
searching for permanent physicians• Transition to new services and expansions• Full-time hire screens
Table of Contents
I) Company and Industry Overview
II) Investment Thesis
III) Valuation
IV) Risks and Catalysts
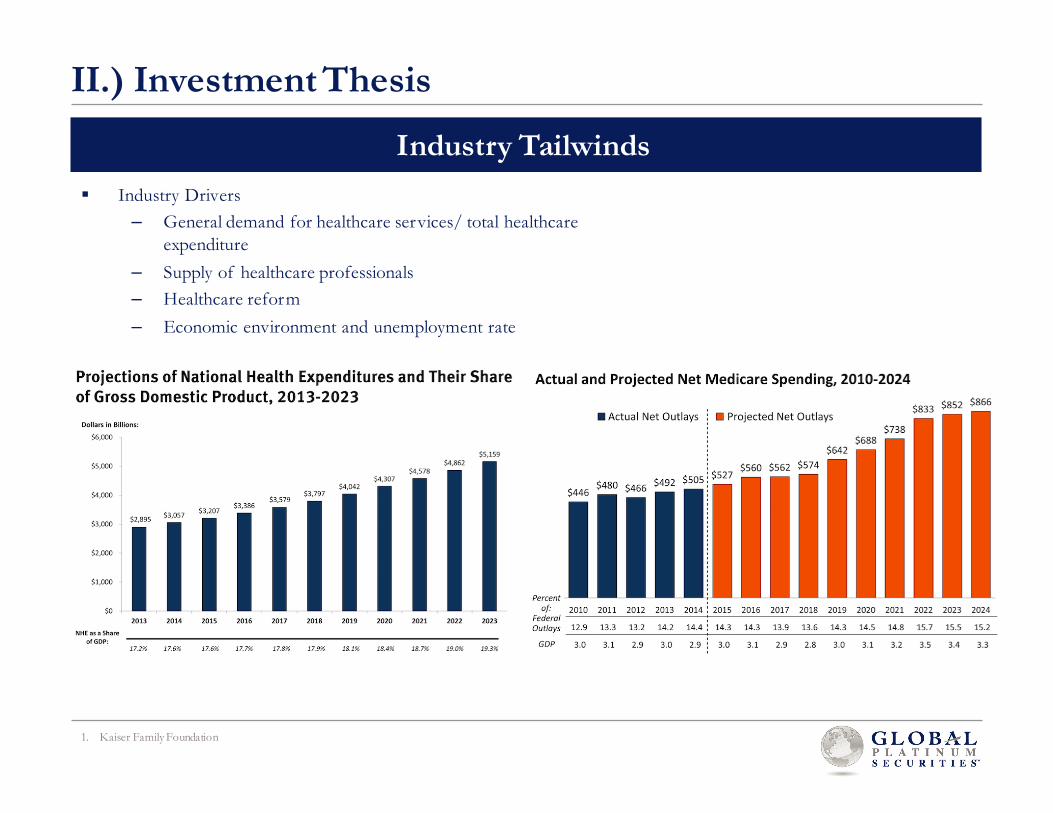
§ Industry Drivers– General demand for healthcare services/ total healthcare
expenditure– Supply of healthcare professionals– Healthcare reform– Economic environment and unemployment rate
1. Kaiser Family Foundation
II.) Investment Thesis
Industry Tailwinds
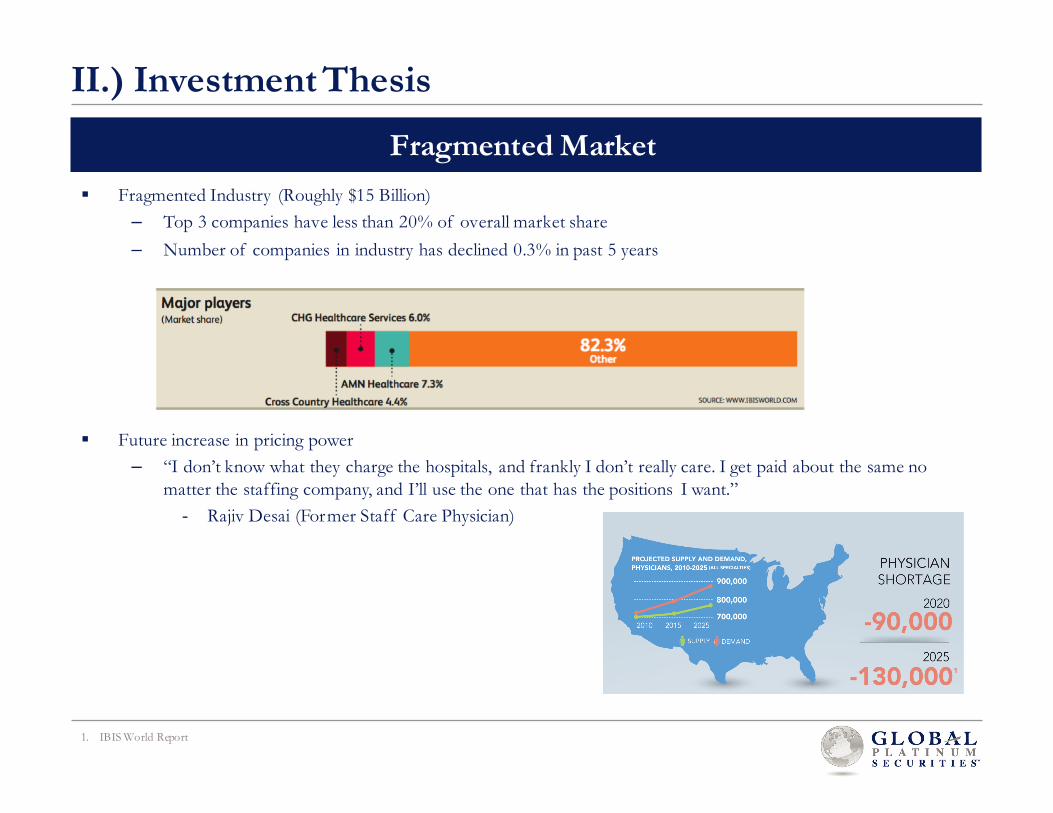
§ Fragmented Industry (Roughly $15 Billion)– Top 3 companies have less than 20% of overall market share– Number of companies in industry has declined 0.3% in past 5 years
§ Future increase in pricing power– “I don’t know what they charge the hospitals, and frankly I don’t really care. I get paid about the same no
matter the staffing company, and I’ll use the one that has the positions I want.”- Rajiv Desai (Former Staff Care Physician)
1. IBIS World Report
II.) Investment Thesis
Fragmented Market
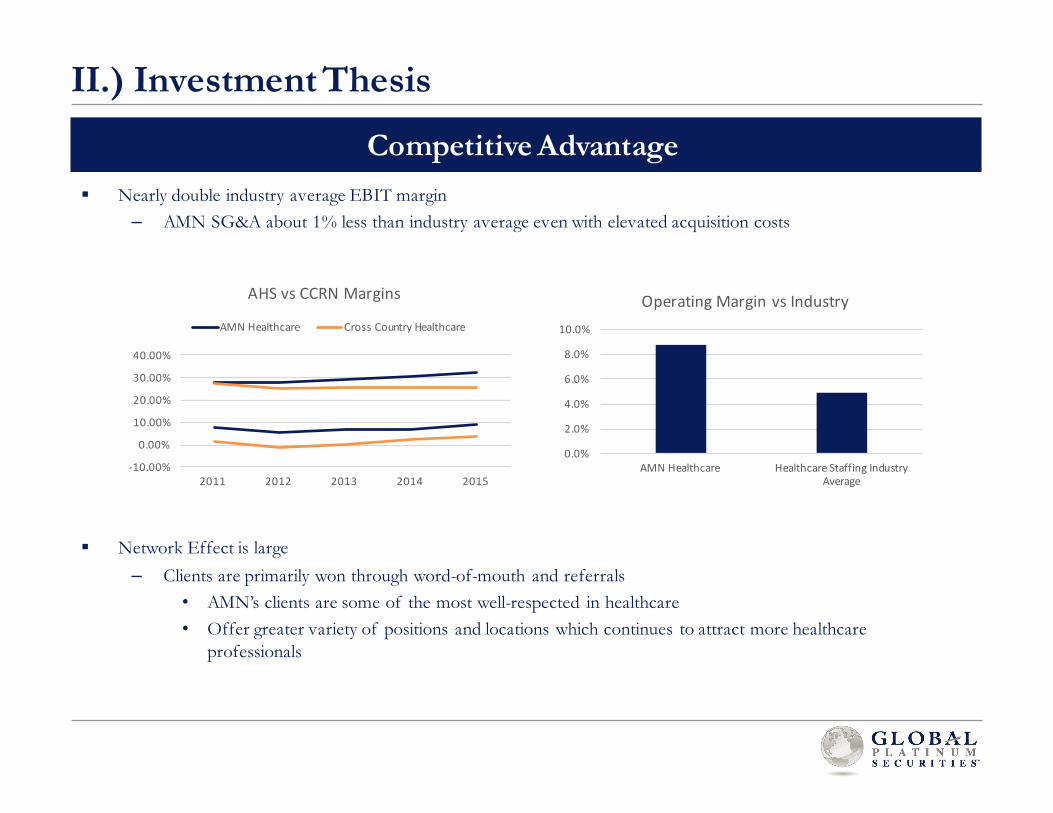
§ Nearly double industry average EBIT margin– AMN SG&A about 1% less than industry average even with elevated acquisition costs
§ Network Effect is large– Clients are primarily won through word-of-mouth and referrals
• AMN’s clients are some of the most well-respected in healthcare• Offer greater variety of positions and locations which continues to attract more healthcare
professionals
II.) Investment Thesis
Competitive Advantage
0.0%
2.0%
4.0%
6.0%
8.0%
10.0%
AMNHealthcare HealthcareStaffingIndustryAverage
OperatingMarginvsIndustry
-10.00%
0.00%
10.00%
20.00%
30.00%
40.00%
2011 2012 2013 2014 2015
AHSvsCCRNMargins
AMNHealthcare CrossCountryHealthcare
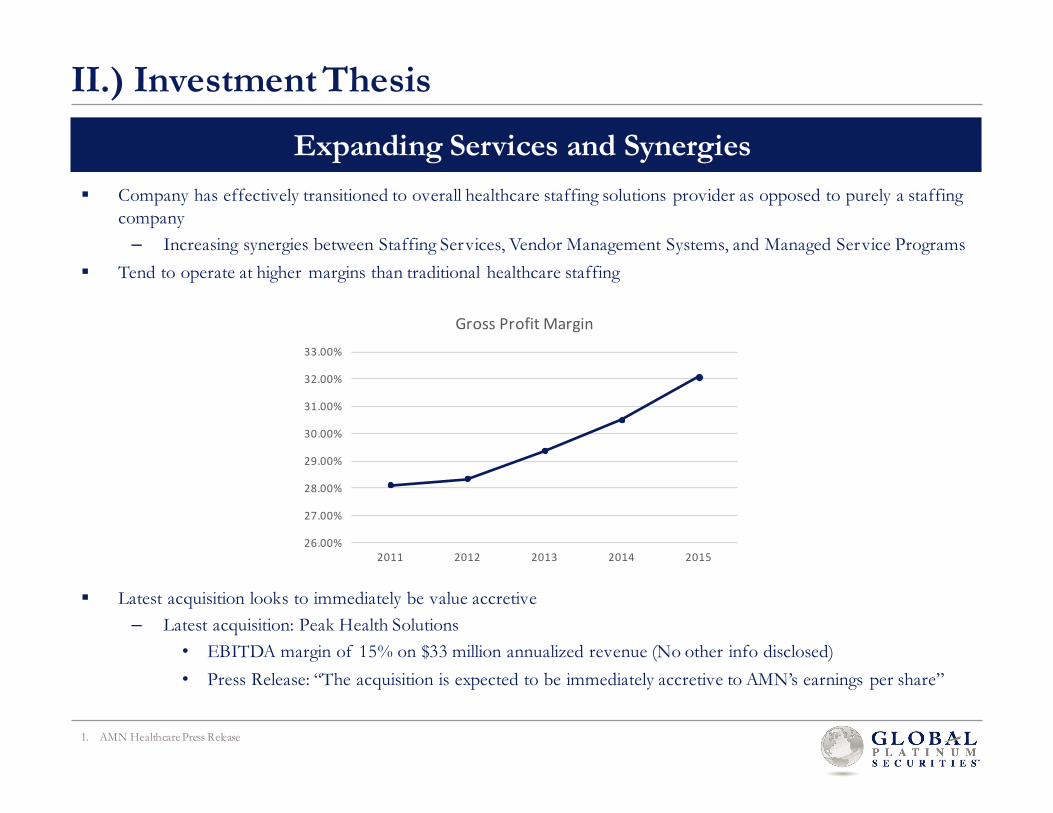
§ Company has effectively transitioned to overall healthcare staffing solutions provider as opposed to purely a staffing company– Increasing synergies between Staffing Services, Vendor Management Systems, and Managed Service Programs
§ Tend to operate at higher margins than traditional healthcare staffing
§ Latest acquisition looks to immediately be value accretive– Latest acquisition: Peak Health Solutions
• EBITDA margin of 15% on $33 million annualized revenue (No other info disclosed)• Press Release: “The acquisition is expected to be immediately accretive to AMN’s earnings per share”
1. AMN Healthcare Press Release
II.) Investment Thesis
Expanding Services and Synergies
26.00%
27.00%
28.00%
29.00%
30.00%
31.00%
32.00%
33.00%
2011 2012 2013 2014 2015
GrossProfitMargin
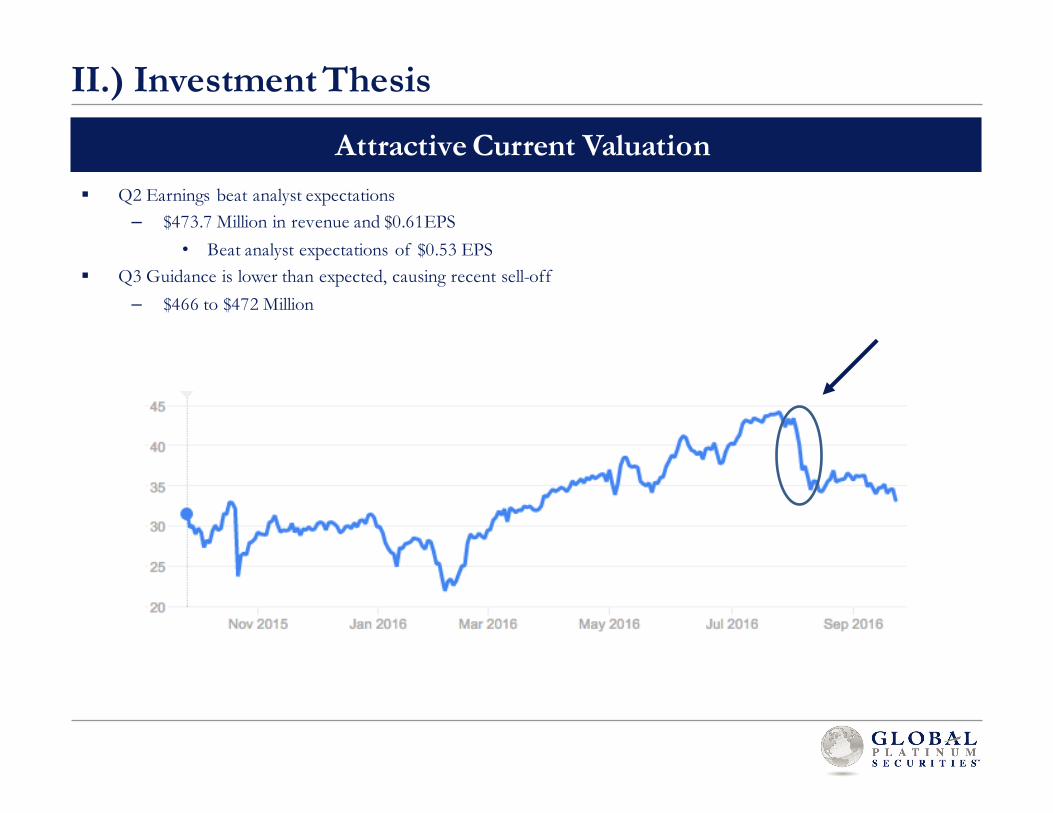
§ Q2 Earnings beat analyst expectations – $473.7 Million in revenue and $0.61EPS
• Beat analyst expectations of $0.53 EPS§ Q3 Guidance is lower than expected, causing recent sell-off
– $466 to $472 Million
II.) Investment Thesis
Attractive Current Valuation
Table of Contents
I) Company and Industry Overview
II) Investment Thesis
III) Valuation
IV) Risks and Catalysts
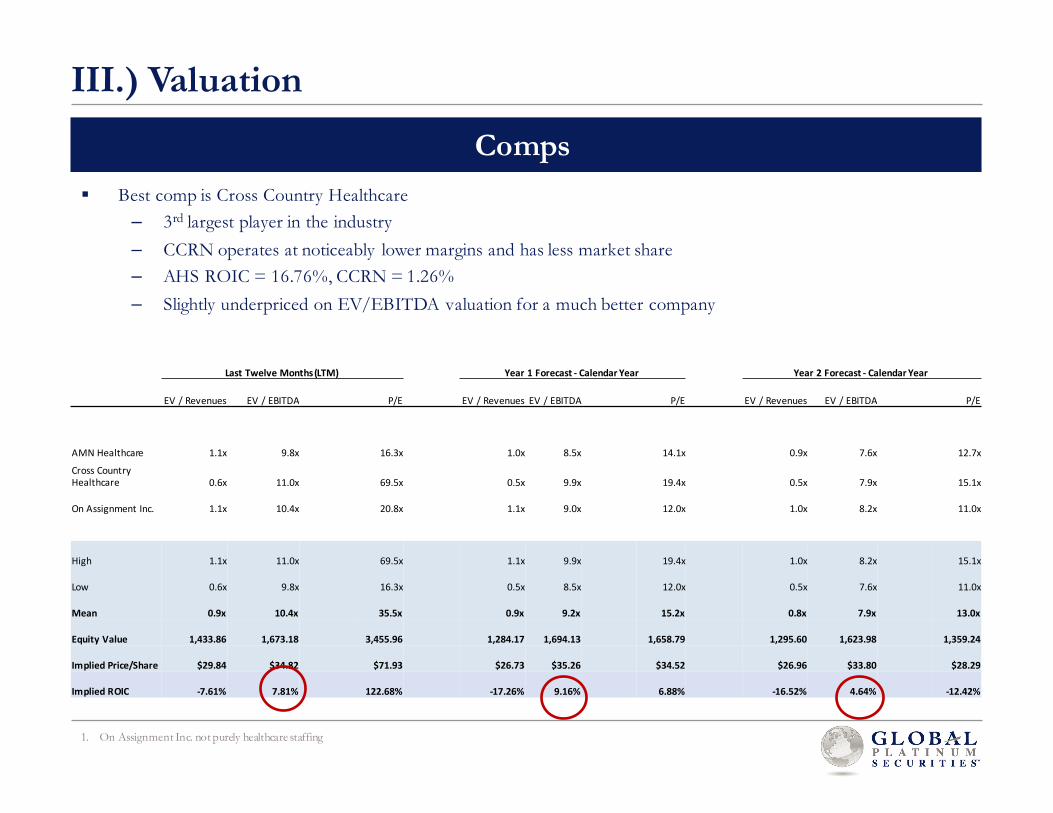
§ Best comp is Cross Country Healthcare– 3rd largest player in the industry– CCRN operates at noticeably lower margins and has less market share– AHS ROIC = 16.76%, CCRN = 1.26%– Slightly underpriced on EV/EBITDA valuation for a much better company
1. On Assignment Inc. not purely healthcare staffing
III.) Valuation
Comps
LastTwelveMonths(LTM) Year1Forecast- CalendarYear Year2Forecast- CalendarYear
EV/Revenues EV/EBITDA P/E EV/Revenues EV/EBITDA P/E EV/Revenues EV/EBITDA P/E
AMNHealthcare 1.1x 9.8x 16.3x 1.0x 8.5x 14.1x 0.9x 7.6x 12.7x
CrossCountryHealthcare 0.6x 11.0x 69.5x 0.5x 9.9x 19.4x 0.5x 7.9x 15.1x
OnAssignmentInc. 1.1x 10.4x 20.8x 1.1x 9.0x 12.0x 1.0x 8.2x 11.0x
High 1.1x 11.0x 69.5x 1.1x 9.9x 19.4x 1.0x 8.2x 15.1x
Low 0.6x 9.8x 16.3x 0.5x 8.5x 12.0x 0.5x 7.6x 11.0x
Mean 0.9x 10.4x 35.5x 0.9x 9.2x 15.2x 0.8x 7.9x 13.0x
EquityValue 1,433.86 1,673.18 3,455.96 1,284.17 1,694.13 1,658.79 1,295.60 1,623.98 1,359.24
ImpliedPrice/Share $29.84 $34.82 $71.93 $26.73 $35.26 $34.52 $26.96 $33.80 $28.29
ImpliedROIC -7.61% 7.81% 122.68% -17.26% 9.16% 6.88% -16.52% 4.64% -12.42%
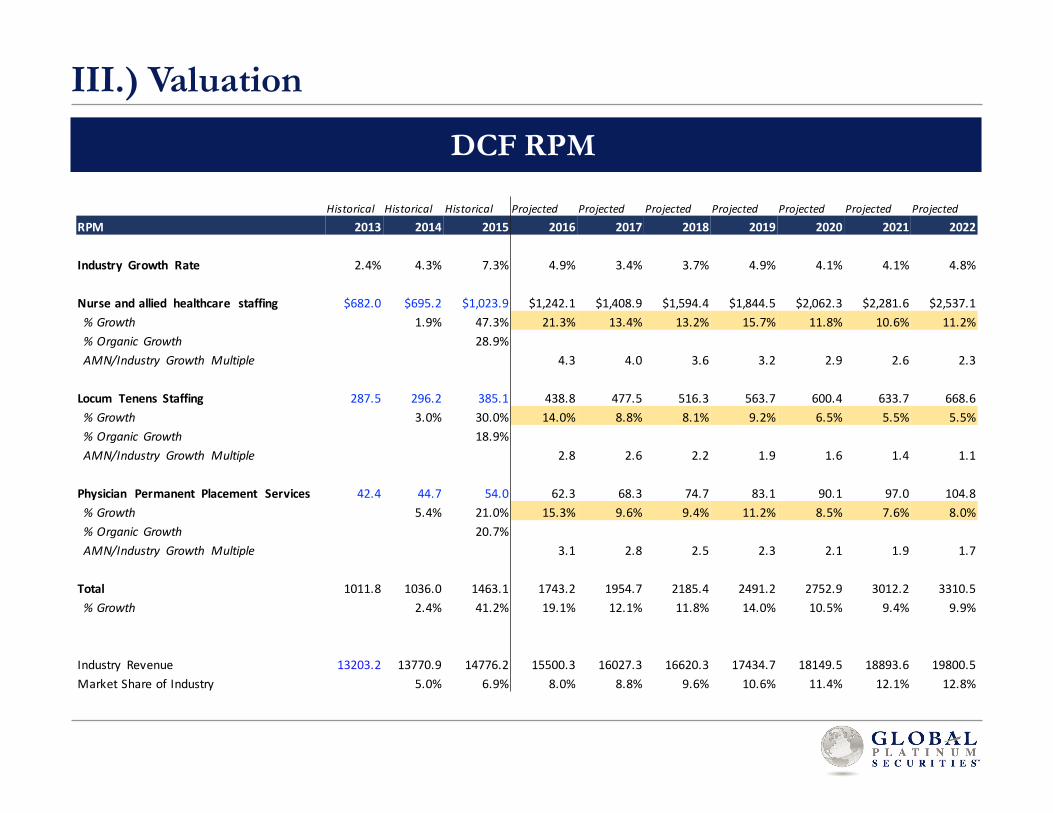
III.) Valuation
DCF RPM
Historical Historical Historical Projected Projected Projected Projected Projected Projected ProjectedRPM 2013 2014 2015 2016 2017 2018 2019 2020 2021 2022
Industry Growth Rate 2.4% 4.3% 7.3% 4.9% 3.4% 3.7% 4.9% 4.1% 4.1% 4.8%
Nurseandallied healthcare staffing $682.0 $695.2 $1,023.9 $1,242.1 $1,408.9 $1,594.4 $1,844.5 $2,062.3 $2,281.6 $2,537.1%Growth 1.9% 47.3% 21.3% 13.4% 13.2% 15.7% 11.8% 10.6% 11.2%%Organic Growth 28.9%AMN/Industry Growth Multiple 4.3 4.0 3.6 3.2 2.9 2.6 2.3
Locum Tenens Staffing 287.5 296.2 385.1 438.8 477.5 516.3 563.7 600.4 633.7 668.6%Growth 3.0% 30.0% 14.0% 8.8% 8.1% 9.2% 6.5% 5.5% 5.5%%Organic Growth 18.9%AMN/Industry Growth Multiple 2.8 2.6 2.2 1.9 1.6 1.4 1.1
Physician Permanent Placement Services 42.4 44.7 54.0 62.3 68.3 74.7 83.1 90.1 97.0 104.8%Growth 5.4% 21.0% 15.3% 9.6% 9.4% 11.2% 8.5% 7.6% 8.0%%Organic Growth 20.7%AMN/Industry Growth Multiple 3.1 2.8 2.5 2.3 2.1 1.9 1.7
Total 1011.8 1036.0 1463.1 1743.2 1954.7 2185.4 2491.2 2752.9 3012.2 3310.5%Growth 2.4% 41.2% 19.1% 12.1% 11.8% 14.0% 10.5% 9.4% 9.9%
Industry Revenue 13203.2 13770.9 14776.2 15500.3 16027.3 16620.3 17434.7 18149.5 18893.6 19800.5MarketShareofIndustry 5.0% 6.9% 8.0% 8.8% 9.6% 10.6% 11.4% 12.1% 12.8%
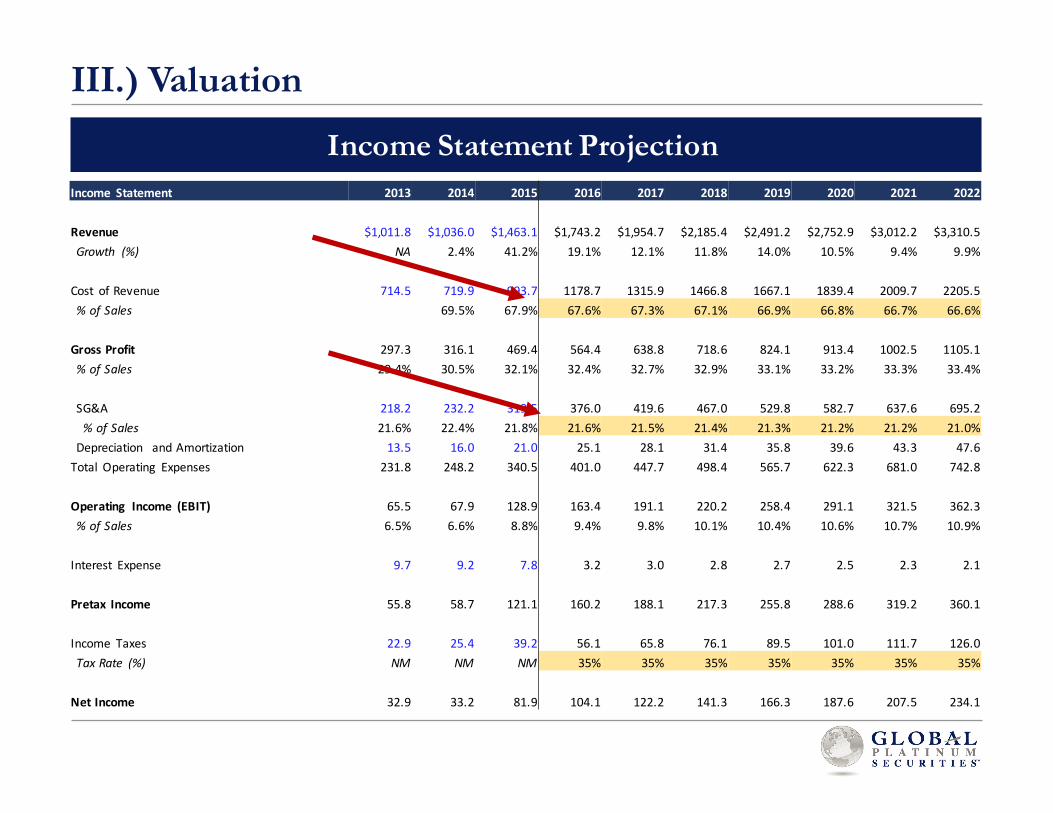
III.) Valuation
Income Statement ProjectionIncome Statement 2013 2014 2015 2016 2017 2018 2019 2020 2021 2022
Revenue $1,011.8 $1,036.0 $1,463.1 $1,743.2 $1,954.7 $2,185.4 $2,491.2 $2,752.9 $3,012.2 $3,310.5Growth (%) NA 2.4% 41.2% 19.1% 12.1% 11.8% 14.0% 10.5% 9.4% 9.9%
Cost ofRevenue 714.5 719.9 993.7 1178.7 1315.9 1466.8 1667.1 1839.4 2009.7 2205.5%ofSales 69.5% 67.9% 67.6% 67.3% 67.1% 66.9% 66.8% 66.7% 66.6%
GrossProfit 297.3 316.1 469.4 564.4 638.8 718.6 824.1 913.4 1002.5 1105.1%ofSales 29.4% 30.5% 32.1% 32.4% 32.7% 32.9% 33.1% 33.2% 33.3% 33.4%
SG&A 218.2 232.2 319.5 376.0 419.6 467.0 529.8 582.7 637.6 695.2%ofSales 21.6% 22.4% 21.8% 21.6% 21.5% 21.4% 21.3% 21.2% 21.2% 21.0%Depreciation andAmortization 13.5 16.0 21.0 25.1 28.1 31.4 35.8 39.6 43.3 47.6Total Operating Expenses 231.8 248.2 340.5 401.0 447.7 498.4 565.7 622.3 681.0 742.8
Operating Income (EBIT) 65.5 67.9 128.9 163.4 191.1 220.2 258.4 291.1 321.5 362.3%ofSales 6.5% 6.6% 8.8% 9.4% 9.8% 10.1% 10.4% 10.6% 10.7% 10.9%
Interest Expense 9.7 9.2 7.8 3.2 3.0 2.8 2.7 2.5 2.3 2.1
PretaxIncome 55.8 58.7 121.1 160.2 188.1 217.3 255.8 288.6 319.2 360.1
Income Taxes 22.9 25.4 39.2 56.1 65.8 76.1 89.5 101.0 111.7 126.0TaxRate (%) NM NM NM 35% 35% 35% 35% 35% 35% 35%
NetIncome 32.9 33.2 81.9 104.1 122.2 141.3 166.3 187.6 207.5 234.1
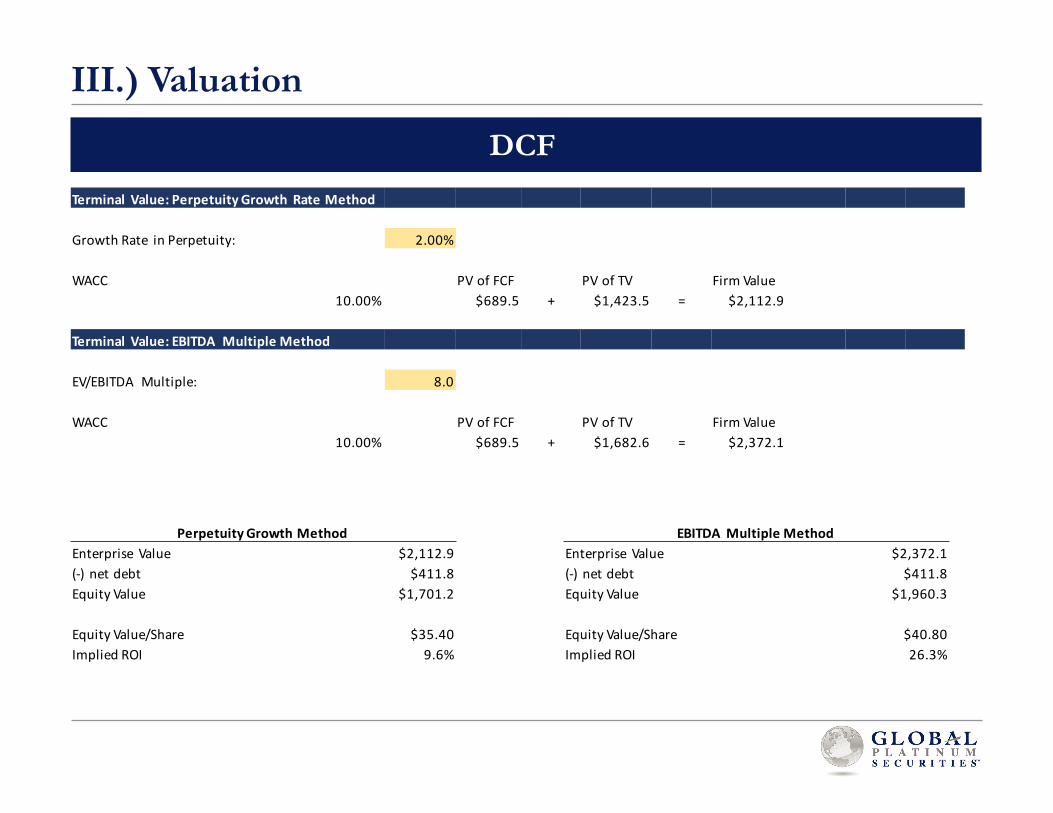
III.) Valuation
DCFTerminal Value:PerpetuityGrowthRateMethod
GrowthRate inPerpetuity: 2.00%
WACC PVofFCF PVofTV FirmValue10.00% $689.5 + $1,423.5 = $2,112.9
Terminal Value:EBITDA MultipleMethod
EV/EBITDA Multiple: 8.0
WACC PVofFCF PVofTV FirmValue10.00% $689.5 + $1,682.6 = $2,372.1
PerpetuityGrowthMethodEnterprise Value $2,112.9(-) netdebt $411.8EquityValue $1,701.2
EquityValue/Share $35.40ImpliedROI 9.6%
EBITDAMultipleMethodEnterprise Value $2,372.1(-) netdebt $411.8EquityValue $1,960.3
EquityValue/Share $40.80ImpliedROI 26.3%
Table of Contents
I) Company and Industry Overview
II) Investment Thesis
III) Valuation
IV) Risks and Catalysts
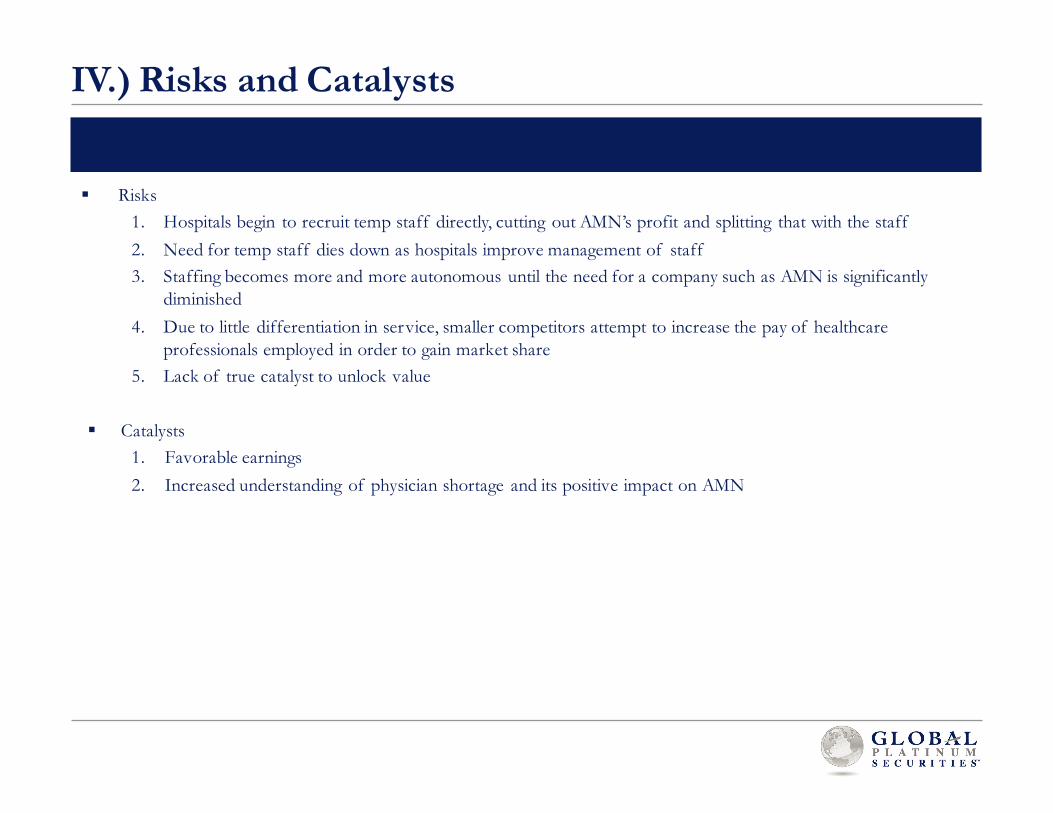
§ Risks1. Hospitals begin to recruit temp staff directly, cutting out AMN’s profit and splitting that with the staff2. Need for temp staff dies down as hospitals improve management of staff3. Staffing becomes more and more autonomous until the need for a company such as AMN is significantly
diminished 4. Due to little differentiation in service, smaller competitors attempt to increase the pay of healthcare
professionals employed in order to gain market share5. Lack of true catalyst to unlock value
§ Catalysts1. Favorable earnings2. Increased understanding of physician shortage and its positive impact on AMN
IV.) Risks and Catalysts
Questions?
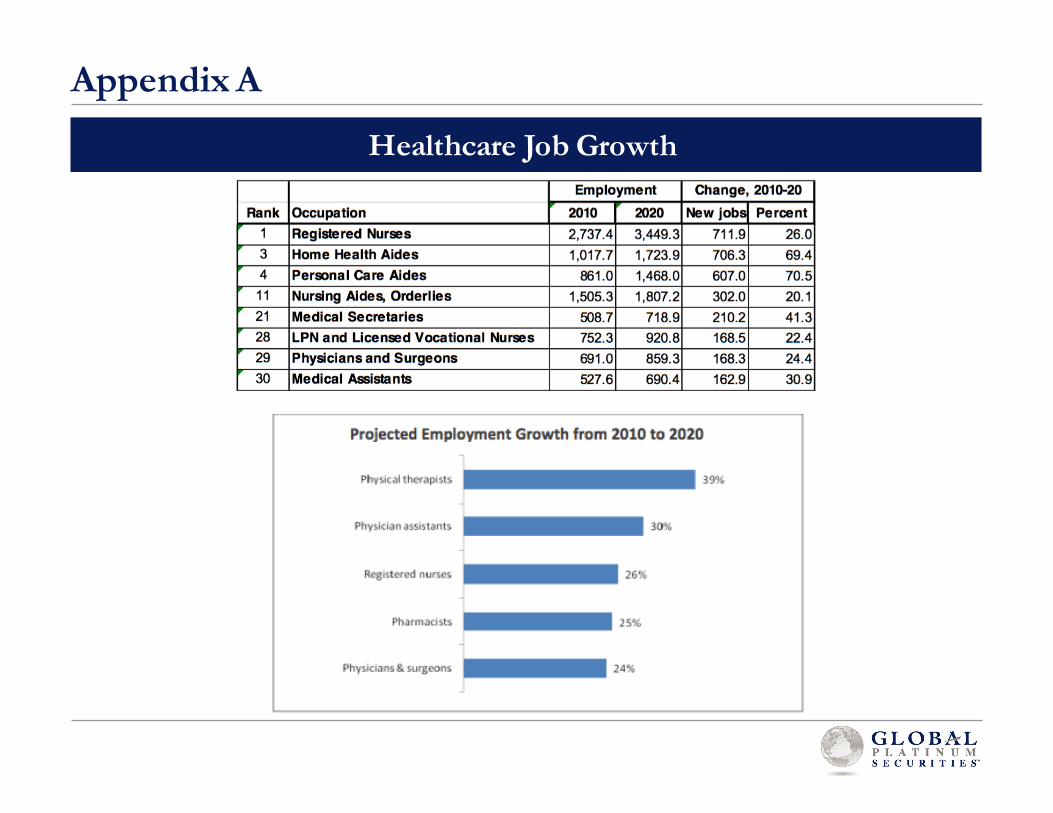
Appendix A
Healthcare Job Growth

Appendix B
Client List
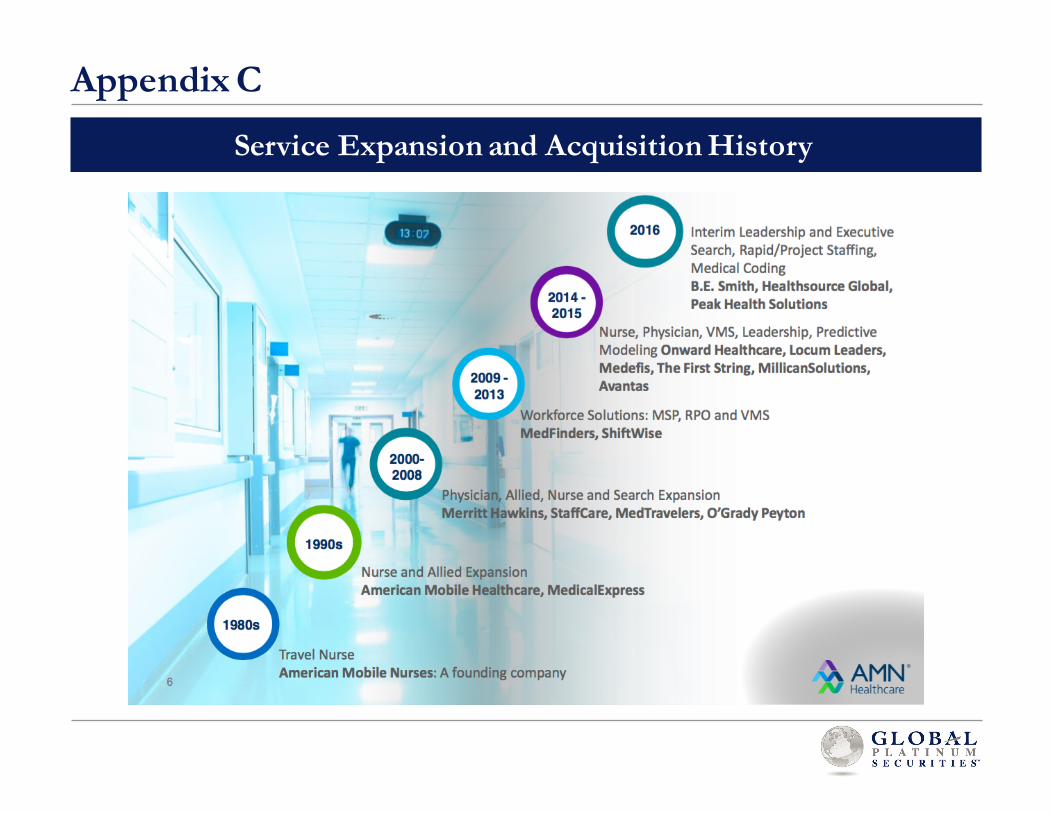
Appendix C
Service Expansion and Acquisition History