AMMONIUM, NITRATE AND PHOSPHATE - Cornell University
54
AMMONIUM, NITRATE AND PHOSPHATE SORPTION TO WATER-RINSED AND NON-RINSED BIOCHARS A Thesis Presented to the Faculty of the Graduate School of Cornell University In Partial Fulfillment of the requirements for the Degree of Master of Science By Charles Colin Hollister August 2011
Transcript of AMMONIUM, NITRATE AND PHOSPHATE - Cornell University
AMMONIUM, NITRATE AND PHOSPHATE SORPTION TO WATER-RINSED AND NON-RINSED BIOCHARS
A Thesis
Presented to the Faculty of the Graduate School of
Cornell University
In Partial Fulfillment of the requirements for the Degree of
Master of Science
By
Charles Colin Hollister
August 2011

© 2011 Charles Colin Hollister
ABSTRACT
Water-rinsed and non-rinsed biochar (BC) was evaluated for nitrogen (N)
and phosphorus (P) removal from aqueous solution in order to quantify its
nutrient pollution mitigation potential in agroecosystems. Sorption isotherms
were prepared for nutrient solutions of ammonium (NH4), nitrate (NO3) and
phosphate (PO4) using BC of corn and oak feedstock, each pyrolyzed at 350º and
550º C highest treatment temperature (HTT). NH4 sorption was observed for
rinsed Corn-BC and rinsed Oak-BC and a 200º C increase in HTT decreased NH4
sorption for both feedstocks. Nitrate sorption was not observed in any of the
rinsed or non-rinsed chars, which indicates a lack of anion exchange capacity
(AEC) for nitrate removal. More P sorption was observed using non-rinsed Oak-
BC relative to rinsed Oak-BC and no phosphate sorption was observed using
rinsed or non-rinsed Corn-BC. A reduction of phosphate removal efficiency for
the rinsed Oak-BC coincided with a loss of calcium (Ca) due to leaching during
the pretreatment. Water leachable Ca increased with HTT for all BC, which
suggests Ca mineral thermal transformation to a more soluble form. Low HTT
BC leached more magnesium (Mg) and P and Corn-BC leached more Mg and P
than Oak-BC. The transition to a micropore dominated surface area with
increasing HTT could restrict nutrient leaching compared to lower HTT where
mesopore surface area is abundant.

iii
BIOGRAPHICAL SKETCH
Colin Hollister was born in Pittsfield, Massachusetts August 5th, 1984. He
attended Berkshire Country Day School (Stockbridge, MA) through the ninth
grade and graduated in 1999. He continued onto Avon Old Farms School (Avon,
CT) where he was inducted to the Cum Laude Society and graduated in 2002.
Colin entered Bates College (Lewiston, ME) and pursued a Bachelor of Science in
Environmental Studies, concentrating in Ecology and minoring in French. In
2004 he was awarded an Otis Fellowhip to thru-hike the Appalachian Trail in
order to study, photograph and become a part of thru-hiker culture. In 2005 he
spent five months in Niger as part of a French study abroad program, where he
received a service-learning grant from Bates to organize local youth who painted
a large mural to raise awareness of important health issues. His independent
thesis research, “Surface soil heavy metal concentrations and cation
exchangeability across a modeled atmospheric deposition gradient in Acadia
National Park, ME,” introduced him to sorption chemistry and mechanisms of
pollutant transport. After graduating from Bates in 2006 he relocated to Munich,
Germany where he became a Math Support Teacher, Environmental Coordinator
and Alpine Ski Coach for the Munich International School. In 2009 he moved
back to the United States and enrolled in the Environmental Processes program
in Civil and Environmental Engineering at Cornell University (Ithaca, NY) where
he pursued a Master of Science degree.

iv
This research is dedicated to sustainable engineering

v
ACKNOWLDGEMENTS
I would like to thank Jim Bisogni for his insightful guidance and
unwavering support as we endeavored on a path of novel research. My study
would not have been possible without the collaboration and cooperation of
Johannes Lehmann of the Crop and Soil Sciences department and his willingness
to provide the biochars used in the experiments. Akio Enders and Kelly Hanley
of the Lehmann research group have been invaluable sources of help and
information around the lab. Special thanks to Jim Gossett for allowing me to use
the ion chromatograph and to Larry Geohring for allowing Shree Giri to assist
me in analyzing samples in the Biological and Environmental Engineering
department Soil and Water Lab.

vi
TABLE OF CONTENTS
Biographical Sketch……………………………………………………………. iii Dedication………………………………………………………………………. iv Acknowledgements……………………………………………………………. v Table of Contents………………………………………………………………. vi List of Figures…………………………………………………………………... vii List of Tables……………………………………………………………………. viii List of Abbreviations…………………………………………………………... ix
Introduction…………………………………………………………………........ 1 Materials and Methods…………………………………………………………. 3
Background…………………………………………………………………. 3 Preparation of the biochars……………………………………………….. 4 Rinse procedure and water leachable nutrients………………………… 4 Sorption experiments……………………………………………………… 7
Results…………………………………………………………………………….. 10 Water leachable nutrients…………………………………………………. 10 Ammonium sorption results……………………………………………… 15 Nitrate sorption results……………………………………………………. 17 Phosphate sorption results………………………………………………... 18
Discussion and Conclusion……………………………………………………. 20 Leachability of nutrients…………………………………………………... 20 Sorption experiments……………………………………………………… 24
Appendix…………………………………………………………………………. 28 References………………………………………………………………………… 40

vii
LIST OF FIGURES
1. Desorption isotherms showing the molar P or Mg contents of Corn-BC and Oak-BC versus the equilibrium concentrations of P or Mg in rinse solutions…………………………………………………………. 13
2. A plot of Ca concentration in the rinse solutions versus Ca content in the char for Corn and Oak-BC……………………………………….. 15
3. A linearized Freundlich isotherm for ammonium adsorption to rinsed chars……………………………………………………………….. 16
4. Phosphate sorption isotherms for rinsed and non-rinsed Corn-BC and Oak-BC………………………………………………………………. 19

viii
LIST OF TABLES
1. Physical and chemical properties of corn and oak biochars………… 4 2. Data gathered from the rinse of each BC. Elemental concentrations
and ratios throughout the rinse series were based on the initial mean concentrations of each element, for each BC…………………… 11
3. Regression line data for P and Mg desorption isotherms for the Corn-BC and Oak-BC rinse series……………………………………… 14
4. Freundlich model terms for ammonium adsorption to rinsed BC….. 17 5. Results of two-tailed t-tests comparing Ce to C0 for nitrate sorption
experiments, calculated at the 5% level………………………………... 17 6. Linear regression results for phosphate sorption isotherms………… 20

ix
LIST OF ABBREVIATIONS
Å angstrom, one hundred-millionth of a centimeter or 10-10 meter AEC anion exchange capacity AFO animal feeding operation
BC biochar Ca calcium
CAFO concentrated animal feeding operation Ce equilibrium concentration
CEC cation exchange capacity C0 initial concentration
CO2 carbon dioxide Corn-350-BC biochar made from corn stover pyrolyzed at 350º C Corn-550-BC biochar made from corn stover pyrolyzed at 550º C
DI deionized water EPA United States Environmental Protection Agency FTIR Fourier transform infrared spectroscopy
g gram HCl hydrochloric acid HTT pyrolysis highest treatment temperature
IC ion chromatograph ICP inductively coupled plasma spectrometer
L liter m meter
m- milli-, one thousandth or 10-3 Mg magnesium mol mole
N nitrogen N2 nitrogen gas
NaOH sodium hydroxide NH4 ammonium
NMP nutrient management plan NO3 nitrate
NPDES national pollution discharge elimination system º C degrees Celcius
Oak-350-BC biochar made from oak wood pyrolyzed at 350º C Oak-550-BC biochar made from oak wood pyrolyzed at 550º C
P phosphorus PO4 phosphate rpm rotations per minute
SPF-BC biochar made from a mixture of spruce, pine and fir wood XRD X-ray diffraction
µ- micro-, one millionth or 10-6

1
Introduction
In recent decades, scientists have observed increases in aquatic primary
production alongside N and P over enrichment [1, 2]. This enrichment can cause
eutrophication, which diminishes biodiversity and disrupts food webs by
altering physical and chemical characteristics of aquatic ecosystems [3-5].
Compounding the problem, algae can produce toxins that have paralytic,
diarrheic and neurotoxic effects with negative impacts on animals, humans and
aquatic species [6, 7]. These toxins can reach high concentrations during an algal
bloom impacting reproduction of aquatic species, fishing industries and coastal
economies [8]. The U.S. Environmental Protection Agency (EPA) monitors
watersheds across the nation and have determined that nutrients are a leading
cause of impaired waters [9]. To date, about a quarter of the rivers and streams
in the U.S. (1,500,000 km) have been assessed, of which half are impaired. The
primary source of the impairment is agriculture, with nutrients being a leading
cause. In attempt to reduce N and P discharge from nonpoint sources, the EPA
encourages farmers to employ strategies such as conservation farming,
vegetative buffers and better fertilizer management to mitigate nutrient pollution
[10].
Biochar (BC) is a carbonaceous geosorbent that is produced by thermal
degradation of organic material during pyrolysis [11]. The utilization of BC as a
chemical sorbent in agroecosystems has both economic and environmental
incentives: BC is generated from waste biomass through a process that can
produce energy and sequester carbon. The pyrolysis reaction is exothermic and
releases gasses from the biomass, yielding both immediate thermal energy and
biofuels that can be captured and stored [12]. Carbonization of biomass increases
2
carbon aromaticity [13-15] and recalcitrance relative to its thermally unaltered
state, which helps mitigate the release of carbon dioxide (CO2) into the
atmosphere through decomposition. The rate of CO2 uptake of living biomass
far exceeds the rate of CO2 released from BC when added to soil [16], making
biochar production an attractive strategy for reducing greenhouse gas emissions.
As a geosorbent BC shows strong affinity for organic compounds [17] and has
been shown to reduce N and P leaching from highly weathered soils [18, 19]. BC
is known to have high cation exchange capacity (CEC) with the ability to adsorb
NH4 [20], has demonstrated NO3 adsorption [21-24] and BC made from
anaerobically digested sugar beet tailings exhibited high PO4 removal from
aqueous solution [25]. Yet, the role of feedstock type, HTT and water rinsing
pretreatment of BC on inorganic nutrient sorption has yet to be systematically
elucidated.
Comparing the sorption capacity of various BCs for inorganic nutrients is
useful in understanding the BC characteristics that may contribute to reduced
nutrient leaching from BC amended soil receiving N and P fertilizer. Soil
application of manure and process wastewater is an option for concentrated
animal feeding operations (CAFOs) that are required to develop a nutrient
management plan (NMP) as part of the national pollution discharge elimination
system (NPDES) permit. The EPA regulates pollution discharge from animal
feeding operations (AFOs) based on the type and number of animals on the
property and whether or not pollutants are discharged into U.S. waters [26]. An
AFO holding more than 200 mature dairy cows, 300 cattle or 750 mature swine
may be classified as a CAFO, which the EPA regulates as a point source of
nutrient pollution [27]. Terms of the NMP require the CAFO to determine the

3
maximum application rates of N and P to soil that does not cause breakthrough
of pollutants to nearby waters even after multi-year application. In order to
evaluate how BC might achieve N and P effluent regulations under successive
applications of CAFO process wastewater, the sorption capacity of water-rinsed
BC for inorganic nutrients must be identified.
The objectives of this study are to determine: (1) how BC feedstock and
HTT influence water leachable nutrients, and (2) the effect of labile ions on
inorganic N and P sorption.
Materials and Methods
Background
Corn stover (Zea mays L.) and oak wood (Quercus ssp.) feedstocks were
slow-pyrolyzed at 350º and 550º C by BEST Energies, Inc. (Daisy Reactor, WI,
USA). These are referred to as Corn-350-BC, Corn-550-BC, Oak-350-BC and Oak-
550-BC. A previous study [28] analyzed elemental concentrations (Ca, H, Mg, N,
O, P) of these BCs including surface area and pore volume of Corn-BC and Oak-
BC pyrolyzed at 400º and 600º C HTT using nitrogen gas (N2) and CO2
adsorbates. Another study [29] performed Fourier transform infrared
spectroscopy (FTIR) on the same corn and oak feedstocks pyrolyzed at 350º and
600º C HTT. Data obtained from these previous experiments will be used to
characterize the BCs of this paper’s study. In cases where specific data is not
available for corn and oak pyrolyzed at 350º and 550º C HTT, data obtained from
corn and oak pyrolyzed at 400º and 600º C HTT will be used as proxy values,
respectively. A summary of the physical and chemical differences among the
temperature BCs is presented in Table 1 and in the Appendix.

4
Table 1: Physical and chemical properties of Corn-BC and Oak-BC. Surface area and pore volume were measured with N2 and CO2 sorbates. Mean elemental concentrations are expressed with standard deviation [± SD], n = 3. Asterisks (*) indicate that data for the exact HTT of a given feedstock is unavailable and the next closest HTT temperature (400º or 600º C) is reported instead. Data is compiled from a previous study [28].
Surface area measurements Elemental concentration (µmol g-1)
BC type
N2 sorbate surface
area (m2 g-1)
N2 sorbate
pore volume (mL g-1)
CO2 sorbate surface
area (m2 g-1)
CO2 sorbate
pore volume (mL g-1)
Ca Mg P
Corn-350-BC 6.7* 0.010* 281.9* 0.050* 61.00 [2.33] 153.11 [4.24] 259.48 [0.92] Corn-550-BC 4.8* 0.006* 527.1* 0.100* 67.58 [7.19] 244.62 [7.93] 365.80 [4.16] Oak-350-BC 3.5* 0.001* 449.8* 0.090* 0.36 [0.36] 27.36 [1.53] 1.69 [0.23] Oak-550-BC 0.9* 0.007* 547.8* 0.095* 0.94 [0.53] 40.14 [2.34] 1.71 [0.17]
Preparation of the biochars
All BCs were gently crushed through sieves with a ceramic pestle so that
BC particles fell between 850 µm and 500 µm mesh sizes. Most BC particles were
long, flat flakes with a length several times their width. Corn-BC occupied more
volume compared to an equal mass of Oak-BC. Corn-BC was also more brittle
than Oak-BC, which was evident while crushing the material through sieves. All
glassware was acid washed in a hydrochloric acid bath (1 mol L-1) and rinsed
with deionized water (DI) prior to use.
Rinse procedure and water leachable nutrients
The “rinsed” BC was prepared by rinsing each BC repetitively with DI,
which was then analyzed to determine water leachable nutrients. The BC
samples were continuously stirred for 16 hours with DI and a magnetic stir bar in

5
an Erlenmeyer flask. The Corn-BCs required a 2 L flask whereas the Oak-BCs
required a 1 L flask in order to obtain slurry that could be adequately mixed with
a stir bar. The approximate weight ratio of BC to DI was 1:45 for Corn-350 and
Corn-550, 1:20 for Oak-350 and 1:40 for Oak-550. For each rinse, the BC slurry
was stirred for 16 hours then passed through a 0.45 µm vacuum filter apparatus.
The BC material that remained on the filter apparatus was rinsed back into the
Erlenmeyer flask and was filled to capacity with DI. This procedure was
repeated until the pH of the filtrate stabilized between two consecutive rinses (±
pH 0.02). The final dry weights of Corn-350-BC, Corn-550-BC, Oak-350-BC and
Oak-550-BC at the end of the rinse series were 37.71 g, 37.18 g, 42.89 g and 22.87 g
respectively.
The pH of the rinse solutions was measured immediately after filtering
and approximately 300 mL of filtrate from each rinse was stored in an airtight
container at 4º C until analyzed for elemental and nutrient concentrations (4-16
weeks after filtering). Elemental composition (Ca, Mg, P) was determined using
an inductively coupled plasma spectrometer (ICP; Thermo Jarrell Ash ICAP 61E
Trace Analyzer). Ammonium concentration was determined using the phenate
colorimetric method [30] with a Hewlett Packard diode array UV-Vis
spectrophotometer. Nitrate was measured with a Dionex ion chromatograph
(IC) installed with an IONPAC® AS14A analytical column and PO4 was measured
with an OI analytical FS 3000 phosphorus analyzer (P-flow analyzer). A quality
control on the P analysis methods confirmed that P measured by the ICP
correlated strongly to P measured by the P-flow analyzer.
After the pH of each rinse solution stabilized, the BC remaining on the
filter apparatus was rinsed into a beaker which was then placed into an oven at

6
110º C for several days until dry. The beakers were covered loosely with
aluminum foil to reduce the risk of cross contamination. Once the BCs were
sufficiently cool, the dry mass of each BC was determined.
The concentration of Ca, Mg and P in the BCs over the course of the rinse
series was determined by mass balances. It is assumed that BC mass was
conserved throughout the rinse and that all nutrient mass leached from the BC
went into solution and was measured:
!!"#$%! = !!! − !!"#$!!"
! (1)
Where: i = element being measured Mfinal = total mass of element in BC at the end of a given rinse (µmol) Mo = initial mass of element in BC (µmol) Mleached = mass of element measured in solution at the end of each rinse (µmol)
The concentration of Ca, Mg and P in the BCs was calculated by dividing
the calculated mass of each element by the dry weight of the BC:
!!"! =!!"#$%!
!!" (2)
Where: !!"! = element (i) concentration in BC at the end of a given rinse (µmol g-1) Mfinal = total mass of element (i) in BC at the end of a given rinse (µmol) MBC = dry mass of BC used (g)
To determine the cumulative percent of element removed, the element
concentration of the rinsed BC is subtracted from the initial element
concentration of the BC and then divided by the initial element concentration of
the BC:

7
!!"#$%"&% =!!"!! !!!"
!
!!"!! ×100 (3)
Where: iremoved % = percent of element (i) removed at the end of a given rinse !!"!! = initial concentration of element (i) in BC (µmol g-1) !!"! = element (i) concentration in BC at the end of a given rinse (µmol g-1) Sorption experiments
Preliminary sorption experiments were performed using non-rinsed BC
prepared by Alterna Biocarbon (Prince George, British Columbia) from a mixture
of softwoods (spruce, pine and fir; referred to as “SPF-BC”) slow-pyrolyzed at
400º C. The preliminary experiments were used to evaluate BC to liquid ratios
and to obtain preliminary sorption results for NH4, NO3, and PO4 (Appendix).
The sorption experiments in this paper’s study were performed in triplicate at
24º C ± 2º C with a Burrell wrist action shaker at 400 rpm. 0.5 g of BC was added
to Corning 50 mL centrifuge tubes along with 50 mL of liquid (DI or nutrient
solution depending on experiment). The tubes were shaken for 24 hours and
then left quiescent for 24 hours before the supernatant was passed through a 0.45
µm vacuum filter apparatus.
Ammonium solutions were prepared using anhydrous ammonia chloride
and serial dilutions were made to obtain concentrations of 1; 10; 100; 1,000 and
10,000 mg NH4-N L-1. A set of BC mixed with DI was also included to measure
NH4 leached from 24 hours of continuous shaking. Only rinsed Corn and Oak-
BC was used for these sorption experiments and equilibrium concentrations
were measured using the phenate colorimetric method, analyzed on the UV-vis
spectrophotometer. Data was analyzed using the linearized Freundlich
adsorption model.

8
Nitrate sorption experiments were performed on both rinsed and non-
rinsed Corn-350-BC, Corn-550-BC and Oak-350-BC (a limited supply of Oak-550-
BC prevented it from being used in the nitrate sorption experiments). A solution
of 10 mg NO3-N L-1 was prepared from anhydrous potassium nitrate. These BCs
were also mixed with DI to quantify nitrate leached from 24 hours of continuous
shaking. The equilibrium solutions were analyzed for NO3 concentration using
the IC. Two-tailed t-tests are used to compare Ce to C0 and will inform whether
to accept or reject the null hypothesis that Ce and C0 are not different.
PO4 sorption experiments were performed on all rinsed-BC using pH
adjusted solutions. Two stock PO4 solutions were made from dibasic anhydrous
potassium phosphate (KH2PO4) and series dilutions were performed to obtain
two sets of identical solutions with concentrations of 0.1, 1 and 10 mg P L-1. One
set of concentrations was adjusted to pH 4 (± 0.02) using HCl and NaOH as
needed. The other set was buffered with sodium bicarbonate (NaHCO3) and
adjusted to pH 7 (± 0.02) with HCl and NaOH as needed. Water adjusted to pH
4 and pH 7 was also mixed with each rinsed-BC to measure P-leaching. For non-
rinsed Corn-350-BC, Corn-550-BC, Oak-350-BC and Oak-550-BC sorption
experiments were performed using 10 mg PO4-P L-1 and water solutions, each
buffered to pH 7. All equilibrium concentrations were determined using the P-
Flow analyzer.
Sorption isotherms are derived from experimental data and describe how
much solute adsorbs to the sorbate at a given equilibrium solute concentration.
Desorption isotherms were constructed based on the nutrient leaching
information gathered during the biochar rinsing series. Adsorption isotherms
were made for NH4 sorption to the rinsed BC, but these isotherms are considered

9
“modified” because the rinsed BC may not be entirely void of sorbate at the
beginning of the experiment. The Freundlich adsorption isotherm is used to
model NH4 sorption:
! = !!!!/! (4)
Where: S= mass of adsorbate per mass of adsorbent at equilibrium KF= experimentally derived constant C = concentration in solution 1/n = experimentally derived constant
S is determined by measuring the concentration of the equilibrium
solution and subtracting that from the initial concentration, times solution
volume (Equation 5). It is then normalized by adsorbent mass. Since the rinsed
BC is starting with an unknown mass of solute on its surface, q* represents the
additional mass of solute sorbed per mass BC:
!∗ = (!! − !!)×!
!!" (5)
Where: q*= additional mass adsorbed at equilibrium per mass sorbent (µMol g-1) Co= initial concentration of solution (µMol L-1) Ce = measured equilibrium concentration (µMol L-1) V = volume of solution (L) MBC = mass of BC used in experiment (g)
A least square regression of log(q*) versus log(Ce) gives:
log !∗ = log !!∗ + !!log (C!) (6)
Where: log(!F∗)= y-intercept n-1= the slope
10
Results Water leachable nutrients
The pH of sequential rinse solutions for each BC progressed towards
neutrality, albeit with fluctuations (Table 2). The Oak-350-BC showed the largest
change between the initial (pH 4.32) and final (pH 5.88) values whereas Corn-
350-BC showed the least change in pH between initial (pH 7.95) and final (pH
7.78) rinses.
The N leached during the rinse series was minimal. Ammonium leaching
was often below detection limits, yet each BC leached a small amount with Corn-
BC leaching slightly more than Oak-BC. Nitrate leaching was not measured in
any sample, as none of the rinse solutions exceeded 0.2 mg NO3-N L-1, which was
the detection limit of the IC.
In the course of rinsing, at the point where the mass of rinse water used
was about 200 times the mass of BC (Corn-350-BC rinse #4; Corn-550-BC rinse
#4; Oak-350-BC rinse #9; Oak-550-BC rinse #5), the low HTT BCs released a
larger percentage of P than the high HTT BCs (Table 2). Both Corn-BCs leached a
larger mass of P than the Oak-BCs. Corn-BC showed a larger discrepancy in
percentage of leachable P based on HTT, with Corn-350-BC leaching a total of
61% of initial P whereas Corn-550-BC leached a total of 24%. Oak-350-BC and
Oak-550-BC leached 49% and 26% of initial P respectively.

11
Table 2: Data gathered from the rinse of each BC. The initial mean elemental concentration for each BC is compiled from a previous study [28] with standard deviation [± SD], n=3. Elemental concentrations and ratios throughout the rinse series were based on the initial mean concentrations of each element, for each BC.
BC sample Rinse number
pH of rinse
solution
Cumulative volume of water used to rinse (L)
Mass of water used per mass BC (g g-‐1)
Mass NH4-‐N leached per mass BC (µmol g -‐1)
Mass NO3-‐N leached per mass BC (µmol g -‐1)
Elemental content of biochar at end of rinse (µmol g-‐1) Cumulative percent of element leached
P Ca Mg Ca:Mg P Ca Mg
Corn-‐350-‐BC -‐-‐-‐ -‐-‐-‐ -‐-‐-‐ -‐-‐-‐ -‐-‐-‐ -‐-‐-‐ 61.00 [2.33] 153.11 [4.24] 259.48 [0.92] 0.59 -‐-‐-‐ -‐-‐-‐ -‐-‐-‐ Corn-‐350-‐BC 1 7.95 1.54 42 0.89 <1.60 36.69 149.21 213.03 0.70 40% 3% 18% Corn-‐350-‐BC 2 7.93 3.29 90 <0.65 <1.60 29.18 146.47 198.39 0.74 52% 4% 24% Corn-‐350-‐BC 3 7.62 4.86 132 <0.65 <1.60 25.99 145.47 193.86 0.75 57% 5% 25% Corn-‐350-‐BC 4 7.77 6.40 174 <0.65 <1.60 23.62 144.05 187.53 0.77 61% 6% 28% Corn-‐350-‐BC 5 7.75 8.19 223 <0.65 <1.60 22.12 142.91 182.91 0.78 64% 7% 30% Corn-‐550-‐BC -‐-‐-‐ -‐-‐-‐ -‐-‐-‐ -‐-‐-‐ -‐-‐-‐ -‐-‐-‐ 67.58 [7.19] 244.62 [7.93] 365.80 [4.16] 0.67 -‐-‐-‐ -‐-‐-‐ -‐-‐-‐ Corn-‐550-‐BC 1 9.76 1.70 47 0.69 <1.60 59.88 239.46 331.63 0.72 11% 2% 9% Corn-‐550-‐BC 2 9.52 3.47 96 0.88 <1.60 54.92 236.48 318.36 0.74 19% 3% 13% Corn-‐550-‐BC 3 9.5 5.27 146 <0.65 <1.60 52.65 233.15 311.17 0.75 22% 5% 15% Corn-‐550-‐BC 4 9.11 7.01 193 <0.65 <1.60 51.23 229.87 306.88 0.75 24% 6% 16% Corn-‐550-‐BC 5 9.06 8.68 240 1.49 <1.60 49.40 224.69 300.46 0.75 27% 8% 18% Corn-‐550-‐BC 6 9.06 10.52 290 <0.65 <1.60 48.15 219.26 295.90 0.74 29% 10% 19% Oak-‐350-‐BC -‐-‐-‐ -‐-‐-‐ -‐-‐-‐ -‐-‐-‐ -‐-‐-‐ -‐-‐-‐ 0.36 [0.43] 27.36 [1.53] 1.69 [0.23] 16.19 -‐-‐-‐ -‐-‐-‐ -‐-‐-‐ Oak-‐350-‐BC 1 4.32 0.91 22 0.36 <0.75 0.36 23.98 1.62 14.82 0% 12% 4% Oak-‐350-‐BC 2 4.5 1.78 43 <0.30 <0.75 0.32 22.64 1.57 14.46 11% 17% 7% Oak-‐350-‐BC 3 5.01 2.68 64 <0.30 <0.75 0.30 21.85 1.56 14.01 16% 20% 8% Oak-‐350-‐BC 4 5.25 3.56 85 <0.30 <0.75 0.29 21.23 1.55 13.70 21% 22% 8% Oak-‐350-‐BC 5 5.7 4.47 107 <0.30 <0.75 0.27 21.01 1.55 13.60 26% 23% 9% Oak-‐350-‐BC 6 5.25 5.36 128 0.32 <0.75 0.26 20.63 1.54 13.42 29% 25% 9% Oak-‐350-‐BC 7 5.59 6.25 149 <0.30 <0.75 0.22 20.05 1.53 13.09 38% 27% 9% Oak-‐350-‐BC 8 5.88 7.09 170 <0.30 <0.75 0.20 19.53 1.52 12.82 44% 29% 10% Oak-‐350-‐BC 9 5.88 8.02 192 <0.30 <0.75 0.18 19.08 1.51 12.61 49% 30% 10% Oak-‐550-‐BC -‐-‐-‐ -‐-‐-‐ -‐-‐-‐ -‐-‐-‐ -‐-‐-‐ -‐-‐-‐ 0.94 [0.53] 40.14 [2.34] 1.71 [0.17] 23.47 -‐-‐-‐ -‐-‐-‐ -‐-‐-‐ Oak-‐550-‐BC 1 6.81 1.01 45 0.68 <1.50 0.91 37.68 1.69 22.34 4% 6% 1% Oak-‐550-‐BC 2 7.29 1.92 86 0.62 <1.50 0.87 31.67 1.67 18.94 8% 21% 2% Oak-‐550-‐BC 3 7.46 2.85 128 <0.50 <1.50 0.80 27.26 1.65 16.49 15% 32% 3% Oak-‐550-‐BC 4 7.14 3.81 171 <0.50 <1.50 0.77 23.97 1.65 14.50 18% 40% 3% Oak-‐550-‐BC 5 6.74 4.47 201 <0.50 <1.50 0.70 23.23 1.61 14.42 26% 42% 6% Oak-‐550-‐BC 6 6.89 5.31 238 <0.50 <1.50 0.67 22.10 1.61 13.76 29% 45% 6% Oak-‐550-‐BC 7 6.91 6.19 278 <0.50 <1.50 0.62 21.48 1.61 13.38 34% 46% 6%

12
The molar P content of Corn-BC decreases with the equilibrium
concentration of P in the rinse solution (Figure 1A). The P content of Corn-350-
BC approached a value of about half that of Corn-550-BC due to a large release of
P in the first rinse, after which the solution equilibrium concentrations of P were
quite similar between the two BCs. Corn-BC shows a trend of decreasing P
content with decreasing equilibrium concentration (P<0.05; Table 3) yet Oak-BC
did not (P>0.05; Table 3).
The low HTT BCs released a higher percentage of their initial Mg content
relative to the high HTT BCs (Table 2). As the ratio of rinse water to BC reached
200, Corn-350-BC leached 28% and Corn-550-BC leached 16% of their initial Mg
content, resulting in a 72 µmol g-1 and 59 µmol g-1 reduction respectively. At
similar rinse water to BC ratios, Oak-350-BC leached 10% and Oak-550-BC 6% of
their initial Mg content, which translates to a 0.18 µmol g-1 and 0.10 µmol g-1
reduction respectively. Corn-BC and Oak-350-BC demonstrate a decrease of Mg
content in the BC as solution concentration of Mg decreases (P<0.05; Table 3)
whereas Oak-550-BC does not show a clear relationship (P>0.05; Table 3).

13
A
B
C
D
Figure 1: Desorption isotherms showing the molar P or Mg contents of Corn-BC and Oak-BC versus the equilibrium concentrations of P or Mg in rinse solutions.
0
10
20
30
40
50
60
70
0 200 400 600 800
P content (µm
ol g-‐1)
Ce (µmol L-‐1)
Corn-‐350-‐BC Corn-‐550-‐BC
0 0.1 0.2 0.3 0.4 0.5 0.6 0.7 0.8 0.9 1
0 1 2 3
P content (µm
ol g-‐1)
Ce (µmol L-‐1)
Oak-‐350-‐BC Oak-‐550-‐BC
0
50
100
150
200
250
300
350
400
0 200 400 600 800 1000 1200
Mg content of Oak-‐BC (µmol g-‐1)
Ce (µmol g-‐1)
Corn-‐350-‐BC Corn-‐550-‐BC
1.50 1.52 1.54 1.56 1.58 1.60 1.62 1.64 1.66 1.68 1.70
0 1 2 3 4
Mg content of Oak-‐BC (µmol g-‐1)
Ce (µmol g-‐1)
Oak-‐350-‐BC Oak-‐550-‐BC

14
Table 3: Regression line data for P and Mg desorption isotherms for the Corn-BC and Oak-BC rinse series.
BC type Element i !!"! = ! ∗ !!! + ! R2 P-level
Corn-350-BC P !!"! = 0.02 ∗ !!! + 23.16 0.92 0.01
Corn-550-BC P !!"! = 0.07 ∗ !!! + 47.69 0.92 <0.01
Oak-350-BC P !!"! = 0.02 ∗ !!! + 0.23 0.05 0.60
Oak-550-BC P !!"! = −0.05 ∗ !!! + 0.81 0.03 0.53
Corn-350-BC Mg !!"!" = 0.02 ∗ !!
!" + 186.40 0.84 0.03
Corn-550-BC Mg !!"!" = 0.05 ∗ !!
!" + 299.27 0.80 0.02
Oak-350-BC Mg !!"!" = 0.02 ∗ !!
!" + 1.53 0.68 0.01
Oak-550-BC Mg !!"!" = −0.01 ∗ !!
!" + 1.64 0.01 0.88
By the end of the fourth rinse, Corn-350-BC and Corn-550-BC both leached
6% of their initial Ca content, resulting in a decrease of Ca content of 9 and 15
µmol g-1 respectively (Table 2). As the ratio of rinse water to BC reached 200, Ca
leaching for Oak-350-BC (rinse #9) was 30% and Oak-550-BC (rinse #5) was 42%,
resulting in a Ca content decrease of 8 and 17 µmol g-1 respectively. The Ca
solution concentrations of the rinse series do not appear to be governed by Ca
content of the BCs, which differ by feedstock. The equilibrium solution Ca
concentrations appear to be grouped based on HTT (Figure 2). The low HTT BCs
show very similar Ca solution concentrations regardless of Ca content, as do the
high HTT BCs.

15
Figure 2: A plot of Ca concentration in the rinse solutions versus Ca content in Corn and Oak-BC. Oak-BC Ca content is on the primary y-axis and Corn-BC Ca content is on the secondary y-axis.
The molar ratios of Ca content to Mg content show that Oak-BC sustains a
much higher ratio over the course of the rinse series than Corn-BC, yet the Ca:Mg
ratio increases for Corn-BC while it decreases for Oak-BC (Table 2). Oak-BC
shows a larger change in Ca:Mg ratio than Corn-BC, which results from
moderately high Ca content relative to low Mg content and the Ca leaches
substantially more than Mg.
Ammonium sorption results
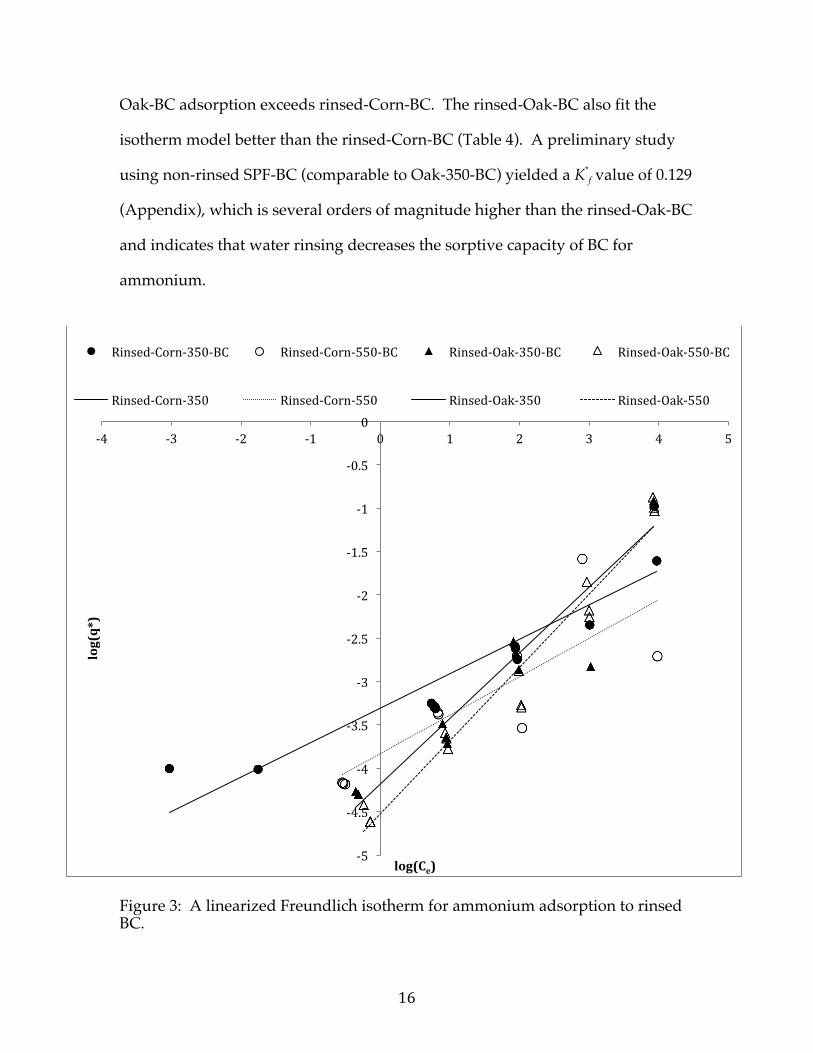
All of the rinsed BCs exhibited ammonium sorption but lower HTT BC
showed a higher sorptive capacity for NH4-N relative to the higher HTT BC of
the same feedstock (Figure 3 and Table 4). At low Ce rinsed-Corn-BC adsorbed
more NH4-N than rinsed-Oak-BC of the same HTT, yet as Ce increases rinsed-
100
120
140
160
180
200
220
240
260
10
15
20
25
30
35
40
0 50 100 150 200
Ca content of Corn-‐BC (µmol g-‐1)
Ca content of Oak-‐BC (µmol g-‐1)
Ce (µmol g-‐1)
Oak-‐350-‐BC Oak-‐550-‐BC Corn-‐350-‐BC Corn-‐550-‐BC
16
Oak-BC adsorption exceeds rinsed-Corn-BC. The rinsed-Oak-BC also fit the
isotherm model better than the rinsed-Corn-BC (Table 4). A preliminary study
using non-rinsed SPF-BC (comparable to Oak-350-BC) yielded a K*f value of 0.129
(Appendix), which is several orders of magnitude higher than the rinsed-Oak-BC
and indicates that water rinsing decreases the sorptive capacity of BC for
ammonium.
Figure 3: A linearized Freundlich isotherm for ammonium adsorption to rinsed BC.
-‐5
-‐4.5
-‐4
-‐3.5
-‐3
-‐2.5
-‐2
-‐1.5
-‐1
-‐0.5
0 -‐4 -‐3 -‐2 -‐1 0 1 2 3 4 5
log(q*)
log(Ce)
Rinsed-‐Corn-‐350-‐BC Rinsed-‐Corn-‐550-‐BC Rinsed-‐Oak-‐350-‐BC Rinsed-‐Oak-‐550-‐BC
Rinsed-‐Corn-‐350 Rinsed-‐Corn-‐550 Rinsed-‐Oak-‐350 Rinsed-‐Oak-‐550

17
Table 4: Freundlich model terms for ammonium adsorption to rinsed BC.
BC type K*f n R2 P-level
Rinsed-Corn-350-BC 4.9e-4 2.52 0.86 <0.01 Rinsed-Corn-550-BC 1.5e-4 2.26 0.69 <0.01 Rinsed-Oak-350-BC 6.5e-5 1.32 0.93 0 Rinsed-Oak-550-BC 2.9e-5 1.18 0.96 0
Nitrate sorption results
The mean Ce values from the sorption experiments using both rinsed and
non-rinsed Corn-350-BC, Corn-550-BC and Oak-350-BC showed no difference
compared to the mean C0 signifying that no NO3 sorption took place (Test
statistic<t-critical value; Table 5). There was also no nitrate detected (<0.2 mg L-1)
in any of the DI solutions that were shaken with each of the BC types listed
above (data not shown).
Table 5: Results of two-tailed t-tests comparing Ce to C0 for nitrate sorption experiments, calculated at the 5% level. Sample size for each variable is 3, each test having 4 degrees of freedom.
Ce of BC type Comparison to C0 Test statistic t-critical value (5%) P-level
Rinsed-Corn-350-BC 0.55 2.78 0.61 Non-rinsed Corn-350-BC 1.63 2.78 0.18
Rinsed-Corn-550-BC 0.85 2.78 0.44 Non-rinsed Corn-550-BC 2.14 2.78 0.10
Rinsed-Oak-350-BC 1.22 2.78 0.29 Non-rinsed Oak-350-BC 2.03 2.78 0.11

18
Phosphate sorption results
Rinsed and non-rinsed Corn-BC did not show additional PO4 sorption at
any equilibrium concentration measured (Figure 4A). Regression line slopes for
the rinsed Corn-BC isotherms are all near zero (Table 6). The non-rinsed Oak-BC
showed PO4 sorption (Figure 4B), which is evident when compared to the initial
concentration of the BCs (Table 1). Very little PO4 sorption occurs on rinsed Oak-
550-BC at higher equilibrium concentrations, as evidenced by a weak positive
slope of the regression line (P<0.05; Table 6). The difference between initial PO4
solution pH values of 4 and 7 does not greatly affect PO4 sorption to any of the
rinsed BCs.

19
A
B
Figure 4: PO4 sorption isotherms for rinsed and non-rinsed Corn-BC and Oak-BC.
0
10
20
30
40
50
60
70
0 100 200 300 400 500 600
P content (µm
ol g-‐1)
Ce (µmol L-‐1)
non-‐rinsed Corn-‐350-‐pH7 rinsed-‐Corn-‐350-‐pH4 rinsed-‐Corn-‐350-‐pH7 non-‐rinsed Corn-‐550-‐pH7 rinsed-‐Corn-‐550-‐pH4 rinsed-‐Corn-‐550-‐pH7
-‐0.5
0
0.5
1
1.5
2
2.5
3
0 50 100 150 200 250 300 350
P content (µm
ol g-‐1)
Ce (µmol L-‐1)
non-‐rinsed Oak-‐350 rinsed-‐Oak-‐350-‐pH4 rinsed-‐Oak-‐350-‐pH7 non-‐rinsed Oak-‐550-‐pH7 rinsed-‐Oak-‐550-‐pH4 rinsed-‐Oak-‐550-‐pH7

20
Table 6: Linear regression results for PO4 sorption isotherms.
BC type Initial pH of PO4
solution !!"! = ! ∗ !!! + ! R2 P-level
Rinsed-Corn-350- BC 4 !!"! = −0.001 ∗ !!! + 4.56 0.04 0.59 7 !!"! = −0.001 ∗ !!! + 5.77 0.34 0.10
Rinsed-Corn-550-BC 4 !!"! = 0.002 ∗ !!! + 44.37 0.17 0.06 7 !!"! = 0.001 ∗ !!! + 45.10 0.26 0.16
Rinsed-Oak-350-BC 4 !!"! = 0.001 ∗ !!! − 0.04 0.18 0.26 7 !!"! = 0.001 ∗ !!! + 0.21 0.34 0.09
Rinsed-Oak-550-BC 4 !!"! = 0.001 ∗ !!! + 0.68 0.41 0.03 7 !!"! = −0.0002 ∗ !!! + 0.28 0.10 0.32
Discussion and Conclusion
Leachability of nutrients
The rinse solution pH of Corn-BC was higher than that of Oak-BC (Table
2) which is consistent with another study that used the same BC materials [29].
The ash percent of Corn-BC is much greater than that of Oak-BC (Appendix) and
is a likely reason for the increased pH in Corn-BC relative to Oak-BC and also the
increased pH with higher HTT within the same feedstock. The relationship
between high ash content and high pH occurs widely in BC made from plant
biomass [31, 32]. Another factor that might influence decreased acidity with
HTT is the loss of acidic carboxyl functional groups with increased HTT [29]. A
loss of carboxyl groups and decrease in surface acidity was observed between
Eucalyptus saligna wood pyrolyzed at 400º and 550ºC [32].
There were very low levels of NH4 leaching from Corn and Oak-BC and
NO3 leaching was not detected. Even though N comprises about 1% of Corn-BC
and 0.1% of the Oak-BC across the temperature series studied (Appendix), the N
is bound in a sparsely water-soluble form. BC derived from undigested plant

21
biomass is not considered a significant source of NH4+ or NO3
- [31-34]. This
agrees with another study that performed a water extraction of citrus wood BC
(having 0.6% N) by continually stirring the BC in water (1:10 w/w) for 30
minutes and measuring the extract for NH4+ and NO3
- [33]. The citrus wood BC
leached 0.2 µg NH4-N g-1 BC and 0.6 µg NO3-N g-1 BC. When combined, N (in the
form of NH4+ and NO3
-) was the least water extractable element, by several
orders of magnitude compared to other elements leached (Ca, K, Mg, Mn, P, S,
Na) [33].
Initial P content is dependent primarily on feedstock and is concentrated
to a greater extent in the BC as HTT increases (Appendix). Comparing
feedstocks, Corn-BC has higher P content than Oak-BC and leached more P as
well (Figure 1). P solubility is not affected by HTT as both high and low HTT
Corn-BC produce the same concentration of P in the rinse solution regardless of
P content in the BC. However, P leachability decreases with increased HTT,
which might result from pore constriction as increased HTT leads to micropore
development (pore diameter<20 Å) and transition away from mesopores (pore
diameter>20 Å).
Surface area measured with N2 sorbate might be distinguished as
mesopore surface area. The inability of N2 to characterize microporous carbon
[35] might help differentiate nutrient-leachable pores from those that are smaller
than the diameter of hydrated nutrient ions. CO2 sorbate achieves higher
equilibrium concentrations on BC [36] due to its smaller radius (3.3 Å) compared
to N2 (3.64 Å), enabling enhanced pore structure information [37]. The first
hydration layer surrounding PO4 can have oxygen molecules in water between
3.0 and 4.8 Å distant to P and the second hydration shell can have distances
22
between 4.8-6.8 Å [38], which makes it unlikely that PO4 will be hydrated and
leached from the micropores.
In aqueous environments, the solute must diffuse through a pore in order
to access all open sites [39]. The easily accessible sites will be preferentially
occupied (or leached) even though the less accessible sites have the same
sorptive energy. CO2 measured surface area increases with HTT for each BC
(Table 1), yet P leaching decreases which suggests that micropore surfaces are
not easily leached. BC that has a larger proportion of mesopores will allow for
better hydration of molecules on its surface than BC with fewer mesopores
relative to micropores. In this study, BCs with a larger mesopore to micropore
ratio leached a higher percentage of total P. This supports the theory that N2
measured surface area is a better predictor of P leaching than CO2 measured
surface area, assuming solubility is constant.
The leachability of Mg follows a very similar trend to that of P release and
the radius of the first hydration layer of Mg2+ (3.00-4.28 Å) is similar to that of
PO4 [40]. The Mg content of the Corn-BC is much larger than that of Oak-BC
(Table 1) and also leached a higher percentage. Solubility of Mg does not appear
to be related to HTT but the low HTT BCs release a larger percent of their total P,
which might be caused by a larger mesopore surface area. The development of
micropores might be limiting the release of Mg. Decreased Mg and P leaching
with increased HTT has been observed in other studies as well [32].
The Ca content of Corn-BC is approximately one order of magnitude
higher than that of Oak-BC, for all HTTs (Table 1). Yet, Ca concentration in the
rinse solutions did not reflect this trend (Figure 2). Ca concentration in the rinse
solutions for Corn-BC and Oak-BC were similar for high and low HTT, where

23
high HTT BC leached more Ca than low HTT BC. Since Ca leaching appears to
be driven by HTT rather than feedstock type, higher pyrolysis temperature
might influence the way in which the Ca is bound in BC and changes in the
molecular structure of the Ca compound could alter its solubility.
HTT has been shown to alter Ca compounds in activated and non-
activated BC made from leaf and wood material of E.saligna [32]. X-ray
diffraction (XRD) analysis revealed the major crystalline phase of E. saligna BC
produced at 400º C was whewellite (calcium oxalate monohydrate,
Ca(C2O4).H2O) yet the structure was carbon rich and poorly crystalline. When
the feedstock was pyrolyzed at 550º C, the whewellite structure was lost and
calcite (CaCO3) was formed in all of the samples. An increase in exchangeable
Ca was also observed in the higher temperature E. saligna BCs [32]. Calcite has
also been observed in cornstraw BC pyrolyzed at 500º C using XRD [41]. The
same study measured the kinetic release of minerals and found that Ca detached
quickly, followed by a zero order release reaction after 24 hours.
Calcium oxalate is a common crystal in plant biomass [42, 43], which
makes it likely that corn and oak feedstocks share the mineral. As the feedstocks
are pyrolyzed calcium oxalate is lost and calcite is formed [32]. The solubility of
calcite, Log Ksp = -6.37 [44], is higher than that of calcium oxalate monohydrate,
Log Ksp = -8.64 [45]. If Ca is predominantly bound to oxalate in the biomass of
corn and oak feedstocks then Ca solubility would be lower in the 350º HTT BC.
The formation of calcite in high HTT BC would also explain the increased Ca
solubility observed in the rinse solutions of Corn-550-BC and Oak-550-BC.

24
Sorption experiments
All rinsed-BC adsorbed NH4+ but low HTT BC sorbed more than high
HTT BC for each feedstock. The decrease in cation exchange capacity (CEC) with
increasing HTT can be attributed to the loss of carboxyl functional groups during
pyrolysis [29, 46, 47]. The relative proportion of carboxyl groups in the corn and
oak BC decreases by half between the HTT range 300º - 600º C [29]. The two
feedstocks have very similar carboxyl group proportions at these temperatures
yet they do not adsorb ammonium the same way. CEC increases with solution
pH [41] which might explain the difference in greater adsorption of NH4 by
Corn-BC than Oak-BC when compared at the same HTT.
Oak-BC showed a better fit to the Freundlich adsorption model compared
to Corn-BC (Table 6), which might be a result of the increased fractal dimensions
of Oak-BC. The 1/n term of the Freundlich equation (Equation 4) has been
shown to be directly proportional to the fractal dimension of the adsorbent [48].
The Freundlich equation normally applies to a limited part of most adsorption
isotherms—at the early stage of adsorption where the relationship between S and
C (Equation 4) is more or less linear. The Freundlich adsorption isotherm for
Corn-BC does not linearize well because NH4+ sorption is more variable over the
concentration range. This could be due to a lower fractal dimension as expressed
by the smaller 1/n terms and less surface area for Corn-BC compared to Oak-BC,
which had a larger 1/n terms and more surface area. NH4+ sorption for Oak-BC
remains linear and is likely caused by a larger micropore surface area. The
constant (K*F) for Oak-BC is lower than Corn-BC (Table 6), which might result
from lower solution pH induced by the Oak-BC. Yet, the fact that q* values for
Oak-BC exceed that of Corn-BC at high NH4 concentrations might indicate better

25
access to micropores by virtue of a smaller hydrated radius (1.04 – 3.31 Å) or
weak hydration [40], which would allow for access to more sorption sites as Oak-
BC has more total surface area than Corn-BC at the same HTT (Table 1).
The inability of BC to adsorb NO3 has been observed in sorption
experiments using sugarcane bagasse-BC (250 µm – 500 µm) of the HTT range
400º - 600º C [22], yet the same study observed NO3 sorption to bagasse-BC above
700º C HTT. Approximately 7.14 µmol NO3-N g-1 adsorbed to the 800º C HTT
bagasse-BC when mixed with a solution of 20 mg NO3-N L-1. One study
concluded the optimal equilibrium pH for NO3 sorption to bamboo-BC (300 µm -
500 µm) occurred at pH 2.4 and used the Langmuir adsorption model to predict a
sorption capacity of 31.5 µmol NO3-N g-1 [23]. Another study utilized the
Langmuir model to predict a sorption capacity of 89.29 µmol NO3-N g-1 for 900º C
HTT bamboo-BC powder (~80 µm). Two scenarios to account for NO3 sorption
to BC might include: 1) the development of basic functional groups with
increasing HTT that provide anion exchange sites [22], and 2) an increase of the
surface positive charge with decreasing pH (pH 3-7) for new BC [49, 50].
However, anion exchange capacity (AEC) is known to be low and transient in
Corn-BC and Oak-BC in the HTT range 350º - 600º C and do not have strong AEC
after repetitive rinsing [49]. It can be concluded that the rinsed and non-rinsed
BC used in this study do not have sufficient AEC to adsorb NO3.
Additional PO4 sorption did not occur on any of the rinsed or non-rinsed
Corn-BC (Figure 4A) yet some additional PO4 sorption occurred on non-rinsed
Oak-BC (Figure 4B). The rinsed BC does not appear to have AEC in the pH
range tested because neither of the dominant ions H2PO4- nor HPO4
2- sorbed to
the rinsed BC at significant concentrations. Some additional PO4 was sorbed on

26
the rinsed Oak-BC at the highest equilibrium concentration tested but this is not
likely caused by AEC because no NO3- sorbed to any of these rinsed BC.
The sorption experiment using non-rinsed Corn-550-BC (Figure 4A)
exceeded the equilibrium concentration observed in the rinse study (Figure 1)
but no additional P was sorbed to the material. Oak-BC on the other hand
showed additional PO4 sorption on rinsed BC above 300 µmol-PO4-P L-1 (Figure
4B). Since none of the Oak-BC rinse solutions were higher than 2 µmol-P L-1
(Figure 1), it is conceivable that PO4 could be sorbed onto the BC surface. The
energy needed to overcome the sorption enthalpy is driven by the concentration
differential between the bulk solution and the sorbent surface [51] and it appears
that a concentration of 320 µmol-PO4-P L-1 provides a large enough gradient for
PO4 sorption to occur on Oak-BC. The non-rinsed Oak-BC shows more sorption
than the rinsed BC at the same concentration, which implies that PO4 sorption
capacity is lost with rinsing.
Since the BC used in this study does not have strong AEC, PO4 cannot be
adsorbed by electrostatic forces. Another possibility is precipitation of calcium
phosphate compounds on the BC surface such as hydroxyapatite (Ca5(PO4)3OH),
which requires available Ca2+, PO4 and OH- without chemical species or
conditions that would enable substitutions to form thermodynamically favorable
and relatively soluble complexes of amorphous Ca phosphate (Ca3(PO4)2.nH2O),
octacalcium phosphate (Ca4H(PO4)3.2.5H2O), dicalcium phosphate dihydrate
(CaHPO4.2H2O) or whitlockite (Ca9(MgFe)(PO4)6PO3OH) [52-55]. Mg2+ can
inhibit hydroxyapatite crystallization through Ca2+ substitution and the presence
of organic acids such as oxalic acid or larger acids can reduce hydroxyapatite
precipitation rate up to 94% [55]. Even in Ca rich soils receiving manure, Mg and

27
P leaching have been correlated, which can be attributed to Mg increasing the
solubility of P [52, 56]. Considering that BC additions to soil have resulted in
significant release of Mg and P [57] and the evidence from this study in terms of
Mg leaching, it is unlikely that PO4 precipitation will occur on Corn-BC due to its
high Mg leachability. Lower HTT BCs also have more carboxyl groups [29],
which can inhibit hydroxyapatite formation [55]. Oak-BC has a larger molar
ratio of Ca:Mg (Table 2) and has shown PO4 sorption. Since Mg2+ can easily
substitute Ca2+ during PO4 precipitation, a Ca:Mg ratio above 15 could indicate
more favorable conditions for precipitation.
The results of this study show that BC would be a good mitigation option
for point and nonpoint source NH4 pollution. BC with Ca:Mg ratios above 15
have the ability to mitigate PO4 pollution yet mitigation potential decreases with
high water loading. No BC studied in this research has the ability to mitigate
NO3 though adsorption.

APPENDIX
28
Physical differences between Corn-BC and Oak-BC with temperature
The N2 measured surface area and pore volume for the Corn-BC shows an
inverse relation to increasing HTT yet CO2 measured surface area and pore
volume increase with increasing HTT (Table 1). The Corn-BC micropore volume
doubles between HTTs of 400-600 ºC and the surface area, including the
micropores, increases 187% over the same range. The mesopores on the other
hand decrease as the HTT increases, which might suggest a shift towards a
surface area that is dominated by micropores in high HTT BC.
The trend towards increased micropore surface area and volume of Corn-
BC and Oak-BC with increasing HTT might be explained in part by mass loss.
Oak-BC has slightly higher volatiles content in 300º and 350 ºC BC relative to
Corn-BC of the same HTT (Appendix figure 1). At 450 ºC and above, Corn-BC
and Oak-BC are closely matched in their volatiles content. Decreasing volatile
content with increasing HTT might imply that micropores become available as
volatile material escapes.

APPENDIX
29
Appendix figure 1: Mean volatile content of Corn-BC and Oak-BC. ASTM 950º C method used, volatile content equals percent mass lost after anoxic combustion at 950º C compared to 105º C dry weight under anoxic conditions. Error bars represent standard deviation, n=3. Data is compiled from a previous study [28].
The ash content between Corn-BC and Oak-BC are markedly different
across the HTT range (Appendix figure 2). The Oak-BC ash content does not
increase with HTT whereas the Corn-BC shows a steady increase in ash content
with increasing HTT. The higher ash content of the Corn-BC might be related to
lower lignin content, whereas Oak-BC has higher lignin and would dilute the ash
content on a weight basis. As Corn-BC loses mass in volatiles, percent ash
content increases. Ash content can also be a surrogate for pH, where BC
produced at higher HTT also have higher pH [29].
0%
10%
20%
30%
40%
50%
60%
70%
250 300 350 400 450 500 550 600 650
Volatile content (w
/w)
pyrolysis highest treatment temperature ºC
Corn-‐BC
Oak-‐BC

APPENDIX
30
Appendix figure 2: Mean ash content (%) of Corn-BC and Oak-BC. ASTM 750º C method used, ash content equals (1- % mass lost after combustion at 750º C in oxic conditions), compared to 105º C dry weight under oxic conditions. Error bars represent standard deviation, n=3. Data is compiled from a previous study [28].
Chemical differences between Corn-BC and Oak-BC with temperature
The nitrogen content of char seems relatively fixed over the HTT range
(Appendix figure 1). The P content of the two chars is very different. The
nitrogen content of Corn-BC is about an order of magnitude higher than that of
Oak-BC. For the 350º and 550º C chars for each feedstock, there does not appear
to be any difference in their nitrogen contents between the two temperatures.
Since this parameter is measured on a mass basis, the nitrogen must be changing
0%
2%
4%
6%
8%
10%
12%
14%
16%
18%
20%
250 300 350 400 450 500 550 600 650
Ash content (w/w)
pyrolysis highest treatment temperature ºC
Corn-‐BC
Oak-‐BC
APPENDIX
31
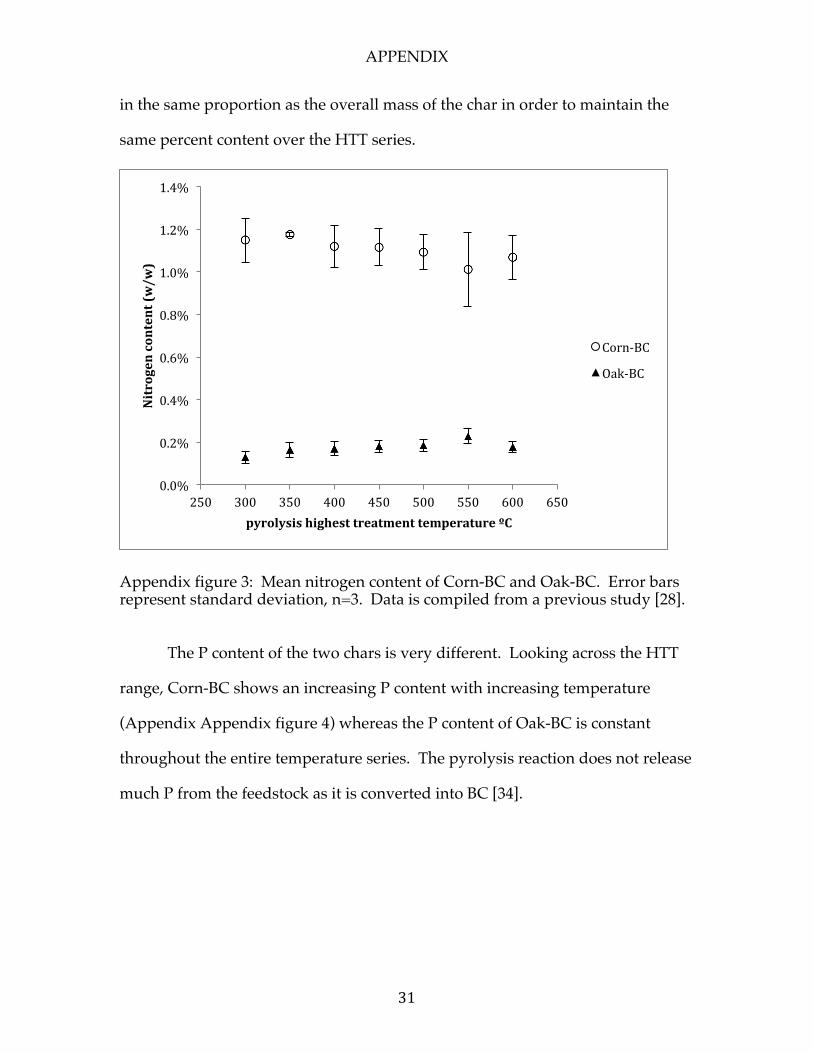
in the same proportion as the overall mass of the char in order to maintain the
same percent content over the HTT series.
Appendix figure 3: Mean nitrogen content of Corn-BC and Oak-BC. Error bars represent standard deviation, n=3. Data is compiled from a previous study [28].
The P content of the two chars is very different. Looking across the HTT
range, Corn-BC shows an increasing P content with increasing temperature
(Appendix Appendix figure 4) whereas the P content of Oak-BC is constant
throughout the entire temperature series. The pyrolysis reaction does not release
much P from the feedstock as it is converted into BC [34].
0.0%
0.2%
0.4%
0.6%
0.8%
1.0%
1.2%
1.4%
250 300 350 400 450 500 550 600 650
Nitrogen content (w/w)
pyrolysis highest treatment temperature ºC
Corn-‐BC
Oak-‐BC

APPENDIX
32
Appendix figure 4: Mean phosphorus content (µmol g-1) of Corn-BC and Oak-BC. Error bars represent standard deviation, n=3. Data is compiled from a previous study [28].
Ca could be an important element for P sorption as it is associated with
the largest fraction of P in some chars [34]. In both Corn-BC and Oak-BC, Ca
appears to increase with increasing HTT (Appendix figure 5).
0 5 10 15 20 25 30 35 40 45 50 55 60 65 70 75
250 300 350 400 450 500 550 600 650
P content (µm
ol g-‐1)
pyrolysis highest treatment temperature ºC
Corn-‐BC
Oak-‐BC

APPENDIX
33
Appendix figure 5: Mean calcium content of Corn-BC and Oak-BC. Error bars represent standard deviation, n=3. Data is compiled from a previous study [28].
The presence of Mg in biochar has been used to explain phosphate
sorption in anaerobically digested sugar beet tailings biochar [25] . Periclase
(MgO) was identified as a possible phosphate precipitation site and was shown
to have higher phosphate removal efficiency than biochar impregnated with
ferric hydroxide—a biochar pretreatment method that has been effective in
removing phosphate from water. Differences in Mg content of the Corn-BC and
Oak-BC are large across the HTT range (Appendix figure 6). For the temperature
range of this study, the Mg content of the Corn-350-BC and Corn-550-BC is 150
and 200 times the Mg content of Oak-350-BC and Oak-550-BC respectively.
0
50
100
150
200
250
300
350
250 300 350 400 450 500 550 600 650
Ca content (µmol g-‐1)
pyrolysis highest treatment temperature ºC
Corn-‐BC
Oak-‐BC

APPENDIX
34
Appendix figure 6: Mean magnesium content of Corn-BC and Oak-BC. Error bars represent standard deviation, n=3. Data is compiled from a previous study [28].
The functional group abundance can be represented generally by
elemental ratios of H:C (Appendix figure 7) and O:C (Appendix figure 8). These
ratios show that hydrogen (H) is in higher abundance than oxygen (O) in biochar
of both feedstocks. Both chars show a steep decrease in H:C and O:C ratios
between the HTT range 300 – 450 ºC, after which the values stabilize for higher
temperatures. Over this same range the fixed carbon content is increasing
(Appendix figure 9) which might be caused by loss of H and O in the form of
volatiles. Both the Corn-BC and Oak-BC have higher H:C and O:C ratios in the
350 ºC char than the 550 ºC char, which means lower temperature chars have
more functional groups. Using FTIR it was found that acidic carboxyl functional
0
50
100
150
200
250
300
350
400
450
250 300 350 400 450 500 550 600 650
Mg content (µm
ol g-‐1)
pyrolysis highest treatment temperature ºC
Corn-‐BC
Oak-‐BC

APPENDIX
35
groups decreased with temperature while hydroxyl groups increased with
temperature for corn and oak chars [29]. The percentage of O and H lost from
Oak-BC was more than that of Corn-BC. In both cases, change in the O:H ratios
is driven by the loss of oxygen (Appendix figure 10).
Appendix figure 7: Molar ratios of total hydrogen to total carbon for Corn-BC and Oak-BC. Data is compiled from a previous study [28].
Appendix figure 8: Molar ratios of total oxygen to total carbon for Corn-BC and Oak-BC. Data is compiled from a previous study [28].
0.0 0.1 0.2 0.3 0.4 0.5 0.6 0.7 0.8 0.9 1.0
250 300 350 400 450 500 550 600 650
H:C ratio
pyrolysis highest treatment temperature ºC
Corn-‐BC
Oak-‐BC
0.0
0.1
0.2
0.3
0.4
250 300 350 400 450 500 550 600 650
O:C ratio
pyrolysis highest treatment temperature ºC
Corn
Oak

APPENDIX
36
Appendix figure 9: Mean fixed carbon content of Corn-BC and Oak-BC. Fixed carbon equals [1- (% ash)- (% volatiles)]. Error bars represent standard deviation, n=3. Data is compiled from a previous study [28].
Appendix figure 10: O:H molar ratio for Corn-BC and Oak-BC with increasing HTT. Data is compiled from a previous study [28].
0%
10%
20%
30%
40%
50%
60%
70%
80%
250 300 350 400 450 500 550 600 650
Fixed carbon content (w
/w)
pyrolysis highest treatment temperature ºC
Corn-‐BC
Oak-‐BC
0.2
0.3
0.3
0.4
0.4
0.5
250 300 350 400 450 500 550 600 650
O:H
pyrolysis highest treatment temperature ºC
Corn
Oak
APPENDIX
37
Preliminary sorption experiments using SPF-BC
The BC was prepared by Alterna Biocarbon (Prince George, British
Columbia) from a mixture of softwoods (Spruce, Pine and Fir; referred to as
“SPF-BC”), which came from a chipped waste stream of the logging and sawmill
industry. The wood mixture was slow-pyrolyzed at 400º C. The sorption
experiments were performed at 24º C + 2º C with a Burrell wrist action shaker at
400 rpm. 0.5 g of BC was added to Corning 50 mL centrifuge tubes along with 50
mL of liquid (water or nutrient solution depending on experiment). The tubes
were shaken for 24 hours and then left quiescent for 24 hours before the
supernatant was filtered.
Ammonium sorption
Ammonium sorption was performed using ground SPF-BC with solution
concentrations ranging: 1; 10; 100; 1000; 10,000 mg NH4–N L-1. Equilibrium
concentrations were analyzed using the phenate colorimetric method [30].
Absorbance was measured at 640 nm on a Hewlett Packard diode array UV-Vis
spectrophotometer. Results were analyzed using the Freundlich isotherm model.
Strong sorption was observed with unwashed, ground SPF-BC. The data
fit the linearized Freundlich model well. The equation for the best fit line
through the data had an R2 value of 0.949, yielding a K*f value of 0.129 and an n
value of 1.423 (Figure 11). It was also confirmed that the solid to liquid ratio in
the sorption experiments was suitable for the ammonium concentration range.

APPENDIX
38
Figure 11: Ammonium sorption results using raw, ground SPF-BC. Data was linearized according to the Freundlich model: K*
f = 0.129, n = 1.423.
Nitrate sorption
Nitrate sorption was performed in triplicate using ground SPF-BC with
solution concentrations ranging: 1; 10; 100 mg NO3–N L-1. Nitrate concentrations
of the equilibrium solutions were calculated from measured light absorbance at
220 nm using a Hewlett Packard diode array UV-Vis spectrophotometer. An
interference correction was made by subtracting the sum of absorbance
measurements at 274 nm and 276 nm from the absorbance measured at 220 nm.
The equilibrium concentrations for the nitrate sorption experiments were
not distinctly different from the initial concentrations at 1 and 10 mg NO3-N L-1
(data not shown). The nitrate content at the low concentration samples was
y = 0.7025x -‐ 0.8888 R² = 0.94886 -‐2
-‐1.5
-‐1
-‐0.5
0
0.5
1
1.5
2
2.5
-‐1 0 1 2 3 4 5
log(q*) m
g NH4-‐N g BC-‐1 L
-‐1
log(Ce) mg NH4-‐N L-‐1

APPENDIX
39
difficult to determine using the UV-vis method because the BC released organic
compounds that interfered with the nitrate absorbance reading.
Phosphate sorption
Phosphate sorption was performed in triplicate using SPF-BC that had
been ground, rinsed and dried. The phosphate solution concentration was 100
mg L-1, in an electrolyte matrix of 0.03M NaCl (the electrolyte matrix was not
employed in later experiments). Equilibrium concentrations were analyzed
using the ascorbic acid colorimetric analysis. Absorbance was measured at 880
nm.
Phosphate concentrations in the equilibrium solutions were normalized
per mass SPF-BC, yielding a mean sorption value of 42.58 mMol PO4-P g-1 (+
31.65 SD). This shows that PO4-P sorption is possible with pre-rinsed, ground
SPF-BC (data not shown).

40
REFERENCES
1. Boesch, D.F., Causes and Cosequences of Nutrient Over-Enrichment of Coastal Waters. Proceedings of the 24th Annual Seminar on World Planetary Emergencies, 2002.
2. Nixon, S., Coastal marine eutrophication: a definition, social causes, and future concerns. Ophelia, 1995. 41: p. 199-219.
3. NOAA. Harmful Algal Blooms. 2010 June 07, 2010 [cited 2011 April 17]; Available from: http://oceanservice.noaa.gov/topics/coasts/hab/.
4. Micheli, F., Eutrophication, Fisheries, and Consumer-Resource Dynamics in Marine Pelagic Ecosystems. Science, 1999. 285: p. 1396-1398.
5. Seehausen, O., J. van Alphen, and F. Witte, Cichlid Fish Diversity Threatened by Eutrophication That Curbs Sexual Selection. Science, 1997. 277: p. 1808-1811.
6. Richardson, K., Harmful or Exceptional Phytoplankton Blooms in the Marine Ecosystem. Advances in Marine Biology, 1997. 31: p. 301-385.
7. Bates, S.S., et al., Controls on Domoic Acid Production by the Diatom Nitzschia pungens f. multiseries in Culture: Nutrients and Irradiance. Canadian Journal of Fisheries and Aquatic Sciences, 1991. 48: p. 1136-1144.
8. Cloern, J., Our evolving conceptual model of the coastal eutrophication problem. Marine Ecology Progress Series, 2001. 210: p. 223-253.
9. EPA. Watershed Assessment, Tracking & Environmental Results. 2011 April 17, 2011 [cited 2011 April 17]; Available from: http://iaspub.epa.gov/waters10/attains_nation_cy.control.
10. Gilinsky, E., Baker, M. G., Capacasa, J. M., King, E. S., An Urgent Call to Action – Report of the State-EPA Nutrient Innovations Task Group. Unites States Environmental Protection Agency, 2009.
11. Keiluweit, M., Nico, P. S., Johnson, M. G., Kleber, M., Dynamic Molecular Structure of Plant Biomass-Derived Black Carbon (Biochar). Environmental Science & Technology, 2010. 44: p. 1247-1253.
12. Lehmann, J., Bio-Energy in the Black. Frontiers in Ecology and the Environment, 2007. 5(7): p. 381-387.

41
13. Baldock, J. and R. Smernik, Chemical composition and bioavailability of thermally altered Pinus resinosa (Red pine) wood. Organic Geochemistry, 2002. 33: p. 1093-1109.
14. Nguyen, B.T., Lehmann, J., Hockaday, W. C., Joseph, S., Masiello, C., Temperature sensitivity of black carbon decomposition and oxidation. Environmental Science & Technology, 2010. 44: p. 3324-3331.
15. Bourke, J., et al., Do all carbonized charcoals have the same chemical structure? 2. A model of the chemical structure of carbonized charcoal. Ind. Eng. Chem. Res., 2007. 46: p. 5964-5967.
16. Lehmann, J., A handful of carbon. Nature, 2007. 447: p. 143-144.
17. Cornelissen, G., Haftka, J., Parsons, J., Gustafsson, Ö, Sorption to Black Carbon of Organic Compounds with Varying Polarity and Planarity. Environmental Science & Technology, 2005. 39: p. 3688-3694.
18. Lehmann, J., Silva, J. P., Steiner, C., Nehls, T., Zech, W., Glaser, B., Nutrient availability and leaching in an archaeological Anthrosol and a Ferralsol of the Central Amazon basin- fertilizer, manure and charcoal amendments. Plant and Soil, 2003. 249: p. 343-357.
19. Laird, D., et al., Biochar impact on nutrient leaching from a Midwestern agricultural soil. Geoderma, 2010. 158: p. 436-442.
20. Ding, Y., et al., Evaluation of Biochar Effects on Nitrogen Retention and Leaching in Multi-Layered Soil Columns. Water, Air, & Soil Pollution, 2010. 213(1-4): p. 47-55.
21. Mishra, P. and R. Patel, Use of agricultural waste for the removal of nitrate-nitrogen from aqueous medium. Journal of Environmental Management, 2009. 90(1): p. 519-522.
22. Kameyama, K., et al., Influence of sugarcane bagasse-derived biochar application on nitrate leaching in calcaric dark red soil, in Journal of Environmental Quality2011: doi:10.2134/jeq2010.0453.
23. Ohe, K., et al., Removal of nitrate anion by carbonaceous materials prepared by bamboo and coconut shell. Journal of Chemical Engineering of Japan, 2003. 36(4): p. 511-515.
24. Mitzua, K., et al., Removal of nitrate-nitrogen from drinking water using bamboo powder charcoal. Bioresource Technology, 2004. 95: p. 255-257.

42
25. Yao, Y., et al., Biochar derived from anaerobically digested sugar beet tailings: Characterization and phosphate removal potential. Bioresource Technology, 2011.
26. USEPA, Consolidated Concentrated Animal Feeding Operations (CAFO) Regulations, November 2008. The Clean Water Act, 33 U.S.C. 1251 1972 (Section 122).
27. U.S.C., Federal Water Pollution Control Act, U.S.E.P. Agency, Editor 1974, United States Congress.
28. Rajkovich, S., Enders, A., Hanley, K., Hyland, C., Zimmerman, A. R., Lehmann, J., Corn growth and nitrogen nutrition after additions of biochars with varying properties to a temperate soil. in revision, 2011.
29. Nguyen, B.T. and J. Lehmann, Black carbon decomposition under varying water regimes. Organic Geochemistry, 2009. 40(8): p. 846-853.
30. AWWA, Standard Methods for the Examination of Water and Wastewater: 4500-NH3 F. Phenate Method, 1999, American Water Works Assoc., American Public Health Assoc., Water Environment Federation.
31. Glaser, B., J. Lehmann, and W. Zech, Ameliorating physical and chemical properties of highly weathered soils in the tropics with charcoal - a review. Biology and Fertility of Soils, 2002. 35(4): p. 219-230.
32. Singh, B., Singh, B. P., Cowie, A. L., Characterisation and evaluation of biochars for their application as a soil amendment. Australian Journal of Soil Research, 2010. 48: p. 516-525.
33. Graber, E.R., et al., Biochar impact on development and productivity of pepper and tomato grown in fertigated soilless media. Plant and Soil, 2010. 337(1-2): p. 481-496.
34. Bridle, T.R., Pritchard, D., Energy and nutrient recovery from sewage sludge via pyrolysis. Water Science & Technology, 2004. 50(9): p. 169-175.
35. Kumar, K.V., et al., Hybrid isotherms for adsorption and capillary condensation of N2 at 77 K on porous and non-porous materials. Chemical Engineering Journal, 2010. 162: p. 424-429.
36. Shen, C., et al., Adsorption equilibria and kinetics of CO2 and N2 on activated carbon beads. Chemical Engineering Journal, 2010. 160: p. 398-407.

43
37. Stewart, M.L., Stencel, J. M., CO2 adsorption techniques on high surface area activated carbons. 1992(40511-8433).
38. Pribil, A.B., et al., Structure and Dynamics of Phosphate Ion in Aqueous Solution: An Ab Initio QMCF MD Study. Journal of Computational Chemistry, 2008. 29: p. 2330-2334.
39. Skopp, J., Derivation of the Freundlich Adsorption Isotherm from Kinetics. Journal of Chemical Education, 2009. 86(11): p. 1341-1343.
40. Tansel, B., et al., Significance of hydrated radius and hydration shells on ionic permeability during nanofiltration in dead end and cross flow modes. Separation and Purification Technology, 2006. 51: p. 40-47.
41. Silber, A., Levkovitch, I., Graber, E. R., ph-dependent mineral release and surface properties of cornstraw biochar: agronomic implications. Environmental Science and Technology, 2010. 44: p. 9318-9323.
42. Nakata, P., Advances in our understanding of calcium oxalate crystal formation and function in plants. Plant Science, 2003. 164(6): p. 901-909.
43. Libert, B., Franceschi, V. R., Oxalate in crop plants. J. Agric. Food Chem., 1987. 35: p. 926-938.
44. Zeebe, R.E., Wolf-Gladrow, Dieter, CO2 in Seawater - Equilibrium, Kinetics, Isotopes, 2001, Elsevier.
45. Knovel, Knovel Critical Tables (2nd Edition), 2003, Knovel.
46. Cheng, C., et al., Oxidation of black carbon by biotic and abiotic processes. Organic Geochemistry, 2006. 37(11): p. 1477-1488.
47. Liang, B., et al., Black Carbon Increases Cation Exchange Capacity in Soils. Soil Science Society of America Journal, 2006. 70(5): p. 1719.
48. Tatlier, M., Sebatakar, A. E., Method to Evaluate the Fractal Dimensions of Solid Adsorbents. Journal of Physical Chemistry, 1999. 103: p. 4360-4365.
49. Cheng, C.-H., J. Lehmann, and M.H. Engelhard, Natural oxidation of black carbon in soils: Changes in molecular form and surface charge along a climosequence. Geochimica et Cosmochimica Acta, 2008. 72(6): p. 1598-1610.
50. Cheng, C.-H. and J. Lehmann, Ageing of black carbon along a temperature gradient. Chemosphere, 2009. 75(8): p. 1021-1027.
44
51. Borizover, M.D., Graber, E. R., Organic compound sorption enthalpy and sorption mechanisms in soil organic matter. Journal of Environmental Quality, 1998. 27(2).
52. Cao, X., Harris, W., Carbonate and magnesium interactive effect on calcium phosphate precipitation. Environmental Science and Technology, 2008. 42: p. 436-442.
53. van der Houwen, J.A.M., et al., The effect of organic ligands on the crystallinity of calcium phosphate. Journal of Crystal Growth, 2003. 249(3-4): p. 572-583.
54. Ferguson, J.F., McCarty, P. L., Effects of carbonate and magnesium on calcium phosphate precipitation. Environmental Science and Technology, 1971. 5(6): p. 534-540.
55. Cao, X., et al., Inhibition of calcium phosphate precipitation under environmentally-relevant conditions. Science of The Total Environment, 2007. 383(1-3): p. 205-215.
56. Josan, M.S., Nair, V. D., Harris, W. G., Herrera, D., Associated release of magnesium and phosphorus from active and abandoned dairy soils. Journal of Environment Quality, 2005. 34: p. 184-191.
57. Rondon, M.A., et al., Biological nitrogen fixation by common beans (Phaseolus vulgaris L.) increases with bio-char additions. Biology and Fertility of Soils, 2006. 43(6): p. 699-708.