Ammonia Wastewater Treatment by Immobilized Activated … · Ammonia Wastewater Treatment by...
74
i Project Number: DDB0848 Ammonia Wastewater Treatment by Immobilized Activated Sludge A Major Qualifying Project submitted to the Faculty of the WORCESTER POLYTECHNIC INSTITUTE in partial fulfillment of the requirements for the Degree of Bachelor of Science Sponsoring Agency: Shanghai Jiao Tong University Shanghai, China Project Center By: ________________________ Cei Ping Wu Date: April 16, 2010 Approved by: ______________________________________ Project Advisor: David DiBiasio, WPI Professor ______________________________________ Project Co-advisor: Susan Zhou, WPI Professor
Transcript of Ammonia Wastewater Treatment by Immobilized Activated … · Ammonia Wastewater Treatment by...

i
Project Number: DDB0848
Ammonia Wastewater Treatment by Immobilized Activated Sludge
A Major Qualifying Project
submitted to the Faculty of the
WORCESTER POLYTECHNIC INSTITUTE
in partial fulfillment of the requirements for the
Degree of Bachelor of Science
Sponsoring Agency: Shanghai Jiao Tong University
Shanghai, China Project Center
By:
________________________
Cei Ping Wu
Date: April 16, 2010
Approved by:
______________________________________
Project Advisor: David DiBiasio, WPI Professor
______________________________________
Project Co-advisor: Susan Zhou, WPI Professor

ii
Abstract
The increase in urbanization has created the need for proper management and treatment of
wastewater. The activated sludge process is an alternative method to treat high strength ammonia
wastewater. In this project, the effect of temperature and the nitrification performances in
treating ammonia wastewater by immobilized activated sludge in both batch culture and
continuous mode methods were examined. Batch culture operated at higher temperature had a
positive effect on the reduction of ammonia concentration by 75% of a specific sample.

iii
Acknowledgements
I would like to thank the people from the School of Environmental Science and
Engineering at Shanghai Jiao Tong University in providing me assistance and guidance
throughout the project. I would specially like to express my gratitude to my advisor at Shanghai
Jiao Tong University, Professor Xiangli Qiao, who was very helpful in assisting me in any
problem encountered in the experiment as well as answering my doubts about the project.
Finally, I would like to acknowledge my project advisor, Professor David DiBiasio in providing
guidance throughout this MQP.

iv
Table of Contents
Title Page…………………………………………………………...……………………………...i
Table of Contents…………………………………………………………………..…..................iv
Abstract ........................................................................................................................................... ii
Acknowledgements ........................................................................................................................ iii
Table of Tables .............................................................................................................................. vi
Table of Equations ......................................................................................................................... vi
Table of Figures ............................................................................................................................ vii
1.0 Introduction ............................................................................................................................... 1
2.0 Background ............................................................................................................................... 3
2.1 Activated Sludge Process: ..................................................................................................... 3
2.1.1 Types of Activated Sludge Processes ............................................................................ 9
2.1.1.1 Single Stage Process ................................................................................................... 9
2.1.1.2 Two Stage Process .................................................................................................... 10
2.1.2 Aeration Systems ......................................................................................................... 12
2.1.3 Nitrification and Denitrification .................................................................................. 14
2.2 Immobilization of Cells in Wastewater Treatment: ............................................................ 15
2.2.1 Types of Immobilization Techniques .......................................................................... 17
2.2.2 Advantages and Disadvantages of the Immobilization System ................................... 18
2.3 Ultraviolet Technology in Wastewater Treatment:............................................................. 19
2.3.1 Low Pressure Lamp UV Technology .......................................................................... 20
2.3.2 Medium Pressure Lamp UV Technology .................................................................... 21
2.3.3 Advantages and Disadvantages of Using UV Technology .......................................... 23
2.3.4 UV Technology in China ............................................................................................. 24
3.0 Methodology ........................................................................................................................... 26
3.1 Preparation of the Immobilized Pellets ............................................................................... 26
3.2 Purpose of the Experiment .................................................................................................. 27
3.3 Pre laboratory Procedure..................................................................................................... 28
Set Up Procedure .................................................................................................................. 28
v
Preparation of Synthetic Ammonia Wastewater ................................................................... 31
Preparation of 1mol/L of HCl ............................................................................................... 32
Preparation of H3NO3S ......................................................................................................... 32
Preparation of Na2 [Fe(CN)5NO] * 2H2O Reagent............................................................... 32
3.4 Preparation of Batch Aeration – Method: Batch Culture.................................................... 33
Preparing concentrations ....................................................................................................... 34
Using UV Spectrophotometer ............................................................................................... 34
Analyzing Concentrations ..................................................................................................... 35
3.5 Preparation of Continuous Aeration – Method: Continuous Mode .................................... 37
Hydraulic Retention Time (HRT) ............................................................................................. 39
Total Organic Compound (TOC) and Total Nitrogen (TN) ..................................................... 40
4.0 Results and Discussion ........................................................................................................... 41
4.1 Batch Culture ...................................................................................................................... 41
4.2 Continuous Mode ................................................................................................................ 45
4.3 Effect of a Carbon Compound ............................................................................................ 47
4.4 Total Nitrogen (TN) ............................................................................................................ 49
5.0 Conclusions ............................................................................................................................. 51
6.0 Recommendations ................................................................................................................... 54
6.1 Evaluate TOC in Batch Culture .......................................................................................... 54
6.2 Further Continuous Mode Analysis .................................................................................... 54
6.3 Test All Samples of Activated Sludge Pellets in Both Methods ........................................ 55
7.0 References ............................................................................................................................... 56
8.0 Appendix ................................................................................................................................. 58
8.1 Appendix A – Batch Culture Data ...................................................................................... 58
8.1.1 Batch Culture at 27oC .................................................................................................. 58
8.1.2 Batch Culture at 32oC .................................................................................................. 62
8.2 Appendix B – Continuous Mode Data ................................................................................ 66
8.2.1 Continuous Mode at 30oC ............................................................................................ 66
8.2.2 Continuous Mode at 32oC ............................................................................................ 67

vi
Table of Tables
Table 1 Four Elements in Activated Sludge Plant .......................................................................... 9
Table 2 Activated Sludge Processes ............................................................................................. 11
Table 3 Advantages and Disadvantages of the Immobilization System ....................................... 19
Table 4 Dosage for 90% Inactivation of Selected Microorganisms by UV ................................. 21
Table 5 Advantages and Disadvantages of Using UV Disinfection ............................................. 24
Table 6 Nitrification Performances of Sample 02 ........................................................................ 45
Table 7 TOC in Continuous Mode................................................................................................ 49
Table 8 TN in Continuous Mode .................................................................................................. 50
Table 9 Batch Culture at 27 C Raw Data ...................................................................................... 58
Table 10 Batch Culture at 27 C Concentrations ........................................................................... 59
Table 11 Batch Culture at 32 C Raw data ..................................................................................... 62
Table 12 Batch Culture at 32 C Concentrations ........................................................................... 63
Table 13 Continuous Mode Sample 02 at 30 C Raw Data ........................................................... 66
Table 14 Continuous Mode Sample 02 at 32 C Raw Data ........................................................... 67
Table of Equations
Equation 1 Net Growth of Biomass ................................................................................................ 7
Equation 2 Total Waste Activated Sludge Solids ........................................................................... 7
Equation 3 Nitrification Step 1 ..................................................................................................... 14
Equation 4 Nitrification Step 2 ..................................................................................................... 15
Equation 5 Nitrification Final Step ............................................................................................... 15
Equation 6 Denitrification............................................................................................................. 15
Equation 7 Inactivation of Pathogens by UV ............................................................................... 20
Equation 8 Calculation for Substance's Weight ............................................................................ 31
Equation 9 Calculation for 1 mol/L of HCL ................................................................................. 32
Equation 10 Calculation for Mass of 0.8% of H3NO3S ................................................................ 32
Equation 11 NH4+ Concentration .................................................................................................. 36
Equation 12 NO2- Concentration .................................................................................................. 37
Equation 13 NO3- Concentration ................................................................................................... 37
Equation 14 Hydraulic Retention Time (HRT) Calculation ......................................................... 39

vii
Table of Figures
Figure 1 Schematic of the Wastewater Treatment .......................................................................... 5
Figure 2 Activated Sludge Process Treatment Plant....................................................................... 6
Figure 3 Conventional Activated Sludge Process ........................................................................... 7
Figure 4 Flow Diagram of a Typical Activated Sludge System ..................................................... 8
Figure 5 Schematic of Single Stage Activated Sludge Process .................................................... 10
Figure 6 Schematic of Two Stage Activated Sludge Process ....................................................... 10
Figure 7 Schematic of the Continuous-Flow Stirred-Tank Process.............................................. 13
Figure 8 Schematic of Pure Oxygen Process ................................................................................ 14
Figure 9 Set Up of Aeration System ............................................................................................. 29
Figure 10 Up-Flow Aeration Bioreactors ..................................................................................... 29
Figure 11 Schematic of Set Up for Continuous Mode Method .................................................... 30
Figure 12 Standard Curve for NH4+ - N ........................................................................................ 36
Figure 13 Standard Curve for NO2- - N ........................................................................................ 36
Figure 14 Standard Curve for NO3- - N......................................................................................... 37
Figure 15 Aeration System Set Up for Continuous Mode ............................................................ 39
Figure 16 Batch Culture - Ammonia Concentration at 27 C ........................................................ 42
Figure 17 Batch Culture - Ammonia Concentration at 32 C ........................................................ 43
Figure 18 Batch Culture - Effect of Temperature in Sample 02 ................................................... 44
Figure 19 Continuous Mode - Effect of Temperature in Sample 02 ............................................ 46
Figure 20 Batch Culture - Sample 06 Concentrations at 27 C ...................................................... 48
Figure 21 Batch Culture - Sample 06 Concentration at 32 C ....................................................... 48
Figure 22 Batch Culture - Sample 02 Concentration at 27 C ....................................................... 60
Figure 23 Batch Culture - Sample 04 Concentration at 27 C ....................................................... 60
Figure 24 Batch Culture - Sample 05 Concentrations at 27 C ...................................................... 61
Figure 25 Batch Culture - Sample 06 Concentrations at 27 C ...................................................... 61
Figure 26 Batch Culture - Sample 02 Concentrations at 32 C ...................................................... 64
Figure 27 Batch Culture - Sample 05 Concentrations at 32 C ...................................................... 64
Figure 28 Batch Culture - Sample 06 Concentrations at 32 C ...................................................... 65
Figure 29 Batch Culture - Sample 04 Concentrations at 32 C ...................................................... 65
Figure 30 Continuous Mode - Sample 02 Concentrations at 30 C ............................................... 66
Figure 31 Continuous Mode - Sample 02 Concentrations at 32 C ............................................... 67

1
1.0 Introduction
One of the many byproducts of civilization is waste. Waste arises from households,
industrial factories, and other facilities. To purge the unwanted wastes, sewage systems were
created in populated areas. Sewage systems wash down the waste with water, disposing the
resulting wastewater in the desired locations.
The increase in population and the expansion of cities have led to a greater disposal of
wastewater into the environment. Improper disposal of wastewater has led to outbreaks of
disease arising from wastewater in many parts of the world. These outbreaks increased the need
for wastewater management and treatment, driving the demand for wastewater treatment to
higher levels. The spark in the demand for wastewater treatment led to new innovations in the
wastewater treatment field, creating new treatment technologies and system processes.
Eutrophication due to high levels of ammonia and nitrogen in wastewater is one of the
main environmental problems associated with the improper dispose of wastewater.
Eutrophication may further bring serious concerns such as the increase of chemical concentration
in the ecosystem, the aggravation of water quality, and consequently these risk animal and
human life (Qiao, Chen, & Zhang). One of the alternative methods to reduce eutrophication is
the use of the activated sludge process to treat wastewater. This method generates an activated
mass of microorganisms, which is used to stabilize wastes (McGraw-Hill ). Immobilization of
cells is another technique used for nitrogen removal in wastewater. The use of cell
immobilization in treating wastewater has been the solution to many problems encountered in
other types of wastewater treatment methods. This technology has a great impact on the
2
nitrification process, which result in an enhanced nitrification performance and consequently
improvements in water quality.
Researches point out some advantages and disadvantages of using only one technology to
treat wastewater. Three major breakthroughs were the creation of the activated sludge process,
immobilization of cells technique, and the use of ultraviolet technology in wastewater treatment.
However, all of these technologies have some disadvantages related to them. A more effective
wastewater treatment system is one that embraces different technologies and applies them with
the purpose to bring an effective solution to a problem. In this research, activated sludge, the
immobilization system and UV technology are used in order to treat synthetic ammonia
wastewater. Activated sludge was immobilized by UV technology in order to treat ammonia
wastewater.
The purpose of this research is to study the immobilization of activated sludge in poly
(ethylene glycol) by ultraviolet technology, its application in treating ammonia wastewater by
examining nitrification performances, and to analyze the effect of temperature in wastewater
treatment. Both batch culture and continuous mode methods were implemented for comparison
and observation of nitrification performances on the reduction of ammonia concentration.
Temperature was also manipulated in order to examine the effect of temperature in treating
ammonia wastewater using batch and continuous mode methods. Furthermore, total organic
compound (TOC), total nitrogen (TN) and the hydraulic retention time (HRT) were analyzed for
continuous mode method.
3
2.0 Background
In order to fully understand the effect of using immobilization of activated sludge in
polyethylene glycol by UV technology and its application in micro-polluted wastewater, it is
indispensable the study involving such technologies. This section covers the three main types of
technologies associated to the project proposal. Wastewater treatment technologies discussed
include activated sludge process, immobilization techniques and ultraviolet (UV) radiation
system.
2.1 Activated Sludge Process:
The increase in population and the development of new cities have created the need for
the proper management and treatment of wastewater. In the middle of the nineteenth century,
waterborne diseases were widespread in England causing many deaths (Bitton). These deaths
helped increase the awareness of microorganisms in diseases, creating a greater demand for
wastewater treatment. To meet this growing demand for wastewater treatment legislations were
passed to ensure and encourage proper treatment and disposal of wastewater with the
construction of wastewater treatment plants.
Wastewater can arise from both household sewage, and industrial wastes. For both cases
it is essential to treat the waste water before disposing in nature. The wastewater is further
classified as nontoxic or toxic wastes (Obayashi & Gorgan). Nontoxic wastes are mainly food
industry waste, and domestic sewage. While toxic wastes are from coal processing,
petrochemical, pesticide, pharmaceutical, and electroplating industries. These two types of

4
wastewater are treated differently, each one of them requiring various steps for the cleansing
process.
Treating wastewater is done by physical forces, chemical and biological processes
(Bitton). Physical forces treatment methods or unit operations include screening, sedimentation,
filtration, and flotation. Chemical and biological methods or unit processes include disinfection,
absorption, precipitation, degradation of organic matter, and removal of nutrients.
The wastewater treatment process objective is to reduce the organic content of
wastewater, remove or reduce nutrients, remove or inactivate pathogenic microorganisms and
parasites (Bitton). To achieve these objectives, there are four major steps that should be taken:
1. Preliminary treatment. The objective of this operation is to remove debris
and coarse materials that may clog equipment in the plant.
2. Primary treatment. Treatment is brought about by physical processes (unit
operations) such as screening and sedimentation.
3. Secondary treatment. Biological (e.g.,activated sludge, trickiling filter,
oxidation ponds) and chemical (e.g., disinfection) unit processes are used to
treat wastewater. Removal of nutrients also generally occurs during
secondary treatment of wastewater.
4. Tertiary or advanced treatment. Unit operations and chemical unit
processes are used to further remove BOD, nutrients, pathogens and
parasites, and sometimes toxic substances.
(Bitton)
A schematic of the wastewater process is shown below:

5
Figure 1 Schematic of the Wastewater Treatment
(Earthpace)
The process of activated sludge first started in England in 1914 by Ardern and Lockett
and then this idea was spread worldwide (Bitton). This new method of treating wastewater was
known as activated sludge since this process generated an activated mass of microorganisms,
which was used in stabilizing a waste (McGraw-Hill ). Activated sludge is a suspended-growth
process that consists of aerobic treatment that oxidizes organic matter to CO2 and H2O, NH4, and
new cell biomass. It is commonly used as a secondary biological treatment for domestic
wastewaters. Activated sludge process includes an aeration tank, sedimentation tank, mixed-
liquor suspended solids (MLSS), mixed liquor volatile suspended solids (MLVSS), and can
furthermore be used to calculate the food-to-microorganism ratio, hydraulic retention time
(HRT), and sludge age (Bitton). Figure 2 below is a picture of a wastewater treatment plant
where the activated sludge process is implemented.

6
Figure 2 Activated Sludge Process Treatment Plant
(McGraw-Hill )
The activated sludge process is a system used for the treatment of sewage and industrial
wastewaters that involves the mixture of biological mass and wastewater. In activated sludge
process, organic waste is fed to the system and leaves the process depending on the desired
treatment efficiency set by the operator. The process begins by mixing the biological waste
present in industrial wastewater or sewage with an aerobic bacterial culture in the reactor and air
(Eckenfelder). This mixture is known as the mixed liquor. Once in the reactor, the mixed liquor
is aerated for a particular period of time in order to ensure that this solution is fully mixed
(McGraw-Hill ). Furthermore, this mixture undergoes separation through the gravity clarifier,
where the waste activated sludge is removed from the treatment and mixed with primary treated
wastewater before it is recycled back to the beginning of the process in order to maintain the
desired concentration of organisms and sludge (Eckenfelder). Lastly, the sludge goes through

7
further treatment and the result of all this process is the treated wastewater that can be safely
disposed to nature. This process is illustrated in Figure 3 below.
Figure 3 Conventional Activated Sludge Process
(McGraw-Hill )
When choosing the activated sludge process for wastewater treatment, special attention
needs to be paid for the amount of substrate removal such as the biological oxygen demand
(BOD) and chemical oxygen demand (COD). Other essential variables include mass of
microorganisms in the system and the non-biodegradable inert suspended solids in the influent to
the system (Turovskiy & Mathai). A relationship can be established between these variables in
the following equations:
Equation 1 Net Growth of Biomass
𝑃𝑥 = 𝑌 𝑆0 − 𝑆 − 𝑘𝑑𝑋
Equation 2 Total Waste Activated Sludge Solids
𝑊𝐴𝑆 = 𝑃𝑥 + 𝐼0 − 𝐸𝑡
Where:
Px = net growth of biomass expressed as volatile suspended solids (VSS), kg/d or lb/d
Y = gross yield coefficient, kg/kg or lb/lb
S0 = influent substrate (BOD or COD), kg/d or lb/d

8
S = effluent substrate (BOD or COD), kg/d or lb/d
kd = endogenous decay coefficient, d-1
X= biomass in aeration tank (MLVSS), kg or lb
WAS = total waste activated sludge solids, kg/d or lb/d
I0= influent nonvolatile suspended solids, kg/d or lb/d
Et = effluent suspended solids, kg/d or lb/d
(Turovskiy & Mathai)
Figure 4 shows how these variables are related in an activated sludge process.
Figure 4 Flow Diagram of a Typical Activated Sludge System
(Turovskiy & Mathai)
The activated sludge method is applicable to a series of specific wastewater treatment
procedures. One application of this method is on treating high strength ammonia wastewater.
The treatment of high strength ammonia wastewater is crucial to the environment since improper
treatment may bring serious environmental problems or eutrophication, which results from the
increase of chemical concentration in the ecosystem thus endangering animal life and affecting
water quality significantly (Qiao, Chen, & Zhang). Researches including cost balance analysis

9
and efficiency suggest that the activated sludge process is a favorable method since it provides
high efficiency and low cost (Qiao, Chen, & Zhang).
2.1.1 Types of Activated Sludge Processes
The activated sludge is characterized into two different processes: single-stage and two-
stage processes. In both processes, four key elements are essential and if any of them
malfunction, the whole process may be put in jeopardy. This is further explained in the table
below:
Table 1 Four Elements in Activated Sludge Plant
An aeration tank equipped with appropriate aeration equipment, in which the
biomass is mixed with wastewater and supplied with oxygen.
A final clarifier, in which the biomass is removed from the treated wastewater
by settling or other means.
Continuous collection of return sludge and pumping it back into the aeration
tank.
Withdraw of excess sludge to maintain the appropriate concentration of
mixed liquor.
(Kayser)
2.1.1.1 Single Stage Process
The single stage process draws its history back to 1910, when the concept of the aeration
technique in treating wastewater was first introduced. In this process, wastewater undergoes
aeration for a specific period with regular stops, so that the suspended wastewater may settle and
more wastewater can be added to the system before aeration starts again (Kayser). This cycle is
repeated until the effluent is fully nitrified and a desired amount of activated sludge or settled

10
sludge is achieved. This whole process may take about six hours for total completion (Kayser).
The diagram (Figure 5) shows a conventional mode for an activated sludge plant:
Figure 5 Schematic of Single Stage Activated Sludge Process
(Kayser)
2.1.1.2 Two Stage Process
Two stage process implements the idea proposed by the single stage process in addition
to adding a second activated sludge plant to the system. Basically, the two stage process is a
combination of two independent activated sludge plants which work in series (Kayser). It is
designed in such a way that the first activated sludge plant has a higher sludge loading rate
(F/M), since it also receives excess sludge from the second stage, on the other hand, the second
plant has a lower sludge loading rate (F/M) (Kayser). Figure 6 is a flow diagram of the two stage
process.
Figure 6 Schematic of Two Stage Activated Sludge Process
(Kayser)

11
The two stage process has some advantages when comparing it to the single stage
process. Since it contains two independent activated sludge plants, it is more efficient in
removing harmful substances. These substances are mostly removed in the first stage and if any
trace is left, it can be completely removed in the second stage. Removal of harmful substances is
extremely important in the treatment of industrial wastewater. In addition to this, bulking sludge
formation is rarely noticed and high sludge age microorganism may facilitate the removal of
biodegradable organisms and also oxidize ammonia (Kayser).
Since the creation of the original activated sludge process, several other processes are
used today. These different versions of activated sludge systems according to specific uses are
listed in Table 2:
Table 2 Activated Sludge Processes
Type Common Name Use
Aerobic processes:
Suspended growth –
Activated sludge
processes
Conventional (plug
flow)
Carbonaceous BOD
removal (nitrification)
Continuous – flow
stirred tank
Step aeration
Pure oxygen
Modified aeration
Contact stabilization
Extended aeration
Oxidation ditch
(McGraw-Hill )

12
2.1.2 Aeration Systems
There are innumerous types of aerators adapted to activated sludge processes. Some of
the different types of aeration systems include the conventional, continuous-flow stirred-tank and
pure oxygen processes.
Conventional
The conventional activated sludge process is the simplest process described earlier in the
activated sludge process section. Equipments used in this system include an aeration tank, where
influent wastewater and recycled sludge are mixed, a secondary clarifier and a sludge recycle
line (McGraw-Hill ). Plug flow with cellular recycle model is applied, where both the influent
wastewater and the recycled sludge are aerated for a time period of six hours (McGraw-Hill ).
Continuous-flow stirred-tank
In the continuous-flow stirred-tank process, the influent wastewater and the return sludge
pass through several parts of the aeration tank. The mixed liquor is also aerated, which helps to
balance the organic load in the system (McGraw-Hill ). When the influent wastewater and the
return sludge exit the tank, they are deposited into the activated sludge the settling tanks. Figure
7 below is a schematic of the continuous-flow stirred-tank activated sludge process.

13
Figure 7 Schematic of the Continuous-Flow Stirred-Tank Process
(McGraw-Hill )
Pure oxygen
The pure oxygen system uses a series of covered continuous-flow stirred-tank reactors,
where oxygen is constantly circulating throughout the process. The idea of using pure oxygen
instead of air, as it was implemented in traditional activated sludge process, was adopted by
several treatment plants since 1970 due to its high performance in treating wastewater (McGraw-
Hill ). In this process, carbon dioxide is released and more oxygen needs to be added depending
on how much oxygen the microorganisms need for their activity. Furthermore, Henry’s Law
suggests that given the mole fraction of oxygen above the liquid to be 0.8, the amount of oxygen
in the liquid needs to be four times the amount of air put in the traditional activated sludge
system (McGraw-Hill ). Figure 8 below is a schematic of pure oxygen activated sludge process
in series.

14
Figure 8 Schematic of Pure Oxygen Process
(McGraw-Hill )
2.1.3 Nitrification and Denitrification
Nitrate brings serious harms to the environment including eutrophication, humans and
drinking water. This concern was further reinforced with the development of technologies to
remove total nitrogen from wastewater (The Water Planet Company). Bacteria are used to
convert ammonia and nitrate to gaseous nitrogen, so that it can be released into the air.
Nitrification and denitrification processes are carried out in the wastewater treatment system to
remove nitrogen from wastewater (Kayser).
The biological conversion of ammonia to nitrogen gas can be accomplished by a two step
process in nitrification. The first step is to convert ammonia and ammonium to nitrite by the
bacteria Nitrosomonas and then the nitrite is converted to nitrate by the bacteria Nitrobacter
(U.S. Environmental Protection Agency (EPA)). Both of these bacteria work under an aerobic
environment. The overall reactions are shown below:
Equation 3 Nitrification Step 1
NH4+ + 1.5 O2 → NO2
- + H2O +2H
+

15
Equation 4 Nitrification Step 2
NO2- + 0.5 O2 → NO3
-
Equation 5 Nitrification Final Step
NH4+ + 2.0 O2 → NO3
- + H2O + 2H
+
(Kayser)
After the nitrate is formed, it undergoes denitrification to be reduced to nitrogen gas. This
process also involves the use of bacteria, however, it requires the dissolved oxygen (DO) level to
be near or equal to zero. The reaction for denitrification is shown below. It is important to note
that for a wastewater treatment plant that adopts the nitrification and denitrification processes to
be effective, there is a need to design a system that will specific sections for aerobic and
anaerobic processes.
Equation 6 Denitrification
2 NO3- + 2H
+ → N2+ H2O + 2.5 O2
(Kayser)
2.2 Immobilization of Cells in Wastewater Treatment:
Cell immobilization techniques for removing unwanted chemicals in wastewater have
been used since the 1980’s. Cells taken from the activated sludge are entrapped in a support
matrix where they go through the process of immobilization. This method has been studied in
laboratories and applied to a sewage treatment plant in the 1990’s, where immobilized cells were
used in the removal of nitrogen (Chen, Lee, Chi, & Houng).
One of the uses of the immobilization of cells technique in wastewater treatment is the
immobilization of activated sludge. Although the activated sludge process is seen as a favorable

16
wastewater treatment, there are also some disadvantages related to it. One of the negative points
in using activated sludge is that most of the times slow growing organisms such as nitryifiers and
anaerobic methane producers take long to be entrapped by the system. This process also requires
a greater biomass concentration for a higher efficiency to be attained. However, the result of
municipal wastewater treatment provides a much diluted feed stream with very low biomass
concentration. A solution to this problem is to use the cell immobilization system in activated
sludge process which will increase biomass retention time, thus enabling the reactor to achieve a
higher capacity and efficiency in the system (Chen, Lee, Chi, & Houng). Cell immobilization
process may also assist in eliminating unwanted elements in a wastewater treatment, in
facilitating a solid-liquid separation in a settling tank thus avoiding bulking (Chen, Lee, Chi, &
Houng).
The use of cell immobilization in treating wastewater has been the solution to many
problems encountered in other types of wastewater treatment methods. Some wastewater
treatment plants use the biological nutrients removal (BNR) process for nitrogen removal as it
brings water quality concerns. In BNR process, suspended biomass is used to remove organic
carbon from the wastewater entering the treatment process. Although some treatment plants
adopted this process since it is fairly economical, it has been noted that it brings several
limitations that affect the process’s efficiency (Chang, Kim, & Nam). One of the most alarming
concerns about using BNR process is that slow growing nitrifying bacteria require a long sludge
retention time (Chang, Kim, & Nam). A solution to this problem is to use immobilization
techniques since it was proven that this form of treating wastewater has brought many
contributions to the efficiency in wastewater treatment. Some of the positive features about the
immobilization system are that it maintains a high cell concentration, has a better solid-liquid

17
separation and is less sensitive to temperature (Chang, Kim, & Nam). All of these advantages
have a great impact on the nitrification process, which result in an enhanced nitrification and
consequently improvements in water quality.
2.2.1 Types of Immobilization Techniques
Cells can undergo the immobilization technique by either encapsulation, which is
sometimes known as entrapment, and attachment.
Immobilization by encapsulation has been mostly chosen for immobilization of living
cells. In this method, cells are immobilized with the use of porous polymeric materials such as
alginate, agar, polyacrylamide, carrageenan, cellulose acetate and poly-vinyl alcohol (PVA),
which is carried out by ionotropic or thermal gelation (Orive, Ponce, Hernandez, Gascon,
Igartua, & Pedraz) . Other materials used in encapsulation method also include polymer gels,
microcapsules, liposomes, hollow fibers and ultrafiltration membranes (Tanaka & Nakajima).
According to a study on the structure of the materials used in immobilization, “The porous
structure of polymers allows substrates and oxygen to diffuse into the internal pores where
nitrification is carried out by the entrapped cells” (Chang, Kim, & Nam). There is a wide range
of choices for materials that can be used in immobilization by encapsulation method; however,
PVA is the most used material. PVA is preferred over other materials since the freezing-thawing
method, a simple technique that does not require chemical initiation, can be applied (Serrano,
Palacio, Trevino, & Esparza). In freezing-thawing, the cross-linking procedure produces an
elastic and non-water-soluble hydrogel (Tanaka & Nakajima). If PVA is used in treating
wastewater with the encapsulation method, some physical stability requirements such as

18
solubility, biodegradability, diffusivity and mechanical stability, need to be met (Chang, Kim, &
Nam). Special consideration need to be made on the solubility of PVA to water since PVA is
considered to be hydrophilic.
The other type of immobilization is by attachment, which has been favored over
encapsulation for wastewater treatment. The attachment method involves the attachment of
biomass to porous support materials such as polyurethane foam and inorganic matrix (Chang,
Kim, & Nam). One advantage in using the attachment method is that are no need for chemical
additions. Although the attachment method has been preferred, the encapsulation method can
produce much higher cell concentrations and higher nitrification rates for PVA (Chang, Kim, &
Nam, 2005).
2.2.2 Advantages and Disadvantages of the Immobilization System
There are a list of advantages and disadvantages associated with the use of the
immobilized cell system in wastewater treatment. This is presented in Table 3 below. As it is
seen from the table, although there are a number of disadvantages in using this technology to
treat industrial/sewage water, the positive points about using it may overcome the limitations
defined in the disadvantages section. “Some of these limitations can be overcome, especially in
the case of immobilization of nonviable cells, where the cells are used mainly as sources of
catalysts in the bioconversion” (Tyagi & Vembu).

19
Table 3 Advantages and Disadvantages of the Immobilization System
Advantages Disadvantages
It allows the recycling of the
biological catalyzers
The undesirable side reactions
It allows the reactor to function
at very high cell concentration,
without rheological or mass
transfer limitations
Inhibition of certain metabolic
activities due either to product
accumulation or some toxic
substances accumulation
There is a decrease in the
metabolic regulation effect due
to product accumulation
The diffusional limitation of the
substrates, mainly those of high
molecular weight. This is one of
the major limitations in the case
of entrapped cells
A better utilization of the
substrate even at low
concentrations, thanks to the
localized concentration of
nutrients and hydrolytic
coenzymes at the support-
substrate/interface
The cell leaking from the solid
support
The possibility of using the cells
in their stationary phase where
only the metabolic chains are
active
(Tyagi & Vembu)
2.3 Ultraviolet Technology in Wastewater Treatment:
The Ultraviolet (UV) radiation system has been used to treat water by destroying
pathogens and bacteria found in wastewater. This system emits electromagnetic energy and
operates at low or medium pressure mercury lamps protected by a quartz tube layer (Bitton). UV
technology is classified into two main types: UV technology using low pressure lamp and UV
technology using medium pressure lamp with high or low intensities. For the low pressure lamp
technology, there is a monochromatic UV output of 254nm and the system involves an open

20
channel with immersed lamps in the water. On the other hand, for medium pressure lamp
technology, there is a polychromatic UV output of 185-400nm and consists of a closed pipe
system with lamps set along the treatment chamber (Berson UV-techniek). In general, UV
radiation travels with a wavelength of a peak of 265nm and penetrates the cell membrane of
pathogens, thus destroying their genetic material (DNA and RNA) and disabling them from
reproducing (U.S Environmental Protection Agency (EPA)).
2.3.1 Low Pressure Lamp UV Technology
Low pressure lamp UV technology designed in open channel has been preferred over
medium pressure lamp for a long time. For this type of system, UV radiation travels at the
germicidal wavelength of 2,537 A and inactivates the microbial organisms (Bitton). Inactivation
of pathogens by UV radiation is due to thymine dimerization, which destroys their DNA and
causes inefficiency for DNA to reproduce, thus avoiding them from spreading through the
effluent. This inactivation can be calculated using the following equation:
Equation 7 Inactivation of Pathogens by UV
𝑁
𝑁0= 𝑒−𝐾𝑃𝑑𝑡
Where:
N0=initial number of microorganisms (#/mL)
N= number of surviving microorganisms (#/mL)
K= inactivation rate constant (µW*s/cm2)
Pd = UV light intensity reaching the organisms (µW/cm2)
t= exposure time (s)
(Bitton)

21
According to the EPA, “the effectiveness of a UV disinfection system depends on the
characteristics of the wastewater, the intensity of UV radiation, the amount of time the microorganisms
are exposed to the radiation, and the reactor configuration” (U.S Environmental Protection Agency
(EPA)). Studies show that the efficacy of UV disinfection varies from types of pathogens and their
resistance to UV radiation. Their resistance can be classified as follows: protozoan cysts> bacterial
spores> viruses> vegetative bacteria (Bitton). This classification and further details on 90% of
inactivation of pathogens can be observed on Table 4:
Table 4 Dosage for 90% Inactivation of Selected Microorganisms by UV
Microorganism Dosage (µW-s/cm2)
Bacteria
E. coli 3,000
Salmonella typhi 2,500
Pseudomonas aeruginosa 5,500
Salmonella enteritis 4,000
Shigella dysenteriae 2,200
Shigella paradysenteriae 1,700
Shigella flexneri 1,700
Shigella sonnei 3,000
Staphylococcus aureus 4,500
Legionella pneumophila 380
Vibrio cholera 3,400
Viruses
Poliovirus 1 5,000
Coliphage 3,600
Hepatitis A virus 3,700
Rotavirus SA 11 8,000
Protozoan cysts
Giardia muris 82,000
Giardia lamblia 63,000
Acanthamoeba castellanii 35,000
(Bitton)
2.3.2 Medium Pressure Lamp UV Technology
Medium pressure lamps offer more advantages both economically and effectively than
low pressure lamps. For a long time low pressure lamps have being preferred and adapted to
wastewater treatment plants, however, new developments in medium pressure lamps are
22
changing this scenario. Since they are designed in compact closed-pipe system, they are much
easier to adapt to different environments and occupy less space than the designed open-pipe low
pressure lamp system (Berson UV-techniek). A small working space required is a crucial benefit
for medium pressure lamps since a large treatment plant is not needed. This reflects a plus in the
plant’s cost since a larger treatment plant will require more space and money to be invested.
Medium pressure lamps also produce higher UV intensity (15 to 20 times more) when compared
to low pressure lamps, which adds favorability over low pressure lamps (Berson UV-techniek).
With a higher germicidal UV intensity produced, disinfection is faster and fewer amounts of
lamps is needed, thus saving more on investments. Unfortunately, the disadvantage of a lamp
that has a higher intensity is that it also requires higher temperatures which lead to a higher
energy consumption (U.S Environmental Protection Agency (EPA)).
Other factors that favor medium pressure lamps include maintenance and design. Closed-
pipe medium pressure systems give better accessibility for workers to clean and to do
maintenance. These pipes are enclosed by a quartz layer, which needs to be cleaned from time to
time to avoid fouling and to ensure a high performance (Berson UV-techniek). For closed-pipe
systems, a mechanical wiper that moves up and down, which makes it very convenient and easy
to clean, is used. In open-channel system the same kind of cleaning aid cannot be used and
chemical cleaning is indispensable, which demands more investment and time (Berson UV-
techniek). For this type of system, personnel need to manually clean the lamps and remove them
for further cleaning in an acid bath, which poses a great danger in exposure to UV light (Berson
UV-techniek). In addition to a more favorable maintenance system, the design of a closed-pipe
system also provides a safer environment to the workers in the treatment plant due to an enclosed

23
system which may prevent people from being exposed to ultraviolet radiation (Berson UV-
techniek).
Studies show that medium pressure lamps are more efficient in destroying
microorganisms since they suggest that damages are irreversible after being treated by UV
technology compared to low pressure lamps where these microorganisms may regenerate
(Berson UV-techniek). Furthermore, low pressure lamps generally use amalgam lamp types,
which use electronic ballasts that need to be replaced at a regular basis since they were proven to
constantly give problems to the system (Berson UV-techniek). Taking into account that low
pressure lamp systems require a greater number of lamps to attain the same intensity provided by
medium pressure lamp system, failures in the electronic ballasts may increase the plant’s cost
exponentially. Moreover, researches show that low pressure lamps are not capable to perform
well when operated at the extremes high or low water temperatures and their hydraulic system is
not at its high performance, resulting in a not well dispersed UV radiation throughout the effluent
(Berson UV-techniek).
2.3.3 Advantages and Disadvantages of Using UV Technology
UV technology has advantages and disadvantages related to its effects in treating
wastewater. The following table from EPA Fact Sheet on ultraviolet disinfection summarizes the
main advantages and disadvantages of using UV technology.

24
Table 5 Advantages and Disadvantages of Using UV Disinfection
Advantages Disadvantages
• UV disinfection is effective at
inactivating most viruses, spores, and
cysts.
• Low dosage may not effectively
inactivate some viruses, spores, and
cysts.
• UV disinfection is a physical process
rather than a chemical disinfectant,
which eliminates the need to generate,
handle, transport, or store
toxic/hazardous or corrosive chemicals.
• Organisms can sometimes repair and
reverse the destructive effects of UV
through a "repair mechanism," known as
photo reactivation, or in the absence of
light known as "dark repair."
• There is no residual effect that can be
harmful to humans or aquatic life.
• A preventive maintenance program is
necessary to control fouling of tubes.
• UV disinfection is user-friendly for
operators.
• Turbidity and total suspended solids
(TSS) in the wastewater can render UV
disinfection ineffective. UV disinfection
with low-pressure lamps is not as
effective or secondary effluent with TSS
levels above 30 mg/L.
• UV disinfection has a shorter contact
time when compared with other
disinfectants (approximately 20 to 30
seconds with low-pressure lamps).
• UV disinfection is not as cost-effective
as chlorination, but costs are competitive
when chlorination dechlorination is used
and fire codes are met.
• UV disinfection equipment requires
less space than other methods.
(U.S Environmental Protection Agency (EPA))
2.3.4 UV Technology in China
UV Disinfection treatment technology, a clean technology with no unwanted by-
products, is common place in first world countries such as Europe and North America. The UV
treatment technology has been improving in China. China first installed a municipal UV system

25
in 2001, yet in eight years the number of UV system in China jumped from one to one hundred,
showing a rapid growth (Berson UV-techniek). UV disinfection treatment technology is mostly
used to remove harmful pathogen from the drinking water. Recent breakthroughs in the UV
technology have expanded the treatment to reduce pesticides and other contaminants from
underground water (Berson UV-techniek).

26
3.0 Methodology
The goal of this project is to examine the effect of temperature and nitrification
performances in treating ammonia wastewater using both batch culture and continuous mode
methods. Background research was essential for the understanding of the main technologies
related to this project: immobilization of cells, activated sludge and the use of ultraviolet
radiation in wastewater treatment. In order to carry on this research project, a methodology was
developed with the purpose to identify the details involved in the process of studying this
particular immobilization of activated sludge process. This chapter will focus on steps taken in
examining the nitrification performances in batch culture and continuous mode methods.
Furthermore, total organic compound (TOC), total nitrogen (TN) and the hydraulic retention
time (HRT) were analyzed for continuous mode method.
3.1 Preparation of the Immobilized Pellets
The immobilized pellets were prepared prior to the experiment under the described
procedure. Samples of concentrated activated sludge were collected from a municipal wastewater
treatment plant facility in Minhang, Shanghai and were used as the basis for immobilization.
After collection, a portion of the activated sludge, which represented approximately 4.8%, m/m,
was added in a polyethylene glycol (PEG) pre-polymer solution (14%, m/m). The PEG solution
contained a cross-linker N, N’-Methylenebisacrylamide (MBA) (0.5%, m/m). The specified

27
portion of activated sludge and the PEG solution were mixed thoroughly with a photo-initiator,
Benzoin Dimethyl Ether (0.1%, m/m)1. Afterwards, the mixture was immediately put under the
UV rays for 4 min to form an elastic gel. This gel was then solidified and cut into 3mm x 3mm x
3mm cubic pellets. After undergoing this process, the pellets were then known to be the
immobilized activated sludge pellets. These pellets were prepared with components to enable
them to undergo aeration. Their density was equivalent to 1.02 g/cm3, which facilitated their
suspension and movement in water while being aerated since it is only a little denser than water
(Qiao, Chen, & Zhang).
3.2 Purpose of the Experiment
The purpose of this experiment was to observe nitrification performances and the effect
of temperature using batch culture and continuous mode methods. This was accomplished by
first acclimating immobilized activated sludge pellets prepared prior to the experiment with 40
mg/l synthetic ammonia wastewater in a 250 ml up-flow aeration bioreactor in both batch culture
and continuous mode methods. Then, we examine ammonium nitrogen (NH4+-N), nitrite
nitrogen (NO2--N), and nitrate nitrogen (NO3
--N) by salicylic acid hypochlorite
spectrophotometer, N-(1-Naphthyl) ethylene diamine spectrophotometer and UV
spectrophotometer. These methods were used to determine trace amounts of nitrite in all water
samples tested. All reagents used to help in analyzing NH4+-N, NO2--N, NO3
--N were purchased
1 Professor Xiangli Qiao

28
from Shanghai chemical reagents Co., China and were directly used without any further
treatment.
3.3 Pre laboratory Procedure
This section addresses the required preparation of immobilized activated sludge prior to
analyzing the performances in treating ammonia wastewater in batch culture and continuous
mode.
Set Up Procedure
Four up-flow aeration bioreactors were set up for this experiment. Each of them
contained different kinds of immobilized activated sludge pellets (sample 02, sample 04, sample
05 and sample 06) and consequently they diverged in properties. The design of the reactors
included a double walled glass column, where the inside wall was filled with 10% (v/v) of
immobilized cell pellets which is approximately a volume of 250 ml (Refer to Figures 9 and 10).
Hot water circulated between the space between the outer and the inner wall (Urra, Sepulveda,
Contreras, & Palma). The hot water temperature was controlled by the temperature controllers
and was manipulated to observe different responses and the effect of temperature in treating the
synthetic ammonia wastewater. The system was oxygenated with a rate of dissolved oxygen
(DO) equal to 5.2 mg/L.
29
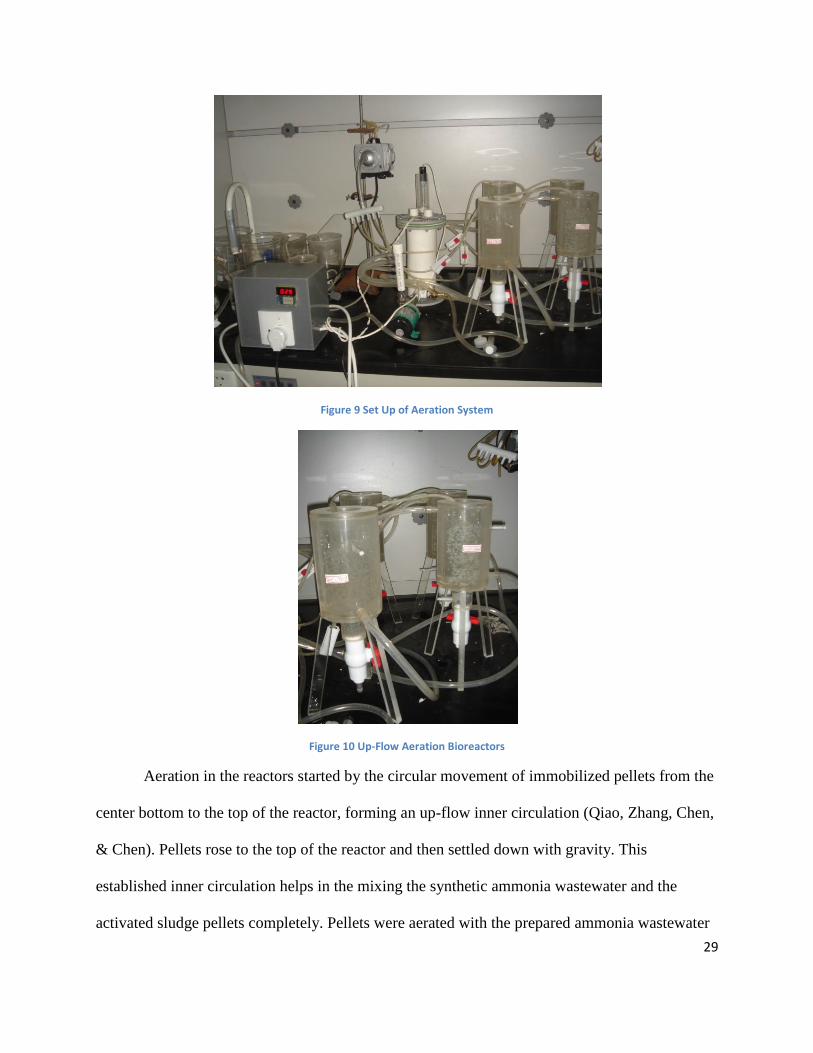
Figure 9 Set Up of Aeration System
Figure 10 Up-Flow Aeration Bioreactors
Aeration in the reactors started by the circular movement of immobilized pellets from the
center bottom to the top of the reactor, forming an up-flow inner circulation (Qiao, Zhang, Chen,
& Chen). Pellets rose to the top of the reactor and then settled down with gravity. This
established inner circulation helps in the mixing the synthetic ammonia wastewater and the
activated sludge pellets completely. Pellets were aerated with the prepared ammonia wastewater

30
for a specific amount of time and final treated wastewater was removed from the process from a
tube attached to the outside wall of the reactor.
In continuous mode method, there was an addition of a pump to the system. Since the
pump could only be attached to one reactor at a time, only one kind of activated sludge was
tested. The same set up was used; however, there was a tube attached to another outlet in the
outside wall of the reactor where the prepared wastewater could be pumped to the bioreactor. See
Figure 11 for continuous mode set up.
Figure 11 Schematic of Set Up for Continuous Mode Method
1. Feed tank
2. Pump
3. Bioreactor with immobilized pellets
4. Aeration
5. Temperature controller
6. Outlet (Effluent)
(Qiao, Zhang, Chen, & Chen)

31
Preparation of Synthetic Ammonia Wastewater
40 mg/L of Ammonia wastewater was prepared using the following steps:
1. Measure bucket volume using a 2 L beaker. Pour tap water 2 L of water into the beaker
and then transfer it to the bucket. Repeat this step five times until a total volume of 10 L
is obtained
a. Note: use distilled water for batch culture method and do not add glucose to the
synthetic ammonia wastewater
2. Mark the water level of 10 L in the bucket
3. Use the following table to calculate the appropriate weight for each substance:
Substance Density (mg/L) Weight (g)
NH4Cl 153.2 1.532
NaHCO3 468 4.68
Na2HPO4 * 12 H2O 46.4 0.464
NaCl 20.5 0.205
KCl 9.6 0.096
CaCl2 * 2 H2O 9.6 0.096
MgSO4 * 7 H2O 33.6 0.336
C6H12O6 25 0.25
Sample calculation for weight:
Equation 8 Calculation for Substance's Weight
𝑊𝑒𝑖𝑔𝑡 =𝐷𝑒𝑛𝑠𝑖𝑡𝑦
𝑉𝑜𝑙𝑢𝑚𝑒= 153.2
𝑚𝑔
𝐿∗ 10 𝐿 ∗ 10−3 = 1.532 𝑔
4. Weigh each substance using the digital scale and pour it into the bucket
5. Mix all substances in the bucket with a stirring rod until they are completely dissolved
6. Reserve the mixture

32
Preparation of 1mol/L of HCl
1. In order to prepare 1 mol/L of HCL, the following calculation was done:
Equation 9 Calculation for 1 mol/L of HCL
250 𝑚𝑙
12𝑚𝑜𝑙/𝐿= 20.8 𝑚𝑙
2. Pour 20.8 ml of pure HCl into a flask and complete the rest with distilled H2O so that the
total volume of the mixture is 250 ml
3. Mix it well and close the flask
Preparation of H3NO3S
1. Calculate the mass required for a 0.8 % of H3NO3S:
Equation 10 Calculation for Mass of 0.8% of H3NO3S
𝑀𝑎𝑠𝑠 = 200 𝑚𝑙 ∗ 0.08 = 1.6 𝑔
2. Clean the beaker with distilled water and fill it with 200 ml of distilled water
3. Pour it into a flask
4. Weigh 1.6 grams of H3NO3S, mix it with the water and pour it into the flask
5. Keep the mixture in the refrigerator
Preparation of Na2 [Fe(CN)5NO] * 2H2O Reagent
1. Mix 0.1grams of Na2[Fe(CN)5NO] * 2H2O with 10 ml of distilled water in a test tube
2. Wait for Na2[Fe(CN)5NO] * 2H2O to completely dissolve in water before using it

33
3.4 Preparation of Batch Aeration – Method: Batch Culture
1. With the four prepared immobilized cells samples, measure the volume of the solid
immobilized cells -> this was taken to be 30 ml in the graduated cylinder
2. Mix the immobilized cells with 230 ml of the prepared synthetic ammonia wastewater
(except the addition of glucose) and pour it to the set up system
3. Dissolved oxygen (DO) used was 5.2 mg/L
4. Turn on the switch to start aeration
5. Wait for 1 hour before taking samples
6. Take samples at different time periods (preferably every 2-3 hours)
Collecting samples:
1. Label three test tubes for each immobilized cell so that we can analyze the concentrations
of NH4+- N, NO2
- - N and NO3
- - N contained in each of them
2. Turn off aeration and let immobilized pellets settle down
3. Place a membrane paper on the syringe
4. Collect liquid sample and pass it three times through the membrane before pouring it to
the test tubes
5. Collect 1 ml of liquid sample with the syringe and pour it to the test tube
6. Repeat steps 4 and 5 to all four immobilized cells
7. After collecting a total of 12 liquid samples in the test tubes, turn on the aeration
Repeat this procedure in different time periods (40 min, 2 hours) to observe its behavior
until most of the ammonia is removed from the solution

34
Preparing concentrations
NH4+- N Concentration
1. Add 1 ml of salicylic acid with pipette to all test tubes labeled with NH4+- N
2. Add 3 drops of 0.35% NaClO
3. Add 2 drops of Na2[Fe(CN)5NO] * 2H2O. Note that Na2[Fe(CN)5NO] * 2H2O needs to
be prepared daily
4. Complete the test tube with distilled water until it reaches the 50 ml mark
5. Wait for 1 hour for reaction to take place
NO2- - N Concentration
1. Add 1 ml of color indicator for NO2- - N with pipette to all test tubes labeled with NO2
- -
N
2. Complete the test tube with distilled water until it reaches the 50 ml mark
3. Wait for 20 min for reaction to take place
NO3- - N Concentration
1. Add 1 ml of the prepared 1 mol/L of HCL with pipette to all test tubes labeled with NO3-
- N
2. Add 0.1 ml of the prepared 0.8% H3NO3S
3. Complete the test tube with distilled water until it reaches the 50 ml mark
Using UV Spectrophotometer
Use UV spectrophotometer to find absorptions for NH4+- N, NO2
- - N and NO3
- - N. For
both NH4+- N and NO2
- - N use the glass cuvette and for NO3
- - N, use the quartz cuvette. Make
sure to fill up to at least 2/3 of the cuvette and always have a blank sample with distilled water

35
for NH4+- N and NO2
- - N or 1 mol/L HCL dissolved in 50 ml of distilled water for NO3
- - N. For
NH4+- N set the wavelength to be 697 nm and for NO2
- - N use 540 nm. Measure two different
wavelengths (220 nm and 275 nm) for NO3- - N. Record the absorbencies acquired for all
samples and repeat the same process of collecting samples from the reactors until most of the
ammonia is removed from the system. This will happen when the values for NH4+- N come very
close to zero, which corresponds to absorbencies of 0.005 or less.
Repeat the same procedure in order to test two different temperatures (27oC and 32
oC) to
observe the effect of temperature in wastewater treatment using the batch culture method.
Analyzing Concentrations
With the absorbencies acquired from NH4+- N, NO2
- - N and NO3
- - N samples, use the
given standard curves for each nitrite and the equations of each specific curve to calculate
concentrations for all samples. The standard curves and equations below were used in order to
calculate concentrations for particular nitrites:

36
Figure 12 Standard Curve for NH4+ - N
In solving for concentration (x), with collected absorption values (y), this equation can be
rewritten as:
Equation 11 NH4+ Concentration
𝑥 =𝑦
1.0432+ 0.0068
Figure 13 Standard Curve for NO2- - N
Rewriting the equation in terms of concentration we have:
y = 1.0432x - 0.0068
0
0.1
0.2
0.3
0.4
0.5
0.6
0.7
0.8
0.9
0 0.2 0.4 0.6 0.8 1
Ab
sorp
tio
n (
nm
)
Concentration (mg/L)
NH4+ - N
y = 0.0555x - 0.0087
0
0.1
0.2
0.3
0.4
0.5
0.6
0 2 4 6 8 10 12
Ab
sorp
tio
n (
nm
)
Concentration (mg/L)
NO2- - N

37
Equation 12 NO2- Concentration
𝑥 =𝑦
0.0555+ 0.0087
Figure 14 Standard Curve for NO3- - N
Rewriting the equation in terms of concentration we have:
Equation 13 NO3- Concentration
𝑥 =𝑦
0.1229+ 0.0141
With the values for concentration a plot was obtained of time and concentrations for each
nitrite to compare/contrast the behaviors of the four different types of immobilized activated
sludge at different temperatures. A graph showing the effect of temperature was also obtained in
order to notice any difference in conducting the same experiment at different temperatures.
3.5 Preparation of Continuous Aeration – Method: Continuous Mode
For continuous mode, a pump was added to the system so that it would continuously feed
the reactor with the synthetic ammonia wastewater. The same system set up for batch culture
was used, however, there were some modifications since the pump could only feed one reactor at
y = 0.1229x - 0.0141
0
0.1
0.2
0.3
0.4
0.5
0.6
0 1 2 3 4 5
Ab
sorp
tio
n (
nm
)
Concentration (mg/L)
NO3- -N

38
a time for continuous mode and for batch culture four reactors were used in the same time. In
this method, the reactor containing the immobilized activated sludge pellets (sample 02) was
chosen since it was more effective in treating the synthetic ammonia wastewater due to its
relative high mechanical strength.
In this method, 40 mg/L of ammonia wastewater was prepared at a larger scale (10 liters)
since wastewater needs to be constantly feeding the reactor. For continuous mode, glucose was
added to the synthetic ammonia wastewater to observe the effect of an external carbon source in
the treatment. Note that the bucket with the prepared ammonia wastewater can never be empty.
The pump was set to work at 1.0 rpm and samples were collected daily instead of on an hourly
basis due to the fact that concentration did not vary as much as in batch culture method.
The same procedure for collecting samples, preparing concentrations, using the UV
spectrophotometer and analyzing concentration were repeated until most of the ammonia was
eliminated from the treated solution.
Based on the results from the batch culture method, I observed that I attain better results
when the bioreactor is set at a higher temperature. Therefore, two temperatures (30oC and 32
oC)
were tested to detect any differences and the effect of temperature in wastewater treatment.
39
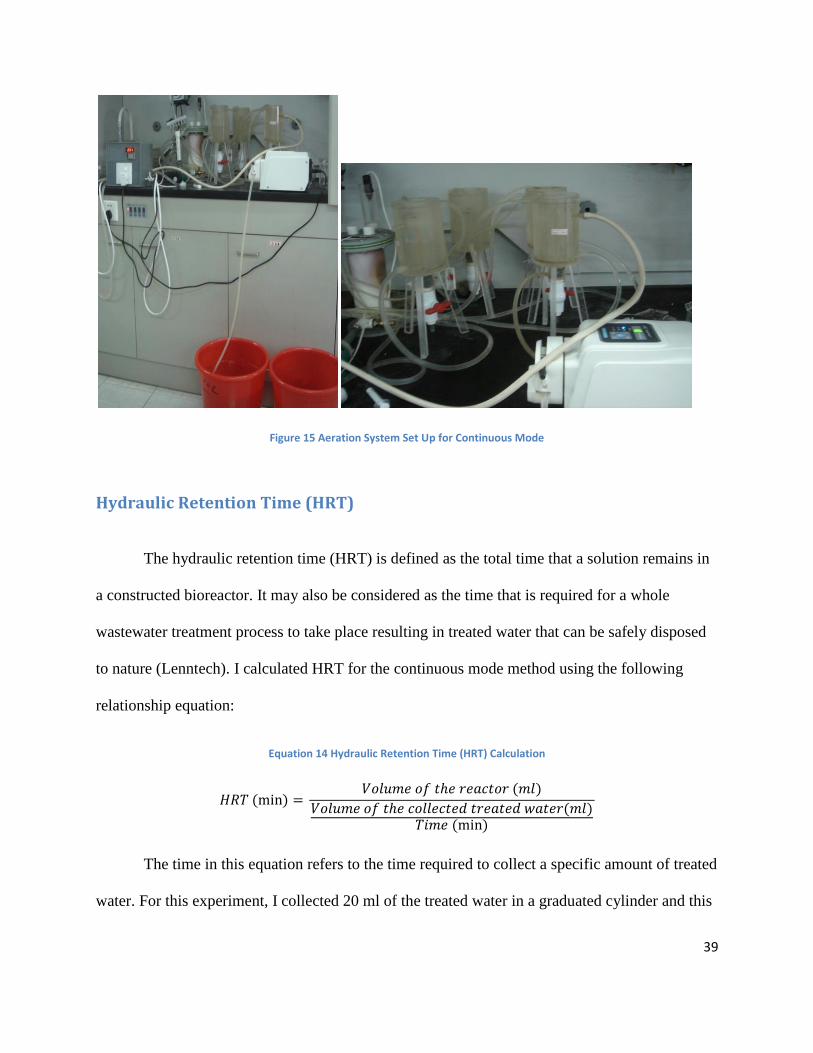
Figure 15 Aeration System Set Up for Continuous Mode
Hydraulic Retention Time (HRT)
The hydraulic retention time (HRT) is defined as the total time that a solution remains in
a constructed bioreactor. It may also be considered as the time that is required for a whole
wastewater treatment process to take place resulting in treated water that can be safely disposed
to nature (Lenntech). I calculated HRT for the continuous mode method using the following
relationship equation:
Equation 14 Hydraulic Retention Time (HRT) Calculation
𝐻𝑅𝑇 (min) = 𝑉𝑜𝑙𝑢𝑚𝑒 𝑜𝑓 𝑡𝑒 𝑟𝑒𝑎𝑐𝑡𝑜𝑟 (𝑚𝑙)
𝑉𝑜𝑙𝑢𝑚𝑒 𝑜𝑓 𝑡𝑒 𝑐𝑜𝑙𝑙𝑒𝑐𝑡𝑒𝑑 𝑡𝑟𝑒𝑎𝑡𝑒𝑑 𝑤𝑎𝑡𝑒𝑟(𝑚𝑙)𝑇𝑖𝑚𝑒 (min)
The time in this equation refers to the time required to collect a specific amount of treated
water. For this experiment, I collected 20 ml of the treated water in a graduated cylinder and this

40
corresponded to 7 minutes of collection. With all the values known, I was able to calculate the
HRT for continuous mode using the above equation:
𝐻𝑅𝑇 (min) = 250 𝑚𝑙
20𝑚𝑙7𝑚𝑖𝑛
𝐻𝑅𝑇 = 87.5 min ≅ 1.46 𝑜𝑢𝑟𝑠
Total Organic Compound (TOC) and Total Nitrogen (TN)
Total organic compound (TOC) and total nitrogen (TN) were analyzed in the continuous
mode method since there was an addition of glucose to the prepared synthetic wastewater. TOC
was measured and used as an indicator of water cleanliness and the treatment’s efficiency in
removing carbon from the synthetic wastewater fed to the system. TN was analyzed in order to
check if denitrification would take place in this experiment environment.
For TOC and TN analysis, 20 ml of the prepared synthetic wastewater and 20 ml of the
treated wastewater collected from the outlet of the bioreactor were collected into two test tubes
and taken to analysis in the laboratory.

41
4.0 Results and Discussion
In this section of the report, the information gathered in the experimental process is
further analyzed and discussed. The results and discussion are broken down into two sections
concerning the two conducted experiments using activated sludge to treat synthetic ammonia
wastewater. The first section refers to the process using the batch culture method and the second
section analyses the outcomes of the same process using the continuous mode method.
Temperature effect was also observed for both methods, since it reveled to be a key component
in the effectiveness of treating the synthetic ammonia wastewater. Furthermore, other
considerations such as the effect of carbon in the synthetic ammonia wastewater preparation, and
the total organic carbon (TOC) in the water after the aeration treatment were examined. All of
the raw data and graphs collected in the experiment can be found in the appendix section.
4.1 Batch Culture
The batch culture method treats a fixed amount of wastewater fed to the system and gives
a fast response to the treatment. Results vary very drastically within few hours of collection of
each sample and in less than 24 hours all samples had reduced their NH4+- N concentration to
nearly total. The hydraulic retention time (HRT) for a batch culture varies from 5 to 8 hours.
When the experiment was conducted at 27 o
C, sample 02, sample 05, sample 06 and sample 04
had an ammonia reduction of 84%, 89%, 95% and 98% respectively. The average percentage of
NH4+- N concentration reduction for these four samples was 91.5%, which is an excellent
amount of ammonia removal from the water. This shows that the method used was relatively
effective in treating the ammonia in the wastewater, therefore disposing water with almost fully

42
eliminated ammonia. Figure 16 below shows the behavior of ammonia reduction for batch
culture method operated at 27 o
C over a period of one day.
Figure 16 Batch Culture - Ammonia Concentration at 27 C
I conducted the same experiment at a higher temperature to compare and contrast the
results and to investigate if modifications in temperature had an effect on nitrification
performance. Figure 17 below shows the behavior of ammonia reduction for batch culture
method operated at 32 o
C over a period of one day. Comparing with the results at a lower
temperature, I observed that there was a greater decrease in ammonia concentration over the
same period of time. At 32 o
C sample 05 had an ammonia concentration reduction of 97.5%,
while sample 06, sample 02 and sample 04 had a reduction of 98.8 %. The average percentage of
NH4+- N concentration reduction for these four samples was 98.5%, which is very close to a
complete removal of ammonia.
0
5
10
15
20
25
30
35
40
45
0 5 10 15 20 25
Co
nce
ntr
atio
n (
mg/
L)
Time (hr)
Ammonia Concentration at 27 o C
Sample 02
Sample 04
Sample 05
Sample 06

43
Figure 17 Batch Culture - Ammonia Concentration at 32 C
All samples of immobilized activated sludge pellets had better results when the
temperature was increased to 32 o
C. The experiment conducted at a lower temperature showed a
difference of 8.5% of the ideal percentage of ammonia removal, however, when the temperature
was raised to 32 o
C, the difference was only of 1.5% of the ideal percentage. Figure 18 shows the
effect of temperature in sample 02. From this graph, one can observe that there is a significant
difference in ammonia removal when the temperature is raised.
0
5
10
15
20
25
30
35
40
45
0 5 10 15 20 25
Co
nce
ntr
atio
n (
mg/
L)
Time (hr)
Ammonia Concentration at 32 o C
Sample 02
Sample 04
Sample 05
Sample 06

44
Figure 18 Batch Culture - Effect of Temperature in Sample 02
Comparing the four samples of immobilized activated sludge pellets, sample 02 was had
a relatively high mechanical strength than the other samples and better outcomes in both
temperatures tested. Table 6 below is a condensed table just focusing only on the results of the
nitrification performance of immobilized cells acquired from sample 02 at 27 o C and 32
o C.
0
5
10
15
20
25
30
35
40
45
0 5 10 15 20 25
NH
4 + -
N C
on
cen
trat
ion
(m
g/L)
Time (hours)
Effect of Temperature in Sample 02
T = 27 C
T = 32 C

45
Table 6 Nitrification Performances of Sample 02
Sample 02 at 27o C All concentrations are in mg/L
Time (hours) NH4 concentration NO2 concentration NO3 concentration
0 40
1 28.95 3.16 20.23
2.35 23.54 18.62 10.06
5.45 20.95 29.53 5.59
8.05 17.5 37.7 5.18
22.15 6.43 25.89 57.26
Sample 02 at 32o C NH4 concentration NO2 concentration NO3 concentration
Time (hours)
0 40
1 16.64 12.25 0.705
2.8 14.77 28.62 25.52
5.8 9.25 31.34 37.73
22.8 0.483 5.89 58.06
4.2 Continuous Mode
The continuous mode method treats a large amount of wastewater, since water is being
constantly fed to the system, however, this process requires a longer time (sometimes it may take
several weeks) to treat all the ammonia in the wastewater. The nitrites responded very slowly to
this method and samples were taken in a daily basis instead of in an hourly basis as for batch
culture. Based on the results obtained using the batch culture method, I also varied temperature
to observe nitrification performance and I chose a higher temperature to start the experiment.
Unlike the batch culture method, in continuous mode ammonia reduction was very slow. When
the temperature was set at 30oC, it took more than a week for the NH4
+- N absorption to reduce
until it was almost 0.005 nm. Due to the limitation of time for the experiment, I stopped
collecting samples at 30oC when NH4
+- N absorption was about 0.1 nm. The same slow response

46
was obtained when the temperature was set to 32oC and nearly two weeks were needed for the
NH4+- N absorption to lower, however, ammonia was not completely removed from the water.
Figure 19 is a comparison between the results collected at 30oC and at 32
oC.
Figure 19 Continuous Mode - Effect of Temperature in Sample 02
As it is seen from Figure 19, ammonia reduction did not follow a trend such as in batch
culture. In continuous mode method, ammonia concentration increased and decreased over the
period of days. This fluctuation in concentration is expected since this is a long term method and
oscillation is predictable until concentration stabilizes and decreases. Unfortunately, stabilization
or acclimation was not fully achieved even after 8 days of experiment and unexpectedly
ammonia removal was more significant at a lower temperature (30oC) than at a higher
temperature (32oC). Even though stabilization was not fully achieved, Figure 19 points out that at
30oC ammonia concentration was perhaps beginning to stabilize, but more time was needed to
0
5
10
15
20
25
30
35
40
45
0 2 4 6 8 10 12
NH
4 +
-N
Co
nce
ntr
atio
n
Time (days)
Effect of Temperature in Sample 02
T = 30 C
T = 32 C

47
verify this hypothesis. For acclimation or stabilization to occur, the activated sludge pellets
should be adjusted or adapted to changes in the environment such as the variation of temperature.
In this particular experiment, the absorptions for NO2- - N, NO3
- - N and specially NH4
+- N need
to come to a value of 0.005 or less.
The efficiency of ammonia removal from the fed wastewater cannot be proven from these
two temperatures, since more time was needed in order to observe the behavior of the
immobilized activated sludge pellets given these conditions. The variation of ambient
temperature of ± 3 oC might also have influenced these results since the aeration used is an open
system and therefore very sensitive to outside temperature.
4.3 Effect of a Carbon Compound
The synthetic ammonia wastewater prepared was different for batch culture and
continuous mode methods. In continuous mode method, glucose was added as a carbon source to
observe if carbon plays an important role in the wastewater treatment used in this experiment. In
batch culture, there was no glucose in the prepared wastewater and possibly this was the cause
for NO3- - N curves to increase drastically compared to NH4
+- N and NO2
- - N curves for both
tested temperatures. This behavior can be seen in both Figures 20 and 21 where sample 06
concentrations at T= 27oC and at T= 32
oC are shown.
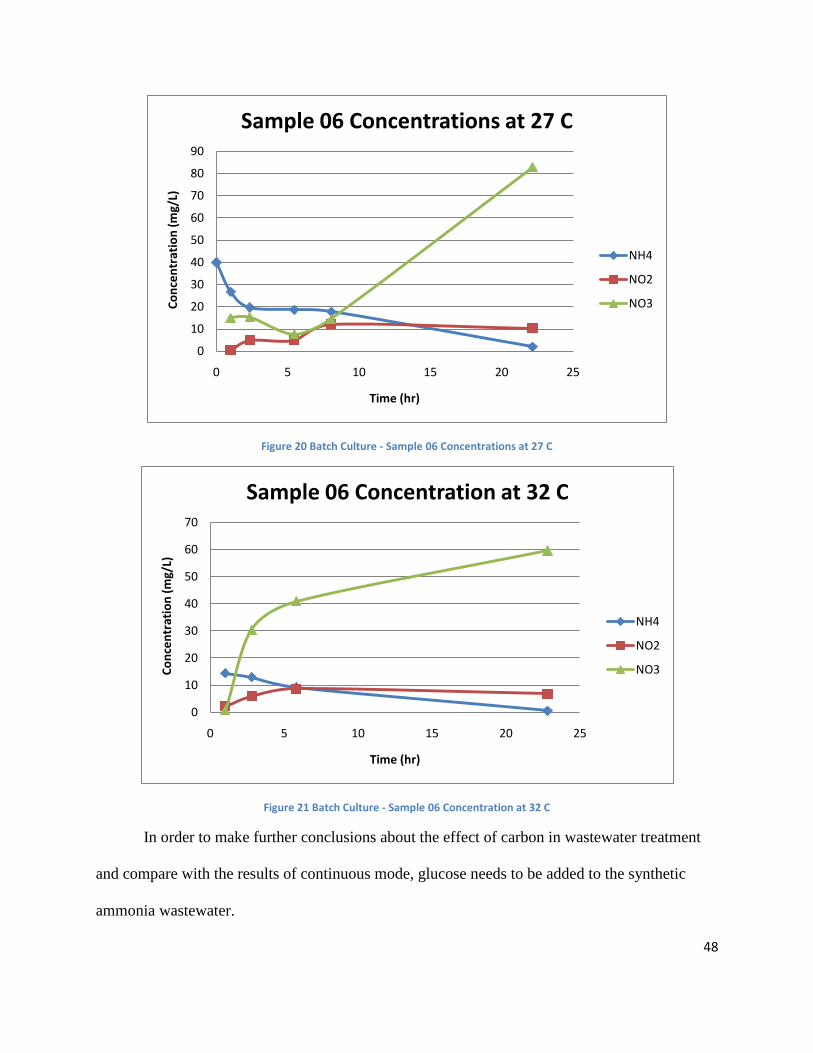
48
Figure 20 Batch Culture - Sample 06 Concentrations at 27 C
Figure 21 Batch Culture - Sample 06 Concentration at 32 C
In order to make further conclusions about the effect of carbon in wastewater treatment
and compare with the results of continuous mode, glucose needs to be added to the synthetic
ammonia wastewater.
0
10
20
30
40
50
60
70
80
90
0 5 10 15 20 25
Co
nce
ntr
atio
n (
mg/
L)
Time (hr)
Sample 06 Concentrations at 27 C
NH4
NO2
NO3
0
10
20
30
40
50
60
70
0 5 10 15 20 25
Co
nce
ntr
atio
n (
mg/
L)
Time (hr)
Sample 06 Concentration at 32 C
NH4
NO2
NO3

49
Glucose was added to the synthetic ammonia wastewater used in the continuous mode
method total organic carbon (TOC) was analyzed before and after the treatment to verify the
treatment’s effectiveness in removing the carbon in the water. TOC was also measured to
observe if the treatment used was responding successfully in ensuring a good water quality at the
end of the process. Table 7 below corresponds to the data recorded before and after the
wastewater was treated.
Table 7 TOC in Continuous Mode
Synthetic Wastewater Treated Wastewater
Total Organic Compound
(TOC)
(mg/L)
20.66 9.63
As it can be noticed from Table 7, the continuous mode method was relatively effective
in removing carbon from the wastewater. The synthetic wastewater had a TOC of 20.66 mg/L
while the treated wastewater had only 9.63 mg/L. The method used was able to remove nearly
50% of the carbon present in the wastewater supplied to the system. Some amount of TOC was
lowered since biological oxygen demand (BOD) oxidizers grown in the beads consumed the
glucose, resulting in a reduction of carbon concentration.
4.4 Total Nitrogen (TN)
Total nitrogen (TN) was also measured in addition to TOC in order to examine if
denitrification took place in this experiment. Table 8 below corresponds to the data recorded
before and after the wastewater was treated. As it is seen from this table, denitrification did not
occur in this experiment. The synthetic wastewater had a TN of 50.20 mg/L and the treated
wastewater had 51.28 mg/L, which is a very similar TN from the untreated wastewater. It was
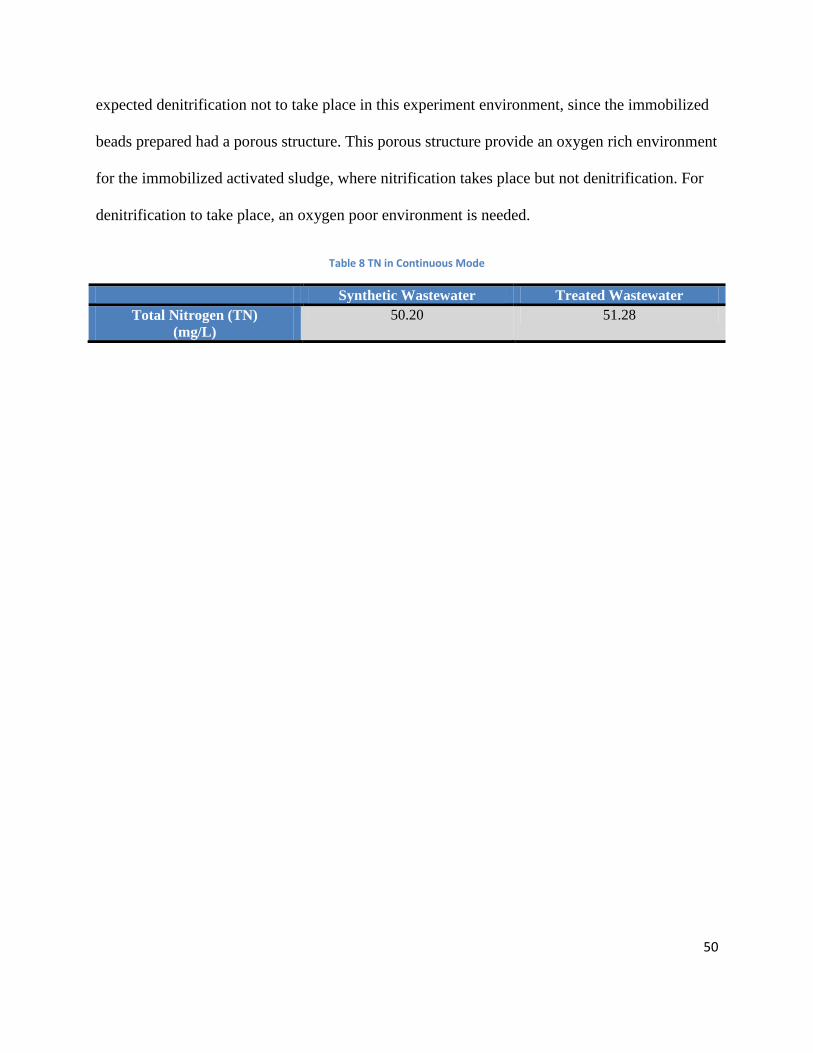
50
expected denitrification not to take place in this experiment environment, since the immobilized
beads prepared had a porous structure. This porous structure provide an oxygen rich environment
for the immobilized activated sludge, where nitrification takes place but not denitrification. For
denitrification to take place, an oxygen poor environment is needed.
Table 8 TN in Continuous Mode
Synthetic Wastewater Treated Wastewater
Total Nitrogen (TN)
(mg/L)
50.20 51.28
51
5.0 Conclusions
This section addresses the conclusions about the different methods used in treating
ammonia wastewater with immobilized activated sludge and the effect of temperature in this
process. This was accomplished through the collection of samples after a designated aeration
period and the analysis for NH4+- N, NO2
- - N and NO3
- - N absorption through the UV
spectrophotometer and concentrations calculations through the standard curves of each kind of
nitrogen.
Samples collection varied for each method. In the case of the batch culture, samples were
collected every 2-3 hours, since ammonia concentration decreased at a very fast pace in a short
period of time. In batch culture, four different kinds of activated sludge were analyzed in order to
determine which one would be selected to test for continuous mode method, since the pump in
this method could only pump one sample at a time. Sample 02 was selected due to its relatively
high mechanical strength. Samples in batch culture were analyzed on their performances at two
different temperatures: 27oC and 32
oC. In theory, wastewater treatment has better performances
at higher temperatures. “An increased wastewater temperature has a positive influence on
biological wastewater treatment methods, since an increase in temperature also increases the
activity of microorganisms. On the other hand, any temperature increase results in a lower
oxygen input capacity of the aeration system” (Kayser). Further analysis revealed that ammonia
wastewater treatment responded better at higher temperatures than at lower temperatures,
matching the theory.
Based on the results from batch culture, the initial temperature was raised to 30oC
instead of 27oC and the higher temperature at 32
oC was kept. Since continuous mode is a long

52
term experiment and sample 02 did not have enough time to reach acclimation completely, no
further conclusions could be done regarding the effect of temperature in the continuous mode
method. Although the graph for temperature comparison in continuous mode suggests that at the
end of the experiment, sample 02 had a greater reduction in ammonia concentration at 30oC, the
level of ammonia concentration decrease at 32oC in the beginning of the experiment was much
greater than at 30oC. While at 30
oC ammonia reduction represented 50% of the original
concentration, at 32oC ammonia reduction was of 75% of the original value in the starting point
of the experiment.
In continuous mode method, glucose was added in the ammonia wastewater to observe
for the effect of carbon in wastewater treatment by immobilized activated sludge. After the
experiment, TOC was analyzed from the synthetic wastewater and the treated wastewater. TOC
revealed that there was approximately 50% of organic compounds removal. The continuous
mode method was relatively effective in removing portions of glucose from the synthetic
wastewater. TN was also analyzed and the results showed that no denitrification took place since
the immobilized beads prepared had a porous structure which provides an oxygen rich
environment.
After much study and investigation on batch culture and continuous mode methods, and
the effect on variation of temperatures, batch culture was more effective in treating ammonia
wastewater by immobilized activated sludge sample 02. A generalized conclusion on the
efficiency of each method tested cannot be stated since only sample 02 was analyzed in both
methods. For the type of activated sludge with the same properties such as the ones from sample

53
02, batch culture worked better in the removal of ammonia concentration in wastewater than
using continuous mode method.

54
6.0 Recommendations
Based on the analysis and comparison of batch culture and continuous mode methods,
some recommendations were proposed on how to improve the experiment and draw further
analysis on the effect of carbon and temperature on both methods used.
6.1 Evaluate TOC in Batch Culture
In order to observe the effect of carbon in the wastewater treatment using batch culture
method and to compare the results with continuous mode method, I suggest that glucose should
be added to the prepared synthetic ammonia wastewater. The addition of glucose will enable a
TOC analysis and therefore a more detailed examination on a batch culture method’s
performance in treating organic compounds. In addition to this, a thorough determination on the
levels of TOC comparison before and after the treatment using both methods could be made.
6.2 Further Continuous Mode Analysis
Due to time constraint, the continuous mode experiment had to be stopped for both
temperatures tested before complete acclimation could be reached. The continuous mode method
requires a longer time than batch culture method since it treats more wastewater and ammonia
concentration removal response is slower when comparing to batch culture. If there was more
time for the experiment, further conclusions could be drawn regarding the effect of temperature
in continuous mode. Once acclimation is reached, it would be easier to determine which of the
two temperatures tested had better outcomes in treating the synthetic ammonia wastewater fed to
the system.

55
6.3 Test All Samples of Activated Sludge Pellets in Both Methods
After the experiment, the results showed that batch culture method was more effective in
treating ammonia wastewater by immobilized activated sludge. Since time was limited and the
pump used in continuous mode could only pump one kind of activated sludge sample, only
sample 02 was tested in both batch culture and continuous mode methods. Therefore, from the
results obtained from sample 02, I observed that batch culture method brought better outcomes in
treating the wastewater than continuous mode method for this kind of activated sludge. In order
to compare and observe more closely the efficiency of both methods, I would test all the four
kinds of activated sludge pellets using both methods. This would enable me to make further
comparisons and contrasts about the methods used and how these four activated sludge pellets
behaves differently in both methods.

56
7.0 References
Berson UV-techniek. (n.d.). The Prospects for UV Water and Wastewater Disinfection
Technology in China. Retrieved October 2, 2009, from Berson UV News:
http://halmapr.com/news/berson/the-prospects-for-uv-water-and-wastewater-disinfection-
technology-in-china/
Bitton, G. (1994). Wastewater Microbiology. New York: Wiley-Liss Inc.
Chang, I.-S., Kim, C.-I., & Nam, B.-U. (2005). The influence of poly-vinyl-alcohol (PVA)
characteristics on the physical stability of encapsulated immobilization media for advanced
wastewater treatment. Elsevier , 3050-3054.
Chen, K.-C., Lee, S.-C., Chi, S.-C., & Houng, J.-Y. (1998). Simultaneous carbon-nitrogen
removal in wastewater using phosphorylated PVA-immobilized microorganisms. Elsevier
Science Inc. , 311-320.
Earthpace. (2009). Wastewater Treatment Technology. Retrieved February 25, 2010, from
Earthpace, LLC - Environmental Consulting Services:
http://www.earthpace.com/resources/wwt/index.html
Eckenfelder, W. W. (1980). Principles of Water Quality Management. Boston: CBI Publishing
Company, Inc. .
Hashimoto, N. a. (1998). Wastewater Treatment Using Activated Sludge Entrapped in
Polyethylene Glycol Prepolymer . Journal of Fermentation and Bioengineering , 424-426.
Kayser, R. (2005). Activated Sludge Process. In H.-J. &. Jordening, Environmental
Biotechnology Concepts and Applications (pp. 79-81). Weinheim: WILEY-VCH Verlag GmbH
& Co. KGaA.
Lenntech. (2009). HRT Hydraulic retention time(residence time) also (tau). Retrieved February
9, 2010, from Lenntech: http://www.lenntech.com/wwtp/hrt.htm#ixzz0f4W0X2bt
McGraw-Hill . (1979). Wastewater Engineering. Boston: Metcalf & Eddy Inc.
Obayashi, A. W., & Gorgan, J. M. (1985). Management of Industrial Pollutants by Anaerobic
Processes. Michigan: Lewis Publishers, Inc.
Orive, G., Ponce, S., Hernandez, R., Gascon, A., Igartua, M., & Pedraz, J. (2002).
Biocompatibility of microcapsules for cell immobilization elaborate with different type of
alginates. Biomaterials , 3825-3831.

57
Qiao, X. L., Chen, Q. X., & Zhang, Z. J. (2007). Comparative study of nitrification performances
of immobilized cell fluidized bed reactor and contact oxidation biofilm reactor in treating high
strength ammonia wastewater. Journal of Chemical Technology and Biotechnology , 84-90.
Qiao, X., Zhang, Z., Chen, Q., & Chen, Y. (2007). Nitrification characteristics of PEG
immobilized activated sludge at high ammonia and COD loading rates. Science Direct , 340-347.
Serrano, M., Palacio, G., Trevino, F., & Esparza, M. (2002). Poly(N-vinyl-pyrrolidone)- Calcium
Alginate (PVP-Ca-alg) Composite Hydrogels: Physical Properties and Activated Sludge
Immobilization for Wastewater Treatment. Ind. Eng. Chem. Res. , 3163-3168.
Tanaka, A., & Nakajima, H. (1990). Application of Immobilized Growing Cells. In A. Fiechter,
Advances in Biochemical Engineering/ Biotechnology (pp. 97-101). Berlin: Springer- Verlag.
The Water Planet Company. (n.d.). Nitrification & Denitrification. Retrieved March 1, 2010,
from The Water Planet Company:
http://www.thewaterplanetcompany.com/docs/WPC_Nitrification%20&%20Denitrification%20.
Turovskiy, I. S., & Mathai, P. (2006). Wastewater Sludge Processing. New Jersey: John Wiley &
Sons, Inc.
Tyagi, R., & Vembu, K. (1990). Wastewater Treatment by Immobilized Cells. CRC Press, Inc.
U.S Environmental Protection Agency (EPA). (1999, September). Wastewater Technology Fact
Sheet - Ultraviolet Disinfection. Retrieved October 8, 2009, from Environmental Protection
Agency (EPA): http://www.epa.gov/owm/mtb/uv.pdf
U.S. Environmental Protection Agency (EPA). (2002, August 15). Nitrification. Retrieved
February 15, 2010, from Environmental Protection Agency (EPA):
http://www.epa.gov/ogwdw000/disinfection/tcr/pdfs/whitepaper_tcr_nitrification.pdf
Urra, J., Sepulveda, L., Contreras, E., & Palma, C. (2006). Screening of static culture and
comparison of batch and continuous culture for the textile dye biological decolorization by
Phanerochaete chrysosporium. Brazilian Journal of Chemical Engineering .
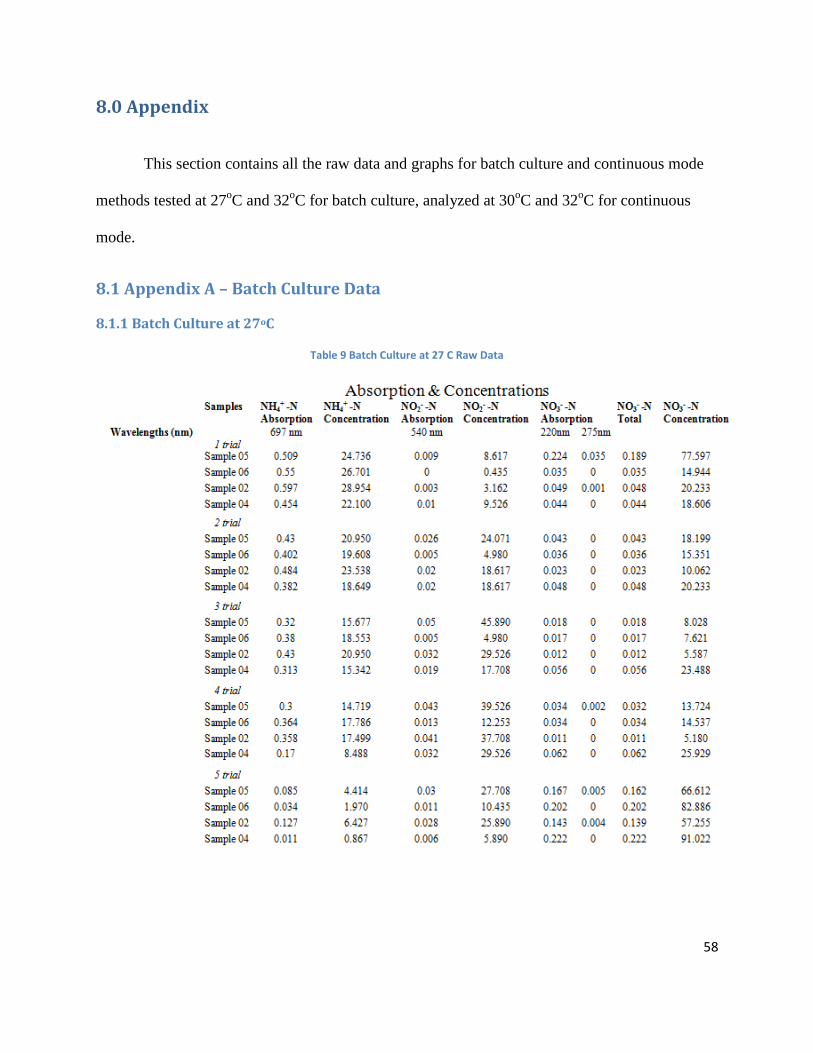
58
8.0 Appendix
This section contains all the raw data and graphs for batch culture and continuous mode
methods tested at 27oC and 32
oC for batch culture, analyzed at 30
oC and 32
oC for continuous
mode.
8.1 Appendix A – Batch Culture Data
8.1.1 Batch Culture at 27oC
Table 9 Batch Culture at 27 C Raw Data

59
Table 10 Batch Culture at 27 C Concentrations
Sample 02 Sample 04 Sample 05 Sample 06
Time (hours)
NH4+ -N
concentration
NH4+ -N
concentration
NH4+ -N
concentration
NH4+ -N
concentration
0 40 40 40 40
1 28.954 22.100 24.736 26.701
2.35 23.538 18.649 20.950 19.608
5.45 20.950 15.342 15.677 18.553
8.05 17.499 8.488 14.719 17.786
22.15 6.427 0.867 4.414 1.970
NO2- -N
concentration
NO2- -N
concentration
NO2- -N
concentration
NO2- -N
concentration
1 3.162 9.526 8.617 0.435
2.35 18.617 18.617 24.071 4.980
5.45 29.526 17.708 45.890 4.980
8.05 37.708 29.526 39.526 12.253
22.15 25.890 5.890 27.708 10.435
NO3- -N
concentration
NO3- -N
concentration
NO3- -N
concentration
NO3- -N
concentration
1 20.233 18.606 77.597 14.944
2.35 10.062 20.233 18.199 15.351
5.45 5.587 23.488 8.028 7.621
8.05 5.180 25.929 13.724 14.537
22.15 57.255 91.022 66.612 82.886

60
Figure 22 Batch Culture - Sample 02 Concentration at 27 C
Figure 23 Batch Culture - Sample 04 Concentration at 27 C
0
10
20
30
40
50
60
70
0 5 10 15 20 25
Co
nce
ntr
atio
n (
mg/
L)
Time (hr)
NH4
NO2
NO3
0
10
20
30
40
50
60
70
80
90
100
0 5 10 15 20 25
Co
nce
ntr
atio
n (
mg/
L)
Time (hr)
NH4
NO2
NO3

61
Figure 24 Batch Culture - Sample 05 Concentrations at 27 C
Figure 25 Batch Culture - Sample 06 Concentrations at 27 C
0
10
20
30
40
50
60
70
80
90
0 5 10 15 20 25
Co
nce
ntr
atio
n (
mg/
L)
Time (hr)
NH4
NO2
NO3
0
10
20
30
40
50
60
70
80
90
0 5 10 15 20 25
Co
nce
ntr
atio
n (
mg/
L)
Time (hr)
NH4
NO2
NO3

62
8.1.2 Batch Culture at 32oC
Table 11 Batch Culture at 32 C Raw data

63
Table 12 Batch Culture at 32 C Concentrations
Sample 05 Sample 06 Sample 02 Sample 04
Time (hours)
NH4+ -N
concentration
NH4+ -N
concentration
NH4+ -N
concentration
NH4+ -N
concentration
0 40 40 40 40
1 16.013 14.383 16.636 10.884
2.8 14.287 12.945 14.767 9.255
5.8 10.549 9.303 9.255 4.893
22.8 1.011 0.484 0.484 0.484
NO2- -N
concentration
NO2- -N
concentration
NO2- -N
concentration
NO2- -N
concentration
1 7.708 2.253 12.253 12.253
2.8 35.890 5.890 28.617 27.708
5.8 43.162 8.617 31.344 34.980
22.8 30.435 6.799 5.890 8.617
NO3- -N
concentration
NO3- -N
concentration
NO3- -N
concentration
NO3- -N
concentration
1 0.705 0.705 0.705 0.705
2.8 25.115 30.404 25.522 25.115
5.8 37.320 40.982 37.727 52.780
22.8 54.814 59.696 58.069 54.814

64
Figure 26 Batch Culture - Sample 02 Concentrations at 32 C
Figure 27 Batch Culture - Sample 05 Concentrations at 32 C
0
10
20
30
40
50
60
70
0 5 10 15 20 25
Co
nce
ntr
atio
n (
mg/
L)
Time (hr)
NH4
NO2
NO3
0
10
20
30
40
50
60
0 5 10 15 20 25
Co
nce
ntr
atio
n (
mg/
L)
Time (hr)
NH4
NO2
NO3

65
Figure 28 Batch Culture - Sample 06 Concentrations at 32 C
Figure 29 Batch Culture - Sample 04 Concentrations at 32 C
0
10
20
30
40
50
60
70
0 5 10 15 20 25
Co
nce
ntr
atio
n (
mg/
L)
Time (hr)
NH4
NO2
NO3
0
10
20
30
40
50
60
0 5 10 15 20 25
Co
nce
ntr
atio
n (
mg/
L)
Time (hr)
NH4
NO2
NO3

66
8.2 Appendix B – Continuous Mode Data
8.2.1 Continuous Mode at 30oC
Table 13 Continuous Mode Sample 02 at 30 C Raw Data
Figure 30 Continuous Mode - Sample 02 Concentrations at 30 C
0
50
100
150
200
250
300
0 1 2 3 4 5 6 7 8 9
Co
nce
ntr
atio
n (
mg/
L)
Time (days)
Continuous Mode at 30 C
NH4
NO2
NO3

67
8.2.2 Continuous Mode at 32oC
Table 14 Continuous Mode Sample 02 at 32 C Raw Data
Figure 31 Continuous Mode - Sample 02 Concentrations at 32 C
0
50
100
150
200
250
300
350
400
450
0 2 4 6 8 10 12
Co
nce
ntr
atio
n (
mg/
L)
Time (days)
NH4
NO2
NO3