Ammonia Volatilization, Urea Hydrolysis, and Urease ... · William Hunter Frame ... of 97% of the...
130
Ammonia Volatilization, Urea Hydrolysis, and Urease Inhibition with the Application of Granular Urea in Agroecosystems William Hunter Frame Dissertation submitted to the faculty of the Virginia Polytechnic Institute and State University in partial fulfillment of the requirements for the degree of Doctor of Philosophy In Crop and Soil Environmental Sciences Marcus M. Alley, Chair Robert D. Grisso Wade E. Thomason Gregory K. Evanylo Mark S. Reiter March 22, 2012 Blacksburg, VA Keywords: Ammonia, volatilization, urea, hydrolysis, urease, N-(n-butyl) thiophosphoric triamide, nitrogen, and fertilization Copyright © 2012, William Hunter Frame
Transcript of Ammonia Volatilization, Urea Hydrolysis, and Urease ... · William Hunter Frame ... of 97% of the...
Ammonia Volatilization, Urea Hydrolysis, and Urease Inhibition with the
Application of Granular Urea in Agroecosystems
William Hunter Frame
Dissertation submitted to the faculty of the Virginia Polytechnic Institute and State University
in partial fulfillment of the requirements for the degree of
Doctor of Philosophy
In
Crop and Soil Environmental Sciences
Marcus M. Alley, Chair
Robert D. Grisso
Wade E. Thomason
Gregory K. Evanylo
Mark S. Reiter
March 22, 2012
Blacksburg, VA
Keywords: Ammonia, volatilization, urea, hydrolysis, urease, N-(n-butyl) thiophosphoric
triamide, nitrogen, and fertilization
Copyright © 2012, William Hunter Frame

Ammonia Volatilization, Urea Hydrolysis, and Urease Inhibition with the Application
of Granular Urea in Agroecosystems.
William Hunter Frame
Abstract
Synthetic nitrogen (N) fertilizers play a key role in human nutrition and crop
production. The most widely used N source globally is urea; however, N loss via ammonia
volatilization can be great in agricultural systems where urea is surface-applied. The
objectives of the experiments reported in this dissertation were: 1) evaluate the performance
of a new laboratory ammonia volatilization measurement system for measuring ammonia
volatilization from coated granular urea; 2) determine if urease can be extracted from corn
and soybean residues; 3) determine if differences in urease activity are present in corn and
soybean residues; and 4) evaluate N content and yield of corn treated with surface-applied
coated urea fertilizers. The laboratory ammonia volatilization system had a system recovery
efficiency (SRE) of 97% of the applied N and the lowest variation in mg N captured in the
acid traps when the air flow rate was 1.00 L min-1, at 26oC, and an acid trap volume of 100
ml 0.02M phosphoric acid. Ammonia volatilization was greatest from 12-24 h after N
application with a total of 17% of the applied N being lost during that period. The urease
inhibitor N-(n-butyl) thiophosphoic triamide (NBPT) was the most effective ammonia
volatilization control treatment and reduced ammonia losses 30-40% compared to urea in the
laboratory trials. Urease was extracted from soybean residue and retained activity during
extraction; however, urease from corn residue could not be identified in extracts. The
agronomic field trials indicated that NBPT increased N concentration in corn ear leaves;
however the effect on corn grain yield was masked by environmental conditions. The data
from this study suggests that ammonia volatilization from granular urea can be effectively
controlled using NBPT, and corn tissue N content in the field indicates that NBPT allows for

iii
more N to be utilized by the plant. The urease extraction showed that there may be
differences in urease activity in different crop residues. Further research is needed to
determine if varying levels of volatilization control are needed for urea applied to different
crop residues in no-till systems.
iv
Acknowledgements
I would like to thank my advisor, Dr. Mark Alley for his mentorship and
professionalism. Dr. Alley’s guidance and tough, but fair, evaluation of my writing and
scientific skills cannot be quantified in my professional development. I would also like to
thank my committee members Dr. Wade Thomason, Dr. Mark Reiter, Dr. Robert Grisso, and
Dr. Greg Evanylo for their guidance and support even during my preliminary examination.
Without the funding and technical support from Garnett Whitehurst, Brooks
Whitehurst, Dr. Bob Campbell, and the research staff at Whitehurst and Associates, Inc. and
Weyerhaeuser Company this research project would not have been possible. Also, thank you
for all the hospitality and inspiration during my time at Virginia Tech.
There have been many people whose contribution to my work cannot go
unrecognized. The first is Tim Woodward who was instrumental in the validation of the
laboratory ammonia volatilization system. Steve Nagle not only helped on every project in
this dissertation, but opened his house up to me and I could not have a greater coworker or
friend, Thank You Steve. I would like to thank Mike Brosius and Harry Behl for their help in
the laboratory and harvesting of my field plots. I want to thank the staff at the Virginia Crop
Improvement Farm, Tidewater Agricultural Research and Extension Center, and the select
grower cooperators where I had test plots. Justin Jones and Michael Childress were always
there when I needed to sample or harvest plots and as great friends. I would like to thank
Kathryn Gaasch for being the first person I ever hired and her patience when working on the
urease extractions.
Without the support of my family this work would not be possible and I will be
forever in debt to them. Thank You All!

v
Attributions
Chapter 2: Design and Validation of a Laboratory System for Measurement of Volatilized Ammonia Chapter 2 was published in Agronomy Journal in January 2011 with the following citation: Woodward T.R., W.H. Frame, M.M. Alley, G.B. Whitehurst, and B.M. Whitehurst. 2011.
Design and validation of a laboratory system for measurement of volatilized ammonia. Agron. J. 103:38-44.
Timothy R. Woodward (Soil Fertility Lab, Crop and Soil Environmental Sciences, Virginia Tech) is currently a soil consultant near Madison, Virginia. Mr. Woodward was a co-author on this manuscript, wrote, and conducted the volatilitilization system validation research.
Marcus M. Alley, PhD (Soil Fertility Lab, Crop and Soil Environmental Sciences, Virginia Tech) is currently a professor emeritus in Crop and Soil Environmental Sciences and is an agronomy consultant. Dr. Alley was a co-author on this manuscript, principal investigator for the grant supporting the research, and contributed to editorial comments.
Garnett B. Whitehurst, PhD (Brooks Whitehurst and Associates, Inc.) is currently the research director and vice president for Brooks Whitehurst and Associates, Inc. in New Bern, NC. Dr. Whitehurst was a co-author, funded the research, and designed the ammonia volatilization system used in this research.
Brooks B. Whitehurst, PhD (Brooks Whitehurst and Associates, Inc.) is currently president for Brooks Whitehurst and Associates, Inc. in New Bern, NC. Mr. Whitehurst was a co-author, funded the research and designed the ammonia volatilization system used in this research.
Chapter 3: In Vitro Evaluation of Coatings to Control Ammonia Volatilization from Surface-applied Urea
Chapter 3 was submitted to Agronomy Journal.
Marcus M. Alley, PhD (Soil Fertility Lab, Crop and Soil Environmental Sciences, Virginia Tech) is currently a professor emeritus in Crop and Soil Environmental Sciences and is an agronomy consultant. Dr. Alley was a co-author on this manuscript, principal investigator for the grant supporting the research, and contributed to editorial comments. Garnett B. Whitehurst, PhD (Brooks Whitehurst and Associates, Inc.) is currently the research director and vice president for Brooks Whitehurst and Associates, Inc. in New Bern, NC. Dr. Whitehurst was a co-author, developed the coated urea fertilizers used, and funded the research on the coated urea fertilizers.
Brooks B. Whitehurst (Brooks Whitehurst and Associates, Inc.) is currently president for Brooks Whitehurst and Associates, Inc. in New Bern, NC. Mr. Whitehurst was a co-author, developed the coated urea fertilizers used, and funded the research on the coated urea fertilizers.

vi
Robert Campbell, PhD (Southern Timberlands Research, Weyerhaeuser NR Company) is currently the senior productivity scientist in the southeast United States for Weyerhaeuser NR Company. Dr. Campbell was a co-author, developed the coated urea fertilizers used, and funded the research on the coated urea fertilizers. Chapter 4: Urease Extraction and Activity of Soybean and Corn Residues in Virginia No-till Cropping Systems Devin Ridgely (Dr, Justine Barone’s Lab, Biological Systems Engineering, Virginia Tech) is currently a doctorate student in the Biological Systems Engineering Department at Virginia Tech. Mr. Ridgely was a co-author, conducted the protein analyses to identify urease in crop residue extracts, and contributed editorial comments. Kathryn Gaasch (Soil Fertility Lab, Crop and Soil Environmental Sciences, Virginia Tech) is currently an undergraduate student in the Crop and Soil Environmental Sciences Department at Virginia Tech. Ms. Gaasch was a co-author and conducted the actual extraction of urease from crop residues. Marcus M. Alley, PhD (Soil Fertility Lab, Crop and Soil Environmental Sciences, Virginia Tech) is currently a professor emeritus in Crop and Soil Environmental Sciences and is an agronomy consultant. Dr. Alley was a co-author on this manuscript, principal investigator for the grant supporting the research, and contributed to editorial comments.
Chao Shang, PhD (Crop and Soil Environmental Sciences, Virginia Tech) is currently a senior research associate and analytical specialist for Crop and Soil Environmental Sciences at Virginia Tech. Dr. Shang was a co-author and supported the preliminary work to find the proper extracting solution to extract urease from crop residues. Chapter 5: Agronomic Evaluation of Coated Urea to Reduce Ammonia Volatilization from Side-dress Applications to Zea mays L. Marcus M. Alley, PhD (Soil Fertility Lab, Crop and Soil Environmental Sciences, Virginia Tech) is currently a professor emeritus in Crop and Soil Environmental Sciences and is an agronomy consultant. Dr. Alley was a co-author on this manuscript, principal investigator for the grant supporting the research, and contributed to editorial comments.
Wade Thomason, PhD (Crop and Soil Environmental Sciences, Virginia Tech) is currently the grain specialist and associate professor in Crop and Soil Environmental Sciences. Dr. Thomason was a co-author and contributed the statistical analysis for this research. Garnett B. Whitehurst, PhD (Brooks Whitehurst and Associates, Inc.) is currently the research director and vice president for Brooks Whitehurst and Associates, Inc. in New Bern, NC. Dr. Whitehurst was a co-author, developed the coated urea fertilizers used, and funded the research on the coated urea fertilizers.
Brooks B. Whitehurst (Brooks Whitehurst and Associates, Inc.) is currently president for Brooks Whitehurst and Associates, Inc. in New Bern, NC. Mr. Whitehurst was a co-author, developed the coated urea fertilizers used, and funded the research on the coated urea fertilizers.

vii
Robert Campbell, PhD (Southern Timberlands Research, Weyerhaeuser NR Company) is currently the senior productivity scientist in the southeast United States for Weyerhaeuser NR Company. Dr. Campbell was a co-author, developed the coated urea fertilizers used, and funded the research on the coated urea fertilizers.
viii
Table of Contents Abstract ..................................................................................................................................... ii Acknowledgements ................................................................................................................. iv Attributions .............................................................................................................................. v List of Figures ........................................................................................................................... x List of Equations .................................................................................................................. xiii Preface .................................................................................................................................... xiv
1 Introduction ...................................................................................................................... 1 1.2 References ................................................................................................................... 6
2 Design and Validation of a Laboratory System for Measurement of Volatilized Ammonia ................................................................................................................................. 10
2.1 Abstract ..................................................................................................................... 11 2.2 Introduction ............................................................................................................... 11 2.3 Materials and Methods .............................................................................................. 13
2.3.1 System Design ................................................................................................... 13 2.3.2 System Validation .............................................................................................. 16 2.3.3 Statistics ............................................................................................................. 18
2.4 Results and Discussion .............................................................................................. 20 2.4.1 Trials I, II, and III .............................................................................................. 20 2.4.2 Trial IV (Multiple N Rates) ............................................................................... 22
2.5 Conclusions ............................................................................................................... 23 2.6 References ................................................................................................................. 24
3 In Vitro Evaluation of Coatings to Control Ammonia Volatilization from Surface-applied Urea ........................................................................................................................... 32
3.1 Abstract ..................................................................................................................... 33 3.2 Introduction ............................................................................................................... 33 3.3 Material and Methods................................................................................................ 37
3.3.1 General ............................................................................................................... 37 3.3.2 Trials I and II ..................................................................................................... 39 3.3.3 Trials III and IV ................................................................................................. 40 3.3.4 Trials V and VI .................................................................................................. 40
3.4 Results and Discussion .............................................................................................. 40 3.4.1 Trials I and II ..................................................................................................... 40 3.4.2 Trials III and IV ................................................................................................. 43 3.4.3 Trials V and VI .................................................................................................. 46
3.5 Conclusions ............................................................................................................... 47 3.6 References ................................................................................................................. 49
ix
4 Urease Extraction and Activity of Soybean and Corn Residues in Virginia No-till Cropping Systems .................................................................................................................. 59
4.1 Abstract ..................................................................................................................... 60 4.2 Introduction ............................................................................................................... 61 4.3 Material and Methods................................................................................................ 65
4.3.1 Urease Extracting Solutions ............................................................................... 65 4.3.2 Extracting Urease from Crop Residues.............................................................. 66 4.3.3 Ammonium Sulfate Fractionation...................................................................... 67 4.3.4 Peak Identification and Standardization with Fourier Transform Infrared Spectroscopy ......................................................................................................................... ............................................................................................................................ 68 4.3.5 Urease Activity Assays with FTIR .................................................................... 70 4.3.6 Urease Identification in Extracts ........................................................................ 70
4.4 Results and Discussion .............................................................................................. 72 4.4.1 Urease Identification .......................................................................................... 72 4.4.2 Assays to detect urease activity ......................................................................... 75
4.5 Conclusions ............................................................................................................... 77 4.6 References ................................................................................................................. 78
5 Agronomic Evaluation of Coated Urea to Reduce Ammonia Volatilization from Side-dress Applications to Zea mays L. ................................................................................ 90
5.1 Abstract ..................................................................................................................... 91 5.2 Introduction ............................................................................................................... 91 5.3 Material and Methods................................................................................................ 94 5.4 Results and Discussion .............................................................................................. 96
5.4.1 Sidedress N rates and Coatings .......................................................................... 96 5.4.2 Physical coatings at 112 kg N ha-1 ..................................................................... 97
5.5 References ................................................................................................................. 99
6 Conclusions.................................................................................................................... 113
x
List of Figures
2. Design and Validation of a Laboratory System for Measurement of Volatilized Ammonia
Fig. 2.1: General schematic of the system used for in-lab ammonia volatilization studies as tested ........................................................................................................................................ 26
Fig. 2.2:Cumulative N captured in acid traps during trials I ,II, and III .................................. 27
Fig. 2.3: Standard Deviation for cumulative N captured for trials I, II, and III ...................... 28
3. In Vitro Evaluation of Coatings to Control Ammonia Volatilization from Surface-applied Urea
Fig. 3.1: Cumulative N loss (percent of applied) as ammonia from granular urea treated with the urease inhibitor NBPT and CaSO4 and K2SO4 physical coatings during trial I. ............... 52
Fig. 3.2: Cumulative N loss (percent of applied) as ammonia from granular urea treated with the urease inhibitor NBPT and CaSO4 and K2SO4 physical coatings during trial II. .............. 53
Fig. 3.3: Cumulative N loss (percent of applied) as ammonia from granular urea coated with CaSO4 alone and in conjunction with the urease inhibitor NBPT during trial III. .................. 54
Fig. 3.4: Cumulative N loss (percent of applied) as ammonia from granular urea coated with K2SO4 alone and in conjunction with the urease inhibitor NBPT during trial IV. .................. 55
Fig. 3.5: Cumulative N loss (percent of applied) as ammonia from granular urea treated with varying rates of the urease inhibitor NBPT during trial V....................................................... 56
Fig. 3.6: Cumulative N loss (percent of applied) as ammonia from granular urea treated with varying rates of the urease inhibitor NBPT during trial VI. .................................................... 57
4. Urease Extraction and Activity of Soybean and Corn Residues in Virginia No-till Cropping Systems
Fig.4.1: Buffering capacity of the 25mM and 50mM Na-Phos solutions prepared to extract urease from crop residues. ....................................................................................................... 82
Fig.4.2: FTIR peaks identified and measured to characterize urea hydrolysis for 200mM Urea (A), 200mM sodium bicarbonate (B) and an assay of Jackbean urease showing the change in peaks ........................................................................................................................................ 83

xi
Fig.4.3: Regression analysis for three FTIR peaks; correlating absorbance peak intensities to a range of urea concentrations at 1,466 cm-1 (A) and 1,160 cm-1 (B) and sodium bicarbonate at 1,362 cm-1 (C). ..................................................................................................................... 84
Fig. 4.4: Fast Protein Liquid Chromatography (FPLC) elution curves measuring absorbance at 280 nm for the Jackbean urease (A) and fractionations of soybean (B) and corn (C) residues in 50 mM sodium phosphate extracting solution. ...................................................... 85
Fig.4.5: SDS-PAGE analysis for a standard with known molecular weights (A), Jackbean urease (10 mg ml-1) (B), crude soybean extract (C), 0-40% (NH4)2SO4 saturation soybean fraction (D), 40-55% (NH4)2SO4 saturation soybean fraction (E), 55+% (NH4)2SO4 saturation soybean fraction (F), and 0-40% (NH4)2SO4 saturation soybean concentrated fraction (G)............................................................................................................................... 86
Fig. 4.6: Progress curves for urea hydrolysis monitoring the formation of bicarbonate at 1,362 cm-1. The reaction mixture contained 1 ml of 200mM urea with 1 ml of Jackbean urease or soybean urease fractionation at 25 oC for 20 minutes .............................................................. 87
Fig. 4.7: SDS-PAGE analysis for a standard with known molecular weights (A), Jackbean urease (10 mg ml-1) (B), crude corn extract (C), 0-40% (NH4)2SO4 saturation corn fraction (D), 40-55% (NH4)2SO4 saturation corn fraction (E), 55+% (NH4)2SO4 saturation corn fraction (F), and 0-40% (NH4)2SO4 saturation corn concentrated fraction (G). ..................... 88
Fig. 4.8: Progress curves for urea hydrolysis monitoring the formation of bicarbonate at 1,362 cm-1. The reaction mixture contained 1 ml of 200mM urea with 1 ml of Jackbean urease or corn urease fractionation at 25oC for 20 minutes..................................................................... 89
5. Agronomic Evaluation of Coated Urea to Reduce Ammonia Volatilization from Side-dress Applications to Zea mays L.
Fig. 5.1: Corn leaf N concentration at V5-V7 following granular urea application at rates from 0 to 224kg N ha-1 for sites where urea and Arborite® Ag were significantly different at α = 0.1. ...................................................................................................................................... 103
Fig. 5.2: Corn ear leaf N concentration at V5-V7 following granular urea application at rates from 0 to 224kg N ha-1 for sites where urea and Arborite® Ag were not significantly different at α = 0.1. ............................................................................................................................... 104
Fig. 5.3: Corn grain yield (Mg ha-1) and granular urea application at rates from 0 to 224kg N ha-1 for sites where urea and Arborite® Ag were significantly different at α = 0.1. .............. 105
Fig. 5.4: Corn grain yield (Mg ha-1) and granular urea application at rates from 0 to 224kg N ha-1 for sites where urea and Arborite® Ag were not significantly different at α = 0.1. ........ 106
xii
List of Tables
2. Design and Validation of a Laboratory System for Measurement of Volatilized Ammonia
Table 2.1: Comparison of system efficiencies and variation for laboratory systems measuring NH3 volatilization. ................................................................................................................... 29
Table 2.2: Detailed materials list with appropriate costs for volatilization system ................ 30
Table 2.3: Volatilization N loss, acid trap N recovery, system N recovery and calculated efficiencies for trialsI, II, and III with a 90 kg N ha-1 surface application ............................... 31
Table 2.4: Mean system recovery efficiencies (SRE) and standard deviation (SD) for all N rates over two weeks for trial IV at 1 L min air flow and 100 ml of 0.02 M phosphoric acid trap volume. ............................................................................................................................. 31
3. In Vitro Evaluation of Coatings to Control Ammonia Volatilization from Surface-applied Urea
Table 3.1: Soil pH and physical characteristics for the Wheeling silt loam (Fine-loamy, mixed, active, mesic Ultic Hapludalf) soil used in all ammonia volatilization trials .............. 58
Table 3.2: Treatment descriptions for trials I, II, III, and IV. ................................................. 58
5. Agronomic Evaluation of Coated Urea to Reduce Ammonia Volatilization from Side-dress Applications to Zea mays L.
Table. 5.1: Location names, coordinates, and soil descriptions for all locations during 2009-2011........................................................................................................................................ 107
Table 5.2: Treatment descriptions for 2009, 2010, and 2011corn trials. .............................. 108
Table 5.3: Main effects for urea and Arborite® Ag coating applied at four sidedress N application rates on N concentration in corn ear leaves and grain yield at all locations. ...... 109
Table 5.4: Effect of different physical and chemical coatings applied at 112 kg N ha-1 on N concentration of corn ear leaves at all locations. ................................................................... 110
Table 5.5: : Monthly rainfall totals at individual location during June, July and August from 2009-2011. ............................................................................................................................. 111
Table 5.6: Effect of different physical and chemical coatings applied at 112 kg N ha-1 on corn grain yield (Mg ha-1) at all locations during 2009 ......................................................... 112
xiii
List of Equations
1. Introduction
Eq.1.1: Calculation of nitrogen use efficiency (NUE) .............................................................. 2
Eq.1.2: Urea Hydrolysis ............................................................................................................ 3
2. Design and Validation of a Laboratory System for Measurement of Volatilized Ammonia
Eq. 2.1: System Recovery Efficiency ...................................................................................... 19
Eq. 2.2: Volatilization Loss ..................................................................................................... 19
Eq. 2.3: Acid Trap Efficiency.................................................................................................. 20
xiv
Preface
The mission of the soil fertility research group at Virginia Tech has been to
understand and improve the efficiency of cropping systems. One focus of the group is
improved nitrogen use efficiency in non-legume systems. Nitrogen loss via ammonia
volatilization has been the focus of many studies within the group and the development of the
ammonia volatilization system was done in collaboration with Timothy Woodward, Garnett
Whitehurst and Brooks Whitehurst. The system has allowed the group to test many coated
materials on granular urea as well as ammonia volatilization from urea ammonia nitrate
solutions. The laboratory trials were then transposed to field agronomic studies to evaluate
agronomic impact of the coated granular urea on corn grain yields and corn ear leaf nitrogen
concentration.
The second mission of the soil fertility group is to be innovative in some aspect of
agronomy. The extraction, identification, and activity analysis of urease from crop residues
in no-till cropping systems will allow for the further understanding of agronomic systems, but
also incorporates biochemistry with agronomic studies. The study was done in collaboration
with Devin Ridgely (Ph.D student, Biological Systems Engineering (BSE)), Dr. Justin
Barone (Associate Professor, BSE), Kathryn Gaasch, Dr. Chao Shang (Crop and Soil
Environmental Sciences). The expertise of these scientists was instrumental in solving and
understanding the complex problems associated with extracting, identifying, and determining
the activity of urease in corn and soybean residues.

1
1 Introduction
Nitrogen (N) is found ubiquitously on earth, varying in forms such as amino acids to
the most abundant gas, N2, in the atmosphere. Despite its abundance in the atmosphere, N is
the most limiting nutrient in non-legume agricultural cropping systems. Starting in the early
1960’s grain production and the global community went through a period known as the
“Green Revolution.” The Green Revolution marked the beginning of use of improved
genetics, synthetic pesticides, and synthetic N fertilizers. Synthetic N fertilizers are
manufactured by reacting N2 gas in the atmosphere with hydrogen gas, H2, under extreme
temperatures and pressure, during the Haber-Bosch process. The resulting product is
ammonia gas, NH3, and can be used as a fertilizer or further reacted to produce N fertilizers
such as urea, ammonium nitrate, and ammonium sulfate.
Close to 40% of the increase in grain production over the past 60 years is attributed to
synthetic N fertilizer (Brown, 1999; Mosier et al., 2004; Smil, 2002). In the early part of the
21st century, 50% of the total N used for global crop production could be traced to synthetic
N fertilizer (Mosier et al., 2004). Worldwide demand for synthetic N fertilizer is expected to
increase from approximately 128 Tg in 2007/2008 to 139 Tg in 2011/2012 (FAO, 2008).
Though the total demand for N is increasing around the world, distribution is not uniform.
Developed or developing areas such as the U.S., Europe, China, and India use the vast
majority of the N supply, whereas places such as the sub-Sahara in Africa apply little
fertilizer N. This is largely due to the cost per unit of N, being cheaper in the U.S. and China
and more expensive in less developed areas due to transportation and infrastructure
limitations.
The nitrogen use efficiency (NUE) of an agronomic system is a measure how
efficiently N is being utilized by the crop of interest and is calculated using Eq. 1.1:

2
Eq.1.1: Calculation of nitrogen use efficiency (NUE)
(Raun and Johnson, 1999)
NUE typically falls short of 50% worldwide with some production systems as low as 20%
(IFA/FAO, 2001; Mosier et al., 2004; Raun and Johnson, 1999; Smil, 2002). Raun and
Johnson (1999) estimated that every 1% increase in NUE would save 490,000 Mg of N
worldwide keeping yields constant. The annual value of that savings would be approximately
$234,660,000 globally. By increasing NUE in agroecosystems less N is needed to optimize
crop yields, profitability of cropping systems increases, and nutrient loading in the
environment decreases.
Nitrogen fertilizer that is not used by the crop can potentially be lost from the
agroecosystem. Nitrogen loss mechanisms include denitrification, leaching, ammonia
volatilization, runoff and erosion. The absolute percentages for individual N loss mechanisms
are difficult to estimate for agricultural production systems due to the effects of climate, soil,
and N fertilization sources. Gaseous losses of N, ammonia volatilization and denitrification,
are the major sources of loss for many production systems (IFA/FAO, 2001).
Among the gaseous loss mechanisms ammonia volatilization is the greatest (Mosier et
al., 2004; Peoples et al., 2004). Of the total N applied as fertilizer, model estimates are that
about fourteen percent is lost via volatilization, and almost eight percent of the N applied as
manure is estimated to be volatilized as ammonia (IFA/FAO, 2001; Peoples et al., 2004). In
most parts of the world urea serves as the principal N source; the exception being in Europe
where nitrate fertilizers dominate (Mosier et al., 2004). High N analysis (46% N), ease of
handling, and its relative low cost have made urea the fertilizer of choice in many production
3
systems (Kiss and Simihaian, 2002). The use of urea as the dominant N source around the
globe makes ammonia volatilization the loss mechanism of greatest importance with respect
to applied fertilizer. Primarily surface applied in granular form in many regions, urea must
have enough moisture to dissolve and then undergoes a hydrolysis reaction in the soil to be
converted to ammonium (Eq. 1.2)
Eq.1.2: Urea Hydrolysis
42222 NHCOONHOHNHCONH Urease
3322 NHHCOOHCOONH
(Krajewska, 2009; Ciurli, 1999)
The urea hydrolysis reaction is catalyzed by urease (urea amidohydrolases
E.C.3.5.1.5) to form ammonia and bicarbonate (Ciurli et al., 1999; Krajewska, 2009) shown
in Eq. 1.2. Ureases are found in many organisms ranging from bacteria, plants, and as an
extracellular enzyme in soil. Urease increases the hydrolysis reaction rate to as much as 1014
times faster than the uncatalyzed reaction (Krajewska, 2009). The function of urease varies
depending on the species, but in plants ureases are involved in urea metabolism as well as
metabolism of N containing molecules within plant cells (Krajewska, 2009). Though ureases
serve different metabolic functions for individual species, the amino acid sequences of
ureases from different species exhibit high levels of homology (Krajewska, 2009). Plant
urease subunits consist of single-chain polypeptides as compared to bacterial urease subunits
consisting of two to three polypeptides (Balasubramanian and Pannuraj, 2010). Though there
are differences in the subunits of plant and bacterial ureases, the amino acid sequences are
homologous (Balasubramanian and Pannuraj, 2010). The subunits of plant ureases have
molecular weights circa 90 kiloDaltons (atomic mass unit = mass of one proton) (kDa) and

4
research has shown that urease extracted from living tissue have different activities among
species (Krajewska, 2009; Balasubramanian and Pannuraj, 2010).
Urease in soil environments is found in two distinct pools: the first being intracellular
urease of living microorganisms and the latter being extracellular urease released from
microbes and plant cells upon death (Mobley and Hausinger, 1989). Extracellular soil urease
is bound to humic substances and adsorbed on clay minerals which is responsible for the
observed increased stability of the enzyme in soils (Mobley and Hausinger, 1989). The rapid
hydrolysis of urea to bicarbonate and ammonia results in an increase in pH around the
dissolved zone of urea which favors volatilization of ammonia at the soil surface (Bremner,
1995; Ciurli, 1999).
Many studies have been conducted to find ways of controlling ammonia
volatilization from surface-applied urea and urea-derivative fertilizers. The studies range
from using tillage as a volatility control measure to using heavy metals as inhibitors of
urease. These studies have typically found that urease activity is not consistent throughout
different soil types (i.e. changes in texture, organic carbon, pH and residue cover) (Antisari et
al., 1996; Beri et al., 1978; Beyrouty et al., 1988; Broadbent et al., 1985; Watson, 2005). The
most successful management practice found to date for controlling volatilization from surface
applied urea is applying the urea right before a rainfall event of at least 14.6 mm so that the
fertilizer is dissolved and moved below the soil surface (Holcomb and Horneck, 2011).
However, since weather is unpredictable and the crop needs the nutrients at specific growth
stages, growers must fertilize at certain points during the growing season, with or without
dependable rainfall.
One of the most effective ammonia volatilization controls for urea involves inhibiting
urease in agroecosytems by applying the chemical N-(n-butyl) thiophosphoric triamide
(NBPT) with urea-based N fertilizer (Watson, 2005). An enzyme inhibitor decreases the
5
efficiency of the enzyme thus slowing the chemical reaction (Chang, 2000). However, NBPT
is not the true urease inhibitor as studies have shown that once in the soil environment NBPT
is degraded to N-(n-butyl) phosphoric triamide (NBPTO) (Christianson et al., 1990; Creason
et al., 1990; McCarty and Bremner, 1989). In the soil system NBPT undergoes an oxidative
desulfuration reaction to form NBPTO (Creason et al., 1990). By replacing the sulfur atom in
the structure with an oxygen atom, the structure more closely imitates the electron
configuration of urea allowing greater inhibition of soil urease. Upon transformation in the
soil NBPTO is the actual competitive inhibitor that reduces urease activity thereby reducing
ammonia volatilization.
Urea treated with NBPT has been extensively studied in soil and on urease from
ureolytic microorganisms to ascertain the percent inhibition. Turner et al. (2010) reported a
reduction in N loss through ammonia volatilization from 9.5% of applied N from uncoated
urea to 1.0% of applied N. Essentially no ammonia was reported in flood waters when urea
was treated with NBPT (Byrnes and Amberger, 1989). Rawluk et al. (2001) reported a
reduction in ammonia loss of 75-85% when NBPT was added to urea. The data set for
controlling N loss in Virginia and North Carolina cropping systems with NBPT is limited and
needs to be expanded as urea containing fertilizers are major N sources in this region.
Until recently, Agrotain® International has been the only supplier of coated urea with
NBPT and the source of the inhibitor for nearly all research on ammonia volatilization from
urea fertilizers. Recently a NBPT coated urea fertilizer has been developed by Weyerhaeuser
Inc. (Seattle, WA) and Whitehurst and Associates (New Bern, NC). The binding agent for the
new coated urea fertilizer has yet to be evaluated against the industry standard. This new
product has the capacity to coat urea with physical coatings in conjunction with the urease
inhibitor NBPT. Being able to physically coat the urea will allow for the application of
minor and micro-nutrients to crops with one spreader pass across the field. Weyerhaeuser has
6
utilized this technology for the past decade on loblolly pine stands across the southeast and
sees the potential for the technology in agronomic crop production (Personal communication,
Robert Campbell, 2010).
The overall objectives of this research was to conduct field and laboratory trials that
describe ammonia volatilization from urea fertilizers with and without volatility control
measures in cropping systems representing those found in Virginia and North Carolina. The
specific objectives of the research were: 1) test and evaluate the design and performance of a
new laboratory ammonia volatilization measurement system; 2) determine if urease can be
extracted from corn and soybean residues; 3) determine if differences in urease activity are
present in corn and soybean residues; and 4) evaluate N content and yield of corn treated with
surface-applied coated urea fertilizers.
1.2 References
Antisari L.V., C. Marzadori, P. Gioacchini, S. Ricci, and C.Gessa. 1996. Effects of the urease
inhibitor N-(n-butyl)phosphorothioic triamide in low concentrations on ammonia
volatilization and evolution of mineral nitrogen. Biol. Fertil. Soils 22:196-201.
Balasubramanian, A. and K. Ponnuraj. 2010. Crystal Structure of the first plant urease from
Jackbean: 83 years of journey from its first crystal to molecular structure. J. Mol.
Biol. 400: 274-283.
Beri, V., K.Goswami, and S.Brar. 1978. Urease activity and its Michaelis constant for soil
systems. Plant Soil 49:105-115.
Beyrouty, C.A., L.E.Sommers, and D.W. Nelson. 1988. Ammonia volatilization from
surface-applied urea as affected by several phosphoroamide compounds. Soil Sci Soc
Am J 52:1173-1178.
7
Bremner, J.M. 1995. Recent research on problems in the use of urea as a nitrogen fertilizer.
Fert. Res. 42:321-329.
Broadbent, F.E., T. Nakashima, and G.Y. Chang. 1985. Performance of some urease
inhibitors in field trials with corn. Soil Sci Soc Am J 49:348-351.
Brown, L.R. 1999. Feeding nine billion, in: L. R. Brown, et al. (Eds.), State of the world
1999: A Worldwatch Institute report on progress toward a sustainable society, W.W.
Norton & Company, New York. pp. 115-132.
Byrnes, B.H. and A. Amberger. 1989. Fate of broadcast urea in a flooded soil when treated
with N-(n-butyl) thiophosphoric triamide, a urease inhibitor. Fert. Res. 18:221-231.
Chang, R. 2000. Chapter 13: Enzyme Kinetics, Physical Chemistry for the Chemical and
Biological Sciences, University Science Books, Sausalito, CA. pp. 511-559.
Christianson, C., B. Byrnes, and G. Carmona 1990. A comparison of the sulfur and oxygen
analogs of phosphoric triamide urease inhibitors in reducing urea hydrolysis and
ammonia volatilization. Fert. Res. 26:21-27.
Ciurli S., S. Benini, W.R. Rypniewski, K.S. Wilson, S. Miletti, and S. Mangani. 1999.
Structural properties of the nickel ions in urease: novel insights into the catalytic and
inhibition mechanisms. Coordination Chemistry Reviews 190-192:331-355. DOI:
Doi: 10.1016/s0010-8545(99)00093-4.
Creason, G.L., M.R. Schmitt, E.A. Douglass, and L.L. Hendrickson. 1990. Urease inhibitory
activity associated with N-(n-butyl)thiophosphoric triamide is due to formation of its
oxon analog. Soil Biol. Biochem. 22:209-211. DOI:10.1016/0038-0717(90)90088-h.
Holcomb, J.C. and D.A. Horneck. 2011. Effect of irrigation rate on ammonia volatilization.
Soil Sci. Soc. Am. J. 75:2341-2347
8
FAO. 2008. Current world fertilizer trends and outlook to 2011/2012. Electronic Publishing
and Support Branch. Communication Division. FAO. URL:
https://www.agronomy.org/files/publications/style/chapter-01.pdf
IFA/FAO. 2001. Global estimates of gaseous emissions of NH3, NO, N2O from agricultural
land, FAO, Rome.
Kiss S. and M. Simihaian 2002. Improving efficiency of urea fertilizers by inhibition of soil
urease activity. Kluwer Academic Publishers, Dordrecht, The Netherlands.
Krajewska, B. 2009. Ureases I. Functional, catalytic and kinetic properties: A review. Journal
of Molecular Catalysis B: Enzymatic 59:9-21. DOI: DOI:
10.1016/j.molcatb.2009.01.003.
McCarty, G.W. and Bremner J.M. 1989. Formation of phosphoryl triamide by decomposition
of thiophosphoryl triamide in soil. Biol. Fert. Soils 8:290-292.
Mobley, H.L. and R.P.Hausinger 1989. Microbial ureases: significance, regulation, and
molecular characterization. Microbiol. Mol. Biol. Rev. 53:85-108.
Mosier, A.R., J.K. Syers, J.R. and Freney. 2004. Nitrogen Fertilizer: An essential component
of increased food, feed, and fiber production, In: A. Mosier, et al. (Eds.), Agriculture
and the nitrogen cycle: assessing the impacts of fertilizer use on food production and
the environment, Island Press, Washington D.C. pp. 3-15.
Peoples, M.B., E.W. Boyer, K.W.T. Goulding, P. Heffer, V.A. Ochwoh, B. Vanlauwe, S.
Wood, K. Yagi, and O.van Cleemput. 2004. Pathways of nitrogen loss and their
impacts on human health and the environment, In: A. R. Mosier, et al. (Eds.),
Agriculture and the Nitrogen Cycle: Assessing the Impacts of the Fertilizers Use on
Food Production and the Environment, Island Press, Washington, D.C. pp. 53-70.
Raun, W.R. and G.V. Johnson. 1999. Improving nitrogen use efficiency for cereal
production. Agron. J. 91:357-363.

9
Rawluk, C.D.L., C.A. Grant, and G.J. Racz 2001. Ammonia volatilization from soils
fertilized with urea and varying rates of urease inhibitor NBPT. Can. J. Soil Sci.
81:239-246.
Smil, V. 2002. Nitrogen and food production: proteins for human diets. AMBIO: A J. of the
Human Environ. 31:126-131. DOI:10.1579/0044-7447-31.2.126.
Turner, D.A., R.B. Edis, D. Chen, J.R. Freney, O.T. Denmead, and R. Christie. 2010.
Determination and mitigation of ammonia loss from urea applied to winter wheat with
N-(n-butyl) thiophosphorictriamide. Agric. Ecosyst. Environ. 137:261-266. DOI:
DOI: 10.1016/j.agee.2010.02.011.
Watson, C. 2005. Urease inhibitors, IFA International Workshop on Enhanced-Efficiency
Fertilizers, Queen's University of Belfast, Frankfurt, Germany.

10
2 Design and Validation of a Laboratory System for Measurement of Volatilized
Ammonia
Timothy Woodwarda aDepartment of Crop and Soil Environmental Sciences, Virginia Tech, 330 Smyth Hall (0404), Blacksburg, VA 24061, USA E-mail address: [email protected] Tel.: +1 540 2314521; fax: +1 540 2313431 William Hunter Framea aDepartment of Crop and Soil Environmental Sciences, Virginia Tech, 330 Smyth Hall (0404), Blacksburg, VA 24061, USA E-mail address: [email protected] Tel.: +1 540 2314521; fax: +1 540 2313431 Marcus M. Alleya* aDepartment of Crop and Soil Environmental Sciences, Virginia Tech, 330 Smyth Hall (0404), Blacksburg, VA 24061, USA *Corresponding author E-mail address: [email protected] Tel.: +1 540 2319777; fax: +1 540 2313431 Garnett Whitehurstb b Vice President, Whitehurst and Associates, Inc. New Bern, NC 28564, USA E-mail: [email protected] Tel.: 1 252 638 2293 Brooks Whitehurstb b President, Whitehurst and Associates, Inc. New Bern, NC 28564, USA E-mail: [email protected] Tel.: +1 252 638 2293
11
2.1 Abstract
The design of laboratory systems for studying ammonia (NH3) released from
fertilizers varies widely, and few designs have been tested to determine the accuracy and
precision in measuring ammonia loss. A standard volatilization system design is needed for
reliable and comparable studies of ammonia volatilization from nitrogen fertilizer. The
objectives of this study are: (i) to describe the design of a system capable of controlling air
flow rate and temperature for laboratory measurement of NH3 volatilized from N fertilizers;
and (ii) assess the system’s efficiency and variation in recovering NH3 lost from NH4Cl
applied to an alkaline sand media. The system is comprised of individual chambers for soil
and fertilizer, where temperature can be varied from room temperature to ~32ºC; humidity is
maintained near saturation, air flow rate can be varied, and acid traps are used to capture
volatilized NH3. Two initial trials (I and II) were conducted at an N rate of 90 kg N ha-1 using
air flow rates of 2.00 and 1.00 L min-1 and trapping acid volumes of 50 and 100 ml,
respectively. A third trial was conducted at 30oC. A fourth trial (IV) was performed using a
range of N application rates (25 to 250 kg N ha-1). The system recovered 89.3% to 97.1% of
the N applied over all four trials and provided accurate and repeatable results under the
conditions tested. Rapid, precise comparisons of NH3 volatilization losses from N fertilizers
under laboratory conditions can be made with this system.
2.2 Introduction
Volatilization of NH3 from N fertilizers is one of many processes where N is lost from
the soil environment. Volatilization of NH3 after fertilizer application did not receive
substantial attention as a possible source for N loss until the 1950’s (Freney et al., 1983). NH3
volatilization reduces N-use efficiency (defined as N yield per unit of applied N) and creates
uncertainty in the management of N at the farm level. The study of NH3 volatilization
12
requires equipment and practices that limit direct and indirect influences of factors that affect
the volatilization of NH3. Developing models to accurately predict NH3 volatilization
amounts in cropping systems, pastures or forests is difficult given the complexity of these
biological systems.
Methods of measuring NH3 volatilization from N sources, organic amendments or
inorganic fertilizers, can be divided into two general classes: i) in-situ and ii) in-lab or
controlled environment experiments. All in-situ NH3 volatilization methods are
disadvantaged by the inability to control climatic factors (e.g. rainfall timing and amount,
humidity, and temperature) that directly influence NH3 volatilization rates. These studies
typically monitor these factors, but are unable to replicate exactly the factors across multiple
studies or treatments unless all are performed during the same period and on the same site.
Also, seasonal fluctuations limit the period in which reliable in-situ studies can be performed.
In-lab controlled studies can maintain environmental factors affecting NH3
volatilization across multiple treatments and multiple treatment periods. Also, in-lab studies
can be performed year-round with limited time needed for set-up between treatment periods.
Reduced sample sizes allow for a larger number of treatments and replications. Results
obtained from well-designed systems can provide reliable comparisons between treatments.
The primary method to measure NH3 volatilization in laboratory studies utilizes a
closed chamber, containing soil and N fertilizer amendments to be evaluated, and forced air
flow across the treatment surface with an acid trap to capture the volatilized NH3 (Hargrove
and Kissel, 1979; Terman, 1979; Shi et al., 2001; Kissel et al., 2004; Portejoie et al., 2004;
Todd et al., 2006, Cole et al., 2005; Miles et al., 2008; Ndegwa et al., 2009). Many in-lab
systems have incorporated humidification features, temperature controls, acid traps to scrub
NH3 from air being drawn into the system, and air flow controls. The design of in-lab systems
13
is inconsistent, but performance of several laboratory systems used to measure ammonia
volatilization have been studied and NH3 recovery values have varied from 72.9 % to 103%
with varying levels of consistency in the measurements (Table 2.1). Currently, in-lab
volatilization systems are primarily being used to measure NH3 released from manures (Cole
et al., 2005; Miles et al., 2008; Portejoie, 2004; Shi et al., 2001; and Todd et al., 2006).
Inorganic fertilizer studies using in-lab systems are less common, but are increasingly being
performed (Knight, 2007; Rochette et al., 2009; and Susilawati et al., 2009). The detailed
construction and operation of in-lab systems vary among studies, and again, few experiments
have examined factors affecting NH3 recovery within the specific system (Miles et al., 2008
and Ndegwa et al., 2009). These factors include: air flow rate, trapping acid (source,
concentration, and volume), temperature and humidity conditions. In order to ascertain the
validity of data from controlled environment systems, newly designed in-lab systems need to
be tested to determine the system’s NH3 recovery efficiency within an estimated range of
potential NH3 volatilization rates.
The objectives of this study were to: i) describe a controlled-environment
volatilization system used for laboratory studies of NH3 volatilization; and ii) assess the
system’s efficiency and variation in recovering NH3 lost from NH4Cl applied to an alkaline
sand media.
2.3 Materials and Methods
2.3.1 System Design
The NH3 volatility measurement system as tested consists of three temperature-
controlled enclosed cabinets that house six chambers each to which treatments are applied to
soil or other media. Humidified (near 100%) air is passed through each chamber above the
soil media of each chamber at a constant flow rate and temperature. Air exiting the chamber
is collected by acid traps to recover ammonia lost by volatilization. Soil temperature within

14
each chamber is monitored using thermocouples to ensure accurate and even temperatures
within and across each chamber (Brooks Whitehurst Associates Inc., New Bern, NC). A
materials list and prices are in Table 2.2 and the schematic for the system is shown in Fig.
2.1.
The enclosed cabinets are constructed using 9.5 mm thick plywood with the internal
dimensions of 61 cm in width, 61 cm in length, and 46 cm in depth. The lid of the cabinets
lifts off and was constructed to overhang the outside edge of the cabinet. The lid has a rim
that fits securely within the internal dimensions and was insulated using 13 mm thick
Styrofoam® sheath insulation (R value = 3). The temperature within the cabinets is
controlled using a 1/32 Din programmable controller (CN7533, Omega Engineering Inc.,
Stamford, CN). The air temperature sensor (RTD-805, Omega Engineering Inc., Stamford,
CN) used by the temperature controller is mounted on the opposite side of the cabinet from
the heating element. The heating element was fabricated by attaching a silicone rubber heat
strip (2.5 cm x 20 cm, 80 W total,SRFG-108/10-P, Omega Engineering Inc., Stamford CN) to
an angular aluminum strip mounted on a rectangular block (4.1 cm x 4.1 cmx 20 cm long -
90°). An electric fan (2000 rpm, 120x120x25mm, 115 V, 60 Hz, 0.10 A) (BT12025B1L,
CoolerGuys.com, Kirkland, WA) was placed above the heating element to disperse heat and
circulate air inside the cabinet. A wooden baffle (19 mm wide, 30.8 cm long, 28 cm tall) with
ends that angle (20-30o) towards the chambers (14 cm long outside and 13cm long inside)
(Fig. 2.1). A raised platform for the chambers are used to insure uniform heat dispersal
around the chambers (Fig. 2.1).The air supply to the entire system is provided by a oil-less
linear air pump (DDL80-101, Gast Manufacturing Inc., Benton Harbor, MI) that pressurizes
and fills a supply tank. This pump has a max power output of 93 W, air flow rates range from
111-120 L min-1 from 50-60 Hz, and maximum pressure of 0.48 bars. The lines carrying the
air from pump to the supply block are 16 mm OD and 13 mm ID vinyl lines. The air
15
pressure is monitored and regulated for the system at the supply tank. Air exiting the supply
tank is supplied to three distribution manifolds via the same size vinyl line entering the
supply tank. All fittings and connections for the 16 mm vinyl lines are secured by plastic
hose clamps (SNP-2, Cole-Parmer Instrument Co. 95613-03) Each distribution manifold is
used to supply air to six flow meters (0.4-5.0 L min-1 flow meters - EW22461-50, Cole-
Parmer Instrument Co., Vernon Hills, IL). Air exiting the distribution manifold flows through
6.4 mm OD and 4.3 mm ID vinyl hose. This size vinyl hose is what carries the air throughout
the rest of the system. All fittings and connections for this size vinyl hose are secured with
SNP-1 plastic hose clamps (Cole-Parmer Instrument Co. 06832-01). Air from the flow meters
is then sparged through air stones (Coarse Bubbles, Kordon LLC., Hayward, CA) to reduce
the bubble size inside a set of closed cylinders (external humistats) containing water purified
by reverse osmosis (RO). This step saturates the air prior to entering the temperature
controlled cabinet. Air exiting the external humistats is sparged through a second set of air
stones inside a second set of closed cylinders containing RO water (internal humistats) within
the controlled-temperature cabinets. This ensures no decrease in humidity due to the change
in temperature between outside and inside the cabinet. Also, the second humidification step
ensures the air temperature is brought to the temperature within the cabinets. The system was
designed to increase the humidity of the air entering the chambers to a level that approaches
100% humidity and levels cannot be varied with the current system. Air from the internal
humistats is routed into the individual chambers and then into an acid trap specific to each
chamber. Since this is a laboratory system and based on the assumption that ambient NH3
concentrations are below our capacity to detect, the humistats are for humidity purposes only
and do not act as NH3 scrubbers.
The chambers consist of threaded 100 mm by 150mm beakers (21650 B, Kimble
Chase Life Science and Research Products LLC, Vineland, N.J.) and three-hole plastic caps
16
(21650 C3, Kimble Chase Life Science and Research Products LLC, Vineland, N.J.). Two
9.5 mm holes with threaded fittings (threaded on top surface) are used in the cap for the air
entry and exit ports, and a third 3.2 mm threaded hole is used to position the thermocouple
into the soil media. The air entry port uses a portion of a small PVC pipe, same size as the
incoming vinyl tubing, allowing the air to enter 6.4 mm above the soil surface. The air exit
port extends 6.4 mm below the bottom face of the lid. The design allows for the air to move
across the soil surface collecting ammonia, before being forced up exiting the chamber. Once
filled the head space above the sand is 0.527 ± 0.005 L, and at an air flow rate of 1.00 L min-1
the air within each chamber is replaced every 32s.
Temperature data from the soil media chambers were collected by type T
thermocouples (TT36-18U-6-SB, Omega Engineering Inc., Stamford, CN) inserted through a
1/8 hole in the cap of each chamber. Analog signals from the thermocouples were converted
to digital temperature readings using a 22 bit A/D converter (DAQ-56, Omega Engineering
Inc., Stamford, CN). Temperature data from type T thermocouples and temperature control
equipment were calibrated against a NIST Traceable™ digital thermistor (90080-12, Cole-
Parmer Instrument Co., Vernon Hills, IL). Software provided with the A/D converter enables
temperature data storage on the linked computer.
The acid traps were 125 ml plastic bottles (PCR8DB, Specialty Bottles, Seattle, WA)
filled with 50 or 100 ml of acid solution. An air stone is used in each acid trap to reduce the
bubble size passing through the 0.02 M phosphoric acid solution.
2.3.2 System Validation
To validate the laboratory system, four loss-and-recovery trials (I, II, III and IV) were
conducted to determine the recovery efficiency and variability of NH3 volatilization between
each individual chamber. We used a similar method outlined by Cabrera et al. (2001) in that
17
we applied ammonium chloride (NH4Cl) to an alkaline sand media. The sand media was a
mixture of CaCO3 and sand, purchased at a local hardware store. Trials I and II tested the
accuracy and precision of the system to measure NH3 loss at different air flow rates and acid
trap volumes at a standard N rate of 20 mg N per chamber (90 kg N ha-1) and a temperature
of 26ºC. Nitrogen rates were based on a weight basis, using 2.245 million kg soil per ha
furrow slice, then calculating the 90 kg N ha-1 rate. Nitrogen was applied as an ammonium
chloride solution to deliver the required N rate by dripping five milliliters of solution on the
surface of the sand-CaCO3 mixture. Trial III evaluated accuracy and precision of the system
at 30 ºC. Trial IV tested the system over multiple N rates using the most accurate and precise
air flow and acid trap volumes determined from trials I and II.
The duration of trial I was 3 wk (504 h). We limited the run length of trials II, III, and
IV to 2 wk as volatilization losses were minimal after 2 wk. The air flow rates were 2.00 L
min-1 and 1.00 L min-1 for trials I and II, respectively. The volume of acid in the acid traps for
trials I and II were 50 and 100 ml, respectively. Trial II air flow rate and acid volume were
found to produce more precise NH3 loss measurements; therefore, an air flow rate of 1.00 L
min-1 and an acid volume of 100 ml were used for trial III, at a temperature of 30ºC, and trial
IV with multiple N rates. N rates for trial IV were 0, 25, 50, 150, 200, and 250 kg N ha-1
replicated three times. The temperature during trials I, II and IV was 26.0±0.5ºC and
30.0±0.3oC for trial III.
The set-up of the system prior to commencing a trial consisted of making the alkaline
sand media by adding calcium carbonate (CaCO3) to oven dried (60°C) sand at a rate of 12.5
g CaCO3 kg-1 dry sand. The mixture was brought to 20% moisture and oven dried overnight
at 60ºC. The wetting-drying step was repeated three times to ensure the pH of the mixture
equilibrated (pH 7.8-8.1). Five-hundred grams of the oven dried mixture were placed into
each chamber and the chambers placed inside the cabinets. Air flow was then calibrated using

18
an NIST TraceableTM digital flow meter (FMA 1700/1800, Omega Engineering Inc.,
Stamford, CN) at the inlet to each chamber. The external and internal humistats were filled
with 900 and 450 ml of reverse osmosis (RO) purified water, respectively. The internal
humistats were positioned in the cabinet and the cabinet temperature controls were set to the
desired temperature. The water in the internal humistats and the sand-CaCO3 mixture was
allowed to come to temperature overnight (~12 h).
The following day RO water was added to the sand-CaCO3 mixture to attain 10%
moisture content. The acid trap bottles for the initial sampling interval were filled to the
desired volume with 0.02 M phosphoric acid and placed in position. A 5 ml NH4Cl solution
at an N concentration to deliver the desired N rate was surface applied onto the sand-CaCO3
mixture. All air connections were secured and the pump was engaged to commence the trial.
Trapping acid was changed with fresh acid at intervals of 1, 3, 6, 9, 12, 24, 48, 96,
144, 192, 240, 288, 336, 388, 432, and 504 h after starting the trial (trials II, III and IV ended
at h 336). The replaced acid was then weighed and analyzed for NH3 concentration
colormetrically with a Lachat QuickChem Automated Ion Analyzer (Lachat Instruments,
Loveland, CO).
Once the trial concluded a 5 g sample of dry sand-CaCO3 mixture from each chamber
was extracted using 2 M KCl and analyzed colormetrically for NH3 and nitrate (NO3) with a
Lachat QuickChem Automated Ion Analyzer. Moisture content of the sand-CaCO3 mixture
was determined and then used to calculate how much of the mixture was needed to attain a
five gram sample of dry sand-CaCO3 mixture.
2.3.3 Statistics
Using PROC MEANS for SAS 9.2 (SAS Institute, Cary, NC) mean N captured and
standard deviation, for each sampling interval as well as cumulative N captured were

19
computed for each trial. System recovery efficiency (SRE) and acid trap efficiency (ATE)
were calculated for all trials using the following formulas:
Eq. 2.1: System Recovery Efficiency
(%)100*Pr
Re SREiorNNaddedsidualNacidtrapN
Where:
acidtrapN = cumulative mg N captured in acid traps
ResidualN = total mg N extracted in 2M KCl from the sand-CaCO3 mixture after completion of the trial
Nadded = mg N added to each chamber
Prior N = total mg N extracted in 2 M KCl from the sand-CaCO3 mixture with no N added
SRE = System Recovery Efficiency
Eq. 2.2: Volatilization Loss
)(Re)Pr( VLtionLossVolatilizasidualNiorNNadded
Where:
PriorN = N in media prior to addition of fertilizer N
Residual N = NO3-N + NH4-N in the media at the end of the trial
VL =Volatilization Loss

20
Eq. 2.3: Acid Trap Efficiency
(%)100 ATEVL
acidtrapN
Where:
ATE = Acid trap efficiency
Two samples of the sand-CaCO3 mixtures with no N applied were taken from two
separately mixed batches and used to calculate PriorN for trials I and II. Both batches were
mixed at the same rates and with the same sources of sand, CaCO3, and water. No detectable
NO3-N or NH3-N was present in those samples using the 2 M KCl extraction method and
colorimetric analysis.
Analysis of variance was conducted for SRE and ATE using PROC MIXED in SAS
9.2 to determine if acid trapping efficiency changed with N rate in trial IV.
2.4 Results and Discussion
2.4.1 Trials I, II, and III
Mean volatilization loss, acid trap N recovered, ATE, total N recovered from both the
trapping acid and the sand-CaCO3 mixture after completion of the trial (system recovery),
and SRE for trials I , II, and III are shown in table 2.3. Volatilization loss would be a
parameter of interest during the study of simulated production systems using this laboratory
system. The sand and NH4Cl system evaluated does not replicate agricultural environments
and was only intended to serve as a means to validate the laboratory system. The mean
amount of N recovered by the trapping acid was 18.7±0.4 mg N. The mean total amount of
system recovery was 18.8±0.3 mg N. SRE was 94.1±1.5% and ATE was 94.0±1.6%. Mean
acid trap N recovery was 16.8±0.4 mg N. The mean system recovery was 19.4±0.3 mg N.

21
ATE and SRE were 96.7±1.8% and 97.1±1.6%, respectively. These values are similar or
exceed the recovery efficiencies shown by Cabrera et al. (2001). The standard deviations of
these values indicate that even relatively small, i.e. 1 mg N loss during a two week period,
treatment differences in future studies should be readily detectable. Upon raising the
temperature to 30oC the efficiency of the system decreased in trial III (Table 2.3). However,
recovery efficiencies were greater than 90% for trial III, and the variation between chambers
was similar to trial II (Table 2.3).
Mean cumulative N captured by the acid traps is shown in Fig. 2.2 for trials I, II, and
III. Between flow rates, temperatures, and acid trap volumes, the amount of nitrogen trapped
is very similar at the 336 h sampling interval. The standard deviations for total acid trapped at
various times in trials I, II, and III are shown in Fig. 2.3. Variation in cumulative N captured
by the acid traps increases from 1 to 96 h then decreases for the duration of the first three
trials. The maximum variation observed at 96 h can be attributed to the longer sampling
interval (48 h compared to 24h), resulting in larger amounts of NH3 collected in the acid
traps. Trial II exhibited less variation in terms of N capture than trial I, which indicates that
by decreasing flow rate to 1.00 L min-1 and increasing the volume of trapping acid to 100 ml
the system’s variation is decreased. Ndegwa et al. (2009) also found that as the air flow rate
decreased, the efficiency of the acid trap increased. Since the acid trap container was kept
constant during trials I and II, doubling the volume of acid resulted in an increase in depth of
the acid trap. Ndegwa et al. (2009) also found that deeper acid traps increased the efficiency
of the trap. Because air flow rate was decreased and acid depth increased from trial I to trial
II neither factor can solely be identified as responsible for the increase in acid trap and system
efficiency, however both factors may have contributed to the increased recovery observed in
trial II.

22
Trial III showed that similar cumulative amounts of NH3 were captured when
compared to trials I and II (Fig. 2.2). Based on the results from trials I and II, the same flow
rate and acid trap volume were used in trial III. The variation in values was similar between
trials II and III (Fig 2.3). Increasing the temperature to 30oC had little effect on variation
among chambers within the system. This is evidence that the system will produce repeatable
measurements up to 30oC. Measurements above 30oC were not obtainable due to the heating
strip capacity.
From the results of trials I and II, 100 ml of trapping acid and 1.00 L min-1 air flow
rate were chosen to evaluate the system over multiple nitrogen rates (trial IV), since variation
between chambers was decreased and SRE and ATE were highest in trial II Table 3).
2.4.2 Trial IV (Multiple N Rates)
Six N rates were applied randomly to the soil chambers within each cabinet to
evaluate the efficiency of the system over a wide range of N application rates. Equations 1, 2
and 3 were used to calculate SRE and ATE for each N application rate and mean separations
can be found in table 4, respectively. Percentages for the 0 kg N ha-1 are not given because
no measureable N was found in the acid traps at each sampling interval or in the sand after
the trial was completed. The SRE decreased as the N rate increased with the 25 kg N ha-1 rate
having the highest SRE, 95.7±1.5% and 250 kg N ha-1 rate having the lowest with 89.3±2.3%.
Standard deviations ranged from 1.5 to 3.0% (Table 2.4).
The ATE for all N rates applied in trial IV decreased with increasing N application
rates (Table 2.4). The highest ATE was 95.3±1.2% for the 25 kg N ha-1 rate and was
significantly higher than all other treatments. When N rates increased to 250 kg N ha-1 the
ATE dropped to 84.7±2.3%, and was significantly lower than all treatments, except the 200
kg N ha-1 rate. The decrease in ATE with increasing N rates agrees with data by Ndgewa et
23
al. (2009), who also found that the efficiency of the acid traps decreases as the amount of
ammonia to be trapped increases. System recovery efficiency decreased as ATE decreased
which is expected since both SRE and ATE are calculated using N captured in the acid traps
as a variable.
2.5 Conclusions
The need to evaluate a system that will be used in quantitatively measuring a
parameter of interest is essential in producing results that are precise and accurate. The
laboratory ammonia volatilization system described was able to detect and capture over 90%
of the ammonia volatized and maintain variation within individual chambers which will allow
for reliable comparisons of fertilizer or simulated production systems in future trials.
Decreasing the air flow rate to each chamber and increasing trapping acid volumes between
trial I and II resulted in the reduction of variation between chambers and increased ATE and
SRE. We believe this is due to the increased time during the gas-liquid interface in the acid
traps, which allows for increased conversion of NH3 to ammonium (NH4) in the acid. This
increased reaction time may also allow the NH3 to be captured by individual traps more
consistently across all chambers. Since the system performed best at an air flow rate of 1.00 L
min-1 and with 100 ml of trapping acid this configuration was used for trial III. The relatively
low SD values (1.2 to 3.5 %) for all N application rates indicate that relative comparisons
between treatments can be made with confidence.
Increasing the temperature to 30oC decreased the SRE and ATE slightly compared to
that of trials I and II, but was still above 90% at this temperature. The variation remained
similar to that in trial II showing that repeatability did not decrease as temperature increased.
With the high recovery efficiencies and low variation this system will be able to operate at
temperatures up to 30oC in order to simulate different environments in future studies.
24
SRE and ATE decreased as N rates increased from 0 to 250 kg N ha-1. This range
covered N fertilization rates that are routinely used in commercial agricultural production
systems. The reduced SRE and ATE rates at higher N rates can be attributed to the total
amount of NH3 volatilized per unit of time. As NH3 volatilized per unit time increases, the
amount of NH3 within each air bubble increases, and since the time for the reaction to take
place remains constant (constant depth of acid and air flow rate) a lower percentage of NH3 is
successfully captured in the trap. Greater acid trap volumes need to be tested to potentially
increase SRE for higher N rates, i.e. 200 to 250 kg N ha-1.
2.6 References
Cabrera, M.L., D.E. Kissel, R.C. Davis, N.P. Qafoku, and W. I. Segars. 2001. Design and
ammonia-recovery evaluation of a wind speed-sensitive chamber system. Soil Sci.
Soc. Am. J. 65:1302-1306.
Cole, N.A., R.N Clark, R.W. Todd, C.R. Richardson, A. Gueye, L.W. Greene, and K.
McBride. 2005. Influence of dietary crude proteins concentration and source on
potential ammonia emissions from beef cattle manure. J. Anim. Sci. 83:722-731
Freney, J.R., J.R. Simpson, and O.T. Denmead. 1983. Volatilization of Ammonia. P. 1-32. In
J.R.Freney and J.R. Simpson (ed.) Gaseous Loss of Nitrogen from Plant-Soil
Systems. Martinus Nijhoff/ Dr. W. Junk Publishers, The Hague, The Netherlands.
Hargrove, W.L. and D.E. Kissel. 1979. Ammonia volatilization from surface applications
of urea in the field and laboratory. Soil Sci. Soc. Am. J. 43:359-363
Kissel, D., M. Cabrera, N. Vaio, J. Craig, J, Rema, and L. Morris. 2004. Rainfall timing and
ammonia loss from urea in a loblolly pine plantation. Soil Sci. Soc. Am. J. 68:1744-
1750.
Knight, E. C. 2007. Mowing and nitrogen source effects on ammonia volatilization from
turfgrass. Crop Sci. 47 (4):1628-1634.
Miles, D.M., P.R. Owens, P.A. Moore Jr., and D.E. Rowe. 2008. Instrumentation for
25
evaluating differences in ammonia volatilization from broiler litter and cake. J. Appl.
Poult. Res. 17:340-347
Ndegwa, P.M., V.K. Vaddella, A.N. Hristov, and H.S. Joo. 2009. Measuring concentrations
of ammonia in ambient air or exhaust stream using acid traps. J. Environ. Qual.
38:647-653.
O'Halloran, I. P. 1993. Ammonia volatilization from liquid hog manure: influence of aeration
and trapping systems. Soil Sci. Soc. Am. J. 57 :1300-1303.
Portejoie, S., J.Y. Dourmad, J. Martinez, and Y. Lebreton. 2004. Effect of lowering dietary
crude protein on nitrogen excretion, manure composition, and ammonia emission
from fattening pigs. Livestock Prod. Sci. 91:45-55.
Rochette, P., D. A. Angers, M. H. Chantigny, J. D. MacDonald, N. Bissonnette, and N.
Bertrand. 2009. Ammonia volatilization following surface application of urea to tilled
and no-till soils: A laboratory comparison. Soil Tillage Res. 103 (2):310-315.
Shi, Y., D.B. Parker, N.A. Cole, B.W. Auvermann, and J.E. Mehlhorn. 2001. Surface
amendments to minimize ammonia emissions from beef cattle feedlots. Trans. ASAE.
44:677-682.
Susilawati, K., A. Osumanu Haruna, A. M. Nik Muhamad, Y. Mohd Khanif, and J.
Mohamadu Boyie. 2009. Reduction of ammonia loss by mixing urea with liquid
humic and fulvic acids isolated from tropical peat soil. Am. J. of Agric. and Biol.
Sci. 4 (1):18-23.
Terman, G.L. 1979. Volatilization loss of nitrogen as ammonia from surface-applied
fertilizers, organic amendments and crop residues. Adv. Agron. 31:189–223.
Todd, R.W., A.N. Cole, and R.N. Clark. 2006. Reducing crude protein in beef cattle diet
reduces ammonia emissions from artificial feedyard surfaces. J. Environ. Qual.
35:404-411.

26
Torello, W. A., D. J. Wehner, and A. J. Turgeon. 1983. Ammonia volatilization from
fertilized turfgrass stands. Agron. J. 75:454-456.
Fig. 2.1: General schematic of the system used for in-lab ammonia volatilization studies as tested

27
Fig. 2.2:Cumulative N captured in acid traps during trials I ,II, and III

28
Fig. 2.3: Standard Deviation for cumulative N captured for trials I, II, and III

29
Table 2.1: Comparison of system efficiencies and variation for laboratory systems measuring NH3 volatilization.
Study N Source Trapping Acid System Efficiency† System Variation molarity (volume) %
O'Halloran (1993) Liquid Hog Manure 0.32M H3BO3 (50&100mL) 82.1-83.5¶¶ NR¶ or 0.9M H2SO4 (50mL) 94.9¶¶ NR
Kissel et al. (2004) Granular Urea 0.05M H2SO4 (50mL) 72.9-100.6¶¶ NR
Todd et al. (2006) Cattle Manure 0.9M H2SO4 (100mL) NR 2.67‡ mg
Cole et al. (2005) Cattle Manure 0.9M H2SO4 (100mL) NR 1.45‡ mg
Miles et al. (2008) Poultry Litter H3BO3 (60mL) NR 2.6-6.3%§
Ndegwa et al. (2009) NH4Cl 0.2M H2SO4 (150&470mL) 93.5-94.8 NR
Torello et al. (1983) (NH4)2SO4 1.5M H3BO3 95.1-103.0 NR †System efficiency is accountable N post trial divided by applied or previously present N. ‡Standard error of the mean NH3 recovered in the acid traps §Standard deviation of the mean NH3 recovered in acid traps ¶ Data not reported in article ¶¶ Calculated from data provided in article for comparison reasons
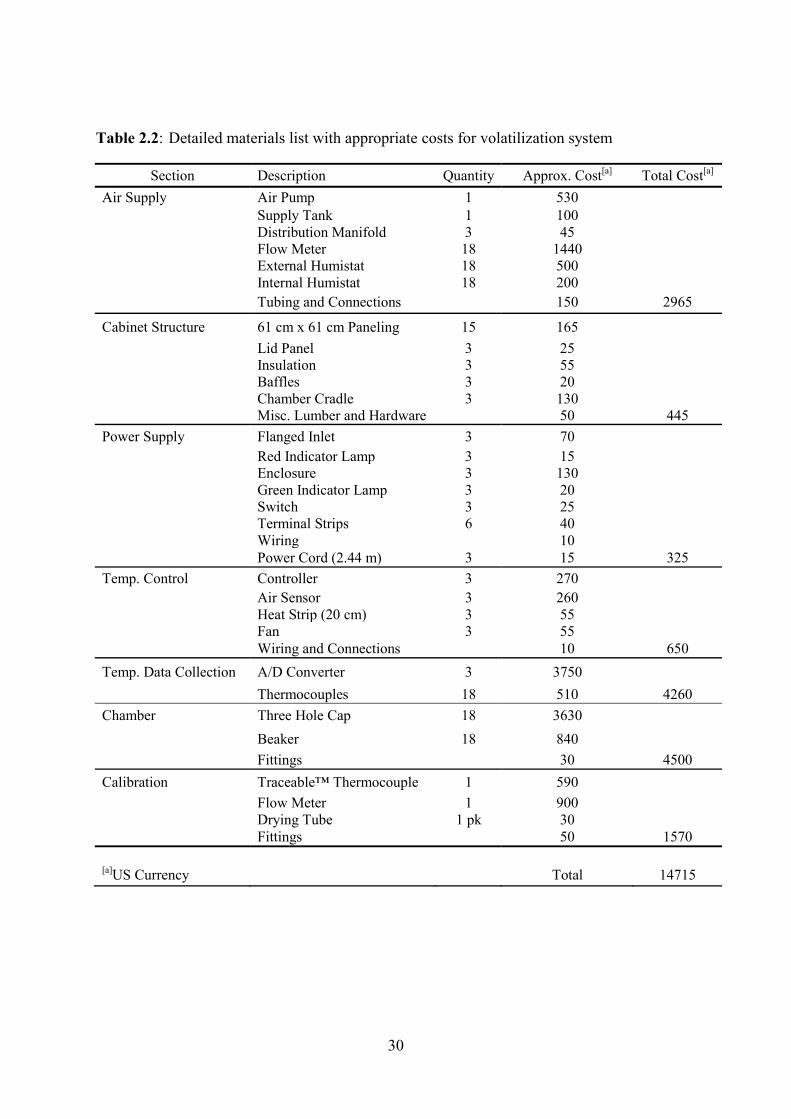
30
Table 2.2: Detailed materials list with appropriate costs for volatilization system
Section Description Quantity Approx. Cost[a] Total Cost[a] Air Supply Air Pump 1 530
Supply Tank 1 100 Distribution Manifold 3 45 Flow Meter 18 1440 External Humistat 18 500 Internal Humistat 18 200
Tubing and Connections 150 2965
Cabinet Structure 61 cm x 61 cm Paneling 15 165 Lid Panel 3 25 Insulation 3 55 Baffles 3 20 Chamber Cradle 3 130
Misc. Lumber and Hardware 50 445 Power Supply Flanged Inlet 3 70
Red Indicator Lamp 3 15 Enclosure 3 130 Green Indicator Lamp 3 20 Switch 3 25 Terminal Strips 6 40 Wiring 10
Power Cord (2.44 m) 3 15 325 Temp. Control Controller 3 270
Air Sensor 3 260 Heat Strip (20 cm) 3 55 Fan 3 55
Wiring and Connections 10 650 Temp. Data Collection A/D Converter 3 3750 Thermocouples 18 510 4260 Chamber Three Hole Cap 18 3630
Beaker 18 840 Fittings 30 4500
Calibration Traceable™ Thermocouple 1 590 Flow Meter 1 900 Drying Tube 1 pk 30
Fittings 50 1570
[a]US Currency Total 14715

31
Table 2.3: Volatilization N loss, acid trap N recovery, system N recovery and calculated efficiencies for trialsI, II, and III with a 90 kg N ha-1 surface application
Trial
I‡ II¶ III¶
Mean† 26°C 30°C Volatilization Loss (mg N) 19.8±0.2§ 17.4±0.3 18.1±0.3
Acid Trap N Recovery (mg N) 18.7±0.4 16.8±0.4 16.7±0.4
System Recovery (mg N) 18.8±0.3 19.4±0.3 18.6±0.2
SRE (%) 94.1±1.5 97.1±1.6 93.0±1.2
ATE (%) 94.0±1.6 96.7±1.8 92.2±1.3
†Averaged across all chambers per trial ‡2.00 L min-1 air rate and 50 mL trapping acid ¶1.00 L min-1 air rate and 100 mL trapping acid § mg N ± standard deviation (SD)
Table 2.4: Mean system recovery efficiencies (SRE) and standard deviation (SD) for all N rates over two weeks for trial IV at 1 L min air flow and 100 ml of 0.02 M phosphoric acid trap volume.
N Rate Total Acid Trap N SRE SD ATE SD
kg∙ha-1 mg % 0 0 f*§ - - - -
25 4.75 e 95.7 a¶ 1.5 95.3 a¶¶ 1.2 50 8.48 d 93.0 b 3 91.7 b 3.5
150 22.55 c 91.0 bc 2 88.0 c 3 200 26.02 b 90.7 bc 1.1 86.0 cd 1.7 250 32.18 a 89.3 c 2.3 84.7 d 2.3
*Significant at the 0.05 probability level. § LSD0.05 = 2.49 mg N ¶LSD0.05 = 2.4% ¶¶ LSD0.05 = 3.1%

32
3 In Vitro Evaluation of Coatings to Control Ammonia Volatilization from Surface-
applied Urea
William Hunter Frame,a* aDepartment of Crop and Soil Environmental Sciences, Virginia Tech, 330 Smyth Hall (0404), Blacksburg, VA 24061, USA *Corresponding author E-mail address: [email protected] Tel.: +1 540 2314521; Marcus M. Alleya aDepartment of Crop and Soil Environmental Sciences, Virginia Tech, 330 Smyth Hall (0404), Blacksburg, VA 24061, USA E-mail address: [email protected] Tel.: +1 540 2319777; fax: +1 540 2313431 Garnett Whitehurstb b Vice President, Whitehurst and Associates, Inc. New Bern, NC 28564, USA E-mail: [email protected] Tel.: 1 252 6382293 Brooks Whitehurstb b President, Whitehurst and Associates, Inc. New Bern, NC 28564, USA E-mail: [email protected] Tel.: +1 252 6382293 Robert Campbellc c Senior Productivity Scientist, Southern Timberlands Research, Weyerhaeuser NR Company Vanceboro, NC 28586, USA E-mail: [email protected] Tel.: +1 252 6337248
33
3.1 Abstract
Ammonia volatilization from surface-applied nitrogen (N) fertilizers containing urea
can be substantial if environmental conditions are favorable. Physical and chemical coating
urea has been effective in preventing ammonia volatilization losses. The objectives of this
study were to quantify the in vitro N loss from surface-applied urea; and measure the rate and
total N volatilization loss from urea coated with calcium sulfate, potassium sulfate, alone and
in combination with the urease inhibitor, N-(n-butyl) thiophosphoric triamide (NBPT). Six
trials, each lasting fourteen days, were conducted using a laboratory system at 26oC, 1.00 L
min-1air flow, an N rate equal to 44.6 mg N kg-1air-dried soil, and 100 ml of 0.02M
phosphoric acid to recover volatilized ammonia. Cumulative ammonia loss from urea ranged
from 33.9- 37.2% of the applied N in all trials. Initial ammonia volatilization losses were
delayed by the addition of calcium and potassium sulfate coatings alone. The inhibitor NBPT
reduced cumulative ammonia losses to 17.9-24.7% of applied N and delayed ammonia
volatilization for 96 hours after N application when applied at the 0.08% w/w application rate
over trials I-IV. During trials V and VI, applying NBPT at 0.02% w/w reduced cumulative
ammonia volatilization from 35.6% and 35.1% to 25.4% and 24.1% respectively. No
difference in cumulative ammonia loss was observed above NBPT rates of 0.04% in both
trials. The inhibitor NBPT had the greatest influence on ammonia volatilization losses in
these studies and further research needs to be conducted to determine optimum levels of the
urease inhibitor in field situations.
3.2 Introduction
Urea fertilizer supplies N to a majority of agricultural systems worldwide. With the
increasing need for more efficient nutrient management strategies, there has been extensive
research conducted to reduce the inefficiencies associated with urea. The major inefficiency
34
of urea arises from volatilization of ammonia (NH3) during the hydrolysis of urea by urease,
an enzyme found ubiquitously throughout agricultural systems (Krajewska, 2009). Urease
catalyzes the reaction that converts urea to carbamate and ammonium. The carbamate
molecule decomposes into bicarbonate and ammonium (Ciurli et al., 1999). The bicarbonate
ion increases the soil pH converting ammonium to ammonia (Ciurli et al., 1999; Kissel et al.,
2008; Krajewska, 2009). Once urea is converted to ammonia, N is lost through volatilization
if left on the soil surface. Nitrogen losses from urea through volatilization can be as great as
70% of the applied fertilizer N, with losses of 35% to 50% of applied fertilizer N in
laboratory and field studies commonly reported under favorable environmental conditions
(Antisari et al., 1996; Bayrakli, 1990; Beyrouty et al., 1988; Carmona et al., 1990;
Christianson et al., 1990; Christianson et al., 1994). Ammonia volatilization loss of N
contributes to the reduction of nitrogen use efficiency (NUE) of agronomic systems which
have been estimated to average 33% worldwide (Raun and Johnson, 1999).
Urea hydrolysis raises soil pH adjacent to urea granules, inhibiting nitrification,
resulting in excess ammonia and conditions favoring ammonia volatilization. Surface
application of urea without a means to control the hydrolysis reaction will result in ammonia
on the soil surface in this high pH zone. Urease activity varies with soil characteristics such
as soil texture, moisture, temperature, crop residue, and organic carbon (Antisari et al., 1996;
Bremner and Douglas, 1973; Carmona et al., 1990; Krajewska, 2009; Rawluk et al., 2001;
Sanz-Cobena et al., 2008). Soil urease is unique compared to ureases derived from living
organisms in that it is more stable and persistent in the soil environment. The enzyme urease
accumulates in soil systems and can be found adsorbed to soil mineral particles and humic
substances (Kiss and Simihaian, 2002). This adsorption inhibits the ability of microorganisms

35
to metabolize urease allowing for excess amounts to build within the soil with the result that
more than enough urease to rapidly hydrolyze fertilizer urea exists in most soils.
Multiple control measures can be implemented to prevent N loss as ammonia
volatilization from agricultural systems. Growers typically try to apply urea-based N
fertilizers prior to a rainfall event to ensure movement of urea into the soil profile, or they
incorporate urea into the soil. Both management strategies are extremely effective in
preventing ammonia volatilization from urea. However, many times growers do not have the
luxury of waiting for rain or irrigation to apply nutrients because they must ensure that
nutrients are applied so that plant growth is not limited by N. In order to do this, farmers may
apply urea when rain is not in the immediate future, which can potentially lead to
volatilization losses of N. Alternative approaches have incorporated urea fertilizers using
banded applications next to the row while others used chemicals that inhibit soil urease
creating a time after urea application in which volatilization losses are low with the
anticipation that rain will occur to move the urea into the soil.
Many studies have been conducted to find the most effective urease inhibitor but few
have produced commercially viable options for controlling ammonia volatilization (Kiss and
Simihaian, 2002). The urease inhibitor, N-(n-butyl) thiophosphoric triamide (NBPT), has
been found to be the most effective in controlling ammonia volatilization (Byrnes and
Amberger, 1988; Chai and Bremner, 1987; Watson, 2005). NBPT is degraded in soil to N-(n-
butyl) phosphoric triamide (NBPTO) which is a competitive inhibitor of urease. Competitive
inhibitors of enyzmes bind directly to the active site of the enzyme, thus competing with the
substrate (urea in the case of urea N fertilizers) at the enzyme active site. During field and
laboratory studies NBPT has successfully decreased urea hydrolysis in varying soil types and
tillage systems. Carmona et al. (1990) reported a reduction in N losses through ammonia
volatilization from 52% in uncoated urea to only 14.7% using 0.05% NBPT on a weight
36
basis. Byrnes and Amberger (1989) showed similar results with the N loss of 73.4% in a
simulated flooded soil using untreated urea with only 34.7% loss of applied N when treated
with NBPT. Antisari et al. (1996) found that the magnitude of reduction in ammonia
volatilization varied from soil to soil and concluded different rates of NBPT may be needed
for different soil types. This supports the evidence of changing urease activity with changing
soil characteristics previously mentioned.
Until recently, Agrotain® (Koch Agronomic Services, Wichita, KS) was the only
commercially available source of NBPT being widely marketed. Weyerhaeuser Co. (Federal
Way, WA) and Brooks Whitehurst Associates Inc. (New Bern, N.C.) have developed a
different solvent system (Trade Name Arborite® Ag) to adhere NBPT to the surface of urea
granules. The NBPT solvent system developed by Weyerhaeuser and Brooks Whitehurst
Associates Inc. can also be used as a binder to attach physical coatings (i.e. calcium sulfate
and potassium sulfate) to the surface of urea granules alone, or in combination with the
urease inhibitor, NBPT. This technology has the potential to supply various nutrients and
adjust nutrient blends for selected regions or cropping systems because the coatings are
applied at the fertilizer blend plant prior to application.
The objectives of this experiment were: 1) quantify ammonia volatilization losses
from surface applied urea under controlled laboratory conditions favoring volatilization; 2)
measure the rate and total N volatilization loss from uncoated urea and urea coated with
calcium sulfate, potassium sulfate, and with or without NBPT incorporated into the sulfur-
coatings and 3) measure the effect of NBPT application rate upon ammonia volatilization
losses from granular urea.
37
3.3 Material and Methods
3.3.1 General
The study consisted of six trials to quantify the reduction, if any, in ammonia
volatilization from physical and chemical coatings applied to granular urea. Each trial was
conducted in the laboratory using the ammonia volatilization system described by Woodward
et al. (2011). The ammonia volatilization measurement system consisted of three temperature
controlled cabinets, each containing six individual soil chambers. Each soil chamber was
filled with 500 grams of air-dried soil limed to a pH of 6.5-6.7. During all trials, air flow rates
through the soil chambers were controlled at 1.00 L min-1 and temperatures were maintained
at 26 °C. The headspace in the chambers during the trials was on average 0.43 L resulting in
2.33 exchange volumes per minute. Moisture laden air was used to sweep ammonia vapors
from the soil chambers (Woodward et. al 2011).
Nitrogen was applied at the rate of 44.6 mg N kg-1 air dry soil, N application rate
approximating 100 kg N ha-1, for all fertilizer treatments. All urea fertilizers were sieved to
pass an 8 mesh sieve and retained on a 10 mesh sieve. This ensured uniformity of granule
size and more accurate treatment weights. Five to six granules were equally spaced on the
surface of the soil in each chamber to achieve the desired N rate.
The soil used was the A horizon from a Fine-loamy, mixed, active, mesic Ultic
Hapludalf (Wheeling silt loam). Soil was air-dried and passed through a 2 mm sieve.
Physical and chemical characteristics of the soil are in table 3.1. Before each trial the soil
was limed with calcium oxide (CaO) at a rate of 0.7 g CaO kg-1 air dried soil to adjust the pH
to 6.5-6.7 (Table 3.1). After liming, the soil was weighed for each individual chamber and 65
ml of deionized water were added to the soil in each chamber and thoroughly mixed to ensure
consistent moisture throughout the soil within the chamber. The addition of water raised the
soil moisture content to approximately two-thirds of field capacity (~14%) (Table 3.1). This
38
ensured adequate soil moisture to dissolve urea granules and provide conditions for
volatilization. Once the moisture equilibrated throughout the soil, the chamber was placed
inside the specified temperature controlled cabinet for twenty-four hours to equilibrate the
moistened soil to 26 °C. After equilibration, the fertilizer granules were placed on the
moistened soil surface of each chamber.
Acid traps containing 100 ml of 0.02M ortho-phosphoric acid captured volatilized
NH3 in the air stream flowing over the soil surface, and acid traps were changed at 1, 3, 6, 9,
12, 24, 48, 72, 96, 120, 144, 168, 216, 264, 312, and 336 hours (two weeks) after initiation of
each trial. Acid traps were weighed and total volume of solution calculated using the density
of 0.02M phosphoric acid at 25 oC. Ammonical N concentration in the acid traps was
determined colorimetrically using a Lachat QuickChem Automated Ion Analyzer (Lachat
Instruments, Loveland, CO). Ammonia captured from soil without N fertilization was
averaged and subtracted from other acid trap totals at each sampling interval for individual
trials. Ammonia levels in the acid traps from soil checks ranged from 0.05-0.25 mg N
captured over the duration of a two week trial, and these levels did not fluctuate from trial to
trial.
Upon completion of each trial the soil from each chamber was immediately air-dried
in a greenhouse for 24 h. Air-dried soil was extracted with 2M KCl to determine ammonium
and nitrate concentrations. Concentrations of ammonium and nitrate were determined
colormetrically using the Lachat QuickChem Automated Ion Analyzer (Lachat Instruments,
Loveland, CO). The soil nitrate, soil ammonium, and the ammonia in the acid traps were used
to calculate the mass balance system N recovery (Woodward et al, 2011). The average
percent of urea-N hydrolyzed over all chambers during each trial in this study ranged from
96.3-99.7% of the applied N with average standard deviations ranging from 2.2-3.1% of

39
applied N. The recovery of applied N over all chambers indicated that urea hydrolysis was
nearly complete over the two week trials.
All trials were analyzed as randomized complete block designs with repeated
measures. Blocks were individual cabinets with treatments randomized among each chamber
within each cabinet, totaling three replications for each treatment. Each trial was analyzed
separately using analysis of variance (ANOVA) with the Proc Mixed model in SAS (SAS
Institute, 2009). Least significant difference (LSD) mean separation was used to determine
treatment differences in cumulative N captured in acid traps and N captured at each sampling
interval.
3.3.2 Trials I and II
Trials I and II consisted of four different coating treatments on granular urea, urea,
and a “check” Wheeling silt loam to which no N was applied, totaling six treatments (Table
3.2). The urea treatment in trials I and II served as the positive control treatment. The urease
inhibitor, N-(n-butyl) thiophosphoric triamide (NBPT) was applied to the granular urea using
two different solvent systems to bind the molecules of NBPT to the granule. The inhibitor
was applied at the North American Industry standard rate of 0.08% w/w. The first method to
bind the inhibitor to urea is the commercially available formulation, Agrotain® (Agrotain-
coated urea). The second method is a new solvent system technology under the trade name,
Arborite® Ag. Using Arborite® Ag two physical coatings were applied in conjunction with
NBPT to urea. Calcium sulfate (-325 mesh) (CaSO4-coated+NBPT) and potassium sulfate (-
50 mesh) (K2SO4-coated+NBPT) were applied in a powder form to urea resulting in
fertilizers with the analyses of 39.9-0-0-3.0S and 36.6-0-7.4-3.2S, respectively. All coatings
were prepared by Brooks Whitehurst Associates Inc. laboratories, developer of the Arborite®
Ag technology.

40
3.3.3 Trials III and IV
Trials III and IV differentiate the impact of the physical coatings from the urease
inhibitor, NBPT. Treatments in trial III were non-coated urea, Agrotain®-coated urea,
Arborite® Ag urea, and the check. The last two treatments in this trial are the CaSO4-coated
urea, with and without the NBPT. In trial IV the first four treatments remain the same as in
trial III; however the last two treatments were K2SO4-coated urea, with and without NBPT.
The calcium and potassium sulfate coated urea without NBPT used the same solvent system
of Arborite® Ag but without NBPT.
3.3.4 Trials V and VI
Trial V and VI assessed the application rate of NBPT applied to the urea granule. Six
rates of NBPT, on a percent by weight basis, were used during this trial being 0.00, 0.02,
0.04, 0.06, 0.08, and 0.1%. The Arborite® Ag binder was used as the carrier to coat the urea
granules with the different concentrations of NBPT during this trial.
3.4 Results and Discussion
3.4.1 Trials I and II
Trials I and II were conducted to compare urea to coated urea containing NBPT from
Agrotain® and Arborite® Ag as well as physically coated urea with Arborite® Ag. Ammonia
losses were negligible from N treatments for one to six hours after N application (Fig. 3.1).
At 9 h after fertilizer application ammonia volatilization from urea was greater than the
coated treatments in trials I (0.65%) and II (0.58%).This loss was not significant for trial I
due to slightly larger variation, standard error of 0.28%, compared to a standard error for trial
II of 0.18%. From 12 to 72 h ammonia volatilization at each sampling interval was
significantly greater from urea than the coated urea products for both trials I and trial II. The

41
greatest loss of N from urea came between 12 and 24h after application with losses of 17.2 %
(1.4 % of applied N h-1) and 17.6 % (1.5% of applied N h-1) of applied N for trials I and II,
respectively. The ammonia loss from 12 to 24 h equaled 46.7 and 51.9% of the total ammonia
loss during the two week period for trials I and II respectively. Ammonia loss, within
sampling intervals, from urea decreased from 24 to 336 h after urea application and was
significantly lower than the coated treatments from 96 to 264 h in both trials I and II.
Cumulative ammonia volatilization N losses from urea plateau beyond 96 h after
application, and cumulative N loss was 36.8 and 33.9 % of applied N for trials I and II,
respectively (Figs. 3.1 and 3.2). Cumulative N loss for non-coated urea was significantly
higher than all NBPT-coated materials for trials I and II, but none of the coating treatments
differed in cumulative N loss (Figs. 3.1 and 3.2). The coated materials slowed ammonia
volatilization losses out to 96 h after N application (Figs. 3.1 and 3.2). For the inhibitor only
coatings, Agrotain® and Arborite® Ag, cumulative ammonia loss as well as ammonia loss at
each sampling interval did not differ for trial I (Fig. 3.1). Ammonia losses from Agrotain®
and Arborite® Ag were greatest from 96 to 120 h with a maximum ammonia loss rate of
0.20% and 0.19% of the applied N h-1 during trial I. Losses during trial II for Arborite® Ag
were greatest from 120 to 144 h (0.16% of applied N h-1) whereas Agrotain® did not reach a
maximum ammonia loss rate until 168 h (0.15% of applied N h-1) (Fig. 2). Agrotain® had
significantly lower ammonia loss at the 120 h (2.70% of applied N) and 144 h (3.31% of
applied N) sampling intervals than Arborite® Ag (3.46% of applied N at 120 h and 3.93% of
applied N at 144 h) during trial II. These two sampling intervals during trial II were the only
sampling intervals throughout trials I-IV where Agrotain® and Arborite® Ag were found to be
significantly different ( Figs. 3.1-3.4). In all trials, cumulative N loss at the end of the two
week sampling period from Agrotain® and Arborite® Ag were similar.
42
The CaSO4-coated+NBPT and K2SO4-coated+NBPT reached a maximum ammonia
loss rate from 120 to 144 h with maximum ammonia loss rates of 0.17% and 0.16% of
applied N h-1 during trial I. The CaSO4-coated+NBPT treatment lost significantly lower
amounts of ammonia at the 96 h (2.42% of applied N) than Arborite® Ag (3.28% of applied
N) as well as being significantly lower at 120 h (3.86% of applied N) than Agrotain® (4.67%
of applied N) and Arborite® AG (4.79% of applied N) during trial I. The K2SO4-
coated+NBPT treatment lost significantly less ammonia at 96 (2.01% of applied N) and 120h
(3.18% of applied N) than Arborite® AG (3.28% of applied N at 96h and 4.79% of applied N
at 120 h) and Agrotain® (2.99% at 96h of applied N and 4.67% of applied N at 120 h), during
trial I. The CaSO4-coated+NBPT and K2SO4-coated+NBPT treatments were not statistically
different during any sampling interval during trial I.
During trial II, the CaSO4-coated+NBPT treatment reached a maximum ammonia
loss rate from 120 to 144 h with an ammonia loss rate of 0.15% of the applied N h-1, while
the K2SO4-coated+NBPT treatment reached a maximum ammonia loss rate of 0.16% from
144 to 168 h. However, the CaSO4-coated+NBPT treatment was only significantly different
from Arborite® Ag during the 216 h sampling interval with ammonia losses of 3.77% and
3.22% of applied N, respectively. The K2SO4-coated+NBPT treatment had significantly
lower ammonia loss (2.69% of applied N) than Arborite® AG (3.46% of applied N) at 120 h ,
but ammonia losses for K2SO4-coated+NBPT (4.57% of applied N) were significantly higher
than Arborite® AG (3.22% of applied N) at 216 h .The physically coated treatments did not
differ from Agrotain at any sampling interval during trial II.
Cumulative N loss did not differ between CaSO4-coated+NBPT, K2SO4-
coated+NBPT, Agrotain® and Arborite® Ag (Figs. 3.1 and 3.2). Cumulative N loss for
CaSO4-coated+NBPT, K2SO4-coated+NBPT, Agrotain® and Arborite® Ag ranged from 22.1-

43
24.8 % and 17.9-20.8% for trials I and II, respectively. Physically coating the urea granule
did not significantly decrease the amount of ammonia loss beyond that of the inhibitor, NBPT
alone over the two week trial period.
3.4.2 Trials III and IV
Trial III was designed to determine the effect on ammonia volatilization when urea
was coated with CaSO4 alone compared to products utilizing the inhibitor NBPT alone, or in
combination with the CaSO4 coating. Ammonia volatilization from non-coated urea was
similar to trials I and II with the peak ammonia loss occurring at the 24 h sampling interval,
17.8% of applied N. When CaSO4 was applied to urea granules, ammonia volatilization was
delayed 24 h and the maximum ammonia loss rate was 0.74% of applied N h-1 with a total of
8.93% of the applied N being lost by the 24 h sampling interval. The hourly ammonia loss
rate with CaSO4-coated urea reached a maximum during the same sampling interval as urea
alone (1.5% of applied N h-1) but the physical coating reduced the ammonia loss rate by 50%
during the sampling interval. Ammonia loss from CaSO4-coated urea was 12.13, 4.87, and
2.48% of applied N at 48, 72, and 96 h respectively. Ammonia losses for CaSO4-coated urea
were significantly higher than urea (6.08, 2.71, and 1.68% of the applied N) over the same
sampling intervals. Ammonia losses were the same for CaSO4-coated urea and urea alone
beyond 96 h after N application. The higher losses of N from CaSO4-coated urea resulted in
cumulative losses that were the same as urea at the conclusion of trial IV (Fig. 3.3)
The CaSO4-coated+NBPT treatment significantly reduced ammonia losses during the
96, 120, and 144 h sampling intervals with (1.34, 2.27, 3.29% of the applied N) compared to
Arborite® Ag (2.14, 3.55, and 4.55% of the applied N). CaSO4-coated+NBPT (2.27, 3.29, and
3.49% of the applied N) significantly reduced ammonia losses compared to Agrotain® during
the 120, 144, and 168 h sampling intervals (3.32, 4.39, and 4.61% of the applied N). The

44
maximum ammonia loss rates for the coatings containing NBPT occurred at 144 h for
Arborite® Ag (0.19% of the applied N h-1) and 168 h for Agrotain® (0.19% of the applied N
h-1) and CaSO4-coated+NBPT (0.15% of the applied N h-1). Coatings containing NBPT
continued to volatilize significantly higher amounts of ammonia within sampling intervals
until 264 h (11 days) after N application. The higher levels of ammonia loss at later sampling
intervals indicated that urea hydrolysis was still occurring at 264 h when NBPT was used.
The higher losses of ammonia were due to the delayed urea hydrolysis with NBPT indicated
by lower ammonia loss from 0 to 96 h and low concentrations of urea left at the soil surface
due to the rapid hydrolysis of urea without NBPT. However, ammonia loss was the same
among all treatments within the sampling intervals from 312 to 336 h. All coatings that
received NBPT had significantly lower cumulative N loss than urea applied without NBPT
(Fig. 3). When NBPT was applied with and without the CaSO4 coating cumulative ammonia
volatilization losses were 24.6, 23.3, and 19.4% for Agrotain®, Arborite® Ag and CaSO4-
coated+NBPT respectively (Fig. 3.3).
Trial IV was identical in treatment design as trial three with K2SO4 replacing CaSO4
as the physical coating. Non-coated urea released ammonia within 9 h after N application
and reached a maximum rate of ammonia volatilization 24 h after application with 17.8%
(1.5% of the applied N h-1) of the N being lost from 12 to 24 h (Fig. 3.4). When urea was
coated with K2SO4, ammonia volatilization was delayed until 24 h with 0.7% of the applied
N lost. Ammonia loss from the K2SO4- coated urea was 3.31% of the applied N at 48 h and
was significantly lower than 7.98% loss from urea. Ammonia loss from K2SO4- coated urea
was significantly higher than from urea at 72 to 216 h. However, the maximum ammonia loss
rate of 1.4% of the applied N h-1 for urea occurred from 12 to 24 h where the maximum
ammonia loss rate for K2SO4- coated urea was 0.21% of the applied N h-1 from 72 to 96 h.

45
The K2SO4- coating delayed ammonia loss for 48 h, reduced the maximum rate of ammonia
loss by 0.9% of the applied N h-1, and also delayed the time to reach maximum ammonia loss
for 3 days (Fig. 3.4)
The K2SO4- coated urea lost significantly greater amounts of ammonia than coatings
containing NBPT from 24 to 120 h during trial IV. Maximum ammonia loss rates for the
coatings containing NBPT occurred from 144 to 168 h and were 0.17, 0.16, and 0.19% of the
applied N h-1, corresponding to 4.05, 3.75, and 4.58% of the applied N for Arborite Ag®,
Agrotain®, and K2SO4- coated+NBPT (Fig.4). Ammonia losses from coatings containing
NBPT were higher than K2SO4- coated urea from 168 to 312 h. The higher ammonia loss
with NBPT at later sampling intervals is evidence that the inhibitor delayed urea hydrolysis
up to 11 to 13 days after N application.
Cumulative ammonia volatilization by 120 h was under 5% of the applied N when
NBPT was applied and no differences among treatments receiving NBPT were seen until 168
hours after N application when Agrotain® differed from K2SO4-coated+NBPT (Fig. 3.4). The
K2SO4 –coated urea did delay and significantly decrease the cumulative N lost from ammonia
volatilization (Fig. 3.4).
Nitrogen loss was lower with the K2SO4- coating, than urea alone; however NPBT
further decreased ammonia volatilization compared to K2SO4 alone (Fig. 4). It has been
postulated that alkali and alkaline earth metals may displace calcium from cation exchange
sites, resulting in calcium reacting with bicarbonate produced during urea hydrolysis creating
a precipitate (Fenn et al., 1982). The reaction, known as the “Fenn reaction”, minimizes the
pH increase around the zone of high urea concentration and decreases the amount of
ammonia gas formed (Fenn et al., 1982; Kiss and Simihaian, 2002). The reduction in
ammonia volatilization during the K2SO4 and CaSO4 trials is most likely due to the reduced

46
pH in the urea concentrated zone after dissolution. The greater effect observed for potassium
sulfate is attributable to its greater solubility in water (11.1 g/100 mL at 20 oC) versus the
solubility of calcium sulfate (0.21 g/100 mL at 20 oC). Observations during the trial revealed
that a shell of CaSO4 was left on the soil surface after the two week trial while there were no
physical remains of K2SO4. Bayrakli (1990) found that phosphogypsum decreased ammonia
volatilization when mixed into the soil with urea. The results from this study indicate that
calcium sulfate and potassium sulfate (Figs. 3.3 and 3.4) alone did delay ammonia
volatilization intially, and in the case of potassium sulfate (Fig. 3.4) decreased cumulative
ammonia volatilization when applied as a coating to urea granules.
3.4.3 Trials V and VI
Trials V and VI were conducted to ascertain the effectiveness of NBPT at different
applicatioin rates, using Arborite® Ag. When no inhibitor was applied to the urea granules,
the ammonia volatilization rate again peaked at 24 h with an ammonia loss rate 1.4 and 1.2%
of the applied N h-1 in trials V and VI, respectively. Ammonia volatilization did not differ as
NBPT rate increased from 0.02 to 0.1% for the first 48 h in trial V and the first 24 h in trial
VI. During the 48 h sampling in trial VI the 0.02% NBPT treatment lost 0.81% of the applied
N and was significantly higher than NBPT levels of 0.06, 0.08, and 0.1% with losses of 0.33,
0.31, and 0.30% of the applied N. The 0.02% NBPT rate reached a maximum ammonia loss
rate of 0.22% of the applied N h-1 (5.35% total N loss) at 144 h during trial V and 0.22% of
the applied N h-1 (5.38% total N loss) at 120 h during trial VI. The 0.04% reached maximum
ammonia loss rates at 144 h in both trials V and VI with rates of 0.21 (5.11% total N loss)
and 0.17% of the applied N h-1(4.06% total N loss). The three higher NBPT rates (0.06, 0.08,
and 0.1%) all showed maximum ammonia loss rates at 168 h during trial V and VI. The
addition of NBPT to the urea granule delayed the maximum ammonia loss rate with each

47
addition of NBPT up to 0.06%. At NBPT rates of 0.08 and 0.1% no additional effects were
seen in ammonia volatilization control compared to the 0.06% NBPT rate.
As the rate of NBPT increased, ammonia volatilization decreased in both trials V and
VI. At NBPT rates of 0.02% w/w cumulative ammonia volatilization decreased from 35.6%
and 35.1% to 25.4% and 24.1% for trials V and VI, respectively. However, for NBPT rates
ranging from 0.04% to 0.1% cumulative ammonia volatilization losses ranged from 23.6% to
19.4% with no differences in either trial V or VI (Figs. 3.5 and 3.6). When NBPT was
applied at rates equal to or above 0.06% ammonia volatilization remained below five percent
of applied N until 120 hours after N application (Figs. 3.5 and 3.6). By applying more
NBPT, ammonia volatilization was delayed an extra 48 hours over the 0.02% NBPT rate,
however, cumulative volatilization did not differ between the 0.04% and 0.1% NBPT rates.
This delay in N loss could allow for a more flexible time frame for N application in
comparison to trying to match rainfall events and N application to a smaller time window.
3.5 Conclusions
Ammonia volatilization (32-35% total N loss) from urea during the six trials was
similar in total N loss to other laboratory trials (Antisari et al, 1996; Carmona et al., 1990;
and Rawluk et al. 2001). Urea reached a maximum volatilization rate from twelve to 12-24 h
after N application when conditions were favorable for volatilization. The inhibitor NBPT
delayed ammonia volatilization in all trials; however reduction in ammonia volatilization was
not as great as in previous research (Rawluk et al., 2001). The higher ammonia volatilization
with NBPT treatment in our studies compared to other studies in the literature may be due to
diffusion away from the zone of NBPT in other studies, because of higher soil moisture
contents. The conditions of our trials may allow greater interaction of the urea granules with
soil urease resulting in higher rates of ammonia volatilization. Urease inhibitors do not stop

48
urea hydrolysis, but their use allows for the urea in the soil solution to diffuse into a greater
volume of soil minimizing the pH increase and the resulting ammonia volatilization.
The physical coatings did not have an additive effect in controlling ammonia
volatilization when applied with NBPT. Though when applied alone the physical coatings did
delay ammonia volatilization for 24 hours. This supports other research cited by Kiss and
Simihaian (2002) which reported that alkali and alkaline earth metals may reduce ammonia
volatilization. The physical coatings tested in this trial allow for sulfur, in the form of
CaSO4 or K2SO4, to be applied with N which may be useful in many regions. However, the
low solubility of CaSO4 may limit its effectiveness for ammonia volatilization control. By
coating the urea with the aforementioned physical coatings the need for a plant available N
and S fertilizer could be met. However, applying a coating to urea adds additional cost as
well as lowers the N content of urea. The additional cost associated with CaSO4 and K2SO4
coated ureas may be offset by the value of sulfur and potassium in the coating.
Increasing NBPT rates decreased ammonia volatilization in the initial hours after
application, but cumulative N loss from the 0.04% to 0.1% rates did not differ significantly.
The inhibitor NBPT is a very efficient urease inhibitor and rates as low as 0.02% w/w, NBPT
can decrease ammonia volatilization. At NBPT rates of 0.04 to 0.1% w/w ammonia
volatilization was delayed an extra 48 hours which could be beneficial. Our data indicate that
0.04-0.06% NBPT produce the same total ammonia volatilization control under laboratory
conditions, as the North American industry standard rate of 0.08% NBPT. Further research is
needed to confirm these findings and determine optimum NBPT rates for field conditions;
and to determine how NBPT in combination with various physical coatings can be most
effectively utilized to increase N use efficiency of urea fertilizers in agronomic crop
production.

49
3.6 References
Antisari L.V., C. Marzadori, P. Gioacchini , S. Ricci, and C. Gessa 1996. Effects of the
urease inhibitor N-(n-butyl)phosphorothioic triamide in low concentrations on
ammonia volatilization and evolution of mineral nitrogen. Biol. Fertil. Soils 22:196-
201.
Bayrakli F. 1990 .Ammonia volatilization losses from different fertilizers and effect of
several urease inhibitors, CaCl2 and phosphogypsum on losses from urea. Fert. Res.
23:147-150.
Beyrouty C.A., L.E. Sommers, and D.W. Nelson. 1988. Ammonia volatilization from
surface-applied urea as affected by several phosphoroamide compounds. Soil Sci Soc
Am J 52:1173-1178.
Bremner J.M. andL.A. Douglas. 1973. Effects of some urease inhibitors on urea hydrolysis in
soils. Soil Sci Soc Am J 37:225-226.
Byrnes B.H. and A. Amberger. 1989. Fate of broadcast urea in a flooded soil when treated
with N-(n-butyl) thiophosphoric triamide, a urease inhibitor. Fert. Res. 18:221-231.
Carmona G., C.B. Christianson, and B.H. Byrnes. 1990. Temperature and low concentration
effects of the urease inhibitor N-(n-butyl) thiophosphoric triamide (nBTPT) on
ammonia volatilization from urea. Soil Biol. Biochem. 22:933-937. DOI: Doi:
10.1016/0038-0717(90)90132-j.
Cassell, D.K. and D.R. Nielsen. 1998. Field Capacity and Available Water Capacity. In A.
Klute (ed.) Methods of soil analysis. p. 901–926.
Chai H.S. and J.M. Bremner. 1987. Evaluation of some phosphoroamides as soil urease
inhibitors. Biol. Fertil. Soils 3:189-194.
50
Christianson C., B. Byrnes, and G. Carmona. 1990. A comparison of the sulfur and oxygen
analogs of phosphoric triamide urease inhibitors in reducing urea hydrolysis and
ammonia volatilization. Fert. Res. 26:21-27.
Christianson C., G. Carmona, M. Klein, and R. Howard. 1994. Impact on ammonia
volatilization losses of mixing KCl of high pH with urea. Fert. Res. 40:89-92.
Ciurli S., S. Benini, W.R. Rypniewski, K.S. Wilson, S. Miletti, and S.Mangani. 1999.
Structural properties of the nickel ions in urease: novel insights into the catalytic and
inhibition mechanisms. Coordination Chem.Rev. 190-192:331-355. DOI: Doi:
10.1016/s0010-8545(99)00093-4.
Fenn, L. B., J. E. Matocha, and E. Wu. 1982. Substitution of ammonium and potassium for
added calcium in reduction of ammonia loss from surface-applied urea. Soil Sci. Soc.
Am. J. 46:771-776.
Kiss S., and M. Simihaian. 2002. Improving efficiency of urea fertilizers by inhibition of soil
urease activity Kluwer Academic Publishers, Dordrecht, The Netherlands.
Kissel, D.E., S. Paramasivam, and M.L. Cabrera. 2008. Ammonium, ammonia, and urea
reactions in soils. p. 101-155. IN J.S. Schepers and W.R. Raun (Eds) Nitrogen in
Agricultural Systems. Agron. Monogr. No. 49, Am. Soc. of Agron., Madison, WI.
Krajewska B. 2009. Ureases I. Functional, catalytic and kinetic properties: A review. J. of
Mol. Catalysis B: Enzymatic 59:9-21. DOI: DOI: 10.1016/j.molcatb.2009.01.003.
Raun, W.R. and G.V. Johnson. 1999. Improving nitrogen use efficiency for cereal
production. Agron. J. 91:357-363.
Rawluk C.D.L., C.A. Grant, and G.J. Racz. 2001. Ammonia volatilization from soils
fertilized with urea and varying rates of urease inhibitor NBPT. Can. J. Soil Sci.
81:239-246.
51
Sanz-Cobena A., T.H. Misselbrook, A. Arce, J.I. Mingot, J.A. Diez, A. Vallejo. (2008) An
inhibitor of urease activity effectively reduces ammonia emissions from soil treated
with urea under Mediterranean conditions. Agric., Ecosystems & Environ. 126:243-
249. DOI: 10.1016/j.agee.2008.02.001.
SAS Insitute. 2009. Users Guide: Statistics 2nd Edition. SAS Inst. Cary, NC.
Watson C. 2005. Urease Inhibitors, IFA International Workshop on Enhanced-Efficiency
Fertilizers, Queen's University of Belfast, Frankfurt, Germany.
Woodward T.R., W.H. Frame, M.M. Alley, G.B. Whitehurst, and B.M. Whitehurst. 2011.
Design and validation of a laboratory system for measurement of volatilized
ammonia. Agron. J. 103:38-44.

52
Fig. 3.1: Cumulative N loss (percent of applied) as ammonia from granular urea treated with the urease inhibitor NBPT and CaSO4 and K2SO4 physical coatings during trial I.

53
Fig. 3.2: Cumulative N loss (percent of applied) as ammonia from granular urea treated with the urease inhibitor NBPT and CaSO4 and K2SO4 physical coatings during trial II.

54
Fig. 3.3: Cumulative N loss (percent of applied) as ammonia from granular urea coated with CaSO4 alone and in conjunction with the urease inhibitor NBPT during trial III.

55
Fig. 3.4: Cumulative N loss (percent of applied) as ammonia from granular urea coated with K2SO4 alone and in conjunction with the urease inhibitor NBPT during trial IV.
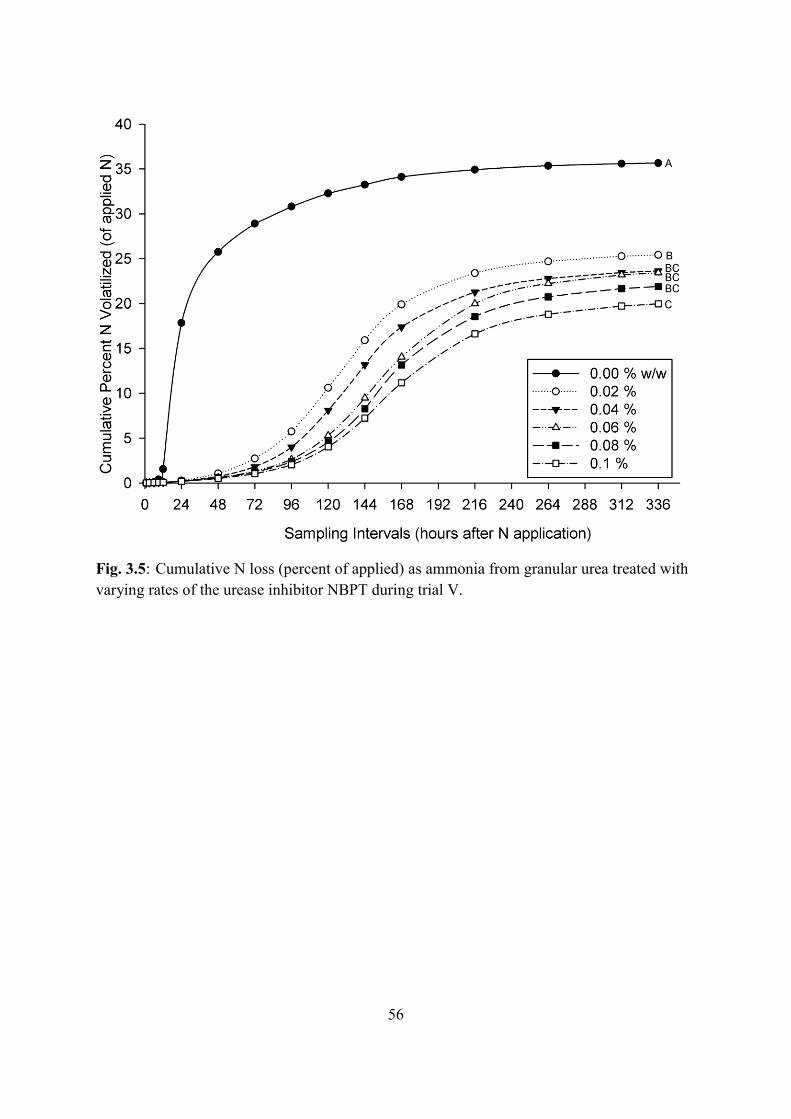
56
Fig. 3.5: Cumulative N loss (percent of applied) as ammonia from granular urea treated with varying rates of the urease inhibitor NBPT during trial V.
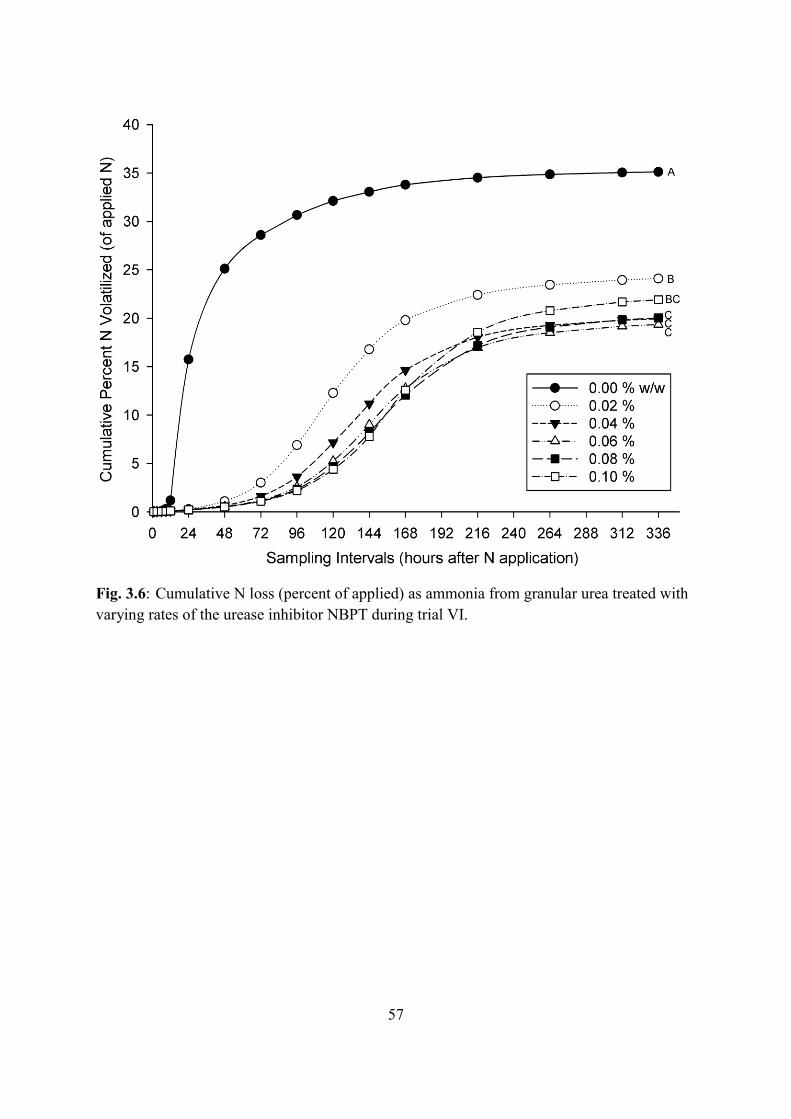
57
Fig. 3.6: Cumulative N loss (percent of applied) as ammonia from granular urea treated with varying rates of the urease inhibitor NBPT during trial VI.

58
Table 3.1: Soil pH and physical characteristics for the Wheeling silt loam (Fine-loamy, mixed, active, mesic Ultic Hapludalf) soil used in all ammonia volatilization trials
Soil pH Moisture Sand Silt Clay Carbon ------------------------ % ---------------------------
Wheeling Silt Loam 6.6-6.7 ~14 (2/3 F.C. †) 44.2 50.2 5.6 2.33 †F.C. denotes field capacity determined by the pressure plate apparatus at -1/3 bar
(Cassell and Nielson, 1998)
Table 3.2: Treatment descriptions for trials I, II, III, and IV.
Coating Fertlizer Analysis Trial I Trial II Trial III Trial IV (N-P-K-S)
Check Urea 46-0-0-0
Arborite® Ag 45.9-0-0-0 Agrotain® 45.8-0-0-0
CaSO4-coated+NBPT† 39.9-0-0-3 CaSO4-coated 39.9-0-03
K2SO4-coated+NBPT† 36.6-0-7.4-3.2 K2SO4-coated 36.6-0-7.4-3.2
† Potassium and calcium physical coatings received the urease inhibitor NBPT in the form of Arborite® Ag
59
4 Urease Extraction and Activity of Soybean and Corn Residues in Virginia No-till Cropping Systems
William Hunter Frame,a* aDepartment of Crop and Soil Environmental Sciences, Virginia Tech, 330 Smyth Hall (0404), Blacksburg, VA 24061, USA *Corresponding author E-mail address: [email protected] Tel.: +1 540 2314521 Devin Ridgelyb bBiological System Engineering Department, Virginia Tech, Blacksburg, VA 24061, USA E-mail: [email protected] Tel.: +1 540 2313498 Kathryn Gaasch aDepartment of Crop and Soil Environmental Sciences, Virginia Tech, 330 Smyth Hall (0404), Blacksburg, VA 24061, USA E-mail address: [email protected] Tel.: +1 540 2314521; Mark Alleya aDepartment of Crop and Soil Environmental Sciences, Virginia Tech, 330 Smyth Hall (0404), Blacksburg, VA 24061, USA E-mail address: [email protected] Tel.: +1 540 2319777; fax: +1 540 2313431 Chao Shanga aDepartment of Crop and Soil Environmental Sciences, Virginia Tech, 330 Smyth Hall (0404), Blacksburg, VA 24061, USA E-mail address: [email protected] Tel.: +1 540 2319801; fax: +1 540 2313431
60
4.1 Abstract
Ammonia volatilization in no-tilled systems, where urea is surface-applied onto crop
residue, is higher than in traditional cultivated agronomic systems. Many studies focused on
urease activity in fresh plant tissues, but little research has been conducted to describe the
urease activity of crop residues in no-tilled agroecosystems. The objectives of the study were
to: 1) extract, concentrate, and identify urease from corn and soybean residues using sodium
phosphate solutions described in previous research; and 2) analyze the urease activity from
soybean and corn residue compared to Jackbean (Canavalia ensiformis) urease using Fourier
Transform Infrared Spectroscoy (FTIR). Urease was extracted from dried and ground (1 mm
sieve) soybean and corn residues collected after grain harvest, using 50 mM sodium
phosphate solutions buffered at pH 7.5. The resulting supernatant was retained as crude
extract and subjected to ammonium sulfate fractionations at 0-40%, 40-55%, and 55+%
saturation levels to concentrate extracted urease. Crude extracts and ammonium sulfate
fractions were compared to Jackbean to identify urease from corn and soybean residues using
fast protein liquid chromotagraphy (FPLC) and SDS-PAGE. The activity of urease extracted
from corn and soybean residues was compared to Jackbean urease using FTIR, and showed
that the activity of soybean urease could be readily measured, while no activity was observed
with the corn residue. Analysis of the crop residue extracts with SDS-PAGE confirmed the
presence of urease in the soybean 0-40% ammonium sulfate fraction with a molecular weight
of approximately 170-180 kDa. Molecular analysis showed no evidence of urease in the corn
residue extracts. The data indicated that active urease can be extracted from soybean crop
residues with the techniques used in this study. Further research is needed to verify the
activity of urease in a range of crop residues with genetic differences and seasonal climatic
variations that lead to differential rates of residue decomposition.

61
4.2 Introduction
When urea is surface applied, as in no-till agronomic systems, urea hydrolysis takes
place on the soil or residue surface and ammonia gas is lost through volatilization. The rate of
urea hydrolysis and urease activity is dependent on soil moisture, soil texture, and organic
matter content. Conservation and no-tilled systems increase soil water holding content and
organic matter content of soils which are two factors that affect urease activity and ammonia
volatilization from agronomic systems (Stavi et al., 2011). Research has shown that
increasing organic matter content in soil increases the urease activity and in turn, potentially,
the amount of N loss through ammonia volatilization from urea containing fertilizers
(Antisari et al., 1996).
Increasing the amount of organic matter in soils contributes to the number of sites
where urease can be adsorbed and remain active, resulting in increased urease activity. Little
research has been dedicated to urease activity in crop residues where urea-based N fertilizers
are broadcast and do not come into contact with the soil. Broadbent et al. (1985) found that
plots covered with chopped wheat (Triticum aestivum L.) straw had lower recovery rates of
applied N than plots that had no residue cover. Ammonia volatilization was greater in the first
four days of a laboratory study conducted by Carmona et al. (1990) when chopped soybean
(Glycine max L.) straw was added to soil compared to when soil alone was used. Beyrouty et
al. (1988) studied the effect of corn (Zea mays L.) residue only and soil amended with corn
residue, and found that ammonia losses were greater on the residue alone than treatments
with soil alone and soil amended with residue. Rochette et al. (2009) found that no-till
agronomic systems had higher ammonia volatilization losses compared to moldboard plow
systems. Perucci et al. (1982) studied ammonia volatilization from different types of crop
residues mixed with soil and found that all residues increased N losses. The percent increase

62
in N loss was related to the type of residue (corn, wheat, sunflower (Helianthus annuus), and
tobacco (Nicotiana tabacum)) used with corn increasing N loss by 35% and tobacco
increasing N loss by 57% (Perucci et al., 1982).
The differences observed by Perucci et al. (1982) indicated that urease content, and
possibly activity, changes depending on species. Leguminous plants generally have higher
concentrations of urease than non-leguminous species (Krajewska, 2009). Klose and
Tabatabai (2000) concluded that total soil urease activity was significantly affected by
cropping rotations. The highest soil urease activities were reported in a four year corn-corn-
oats-meadow rotation and the lowest activities were found in monoculture corn and soybean
(Klose and Tabatabai, 2000). This suggests that systems containing multiple crops or residue
covers may result in higher soil urease activity, and, thus, may require different N
management tactics when urea is surface applied to these soils.
The bulk of the research has been conducted looking at the effects of adding residue
to soil. The reason for this was to simulate conventionally-tilled agronomic systems. The
ammonia volatilization data from conservation and no-tilled agronomic systems, as well as
the data from studies looking at soil + residues, suggests that urease activity of plant material
contributes significantly to total urease activity of agronomic systems. Substantial research
has been conducted to ascertain the role of urease in urea metabolism in actively growing
tissues as well as seed development, but little is known about the urease activity of crop
tissues after senescence (Ciurli et al., 1999; Krajeswka, 2009).
Jack bean (Canavalia ensiformis) and soybean ureases have been extracted and
purified from the meal of seeds for many years. Jackbean seed urease is currently the only
plant urease to be structurally described in the literature, and urease from vegetative portions
of plants have yet to be completely described (Balasubramanian and Pannuraj, 2010).
Extraction of urease from plant material usually involves grinding of fresh plant material

63
immediately or flash freezing the tissue with liquid nitrogen before processing. Davies and
Shih (1984) reported higher urease activities in urease extracts from fresh soybean leaves
compared to corn leaves. This difference could be due to higher activity in soybeans or more
urease being produced by soybean than corn. Witte and Escobar (2001) extracted and
compared urease from fresh leaves of bean (Vicia faba), maple pea (Pisum sativum), potato
(Solanum tuberosum), swede(Brassica napobrassica), oil seed rape (Brassica napus), winter
barley (Hordeum vulgare), wheat (Triticum aestivum), oat (Avena sativa), and apple (Malus
domestica). Current research on plant tissue ureases involves extracting ureases from living
tissue, rather than the senesced plant material found in agricultural fields after harvest, to
which urea containing fertilizers are commonly applied.
The use of buffered solutions containing sodium or potassium phosphate,
ethylenediaminetetraacetic acid (EDTA), sodium chloride, and 2-mercaptoethanol are the
most common chemical agents utilized in urease extracting solutions (Davies and Shih, 1984;
Witte and Escobar, 2001; Follmer et al., 2004). Phosphate buffer solutions have been shown
to be competitive inhibitors of urease as the concentration of phosphate increases in the
buffering solutions and as pH decreases. Krajewska and Zaborska (1999) demonstrated the
competitive inhibitory effects on Jackbean urease and that as the pH of the solution decreases
between 7.49 and 5.80, the Km increases for the reaction. This is due to the inhibitory effect
of the orthophosphate ion, H2PO4-, which deprotonates as pH approaches 7.2 and upon
deprotonation decreases the inhibition of urease (Krajewska and Zaborska, 1999). When
using phosphate based buffering systems to extract urease, one must ensure that the pH of the
solution is maintained near or above 7 and to use low concentrations of phosphate to maintain
conditions where concentrations of the orthophosphate ion H2PO4- is minimal.
Competitive inhibition occurs when the inhibitor blocks the active site of the enzyme
preventing the binding of the substrate. To determine the inhibitory effect of a chemical on a
64
chemical reaction, the Vmax, maximum reaction rate, and Km, Michaelis-Menton reaction
constant (1/2 Vmax) must be determined. The Km of a reaction can also be used to describe
the enzyme affinity for the substrate by calculating 1/ Km. Competitive inhibition of an
enzyme increases Km but does not change the Vmax of the reaction (Chang, 2000).
Once the urease has been extracted from the plant material, a urease activity assay can
be conducted. Urease activity assays consist of adding a known volume to an enzyme extract
and determining a reaction rate. The reaction rate is determined by measuring the
disappearance of substrate (urea) or the appearance of reaction products (ammonia or
bicarbonate). The most common urease activity assay is a colorimetric method to determine
the accumulation of ammonia with phenolic compounds (Follmer et al., 2004, Witte and
Escobar, 2001). Karmali et al. (2004) used Fourier Transform Infrared Spectroscopy (FTIR)
to successfully determine reaction kinetics of the urea hydrolysis reaction. The use of FTIR
allows for real-time measurements of the disappearance of substrate (urea) as well as the
accumulation of products without disturbance to the reaction vessel or reacting materials.
The development of a method to extract and quantify urease activity from different
plant residues would enable cropping systems to be assessed for urea volatilization potential.
Understanding different crop urease activities could improve N management practices when
applying urea-based fertilizers to no-till production systems. For example, if urease activity
differs among residues, different strategies for reducing N volatilization losses might be
employed.
The objectives of this experiment were: 1) to extract, concentrate, and identify urease
from corn and soybean after plant senescence using sodium phosphate solutions described in
previous research; and 2) to determine using FTIR the urease activity from soybean and corn
residue compared to Jackbean urease.

65
4.3 Material and Methods
Crop residues were sampled from two separate fields the same day as machine
harvesting of grain. Removing the residue the same day as harvesting reduced the potential
soil contamination and degradation of residue by microorganisms, allowing for the
determination of urease activity from the crop residue with minimum environmental
interferences. Care was taken to omit soybean seed in the residue to prevent contamination by
soybean seed urease. To aid in transport and prevent contamination, the corn residue was
collected by harvesting mature, whole corn plants and removing the ears prior to processing.
The corn residue was coarsely ground using a wood chipper. The ground corn residue and
whole soybean residue was air-dried for 72 h. The dried residues were ground to pass a 1-mm
sieve using a hammer mill and placed in sealable plastic bags for storage at room
temperature. During storage of the crop residues, the residues were visually monitored to
ensure that no decomposition that might influence urease activity was occurring inside the
storage bags.
4.3.1 Urease Extracting Solutions
Buffered extracting solutions used were sodium phosphate (Na-Phos) solutions of
25mM and 50mM with 50mM sodium chloride, 5mM EDTA, and 0.1% 2-mercaptoethanol at
a pH of 7.5. The initial 25 mM sodium phosphate was made using Na-Phos, monobasic. After
extracting the corn residue the pH of the crude extract decreased to 6.67 for corn and to 6.95
for soybean. Davies and Shih (1984) report the minimum activity for corn and soybean leaf
urease to be at a pH of 6.5; therefore, the corn residue extract pH of 6.67 might differentially
affect measured urease activities compared to soybean residue. In light of the results of
Davies and Shih (1984) we substituted a 50 mM Na-Phos buffer in the extracting solution to
reduce the pH decrease associated with addition of the corn residue.
66
The 50 mM Na-Phos buffer consisted of using Na-Phos, monobasic in conjunction
with Na-Phos, dibasic. Two 50 mM solutions of each Na-Phos compound were made and
mixed at a ratio of 1:4, monobasic to dibasic. This ratio produced a buffered solution with a
pH near 7.5 that, when combined with 5mM EDTA, disodium salt and 50mM sodium
chloride, attained a solution pH of 7.2. The extracting solution was then adjusted to a pH of
7.5 using 2M sodium hydroxide.
The resulting 50 mM Na-Phos buffer increased the buffering capacity of the solution
(Fig. 4.1) and maintained the pH of the corn and soybean crude extracts to range from 6.89-
6.97 and 6.98-7.06, respectively. Krajewska (2009) reported pH optima for soybean urease
activity to be 7.0 and Jackbean urease activity at pH 7.0-7.5, whereas Davies and Shih (1984)
reported activity optima for soybean and corn leaf urease to be at 5.5 and 8.8 for soybean and
5.0-5.5, 7.5, and 8.8 for corn. For our studies, the small difference in crude extract pH for
corn and soybean residues allows for activity comparisons and is in the range of activity
optima reported in previous literature for both species. The 50 mM Na-Phos extracting
solution was used exclusively for all extractions and data reported in this study.
4.3.2 Extracting Urease from Crop Residues
The 50 mM Na-Phos, 5 mM EDTA disodium salt, 50 mM sodium chloride extracting
solution was stored at 10oC. All steps of the extraction process were carried out at 0-4oC.
Prior to the mixing of residues, 2-mercaptoethanol was added to the volume of extracting
solution being used at a rate of 0.1% v/v. A ratio of one gram residue material to 10 ml of
extracting solution was used to extract urease from corn and soybean residue. An Oster®
(Jarden Consumer Solutions, Boca Raton, FL) 6843 12-speed kitchen blender, operated at
maximum speed level of 6, was used to homogenize the crop residue and extracting solution
mixture. The mixture was blended for three minutes and placed in the refrigerator for 1-5
67
minutes, and the process was repeated five times for a total blending period of fifteen
minutes. Intermittent blending ensured that heating of the residue mixture during blending
was minimal. The residue mixture was sieved using a stainless steel French coffee press (Mr.
Coffee®, Jarden Consumer Solutions, Boca Raton, FL) to remove large residue material and
then passed through a 270 mesh sieve to remove smaller residue material.
The resulting urease solution was then filtered using a #1 Whatman filter paper and
vacuum filtration to remove fine particulate material from the urease solution. The urease
solution was centrifuged at 15,000g at 2oC for 30 minutes using a Sorvall RC 6+ Superspeed
fixed angle centrifuge. The supernatant was retained as the crude extract for both corn and
soybean residue and stored at 10oC.
4.3.3 Ammonium Sulfate Fractionation
Urease in plant tissue was not concentrated enough to be identified using routine
protein analysis procedures. In order to concentrate the urease extracted from the corn and
soybean residues, the protein was precipitated from the extracting solution using ammonium
sulfate (Davies and Shih, 1984). Ammonium sulfate fractionations allow for the
concentration of urease as well as separation of the urease protein from other molecules in the
crude extract. Three ammonium sulfate fractions were examined to find which contained the
enzyme urease. The fractions were based on the findings of Davies and Shih (1984) and were
at the ammonium sulfate saturation levels of 0-40%, 40-55%, and 55+%. Seven grams of
ammonium sulfate were added to 30 ml of crude extract, dissolved, and centrifuged at
10,000g and 2oC for 20 minutes. The supernatant was decanted and the precipitate (0-40%
saturation fraction) was re-suspended in 1 ml of extracting solution without 2-
mercaptoethanol. To achieve the 55% ammonium sulfate saturation, 2.75 g of ammonium
sulfate were added to the 30 ml of supernatant. The supernatant was centrifuged at 10,000g

68
and 2oC for 20 minutes, decanting the supernatant, and re-suspending the precipitate (40-55%
saturation fraction) in 1 ml of extracting solution without 2-mercaptoethanol. The supernatant
from the second centrifugation was retained as the 55+% saturation fraction. The fractionation
steps were replicated three times for each urease extraction from each crop residue.
In order to remove the ammonium sulfate and other smaller molecular weight
molecules from the concentrated urease, dialysis was conducted. The use of a size selective
membrane and concentration gradient allow for the highly concentrated smaller molecules in
the crude extract to diffuse into a larger volume of Na-Phos extracting solution. Once the
fractions were re-suspended they were placed in Snakeskin® dialysis tubing (3,500 molecular
weight (Da) (3.5 kDa) (Thermo Scientific, Product # 68035) and dialyzed for 24 hours in 2 l
of extracting solution without 2-mercaptoethanol. The 2 l of extracting solution were changed
once in the 24 h period. After dialysis was complete the fractions were stored at 10oC.
4.3.4 Peak Identification and Standardization with Fourier Transform Infrared
Spectroscopy
The urease activity in the extracts was tested using Fourier transform infrared
spectroscopy (FTIR). Infrared spectroscopy allows for the detection of specific chemical
species based on the absorption spectra of a chemical bond vibrating at certain wavelengths
of light energy reported as wavenumbers (cm-1). This study used a Thermo Scientific Nicolet
6700 with a Smart ARK ZnSe 45o sample tray. Each spectrum was conducted at a resolution
of 4 cm-1 and 64 scans per spectrum. A resolution of 4 cm-1 means that there is a ± 4 cm-1
variation of where the peak exists, so if a peak is detected at 1,362 cm-1 that is accurate ± 4
cm-1. A spectrum was measured every 1-2 minutes during the 20 minute assays to determine
if the urease extracts contained active urease.

69
To identify peaks of reaction products and substrate, 200 mM standards of sodium
bicarbonate and urea were analyzed. Prior to analysis of the standards, the Na-Phos extracting
solution was analyzed as a background solution. Five peaks were identified from the spectra
and standard curves were developed for each peak over a range of sodium bicarbonate and
urea concentrations (Figs. 4.2A-C). Each peak represents unique chemical bonds associated
with bicarbonate and urea. The correlation of the peak intensities and concentration will
allow for future kinetic analyses of urease from crop residues. Karmali et al. (2004)
investigated peak heights at 1,625 cm-1 and 1,605 cm-1 along with the 1,365 cm-1 peak for
analysis of urea hydrolysis, and our spectra also contained peaks at 1,625 and 1,605 cm-1.
However due to the proximity of these peaks and high peak intensities it was difficult to
measure peak height accurately. Peak intensity (corrected peak height) was determined using
the peak height tool in the OMINIC 8.1 software (Thermo Scientific, 2009). A regression
analysis was conducted to determine the correlation between peak intensities and
urea/bicarbonate concentrations at 1,466, 1,362, and 1,160 cm-1 using Sigma Plot 11 (Systat
Software, Inc., 2008). Three of the peaks were selected based on the high linear correlation
between reaction products/substrate and peak intensity (Figs. 4.3A-C). The three peaks
selected were at 1,466, 1,362, and 1,160 cm-1. The 1,466 and 1,160 cm-1 peaks were specific
to the substrate, urea, and the 1,362 cm-1 was specific to reaction product bicarbonate (Figs.
4.2A and 4.2B). The 1,466 and 1,160 cm-1 peaks were associated with the distortion
(bending) of the N-H bonds in the urea molecule (Günzler and Gremlich, 2002). Nickolov et
al (2003) reported the asymmetrical stretching band for bicarbonate at 1,362 cm-1 as well as a
shoulder at 1,310 cm-1, which matches the peak selected for bicarbonate in this study (Fig.
4.2B).
70
4.3.5 Urease Activity Assays with FTIR
Prior to each urease extract assay a background solution was analyzed which
consisted of 1 ml of Na-Phos extracting solution and 1 ml of the urease extract of interest.
This allowed the analysis to subtract out any background spectra from the assay other than
the spectra of bicarbonate and urea. Each assay consisted of 1 ml of the urease extract of
interest and 1 ml of the Na-Phos extracting solution containing a concentration of 200 mM
urea. A spectrum of the urease assay was scanned every 1-2 minutes for a total assay length
of 20 minutes. The scanning period varied slightly because each scan had to be manually
started after the one prior had finished, however each time interval was recorded. Three
replicate assays were conducted for each urease extract/fraction. The urease concentration of
the corn and soybean urease extract/fractions was not known. The Jackbean urease was
prepared by dissolving 60 mg of Jackbean urease solid (Urease, Type IX, Sigma Aldrich,
U4002) in 250 ml of Na-Phos extracting solution (Quickchem Method 14-206-00-2A). Peak
intensities at the three wavenumbers selected were recorded and Fig. 4.2C represents typical
spectra for a urease activity assay using FTIR. The peak intensities were plotted at each
sampling interval over the duration of the 20 min assays and these plots are referred to as
progress curves for the urea hydrolysis reaction.
4.3.6 Urease Identification in Extracts
Urease is a large, complex protein that is composed of six distinct subunits
(monomers). Krajewska (2009) and Balasubramanian and Punnuraj (2010) reported the
molecular weight of a subunit of Jackbean urease to be 90 kDa and a soybean urease subunit
to be 93.5 kDa. To determine if the molecules within each fractionation were similar to the
molecular weight of Jackbean urease, two methods were used to identify urease in extracts
71
from corn and soybean residues. The first method used was fast protein liquid
chromatography (FPLC) and the second method was SDS-PAGE.
Urease extracts were separated using a Hi Load 16/60 Superdex 30 column and a GE®
ÄKTA Purifier 900. Absorbance of light at 280 nm was measured over the total elution
volume (ml of flow through the separation column) to separate out molecules of different
molecular weights. Each extract/fraction of corn and soybean urease was compared to
Jackbean urease at a concentration of 50 mg solid per 5 ml of extracting solution.
Similar to other gel electrophoresis methods, sodium dodecyl sulfate polyacrylamide
gel electrophoresis (SDS-PAGE) separates proteins by the length of the peptide and the
charge. The SDS-PAGE analysis was conducted on all extracts/fractions to compare the
molecular weight of the proteins in each sample to that of Jackbean urease. The Jackbean
urease was prepared in the same manner for SDS-PAGE analysis as in the FPLC analysis. A
BIO-RAD Power Pac Basic and BIO-RAD mini-PROTEAN® tetra cell ran at 200 volts for 30
minutes separated the proteins by molecular weight. The stain used was Coomassie G-250
and Tris/Glycerine/SDS solution made by BIO-RAD and 7.5% Mini-PROTEAN® TGX gels
(BIO-RAD) were used in the analysis. The procedure was conducted according to the BIO-
RAD application guide for SDS-PAGE analysis. The enhanced 0-40% fractionation lane in
the SDS-PAGE analyses was achieved by centrifugation of the 0-40% fraction in a centrifuge
tube containing a selective membrane that retained molecules above 3.5 kDa. The
centrifugation step was done to intensify the band of the 0-40% saturation fraction to ensure
correct identification of the band present.
The data collected from the FPLC and SDS-PAGE analysis was analyzed visually for
the appearance of bands at certain molecular weights and peaks at certain elution volumes.
Three replications of the spectra for concentrations ranging from 0-200 mM of sodium
bicarbonate and urea were collected and peak heights measured. Linear regression was used

72
to determine the relationship between concentration of sodium bicarbonate and urea with
peak height. Urease activity assays were conducted in triplicate and the peaks heights at the
selected peaks were measured at each sampling interval. Averages and standard deviations
were plotted and fit with a spline line to create the urease activity progress curves.
4.4 Results and Discussion
4.4.1 Urease Identification
The urease fractionations from corn and soybean residues were subjected to analysis
using a FPLC and SDS-PAGE to determine if urease was present in the extracts. For the
purified Jackbean urease, there were only three peaks identified in the FPLC elution curve,
with the largest absorbance intensity appearing at 41.6 ml of flow (Fig. 4.4A). The highest
absorbance intensities for the soybean residue were at 43, 43.3, 42.5, and 42.3 ml of flow for
the crude extract, 0-40%, 40-55% and 55+% fractionations, respectively (Fig. 4.4B). The
highest absorbance intensities for the corn residue were found to be 44, 42, 42.5, and 43.5 ml
of flow for the crude extract, 0-40%, 40-55% and 55+% fractionations, respectively (Fig.
4.4C). The highest peak intensities for both residues were similar to that of Jackbean urease
indicating that similar molecular weight molecules were present in all solutions. The location
of the highest peak intensity (41.6-44 ml) for urease in these corn and soybean extracts was
similar to the observed elution volume found for urease extracted from Cajanus cajan L.
(pigeon pea), Morus alba (mulberry), and Momordica charantia (Das et al., 2002; Hirayama
et al., 2000; and Krishna et al., 2011). The fractionations of the crude urease extracts also
removed the peaks observed in the crude extracts at greater elution volumes (Fig. 4.4B-C).
This could be attributed to the removal of molecules with molecular weights less than 3.5
kDa during dialysis leaving only the peak near the 42 ml of elution volume.
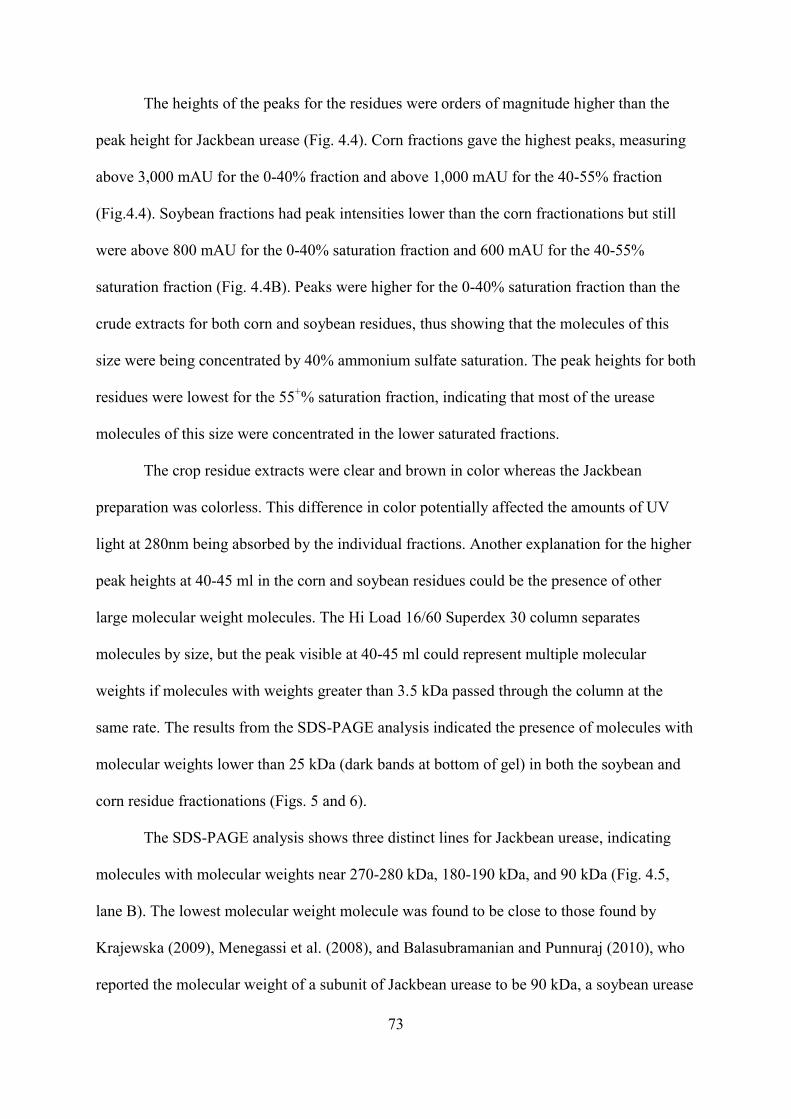
73
The heights of the peaks for the residues were orders of magnitude higher than the
peak height for Jackbean urease (Fig. 4.4). Corn fractions gave the highest peaks, measuring
above 3,000 mAU for the 0-40% fraction and above 1,000 mAU for the 40-55% fraction
(Fig.4.4). Soybean fractions had peak intensities lower than the corn fractionations but still
were above 800 mAU for the 0-40% saturation fraction and 600 mAU for the 40-55%
saturation fraction (Fig. 4.4B). Peaks were higher for the 0-40% saturation fraction than the
crude extracts for both corn and soybean residues, thus showing that the molecules of this
size were being concentrated by 40% ammonium sulfate saturation. The peak heights for both
residues were lowest for the 55+% saturation fraction, indicating that most of the urease
molecules of this size were concentrated in the lower saturated fractions.
The crop residue extracts were clear and brown in color whereas the Jackbean
preparation was colorless. This difference in color potentially affected the amounts of UV
light at 280nm being absorbed by the individual fractions. Another explanation for the higher
peak heights at 40-45 ml in the corn and soybean residues could be the presence of other
large molecular weight molecules. The Hi Load 16/60 Superdex 30 column separates
molecules by size, but the peak visible at 40-45 ml could represent multiple molecular
weights if molecules with weights greater than 3.5 kDa passed through the column at the
same rate. The results from the SDS-PAGE analysis indicated the presence of molecules with
molecular weights lower than 25 kDa (dark bands at bottom of gel) in both the soybean and
corn residue fractionations (Figs. 5 and 6).
The SDS-PAGE analysis shows three distinct lines for Jackbean urease, indicating
molecules with molecular weights near 270-280 kDa, 180-190 kDa, and 90 kDa (Fig. 4.5,
lane B). The lowest molecular weight molecule was found to be close to those found by
Krajewska (2009), Menegassi et al. (2008), and Balasubramanian and Punnuraj (2010), who
reported the molecular weight of a subunit of Jackbean urease to be 90 kDa, a soybean urease

74
subunit to be 93.5 kDa , and cotton seed urease subunit weight of 98 kDa. The two higher
molecular weights present in solution could be explained by the presence of dimers (two
subunits bonded together) and trimers (three subunits bonded together) of the Jackbean
urease protein. Soybean fractions were analyzed with SDS-PAGE and each fraction appears
in the lanes B-G in Fig. 4.5. In the soybean crude extract (Fig. 4.5, lane C) the enzyme
urease was apparently not concentrated enough to produce a band. The 0-40% saturation
fraction of soybean residue urease was identified at a molecular weight of near 170-180 kDa
(Fig. 4.5, lane D). This fraction contained the highest urease activity of the soybean fractions
(Fig.4.6) indicating higher concentrations of urease and was supported by the SDS-PAGE
analysis (Fig. 4.5, lane D and G). The 40-55% ammonium sulfate fraction has a very faint
band near 90-100 kDa signifying a low concentration of single subunits of soybean urease in
this fractionation (Fig. 4.5, lane E). Polymers of urease subunits (dimers and trimers) may
precipitate at lower saturation levels than single subunits of urease. Thus, explaining the
presence of a band at 90-100 kDa in the 0-40% fractionation (Fig. 4.5, lane C) and the faint
band at 90-100 kDa visible in the 40-55% fractionation (Fig. 4.5, lane E). No bands were
present in the 55+% fractionation (Fig. 4.5, lane F). This was supported by the lack of activity
in this fraction of soybean residue urease (Fig. 4.6). Polymers of urease were successfully
separated from crude extracts with ammonium sulfate saturation levels up to 55%. Krishna et
al. (2011) found urease extracted from Momordica charantia to have a molecular mass of
174.5 kDa with native-PAGE; Hirayama et al. (2000) confirmed that urease extracted from
leaves of mulberry (Morus alba) existed as a homo-dimer enzyme. The band produced in the
0-40% saturation fraction of soybean residue was also of similar size (170-180 kDa) as urease
extracted from M. charantia whose molecular weight inferred the presence of two bonded
urease subunits (dimers).
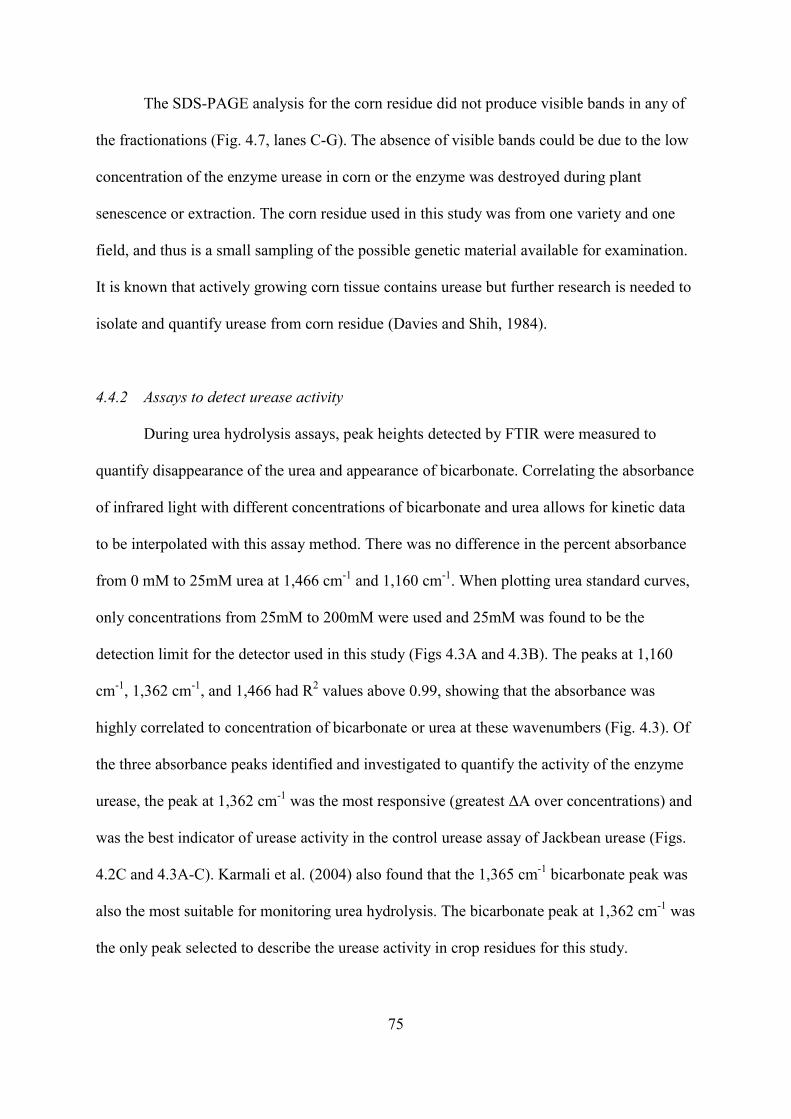
75
The SDS-PAGE analysis for the corn residue did not produce visible bands in any of
the fractionations (Fig. 4.7, lanes C-G). The absence of visible bands could be due to the low
concentration of the enzyme urease in corn or the enzyme was destroyed during plant
senescence or extraction. The corn residue used in this study was from one variety and one
field, and thus is a small sampling of the possible genetic material available for examination.
It is known that actively growing corn tissue contains urease but further research is needed to
isolate and quantify urease from corn residue (Davies and Shih, 1984).
4.4.2 Assays to detect urease activity
During urea hydrolysis assays, peak heights detected by FTIR were measured to
quantify disappearance of the urea and appearance of bicarbonate. Correlating the absorbance
of infrared light with different concentrations of bicarbonate and urea allows for kinetic data
to be interpolated with this assay method. There was no difference in the percent absorbance
from 0 mM to 25mM urea at 1,466 cm-1 and 1,160 cm-1. When plotting urea standard curves,
only concentrations from 25mM to 200mM were used and 25mM was found to be the
detection limit for the detector used in this study (Figs 4.3A and 4.3B). The peaks at 1,160
cm-1, 1,362 cm-1, and 1,466 had R2 values above 0.99, showing that the absorbance was
highly correlated to concentration of bicarbonate or urea at these wavenumbers (Fig. 4.3). Of
the three absorbance peaks identified and investigated to quantify the activity of the enzyme
urease, the peak at 1,362 cm-1 was the most responsive (greatest ΔA over concentrations) and
was the best indicator of urease activity in the control urease assay of Jackbean urease (Figs.
4.2C and 4.3A-C). Karmali et al. (2004) also found that the 1,365 cm-1 bicarbonate peak was
also the most suitable for monitoring urea hydrolysis. The bicarbonate peak at 1,362 cm-1 was
the only peak selected to describe the urease activity in crop residues for this study.
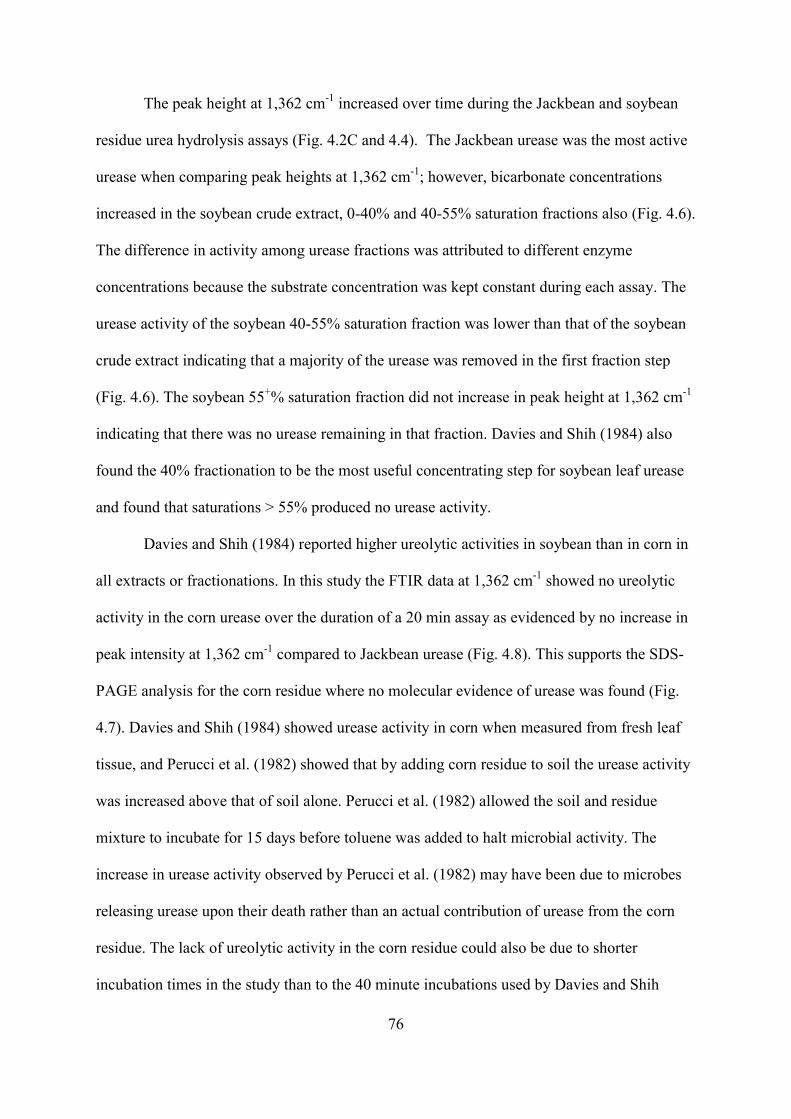
76
The peak height at 1,362 cm-1 increased over time during the Jackbean and soybean
residue urea hydrolysis assays (Fig. 4.2C and 4.4). The Jackbean urease was the most active
urease when comparing peak heights at 1,362 cm-1; however, bicarbonate concentrations
increased in the soybean crude extract, 0-40% and 40-55% saturation fractions also (Fig. 4.6).
The difference in activity among urease fractions was attributed to different enzyme
concentrations because the substrate concentration was kept constant during each assay. The
urease activity of the soybean 40-55% saturation fraction was lower than that of the soybean
crude extract indicating that a majority of the urease was removed in the first fraction step
(Fig. 4.6). The soybean 55+% saturation fraction did not increase in peak height at 1,362 cm-1
indicating that there was no urease remaining in that fraction. Davies and Shih (1984) also
found the 40% fractionation to be the most useful concentrating step for soybean leaf urease
and found that saturations > 55% produced no urease activity.
Davies and Shih (1984) reported higher ureolytic activities in soybean than in corn in
all extracts or fractionations. In this study the FTIR data at 1,362 cm-1 showed no ureolytic
activity in the corn urease over the duration of a 20 min assay as evidenced by no increase in
peak intensity at 1,362 cm-1 compared to Jackbean urease (Fig. 4.8). This supports the SDS-
PAGE analysis for the corn residue where no molecular evidence of urease was found (Fig.
4.7). Davies and Shih (1984) showed urease activity in corn when measured from fresh leaf
tissue, and Perucci et al. (1982) showed that by adding corn residue to soil the urease activity
was increased above that of soil alone. Perucci et al. (1982) allowed the soil and residue
mixture to incubate for 15 days before toluene was added to halt microbial activity. The
increase in urease activity observed by Perucci et al. (1982) may have been due to microbes
releasing urease upon their death rather than an actual contribution of urease from the corn
residue. The lack of ureolytic activity in the corn residue could also be due to shorter
incubation times in the study than to the 40 minute incubations used by Davies and Shih
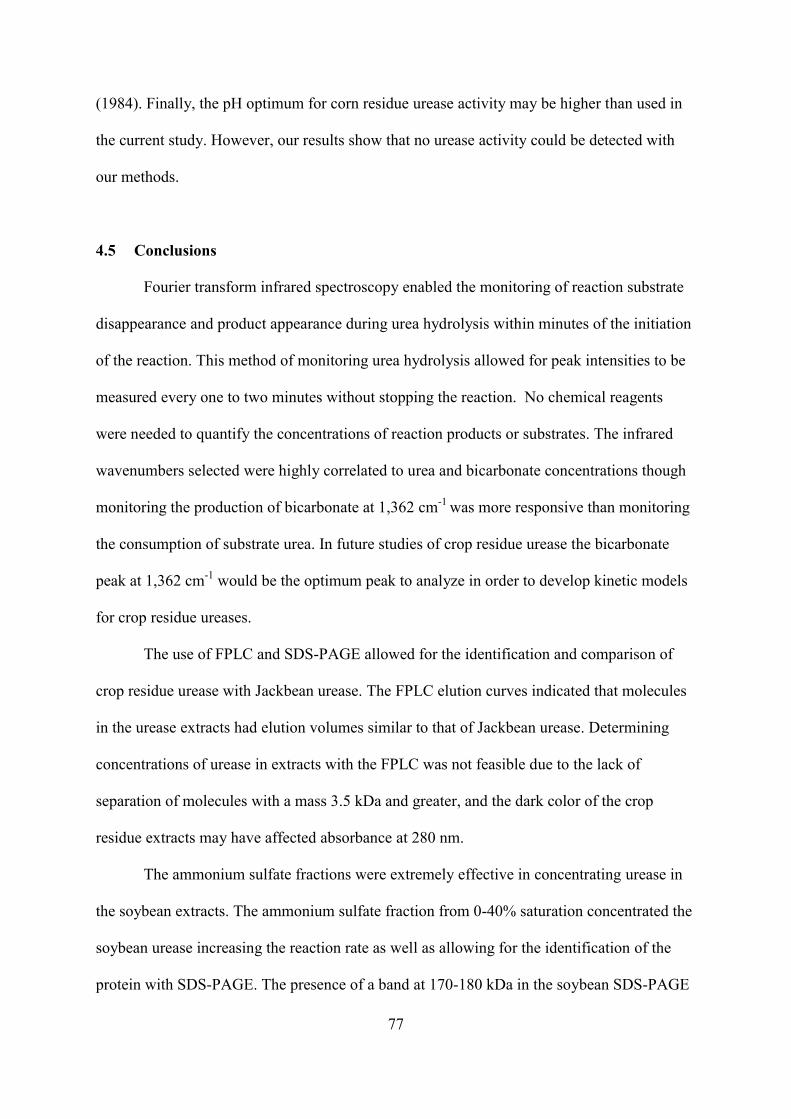
77
(1984). Finally, the pH optimum for corn residue urease activity may be higher than used in
the current study. However, our results show that no urease activity could be detected with
our methods.
4.5 Conclusions
Fourier transform infrared spectroscopy enabled the monitoring of reaction substrate
disappearance and product appearance during urea hydrolysis within minutes of the initiation
of the reaction. This method of monitoring urea hydrolysis allowed for peak intensities to be
measured every one to two minutes without stopping the reaction. No chemical reagents
were needed to quantify the concentrations of reaction products or substrates. The infrared
wavenumbers selected were highly correlated to urea and bicarbonate concentrations though
monitoring the production of bicarbonate at 1,362 cm-1 was more responsive than monitoring
the consumption of substrate urea. In future studies of crop residue urease the bicarbonate
peak at 1,362 cm-1 would be the optimum peak to analyze in order to develop kinetic models
for crop residue ureases.
The use of FPLC and SDS-PAGE allowed for the identification and comparison of
crop residue urease with Jackbean urease. The FPLC elution curves indicated that molecules
in the urease extracts had elution volumes similar to that of Jackbean urease. Determining
concentrations of urease in extracts with the FPLC was not feasible due to the lack of
separation of molecules with a mass 3.5 kDa and greater, and the dark color of the crop
residue extracts may have affected absorbance at 280 nm.
The ammonium sulfate fractions were extremely effective in concentrating urease in
the soybean extracts. The ammonium sulfate fraction from 0-40% saturation concentrated the
soybean urease increasing the reaction rate as well as allowing for the identification of the
protein with SDS-PAGE. The presence of a band at 170-180 kDa in the soybean SDS-PAGE

78
indicates the presence of urease as a homodimer. Urease subunits have been reported for
Jackbean urease at 90 kDa, soybean urease subunits at 93 kDa and cotton urease subunits at
98 kDa (Balasubramanian and Punnuraj, 2010; Krajewska, 2009; Menegassi et al., 2008).
Krishna et al. (2011) and Hirayama et al. (2000) reported urease as homodimers supporting
the findings from soybean residue urease. However, corn residue showed no urease activity
during the assays and molecular analysis yielded no evidence of the protein. Corn has lower
protein content than soybean and the lack of urease being extracted and detected in corn
residue in our study may be due to low concentrations of the enzyme in corn residues.
Extracting urease with sodium phosphate solutions was successful in extracting active
urease from soybean crop residue. The results from this study indicate that differences in
urease activity and concentration may be present between corn and soybean residues. Future
research is needed to ascertain the correlation between ammonia volatilization from crop
residues and their respective urease activities. If large differences in potential volatilization
losses were found for different residues, N management practices in no-till productions may
need to be adjusted. For example, different rates of the urease inhibitor, N-(n-butyl)
thiophosphoric triamide (NBPT), might be needed to optimize the reduction in ammonia
volatilization from surface-applied urea to different residues. Research with different residues
over different sites is needed to determine if such differences exist.
4.6 References
Antisari, L.V., C.Marzadori, P. Gioacchini, S. Ricci, and C. Gessa. 1996. Effects of the
urease inhibitor N-(n-butyl) phosphorothioic triamide in low concentrations on
ammonia volatilization and evolution of mineral nitrogen. Biol. Fert. Soils 22:196-
201.

79
Balasubramanian, A. and K. Ponnuraj. 2010. Crystal structure of the first plant urease from
Jack Bean: 83 years of journey from its first crystal to molecular structure. J. Mol.
Biol. 400:274-283.
Beyrouty, C.A., L.E. Sommers, and D.W. Nelson. 1988. Ammonia volatilization from
surface-applied urea as affected by several phosphoroamide compounds. Soil Sci Soc
Am J 52:1173-1178.
Broadbent, F.E., T. Nakashima, and G.Y. Chang. 1985. Performance of some urease
inhibitors in field trials with corn. Soil Sci Soc Am J 49:348-351.
Carmona, G., C.B. Christianson, and B.H. Byrnes. 1990. Temperature and low concentration
effects of the urease inhibitor N-(n-butyl) thiophosphoric triamide (nBTPT) on
ammonia volatilization from urea. Soil Biol. Biochem. 22:933-937. DOI: Doi:
10.1016/0038-0717(90)90132-j.
Chang, R. 2000. Chapter 13: Enzyme Kinetics, Physical Chemistry for the Chemical and
Biological Sciences, University Science Books, Sausalito, CA. pp. 511-559.
Ciurli S., S. Benini, W.R. Rypniewski, K.S. Wilson, S. Miletti, and S.Mangani. 1999.
Structural properties of the nickel ions in urease: novel insights into the catalytic and
inhibition mechanisms. Coordination Chem.Rev. 190-192:331-355. DOI: Doi:
10.1016/s0010-8545(99)00093-4.
Davies, H.M., L.M. Shih. 1984. Urease from leaves of Glycine max and Zea mays.
Phytochem. 23:2741-2745. DOI: Doi: 10.1016/0031-9422(84)83007-1.
Das, N., A.M. Kayastha, and P.K. Srivastava. 2002. Purification and characterization of
urease from dehusked pigeonpea (Cajanus cajan L.) seeds. Phytochem.. 61:513-521.
Follmer, C., R. Real-Guerra, G.E. Wasserman, D. Olivera-Severo, and C. R. Carlini. 2004.
Jackbean, soybean , and Bacillus pasteurii ureases: Biological effects unrelated to
ureolytic activity. Eur. J. Biochem. 271:1357-1363.
80
Günzler, H. and H. Gremlich. 2002. Qualitative spectral interpretation. In: IR spectroscopy:
an introduction. Wiley-VCH, Weinheim (Federal Republic of Germany).171-274.
Hirayama, C., M. Sugimura, H. Saito, and M. Nakamura. 2000. Purification and properties of
urease from the leaf of mulberry, Morus alba. Phytochem.. 53:325-330.
Karmali, K., A.Karmali, A. Teixeira, and M.J.M. Curto. 2004. The use of Fourier transform
infrared spectroscopy to assay for urease from Pseudomonas aeruginosa and
Canavalia ensiformis. Anal. Biochem. 331:115-121.
Klose, S. and M.A. Tabatabai. 2000. Urease activity of microbial biomass in soils as affected
by cropping systems. Biol. Fertil. Soils. 31:191-199.
Krajewska B. 2009. Ureases I. Functional, catalytic and kinetic properties: A review. J.
Mol. Catalysis B: Enzymatic 59:9-21. DOI: DOI: 10.1016/j.molcatb.2009.01.003.
Krajewska, B. and S. Ciurli. 2005. Jack bean (Canavalia ensiformis) urease: Probing
acid-base groups of the active by pH variation. Plant Physio. and Biochem. 43:651-
658.
Krajewska, B. and W. Zaborska. 1999. The effect of phosphate buffer in the range of pH 5.8-
8.07 on jack bean urease activity. J. of Mol. Catalysis B: Enzymatic. 6:75-81.
Krishna, B.L., A.N. Singh, S. Patra, and V.K. Dubey. 2011. Purification, characterization and
immobilization of urease from Momordica charantia seeds. Process Biochem.
46:1486-1491.
Menegassi, A., G.E. Wassermann, D. Olivera-Severo, A.B. Becker-Pitt, A.H.S. Martinelli, V.
Feder, and C.R. Carlini. 2008. Urease from Cotton (Gossypium hirsutum) seeds:
isolation, physicochemical characterization, and antifungal properties of the protein. J.
Agric. Food. Chem. 56:4399-4405.
81
Nickolov, Zh.S., O. Ozcan, and J.D. Miller. 2003. FTIR analysis of water structure and its
significance in the flotation of sodium carbonate and sodium bicarbonate salts.
Colloids and Surfaces A: Physicochem. Eng. Aspects 224: 231-239.
Perucci, P., P. Giusquiani, and L. Scarponi. 1982. Nitrogen losses from added urea and
urease activity of a clay-loam soil amended with crop residues. Plant Soil 69:457-463.
Rochette, P., D. A. Angers, M. H. Chantigny, J. D. MacDonald, N. Bissonnette, and N.
Bertrand. 2009. Ammonia volatilization following surface application of urea
to tilled and no-till soils: A laboratory comparison. Soil Tillage Res. 103
(2):310-315.
Sigma Plot 11. 2008. Sigma plot 11: User’s guide. Systat Software, Inc. San Jose, CA.
Stavi, I., R. Lal, and L.B. Owens. 2011. On-farm effects of no-till versus occasional tillage
on soil quality and crop yields in eastern Ohio. Agron. for Sustainable Development
31: 475-482.
Witte, C. and N. Medina-Escobar. 2001. In-Gel detection of urease with nitroblue tetrazolium
and quantification of the enzyme from different crop plants using the indophenols
reaction. Anal. Biochem. 290:10-107.
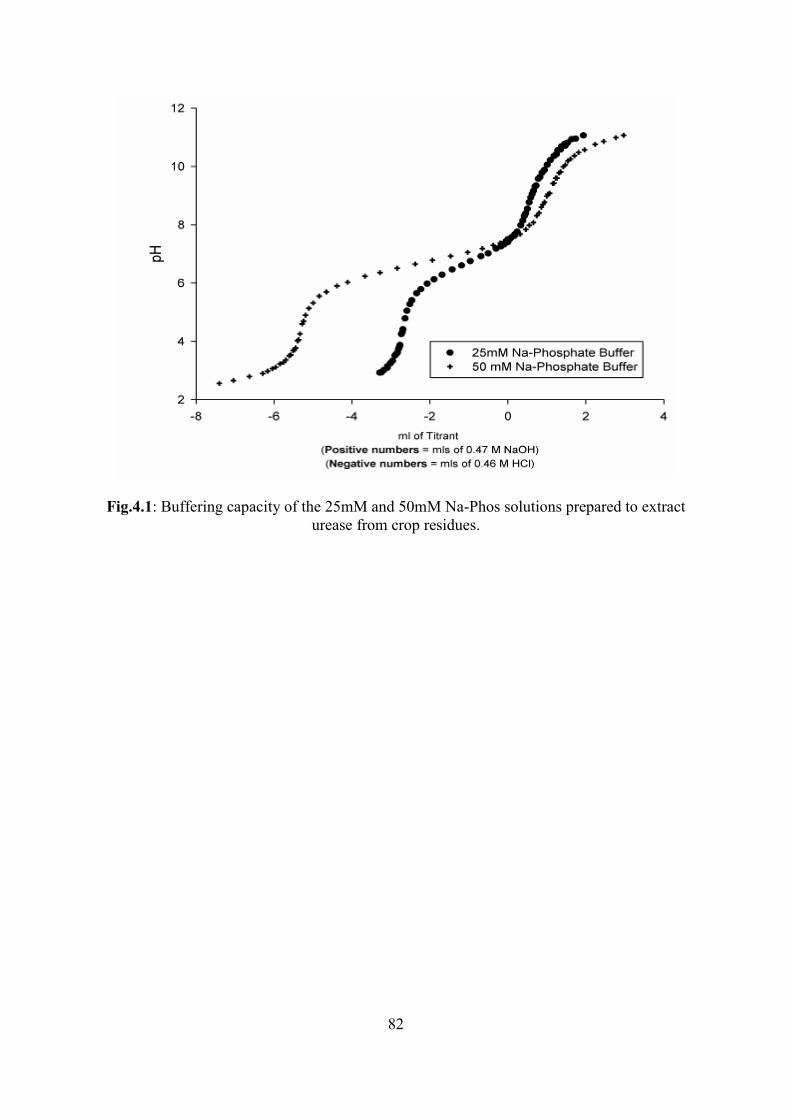
82
Fig.4.1: Buffering capacity of the 25mM and 50mM Na-Phos solutions prepared to extract urease from crop residues.
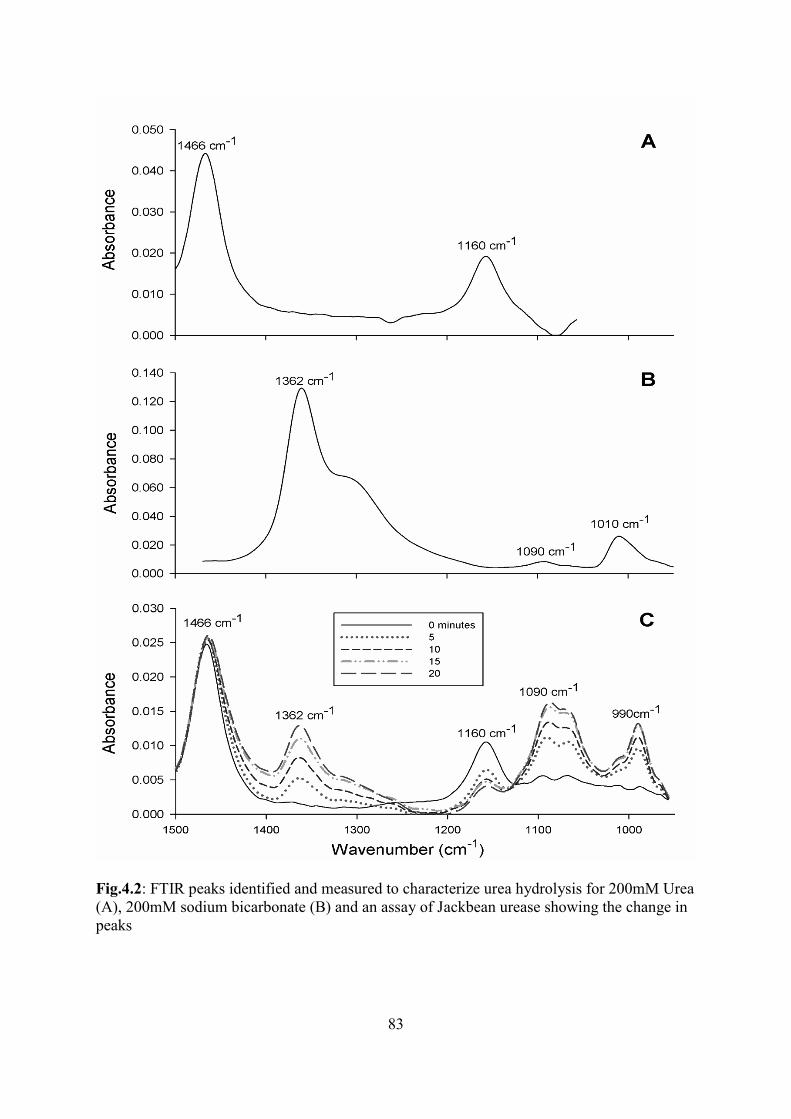
83
Fig.4.2: FTIR peaks identified and measured to characterize urea hydrolysis for 200mM Urea (A), 200mM sodium bicarbonate (B) and an assay of Jackbean urease showing the change in peaks
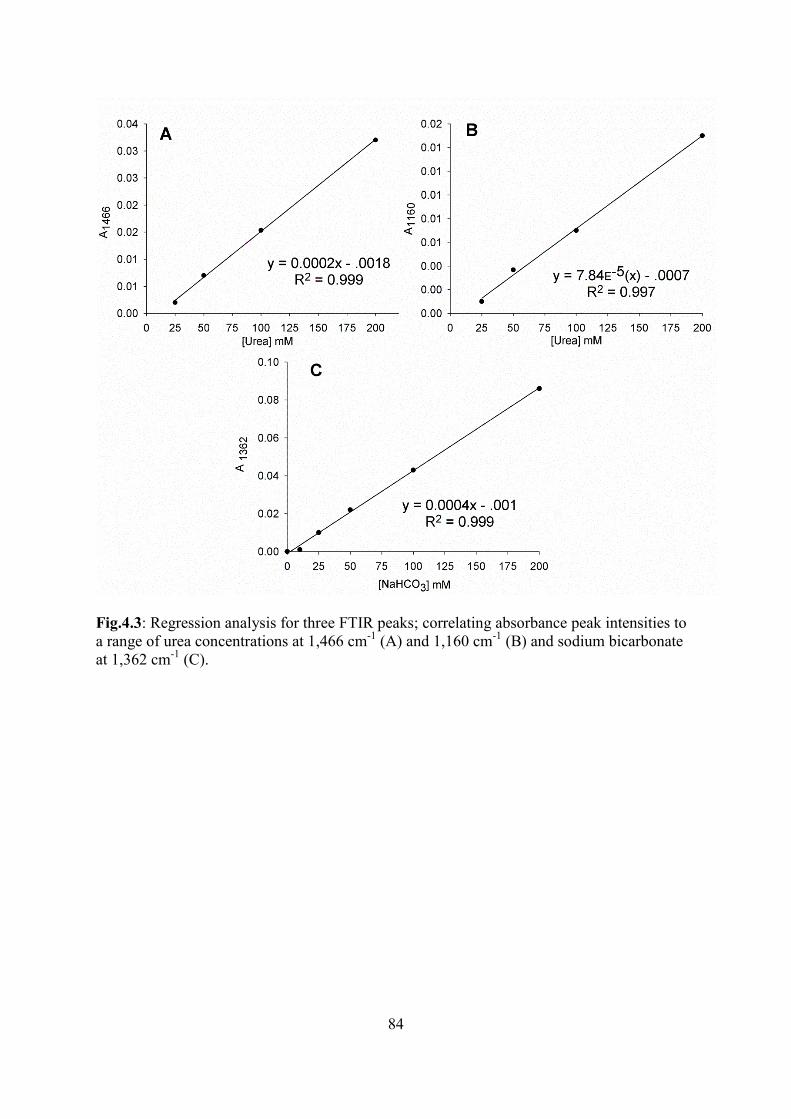
84
Fig.4.3: Regression analysis for three FTIR peaks; correlating absorbance peak intensities to a range of urea concentrations at 1,466 cm-1 (A) and 1,160 cm-1 (B) and sodium bicarbonate at 1,362 cm-1 (C).
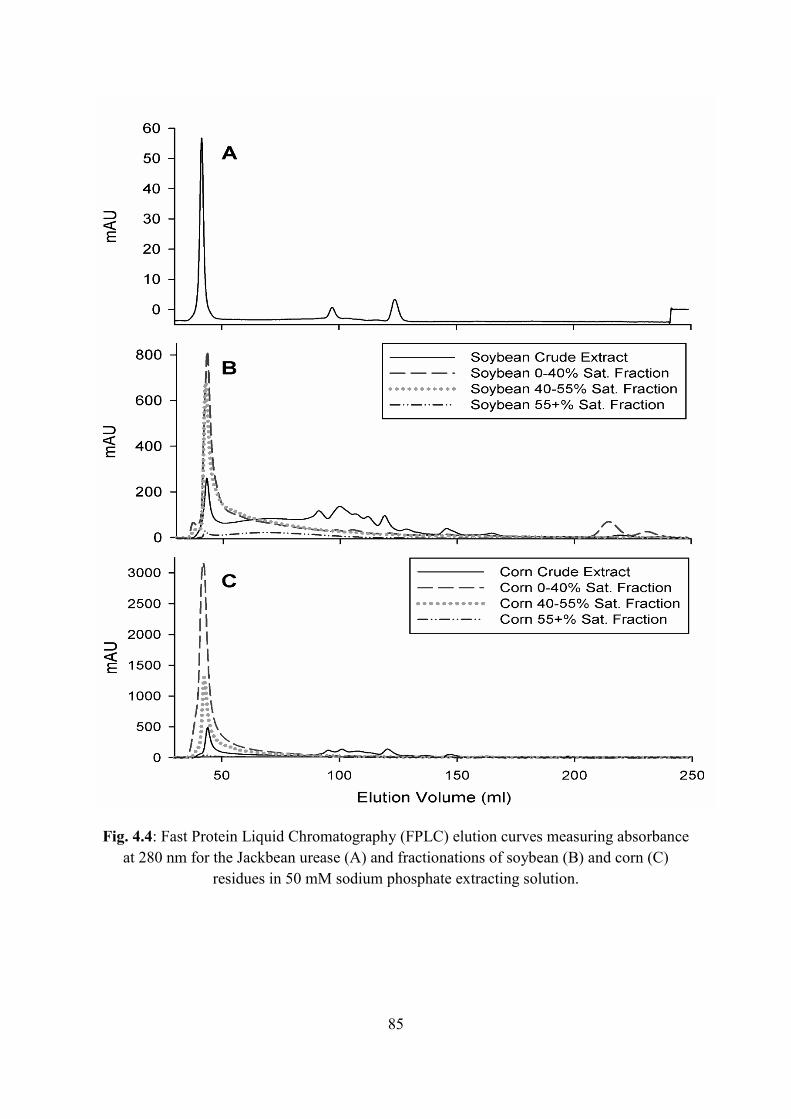
85
Fig. 4.4: Fast Protein Liquid Chromatography (FPLC) elution curves measuring absorbance at 280 nm for the Jackbean urease (A) and fractionations of soybean (B) and corn (C)
residues in 50 mM sodium phosphate extracting solution.
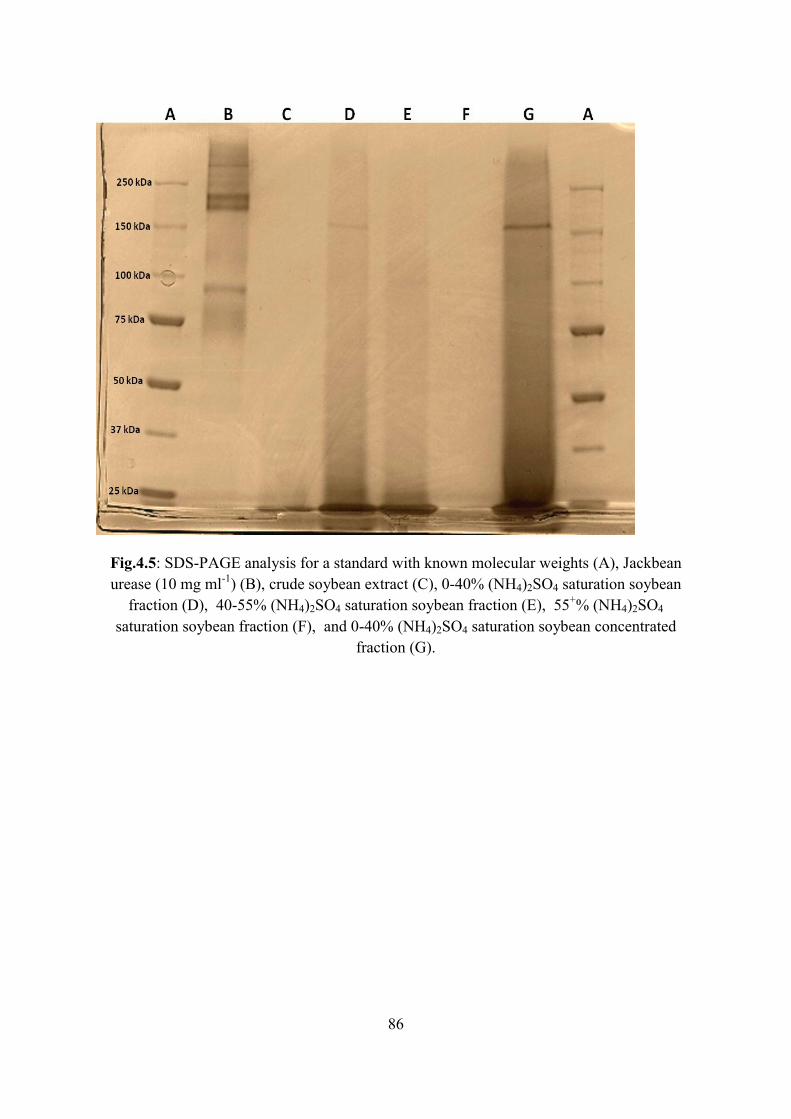
86
Fig.4.5: SDS-PAGE analysis for a standard with known molecular weights (A), Jackbean urease (10 mg ml-1) (B), crude soybean extract (C), 0-40% (NH4)2SO4 saturation soybean
fraction (D), 40-55% (NH4)2SO4 saturation soybean fraction (E), 55+% (NH4)2SO4 saturation soybean fraction (F), and 0-40% (NH4)2SO4 saturation soybean concentrated
fraction (G).

87
Fig. 4.6: Progress curves for urea hydrolysis monitoring the formation of bicarbonate at 1,362 cm-1. The reaction mixture contained 1 ml of 200mM urea with 1 ml of Jackbean
urease or soybean urease fractionation at 25 oC for 20 minutes
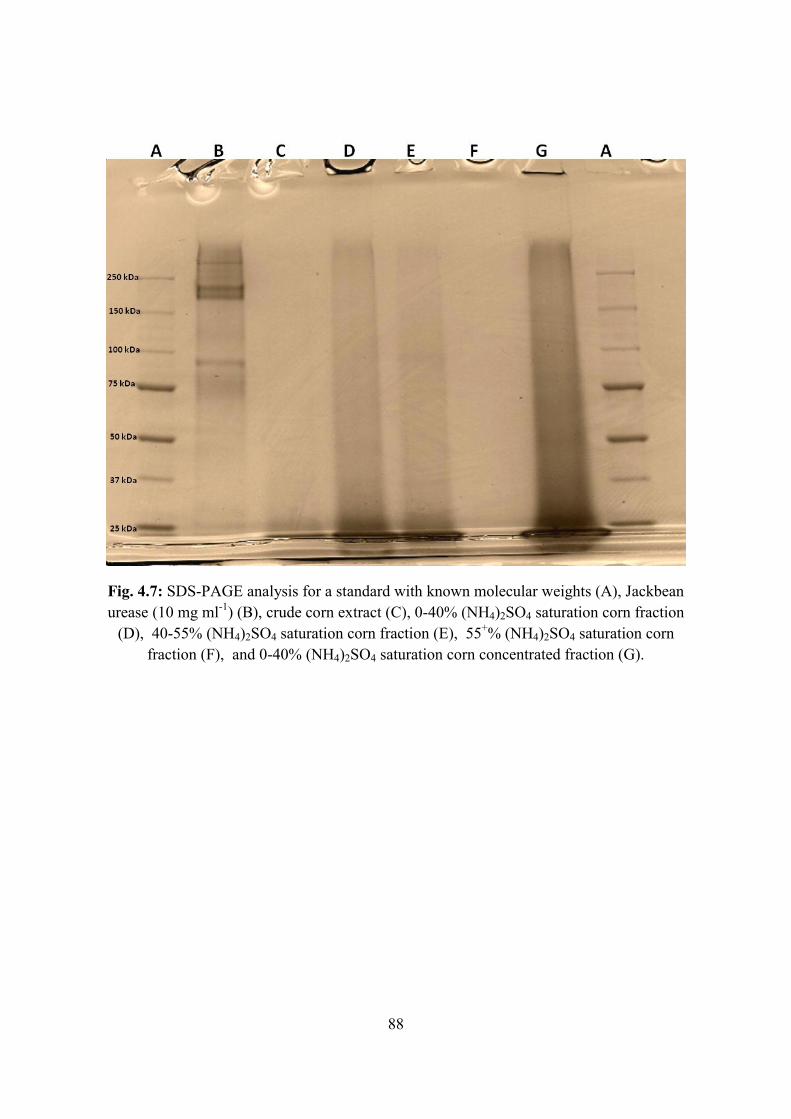
88
Fig. 4.7: SDS-PAGE analysis for a standard with known molecular weights (A), Jackbean urease (10 mg ml-1) (B), crude corn extract (C), 0-40% (NH4)2SO4 saturation corn fraction
(D), 40-55% (NH4)2SO4 saturation corn fraction (E), 55+% (NH4)2SO4 saturation corn fraction (F), and 0-40% (NH4)2SO4 saturation corn concentrated fraction (G).
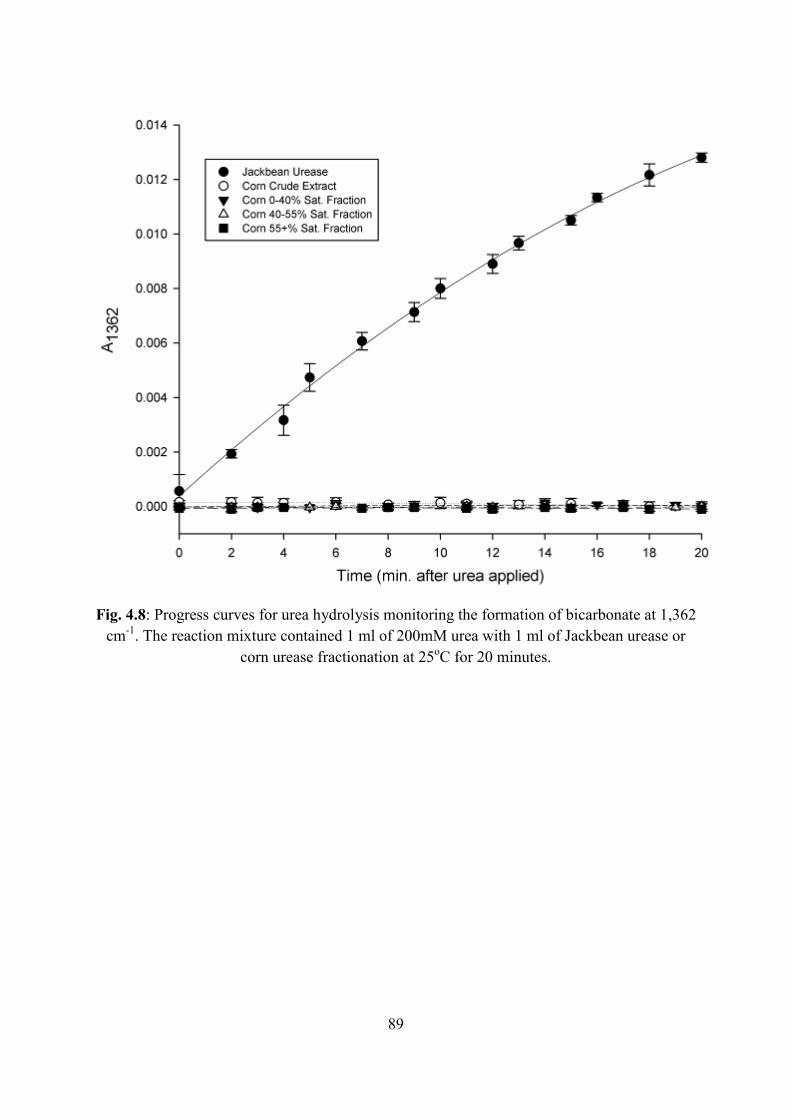
89
Fig. 4.8: Progress curves for urea hydrolysis monitoring the formation of bicarbonate at 1,362 cm-1. The reaction mixture contained 1 ml of 200mM urea with 1 ml of Jackbean urease or
corn urease fractionation at 25oC for 20 minutes.
90
5 Agronomic Evaluation of Coated Urea to Reduce Ammonia Volatilization from
Side-dress Applications to Zea mays L.
William Hunter Frame,a* aDepartment of Crop and Soil Environmental Sciences, Virginia Tech, 330 Smyth Hall (0404), Blacksburg, VA 24061, USA *Corresponding author E-mail address: [email protected] Tel.: +1 540 2314521; Marcus M. Alleya aDepartment of Crop and Soil Environmental Sciences, Virginia Tech, 330 Smyth Hall (0404), Blacksburg, VA 24061, USA E-mail address: [email protected] Tel.: +1 540 2319777; fax: +1 540 2313431 Wade Thomason aDepartment of Crop and Soil Environmental Sciences, Virginia Tech, 330 Smyth Hall (0404), Blacksburg, VA 24061, USA E-mail address: [email protected] Tel.: +1 540 2312988; fax: +1 540 2313431 Garnett Whitehurstb b Vice President, Whitehurst and Associates, Inc. New Bern, NC 28564, USA E-mail: [email protected] Tel.: 1 252 6382293 Brooks Whitehurstb b President, Whitehurst and Associates, Inc. New Bern, NC 28564, USA E-mail: [email protected] Tel.: +1 252 6382293 Robert Campbellc c Senior Productivity Scientist, Southern Timberlands Research, Weyerhaeuser NR Company Vanceboro, NC 28586, USA E-mail: [email protected] Tel.: +1 252 6337248

91
5.1 Abstract
Urea is the dominant nitrogen (N) fertilizer used globally because of its high N
concentration, ease of handling, and cost. The objectives of this research were: 1) to compare
the effect of urea with and without the urease inhibitor, N-(n-butyl) thiophosphoric triamide
(NBPT) on corn ear leaf N content and grain yield; and 2) to compare the effect of sulfate
salts as coatings with and without NBPT on N concentration in corn ear leaves and corn grain
yield in field studies. The current study was conducted at 10 locations over 3 years in
Virginia and North Carolina to evaluate NBPT as a coating on granular urea in corn
production systems. Urea and Arborite® Ag were applied at four N rates: 56, 112, 168, and
224 kg N ha-1and all other coatings were applied at 112 kg N ha-1. All treatments were
surface broadcast at V5-V7, and all other nutrients were applied based on soil test
recommendations. Percent N in corn ear leaves and grain yield were measured to evaluate the
effect of the coatings on N availability. Low rainfall early in the growing season at locations
3-10 did not seem to be detrimental to grain yield as all locations had higher than the
expected grain yields for their respective soil types. The concentration of N in corn ear leaves
was significantly increased using Arborite® Ag at 5 out the 10 locations during the study at α
= 0.1. Grain yield and N concentration in corn ear leaves increased at a decreasing rate with
N rates from 0-224 kg N ha-1. Physical and chemical coatings had no effect on N
concentration in corn ear leaves and grain yield at 112 kg N ha-1.
5.2 Introduction
Commercial N fertilizers are an essential part of agricultural cropping systems
worldwide. Nearly 40% of the increase in grain yield over the past sixty years can be
attributed to N fertilization. (Brown, 1999; Mosier et al., 2004; Peoples et al., 2004; Smil,
2002). Nitrogen is lost through the following pathways: (1) denitrification; (2) leaching; (3)
ammonia volatilization; (4) runoff; and (5) erosion. Of these loss pathways, denitrification

92
and ammonia volatilization are the greatest gaseous loss mechanisms worldwide (IFA/FAO,
2001). Losses of N from ammonia volatilization are higher than losses from denitrification
due to the increased use of urea during the past two decades (IFA/FAO, 2001).
Urea has become the dominant N source worldwide because of its high N
concentration, positive handling characteristics, and cost compared to alternative N sources.
Urea undergoes a hydrolysis reaction when applied to the soil surface, converting urea to
bicarbonate and ammonium. The reaction is catalyzed by the enzyme urease, found
ubiquitously in soil, plants and animals. Soil urease is more stable and persistent than other
ureases found in bacteria and plants (Kiss and Simihaian, 2002). Adsorption of the enzyme to
organic matter and clay colloids protect the enzyme from microorganisms and subsequent
degradation. The protected soil urease enables the hydrolysis reaction to proceed at rates 1014
times faster than the non-catalyzed reaction, producing large quantities of ammonium in a
small zone surrounding the applied urea fertilizer granule and bicarbonate that produces an
abrupt increase in pH in the zone of urea hydrolysis (Ciurli et al., 1999; Mobley and
Hausinger, 1989). The pH increase around the concentrated zone of urea converts ammonium
to ammonia, and if this occurs on the soil surface, the ammonia is lost to the atmosphere.
Applying urea on the soil surface can result in losses greater than 50% of the applied fertilizer
N via ammonia volatilization, although average losses are generally much lower, i.e. 20 to
25% (Antisari et al., 1996; Bayrakli, 1990; Beyrouty et al., 1988; Carmona et al., 1990;
Christianson et al., 1990; Christianson et al., 1994).
A management tactic to prevent rapid hydrolysis in soil systems is to apply a urease
inhibitor with the urea fertilizer. A urease inhibitor application is usually accomplished as a
coating on urea granules or adding the inhibitor into urea-ammonium nitrate (UAN)
solutions. Urease inhibitors block the active site of the enzyme preventing hydrolysis of urea.
Urease inhibitors have been studied for agricultural systems in the field and simulated
93
systems in laboratories. Turner et al. (2010) found that NBPT slowed urea hydrolysis and
decreased ammonia loss compared to untreated urea during a trial using winter wheat.
Rawluk et al. (2001) also found that the rate of hydrolysis and ammonia volatilization losses
were reduced 75-85% for urea treated with NBPT rates ranging from 0.05 to 0.15% w/w,
when compared to untreated urea applied at 100 kg N ha-1. Buresh et al. (1988) concluded
that NBPT increased agronomic efficiency and potentially could increase yields of lowland
rice. However, little information has been compiled on the effect of NBPT on corn (Zea Mays
L.) production in Virginia and North Carolina.
Until recently the only source of NBPT available to producers was Agrotain®
products (Koch Agronomic Services, LLC, Wichita, KS). Recently, Weyerhaeuser Co.
(Federal Way, W.A.) and Brooks Whitehurst and Associates, Inc. (New Bern, N.C.) have
developed a binder technology to coat urea granules with NBPT. This new product will be
marketed under the trade name Arborite® Ag, with a NBPT application rate of 0.08% w/w.
The coating technology has been successfully used in commercial fertilization of loblolly
pine (Pinus taeda) production, and also has the benefit of being able to coat urea with
secondary and micronutrients such as sulfur, or other powder formulated nutrients (Personal
Communication, Robert Campbell, 2010). Calcium sulfate coated urea has shown promise as
an ammonia volatilization control as well as providing plant available sulfur. Laboratory
studies have shown that ammonia volatilization was reduced with the use of the calcium
sulfate and ammonium sulfate coatings when NBPT was also applied in the coating (Frame et
al., 2012, Agron. J. In review). Field evaluations of these fertilizers have not been conducted.
The objectives of this research were: 1) to compare the effect of urea with and without
the urease inhibitor, NBPT on corn ear leaf N content and grain yield; and 2) to compare the
effect of sulfate salts as coatings on urea with and without NBPT on N concentration in corn
ear leaves and corn grain yield in field studies.

94
5.3 Material and Methods
A total of 10 field trials from 2009-2011 were conducted to evaluate the use of
surface-applied urea with multiple physical coatings with and without the urease inhibitor
NBPT. Out of the 10 sites, 4 were conducted in 2009, 5 in 2010, and 1 in 2011. Five sites
over 2 years were conducted near New Bern, N.C., in the Neuse River Basin, with the
remaining four in Virginia (Table 5.1). One site was in the eastern piedmont of Virginia with
the remaining four being conducted in Blacksburg, Va., at Virginia Tech’s Kentland Farm, in
the Ridge and Valley physiographic province. Dominant soil series, taxonomic description,
and coordinates for each site are shown in table 5.1. Trials were conducted using a
randomized complete block design with four replicates of each treatment at each location.
Nitrogen application rates were nested within treatments for both years of the study with urea
and Arborite® Ag urea applied at 56, 112, 168, and 224 kg N ha-1. The urease inhibitor,
NBPT, was applied at an application rate of 0.08% w/w as this is the commercial standard
rate used in the U.S. All other coated treatments were applied at 112 kg N ha-1. In 2009, there
were 12 total treatments (Table 5.2) and 15 total treatments in 2010 and 2011 (Table 5.2).
Treatments were applied to 6 row plots with row widths of 0.76 and 0.91 m. An
individual plot consisted of 6 rows of corn and varying row widths were a result of dual
purpose planters for cotton and corn in North Carolina. Plot lengths varied from 9.14 m and
7.62 m depending on the available area at each location. Treatments were hand-applied at
growth stage V5-V7 and every effort made to avoid precipitation in the weather forecast
around the time of application. Phosphorus and potassium were applied at the recommended
rates based on soil tests to ensure no other nutrient was limiting plant growth.
Corn ear leaf samples were collected from the second and fifth rows of plots, dried at
60°C until a constant weight was reach, ground to pass a 0.5mm sieve and analyzed for g N
100 g-1 tissue using a Vario Max CNS-analyzer (Elementar, Hanau, Germany). All corn ear
95
leaves were collected at green silking stage of development. Yield data were collected on the
third and fourth rows, the two middle rows, of plots using two different methods. A plot
combine was used to harvest where possible. The combine shelled the grain and weighed the
grain from the total length of the plot using a load cell. A subsample was then taken from
each plot for analysis of moisture and test weight using a Dickey John GAC® 2000. For the
remaining sites two 3.05 meter sections were hand-harvested from the third and fourth rows
of plots. The total weight of ears was recorded and six representative ears were sub-sampled
and weighed. The grain and cob were separated by hand shelling the six ear sample and the
cobs were weighed to calculate a percent shelled weight from the subsample. The grain
subsample was processed using the Dickey John GAC 2000. Yields were calculated as Mg
grain ha-1 based on an adjusted moisture content of 15.5%.
Treatments were analyzed in two groups based on treatment design. Analysis of
variance was conducted using Proc Mixed, with a factorial treatment design, for all
combinations of N rates, urea and Arborite® Ag in SAS 9.2. Polynomial regression analyses
were conducted to determine the response to N fertilization as urea and Arborite® Ag using
Sigma Plot 11 (Systat Systems, 2008). Regression analyses for both urea and Arborite® Ag
were conducted only at sites where the main effect of coating was significant at α = 0.1. At
locations where the coating main effect was not significant a combined regression analysis
was conducted to described the N rate response on N content in corn ear leaves and grain
yield. Analysis of variance was conducted for all coatings at 112 kg N ha-1 using Proc Mixed
in SAS 9.2 and mean separation was conducted using the Tukey-Kramer mean separation
procedure at alpha = 0.05.
96
5.4 Results and Discussion
5.4.1 Sidedress N rates and Coatings
Nitrogen content of corn ear leaves increased at a decreasing rate (quadratic response)
from 0-224 kg N ha-1 at all locations except location 9 (Figs 5.1 and 5.2). Nitrogen
concentration in corn ear leaves was significantly higher using Arborite® Ag than urea alone
at 5 out of the 10 locations during the study (Table 5.3 and Fig. 5.1). The five locations had
the strongest relationship between N rate and N content of corn ear leaves out of the ten
locations (Fig. 5.1). The N response at locations where Arborite® Ag and urea were not
significantly different in N content of corn ear leaves can be found in Fig. 5.2 and Table 5.3.
The relationship between N content in corn ear leaves and N sidedress application rates was
weaker (lower R2 values) at these sites than the locations where Arborite® Ag and urea were
significantly different (Figs. 5.1 and 5.2).
The N sufficiency range for N content of corn ear leaves in Virginia is defined as
3.00-3.50 g N 100 g-1 tissue (Donohue, 2000). The average y-intercept of the regression
analyses at the locations where Arborite® Ag and urea did not differ was 2.59±0.51 while at
the locations in Fig. 5.1 the average y-intercept was 2.04±0.32. This difference in N content
at 0 kg N ha-1 suggests that at the sites where Arborite® Ag and urea did not different, there
was more N available from mineralization than at the locations where Arborite® Ag and urea
differed.
Grain yield with Arborite® Ag and urea significantly differed at 3 out of the 10
locations during the study (Fig. 5.3). At locations 1 and 3 Arborite® Ag significantly
increased grain yields while at location 6, urea produced significantly higher grain yields
(Table 5.3). The regression analysis of Arborite® Ag over sidedress N application rates was
not significant at location 6 and the difference between urea and Arborite® Ag cannot be
biologically explained as urea did not produce significantly higher in N content of corn ear
97
leaves or higher grain yields at any other location. At the other 7 locations Arborite® Ag and
urea did not different in grain yield and regression analyses show that yield response to N
sidedress application was quadratic at all sites except locations 2 and 9. There was not a
significant relationship between grain yield and sidedress N rate at location 9 (Fig. 5.4), this
was the only location in the study that did not have a significant grain yield response to N
fertilization. The coefficient of variation for grain yield at each location ranged from 3-14%
with an average of 9.9% during the study. Rozas et al. (1999) found that NBPT did not
significantly increase N uptake and grain yield of corn. Watson et al. (1998) reported mixed
responses to NBPT in terms of dry matter yield and N offtake in a perennial ryegrass (Lolium
perrenne) system. Dawar et al. (2010) found that dry matter yield of herbage in a mixed
pasture system was increased with the addition of NBPT coated on granular urea. The
variable grain yield response to NBPT during the study was most likely due to environmental
conditions during the 2009-2011 growing seasons such that volatilization losses of N from
the side-dress applications was not a major limiting factor to corn grain yields.
5.4.2 Physical coatings at 112 kg N ha-1
Responses to physical coatings were sparse during the study with only 3 out the 10
locations having significant differences in N concentration in corn ear leaves (Table 5.4). The
N concentration in corn ear leaves using urea was significantly lower than the K2SO4-coated
at location 4 (Table 5.4). These two treatments were the only treatments to be significantly
different at this location. The other two locations where differences occurred were locations 5
and 6 in 2010 where ESN® had significantly lower N concentrations in corn ear leaves than
all other coated treatments (Table 5.4). The lower N concentrations in corn ear leaves with
ESN® was most likely due to lower than average precipitation (Table 5.5) in June and July
which was not adequate to diffuse the urea through the polymer coating so that the N would
be plant available. The data set on ESN® was limited since only two locations contained the

98
treatment and more data are needed to make general conclusions about the effect of ESN® on
N content in corn ear leaves from surface broadcast, sidedress applications.
Grain yields were not significantly different at 112 kg N ha-1 between the selected
physically coated materials at each location from 2009-2011 (Table 5.6). The lack of
response to the coated urea materials was indicative that ammonia volatilization losses were
not great enough to influence yields at each location in this study. Also, at a majority of the
sites in this study N concentrations and grain yields were optimized at 112 kg N ha-1 (Figs.
5.1-5.4). While we expected that the 112 kg N ha-1 rate would be on the linear part of the
response curve where differences between coatings were likely to be observed, the rate was
not low enough for these sites. This means that the coated treatments were applied at an N
rate where the response to N loss would not be as great as at lower N rates (the linear portion
of the N response curves). The coefficient of variation at each location ranged from 3-16%
with an average of 10.9% which was lower than expected given the moisture stress during
June and July (Table 5.5). Also, the sulfur coated materials showed no advantage compared
to bulk blended fertilizer in respect to N concentration in tissues or grain yield.
All locations, except locations 1 and 2, received lower than average precipitation
during June (Table 5.5). Precipitation was lower than the 30 year averages for July at all
locations in 2009-2011. This time period was directly after N sidedress application and
visible signs of drought stress were present at many of the locations. Comparing the grain
yields at each location with the expected yields determined by soil type in table 5.1, the grain
yields in the current study are higher than expected yields. The average grain yields for
Virginia and North Carolina in 2009, 2010, and 2011 were 8.2, 4.2, and 7.4 Mg ha-1 and 7.3,
5.7, and 5.3 Mg ha-1, respectively (National Agricultural Statistic Service, 2012). The higher
than average and published expected grain yields in this study from 2009-2011 indicate that
there was enough moisture available to support higher than average yields in Virginia and
99
North Carolina at individual locations. The precipitation at the locations in this study was
lower than normal levels at all locations, and at locations 3, 4, 7, 8, and 9 the poorly drained
soils may have helped prevent drought stress from limiting grain yield at these locations.
Location 2 was irrigated during the growing season to ensure yields were not limited by
drought. The expected yields of soil series may need to be updated to account for the higher
genetic yield potential and drought tolerance of current varieties given the lower than average
rainfall and higher grain yields measured during the study.
5.5 References
Antisari, L.V., C. Marzadori, P. Gioacchini, S. Ricci S., and C. Gessa. 1996. Effects of the
urease inhibitor N-(n-butyl)phosphorothioic triamide in low concentrations on
ammonia volatilization and evolution of mineral nitrogen. Biol. Fert. Soils 22:196-
201.
Bayrakli, F. 1990. Ammonia volatilization losses from different fertilizers and effect of
several urease inhibitors, CaCl2 and phosphogypsum on losses from urea. Fert. Res.
23:147-150.
Beyrouty, C.A., L.E. Sommers, and D.W.Nelson.1988. Ammonia volatilization from surface-
applied urea as affected by several phosphoroamide compounds. Soil Sci Soc Am J
52:1173-1178.
Brown, L.R. 1999. Feeding Nine Billion, In: L. R. Brown, et al. (Eds.), State of the world
1999: A Worldwatch Institute report on progress toward a sustainable society, W.W.
Norton & Company, New York. pp. 115-132.
Buresh,R.J., S.K. De Datta, J.L. Padilla, and M.I. Samsoa. 1988. Field evaluation of two
urease inhibitors with transplanted lowland rice. Agon. J. 80:763-768.
100
Carmona, G., C.B. Christianson, and B.H. Byrnes. 1990. Temperature and low concentration
effects of the urease inhibitor N-(n-butyl) thiophosphoric triamide (nBTPT) on
ammonia volatilization from urea. Soil Biol. Biochem.22:933-937. DOI: Doi:
10.1016/0038-0717(90)90132-j.
Christianson, C., B.Byrnes, and G. Carmona. 1990. A comparison of the sulfur and oxygen
analogs of phosphoric triamide urease inhibitors in reducing urea hydrolysis and
ammonia volatilization. Fert. Res. 26:21-27.
Christianson, C., G. Carmona, M. Klein, and R. Howard.1994. Impact on ammonia
volatilization losses of mixing KCl of high pH with urea. Fert. Res. 40:89-92.
Ciurli, S., S. Benini, W.R. Rypniewski, K.S. Wilson, S. Miletti, and S. Mangani.1999.
Structural properties of the nickel ions in urease: novel insights into the catalytic and
inhibition mechanisms. Coordination Chemistry Reviews 190-192:331-355. DOI:
Doi: 10.1016/s0010-8545(99)00093-4.
Dawar, K., M. Zaman, J.S. Rowarth, J. Blennerhassett, and M.H. Turnbull. 2010. The impact
of urease inhibitor on the biovariability of nitrogen in urea and in comparison with
other nitrogen sources in ryegrass (Lolium perenne L.). Crop Pasture Sci. 61:214-221.
Donohue, S.J. 2000. Part VII: Soil testing and plant analysis. In: D.E. Brann, D.L.
Holshouser, and G.L. Mullins, editors, Agronomy handbook. Virginia Cooperative
Extension, Virginia Tech, Blacksburg, VA. 75-86.
Frame, W.H., M. Alley, R. Campbell, G. Whitehurst, and B. Whitehurst. 2012. In vitro
evaluation of coatings to control ammonia volatilization from surface-applied urea.
Agron. J. In Review.
IFA/FAO. 2001. Global estimates of gaseous emissions of NH3, NO, N2O from agricultural
land, FAO, Rome.

101
Kiss, S., and M. Simihaian. 2002. Improving efficiency of urea fertilizers by inhibition of soil
urease activity. Kluwer Academic Publishers, Dordrecht, The Netherlands.
Mobley, H.L. and R.P.Hausinger 1989. Microbial ureases: significance, regulation, and
molecular characterization. Microbiol. Mol. Biol. Rev. 53:85-108.
Mosier, A.R., J.K.Syers, and J.R. Freney.2004. Nitrogen fertilizer: An essential component of
increased food, feed, and fiber production, In: A. Mosier, et al. (Eds.), Agriculture and
the Nitrogen Cycle: Assessing the impacts of fertilizeruse on food production and the
environment, Island Press, Washington D.C. pp. 3-15.
National Agricultural Statistics Service. 2012. Quick Stats. USDA.
http://quickstats.nass.usda.gov/results/484965C8-0EEF-3C2C-86B9-
E5A5AC9AB416 (accessed 7 April. 2012).
North Carolina Nutrient Management Workgroup. 2003. Realistic yields and nitrogen
application factors for North Carolina crops. http://nutrients.soil.ncsu.edu/yields/
North Carolina State University, North Carolina Department of Agriculture and
Consumer Services, North Carolina Department of Environment and Natural
Resources, Natural Resources Conservation Service. Raleigh NC.
Peoples, M.B., E.W. Boyer, K.W.T. Goulding, P. Heffer, V.A. Ochwoh, B. Vanlauwe, S.
Wood, K. Yagi, and van O. Cleemput.2004.Pathways of nitrogen loss and their
impacts on human health and the environment, In: A. R. Mosier, et al. (Eds.),
Agriculture and the nitrogen cycle: Assessing the impacts of the fertilizers use on
food production and the environment, Island Press, Washington, D.C. pp. 53-70.
Rawluk, C.D.L. and C.A.Grant, Racz G.J. 2001. Ammonia volatilization from soils fertilized
with urea and varying rates of urease inhibitor NBPT. Can. J. Soil Sci. 81:239-246.

102
Rozas, H. S., H. E. Echeverría, G.A. Studdert, and F.H. Andrade. 1999. No-till maize
nitrogen uptake and yield: effect of urease inhibitor and application time. Agron. J.
91:950-955
SAS Insitute. 2009. Users Guide: Statistics 2nd Edition. SAS Inst. Cary, NC.
Sigma Plot 11. 2008. Sigma plot 11: User’s guide. Systat Software, Inc. San Jose, CA.
Smil, V.2002. Nitrogen and food production: Proteins for human diets. AMBIO: A J. of the
Human Environ. 31:126-131. DOI:10.1579/0044-7447-31.2.126.
Turner, D.A., R.B. Edis, D. Chen, J.R. Freney, O.T. Denmead, and R. Christie. 2010.
Determination and mitigation of ammonia loss from urea applied to winter wheat with
N-(n-butyl) thiophosphorictriamide. Agric., Ecosyst.Environ. 137:261-266. DOI:
10.1016/j.agee.2010.02.011.
Watson, C.J., P. Poland, and M.B.D. Allen. 1998. The efficacy of repeated applications of the
urease inhibitor N-(n-butyl) thiophosphoric triamide for improving the efficiency of
urea fertilizer utilization on temperate grassland. Grass Forage Sci. 53:137-145.
Virginia Department of Conservation and Recreation. 2002. Nutrient management handbook
3rd edition. Section V: Nutrient Resource Assessments. Division of Soil and Water
Conservation. Richmond, VA.
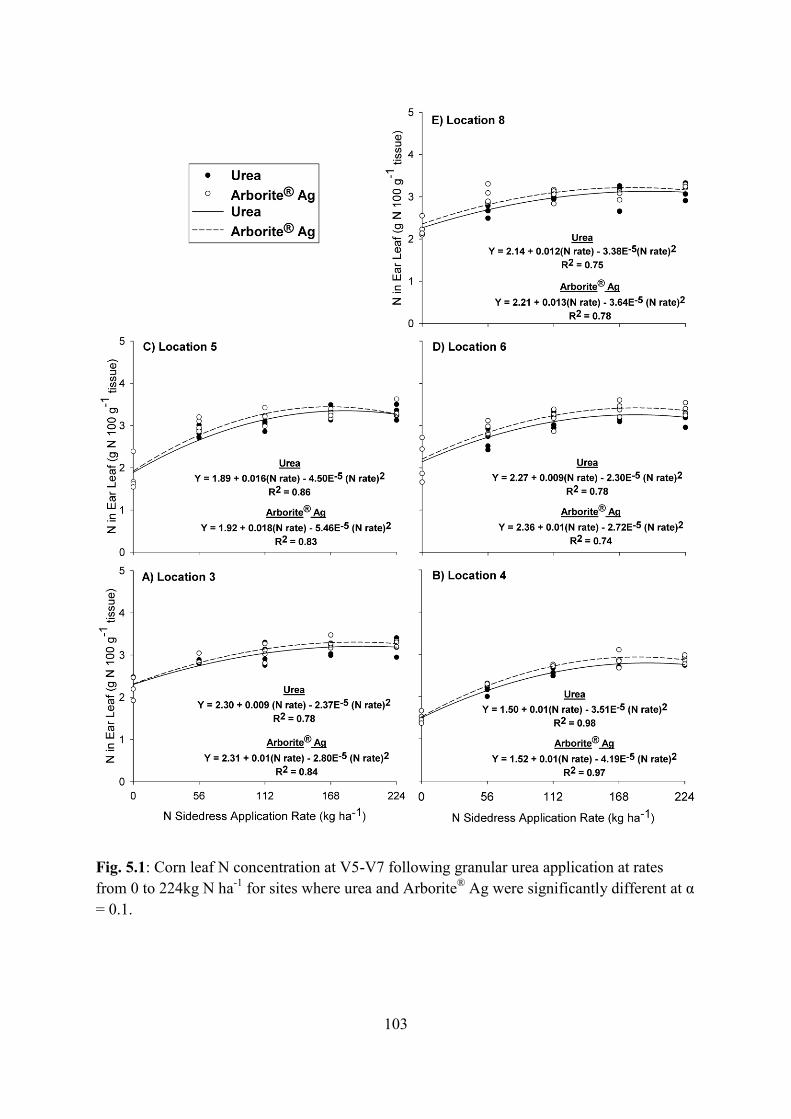
103
Fig. 5.1: Corn leaf N concentration at V5-V7 following granular urea application at rates from 0 to 224kg N ha-1 for sites where urea and Arborite® Ag were significantly different at α = 0.1.
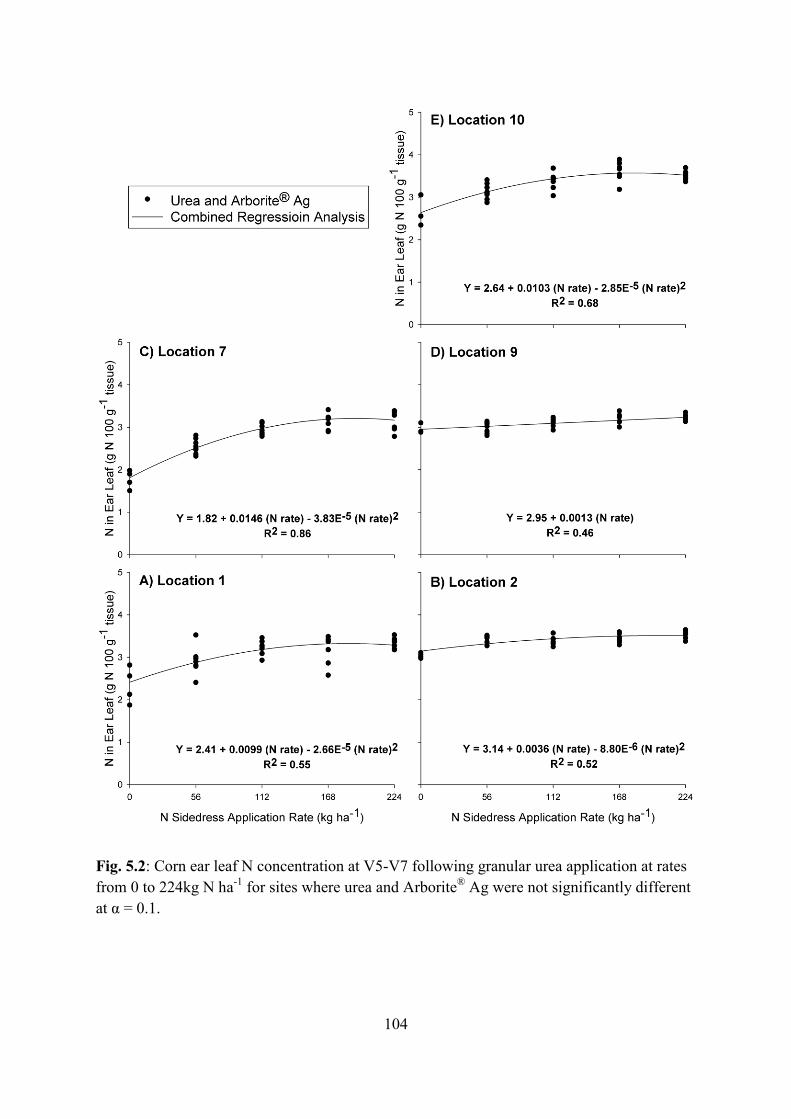
104
Fig. 5.2: Corn ear leaf N concentration at V5-V7 following granular urea application at rates from 0 to 224kg N ha-1 for sites where urea and Arborite® Ag were not significantly different at α = 0.1.

105
Fig. 5.3: Corn grain yield (Mg ha-1) and granular urea application at rates from 0 to 224kg N ha-1 for sites where urea and Arborite® Ag were significantly different at α = 0.1.
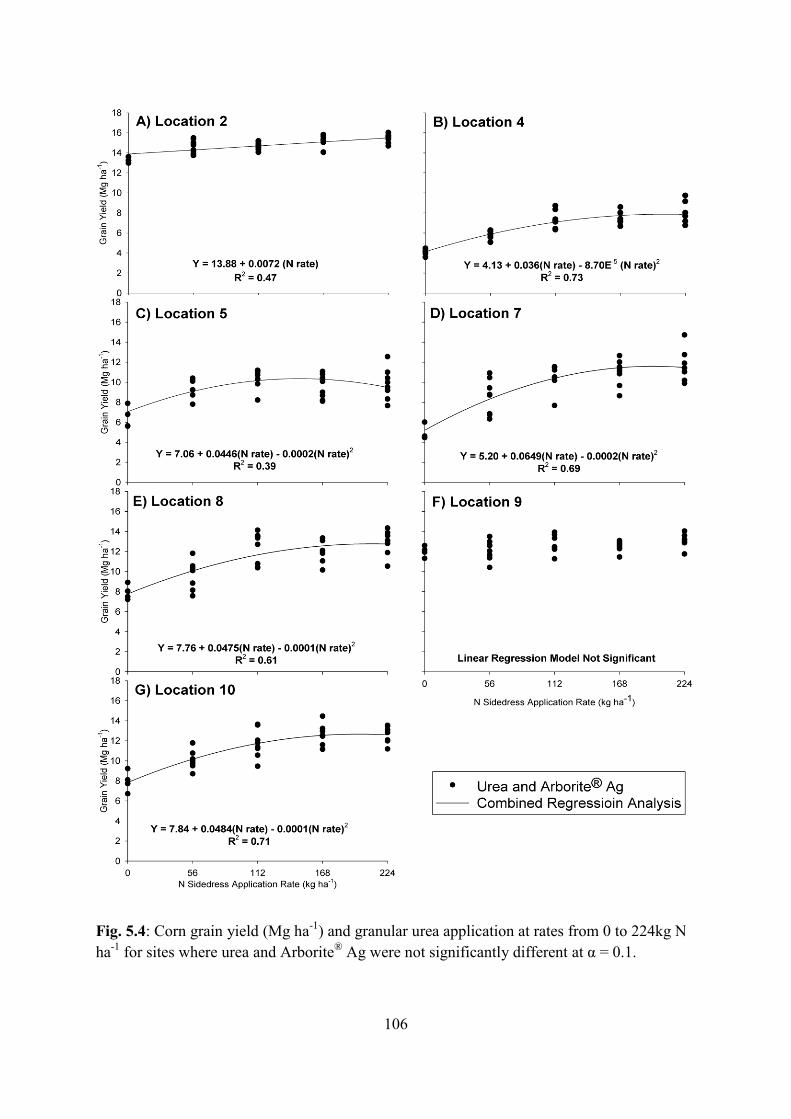
106
Fig. 5.4: Corn grain yield (Mg ha-1) and granular urea application at rates from 0 to 224kg N ha-1 for sites where urea and Arborite® Ag were not significantly different at α = 0.1.

107
Table. 5.1: Location names, coordinates, and soil descriptions for all locations during 2009-2011
† Soil productivity class and expected yields were determined by soil series in the Virginia Department of Conservation and Recreation (2002) ‡ Expected yields were taken from the North Carolina Nutrient Management Workgroup (2003)
Location # Year and Location Coordinates
Dominant Soil Series Taxonomic Description Expected Yields
(Productivity Class†) 2009 Mg ha-1
1 Kentland Farm, VA 37o 12’07.53" N, 80o 33’58.13”W Hayter loam Fine-loamy, mixed, active, mesic Ultic
Hapludalfs 9.41 (Ib)
2 Hanover, VA 37o 46’40.11”N, 77o 18’47.77”W
State loamy fine sand
Fine-loamy, mixed, semiactive, thermic Typic Hapludults 10.04 (Ia)
3 B. Campbell, NC 35o 13’46.39”N, 77o 03’00.51”W
Lynchburg fine sandy loam
Fine-loamy, siliceous, semiactive, thermic Aeric Paleaquults 7.8‡
4 Cove City, NC 35o 10’12.31”N, 77o 17’31.65”W
Rains fine sandy loam
Fine-loamy, siliceous, semiactive, thermic Typic Paleaquults 7.8‡
2010
5 Kentland Farm, VA 37o 12’15.31”N, 80o 33’39.36”W Hayter loam Fine-loamy, mixed, active, mesic Ultic
Hapludalfs 9.41 (Ib)
6 Childress Farms, VA 37o 05’06.11”N, 80o 29'45.06”W
Frederick/ Vertrees Silt Loam
Fine, mixed, semiactive, mesic Typic Paleudults/Fine, mixed, semiactive, mesic
Typic Paleudalfs 8.16 (IIb)
7 River rd, NC 35o 14’41.97”N, 77o 09’22.67”W Leon sand Sandy, siliceous, thermic Aeric Alaquods 4.4‡
8 Cow Pen Landing rd, NC 35o 15’04.79”N, 77o 09’14.63”W
Arapahoe fine sandy loam
Coarse-loamy, mixed, semiactive, nonacid, thermic Typic Humaquepts 8.8‡
9 State Camp rd, NC 35o 16’23.11”N, 77o 10’11.34”W
Arapahoe fine sandy loam
Coarse-loamy, mixed, semiactive, nonacid, thermic Typic Humaquepts 8.8‡
2011
10 Kentland Farm, VA 37o 11’32.21”N, 80o 34’39.17”W
Guernsey silt loam/Hayter loam
Fine, mixed, superactive, mesic Aquic Hapludalfs/
Fine-loamy, mixed, active, mesic Ultic Hapludalfs
8.16 (IIb)
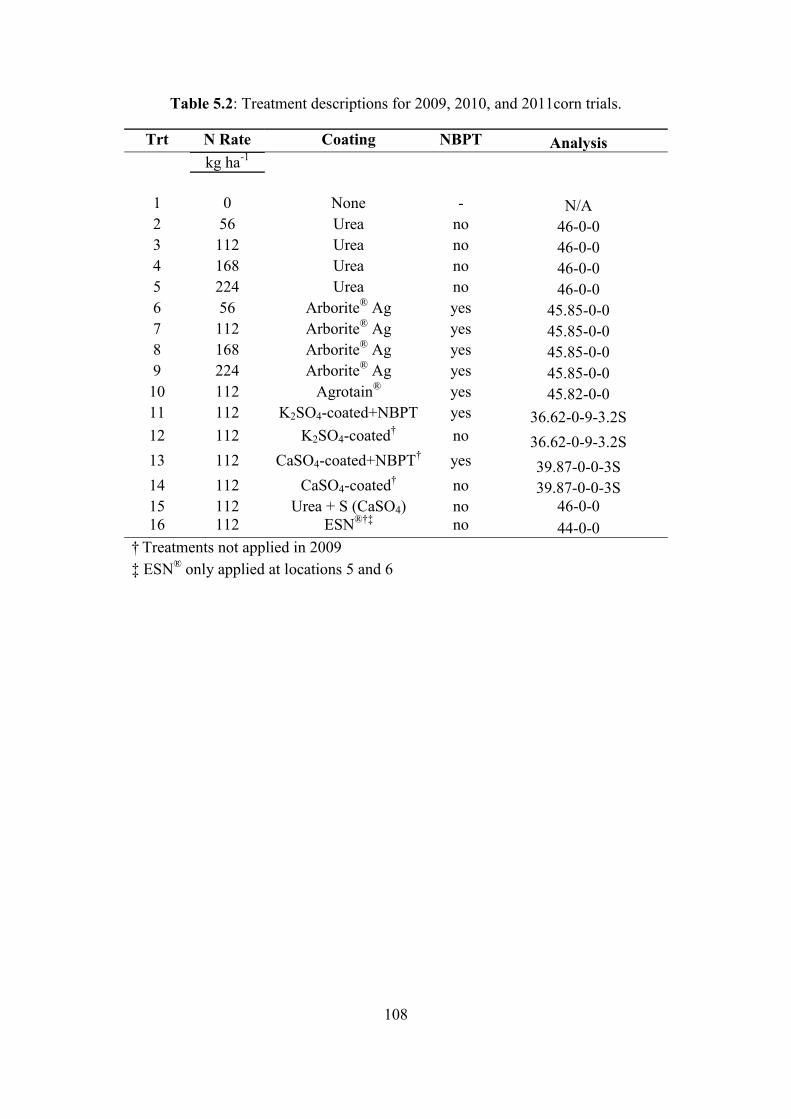
108
Table 5.2: Treatment descriptions for 2009, 2010, and 2011corn trials.
Trt N Rate Coating NBPT Analysis kg ha-1 1 0 None - N/A 2 56 Urea no 46-0-0 3 112 Urea no 46-0-0 4 168 Urea no 46-0-0 5 224 Urea no 46-0-0 6 56 Arborite® Ag yes 45.85-0-0 7 112 Arborite® Ag yes 45.85-0-0 8 168 Arborite® Ag yes 45.85-0-0 9 224 Arborite® Ag yes 45.85-0-0 10 112 Agrotain® yes 45.82-0-0 11 112 K2SO4-coated+NBPT yes 36.62-0-9-3.2S 12 112 K2SO4-coated† no 36.62-0-9-3.2S 13 112 CaSO4-coated+NBPT† yes 39.87-0-0-3S 14 112 CaSO4-coated† no 39.87-0-0-3S 15 112 Urea + S (CaSO4) no 46-0-0 16 112 ESN®†‡ no 44-0-0
† Treatments not applied in 2009 ‡ ESN® only applied at locations 5 and 6
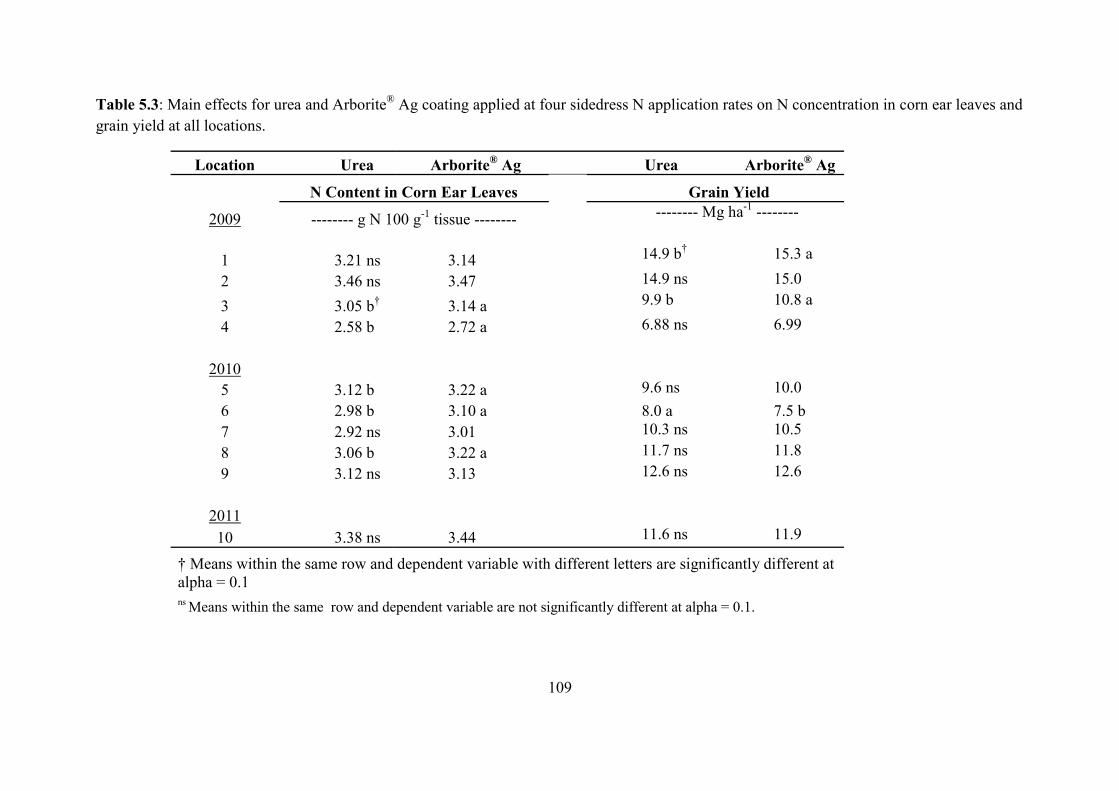
109
Table 5.3: Main effects for urea and Arborite® Ag coating applied at four sidedress N application rates on N concentration in corn ear leaves and grain yield at all locations.
Location Urea Arborite® Ag Urea Arborite® Ag
N Content in Corn Ear Leaves Grain Yield
2009 -------- g N 100 g-1 tissue -------- -------- Mg ha-1 --------
1 3.21 ns 3.14 14.9 b† 15.3 a
2 3.46 ns 3.47 14.9 ns 15.0
3 3.05 b† 3.14 a 9.9 b 10.8 a
4 2.58 b 2.72 a 6.88 ns 6.99
2010 5 3.12 b 3.22 a 9.6 ns 10.0 6 2.98 b 3.10 a 8.0 a 7.5 b 7 2.92 ns 3.01 10.3 ns 10.5 8 3.06 b 3.22 a 11.7 ns 11.8 9 3.12 ns 3.13 12.6 ns 12.6
2011 10 3.38 ns 3.44 11.6 ns 11.9
† Means within the same row and dependent variable with different letters are significantly different at alpha = 0.1 ns Means within the same row and dependent variable are not significantly different at alpha = 0.1.
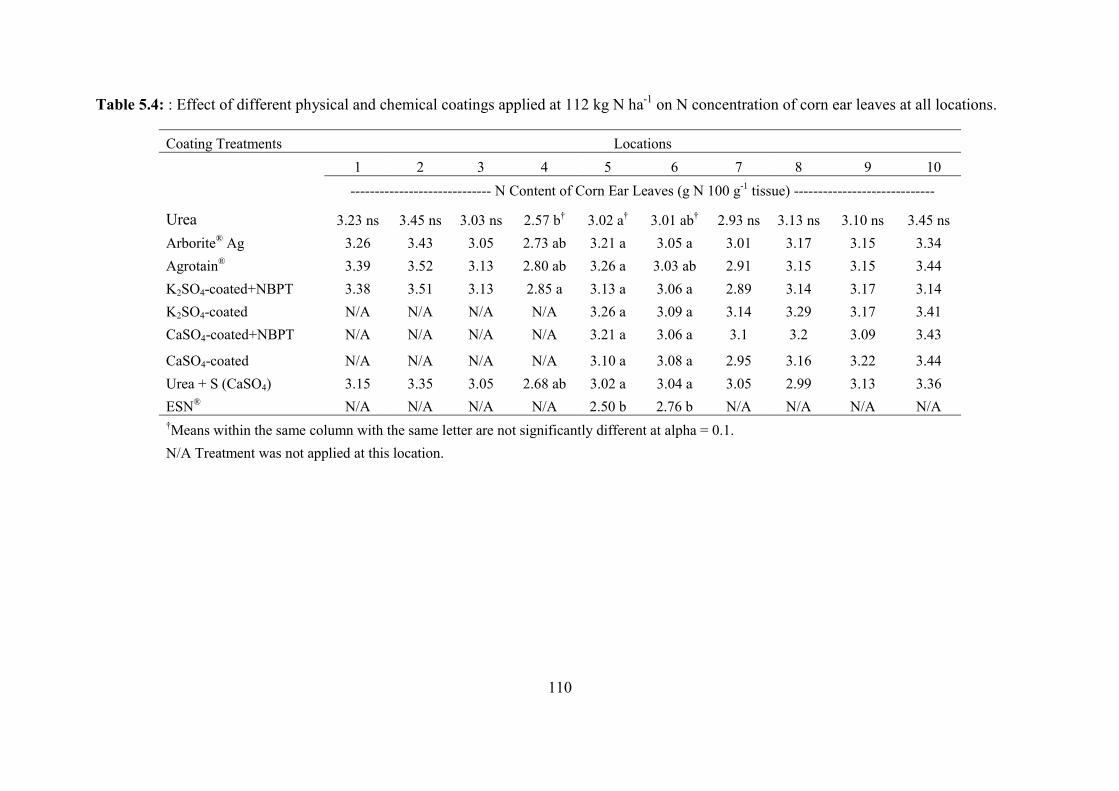
110
Table 5.4: : Effect of different physical and chemical coatings applied at 112 kg N ha-1 on N concentration of corn ear leaves at all locations.
Coating Treatments Locations 1 2 3 4 5 6 7 8 9 10 ----------------------------- N Content of Corn Ear Leaves (g N 100 g-1 tissue) -----------------------------
Urea 3.23 ns 3.45 ns 3.03 ns 2.57 b† 3.02 a† 3.01 ab† 2.93 ns 3.13 ns 3.10 ns 3.45 ns Arborite® Ag 3.26 3.43 3.05 2.73 ab 3.21 a 3.05 a 3.01 3.17 3.15 3.34 Agrotain® 3.39 3.52 3.13 2.80 ab 3.26 a 3.03 ab 2.91 3.15 3.15 3.44 K2SO4-coated+NBPT 3.38 3.51 3.13 2.85 a 3.13 a 3.06 a 2.89 3.14 3.17 3.14 K2SO4-coated N/A N/A N/A N/A 3.26 a 3.09 a 3.14 3.29 3.17 3.41 CaSO4-coated+NBPT N/A N/A N/A N/A 3.21 a 3.06 a 3.1 3.2 3.09 3.43
CaSO4-coated N/A N/A N/A N/A 3.10 a 3.08 a 2.95 3.16 3.22 3.44 Urea + S (CaSO4) 3.15 3.35 3.05 2.68 ab 3.02 a 3.04 a 3.05 2.99 3.13 3.36 ESN® N/A N/A N/A N/A 2.50 b 2.76 b N/A N/A N/A N/A †Means within the same column with the same letter are not significantly different at alpha = 0.1. N/A Treatment was not applied at this location.
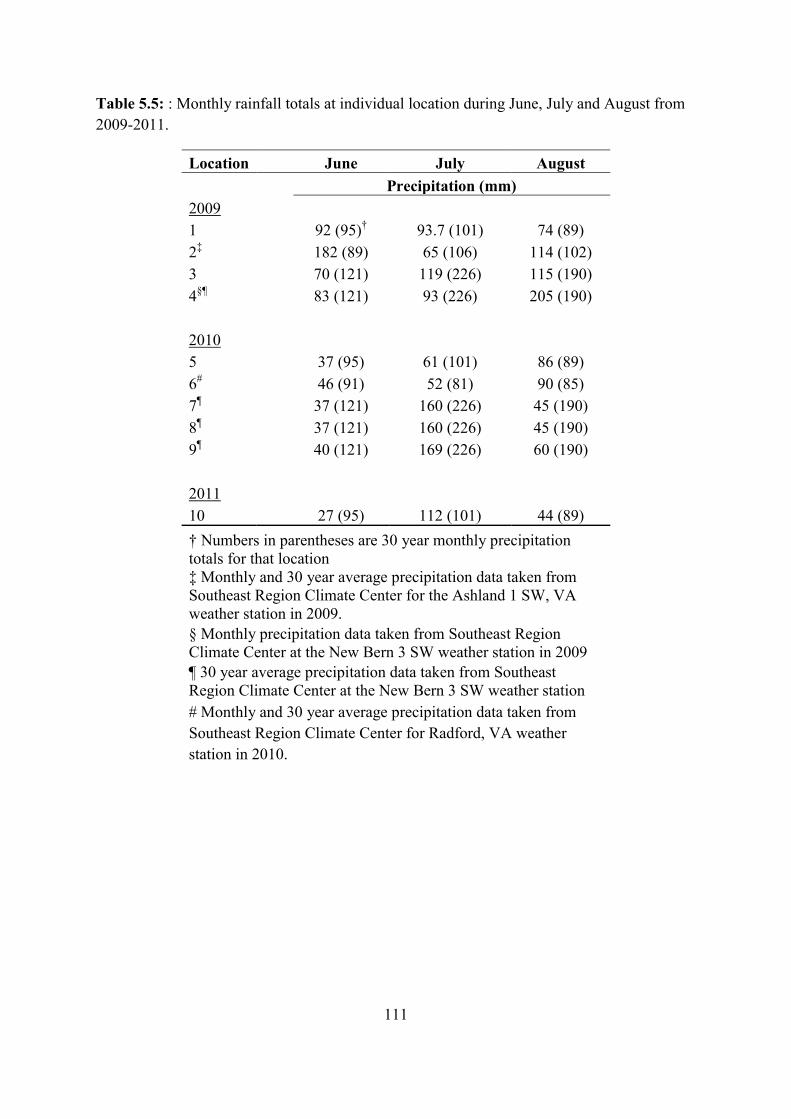
111
Table 5.5: : Monthly rainfall totals at individual location during June, July and August from 2009-2011.
Location June July August Precipitation (mm)
2009 1 92 (95)† 93.7 (101) 74 (89) 2‡ 182 (89) 65 (106) 114 (102) 3 70 (121) 119 (226) 115 (190) 4§¶ 83 (121) 93 (226) 205 (190)
2010 5 37 (95) 61 (101) 86 (89) 6# 46 (91) 52 (81) 90 (85) 7¶ 37 (121) 160 (226) 45 (190) 8¶ 37 (121) 160 (226) 45 (190) 9¶ 40 (121) 169 (226) 60 (190)
2011 10 27 (95) 112 (101) 44 (89) † Numbers in parentheses are 30 year monthly precipitation totals for that location ‡ Monthly and 30 year average precipitation data taken from Southeast Region Climate Center for the Ashland 1 SW, VA weather station in 2009. § Monthly precipitation data taken from Southeast Region Climate Center at the New Bern 3 SW weather station in 2009 ¶ 30 year average precipitation data taken from Southeast Region Climate Center at the New Bern 3 SW weather station # Monthly and 30 year average precipitation data taken from Southeast Region Climate Center for Radford, VA weather station in 2010.
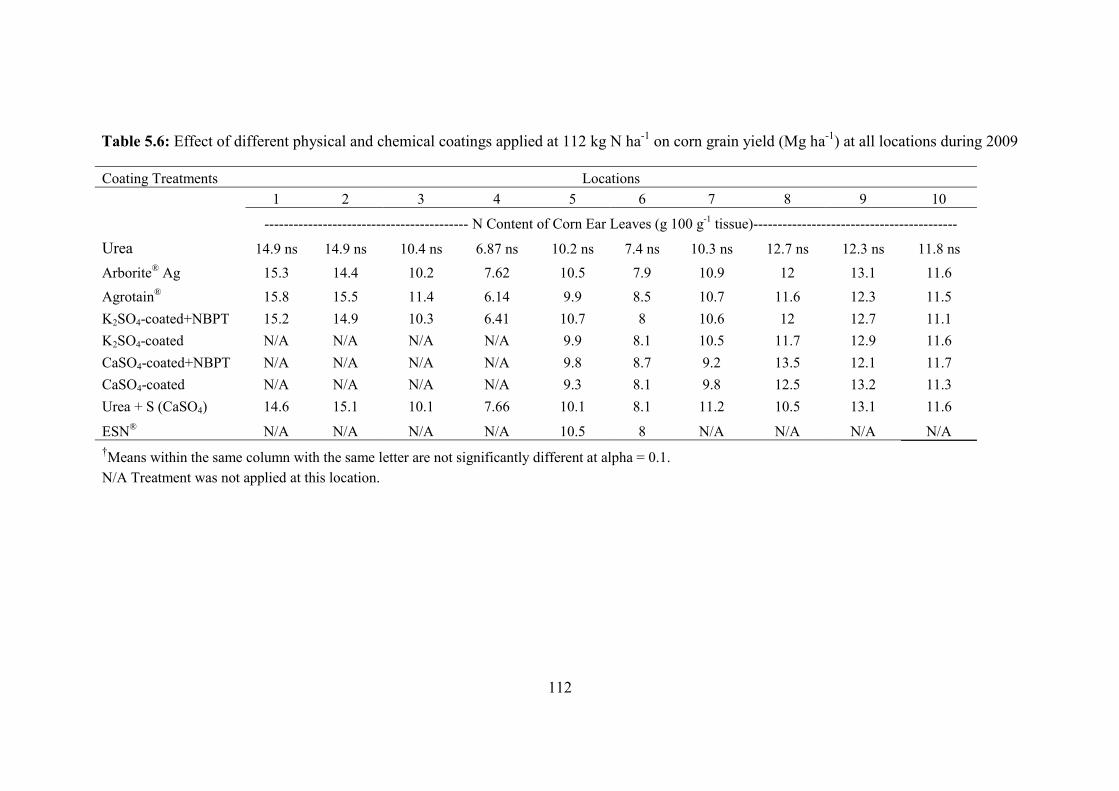
112
Table 5.6: Effect of different physical and chemical coatings applied at 112 kg N ha-1 on corn grain yield (Mg ha-1) at all locations during 2009
Coating Treatments Locations 1 2 3 4 5 6 7 8 9 10
------------------------------------------ N Content of Corn Ear Leaves (g 100 g-1 tissue)------------------------------------------
Urea 14.9 ns 14.9 ns 10.4 ns 6.87 ns 10.2 ns 7.4 ns 10.3 ns 12.7 ns 12.3 ns 11.8 ns Arborite® Ag 15.3 14.4 10.2 7.62 10.5 7.9 10.9 12 13.1 11.6 Agrotain® 15.8 15.5 11.4 6.14 9.9 8.5 10.7 11.6 12.3 11.5 K2SO4-coated+NBPT 15.2 14.9 10.3 6.41 10.7 8 10.6 12 12.7 11.1 K2SO4-coated N/A N/A N/A N/A 9.9 8.1 10.5 11.7 12.9 11.6 CaSO4-coated+NBPT N/A N/A N/A N/A 9.8 8.7 9.2 13.5 12.1 11.7 CaSO4-coated N/A N/A N/A N/A 9.3 8.1 9.8 12.5 13.2 11.3 Urea + S (CaSO4) 14.6 15.1 10.1 7.66 10.1 8.1 11.2 10.5 13.1 11.6
ESN® N/A N/A N/A N/A 10.5 8 N/A N/A N/A N/A †Means within the same column with the same letter are not significantly different at alpha = 0.1. N/A Treatment was not applied at this location.

113
6 Conclusions
The human population eclipsed 7 billion in 2011 and with that increasing population is
the need for increased food production globally. Since most of the arable land in the world is
already cultivated there needs to be increased crop yields on currently available arable land.
The use of synthetic inorganic N fertilizers, such as urea, has enable non-legume crop yields
to sustain human population growth. The dominant N source used globally is urea; however
when urea is surface-applied up to 50% of the applied N can be lost via ammonia
volatilization. This dissertation focused on management strategies to decrease ammonia
volatilization from agroecosystems, specifically corn production systems, in Virginia and
North Carolina utilizing NBPT coated granular urea, and selected physical coatings
containing sulfate salts. To accomplish this, a series of experiments were designed to evaluate
coated granular urea under controlled environmental conditions, determine the agronomic
impact of such coatings, and quantify the urease activity from two crop residues commonly
found in conservation tillage systems in Virginia and North Carolina.
The evaluation of coated granular urea was conducted using a novel laboratory
ammonia volatilization system. A series of two week trials were conducted to determine the
efficiency and variation inherent in the laboratory system at two air flow rates (1.00 and 2.00
L min-1), two acid trap volumes (50 and 100 ml), and at two temperatures (26 and 30 oC).
When the system was operated at 1.00 L min-1, with 100 ml of 0.02M phosphoric acid, and at
26oC the system could account for 97% of the applied N with a standard deviation of 1.6%
over all chambers. The standard deviation of mg N captured at each sampling interval was
also minimized at these system parameters. Given the efficiency and variation it was
determined that 1.00 L min-1, with 100 ml of 0.02M phosphoric acid, and at 26oC were the
optimum system parameters for future trials conducted with the laboratory ammonia

114
volatilization system, and that the system provided for reproducible comparison of ammonia
volatilization from urea fertilizers.
Using the system described and validated in chapter II, a series of trials were designed
to look at two chemically coated urea formulations consisting of NBPT, Arborite® Ag and
Agrotain®, as well as urea coated with calcium and potassium sulfate with and without the
inhibitor, NBPT. The final experiments quantified the effects of varying rates of NBPT as
Arborite® Ag on ammonia volatilization losses. Ammonia loss from granular urea occurred
within the first 9 h after N application and the maximum loss rate occurred from 12 to 24 h.
During this 12 h period 17-18% of the applied N was lost and this was equal to 1.5% of the
applied N h-1. Cumulative losses of N from urea ranged from 33-37% of the applied N over
the duration of a two week trial. When NBPT was applied as a coating to urea, ammonia
volatilization losses were delayed for 96h, the maximum loss rate averaged 0.16% of the
applied N h-1 at 120 to 168 h after N application, and cumulative losses were reduced to 19-
25% of the applied N. Calcium sulfate coated urea delayed ammonia volatilization for 24 h
after N application but did not reduce the cumulative loss of N during the two week trial.
Potassium sulfate coating delayed ammonia volatilization for 48 h after N application and
significantly reduced cumulative loss of N compared to urea. There was no difference in
cumulative losses of ammonia from urea coated with NBPT rates from 0.04 to 0.1% w/w.
Further research needs to be conducted to see if NBPT rates lower than the commercial
standard of 0.08% w/w could be used to achieve similar control of volatilization under field
conditions.
Under field conditions ammonia volatilization losses are generally lower than those
reported in laboratory studies. However, in no-till cropping systems ammonia volatilization
losses are higher than conventionally tilled cropping systems. In order to understand why
losses of ammonia are greater in no-till systems, an experiment was designed to extract and

115
assay the activity of urease from crop residues commonly found in Virginia. Urease was
extracted using sodium phosphate based extracting solutions and urease activity assays were
conducted using Fourier transform infrared spectroscopy (FTIR). It was found that a 50 mM
sodium phosphate solution provided enough buffering capacity to minimize pH change in
crude extracts. Using FTIR one could monitor the disappearance of reactants and appearance
of reaction products in real time without altering the reaction mixture. Monitoring the
production of bicarbonate at 1362 cm-1 was optimum for determining the rate of urea
hydrolysis compared to monitoring the disappearance of urea. Urease was successfully
extracted and assayed from soybean residues, however urease from corn residues could not
be identified in the extract and urease activity assays did not produce bicarbonate as seen in
the Jackbean and soybean urease activity assays. Further research needs to be conducted over
a more diverse pool of genetic material for corn and soybeans as well as other potential
residue covers. However, the initial results of the extractions indicated that there might be
differences in urease content and thus urease activity in different residues. Further studies are
needed to determine if urease activity in different residue covers needs to be considered when
selecting N management tactics to minimize losses via ammonia volatilization.
The final study conducted for this dissertation was a field study to measure the
impacts of Arborite® Ag, Agrotain®, and the selected physical coatings on the agronomic
performance of corn receiving urea N fertilization. Ten locations during 2009-2011 were
selected in Virginia and North Carolina for the agronomic trials where urea and coated urea
was applied at corn growth stage V5-V7 as surface broadcast applications. Sampling of corn
ear leaves at silking for N content revealed a trend that applying Arborite® Ag at four N rates
increased the percent N in leaf tissue. Yield responses to Arborite® Ag were inconclusive as
there was no clear advantage when Arborite® Ag was applied compared to urea. A literature
review revealed that other field trials utilizing NBPT were also mixed with some reporting
116
substantial increases in grain or biomass yields while others reported little to no effect of
NBPT. When Arborite® Ag, Agrotain®, and sulfate coatings were compared at 112 kg N ha-1
there were no differences in N concentration of corn ear leaves and grain yields. The polymer
coated urea, ESN®, was significantly lower in N concentration in corn ear leaves, however
the treatment was only applied at two locations and a larger data set is needed to confirm this
difference. The lack of response to different coatings on granular urea was most likely due to
applying the fertilizers at an N rate above the linear portion of the N response curve.
Coating granular urea with NBPT reduced ammonia loss allowing more N to be
available for plant uptake. While the reduction in ammonia loss from surface applied NBPT-
coated urea could be clearly measured in laboratory studies, and corn ear leaf N
concentrations were generally higher in field studies, the influence on grain yields was
limited. This lack of clarity in grain yield responses probably reflects the complex influence
of climate, soil and management on grain yield. The use of NBPT coatings when surface
applying urea fertilizers is one component to increasing N use efficiency in crop production,
and continuing research will add to the knowledge base to refine the conditions and rates
under which the use of this technology provides economic and/or environmental benefits.