AMMB Investor Presentation
48
FY2021 RESULTS INVESTOR PRESENTATION 31 MAY 2021
Transcript of AMMB Investor Presentation

FY2021 RESULTSINVESTOR PRESENTATION
31 MAY 2021

GCEO PRESENTATIONDato’ Sulaiman Mohd Tahir
FY21 Financial snapshot
Effects of corporate actions
Repayment assistance
Loans by stages
Outlook for 2021
Focus 8
3
4
5
7
8
9

FY21 Financials Resolution of legacy matters and one-off goodwill and other impairment charges impacted results
Profitability(RM’ mil)
Income4,552
FY20: 4,227 8% • Sustained income growth
Expenses2,132
FY20: 2,108 1% • Maintained cost discipline
PBP2,420
FY20: 2,119 14% • Positive JAWS of 7%, CTI of 46.8%
Impairment1,137
FY20: 336 >100%
• Additional RM304mil macro provisions made in Q4. Total macro overlay at RM745mil (carried forward)
SettlementGoodwill and other impairment
2,8301,937
N/A • One-off exceptional items in Q4FY21
(LATMI) / PATMI(3,826)
FY20: 1,341 >100%
• Results materially impacted by one-off exceptional items and higher impairment charges
Core PATMI962
FY20: 1,341 28%
• Excluding exceptional one-off items of RM4,767mil and related legal and professional expenses RM21mil
ROE(20.2%)
FY20: 7.4%N/A • Core ROE of 5.0%
Assets & Liabilities (RM’ bil)
Gross Loans114.8
FY20: 107.2 7% • Continued loans growth in Retail and Business Banking
Deposits120.5
FY20: 113.0 7% • CASA up 24%, double-digit growth across all businesses
Capital & Liquidity
FHC CET111.3%
FY20: 12.4%1 110bps• CET1 without TA: 10.4%, within internal thresholds• Proforma CET1 after PP: 11.1% (without TA)• Proforma CET1 after PP: 12.0% (with TA)
FHC LCR157.5%
FY20: 158.2% 70bps • Highly liquid
FY21 Financial snapshot
FY2021 Results – Investor Presentation3
Financial Snapshot
1. After deducting proposed dividends2. TA - Transitional Arrangements; PP – Private Placement of 300mil new AMMB shares at RM2.75 per new share, raising RM825mil

13.8%11.3% 12.0%
16.7%
14.5% 15.2%
FY21 BeforeSettlement
FY21 Proforma FY21
CET 1 (with TA) Total CAR (with TA)
Effects of corporate actions
FY2021 Results – Investor Presentation4
Other impairment (REITs Associate)
Settlement and Private Placement (PP) impact to capital ratios Goodwill by Banking CGUs – post impairment
Post-Settlement
225.2
77.4 77.1
Carrying value Carrying valuepost impairment
Market value@ 23 Mar 21
(147.8) impairment
RM0.42RM0.42
RM1.23Cost per unit
PP: +0.7%
Banking CGU2
(RM’ mil)Before
impairment
Net of goodwill
impairment
Total impairment
Conventional Banking 1,495 130 (1,365)
Asset and Fund Management 116 116 -
Islamic Banking 54 54 -
Investment Banking 428 4 (424)
Total 2,093 303 (1,789)
RM’ milBefore
impairment
Net of goodwill
impairment
After Private Placement
PATMI after adjusted items3 1,370 1,370 1,370
Shareholders’ funds @ 31 Mar 21
16,430 14,6414 15,466
Proforma ROE (%) 8.3% 9.4% 8.9%
RM’ mil
1. TA - Transitional Arrangements 2. Cash Generating Unit3. Excluding net mod impact, macro provisions, Settlement and related legal and professional fees,
goodwill and other impairment4. After deducting goodwill impairment (RM1,789 mil)
Settlement: CET1: -2.5%TCR: -2.2%

MIA 03.62 bil
91%
MIA 10.17 bil
4%
MIA 20.17 bil
4%
MIA ≥30.03 bil
1%
Total assistance:RM4.0bil
13.2 bil
7.5 bil
3.8 bil
4.0 bil
3.6 bil
3.7 bil
20.6 bil
15.2 bil
Dec'20 Mar'21
Retail SME Corporate
MIA 06.01 bil
80%
MIA 10.92 bil
12%
MIA 20.44 bil
6%
MIA ≥30.16 bil
2%
Total assistance:RM7.5bil
Strong ~ Very Strong
2.23 bil61%
Satisfactory ~ Moderate
0.98 bil27%
Marginal ~ Substandard
0.40 bil11%
Impaired0.06 bil
1%
Total assistance:RM3.7bil
Repayment assistance overview
FY2021 Results – Investor Presentation5
SME: Repayment assistance by MIA status Retail: Repayment assistance by MIA status
Repayment assistance by type of borrowers Corporate: Repayment assistance by Internal Risk Grade
Repayment Assistance
18% of total gross loans
13% of total gross loans
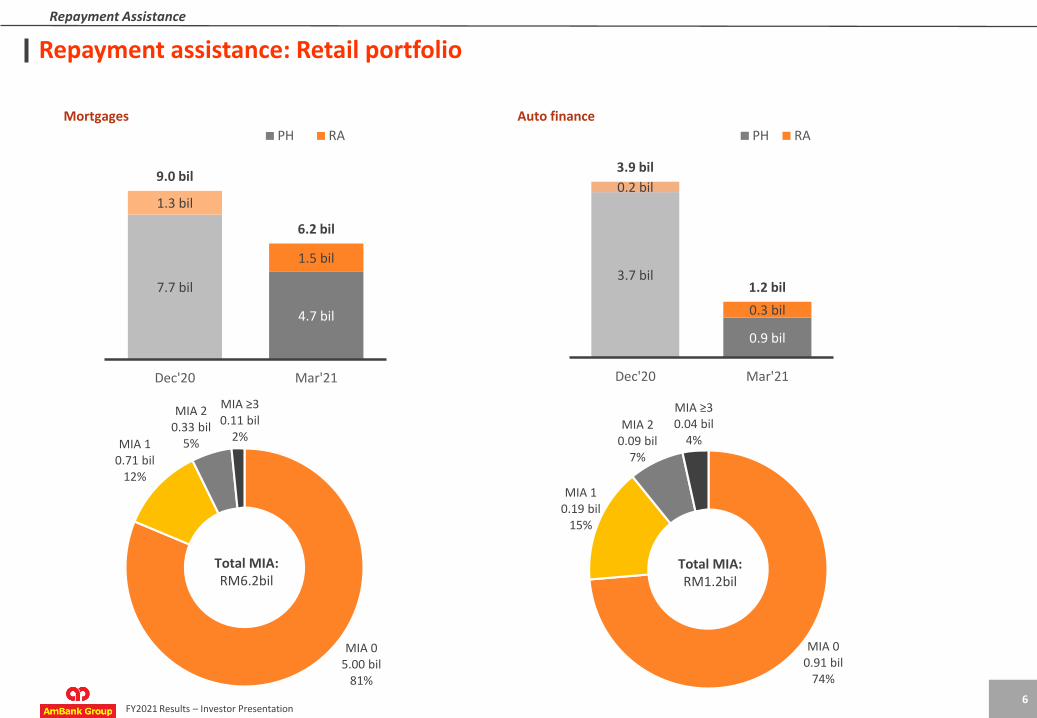
MIA 00.91 bil
74%
MIA 10.19 bil
15%
MIA 20.09 bil
7%
MIA ≥30.04 bil
4%
Total MIA:RM1.2bil
3.7 bil
0.9 bil
0.2 bil
0.3 bil
3.9 bil
1.2 bil
Dec'20 Mar'21
PH RA
7.7 bil
4.7 bil
1.3 bil
1.5 bil
9.0 bil
6.2 bil
Dec'20 Mar'21
PH RA
MIA 05.00 bil
81%
MIA 10.71 bil
12%
MIA 20.33 bil
5%
MIA ≥30.11 bil
2%
Total MIA:RM6.2bil
Repayment assistance: Retail portfolio
FY2021 Results – Investor Presentation6
Mortgages Auto finance
Repayment Assistance
1%
2%
2%
Q1FY20 Q2FY20 Q3FY20 Q4FY20 Q1FY21 Q2FY21 Q3FY21 Q4FY21
14%
13%
16%
Q1FY20 Q2FY20 Q3FY20 Q4FY20 Q1FY21 Q2FY21 Q3FY21 Q4FY21
85%86%
82%
Q1FY20 Q2FY20 Q3FY20 Q4FY20 Q1FY21 Q2FY21 Q3FY21 Q4FY21
Loans by stages
FY2021 Results – Investor Presentation7
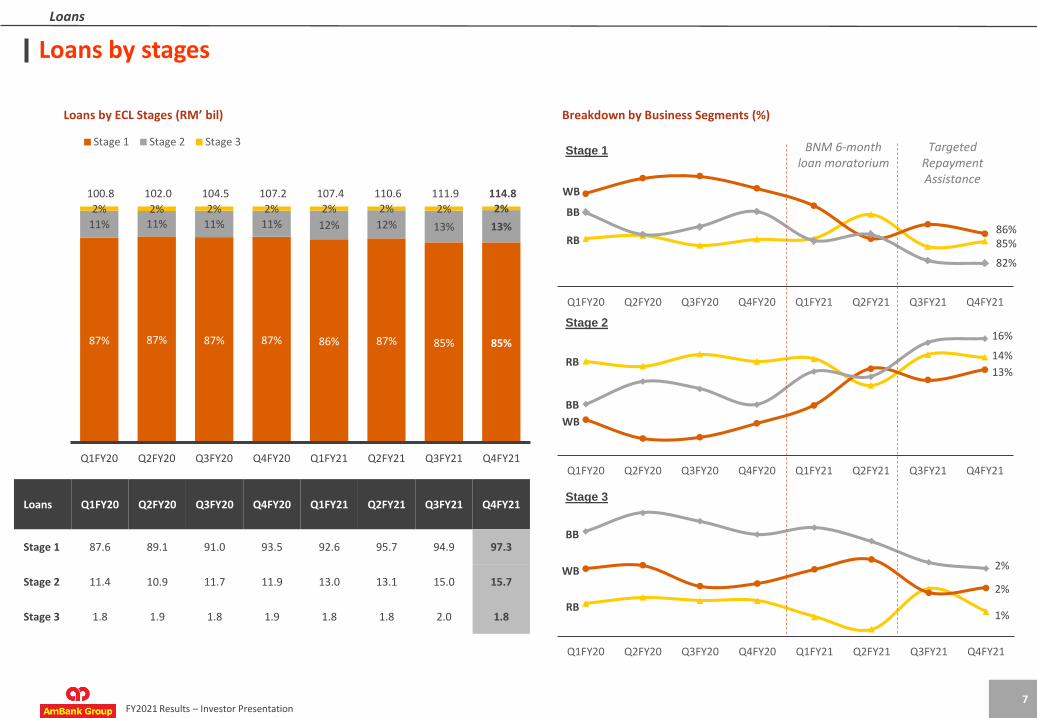
Loans by ECL Stages (RM’ bil)
Loans
Loans Q1FY20 Q2FY20 Q3FY20 Q4FY20 Q1FY21 Q2FY21 Q3FY21 Q4FY21
Stage 1 87.6 89.1 91.0 93.5 92.6 95.7 94.9 97.3
Stage 2 11.4 10.9 11.7 11.9 13.0 13.1 15.0 15.7
Stage 3 1.8 1.9 1.8 1.9 1.8 1.8 2.0 1.8
Stage 1
Stage 2
Stage 3
BB
RB
BB
WB
BB
WB
RB
WB
RB
Breakdown by Business Segments (%)
BNM 6-month loan moratorium
Targeted Repayment Assistance
87% 87% 87% 87% 86% 87% 85% 85%
11% 11% 11% 11% 12% 12% 13% 13%
2% 2% 2% 2% 2% 2% 2% 2%
100.8 102.0 104.5 107.2 107.4 110.6 111.9 114.8
Q1FY20 Q2FY20 Q3FY20 Q4FY20 Q1FY21 Q2FY21 Q3FY21 Q4FY21
Stage 1 Stage 2 Stage 3
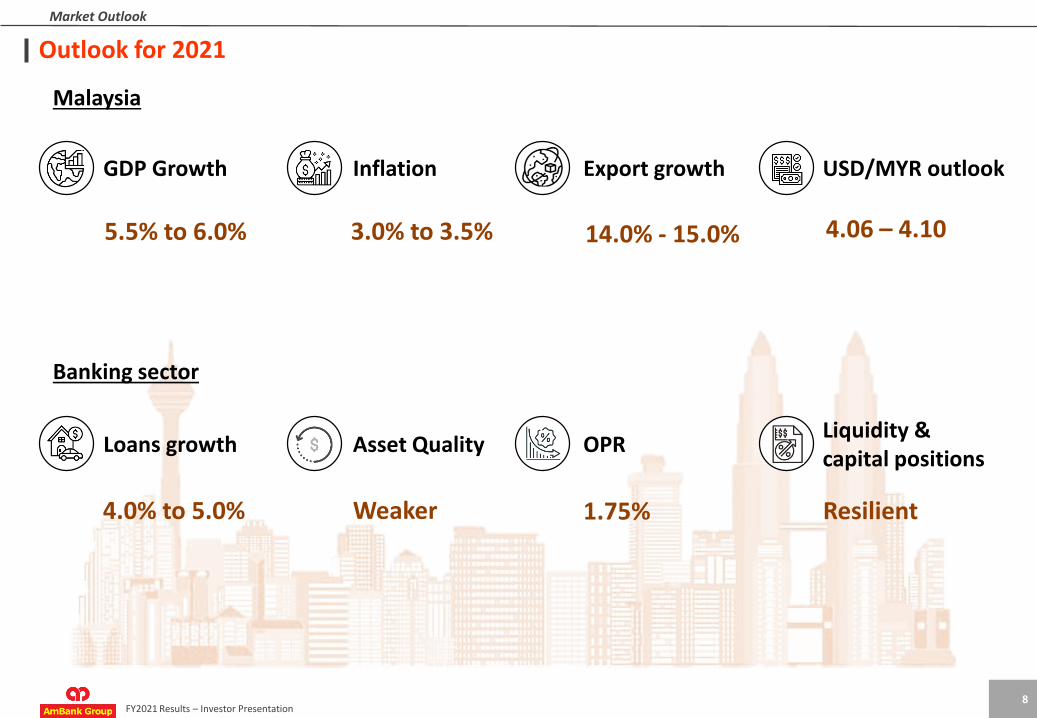
Outlook for 2021
FY2021 Results – Investor Presentation8
Market Outlook
Malaysia
Banking sector
GDP Growth Inflation Export growth USD/MYR outlook
5.5% to 6.0% 4.06 – 4.10
Loans growth Asset Quality OPRLiquidity & capital positions
Weaker Resilient
3.0% to 3.5% 14.0% - 15.0%
4.0% to 5.0% 1.75%

Focus 8: Key initiatives and progress
FY2021 Results – Investor Presentation9
Focus 8 Strategy
The path to ROE of 10% • RWA management• Sharpen capital allocation
Building capital light revenue • FX income grew 24%• ASNBV sales grew 120% in wealth management
Sharpening our segment play • Over 200 active users in BizHub SME Marketplace • 16% merchant CASA growth
Collaborators & Partners • 18% growth in Bonuslink payment value (industry: -12.8%)• 2.5k registered interest from Maxis collaboration (SME-in-a-box)
AmBank Digital • 1.2mil AmOnline users• 34% growth in AmAccessBiz users
Connecting people • Improved engagement scores to 77%• 5 Action Learning initiatives led by key talents
ESG • Improved Net Promoter Score (NPS) by +20 points• WB loans under exclusion list reduced by 79% • First financial institution to adopt renewable energy (solar panels) • Reduced energy consumption by 11%
Digital bank option • Not applying for digital banking license

GCFO PRESENTATIONJamie Ling
Financial Overview11 - 26
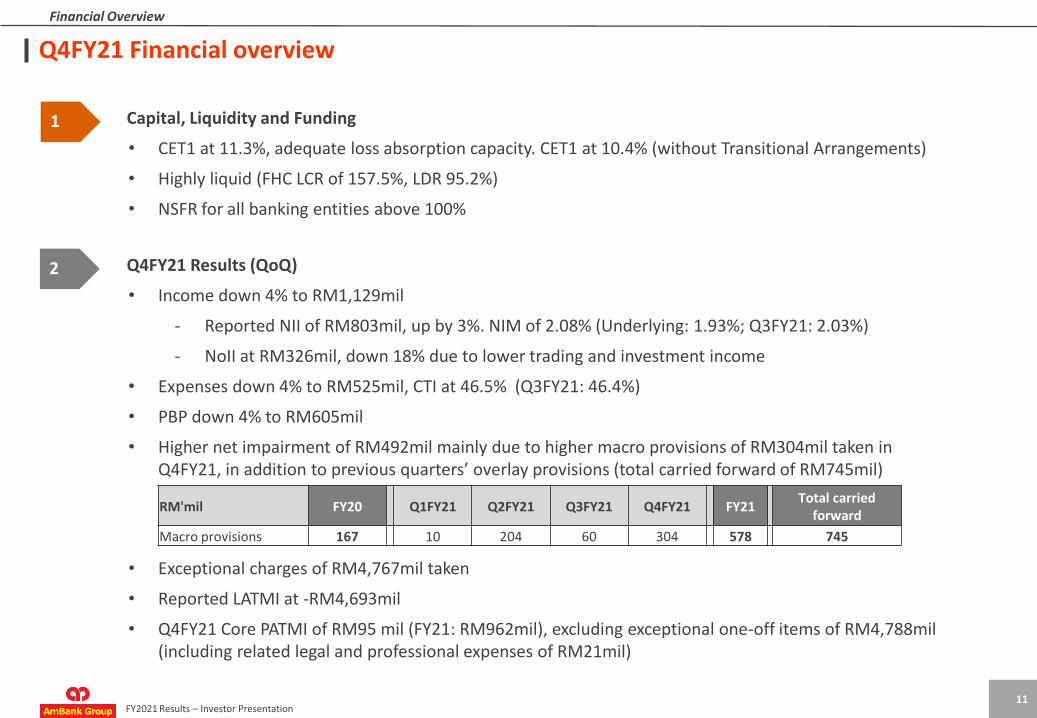
Q4FY21 Financial overview
FY2021 Results – Investor Presentation11
Financial Overview
Q4FY21 Results (QoQ)
• Income down 4% to RM1,129mil
- Reported NII of RM803mil, up by 3%. NIM of 2.08% (Underlying: 1.93%; Q3FY21: 2.03%)
- NoII at RM326mil, down 18% due to lower trading and investment income
• Expenses down 4% to RM525mil, CTI at 46.5% (Q3FY21: 46.4%)
• PBP down 4% to RM605mil
• Higher net impairment of RM492mil mainly due to higher macro provisions of RM304mil taken in Q4FY21, in addition to previous quarters’ overlay provisions (total carried forward of RM745mil)
• Exceptional charges of RM4,767mil taken
• Reported LATMI at -RM4,693mil
• Q4FY21 Core PATMI of RM95 mil (FY21: RM962mil), excluding exceptional one-off items of RM4,788mil (including related legal and professional expenses of RM21mil)
1
2
Capital, Liquidity and Funding
• CET1 at 11.3%, adequate loss absorption capacity. CET1 at 10.4% (without Transitional Arrangements)
• Highly liquid (FHC LCR of 157.5%, LDR 95.2%)
• NSFR for all banking entities above 100%
RM'mil FY20 Q1FY21 Q2FY21 Q3FY21 Q4FY21 FY21Total carried
forward
Macro provisions 167 10 204 60 304 578 745
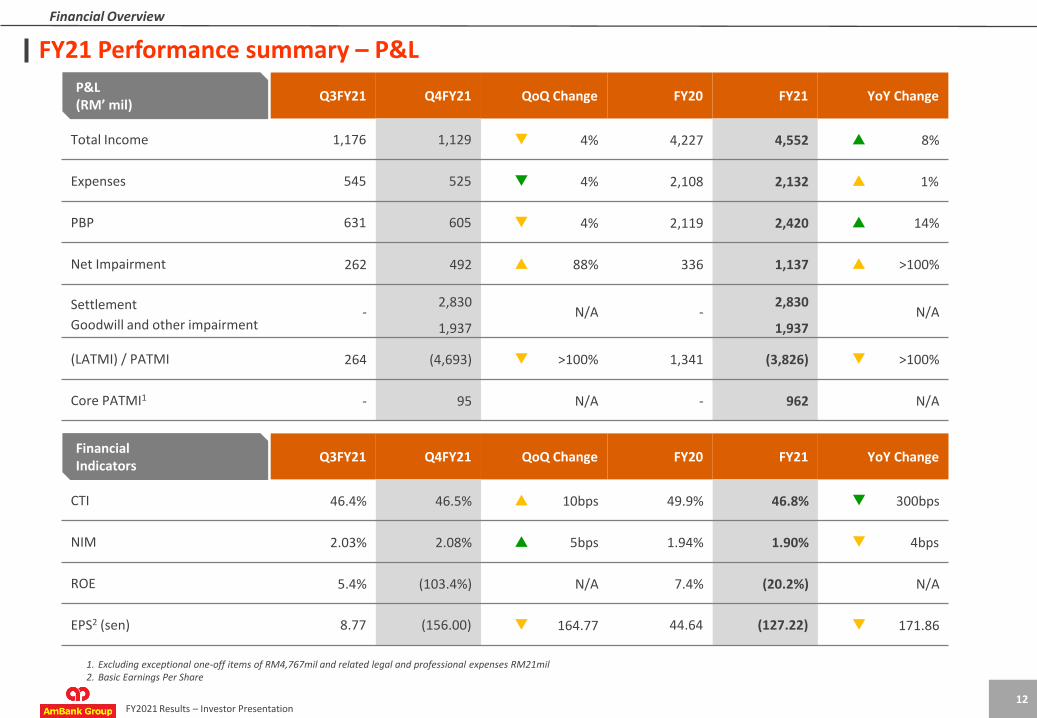
Q3FY21 Q4FY21 QoQ Change FY20 FY21 YoY Change
CTI 46.4% 46.5% 10bps 49.9% 46.8% 300bps
NIM 2.03% 2.08% 5bps 1.94% 1.90% 4bps
ROE 5.4% (103.4%) N/A 7.4% (20.2%) N/A
EPS2 (sen) 8.77 (156.00) 164.77 44.64 (127.22) 171.86
FY21 Performance summary – P&L
FY2021 Results – Investor Presentation12
Financial Overview
1. Excluding exceptional one-off items of RM4,767mil and related legal and professional expenses RM21mil2. Basic Earnings Per Share
Q3FY21 Q4FY21 QoQ Change FY20 FY21 YoY Change
Total Income 1,176 1,129 4% 4,227 4,552 8%
Expenses 545 525 4% 2,108 2,132 1%
PBP 631 605 4% 2,119 2,420 14%
Net Impairment 262 492 88% 336 1,137 >100%
Settlement
Goodwill and other impairment-
2,830
1,937N/A -
2,830
1,937N/A
(LATMI) / PATMI 264 (4,693) >100% 1,341 (3,826) >100%
Core PATMI1 - 95 N/A - 962 N/A
P&L(RM’ mil)
FinancialIndicators

Q3FY213 Q4FY213 QoQ Change FY202 FY213 YTD Change
FHC CET1 13.5% 11.3% 220bps 12.4% 11.3% 110bps
FHC Tier 1 13.5% 11.3% 220bps 12.4% 11.3% 110bps
FHC Total Capital 16.4% 14.5% 190bps 15.8% 14.5% 130bps
FY21 Performance summary – balance sheet
FY2021 Results – Investor Presentation13
Financial Overview
Q3FY21 Q4FY21 QoQ Change FY20 FY21 YTD Change
Gross Loans 111.9 114.8 3% 107.2 114.8 7%
GIL 1.73% 1.54% 19bps 1.73% 1.54% 19bps
LLC 103.4%1 135.6% >1000bps 93.4%1 135.6% >1000bps
Customer Deposits 119.0 120.5 1% 113.0 120.5 7%
CASA 33.5 35.8 7% 28.8 35.8 24%
Balance Sheet(RM’ bil)
Capital Indicators
1. Includes regulatory reserves2. After deducting proposed dividends3. With Transitional Arrangements

Settlement - - - 2,830 -
Goodwill and other impairment - - - 1,937 -
Additional items to highlight
FY2021 Results – Investor Presentation14
Underlying
ROE – Reported 8.8% 7.4% 1.4% (20.2%) 27.6%
ROE after adjusted items 7.4% 8.1% 0.7% 7.1% 1.0%
FY19 FY20 YoY Change FY21 YoY Change
Income – Reported 3,922 4,227 8% 4,552 8%
Foreclosed properties disposal gain 22 - - - -
Net modification (loss)/ unwinding - - - 41 -
Income after adjusted items 3,900 4,227 8% 4,511 7%
P&L (RM’ mil)
Expenses – Reported 2,131 2,108 1% 2,132 1%
Legal and professional expenses - - 21 -
Expenses after adjusted item 2,131 2,108 1% 2,111 0%
Ratios (RM’ mil)
(LATMI) / PATMI – Reported 1,505 1,341 11% (3,826) >100%
PATMI after adjusted items 1,273 1,468 15% 1,370 7%
PBP – Reported 1,792 2,119 18% 2,420 14%
PBP after adjusted items 1,769 2,119 20% 2,400 13%
CTI – Reported 54.3% 49.9% 4.4% 46.8% 3.1%
CTI after adjusted items 54.6% 49.9% 4.7% 46.8% 3.1%
Impairment – Reported (304) 336 >100% 1,137 >100%
Macro provisions - 167 578 -
Gain on Retail debt sale (285) - - -
Impairment after adjusted items (19) 169 >100% 559 >100%
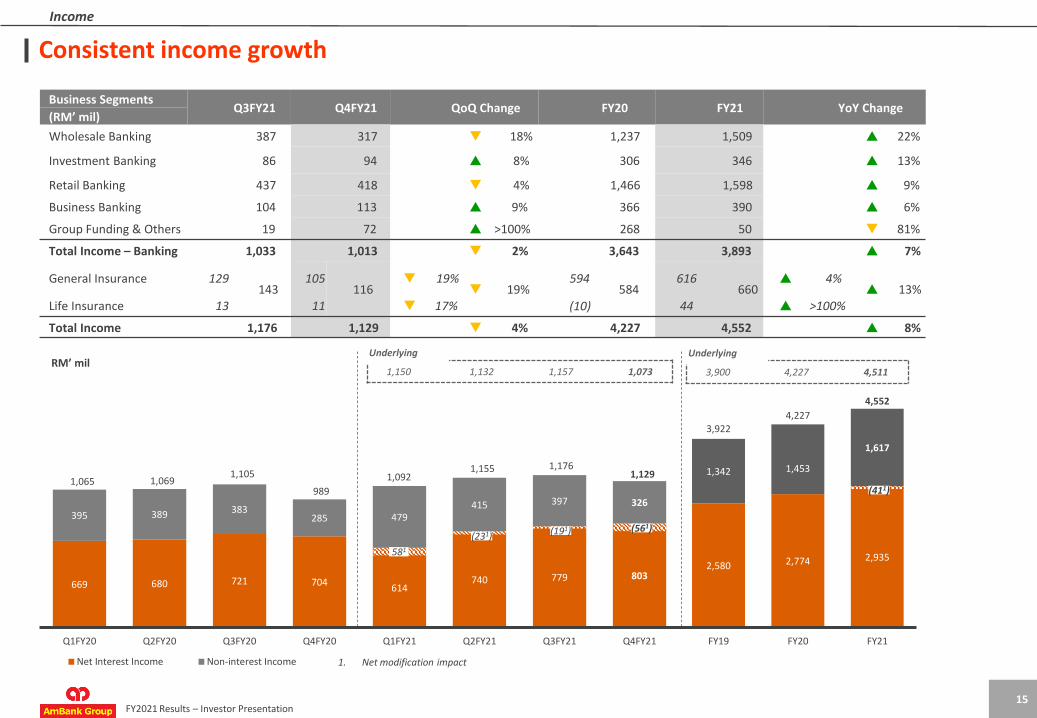
669 680 721 704614
740 779 803
395 389 383285 479
415 397 326
1,065 1,0691,105
989
1,0921,155 1,176
1,129
Q1FY20 Q2FY20 Q3FY20 Q4FY20 Q1FY21 Q2FY21 Q3FY21 Q4FY21
Net Interest Income Non-interest Income
2,580 2,774 2,935
1,342 1,453
1,617
3,9224,227
4,552
FY19 FY20 FY21
Consistent income growth
FY2021 Results – Investor Presentation15
Income
RM’ mil
Business SegmentsQ3FY21 Q4FY21 QoQ Change FY20 FY21 YoY Change
(RM’ mil)
Wholesale Banking 387 317 18% 1,237 1,509 22%
Investment Banking 86 94 8% 306 346 13%
Retail Banking 437 418 4% 1,466 1,598 9%
Business Banking 104 113 9% 366 390 6%
Group Funding & Others 19 72 >100% 268 50 81%
Total Income – Banking 1,033 1,013 2% 3,643 3,893 7%
General Insurance 129143
105116
19% 19%
594584
616660
4% 13%
Life Insurance 13 11 17% (10) 44 >100%
Total Income 1,176 1,129 4% 4,227 4,552 8%
1. Net modification impact
581
(231) (191) (561)
3,900 4,227 4,511
Underlying
(411)
1,150 1,132 1,157 1,073
Underlying

Broad-based PBP growth
FY2021 Results – Investor Presentation16
PBP & PATMI
RM’ mil
Business SegmentsQ3FY21 Q4FY21 QoQ Change FY20 FY21 YoY Change
(RM’ mil)
Wholesale Banking 308 249 19% 934 1,227 31%
Investment Banking 38 49 28% 119 165 39%
Retail Banking 226 192 15% 601 733 22%
Business Banking 69 77 12% 221 251 14%
Group Funding & Others (71) (11) 84% (2) (259) >100%
PBP – Banking 570 556 2% 1,873 2,117 13%
General Insurance 4861
3849
21% 20%
256246
259303
1% 23%
Life Insurance 13 11 17% (10) 44 >100%
PBP 631 605 4% 2,119 2,420 14%
536 543 552488
554
631 631 605
391320
382
248365
237 264
(4,693)
8.8%
7.0%8.3%
5.4%
7.7%
4.9% 5.4%
Q1FY20 Q2FY20 Q3FY20 Q4FY20 Q1FY21 Q2FY21 Q3FY21 Q4FY21
PBP (LATMI) / PATMI ROE
417608
▲-103.4%
1,792
2,119
2,420
1,505
1,341
(3,826)
8.8% 7.4%
FY19 FY20 FY21
▲-20.2%
1271523
582 (232)
1383
(192)
313
(562)
375
611
611 548375
295
1271
(412)
2,379
1,468
1. Macro provisions2. Net modification impact3. Net modification impact and macro provisions4. Underlying PATMI for Q4FY21 and FY21 are RM262mil and RM1,349mil respectively
(excluding net mod impact, macro provisions, Settlement, goodwill and other impairment)
4 4

P&L walk
FY2021 Results – Investor Presentation17
Group P&L
YoYGrowth
4% 11% 8% 1% 14% 100% >100% 31% >100% 2% >100%
RM’ milNet Interest
Income
Non-Interest Income
Net Modimpact
Total Income
Expenses PBP Impairment SettlementGoodwill and other
impairmentPBT Tax & Zakat PAT MI
(LATMI) / PATMI
*One-off items
Core PATMI
FY21 2,894 1,617 41 4,552 2,132 2,420 1,137 2,830 1,937 (3,483) 229 (3,712) 114 (3,826) 4,788 962
FY20 2,774 1,453 - 4,227 2,108 2,119 336 - - 1,783 330 1,453 112 1,341 - -
Positive growth in FY21 Contraction in FY21
NIM NoII % CTI Effective Tax Rate
FY21 1.90% 35.5% 46.8% -6.5%
FY20 1.94% 34.4% 49.9% 18.3%
1,341
(3,826)
962
120 164 41
101
4,78824
801
2,830
1,937 2
Note: *One-off items include Settlement, Goodwill and other impairment and Settlement-related legal and professional expenses

194 187 190
9.7
15.2 0.2 0.1
3.0
1.0 2.7
16.3
12.3
FY20Reported
RetailBanking
WholesaleBanking
InvestmentBanking
BusinessBanking
GeneralInsurance
Asset mix Interbank / GroupFunding
Deposits FY21Underlying
Netmodification
impact
FY21Reported
4.93% 4.83% 4.84%4.63%
3.95% 3.84% 3.77% 3.75% 3.58%3.37% 3.22% 3.11% 2.96%
2.62%
2.16%
1.96%1.87% 1.86%
1.87% 1.91% 2.02% 1.95%1.59% 1.92%
2.03%2.08%
1.93%
1.56% 1.61% 1.73% 1.67% 1.33% 1.69% 1.81% 1.88% 1.72%
Q1FY20 Q2FY20 Q3FY20 Q4FY20 Q1FY21 Q2FY21 Q3FY21 Q4FY21 Q4FY21excluding
net mod impact
Gross Yield COF NIM Net Spread
Margin recovery in 2HFY21
FY2021 Results – Investor Presentation18
NIM Trend
Net Interest Margin (NIM) Movement (YoY)
NIM
Q4FY21:Reported: 2.08% ( 5bps)Underlying: 1.93% ( 4bps)Q3FY21: Reported: 2.03% Underlying: 1.97%
Funding + DepositsDivisions
Positive growth in FY21 Contraction in FY21
1. Net spread equals to Gross Yield less COF
bps
Reported: 4bps
Underlying: 7bps
QoQ NIM
1
5.02%4.81%
3.83% 3.78%3.45%
3.16%
2.15% 2.15%1.89% 1.94%
1.90% 1.87%
1.58%1.64% 1.68% 1.64%
FY19 FY20 FY21 FY21excludingnet modimpact

1,453
1,617
66
34
44 4
40
54
40
18
21
YoY Growth 25% 29% 13% 48% 12% 5% 9% >100% >100% 11%
Strong trading, investment banking, wealth management and insurance performance
FY2021 Results – Investor Presentation19
NoII
RM’ milCorporate & Transaction
Banking
Group Treasury
& Markets
Investment Banking &
Fund Mgmt
WealthMgmt
Other RetailBusiness Banking
General Insurance
Life Insurance
Group Funding &
OthersNoII
FY21 120 294 299 137 133 93 503 44 (6) 1,617
FY20 160 227 265 92 151 89 463 (10) 15 1,453
FY20 NoII FY21 NoIIPositive growth in FY21 Contraction in FY21
Q1FY21: 478.5Q2FY21: 414.9Q3FY21: 397.3Q4FY21: 326.4

2,108
2,132 2,132
21
20
6
23
FY20 Salary Staffincentives
Sales &Marketing
Others FY21
2,131 2,108 2,132
54.3%
49.9%46.8%
FY19 FY20 FY21
529 526552
501539 524 545
525
49.7% 49.2% 50.0% 50.7% 49.3% 45.4% 46.4% 46.5%
Q1FY20 Q2FY20 Q3FY20 Q4FY20 Q1FY21 Q2FY21 Q3FY21 Q4FY21
CTI improved YoY, positive JAWS of +7%
FY2021 Results – Investor Presentation20
Expense Growth Driver (YoY) Expense and CTI Trend
Expenses
Positive P&L impact in FY21 Negative P&L impact in FY21
RM’ mil RM’ mil
Business SegmentsQ3FY21 Q4FY21 QoQ Change FY20 FY21 YoY Change
(RM’ mil)
Wholesale Banking 79 68 14% 303 282 7%
Investment Banking 48 45 7% 187 181 3%
Retail Banking 212 226 7% 865 865
Business Banking 35 36 2% 145 139 5%
Group Funding & Others 90 83 8% 270 309 14%
Expenses – Banking 464 457 1% 1,770 1,776
General Insurance 81 67 17% 338 357 5%
Expenses 545 525 4% 2,108 2,132 1%

107.2
114.8
0.2 0.3
3.6 0.1 0.8
1.4
1.3
0.1
0.1
FY20 MidCorp Large Corp &Others
InvestmentBanking
Mortgage Auto Finance Cards Retail SME Others Business Banking FY21
Continued growth in Retail and SME loans, above market growth
FY2021 Results – Investor Presentation21
Gross Loans Movement (RM’ bil)
Loans
YTD Growth 1% 1% 18% 10% 1% 2% 22% 44% 12% 7%
Composition 14% 17% 2% 35% 11% 2% 4% 4% 11% 100%
Retail 10%
1. Annualised2. Based on BNM data from Mar’20 to Mar’213. Based on BNM data and in accordance with AMMB’s financial period
Wholesale
Gross loans trend
Positive growth in FY21 Contraction in FY21
YTD Growth Industry
7% 4%2
5% 4%3
6% 5%3
ROA1: -2.24%
RoTA1: -2.27%
101.8
107.2
114.8
FY19
FY20
FY21
Breakdown by rate sensitivity:Fixed rate – 21%Variable rate –79%
Breakdown by customers type:Retail – 54%Non-retail – 46%
Breakdown by concept:Islamic – 32%Conventional – 68%

AmBank Group FY17 FY18 FY19 FY20 FY21FY21
(excl. macro provision)
Net credit cost3 (%) -0.19% 0.00% -0.30% 0.30% 0.97% 0.47%
Gross credit cost3
(excl. recoveries) (%)0.56% 0.47% 0.53% 0.62% 1.28% 0.78%
New Impaired LoansFormation (RM’ mil)
1,330 1,162 1,123 1,491 990 N/A
168.8
336.1
558.5
1,136.7
167.3
416.6
58.2
578.2
205.4 39.1 7.8
FY20beforemacro
provision
Macroprovision
FY20 ECLStage 1 & 2
ECLStage 3
IndividualAllowance
Recoveries Others FY21before macro
provision
Macroprovision
FY21
187 215
898
97 197 247
823
75
272 262
1,746
121
IndividualAllowance
ECL Stage 3 /CP - Defaulted
ECL Stage 1 & 2 /CP - Non defaulted
ECL - Off BS
FY19 FY20 FY21
79.7%100.5% 114.0%
93.4%135.6%
649 681 728 924 882
1,000 749 676 646 638
40 209 217 283 251
1,689 1,638 1,621 1,853 1,770
1.86% 1.70% 1.59% 1.73% 1.54%
FY17 FY18 FY19 FY20 FY21
Retail Wholesale
Business GIL Ratio
Overlay macro provisions as additional buffers
FY2021 Results – Investor Presentation
Impairment Balance (Balance Sheet) Credit Cost and New Impaired Loans Formation
Net Impairment (YoY Movement) Gross Impaired Loans, GIL and LLC Ratios
Asset Quality
1. Includes regulatory reserve of RM703m (FY18), RM450m (FY19), RM388m (FY20), NIL (FY21)
RM’ mil
1Loan Loss Coverage
Positive P&L impact in FY21 Negative P&L impact in FY21
Non-performing / impaired loans
Performing loans
Stage 2
Stage 1
FY19: 1,397FY20: 1,343FY21: 2,401
Impairment Balance
RM’ mil
2. Includes macro provision
2
590540
22
3. Includes loan loss allowances only
1,312
308 283433
RM’ mil
Q1FY21: 49.9Q2FY21: 332.5Q3FY21: 262.1Q4FY21: 492.2

8.3
8.1
7.6
FY19
FY20
FY21
4.4
4.9
4.7
FY19
FY20
FY21
1.6
2.3
2.7
FY19
FY20
FY21
67%
29%
3% 1%
57%
35%
6%2%
55%34%
6%5%
Close monitoring of asset quality
FY2021 Results – Investor Presentation23
Impaired Loans by Sector Loans by Internal Risk Grade
Asset Quality
SectorMar’20 Mar’21
Composition YTD GrowthRM’mil RM’ mil
Agriculture 85 80 4% 6%
Mining and quarrying 54 38 2% 29%
Manufacturing 248 194 11% 22%
Electricity, gas and water 0 4 >100%
Construction 84 92 5% 10%
Wholesale, retail trade, hotels and restaurants 134 202 11% 51%
Transport, storage and communication
81 59 3% 27%
Finance and insurance 0 1 >100%
Real estate 314 313 18%
Business activities 49 42 2% 14%
Education and health 10 7 36%
Household of which: 794 739 42% 7%
- Residential Properties 496 531 30% 7%
- Transport Vehicles 157 68 4% 57%
- Others 141 140 8% 1%
Total 1,853 1,770 100% 4%
Oil & Gas:Approx. 2% of
Total Gross Loans
Real Estate:Approx. 7% of
Total Gross Loans
Construction:Approx. 4% of
Total Gross Loans
RM’ bil
RM’ bil
RM’ bil
Strong ~ Very Strong Satisfactory ~ Moderate Marginal ~ Substandard Impaired

11.6 11.8 12.2 13.0 13.8 15.1 15.6 16.3
11.5 11.612.5
15.816.8
19.0 17.819.5
23.1 23.424.8
28.830.6
34.1 33.5
35.8
22.5% 22.8% 23.4%25.5%
26.8%
29.7%28.1%
29.7%
Q1FY20 Q2FY20 Q3FY20 Q4FY20 Q1FY21 Q2FY21 Q3FY21 Q4FY21
Retail CASA Non-Retail CASA CASA Composition (%)
38.6 35.3 34.0 32.5 33.4 32.9 31.8 31.0
11.611.8 12.2 13.0 13.8 15.1 15.6 16.3
41.0 44.1 47.0 51.7 50.3 47.8 53.8 53.8
11.5 11.6 12.515.8 16.8 19.0
17.8 19.5102.8 102.7105.7
113.0 114.3 114.8
119.0 120.55.3% 5.3% 5.4%
5.7%5.7% 5.6%
5.8% 5.8%
Q1FY20 Q2FY20 Q3FY20 Q4FY20 Q1FY21 Q2FY21 Q3FY21 Q4FY21
Retail FD Retail CASA
Non-Retail FD Non-Retail CASA
AmBank Group Deposits Market Share (%)
Deposits grew in line with loans, CASA up 24% YoY
FY2021 Results – Investor Presentation24
Deposits (RM’ bil) CASA (RM’ bil) and CASA Composition (%)
Deposits
1. Based on BNM data from Mar’20 to Mar’212. Based on BNM data and in accordance with AMMB’s financial period
Retail DepositMix
48.9% 45.8% 43.7% 40.2% 41.3% 41.8% 39.8% 39.2%
Customer Deposits Trend CASA TrendYTD Growth Industry
7% 6%1
6% 2%2
12% 5%2
YTD Growth Industry
24% 21%1
16% 10%2
22% 3%2
1
Retail CASAMix
50.1% 50.3% 49.3% 45.1% 45.2% 44.2% 46.7% 45.5%
120.5
113.0
106.9
FY21
FY20
FY19
35.8
28.8
24.9
FY21
FY20
FY19

11.1% 11.9% 12.4%11.3% 12.0%
13.6%15.4% 15.8%
14.5%15.2%
FY18 FY19 FY20 FY21(with TA)
ProformaFY21
CET 1 / Tier 1 Total CAR
12.44%12.91%
10.42%11.33%
0.70% 0.36% 0.14%
0.91%0.14% 0.53% 0.06%
2.49%
FY20 Gains forFY21
Otherimpairment
TransferfromReg
reserveto RE
RWA AMABHoldingsDividend
Others FY21CET1
(beforeSettlement
& TA)
Settlement FY21CET1
(beforeTA)
TA FY21CET1
(under TA)
134.8 137.9158.8 169.2 170.2
72.2% 72.2%
65.0% 64.4% 66.7%
59.5% 59.3% 58.4% 58.5% 58.1%
FY17 FY18 FY19 FY20 FY21
Total Assets RWA/Total Assets Peers
Strengthening measures taken on capital
FY2021 Results – Investor Presentation25
FHC CET1 (YoY Movement) Liquidity Ratios
RWA/Total Assets FHC Capital Adequacy Ratios3
Capital
RM’ bil
1. Based on an average of our seven peer domestic banks as at 31 Dec 20202. FHC RWA/Total Assets
1
3. After deducting proposed dividends
22 2
2
4. Excluding Settlement and other impairment5. Credit RWA: -0.39%; Market RWA: -0.07%; Operational & Others RWA: -0.07%6. AmBank Group’s Insurance Holding7. Transitional Arrangements8. Loan-to-Available-Funds ratio (LTAF) refers to gross loans (excluding financing funded by
Islamic Investment Accounts and loans sold to Cagamas) divided by deposits plus borrowings and sub debt
Ratios FY19 FY20 FY21
FHC LCR 192.9% 158.2% 157.5%
LDR 95.3% 94.9% 95.2%
LTAF9 83.0% 81.5% 81.3%
NSFR >115% >100% >100%
4
5 6 7
Post Private Placement
7
FY22 Agenda
FY2021 Results – Investor Presentation26
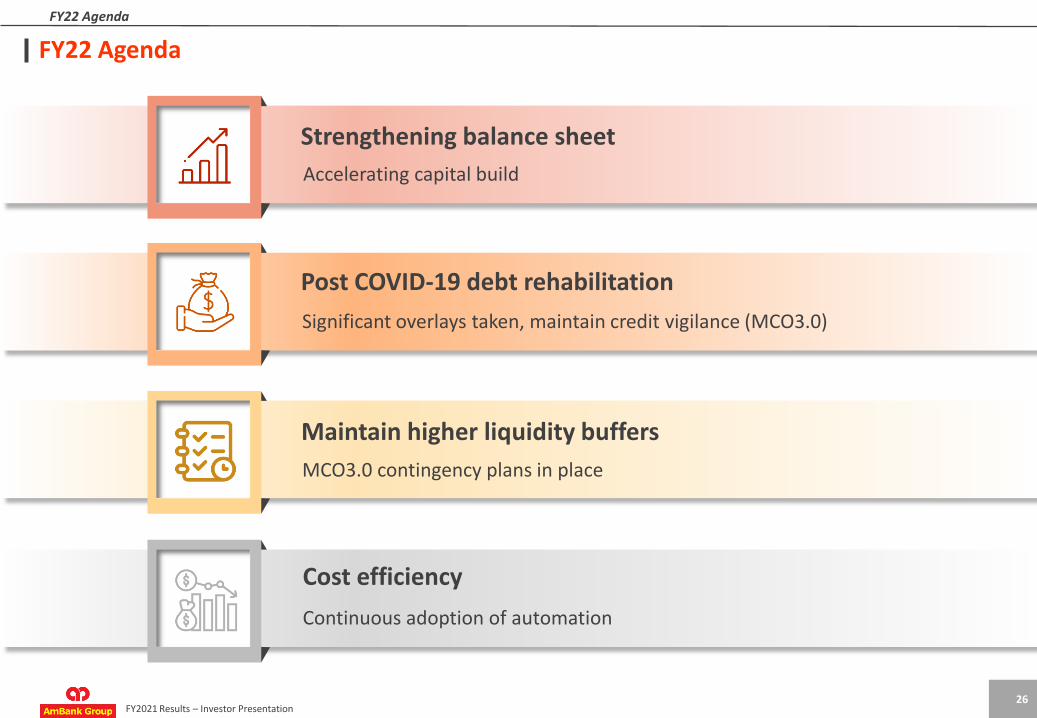
FY22 Agenda
Strengthening balance sheet
Post COVID-19 debt rehabilitation
Maintain higher liquidity buffers
Cost efficiency
Accelerating capital build
Significant overlays taken, maintain credit vigilance (MCO3.0)
MCO3.0 contingency plans in place
Continuous adoption of automation

THANK YOU

57.4% 60.8%54.3%
49.9% 46.8%
-0.6%
12.0%
-12.0%
-1.1% 1.1%
FY17 FY18 FY19 FY20 FY21
CTI Expenses Growth
44.1 37.6 50.0 44.6
(127.2)
1.09%0.91%
1.08%0.93%
(2.24%)
FY17 FY18 FY19 FY20 FY21
EPS ROA
3,766 3,979 3,922 4,227 4,552
39% 38%34% 34% 36%
FY17 FY18 FY19 FY20 FY21
Total Income Non-interest Income %
1,325 1,132 1,505 1,341
(3,826)
8.5%7.0%
8.8%7.4%
-20.2%
FY17 FY18 FY19 FY20 FY21
(LATMI) / PATMI ROE (%)
Yearly performance
FY2021 Results – Investor Presentation28
Cost to Income Ratio and Expenses Growth (%) ROA (%) and EPS (Basic)
(LATMI) / PATMI (RM’ mil) & ROE (%) Total Income (RM’ mil) and Non-interest Income (%)
FY21 Results
Total IncomeCAGR FY17-FY21: 4.9%YoY Growth 7.7%
CTI: Expenses:CAGR FY17-FY21: 2.6% CAGR FY17-FY21: YoY Growth 3.0%

Corporate Banking7%
Group Treasury & Market
18%
Other IB businesses5%
Equity Markets
5%
Fund Management
8%
Business Banking6%
Wealth Management9%
Cards3%
Other Retail5%
Insurance 34% Wholesale
Banking25%
Investment Banking
18%Business Banking
6%
Retail Banking
17%
Insurance 34%
4%
20%
4%
4%
4%
-135%
Retail Banking Wholesale Banking
Investment Banking Business Banking
Insurance Group Funding & Others
Reported(RM3,826mil)
Non-interest income and (LATMI) / PATMI mix
FY2021 Results – Investor Presentation29
Non-interest Income by Lines of Business (YoY) (LATMI) / PATMI by Lines of Business (YoY)
NoII & PATMI / (LATMI)
7%
27%
29%
22%
52%
13%
21%
3%
38%2
1. Including net mod impact, macro provisions, Settlement, goodwill and other investment impairment
2. After deducting share of minority interests
25%
Non-interest income
RM1,617 mil
28%
48% 5%
21%
11% 5%
>100%
15%
53% >100%
1

Total impairments by category (RM’ mil) Q1FY20 Q2FY20 Q3FY20 Q4FY20 Q1FY21 Q2FY21 Q3FY21 Q4FY21 QoQ Change FY20 FY21 YoY Change
ECL Stage 1 & 2 / CP – Non defaulted1 (128) (38) (29) 116 31 121 454 310 32% (79) 915 >100%
ECL Stage 3 / CP – Defaulted 163 182 132 116 89 265 (98) 131 >100% 593 387 35%
Individual Provisions 9 123 44 21 2 78 (3) 81 >100% 197 158 20%
Recoveries (93) (120) (77) (54) (79) (114) (93) (65) 30% (344) (352) 2%
Other Provisions2 15 (37) (13) 4 7 (17) 2 36 >100% (31) 27 >100%
Total net impairments / (writeback) (32) 109 57 203 50 333 262 492 88% 336 1,137 >100%
Total impairments by divisions (RM’ mil) Q1FY20 Q2FY20 Q3FY20 Q4FY20 Q1FY21 Q2FY21 Q3FY21 Q4FY21 QoQ Change FY20 FY21 YoY Change
Wholesale Banking (106) 48 1 (2) (5) 141 22 99 >100% (60) 257 >100%
Investment Banking (0) 1 (8) 2 (1) (4) (1) (0) 74% (6) (7) 23%
Retail Banking 59 37 49 42 36 (8) 160 345 >100% 187 534 >100%
Business Banking 14 27 21 (5) 7 2 24 31 30% 57 63 10%
Group Funding & Others (1) (1) (4) 168 11 204 58 19 67% 162 293 81%
General Insurance 2 (2) (2) (2) 2 (3) 0 (2) >100% (4) (3) 35%
Total net impairment / (writeback) (32) 109 57 203 50 333 262 492 88% 336 1,137 >100%
GIL Ratio (%) Q1FY20 Q2FY20 Q3FY20 Q4FY20 Q1FY21 Q2FY21 Q3FY21 Q4FY21 QoQ Change FY20 FY21 YoY Change
Wholesale Banking 1.90% 2.06% 1.77% 1.81% 1.97% 2.17% 1.71% 1.79% 8bps 1.81% 1.79% 2bps
Investment Banking 0.11% 0.11% 0.11% 0.11% 1.44% 0.45% 0.03% 0.02% 1bps 0.11% 0.02% 9bps
Retail Banking 1.44% 1.51% 1.54% 1.57% 1.29% 1.11% 1.71% 1.36% 35bps 1.57% 1.36% 21bps
Business Banking 2.39% 2.52% 2.73% 2.51% 2.61% 2.41% 2.09% 1.99% 10bps 2.51% 1.99% 52bps
Group 1.66% 1.77% 1.71% 1.73% 1.66% 1.57% 1.73% 1.54% 19bps 1.73% 1.54% 19bps
Industry 1.56% 1.59% 1.51% 1.57% 1.44% 1.37% 1.57% 1.58% 1bps 1.57% 1.58% 1bps
Impairments
FY2021 Results – Investor Presentation30
Net Impairment / (Writebacks) and GIL Ratio
Asset Quality
1. Includes macro provision 2. Includes trade & sundry debtors and provision for contingencies

2.7 2.9
14.6
1.2 4.7 9.04.5
4.8 7.71.0
61.6
0.0
114.8
Mar'21
34.0 10.9 125.8
15.9 94.8 142.3 40.5 118.4 114.1
52.6
1,089.4
14.9
1,853.6
Mar'21
LoansComposition 2% 2% 13% 1% 4% 8% 4% 4% 7% 1% 54% ≈ 100%
YTDGrowth 10% 18% 10% 43% 3% 17% 26% 21% 5% 10% 9% 3% 7%
Loans by sector vs industry
FY2021 Results – Investor Presentation31
Industry (RM’ bil)
AmBank Group (RM’ bil)
Loans
Source : BNM, financial statements
LoansComposition 2% 1% 7% 1% 5% 8% 2% 6% 6% 3% 59% 1% 100%
YTDGrowth 7% 6% ≈ 10% 2% 8% 3% 1% ≈ 23% 6% 32% 4%
AgricultureMining & Quarrying
ManufacturingElectricity,
Gas & WaterConstruction
Wholesale, Retail, Hotels &
Restaurant
Transport, Storage & Com
Finance, Insurance, & Biz Act
Real EstateEducation &
HealthHousehold Others Total Loans

Divisional Performance

Wholesale Banking
Coverage31%
Group Treasury & Markets
52%
Transaction Banking
17%
Wholesale Banking
Coverage33%
Group Treasury
& Markets
58%
Transaction Banking
9%
Total AssetsRM84.2b
Q1FY20 Q2FY20 Q3FY20 Q4FY20 Q1FY21 Q2FY21 Q3FY21 Q4FY21
Disbursement Repayment
259
164188
161
269
146
220
111
Q1FY20 Q2FY20 Q3FY20 Q4FY20 Q1FY21 Q2FY21 Q3FY21 Q4FY21
Wholesale Banking
FY2021 Results – Investor Presentation33
Total Income (YoY Movement) and Total Assets by Line of Business PAT Trend (RM’ mil)
Wholesale Banking
Corporate Banking Loan Disbursement and Repayment
Total IncomeRM1,509 mil
3%
70%
QoQ Growth: 49%YoY Growth: 3%
13%
Disbursement QoQ Mvmt: 5%Disbursement YoY Mvmt: 39%Repayment QoQ Mvmt: 28%Repayment YoY Mvmt: 29%
FY20: 772 FY21: 747

Wholesale Banking
FY2021 Results – Investor Presentation34
Balance Sheet (RM’ mil/%)
Income Statement
Key Ratios
Wholesale Banking
YoY Growth 29% 7% 22% 7% 31% >100% 2% 3%
RM' milNet Interest
IncomeNon-Interest
IncomeTotal Income Expenses PBP Impairment PBT Tax PAT
FY21 1,096 414 1,509 282 1,228 257 971 223 747
FY20 850 387 1,237 303 934 (60) 994 222 772
FY20 FY21 YTD Change
Gross Loans / Financing 35,596 35,614
Gross Impaired Loans 644 638 1%
Customer Deposits 60,021 65,288 9%
CASA 12,966 15,988 23%
FY20 FY21 YTD Change
GIL Ratio 1.81% 1.79% 2bps
CTI 24.5% 18.7% >100bps
Loan Loss Coverage 35.4% 84.9% >100bps
ROA 1.00% 0.92% 8bps
FY21 PAT FY20 PAT Positive growth in FY21 Contraction in FY21

37.1 35.7
40.542.1
47.9
FY17 FY18 FY19 FY20 FY21
Investment Banking
FY2021 Results – Investor Presentation35
Fund Management – AUM (RM’ bil)
League Table Market Share of Value and Volume Traded on Bursa (KLSE)1
Investment Banking
Market Share1 As At 31 Mar 2021(%)
Rank2
DCM (Overall MYR Bonds) 11.9% 4
Islamic Sukuk 10.5% 4
Unit Trust 8.2% 5
Stockbroking 4.1% 8
M&A 13.9% 2
Fund Raising 16.2% 2
1. Calendar Year data2. Comparing rank movement with 31 December 2020
5.0% 4.9% 4.8%4.3% 4.0%
3.6%3.4%
3.6%
3.2%
2.9%
2017 2018 2019 2020 1Q2021
Trading Value Trading Volume

Investment Banking
FY2021 Results – Investor Presentation36
Balance Sheet (RM’ mil/%)
Income Statement
Key Ratios
Investment Banking
YoY Growth 17% 13% 13% 3% 39% 23% 38% 40% 38%
RM' milNet Interest
IncomeNon-Interest
IncomeTotal Income Expenses PBP Impairment PBT Tax PAT
FY21 47 299 346 181 165 (7) 172 37 136
FY20 40 265 306 187 119 (6) 125 26 98
FY20 FY21 YTD Change
Gross Loans / Financing 1,583 1,870 18%
Share Margin Financing 300 504 68%
Gross Impaired Loans 2 ≈ 79%
Customer Deposits 833 615 26%
CASA 203 264 30%
FY20 FY21 YTD Change
GIL Ratio 0.11% 0.02% 9bps
CTI 61.1% 52.3% >100bps
Loan Loss Coverage 267.5% 100.0% >100bps
ROA 4.28% 5.46% >100bps
Average AUM 52,972 57,621 9%
FY21 PAT FY20 PAT Positive growth in FY21 Contraction in FY21

Auto14%
Mortgage19%
Cards17%
Personal Financing2%
Deposits28%
Wealth8%
Retail SME11%
Others1%
Auto20%
Mortgage62%
Cards4%
Retail SME7%
Others7%
Total loans
RM64.8 bil
71
8692
6671
146
50
(116)
Q1FY20 Q2FY20 Q3FY20 Q4FY20 Q1FY21 Q2FY21 Q3FY21 Q4FY21
Retail Banking
FY2021 Results – Investor Presentation37
Total Income (YoY Movement) and Loans by Line of Business (LAT) / PAT Trend (RM’ mil)
Retail Banking
Total IncomeRM1,598 mil
QoQ Growth: >100%YoY Growth: 52%
16%
36%
48%
14%
35%
11%
12%
20%
FY20: 315 FY21: 151

799 818 882 954 1001
1,456
1,8531,692
Q1FY20 Q2FY20 Q3FY20 Q4FY20 Q1FY21 Q2FY21 Q3FY21 Q4FY21
2,553 2,594 2,473 2,323
1,646
2,420 2,3422,532
37 36 36 35 35 35 35 35
Q1FY20 Q2FY20 Q3FY20 Q4FY20 Q1FY21 Q2FY21 Q3FY21 Q4FY21
Merchant volume (RM'mil)
Merchants in force ('000)
-
200
400
600
-
20
40
60
80
Q1FY20 Q2FY20 Q3FY20 Q4FY20 Q1FY21 Q2FY21 Q3FY21 Q4FY21
Car
ds
in c
ircu
lati
on
Ne
w c
ard
s is
sue
d
New cards issued ('000) Cards in circulation ('000)
Q1FY20 Q2FY20 Q3FY20 Q4FY20 Q1FY21 Q2FY21 Q3FY21 Q4FY21
Mortgage Auto Finance
Retail Banking
FY2021 Results – Investor Presentation38
Credit Cards Mortgage and Auto Finance Quarterly Disbursements
Wealth Sales (RM’ mil) Merchant Volume
Retail Banking
QoQ Growth: 8% YoY Growth: 10%
QoQ Growth: 1% YoY Growth: 1%QoQ Growth: 9%YoY Growth: 74%
Mortgage QoQ Growth: 3%Mortgage YTD Growth: 7%Auto Finance QoQ Growth: 19%Auto Finance YTD Growth: 22%
FY20: 9,943 FY21: 8,940
FY20: 3,453 FY21: 6,002

Retail Banking
FY2021 Results – Investor Presentation39
Balance Sheet (RM’ mil/%)
Income Statement
Key Ratios
Retail Banking
RM' milNet Interest
IncomeNon-Interest
IncomeTotal Income Expenses PBP Impairment PBT Tax PAT
FY21 1,328 270 1,598 865 733 534 199 48 151
FY20 1,223 243 1,466 865 601 187 414 99 315
FY20 FY21 YTD Change
Gross Loans / Financing 58,892 64,787 10%
Gross Impaired Loans 924 882 5%
Customer Deposits 45,456 47,251 4%
CASA 13,002 16,288 25%
FY20 FY21 YTD Change
GIL Ratio 1.57% 1.36% 21bps
CTI 59.0% 54.1% >100bps
Loan Loss Coverage 88.6% 137.8% >100bps
ROA 0.59% 0.24% 35bps
Average AUM 1,473 2,067 40%
YoY Growth 9% 11% 9% 22% >100% 52% 52% 52%
FY21 PAT FY20 PAT Positive growth in FY21 Contraction in FY21

Distribution Channels
FY2021 Results – Investor Presentation40
Retail Banking
Branches ATM CRM2 Regional Offices
Perlis 1 3 1
Kedah 6 19 6
Pulau Pinang 14 43 15 2
Perak 18 40 21 2
Selangor 36 174 42 2
Kuala Lumpur 23 77 27 3
Putrajaya 1 4 2
Negeri Sembilan 7 39 8 1
Melaka 6 26 8 1
Johor 21 75 30 1
Pahang 8 20 12 1
Terengganu 2 14 4
Kelantan 2 14 3
Sabah 9 35 13 1
Labuan 1 3 1
Sarawak 15 57 21 1
170 643 214 15
1. Data shown as at 31 March 2021 2. MBC – Merchant Business Centres
Other Customer Touch Points
Population Density
< 100 persons per km2
101-500 persons per km2
501-1,000 persons per km2
1,001-1,500 persons per km2
> 1,501 persons per km2
Retail Banking
170 Branches
AmBank Islamic
2 Branches
Priority Banking
9 Branches
AmInvestment Bank
6 Branches5 Retail Broking
BranchesAmGeneral
4 Counters
29 Branches
AmMetLife
31 Agencies
15 Branches
ATMs at 7-Eleven
201ATMs
643Self-Service
Terminals
1,097Internet &
Mobile Banking
AmOnlineElectronic
Banking Centres
170 BranchesAmCard
Services MBC2
15

7,607 7,898 8,264 8,607 8,774 9,330 9,623 9,856
2,462 2,527 2,585 2,640 2,6472,569 2,537 2,73010,069 10,425
10,850 11,248 11,420 11,898 12,160
12,586
Q1FY20 Q2FY20 Q3FY20 Q4FY20 Q1FY21 Q2FY21 Q3FY21 Q4FY21
Non-trade Trade
2,099 2,176 2,382 3,092 2,918 3,387 3,219
4,046
3,808 4,017 3,907
4,090 4,233 4,514 4,282
4,177 5,907
6,193 6,290
7,182 7,151
7,901 7,502
8,223
Q1FY20 Q2FY20 Q3FY20 Q4FY20 Q1FY21 Q2FY21 Q3FY21 Q4FY21
CASA FD
29
19
27
50
31
43
35 35
Q1FY20 Q2FY20 Q3FY20 Q4FY20 Q1FY21 Q2FY21 Q3FY21 Q4FY21
Business Banking
FY2021 Results – Investor Presentation41
Customer Deposits (RM’ mil)
Gross Loans (RM’ mil) PAT Trend (RM’ mil)
Business Banking
QoQ Growth:
YoY Growth: 15%YTD Growth: 12%
YTD Growth: 14%
FY20: 126 FY21: 144

Business Banking
FY2021 Results – Investor Presentation42
Balance Sheet (RM’ mil/%)
Income Statement
Key Ratios
Business Banking
YoY Growth 7% 5% 6% 5% 14% 10% 15% 16% 15%
RM' milNet Interest
IncomeNon-Interest
IncomeTotal Income Expenses PBP Impairment PBT Tax PAT
FY21 297 93 390 139 251 63 189 44 144
FY20 277 89 366 145 221 57 164 38 126
FY20 FY21 YTD Change
Gross Loans / Financing 11,248 12,586 12%
Gross Impaired Loans 283 251 11%
Customer Deposits 7,182 8,223 14%
CASA 3,092 4,046 31%
FY20 FY21 YTD Change
GIL Ratio 2.51% 1.99% 52bps
CTI 39.7% 35.6% >100bps
Loan Loss Coverage 46.2% 69.9% >100bps
ROA 1.21% 1.23% 2bps
FY21 PAT FY20 PAT Positive growth in FY21 Contraction in FY21
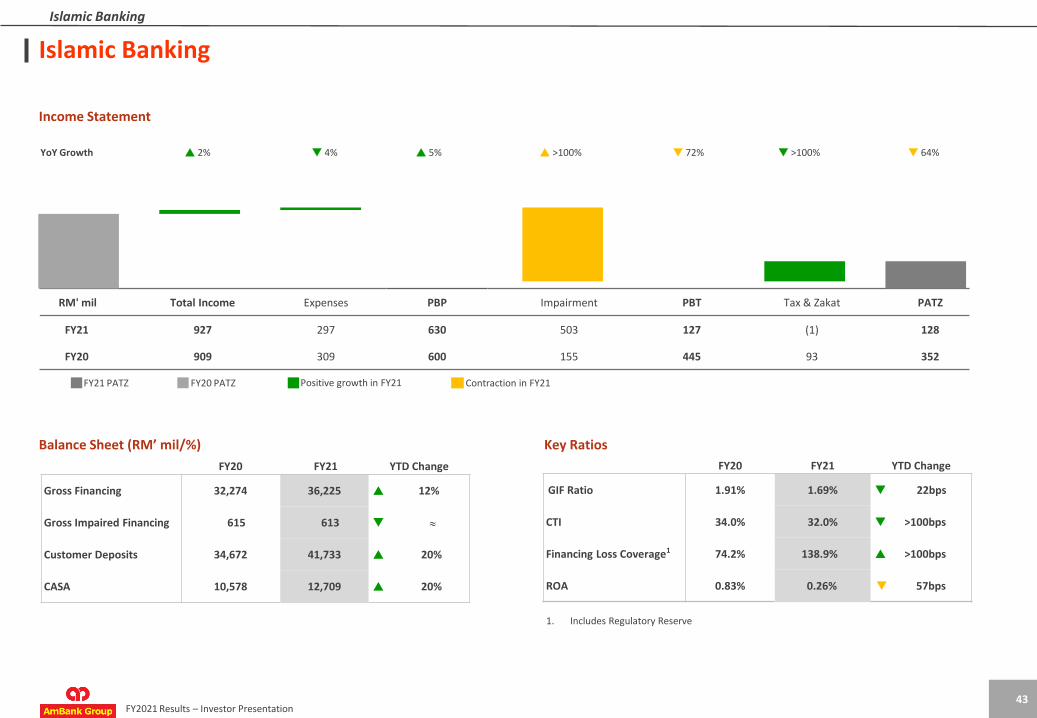
FY20 FY21 YTD Change
GIF Ratio 1.91% 1.69% 22bps
CTI 34.0% 32.0% >100bps
Financing Loss Coverage1 74.2% 138.9% >100bps
ROA 0.83% 0.26% 57bps
FY20 FY21 YTD Change
Gross Financing 32,274 36,225 12%
Gross Impaired Financing 615 613
Customer Deposits 34,672 41,733 20%
CASA 10,578 12,709 20%
Islamic Banking
FY2021 Results – Investor Presentation43
Balance Sheet (RM’ mil/%)
Income Statement
Key Ratios
Islamic Banking
RM' mil Total Income Expenses PBP Impairment PBT Tax & Zakat PATZ
FY21 927 297 630 503 127 (1) 128
FY20 909 309 600 155 445 93 352
YoY Growth 2% 4% 5% >100% 72% >100% 64%
FY21 PATZ FY20 PATZ Positive growth in FY21 Contraction in FY21
1. Includes Regulatory Reserve

81% 79% 79% 79% 79%
19%21% 21% 21% 21%
1,5801,474 1,527
1,576 1,560
FY17 FY18 FY19 FY20 FY21
Motor Non-Motor
63% 57% 58% 60% 56%
97%92% 92% 93% 91%
FY17 FY18 FY19 FY20 FY21
Loss Ratio Combined Ratio
192
282
242260 262
170
246
198
228 233
FY17 FY18 FY19 FY20 FY21
PBT PAT
General Insurance
FY2021 Results – Investor Presentation44
Gross Premium Mix and Growth (RM’ mil)
Loss Ratio and Combined Ratio PBT and PAT (RM’ mil)
General Insurance
YoY PBT Growth: 1%YoY PAT Growth: 2%
YoY GWP Growth: 1%YoY Motor Growth: 1%
YoY Non-motor Growth: 2%1
1. Includes motor PA

Insurance and Group Funding & Others
FY2021 Results – Investor Presentation45
Income Statement – Group Funding & Others
Income Statement – Insurance (General, Life & Takaful)
Insurance & Others
RM'mil Total Income Expenses PBP Impairment PBT Tax PAT
FY21 660 357 303 (3) 305 29 276
FY20 584 338 246 (4) 250 32 218
RM'mil Total Income Expenses PBP Impairment SettlementGoodwill
ImpairmentOther
ImpairmentPBT Tax PAT MI (LATMI) / PATMI
FY21 50 309 (259) 293 2,830 1,789 148 (5,319) (153) (5,166) 114 (5,281)
FY20 268 270 (2) 162 - - - (164) (88) (76) 112 (189)
YoY Growth 13% 5% 23% 35% 22% 9% 27%
YoY Growth 81% 14% >100% 81% >100% 75% >100% 2% >100%
FY21 PAT FY20 PAT Positive growth in FY21 Contraction in FY21

Shareholding structure
FY2021 Results – Investor Presentation46
Corporate Structure
AMMB Holdings Berhad
23.8%1 AmCorp 13.0% EPF 10.7% PNB 9.2%2 Others 43.3%
100% AmBank (M) Berhad
100% AmInvestment Group Berhad
100% AmInvestment Bank Berhad
FY17 FY18 FY19 FY20 FY21
26% 23% 26% 24% 19%
1.ANZ: ANZ Funds Pty Ltd,a wholly owned subsidiary of Australia and New Zealand Banking Group Limited2.Based on amalgamation of shares held by funds managed by PNB3.MetLife owns 50% plus one share in AmMetLife Insurance Berhad, with the remaining shares held by AmBank Group, and AmBank Group owns 50% plus one share in AmMetLife Takaful Berhad, with the remaining
shares owned by MetLife
Foreign shareholding excluding ANZ
100% AmBank Islamic Berhad
100% MBF Cards (M’sia) Sdn Bhd
33.33% Bonuskad Loyalty Sdn Bhd
100% AMAB Holdings Sdn Bhd
51% AmGeneral Holdings Berhad
~50% AmMetLife Takaful Berhad3
~50% AmMetLife Insurance Berhad3
100% AmGeneral Insurance Berhad
49%
~50%
~50%
As at 31 March 2021
Retail Banking Wholesale Banking Islamic Banking General Insurance Life Assurance & Takaful

2.40 2.50 2.60 2.67 2.75 2.90 2.90 2.95 2.95 3.25 3.38 3.40 3.40 3.40 3.70 4.00 4.00
KEN MACQ PIVB CGS-CIMB MIDF AFFIN UOB ADBS HLIB CITI CLSA JP MBB RHB NOMURA KAF TA
Credit ratings, target price and recommendations
FY2021 Results – Investor Presentation47
Ratings & Target Price
Credit Ratings
Target Price and Recommendations
Buy / Outperform / Overweight / AddAverage target priceSell / Trading Sell/ Underperform / Fully valued / Reduce / Underweight
Hold / Neutral / Market perform / Equalwt / In line Source: Bloomberg, Research House Report as at 31 March 2021
P/EPS : 7.91 Closing Price: RM 2.93 Average TP : RM 3.13
P/BV : 0.45 Market Cap: RM 8.81 bil Buy : 6 (35%)
Hold : 5 (30%)
Sell : 6 (35%)
Ave. TP/ Ave. CP : 1.05x
FY21 Ratings AMMB AmBank (M) AmBank Islamic AmInvestment
RAM LT: AA3, ST: P1 Outlook: Stable
LT: AA3, ST: P1Outlook: Stable
LT: AA3, ST: P1 Outlook: Stable
LT: AA3, ST: P1 Outlook: Stable
S&P LT: BBB+, ST: A-2Outlook: Negative
RH1 RH2CIMB

Glossary & Disclaimer of warranty and limitation of liability
FY2021 Results – Investor Presentation48
Glossary & Disclaimer
Reported PerformanceReported performance refers to the financial performance as reported in the audited financial statements and disclosed to the market
Growth DefinitionQoQ growth refers to Q4FY21 vs Q3FY21YoY / YTD growth refers to FY21 vs FY20
Disclaimer on rounding differencesNumbers may not add up due to rounding
Disclaimer on restatement of comparativesThe comparatives for business segments’ financials have been restated to reflect current business realignment
The information has been prepared by AMMB Holdings Berhad (AmBank Group or the Group) for information purpose and is believed to be correct at the time of presentation. No representationor warranty, express or implied, is given by or on behalf of AMMB Holdings as to the accuracy and completeness of the information or opinion contained in this presentation.
This presentation does not purport to contain all information that may be required to evaluate AmBank Group or its financial position and should not be construed as an offer or recommendationto buy or sell securities. Neither does this presentation to form the basis of, or be relied in any connection with, any contract, investment decision or commitment whatsoever.
Certain statements in this presentation may contain forward-looking statements. These forward-looking statements are based on current beliefs and expectations of the Group and are subject tosignificant risks and uncertainties that could cause actual results, performance or events to differ materially from those expressed or implied in such statements.
The term “AMMB Holdings” and “AmBank Group” denotes all Group companies within the AMMB Holdings Group and this Disclaimer of Warranty and Limitation of Liability policy applies to thefinancial institutions under AMMB Holdings.
For further information, visit www.ambankgroup.com;
or contact
Yeoh Ru Hann
Head, Group Finance – Investor Relations
Tel : +603 2036 1425
Fax: +603 2070 8262
Email: [email protected] / [email protected]
Soh Yee Tyng
Vice President, Group Finance – Investor Relations
Tel : +603 2036 1435
Fax: +603 2070 8262
Email: [email protected]