Amgen 2014 Environmental Sustainability Report
20
Amgen 2014 Environmental Sustainability Highlights
-
Upload
amgen -
Category
Environment
-
view
233 -
download
2
Transcript of Amgen 2014 Environmental Sustainability Report

Amgen 2014 Environmental Sustainability Highlights

2
Robert A. Bradway
Chairman and Chief Executive Officer
Leadership Message
I am pleased to provide you with Amgen’s 2014
Environmental Sustainability report. Amgen is at a very
exciting time in its history. We are preparing to launch
new medicines for patients suffering from serious illness
and expanding the reach of our existing medicines as
we enter new geographies. We are innovating new ways
to manufacture medicines, and we are introducing new
technologies to deliver these medicines to patients. This
is important work for Amgen, our shareholders, and the
patients we serve. We also believe it is important that
we engage in these activities while remaining
committed to sustainability.
Amgen’s Next-Generation Biomanufacturing facility in
Singapore is an excellent example of the strides we
are making. Once licensed, this site will deploy new
processes and technologies which conserve substantial
amounts of water, curb carbon emissions, reduce the
amount of solid waste generated and operate with a
dramatically smaller footprint than conventional facilities.
In a setting of new technology, we are building upon
our established sustainability practices including green
biology and green chemistry.
Our sustainability achievements would not be possible
without the efforts of staff members who have dedicated
themselves to the company’s targets. Part of our
commitment to all Amgen staff members is the creation
of a work environment that stresses safety and wellness.
Consistent with our commitment, Amgen received a
number of important sustainability acknowledgements in
2014. We were named to the Dow Jones Sustainability
World Index for the first time, and we maintained our
position on the North America Index. The U.S. Green
Building Council recognized our building design strategy
by certifying our innovative drug product research
center in Thousand Oaks, California, at the highest
level—LEED (Leadership in Energy and Environmental
Design) Platinum. The Association of Energy Engineers
recognized Amgen’s energy management strategy with
its top honor, the Corporate Energy Management Award.
Thank you for engaging with us as we continue to
improve Amgen’s sustainability performance. We value
your input and invite you to share your thoughts through
the feedback link on the report website.
Robert A. Bradway
3
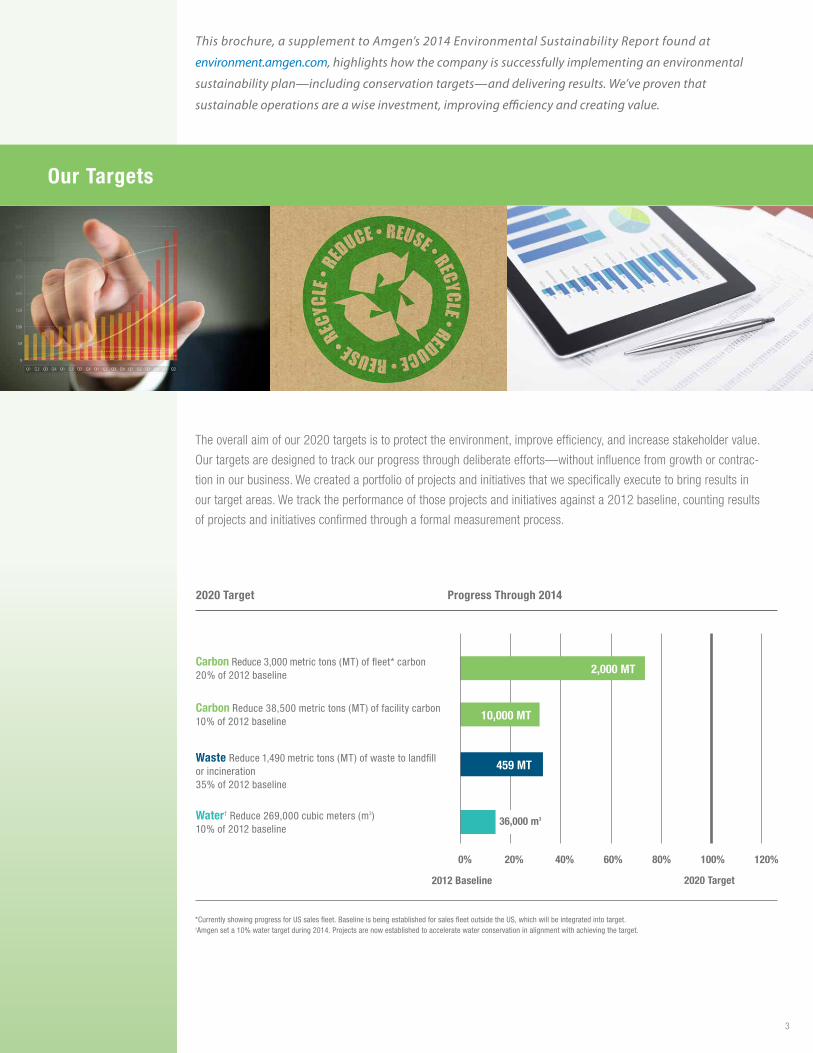
The overall aim of our 2020 targets is to protect the environment, improve efficiency, and increase stakeholder value.
Our targets are designed to track our progress through deliberate efforts—without influence from growth or contrac-
tion in our business. We created a portfolio of projects and initiatives that we specifically execute to bring results in
our target areas. We track the performance of those projects and initiatives against a 2012 baseline, counting results
of projects and initiatives confirmed through a formal measurement process.
Our Targets
Progress Through 20142020 Target
Waste Reduce 1,490 metric tons (MT) of waste to landfill or incineration35% of 2012 baseline
Water† Reduce 269,000 cubic meters (m3)10% of 2012 baseline
Carbon Reduce 3,000 metric tons (MT) of fleet* carbon20% of 2012 baseline
Carbon Reduce 38,500 metric tons (MT) of facility carbon10% of 2012 baseline 10,000 MT
459 MT
2,000 MT
This brochure, a supplement to Amgen’s 2014 Environmental Sustainability Report found at
environment.amgen.com, highlights how the company is successfully implementing an environmental
sustainability plan—including conservation targets—and delivering results. We’ve proven that
sustainable operations are a wise investment, improving efficiency and creating value.
0% 20% 40% 60% 80% 100% 120%
*Currently showing progress for US sales fleet. Baseline is being established for sales fleet outside the US, which will be integrated into target.†Amgen set a 10% water target during 2014. Projects are now established to accelerate water conservation in alignment with achieving the target.
36,000 m3
2012 Baseline 2020 Target
4
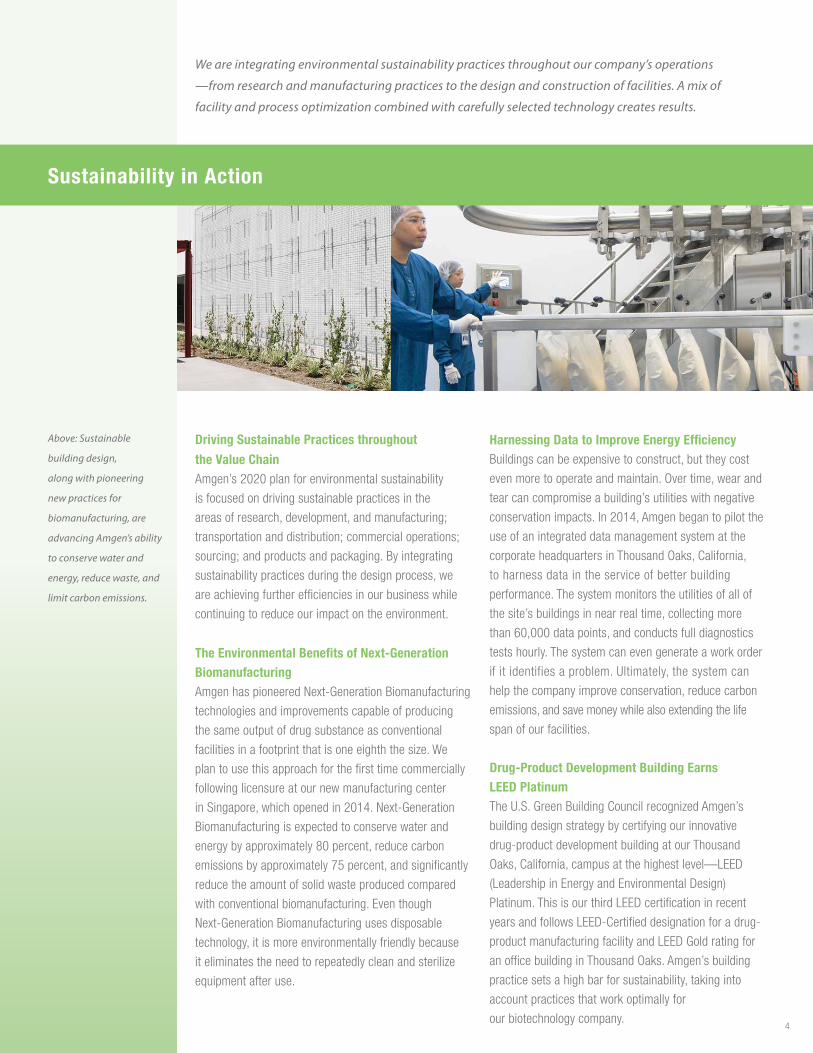
We are integrating environmental sustainability practices throughout our company’s operations
—from research and manufacturing practices to the design and construction of facilities. A mix of
facility and process optimization combined with carefully selected technology creates results.
Above: Sustainable
building design,
along with pioneering
new practices for
biomanufacturing, are
advancing Amgen’s ability
to conserve water and
energy, reduce waste, and
limit carbon emissions.
Sustainability in Action
Driving Sustainable Practices throughout
the Value ChainAmgen’s 2020 plan for environmental sustainability
is focused on driving sustainable practices in the
areas of research, development, and manufacturing;
transportation and distribution; commercial operations;
sourcing; and products and packaging. By integrating
sustainability practices during the design process, we
are achieving further efficiencies in our business while
continuing to reduce our impact on the environment.
The Environmental Benefits of Next-Generation Biomanufacturing
Amgen has pioneered Next-Generation Biomanufacturing
technologies and improvements capable of producing
the same output of drug substance as conventional
facilities in a footprint that is one eighth the size. We
plan to use this approach for the first time commercially
following licensure at our new manufacturing center
in Singapore, which opened in 2014. Next-Generation
Biomanufacturing is expected to conserve water and
energy by approximately 80 percent, reduce carbon
emissions by approximately 75 percent, and significantly
reduce the amount of solid waste produced compared
with conventional biomanufacturing. Even though
Next-Generation Biomanufacturing uses disposable
technology, it is more environmentally friendly because
it eliminates the need to repeatedly clean and sterilize
equipment after use.
Harnessing Data to Improve Energy Efficiency
Buildings can be expensive to construct, but they cost
even more to operate and maintain. Over time, wear and
tear can compromise a building’s utilities with negative
conservation impacts. In 2014, Amgen began to pilot the
use of an integrated data management system at the
corporate headquarters in Thousand Oaks, California,
to harness data in the service of better building
performance. The system monitors the utilities of all of
the site’s buildings in near real time, collecting more
than 60,000 data points, and conducts full diagnostics
tests hourly. The system can even generate a work order
if it identifies a problem. Ultimately, the system can
help the company improve conservation, reduce carbon
emissions, and save money while also extending the life
span of our facilities.
Drug-Product Development Building Earns LEED PlatinumThe U.S. Green Building Council recognized Amgen’s
building design strategy by certifying our innovative
drug-product development building at our Thousand
Oaks, California, campus at the highest level—LEED
(Leadership in Energy and Environmental Design)
Platinum. This is our third LEED certification in recent
years and follows LEED-Certified designation for a drug-
product manufacturing facility and LEED Gold rating for
an office building in Thousand Oaks. Amgen’s building
practice sets a high bar for sustainability, taking into
account practices that work optimally for
our biotechnology company.

5
Amgen staff approach opportunities to make
environmental improvements with the same enthusiasm
and rigor they apply to scientific challenges. Staff-
supported improvements in technology and processes
have created significant conservation benefits, saved
financial resources, and earned many awards over
the years. Amgen maintains a yearly Environmental
Champions program, which honors numerous staff
from around the company for their green actions.
Reaching Out in the Community Amgen staff are avid volunteers, contributing to a
number of environmentally beneficial events throughout
the year. Amgen participates annually in the International
Coastal Cleanup, a global volunteering opportunity in
which participants clear waterways and beaches of
trash while collecting data that supports the Ocean
Conservancy in its goal of trash-free seas. Other
environmental volunteering events that staff organize
include Clean Up Australia Day and work parties at the
Charles River and at Kendall Square in Massachusetts.
The Amgen Foundation is deeply committed to fostering
the next generation of scientific innovators, including
our support of important initiatives that advance
environmental education in our local communities.
We also help to further staff contributions of personal
time, energy, and talents to these important causes
through Amgen Volunteers and the Amgen Foundation
Matching Gift Program.
Sustainable Commuting Staff commitment to alternative commuting modes
at six North American worksites helped Amgen avoid
approximately 536 metric tons of greenhouse gas
emissions in 2014. Amgen supports carpools, vanpools,
public transportation vouchers, bicycle commuting, and
electric car charging where possible.
Education for the Environment Amgen celebrated Earth Day at most of its US-based
locations in 2014. Events encouraged staff to develop
environmentally friendly habits both at work and at home
in the areas of recycling, composting, waste reduction,
energy efficiency, water conservation, and alternative
commuting. Amgen’s Thousand Oaks, California, campus
also held events in support of America Recycles Day.
A special focus for 2014 was the promotion of
greener practices in the labs such as the use of
more environmentally friendly supplies and
increased recycling.
The success of our environmental sustainability plan depends on the creativity and resourcefulness of our
staff who demonstrate their commitment to the environment both at work and in their communities.
Left: Amgen participates
each year in the
International Coastal
Cleanup.
Middle and right:
Amgen staff drive
Amgen’s environmental
sustainability efforts.

6
2007–2014 Energy Use and Energy Use Avoided* Through Conservation Efforts (1,000 GJ)
Energy Use Energy Use Avoided* 2007 Through 2012
Energy Use Avoided 2013+
2,000
4,000
1,000
0
3,000
5,000
*Value represents year-over-year, cumulative, and continuing avoidance.
2007–2014 Carbon Emissions and Carbon Emissions Avoided* Through Conservation Efforts (1,000 MT)
Carbon Emissions Carbon Emissions Avoided From 2007 Through 2012*
Carbon Emissions Avoided 2013+
200
400
100
0
300
500
416
2007
19
391
2008
50
407
2010
63
381
2011
*Value represents year-over-year, cumulative and continuing avoidance. *Value represents continued avoidance based on fleet efficiency improvements
Energy
Carbon
Conserving ResourcesConserving energy allows us to retain more financial resources for
our core business of discovering, developing, manufacturing, and
delivering innovative human therapeutics while helping us to reduce
our environmental impact. Our strategy has been to complete utilities
projects that provide substantial returns for both energy savings and
carbon reduction across our network of facilities around the world. We
also mitigate environmental impacts using sustainable practices and
technology in the design and construction of manufacturing and office
facilities. We have realized more than $21 million in cost savings and
reduced carbon emissions by 94,000 metric tons from 2008 through
2014 by implementing specific energy conservation and carbon
reduction projects.
We are making progress towards our sales fleet carbon-reduction
target, raising the minimum fuel efficiency standard for vehicles year
by year. We continue to expand the range of fuel-efficient vehicle
choices available for mobile staff—and to rotate out less fuel-
efficient vehicles.
2007–2014 US Fleet Fuel Use and Fuel Use Avoided Through Conservation (per 1,000 Gal)*
2,000
1,000
500
0
1,500
2,500
US Fleet Fuel Use US Fuel Use Avoided 2007 Through 2012
US Fuel Use Avoided 2013+
Fuel Efficiency
412
2009
36
Performance
84
385
2012
84 84
8 10
363 354
2013 2014
4,341
2007
4,019
245
2008
542
3,916
2010
718
3,903
2011
407
4,006
2009
919
3,849
2012
919
106
3,817
2013
919
131
3,706
2014
1,498
2007
1,443
14
2008
1,849
345
2010
1,784
363
2011
1,297
169
2009
1,739
427
2012
1,738
427
104
2013
1,381
427
2014
185

7
2007—2014 Routine Waste Categorized by Waste Hierarchy
80%
20%
60%
0%
50%
70%
10%
90%
30%
100%
40%
Disposed Recycled, Composted, and Reused
Reduction From 2007 Through 2012*
Reduction 2013+
The Waste Hierarchy as a Model for Our Waste-Reduction Goals
More Sustainable
Less Sustainable
Waste
Reducing Waste; Saving WaterAmgen has reduced waste by more than 1,500 metric tons from
2007 through 2014. We continue to analyze data from waste audits
conducted at our largest sites to shape initiatives for recycling and
waste reduction. These initiatives have helped us to increase our rate
of recycling from 35 percent to 50 percent from 2007 through 2014.
We use data from water maps developed for each of our sites
to understand our most significant water users and identify new
opportunities for conservation. A key component of Amgen’s water
conservation program is a wastewater treatment plant at our
manufacturing plant in Puerto Rico that has enabled an average of 74
percent of the treated wastewater to be recycled on-site each year.
We also integrate low-water landscaping and smart-irrigation controls
at a variety of facilities. Energy conservation projects lead to water
conservation benefits.Water Intake Water Intake Avoided
From 2007 Through 2012*Water Intake Avoided* 2013+
3,000
1,000
500
2,000
1,500
2,500
3,500
*Value represents year-over-year, cumulative and continuing avoidance.
2007–2014 Water Intake and Intake Avoided* Through Conservation Efforts (1,000 m3)
Water
0
Reduction
Recycling, Composting, Reuse
Disposal
3,542
6,604
2007
4,037
249
4,798
2008
4,757
442
4,370
2010
5,197
875
4,449
2011
4,532
358
4,177
2009
4,762
1,094
4,256
2012
4,520
1,094320
4,260
2013
4,501
1,094
459
4,429
2014
2007
3,286
2008
2,738
550
2009
2,537
601
2010
2,574
663
2011
2,577
673
2013
2,725
686
19
2014
2,487
686
36
2012
2,720
686
8
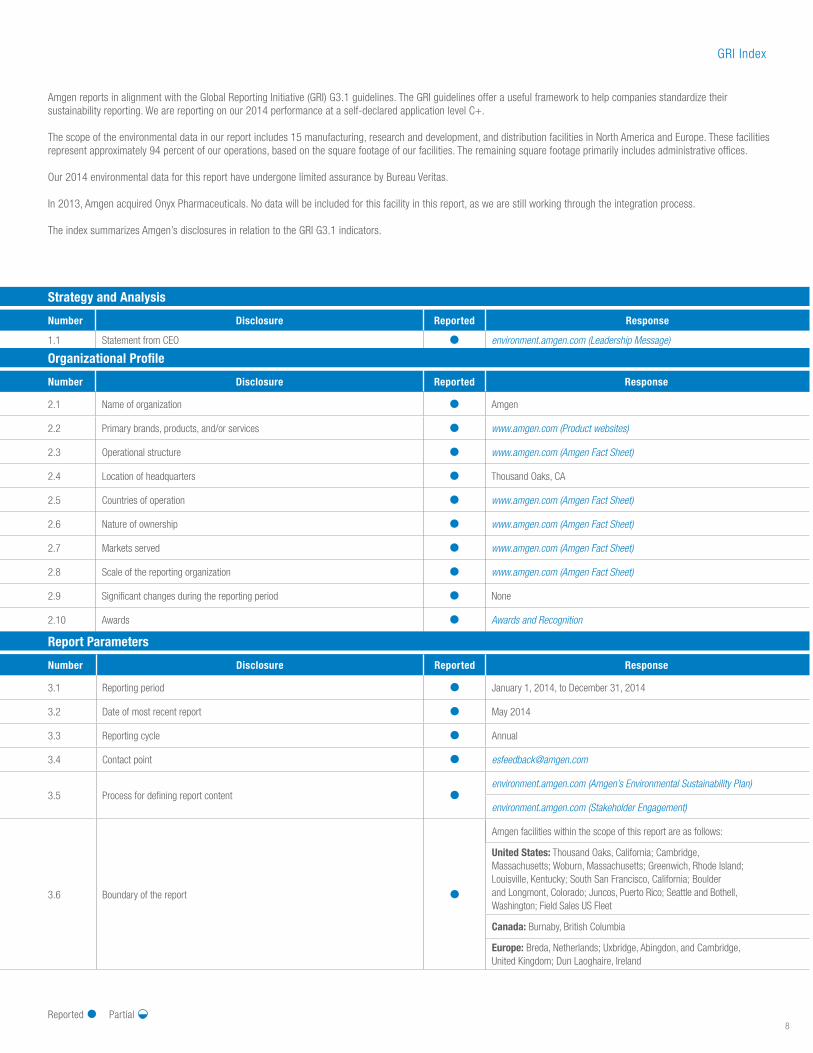
Strategy and Analysis
Organizational Profile
Number Disclosure Reported Response
1.1 Statement from CEO environment.amgen.com (Leadership Message)
Number Disclosure Reported Response
2.1 Name of organization Amgen
2.2 Primary brands, products, and/or services www.amgen.com (Product websites)
2.3 Operational structure www.amgen.com (Amgen Fact Sheet)
2.4 Location of headquarters Thousand Oaks, CA
2.5 Countries of operation www.amgen.com (Amgen Fact Sheet)
2.6 Nature of ownership www.amgen.com (Amgen Fact Sheet)
2.7 Markets served www.amgen.com (Amgen Fact Sheet)
2.8 Scale of the reporting organization www.amgen.com (Amgen Fact Sheet)
2.9 Significant changes during the reporting period None
2.10 Awards Awards and Recognition
Amgen reports in alignment with the Global Reporting Initiative (GRI) G3.1 guidelines. The GRI guidelines offer a useful framework to help companies standardize their sustainability reporting. We are reporting on our 2014 performance at a self-declared application level C+.
The scope of the environmental data in our report includes 15 manufacturing, research and development, and distribution facilities in North America and Europe. These facilities represent approximately 94 percent of our operations, based on the square footage of our facilities. The remaining square footage primarily includes administrative offices.
Our 2014 environmental data for this report have undergone limited assurance by Bureau Veritas.
In 2013, Amgen acquired Onyx Pharmaceuticals. No data will be included for this facility in this report, as we are still working through the integration process.
The index summarizes Amgen’s disclosures in relation to the GRI G3.1 indicators.
GRI Index
Report Parameters
Number Disclosure Reported Response
3.1 Reporting period January 1, 2014, to December 31, 2014
3.2 Date of most recent report May 2014
3.3 Reporting cycle Annual
3.4 Contact point [email protected]
3.5 Process for defining report contentenvironment.amgen.com (Amgen’s Environmental Sustainability Plan)
environment.amgen.com (Stakeholder Engagement)
3.6 Boundary of the report
Amgen facilities within the scope of this report are as follows:
United States: Thousand Oaks, California; Cambridge, Massachusetts; Woburn, Massachusetts; Greenwich, Rhode Island; Louisville, Kentucky; South San Francisco, California; Boulder and Longmont, Colorado; Juncos, Puerto Rico; Seattle and Bothell, Washington; Field Sales US Fleet
Canada: Burnaby, British Columbia
Europe: Breda, Netherlands; Uxbridge, Abingdon, and Cambridge, United Kingdom; Dun Laoghaire, Ireland
Reported Partial
Number Disclosure Reported Response
3.7 Limitations on the scope and boundary of the report
Items that are out of scope for this report include global sales and administrative offices with minimal environmental impact; outsourced activities, such as contract manufacturers; Onyx Pharmaceuticals, which was acquired in 2013; companies acquired in 2012, including Micromet, KAI Pharmaceuticals, deCODE genetics, and Mustafa Nevzat Pharmaceuticals; and Amgen’s facility in São Paulo, Brazil, acquired in 2011.
3.8 Basis for reporting
The in-scope facilities listed in indicator 3.6 represent our 15 manufacturing, research and development, and distribution facilities in North America, Europe, and Puerto Rico. These facilities represent 94 percent of our operations, based on the square footage of our facilities. The remaining square footage primarily includes administrative offices. We do not include environmental data from outsourced activities in this report.
3.9 Data measurement techniques and basis of calculations and assumptions environment.amgen.com (Summary of Data Notes)
3.10 Explanation of the effect of any restatements No restatements
3.11 Significant changes from previous reporting periods None
3.12 GRI content index table environment.amgen.com (GRI Index)
Number Disclosure Reported Response
4.1 Governance structure including committeesenvironment.amgen.com (Governance)
www.amgen.com (Corporate Governance)
4.2 Indicate whether the chair of the highest governance body is also an executive officerRobert Bradway is both CEO and Chairman of the Board. For more information on Amgen’s Board, see amgen.com (Corporate Governance)
4.3 Unitary board structure www.amgen.com (Corporate Governance)
4.4Mechanisms for shareholders and employees to provide recommendations/direction to highest governance board
www.amgen.com (Corporate Governance)
4.14 List of stakeholder groups engaged by the organization environment.amgen.com (Stakeholder Engagement)
4.15 Basis for identification and selection of stakeholders with whom to engage environment.amgen.com (Stakeholder Engagement)
Number Disclosure Reported Response
EC1 Economic Performance: Direct economic value generated and distributedenvironment.amgen.com (Summary of Data and Data Notes)
www.amgen.com (2014 Annual Report and Financial Summary)
EC2Economic Performance: Financial implications and other risks and opportunities due to climate change
We’re actively working to conserve energy and reduce greenhouse gas emissions that result from our operations. We have also considered potential risks to our business associated with climate change such as extreme weather events and increasing regulation. Financial impact is considered as part of our risk management processes. Having plans in place to mitigate these risks increases the overall sustainability of the business.
EC9Indirect Economic Impacts: Understanding and describing significant indirect economic impacts, including the extent of impacts
www.amgen.com (AmgenAssist)

9
Number Disclosure Reported Response
1.1 Statement from CEO environment.amgen.com (Leadership Message)
Report Parameters (continued)
Number Disclosure Reported Response
3.7 Limitations on the scope and boundary of the report
Items that are out of scope for this report include global sales and administrative offices with minimal environmental impact; outsourced activities, such as contract manufacturers; Onyx Pharmaceuticals, which was acquired in 2013; companies acquired in 2012, including Micromet, KAI Pharmaceuticals, deCODE genetics, and Mustafa Nevzat Pharmaceuticals; and Amgen’s facility in São Paulo, Brazil, acquired in 2011.
3.8 Basis for reporting
The in-scope facilities listed in indicator 3.6 represent our 15 manufacturing, research and development, and distribution facilities in North America, Europe, and Puerto Rico. These facilities represent 94 percent of our operations, based on the square footage of our facilities. The remaining square footage primarily includes administrative offices. We do not include environmental data from outsourced activities in this report.
3.9 Data measurement techniques and basis of calculations and assumptions environment.amgen.com (Summary of Data Notes)
3.10 Explanation of the effect of any restatements No restatements
3.11 Significant changes from previous reporting periods None
3.12 GRI content index table environment.amgen.com (GRI Index)
Governance, Commitments, and Engagement
Number Disclosure Reported Response
4.1 Governance structure including committeesenvironment.amgen.com (Governance)
www.amgen.com (Corporate Governance)
4.2 Indicate whether the chair of the highest governance body is also an executive officerRobert Bradway is both CEO and Chairman of the Board. For more information on Amgen’s Board, see amgen.com (Corporate Governance)
4.3 Unitary board structure www.amgen.com (Corporate Governance)
4.4Mechanisms for shareholders and employees to provide recommendations/direction to highest governance board
www.amgen.com (Corporate Governance)
4.14 List of stakeholder groups engaged by the organization environment.amgen.com (Stakeholder Engagement)
4.15 Basis for identification and selection of stakeholders with whom to engage environment.amgen.com (Stakeholder Engagement)
Economic Performance Indicators
Number Disclosure Reported Response
EC1 Economic Performance: Direct economic value generated and distributedenvironment.amgen.com (Summary of Data and Data Notes)
www.amgen.com (2014 Annual Report and Financial Summary)
EC2Economic Performance: Financial implications and other risks and opportunities due to climate change
We’re actively working to conserve energy and reduce greenhouse gas emissions that result from our operations. We have also considered potential risks to our business associated with climate change such as extreme weather events and increasing regulation. Financial impact is considered as part of our risk management processes. Having plans in place to mitigate these risks increases the overall sustainability of the business.
EC9Indirect Economic Impacts: Understanding and describing significant indirect economic impacts, including the extent of impacts
www.amgen.com (AmgenAssist)
GRI Index
Reported Partial
10
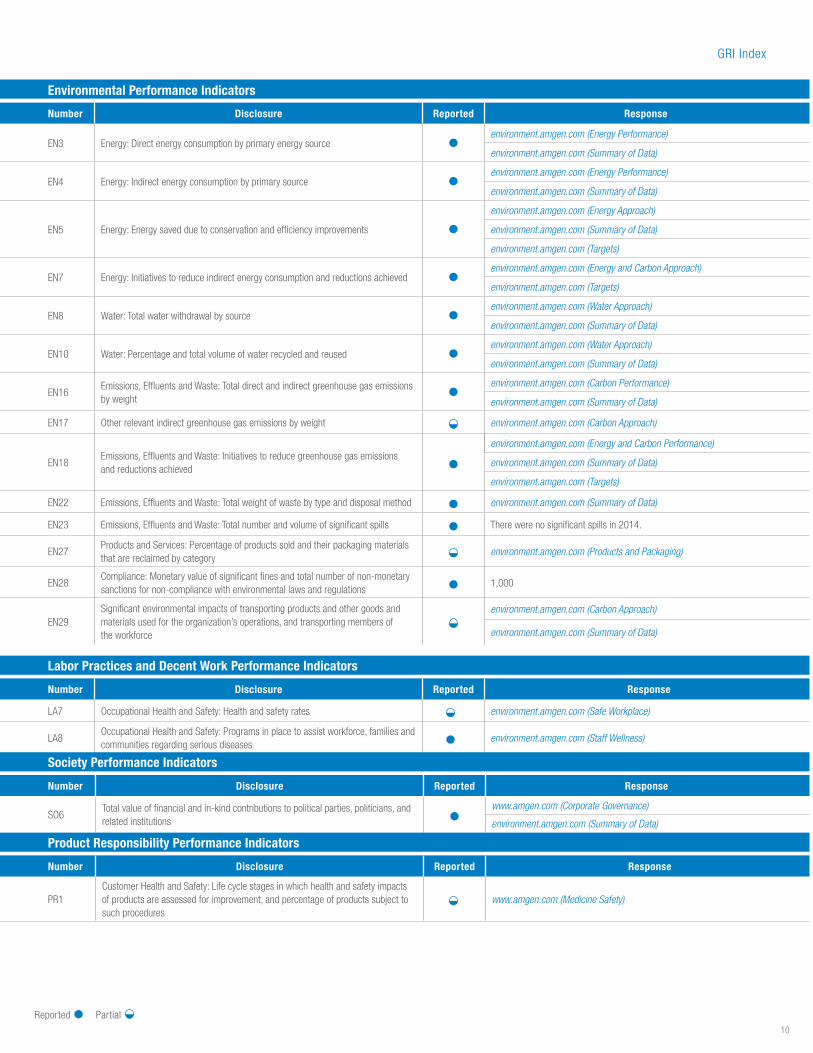
Environmental Performance Indicators
Labor Practices and Decent Work Performance Indicators
Number Disclosure Reported Response
LA7 Occupational Health and Safety: Health and safety rates environment.amgen.com (Safe Workplace)
LA8Occupational Health and Safety: Programs in place to assist workforce, families and communities regarding serious diseases
environment.amgen.com (Staff Wellness)
Number Disclosure Reported Response
EN3 Energy: Direct energy consumption by primary energy sourceenvironment.amgen.com (Energy Performance)
environment.amgen.com (Summary of Data)
EN4 Energy: Indirect energy consumption by primary sourceenvironment.amgen.com (Energy Performance)
environment.amgen.com (Summary of Data)
EN5 Energy: Energy saved due to conservation and efficiency improvements
environment.amgen.com (Energy Approach)
environment.amgen.com (Summary of Data)
environment.amgen.com (Targets)
EN7 Energy: Initiatives to reduce indirect energy consumption and reductions achievedenvironment.amgen.com (Energy and Carbon Approach)
environment.amgen.com (Targets)
EN8 Water: Total water withdrawal by sourceenvironment.amgen.com (Water Approach)
environment.amgen.com (Summary of Data)
EN10 Water: Percentage and total volume of water recycled and reusedenvironment.amgen.com (Water Approach)
environment.amgen.com (Summary of Data)
EN16Emissions, Effluents and Waste: Total direct and indirect greenhouse gas emissions by weight
environment.amgen.com (Carbon Performance)
environment.amgen.com (Summary of Data)
EN17 Other relevant indirect greenhouse gas emissions by weight environment.amgen.com (Carbon Approach)
EN18Emissions, Effluents and Waste: Initiatives to reduce greenhouse gas emissions and reductions achieved
environment.amgen.com (Energy and Carbon Performance)
environment.amgen.com (Summary of Data)
environment.amgen.com (Targets)
EN22 Emissions, Effluents and Waste: Total weight of waste by type and disposal method environment.amgen.com (Summary of Data)
EN23 Emissions, Effluents and Waste: Total number and volume of significant spills There were no significant spills in 2014.
EN27Products and Services: Percentage of products sold and their packaging materials that are reclaimed by category
environment.amgen.com (Products and Packaging)
EN28Compliance: Monetary value of significant fines and total number of non-monetary sanctions for non-compliance with environmental laws and regulations
1,000
EN29Significant environmental impacts of transporting products and other goods and materials used for the organization’s operations, and transporting members of the workforce
environment.amgen.com (Carbon Approach)
environment.amgen.com (Summary of Data)
Product Responsibility Performance Indicators
Society Performance Indicators
Number Disclosure Reported Response
PR1Customer Health and Safety: Life cycle stages in which health and safety impacts of products are assessed for improvement, and percentage of products subject to such procedures
www.amgen.com (Medicine Safety)
Number Disclosure Reported Response
SO6Total value of financial and in-kind contributions to political parties, politicians, and related institutions
www.amgen.com (Corporate Governance)
environment.amgen.com (Summary of Data)
GRI Index
Reported Partial
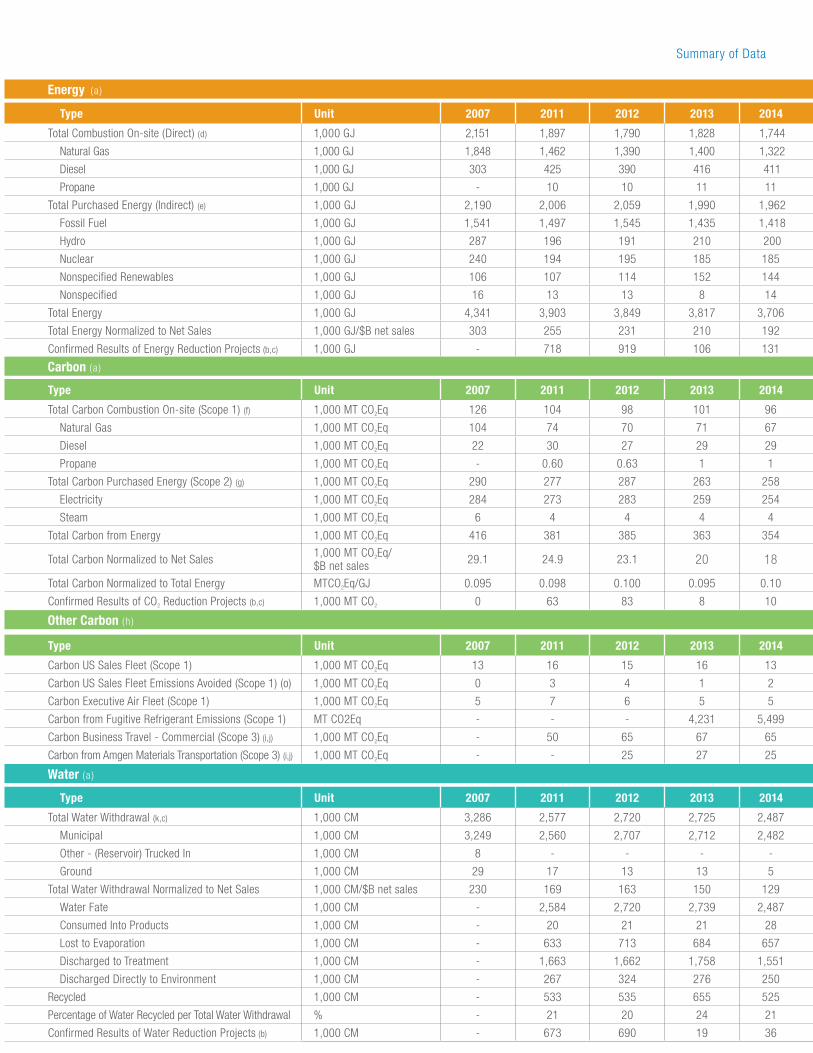
Type Unit 2007 2011 2012 2013 2014
Total Combustion On-site (Direct) (d) 1,000 GJ 2,151 1,897 1,790 1,828 1,744
Natural Gas 1,000 GJ 1,848 1,462 1,390 1,400 1,322
Diesel 1,000 GJ 303 425 390 416 411
Propane 1,000 GJ - 10 10 11 11
Total Purchased Energy (Indirect) (e) 1,000 GJ 2,190 2,006 2,059 1,990 1,962
Fossil Fuel 1,000 GJ 1,541 1,497 1,545 1,435 1,418
Hydro 1,000 GJ 287 196 191 210 200
Nuclear 1,000 GJ 240 194 195 185 185
Nonspecified Renewables 1,000 GJ 106 107 114 152 144
Nonspecified 1,000 GJ 16 13 13 8 14
Total Energy 1,000 GJ 4,341 3,903 3,849 3,817 3,706
Total Energy Normalized to Net Sales 1,000 GJ/$B net sales 303 255 231 210 192
Confirmed Results of Energy Reduction Projects (b,c) 1,000 GJ - 718 919 106 131
Type Unit 2007 2011 2012 2013 2014
Total Water Withdrawal (k,c) 1,000 CM 3,286 2,577 2,720 2,725 2,487
Municipal 1,000 CM 3,249 2,560 2,707 2,712 2,482
Other - (Reservoir) Trucked In 1,000 CM 8 - - - -
Ground 1,000 CM 29 17 13 13 5
Total Water Withdrawal Normalized to Net Sales 1,000 CM/$B net sales 230 169 163 150 129
Water Fate 1,000 CM - 2,584 2,720 2,739 2,487
Consumed Into Products 1,000 CM - 20 21 21 28
Lost to Evaporation 1,000 CM - 633 713 684 657
Discharged to Treatment 1,000 CM - 1,663 1,662 1,758 1,551
Discharged Directly to Environment 1,000 CM - 267 324 276 250
Recycled 1,000 CM - 533 535 655 525
Percentage of Water Recycled per Total Water Withdrawal % - 21 20 24 21
Confirmed Results of Water Reduction Projects (b) 1,000 CM - 673 690 19 36
Type Unit 2007 2011 2012 2013 2014
Total Carbon Combustion On-site (Scope 1) (f) 1,000 MT CO2Eq 126 104 98 101 96
Natural Gas 1,000 MT CO2Eq 104 74 70 71 67
Diesel 1,000 MT CO2Eq 22 30 27 29 29
Propane 1,000 MT CO2Eq - 0.60 0.63 1 1
Total Carbon Purchased Energy (Scope 2) (g) 1,000 MT CO2Eq 290 277 287 263 258
Electricity 1,000 MT CO2Eq 284 273 283 259 254
Steam 1,000 MT CO2Eq 6 4 4 4 4
Total Carbon from Energy 1,000 MT CO2Eq 416 381 385 363 354
Total Carbon Normalized to Net Sales 1,000 MT CO2Eq/$B net sales 29.1 24.9 23.1 20 18
Total Carbon Normalized to Total Energy MTCO2Eq/GJ 0.095 0.098 0.100 0.095 0.10
Confirmed Results of CO2 Reduction Projects (b,c) 1,000 MT CO2 0 63 83 8 10
Type Unit 2007 2011 2012 2013 2014
Carbon US Sales Fleet (Scope 1) 1,000 MT CO2Eq 13 16 15 16 13
Carbon US Sales Fleet Emissions Avoided (Scope 1) (o) 1,000 MT CO2Eq 0 3 4 1 2
Carbon Executive Air Fleet (Scope 1) 1,000 MT CO2Eq 5 7 6 5 5
Carbon from Fugitive Refrigerant Emissions (Scope 1) MT CO2Eq - - - 4,231 5,499
Carbon Business Travel - Commercial (Scope 3) (i,j) 1,000 MT CO2Eq - 50 65 67 65
Carbon from Amgen Materials Transportation (Scope 3) (i,j) 1,000 MT CO2Eq - - 25 27 25
Energy ( a )
Carbon ( a )
Other Carbon ( h )
Summary of Data
Water ( a )
12
Type Unit 2007 2011 2012 2013 2014
US Sales Fleet Fuel Efficiency MPG-US 18.7 22.6 23.3 25 26
US Sales Fleet Fuel Use Avoided (o) 1,000 GL - 363 427 104 185
US Sales Fleet Fuel Use 1,000 GL 1,498 1,784 1,739 1,738 1,381
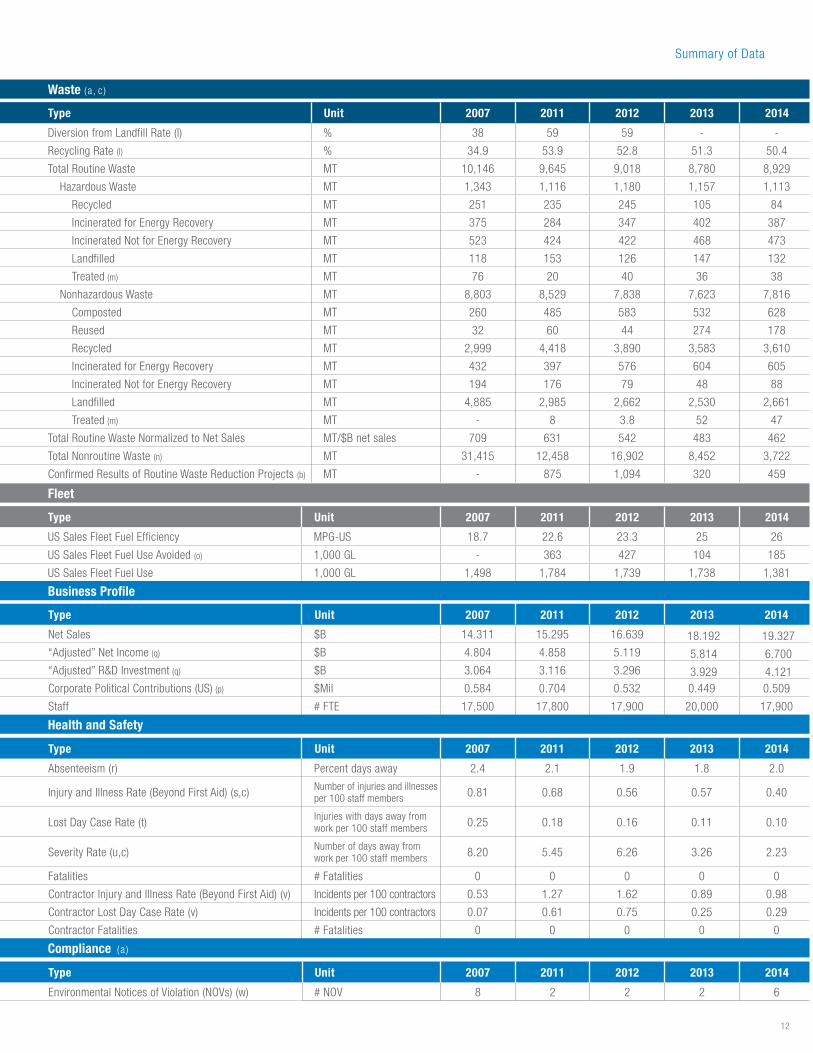
Waste ( a , c )
Compliance ( a )
Business Profile
Health and Safety
Fleet
Summary of Data
Type Unit 2007 2011 2012 2013 2014
Diversion from Landfill Rate (l) % 38 59 59 - -
Recycling Rate (l) % 34.9 53.9 52.8 51.3 50.4
Total Routine Waste MT 10,146 9,645 9,018 8,780 8,929
Hazardous Waste MT 1,343 1,116 1,180 1,157 1,113
Recycled MT 251 235 245 105 84
Incinerated for Energy Recovery MT 375 284 347 402 387
Incinerated Not for Energy Recovery MT 523 424 422 468 473
Landfilled MT 118 153 126 147 132
Treated (m) MT 76 20 40 36 38
Nonhazardous Waste MT 8,803 8,529 7,838 7,623 7,816
Composted MT 260 485 583 532 628
Reused MT 32 60 44 274 178
Recycled MT 2,999 4,418 3,890 3,583 3,610
Incinerated for Energy Recovery MT 432 397 576 604 605
Incinerated Not for Energy Recovery MT 194 176 79 48 88
Landfilled MT 4,885 2,985 2,662 2,530 2,661
Treated (m) MT - 8 3.8 52 47
Total Routine Waste Normalized to Net Sales MT/$B net sales 709 631 542 483 462
Total Nonroutine Waste (n) MT 31,415 12,458 16,902 8,452 3,722
Confirmed Results of Routine Waste Reduction Projects (b) MT - 875 1,094 320 459
Type Unit 2007 2011 2012 2013 2014
Net Sales $B 14.311 15.295 16.639 18.192 19.327“Adjusted” Net Income (q) $B 4.804 4.858 5.119 5.814 6.700“Adjusted” R&D Investment (q) $B 3.064 3.116 3.296 3.929 4.121Corporate Political Contributions (US) (p) $Mil 0.584 0.704 0.532 0.449 0.509
Staff # FTE 17,500 17,800 17,900 20,000 17,900
Type Unit 2007 2011 2012 2013 2014
Absenteeism (r) Percent days away 2.4 2.1 1.9 1.8 2.0
Injury and Illness Rate (Beyond First Aid) (s,c) Number of injuries and illnesses per 100 staff members 0.81 0.68 0.56 0.57 0.40
Lost Day Case Rate (t) Injuries with days away from work per 100 staff members 0.25 0.18 0.16 0.11 0.10
Severity Rate (u,c) Number of days away from work per 100 staff members 8.20 5.45 6.26 3.26 2.23
Fatalities # Fatalities 0 0 0 0 0
Contractor Injury and Illness Rate (Beyond First Aid) (v) Incidents per 100 contractors 0.53 1.27 1.62 0.89 0.98
Contractor Lost Day Case Rate (v) Incidents per 100 contractors 0.07 0.61 0.75 0.25 0.29
Contractor Fatalities # Fatalities 0 0 0 0 0
Type Unit 2007 2011 2012 2013 2014
Environmental Notices of Violation (NOVs) (w) # NOV 8 2 2 2 6

(o) Emissions and fuel use avoided are the result of improvements in fleet efficiency from years 2007 through 2012 based on a 2007 baseline, and 2013+ based on a 2012 baseline.
13
Type Unit 2007 2011 2012 2013 2014
US Sales Fleet Fuel Efficiency MPG-US 18.7 22.6 23.3 25 26
US Sales Fleet Fuel Use Avoided (o) 1,000 GL - 363 427 104 185
US Sales Fleet Fuel Use 1,000 GL 1,498 1,784 1,739 1,738 1,381
Type Unit 2007 2011 2012 2013 2014
Diversion from Landfill Rate (l) % 38 59 59 - -
Recycling Rate (l) % 34.9 53.9 52.8 51.3 50.4
Total Routine Waste MT 10,146 9,645 9,018 8,780 8,929
Hazardous Waste MT 1,343 1,116 1,180 1,157 1,113
Recycled MT 251 235 245 105 84
Incinerated for Energy Recovery MT 375 284 347 402 387
Incinerated Not for Energy Recovery MT 523 424 422 468 473
Landfilled MT 118 153 126 147 132
Treated (m) MT 76 20 40 36 38
Nonhazardous Waste MT 8,803 8,529 7,838 7,623 7,816
Composted MT 260 485 583 532 628
Reused MT 32 60 44 274 178
Recycled MT 2,999 4,418 3,890 3,583 3,610
Incinerated for Energy Recovery MT 432 397 576 604 605
Incinerated Not for Energy Recovery MT 194 176 79 48 88
Landfilled MT 4,885 2,985 2,662 2,530 2,661
Treated (m) MT - 8 3.8 52 47
Total Routine Waste Normalized to Net Sales MT/$B net sales 709 631 542 483 462
Total Nonroutine Waste (n) MT 31,415 12,458 16,902 8,452 3,722
Confirmed Results of Routine Waste Reduction Projects (b) MT - 875 1,094 320 459
Type Unit 2007 2011 2012 2013 2014
Environmental Notices of Violation (NOVs) (w) # NOV 8 2 2 2 6
Summary of Data—Notes
(a)
Amgen has included data from 15 facilities covering energy and carbon, water, and waste. The facilities represent approximately 94 percent of Amgen’s worldwide facility space based on total square feet. Included facilities are in Thousand Oaks, California, US; Greenwich, Rhode Island, US; Boulder and Longmont, Colorado, US; Seattle and Bothell, Washington, US; Juncos, Puerto Rico, US; Louisville, Kentucky, US; South San Francisco, California, US; Cambridge and Woburn, Massachusetts, US; Burnaby, Canada; Breda, Netherlands; Dun Laoghaire, Ireland; and Uxbridge, Abingdon, and Cambridge, United Kingdom. This includes leased buildings where we have operational control over building infrastructure, including utilities. In 2011, Amgen acquired a facility in São Paulo. In 2012, Amgen acquired four companies: Micromet, KAI Pharmaceuticals, deCODE genetics, and Mustafa Nevzat Pharmaceuticals. In 2013 Amgen acquired Onyx Pharmaceuticals. No data will be included for our São Paulo facility or for Micromet, KAI Pharmaceuticals, deCODE genetics, Mustafa Nevzat Pharmaceuticals, or Onyx Pharmaceuticals in this report, as we are still working through the integration process for these facilities.
(b)
Measurement and verification of conservation and reduction projects for energy and carbon, water, and waste are based on adaptation of the International Performance Measurement and Verification Protocol (IPMVP), Concepts and Options for Determining Energy and Water Savings Volume 1, EVO 10000-1.2007, April 2007. Project measurements are conducted using reasonable means, including direct measurements and scientific estimations as appropriate. Values for conservation and reduction projects represent year-over-year, cumulative and continuing avoidance based on a 2007 baseline, then rebaselined in 2012 to match the next generation 2020 Target design.
(c) Immaterial changes to 2007–14 data may have occurred due to refinements in calculations. All changes have been confirmed through a documented change control process.
(d)
Direct energy use results from the operation of equipment that is owned or controlled by Amgen at the facilities listed in note (a). Data on the use of natural gas, propane, and diesel in boilers, furnaces, and HVAC are recorded from utility bills or purchase records. Data on the use of diesel in emergency generators are recorded from purchase records or meter readings and, in some cases, estimated from run-hours. Utility bills recorded in units of volume are converted to energy by using the Global Reporting Initiative Version 3.1, EN3 table, to convert volumes of primary sources (natural gas, diesel), or from specific fuel analysis data (diesel used in Juncos, Puerto Rico), and the US Energy Information Administration/Annual Energy Review Table A1 (propane). Energy from emergency generators recorded as run-hours is estimated using the manufacturer’s specified fuel-feed rate for each generator.
(e)Indirect energy use results from purchased energy in the forms of electricity and steam at the Amgen facilities listed in note (a). Data on the use of electricity and steam are recorded from utility bills. Utility bills for purchased steam that are recorded in units of mass (i.e., ‘lb steam’) are converted to energy by using the latent heat of evaporation from the saturated steam tables, then dividing by the efficiency of the supplier’s steam generator.
(f)
Scope 1 carbon emissions result from direct energy sources defined in note (d). Additional Scope 1 Carbon emissions from our US sales fleet, executive air fleet, and fugitive emissions from chillers, coolers, and HVAC are found in the Other Carbon category in this data summary. Carbon data from natural gas sources are calculated using regional specific emission factors from US EPA Rule Part 98A Table C-3 (US weighted average) for all US sites; from the Ireland UFCCC for Amgen’s facility in Dun Laoghaire, Ireland; from U.K. Defra/DECC’s 110819 Guidelines for Amgen’s facilities in the United Kingdom (Uxbridge, Abingdon, and Cambridge); from the NL Agency standard CO2 emission factors for Amgen’s facility in the Netherlands (Breda); and from the Methodology for Reporting 2013 /Ministry of Environment Victoria, BC, 2013, for Amgen’s facility in Burnaby, Canada. Carbon emissions data from propane and diesel fuel sources (except Amgen’s facility in Juncos, Puerto Rico) are calculated using the Greenhouse Gas Protocol Cross-Sector Tools-Stationary Combustion-V.1.0 (August 2012). Carbon from diesel use in Amgen’s Juncos, Puerto Rico, facility are calculated using specific fuel analysis information and from US EPA Rule Part 98A Table C-1. Carbon data from direct energy sources prior to 2011 were calculated using emission factors from the Greenhouse Gas Protocol Cross-Sector Tools-Stationary Combustion-V.1.0 (Jul 2009). Scope 1 emissions that are not included in this data summary include process-related emissions from cell respiration (carbon as a by-product) and pH adjustments (CO2 injection). Analysis of these sources in 2013 showed that cell respiration and emissions from pH adjustments are negligible (less than 0.1 percent of our total carbon emissions).
(g)
Scope 2 carbon emissions result from indirect energy sources defined in note (e). Carbon data from purchased electricity are calculated using emission factors from US EPA eGRID 9th Edition Version 1 (2010 data: eGRID subregion annual carbon output emission rate) for all US locations except Amgen’s facility in Puerto Rico, which has been determined using EPA GHG Report YE 2012 for Power Suppliers in Puerto Rico; from the Greenhouse Gas Division, Environment Canada (2006 data)-V.1.0 (April 2009) for Amgen’s facility in Burnaby, Canada; and from specific utility annual providers’ reports for Amgen facilities in the United Kingdom (Uxbridge, Abingdon, and Cambridge), the Netherlands (Breda), and Dun Laoghaire, Ireland. Carbon data from purchased steam are calculated using the Emission Factor for Natural Gas as identified in US EPA Rule Part 98A Table C-3 (US weighted average) for Amgen’s facility in Cambridge, Massachusetts. Carbon data from indirect energy sources prior to 2011 were calculated using emission factors from US EPA eGRID2007 Version 1.1 for US facilities.
(h)
The Other Carbon category contains additional Scope 1 and Scope 3 carbon emissions that are tracked. Carbon emissions from our executive air fleet are calculated using emission factors from the Greenhouse Gas Protocol Cross-Sector Tools-Transport-Fuel-Use (August 2012). Carbon emissions from our US sales fleet are calculated using emission factors from the GHG Protocol Emission Factors for Petrol passenger cars (volume) (GHG Protocol) = 8.81 kg/gal. Fuel use and mileage data are collected at the pump for each vehicle. Carbon emissions from our commercial business travel are calculated by Amgen’s travel provider using the Defra tool. Carbon emissions from Amgen’s material transportation have been provided by the carrier using its own specific methods. Fugitive emissions from process equipment (e.g., refrigerant from refrigeration and HVAC equipment) are calculated using emission factors from the Greenhouse Gas Protocol Cross-Sector Tools-Transport-Fuel-Use (August 2012). Processes are in place to maintain chillers, coolers, and HVAC equipment to prevent unintended emissions.
(i) Scope 3 carbon emissions are a consequence of the activities of the company but occur from sources not owned or controlled by the company. Scope 3 carbon emissions that are currently tracked include emissions from Amgen’s commercial business travel (air and rail) and material transportation.
(j) Commercial business travel was not tracked in 2007 or 2008. Material transportation was not tracked from 2007 to 2011. The accuracy of carbon emissions tracking from chillers, coolers, and HVAC improved in 2013 and will now be reported going forward.
(k) Immaterial discrepancy between values for total water fate and total water withdrawal is due to rounding and compilation of individual facility totals.
(l) Recycling rate is the proportion of waste that is recycled, composted, and reused compared with the total volume of routine, nonhazardous and hazardous waste generated. Diversion from landfill is the proportion of waste that is incinerated (both for energy recovery and not), landfilled, and treated compared with the total routine, nonhazardous waste generated.
(m) Treatment means the physical, thermal, chemical, or biological processes that change the characteristics of the waste in order to reduce its volume or hazardous nature, facilitate its handling, or enhance recovery.
(n) Nonroutine waste constitutes waste generated outside the normal operations of our facilities and consists mainly of construction and demolition waste.
General
Energy
Carbon
Other Carbon
Water
Waste
Fleet

14
Notes
(a) The expenses related primarily to non-cash amortization of intangible assets acquired in business combinations.
(b)The adjustment related to the Internal Revenue Service issuing final regulations that required us to recognize an additional year of the non-tax deductible branded prescription drug fee.
(c) The adjustment related primarily to changing regulatory and reimbursement environments.
(d)
The tax effect of the adjustments between our GAAP and Adjusted results takes into account the tax treatment and related tax rate(s) that apply to each adjustment in the applicable tax jurisdiction(s). Generally, this results in a tax impact at the U.S. marginal tax rate for certain adjustments, including the majority of amortization of intangible assets and non-cash interest expense associated with our convertible notes, whereas the tax impact of other adjustments, including the various legal proceedings, stock option expense and restructuring expense, depends on whether the amounts are deductible in the respective tax jurisdictions and the applicable tax rate(s) in those jurisdictions.
(e)The adjustments related to resolving certain non-routine transfer-pricing and acquisition-related issues with tax authorities as well as the impact related to certain prior period items excluded from adjusted earnings.
Summary of Data—Notes
Business Profile
(p)
Corporate political contributions represent Amgen Inc.’s US aggregate contributions among those states where these are permissible. Corporate political contributions to certain candidates for state and local elected offices are permissible in accordance with applicable laws and Amgen policy. Outside the US, the rules governing corporate contributions to political parties and/or organizations vary by country. Amgen complies with all applicable laws and regulations in countries in which it has or intends to have a corporate presence or does business. Amgen adheres to a corporate policy that requires internal legal review before any contribution is made. Amgen considers making such contributions, where they are legally permissible, if the funds will be used to support education and engagement on science, technology, and innovation issues. Additional information may be found in the Corporate Governance section at www.amgen.com.
Amgen Inc.Reconciliation of GAAP Net Income to “Adjusted” Net Income (Unaudited) ($ in billions)
Results for the years ended December 31, 2007 2011 2012 2013 2014
GAAP net income $3.078 $3.683 $4.345 $5.081 $5.158
Adjustments to GAAP net income:
Acquisition-related expenses (a) 0.402 0.342 0.470 1.008 1.546
Restructuring and cost savings initiatives 0.739 0.162 0.347 0.071 0.596
Expense resulting from clarified guidance on branded prescription drug fee (b)
0.129
Stock option expense 0.181 0.085 0.059 0.034 0.016
Expense/(benefit) related to various legal proceedings 0.034 0.786 0.064 0.014 (0.003)
Non-cash interest expense associated with our convertible notes
0.219 0.143 0.140 0.012 -
Write-off of acquired in-process R&D 0.590 - - - -
Write-off of inventory (c) 0.090 - - - -
Other 0.054 - - - -
2.309 1.518 1.080 1.139 2.284
Tax effect of the above adjustments (d) (0.491) (0.331) (0.329) (0.376) (0.717)
Other tax adjustments (e) (0.092) (0.012) 0.023 (0.030) (0.025)
“Adjusted” net income $4.804 $4.858 $5.119 $5.814 $6.700
Reconciliation of GAAP R&D Expense to “Adjusted” R&D (Unaudited) ($ in billions)
Results for the years ended December 31, 2007 2011 2012 2013 2014
GAAP R&D expense $3.266 $3.167 $3.380 $4.083 $4.297
Adjustments to GAAP R&D expense:
Acquisition-related expenses (a) (0.100) (0.028) (0.050) (0.142) (0.124)
Stock option expense (0.083) (0.035) (0.022) (0.012) (0.003)
Restructuring and cost savings initiatives (0.019) (0.012) (0.012) - (0.049)
“Adjusted” R&D expense $3.064 $3.116 $3.296 $3.929 $4.121
(q)

15
Notes
(a) The expenses related primarily to non-cash amortization of intangible assets acquired in business combinations.
(b)The adjustment related to the Internal Revenue Service issuing final regulations that required us to recognize an additional year of the non-tax deductible branded prescription drug fee.
(c) The adjustment related primarily to changing regulatory and reimbursement environments.
(d)
The tax effect of the adjustments between our GAAP and Adjusted results takes into account the tax treatment and related tax rate(s) that apply to each adjustment in the applicable tax jurisdiction(s). Generally, this results in a tax impact at the U.S. marginal tax rate for certain adjustments, including the majority of amortization of intangible assets and non-cash interest expense associated with our convertible notes, whereas the tax impact of other adjustments, including the various legal proceedings, stock option expense and restructuring expense, depends on whether the amounts are deductible in the respective tax jurisdictions and the applicable tax rate(s) in those jurisdictions.
(e)The adjustments related to resolving certain non-routine transfer-pricing and acquisition-related issues with tax authorities as well as the impact related to certain prior period items excluded from adjusted earnings.
Summary of Data—Notes
(r)Absentee rate is based on US staff members, including full-time, part-time, management, and nonmanagement. Hours recorded for family medical leave are divided by hours staff members were expected to work to calculate the absenteeism rate (percent).
(s)Injury and illness rate is calculated based on the number of reported Amgen staff member injuries and illnesses beyond first aid. The rate is based on the number of injuries and illnesses per 100 Amgen staff members. Data as of March 2014.
(t) Lost day case rate is the number of injury and illness cases involving days away from work per 100 Amgen staff members. Data as of March 2014.
(u) Severity rate is the actual number of days away from work due to injury or illness per 100 Amgen staff members. Data as of March 2014.
(v)In 2009, we expanded our data tracking to include all contractors that work at our facilities. Previously the 2007 and 2008 data only included contractors working on large capital construction projects.
(w) Environmental notices of violation (NOVs) reported that resulted from agency inspections.
Health and Safety
Compliance

16
Summary of Data—Assurance
INDEPENDENT ASSURANCE STATEMENT
Introduction and objectives of work Bureau Veritas North America, Inc. (BVNA) has been engaged by Amgen to conduct an independent assurance of selected environmental health and safety data included in Amgen’s 2014 Environmental Sustainability Report.
This Assurance Statement applies to the related information included within the scope of work described below.
The data presented in Amgen’s 2014 Environmental Sustainability Report is the sole responsibility of the management of Amgen. BVNA was not involved in the drafting of the Report. Our sole responsibility was to provide independent verification of the accuracy of selected information included in the Report.
Scope of workAmgen requested BVNA to verify the accuracy of the following environmental health and safety data summarized in Amgen’s Environmental Sustainability Report for the Calendar Year 2014 reporting period:
Energy Use (Total, Direct and Indirect) Greenhouse Gas Emissions (Direct Scope 1 and Indirect Scope 2) Water Withdrawal and Fate Waste Quantities and Disposition Injury and Illness Rate (Number of injuries and illnesses per 100 staff members) Lost Day Rate (Number of injuries with days away from work per 100 staff members) Severity Rate (Number of days away from work per 100 staff members) Number of Environmental Violations
Excluded from the scope of our work is any verification of information relating to:
Text or other written statements associated with Amgen’s 2014 Environmental Sustainability Report
Activities outside the defined verification period of Calendar Year 2014
Methodology As part of its independent verification, BVNA undertook the following activities:
1. Interviews with relevant personnel of Amgen regarding data collection and reporting systems;
2. Review of Amgen’s data and information systems and methodology for collection, aggregation, analysis and internal audit of information used to determine the environmental data;
3. Review of documentary evidence produced by Amgen;
4. Audit of Amgen’s data traced back to the source for facilities located in Cambridge, Massachusetts and Thousand Oaks, California during site visits; and
5. Review of the centralized data, methods for consolidation of site data and site data available in the centralized data management system during a visit to Amgen’s headquarters location in Thousand Oaks, California.
17
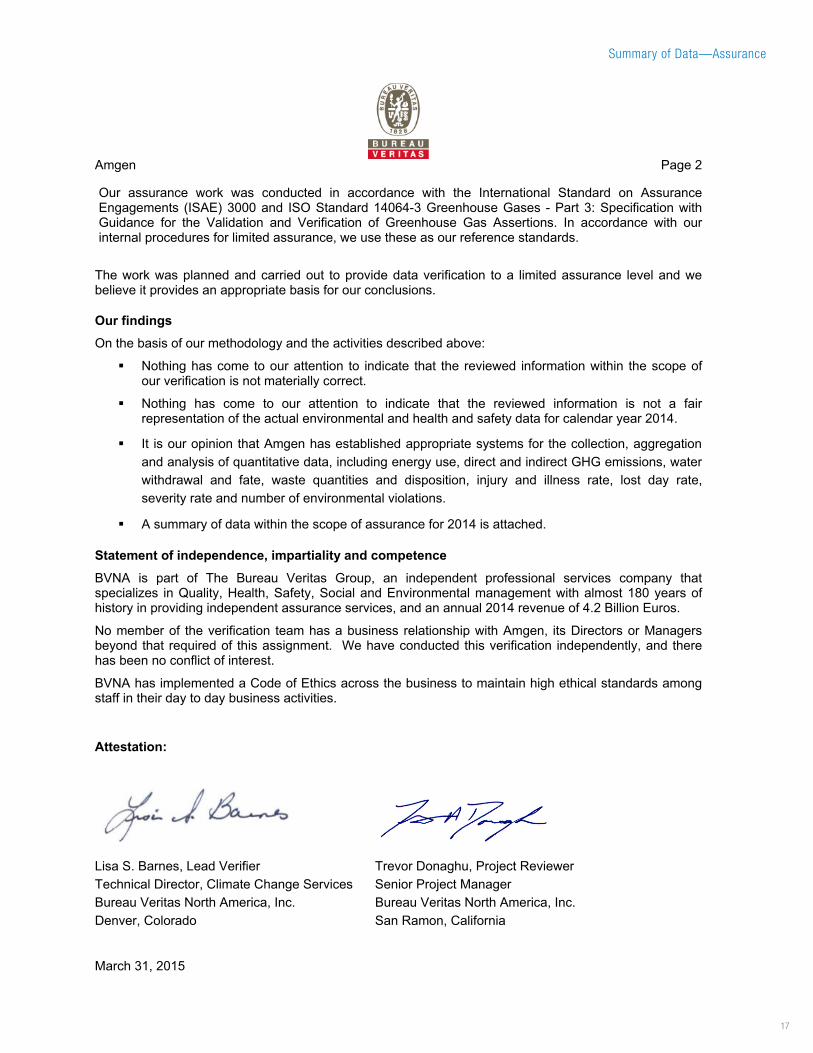
Amgen Page 2
Our assurance work was conducted in accordance with the International Standard on Assurance Engagements (ISAE) 3000 and ISO Standard 14064-3 Greenhouse Gases - Part 3: Specification with Guidance for the Validation and Verification of Greenhouse Gas Assertions. In accordance with our internal procedures for limited assurance, we use these as our reference standards.
The work was planned and carried out to provide data verification to a limited assurance level and we believe it provides an appropriate basis for our conclusions.
Our findings
On the basis of our methodology and the activities described above:
Nothing has come to our attention to indicate that the reviewed information within the scope of our verification is not materially correct.
Nothing has come to our attention to indicate that the reviewed information is not a fair representation of the actual environmental and health and safety data for calendar year 2014.
It is our opinion that Amgen has established appropriate systems for the collection, aggregation and analysis of quantitative data, including energy use, direct and indirect GHG emissions, water withdrawal and fate, waste quantities and disposition, injury and illness rate, lost day rate, severity rate and number of environmental violations.
A summary of data within the scope of assurance for 2014 is attached.
Statement of independence, impartiality and competence BVNA is part of The Bureau Veritas Group, an independent professional services company that specializes in Quality, Health, Safety, Social and Environmental management with almost 180 years of history in providing independent assurance services, and an annual 2014 revenue of 4.2 Billion Euros.
No member of the verification team has a business relationship with Amgen, its Directors or Managers beyond that required of this assignment. We have conducted this verification independently, and there has been no conflict of interest.
BVNA has implemented a Code of Ethics across the business to maintain high ethical standards among staff in their day to day business activities.
Attestation:
Lisa S. Barnes, Lead Verifier Trevor Donaghu, Project Reviewer Technical Director, Climate Change Services Senior Project Manager Bureau Veritas North America, Inc. Bureau Veritas North America, Inc. Denver, Colorado San Ramon, California
March 31, 2015
Summary of Data—Assurance
18
“As we prepare to launch new medicines for
patients suffering from serious illness while
expanding the reach of our existing medicines
by entering new geographies, we believe it is
important that we engage in these activities
while remaining committed to sustainability.”
— Robert A. Bradway, Chairman and CEO, Amgen

19
To view Amgen’s full 2014 Environmental Sustainability
Report, see environment.amgen.com. We welcome
your feedback.
Forward-Looking Statements This report contains forward-looking statements that involve significant risks and uncertainties, including those related to our
environmental sustainability program design; expected environmental sustainability goals, targets, plans, focus areas, savings or
progress towards any of the same; current and future R&D, manufacturing, commercialization, infrastructure or other workplace-related
processes, improvements or practices; as well as those discussed below and others that can be found in our Form 10-K for the year
ended December 31, 2014, and in any subsequent periodic reports on Form 10-Q and Form 8-K. Amgen is providing this information
as of March 9, 2015 and does not undertake any obligation to update any forward-looking statements contained in this report as a
result of new information, future events or otherwise.
No forward-looking statement can be guaranteed and actual results may differ materially from those we project. The Company’s
results may be affected by our ability to successfully market both new and existing products domestically and internationally, clinical
and regulatory developments (domestic or foreign) involving current and future products, sales growth of recently launched products,
competition from other products (domestic or foreign) and difficulties or delays in manufacturing our products. In addition, sales of our
products (including products of our wholly-owned subsidiaries) are affected by reimbursement policies imposed by third-party payers,
including governments, private insurance plans and managed care providers and may be affected by regulatory, clinical and guideline
developments and domestic and international trends toward managed care and healthcare cost containment as well as U.S. legislation
affecting pharmaceutical pricing and reimbursement. Government and others’ regulations and reimbursement policies may affect the
development, usage and pricing of our products. Furthermore, our research, testing, pricing, marketing and other operations are
subject to extensive regulation by domestic and foreign government regulatory authorities. We or others could identify safety, side
effects or manufacturing problems with our products after they are on the market. Our business may be impacted by government
investigations, litigation and product liability claims. If we fail to meet the compliance obligations in the corporate integrity agreement
between us and the U.S. government, we could become subject to significant sanctions. Further, while we and our partners routinely
obtain patents for our and their products and technology, the protection of our products offered by our patents and patent applications
may be challenged, invalidated or circumvented by our or our partners’ competitors. We depend on third parties for a significant portion
of our manufacturing capacity for the supply of certain of our current and future products and limits on supply may constrain sales of
certain of our current products and product candidate development. In addition, we compete with other companies with respect to
some of our marketed products as well as for the discovery and development of new products. Discovery or identification of new
product candidates cannot be guaranteed and movement from concept to product is uncertain; consequently, there can be no
guarantee that any particular product candidate will be successful and become a commercial product. Further, some raw materials,
medical devices and component parts for our products are supplied by sole third-party suppliers. Our efforts to integrate the operations
of companies we have acquired may not be successful. We may experience difficulties, delays or unexpected costs and not achieve
anticipated benefits and savings from our recently announced restructuring plan. Our business performance could affect or limit the
ability of the Amgen Inc. Board of Directors to declare a dividend or our ability to pay a dividend or repurchase our common stock.

Amgen Inc.
One Amgen Center Drive
Thousand Oaks, CA 91320-1799
www.amgen.com
© 2015 Amgen Inc. All rights reserved.
Printed on paper made with 100% post-consumer waste.
Please recycle.
Design by Saputo Design, Inc.