Amgen Cowen and Company 37th Annual Health Care Conference Presentation

Amgen 2009 Annual Report and Financial SummaryAmgen Inc.
One Amgen Center Drive
Thousand Oaks, CA 91320-1799
www.amgen.com
About Amgen
©2010 Amgen Inc. All rights reserved.
MC45347-A
Amgen discovers, develops, manufactures, and delivers
innovative human therapeutics. A biotechnology
pioneer since 1980, Amgen was one of the first
companies to realize the new science’s promise by
bringing safe and effective medicines from the lab
to the manufacturing plant to patients.
Amgen therapeutics have changed the practice of
medicine, helping millions of people around the world
in the fi ght against serious illnesses. So far, more than
18 million patients worldwide have been treated with
Amgen products.
With a broad and deep pipeline of potential new
medicines, Amgen remains committed to advancing
science to dramatically improve people’s lives.
95437_Cvr_sprds.indd 195437_Cvr_sprds.indd 1 3/4/10 1:29 PM3/4/10 1:29 PM

Serving Patients for 30 Years
Since 1980, Amgen has been a pioneer, leader, and innovator in medical biotechnology. Amgen medicines have helped more
than 18 million people around the world fi ght cancer, kidney disease, rheumatoid arthritis, and other serious illnesses.
With a number of novel potential new medicines in our pipeline, the next decade will mark a promising new chapter for Amgen—
and for patients. We are conducting medical research and clinical trials in our current therapeutic areas, and branching out
into new areas where fresh treatment approaches are urgently needed—areas such as bone health, cardiovascular disease,
cholesterol management, diabetes, and asthma. These are persistent and diffi cult medical issues that seriously impact the lives
of growing numbers of patients around the globe.
Biotechnology medicine plays an ever greater role in improving the lives of people everywhere, and Amgen continues to lead the
charge, in our own research laboratories and manufacturing facilities and in partnership with the industry’s foremost innovators
worldwide. Wherever biomedical innovation is happening and wherever patients need us most, that’s where Amgen will be.
Serving Patients“Both my mother and sister also had
osteoporosis, and they suffered with
hunched backs and broken bones.
I realize that I have the power to help
keep my bones strong. I go to the
gym regularly, eat well, and visit my
doctor. I want to do all I can to stay
independent.” —Louise, denosumab
clinical trial participant
Above: Louise walks in a park near
her home in Gaithersburg, Maryland.
Driving InnovationAmgen, the world’s leading biotechnology
medicines company, is among a select
few biotechs that are fully integrated—
combining innovative laboratory research
and clinical development with world-class
manufacturing and distribution capabilities.
Above: An Amgen staff member in a
research laboratory at the company’s
headquarters in Thousand Oaks,
California.
Fighting Serious Illness Research and development at Amgen
begins with science and ends with
new therapies with the potential to help
millions. Our strong, emerging pipeline
contains novel approaches for treating
diabetes, asthma, heart disease, skeletal
problems, and high cholesterol, among
other diseases and conditions.
Above: Cardiac muscle cells showing
the cardiac sarcomere, the fundamental
contractile element of the heart, the
target of an investigational therapy for
heart failure that Amgen is developing
with Cytokinetics.
Researching New Frontiers Amgen fi ghts cancer on multiple fronts
by exploring numerous biologic pathways
that play a role in cancer’s growth and
survival. One of many areas of study
that Amgen scientists are taking in
new directions is angiogenesis—the
process by which tumors induce new
blood vessel growth.
Above: A multimedia website,
angiogenesis.amgen.com, brings
to life the angiogenesis process
and the novel approaches being
taken by Amgen researchers.
Amgen Inc. Corporate Offi ce
One Amgen Center Drive
Thousand Oaks, California 91320-1799
(805) 447-1000
Amgen 2009 Annual Report Summary and SEC Form 10-K
Additional copies of the Company’s Form 10-K for the year ended December 31,
2009, fi led with the Securities and Exchange Commission, are available without
charge, upon written request to Investor Relations, Amgen Inc., One Amgen Center
Drive, Thousand Oaks, California 91320-1799, or by calling (800) 84-AMGEN,
or by accessing the Company’s website at www.amgen.com.
Transfer Agent and Registrar
American Stock Transfer & Trust Company
59 Maiden Lane
New York, New York 10038
Stockholder Inquiries
Inquiries related to stock transfers or lost certifi cates should be directed to
American Stock Transfer & Trust Company, (800) 937-5449 or (212) 936-5100
(www.amstock.com). General information regarding the Company and recent
news releases can be obtained by calling Amgen’s automated stockholder
information line at (800) 84-AMGEN, or by accessing the Company’s website
at www.amgen.com.
Independent Registered Public Accounting Firm
Ernst & Young LLP
Los Angeles, California
Annual Meeting
The Annual Meeting will be held on Wednesday, May 12, 2010, at 11 a.m. at
the Four Seasons Hotel Westlake Village, Two Dole Drive, Westlake Village,
California 91362.
Price Range of Common Stock
The Company’s common stock trades on the NASDAQ Stock Market under the
symbol AMGN. No cash dividends have been paid on the common stock to date,
and we currently do not intend to pay any dividends.
The following table sets forth, for the fi scal periods indicated, the range of high
and low closing sales prices of the common stock as quoted on the NASDAQ
Stock Market for the years 2009 and 2008.
Stockholder Information
Hotlines
Customer Service (800) 28-AMGEN | Investor Materials (800) 84-AMGEN
Medical Information (800) 77-AMGEN | Amgen Assist™ (800) 272-9376
Amgen, Amgen Assist™, Aranesp®, Breakaway from Cancer ®, Enbrel®, EPOGEN®,
Mimpara®, Neulasta®, NEUPOGEN®, Nplate®, Prolia™, Sensipar®, and Vectibix®
are trademarks of Amgen Inc. or its wholly owned subsidiaries.
Design by Saputo Design, Inc.
Page 6 photographs by Yesikka Vivancos (top) and Andrew J. Tao (center)
2009 2008
High Low High Low
4th Quarter $ 61.83 $ 52.12 $ 61.55 $ 47.76
3rd Quarter 64.41 51.47 65.89 48.64
2nd Quarter 53.11 45.11 47.16 41.49
1st Quarter 59.65 46.27 48.14 39.97
Board of Directors
Leadership
David Baltimore
President Emeritus and Robert
Andrews Millikan Professor of Biology,
California Institute of Technology
Frank J. Biondi, Jr.
Senior Managing Director,
WaterView Advisors LLC
François de Carbonnel
Former Chairman of the Board
and Director, Thomson S.A. and
Director of Corporations
Jerry D. Choate
Retired Chairman and CEO,
The Allstate Corporation
Vance D. Coffman
Retired Chairman
of the Board and CEO,
Lockheed Martin Corporation
Frederick W. Gluck
Former Managing Director,
McKinsey & Company, Inc.
Rebecca M. Henderson
Faculty, Harvard Business School
Frank C. Herringer
Chairman and Retired CEO,
Transamerica Corporation
Gilbert S. Omenn
Professor of Internal Medicine,
Human Genetics & Public Health
and Director of the Center for
Computational Medicine and
Bioinformatics, University of Michigan;
Former CEO, University of Michigan
Health System
Judith C. Pelham
President Emeritus,
Trinity Health
Adm. J. Paul Reason,
USN (Retired)
Former Vice Chairman and President,
Metro Machine Corporation
Leonard D. Schaeffer
Chairman,
Surgical Care Affi liates
Kevin W. Sharer
Chairman of the Board,
CEO and President, Amgen Inc.
Madhavan Balachandran
Senior Vice President,
Manufacturing
David W. Beier
Senior Vice President,
Global Government and
Corporate Affairs
Fabrizio Bonanni
Executive Vice President,
Operations
Robert A. Bradway
Executive Vice President
and Chief Financial Offi cer
James M. Daly
Senior Vice President,
North America Commercial
Operations
Willard H. Dere
Senior Vice President
and International Chief
Medical Offi cer
Paul R. Eisenberg
Senior Vice President,
Global Regulatory Affairs
and Safety
Thomas J. Flanagan
Senior Vice President and
Chief Information Offi cer
Sean E. Harper
Senior Vice President,
Global Development, and
Corporate Chief Medical Offi cer
Rolf K. Hoffmann
Senior Vice President,
International Commercial
Operations
David L. Lacey
Senior Vice President,
Research
Brian M. McNamee
Senior Vice President,
Human Resources
Joseph P. Miletich
Senior Vice President,
Research and Development
George J. Morrow
Executive Vice President,
Global Commercial Operations
Roger M. Perlmutter
Executive Vice President,
Research and Development
Anna S. Richo
Senior Vice President and
Chief Compliance Offi cer
David J. Scott
Senior Vice President,
General Counsel and Secretary
Kevin W. Sharer
Chairman of the Board,
CEO and President
Geoffrey F. Slaff
Senior Vice President,
Process and Product Engineering
Martin VanTrieste
Senior Vice President,
Quality
95437_Cvr_sprds_V2.indd 295437_Cvr_sprds_V2.indd 2 3/4/10 8:47 PM3/4/10 8:47 PM
Dear Stockholders,
In 2009, Amgen delivered vital medicines to
patients as we weathered the most challenging
economic environment in our 30-year history.
We managed our business with fi scal discipline,
generated more than $6 billion in operating cash
fl ow, and advanced our pipeline meaningfully.
This is a challenging time for investors, but we
feel good that in a time of particular uncertainty
in our industry, we have outperformed many
of our major competitors and more than held
our own compared to the S&P 500 Index
performance. However, we are not satisfi ed
with these results and hope, as denosumab
and our pipeline develop, to do even better.
We predict in our revenue guidance for 2010
a return to top-line growth.* We also anticipate
continuing our strong adjusted earnings per
share** performance with the prospect of growing
adjusted earnings per share** meaningfully this
year.* In fact, we have grown adjusted earnings
per share** at an average rate of approximately
16 percent per year during the last fi ve years.
Total revenues ($ in millions)
2009 $14,642
2008 15,003
2007 14,771
2006 14,268
2005 12,430
“Adjusted” earnings per share (EPS)**
2009 $4.91
2008 4.55
2007 4.29
2006 3.90
2005 3.20
2009 $6,336
2008 5,988
2007 5,401
2006 5,389
2005 4,911
2009 $2,739
2008 2,910
2007 3,064
2006 3,191
2005 2,302
Cash fl ow from operations ($ in millions) “Adjusted” research and development
(R&D) expenses** ($ in millions)
* Guidance as of January 25, 2010; Amgen disclaims any duty to update.
** “Adjusted” EPS and “adjusted” R&D expenses are non-GAAP fi nancial measures. See page 8 for reconciliations to U.S. Generally Accepted Accounting Principles (GAAP).
A m g e n 2 0 0 9 A n n u a l R e p o r t ■ 1
Products
Aranesp® (darbepoetin alfa)
Enbrel® (etanercept)
EPOGEN® (Epoetin alfa)
Neulasta® (pegfi lgrastim)
NEUPOGEN® (Filgrastim)
Nplate® (romiplostim)
Sensipar® (cinacalcet)
Vectibix® (panitumumab)
Letter to Stockholders
0705 06 08 09 0705 06 08 09 0705 06 08 09 0705 06 08 09
95437_Page1.indd 195437_Page1.indd 1 3/9/10 3:14 PM3/9/10 3:14 PM
The European regulatory authorities
recommended Prolia™ (denosumab) for
approval in Europe last December, and we
announced in January that we have submitted
the information the U.S. Food and Drug
Administration requested in the Complete
Response letter for Prolia™ in the treatment
of postmenopausal osteoporosis—a very
important step on the way to approval. We
expect Prolia™ approval this year in the
United States, Europe, and other regions.
In the United States, we have a world-class
sales force hired and trained; we have a
collaboration in place with GlaxoSmithKline
to commercialize Prolia™ in markets outside
the United States and Japan; and we are
ready to launch worldwide. This is exciting
for patients, and for all of us at Amgen. We
are also enthusiastic about denosumab’s
potential to help people with cancer. In several
common cancers, including prostate and
breast cancers, tumor cells may spread to
bone, causing fractures or other painful and
dangerous complications (known as skeletal-
related events, or SREs). In pivotal studies,
denosumab demonstrated superiority over
zoledronic acid, the standard of care, in
delaying SREs in breast and prostate cancer
and non-inferiority to the standard of care in
solid tumor/multiple myeloma. Data from these
studies will form the basis of our submissions
to regulatory agencies this year for an SRE
indication. This year, we also anticipate results
from an important study of denosumab’s ability
to prevent bone metastases in prostate cancer
patients. Denosumab is perhaps the most
promising product opportunity in the industry
right now, and it was included in TIME’s list of
Top 10 Medical Breakthroughs of 2009.
Delivering fi nancially and making Prolia™
available to patients are important goals we
have set this year. Another important goal is
to advance the pipeline beyond denosumab.
Late last year we were recognized by Scrip
as having the best overall pipeline in the
business. We owe it to patients everywhere
to deliver on that promise. Our pipeline
programs will continue to progress in 2010.
In addition to denosumab in oncology, we
look forward to additional data and fi lings
for Vectibix® (panitumumab) and phase 3
decisions on a number of therapeutic oncology
programs. We are also focused on earlier
programs in new therapeutic areas for Amgen
such as diabetes, asthma, and cardiovascular
disease. Over the past decade we have made
a sustained investment in research and
Access to Our Medicines We believe people should have access
to our medicines regardless of their ability
to pay. Over the past year, Amgen has
responded to economic conditions by
increasing the scope and number of patient
access programs offered by the company.
We also streamlined our access and
patient assistance services under an
integrated program called Amgen Assist.™
95437_txt.indd 295437_txt.indd 2 3/4/10 11:02 AM3/4/10 11:02 AM
development. It has been a long and diffi cult
road, but returns on that investment are now
in our sights for the decade ahead. Driving
innovation will continue to mean looking
outside as well as inside—as we did last year
with Cytokinetics in heart failure and Array
BioPharma in type 2 diabetes. Investing in our
pipeline and pursuing growth through strategic
partnerships and business development are
cornerstones of our strategy.
Another goal we have set this year is to
expand internationally. Over the past decade,
we have expanded our international presence
from 18 to nearly 50 countries. In so doing,
our international product sales have grown
from 10 percent to 22 percent of total product
sales. We are committed to aggressively
continue this expansion into underserved
and fast-growing markets which many see
as among the most attractive opportunities
in our sector.
Amgen operates in a diffi cult environment.
Discovering and developing innovative new
medicines is hard work. Our U.S. healthcare
system also needs reform. The percent of GDP
spent on healthcare grows inexorably and is
the highest in the world. Yet our outcomes
are no better, and in many cases, worse than
other societies and tens of millions of our fellow
citizens cannot afford insurance or care. Our
national attempt to begin to address some
of these issues was disappointing in process
and result, but we must keep trying. Amgen
will remain constructively engaged to help
address our national healthcare system
challenges and assure America remains
a place where innovation is encouraged,
protected, and rewarded.
After 30 years, Amgen remains as committed
as ever to our mission to serve patients by
developing innovative medicines to address
serious unmet medical needs. We continue
to believe that delivering against our mission
is also the very best way to serve our
stockholders. I am excited by our prospects
and Amgen is well prepared to deal with
these challenging times.
KEVIN W. SHARER
Chairman and Chief Executive Offi cer
February 15, 2010
Awards and
Recognition
■ Denosumab was named one
of TIME magazine’s Top 10
Medical Breakthroughs of 2009.
■ Amgen was honored with
two 2009 Scrip Awards,
winning for Best Overall
Pipeline and for Best New
Drug in Nplate® (romiplostim).
■ Nplate® received the 2009
Prix Galien USA Award for
Best Biotechnology Product.
■ Amgen was among the top
10 in both Science’s 2009
Top Employers List for large
companies and The Scientist’s
2009 survey of the Best Places
to Work in Industry.
A m g e n 2 0 0 9 A n n u a l R e p o r t ■ 3
95437_txt.indd 395437_txt.indd 3 3/4/10 11:02 AM3/4/10 11:02 AM
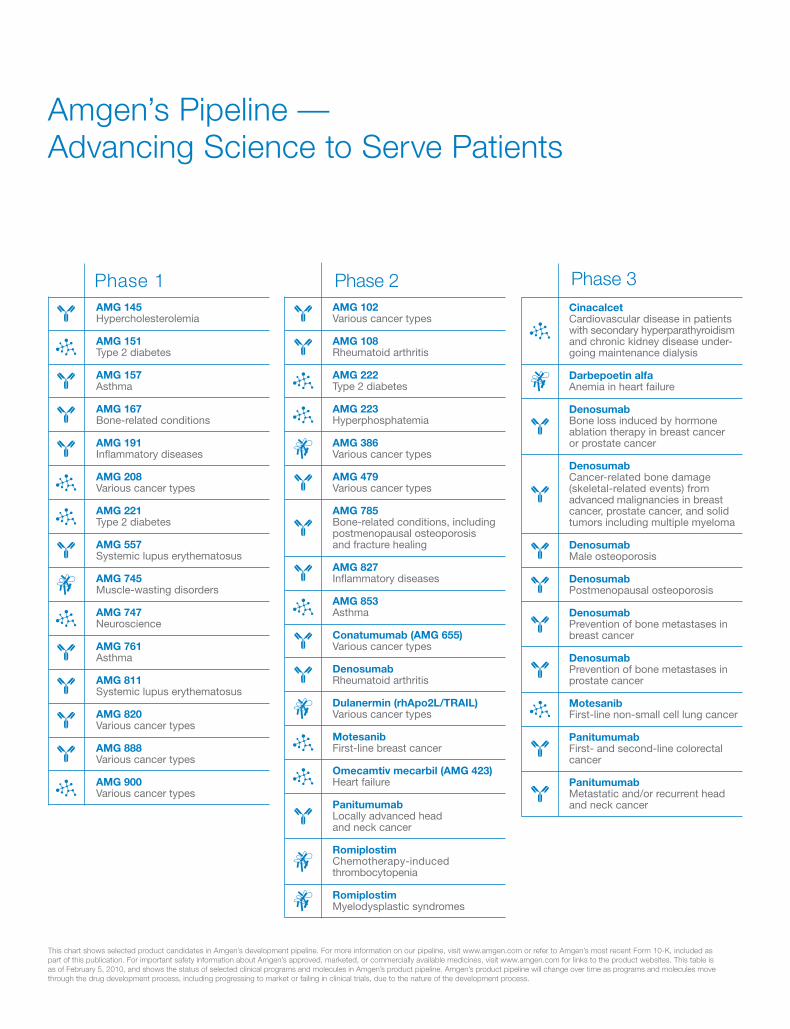
This chart shows selected product candidates in Amgen’s development pipeline. For more information on our pipeline, visit www.amgen.com or refer to Amgen’s most recent Form 10-K, included as
part of this publication. For important safety information about Amgen’s approved, marketed, or commercially available medicines, visit www.amgen.com for links to the product websites. This table is
as of February 5, 2010, and shows the status of selected clinical programs and molecules in Amgen’s product pipeline. Amgen’s product pipeline will change over time as programs and molecules move
through the drug development process, including progressing to market or failing in clinical trials, due to the nature of the development process.
Amgen’s Pipeline —
Advancing Science to Serve Patients
Phase 1
AMG 145 Hypercholesterolemia
AMG 151 Type 2 diabetes
AMG 157 Asthma
AMG 167 Bone-related conditions
AMG 191 Infl ammatory diseases
AMG 208 Various cancer types
AMG 221 Type 2 diabetes
AMG 557 Systemic lupus erythematosus
AMG 745 Muscle-wasting disorders
AMG 747 Neuroscience
AMG 761 Asthma
AMG 811 Systemic lupus erythematosus
AMG 820 Various cancer types
AMG 888 Various cancer types
AMG 900 Various cancer types
Phase 2
AMG 102 Various cancer types
AMG 108 Rheumatoid arthritis
AMG 222 Type 2 diabetes
AMG 223 Hyperphosphatemia
AMG 386 Various cancer types
AMG 479 Various cancer types
AMG 785 Bone-related conditions, including
postmenopausal osteoporosis and fracture healing
AMG 827 Infl ammatory diseases AMG 853 Asthma
Conatumumab (AMG 655) Various cancer types
Denosumab Rheumatoid arthritis
Dulanermin (rhApo2L/TRAIL) Various cancer types
Motesanib First-line breast cancer
Omecamtiv mecarbil (AMG 423) Heart failure
Panitumumab Locally advanced head
and neck cancer
Romiplostim Chemotherapy-induced
thrombocytopenia
Romiplostim Myelodysplastic syndromes
Phase 3
Cinacalcet Cardiovascular disease in patients
with secondary hyperparathyroidism and chronic kidney disease under-going maintenance dialysis
Darbepoetin alfa Anemia in heart failure
Denosumab Bone loss induced by hormone
ablation therapy in breast cancer or prostate cancer
Denosumab Cancer-related bone damage
(skeletal-related events) from advanced malignancies in breast cancer, prostate cancer, and solid tumors including multiple myeloma
Denosumab Male osteoporosis
Denosumab Postmenopausal osteoporosis
Denosumab Prevention of bone metastases in
breast cancer
Denosumab Prevention of bone metastases in
prostate cancer
Motesanib First-line non-small cell lung cancer
Panitumumab First- and second-line colorectal
cancer
Panitumumab Metastatic and/or recurrent head
and neck cancer
95437_txt.indd 495437_txt.indd 4 3/4/10 11:02 AM3/4/10 11:02 AM
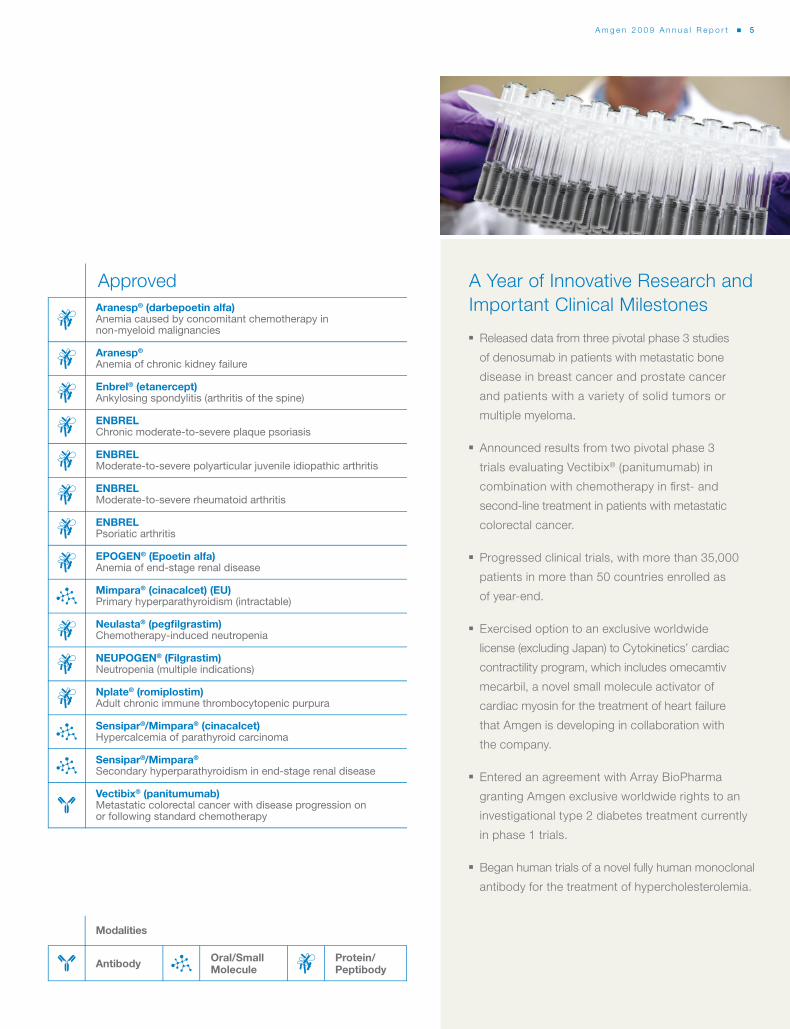
Approved
Aranesp® (darbepoetin alfa) Anemia caused by concomitant chemotherapy in
non-myeloid malignancies
Aranesp®
Anemia of chronic kidney failure
Enbrel® (etanercept)Ankylosing spondylitis (arthritis of the spine)
ENBRELChronic moderate-to-severe plaque psoriasis
ENBRELModerate-to-severe polyarticular juvenile idiopathic arthritis
ENBRELModerate-to-severe rheumatoid arthritis
ENBRELPsoriatic arthritis
EPOGEN® (Epoetin alfa)Anemia of end-stage renal disease
Mimpara® (cinacalcet) (EU)Primary hyperparathyroidism (intractable)
Neulasta® (pegfi lgrastim)Chemotherapy-induced neutropenia
NEUPOGEN® (Filgrastim)Neutropenia (multiple indications)
Nplate® (romiplostim)Adult chronic immune thrombocytopenic purpura
Sensipar®/Mimpara® (cinacalcet)Hypercalcemia of parathyroid carcinoma
Sensipar®/Mimpara®
Secondary hyperparathyroidism in end-stage renal disease
Vectibix® (panitumumab) Metastatic colorectal cancer with disease progression on
or following standard chemotherapy
Modalities
Oral/SmallMolecule
Protein/PeptibodyAntibody
A Year of Innovative Research and
Important Clinical Milestones
■ Released data from three pivotal phase 3 studies
of denosumab in patients with metastatic bone
disease in breast cancer and prostate cancer
and patients with a variety of solid tumors or
multiple myeloma.
■ Announced results from two pivotal phase 3
trials evaluating Vectibix® (panitumumab) in
combination with chemotherapy in fi rst- and
second-line treatment in patients with metastatic
colorectal cancer.
■ Progressed clinical trials, with more than 35,000
patients in more than 50 countries enrolled as
of year-end.
■ Exercised option to an exclusive worldwide
license (excluding Japan) to Cytokinetics’ cardiac
contractility program, which includes omecamtiv
mecarbil, a novel small molecule activator of
cardiac myosin for the treatment of heart failure
that Amgen is developing in collaboration with
the company.
■ Entered an agreement with Array BioPharma
granting Amgen exclusive worldwide rights to an
investigational type 2 diabetes treatment currently
in phase 1 trials.
■ Began human trials of a novel fully human monoclonal
antibody for the treatment of hypercholesterolemia.
A m g e n 2 0 0 9 A n n u a l R e p o r t ■ 5
95437_txt.indd 595437_txt.indd 5 3/4/10 11:02 AM3/4/10 11:02 AM
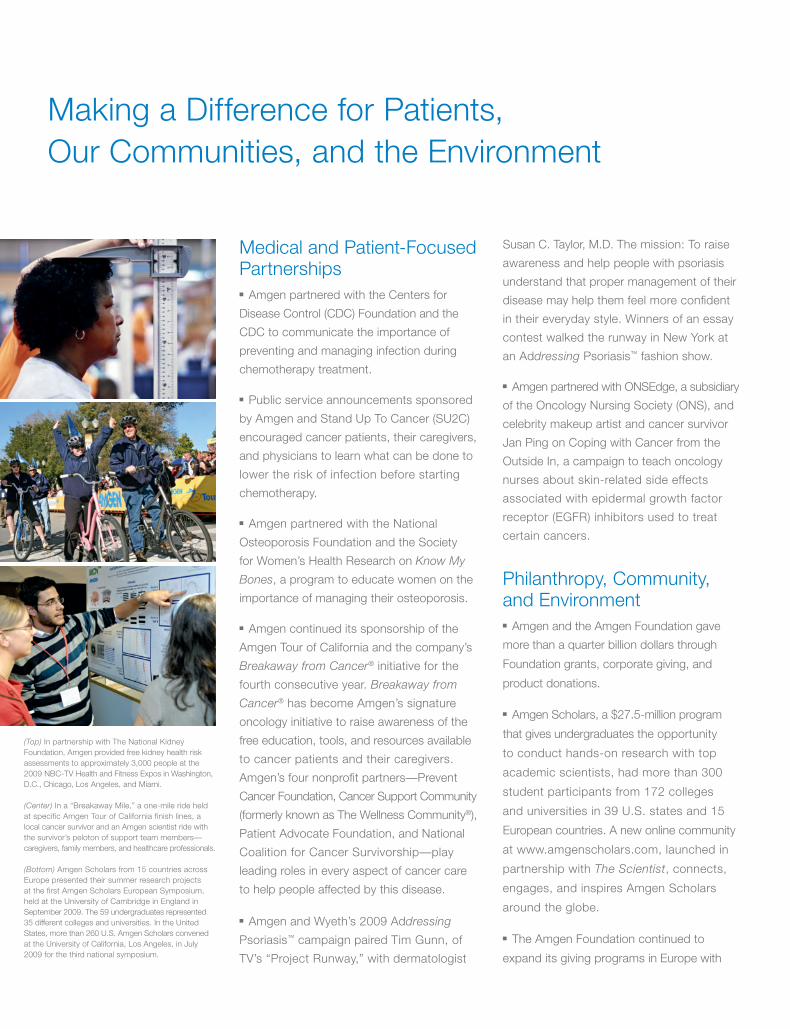
Making a Difference for Patients,
Our Communities, and the Environment
(Top) In partnership with The National Kidney
Foundation, Amgen provided free kidney health risk
assessments to approximately 3,000 people at the
2009 NBC-TV Health and Fitness Expos in Washington,
D.C., Chicago, Los Angeles, and Miami.
(Center) In a “Breakaway Mile,” a one-mile ride held
at specific Amgen Tour of California finish lines, a
local cancer survivor and an Amgen scientist ride with
the survivor’s peloton of support team members—
caregivers, family members, and healthcare professionals.
(Bottom) Amgen Scholars from 15 countries across
Europe presented their summer research projects
at the fi rst Amgen Scholars European Symposium,
held at the University of Cambridge in England in
September 2009. The 59 undergraduates represented
35 different colleges and universities. In the United
States, more than 260 U.S. Amgen Scholars convened
at the University of California, Los Angeles, in July
2009 for the third national symposium.
Medical and Patient-Focused
Partnerships
■ Amgen partnered with the Centers for
Disease Control (CDC) Foundation and the
CDC to communicate the importance of
preventing and managing infection during
chemotherapy treatment.
■ Public service announcements sponsored
by Amgen and Stand Up To Cancer (SU2C)
encouraged cancer patients, their caregivers,
and physicians to learn what can be done to
lower the risk of infection before starting
chemotherapy.
■ Amgen partnered with the National
Osteoporosis Foundation and the Society
for Women’s Health Research on Know My
Bones, a program to educate women on the
importance of managing their osteoporosis.
■ Amgen continued its sponsorship of the
Amgen Tour of California and the company’s
Breakaway from Cancer® initiative for the
fourth consecutive year. Breakaway from
Cancer® has become Amgen’s signature
oncology initiative to raise awareness of the
free education, tools, and resources available
to cancer patients and their caregivers.
Amgen’s four nonprofi t partners—Prevent
Cancer Foundation, Cancer Support Community
(formerly known as The Wellness Community®),
Patient Advocate Foundation, and National
Coalition for Cancer Survivorship—play
leading roles in every aspect of cancer care
to help people affected by this disease.
■ Amgen and Wyeth’s 2009 Addressing
Psoriasis™ campaign paired Tim Gunn, of
TV’s “Project Runway,” with dermatologist
Susan C. Taylor, M.D. The mission: To raise
awareness and help people with psoriasis
understand that proper management of their
disease may help them feel more confi dent
in their everyday style. Winners of an essay
contest walked the runway in New York at
an Addressing Psoriasis™ fashion show.
■ Amgen partnered with ONSEdge, a subsidiary
of the Oncology Nursing Society (ONS), and
celebrity makeup artist and cancer survivor
Jan Ping on Coping with Cancer from the
Outside In, a campaign to teach oncology
nurses about skin-related side effects
associated with epidermal growth factor
receptor (EGFR) inhibitors used to treat
certain cancers.
Philanthropy, Community,
and Environment
■ Amgen and the Amgen Foundation gave
more than a quarter billion dollars through
Foundation grants, corporate giving, and
product donations.
■ Amgen Scholars, a $27.5-million program
that gives undergraduates the opportunity
to conduct hands-on research with top
academic scientists, had more than 300
student participants from 172 colleges
and universities in 39 U.S. states and 15
European countries. A new online community
at www.amgenscholars.com, launched in
partnership with The Scientist, connects,
engages, and inspires Amgen Scholars
around the globe.
■ The Amgen Foundation continued to
expand its giving programs in Europe with
95437_txt_r1.indd 695437_txt_r1.indd 6 3/8/10 7:53 PM3/8/10 7:53 PM
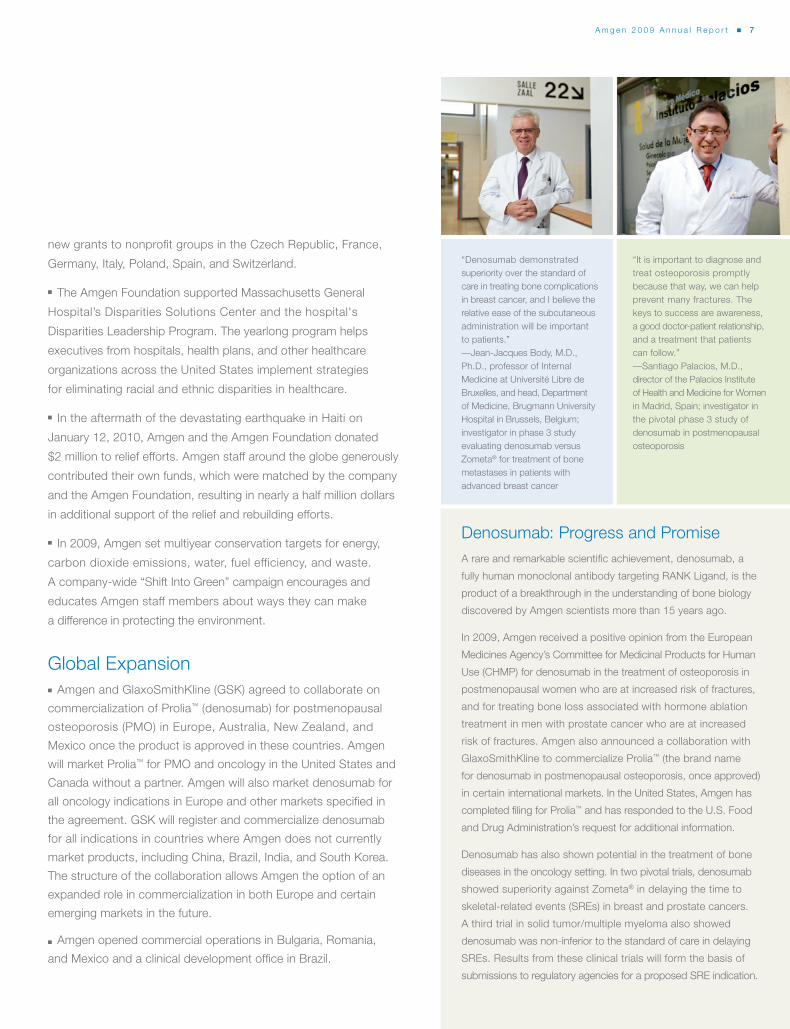
Denosumab: Progress and Promise
A rare and remarkable scientifi c achievement, denosumab, a
fully human monoclonal antibody targeting RANK Ligand, is the
product of a breakthrough in the understanding of bone biology
discovered by Amgen scientists more than 15 years ago.
In 2009, Amgen received a positive opinion from the European
Medicines Agency’s Committee for Medicinal Products for Human
Use (CHMP) for denosumab in the treatment of osteoporosis in
postmenopausal women who are at increased risk of fractures,
and for treating bone loss associated with hormone ablation
treatment in men with prostate cancer who are at increased
risk of fractures. Amgen also announced a collaboration with
GlaxoSmithKline to commercialize Prolia™ (the brand name
for denosumab in postmenopausal osteoporosis, once approved)
in certain international markets. In the United States, Amgen has
completed fi ling for Prolia™ and has responded to the U.S. Food
and Drug Administration’s request for additional information.
Denosumab has also shown potential in the treatment of bone
diseases in the oncology setting. In two pivotal trials, denosumab
showed superiority against Zometa® in delaying the time to
skeletal-related events (SREs) in breast and prostate cancers.
A third trial in solid tumor/multiple myeloma also showed
denosumab was non-inferior to the standard of care in delaying
SREs. Results from these clinical trials will form the basis of
submissions to regulatory agencies for a proposed SRE indication.
“Denosumab demonstrated
superiority over the standard of
care in treating bone complications
in breast cancer, and I believe the
relative ease of the subcutaneous
administration will be important
to patients.”
—Jean-Jacques Body, M.D.,
Ph.D., professor of Internal
Medicine at Université Libre de
Bruxelles, and head, Department
of Medicine, Brugmann University
Hospital in Brussels, Belgium;
investigator in phase 3 study
evaluating denosumab versus
Zometa® for treatment of bone
metastases in patients with
advanced breast cancer
“It is important to diagnose and
treat osteoporosis promptly
because that way, we can help
prevent many fractures. The
keys to success are awareness,
a good doctor-patient relationship,
and a treatment that patients
can follow.”
—Santiago Palacios, M.D.,
director of the Palacios Institute
of Health and Medicine for Women
in Madrid, Spain; investigator in
the pivotal phase 3 study of
denosumab in postmenopausal
osteoporosis
new grants to nonprofi t groups in the Czech Republic, France,
Germany, Italy, Poland, Spain, and Switzerland.
■ The Amgen Foundation supported Massachusetts General
Hospital’s Disparities Solutions Center and the hospital's
Disparities Leadership Program. The yearlong program helps
executives from hospitals, health plans, and other healthcare
organizations across the United States implement strategies
for eliminating racial and ethnic disparities in healthcare.
■ In the aftermath of the devastating earthquake in Haiti on
January 12, 2010, Amgen and the Amgen Foundation donated
$2 million to relief efforts. Amgen staff around the globe generously
contributed their own funds, which were matched by the company
and the Amgen Foundation, resulting in nearly a half million dollars
in additional support of the relief and rebuilding efforts.
■ In 2009, Amgen set multiyear conservation targets for energy,
carbon dioxide emissions, water, fuel efficiency, and waste.
A company-wide “Shift Into Green” campaign encourages and
educates Amgen staff members about ways they can make
a difference in protecting the environment.
Global Expansion
■ Amgen and GlaxoSmithKline (GSK) agreed to collaborate on
commercialization of Prolia™ (denosumab) for postmenopausal
osteoporosis (PMO) in Europe, Australia, New Zealand, and
Mexico once the product is approved in these countries. Amgen
will market Prolia™ for PMO and oncology in the United States and
Canada without a partner. Amgen will also market denosumab for
all oncology indications in Europe and other markets specifi ed in
the agreement. GSK will register and commercialize denosumab
for all indications in countries where Amgen does not currently
market products, including China, Brazil, India, and South Korea.
The structure of the collaboration allows Amgen the option of an
expanded role in commercialization in both Europe and certain
emerging markets in the future.
■ Amgen opened commercial operations in Bulgaria, Romania,
and Mexico and a clinical development offi ce in Brazil.
A m g e n 2 0 0 9 A n n u a l R e p o r t ■ 7
95437_txt.indd 795437_txt.indd 7 3/4/10 6:21 PM3/4/10 6:21 PM
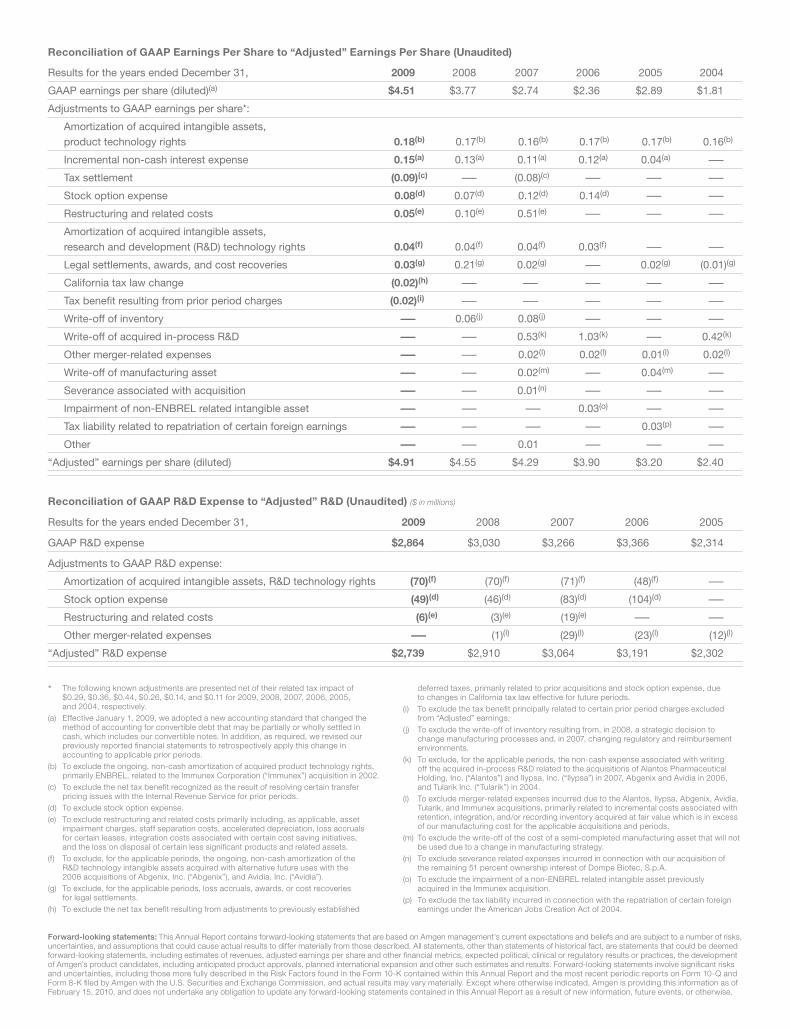
The following known adjustments are presented net of their related tax impact of
$0.29, $0.36, $0.44, $0.26, $0.14, and $0.11 for 2009, 2008, 2007, 2006, 2005,
and 2004, respectively.
(a) Effective January 1, 2009, we adopted a new accounting standard that changed the
method of accounting for convertible debt that may be partially or wholly settled in
cash, which includes our convertible notes. In addition, as required, we revised our
previously reported fi nancial statements to retrospectively apply this change in
accounting to applicable prior periods.
(b) To exclude the ongoing, non-cash amortization of acquired product technology rights,
primarily ENBREL, related to the Immunex Corporation (“Immunex”) acquisition in 2002.
(c) To exclude the net tax benefi t recognized as the result of resolving certain transfer
pricing issues with the Internal Revenue Service for prior periods.
(d) To exclude stock option expense.
(e) To exclude restructuring and related costs primarily including, as applicable, asset
impairment charges, staff separation costs, accelerated depreciation, loss accruals
for certain leases, integration costs associated with certain cost saving initiatives,
and the loss on disposal of certain less signifi cant products and related assets.
(f) To exclude, for the applicable periods, the ongoing, non-cash amortization of the
R&D technology intangible assets acquired with alternative future uses with the
2006 acquisitions of Abgenix, Inc. (“Abgenix”), and Avidia, Inc. (“Avidia”).
(g) To exclude, for the applicable periods, loss accruals, awards, or cost recoveries
for legal settlements.
(h) To exclude the net tax benefi t resulting from adjustments to previously established
deferred taxes, primarily related to prior acquisitions and stock option expense, due
to changes in California tax law effective for future periods.
(i) To exclude the tax benefi t principally related to certain prior period charges excluded
from “Adjusted” earnings.
( j) To exclude the write-off of inventory resulting from, in 2008, a strategic decision to
change manufacturing processes and, in 2007, changing regulatory and reimbursement
environments.
(k) To exclude, for the applicable periods, the non-cash expense associated with writing
off the acquired in-process R&D related to the acquisitions of Alantos Pharmaceutical
Holding, Inc. (“Alantos”) and Ilypsa, Inc. (“Ilypsa”) in 2007, Abgenix and Avidia in 2006,
and Tularik Inc. (“Tularik”) in 2004.
(l) To exclude merger-related expenses incurred due to the Alantos, Ilypsa, Abgenix, Avidia,
Tularik, and Immunex acquisitions, primarily related to incremental costs associated with
retention, integration, and/or recording inventory acquired at fair value which is in excess
of our manufacturing cost for the applicable acquisitions and periods.
(m) To exclude the write-off of the cost of a semi-completed manufacturing asset that will not
be used due to a change in manufacturing strategy.
(n) To exclude severance related expenses incurred in connection with our acquisition of
the remaining 51 percent ownership interest of Dompe Biotec, S.p.A.
(o) To exclude the impairment of a non-ENBREL related intangible asset previously
acquired in the Immunex acquisition.
(p) To exclude the tax liability incurred in connection with the repatriation of certain foreign
earnings under the American Jobs Creation Act of 2004.
Results for the years ended December 31, 2009 2008 2007 2006 2005
GAAP R&D expense $2,864 $3,030 $3,266 $3,366 $2,314
Adjustments to GAAP R&D expense:
Amortization of acquired intangible assets, R&D technology rights (70)(f) (70)(f) (71)(f) (48)(f) —
Stock option expense (49)(d) (46)(d) (83)(d) (104)(d) —
Restructuring and related costs (6)(e) (3)(e) (19)(e) — —
Other merger-related expenses — (1)(l) (29)(l) (23)(l) (12)(l)
“Adjusted” R&D expense $2,739 $2,910 $3,064 $3,191 $2,302
Reconciliation of GAAP R&D Expense to “Adjusted” R&D (Unaudited) ($ in millions)
Reconciliation of GAAP Earnings Per Share to “Adjusted” Earnings Per Share (Unaudited)
Results for the years ended December 31, 2009 2008 2007 2006 2005 2004
GAAP earnings per share (diluted)(a) $4.51 $3.77 $2.74 $2.36 $2.89 $1.81
Adjustments to GAAP earnings per share*:
Amortization of acquired intangible assets,
product technology rights 0.18(b) 0.17(b) 0.16(b) 0.17(b) 0.17(b) 0.16(b)
Incremental non-cash interest expense 0.15(a) 0.13(a) 0.11(a) 0.12(a) 0.04(a) —
Tax settlement (0.09)(c) — (0.08)(c) — — —
Stock option expense 0.08(d) 0.07(d) 0.12(d) 0.14(d) — —
Restructuring and related costs 0.05(e) 0.10(e) 0.51(e) — — —
Amortization of acquired intangible assets,
research and development (R&D) technology rights 0.04(f) 0.04(f) 0.04(f) 0.03(f) — —
Legal settlements, awards, and cost recoveries 0.03(g) 0.21(g) 0.02(g) — 0.02(g) (0.01)(g)
California tax law change (0.02)(h) — — — — —
Tax benefi t resulting from prior period charges (0.02)(i) — — — — —
Write-off of inventory — 0.06(j) 0.08(j) — — —
Write-off of acquired in-process R&D — — 0.53(k) 1.03(k) — 0.42(k)
Other merger-related expenses — — 0.02(l) 0.02(l) 0.01(l) 0.02(l)
Write-off of manufacturing asset — — 0.02(m) — 0.04(m) —
Severance associated with acquisition — — 0.01(n) — — —
Impairment of non-ENBREL related intangible asset — — — 0.03(o) — —
Tax liability related to repatriation of certain foreign earnings — — — — 0.03(p) —
Other — — 0.01 — — —
“Adjusted” earnings per share (diluted) $4.91 $4.55 $4.29 $3.90 $3.20 $2.40
Forward-looking statements: This Annual Report contains forward-looking statements that are based on Amgen management’s current expectations and beliefs and are subject to a number of risks,
uncertainties, and assumptions that could cause actual results to differ materially from those described. All statements, other than statements of historical fact, are statements that could be deemed
forward-looking statements, including estimates of revenues, adjusted earnings per share and other fi nancial metrics, expected political, clinical or regulatory results or practices, the development
of Amgen’s product candidates, including anticipated product approvals, planned international expansion and other such estimates and results. Forward-looking statements involve signifi cant risks
and uncertainties, including those more fully described in the Risk Factors found in the Form 10-K contained within this Annual Report and the most recent periodic reports on Form 10-Q and
Form 8-K fi led by Amgen with the U.S. Securities and Exchange Commission, and actual results may vary materially. Except where otherwise indicated, Amgen is providing this information as of
February 15, 2010, and does not undertake any obligation to update any forward-looking statements contained in this Annual Report as a result of new information, future events, or otherwise.
*
95437_txt.indd 895437_txt.indd 8 3/4/10 11:03 AM3/4/10 11:03 AM
UNITED STATESSECURITIES AND EXCHANGE COMMISSION
Washington D.C. 20549
Form 10-K(Mark One)
È ANNUAL REPORT PURSUANT TO SECTION 13 OR 15(d) OF THESECURITIES EXCHANGE ACT OF 1934
For the fiscal year ended December 31, 2009OR
‘ TRANSITION REPORT PURSUANT TO SECTION 13 OR 15(d) OF THESECURITIES EXCHANGE ACT OF 1934
Commission file number 000-12477
Amgen Inc.(Exact name of registrant as specified in its charter)
Delaware 95-3540776(State or other jurisdiction ofincorporation or organization)
(I.R.S. EmployerIdentification No.)
One Amgen Center Drive,Thousand Oaks, California
91320-1799(Zip Code)
(Address of principal executive offices)
(805) 447-1000(Registrant’s telephone number, including area code)
Securities registered pursuant to Section 12(b) of the Act:Common stock, $0.0001 par value
(Title of class)Indicate by check mark if the registrant is a well-known seasoned issuer, as defined in Rule 405 of the Securities
Act. Yes È No ‘Indicate by check mark if the registrant is not required to file reports pursuant to Section 13 or Section 15(d) of the
Act. Yes ‘ No ÈIndicate by check mark whether the registrant (1) has filed all reports required to be filed by Section 13 or Section 15(d) of the
Securities Exchange Act of 1934 during the preceding 12 months (or for such shorter period that the registrant was required to filesuch reports), and (2) has been subject to such filing requirements for the past 90 days. Yes È No ‘
Indicate by check mark whether the registrant has submitted electronically and posted on its corporate Web site, if any, everyInteractive Data File required to be submitted and posted pursuant to Rule 405 of Regulation S-T (§ 232.405 of this chapter) duringthe preceding 12 months (or for such shorter period that the registrant was required to submit and post such files). Yes È No ‘
Indicate by check mark if disclosure of delinquent filers pursuant to Item 405 of Regulation S-K is not contained herein, andwill not be contained, to the best of registrant’s knowledge, in definitive proxy or information statements incorporated by referencein Part III of this Form 10-K or any amendment to this Form 10-K. ‘
Indicate by check mark whether the registrant is a large accelerated filer, an accelerated filer, a non-accelerated filer, or a small-er reporting company. See definitions of “large accelerated filer,” “accelerated filer” and “smaller reporting company” in Rule 12b-2of the Exchange Act. (Check one):
Large accelerated filer È Accelerated filer ‘ Non-accelerated filer ‘ Smaller reporting company ‘(Do not check if a smaller reporting company)
Indicate by check mark whether the registrant is a shell company (as defined in Rule 12b-2 of the Act) Yes ‘ No ÈThe approximate aggregate market value of voting and non-voting stock held by non-affiliates of the registrant was
$53,667,437,634 as of June 30, 2009(A)
(A) Excludes 1,036,665 shares of common stock held by directors and officers, and any stockholders whose ownership exceeds five percent of theshares outstanding, at June 30, 2009. Exclusion of shares held by any person should not be construed to indicate that such person possesses thepower, directly or indirectly, to direct or cause the direction of the management or policies of the registrant, or that such person is controlled byor under common control with the registrant.
979,301,627(Number of shares of common stock outstanding as of February 12, 2010)
DOCUMENTS INCORPORATED BY REFERENCESpecified portions of the registrant’s Proxy Statement with respect to the 2010 Annual Meeting of stockholders to be held
May 12, 2010 are incorporated by reference into Part III of this annual report.
INDEXPage No.
PART I . . . . . . . . . . . . . . . . . . . . . . . . . . . . . . . . . . . . . . . . . . . . . . . . . . . . . . . . . . . . . . . . . . . . . . . . . . 1
Item 1. BUSINESS . . . . . . . . . . . . . . . . . . . . . . . . . . . . . . . . . . . . . . . . . . . . . . . . . . . . . . . . . . . . 1Overview . . . . . . . . . . . . . . . . . . . . . . . . . . . . . . . . . . . . . . . . . . . . . . . . . . . . . . . . . . . . . 1Key Developments . . . . . . . . . . . . . . . . . . . . . . . . . . . . . . . . . . . . . . . . . . . . . . . . . . . . . . 2Marketed Products and Selected Product Candidates . . . . . . . . . . . . . . . . . . . . . . . . . . . 3Marketing and Distribution . . . . . . . . . . . . . . . . . . . . . . . . . . . . . . . . . . . . . . . . . . . . . . . 16Reimbursement . . . . . . . . . . . . . . . . . . . . . . . . . . . . . . . . . . . . . . . . . . . . . . . . . . . . . . . . 17Manufacturing, Distribution and Raw Materials . . . . . . . . . . . . . . . . . . . . . . . . . . . . . . . 21Business Relationships . . . . . . . . . . . . . . . . . . . . . . . . . . . . . . . . . . . . . . . . . . . . . . . . . . 24Government Regulation . . . . . . . . . . . . . . . . . . . . . . . . . . . . . . . . . . . . . . . . . . . . . . . . . . 26Research and Development and Selected Product Candidates . . . . . . . . . . . . . . . . . . . . 30Human Resources . . . . . . . . . . . . . . . . . . . . . . . . . . . . . . . . . . . . . . . . . . . . . . . . . . . . . . 38Executive Officers of the Registrant . . . . . . . . . . . . . . . . . . . . . . . . . . . . . . . . . . . . . . . . 38Geographic Area Financial Information . . . . . . . . . . . . . . . . . . . . . . . . . . . . . . . . . . . . . 40Investor Information . . . . . . . . . . . . . . . . . . . . . . . . . . . . . . . . . . . . . . . . . . . . . . . . . . . . 40
Item 1A. RISK FACTORS . . . . . . . . . . . . . . . . . . . . . . . . . . . . . . . . . . . . . . . . . . . . . . . . . . . . . . . 40Item 1B. UNRESOLVED STAFF COMMENTS . . . . . . . . . . . . . . . . . . . . . . . . . . . . . . . . . . . . . 56Item 2. PROPERTIES . . . . . . . . . . . . . . . . . . . . . . . . . . . . . . . . . . . . . . . . . . . . . . . . . . . . . . . . . 57Item 3. LEGAL PROCEEDINGS . . . . . . . . . . . . . . . . . . . . . . . . . . . . . . . . . . . . . . . . . . . . . . . . 58Item 4. RESERVED . . . . . . . . . . . . . . . . . . . . . . . . . . . . . . . . . . . . . . . . . . . . . . . . . . . . . . . . . . . 58
PART II . . . . . . . . . . . . . . . . . . . . . . . . . . . . . . . . . . . . . . . . . . . . . . . . . . . . . . . . . . . . . . . . . . . . . . . . . 59
Item 5. MARKET FOR REGISTRANT’S COMMON EQUITY, RELATEDSTOCKHOLDER MATTERS AND ISSUER PURCHASES OF EQUITYSECURITIES . . . . . . . . . . . . . . . . . . . . . . . . . . . . . . . . . . . . . . . . . . . . . . . . . . . . . . . . 59
Item 6. SELECTED FINANCIAL DATA . . . . . . . . . . . . . . . . . . . . . . . . . . . . . . . . . . . . . . . . . . 62Item 7. MANAGEMENT’S DISCUSSION AND ANALYSIS OF FINANCIAL
CONDITION AND RESULTS OF OPERATIONS . . . . . . . . . . . . . . . . . . . . . . . . . . 65Item 7A. QUANTITATIVE AND QUALITATIVE DISCLOSURES ABOUT MARKET
RISK . . . . . . . . . . . . . . . . . . . . . . . . . . . . . . . . . . . . . . . . . . . . . . . . . . . . . . . . . . . . . . 87Item 8. FINANCIAL STATEMENTS AND SUPPLEMENTARY DATA . . . . . . . . . . . . . . . . 89Item 9. CHANGES IN AND DISAGREEMENTS WITH ACCOUNTANTS ON
ACCOUNTING AND FINANCIAL DISCLOSURES . . . . . . . . . . . . . . . . . . . . . . . . 89Item 9A. CONTROLS AND PROCEDURES . . . . . . . . . . . . . . . . . . . . . . . . . . . . . . . . . . . . . . . . 89Item 9B. OTHER INFORMATION . . . . . . . . . . . . . . . . . . . . . . . . . . . . . . . . . . . . . . . . . . . . . . . . 92
PART III . . . . . . . . . . . . . . . . . . . . . . . . . . . . . . . . . . . . . . . . . . . . . . . . . . . . . . . . . . . . . . . . . . . . . . . . . 92
Item 10. DIRECTORS, EXECUTIVE OFFICERS AND CORPORATE GOVERNANCE OFTHE REGISTRANT . . . . . . . . . . . . . . . . . . . . . . . . . . . . . . . . . . . . . . . . . . . . . . . . . . 92
Item 11. EXECUTIVE COMPENSATION . . . . . . . . . . . . . . . . . . . . . . . . . . . . . . . . . . . . . . . . . . 92Item 12. SECURITY OWNERSHIP OF CERTAIN BENEFICIAL OWNERS AND
MANAGEMENT AND RELATED STOCKHOLDER MATTERS . . . . . . . . . . . . . 93Item 13. CERTAIN RELATIONSHIPS AND RELATED TRANSACTIONS AND
DIRECTOR INDEPENDENCE . . . . . . . . . . . . . . . . . . . . . . . . . . . . . . . . . . . . . . . . . 95Item 14. PRINCIPAL ACCOUNTING FEES AND SERVICES . . . . . . . . . . . . . . . . . . . . . . . . . 95
PART IV . . . . . . . . . . . . . . . . . . . . . . . . . . . . . . . . . . . . . . . . . . . . . . . . . . . . . . . . . . . . . . . . . . . . . . . . . 96
Item 15. EXHIBITS AND FINANCIAL STATEMENT SCHEDULES . . . . . . . . . . . . . . . . . . . 96SIGNATURES . . . . . . . . . . . . . . . . . . . . . . . . . . . . . . . . . . . . . . . . . . . . . . . . . . . . . . . . . . . . . . . . . . . . . 103
i
PART I
Item 1. BUSINESS
Overview
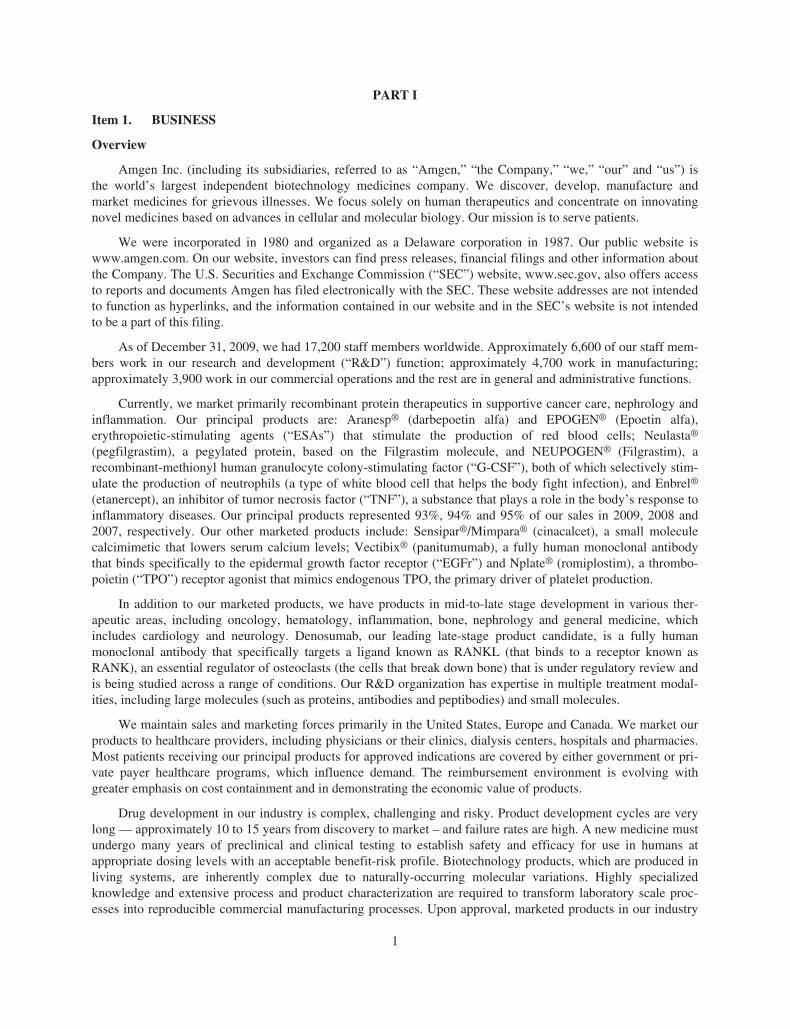
Amgen Inc. (including its subsidiaries, referred to as “Amgen,” “the Company,” “we,” “our” and “us”) isthe world’s largest independent biotechnology medicines company. We discover, develop, manufacture andmarket medicines for grievous illnesses. We focus solely on human therapeutics and concentrate on innovatingnovel medicines based on advances in cellular and molecular biology. Our mission is to serve patients.
We were incorporated in 1980 and organized as a Delaware corporation in 1987. Our public website iswww.amgen.com. On our website, investors can find press releases, financial filings and other information aboutthe Company. The U.S. Securities and Exchange Commission (“SEC”) website, www.sec.gov, also offers accessto reports and documents Amgen has filed electronically with the SEC. These website addresses are not intendedto function as hyperlinks, and the information contained in our website and in the SEC’s website is not intendedto be a part of this filing.
As of December 31, 2009, we had 17,200 staff members worldwide. Approximately 6,600 of our staff mem-bers work in our research and development (“R&D”) function; approximately 4,700 work in manufacturing;approximately 3,900 work in our commercial operations and the rest are in general and administrative functions.
Currently, we market primarily recombinant protein therapeutics in supportive cancer care, nephrology andinflammation. Our principal products are: Aranesp® (darbepoetin alfa) and EPOGEN® (Epoetin alfa),erythropoietic-stimulating agents (“ESAs”) that stimulate the production of red blood cells; Neulasta®
(pegfilgrastim), a pegylated protein, based on the Filgrastim molecule, and NEUPOGEN® (Filgrastim), arecombinant-methionyl human granulocyte colony-stimulating factor (“G-CSF”), both of which selectively stim-ulate the production of neutrophils (a type of white blood cell that helps the body fight infection), and Enbrel®
(etanercept), an inhibitor of tumor necrosis factor (“TNF”), a substance that plays a role in the body’s response toinflammatory diseases. Our principal products represented 93%, 94% and 95% of our sales in 2009, 2008 and2007, respectively. Our other marketed products include: Sensipar®/Mimpara® (cinacalcet), a small moleculecalcimimetic that lowers serum calcium levels; Vectibix® (panitumumab), a fully human monoclonal antibodythat binds specifically to the epidermal growth factor receptor (“EGFr”) and Nplate® (romiplostim), a thrombo-poietin (“TPO”) receptor agonist that mimics endogenous TPO, the primary driver of platelet production.
In addition to our marketed products, we have products in mid-to-late stage development in various ther-apeutic areas, including oncology, hematology, inflammation, bone, nephrology and general medicine, whichincludes cardiology and neurology. Denosumab, our leading late-stage product candidate, is a fully humanmonoclonal antibody that specifically targets a ligand known as RANKL (that binds to a receptor known asRANK), an essential regulator of osteoclasts (the cells that break down bone) that is under regulatory review andis being studied across a range of conditions. Our R&D organization has expertise in multiple treatment modal-ities, including large molecules (such as proteins, antibodies and peptibodies) and small molecules.
We maintain sales and marketing forces primarily in the United States, Europe and Canada. We market ourproducts to healthcare providers, including physicians or their clinics, dialysis centers, hospitals and pharmacies.Most patients receiving our principal products for approved indications are covered by either government or pri-vate payer healthcare programs, which influence demand. The reimbursement environment is evolving withgreater emphasis on cost containment and in demonstrating the economic value of products.
Drug development in our industry is complex, challenging and risky. Product development cycles are verylong — approximately 10 to 15 years from discovery to market – and failure rates are high. A new medicine mustundergo many years of preclinical and clinical testing to establish safety and efficacy for use in humans atappropriate dosing levels with an acceptable benefit-risk profile. Biotechnology products, which are produced inliving systems, are inherently complex due to naturally-occurring molecular variations. Highly specializedknowledge and extensive process and product characterization are required to transform laboratory scale proc-esses into reproducible commercial manufacturing processes. Upon approval, marketed products in our industry
1
generally face substantial competition. Our industry is also highly regulated, and various U.S. and internationalregulatory bodies have substantial authority over how we develop, manufacture and commercialize our productsas well as conduct our business. The regulatory environment is evolving and there is increased scrutiny on drugsafety and increased authority being granted to regulatory bodies, in particular the U.S. Food and Drug Admin-istration (“FDA”), to assist in ensuring safety of therapeutic products, which may lead to fewer products beingapproved by the FDA or other regulatory bodies, delays in receiving approvals or additional safety-related re-quirements or restrictions on the use of our products, including expanded safety labeling, required riskmanagement activities, including a risk evaluation and mitigation strategy (“REMS”), and/or additional or moreextensive clinical trials as part of post-marketing commitments (“PMCs”), post-marketing requirements(“PMRs”) or pharmacovigilance programs.
Key Developments
The following is a list of selected key developments that occurred during 2009 and early 2010 affecting ourbusiness, including regulatory and reimbursement developments associated with certain of our marketed productsand product candidates. A more detailed discussion of each key development follows in the appropriate sections.
Denosumab
• We received Complete Response Letters from the FDA on our biologics license application (“BLA”) forProlia™ in the treatment and prevention of postmenopausal osteoporosis (“PMO”) in women and boneloss in patients undergoing hormone ablation therapy (“HALT”) for either prostate or breast cancer.These Complete Response Letters requested additional information to support approval of the treatmentof the PMO indication and the HALT indication, and requested a new clinical program to support appro-val of the prevention of the PMO indication. (The FDA has provisionally approved the trade nameProlia™ in the indications noted above, for which the drug is administered twice yearly subcutaneously ata 60 milligram (“mg”) dose. The trade name is only for these indications and may not apply for other in-dications of denosumab.)
• On February 19, 2010, we announced that the FDA has evaluated the content of our Complete Responsesubmission for Prolia™ in the treatment of PMO, which we submitted on January 25, 2010, and classifiedit as a Class 2 resubmission. With the Class 2 designation, the FDA set a corresponding Prescription DrugUser Fee Act (“PDUFA”) action date of July 25, 2010.
• We received a positive opinion from the Committee for Medicinal Products for Human Use (“CHMP”) ofthe European Medicines Agency (“EMA”) (formerly known as the EMEA) for marketing authorizationfor the treatment of osteoporosis in postmenopausal women at increased risk of fractures and bone lossassociated with hormone ablation in men with prostate cancer at increased risk of fractures.
• We announced positive results from the following three phase 3 head-to-head trials evaluating denosumabversus Zometa® (zoledronic acid) in the treatment of bone metastases:
O in patients with advanced breast cancer, in which denosumab was superior to Zometa® in delayingthe time to the first skeletal-related event (“SRE”) and delaying the time to the first-and-subsequentSREs,
O in advanced cancer patients with solid tumors or multiple myeloma, in which denosumab wasnon-inferior to Zometa® in delaying the time to the first SRE,
O in men with advanced prostate cancer, in which denosumab was superior to Zometa® in delaying thetime to the first SRE and delaying the time to the first-and-subsequent SREs.
These three studies will form the basis of the clinical evidence package for denosumab in advanced can-cer, which will be submitted to regulatory authorities later in 2010.
2
ESAs
• On February 16, 2010, we announced that the FDA approved a REMS program for our ESAs.
• We published detailed results from the Trial to Reduce Cardiovascular Endpoints with Aranesp® Therapy(“TREAT”) and updated the ESA labels to incorporate certain of the trial results regarding the increasedrisk of stroke and to reinforce the need to follow the approved label guidance to maintain appropriate he-moglobin (“Hb”) levels.
• The FDA announced that it will call an advisory committee meeting in 2010 to re-evaluate the use ofESAs to treat anemia in patients with chronic kidney disease (“CKD”) and could consider lowering tar-geted Hb levels and reducing approved dosing for ESAs.
• The Centers for Medicare & Medicaid Services (“CMS”) has scheduled a Medicare Evidence Develop-ment & Coverage Advisory Committee (“MEDCAC”) meeting on March 24, 2010 to examine currentlyavailable evidence on the use of ESAs to manage anemia in patients who have CKD, which may considerthe results of the TREAT study.
• The CMS released its proposed rule to implement the bundled prospective payment system for end stagerenal disease (“ESRD”), which could impact reimbursement for EPOGEN®.
U.S. healthcare reform
• Healthcare reform, focused on expanding healthcare coverage to millions of uninsured Americans and re-ducing the rate of increase in the costs of healthcare, remains a priority for President Obama, U.S.Congress and a number of states. Developments in this area have been highly dynamic and difficult topredict. As recently as February 23, 2010, President Obama released a new proposal for healthcare reformwhich includes a combination of provisions from both the Senate and House of Representatives billspassed in late 2009. Certain healthcare reform proposals being considered, which may or may not beadopted into law, could:
O restrict the coverage and reimbursement of our products by Medicare, Medicaid and other govern-ment programs;
O reduce the number of years of data exclusivity for innovative biological products potentially leadingto earlier biosimilar competition; and/or
O require additional healthcare reform costs be borne by pharmaceutical and biotechnology companies.
At this time, we cannot predict which or whether any reform measures will be adopted into law.
Other pipeline developments
• We announced detailed results from two key phase 3 trials evaluating Vectibix® as a first- and second-line treatment in patients with KRAS wild-type metastatic colorectal cancer (“mCRC”).
• We announced plans to initiate a phase 3 trial for AMG 386 in ovarian cancer.
Marketed Products and Selected Product Candidates
We market our principal products, Aranesp®, EPOGEN®, Neulasta®, NEUPOGEN® and ENBREL, in theareas of supportive cancer care, nephrology and inflammation. Our products’ competitive position among otherbiologic and pharmaceutical products may be based on, among other things, patent position, product efficacy,safety, reliability, availability, patient convenience/delivery devices, price and reimbursement. Certain of ourmarketed products face, and our product candidates, if approved, are also expected to face, substantial competi-tion from products marketed by large pharmaceutical corporations, which may have greater clinical, research,regulatory, manufacturing, marketing, financial and human resources than we do. In addition, the introduction ofnew products or the development of new processes or technologies by competitors or new information about ex-isting products may result in increased competition for our marketed products, even for those protected by
3
patents, or a reduction in the price we receive from selling our products. For example, we are facing increasingcompetition from biosimilars in the European Union (“EU”), which has an established regulatory pathway forbiosimilars. In addition, lawmakers in the United States have proposed bills to create a regulatory pathway forthe abbreviated approval of biosimilars and several companies have recently announced plans to pursuedevelopment of biosimilars in the United States. Further, the development of new treatment options or standardsof care may require less use of our products, particularly in supportive cancer care, or limit the utility andapplication of ongoing clinical trials for our product candidates.
In addition to challenges presented by competition, our existing products and product candidates are alsosubject to increasing regulatory compliance requirements which can be imposed as a condition of approval or af-ter a product has been approved. This is increasingly true of new therapies with novel mechanisms of action.While these therapies may offer important benefits and/or better treatment alternatives, they may also involve arelatively new or higher level of scientific complexity and, therefore, generate increased safety concerns. For ex-ample, as a condition of approval or due to safety concerns after the product has been approved, we may berequired to perform additional clinical trials or studies, such as observational epidemiological studies. Such trialsor studies are called PMCs or PMRs. We currently have PMCs or PMRs for some of our marketed products. Inaddition, we may be required to implement a REMS for a product to ensure that the benefits of the drug outweighthe risks. This requirement, too, may be imposed as a condition of approval or after a product has been on themarket. A REMS may include a medication guide or a patient package insert, a healthcare provider communica-tion plan or other elements the FDA deems are necessary to assure safe use of the product. While the elements ofa REMS may vary, all REMS are required to have a timetable for assessments.
ESAs
Aranesp® is our registered trademark for one of our ESAs, a protein that stimulates red blood cell pro-duction. Red blood cells transport oxygen to all cells of the body. Without adequate amounts of erythropoietin,the red blood cell count is reduced. A deficient red blood cell count can result in anemia, a condition where in-sufficient oxygen is delivered to the body’s organs and tissues. Anemia can be associated with chronic renalfailure (“CRF”), both in patients on dialysis and not on dialysis. Anemia can also result from chemotherapytreatments for patients with non-myeloid malignancies.
EPOGEN® is our other ESA and is our registered trademark for our recombinant human erythropoietin prod-uct, a protein that stimulates red blood cell production. A reduced red blood cell count can result in anemia (see“— Aranesp® (darbepoetin alfa)”). Individuals with CRF suffer from anemia because they do not produce suffi-cient amounts of erythropoietin, which is normally produced in healthy kidneys.
Our ESA products have and will continue to face challenges. For example, based on adverse safety resultsobserved beginning in late 2006 in various ESA studies, performed by us and others, that explored the use ofESAs in settings different from those outlined in the FDA approved label, the product labeling of our ESA prod-ucts has been updated several times to reflect these safety concerns in the United States and the EU, including,most recently, label updates in the United States in August 2008 and in December 2009 to reflect certain resultsof our TREAT study, as discussed below. In addition, due in part to certain of these developments, reimburse-ment of our ESA products in the United States was also revised resulting in changes in the way ESAs are used inclinical practice, including by decreasing the number of treated patients, average dose and duration of ESA ther-apy. Certain of these developments have had a material adverse impact on sales of our ESA products, inparticular Aranesp® sales in the U.S. supportive cancer care setting.
Further, we believe that certain of the following recent and pending developments could have a material ad-verse impact on the future sales of Aranesp® and EPOGEN®:
• On February 16, 2010, Amgen and Centocor Ortho Biotech Products, L.P. (“Centocor Ortho BiotechProducts”), a subsidiary of Johnson & Johnson (“J&J”), announced that the FDA approved a REMS forESAs which includes Aranesp®, EPOGEN® and Procrit® (Epoetin alfa). The FDA has determined that aREMS is necessary for ESAs to ensure the benefits of these drugs outweigh the risks of shortened overallsurvival (“OS”) and/or increased tumor progression or recurrence as identified in clinical studies in
4
patients with breast, non-small cell lung, head and neck, lymphoid and cervical cancers. As part of theREMS, a medication guide explaining the risks and benefits of ESAs must be provided to all patients re-ceiving ESAs. To ensure continued access to ESAs for healthcare providers who prescribe, or prescribeand dispense, ESAs to patients with cancer, providers are required to train and enroll in the ESA AP-PRISE (Assisting Providers and cancer Patients with Risk Information for the Safe use of ESAs)Oncology Program and to document that a discussion about the risks of ESAs took place with each pa-tient prior to the initiation of each new course of ESA therapy. The ESA APPRISE Oncology Programwill be launched on March 24, 2010. Direct patient registration or approval prior to ESA administration isnot required through the ESA APPRISE Oncology Program.
• On December 16, 2009, after consultation with the FDA, Amgen and Centocor Ortho Biotech Productsupdated the safety information in the ESA product labeling to reflect certain results of our TREAT study.These changes include a revision to the BOXED WARNINGS section to include the increased risk ofstroke and to reinforce the need to follow the approved label guidance to maintain Hb levels within therange of 10 to 12 grams per deciliter (“g/dL”). (See discussion of Aranesp® TREAT study results in“Research and Development and Selected Product Candidates.”)
• The FDA has announced that it will call an advisory committee meeting in 2010 to re-evaluate the use ofESAs to treat anemia in patients with CKD and could consider lowering targeted Hb levels and reducingapproved dosing for ESAs.
• The CMS has scheduled a MEDCAC meeting for March 24, 2010 to examine currently available evi-dence on the use of ESAs to manage anemia in patients who have CKD, which may consider the resultsof the TREAT study. In February 2010, the CMS released the voting questions the MEDCAC will ad-dress, including whether the available evidence in both CKD not on dialysis and ESRD clearly (i)demonstrates benefits and risks of ESA therapy, (ii) supports a baseline Hb range or (iii) justifies a doseresponse or maximum dose. The CMS will decide whether more evidence is needed to determine whetherESA treatment is reasonable and necessary to support continued Medicare coverage. (See“Reimbursement.”)
• On September 15, 2009, the CMS released its proposed rule to implement a bundled prospective paymentsystem for ESRD, which becomes effective in 2011 and could impact EPOGEN®. (See“Reimbursement.”)
• We are working with the FDA to make ESA product package insert changes associated with the Phys-ician’s Labeling Rule (“PLR”) conversion process. During the process of converting from the existingformat to the new PLR format, the FDA may evaluate the package insert information to ensure that it ac-curately reflects current knowledge and may revise, add to or remove information appearing in the oldformat that could substantively impact the content of the product package insert.
In addition to the above, following the Oncologic Drugs Advisory Committee (“ODAC”) meeting in May2004, we proposed a pharmacovigilance program for Aranesp® comprised of five studies to explore the use ofESAs in settings different from those outlined in the FDA approved label. These studies were subsequently des-ignated by the FDA as PMCs. Of the five studies, one was sponsored by Amgen while the remaining four wereinvestigator-sponsored. Results of certain of these studies contributed to safety-related product labeling changesfor our ESA products and changes in reimbursement, as noted above. Of the five studies, three are completewhile final results of the other two are expected in 2010 or 2011. In addition, Johnson and Johnson Pharmaceut-ical Research & Development (“J&JPRD”), a subsidiary of J&J, and/or its investigators have conductednumerous studies proposed at the 2004 ODAC meeting. All of these studies are closed to enrollment and sum-mary results were submitted to the FDA. In addition, J&JPRD’s EPO-ANE-3010 study in breast cancer isongoing and is designated as a FDA PMC.
Based on our ongoing discussions with the FDA in response to the May 2007 ODAC meeting, we andJ&JPRD have carefully considered potential new study designs to determine the effects of ESAs on survival andtumor outcomes in anemic patients with metastatic cancer receiving concomitant myelosuppressive chemo-therapy. Based on these discussions, we have initiated a randomized, double-blind, placebo-controlled, phase 3
5
non-inferiority study evaluating OS when comparing advanced non-small cell lung cancer (“NSCLC”) patientson Aranesp® to patients receiving placebo (“Study 782”) as part of our Aranesp® pharmacovigilance program.Adverse events or results of any of these studies could further affect product safety labeling, healthcare providerprescribing behavior, regulatory or private healthcare organization medical guidelines and/or reimbursementpractices related to Aranesp®.
Aranesp® (darbepoetin alfa)
We were granted an exclusive license by Kirin-Amgen, Inc. (“KA”), a joint venture between Kirin HoldingsCompany, Limited (“Kirin”) and Amgen (see “Business Relationships — Kirin Holdings Company, Limited”), tomanufacture and market Aranesp® in the United States, all European countries, Canada, Australia, New Zealand,Mexico, all Central and South American countries and certain countries in Central Asia, Africa and the MiddleEast.
We market Aranesp® primarily in the United States and Europe. Aranesp® was initially launched in 2001 inthe United States and Europe for the treatment of anemia associated with CRF (both in patients on dialysis andpatients not on dialysis) and is also indicated for the treatment of anemia due to concomitant chemotherapy in pa-tients with non-myeloid malignancies.
Worldwide Aranesp® sales for the years ended December 31, 2009, 2008 and 2007 were $2.65 billion,$3.14 billion and $3.61 billion, respectively. For the years ended December 31, 2009, 2008 and 2007, U.S. Ara-nesp® sales were $1.25 billion, $1.65 billion and $2.15 billion, respectively and international Aranesp® saleswere $1.40 billion, $1.49 billion and $1.46 billion, respectively.
Our outstanding material patents for darbepoetin alfa are described in the table below.
Territory General Subject Matter Expiration
U.S. Glycosylation analogs of erythropoietin proteins 5/15/2024Europe(1) Glycosylation analogs of erythropoietin proteins 10/12/2010Europe(1) Glycosylation analogs of erythropoietin proteins 8/16/2014
(1) In some cases, these European patents may also be entitled to supplemental protection in one or more coun-tries in Europe and the length of any such extension will vary by country.
Our principal European patent relating to Epoetin alfa expired on December 12, 2004. Although we do notmarket EPOGEN® in Europe, upon expiration of this patent, some companies have received approval to marketbiosimilars or other products that compete with Aranesp® in Europe, presenting additional competition, as furtherdiscussed below.
6
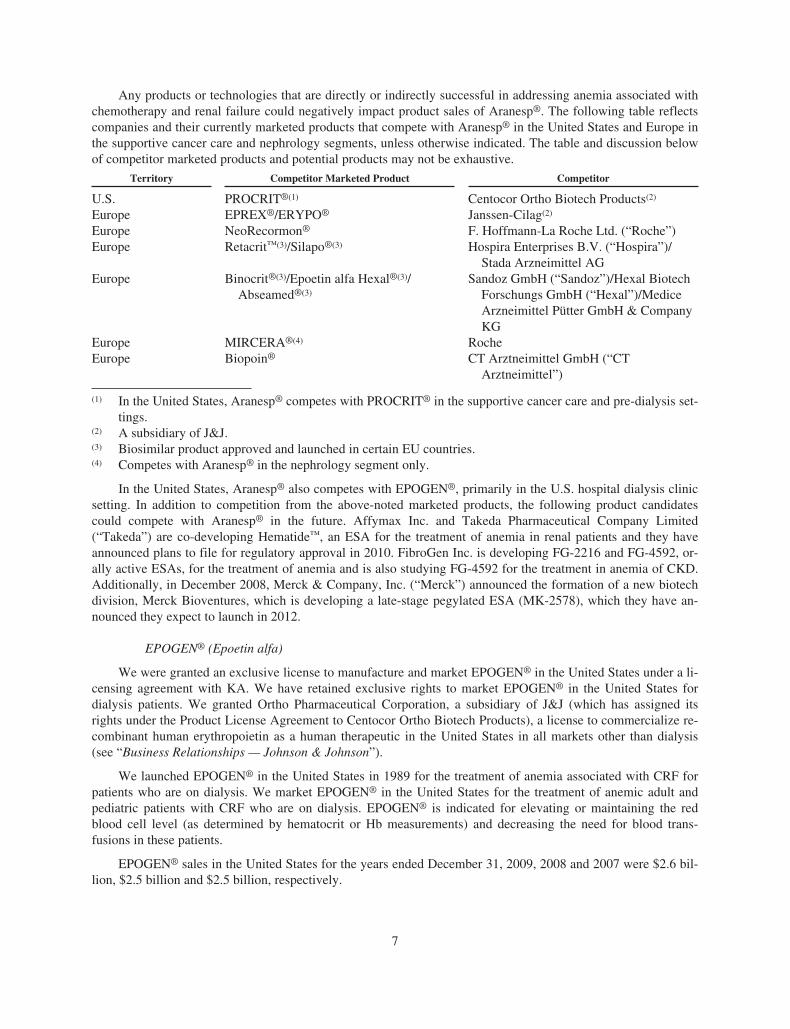
Any products or technologies that are directly or indirectly successful in addressing anemia associated withchemotherapy and renal failure could negatively impact product sales of Aranesp®. The following table reflectscompanies and their currently marketed products that compete with Aranesp® in the United States and Europe inthe supportive cancer care and nephrology segments, unless otherwise indicated. The table and discussion belowof competitor marketed products and potential products may not be exhaustive.
Territory Competitor Marketed Product Competitor
U.S. PROCRIT®(1) Centocor Ortho Biotech Products(2)
Europe EPREX®/ERYPO® Janssen-Cilag(2)
Europe NeoRecormon® F. Hoffmann-La Roche Ltd. (“Roche”)Europe Retacrit™(3)/Silapo®(3) Hospira Enterprises B.V. (“Hospira”)/
Stada Arzneimittel AGEurope Binocrit®(3)/Epoetin alfa Hexal®(3)/
Abseamed®(3)
Sandoz GmbH (“Sandoz”)/Hexal BiotechForschungs GmbH (“Hexal”)/MediceArzneimittel Pütter GmbH & CompanyKG
Europe MIRCERA®(4) RocheEurope Biopoin® CT Arztneimittel GmbH (“CT
Arztneimittel”)
(1) In the United States, Aranesp® competes with PROCRIT® in the supportive cancer care and pre-dialysis set-tings.
(2) A subsidiary of J&J.(3) Biosimilar product approved and launched in certain EU countries.(4) Competes with Aranesp® in the nephrology segment only.
In the United States, Aranesp® also competes with EPOGEN®, primarily in the U.S. hospital dialysis clinicsetting. In addition to competition from the above-noted marketed products, the following product candidatescould compete with Aranesp® in the future. Affymax Inc. and Takeda Pharmaceutical Company Limited(“Takeda”) are co-developing Hematide™, an ESA for the treatment of anemia in renal patients and they haveannounced plans to file for regulatory approval in 2010. FibroGen Inc. is developing FG-2216 and FG-4592, or-ally active ESAs, for the treatment of anemia and is also studying FG-4592 for the treatment in anemia of CKD.Additionally, in December 2008, Merck & Company, Inc. (“Merck”) announced the formation of a new biotechdivision, Merck Bioventures, which is developing a late-stage pegylated ESA (MK-2578), which they have an-nounced they expect to launch in 2012.
EPOGEN® (Epoetin alfa)
We were granted an exclusive license to manufacture and market EPOGEN® in the United States under a li-censing agreement with KA. We have retained exclusive rights to market EPOGEN® in the United States fordialysis patients. We granted Ortho Pharmaceutical Corporation, a subsidiary of J&J (which has assigned itsrights under the Product License Agreement to Centocor Ortho Biotech Products), a license to commercialize re-combinant human erythropoietin as a human therapeutic in the United States in all markets other than dialysis(see “Business Relationships — Johnson & Johnson”).
We launched EPOGEN® in the United States in 1989 for the treatment of anemia associated with CRF forpatients who are on dialysis. We market EPOGEN® in the United States for the treatment of anemic adult andpediatric patients with CRF who are on dialysis. EPOGEN® is indicated for elevating or maintaining the redblood cell level (as determined by hematocrit or Hb measurements) and decreasing the need for blood trans-fusions in these patients.
EPOGEN® sales in the United States for the years ended December 31, 2009, 2008 and 2007 were $2.6 bil-lion, $2.5 billion and $2.5 billion, respectively.
7
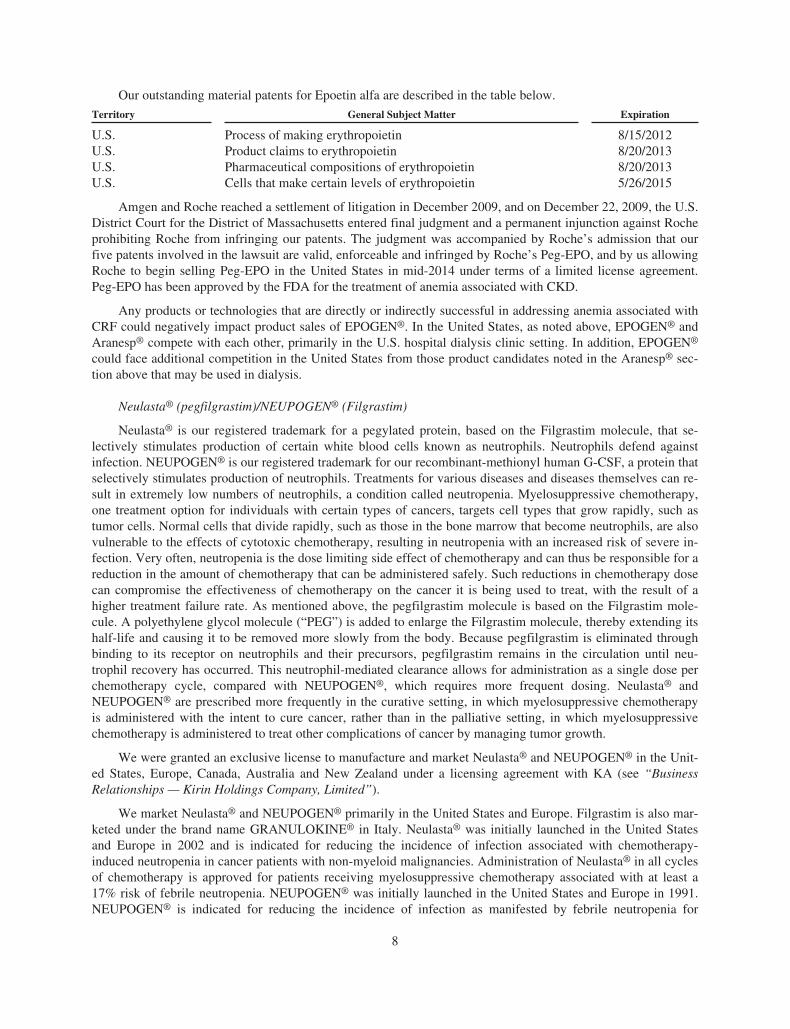
Our outstanding material patents for Epoetin alfa are described in the table below.
Territory General Subject Matter Expiration
U.S. Process of making erythropoietin 8/15/2012U.S. Product claims to erythropoietin 8/20/2013U.S. Pharmaceutical compositions of erythropoietin 8/20/2013U.S. Cells that make certain levels of erythropoietin 5/26/2015
Amgen and Roche reached a settlement of litigation in December 2009, and on December 22, 2009, the U.S.District Court for the District of Massachusetts entered final judgment and a permanent injunction against Rocheprohibiting Roche from infringing our patents. The judgment was accompanied by Roche’s admission that ourfive patents involved in the lawsuit are valid, enforceable and infringed by Roche’s Peg-EPO, and by us allowingRoche to begin selling Peg-EPO in the United States in mid-2014 under terms of a limited license agreement.Peg-EPO has been approved by the FDA for the treatment of anemia associated with CKD.
Any products or technologies that are directly or indirectly successful in addressing anemia associated withCRF could negatively impact product sales of EPOGEN®. In the United States, as noted above, EPOGEN® andAranesp® compete with each other, primarily in the U.S. hospital dialysis clinic setting. In addition, EPOGEN®
could face additional competition in the United States from those product candidates noted in the Aranesp® sec-tion above that may be used in dialysis.
Neulasta® (pegfilgrastim)/NEUPOGEN® (Filgrastim)
Neulasta® is our registered trademark for a pegylated protein, based on the Filgrastim molecule, that se-lectively stimulates production of certain white blood cells known as neutrophils. Neutrophils defend againstinfection. NEUPOGEN® is our registered trademark for our recombinant-methionyl human G-CSF, a protein thatselectively stimulates production of neutrophils. Treatments for various diseases and diseases themselves can re-sult in extremely low numbers of neutrophils, a condition called neutropenia. Myelosuppressive chemotherapy,one treatment option for individuals with certain types of cancers, targets cell types that grow rapidly, such astumor cells. Normal cells that divide rapidly, such as those in the bone marrow that become neutrophils, are alsovulnerable to the effects of cytotoxic chemotherapy, resulting in neutropenia with an increased risk of severe in-fection. Very often, neutropenia is the dose limiting side effect of chemotherapy and can thus be responsible for areduction in the amount of chemotherapy that can be administered safely. Such reductions in chemotherapy dosecan compromise the effectiveness of chemotherapy on the cancer it is being used to treat, with the result of ahigher treatment failure rate. As mentioned above, the pegfilgrastim molecule is based on the Filgrastim mole-cule. A polyethylene glycol molecule (“PEG”) is added to enlarge the Filgrastim molecule, thereby extending itshalf-life and causing it to be removed more slowly from the body. Because pegfilgrastim is eliminated throughbinding to its receptor on neutrophils and their precursors, pegfilgrastim remains in the circulation until neu-trophil recovery has occurred. This neutrophil-mediated clearance allows for administration as a single dose perchemotherapy cycle, compared with NEUPOGEN®, which requires more frequent dosing. Neulasta® andNEUPOGEN® are prescribed more frequently in the curative setting, in which myelosuppressive chemotherapyis administered with the intent to cure cancer, rather than in the palliative setting, in which myelosuppressivechemotherapy is administered to treat other complications of cancer by managing tumor growth.
We were granted an exclusive license to manufacture and market Neulasta® and NEUPOGEN® in the Unit-ed States, Europe, Canada, Australia and New Zealand under a licensing agreement with KA (see “BusinessRelationships — Kirin Holdings Company, Limited”).
We market Neulasta® and NEUPOGEN® primarily in the United States and Europe. Filgrastim is also mar-keted under the brand name GRANULOKINE® in Italy. Neulasta® was initially launched in the United Statesand Europe in 2002 and is indicated for reducing the incidence of infection associated with chemotherapy-induced neutropenia in cancer patients with non-myeloid malignancies. Administration of Neulasta® in all cyclesof chemotherapy is approved for patients receiving myelosuppressive chemotherapy associated with at least a17% risk of febrile neutropenia. NEUPOGEN® was initially launched in the United States and Europe in 1991.NEUPOGEN® is indicated for reducing the incidence of infection as manifested by febrile neutropenia for
8
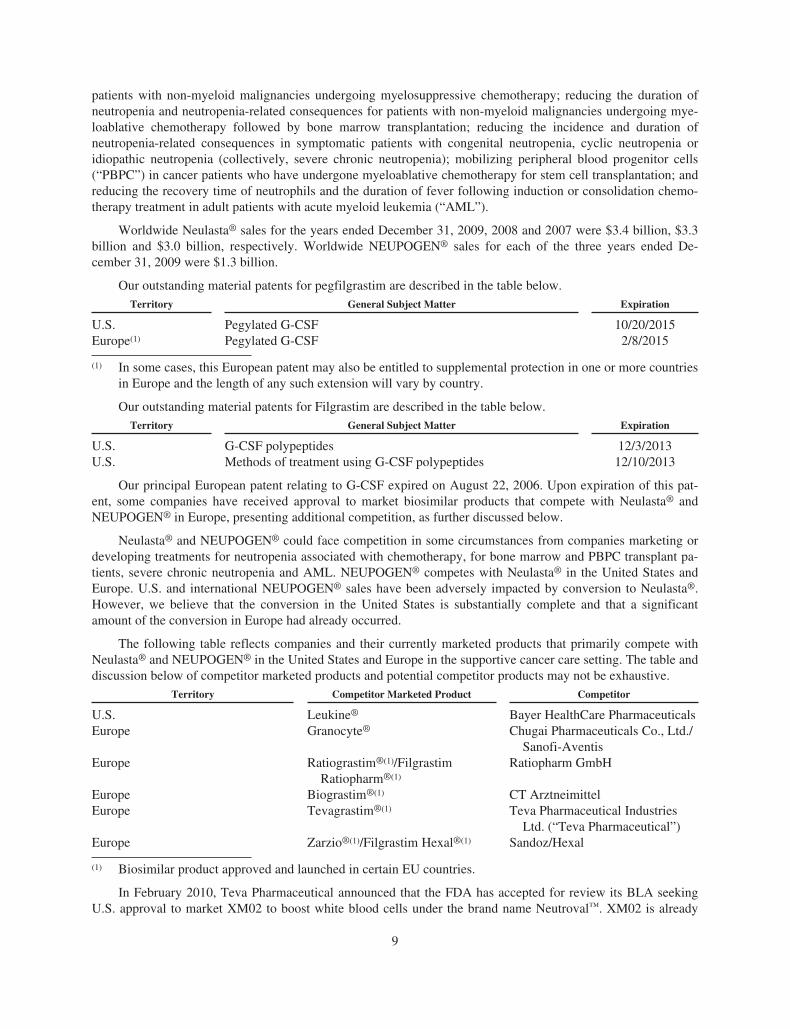
patients with non-myeloid malignancies undergoing myelosuppressive chemotherapy; reducing the duration ofneutropenia and neutropenia-related consequences for patients with non-myeloid malignancies undergoing mye-loablative chemotherapy followed by bone marrow transplantation; reducing the incidence and duration ofneutropenia-related consequences in symptomatic patients with congenital neutropenia, cyclic neutropenia oridiopathic neutropenia (collectively, severe chronic neutropenia); mobilizing peripheral blood progenitor cells(“PBPC”) in cancer patients who have undergone myeloablative chemotherapy for stem cell transplantation; andreducing the recovery time of neutrophils and the duration of fever following induction or consolidation chemo-therapy treatment in adult patients with acute myeloid leukemia (“AML”).
Worldwide Neulasta® sales for the years ended December 31, 2009, 2008 and 2007 were $3.4 billion, $3.3billion and $3.0 billion, respectively. Worldwide NEUPOGEN® sales for each of the three years ended De-cember 31, 2009 were $1.3 billion.
Our outstanding material patents for pegfilgrastim are described in the table below.Territory General Subject Matter Expiration
U.S. Pegylated G-CSF 10/20/2015Europe(1) Pegylated G-CSF 2/8/2015
(1) In some cases, this European patent may also be entitled to supplemental protection in one or more countriesin Europe and the length of any such extension will vary by country.
Our outstanding material patents for Filgrastim are described in the table below.Territory General Subject Matter Expiration
U.S. G-CSF polypeptides 12/3/2013U.S. Methods of treatment using G-CSF polypeptides 12/10/2013
Our principal European patent relating to G-CSF expired on August 22, 2006. Upon expiration of this pat-ent, some companies have received approval to market biosimilar products that compete with Neulasta® andNEUPOGEN® in Europe, presenting additional competition, as further discussed below.
Neulasta® and NEUPOGEN® could face competition in some circumstances from companies marketing ordeveloping treatments for neutropenia associated with chemotherapy, for bone marrow and PBPC transplant pa-tients, severe chronic neutropenia and AML. NEUPOGEN® competes with Neulasta® in the United States andEurope. U.S. and international NEUPOGEN® sales have been adversely impacted by conversion to Neulasta®.However, we believe that the conversion in the United States is substantially complete and that a significantamount of the conversion in Europe had already occurred.
The following table reflects companies and their currently marketed products that primarily compete withNeulasta® and NEUPOGEN® in the United States and Europe in the supportive cancer care setting. The table anddiscussion below of competitor marketed products and potential competitor products may not be exhaustive.
Territory Competitor Marketed Product Competitor
U.S. Leukine® Bayer HealthCare PharmaceuticalsEurope Granocyte® Chugai Pharmaceuticals Co., Ltd./
Sanofi-AventisEurope Ratiograstim®(1)/Filgrastim
Ratiopharm®(1)
Ratiopharm GmbH
Europe Biograstim®(1) CT ArztneimittelEurope Tevagrastim®(1) Teva Pharmaceutical Industries
Ltd. (“Teva Pharmaceutical”)Europe Zarzio®(1)/Filgrastim Hexal®(1) Sandoz/Hexal
(1) Biosimilar product approved and launched in certain EU countries.
In February 2010, Teva Pharmaceutical announced that the FDA has accepted for review its BLA seekingU.S. approval to market XM02 to boost white blood cells under the brand name Neutroval™. XM02 is already
9
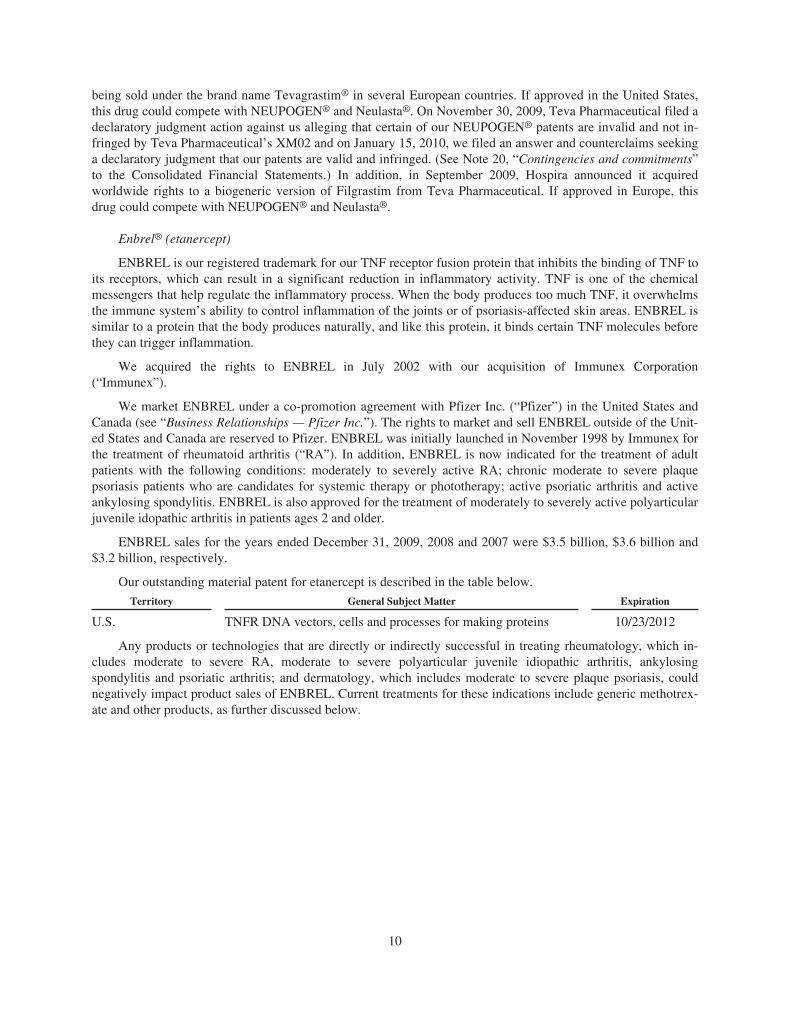
being sold under the brand name Tevagrastim® in several European countries. If approved in the United States,this drug could compete with NEUPOGEN® and Neulasta®. On November 30, 2009, Teva Pharmaceutical filed adeclaratory judgment action against us alleging that certain of our NEUPOGEN® patents are invalid and not in-fringed by Teva Pharmaceutical’s XM02 and on January 15, 2010, we filed an answer and counterclaims seekinga declaratory judgment that our patents are valid and infringed. (See Note 20, “Contingencies and commitments”to the Consolidated Financial Statements.) In addition, in September 2009, Hospira announced it acquiredworldwide rights to a biogeneric version of Filgrastim from Teva Pharmaceutical. If approved in Europe, thisdrug could compete with NEUPOGEN® and Neulasta®.
Enbrel® (etanercept)
ENBREL is our registered trademark for our TNF receptor fusion protein that inhibits the binding of TNF toits receptors, which can result in a significant reduction in inflammatory activity. TNF is one of the chemicalmessengers that help regulate the inflammatory process. When the body produces too much TNF, it overwhelmsthe immune system’s ability to control inflammation of the joints or of psoriasis-affected skin areas. ENBREL issimilar to a protein that the body produces naturally, and like this protein, it binds certain TNF molecules beforethey can trigger inflammation.
We acquired the rights to ENBREL in July 2002 with our acquisition of Immunex Corporation(“Immunex”).
We market ENBREL under a co-promotion agreement with Pfizer Inc. (“Pfizer”) in the United States andCanada (see “Business Relationships — Pfizer Inc.”). The rights to market and sell ENBREL outside of the Unit-ed States and Canada are reserved to Pfizer. ENBREL was initially launched in November 1998 by Immunex forthe treatment of rheumatoid arthritis (“RA”). In addition, ENBREL is now indicated for the treatment of adultpatients with the following conditions: moderately to severely active RA; chronic moderate to severe plaquepsoriasis patients who are candidates for systemic therapy or phototherapy; active psoriatic arthritis and activeankylosing spondylitis. ENBREL is also approved for the treatment of moderately to severely active polyarticularjuvenile idopathic arthritis in patients ages 2 and older.
ENBREL sales for the years ended December 31, 2009, 2008 and 2007 were $3.5 billion, $3.6 billion and$3.2 billion, respectively.
Our outstanding material patent for etanercept is described in the table below.
Territory General Subject Matter Expiration
U.S. TNFR DNA vectors, cells and processes for making proteins 10/23/2012
Any products or technologies that are directly or indirectly successful in treating rheumatology, which in-cludes moderate to severe RA, moderate to severe polyarticular juvenile idiopathic arthritis, ankylosingspondylitis and psoriatic arthritis; and dermatology, which includes moderate to severe plaque psoriasis, couldnegatively impact product sales of ENBREL. Current treatments for these indications include generic methotrex-ate and other products, as further discussed below.
10
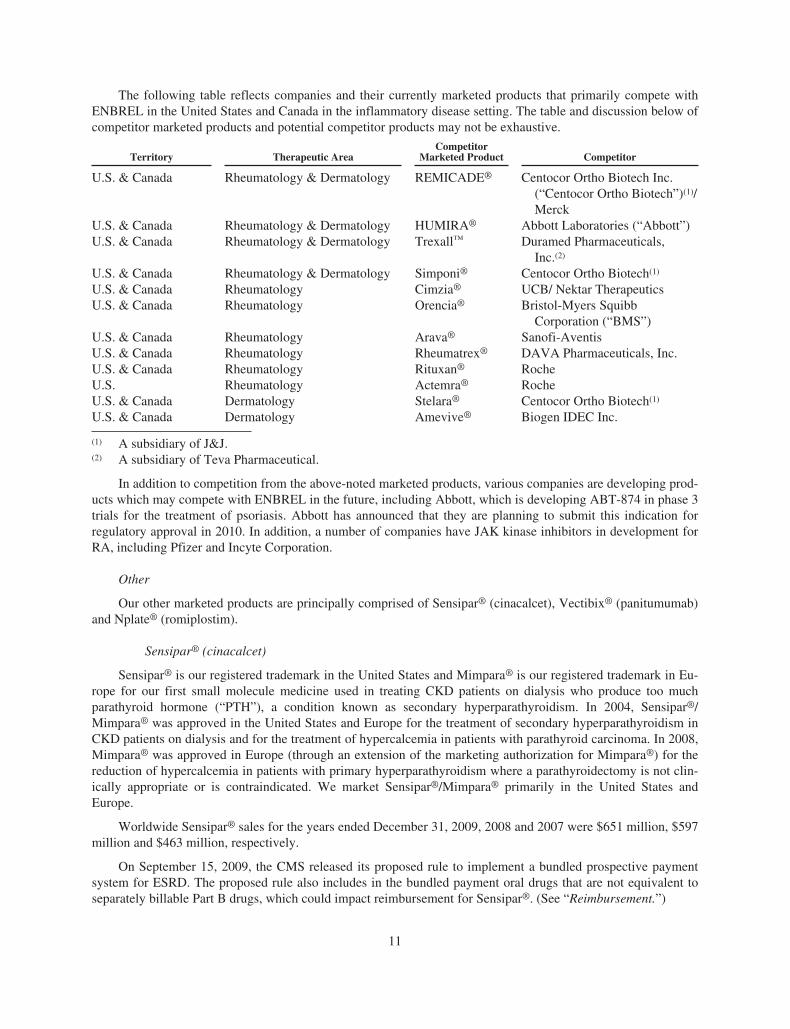
The following table reflects companies and their currently marketed products that primarily compete withENBREL in the United States and Canada in the inflammatory disease setting. The table and discussion below ofcompetitor marketed products and potential competitor products may not be exhaustive.
Territory Therapeutic AreaCompetitor
Marketed Product Competitor
U.S. & Canada Rheumatology & Dermatology REMICADE® Centocor Ortho Biotech Inc.(“Centocor Ortho Biotech”)(1)/Merck
U.S. & Canada Rheumatology & Dermatology HUMIRA® Abbott Laboratories (“Abbott”)U.S. & Canada Rheumatology & Dermatology Trexall™ Duramed Pharmaceuticals,
Inc.(2)
U.S. & Canada Rheumatology & Dermatology Simponi® Centocor Ortho Biotech(1)
U.S. & Canada Rheumatology Cimzia® UCB/ Nektar TherapeuticsU.S. & Canada Rheumatology Orencia® Bristol-Myers Squibb
Corporation (“BMS”)U.S. & Canada Rheumatology Arava® Sanofi-AventisU.S. & Canada Rheumatology Rheumatrex® DAVA Pharmaceuticals, Inc.U.S. & Canada Rheumatology Rituxan® RocheU.S. Rheumatology Actemra® RocheU.S. & Canada Dermatology Stelara® Centocor Ortho Biotech(1)
U.S. & Canada Dermatology Amevive® Biogen IDEC Inc.
(1) A subsidiary of J&J.(2) A subsidiary of Teva Pharmaceutical.
In addition to competition from the above-noted marketed products, various companies are developing prod-ucts which may compete with ENBREL in the future, including Abbott, which is developing ABT-874 in phase 3trials for the treatment of psoriasis. Abbott has announced that they are planning to submit this indication forregulatory approval in 2010. In addition, a number of companies have JAK kinase inhibitors in development forRA, including Pfizer and Incyte Corporation.
Other
Our other marketed products are principally comprised of Sensipar® (cinacalcet), Vectibix® (panitumumab)and Nplate® (romiplostim).
Sensipar® (cinacalcet)
Sensipar® is our registered trademark in the United States and Mimpara® is our registered trademark in Eu-rope for our first small molecule medicine used in treating CKD patients on dialysis who produce too muchparathyroid hormone (“PTH”), a condition known as secondary hyperparathyroidism. In 2004, Sensipar®/Mimpara® was approved in the United States and Europe for the treatment of secondary hyperparathyroidism inCKD patients on dialysis and for the treatment of hypercalcemia in patients with parathyroid carcinoma. In 2008,Mimpara® was approved in Europe (through an extension of the marketing authorization for Mimpara®) for thereduction of hypercalcemia in patients with primary hyperparathyroidism where a parathyroidectomy is not clin-ically appropriate or is contraindicated. We market Sensipar®/Mimpara® primarily in the United States andEurope.
Worldwide Sensipar® sales for the years ended December 31, 2009, 2008 and 2007 were $651 million, $597million and $463 million, respectively.
On September 15, 2009, the CMS released its proposed rule to implement a bundled prospective paymentsystem for ESRD. The proposed rule also includes in the bundled payment oral drugs that are not equivalent toseparately billable Part B drugs, which could impact reimbursement for Sensipar®. (See “Reimbursement.”)
11
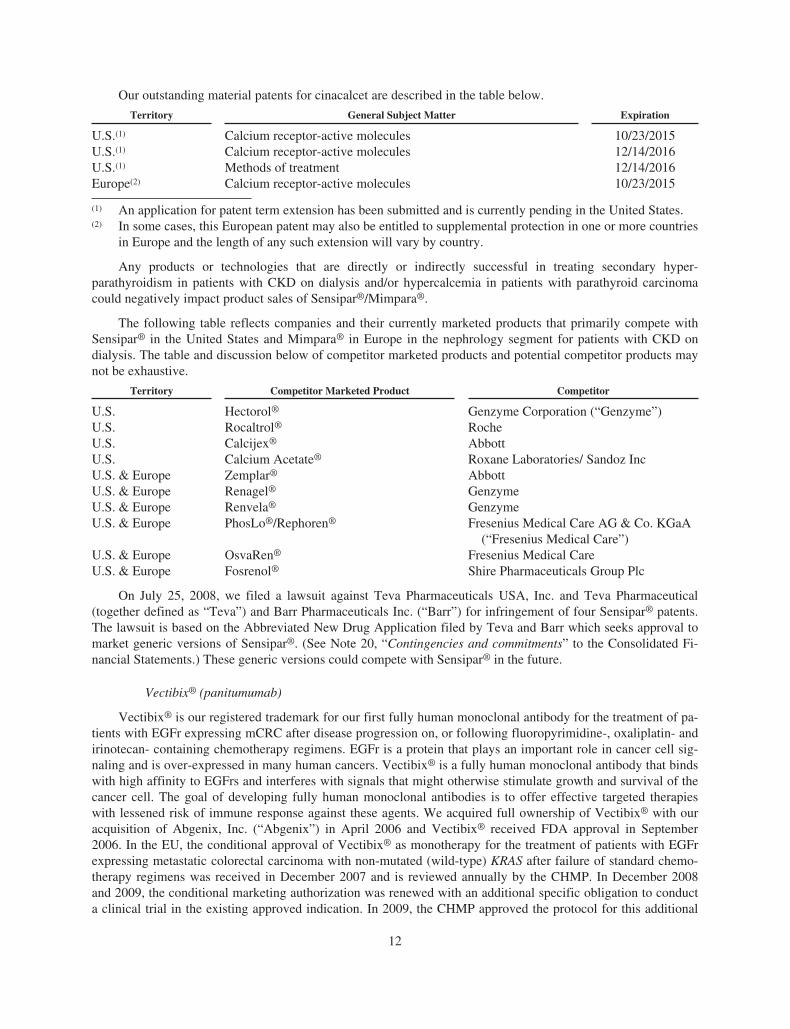
Our outstanding material patents for cinacalcet are described in the table below.
Territory General Subject Matter Expiration
U.S.(1) Calcium receptor-active molecules 10/23/2015U.S.(1) Calcium receptor-active molecules 12/14/2016U.S.(1) Methods of treatment 12/14/2016Europe(2) Calcium receptor-active molecules 10/23/2015
(1) An application for patent term extension has been submitted and is currently pending in the United States.(2) In some cases, this European patent may also be entitled to supplemental protection in one or more countries
in Europe and the length of any such extension will vary by country.
Any products or technologies that are directly or indirectly successful in treating secondary hyper-parathyroidism in patients with CKD on dialysis and/or hypercalcemia in patients with parathyroid carcinomacould negatively impact product sales of Sensipar®/Mimpara®.
The following table reflects companies and their currently marketed products that primarily compete withSensipar® in the United States and Mimpara® in Europe in the nephrology segment for patients with CKD ondialysis. The table and discussion below of competitor marketed products and potential competitor products maynot be exhaustive.
Territory Competitor Marketed Product Competitor
U.S. Hectorol® Genzyme Corporation (“Genzyme”)U.S. Rocaltrol® RocheU.S. Calcijex® AbbottU.S. Calcium Acetate® Roxane Laboratories/ Sandoz IncU.S. & Europe Zemplar® AbbottU.S. & Europe Renagel® GenzymeU.S. & Europe Renvela® GenzymeU.S. & Europe PhosLo®/Rephoren® Fresenius Medical Care AG & Co. KGaA
(“Fresenius Medical Care”)U.S. & Europe OsvaRen® Fresenius Medical CareU.S. & Europe Fosrenol® Shire Pharmaceuticals Group Plc
On July 25, 2008, we filed a lawsuit against Teva Pharmaceuticals USA, Inc. and Teva Pharmaceutical(together defined as “Teva”) and Barr Pharmaceuticals Inc. (“Barr”) for infringement of four Sensipar® patents.The lawsuit is based on the Abbreviated New Drug Application filed by Teva and Barr which seeks approval tomarket generic versions of Sensipar®. (See Note 20, “Contingencies and commitments” to the Consolidated Fi-nancial Statements.) These generic versions could compete with Sensipar® in the future.
Vectibix® (panitumumab)
Vectibix® is our registered trademark for our first fully human monoclonal antibody for the treatment of pa-tients with EGFr expressing mCRC after disease progression on, or following fluoropyrimidine-, oxaliplatin- andirinotecan- containing chemotherapy regimens. EGFr is a protein that plays an important role in cancer cell sig-naling and is over-expressed in many human cancers. Vectibix® is a fully human monoclonal antibody that bindswith high affinity to EGFrs and interferes with signals that might otherwise stimulate growth and survival of thecancer cell. The goal of developing fully human monoclonal antibodies is to offer effective targeted therapieswith lessened risk of immune response against these agents. We acquired full ownership of Vectibix® with ouracquisition of Abgenix, Inc. (“Abgenix”) in April 2006 and Vectibix® received FDA approval in September2006. In the EU, the conditional approval of Vectibix® as monotherapy for the treatment of patients with EGFrexpressing metastatic colorectal carcinoma with non-mutated (wild-type) KRAS after failure of standard chemo-therapy regimens was received in December 2007 and is reviewed annually by the CHMP. In December 2008and 2009, the conditional marketing authorization was renewed with an additional specific obligation to conducta clinical trial in the existing approved indication. In 2009, the CHMP approved the protocol for this additional
12
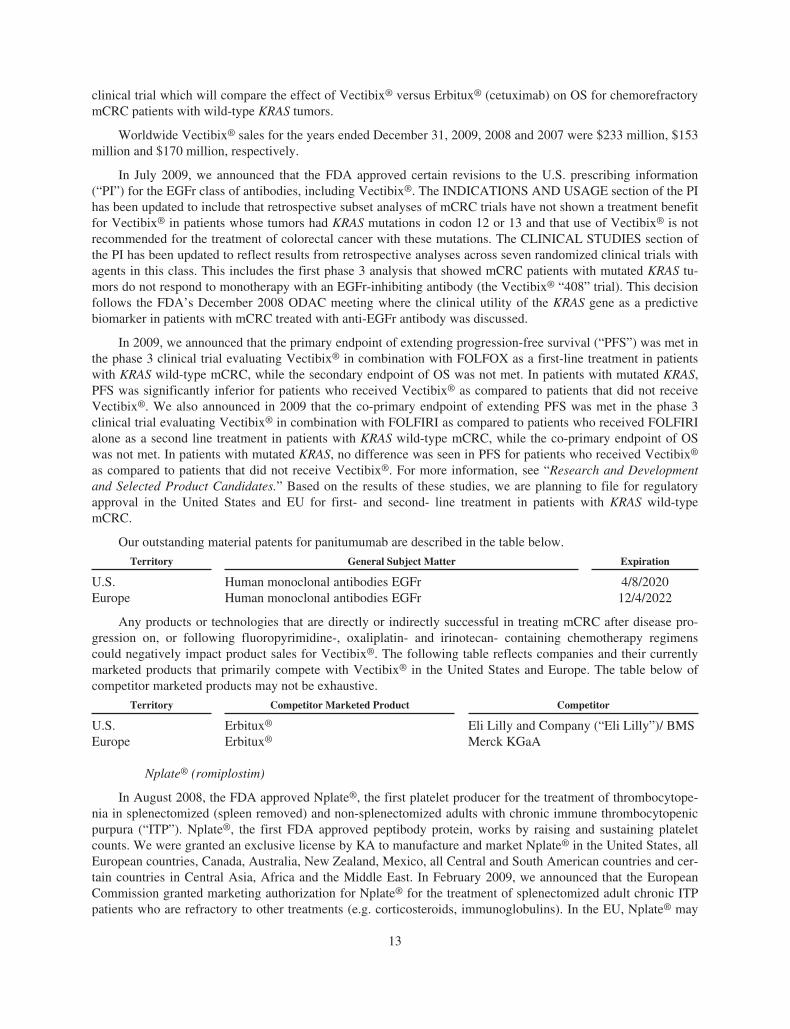
clinical trial which will compare the effect of Vectibix® versus Erbitux® (cetuximab) on OS for chemorefractorymCRC patients with wild-type KRAS tumors.
Worldwide Vectibix® sales for the years ended December 31, 2009, 2008 and 2007 were $233 million, $153million and $170 million, respectively.
In July 2009, we announced that the FDA approved certain revisions to the U.S. prescribing information(“PI”) for the EGFr class of antibodies, including Vectibix®. The INDICATIONS AND USAGE section of the PIhas been updated to include that retrospective subset analyses of mCRC trials have not shown a treatment benefitfor Vectibix® in patients whose tumors had KRAS mutations in codon 12 or 13 and that use of Vectibix® is notrecommended for the treatment of colorectal cancer with these mutations. The CLINICAL STUDIES section ofthe PI has been updated to reflect results from retrospective analyses across seven randomized clinical trials withagents in this class. This includes the first phase 3 analysis that showed mCRC patients with mutated KRAS tu-mors do not respond to monotherapy with an EGFr-inhibiting antibody (the Vectibix® “408” trial). This decisionfollows the FDA’s December 2008 ODAC meeting where the clinical utility of the KRAS gene as a predictivebiomarker in patients with mCRC treated with anti-EGFr antibody was discussed.
In 2009, we announced that the primary endpoint of extending progression-free survival (“PFS”) was met inthe phase 3 clinical trial evaluating Vectibix® in combination with FOLFOX as a first-line treatment in patientswith KRAS wild-type mCRC, while the secondary endpoint of OS was not met. In patients with mutated KRAS,PFS was significantly inferior for patients who received Vectibix® as compared to patients that did not receiveVectibix®. We also announced in 2009 that the co-primary endpoint of extending PFS was met in the phase 3clinical trial evaluating Vectibix® in combination with FOLFIRI as compared to patients who received FOLFIRIalone as a second line treatment in patients with KRAS wild-type mCRC, while the co-primary endpoint of OSwas not met. In patients with mutated KRAS, no difference was seen in PFS for patients who received Vectibix®
as compared to patients that did not receive Vectibix®. For more information, see “Research and Developmentand Selected Product Candidates.” Based on the results of these studies, we are planning to file for regulatoryapproval in the United States and EU for first- and second- line treatment in patients with KRAS wild-typemCRC.
Our outstanding material patents for panitumumab are described in the table below.
Territory General Subject Matter Expiration
U.S. Human monoclonal antibodies EGFr 4/8/2020Europe Human monoclonal antibodies EGFr 12/4/2022
Any products or technologies that are directly or indirectly successful in treating mCRC after disease pro-gression on, or following fluoropyrimidine-, oxaliplatin- and irinotecan- containing chemotherapy regimenscould negatively impact product sales for Vectibix®. The following table reflects companies and their currentlymarketed products that primarily compete with Vectibix® in the United States and Europe. The table below ofcompetitor marketed products may not be exhaustive.
Territory Competitor Marketed Product Competitor
U.S. Erbitux® Eli Lilly and Company (“Eli Lilly”)/ BMSEurope Erbitux® Merck KGaA
Nplate® (romiplostim)
In August 2008, the FDA approved Nplate®, the first platelet producer for the treatment of thrombocytope-nia in splenectomized (spleen removed) and non-splenectomized adults with chronic immune thrombocytopenicpurpura (“ITP”). Nplate®, the first FDA approved peptibody protein, works by raising and sustaining plateletcounts. We were granted an exclusive license by KA to manufacture and market Nplate® in the United States, allEuropean countries, Canada, Australia, New Zealand, Mexico, all Central and South American countries and cer-tain countries in Central Asia, Africa and the Middle East. In February 2009, we announced that the EuropeanCommission granted marketing authorization for Nplate® for the treatment of splenectomized adult chronic ITPpatients who are refractory to other treatments (e.g. corticosteroids, immunoglobulins). In the EU, Nplate® may
13
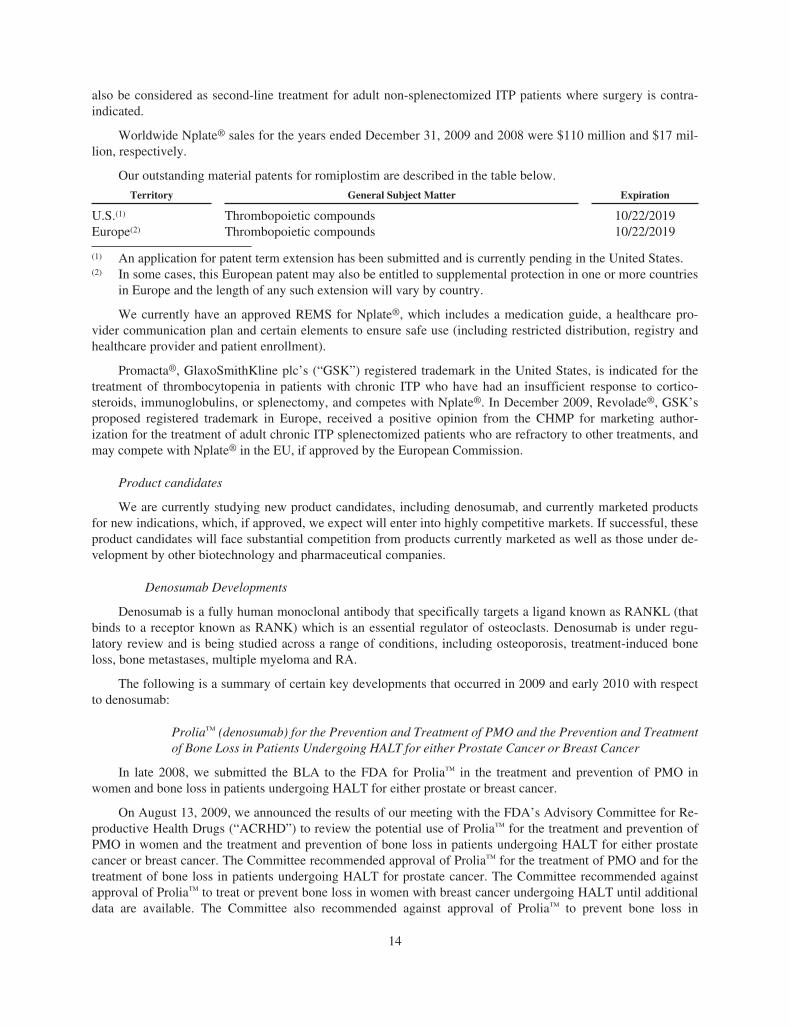
also be considered as second-line treatment for adult non-splenectomized ITP patients where surgery is contra-indicated.
Worldwide Nplate® sales for the years ended December 31, 2009 and 2008 were $110 million and $17 mil-lion, respectively.
Our outstanding material patents for romiplostim are described in the table below.
Territory General Subject Matter Expiration
U.S.(1) Thrombopoietic compounds 10/22/2019Europe(2) Thrombopoietic compounds 10/22/2019
(1) An application for patent term extension has been submitted and is currently pending in the United States.(2) In some cases, this European patent may also be entitled to supplemental protection in one or more countries
in Europe and the length of any such extension will vary by country.
We currently have an approved REMS for Nplate®, which includes a medication guide, a healthcare pro-vider communication plan and certain elements to ensure safe use (including restricted distribution, registry andhealthcare provider and patient enrollment).
Promacta®, GlaxoSmithKline plc’s (“GSK”) registered trademark in the United States, is indicated for thetreatment of thrombocytopenia in patients with chronic ITP who have had an insufficient response to cortico-steroids, immunoglobulins, or splenectomy, and competes with Nplate®. In December 2009, Revolade®, GSK’sproposed registered trademark in Europe, received a positive opinion from the CHMP for marketing author-ization for the treatment of adult chronic ITP splenectomized patients who are refractory to other treatments, andmay compete with Nplate® in the EU, if approved by the European Commission.
Product candidates
We are currently studying new product candidates, including denosumab, and currently marketed productsfor new indications, which, if approved, we expect will enter into highly competitive markets. If successful, theseproduct candidates will face substantial competition from products currently marketed as well as those under de-velopment by other biotechnology and pharmaceutical companies.
Denosumab Developments
Denosumab is a fully human monoclonal antibody that specifically targets a ligand known as RANKL (thatbinds to a receptor known as RANK) which is an essential regulator of osteoclasts. Denosumab is under regu-latory review and is being studied across a range of conditions, including osteoporosis, treatment-induced boneloss, bone metastases, multiple myeloma and RA.
The following is a summary of certain key developments that occurred in 2009 and early 2010 with respectto denosumab:
Prolia™ (denosumab) for the Prevention and Treatment of PMO and the Prevention and Treatmentof Bone Loss in Patients Undergoing HALT for either Prostate Cancer or Breast Cancer
In late 2008, we submitted the BLA to the FDA for Prolia™ in the treatment and prevention of PMO inwomen and bone loss in patients undergoing HALT for either prostate or breast cancer.
On August 13, 2009, we announced the results of our meeting with the FDA’s Advisory Committee for Re-productive Health Drugs (“ACRHD”) to review the potential use of Prolia™ for the treatment and prevention ofPMO in women and the treatment and prevention of bone loss in patients undergoing HALT for either prostatecancer or breast cancer. The Committee recommended approval of Prolia™ for the treatment of PMO and for thetreatment of bone loss in patients undergoing HALT for prostate cancer. The Committee recommended againstapproval of Prolia™ to treat or prevent bone loss in women with breast cancer undergoing HALT until additionaldata are available. The Committee also recommended against approval of Prolia™ to prevent bone loss in
14
low-risk patients in all three populations. Finally, the Committee recommended that Prolia™ have a REMS. TheACRHD is an advisory committee of external experts who advise the FDA about the safety and effectiveness ofmarketed and investigational human drugs for use in the practice of obstetrics, gynecology and related special-ties. This committee is advisory only and FDA officials are not bound to or limited by their recommendations.
In October 2009, the FDA issued Complete Response Letters for our BLA for Prolia™ for the above-notedindications. The FDA issues Complete Response Letters to request additional information needed to complete thereview of applications for product approval.
The Complete Response Letter related to the Prolia™ application for the treatment and prevention of PMOin women requested several items, including further information on the design and background adverse eventrates that will inform the methodology of our previously submitted post-marketing surveillance program, al-though the letter did not require additional pre-marketing clinical trials to complete the review of the treatmentindication. The FDA has also requested a new clinical program to support approval of Prolia™ for the preventionof PMO indication. In addition, the FDA has determined that a REMS is necessary for Prolia™ and must includea medication guide and a healthcare provider communication plan. The FDA acknowledged receipt of our pre-viously submitted proposed REMS materials. The FDA also requested all updated safety data related to Prolia™.On February 19, 2010, we announced that the FDA has evaluated the content of our Complete Response sub-mission for Prolia™ in the treatment of PMO, which we submitted on January 25, 2010, and classified it as aClass 2 resubmission. With the Class 2 designation, the FDA set a corresponding PDUFA action date of July 25,2010.
The Complete Response Letter related to the Prolia™ HALT application requested additional informationregarding the safety of Prolia™ in patients with breast cancer receiving aromatase inhibitor therapy and patientswith prostate cancer receiving androgen deprivation therapy (“ADT”). Specifically, the FDA has requested re-sults from additional adequate and well-controlled clinical trials demonstrating that Prolia™ has no detrimentaleffects on either time-to-disease progression or OS. We continue to work with the FDA to determine the appro-priate next steps regarding our application for the HALT indication.
Prolia™ Received Positive Opinion from CHMP in the EU
In December 2009, the CHMP announced a positive opinion for the marketing authorization of Prolia™ forthe treatment of osteoporosis in postmenopausal women at increased risk of fractures, and for the treatment ofbone loss associated with hormone ablation in men with prostate cancer at increased risk of fractures. If approvedby the European Commission, we would receive marketing authorization for Prolia™ in all EU Member States.The timing of actual launch dates would vary by country based on reimbursement authority approval of pricingwhich could follow the EMA approval by many months. While the European Commission generally follows theCHMP’s opinion, it is not bound to do so.
Prolia™ is also under regulatory review in Switzerland, Australia and Canada for the treatment and pre-vention of PMO and the treatment of bone loss in patients undergoing HALT for breast and prostate cancer. Weare working closely with regulatory agencies in each of these countries.
Denosumab Phase 3 Bone Metastases Clinical Trials
In 2009, we announced that the phase 3 head-to-head trial evaluating denosumab versus Zometa® in thetreatment of bone metastases in patients with advanced breast cancer met its primary endpoint of non-inferiorityin time to first SRE and its secondary endpoints (superiority compared to Zometa® for both delaying the time tothe first on-study SRE and delaying the time to the first-and-subsequent SREs). We also announced that thephase 3 head-to-head trial evaluating denosumab versus Zometa® in the treatment of bone metastases in ad-vanced cancer patients with solid tumors (not including breast and prostate cancer) or multiple myeloma met itsprimary endpoint of non-inferiority in time to first SRE. On February 8, 2010, we announced that the phase 3head-to-head trial evaluating denosumab versus Zometa® in the treatment of bone metastases in advanced cancerpatients with prostate cancer met its primary endpoint of non-inferiority in time to first SRE and its secondaryendpoints (superiority compared to Zometa® for both delaying the time to the first on-study SRE and delaying
15
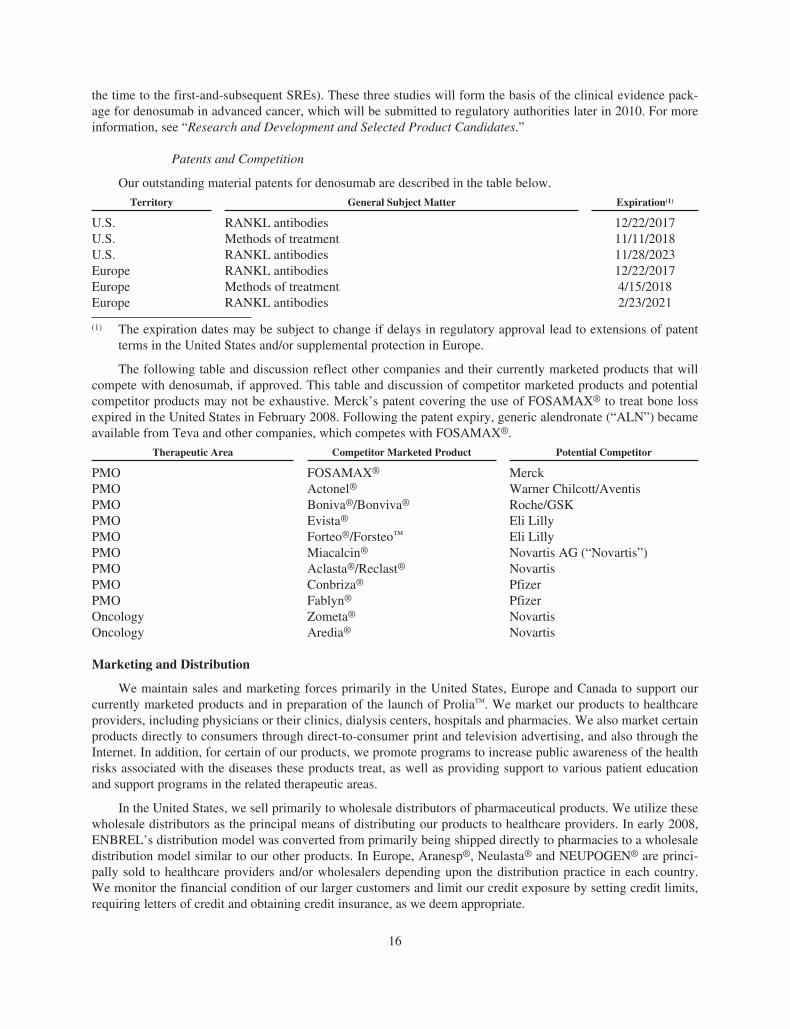
the time to the first-and-subsequent SREs). These three studies will form the basis of the clinical evidence pack-age for denosumab in advanced cancer, which will be submitted to regulatory authorities later in 2010. For moreinformation, see “Research and Development and Selected Product Candidates.”
Patents and Competition
Our outstanding material patents for denosumab are described in the table below.
Territory General Subject Matter Expiration(1)
U.S. RANKL antibodies 12/22/2017U.S. Methods of treatment 11/11/2018U.S. RANKL antibodies 11/28/2023Europe RANKL antibodies 12/22/2017Europe Methods of treatment 4/15/2018Europe RANKL antibodies 2/23/2021
(1) The expiration dates may be subject to change if delays in regulatory approval lead to extensions of patentterms in the United States and/or supplemental protection in Europe.
The following table and discussion reflect other companies and their currently marketed products that willcompete with denosumab, if approved. This table and discussion of competitor marketed products and potentialcompetitor products may not be exhaustive. Merck’s patent covering the use of FOSAMAX® to treat bone lossexpired in the United States in February 2008. Following the patent expiry, generic alendronate (“ALN”) becameavailable from Teva and other companies, which competes with FOSAMAX®.
Therapeutic Area Competitor Marketed Product Potential Competitor
PMO FOSAMAX® MerckPMO Actonel® Warner Chilcott/AventisPMO Boniva®/Bonviva® Roche/GSKPMO Evista® Eli LillyPMO Forteo®/Forsteo™ Eli LillyPMO Miacalcin® Novartis AG (“Novartis”)PMO Aclasta®/Reclast® NovartisPMO Conbriza® PfizerPMO Fablyn® PfizerOncology Zometa® NovartisOncology Aredia® Novartis
Marketing and Distribution
We maintain sales and marketing forces primarily in the United States, Europe and Canada to support ourcurrently marketed products and in preparation of the launch of Prolia™. We market our products to healthcareproviders, including physicians or their clinics, dialysis centers, hospitals and pharmacies. We also market certainproducts directly to consumers through direct-to-consumer print and television advertising, and also through theInternet. In addition, for certain of our products, we promote programs to increase public awareness of the healthrisks associated with the diseases these products treat, as well as providing support to various patient educationand support programs in the related therapeutic areas.
In the United States, we sell primarily to wholesale distributors of pharmaceutical products. We utilize thesewholesale distributors as the principal means of distributing our products to healthcare providers. In early 2008,ENBREL’s distribution model was converted from primarily being shipped directly to pharmacies to a wholesaledistribution model similar to our other products. In Europe, Aranesp®, Neulasta® and NEUPOGEN® are princi-pally sold to healthcare providers and/or wholesalers depending upon the distribution practice in each country.We monitor the financial condition of our larger customers and limit our credit exposure by setting credit limits,requiring letters of credit and obtaining credit insurance, as we deem appropriate.
16
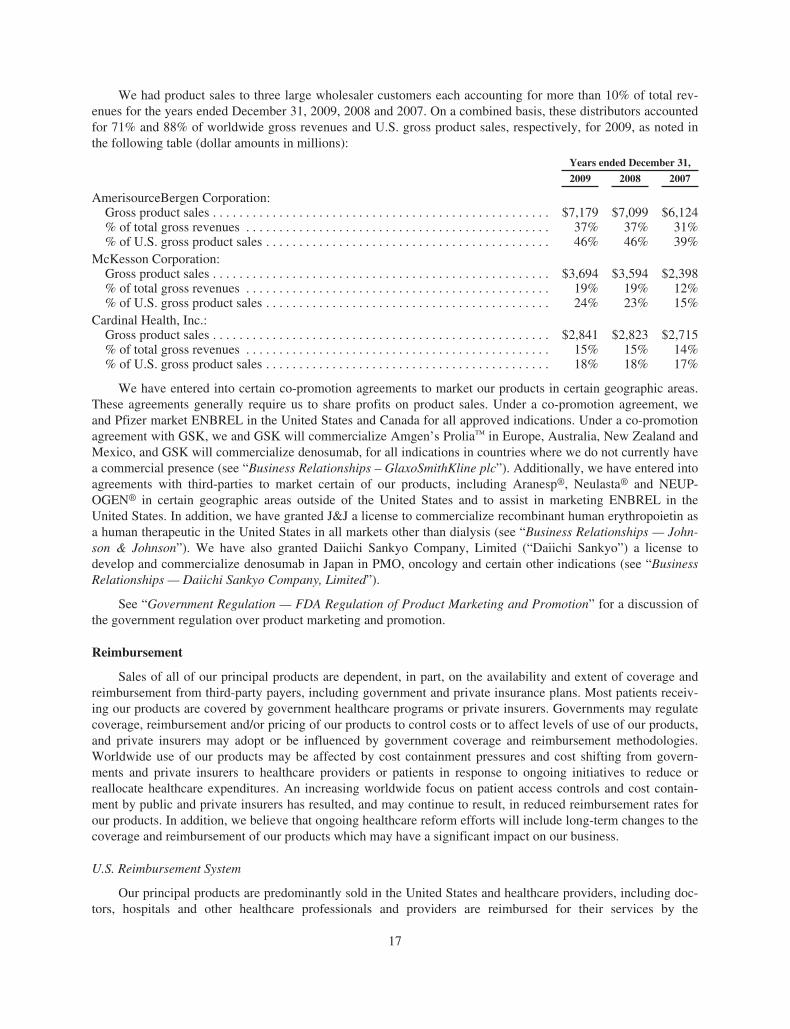
We had product sales to three large wholesaler customers each accounting for more than 10% of total rev-enues for the years ended December 31, 2009, 2008 and 2007. On a combined basis, these distributors accountedfor 71% and 88% of worldwide gross revenues and U.S. gross product sales, respectively, for 2009, as noted inthe following table (dollar amounts in millions):
Years ended December 31,
2009 2008 2007
AmerisourceBergen Corporation:Gross product sales . . . . . . . . . . . . . . . . . . . . . . . . . . . . . . . . . . . . . . . . . . . . . . . . . . . $7,179 $7,099 $6,124% of total gross revenues . . . . . . . . . . . . . . . . . . . . . . . . . . . . . . . . . . . . . . . . . . . . . . 37% 37% 31%% of U.S. gross product sales . . . . . . . . . . . . . . . . . . . . . . . . . . . . . . . . . . . . . . . . . . . 46% 46% 39%
McKesson Corporation:Gross product sales . . . . . . . . . . . . . . . . . . . . . . . . . . . . . . . . . . . . . . . . . . . . . . . . . . . $3,694 $3,594 $2,398% of total gross revenues . . . . . . . . . . . . . . . . . . . . . . . . . . . . . . . . . . . . . . . . . . . . . . 19% 19% 12%% of U.S. gross product sales . . . . . . . . . . . . . . . . . . . . . . . . . . . . . . . . . . . . . . . . . . . 24% 23% 15%
Cardinal Health, Inc.:Gross product sales . . . . . . . . . . . . . . . . . . . . . . . . . . . . . . . . . . . . . . . . . . . . . . . . . . . $2,841 $2,823 $2,715% of total gross revenues . . . . . . . . . . . . . . . . . . . . . . . . . . . . . . . . . . . . . . . . . . . . . . 15% 15% 14%% of U.S. gross product sales . . . . . . . . . . . . . . . . . . . . . . . . . . . . . . . . . . . . . . . . . . . 18% 18% 17%
We have entered into certain co-promotion agreements to market our products in certain geographic areas.These agreements generally require us to share profits on product sales. Under a co-promotion agreement, weand Pfizer market ENBREL in the United States and Canada for all approved indications. Under a co-promotionagreement with GSK, we and GSK will commercialize Amgen’s Prolia™ in Europe, Australia, New Zealand andMexico, and GSK will commercialize denosumab, for all indications in countries where we do not currently havea commercial presence (see “Business Relationships – GlaxoSmithKline plc”). Additionally, we have entered intoagreements with third-parties to market certain of our products, including Aranesp®, Neulasta® and NEUP-OGEN® in certain geographic areas outside of the United States and to assist in marketing ENBREL in theUnited States. In addition, we have granted J&J a license to commercialize recombinant human erythropoietin asa human therapeutic in the United States in all markets other than dialysis (see “Business Relationships — John-son & Johnson”). We have also granted Daiichi Sankyo Company, Limited (“Daiichi Sankyo”) a license todevelop and commercialize denosumab in Japan in PMO, oncology and certain other indications (see “BusinessRelationships — Daiichi Sankyo Company, Limited”).
See “Government Regulation — FDA Regulation of Product Marketing and Promotion” for a discussion ofthe government regulation over product marketing and promotion.
Reimbursement
Sales of all of our principal products are dependent, in part, on the availability and extent of coverage andreimbursement from third-party payers, including government and private insurance plans. Most patients receiv-ing our products are covered by government healthcare programs or private insurers. Governments may regulatecoverage, reimbursement and/or pricing of our products to control costs or to affect levels of use of our products,and private insurers may adopt or be influenced by government coverage and reimbursement methodologies.Worldwide use of our products may be affected by cost containment pressures and cost shifting from govern-ments and private insurers to healthcare providers or patients in response to ongoing initiatives to reduce orreallocate healthcare expenditures. An increasing worldwide focus on patient access controls and cost contain-ment by public and private insurers has resulted, and may continue to result, in reduced reimbursement rates forour products. In addition, we believe that ongoing healthcare reform efforts will include long-term changes to thecoverage and reimbursement of our products which may have a significant impact on our business.
U.S. Reimbursement System
Our principal products are predominantly sold in the United States and healthcare providers, including doc-tors, hospitals and other healthcare professionals and providers are reimbursed for their services by the
17

government through Medicare, Medicaid and other government healthcare programs as well as through privatepayers. Government healthcare programs are funded primarily through the payment of taxes from individuals andbusinesses. The public and private components of this multi-payer system are described below.
Medicare and Other Forms of Public Health Insurance
Medicare is a federal program administered by the federal government that covers individuals age 65 andover as well as those with certain disabilities and ESRD, regardless of their age. The primary Medicare programsthat affect reimbursement for our products are Medicare Part B, which covers physician services and outpatientcare, and Medicare Part D, which provides a voluntary outpatient prescription drug benefit. CMS is the federalagency responsible for administering Medicare (as well as Medicaid, described below) and, among its re-sponsibilities, has authority to issue Medicare national coverage decisions (“NCD”) as well as manual policyissuances and updates and codes for drugs and other items. Local Medicare contractors have authority to issueLocal Coverage Determinations. Generally, a NCD issued by CMS is a national policy statement granting, limit-ing or excluding Medicare coverage for a specific medical item or service.
Medicare Part B Coverage of Drugs and ESRD. Medicare Part B provides limited coverage of outpatientdrugs and biologicals that are furnished “incident to” a physician’s services. Generally, “incident to” drugs andbiologicals are covered only if they satisfy certain criteria, including that they are of the type that is not usuallyself-administered by the patient and they are reasonable and necessary for a medically accepted diagnosis ortreatment. Medicare Part B also covers some drugs pursuant to a specific statutory directive, such as blood-clotting factors and certain immunosuppressive drugs, erythropoietin and certain oral cancer drugs, if they fallunder a specific statutory benefit category and they are “safe and effective” as established by FDA approval.Many of our principal products, including EPOGEN®, Aranesp®, Neulasta® and NEUPOGEN®, are currentlycovered under Medicare Part B (as well as other government healthcare programs). In addition, most patientswith ESRD, regardless of age, are eligible for coverage of dialysis treatment through the ESRD Program underMedicare Part B, the primary payer for dialysis treatment. Because Medicare Part B is the primary payer fordialysis treatment, reimbursement for products, such as EPOGEN®, that are typically administered in dialysiscenters and other settings is particularly sensitive to changes in Medicare coverage and reimbursement policy.
Medicare Part D. Medicare Part D provides a voluntary prescription drug benefit for Medicare eligiblebeneficiaries. This coverage is available through various private plans that provide insurance coverage for pre-scription drugs for a monthly premium. The list of prescription drugs covered by Medicare Part D plans varies byplan, but drug lists maintained by individual plans must cover certain classes of drugs and biologicals, specifi-cally the statute stipulates that Part D plans have at least two drugs in each unique therapeutic category, subject tocertain exceptions. Medicare patients who obtain ENBREL and Sensipar® under retail coverage, where they areprimarily provided, are typically covered by Medicare Part D.
Medicaid. Medicaid is a joint federal and state program administered by individual states for low-incomeand disabled eligible beneficiaries. CMS also has responsibility for federal administration of the Medicaid pro-gram. Under federal law, states must cover low-income adults and children, pregnant women, disabledindividuals and seniors, and states have the option of expanding eligibility beyond these groups of beneficiaries.Medicaid is financed jointly by the states and federal government through taxes. Medicaid offers a broad set ofbenefits, including prescription drugs. Medicaid includes the Drug Rebate Program which requires manufacturersto provide rebates to the states for our products covered and reimbursed by state Medicaid programs. (See—“Government Regulation” and “Item 1A. Risk Factors — Our sales depend on coverage and reimbursement fromthird-party payers.”)
Private Health Insurance
Employer-sponsored insurance. Employer-sponsored insurance represents the main pathway by whichAmericans receive private health insurance. Many employers provide health insurance as part of the benefitspackage for employees. Insurance plans are administered by private companies, both for-profit and not-for-profit,and some companies are “self-insured” (i.e., they pay for all healthcare costs incurred by employees directlythrough a plan administered by a third party). Generally, employer-sponsored insurance premiums are paid pri-marily by employers and secondarily by employees.
18
Individual market. The individual market covers part of the population that is self-employed or retired. Inaddition, it covers some people who are unable to obtain insurance through their employer. In contrast to theemployer-sponsored insurance, the individual market allows health insurance companies to deny people coveragebased on pre-existing conditions although a newly enacted law prohibits denial of coverage based on genetic dis-crimination. The plans are administered by private insurance companies. Individuals pay an out-of-pocketinsurance premium for coverage and benefits vary widely according to plan specifications.
Reimbursement of Our Principal Products
Aranesp®, Neulasta® and NEUPOGEN®. Medicare and Medicaid payment policies for drugs and bio-logicals are subject to various laws and regulations. The Medicare program covers Aranesp®, Neulasta® andNEUPOGEN®, under Part B, when administered in the physician clinic setting and the hospital outpatient anddialysis settings and reimburses providers using a payment methodology based on a fixed percentage of eachproduct’s average sales price (“ASP”). ASP is calculated by the manufacturer based on a statutorily defined for-mula and submitted to CMS. A product’s ASP is calculated and reported to CMS on a quarterly basis andtherefore may change each quarter. The ASP in effect for a given quarter (the “Current Period”) is based uponcertain historical sales and sales incentive data covering a statutorily defined period of time preceding the CurrentPeriod. CMS publishes the ASPs for products in advance of the quarter in which they go into effect. In the calcu-lation of ASP, CMS currently allows manufacturers to make reasonable assumptions consistent with the generalrequirements and the intent of the Medicare statute and regulations and their customary business practices and inthe future CMS may provide more specific guidance. Any changes to the ASP calculations directly affect theMedicare reimbursement for our products administered in the physician clinic setting, dialysis facility or hospitaloutpatient setting. Our ASP calculations are reviewed quarterly for completeness and based on such review, wehave on occasion restated our reported ASPs to reflect calculation changes both prospectively and retroactively.(See “Items 1A. Risk Factors — Our sales depend on coverage and reimbursement from third-party payers.”)
Since January 1, 2005, in the physician office setting under Part B, our products have been reimbursed at106% of its ASP (sometimes referred to as “ASP+6%”). As of January 1, 2009, Medicare payment in the hospitaloutpatient setting reimbursed each product ASP+4% which is lower than the payment rate was in 2008(ASP+5%) or from 2006-2007 (ASP+6%). In 2010, the payment methodologies in both the hospital outpatientand physician office settings are at the same levels from 2009 (ASP+6% in the physician office setting andASP+4% in the hospital outpatient setting), pursuant to the 2010 Medicare Physician Fee Schedule Final Ruleand the 2010 Hospital Outpatient Prospective Payment Final Rule. CMS has the regulatory authority to furtheradjust the outpatient hospital payment formula in future years. The extent to which commercial payers adopt theuse of ASP as a payment methodology is still evolving and is often based on the relationship between the pro-vider and the insurer.
Dialysis Reimbursement. Currently, dialysis providers in the United States are primarily reimbursed forEPOGEN® by Medicare through the ESRD Program. The ESRD Program reimburses Medicare providers for80% of allowed dialysis costs; the remainder is paid by other sources, including patients, state Medicaid pro-grams, private insurance, and to a lesser extent, state kidney patient programs. The ESRD Programreimbursement methodology is established by federal law and is implemented by CMS. Medicare reimburses forseparately billable dialysis drugs administered in both freestanding and hospital-based dialysis centers, includingEPOGEN® and Aranesp®, at ASP+6%, using the same payment amount methodology used in the physician clin-ic setting under Part B. On July 15, 2008, the Medicare Improvements for Patients and Providers Act of 2008(the “MIPPA”) became law and contained a number of Medicare and Medicaid reforms, including a broaderpayment bundle for dialysis services and drugs which will require CMS, beginning in 2011, to establish a bun-dled Medicare payment rate that includes dialysis services and drug/labs that are currently separately billed. OnSeptember 15, 2009, CMS released its proposed rule to implement the bundled prospective payment system forESRD. Under the proposed rule, the bundled payment system will include dialysis services covered under thecurrent composite rate, as well as drugs and biologicals furnished for treatment of ESRD that are currently billedseparately, including ESAs, intravenous iron and intravenous vitamin D, as well as “oral equivalent” forms ofthese intravenous drugs. In addition, the proposed rule also includes in the bundled payment oral drugs that arenot equivalent to separately billable Part B drugs, specifically Sensipar® and phosphate binders. The public
19
comment period ended on December 16, 2009. The bundled reimbursement rate will be phased in over a fouryear period in equal increments starting in 2011. Providers have the option to move to a full Medicare bundledpayment system in 2011 or may elect to adopt certain components of the bundled payment system beginning in2010. CMS will also be required to establish a quality incentive program that begins concurrently with bundlingin 2011. Beginning in 2012, facilities would be subject to up to a 2% annual reduction in Medicare reimburse-ment for failure to meet or exceed CMS quality performance standards, including performance standards relatedto anemia management and dialysis adequacy. Bundling initiatives that have been implemented in other health-care settings have occasionally resulted in lower utilization of services that had not previously been a part of thebundled payment.
ESA Reimbursement Developments. Since April 1, 2006, Medicare reimbursement for ESAs administered todialysis patients has been subject to a revised Erythropoietin Monitoring Policy (“EMP”), the Medicare paymentreview mechanism used by CMS to monitor EPOGEN® and Aranesp® utilization and appropriate hematocritoutcomes of dialysis patients. The EMP was revised, effective January 1, 2008, requiring a 50% reduction inMedicare reimbursement if a patient’s Hb is above 13 g/dL for three or more consecutive months. In addition, therevised EMP reduces the monthly dosing limits to 400,000 international units (“IUs”) of EPOGEN®, from500,000 IUs, and to 1,200 micrograms (“mcgs”) of Aranesp®, from 1,500 mcgs. On March 14, 2007, CMS an-nounced a review of all Medicare policies related to the administration of ESAs in non-renal disease applicationsas part of a national coverage analysis (“NCA”), which is generally CMS’ first step toward developing a NCD.Subsequently, on May 14, 2007, CMS issued a proposed NCD that was open for public comment throughJune 13, 2007. On July 30, 2007, CMS issued a NCD which was substantially altered from the proposed NCD.On January 14, 2008, CMS issued changes to its Medicare NCD Manual, adding the ESA NCD, effective forclaims with dates of service on and after July 30, 2007 with an implementation date of April 7, 2008. The NCDdetermined that ESA treatment was not reasonable and necessary for certain clinical conditions, and establishedMedicare coverage parameters for FDA-approved ESA use in oncology. We believe that the restrictions in theNCD changed the way ESAs are used in clinical practice, for example, by decreasing the number of treated pa-tients, the average ESA dose and the duration of ESA therapy. We believe this restriction on coverage of ESAs inthe NCD has had a material adverse effect on the coverage, reimbursement and sales of Aranesp®, and our busi-ness and results of operations. In addition, many private payers have implemented portions of the NCD and webelieve many healthcare providers have reduced ESA utilization for all of their patients regardless of insurancecoverage.
On September 11, 2007, the FDA held a joint meeting of the Cardiovascular-Renal Drug Advisory Commit-tee (“CRDAC”) and the Drug Safety and Risk Management Advisory Committee (“DSaRMAC”) to evaluate thesafety data on ESA use in renal disease. On July 31, 2008, CMS issued a listing of potential topics for futureNCDs as a step to increase transparency in the NCD process, which included as potential topics the use of ESAsin ESRD and CKD. CMS has not announced whether it will proceed to a NCD for ESAs in ESRD or CKD andwe cannot predict whether ESAs in the renal setting will be the subject of a future NCD, however, any final NCDfor ESAs in the renal setting, which may include non-coverage and/or new dosing and treatment restrictions sim-ilar to those in the NCD for treatment of anemia in oncology with ESAs, would negatively affect use, reducecoverage and reimbursement, negatively affect product sales of our ESA products and may have a material ad-verse effect on our business and results of operations. In addition, the CMS has scheduled a meeting onMarch 24, 2010 of the MEDCAC to review the available evidence on the use of ESAs to manage anemia in pa-tients who have CKD, which may consider the results of the TREAT study. In February 2010, the CMS releasedthe voting questions the MEDCAC will address, including whether the available evidence in both CKD not ondialysis and ESRD clearly (i) demonstrates benefits and risks of ESA therapy, (ii) supports a baseline Hb rangeor (iii) justifies a dose response or maximum dose. The CMS will decide whether more evidence is needed to de-termine whether ESA treatment is reasonable and necessary to support continued Medicare coverage. The CMSmay consider initiating a NCA or a NCD following the MEDCAC. While the MEDCAC provides advice andrecommendations to CMS about the adequacy of scientific evidence and votes on certain questions proposed byCMS, it functions as an independent advisory body and its advice and recommendations to CMS are advisoryonly.
20
Enbrel® Reimbursement. The majority of prescription claims for ENBREL are paid through private in-surance companies. Under Medicare, ENBREL is reimbursed through the Part D program, although less then10% of all ENBREL U.S. prescriptions are reimbursed by Medicare.
Healthcare Reform. Healthcare reform, focused on expanding healthcare coverage to millions of uninsuredAmericans and reducing the rate of increase in the costs of healthcare, remains a priority for President Obama,U.S. Congress and a number of states. Developments in this area have been highly dynamic and difficult to pre-dict. As recently as February 23, 2010, President Obama released a new proposal for healthcare reform whichincludes a combination of provisions from both the Senate and House of Representatives bills passed in late2009. Certain healthcare reform proposals being considered, which may or may not be adopted into law, could:
• restrict the coverage and reimbursement of our products by Medicare, Medicaid and other governmentprograms
• reduce the number of years of data exclusivity for innovative biological products potentially leading toearlier biosimilar competition and/or
• require additional healthcare reform costs to be borne by pharmaceutical and biotechnology companies.
At this time, we cannot predict which or whether any reform measures will be adopted into law.
Reimbursement Outside the United States
Generally, in Europe and other countries outside the United States, the government-sponsored healthcare sys-tem has traditionally been the primary payer for all healthcare costs, including payment for drugs and biologicals.Over the past several years, the reimbursement environment in Europe has become very challenging, with theadvent of Health Technology Assessment (“HTA”) organizations (e.g., National Institute for Health and ClinicalExcellence (“NICE”) in the United Kingdom) that make recommendations and/or determinations of coverage andreimbursement based upon both the clinical as well as the economic value of a product. Although the methodsemployed by different HTA agencies differ from country to country, the use of formal economic metrics hasbeen increasing across Europe as well as in several emerging markets throughout the world.
With increased budgetary constraints, payers in many countries employ a variety of measures to exert down-ward price pressure. In some countries, international price referencing is the primary mechanism for price controlin which the ceiling price of a pharmaceutical or biological product is set based to the price in particular bench-mark countries. These price referencing rules are increasing in complexity as prices are more transparent andpayers seek lower-price benchmarks against which to compare themselves. Additional cost-containment meas-ures can include therapeutic reference pricing, including setting the reimbursement rate for a given class ofagents at the lowest price within the class, generic substitution and government-mandated price cuts. In manycountries, the influence of regional and hospital payers also contributes to whether patients have access to certainproducts. For example, a product may be successfully listed on a national formulary, but may also be subject tofurther evaluations or competitive bidding by payers at a regional or hospital level. Finally, payers in some coun-tries are beginning to experiment with alternative pricing mechanisms (e.g., payment caps) that facilitate greaterpredictability of payer budgets and require manufacturers to assume some financial risk.
Manufacturing, Distribution and Raw Materials
Manufacturing
Biotechnology products, which are produced in living systems, are inherently complex due to naturally-occurring molecular variations. Highly specialized knowledge and extensive process and product characterizationare required to transform laboratory scale processes into reproducible commercial manufacturing processes. Ourmanufacturing operations consist of bulk manufacturing, formulation, fill and finish and distribution activities forAranesp®, Epoetin alfa, Neulasta®, NEUPOGEN®, ENBREL, Vectibix®, Nplate® and other products and prod-uct candidates, including denosumab, for both commercial and clinical purposes. Bulk manufacturing includesfermentation and cell culture, which are the processes by which our proteins are produced. The proteins are puri-fied to a high quality and then formulated into a stable form. The fill process dispenses the formulated bulkprotein into vials or syringes. Finally, in the finish process, our products are packaged for distribution.
21
We operate commercial and clinical manufacturing facilities in several locations throughout the UnitedStates, Puerto Rico and the Netherlands (see “Item 2. Properties”). Manufacturing of Sensipar®, our small mole-cule product, is performed entirely by third-party contract manufacturers. We also use and expect to continue touse third-party contract manufacturers to produce or assist in the production of certain of our large moleculemarketed products, including ENBREL and Nplate®, and a number of our clinical product candidates, includingdenosumab.
The global supply of our principal products is dependent on actively managing the inventory produced atour facilities and by third-party contract manufacturers and the uninterrupted and efficient operation of ourmanufacturing facilities. During the manufacturing scale-up process, and even after achieving sustainable com-mercial manufacturing, we may encounter difficulties or disruptions due to defects in raw materials orequipment, contamination or other factors which may impact product availability. (See “Item 1A. Risk Factors —Manufacturing difficulties, disruptions or delays could limit supply of our products and limit our product sales.”)
We have obtained from various parties licenses that we deem to be necessary or desirable for the manu-facture of our products. These licenses generally require us to pay royalties to the licensors based on productsales.
Commercial Bulk Manufacturing
We operate commercial bulk manufacturing facilities in Puerto Rico and in several locations throughout theUnited States (see “Item 2. Properties”). Other than for ENBREL, we perform all of the commercial bulk manu-facturing for our proteins. We supplement our own bulk manufacturing of ENBREL with a third-party contractmanufacturer.
In addition to producing our own commercial quantities of bulk Epoetin alfa, we also supply bulk Epoetinalfa in the United States to J&J under a supply agreement (see “Business Relationships — Johnson & Johnson”).
Commercial Formulation, Fill and Finish Manufacturing
Our primary commercial formulation, fill and finish manufacturing facility is located in Puerto Rico. In addi-tion, we operate a commercial formulation, fill and finish manufacturing facility in California for Vectibix® andconduct certain finish activities in the Netherlands (see “Item 2. Properties”). Other than for Nplate®, we performsubstantially all of our commercial formulation, fill and finish activities for our proteins in Puerto Rico. Theformulation, fill and finish for Nplate® is performed by a third-party contract manufacturer. In addition to theformulation, fill and finish of ENBREL performed by us in Puerto Rico, fill and finish of a certain portion ofENBREL is also performed by third-party contract manufacturers (see “Item 1A. Risk Factors — We manu-facture and formulate, fill and finish substantially all our products at our Puerto Rico manufacturing facility; ifsignificant natural disasters or production failures occur at this facility, we may not be able to supply theseproducts”).
Clinical Manufacturing
Clinical bulk, formulation, fill and finish manufacturing facilities are operated in several locations through-out the United States and in Puerto Rico (see “Item 2. Properties”). Certain finishing activities for our clinicalproducts are performed in the Netherlands. In addition, we also utilize third-party contract manufacturers for cer-tain of our clinical products.
Distribution
We operate distribution centers in the United States, principally in Kentucky and California, and the Nether-lands for worldwide distribution of the majority of our commercial and clinical products. In addition, we also usethird-party distributors to supplement distribution of our commercial and clinical products in certain areas of theworld.
22
Other
In addition to the manufacturing and distribution activities noted above, our operations in the United States,Puerto Rico and the Netherlands perform key manufacturing support functions, including quality control, processdevelopment, procurement, distribution and production scheduling. Certain of these manufacturing and dis-tribution activities are highly regulated by the FDA and other international regulatory agencies (see “GovernmentRegulation — FDA Regulation of Manufacturing Standards”).
In preparation for the anticipated launch of Prolia™, we have performed bulk manufacturing at our Boulder,Colorado manufacturing facility and formulation, fill and finish manufacturing activities in Puerto Rico. We alsohave an agreement with a third-party contract manufacturer that allows us to supplement, if necessary, our ownbulk manufacturing activities of denosumab. In addition, in order to assist in meeting anticipated future demand,we are expanding our Puerto Rico bulk protein facilities to manufacture denosumab, as discussed below.
Manufacturing Initiatives
We have certain key ongoing initiatives to assist in meeting our future manufacturing needs. To maintainsupply, mitigate risks associated with the majority of our formulation, fill and finish operations being performedin a single facility, and to satisfy anticipated future demand for a number of our late-stage product candidates, inparticular denosumab, we are completing the construction and qualification of a new formulation and filling fa-cility at our Puerto Rico site and the expansion and qualification of our existing bulk protein facilities at ourPuerto Rico site. Upon completion, these facilities will require licensure by the various regulatory authorities. Inaddition to these projects, we have initiatives designed to operate our facilities at appropriate production capacityover the next few years, optimize manufacturing asset utilization, continue our use of third-party contract manu-facturers and maintain a state of regulatory compliance. (See “Item 1A. Risk Factors — Manufacturingdifficulties, disruptions or delays could limit supply of our products and limit our product sales.”)
Raw Materials and Medical Devices
Certain raw materials necessary for the commercial and clinical manufacturing of our products are providedby single-source unaffiliated third-party suppliers. Also, certain medical devices and components necessary forthe formulation, fill and finish of our products are provided by single-source unaffiliated third-party suppliers.Certain of these raw materials, medical devices and components are the proprietary products of these unaffiliatedthird-party suppliers and, in some cases, such proprietary products are specifically cited in our drug applicationwith regulatory agencies so that they must be obtained from the specific sole source and could not be obtainedfrom another supplier unless and until the regulatory agency approved such supplier. We currently attempt tomanage the risk associated with such sole-sourced suppliers by inventory management, relationship managementand evaluating alternate sources when feasible. We also monitor the financial condition of certain suppliers, theirability to supply our needs and the market conditions for these items.
Also, certain of the raw materials required in the commercial and clinical manufacturing of our products aresourced from other countries and/or derived from biological sources, including mammalian tissues. In addition,one of our marketed products also includes bovine serum and human serum albumin (“HSA”). We continue toinvestigate alternatives to biological sources and alternative manufacturing processes that do not require the useof biologically-sourced raw materials as such raw materials may be subject to contamination and/or recall. Also,some countries in which we market our products may restrict the use of certain biologically derived substances inthe manufacture of drugs. A material shortage, contamination, recall and/or restriction of the use of certain bio-logically derived substances or other raw materials, which may be sourced from other countries, used in themanufacture of our products could adversely impact or disrupt the commercial manufacturing of our products orcould result in a mandated withdrawal of our products from the market. (See “Item 1A. Risk Factors — We relyon single-source third-party suppliers for certain of our raw materials, medical devices and components.”)
We perform various procedures to assist in authenticating the source of raw materials, including interme-diary materials used in the manufacture of our products, which include verification of the country of origin.These procedures are incorporated into the manufacturing processes performed by us and our third-party contractmanufacturers.
23
Business Relationships
From time to time, we enter into business relationships including, joint ventures and collaborative arrange-ments, for the R&D, manufacture and/or commercialization of products and product candidates. In addition, wealso acquire product rights and have established R&D collaborations with third-parties to enhance our R&Dcapabilities and internally developed product pipeline. These arrangements may provide for non-refundable, up-front license fees, R&D and commercial performance milestone payments, cost sharing, royalty payments and/orprofit sharing. Our collaboration agreements with third parties are performed on a “best efforts” basis with noguarantee of either technological or commercial success.
Trade secret protection for our unpatented confidential and proprietary information is important to us. Toprotect our trade secrets, we generally require parties to business relationships to execute confidentiality agree-ments upon the commencement of the business relationship with us. However, others could either developindependently the same or similar information or obtain access to our information.
Kirin Holdings Company, Limited
We formed KA, a 50-50 joint venture with Kirin in 1984. KA develops and commercializes certain of ourand Kirin’s product rights, which have been transferred to this joint venture. KA has given exclusive licenses tous to manufacture and market: (i) darbepoetin alfa in the United States, Europe, Canada, Australia, New Zealand,Mexico, all Central and South American countries and certain countries in Central Asia, Africa and the MiddleEast, (ii) pegfilgrastim and G-CSF in the United States, Europe, Canada, Australia and New Zealand,(iii) recombinant human erythropoietin in the United States and (iv) romiplostim in the United States, Europe,Canada, Australia, New Zealand, Mexico, all Central and South American countries and certain Central Asian,African and Middle East countries. We currently market darbepoetin alfa, pegfilgrastim, G-CSF, recombinanthuman erythropoietin and romiplostim under the brand names Aranesp®, Neulasta®, NEUPOGEN®/GRANULOKINE®, EPOGEN® and Nplate®, respectively.
KA has also given exclusive licenses to Kirin to manufacture and market: (i) darbepoetin alfa, pegfilgrastim,G-CSF and romiplostim in Japan, the People’s Republic of China (“China”), Taiwan, Korea and certain othercountries in Asia, (ii) pegfilgrastim and G-CSF in Japan, China, Taiwan and Korea and (iii) recombinant humanerythropoietin in Japan and China. Kirin markets darbepoetin alfa in Japan under the brand name NESP®. Kirinmarkets G-CSF and recombinant human erythropoietin in China under separate agreements with KA. Kirin mar-kets its G-CSF product in its respective territories under the trademark GRAN®/Grasin®/Filgrastim®. Kirinmarkets its recombinant human erythropoietin product in Japan under the trademark ESPO®. Kirin also marketsG-CSF and recombinant human erythropoietin in China under a separate agreement with Amgen Greater ChinaLtd., a subsidiary of Amgen Inc.
KA has licensed to J&J rights to recombinant human erythropoietin in all geographic areas of the world out-side the United States, China and Japan (see “— Johnson & Johnson”). Under its agreement with KA, J&J pays aroyalty to KA based on sales. KA has also licensed to Roche rights to pegfilgrastim and G-CSF in certain geo-graphic areas of the world.
In connection with our various license agreements with KA, we pay KA royalties based on product sales. Inaddition, we also receive payment from KA for conducting certain R&D activities on its behalf (see Note 8,“Related party transactions” to the Consolidated Financial Statements).
Johnson & Johnson
We granted J&J a license to commercialize recombinant human erythropoietin as a human therapeutic in theUnited States in all indications other than dialysis and diagnostics. All recombinant human erythropoietin sold byJ&J in the United States is manufactured by us and sold by J&J under the trademark PROCRIT® (Epoetin alfa).PROCRIT® brand Epoetin alfa is identical to EPOGEN® brand Epoetin alfa, which is manufactured and sold byus in the U.S. market for the dialysis indication. Pursuant to the license agreement with J&J, we earn a 10% roy-alty on net sales of PROCRIT® by J&J in the United States.
24
Outside the United States, with the exception of China and Japan, J&J was granted rights to manufactureand commercialize recombinant human erythropoietin as a human therapeutic for all uses under a licensingagreement with KA. With respect to its sales outside of the United States, J&J manufactures and commercializesits own brand of Epoetin alfa which is then sold by a subsidiary of J&J under various trademarks such asEPREX® and ERYPO®. We are not involved in the manufacture of Epoetin alfa sold by J&J outside of the Unit-ed States.
Pfizer Inc.
Amgen and Pfizer are in a collaboration agreement to co-promote ENBREL in the United States and Cana-da. The rights to market ENBREL outside of the United States and Canada are reserved to Pfizer. Under theagreement, a management committee comprised of equal representation from Amgen and Pfizer is responsiblefor overseeing the marketing and sales of ENBREL, including strategic planning, the approval of an annual mar-keting plan, product pricing and the establishment of a brand team. The brand team, with equal representationfrom each party, prepares and implements the annual marketing plan, which requires a minimum level of finan-cial and sales personnel commitment from each party, and is responsible for all sales activities. Further, pursuantto the co-promotion agreement, Pfizer and Amgen each pay a defined percentage of all selling and marketing ex-penses approved by the joint management committee. In addition, we pay Pfizer a percentage of the annual grossprofits on our ENBREL sales in the United States and Canada attributable to all approved indications for EN-BREL on a scale that increases as gross profits increase; however, we maintain a majority share of ENBRELprofits.
GlaxoSmithKline plc
In July 2009, we entered into a collaboration agreement with GSK for the commercialization of our late-stage product candidate, denosumab, in Europe, Australia, New Zealand and Mexico (the “Primary Territories”)for osteoporosis indications. We will commercialize denosumab for all indications in the United States andCanada and for oncology indications in the Primary Territories. GSK will commercialize denosumab for all in-dications in countries where we do not currently have a commercial presence, including China, Brazil, India,Taiwan and South Korea (the “Expansion Territories”). In the Expansion Territories, GSK will be responsible forall development and commercialization costs and will purchase denosumab from us to meet demand. We havethe option of expanding our role in the commercialization of denosumab in the Primary Territories and certain ofthe Expansion Territories in the future. In the Primary Territories, we will share equally in commercializationprofits and losses related to the collaboration after accounting for expenses, including an amount payable to us inrecognition of our discovery and development of denosumab that will decline as certain sales thresholds are met.GSK will also be responsible for bearing a portion of the cost of certain specified development activities.
Takeda Pharmaceutical Company Limited
In February 2008, we entered into a collaboration agreement with Takeda Pharmaceutical Company Limited(“Takeda”), which provides them the exclusive rights to develop and commercialize for the Japanese market upto 12 clinical stage molecules, including Vectibix®, from our pipeline across a range of therapeutic areas, includ-ing oncology and inflammation. We have the right to participate in the promotion of these products in Japan. Inaddition, we entered into a collaboration agreement with Takeda for the worldwide development andcommercialization of our product candidate motesanib in the oncology area. Each party has the right to partic-ipate in the commercialization of motesanib in the other party’s territory.
Daiichi Sankyo Company, Limited
In July 2007, we entered into a collaboration and license agreement with Daiichi Sankyo, which providesthem the exclusive rights to develop and commercialize our late-stage product candidate, denosumab, in Japan inPMO, oncology and certain other indications. As part of the agreement, Amgen received exclusive worldwiderights to certain Daiichi Sankyo intellectual property to the extent applicable to denosumab.
25
Fresenius Medical Care North America
In October 2006, we entered into a five-year sole sourcing and supply agreement with an affiliate of Frese-nius Medical Care North America (“Fresenius North America”) (a wholly owned subsidiary of FreseniusMedical Care), on its behalf and on behalf of certain of its affiliates, whereby they have agreed to purchase, andwe have agreed to supply, all of Fresenius North America’s commercial requirements for ESAs for use in manag-ing the anemia of its hemodialysis patients in the United States and Puerto Rico, based on forecasts provided byFresenius and subject to the terms and conditions of the agreement.
Government Regulation
Regulation by governmental authorities in the United States and other countries is a significant factor in theproduction and marketing of our products and our ongoing R&D activities.
In order to clinically test, manufacture and market products for therapeutic use, we must satisfy mandatoryprocedures and safety and effectiveness standards established by various regulatory bodies. In the United States,the Public Health Service Act, the Federal Food, Drug and Cosmetic Act (“FDCA”) and the regulations promul-gated thereunder, and other federal and state statutes and regulations govern, among other things, the rawmaterials and components used in the production of, research, development, testing, manufacture, quality control,labeling, storage, record keeping, approval, advertising and promotion, and distribution of our products on aproduct-by-product basis. The failure to comply with the applicable regulatory requirements may subject us to avariety of administrative and/or judicially imposed sanctions. These sanctions could include the FDA’s refusal toapprove pending applications, withdrawals of approvals, delay or suspension of clinical trials, warning letters,product recalls, product seizures, total or partial suspension of our operations, injunctions, fines, civil penaltiesand/or criminal prosecution.
Clinical Development. We must conduct extensive clinical trials designed to establish the safety and effi-cacy of product candidates in order to file for regulatory approval to market a product. Product development andapproval within this regulatory framework takes a number of years and involves our expenditure of substantialresources, and any approval we obtain remains costly for us to maintain. After laboratory analysis and preclinicaltesting in animals, we file an investigational new drug (“IND”) application with the FDA to begin human testing.The IND application automatically becomes effective 30 days after receipt by the FDA, unless the FDA raisesconcerns or questions. In such a case, we and the FDA must resolve any outstanding concerns before the clinicaltrial can begin.
Typically, we undertake a three-phase human clinical testing program. In phase 1, we conduct small clinicaltrials to investigate the safety and proper dose ranges of our product candidates in a small number of human sub-jects. In phase 2, we conduct clinical trials to investigate side effect profiles and efficacy of our productcandidates in a larger number of patients who have the disease or condition under study. In phase 3, we conductclinical trials to investigate the safety and efficacy of our product candidates in a large number of patients whohave the disease or condition under study. The time and expense required for us to perform this clinical testing issubstantial and may vary by product. For example, the clinical trials for the BLA for ProliaTM were large and re-quired substantial time and resources to recruit patients and significant expense to execute. Historically, ourproducts have required smaller, shorter trials. Foreign studies performed under an IND must meet the same re-quirements that apply to U.S. studies. The FDA will accept a foreign clinical study not conducted under an INDonly if the study is well-designed, well-conducted, performed by qualified investigators, and conforms to goodclinical practice. Phase 1, 2 and 3 testing may not be completed successfully within any specified time period, ifat all. (See “Item 1A. Risk Factors — We may not be able to develop commercial products.”) The FDA monitorsthe progress of each trial conducted under an IND and may, at its discretion, re-evaluate, alter, suspend, or termi-nate the testing based upon the data accumulated to that point and the FDA’s risk/benefit assessment with regardto the patients enrolled in the trial. (See “Item 1A. Risk Factors — We must conduct clinical trials in humans be-fore we can commercialize and sell any of our product candidates or existing products for new indications.”)
Applications. The results of preclinical and clinical trials are submitted to the FDA in the form of a BLA forbiologic products subject to the Public Health Service Act or a new drug application (“NDA”) for drugs subject
26
to the approval provisions of the FDCA. The submission of the application is no guarantee that the FDA will findit complete and accept it for filing. If an application is accepted for filing, following the FDA’s review, the FDAmay grant marketing approval, request additional information, or deny the application if it determines that theapplication does not provide an adequate basis for approval. We cannot take any action to market any new drugor biologic product in the United States until our appropriate marketing application has been approved by theFDA.
Post-approval Phase. After we have obtained approval to market our products, we monitor adverse eventsfrom the use of our products and report these events to regulatory agencies, along with information from postmarketing surveillance or studies. We may utilize other research approaches to learn or confirm informationabout our marketed products, including observational studies and patient registries, and may engage in risk man-agement activities such as physician education initiatives and patient advocacy group initiatives. We may alsoconduct, or be required by regulatory agencies to conduct, further clinical trials to provide additional informationon our marketed products’ safety and efficacy. These additional trials may include, among other things, studyingdifferent doses or schedules of administration that were used in previous studies, use in other patient populationsor other stages of the disease or use over a longer period of time. Additional trials of this nature are sometimesrequired by regulatory agencies as a condition of their approval to market our products and they may also requestor require that we conduct specific studies, including observational epidemiological studies, in order to identifyor assess possible safety risks of our marketed products that are observed or suggested by available scientific dataand such trials are sometimes referred to as PMCs or PMRs. In the United States, under the Food and Drug Ad-ministration Amendments Act of 2007 (the “FDAAA”), if the FDA becomes aware of new safety informationafter approval of a product, they may require us to conduct further clinical trials to assess a known or potentialserious risk. If required to conduct a post-approval study, periodic status reports must be submitted to the FDA.Failure to conduct such post-approval studies in a timely manner may result in substantial civil or criminal penal-ties.
The FDAAA also gave the FDA authority to require companies to implement a REMS for a product to en-sure that the benefits of the drug outweigh the risks. The FDA may require the submission of a REMS before aproduct is approved or after approval based on new safety information, including new analyses of existing safetyinformation. In determining whether a product will require a REMS, the FDA may consider a number of factorsincluding:
• estimated size of the population likely to use the product
• seriousness of the condition treated and expected benefits of the product
• duration of treatment with the product
• seriousness of known or potential adverse events associated with the product
• whether the product is a new molecular entity.
All REMS are required to have a timetable for assessment and may have one or more of the following threeelements:
• distribution of a medication guide or a patient package insert to patients
• communication plan for the healthcare provider, such as a Dear Healthcare Professional Letter
• elements to ensure safe use including, but not limited to
O specific training, experience or certification for prescribers
O certification of medication dispensing sites and dispensing in limited settings
O monitoring of specific patients
O enrollment of patients in a registry.
27
Each REMS is unique and varies depending on the specific factors required. Failure to comply with aREMS, including the submission of a required assessment or any modification to a REMS, may result in sub-stantial civil or criminal penalties. We currently have approved REMS for our ESAs, ENBREL and Nplate®.Additionally, in response to the FDA’s request, under authority prescribed by the FDAAA, we are currently indiscussions with the FDA regarding an update to the existing REMS for ENBREL and a REMS for our productcandidate ProliaTM.
Adverse events that are reported after marketing approval also can result in additional limitations beingplaced on a product’s use and, potentially, withdrawal of the product from the market. The FDA has authority tomandate labeling changes to products at any point in a product’s lifecycle based on new safety information or aspart of an evolving label change to a particular class of products. Also under the FDA’s PLR implemented in2006, we are required to make changes to the existing format of U.S. product package inserts for human pre-scription drug and biological products with the intent of making product information more easily accessible. ThePLR requires revised standards of content and format of labeling and provides timelines for when new and pre-viously approved products must comply with the new regulations. During the PLR conversion process from anold format to the new PLR format, the FDA has the authority to evaluate the package insert information to ensurethat it accurately reflects current knowledge and may revise, add or remove information in the old format thatcould substantively impact the content of the product package insert for the new format. Failure to implementFDA-mandated changes may result in civil or criminal penalties. (See “Item 1A. Risk Factors — Our ESA prod-ucts continue to be under review and receive scrutiny by regulatory authorities.” and “— Our current productsand products in development cannot be sold if we do not gain or maintain regulatory approval.”)
The FDA also uses various advisory committees of external experts to assist in its mission to protect andpromote the public health, to obtain independent expert advice on scientific, technical and policy matters. Thecommittees are generally advisory only and FDA officials are not bound to or limited by their recommendations.We have participated in meetings of the ODAC, the CRDAC and the ACRHD, among others, to address certainissues related to Aranesp®, EPOGEN® and ProliaTM, respectively. The FDA has also announced that it will callan advisory committee meeting in 2010 to re-evaluate the use of ESAs to treat anemia in patients with CKD andthe advisory committee could consider lowering targeted Hb levels and reducing approved dosing for ESAs.
FDA Regulation of Product Marketing and Promotion. The FDA closely reviews and regulates the market-ing and promotion of products. We are required to gain FDA approval before marketing or promoting a productas a treatment for a particular indication. Our product promotion for approved product indications must complywith the statutory standards of the FDCA, and the FDA’s implementing regulations and standards. The FDA’sreview of marketing and promotional activities encompasses, but is not limited to, direct-to-consumer advertis-ing, healthcare provider-directed advertising and promotion, sales representative communications to healthcareprofessionals, promotional programming and promotional activities involving the Internet. The FDA may alsoreview industry-sponsored scientific and educational activities. The FDA may take enforcement action against acompany for promoting unapproved uses of a product (“off-label promotion”) or for other violations of its adver-tising and labeling laws and regulations. Enforcement action may include product seizures, injunctions, civil orcriminal penalties or regulatory letters, which may require corrective advertising or other corrective communica-tions to healthcare professionals. Failure to comply with the FDA regulations also can result in adverse publicityor increased scrutiny of company activities by the U.S. Congress or other legislators.
FDA Regulation of Manufacturing Standards. The FDA regulates and inspects equipment, facilities, labo-ratories and processes used in the manufacturing and testing of products prior to providing approval to market aproduct. If after receiving clearance from the FDA, we make a material change in manufacturing equipment,location or process, additional regulatory review may be required. We also must adhere to current Good Manu-facturing Practice (“GMP”) regulations and product-specific regulations enforced by the FDA through itsfacilities inspection program. The FDA also conducts regular, periodic visits to re-inspect our equipment, facili-ties, laboratories and processes following an initial approval. If, as a result of these inspections, the FDAdetermines that our equipment, facilities, laboratories or processes do not comply with applicable FDA regu-lations and conditions of product approval, the FDA may seek civil, criminal or administrative sanctions and/orremedies against us, including the suspension of our manufacturing operations.
28
Approval and Post-Approval Regulation Outside the United States. In the EU countries, Switzerland, Cana-da and Australia, regulatory requirements and approval processes are similar in principle to those in the UnitedStates. Additionally, depending on the type of drug for which approval is sought, there are currently two potentialtracks for marketing approval in the EU, including a centralized procedure. The specific requirements of eachtrack differ depending upon the type of drug being reviewed. In the centralized procedure, a company submits asingle marketing authorization application to the EMA who conducts a thorough evaluation, drawing from itsscientific resources across Europe. If the drug product is proven to fulfill the requirements for quality, safety andefficacy, the CHMP adopts a positive opinion, which is transmitted to the European Commission for final appro-val of the marketing authorization. While the European Commission generally follows the CHMP’s opinion, it isnot bound to do so. Although not all medicines have to undergo the centralized procedure, it is required of prod-ucts derived from biotechnology. After evaluation and marketing authorization, various parties, including thenational competent authorities, the EMA, the European Commission and the marketing authorization holdersshare responsibilities for the detection, assessment and prevention of adverse effects and other medicine-relatedproblems in a process known as pharmacovigilance. Healthcare professionals and patients are also encouraged toreport adverse effects and other medicine-related problems. This process includes the collection of adverse drugreaction reports as part of the follow-up on any side effects of a product, and upon assessment, the authorities candecide to demand that the product labels be updated with safety data or warnings, that safety data or warnings beprovided to healthcare professionals, or recommend the temporary suspension or complete withdrawal of a prod-uct from the market.
Other. We are also subject to various federal and state laws, as well as foreign laws, pertaining to healthcare“fraud and abuse,” including anti-kickback laws and false claims laws. Anti-kickback laws make it illegal to solicit,offer, receive or pay any remuneration in exchange for, or to induce, the referral of business, including the purchaseor prescription of a particular drug that is reimbursed by a state or federal program. The federal government and thestates have published regulations that identify “safe harbors” or exemptions for certain arrangements that do notviolate the anti-kickback statute. We seek to comply with the safe harbors wherever possible. Due to the breadth ofthe statutory provisions and the absence of guidance in the form of regulations or court decisions addressing someof our practices, it is possible that our practices might be challenged under anti-kickback or similar laws. Falseclaims laws prohibit anyone from knowingly and willingly presenting, or causing to be presented for payment tothird-party payers (including Medicare and Medicaid), claims for reimbursed drugs or services that are false orfraudulent, claims for items or services not provided as claimed or claims for medically unnecessary items or serv-ices. Our activities relating to the sale and marketing of our products may be subject to scrutiny under these laws.Violations of fraud and abuse laws may be punishable by criminal and/or civil sanctions, including fines and civilmonetary penalties, as well as the possibility of exclusion from federal healthcare programs (including Medicareand Medicaid). If the government was to allege against or convict us of violating these laws or we entered into a set-tlement with the government, there could be a material adverse effect on our business, including our stock price.Our activities could be subject to challenge for the reasons discussed above and due to the broad scope of these lawsand the increasing attention being given to them by law enforcement authorities.
Since 1991, we have participated in the Medicaid drug rebate program established in Section 1927 of theSocial Security Act by the Omnibus Budget Reconciliation Act of 1990 and subsequent amendments of that law.Related to our participation in this program is a requirement that we extend comparable discounts under the Pub-lic Health Service (“PHS”) drug pricing program. Under the Medicaid drug rebate program, we pay a rebate foreach unit of our product reimbursed by Medicaid. The amount of the rebate for each of our products is currentlyset by law as a minimum 15.1% of the Average Manufacturer Price (“AMP”) of that product, or if it is greater,the difference between AMP and the best price available from us to any non-exempt customer. The rebateamount also includes an inflation adjustment if AMP increases faster than inflation. The PHS pricing programrequires that we extend discounts comparable to the Medicaid rebate to a variety of community health clinics andother entities that receive health services grants from the PHS, as well as hospitals that serve a disproportionateshare of Medicare and Medicaid beneficiaries. The rebate amount is determined for each quarter based on ourreports to CMS of the quarter’s AMP and best price for each of our products. The terms of our participation inthe Medicaid drug rebate program impose an obligation to correct the prices reported in previous quarters, asmay be necessary. Any such corrections could result in an overage or underage in our rebate liability for past
29
quarters, depending on the direction of the correction. In addition to retroactive rebates, if we were found to haveknowingly submitted false information to the government, in addition to other penalties available to the govern-ment, the statute provides for civil monetary penalties in the amount of $100,000 per item of false information.There are also proposals related to both the Medicaid drug rebate program and the PHS drug pricing program aspart of healthcare reform which could significantly alter the programs.
We also make our products available to authorized users of the Federal Supply Schedule (“FSS”) of the Gen-eral Services Administration. Since 1993, as a result of the Veterans Health Care Act of 1992 (the “VHC Act”),federal law has required that we offer deeply discounted FSS contract pricing for purchases by the Department ofVeterans Affairs, the Department of Defense, the Coast Guard and the PHS (including the Indian Health Service)in order for federal funding to be available for reimbursement of our products under the Medicaid program orpurchase of our products by these four federal agencies and certain federal grantees. FSS pricing to these fourfederal agencies must be equal to or less than the Federal Ceiling Price (“FCP”), which is 24% below theNon-Federal Average Manufacturer Price (“Non-FAMP”) for the prior fiscal year. The accuracy of our reportedNon-FAMPs, FCPs and our FSS contract prices may be audited by the government under applicable federal pro-curement laws and the terms of our FSS contract. Among the remedies available to the government forinaccuracies in calculation of Non-FAMPs and FCPs is recoupment of any overcharges to the four specified Fed-eral agencies based on those inaccuracies. Also, if we were found to have knowingly reported a falseNon-FAMP, in addition to other penalties available to the government, the VHC Act provides for civil monetarypenalties of $100,000 per item that is incorrect. Finally, we are required to disclose in our FSS contract proposalall commercial pricing that is equal to or less than our proposed FSS pricing, and subsequent to award of an FSScontract, we are required to monitor certain commercial price reductions and extend commensurate price reduc-tions to the government, under the terms of the FSS contract Price Reductions Clause. Among the remediesavailable to the government for any failure to properly disclose commercial pricing and/or to extend FSS contractprice reductions is recoupment of any FSS overcharges that may result from such omissions.
We are also subject to regulation under the Occupational Safety and Health Act, the Toxic Substances Con-trol Act, the Resource Conservation and Recovery Act and other current and potential future federal, state orlocal laws, rules and/or regulations. Our R&D activities involve the controlled use of hazardous materials, chem-icals, biological materials and various radioactive compounds. We believe that our procedures comply with thestandards prescribed by federal, state or local laws, rules and/or regulations; however, the risk of injury or acci-dental contamination cannot be completely eliminated. While we are not required to do so, we strive to conductour research and manufacturing activities in a manner that meets the intents and purposes of the National In-stitutes of Health Guidelines for Recombinant DNA Research.
Additionally, the U.S. Foreign Corrupt Practices Act (“FCPA”) prohibits U.S. corporations and their representa-tives from offering, promising, authorizing or making payments to any foreign government official, governmentstaff member, political party or political candidate in an attempt to obtain or retain business abroad. The scope of theFCPA would include interactions with certain healthcare professionals in many countries. Our present and futurebusiness has been and will continue to be subject to various other U.S. and foreign laws, rules and/or regulations.
Research and Development and Selected Product Candidates
Our vision is to deliver therapeutics that can make a meaningful difference in patients’ lives. Therefore, wefocus our R&D on novel human therapeutics for the treatment of grievous illness in the areas of oncology, hema-tology, inflammation, bone, nephrology and general medicine, which includes cardiology and neurology. Wetake a modality-independent approach to R&D — that is, we identify targets, and then choose the modality bestsuited to address a specific target. As such, our discovery research programs may yield targets that lead to thedevelopment of human therapeutics delivered as large molecules (such as proteins, antibodies and peptibodies) orsmall molecules.
To execute our clinical trial programs, we need to maintain an effective development organization and asso-ciated R&D support organizations. We conduct clinical trial activities with both our internal staff and third-partycontract clinical trial service providers. In order to increase the number of patients available for enrollment for
30
our clinical trials, we have and will continue to open clinical sites and enroll patients in a number of geographiclocations. (See “Item 1A. Risk Factors — We must conduct clinical trials in humans before we can commerci-alize and sell any of our product candidates or existing products for new indications.”)
We have major R&D centers in several locations throughout the United States and in the United Kingdom,as well as smaller research centers in Canada and Germany, and smaller development facilities throughout Eu-rope and in Canada, Australia, Mexico, Hong Kong and India (see “Item 2. Properties”).
In addition to product candidates and marketed products generated from our internal R&D efforts, we ac-quire companies, acquire and license certain product and technology rights and establish R&D collaborationswith third parties, which enhance our strategic position within our industry by strengthening and diversifying ourR&D capabilities, product pipeline and marketed product base. These licenses and collaboration agreementsgenerally provide for non-refundable, upfront license fees, R&D and commercial performance milestone pay-ments, cost sharing, royalty payments and/or profit sharing. (See “Business Relationships” and Note 3,“Acquisitions” to the Consolidated Financial Statements.)
Some of our competitors are actively engaged in R&D in areas where we have products or where we are de-veloping product candidates or new indications for existing products. For example, we compete with otherclinical trials for eligible patients, which may limit the number of available patients who meet the criteria for cer-tain clinical trials. The competitive marketplace for our product candidates is significantly dependent upon thetiming of entry into the market. Early entry may have important advantages in gaining product acceptance, con-tributing to the product’s eventual success and profitability. Accordingly, we expect that in some cases, therelative speed with which we can develop products, complete clinical testing, receive regulatory approval andsupply commercial quantities of the product to the market is expected to be important to our competitive posi-tion.
Various public and privately owned companies, research organizations, academic institutions and gov-ernmental agencies conduct a significant amount of R&D in the biotechnology industry. We face competition inpursuing collaborative arrangements and licensing or acquisition activities from other pharmaceutical and bio-technology companies that also seek to license or acquire technologies, product candidates or marketed productsfrom these entities. Accordingly, we may have difficulty entering into collaborative arrangements and licensingor acquiring technologies, product candidates and marketed products on acceptable terms.
See “Government Regulation — Clinical Development” for a discussion of the government regulation overclinical development.
31
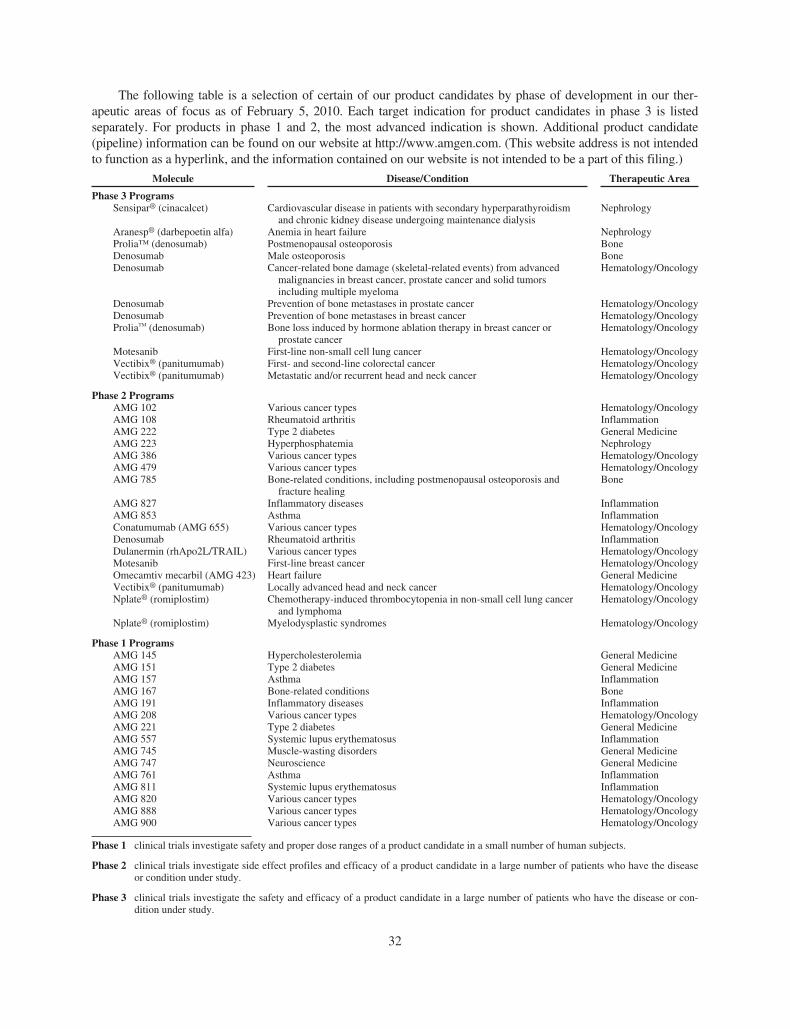
The following table is a selection of certain of our product candidates by phase of development in our ther-apeutic areas of focus as of February 5, 2010. Each target indication for product candidates in phase 3 is listedseparately. For products in phase 1 and 2, the most advanced indication is shown. Additional product candidate(pipeline) information can be found on our website at http://www.amgen.com. (This website address is not intendedto function as a hyperlink, and the information contained on our website is not intended to be a part of this filing.)
Molecule Disease/Condition Therapeutic Area
Phase 3 ProgramsSensipar® (cinacalcet) Cardiovascular disease in patients with secondary hyperparathyroidism
and chronic kidney disease undergoing maintenance dialysisNephrology
Aranesp® (darbepoetin alfa) Anemia in heart failure NephrologyProlia™ (denosumab) Postmenopausal osteoporosis BoneDenosumab Male osteoporosis BoneDenosumab Cancer-related bone damage (skeletal-related events) from advanced
malignancies in breast cancer, prostate cancer and solid tumorsincluding multiple myeloma
Hematology/Oncology
Denosumab Prevention of bone metastases in prostate cancer Hematology/OncologyDenosumab Prevention of bone metastases in breast cancer Hematology/OncologyProlia™ (denosumab) Bone loss induced by hormone ablation therapy in breast cancer or
prostate cancerHematology/Oncology
Motesanib First-line non-small cell lung cancer Hematology/OncologyVectibix® (panitumumab) First- and second-line colorectal cancer Hematology/OncologyVectibix® (panitumumab) Metastatic and/or recurrent head and neck cancer Hematology/Oncology
Phase 2 ProgramsAMG 102 Various cancer types Hematology/OncologyAMG 108 Rheumatoid arthritis InflammationAMG 222 Type 2 diabetes General MedicineAMG 223 Hyperphosphatemia NephrologyAMG 386 Various cancer types Hematology/OncologyAMG 479 Various cancer types Hematology/OncologyAMG 785 Bone-related conditions, including postmenopausal osteoporosis and
fracture healingBone
AMG 827 Inflammatory diseases InflammationAMG 853 Asthma InflammationConatumumab (AMG 655) Various cancer types Hematology/OncologyDenosumab Rheumatoid arthritis InflammationDulanermin (rhApo2L/TRAIL) Various cancer types Hematology/OncologyMotesanib First-line breast cancer Hematology/OncologyOmecamtiv mecarbil (AMG 423) Heart failure General MedicineVectibix® (panitumumab) Locally advanced head and neck cancer Hematology/OncologyNplate® (romiplostim) Chemotherapy-induced thrombocytopenia in non-small cell lung cancer
and lymphomaHematology/Oncology
Nplate® (romiplostim) Myelodysplastic syndromes Hematology/Oncology
Phase 1 ProgramsAMG 145 Hypercholesterolemia General MedicineAMG 151 Type 2 diabetes General MedicineAMG 157 Asthma InflammationAMG 167 Bone-related conditions BoneAMG 191 Inflammatory diseases InflammationAMG 208 Various cancer types Hematology/OncologyAMG 221 Type 2 diabetes General MedicineAMG 557 Systemic lupus erythematosus InflammationAMG 745 Muscle-wasting disorders General MedicineAMG 747 Neuroscience General MedicineAMG 761 Asthma InflammationAMG 811 Systemic lupus erythematosus InflammationAMG 820 Various cancer types Hematology/OncologyAMG 888 Various cancer types Hematology/OncologyAMG 900 Various cancer types Hematology/Oncology
Phase 1 clinical trials investigate safety and proper dose ranges of a product candidate in a small number of human subjects.
Phase 2 clinical trials investigate side effect profiles and efficacy of a product candidate in a large number of patients who have the diseaseor condition under study.
Phase 3 clinical trials investigate the safety and efficacy of a product candidate in a large number of patients who have the disease or con-dition under study.
32
The following text provides additional information about selected product candidates that have advanced in-to human clinical trials.
AMG 102
AMG 102 is a fully human monoclonal antibody that blocks the action of hepatocyte growth factor/scatterfactor. It is being investigated as a cancer treatment.
Phase 2 studies of single agent AMG 102 for renal cell carcinoma (“RCC”) and glioblastoma multiforme(“GBM”) were completed in 2009. Limited efficacy was seen in GBM and RCC when AMG 102 was ad-ministered in monotherapy, and the effect size was not large enough to warrant moving forward with late-stagestudies in these monotherapy indications.
Phase 2 combination studies with AMG 102 in the gastric, prostate, mCRC and small cell lung cancer set-tings continue. We expect data from the phase 2 study in mCRC to be available in 2010.
AMG 108
AMG 108 is a fully human monoclonal antibody that targets inhibition of the action of interleukin-1(“IL-1”).
AMG 222
AMG 222 is an orally-administered small molecule antagonist of DPP-IV. It is being investigated as a treat-ment of type 2 diabetes. AMG 222 is being developed in partnership with Servier.
In July 2009, we received results from a phase 2a study of AMG 222 in patients with type 2 diabetes. Theresults support continued phase 2 development of AMG 222.
AMG 223
AMG 223 is an orally-administered polymer which binds phosphate. It is being investigated as a treatmentof hyperphosphatemia in CKD patients on hemodialysis.
AMG 386
AMG 386 is a peptibody that binds to and inhibits angiopoietin 1 and 2. It is being investigated as a cancertreatment.
In 2007 and 2008, we initiated five randomized phase 2 studies of AMG 386 for the treatment of RCC,metastatic breast cancer, ovarian cancer, gastric cancer and colorectal cancer, and numerous other supportivestudies. Based on study results, we plan to initiate a phase 3 trial in ovarian cancer. We expect the results fromthese other randomized phase 2 studies to be available in 2010 and 2011.
AMG 479
AMG 479 is a fully human monoclonal antibody antagonist of IGF-1 receptor. It is being investigated as acancer treatment.
In 2007, we initiated a phase 2 study of AMG 479 as a potential cancer therapeutic in Ewing’s sarcoma. Wealso initiated, in 2008, phase 2 studies for the treatment of advanced breast, pancreatic, colorectal and small celllung cancers. We received the results from the phase 2 pancreatic cancer study in the second half of 2009 and weplan to present the results at an upcoming medical meeting. We expect the results from the phase 2 Ewing’ssarcoma, metastatic breast cancer and mCRC studies to be available in 2010.
AMG 785
AMG 785 is a humanized monoclonal antibody that targets sclerostin, a protein secreted by bone cells thatinhibits bone formation. AMG 785 (also known as CDP7851) is being developed in collaboration with UCB forbone-related conditions, including PMO and fracture healing.
33
In 2009, we initiated phase 2 studies of AMG 785 for the treatment of PMO and fracture healing.
AMG 827
AMG 827 is a fully human monoclonal antibody that binds to and blocks signaling via the interleukin-17(“IL-17”) receptor. It is being investigated as a treatment for a variety of inflammatory disorders.
In 2009, we initiated phase 2 studies of AMG 827 as a potential treatment for psoriasis and RA. We expectdata from the phase 2 study in psoriasis to be available in 2010.
AMG 853
AMG 853 is an orally-administered small molecule antagonist of the CRTH2 and D-prostanoid receptors ofprostaglandin D2. It is being investigated as a treatment for asthma.
Phase 1 single- and multiple-ascending dose studies have been completed. A global, randomized, double-blind, placebo controlled, multiple dose phase 2 study in subjects with inadequately controlled asthma wasinitiated in December 2009.
Aranesp® (darbepoetin alfa)
Aranesp® is a recombinant human protein agonist of the erythropoietic receptor.
In 2009, we announced the results from TREAT, the large, randomized, double-blind, placebo-controlled,phase 3 study of patients with CKD (not requiring dialysis), anemia and type-2 diabetes. Treatment of anemiawith Aranesp® to a Hb target of 13 g/dL failed to meet either of two primary endpoints compared with placebotreatment with Aranesp® when the Hb level was less than 9 g/dL. The two primary endpoints were a compositeof time to all-cause mortality or cardiovascular morbidity (including heart failure, heart attack, stroke or hospital-ization for myocardial ischemia) and a composite of time to all-cause mortality or chronic renal replacementtherapy. Among the components of the TREAT outcomes measures, stroke was more likely to occur in the pa-tients who received Aranesp® (101 patients [5.0%] versus 53 patients [2.6%]; Hazard Ratio (“HR”): 1.92 [95%Confidence Interval (“CI”) 1.38 to 2.68; P<0.001]). Although stroke has been noted in the Aranesp® label since2001, the risk of stroke observed in TREAT was of a higher magnitude than that seen in previous clinical trials inCKD patients not on dialysis. Further, among patients who reported a history of cancer, there were 60 deathsfrom any cause in the 188 patients assigned to Aranesp® and 37 deaths in the 160 patients assigned to placebo(P=0.13 by the log-rank test). In this subgroup, 14 of the 188 patients assigned to Aranesp® died from cancer, ascompared with 1 of the 160 patients assigned to placebo (P=0.002 by the log-rank test). Aranesp® treatment wasassociated with a statistically significant reduction in blood transfusions.
The Reduction of Events with Darbepoetin alfa in Heart Failure (“RED-HF™”) Trial phase 3 study, initiatedin 2006, is a large (2,600 subjects), global, randomized, double-blind, placebo-controlled study to evaluate theeffect of treatment of anemia with darbepoetin alfa on morbidity and mortality in patients with symptomatic leftventricular heart failure. The RED-HF™ Trial continues to enroll subjects. On December 8, 2009, the RED-HF™
Trial Data Monitoring Committee (“DMC”) reviewed approximately 43% of the target number of primary end-points. After careful review of outcomes and adverse events, including the results of TREAT (which wasconducted in subjects with CKD, anemia and type 2 diabetes who were not receiving dialysis), the RED-HF™
Trial DMC recommended that the study continue as designed.
Conatumumab (AMG 655)
Conatumumab is a fully human monoclonal antibody agonist that targets death receptor 5 (“DR5”) and in-duces apoptosis in sensitive tumor cells. It is being investigated as a cancer treatment.
We received the results from the phase 2 NSCLC and the soft tissue sarcoma studies in the second half of2009 and we continue to analyze the data. We also received results from the phase 2 pancreatic cancer study andwe plan to present the results at an upcoming medical meeting. We expect data from an on-going phase 2 studyin mCRC to be available in 2010.
34
Dulanermin (rhApo2L/TRAIL)
Dulanermin is a recombinant human protein that targets death receptors 4 (“DR4”) and DR5 and inducesapoptosis in sensitive tumor cells. It is being investigated as a cancer treatment. We are developing this moleculein collaboration with Genentech, Inc., a wholly owned member of the Roche Group.
Phase 2 data from the non-Hodgkin’s Lymphoma and NSCLC studies have been analyzed and we plan topresent the results at an upcoming medical meeting.
Denosumab
Denosumab is a fully human monoclonal antibody that specifically targets a ligand known as RANKL (thatbinds to a receptor known as RANK) which is a key mediator of osteoclast formation, function and survival. De-nosumab is being studied across a range of conditions including osteoporosis, treatment-induced bone loss, bonemetastases, multiple myeloma and RA.
The overall denosumab program remains on track with all completed phase 3 trials for denosumab havingmet all primary endpoints. The following chart is an overview of the phase 3 clinical development program fordenosumab:
Program Area IndicationEnrollment
Status Projected Data Availability
Osteoporosis PMO Treatment (versus placebo) Complete ReceivedOsteoporosis PMO Treatment (versus ALN) Complete ReceivedOsteoporosis PMO Prevention Complete ReceivedOsteoporosis PMO Transition (from ALN) Complete ReceivedOsteoporosis Male Osteoporosis Enrolling 2012Oncology Treatment-Induced Bone Loss-Prostate Cancer Complete ReceivedOncology Treatment-Induced Bone Loss-Breast Cancer Complete ReceivedOncology Bone Metastases-Prostate Cancer Complete 2010(1)
Oncology Bone Metastases-Breast Cancer Approved TBD(2)
Oncology Skeletal-Related Events-Breast Cancer Complete ReceivedOncology Skeletal-Related Events-Solid Tumors/multiple myeloma Complete ReceivedOncology Skeletal-Related Events-Prostate Cancer Complete Received
(1) Event-driven study and consequently data availability may vary as a result(2) TBD = to be determined
In 2009, we announced that a pivotal, phase 3, head-to-head trial evaluating denosumab versus Zometa® inthe treatment of bone metastases in 2,046 patients with advanced breast cancer met its primary endpoint (non-inferiority compared to Zometa®) and secondary endpoints (superiority compared to Zometa®). Superior efficacycompared to Zometa® was demonstrated for both delaying the time to the first on-study SREs (fracture, radiationto bone, surgery to bone or spinal cord compression) (HR: 0.82 [95% CI 0.71 - 0.95]), and delaying the time tothe first-and-subsequent SREs (HR: 0.77 [95% CI 0.66 - 0.89]). Both results were statistically significant in this34 month study. The median time to first on-study SRE was not reached for denosumab and therefore could notbe estimated. The median time to first on-study SRE was 26.5 months for Zometa®, the current standard of care.Overall, the incidence of adverse events and serious adverse events was consistent with what has previously beenreported for these two agents. Of note, osteonecrosis of the jaw (“ONJ”), which had not been observed in pre-viously reported phase 3 studies with denosumab, was seen infrequently in both treatment groups (20 patientsreceiving denosumab as compared with 14 patients receiving Zometa®). There was no statistically significantdifference in the rate of ONJ between the two treatment arms. Infectious adverse events were balanced betweenthe two treatment arms, as was OS and the time to cancer progression.
In 2009, we also announced that a pivotal, phase 3, head-to-head trial evaluating denosumab administeredsubcutaneously versus Zometa® administered as an intravenous infusion in the treatment of bone metastases in1,776 advanced cancer patients with solid tumors (not including breast and prostate cancer) or multiple myeloma
35
met its primary endpoint. For the primary endpoint of this study, the median time to first on-study SRE (fracture,radiation to bone, surgery to bone or spinal cord compression) was 20.6 months for those patients receivingdenosumab and 16.3 months for those patients receiving Zometa® (HR: 0.84, 95% CI: 0.71-0.98), which is stat-istically significant for non-inferiority (p=0.0007). Although numerically greater, the delay in the time to firstSRE associated with denosumab was not statistically superior compared to Zometa® based upon the statisticaltesting strategy (adjusted p=0.06) (secondary endpoint). The time to first-and-subsequent SRE was also numeri-cally greater but not statistically superior compared to Zometa® (HR: 0.90 [95% CI 0.77 - 1.04]) (secondaryendpoint). Overall, the incidence of adverse events and serious adverse events was consistent with what has pre-viously been reported for these two agents. Rates of ONJ were balanced and infrequent in both treatment groups(10 patients receiving denosumab as compared with 11 patients receiving Zometa®). Infectious adverse eventswere balanced between the two treatment arms, as was OS and the time to cancer progression.
On February 8, 2010, we announced that a pivotal, phase 3, head-to-head trial evaluating denosumab versusZometa® in the treatment of bone metastases in 1,901 men with advanced prostate cancer met its primary end-point of non-inferiority in time to first SRE and its secondary endpoints (superiority compared to Zometa® forboth delaying the time to the first on-study SRE and delaying the time to the first-and-subsequent SREs).Denosumab demonstrated superiority over Zometa® for both delaying the time to the first on-study SREs(fracture, radiation to bone, surgery to bone or spinal cord compression) (HR: 0.82 [95% CI 0.71 - 0.95]), and de-laying the time to the first-and-subsequent SREs (HR: 0.82 [95% CI 0.71 - 0.94]). Both results were statisticallysignificant. Overall rates of adverse events and serious adverse events, including infections, were generally sim-ilar between the two arms. ONJ was infrequent (22 patients receiving denosumab as compared with 12 patientsreceiving Zometa®) and there was no statistically significant difference between treatment arms. As with pre-vious studies in advanced cancer patients, hypocalcemia was more frequent in the denosumab arm. Both OS andthe time to cancer progression were balanced between treatment arms.
The phase 3 ‘147 study evaluating denosumab in patients with non-metastatic prostate cancer to preventbone metastases is ongoing. We expect to receive the results from this study the second half of 2010.
Motesanib
Motesanib is an orally-administered small molecule antagonist of vascular endothelial growth factor re-ceptors 1, 2 and 3, platelet-derived growth factor receptor and stem cell factor receptor. It is being investigated asa cancer treatment. We are developing this product in collaboration with Takeda.
Enrollment in the phase 3 first-line NSCLC study (MONET1) evaluating motesanib in combination withpaclitaxel and carboplatin for the first-line treatment of advanced NSCLC is nearly complete. Based on currentevent rates, we anticipate completion of the study in 2011.
In April 2009, Amgen and Millennium announced the phase 2 trial in metastatic breast cancer has been com-pleted and the results support continued development.
Nplate® (romiplostim)
Nplate® is a peptibody agonist of the TPO receptor.
Nplate® is the first FDA-approved agent that acts directly to increase platelet production for the treatment ofthrombocytopenia in splenectomized (spleen removed) and non-splenectomized adults with chronic ITP, whohave had an insufficient response to corticosteroids, immunoglobulins or splenectomy.
In December 2009, we announced results from its first phase 1/2 study evaluating the safety and efficacy ofNplate® in children with chronic ITP. Results of the study showed that treatment with Nplate® appeared to begenerally well-tolerated compared to placebo in children (aged 12 months to less than 18 years old) with chronicITP (treatment related adverse events = 18% versus 20%, respectively).
In addition, we announced results from three studies on the safety and efficacy of Nplate® in adult patientswith myelodysplastic syndromes (“MDS”). Data from two separate phase 2 studies showed that patients with low
36
and intermediate risk MDS currently receiving either decitabine or lenalidomide showed reduced incidence ofclinically significant thrombocytopenic events and platelet transfusions with the addition of Nplate® treatment.
We are also evaluating Nplate® in chemotherapy-induced thrombocytopenia.
Omecamtiv mecarbil (AMG 423)
Omecamtiv mecarbil is a small molecule activator of cardiac myosin. Omecamtiv mecarbil is being inves-tigated to improve cardiac contractility in subjects with heart failure. We are developing this product incollaboration with Cytokinetics, Inc. (“Cytokinetics”).
In May 2009, Cytokinetics and Amgen Inc. announced that Amgen had exercised its option to obtain an ex-clusive license, worldwide (excluding Japan), to Cytokinetics’ cardiac contractility program, which includesomecamtiv mecarbil.
Sensipar® (cinacalcet)
Sensipar®/Mimpara® is an orally-administered small molecule that lowers PTH levels in blood by signalingthrough the calcium-sensing receptor in parathyroid tissue to inhibit PTH secretion. It also lowers blood calciumand phosphorous levels.
The phase 3 EValuation Of Cinacalcet HCl Therapy to Lower CardioVascular Events (“E.V.O.L.V.E.™”) tri-al, initiated in 2006, is a large (3,800 patient), multi-center, international, randomized, double-blind study toassess the effects of Sensipar® on mortality and cardiovascular morbidity in patients with CKD undergoing main-tenance dialysis. The E.V.O.L.V.E.™ study completed enrollment in January 2008. Based on current event rates,we anticipate completion of the study in dialysis patients in 2011.
Vectibix® (panitumumab)
Vectibix® is a fully human monoclonal antibody antagonist of the EGFr pathway. It is being investigated asa cancer treatment.
In September 2009, we announced detailed results from the phase 3 ‘181 trial evaluating Vectibix® incombination with FOLFIRI (an irinotecan-based chemotherapy), as a second-line treatment for mCRC. The ‘181trial is a global, multicenter, randomized phase 3 study. Patients enrolled in the study were randomized to receiveeither 6.0 milligram/kilogram of Vectibix® and FOLFIRI once every two weeks or FOLFIRI alone once everytwo weeks. The independently tested co-primary endpoints were PFS and OS. Secondary endpoints included ob-jective response rate, time to progression, duration of response and safety by KRAS status. Originally designed tocompare the treatment effect in the overall population, the study was amended to analyze outcomes with respectto the presence or absence of activating mutations in KRAS. Tumor KRAS status was ascertained in 91% of the1,186 patients enrolled in this trial, the highest number ever reported for a second-line trial. In this trial, Vecti-bix® significantly improved PFS in patients with KRAS wild-type mCRC. The addition of Vectibix® to FOLFIRIsignificantly improved median PFS (co-primary endpoint) by two months (5.9 months versus 3.9 months for pa-tients treated with FOLFIRI alone, HR: 0.73, p=0.004) in patients with KRAS wild-type mCRC. Althoughnumerically greater (14.5 months versus 12.5 months, HR: 0.85), the improvement in median OS (co-primaryendpoint) in the Vectibix® arm did not achieve statistical significance (p=0.115) in the same patient population.Further, the addition of Vectibix® to FOLFIRI resulted in greater than a three-fold improvement (35% versus10%) in response rate in the KRAS wild-type patient population as measured by a blinded central review. In gen-eral, adverse events rates were comparable across arms with the exception of known toxicities associated withanti-EGFr therapy such as rash, diarrhea and hypomagnesemia. Vectibix®-related grade 3/4 infusion reactionswere reported in less than 1% of patients. There were no differences in PFS, OS and response rates among pa-tients with mutated KRAS who received Vectibix®. Tumor KRAS tests were finalized after the completion ofenrollment and prior to the primary analysis.
Also in September 2009, we announced detailed results from the phase 3 ‘203 trial evaluating Vectibix®
administered in combination with FOLFOX (an oxaliplatin-based chemotherapy) as the first-line treatment of
37
mCRC. In this trial, Vectibix® significantly improved median PFS by 1.6 months (9.6 months versus 8.0 monthsfor patients treated with FOLFOX alone, (HR: 0.80; p=0.02)) in patients with KRAS wild-type mCRC (primaryendpoint). Further, the addition of Vectibix® to chemotherapy also increased the response rate in the KRAS wild-type patient population as measured by blinded central review (55% versus 48% in the FOLFOX only arm).Importantly, in patients with tumors harboring activating KRAS mutations, PFS was significantly inferior in theVectibix® arm. For patients with mutant KRAS tumors, median PFS was 7.3 months with Vectibix® in combina-tion with FOLFOX versus 8.8 months with FOLFOX alone (HR: 1.29, p=0.02). These data confirm previousfindings when oxaliplatin-based chemotherapy and an anti-EGFr antibody are combined in patients bearing tu-mors with activating KRAS mutations. Adverse event rates were comparable across arms with the exception ofknown toxicities associated with anti-EGFr therapy such as rash, diarrhea and hypomagnesemia. Vectibix®-related grade 3 infusion reactions were reported for two patients (less than 1%). Originally designed to comparethe treatment effect in the overall population, the study was amended to analyze outcomes with respect to thepresence or absence of activating mutations in KRAS in the tumor itself. Tumor KRAS status was ascertained in93% of the 1,183 patients enrolled in the trial, the highest percentage ever reported. Tumor KRAS tests werefinalized after the completion of enrollment and prior to the primary analysis.
In November 2009, we announced that the phase 3 ‘203 trial evaluating Vectibix® administered in combina-tion with FOLFOX (an oxaliplatin-based chemotherapy) as a first-line treatment of mCRC failed to meet asecondary endpoint of OS. The prospective analysis of the ‘203 study showed that Vectibix®, when added to aFOLFOX chemotherapy regimen in patients with KRAS wild-type mCRC, resulted in a median OS of 23.9months compared to 19.7 months for patients treated with FOLFOX alone. The median OS difference of 4.2months in the Vectibix® arm did not reach statistical significance (HR: 0.83, p=0.072). OS appeared to be re-duced in patients with KRAS mutant tumors receiving Vectibix®. Although not statistically significant, this resultemphasizes the importance, as described in product labeling, of ensuring that patients receiving Vectibix® do notbear tumors containing KRAS mutations.
In 2007, we initiated a phase 3 study for the first-line treatment of metastatic squamous cell carcinoma ofthe head and neck (“SCCHN”) as well as two randomized phase 2 studies in locally advanced SCCHN testingVectibix® in combination with chemoradiotherapy or with radiotherapy alone. We expect the results from thisstudy to be available in 2010. Vectibix® is also being investigated in combination with other investigational anti-cancer therapies.
Human Resources
As of December 31, 2009, we had approximately 17,200 staff members, which include approximately 200part-time staff members. There can be no assurance that we will be able to continue attracting and retainingqualified personnel in sufficient numbers to meet our needs. None of our staff members are covered by a collec-tive bargaining agreement, and we have experienced no work stoppages. We consider our staff relations to begood.
Trade secret protection for our unpatented confidential and proprietary information is important to us. Toprotect our trade secrets, we generally require our staff members, material consultants and scientific advisors toexecute confidentiality agreements upon the commencement of employment or the consulting relationship withus. However, others could either develop independently the same or similar information or obtain access to ourinformation.
Executive Officers of the Registrant
The executive officers of the Company as of January 31, 2010 are as follows:
Mr. Kevin W. Sharer, age 61, has served as a director of the Company since November 1992. Chief Execu-tive Officer and President of the Company and has also been Chairman of the Board of Directors since January2001. From October 1992 to May 2000, Mr. Sharer served as President and Chief Operating Officer of the Com-pany. From April 1989 to October 1992, Mr. Sharer was President of the Business Markets Division of MCI
38
Communications Corporation (“MCI”). From February 1984 to March 1989, Mr. Sharer held numerous execu-tive capacities at General Electric Company (“GE”). Mr. Sharer is a director of Chevron Corporation andNorthrop Grumman Corporation. He is a trustee of the California Institute of Technology, or Caltech.
Mr. David W. Beier, age 61, became Senior Vice President, Global Government and Corporate Affairs inMarch 2008. He joined the Company in 2003 as Senior Vice President, Global Government Affairs. Previously,Mr. Beier was a partner with the law firm of Hogan and Hartson in Washington, D.C. From 1998 to early 2001,Mr. Beier served as Chief Domestic Policy Advisor to the Vice President of the United States. He also held posi-tions as Vice President of Government Affairs and Public Policy for Genentech and staff counsel in the U.S.House of Representatives. Mr. Beier is a director of ARYx Therapeutics, Inc.
Dr. Fabrizio Bonanni, age 63, became Executive Vice President, Operations in August 2007. He has servedas Senior Vice President, Manufacturing of the Company since 2004. Dr. Bonanni joined the Company in 1999as Senior Vice President, Quality and Compliance and in June 2001 he also became the Corporate ComplianceOfficer. Previously, Dr. Bonanni held various management positions at Baxter International, Inc. from 1974 to1999, including positions as Corporate Vice President, Regulatory and Clinical Affairs and Corporate VicePresident, Quality System.
Mr. Robert A. Bradway, age 47, became Executive Vice President and Chief Financial Officer in April2007. He joined the Company in 2006 as Vice President, Operations Strategy. Previously, Mr. Bradway had an18 year career at Morgan Stanley in New York and London where he was a managing director in investmentbanking. Mr. Bradway led Morgan Stanley’s healthcare practice in Europe for several years and also ran MorganStanley’s European banking department.
Mr. Thomas J. Flanagan, age 60, became Senior Vice President and Chief Information Officer in October2006. From June 2004 to October 2006, Mr. Flanagan served as Vice President, Information Systems. From De-cember 1995 to May 2004, Mr. Flanagan served in a variety of executive positions including Chief InformationOfficer and Vice President, Global Service Delivery at MCI.
Mr. Brian McNamee, age 53, became Senior Vice President, Human Resources in June 2001. From No-vember 1999 to June 2001, Mr. McNamee served as Vice President of Human Resources at Dell Computer Corp.From 1998 to 1999, Mr. McNamee served as Senior Vice President, Human Resources for the National Broad-casting Corporation, a division of GE. From July 1988 to November 1999, Mr. McNamee held human resourcepositions at GE.
Mr. George J. Morrow, age 57, became Executive Vice President of Worldwide Sales and Marketing in Jan-uary 2001 and became Executive Vice President, Global Commercial Operations in April 2003. From January1999 to December 2000, Mr. Morrow was President and Chief Executive Officer of Glaxo Wellcome Inc.(“Glaxo”), a subsidiary of GlaxoSmithKline. From January 1997 to December 1998, Mr. Morrow was ManagingDirector of Glaxo Wellcome U.K., also a subsidiary of GlaxoSmithKline. From May 1993 to December 1996,Mr. Morrow was Group Vice President for Commercial Operations of Glaxo. Mr. Morrow currently serves onthe Board of Directors of Align Technology, Inc.
Dr. Roger M. Perlmutter, age 57, became Executive Vice President, Research and Development in January2001. From July 1999 to December 2000, Dr. Perlmutter was Executive Vice President, Worldwide Basic Re-search and Preclinical Development of Merck Research Laboratories. From February 1999 to July 1999,Dr. Perlmutter served as Executive Vice President of Merck Research Laboratories, and from February 1997 toJanuary 1999, as Senior Vice President of Merck Research Laboratories. From May 1989 to January 1997,Dr. Perlmutter was also Chairman of the Department of Immunology, University of Washington, and from Jan-uary 1991 to January 1997, Professor in the Departments of Immunology, Biochemistry and Medicine,University of Washington. From July 1984 to January 1997, Dr. Perlmutter served as Investigator at the HowardHughes Medical Institute at the University of Washington. Dr. Perlmutter currently serves on the Board of Direc-tors of StemCells, Inc.
Ms. Anna S. Richo, age 49, became Senior Vice President and Chief Compliance Officer in June 2008.From December 2003 to June 2008, Ms. Richo served as Vice President, Law. Prior to Amgen, she spent 12
39
years at Baxter Healthcare Corporation in roles of increasing responsibility in law, including Vice President,Law, for Baxter’s BioScience Division. Also, for more than five years, Ms. Richo served on the Board of Direc-tors of Cytyc Corporation and was a member of the Audit and Finance Committees.
Mr. David J. Scott, age 57, became Senior Vice President, General Counsel and Secretary in March 2004.From May 1999 to February 2004, Mr. Scott served as Senior Vice President and General Counsel of Medtronic,Inc. and also as Secretary from January 2000. From December 1997 to April 1999, Mr. Scott served as GeneralCounsel of London-based United Distillers & Vintners. Mr. Scott also served in executive roles at Grand Metro-politan plc and RJR Nabisco, Inc., and was an attorney in private practice.
Geographic Area Financial Information
For financial information concerning the geographic areas in which we operate, see Note 21, “Segment in-formation — Geographic information” to the Consolidated Financial Statements.
Investor Information
Financial and other information about us is available on our website (http://www.amgen.com) (This websiteaddress is not intended to function as a hyperlink, and the information contained in our website is not intended tobe a part of this filing). We make available on our website, free of charge, copies of our annual report on Form10-K, quarterly reports on Form 10-Q, current reports on Form 8-K and amendments to those reports filed orfurnished pursuant to Section 13(a) or 15(d) of the Exchange Act as soon as reasonably practicable after filing orsubmitting such material electronically or otherwise furnishing it to the SEC. In addition, we have previouslyfiled registration statements and other documents with the SEC. Any document we file may be inspected, withoutcharge, at the SEC’s public reference room at 100 F Street NE, Washington, D.C. 20549 or at the SEC’s internetaddress at http://www.sec.gov. Information related to the operation of the SEC’s public reference room may beobtained by calling the SEC at 1-800-SEC-0330.
Item 1A. RISK FACTORS
This report and other documents we file with the SEC contain forward looking statements that are based oncurrent expectations, estimates, forecasts and projections about us, our future performance, our business or otherson our behalf, our beliefs and our management’s assumptions. These statements are not guarantees of future per-formance and involve certain risks, uncertainties and assumptions that are difficult to predict. You shouldcarefully consider the risks and uncertainties facing our business. The risks described below are not the only onesfacing us. Our business is also subject to the risks that affect many other companies, such as employment rela-tions, general economic conditions, geopolitical events and international operations. Further, additional risks notcurrently known to us or that we currently believe are immaterial also may impair our business, operations,liquidity and stock price materially and adversely.
Our current products and products in development cannot be sold if we do not gain or maintain regulatoryapproval.
Our business is subject to extensive regulation by numerous state and federal governmental authorities inthe United States, including the FDA, and by foreign regulatory authorities, including the EMA. We are requiredin the United States and in foreign countries to obtain approval from regulatory authorities before we can manu-facture, market and sell our products. Once approved, the FDA and other U.S. and foreign regulatory agencieshave substantial authority to require additional testing, change product labeling or mandate withdrawals of ourproducts. Also, regulatory agencies could add new regulations or change existing regulations at any time, whichcould affect our ability to obtain or maintain approval of our products. Regulatory reform efforts currently underdiscussion by U.S. policymakers may include changes to applicable laws and regulations that could have a sig-nificant impact on our business. For example, the 2007 creation of the FDAAA significantly added to the FDA’sauthority, allowing the FDA to (i) require sponsors of marketed products to conduct post-approval clinical stud-
40
ies; (ii) mandate labeling changes to products and (iii) require sponsors to implement a REMS for a product. Fail-ure to comply with FDAAA requirements could result in significant civil monetary penalties, reputational harmand increased product liability risk. We are unable to predict when and whether any changes to regulatory policyaffecting our business could occur, and such changes could have a material adverse impact on our business.
Obtaining and maintaining regulatory approval has been and will continue to be increasingly difficult, time-consuming and costly. For example, in October 2009 we received Complete Response Letters from the FDA forthe BLA for our late-stage product candidate ProliaTM in the treatment and prevention of PMO and in the treat-ment and prevention of bone loss due to HALT in breast and prostate cancer patients. The Complete ResponseLetter related to the PMO indication requested several items, including further information on the design andbackground adverse event rates that will inform the methodology of our previously submitted post-marketingsurveillance program. The FDA also requested a new clinical program to support approval of ProliaTM for theprevention of PMO, updated safety data and stated that a REMS is necessary for ProliaTM. The Complete Re-sponse Letter related to the HALT indication requested additional information regarding the safety of ProliaTM inpatients with breast cancer receiving aromatase inhibitor therapy and patients with prostate cancer receivingADT. The FDA specifically requested results from additional adequate and well-controlled clinical trials demon-strating that ProliaTM has no detrimental effects on either time to disease progression or OS. On February 19,2010, we announced that the FDA has evaluated the content of our Complete Response submission for ProliaTM
in the treatment of PMO, which we submitted on January 25, 2010, and classified it as a Class 2 resubmission.With the Class 2 designation, the FDA set a corresponding PDUFA action date of July 25, 2010. A significantdelay in regulatory approval to market and sell ProliaTM for the treatment of PMO could have a material adverseaffect on our business and results of operations.
In addition, some of our products are approved by U.S. and foreign regulatory authorities on a conditionalbasis with full approval conditioned upon fulfilling requirements of regulators. Vectibix®, for example, receivedconditional approval in the United States and EU, with final approval conditioned on conducting additional clin-ical trials of the use of Vectibix® as a therapy in treating mCRC. Our conditional approval of Vectibix® in theEU was received in December 2007 and is reviewed annually by the CHMP and in December 2008 and 2009 wereceived renewal of the conditional approval subject to us completing an additional clinical trial in the existingapproved indication. In 2009, the CHMP approved our protocol for this additional clinical trial, which will com-pare the effect of Vectibix® versus Erbitux® on OS for chemorefractory mCRC patients with wild-type KRAStumors. Further, some of our products or product candidates may be used with a companion diagnostic product,such as a test-kit, or companion device, such as an injector or other delivery system. These product candidates orexpanded indications of our products may not be approved if the companion diagnostic product or companiondevice does not gain or maintain regulatory approval. These companion diagnostics and devices may be providedby single-source unaffiliated third-party companies. We are dependent on the sustained cooperation and effort ofthese third-party companies in conducting the studies required for such approval by the applicable regulatoryagencies. Delays in the studies or failure of the third-party company to obtain regulatory approval of the com-panion diagnostic or device could negatively impact the approval of our product candidate or the expandedindication of our product and we may incur increased development costs, delays in regulatory approval, asso-ciated delays in a product candidate reaching the market or the expansion of existing product labels for newindications.
The occurrence of a number of high profile safety events has caused an increased public and governmentalconcern about potential safety issues relating to pharmaceutical and biological products and certain of our prod-ucts and product candidates. (See “— Our ESA products continue to be under review and receive scrutiny byregulatory authorities.”) As a result of this increased concern, safety signals and safety concerns resulting fromclinical trials (including sub-analyses and meta-analyses), market use or other sources are receiving greater scru-tiny. Actual or perceived safety problems could lead to significant revised or restrictive labeling of our approvedproducts or a class of products, potentially including limitations on the use of approved products in certain pa-tients because of:
• the identification of actual or theoretical safety or efficacy concerns with respect to any of our productsby regulatory agencies
41
• an increased rate or number of previously-identified safety-related events
• the discovery of significant problems or safety signals or trends with a similar product that implicates anentire class of products
• subsequent concerns about the sufficiency of the data or studies underlying the label or changes to the un-derlying safety/efficacy analysis related to results from clinical trials, including sub-analyses, or meta-analysis (a meta-analysis is the review of studies using various statistical methods to combine resultsfrom previous separate but related studies) of clinical trials or clinical data performed by us or others
• new legislation or rules by regulatory agencies
For example, on December 16, 2009, based on the TREAT results, we updated the boxed warning in the la-beling information for ESAs, to reflect an increased risk of stroke when ESAs are administered to CRF patientsto target Hb levels of 13 g/dL and above. (See — “Our ESA products continue to be under review and receivescrutiny by regulatory authorities.”)
In addition to revised labeling for our products, discovery of new safety information or previously unknownsafety concerns and/or safety signals with our products could also lead to:
• requirement of risk management activities (including a REMS) related to the promotion and sale of ourproducts
• mandated PMCs or pharmacovigilance programs for our approved products
• product recalls of certain of our approved products
• revocation of approval for our products from the market completely, or within particular therapeuticareas, and/or
• delay in or fewer treatments being approved by the FDA or other regulatory bodies
Product safety concerns could cause regulatory agencies to impose risk management activities upon us(including a REMS), which may require substantial costs and resources to negotiate, develop and implement. Theresults of these risk management activities could:
• impact the ability of healthcare providers to prescribe, dispense or use our products
• limit patient access to our products
• place administrative burdens on healthcare providers in prescribing our products, or
• affect our ability to compete against products that do not have a REMS or similar risk management activ-ities
We currently have approved REMS for our ESAs, ENBREL and Nplate® and are currently in discussionswith the FDA regarding an update to the existing REMS for ENBREL and a REMS for our product candidateProliaTM.
Further, if new medical data or product quality issues suggest an unacceptable safety risk or previously un-identified side-effects, we may withdraw some or all affected product — either voluntarily or by regulatorymandate — in certain therapeutic areas, or completely recall a product presentation from the market for some pe-riod or permanently. For example, in September 2009, we initiated a voluntary recall of a limited number ofENBREL SureClick® lots due to a defect in the glass syringe barrel which resulted in a small number of brokensyringes following assembly of the autoinjector device. We may experience the same or other problems in the fu-ture resulting in broader product recalls or adverse event trends, which may adversely affect the sales of ourproducts. Additionally, if other parties (including our licensees, such as J&J and Pfizer, or independent inves-tigators) report or fail to effectively report to regulatory agencies side effects or other safety concerns that occurfrom their use of our products in clinical trials or studies or from marketed use, resulting regulatory action couldadversely affect the sales of our products and our business and results of operations.
If regulatory authorities determine that we have not complied with regulations in the R&D of a product can-didate, a new indication for an existing product or information to support a current indication, they may not
42
approve the product candidate or new indication or maintain approval of the current indication in its current formor at all, and we would not be able to market and sell it. If we were unable to market and sell our products orproduct candidates, our business and results of operations would be materially and adversely affected. Further,safety signals, trends, adverse events or results from clinical trials or studies performed by us or by others(including our licensees or independent investigators) from the marketed use of our drugs that result in revisedsafety-related labeling or restrictions on the use of our approved products could negatively impact healthcareprovider prescribing behavior, use of our products, regulatory or private health organization medical guidelinesand reimbursement for our products all of which would have a material adverse effect on our business and resultsof operations.
Our ESA products continue to be under review and receive scrutiny by regulatory authorities.
Beginning in 2006, adverse safety results involving ESA products were observed and since that time ourESAs have been the subject of ongoing review and scrutiny from regulatory authorities. In the United States, theFDA continues to review the benefit-risk profile of ESAs, which have resulted and could result in future changesto ESA labeling and usage. For example, we revised the labeling for our ESAs in August 2008, as the FDA di-rected, and since that time have experienced a reduction in our ESA sales, in particular Aranesp® sales in theU.S. supportive cancer care setting. In October 2009, the results from TREAT, a phase 3 pivotal study of patientswith CKD not on dialysis were published in the New England Journal of Medicine. The study failed to meet itsprimary objectives of demonstrating a reduction in all-cause mortality, cardiovascular morbidity, including heartfailure, heart attack, stroke or hospitalization for myocardial ischemia, or time to ESRD. On December 16, 2009,based on the TREAT results, we updated the boxed warning in the labeling information for ESAs, to reflect anincreased risk of stroke when ESAs are administered to CRF patients to target Hb levels of 13 g/dL and above. Inan editorial published in the New England Journal of Medicine in January 2010, the FDA announced that it willcall an advisory committee meeting in 2010 to re-evaluate the use of ESAs to treat anemia in patients with CKDand could consider lowering targeted Hb levels. In addition, CMS has scheduled a MEDCAC meeting for March24, 2010 to examine currently available evidence on the use of ESAs to manage anemia in patients who haveCKD, which may consider the results from the TREAT study. The FDA may also require that we update theREMS for ESAs based on the TREAT results. Although we cannot predict what impact all of these activitiescould have on our business, the revised ESA labeling or any future labeling changes, including any required inconnection with the scheduled advisory committee meeting, our ongoing discussions with the FDA regarding theconversion of the format of our ESA U.S. labels in accordance with the PLR or other changes required by theFDA, the outcome from the MEDCAC meeting or the impact of the approved REMS for ESAs could have amaterial adverse impact on the coverage, reimbursement and sales of our ESAs, which would have a materialadverse effect on our business and results of operations. (See “— Our current products and products indevelopment cannot be sold if we do not gain or maintain regulatory approval.” and “Our sales depend oncoverage and reimbursement from third-party payers.”)
We also have ongoing PMC studies for our ESAs which must be conducted to maintain regulatory approvaland marketing authorization. We have agreed with the FDA to a robust pharmacovigilance program to continueto study the safety surrounding the use of ESAs in the oncology setting and we initiated Study 782 as part of ourAranesp® pharmacovigilance program, a phase 3 non-inferiority study evaluating OS when comparing NSCLCpatients on Aranesp® to patients receiving placebo. We are currently identifying clinical sites for Study 782 andhave begun enrolling patients in the study. Further, in 2008 the FDA and EMA reviewed interim results from thePreoperative Epirubicin Paclitaxel Aranesp® (“PREPARE”) study in neo-adjuvant breast cancer, a PMC study,which were ultimately incorporated into the ESA labeling in both the United States and the EU. We received thefinal results from the PREPARE study in 2009, which were substantially consistent with the interim results, andprovided that data to the FDA and EMA. Although we cannot predict the results or the outcomes of ongoing clin-ical trials, or the extent to which regulatory authorities may require additional labeling changes as a result ofthese or other trials, we cannot exclude the possibility that adverse results from clinical trials, including PMCs,could have a material adverse impact on the reimbursement, use and sales of our ESAs, which would have amaterial adverse effect on our business and results of operations.
43
Regulatory authorities outside the United States have also reviewed and scrutinized the use of our ESA prod-ucts. In June 2008, the EMA recommended updating the product information for ESAs with a new warning fortheir use in cancer patients, which was approved by the European Commission in October 2008. The product in-formation for all ESAs was updated to advise that in some clinical situations blood transfusions should be thepreferred treatment for the management of anemia in patients with cancer and that the decision to administerESAs should be based on a benefit-risk assessment with the participation of the individual patient. Since the Oc-tober 2008 revision, we have experienced a reduction of Aranesp® sales in the supportive cancer care setting inthe EU and, although we cannot predict what further impact the revised EU ESA product information could haveon our business, the reimbursement, use and sales of Aranesp® in Europe could further be materially adverselyaffected, which would have a material adverse effect on our business and results of operations.
Moreover, we continue to receive results from meta-analyses or previously initiated clinical trials usingESAs, including PMCs, and adverse results could negatively impact the use and sales of our ESAs. For example,in September 2008, we announced that we had received a summary of preliminary results from the CochraneCollaboration’s independent meta-analysis of patient-level data from previously conducted, randomized, con-trolled, clinical studies evaluating ESAs in cancer patients which we submitted to the FDA and the EMA. ThisCochrane meta-analysis of patient-level data from previous studies corroborates prior analyses indicating that theuse of ESAs may increase the risk of death in cancer patients. The studies in the analysis all predate the currentlabel, which advises using the least amount of ESA necessary to avoid transfusion but they do not exclude thepotential for adverse outcomes when ESAs are prescribed according to the current label.
We must conduct clinical trials in humans before we can commercialize and sell any of our product candi-dates or existing products for new indications.
Before we can sell any products, we must conduct clinical trials to demonstrate that our product candidatesare safe and effective for use in humans. The results of these clinical trials are used as the basis to obtain regu-latory approval from regulatory authorities such as the FDA. (See — “Our current products and products indevelopment cannot be sold if we do not gain or maintain regulatory approval.”) We are required to conductclinical trials using an appropriate number of trial sites and patients to support the product label claims. Thelength of time, number of trial sites and patients required for clinical trials vary substantially and therefore, wemay spend several years and incur substantial expense in completing certain clinical trials. Delays in plannedclinical trials can result in increased development costs, delays in regulatory approvals, associated delays inproduct candidates reaching the market and revisions to existing product labels. For example, in 2006 we delayedthe start of our phase 3 trial in first-line NSCLC due to an increased frequency of cholecystitis (inflammation ofthe gall bladder) in patients treated with our late-stage product candidate motesanib. Following initiation of thetrial in November 2008, enrollment in this phase 3 trial was temporarily suspended following a planned safetydata review of 600 patients by the study’s independent DMC. In February 2009, the DMC recommended the trialresume enrollment of patients with non-squamous NSCLC only, and in June 2009, we reinitiated enrollment inthis patient population following an FDA-approved revision to the study protocol.
In addition, in order to increase the number of patients available for enrollment for our clinical trials, wehave and will continue to open clinical sites and enroll patients in a number of new geographic locations whereour experience conducting clinical trials is more limited, including Russia, India, East Asia and some Central andSouth American countries either through utilization of third-party contract clinical trial providers entirely or incombination with local staff. Conducting clinical trials in locations where we have limited experience requiressubstantial time and resources to identify and understand the unique regulatory environments of individual coun-tries. If we fail to adequately manage the design, execution and regulatory aspects of our large, complex andregulatory diverse clinical trials, corresponding regulatory approvals may be delayed or we may fail to gain ap-proval for our product candidates or could lose our ability to market existing products in certain therapeutic areasor altogether. If we are unable to market and sell our product candidates or are unable to obtain approvals in thetimeframe needed to execute our product strategies, our business and results of operations would be materiallyadversely affected. Additional information on our clinical trials can be found on our website at www.amgen.com.(This website address is not intended to function as a hyperlink, and the information contained on our website isnot intended to be a part of this filing.)
44
Patients may also suffer adverse medical events or side effects in the course of our, our licensees, partners orindependent investigator’s clinical trials which could:
• delay the clinical trial program
• require additional or longer trials to gain approval
• prohibit regulatory approval of our product candidates or new indications for existing products
• render the product candidate commercially unfeasible or limit our ability to market existing productscompletely or in certain therapeutic areas.
Clinical trials must be designed based on the current standard of medical care. However in certain diseases,such as cancer, the standard of care is evolving rapidly. In these diseases, the duration of time needed to completecertain clinical trials may result in the design of such clinical trials being based on an out of date standard ofmedical care, limiting the utility and application of such trials. We may not obtain favorable clinical trial resultsand may not be able to obtain regulatory approval for new product candidates, new indications for existing prod-ucts or maintenance of our current labels on this basis. Further, clinical trials conducted by others, including ourlicensees, partners or independent investigators, may result in unfavorable clinical trials results that may call intoquestion the safety of our products in off-label or on label uses that may result in label restrictions and/or addi-tional trials.
Even after a product is on the market, safety concerns may require additional or more extensive clinical tri-als as part of a pharmacovigilance program of our product or for approval of a new indication. For example, weare moving forward with Study 782 as part of our Aranesp® pharmacovigilance program. (See “— Our ESAproducts continue to be under review and receive scrutiny by regulatory authorities.”) Additional clinical trialswe initiate, including those required by the FDA, could result in substantial additional expense and the outcomescould result in additional label restrictions or the loss of regulatory approval for an approved indication, each ofwhich may have a material adverse effect on our business and results of operations. Additionally, any negativeresults from such trials could materially affect the extent of approvals, the use, reimbursement and sales of ourproducts.
Our sales depend on coverage and reimbursement from third-party payers.
Sales of all of our principal products are dependent on the availability and extent of coverage and reimburse-ment from third-party payers, including government healthcare programs and private insurance plans. We rely inlarge part on the reimbursement of our principal products through government programs such as Medicare andMedicaid in the United States and similar programs in foreign countries. (See “Item 1. Business —Reimbursement”) The government-sponsored healthcare systems in Europe and other foreign countries are theprimary payers of healthcare costs in those regions. Governments and private payers may regulate prices, re-imbursement levels and/or access to our products to control costs or to affect levels of use of our products. Wecannot predict the availability or level of coverage and reimbursement for our approved products or product can-didates and a reduction in coverage and/or reimbursement for our products could have a material adverse effecton our product sales and results of operations.
Healthcare reform, focused on expanding healthcare coverage to millions of uninsured Americans and re-ducing the rate of increase in the cost of healthcare, remains a priority for President Obama, U.S. Congress and anumber of states. Developments in this area have been highly dynamic and difficult to predict. As recently asFebruary 23, 2010, President Obama released a new proposal for healthcare reform which includes a combinationof provisions from both the Senate and House of Representatives bills passed in late 2009. Certain healthcare re-form proposals being considered, which may or may not be adopted into law, could:
• restrict the coverage and reimbursement of our products by Medicare, Medicaid and other governmentprograms
• reduce the number of years of data exclusivity for innovative biological products potentially leading toearlier biosimilar competition and/or
45
• require additional healthcare reform costs to be borne by pharmaceutical and biotechnology companies.
We cannot predict whether these or any future proposed reform measures will be adopted into law. Health-care cost-containment measures or other healthcare system reforms that are adopted could have a materialadverse effect on our industry generally and any changes to the current U.S. healthcare system that reduce thecoverage and reimbursement of our products, or restrict the way our products are used or prescribed, could havea material adverse impact on our business. (See “— Our current products and products in development cannot besold if we do not gain or maintain regulatory approval.”)
Public and private insurers have pursued, and continue to pursue, aggressive cost containment initiatives,which could result in lower reimbursement rates for our products. For example, most of our products furnished toMedicare beneficiaries in both a physician office setting and hospital outpatient setting are reimbursed under theASP payment methodology. The ASP payment rate for most of our products furnished in the hospital outpatientsetting has been reduced twice since 2007. ASP-based reimbursements of products under Medicare may be be-low or could fall below the cost that some medical providers pay for such products, which would adversely affectsales of our products. We also face certain risks relating to the calculation of ASP. ASP is calculated by themanufacturer based on a statutorily defined formula and submitted to CMS. However, the statute, regulations andCMS guidance do not define specific methodologies for all aspects of the calculation of ASP. For example, in theMedicare Physician Fee Schedule Final Rule for 2010, CMS did not address a proposed methodology for treat-ment of bundled price concessions. Consequently, the current CMS guidance is that manufacturers may make“reasonable assumptions” in their calculation of ASP consistent with the general requirements and the intent ofthe Medicare statute, federal regulations and their customary business practices. As a result, we are required toapply our judgment in certain aspects of calculating ASP which are disclosed to CMS and also are subject to fur-ther CMS review. If our calculation of ASP is incorrect, we could be subject to substantial fines and penaltieswhich could have a material adverse impact on our results of operations.
Other initiatives reviewing the coverage or reimbursement of our products could result in less extensive cov-erage or lower reimbursement rates. For example, in March 2007, CMS announced a review of all Medicarecoverage policies related to the administration of ESAs in non-renal disease applications which is a precursor to aNCD. In July 2007, CMS issued a NCD where it determined that ESA treatment was not reasonable and neces-sary for certain clinical conditions and established Medicare coverage parameters for FDA-approved ESA use inoncology. We believe the restrictions in the NCD on the coverage and reimbursement of ESAs has had a materialadverse effect on the use, reimbursement and sales of Aranesp®, which has had a significant impact to our busi-ness. We believe that the NCD may continue to impact us in the future.
In the dialysis setting, the reimbursement rates for our products may also be subject to downward pressure.In the United States, dialysis providers are primarily reimbursed for EPOGEN® by the federal governmentthrough the ESRD Program of Medicare. The ESRD Program reimburses approved dialysis providers for 80% ofallowed dialysis costs while the remainder is paid by other sources, including patients, state Medicaid programs,private insurance, and to a lesser extent, state kidney patient programs. The ESRD Program reimbursementmethodology is established by federal law and is monitored and implemented by CMS. Since April 2006, theMedicare reimbursement for ESAs administered to dialysis patients has been subject to an EMP, the Medicarepayment review mechanism used by CMS to monitor EPOGEN® and Aranesp® utilization and hematocrit out-comes of dialysis patients. CMS revised the EMP, effective January 2008, further limiting reimbursement forEPOGEN® and Aranesp® in certain cases. Further reduction in reimbursement in the dialysis setting could have amaterial adverse effect on sales of EPOGEN® and Aranesp®, and our business.
In addition, on July 30, 2008, CMS issued a listing of potential topics for future NCDs as a step to increasetransparency in the NCD process, which included as potential topics the use of ESAs in ESRD and CKD. Medi-care currently does not have a NCD for the use of ESAs for anemia in patients who have CKD and CMS has notannounced whether it will proceed with a NCD for ESAs in ESRD or CKD. However, CMS announced it hadscheduled a MEDCAC meeting for March 24, 2010 to review the use of ESAs to manage anemia in patients whohave CKD, which may consider the results of the TREAT study. In February 2010, CMS released the votingquestions the MEDCAC will address, including whether the available evidence in both CKD not on dialysis and
46
ESRD clearly (i) demonstrates the benefits and risks of ESA therapy, (ii) supports a baseline Hb range or (iii) jus-tifies a dose response or maximum dose. CMS will decide whether more evidence is needed to determinewhether ESA treatment is reasonable and necessary to support continued Medicare coverage. CMS may considerinitiating a NCA or a NCD following the MEDCAC and a NCD for ESAs in the renal setting, which may includenon-coverage and/or new dosing and treatment restrictions, could negatively affect use, reimbursement andcoverage, and product sales of our ESA products. Also included in the initial potential future NCD topic list isthe category of thrombopoiesis stimulating agents (platelet growth factors), the category of drugs that includesNplate® although CMS has not announced whether it will proceed with a NCD related to thrombopoiesisstimulating agents.
Additional initiatives addressing the coverage or reimbursement of our products could result in less ex-tensive coverage or lower reimbursement, which could negatively affect sales of our products. For example, onSeptember 15, 2009, CMS released its proposed rule to implement a bundled prospective payment system forESRD facilities as required by the MIPPA. Although we cannot predict what the final rule on the bundled pay-ment system for ESRD facilities will include, implementation of the rule as proposed could have a materialadverse impact on the coverage and reimbursement, use and sales of EPOGEN® and Sensipar®. Healthcare pro-viders may narrow the circumstances in which they prescribe or administer our products if reimbursement ratesare reduced or in anticipation of reimbursement being reduced, which could reduce the use and/or price of ourproducts. A reduction in the use or price of our products could have a material adverse effect on us and our re-sults of operations.
If our intellectual property positions are challenged, invalidated, circumvented or expire, or if we fail to pre-vail in present and future intellectual property litigation, our business could be adversely affected.
Our success depends in part on our ability to obtain and defend patent rights and other intellectual propertyrights that are important to the commercialization of our products and product candidates. The patent positions ofpharmaceutical and biotechnology companies can be highly uncertain and often involve complex legal, scientificand factual questions. Third parties may challenge, invalidate or circumvent our patents and patent applicationsrelating to our products, product candidates and technologies. In addition, our patent positions might not protectus against competitors with similar products or technologies because competing products or technologies maynot infringe our patents. For certain of our product candidates, there are third parties who have patents or pendingpatent applications that they may claim necessitate payment of a royalty or prevent us from commercializingthese product candidates in certain territories. Patent disputes are frequent, costly and can preclude, delay or in-crease the cost of commercialization of products. We are currently, and in the future may be, involved in patentlitigation. A patent dispute or litigation may not discourage a potential violator from bringing the product that isalleged to infringe to market and we may be subject to competition during certain periods of litigation. Further,under the Hatch-Waxman Act, products approved by the FDA under a NDA may be the subject of patent liti-gation with generic competitors before the five year period of data exclusivity provided for under the Hatch-Waxman Act has expired and prior to the expiration of the patents listed for the product. Moreover, if we lose orsettle current or future litigations at certain stages or entirely, we could be subject to competition and/or sig-nificant liabilities; be required to enter into third-party licenses for the infringed product or technology or berequired to cease using the technology or product in dispute. In addition, we cannot guarantee that such licenseswill be available on terms acceptable to us, or at all.
In recent years, policymakers have proposed reforming U.S. patent laws and regulations. For example, pat-ent reform legislation was introduced in both houses of the U.S. Congress in 2009, and the Senate JudiciaryCommittee approved a patent reform bill on April 2, 2009. In general, the proposed legislation attempts to ad-dress issues surrounding the increase in patent litigation by, among other things, establishing new procedures forchallenging patents. While we cannot predict what form any new patent reform laws or regulations ultimatelymay take, final legislation could introduce new substantive rules and procedures for challenging patents, and cer-tain reforms that make it easier for competitors to challenge our patents could have a material adverse effect onour business.
47
We may not be able to develop commercial products.
Successful product development in the biotechnology industry is highly uncertain, and very few R&D proj-ects produce a commercial product. We intend to continue to make significant R&D investments. Productcandidates or new indications for existing products (collectively, “product candidates”) that appear promising inthe early phases of development may fail to reach the market for a number of reasons, such as:
• the product candidate did not demonstrate acceptable clinical trial results even though it demonstratedpositive preclinical trial results
• the product candidate was not effective or more effective than currently available therapies in treating aspecified condition or illness
• the product candidate is not cost effective in light of existing therapeutics
• the product candidate had harmful side effects in humans or animals
• the necessary regulatory bodies, such as the FDA, did not approve our product candidate for an intendeduse
• the product candidate was not economical for us to manufacture and commercialize
• other parties have or may have proprietary rights relating to our product candidate, such as patent rights,and will not let us sell it on reasonable terms, or at all
• we and certain of our licensees, partners or independent investigators may fail to effectively conduct clin-ical development or clinical manufacturing activities
• the regulatory pathway to approval for product candidates is uncertain or not well-defined
For example, after discussions with the FDA we have decided not to file for approval of motesanib in re-fractory thyroid cancer until there is more clarity on what would constitute an appropriate regulatory filingpackage for that indication. Further, several of our product candidates have failed or been discontinued at variousstages in the product development process. For example, in June 2004, we announced that the phase 2 study ofGlial Cell Lined-Derived Neurotrophic Factor (“GDNF”) for the treatment of advanced Parkinson’s disease didnot meet the primary study endpoint upon completion of nine months of the double-blind treatment phase of thestudy. The conclusion was reached even though a small phase 1 pilot investigator-initiated open-label study overa three-year period appeared to result in improvements for advanced Parkinson’s disease patients. Subsequently,we discontinued clinical development of GDNF in patients with advanced Parkinson’s disease.
Our business may be affected by litigation and government investigations.
We and certain of our subsidiaries are involved in legal proceedings. Civil and criminal litigation is in-herently unpredictable, and the outcome can result in excessive verdicts, fines, penalties and/or injunctive reliefthat affect how we operate our business. Defense of litigation claims can be expensive, time-consuming and dis-tracting and it is possible that we could incur judgments or enter into settlements of claims for monetary damagesor change the way we operate our business, which could have a material adverse effect on our results of oper-ations, financial position or cash flows. In addition, product liability is a major risk in testing and marketingbiotechnology and pharmaceutical products. We may face substantial product liability exposure in human clinicaltrials and for products that we sell after regulatory approval. Product liability claims, regardless of their merits,could be costly and divert management’s attention, and adversely affect our reputation and the demand for ourproducts. Amgen and Immunex have previously been named as defendants in product liability actions for certainof our products.
We are also involved in government investigations that arise in the ordinary course of our business. Wehave received subpoenas from a number of government entities, including the U.S. Attorney’s Offices for theEastern District of New York and the Western District of Washington, as well as the Attorneys General of New
48
York and New Jersey. The federal subpoenas have been issued pursuant to the Health Insurance Portability andAccountability Act of 1996 (18 U.S.C. 3486), and by a federal grand jury, while the Attorneys General sub-poenas have been issued pursuant to state specific statutes relating to consumer fraud laws and state false claimsacts. In general, the subpoenas request documents relating to the sales and marketing of our products, and ourcollection and dissemination of information reflecting clinical research as to the safety and efficacy of our ESAs.Based on representations in a U.S. government filing that became public in May 2009 relating to the Massachu-setts Qui Tam Action, we now believe the subpoenas we received from the U.S. Attorney’s Offices for theEastern District of New York and the Western District of Washington also relate to nine additional Qui Tam Ac-tions which are purportedly pending against Amgen, including eight pending in the U.S. District Court for theEastern District of New York and one pending in the U.S. District Court for the Western District of Washington.The U.S. government filing further alleges that a large number of states are involved in the Qui Tam inves-tigations, led by the State of New York. These investigations are represented to be joint criminal and civilinvestigations. On October 30, 2009 fourteen states and the District of Columbia’s state attorneys’ general filedan amended complaint in intervention against Amgen alleging violations of the federal Anti-Kickback Statuteand various state false claims acts. Additionally, the U.S. government may seek to intervene in the lawsuit filedby the states at any time.
Although we cannot predict whether additional proceedings may be initiated against us, or predict whenthese matters may be resolved, it is not unusual for investigations such as these to continue for a considerable pe-riod of time and to require management’s attention and significant legal expense. A determination that we are inviolation of the various federal and state laws that govern the sales and marketing of our products could result infederal criminal liability and/or federal or state civil or administrative liability, and thus could result in sub-stantial financial damages or criminal penalties and possible exclusion from future participation in the Medicareand Medicaid programs. In addition, we may see new governmental investigations of or actions against us citingnovel theories of recovery. Any of these results could have a material adverse effect on our results of operations,financial position or cash flows in the period in which such liabilities are incurred.
Our stock price is volatile.
Our stock price, like that of our peers in the biotechnology industry, is volatile. Our revenues and operatingresults may fluctuate from period to period for a number of reasons. Events such as a delay in product develop-ment or even a relatively small revenue shortfall may cause financial results for a period to be below ourexpectations or projections. As a result, our revenues and operating results and, in turn, our stock price may besubject to significant fluctuations.
The capital and credit markets have experienced extreme volatility and disruption which has led to un-certainty and liquidity issues for both borrowers and investors. Historically, we have occasionally andopportunistically accessed the capital markets to support certain business activities including acquisitions,in-licensing activities, share repurchases and to refinance existing debt. In the event of adverse capital and creditmarket conditions, we may not be able to obtain capital market financing on similar favorable terms, or at all,which could have a material adverse effect on our business and results of operations. Changes in credit ratings is-sued by nationally recognized credit rating agencies could adversely affect our cost of financing and have anadverse effect on the market price of our securities.
Current economic conditions may magnify certain risks that affect our business.
Our operations and performance have been, and may continue to be, affected by economic conditions. Salesof our principal products are dependent, in part, on the availability and extent of reimbursement from third-partypayers, including government programs such as Medicare and Medicaid and private payer healthcare and in-surance programs. (See “— Our sales depend on coverage and reimbursement from third-party payers.”) As aresult of the current global economic downturn, our third-party payers may delay or be unable to satisfy their re-imbursement obligations. A reduction in the availability or extent of reimbursement from government and/orprivate payer healthcare programs could have a material adverse affect on the sales of our products, our businessand results of operations.
49
In addition, as a result of the economic downturn, some employers may seek to reduce costs by reducing oreliminating employer group healthcare plans or transferring a greater portion of healthcare costs to their employ-ees. Job losses or other economic hardships may also result in reduced levels of coverage for some individuals,potentially resulting in lower levels of healthcare coverage for themselves or their families. These economicconditions may affect patients’ ability to afford healthcare as a result of increased co-pay or deductible obliga-tions, greater cost sensitivity to existing co-pay or deductible obligations, lost healthcare insurance coverage orfor other reasons. We believe such conditions have led and could continue to lead to changes in patient behaviorand spending patterns that negatively affect usage of certain of our products, including delaying treatment,rationing prescription medications, leaving prescriptions unfilled, reducing the frequency of visits to healthcarefacilities, utilizing alternative therapies and/or foregoing healthcare insurance coverage. In addition to its effectson consumers, the economic downturn may have also increased cost sensitivities among medical providers in theUnited States, such as oncology clinics, particularly in circumstances where providers may experience challengesin the collection of patient co-pays or be forced to absorb treatment costs as a result of coverage decisions or re-imbursement terms. Collectively, we believe that these changes have resulted and may continue to result inreduced demand for our products, which could continue to adversely affect our business and results of oper-ations. Any resulting decrease in demand for our products could also cause us to experience excess inventorywrite-offs and/or excess capacity or impairment charges at certain of our manufacturing facilities.
Additionally, we rely upon third-parties for certain parts of our business, including licensees and partners,wholesale distributors of our products, contract clinical trial providers, contract manufacturers and single third-party suppliers. Because of the recent volatility in the financial markets, there may be a disruption or delay in theperformance or satisfaction of commitments to us by these third-parties which could have a material adverse af-fect on our business and results of operations. Current economic conditions may adversely affect the ability ofour distributors, customers and suppliers to obtain liquidity required to buy inventory or raw materials and toperform their obligations under agreements with us, which could disrupt our operations. Further, economic con-ditions appear to have affected, and may continue to affect, the business practices of our wholesale distributors ina manner that has and may continue to contribute to lower sales of our products. For example, in the first quarterof 2009, certain of our wholesale distributors lowered their levels of inventory on hand, which we believe wasdone to reduce their carrying costs and improve their results of operations Although we monitor our distributors’,customers’ and suppliers’ financial condition and their liquidity, in order to mitigate our business risks, some ofour distributors, customers and suppliers may become insolvent, which could negatively impact our business andresults of operations.
We maintain a significant portfolio of investments disclosed as cash equivalents and marketable securitieson our Consolidated Balance Sheet. The value of our investments may be adversely affected by interest rate fluc-tuations, downgrades in credit ratings, illiquidity in the capital markets and other factors which may result inother than temporary declines in the value of our investments. Any of these events could cause us to record im-pairment charges with respect to our investment portfolio or to realize losses on the sale of investments.
We rely on single-source third-party suppliers for certain of our raw materials, medical devices and compo-nents.
We rely on single-source unaffiliated third-party suppliers for certain raw materials, medical devices andcomponents necessary for the formulation, fill and finish of our products. Certain of these raw materials, medicaldevices and components are the proprietary products of these unaffiliated third-party suppliers and are specifi-cally cited in our drug application with regulatory agencies so that they must be obtained from that specific solesource and could not be obtained from another supplier unless and until the regulatory agency approved suchsupplier.
Among the reasons we may be unable to obtain these raw materials, medical devices and components in-clude:
• regulatory requirements or action by regulatory agencies or others
• adverse financial or other strategic developments at or affecting the supplier
50
• unexpected demand for or shortage of raw materials, medical devices or components
• labor disputes or shortages, including the effects of a pandemic flu outbreak or otherwise
• failure to comply with our quality standards which results in quality and product failures, product con-tamination and/or recall
These events could adversely affect our ability to satisfy demand for our products, which could adversely af-fect our product sales and operating results materially. For example, we have experienced shortages in certaincomponents necessary for the formulation, fill and finish of certain of our products in our Puerto Rico facilitywithout impact on our ability to supply these products. However, we may experience these or other shortages inthe future resulting in delayed shipments, supply constraints, contract disputes and/or stock-outs of our products.Also, certain of the raw materials required in the commercial and clinical manufacturing and the formulation ofour products are sourced from other countries and/or derived from biological sources, including mammalian tis-sues. In addition, one of our marketed products also includes bovine serum and HSA. Some countries in whichwe market our products may restrict the use of certain biologically derived substances in the manufacture ofdrugs. We continue to investigate alternatives to certain biological sources and alternative manufacturing proc-esses that do not require the use of certain biologically derived substances as such raw materials may be subjectto contamination and/or recall.
A material shortage, contamination, recall and/or restriction of the use of certain biologically derived sub-stances or other raw materials, which may be sourced from other countries, used in the manufacture of ourproducts could adversely impact or disrupt our commercial manufacturing of our products or could result in amandated withdrawal of our products from the market. This could adversely affect our ability to satisfy demandfor our products, which could adversely affect our product sales and operating results materially. Further, anydisruptions or delays by us or by third-party suppliers or partners in converting to alternatives to certain bio-logically derived substances and alternative manufacturing processes or our ability to gain regulatory approvalfor the alternative materials and manufacturing processes could increase our associated costs or result in the rec-ognition of an impairment in the carrying value of certain related assets, which could have a material and adverseaffect on our results of operations.
Manufacturing difficulties, disruptions or delays could limit supply of our products and limit our productsales.
Manufacturing biologic human therapeutic products is difficult, complex and highly regulated. We currentlymanufacture all of our principal products and plan to manufacture many of our product candidates. In addition,we currently use third-party contract manufacturers to produce or assist in the production of ENBREL, Sensi-par®/Mimpara® and Nplate® as well as our late-stage product candidate denosumab and plan to use contractmanufacturers to produce a number of our other late-stage product candidates. Our ability to adequately andtimely manufacture and supply our products is dependent on the uninterrupted and efficient operation of our fa-cilities and those of our third-party contract manufacturers, which may be impacted by:
• availability or contamination of raw materials and components used in the manufacturing process, partic-ularly those for which we have no other source or supplier
• capacity of our facilities and those of our contract manufacturers
• facility contamination by microorganisms or viruses
• labor disputes or shortages, including the effects of a pandemic flu outbreak
• compliance with regulatory requirements
• changes in forecasts of future demand
• timing and actual number of production runs
• updating of manufacturing specifications
51
• production success rates and bulk drug yields
• timing and outcome of product quality testing
If the efficient manufacture and supply of our products is interrupted, we may experience delayed ship-ments, supply constraints, stock-outs and/or recalls of our products. If we are at any time unable to provide anuninterrupted supply of our products to patients, we may lose patients and physicians may elect to prescribecompeting therapeutics instead of our products, which could materially and adversely affect our product salesand results of operations.
Our manufacturing processes and those of our third-party contract manufacturers must undergo a potentiallylengthy FDA or other regulatory approval process and are subject to continued review by the FDA and otherregulatory authorities. It can take longer than five years to build and license a new manufacturing plant and it cantake longer than three years to qualify and license a new contract manufacturer. In order to maintain supply,mitigate risks associated with the majority of our formulation, fill and finish operations being performed in a sin-gle facility and to satisfy anticipated demand for our late-stage product candidates, in particular denosumab, wemust successfully implement certain manufacturing projects on schedule.
If regulatory authorities determine that we or our third-party contract manufacturers or certain of our third-party service providers have violated regulations or if they restrict, suspend or revoke our prior approvals, theycould prohibit us from manufacturing our products or conducting clinical trials or selling our marketed productsuntil we or the affected third-party contract manufacturers or third-party service providers comply, or indef-initely. Because our third-party contract manufacturers and certain of our third-party service providers are subjectto the FDA and foreign regulatory authorities, alternative qualified third-party contract manufacturers and third-party service providers may not be available on a timely basis or at all. If we or our third-party contractmanufacturers or third-party service providers cease or interrupt production or if our third-party contract manu-facturers and third-party service providers fail to supply materials, products or services to us, we may experiencedelayed shipments, supply constraints, stock-outs and/or recalls of our products. Additionally, we distribute asubstantial volume of our commercial products through a single distribution center in Louisville, Kentucky forthe United States and another in Breda, the Netherlands for Europe and the rest of the world. Our ability to timelysupply products is dependent on the uninterrupted and efficient operations of our distribution and logistics cen-ters and our third-party logistics providers.
We manufacture and formulate, fill and finish substantially all our products at our Puerto Rico manufactur-ing facility; if significant natural disasters or production failures occur at this facility, we may not be ableto supply these products.
We currently perform all of the formulation, fill and finish for EPOGEN®, Aranesp®, Neulasta® and NEUP-OGEN®, and substantially all of the formulation, fill and finish operations for ENBREL, and all of the bulkmanufacturing for Aranesp®, Neulasta® and NEUPOGEN® at our manufacturing facility in Juncos, Puerto Rico.In addition if denosumab is approved by the FDA, it will be primarily produced at the Puerto Rico facility. Ourglobal supply of these products is significantly dependent on the uninterrupted and efficient operation of this fa-cility. A number of factors could adversely affect our operations, including:
• power failures and/or other utility failures
• breakdown, failure or substandard performance of equipment
• improper installation or operation of equipment
• labor disputes or shortages, including the effects of a pandemic flu outbreak
• inability or unwillingness of third-party suppliers to provide raw materials and components
• natural or other disasters, including hurricanes
• failures to comply with regulatory requirements, including those of the FDA
52
In the past, the Puerto Rico facility has experienced manufacturing component shortages and there was evi-dence of adverse trends in the microbial bioburden of the production environment that reduced the productionoutput. The same or other problems may result in our being unable to supply these products, which could ad-versely affect our product sales and operating results materially. Although we have obtained limited insurance toprotect against certain business interruption losses, there can be no assurance that such coverage will be adequateor that such coverage will continue to remain available on acceptable terms, if at all. The extent of the coverageof our insurance could limit our ability to mitigate for lost sales and such losses could materially adversely affectour product sales and operating results. Our Puerto Rico facility is also subject to the same difficulties, dis-ruptions or delays in manufacturing experienced in our other manufacturing facilities. For example, the limitednumber of lots of ENBREL voluntarily recalled in September 2009 were manufactured at our Puerto Rico facilityand we have made commitments to the FDA to address the causes behind the recall. In future inspections, ourfailure to adequately address the FDA’s expectations could lead to further inspections of the facility or regulatoryactions. (See “— Manufacturing difficulties, disruptions or delays could limit supply of our products and limitour product sales.”)
Our marketed products face substantial competition.
We operate in a highly competitive environment. Our products compete with other products or treatmentsfor diseases for which our products may be indicated. Our competitors market products or are actively engaged inR&D in areas where we have products, where we are developing product candidates or new indications for exist-ing products. In the future, we expect that our products will compete with new drugs currently in development,drugs currently approved for other indications that may later be approved for the same indications as those of ourproducts and drugs approved for other indications that are used off-label. Large pharmaceutical companies andgeneric manufacturers of pharmaceutical products are expanding into the biotechnology field with increasingfrequency. These companies may have greater resources than we do. In addition, some of our competitors mayhave technical or competitive advantages over us for the development of technologies and processes. These re-sources may make it difficult for us to compete with them to successfully discover, develop and market newproducts and for our current products to compete with new products or new product indications that these com-petitors may bring to market. As a result, our products may compete against products that have lower prices,equivalent or superior performance, are easier to administer or that are otherwise competitive with our products.
We expect to face increasing competition from biosimilar products which could impact our profitability.
We currently face competition in Europe from biosimilar products, and we expect to face increasing com-petition from biosimilars in the future. Lawmakers in the United States have proposed bills to create a regulatorypathway for the abbreviated approval of biosimilars, and the EU has already created such a regulatory pathway.To the extent that governments adopt more permissive approval frameworks and competitors are able to obtainbroader marketing approval for biosimilars, our products will become subject to increased competition. Expira-tion or successful challenge of applicable patent rights could trigger such competition, and we could face morelitigation regarding the validity and/or scope of our patents.
In the EU, the European Commission has granted marketing authorizations for several biosimilars pursuantto a set of general and product class-specific guidelines for biosimilar approvals issued over the past few years.In 2006, the EMA developed and issued final regulatory guidelines related to the development and approval ofbiosimilar products. The final guidelines included clinical trial guidance for certain biosimilar products, includ-ing erythropoietins and G-CSFs, recommending that applicants seeking approval of such biosimilar productsconduct pharmacodynamic, toxicological and clinical safety studies as well as a pharmacovigilance program.Some companies have received and other companies are seeking approval to market erythropoietin and G-CSFbiosimilars in the EU, presenting additional competition for our products. (See “— Our marketed products facesubstantial competition.”) For example, following the expiration of the principal European patent relating to re-combinant G-CSF in August 2006, the European Commission issued marketing authorizations for the firstG-CSF biosimilar products and the product was launched in certain EU countries in 2008 and 2009. There areseveral G-CSF biosimilars available in the EU marketed by different companies and these G-CSF biosimilar
53
products compete with NEUPOGEN® and Neulasta®. We cannot predict to what extent the entry of biosimilarproducts or other competing products will impact future NEUPOGEN® or Neulasta® sales in the EU. Our inabil-ity to compete effectively could reduce sales, which could have a material adverse effect on our results ofoperations.
In the United States, there is no regulatory pathway for the abbreviated approval of BLAs for biosimilars,but legislation on biosimilars has been proposed and may be enacted in the in the near future. Such biosimilarswould reference biotechnology products already approved under the U.S. Public Health Service Act. Under cur-rent law, potential competitors may introduce biotechnology products in the United States only by filing acomplete BLA. Before biosimilar products could enter the U.S. market through an abbreviated approval process,the U.S. Congress would need to pass legislation to create a new approval pathway and the FDA may also thenpromulgate associated regulations or guidance. The Obama Administration has expressed support for the creationof such an approval pathway for biosimilars, including as a part of its broader healthcare reform effort, which theAdministration has identified as one of its top priorities. In late 2009, both the full House of Representatives andthe Senate passed bills that would provide twelve years of data exclusivity for innovative biological products.Data exclusivity protects the data in the innovator’s regulatory application by, for a limited period of time,prohibiting others from gaining FDA approval based, in part, on reliance or reference to the innovator’s data intheir application to the FDA. The debate on biosimilars continues, however, with a number of members of theU.S. Congress and the Obama administration supporting a shorter period of data exclusivity. We cannot predictwhat the specific provisions of any final legislation might be or the timing of implementation of the pathway bythe FDA. To the extent that an abbreviated biosimilar pathway is created through legislation in the United States,we would likely face greater competition and downward pressure on our product prices, sales and revenues, sub-ject to our ability to enforce our patents. Further, biosimilar manufacturers with approved products in Europemay seek to quickly obtain U.S. approval if an abbreviated regulatory pathway for biosimilars is adopted. How-ever, the absence of an abbreviated approval pathway for biosimilar products may not be a complete barrier tothe introduction of biosimilar-type products in the United States.
Concentration of sales at certain of our wholesaler distributors and consolidation of free-standing dialysisclinic businesses may negatively impact our bargaining power and profit margins.
The substantial majority of our U.S. product sales are made to three pharmaceutical product wholesaler dis-tributors, AmerisourceBergen Corporation, Cardinal Health, Inc. and McKesson Corporation. These distributors,in turn, sell our products to their customers, which include physicians or their clinics, dialysis centers, hospitalsand pharmacies. These entities’ purchasing leverage has increased due to this concentration and consolidationwhich may put pressure on our pricing by their potential ability to extract price discounts on our products or feesfor other services, correspondingly negatively impacting our bargaining position and profit margins. One of ourproducts, EPOGEN®, is primarily sold to free-standing dialysis clinics, which have experienced significant con-solidation. Two organizations, DaVita Inc. and Fresenius North America own or manage a large number of theoutpatient dialysis facilities located in the United States and account for a substantial majority of all EPOGEN®
sales in the free-standing dialysis clinic setting. In October 2006, we entered into a five-year sole sourcing andsupply agreement with an affiliate of Fresenius North America, on its behalf and on behalf of certain of its affili-ates, whereby they have agreed to purchase, and we have agreed to supply, all of Fresenius North America’scommercial requirements for ESAs for use in managing the anemia of its hemodialysis patients in the UnitedStates and Puerto Rico, based on forecasts provided by Fresenius North America and subject to the terms andconditions of the agreement.
Our marketing of ENBREL is dependent in part upon Pfizer (formerly Wyeth).
On October 15, 2009, Pfizer and Wyeth completed their merger and our relationship with Pfizer may be dif-ferent than our prior relationship with Wyeth. Under a co-promotion agreement, we and Pfizer market and sellENBREL in the United States and Canada. A management committee comprised of an equal number of repre-sentatives from us and Pfizer is responsible for overseeing the marketing and sales of ENBREL includingstrategic planning, the approval of an annual marketing plan and the establishment of a brand team. The brand
54
team, with equal representation from us and Pfizer, prepares and implements the annual marketing plan, whichincludes a minimum level of financial and sales personnel commitment from each party, and is responsible for allsales activities. If Pfizer fails to effectively deliver on its marketing commitments to us or if we and Pfizer fail tocoordinate our efforts effectively, our sales of ENBREL may be materially adversely affected.
We may be forced to undertake cost savings and/or restructuring initiatives in the future.
As a result of various regulatory and reimbursement developments that began in 2007, we completed a re-structuring of our worldwide operations in order to improve our cost structure while continuing to makesignificant R&D investments and build the framework for our future growth. As part of these actions, we reducedstaff, made changes to certain capital projects, closed certain production operations and abandoned leases primar-ily for certain R&D facilities that will not be used in our operations. Our business continues to face a variety ofchallenges. As a result, we may be forced to undertake further cost saving and/or restructuring initiatives in thefuture. The current economic climate has forced many U.S. companies to cut costs in order to maintain theircompetitive standing, including through restructurings and reorganizations. We have worked, and we continue towork, to increase cost efficiencies and to reduce discretionary expenditures. The anticipated benefits of our costreduction initiatives are based on forecasts which could vary substantially from actual results, and we cannotprovide assurance that any such cost saving initiatives will not have a material adverse effect on our business.
Guidelines and recommendations published by various organizations can reduce the use of our products.
Government agencies promulgate regulations and guidelines directly applicable to us and to our products.However, professional societies, practice management groups, insurance carriers, physicians, private health/science foundations and organizations involved in various diseases from time to time may also publish guidelinesor recommendations to healthcare providers, administrators and payers, and patient communities. Recom-mendations of government agencies or these other groups/organizations may relate to such matters as usage,dosage, route of administration and use of related therapies and reimbursement of our products by governmentand private payers. Recommendations or guidelines that are followed by patients and healthcare providers couldresult in decreased use and/or dosage of our products. Some examples of agency and organizational guidelinesinclude:
• On July 31, 2009, the Kidney Disease: Improving Global Outcomes group (“KDIGO”) released its Clin-ical Practice Guideline for the Diagnosis, Evaluation, Prevention, and Treatment of Chronic KidneyDisease-Mineral and Bone Disorder (“CKD-MBD”). The guideline includes detailed recommendationsfor the diagnosis and evaluation of the three components of CKD-MBD followed by recommendationsfor treatment. These recommendations could affect how healthcare providers prescribe Sensipar® forESRD patients. The impact of the KDIGO is guidelines on clinical practice or the use of Sensipar® is notyet known.
• In August 2007, the National Kidney Foundation (“NKF”) distributed to the nephrology community finalupdated Kidney Disease Outcomes Quality Initiative (“KDOQI”) clinical practice guidelines and clinicalpractice recommendations for anemia in CKD. The NKF-KDOQI™ Anemia Work Group recommendedin their 2007 Update to the NKF-KDOQI™ Anemia Management Guidelines that physicians target Hb inthe range of 11 g/dL to 12 g/dL, and also stipulated that the target not be above 13 g/dL.
• In February 2007, following the reported results from our Anemia of Cancer (“AoC”) 103 Study, theUnited States Pharmacopoeia Dispensing Information Drug Reference Guides removed Aranesp® in thetreatment of AoC.
Any recommendations or guidelines that result in decreased use, dosage or reimbursement of our productscould adversely affect our product sales and operating results materially. In addition, the perception by theinvestment community or stockholders that such recommendations or guidelines will result in decreased use anddosage of our products could adversely affect the market price for our common stock.
55
Our corporate compliance and risk mitigation programs cannot guarantee that we are in compliance withall potentially applicable U.S. federal and state regulations and all potentially applicable foreign regu-lations and/or that we effectively manage all operational risks.
The development, manufacturing, distribution, pricing, sales, marketing and reimbursement of our products,together with our general operations, are subject to extensive federal and state regulation in the United States andto extensive regulation in foreign countries. (See “— Our current products and products in development cannotbe sold if we do not gain or maintain regulatory approval.” and “— Manufacturing difficulties, disruptions ordelays could limit supply of our products and limit our product sales.”) While we have developed and instituted acorporate compliance program, we cannot guarantee you that we, our employees, our consultants or our con-tractors are or will be in compliance with all potentially applicable U.S. federal and state regulations and/or lawsor all potentially applicable foreign regulations and/or laws. If we or our agents fail to comply with any of theseregulations and/or laws, a range of actions could result, including, but not limited to, the termination of clinicaltrials, the failure to approve a product candidate, restrictions on our products or manufacturing processes, with-drawal of our products from the market, significant fines, exclusion from government healthcare programs orother sanctions or litigation. Additionally, while we have implemented numerous risk mitigation measures, wecannot guarantee that we will be able to effectively mitigate all operational risks. If we fail to effectively mitigateall operational risks, our product supply may be materially adversely affected, which could have a material ad-verse effect on our product sales and results of operations.
Continual process improvement efforts may result in the carrying value of certain existing manufacturingfacilities or other assets becoming impaired or other related charges being incurred.
In connection with our continuous process improvement activities, we evaluate our processes and proce-dures in order to identify opportunities to achieve greater efficiencies in how we conduct our business in order toreduce costs. In particular, we evaluate our manufacturing practices and related processes to increase productionyields and/or success rates as well as capacity utilization to gain increased cost efficiencies. Depending on thetiming and outcomes of these process improvement initiatives, the carrying value of certain manufacturing orother assets may not be fully recoverable and could result in the recognition of impairment charges and/or therecognition of other related charges. The recognition of such charges, if any, could have a material and adverseaffect on our results of operations.
Item 1B. UNRESOLVED STAFF COMMENTS
None.
56
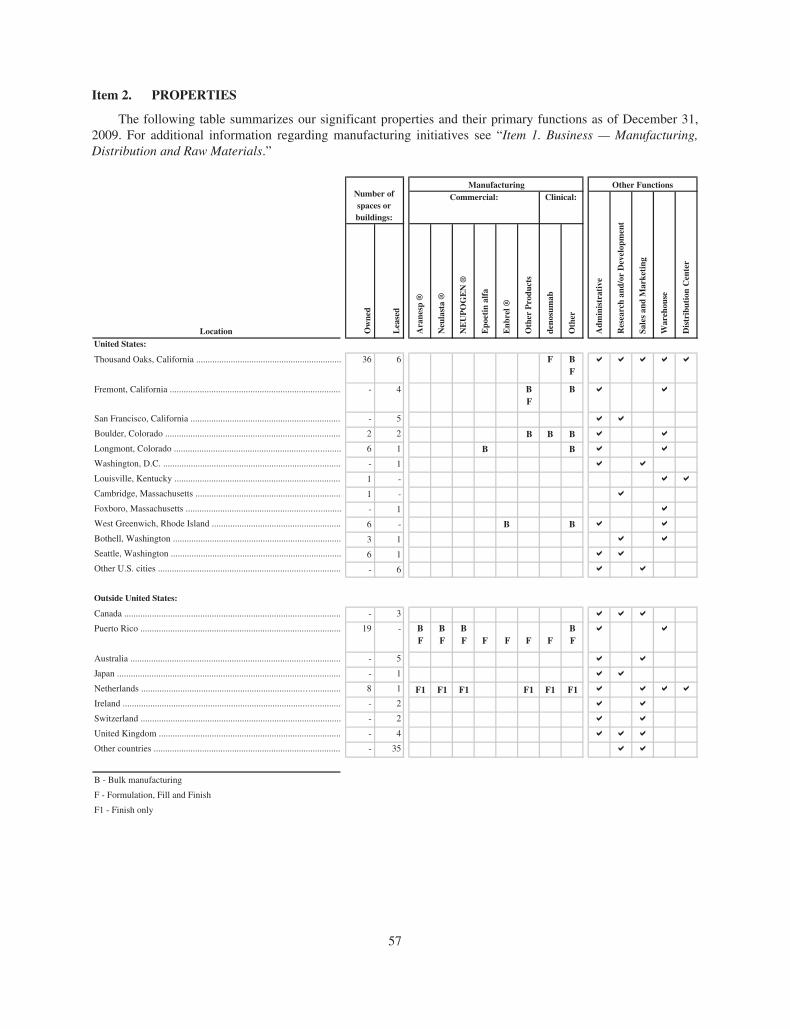
Item 2. PROPERTIES
The following table summarizes our significant properties and their primary functions as of December 31,2009. For additional information regarding manufacturing initiatives see “Item 1. Business — Manufacturing,Distribution and Raw Materials.”
Location Ow
ned
Lea
sed
Ara
nesp
®
Neu
last
a ®
NE
UP
OG
EN
®
Epo
etin
alf
a
Enb
rel ®
Oth
er P
rodu
cts
deno
sum
ab
Oth
er
United States:
Thousand Oaks, California ............................................................... 36
- 5
2 2
6 1
- 1
- 1
6 -
3 1
6 1
- 6
- 3
19 -
- 5
- 1
- 2
- 2
8 1
1 -
1 -
- 4
6 FFB
Fremont, California .......................................................................... BF
B
San Francisco, California .................................................................
Boulder, Colorado ............................................................................ B B
Longmont, Colorado ........................................................................ B B
Washington, D.C. .............................................................................
Louisville, Kentucky ........................................................................
Cambridge, Massachusetts ...............................................................
Foxboro, Massachusetts ...................................................................
West Greenwich, Rhode Island ........................................................ B B
Bothell, Washington .........................................................................
Seattle, Washington ..........................................................................
Other U.S. cities ...............................................................................
Outside United States:
Canada ..............................................................................................
Puerto Rico ....................................................................................... BF
BF
BF F F F F
BF
Australia ...........................................................................................
Japan .................................................................................................
Netherlands ...................................................................................... F1 F1
Ireland ..............................................................................................
Switzerland .......................................................................................
United Kingdom ...............................................................................
Other countries .................................................................................
B - Bulk manufacturing
F - Formulation, Fill and Finish
F1 - Finish only
Number of spaces or buildings:
Other FunctionsCommercial:
Adm
inis
trat
ive
Res
earc
h an
d/or
Dev
elop
men
t
Sale
s an
d M
arke
ting
War
ehou
se
Dis
trib
utio
n C
ente
r
Clinical:Manufacturing
B
F1 F1 F1 F1
- 4
- 35
57
Our corporate headquarters are located in Thousand Oaks, California. In addition to the properties listedabove, we have undeveloped land at certain locations, principally in Thousand Oaks, California; Longmont,Colorado; Louisville, Kentucky; Allentown, Pennsylvania; West Greenwich, Rhode Island; Seattle and Bothell,Washington and Juncos, Puerto Rico, to accommodate future expansion, as required. Excluded from the tableabove are leased properties that have been abandoned and certain buildings that we still own but are no longerused in our business. There are no material encumbrances on our properties.
We believe our facilities are suitable for their intended use and, in conjunction with our third-party contract-ing manufacturing agreements, provide adequate capacity. We also believe that our existing facilities, third-partycontract manufacturing agreements and our anticipated additions are sufficient to meet our expected needs. (See“Item 1A. Risk Factors — We manufacture and formulate, fill and finish substantially all our products at our Pu-erto Rico manufacturing facility; if significant natural disasters or production failures occur at this facility, wemay not be able to supply these products.”, “— We rely on single-source third-party suppliers for certain of ourraw materials, medical devices and components.” and “— Manufacturing difficulties, disruptions or delays couldlimit supply of our products and limit our product sales.”)
Item 3. LEGAL PROCEEDINGS
Certain of our legal proceedings in which we are involved are discussed in Note 20, “Contingencies andcommitments” to our Consolidated Financial Statements in our 2009 Form 10-K and are hereby incorporated byreference.
Item 4. RESERVED
58
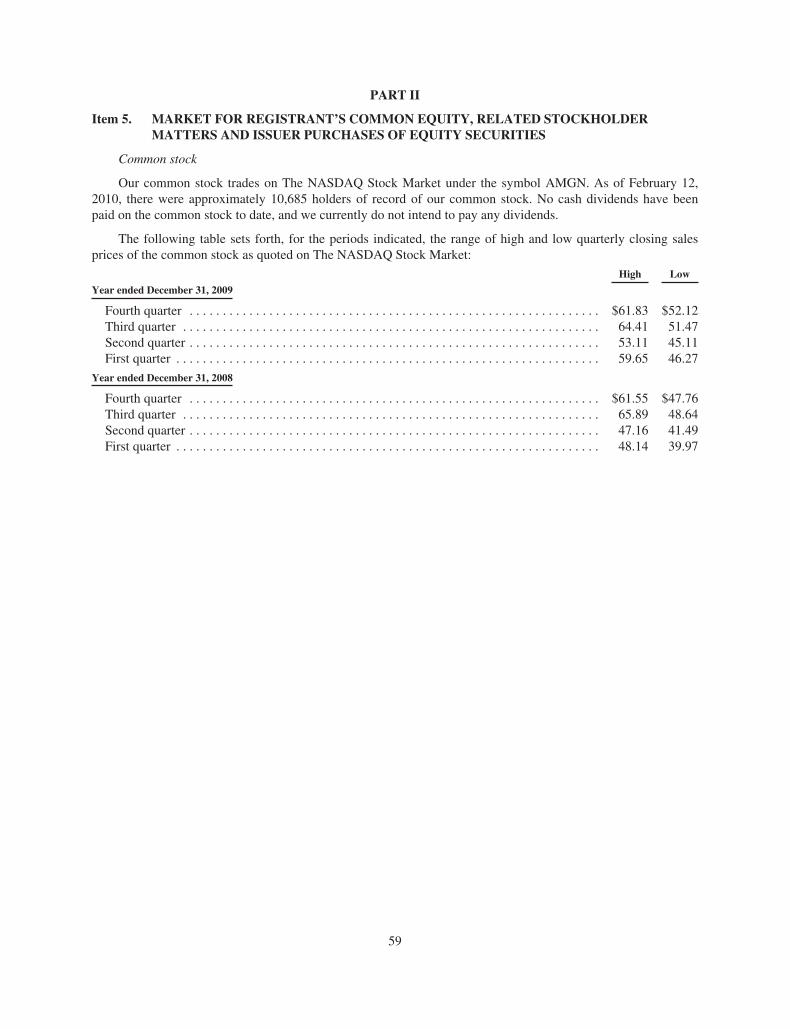
PART II
Item 5. MARKET FOR REGISTRANT’S COMMON EQUITY, RELATED STOCKHOLDERMATTERS AND ISSUER PURCHASES OF EQUITY SECURITIES
Common stock
Our common stock trades on The NASDAQ Stock Market under the symbol AMGN. As of February 12,2010, there were approximately 10,685 holders of record of our common stock. No cash dividends have beenpaid on the common stock to date, and we currently do not intend to pay any dividends.
The following table sets forth, for the periods indicated, the range of high and low quarterly closing salesprices of the common stock as quoted on The NASDAQ Stock Market:
High Low
Year ended December 31, 2009
Fourth quarter . . . . . . . . . . . . . . . . . . . . . . . . . . . . . . . . . . . . . . . . . . . . . . . . . . . . . . . . . . . . . . $61.83 $52.12Third quarter . . . . . . . . . . . . . . . . . . . . . . . . . . . . . . . . . . . . . . . . . . . . . . . . . . . . . . . . . . . . . . . 64.41 51.47Second quarter . . . . . . . . . . . . . . . . . . . . . . . . . . . . . . . . . . . . . . . . . . . . . . . . . . . . . . . . . . . . . . 53.11 45.11First quarter . . . . . . . . . . . . . . . . . . . . . . . . . . . . . . . . . . . . . . . . . . . . . . . . . . . . . . . . . . . . . . . . 59.65 46.27
Year ended December 31, 2008
Fourth quarter . . . . . . . . . . . . . . . . . . . . . . . . . . . . . . . . . . . . . . . . . . . . . . . . . . . . . . . . . . . . . . $61.55 $47.76Third quarter . . . . . . . . . . . . . . . . . . . . . . . . . . . . . . . . . . . . . . . . . . . . . . . . . . . . . . . . . . . . . . . 65.89 48.64Second quarter . . . . . . . . . . . . . . . . . . . . . . . . . . . . . . . . . . . . . . . . . . . . . . . . . . . . . . . . . . . . . . 47.16 41.49First quarter . . . . . . . . . . . . . . . . . . . . . . . . . . . . . . . . . . . . . . . . . . . . . . . . . . . . . . . . . . . . . . . . 48.14 39.97
59
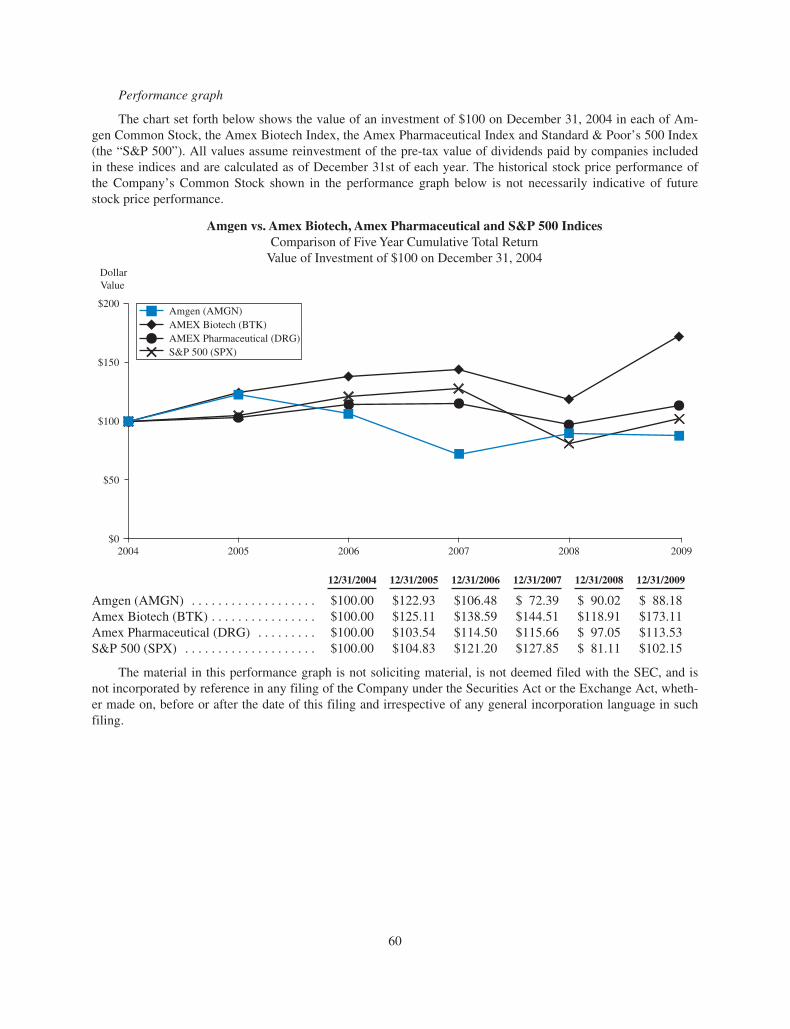
Performance graph
The chart set forth below shows the value of an investment of $100 on December 31, 2004 in each of Am-gen Common Stock, the Amex Biotech Index, the Amex Pharmaceutical Index and Standard & Poor’s 500 Index(the “S&P 500”). All values assume reinvestment of the pre-tax value of dividends paid by companies includedin these indices and are calculated as of December 31st of each year. The historical stock price performance ofthe Company’s Common Stock shown in the performance graph below is not necessarily indicative of futurestock price performance.
Amgen vs. Amex Biotech, Amex Pharmaceutical and S&P 500 IndicesComparison of Five Year Cumulative Total Return
Value of Investment of $100 on December 31, 2004
2004 2005 2006 2007 20092008 $0
$50
$100
$150
$200Amgen (AMGN)AMEX Biotech (BTK)AMEX Pharmaceutical (DRG)S&P 500 (SPX)
DollarValue
12/31/2004 12/31/2005 12/31/2006 12/31/2007 12/31/2008 12/31/2009
Amgen (AMGN) . . . . . . . . . . . . . . . . . . . $100.00 $122.93 $106.48 $ 72.39 $ 90.02 $ 88.18Amex Biotech (BTK) . . . . . . . . . . . . . . . . $100.00 $125.11 $138.59 $144.51 $118.91 $173.11Amex Pharmaceutical (DRG) . . . . . . . . . $100.00 $103.54 $114.50 $115.66 $ 97.05 $113.53S&P 500 (SPX) . . . . . . . . . . . . . . . . . . . . $100.00 $104.83 $121.20 $127.85 $ 81.11 $102.15
The material in this performance graph is not soliciting material, is not deemed filed with the SEC, and isnot incorporated by reference in any filing of the Company under the Securities Act or the Exchange Act, wheth-er made on, before or after the date of this filing and irrespective of any general incorporation language in suchfiling.
60
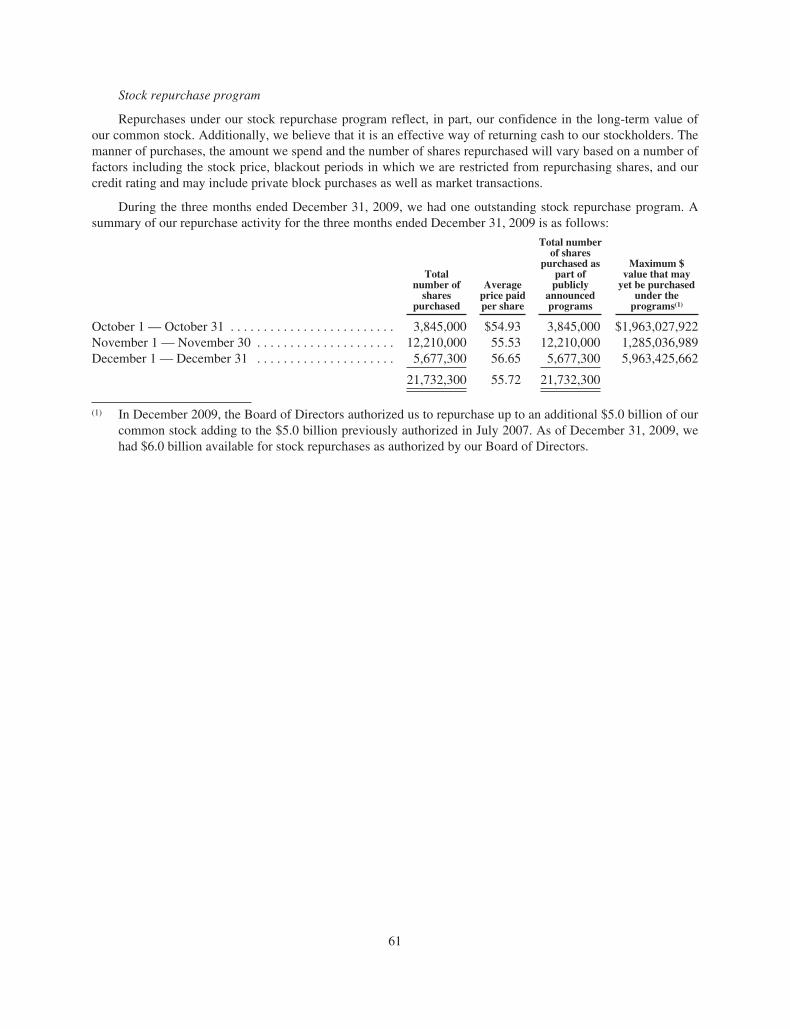
Stock repurchase program
Repurchases under our stock repurchase program reflect, in part, our confidence in the long-term value ofour common stock. Additionally, we believe that it is an effective way of returning cash to our stockholders. Themanner of purchases, the amount we spend and the number of shares repurchased will vary based on a number offactors including the stock price, blackout periods in which we are restricted from repurchasing shares, and ourcredit rating and may include private block purchases as well as market transactions.
During the three months ended December 31, 2009, we had one outstanding stock repurchase program. Asummary of our repurchase activity for the three months ended December 31, 2009 is as follows:
Totalnumber of
sharespurchased
Averageprice paidper share
Total numberof shares
purchased aspart of
publiclyannouncedprograms
Maximum $value that may
yet be purchasedunder the
programs(1)
October 1 — October 31 . . . . . . . . . . . . . . . . . . . . . . . . . 3,845,000 $54.93 3,845,000 $1,963,027,922November 1 — November 30 . . . . . . . . . . . . . . . . . . . . . 12,210,000 55.53 12,210,000 1,285,036,989December 1 — December 31 . . . . . . . . . . . . . . . . . . . . . 5,677,300 56.65 5,677,300 5,963,425,662
21,732,300 55.72 21,732,300
(1) In December 2009, the Board of Directors authorized us to repurchase up to an additional $5.0 billion of ourcommon stock adding to the $5.0 billion previously authorized in July 2007. As of December 31, 2009, wehad $6.0 billion available for stock repurchases as authorized by our Board of Directors.
61
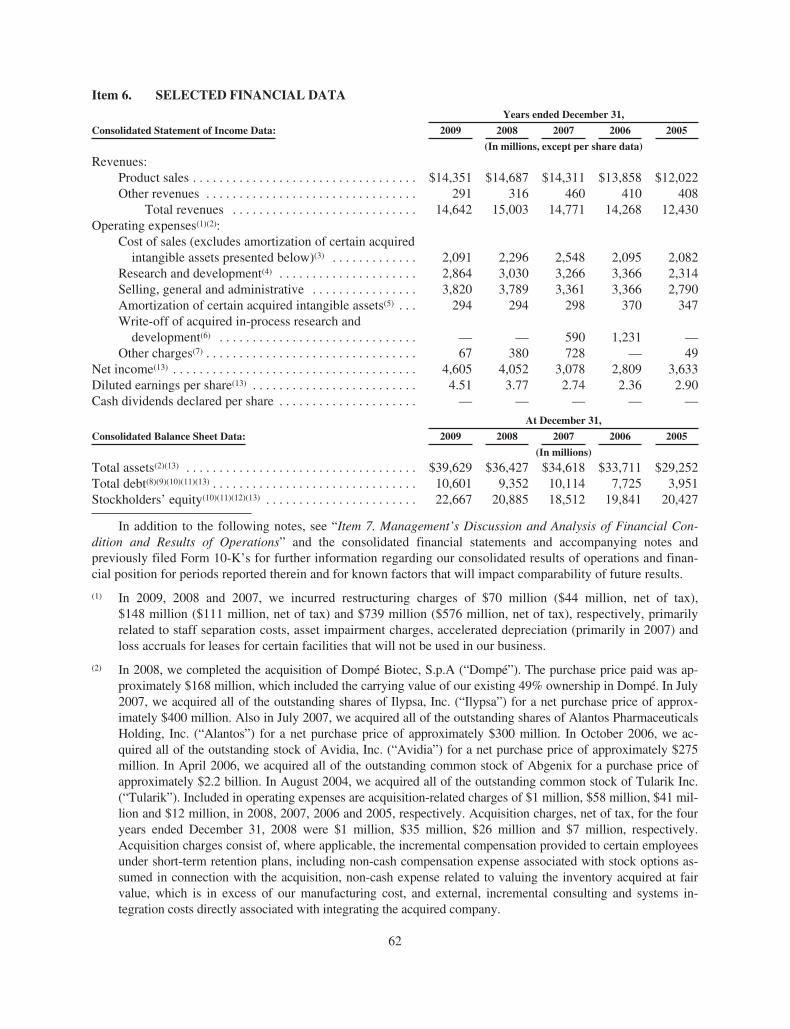
Item 6. SELECTED FINANCIAL DATA
Consolidated Statement of Income Data:
Years ended December 31,
2009 2008 2007 2006 2005
(In millions, except per share data)
Revenues:Product sales . . . . . . . . . . . . . . . . . . . . . . . . . . . . . . . . . . $14,351 $14,687 $14,311 $13,858 $12,022Other revenues . . . . . . . . . . . . . . . . . . . . . . . . . . . . . . . . 291 316 460 410 408
Total revenues . . . . . . . . . . . . . . . . . . . . . . . . . . . . 14,642 15,003 14,771 14,268 12,430Operating expenses(1)(2):
Cost of sales (excludes amortization of certain acquiredintangible assets presented below)(3) . . . . . . . . . . . . . 2,091 2,296 2,548 2,095 2,082
Research and development(4) . . . . . . . . . . . . . . . . . . . . . 2,864 3,030 3,266 3,366 2,314Selling, general and administrative . . . . . . . . . . . . . . . . 3,820 3,789 3,361 3,366 2,790Amortization of certain acquired intangible assets(5) . . . 294 294 298 370 347Write-off of acquired in-process research and
development(6) . . . . . . . . . . . . . . . . . . . . . . . . . . . . . . — — 590 1,231 —Other charges(7) . . . . . . . . . . . . . . . . . . . . . . . . . . . . . . . . 67 380 728 — 49
Net income(13) . . . . . . . . . . . . . . . . . . . . . . . . . . . . . . . . . . . . . 4,605 4,052 3,078 2,809 3,633Diluted earnings per share(13) . . . . . . . . . . . . . . . . . . . . . . . . . 4.51 3.77 2.74 2.36 2.90Cash dividends declared per share . . . . . . . . . . . . . . . . . . . . . — — — — —
At December 31,
Consolidated Balance Sheet Data: 2009 2008 2007 2006 2005
(In millions)
Total assets(2)(13) . . . . . . . . . . . . . . . . . . . . . . . . . . . . . . . . . . . $39,629 $36,427 $34,618 $33,711 $29,252Total debt(8)(9)(10)(11)(13) . . . . . . . . . . . . . . . . . . . . . . . . . . . . . . . 10,601 9,352 10,114 7,725 3,951Stockholders’ equity(10)(11)(12)(13) . . . . . . . . . . . . . . . . . . . . . . . 22,667 20,885 18,512 19,841 20,427
In addition to the following notes, see “Item 7. Management’s Discussion and Analysis of Financial Con-dition and Results of Operations” and the consolidated financial statements and accompanying notes andpreviously filed Form 10-K’s for further information regarding our consolidated results of operations and finan-cial position for periods reported therein and for known factors that will impact comparability of future results.
(1) In 2009, 2008 and 2007, we incurred restructuring charges of $70 million ($44 million, net of tax),$148 million ($111 million, net of tax) and $739 million ($576 million, net of tax), respectively, primarilyrelated to staff separation costs, asset impairment charges, accelerated depreciation (primarily in 2007) andloss accruals for leases for certain facilities that will not be used in our business.
(2) In 2008, we completed the acquisition of Dompé Biotec, S.p.A (“Dompé”). The purchase price paid was ap-proximately $168 million, which included the carrying value of our existing 49% ownership in Dompé. In July2007, we acquired all of the outstanding shares of Ilypsa, Inc. (“Ilypsa”) for a net purchase price of approx-imately $400 million. Also in July 2007, we acquired all of the outstanding shares of Alantos PharmaceuticalsHolding, Inc. (“Alantos”) for a net purchase price of approximately $300 million. In October 2006, we ac-quired all of the outstanding stock of Avidia, Inc. (“Avidia”) for a net purchase price of approximately $275million. In April 2006, we acquired all of the outstanding common stock of Abgenix for a purchase price ofapproximately $2.2 billion. In August 2004, we acquired all of the outstanding common stock of Tularik Inc.(“Tularik”). Included in operating expenses are acquisition-related charges of $1 million, $58 million, $41 mil-lion and $12 million, in 2008, 2007, 2006 and 2005, respectively. Acquisition charges, net of tax, for the fouryears ended December 31, 2008 were $1 million, $35 million, $26 million and $7 million, respectively.Acquisition charges consist of, where applicable, the incremental compensation provided to certain employeesunder short-term retention plans, including non-cash compensation expense associated with stock options as-sumed in connection with the acquisition, non-cash expense related to valuing the inventory acquired at fairvalue, which is in excess of our manufacturing cost, and external, incremental consulting and systems in-tegration costs directly associated with integrating the acquired company.
62
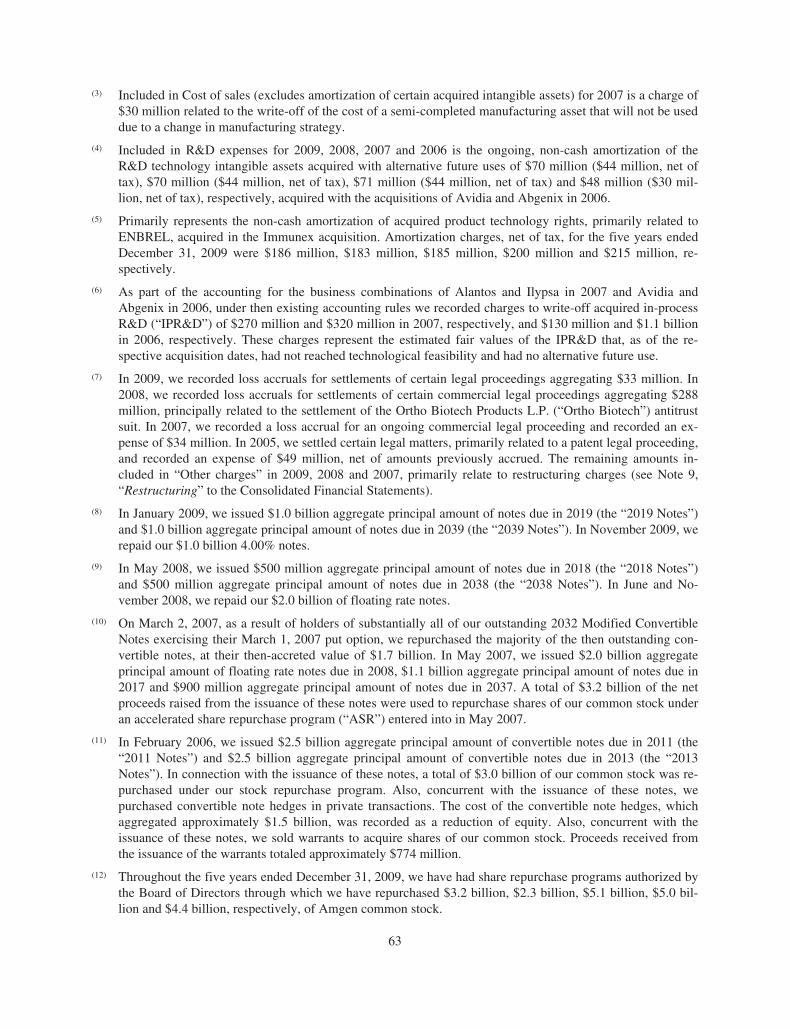
(3) Included in Cost of sales (excludes amortization of certain acquired intangible assets) for 2007 is a charge of$30 million related to the write-off of the cost of a semi-completed manufacturing asset that will not be useddue to a change in manufacturing strategy.
(4) Included in R&D expenses for 2009, 2008, 2007 and 2006 is the ongoing, non-cash amortization of theR&D technology intangible assets acquired with alternative future uses of $70 million ($44 million, net oftax), $70 million ($44 million, net of tax), $71 million ($44 million, net of tax) and $48 million ($30 mil-lion, net of tax), respectively, acquired with the acquisitions of Avidia and Abgenix in 2006.
(5) Primarily represents the non-cash amortization of acquired product technology rights, primarily related toENBREL, acquired in the Immunex acquisition. Amortization charges, net of tax, for the five years endedDecember 31, 2009 were $186 million, $183 million, $185 million, $200 million and $215 million, re-spectively.
(6) As part of the accounting for the business combinations of Alantos and Ilypsa in 2007 and Avidia andAbgenix in 2006, under then existing accounting rules we recorded charges to write-off acquired in-processR&D (“IPR&D”) of $270 million and $320 million in 2007, respectively, and $130 million and $1.1 billionin 2006, respectively. These charges represent the estimated fair values of the IPR&D that, as of the re-spective acquisition dates, had not reached technological feasibility and had no alternative future use.
(7) In 2009, we recorded loss accruals for settlements of certain legal proceedings aggregating $33 million. In2008, we recorded loss accruals for settlements of certain commercial legal proceedings aggregating $288million, principally related to the settlement of the Ortho Biotech Products L.P. (“Ortho Biotech”) antitrustsuit. In 2007, we recorded a loss accrual for an ongoing commercial legal proceeding and recorded an ex-pense of $34 million. In 2005, we settled certain legal matters, primarily related to a patent legal proceeding,and recorded an expense of $49 million, net of amounts previously accrued. The remaining amounts in-cluded in “Other charges” in 2009, 2008 and 2007, primarily relate to restructuring charges (see Note 9,“Restructuring” to the Consolidated Financial Statements).
(8) In January 2009, we issued $1.0 billion aggregate principal amount of notes due in 2019 (the “2019 Notes”)and $1.0 billion aggregate principal amount of notes due in 2039 (the “2039 Notes”). In November 2009, werepaid our $1.0 billion 4.00% notes.
(9) In May 2008, we issued $500 million aggregate principal amount of notes due in 2018 (the “2018 Notes”)and $500 million aggregate principal amount of notes due in 2038 (the “2038 Notes”). In June and No-vember 2008, we repaid our $2.0 billion of floating rate notes.
(10) On March 2, 2007, as a result of holders of substantially all of our outstanding 2032 Modified ConvertibleNotes exercising their March 1, 2007 put option, we repurchased the majority of the then outstanding con-vertible notes, at their then-accreted value of $1.7 billion. In May 2007, we issued $2.0 billion aggregateprincipal amount of floating rate notes due in 2008, $1.1 billion aggregate principal amount of notes due in2017 and $900 million aggregate principal amount of notes due in 2037. A total of $3.2 billion of the netproceeds raised from the issuance of these notes were used to repurchase shares of our common stock underan accelerated share repurchase program (“ASR”) entered into in May 2007.
(11) In February 2006, we issued $2.5 billion aggregate principal amount of convertible notes due in 2011 (the“2011 Notes”) and $2.5 billion aggregate principal amount of convertible notes due in 2013 (the “2013Notes”). In connection with the issuance of these notes, a total of $3.0 billion of our common stock was re-purchased under our stock repurchase program. Also, concurrent with the issuance of these notes, wepurchased convertible note hedges in private transactions. The cost of the convertible note hedges, whichaggregated approximately $1.5 billion, was recorded as a reduction of equity. Also, concurrent with theissuance of these notes, we sold warrants to acquire shares of our common stock. Proceeds received fromthe issuance of the warrants totaled approximately $774 million.
(12) Throughout the five years ended December 31, 2009, we have had share repurchase programs authorized bythe Board of Directors through which we have repurchased $3.2 billion, $2.3 billion, $5.1 billion, $5.0 bil-lion and $4.4 billion, respectively, of Amgen common stock.
63
(13) Effective January 1, 2009, we adopted a new accounting standard that changed the method of accounting forconvertible debt that may be partially or wholly settled in cash. As required by this new standard, we retro-spectively applied this change in accounting to all prior periods for which we had applicable outstandingconvertible debt. Under this method of accounting, the debt and equity components of our convertible notesare bifurcated and accounted for separately. The equity components of our convertible notes, including our2011 Convertible Notes, 2013 Convertible Notes and 2032 Modified Convertible Notes, are included in“Common stock and additional paid-in capital” in the Consolidated Balance Sheets, with a correspondingreduction in the carrying values of these convertible notes as of the date of issuance or modification, asapplicable. The reduced carrying values of our convertible notes are being accreted back to their principalamounts through the recognition of non-cash interest expense. This results in recognizing interest expenseon these borrowings at effective rates approximating what we would have incurred had we issued non-convertible debt with otherwise similar terms. Included in net income for 2009, 2008, 2007, 2006 and 2005is non-cash interest expense of $250 million ($155 million, net of tax), $235 million ($144 million, net oftax), $168 million ($88 million, net of tax) , $197 million ($141 million, net of tax) and $67 million ($41million, net of tax), respectively, related to the amortization of the discounts resulting from the adoption ofthe new accounting standard. See Note 1, “Summary of significant accounting policies,” Note 2, “Change inmethod of accounting for convertible debt instruments” and Note 16, “Financing arrangements” to the Con-solidated Financial Statements for further information.
64
Item 7. MANAGEMENT’S DISCUSSION AND ANALYSIS OF FINANCIAL CONDITION ANDRESULTS OF OPERATIONS
Forward looking statements
This report and other documents we file with the SEC contain forward looking statements that are based oncurrent expectations, estimates, forecasts and projections about us, our future performance, our business or otherson our behalf, our beliefs and our management’s assumptions. In addition, we, or others on our behalf, may makeforward looking statements in press releases or written statements, or in our communications and discussionswith investors and analysts in the normal course of business through meetings, webcasts, phone calls and confer-ence calls. Words such as “expect,” “anticipate,” “outlook,” “could,” “target,” “project,” “intend,” “plan,”“believe,” “seek,” “estimate,” “should,” “may,” “assume,” “continue,” variations of such words and similar ex-pressions are intended to identify such forward looking statements. These statements are not guarantees of futureperformance and involve certain risks, uncertainties and assumptions that are difficult to predict. We describe ourrespective risks, uncertainties and assumptions that could affect the outcome or results of operations in “Item 1A.Risk Factors.” We have based our forward looking statements on our management’s beliefs and assumptionsbased on information available to our management at the time the statements are made. We caution you that ac-tual outcomes and results may differ materially from what is expressed, implied or forecast by our forwardlooking statements. Reference is made in particular to forward looking statements regarding product sales, regu-latory activities, clinical trial results, reimbursement, expenses, earnings per share (“EPS”), liquidity and capitalresources and trends. Except as required under the federal securities laws and the rules and regulations of theSEC, we do not have any intention or obligation to update publicly any forward looking statements after the dis-tribution of this report, whether as a result of new information, future events, changes in assumptions orotherwise.
Overview
The following management’s discussion and analysis (“MD&A”) is intended to assist the reader in under-standing Amgen’s business. MD&A is provided as a supplement to, and should be read in conjunction with, ourconsolidated financial statements and accompanying notes. Our results of operations discussed in MD&A arepresented in conformity with accounting principles generally accepted in the United States (“GAAP”).
We are the largest independent biotechnology medicines company. We discover, develop, manufacture andmarket medicines for grievous illnesses. We concentrate on innovative novel medicines based on advances incellular and molecular biology. Our mission is to serve patients. We operate in one business segment — humantherapeutics. Therefore, our results of operations are discussed on a consolidated basis.
We operate in a highly regulated industry and various U.S. and foreign regulatory bodies have substantialauthority over how we conduct our business. Government authorities in the United States and in other countriesregulate the manufacturing and marketing of our products and our ongoing R&D activities. The regulatory envi-ronment is evolving and there is increased scrutiny on drug safety and increased authority being granted toregulatory bodies, in particular the FDA, to assist in ensuring the safety of therapeutic products, which may leadto fewer products being approved by the FDA or other regulatory bodies, delays in receiving approvals or addi-tional safety-related requirements or restrictions on the use of our products, including expanded safety labeling,required risk management activities, including a REMS, and/or additional or more extensive clinical trials as partof PMCs, PMRs or a pharmacovigilance program. This is increasingly true of new therapies with novel mecha-nisms of action. While these therapies may offer important benefits and/or better treatment alternatives, they mayalso involve a relatively new or higher level of scientific complexity and, therefore, generate increased safetyconcerns.
Most patients receiving our principal products for approved indications are covered by either government orprivate payer healthcare programs, which are placing greater emphasis on cost containment, including requiringthat the economic value of products be clearly demonstrated. Governments may regulate access to, prices or re-imbursement levels of our products to control costs or to affect levels of use of our products and private insurersmay be influenced by government reimbursement methodologies. Worldwide use of our products may be af-fected by these cost containment pressures and cost shifting from governments and private insurers to healthcare
65
providers or patients in response to ongoing initiatives to reduce or reallocate healthcare expenditures. Therefore,sales of our principal products have and will continue to be affected by the availability and extent of reimburse-ment from third-party payers, including government and private insurance plans, and administration of thoseprograms. Additionally, ongoing healthcare reform efforts may also have a significant impact on our business.For example healthcare reform, focused on expanding healthcare coverage to millions of uninsured Americansand reducing the rate of increase in the costs of healthcare, remains a priority for President Obama, U.S. Con-gress and a number of states. Developments in this area have been highly dynamic and difficult to predict. Asrecently as February 23, 2010, President Obama released a new proposal for healthcare reform which includes acombination of provisions from both the Senate and House of Representatives bills passed in late 2009. Certainhealthcare reform proposals being considered, which may or may not be adopted into law, could:
• restrict the coverage and reimbursement of our products by Medicare, Medicaid and other governmentprograms
• reduce the number of years of data exclusivity for innovative biological products potentially leading toearlier biosimilar competition and/or
• require additional healthcare reform costs be borne by pharmaceutical and biotechnology companies
At this time, we cannot predict which or whether any reform measures will be adopted into law.
We primarily earn revenues and income and generate cash from sales of human therapeutic products in theareas of supportive cancer care, nephrology and inflammation. Our principal products include Aranesp®, EP-OGEN®, Neulasta®, NEUPOGEN® and ENBREL all of which are sold in the United States. ENBREL ismarketed under a co-promotion agreement with Pfizer in the United States and Canada. Our international productsales consist principally of European sales of Aranesp®, Neulasta® and NEUPOGEN®. For additional in-formation about our products, their approved indications and where they are marketed, see “Item 1. Business —Marketed Products and Selected Product Candidates.” Our product sales are subject to certain influencesthroughout the year, including wholesaler and customer buying patterns, both of which fluctuate around holidays,and contract-driven customer buying. These factors can periodically result in higher U.S. wholesaler distributorinventory levels in the United States, and therefore higher product sales. We did not experience as large of an in-crease in wholesaler inventory levels in the fourth quarter of 2009 as in the prior year.
Worldwide product sales for the year ended December 31, 2009 were $14.4 billion, representing a decreaseof 2% compared to 2008. U.S. product sales for the year ended December 31, 2009 were $11.1 billion comparedto $11.5 billion in 2008, representing a decrease of 3%. The decrease in U.S. product sales was largely attribut-able to a 24% decline in Aranesp® sales primarily reflecting the negative impact of a product safety-related labelchange that occurred in August 2008. Combined sales of our other products in the United States in 2009 in-creased 1% compared to 2008 as increased EPOGEN® sales in 2009 largely offset the decline in ENBREL sales.This decrease in ENBREL sales primarily reflects the unfavorable change in wholesaler inventories resultingfrom an approximate $100 million wholesaler inventory build in 2008 related to the shift of ENBREL to awholesaler distribution model.
International product sales were relatively unchanged at $3.2 billion for the year ended December 31, 2009.International product sales for 2009 were unfavorably impacted by foreign currency exchange rate changes of$213 million. Excluding the impact of foreign currency exchange rate changes, international product sales for theyear ended December 31, 2009 increased 6%. This increase in international product sales is primarily due to thelaunches of Vectibix®, Mimpara® and Nplate® into our existing international markets and the expansion of Neu-lasta® and NEUPOGEN® into new international territories.
Although changes in foreign currency rates result in increases or decreases in our reported international prod-uct sales, the benefit or detriment that such movements have on our international product sales are partially offsetby corresponding increases or decreases in our international operating expenses and our related foreign currencyhedging activities. Our hedging activities seek to offset the impact, both positive and negative, that foreign cur-rency exchange rate changes may have on our net income by hedging our net foreign currency exposure,primarily with respect to the Euro.
66
Our operating expenses for the year ended December 31, 2009 declined approximately $650 million, or 7%,over 2008 of which approximately one-half of this reduction was attributable to lower legal settlements and re-structuring and related costs. In addition, cost of sales declined in 2009 principally due to improved operatingefficiencies and lower sales volume, partially offset by a less favorable product mix. Our R&D expenses in 2009also declined primarily due to lower clinical trial costs due to the completion of certain late-stage registrationalstudies for denosumab and Vectibix®. These decreases in our operating expenses were partially offset by a slightincrease in our SG&A expenses primarily due to increased promotional expenses, including spending for activ-ities in advance of our anticipated launch of Prolia™. This reduction in operating expenses also reflects, in part,our continuing efforts to maintain control over discretionary expenditures.
For the year ended December 31, 2009, our net income was $4.6 billion, or $4.51 per share on a diluted ba-sis, reflecting increases of 14% and 20%, respectively, compared to 2008. The growth in our net incomeprincipally reflects our reduced operating expenses, discussed above, and a reduction in our provision for incometaxes primarily due to favorable income tax settlements of approximately $220 million and increasedmanufacturing and profits in Puerto Rico, which are taxed under an incentive grant. Our 2009 EPS also benefitedfrom a reduction in our weighted average shares used to compute diluted EPS resulting from our stock re-purchase program, including 59 million shares repurchased in 2009 at a total cost of $3.2 billion.
Our financial condition remains strong. At December 31, 2009, our cash, cash equivalents and marketablesecurities aggregated $13.4 billion, our total debt outstanding was $10.6 billion and our stockholders’ equity ag-gregated $22.7 billion. In addition, our cash flow from operations for the year ended December 31, 2009aggregated $6.3 billion, representing a 6% increase over the prior year. Capital expenditures for 2009 were ap-proximately $530 million, which represents a decrease from $672 million in 2008 due to improved productivityand efficiency in our capital program. We believe that existing funds, cash generated from operations and exist-ing sources of and access to financing are adequate to satisfy our working capital, capital expenditure and debtservice requirements for the foreseeable future. Of our total cash, cash equivalents and marketable securities bal-ance as of December 31, 2009, $12.1 billion was generated from operations in foreign tax jurisdictions and isintended for use in our foreign operations. If these funds were repatriated for use in our U.S. operations, wewould be required to pay additional U.S. federal and state income taxes at the applicable marginal tax rates.
Looking forward, we believe that our business will continue to face various regulatory, reimbursement andcompetitive challenges. In particular, our ESA products, Aranesp® and EPOGEN®, will continue to be impactedby regulatory developments, such as the REMS, which has been recently approved by the FDA, and recent or po-tential future product label changes, including any that may result from the advisory committee meeting proposedby the FDA to be held in 2010 to re-evaluate the use of ESAs in CKD. In the United States, we rely in large parton the reimbursement of our products through government programs such as Medicare and Medicaid.Reimbursement challenges may result from the MEDCAC meeting scheduled for March 24, 2010 to examinecurrently available evidence on the use of ESAs to manage anemia in patients who have CKD and the provisionsof the CMS’ proposed rule to implement a bundling prospective payment system for ESRD. In addition, the out-come of the proposed healthcare reform in the United States is very much uncertain at this time. Further, certainof our products will continue to face increasing competitive pressure, including our marketed products in theUnited States, in particular ENBREL as well as from biosimilar and other products in Europe which competewith Aranesp®, Neulasta® and NEUPOGEN®.
We also have various opportunities to grow our business in the future, primarily due to our late-stage productcandidate, denosumab. We continue to work with the FDA regarding our BLA for Prolia™. On February 19, 2010,we announced that the FDA has evaluated the content of our Complete Response submission for Prolia™ in thetreatment of PMO, which we submitted on January 25, 2010, and classified it as a Class 2 resubmission. With theClass 2 designation, the FDA set a corresponding PDUFA action date of July 25, 2010. Additionally, in December2009, the CHMP announced a positive opinion for the marketing authorization for Prolia™ for the treatment of os-teoporosis in postmenopausal women at increased risk of fracture and for the treatment of bone loss associated withhormone ablation in men with prostate cancer at increased risk of fractures. Furthermore, we announced positivestudy results from three phase 3 denosumab trials in the treatment of bone metastases that will form the basis of theclinical evidence package for denosumab in advanced cancer, which will be submitted to regulatory authorities later
67
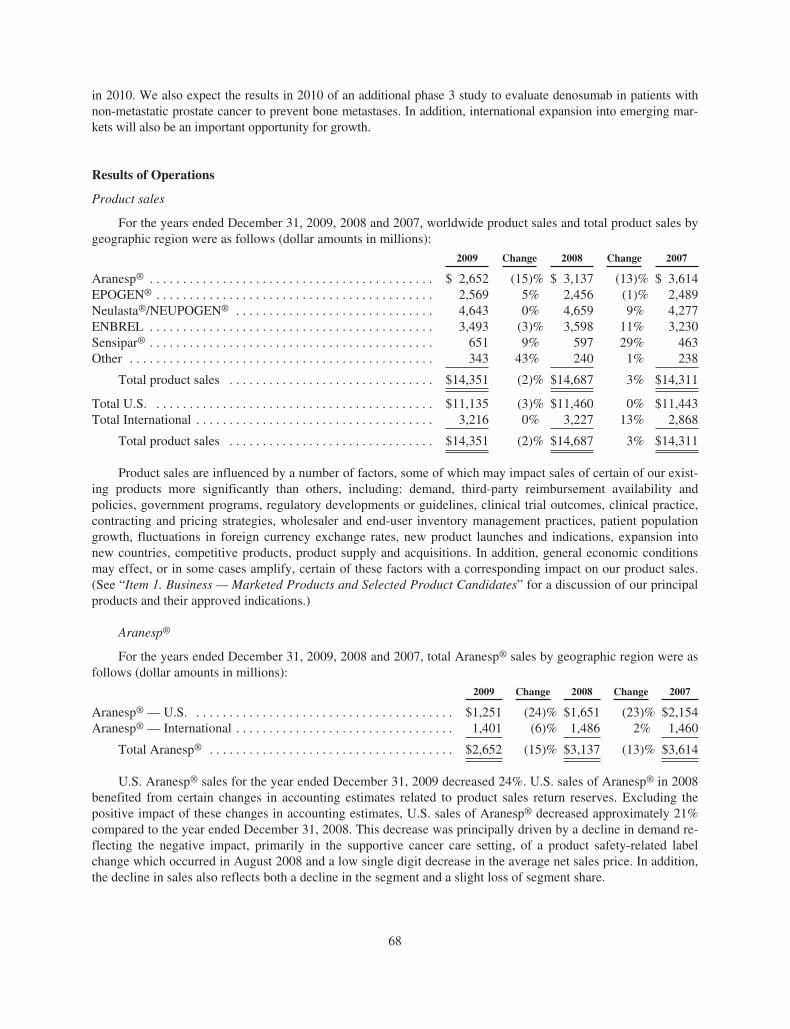
in 2010. We also expect the results in 2010 of an additional phase 3 study to evaluate denosumab in patients withnon-metastatic prostate cancer to prevent bone metastases. In addition, international expansion into emerging mar-kets will also be an important opportunity for growth.
Results of Operations
Product sales
For the years ended December 31, 2009, 2008 and 2007, worldwide product sales and total product sales bygeographic region were as follows (dollar amounts in millions):
2009 Change 2008 Change 2007
Aranesp® . . . . . . . . . . . . . . . . . . . . . . . . . . . . . . . . . . . . . . . . . . . $ 2,652 (15)% $ 3,137 (13)% $ 3,614EPOGEN® . . . . . . . . . . . . . . . . . . . . . . . . . . . . . . . . . . . . . . . . . . 2,569 5% 2,456 (1)% 2,489Neulasta®/NEUPOGEN® . . . . . . . . . . . . . . . . . . . . . . . . . . . . . . 4,643 0% 4,659 9% 4,277ENBREL . . . . . . . . . . . . . . . . . . . . . . . . . . . . . . . . . . . . . . . . . . . 3,493 (3)% 3,598 11% 3,230Sensipar® . . . . . . . . . . . . . . . . . . . . . . . . . . . . . . . . . . . . . . . . . . . 651 9% 597 29% 463Other . . . . . . . . . . . . . . . . . . . . . . . . . . . . . . . . . . . . . . . . . . . . . . 343 43% 240 1% 238
Total product sales . . . . . . . . . . . . . . . . . . . . . . . . . . . . . . . $14,351 (2)% $14,687 3% $14,311
Total U.S. . . . . . . . . . . . . . . . . . . . . . . . . . . . . . . . . . . . . . . . . . . $11,135 (3)% $11,460 0% $11,443Total International . . . . . . . . . . . . . . . . . . . . . . . . . . . . . . . . . . . . 3,216 0% 3,227 13% 2,868
Total product sales . . . . . . . . . . . . . . . . . . . . . . . . . . . . . . . $14,351 (2)% $14,687 3% $14,311
Product sales are influenced by a number of factors, some of which may impact sales of certain of our exist-ing products more significantly than others, including: demand, third-party reimbursement availability andpolicies, government programs, regulatory developments or guidelines, clinical trial outcomes, clinical practice,contracting and pricing strategies, wholesaler and end-user inventory management practices, patient populationgrowth, fluctuations in foreign currency exchange rates, new product launches and indications, expansion intonew countries, competitive products, product supply and acquisitions. In addition, general economic conditionsmay effect, or in some cases amplify, certain of these factors with a corresponding impact on our product sales.(See “Item 1. Business — Marketed Products and Selected Product Candidates” for a discussion of our principalproducts and their approved indications.)
Aranesp®
For the years ended December 31, 2009, 2008 and 2007, total Aranesp® sales by geographic region were asfollows (dollar amounts in millions):
2009 Change 2008 Change 2007
Aranesp® — U.S. . . . . . . . . . . . . . . . . . . . . . . . . . . . . . . . . . . . . . . . $1,251 (24)% $1,651 (23)% $2,154Aranesp® — International . . . . . . . . . . . . . . . . . . . . . . . . . . . . . . . . . 1,401 (6)% 1,486 2% 1,460
Total Aranesp® . . . . . . . . . . . . . . . . . . . . . . . . . . . . . . . . . . . . . $2,652 (15)% $3,137 (13)% $3,614
U.S. Aranesp® sales for the year ended December 31, 2009 decreased 24%. U.S. sales of Aranesp® in 2008benefited from certain changes in accounting estimates related to product sales return reserves. Excluding thepositive impact of these changes in accounting estimates, U.S. sales of Aranesp® decreased approximately 21%compared to the year ended December 31, 2008. This decrease was principally driven by a decline in demand re-flecting the negative impact, primarily in the supportive cancer care setting, of a product safety-related labelchange which occurred in August 2008 and a low single digit decrease in the average net sales price. In addition,the decline in sales also reflects both a decline in the segment and a slight loss of segment share.
68
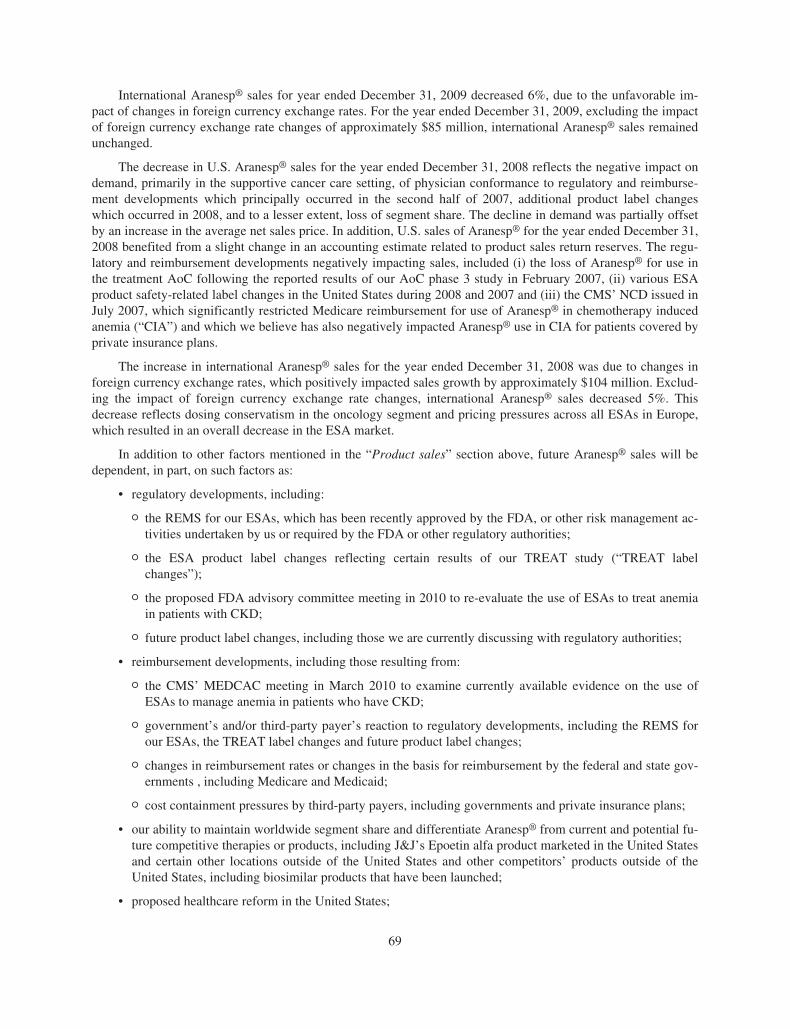
International Aranesp® sales for year ended December 31, 2009 decreased 6%, due to the unfavorable im-pact of changes in foreign currency exchange rates. For the year ended December 31, 2009, excluding the impactof foreign currency exchange rate changes of approximately $85 million, international Aranesp® sales remainedunchanged.
The decrease in U.S. Aranesp® sales for the year ended December 31, 2008 reflects the negative impact ondemand, primarily in the supportive cancer care setting, of physician conformance to regulatory and reimburse-ment developments which principally occurred in the second half of 2007, additional product label changeswhich occurred in 2008, and to a lesser extent, loss of segment share. The decline in demand was partially offsetby an increase in the average net sales price. In addition, U.S. sales of Aranesp® for the year ended December 31,2008 benefited from a slight change in an accounting estimate related to product sales return reserves. The regu-latory and reimbursement developments negatively impacting sales, included (i) the loss of Aranesp® for use inthe treatment AoC following the reported results of our AoC phase 3 study in February 2007, (ii) various ESAproduct safety-related label changes in the United States during 2008 and 2007 and (iii) the CMS’ NCD issued inJuly 2007, which significantly restricted Medicare reimbursement for use of Aranesp® in chemotherapy inducedanemia (“CIA”) and which we believe has also negatively impacted Aranesp® use in CIA for patients covered byprivate insurance plans.
The increase in international Aranesp® sales for the year ended December 31, 2008 was due to changes inforeign currency exchange rates, which positively impacted sales growth by approximately $104 million. Exclud-ing the impact of foreign currency exchange rate changes, international Aranesp® sales decreased 5%. Thisdecrease reflects dosing conservatism in the oncology segment and pricing pressures across all ESAs in Europe,which resulted in an overall decrease in the ESA market.
In addition to other factors mentioned in the “Product sales” section above, future Aranesp® sales will bedependent, in part, on such factors as:
• regulatory developments, including:
O the REMS for our ESAs, which has been recently approved by the FDA, or other risk management ac-tivities undertaken by us or required by the FDA or other regulatory authorities;
O the ESA product label changes reflecting certain results of our TREAT study (“TREAT labelchanges”);
O the proposed FDA advisory committee meeting in 2010 to re-evaluate the use of ESAs to treat anemiain patients with CKD;
O future product label changes, including those we are currently discussing with regulatory authorities;
• reimbursement developments, including those resulting from:
O the CMS’ MEDCAC meeting in March 2010 to examine currently available evidence on the use ofESAs to manage anemia in patients who have CKD;
O government’s and/or third-party payer’s reaction to regulatory developments, including the REMS forour ESAs, the TREAT label changes and future product label changes;
O changes in reimbursement rates or changes in the basis for reimbursement by the federal and state gov-ernments , including Medicare and Medicaid;
O cost containment pressures by third-party payers, including governments and private insurance plans;
• our ability to maintain worldwide segment share and differentiate Aranesp® from current and potential fu-ture competitive therapies or products, including J&J’s Epoetin alfa product marketed in the United Statesand certain other locations outside of the United States and other competitors’ products outside of theUnited States, including biosimilar products that have been launched;
• proposed healthcare reform in the United States;
69
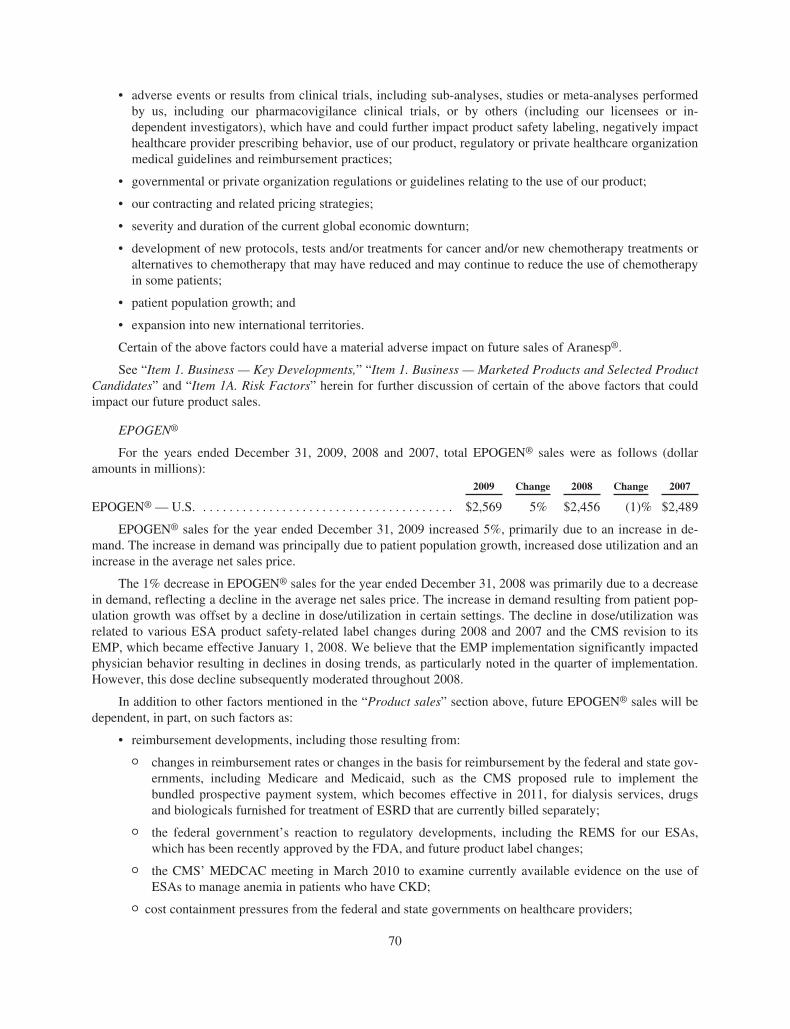
• adverse events or results from clinical trials, including sub-analyses, studies or meta-analyses performedby us, including our pharmacovigilance clinical trials, or by others (including our licensees or in-dependent investigators), which have and could further impact product safety labeling, negatively impacthealthcare provider prescribing behavior, use of our product, regulatory or private healthcare organizationmedical guidelines and reimbursement practices;
• governmental or private organization regulations or guidelines relating to the use of our product;
• our contracting and related pricing strategies;
• severity and duration of the current global economic downturn;
• development of new protocols, tests and/or treatments for cancer and/or new chemotherapy treatments oralternatives to chemotherapy that may have reduced and may continue to reduce the use of chemotherapyin some patients;
• patient population growth; and
• expansion into new international territories.
Certain of the above factors could have a material adverse impact on future sales of Aranesp®.
See “Item 1. Business — Key Developments,” “Item 1. Business — Marketed Products and Selected ProductCandidates” and “Item 1A. Risk Factors” herein for further discussion of certain of the above factors that couldimpact our future product sales.
EPOGEN®
For the years ended December 31, 2009, 2008 and 2007, total EPOGEN® sales were as follows (dollaramounts in millions):
2009 Change 2008 Change 2007
EPOGEN® — U.S. . . . . . . . . . . . . . . . . . . . . . . . . . . . . . . . . . . . . . . $2,569 5% $2,456 (1)% $2,489
EPOGEN® sales for the year ended December 31, 2009 increased 5%, primarily due to an increase in de-mand. The increase in demand was principally due to patient population growth, increased dose utilization and anincrease in the average net sales price.
The 1% decrease in EPOGEN® sales for the year ended December 31, 2008 was primarily due to a decreasein demand, reflecting a decline in the average net sales price. The increase in demand resulting from patient pop-ulation growth was offset by a decline in dose/utilization in certain settings. The decline in dose/utilization wasrelated to various ESA product safety-related label changes during 2008 and 2007 and the CMS revision to itsEMP, which became effective January 1, 2008. We believe that the EMP implementation significantly impactedphysician behavior resulting in declines in dosing trends, as particularly noted in the quarter of implementation.However, this dose decline subsequently moderated throughout 2008.
In addition to other factors mentioned in the “Product sales” section above, future EPOGEN® sales will bedependent, in part, on such factors as:
• reimbursement developments, including those resulting from:
O changes in reimbursement rates or changes in the basis for reimbursement by the federal and state gov-ernments, including Medicare and Medicaid, such as the CMS proposed rule to implement thebundled prospective payment system, which becomes effective in 2011, for dialysis services, drugsand biologicals furnished for treatment of ESRD that are currently billed separately;
O the federal government’s reaction to regulatory developments, including the REMS for our ESAs,which has been recently approved by the FDA, and future product label changes;
O the CMS’ MEDCAC meeting in March 2010 to examine currently available evidence on the use ofESAs to manage anemia in patients who have CKD;
O cost containment pressures from the federal and state governments on healthcare providers;
70
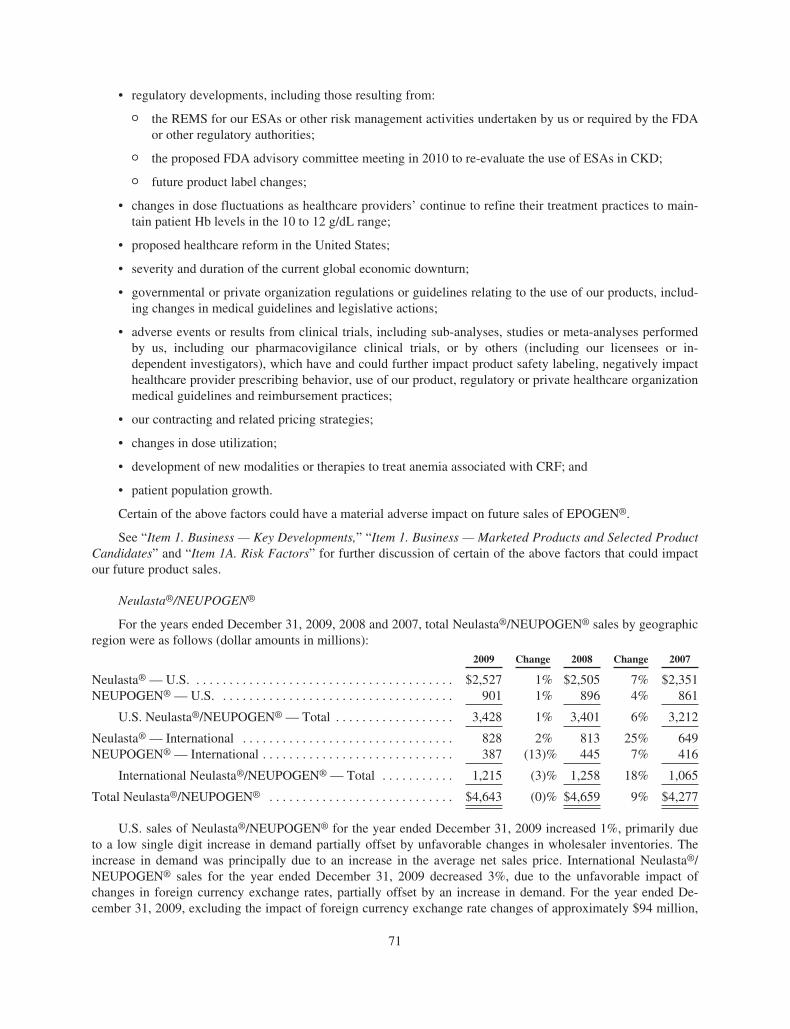
• regulatory developments, including those resulting from:
O the REMS for our ESAs or other risk management activities undertaken by us or required by the FDAor other regulatory authorities;
O the proposed FDA advisory committee meeting in 2010 to re-evaluate the use of ESAs in CKD;
O future product label changes;
• changes in dose fluctuations as healthcare providers’ continue to refine their treatment practices to main-tain patient Hb levels in the 10 to 12 g/dL range;
• proposed healthcare reform in the United States;
• severity and duration of the current global economic downturn;
• governmental or private organization regulations or guidelines relating to the use of our products, includ-ing changes in medical guidelines and legislative actions;
• adverse events or results from clinical trials, including sub-analyses, studies or meta-analyses performedby us, including our pharmacovigilance clinical trials, or by others (including our licensees or in-dependent investigators), which have and could further impact product safety labeling, negatively impacthealthcare provider prescribing behavior, use of our product, regulatory or private healthcare organizationmedical guidelines and reimbursement practices;
• our contracting and related pricing strategies;
• changes in dose utilization;
• development of new modalities or therapies to treat anemia associated with CRF; and
• patient population growth.
Certain of the above factors could have a material adverse impact on future sales of EPOGEN®.
See “Item 1. Business — Key Developments,” “Item 1. Business — Marketed Products and Selected ProductCandidates” and “Item 1A. Risk Factors” for further discussion of certain of the above factors that could impactour future product sales.
Neulasta®/NEUPOGEN®
For the years ended December 31, 2009, 2008 and 2007, total Neulasta®/NEUPOGEN® sales by geographicregion were as follows (dollar amounts in millions):
2009 Change 2008 Change 2007
Neulasta® — U.S. . . . . . . . . . . . . . . . . . . . . . . . . . . . . . . . . . . . . . . . $2,527 1% $2,505 7% $2,351NEUPOGEN® — U.S. . . . . . . . . . . . . . . . . . . . . . . . . . . . . . . . . . . . 901 1% 896 4% 861
U.S. Neulasta®/NEUPOGEN® — Total . . . . . . . . . . . . . . . . . . 3,428 1% 3,401 6% 3,212
Neulasta® — International . . . . . . . . . . . . . . . . . . . . . . . . . . . . . . . . 828 2% 813 25% 649NEUPOGEN® — International . . . . . . . . . . . . . . . . . . . . . . . . . . . . . 387 (13)% 445 7% 416
International Neulasta®/NEUPOGEN® — Total . . . . . . . . . . . 1,215 (3)% 1,258 18% 1,065
Total Neulasta®/NEUPOGEN® . . . . . . . . . . . . . . . . . . . . . . . . . . . . $4,643 (0)% $4,659 9% $4,277
U.S. sales of Neulasta®/NEUPOGEN® for the year ended December 31, 2009 increased 1%, primarily dueto a low single digit increase in demand partially offset by unfavorable changes in wholesaler inventories. Theincrease in demand was principally due to an increase in the average net sales price. International Neulasta®/NEUPOGEN® sales for the year ended December 31, 2009 decreased 3%, due to the unfavorable impact ofchanges in foreign currency exchange rates, partially offset by an increase in demand. For the year ended De-cember 31, 2009, excluding the impact of foreign currency exchange rate changes of approximately $94 million,
71
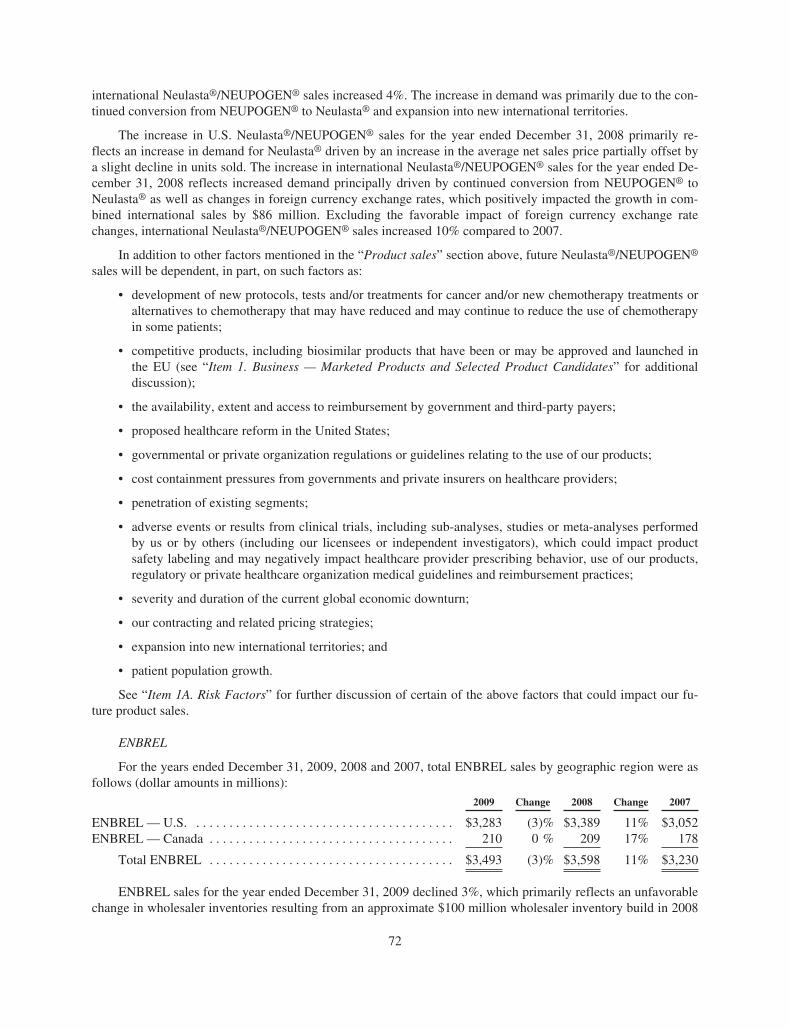
international Neulasta®/NEUPOGEN® sales increased 4%. The increase in demand was primarily due to the con-tinued conversion from NEUPOGEN® to Neulasta® and expansion into new international territories.
The increase in U.S. Neulasta®/NEUPOGEN® sales for the year ended December 31, 2008 primarily re-flects an increase in demand for Neulasta® driven by an increase in the average net sales price partially offset bya slight decline in units sold. The increase in international Neulasta®/NEUPOGEN® sales for the year ended De-cember 31, 2008 reflects increased demand principally driven by continued conversion from NEUPOGEN® toNeulasta® as well as changes in foreign currency exchange rates, which positively impacted the growth in com-bined international sales by $86 million. Excluding the favorable impact of foreign currency exchange ratechanges, international Neulasta®/NEUPOGEN® sales increased 10% compared to 2007.
In addition to other factors mentioned in the “Product sales” section above, future Neulasta®/NEUPOGEN®
sales will be dependent, in part, on such factors as:
• development of new protocols, tests and/or treatments for cancer and/or new chemotherapy treatments oralternatives to chemotherapy that may have reduced and may continue to reduce the use of chemotherapyin some patients;
• competitive products, including biosimilar products that have been or may be approved and launched inthe EU (see “Item 1. Business — Marketed Products and Selected Product Candidates” for additionaldiscussion);
• the availability, extent and access to reimbursement by government and third-party payers;
• proposed healthcare reform in the United States;
• governmental or private organization regulations or guidelines relating to the use of our products;
• cost containment pressures from governments and private insurers on healthcare providers;
• penetration of existing segments;
• adverse events or results from clinical trials, including sub-analyses, studies or meta-analyses performedby us or by others (including our licensees or independent investigators), which could impact productsafety labeling and may negatively impact healthcare provider prescribing behavior, use of our products,regulatory or private healthcare organization medical guidelines and reimbursement practices;
• severity and duration of the current global economic downturn;
• our contracting and related pricing strategies;
• expansion into new international territories; and
• patient population growth.
See “Item 1A. Risk Factors” for further discussion of certain of the above factors that could impact our fu-ture product sales.
ENBREL
For the years ended December 31, 2009, 2008 and 2007, total ENBREL sales by geographic region were asfollows (dollar amounts in millions):
2009 Change 2008 Change 2007
ENBREL — U.S. . . . . . . . . . . . . . . . . . . . . . . . . . . . . . . . . . . . . . . . $3,283 (3)% $3,389 11% $3,052ENBREL — Canada . . . . . . . . . . . . . . . . . . . . . . . . . . . . . . . . . . . . . 210 0 % 209 17% 178
Total ENBREL . . . . . . . . . . . . . . . . . . . . . . . . . . . . . . . . . . . . . $3,493 (3)% $3,598 11% $3,230
ENBREL sales for the year ended December 31, 2009 declined 3%, which primarily reflects an unfavorablechange in wholesaler inventories resulting from an approximate $100 million wholesaler inventory build in 2008
72
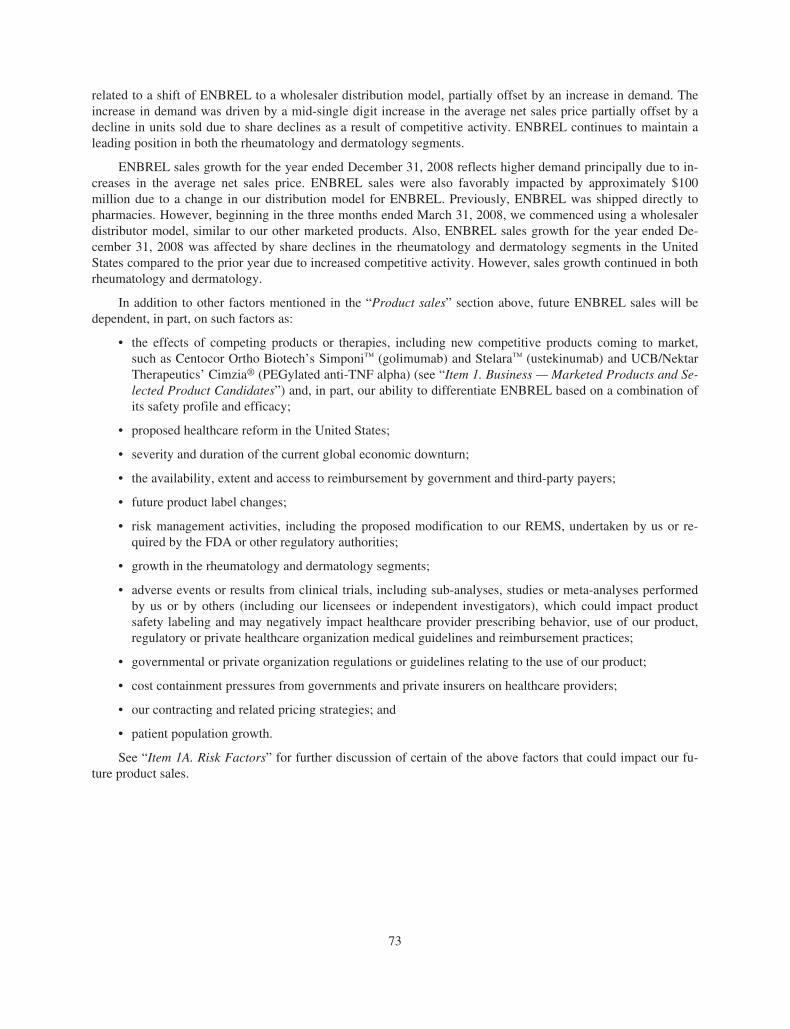
related to a shift of ENBREL to a wholesaler distribution model, partially offset by an increase in demand. Theincrease in demand was driven by a mid-single digit increase in the average net sales price partially offset by adecline in units sold due to share declines as a result of competitive activity. ENBREL continues to maintain aleading position in both the rheumatology and dermatology segments.
ENBREL sales growth for the year ended December 31, 2008 reflects higher demand principally due to in-creases in the average net sales price. ENBREL sales were also favorably impacted by approximately $100million due to a change in our distribution model for ENBREL. Previously, ENBREL was shipped directly topharmacies. However, beginning in the three months ended March 31, 2008, we commenced using a wholesalerdistributor model, similar to our other marketed products. Also, ENBREL sales growth for the year ended De-cember 31, 2008 was affected by share declines in the rheumatology and dermatology segments in the UnitedStates compared to the prior year due to increased competitive activity. However, sales growth continued in bothrheumatology and dermatology.
In addition to other factors mentioned in the “Product sales” section above, future ENBREL sales will bedependent, in part, on such factors as:
• the effects of competing products or therapies, including new competitive products coming to market,such as Centocor Ortho Biotech’s Simponi™ (golimumab) and Stelara™ (ustekinumab) and UCB/NektarTherapeutics’ Cimzia® (PEGylated anti-TNF alpha) (see “Item 1. Business — Marketed Products and Se-lected Product Candidates”) and, in part, our ability to differentiate ENBREL based on a combination ofits safety profile and efficacy;
• proposed healthcare reform in the United States;
• severity and duration of the current global economic downturn;
• the availability, extent and access to reimbursement by government and third-party payers;
• future product label changes;
• risk management activities, including the proposed modification to our REMS, undertaken by us or re-quired by the FDA or other regulatory authorities;
• growth in the rheumatology and dermatology segments;
• adverse events or results from clinical trials, including sub-analyses, studies or meta-analyses performedby us or by others (including our licensees or independent investigators), which could impact productsafety labeling and may negatively impact healthcare provider prescribing behavior, use of our product,regulatory or private healthcare organization medical guidelines and reimbursement practices;
• governmental or private organization regulations or guidelines relating to the use of our product;
• cost containment pressures from governments and private insurers on healthcare providers;
• our contracting and related pricing strategies; and
• patient population growth.
See “Item 1A. Risk Factors” for further discussion of certain of the above factors that could impact our fu-ture product sales.
73
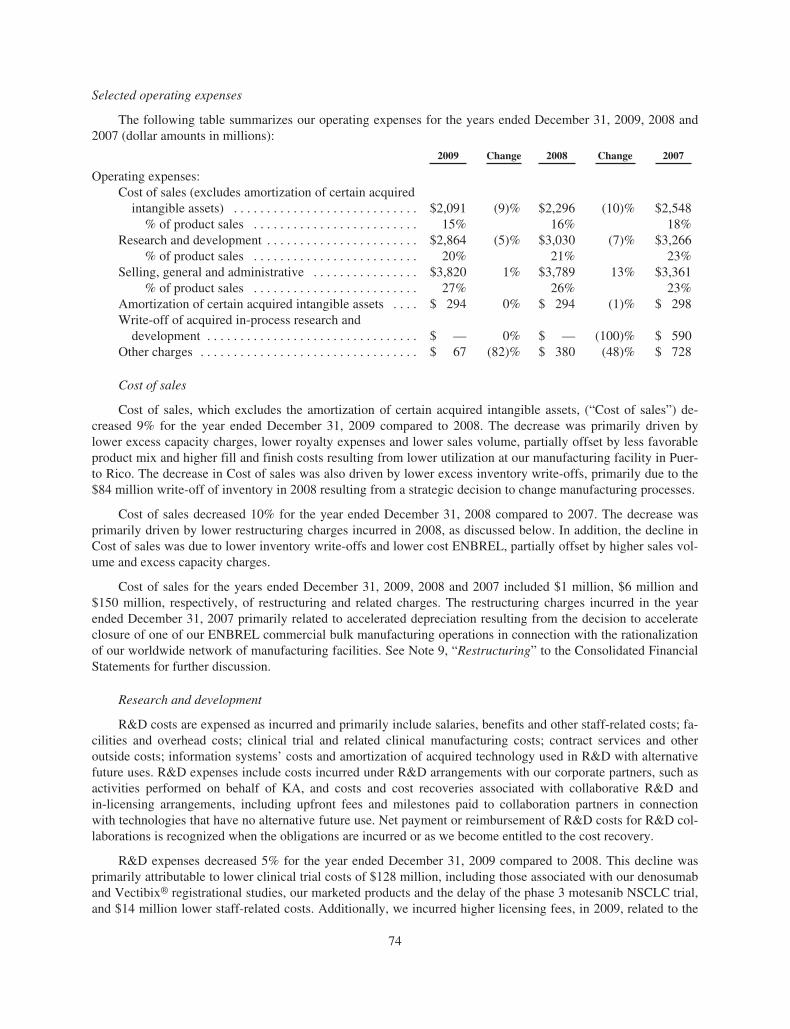
Selected operating expenses
The following table summarizes our operating expenses for the years ended December 31, 2009, 2008 and2007 (dollar amounts in millions):
2009 Change 2008 Change 2007
Operating expenses:Cost of sales (excludes amortization of certain acquired
intangible assets) . . . . . . . . . . . . . . . . . . . . . . . . . . . . $2,091 (9)% $2,296 (10)% $2,548% of product sales . . . . . . . . . . . . . . . . . . . . . . . . . 15% 16% 18%
Research and development . . . . . . . . . . . . . . . . . . . . . . . $2,864 (5)% $3,030 (7)% $3,266% of product sales . . . . . . . . . . . . . . . . . . . . . . . . . 20% 21% 23%
Selling, general and administrative . . . . . . . . . . . . . . . . $3,820 1% $3,789 13% $3,361% of product sales . . . . . . . . . . . . . . . . . . . . . . . . . 27% 26% 23%
Amortization of certain acquired intangible assets . . . . $ 294 0% $ 294 (1)% $ 298Write-off of acquired in-process research and
development . . . . . . . . . . . . . . . . . . . . . . . . . . . . . . . . $ — 0% $ — (100)% $ 590Other charges . . . . . . . . . . . . . . . . . . . . . . . . . . . . . . . . . $ 67 (82)% $ 380 (48)% $ 728
Cost of sales
Cost of sales, which excludes the amortization of certain acquired intangible assets, (“Cost of sales”) de-creased 9% for the year ended December 31, 2009 compared to 2008. The decrease was primarily driven bylower excess capacity charges, lower royalty expenses and lower sales volume, partially offset by less favorableproduct mix and higher fill and finish costs resulting from lower utilization at our manufacturing facility in Puer-to Rico. The decrease in Cost of sales was also driven by lower excess inventory write-offs, primarily due to the$84 million write-off of inventory in 2008 resulting from a strategic decision to change manufacturing processes.
Cost of sales decreased 10% for the year ended December 31, 2008 compared to 2007. The decrease wasprimarily driven by lower restructuring charges incurred in 2008, as discussed below. In addition, the decline inCost of sales was due to lower inventory write-offs and lower cost ENBREL, partially offset by higher sales vol-ume and excess capacity charges.
Cost of sales for the years ended December 31, 2009, 2008 and 2007 included $1 million, $6 million and$150 million, respectively, of restructuring and related charges. The restructuring charges incurred in the yearended December 31, 2007 primarily related to accelerated depreciation resulting from the decision to accelerateclosure of one of our ENBREL commercial bulk manufacturing operations in connection with the rationalizationof our worldwide network of manufacturing facilities. See Note 9, “Restructuring” to the Consolidated FinancialStatements for further discussion.
Research and development
R&D costs are expensed as incurred and primarily include salaries, benefits and other staff-related costs; fa-cilities and overhead costs; clinical trial and related clinical manufacturing costs; contract services and otheroutside costs; information systems’ costs and amortization of acquired technology used in R&D with alternativefuture uses. R&D expenses include costs incurred under R&D arrangements with our corporate partners, such asactivities performed on behalf of KA, and costs and cost recoveries associated with collaborative R&D andin-licensing arrangements, including upfront fees and milestones paid to collaboration partners in connectionwith technologies that have no alternative future use. Net payment or reimbursement of R&D costs for R&D col-laborations is recognized when the obligations are incurred or as we become entitled to the cost recovery.
R&D expenses decreased 5% for the year ended December 31, 2009 compared to 2008. This decline wasprimarily attributable to lower clinical trial costs of $128 million, including those associated with our denosumaband Vectibix® registrational studies, our marketed products and the delay of the phase 3 motesanib NSCLC trial,and $14 million lower staff-related costs. Additionally, we incurred higher licensing fees, in 2009, related to the
74
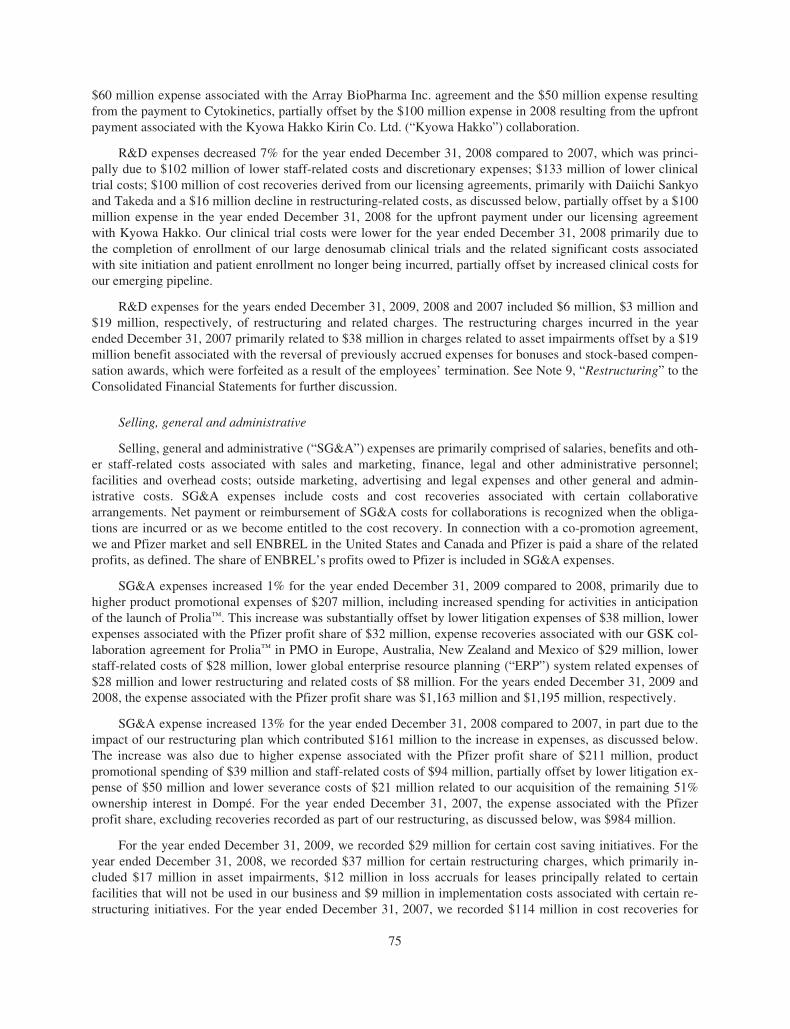
$60 million expense associated with the Array BioPharma Inc. agreement and the $50 million expense resultingfrom the payment to Cytokinetics, partially offset by the $100 million expense in 2008 resulting from the upfrontpayment associated with the Kyowa Hakko Kirin Co. Ltd. (“Kyowa Hakko”) collaboration.
R&D expenses decreased 7% for the year ended December 31, 2008 compared to 2007, which was princi-pally due to $102 million of lower staff-related costs and discretionary expenses; $133 million of lower clinicaltrial costs; $100 million of cost recoveries derived from our licensing agreements, primarily with Daiichi Sankyoand Takeda and a $16 million decline in restructuring-related costs, as discussed below, partially offset by a $100million expense in the year ended December 31, 2008 for the upfront payment under our licensing agreementwith Kyowa Hakko. Our clinical trial costs were lower for the year ended December 31, 2008 primarily due tothe completion of enrollment of our large denosumab clinical trials and the related significant costs associatedwith site initiation and patient enrollment no longer being incurred, partially offset by increased clinical costs forour emerging pipeline.
R&D expenses for the years ended December 31, 2009, 2008 and 2007 included $6 million, $3 million and$19 million, respectively, of restructuring and related charges. The restructuring charges incurred in the yearended December 31, 2007 primarily related to $38 million in charges related to asset impairments offset by a $19million benefit associated with the reversal of previously accrued expenses for bonuses and stock-based compen-sation awards, which were forfeited as a result of the employees’ termination. See Note 9, “Restructuring” to theConsolidated Financial Statements for further discussion.
Selling, general and administrative
Selling, general and administrative (“SG&A”) expenses are primarily comprised of salaries, benefits and oth-er staff-related costs associated with sales and marketing, finance, legal and other administrative personnel;facilities and overhead costs; outside marketing, advertising and legal expenses and other general and admin-istrative costs. SG&A expenses include costs and cost recoveries associated with certain collaborativearrangements. Net payment or reimbursement of SG&A costs for collaborations is recognized when the obliga-tions are incurred or as we become entitled to the cost recovery. In connection with a co-promotion agreement,we and Pfizer market and sell ENBREL in the United States and Canada and Pfizer is paid a share of the relatedprofits, as defined. The share of ENBREL’s profits owed to Pfizer is included in SG&A expenses.
SG&A expenses increased 1% for the year ended December 31, 2009 compared to 2008, primarily due tohigher product promotional expenses of $207 million, including increased spending for activities in anticipationof the launch of Prolia™. This increase was substantially offset by lower litigation expenses of $38 million, lowerexpenses associated with the Pfizer profit share of $32 million, expense recoveries associated with our GSK col-laboration agreement for Prolia™ in PMO in Europe, Australia, New Zealand and Mexico of $29 million, lowerstaff-related costs of $28 million, lower global enterprise resource planning (“ERP”) system related expenses of$28 million and lower restructuring and related costs of $8 million. For the years ended December 31, 2009 and2008, the expense associated with the Pfizer profit share was $1,163 million and $1,195 million, respectively.
SG&A expense increased 13% for the year ended December 31, 2008 compared to 2007, in part due to theimpact of our restructuring plan which contributed $161 million to the increase in expenses, as discussed below.The increase was also due to higher expense associated with the Pfizer profit share of $211 million, productpromotional spending of $39 million and staff-related costs of $94 million, partially offset by lower litigation ex-pense of $50 million and lower severance costs of $21 million related to our acquisition of the remaining 51%ownership interest in Dompé. For the year ended December 31, 2007, the expense associated with the Pfizerprofit share, excluding recoveries recorded as part of our restructuring, as discussed below, was $984 million.
For the year ended December 31, 2009, we recorded $29 million for certain cost saving initiatives. For theyear ended December 31, 2008, we recorded $37 million for certain restructuring charges, which primarily in-cluded $17 million in asset impairments, $12 million in loss accruals for leases principally related to certainfacilities that will not be used in our business and $9 million in implementation costs associated with certain re-structuring initiatives. For the year ended December 31, 2007, we recorded $114 million in cost recoveries for
75
certain restructuring charges, principally with respect to accelerated depreciation, in connection with ourco-promotion agreement with Pfizer and $11 million of benefit associated with the reversal of previously accruedexpenses for bonuses and stock-based compensation awards, which were forfeited as a result of the employees’termination. See Note 9, “Restructuring” to the Consolidated Financial Statements for further discussion.
Amortization of certain acquired intangible assets
Amortization of certain acquired intangible assets relates to products technology rights acquired in con-nection with the Immunex acquisition. For the year ended December 31, 2007, amortization expense alsoincluded $3 million related to the impairment of a non-ENBREL related intangible asset previously acquired inthe Immunex acquisition.
Write-off of acquired in-process research and development
In accordance with the accounting standards for business combinations, prior to January 1, 2009, the fairvalue of acquired IPR&D projects, which have no alternative future use and which have not reached techno-logical feasibility at the date of acquisition, were immediately expensed. In 2007, we wrote-off $270 million and$320 million of acquired IPR&D related to the acquisitions of Alantos and Ilypsa, respectively. The AlantosIPR&D amount is related to an orally-administered treatment for type II diabetes that, at the date of acquisition,was in phase 2a clinical trials. The Ilypsa IPR&D amount is related to a phosphate binder that, at the date of ac-quisition, was in phase 2 clinical trials for the treatment of hyperphosphatemia in CKD patients on hemodialysis.
We used the “income method” to determine the estimated fair values of acquired IPR&D, which uses a dis-counted cash flow model and applies a probability weighting based on estimates of successful productdevelopment and commercialization to estimated future net cash flows resulting from projected revenues and re-lated costs. These success rates take into account the stages of completion and the risks surrounding successfuldevelopment and commercialization of the underlying product candidates. These cash flows were then dis-counted to present value using a discount rate of 10%. The estimated after-tax cash flows were probabilityweighted at success rates of 38% for the Alantos product candidate and 77% for the Ilypsa product candidate.The incremental R&D expenses assumed to be incurred to obtain necessary regulatory approval for the Alantosand Ilypsa product candidates are immaterial.
The above assumptions were used solely for the purposes of estimating fair values of these product candi-dates as of the date of their acquisition. However, we cannot provide assurance that the underlying assumptionsused to forecast the cash flows or the timely and successful completion of development and commercializationwill materialize, as estimated. The major risks and uncertainties associated with the timely and successful com-pletion of development and commercialization of these product candidates are our ability to confirm their safetyand efficacy based on data from clinical trials, our ability to obtain necessary regulatory approvals and our abilityto successfully complete these tasks within budgeted costs. We are not able to market a human therapeutic with-out obtaining regulatory approvals, and such approvals require completing clinical trials that demonstrate aproduct candidate is safe and effective. Consequently, the eventual realized value of the acquired IPR&D mayvary from its estimated value at the date of acquisition.
We are continuing to develop the product candidate acquired in the Alantos acquisition. We have revieweddata from recently-completed phase 1 and 2 clinical trials for AMG 223, the product candidate acquired in theIlypsa acquisition. The results were consistent with what is likely required for registration of a phosphate-bindingtherapy. However, in the context of our overall development portfolio, the Company will be reviewing other op-tions for the commercialization of this investigational product.
In addition, in 2006, we wrote-off acquired IPR&D related to the acquisition of Abgenix. The IPR&Damount was primarily related to the rights which we did not own pursuant to our agreement with Abgenix tojointly develop and commercialize panitumumab and related to a royalty that we would have owed to Abgenixwith respect to future sales of denosumab as a result of using certain of Abgenix’s patented technologies in thedevelopment of this product candidate (see “Item 1. Business – Marketed Products and Selected ProductCandidates”). The elimination of the royalty on potential future sales of denosumab did not result in us incurring
76
any incremental R&D expenses. Panitumumab was Abgenix’s fully human monoclonal antibody which, at acquis-ition, was in phase 2/3 clinical trials for the treatment of certain types of cancer. The incremental R&D expensesassumed to be incurred to obtain necessary regulatory approvals for the various indications of panitumumab wereestimated at the time of acquisition at approximately $300 million and would be incurred through 2011 and therehave been no significant changes in these estimates.
At the date of acquisition, we intended to develop panitumumab for treatment of various types of cancer. In2006, panitumumab received FDA approval for the treatment of mCRC after disease progression on, or follow-ing, fluoropyrimidine-, oxaliplatin- and irinotecan- containing chemotherapy regimens and is marketed under thetrademark Vectibix®. In December 2007, the European Commission granted a conditional marketing author-ization for Vectibix® as monotherapy for the treatment of patients with EGFr expressing mCRC withnon-mutated (wild-type) KRAS genes after failure of standard chemotherapy regimens. This conditional approvalis reviewed annually by the CHMP, and in December 2008 we agreed as a condition of the renewal of approvalto conduct an additional clinical trial in the existing approved indication. The conditional approval was grantedagain in December 2009. We are continuing to develop or are evaluating plans to develop Vectibix® in all of theremaining indications we had intended at the date of acquisition. However, since the acquisition, there have beenseveral events that have affected the development plans for Vectibix® and because of these developments, ourexpected time to obtain regulatory approvals for the remaining indications has been delayed and the expectedcost to obtain necessary approvals has increased compared to our original expectations. See “Item 1. Business –Marketed Products and Selected Product Candidates” and “Item 1. Business – Research and Development andSelected Product Candidates” for developments related to Vectibix® and denosumab.
Other charges
As discussed in Note 9, “Restructuring” to the Consolidated Financial Statements, on August 15, 2007, weannounced a plan to restructure our worldwide operations in order to improve our cost structure while continuingto make significant R&D investments and build the framework for our future growth. Subsequently, we identi-fied certain additional initiatives designed to further assist in improving our cost structure. As a result of theserestructuring and related charges, we recorded in “Other charges” in 2009, 2008 and 2007 expenses for staffseparation costs of $30 million, $7 million and $209 million, respectively, asset impairments of $36 million and$366 million in 2008 and 2007, respectively, and charges of $4 million, $49 million and $119 million, re-spectively, primarily related to the loss accruals for leases for certain facilities that will not be used in ourbusiness.
Also, in 2009, the Company recorded in “Other charges” loss accruals for settlements of certain legal pro-ceedings aggregating $33 million. Also, in 2008, the Company recorded in “Other charges” loss accruals forsettlements of certain commercial legal proceedings aggregating $288 million, principally related to the settle-ment of the Ortho Biotech antitrust suit. In addition, in 2007, the Company recorded a $34 million loss accrualfor an ongoing commercial legal proceeding.
Interest expense, net
For the years ended December 31, 2009, 2008 and 2007, interest expense, net was $578 million, $551 mil-lion and $496 million, respectively. Included in interest expense, net for the years ended December 31, 2009,2008 and 2007, is the impact of non-cash interest expense of $250 million, $235 million and $168 million, re-spectively, resulting from the adoption of the new accounting standard that changed the method of accounting forour convertible debt. (See Note 2, “Change in method of accounting for convertible debt instruments” to theConsolidated Financial Statements for further discussion.)
Interest and other income, net
Interest and other income, net decreased 22% for the year ended December 31, 2009 compared to 2008.This decline is primarily due to lower interest income of $45 million, principally due to lower portfolio invest-ment returns; lower net gains on sales of investments of $28 million; and higher losses on certain leased facilitiesthat will no longer be used in our operations of $31 million; partially offset by higher foreign currency exchange
77
net gains of $27 million. Interest and other income, net increased 14% for the year ended December 31, 2008compared to 2007. This increase is primarily due to higher net gains on sales of investments of $79 million;higher interest income of $20 million, principally due to higher portfolio investment returns; partially offset byhigher foreign currency exchange net losses of $34 million.
Income taxes
Our effective tax rate was 11.5%, 19.2% and 18.9% for 2009, 2008 and 2007, respectively. Our effective taxrate for 2009 decreased over 2008 primarily due to: (i) the favorable resolution of certain prior years’ matterswith tax authorities, (ii) higher profits and manufacturing in Puerto Rico, which are taxed under an incentivegrant, and (iii) a tax benefit from adjustments to previously established deferred taxes arising from changes inCalifornia tax law enacted in 2009 and effective for subsequent periods. The resolution of prior years’ tax mattersrecognized in the year ended December 31, 2009 reduced the effective tax rate by 4.2%.
Our effective tax rate for 2008 remained relatively unchanged from 2007. Although the 2007 effective taxrate benefited from the favorable resolution of certain income tax examinations, this benefit was substantiallyoffset by the write-off of nondeductible acquired IPR&D costs, resulting in a comparable effective tax rate be-tween the two years.
As permitted under U.S. GAAP, we do not provide for U.S. income taxes on undistributed earnings of ourforeign operations that are intended to be invested indefinitely outside of the United States.
(See “Summary of Critical Accounting Policies – Income taxes” and Note 5, “Income taxes” to the Con-solidated Financial Statements for further discussion.)
Recent accounting pronouncements
In June 2009, the Financial Accounting Standards Board (“FASB”) issued a new accounting standard whichamends guidance regarding consolidation of variable interest entities to address the elimination of the concept ofa qualifying special purpose entity. This standard also replaces the quantitative-based risks and rewards calcu-lation for determining which enterprise has a controlling financial interest in a variable interest entity with anapproach focused on identifying which enterprise has the power to direct the activities of the variable interest en-tity and the obligation to absorb losses of the entity or the right to receive benefits from the entity. Additionally,this standard requires any enterprise that holds a variable interest in a variable interest entity to make ongoing as-sessments of whether it has a controlling financial interest in the variable interest entity and to provide enhanceddisclosures that will provide users of financial statements with more transparent information about an enterprise’sinvolvement in the variable interest entity. This standard is effective for us beginning January 1, 2010. The adop-tion of this standard is not expected to have a material impact on our consolidated results of operations, financialposition or cash flows.
In October 2009, the FASB issued a new accounting standard which amends guidance on accounting for rev-enue arrangements involving the delivery of more than one element of goods and/or services. This standardaddresses the unit of accounting for arrangements involving multiple deliverables and removes the previousseparation criteria that objective and reliable evidence of fair value of any undelivered item must exist for the de-livered item to be considered a separate unit of accounting. This standard also addresses how the arrangementconsideration should be allocated to each deliverable. Finally, this standard expands disclosures related to multi-ple element revenue arrangements. This standard is effective for us beginning January 1, 2011. The adoption ofthis standard is not expected to have a material impact on our consolidated results of operations, financial posi-tion or cash flows.
78
Financial Condition, Liquidity and Capital Resources
The following table summarizes selected financial data. The amounts reflect the adoption of a new account-ing standard which changed the method of accounting for our convertible debt (see Note 2, “Change in methodof accounting for convertible debt instruments” to the Consolidated Financial Statements for further discussionof our adoption of this new accounting standard, effective January 1, 2009) (in millions):
December 31,
2009 2008
Cash, cash equivalents and marketable securities . . . . . . . . . . . . . . . . . . . . . . . . . . . . . . . . . . . $13,442 $ 9,552Total assets . . . . . . . . . . . . . . . . . . . . . . . . . . . . . . . . . . . . . . . . . . . . . . . . . . . . . . . . . . . . . . . . 39,629 36,427Current debt . . . . . . . . . . . . . . . . . . . . . . . . . . . . . . . . . . . . . . . . . . . . . . . . . . . . . . . . . . . . . . . . — 1,000Non-current debt . . . . . . . . . . . . . . . . . . . . . . . . . . . . . . . . . . . . . . . . . . . . . . . . . . . . . . . . . . . . 10,601 8,352Stockholders’ equity . . . . . . . . . . . . . . . . . . . . . . . . . . . . . . . . . . . . . . . . . . . . . . . . . . . . . . . . . 22,667 20,885
We believe that existing funds, cash generated from operations and existing sources of and access to financ-ing are adequate to satisfy our working capital, capital expenditure and debt service requirements for theforeseeable future. In addition, we plan to opportunistically pursue our stock repurchase program and other busi-ness initiatives, including acquisitions and licensing activities. We anticipate that our liquidity needs can be metthrough a variety of sources, including: cash provided by operating activities, sale of marketable securities, bor-rowings through commercial paper and/or our syndicated credit facility and access to other debt markets andequity markets. (See “Item 1A. Risk Factors — Current economic conditions may magnify certain risks that af-fect our business.”)
Cash, cash equivalents and marketable securities
Of the total cash, cash equivalents and marketable securities at December 31, 2009, approximately $12.1 bil-lion was generated from operations in foreign tax jurisdictions and is intended for use in our foreign operations.If these funds were repatriated for use in our U.S. operations, we would be required to pay additional U.S. federaland state income taxes at the applicable marginal tax rates.
The primary objectives for our marketable security investment portfolio are liquidity and safety of principal.Investments are made with the objective of achieving the highest rate of return, consistent with these two ob-jectives. Our investment policy limits investments to certain types of debt and money market instruments issuedby institutions primarily with investment grade credit ratings and places restrictions on maturities and concen-tration by type and issuer.
79
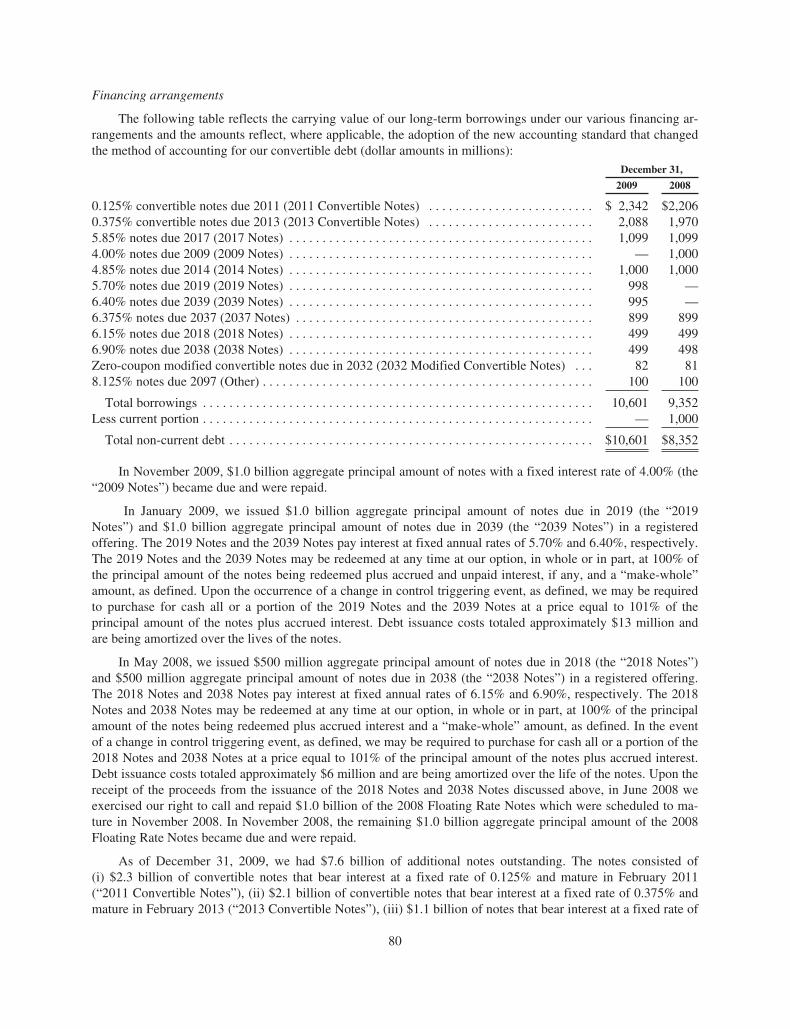
Financing arrangements
The following table reflects the carrying value of our long-term borrowings under our various financing ar-rangements and the amounts reflect, where applicable, the adoption of the new accounting standard that changedthe method of accounting for our convertible debt (dollar amounts in millions):
December 31,
2009 2008
0.125% convertible notes due 2011 (2011 Convertible Notes) . . . . . . . . . . . . . . . . . . . . . . . . . $ 2,342 $2,2060.375% convertible notes due 2013 (2013 Convertible Notes) . . . . . . . . . . . . . . . . . . . . . . . . . 2,088 1,9705.85% notes due 2017 (2017 Notes) . . . . . . . . . . . . . . . . . . . . . . . . . . . . . . . . . . . . . . . . . . . . . . 1,099 1,0994.00% notes due 2009 (2009 Notes) . . . . . . . . . . . . . . . . . . . . . . . . . . . . . . . . . . . . . . . . . . . . . . — 1,0004.85% notes due 2014 (2014 Notes) . . . . . . . . . . . . . . . . . . . . . . . . . . . . . . . . . . . . . . . . . . . . . . 1,000 1,0005.70% notes due 2019 (2019 Notes) . . . . . . . . . . . . . . . . . . . . . . . . . . . . . . . . . . . . . . . . . . . . . . 998 —6.40% notes due 2039 (2039 Notes) . . . . . . . . . . . . . . . . . . . . . . . . . . . . . . . . . . . . . . . . . . . . . . 995 —6.375% notes due 2037 (2037 Notes) . . . . . . . . . . . . . . . . . . . . . . . . . . . . . . . . . . . . . . . . . . . . . 899 8996.15% notes due 2018 (2018 Notes) . . . . . . . . . . . . . . . . . . . . . . . . . . . . . . . . . . . . . . . . . . . . . . 499 4996.90% notes due 2038 (2038 Notes) . . . . . . . . . . . . . . . . . . . . . . . . . . . . . . . . . . . . . . . . . . . . . . 499 498Zero-coupon modified convertible notes due in 2032 (2032 Modified Convertible Notes) . . . 82 818.125% notes due 2097 (Other) . . . . . . . . . . . . . . . . . . . . . . . . . . . . . . . . . . . . . . . . . . . . . . . . . . 100 100
Total borrowings . . . . . . . . . . . . . . . . . . . . . . . . . . . . . . . . . . . . . . . . . . . . . . . . . . . . . . . . . . . 10,601 9,352Less current portion . . . . . . . . . . . . . . . . . . . . . . . . . . . . . . . . . . . . . . . . . . . . . . . . . . . . . . . . . . . — 1,000
Total non-current debt . . . . . . . . . . . . . . . . . . . . . . . . . . . . . . . . . . . . . . . . . . . . . . . . . . . . . . . $10,601 $8,352
In November 2009, $1.0 billion aggregate principal amount of notes with a fixed interest rate of 4.00% (the“2009 Notes”) became due and were repaid.
In January 2009, we issued $1.0 billion aggregate principal amount of notes due in 2019 (the “2019Notes”) and $1.0 billion aggregate principal amount of notes due in 2039 (the “2039 Notes”) in a registeredoffering. The 2019 Notes and the 2039 Notes pay interest at fixed annual rates of 5.70% and 6.40%, respectively.The 2019 Notes and the 2039 Notes may be redeemed at any time at our option, in whole or in part, at 100% ofthe principal amount of the notes being redeemed plus accrued and unpaid interest, if any, and a “make-whole”amount, as defined. Upon the occurrence of a change in control triggering event, as defined, we may be requiredto purchase for cash all or a portion of the 2019 Notes and the 2039 Notes at a price equal to 101% of theprincipal amount of the notes plus accrued interest. Debt issuance costs totaled approximately $13 million andare being amortized over the lives of the notes.
In May 2008, we issued $500 million aggregate principal amount of notes due in 2018 (the “2018 Notes”)and $500 million aggregate principal amount of notes due in 2038 (the “2038 Notes”) in a registered offering.The 2018 Notes and 2038 Notes pay interest at fixed annual rates of 6.15% and 6.90%, respectively. The 2018Notes and 2038 Notes may be redeemed at any time at our option, in whole or in part, at 100% of the principalamount of the notes being redeemed plus accrued interest and a “make-whole” amount, as defined. In the eventof a change in control triggering event, as defined, we may be required to purchase for cash all or a portion of the2018 Notes and 2038 Notes at a price equal to 101% of the principal amount of the notes plus accrued interest.Debt issuance costs totaled approximately $6 million and are being amortized over the life of the notes. Upon thereceipt of the proceeds from the issuance of the 2018 Notes and 2038 Notes discussed above, in June 2008 weexercised our right to call and repaid $1.0 billion of the 2008 Floating Rate Notes which were scheduled to ma-ture in November 2008. In November 2008, the remaining $1.0 billion aggregate principal amount of the 2008Floating Rate Notes became due and were repaid.
As of December 31, 2009, we had $7.6 billion of additional notes outstanding. The notes consisted of(i) $2.3 billion of convertible notes that bear interest at a fixed rate of 0.125% and mature in February 2011(“2011 Convertible Notes”), (ii) $2.1 billion of convertible notes that bear interest at a fixed rate of 0.375% andmature in February 2013 (“2013 Convertible Notes”), (iii) $1.1 billion of notes that bear interest at a fixed rate of
80
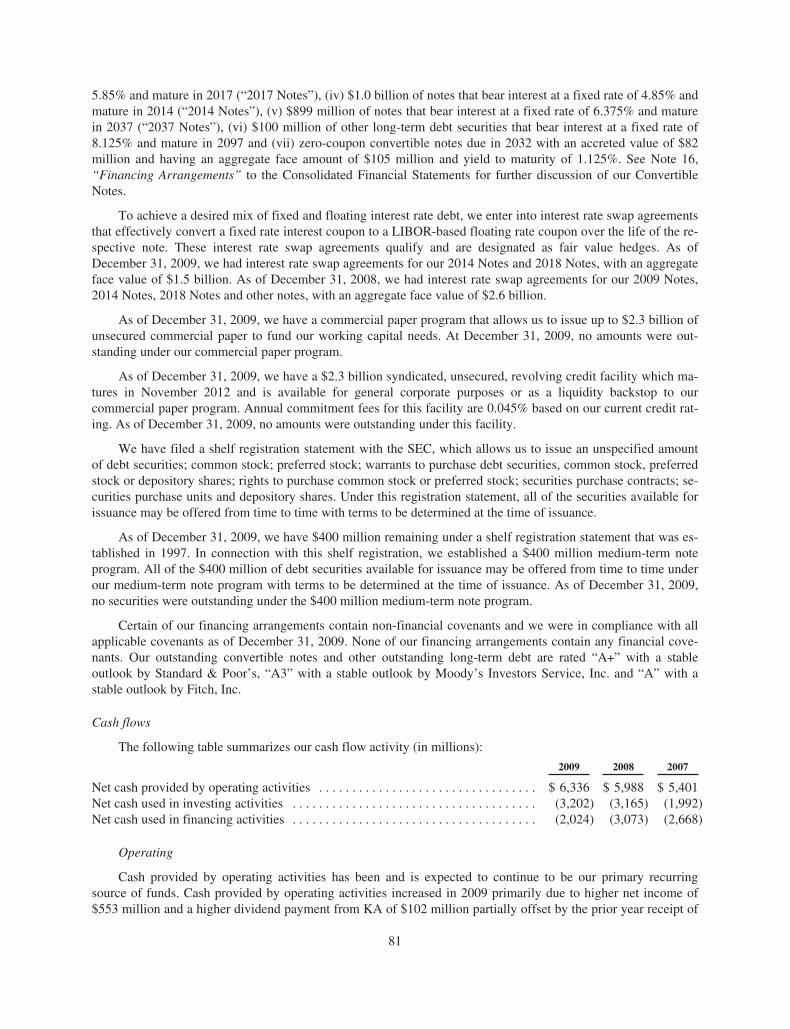
5.85% and mature in 2017 (“2017 Notes”), (iv) $1.0 billion of notes that bear interest at a fixed rate of 4.85% andmature in 2014 (“2014 Notes”), (v) $899 million of notes that bear interest at a fixed rate of 6.375% and maturein 2037 (“2037 Notes”), (vi) $100 million of other long-term debt securities that bear interest at a fixed rate of8.125% and mature in 2097 and (vii) zero-coupon convertible notes due in 2032 with an accreted value of $82million and having an aggregate face amount of $105 million and yield to maturity of 1.125%. See Note 16,“Financing Arrangements” to the Consolidated Financial Statements for further discussion of our ConvertibleNotes.
To achieve a desired mix of fixed and floating interest rate debt, we enter into interest rate swap agreementsthat effectively convert a fixed rate interest coupon to a LIBOR-based floating rate coupon over the life of the re-spective note. These interest rate swap agreements qualify and are designated as fair value hedges. As ofDecember 31, 2009, we had interest rate swap agreements for our 2014 Notes and 2018 Notes, with an aggregateface value of $1.5 billion. As of December 31, 2008, we had interest rate swap agreements for our 2009 Notes,2014 Notes, 2018 Notes and other notes, with an aggregate face value of $2.6 billion.
As of December 31, 2009, we have a commercial paper program that allows us to issue up to $2.3 billion ofunsecured commercial paper to fund our working capital needs. At December 31, 2009, no amounts were out-standing under our commercial paper program.
As of December 31, 2009, we have a $2.3 billion syndicated, unsecured, revolving credit facility which ma-tures in November 2012 and is available for general corporate purposes or as a liquidity backstop to ourcommercial paper program. Annual commitment fees for this facility are 0.045% based on our current credit rat-ing. As of December 31, 2009, no amounts were outstanding under this facility.
We have filed a shelf registration statement with the SEC, which allows us to issue an unspecified amountof debt securities; common stock; preferred stock; warrants to purchase debt securities, common stock, preferredstock or depository shares; rights to purchase common stock or preferred stock; securities purchase contracts; se-curities purchase units and depository shares. Under this registration statement, all of the securities available forissuance may be offered from time to time with terms to be determined at the time of issuance.
As of December 31, 2009, we have $400 million remaining under a shelf registration statement that was es-tablished in 1997. In connection with this shelf registration, we established a $400 million medium-term noteprogram. All of the $400 million of debt securities available for issuance may be offered from time to time underour medium-term note program with terms to be determined at the time of issuance. As of December 31, 2009,no securities were outstanding under the $400 million medium-term note program.
Certain of our financing arrangements contain non-financial covenants and we were in compliance with allapplicable covenants as of December 31, 2009. None of our financing arrangements contain any financial cove-nants. Our outstanding convertible notes and other outstanding long-term debt are rated “A+” with a stableoutlook by Standard & Poor’s, “A3” with a stable outlook by Moody’s Investors Service, Inc. and “A” with astable outlook by Fitch, Inc.
Cash flows
The following table summarizes our cash flow activity (in millions):
2009 2008 2007
Net cash provided by operating activities . . . . . . . . . . . . . . . . . . . . . . . . . . . . . . . . . $ 6,336 $ 5,988 $ 5,401Net cash used in investing activities . . . . . . . . . . . . . . . . . . . . . . . . . . . . . . . . . . . . . (3,202) (3,165) (1,992)Net cash used in financing activities . . . . . . . . . . . . . . . . . . . . . . . . . . . . . . . . . . . . . (2,024) (3,073) (2,668)
Operating
Cash provided by operating activities has been and is expected to continue to be our primary recurringsource of funds. Cash provided by operating activities increased in 2009 primarily due to higher net income of$553 million and a higher dividend payment from KA of $102 million partially offset by the prior year receipt of
81
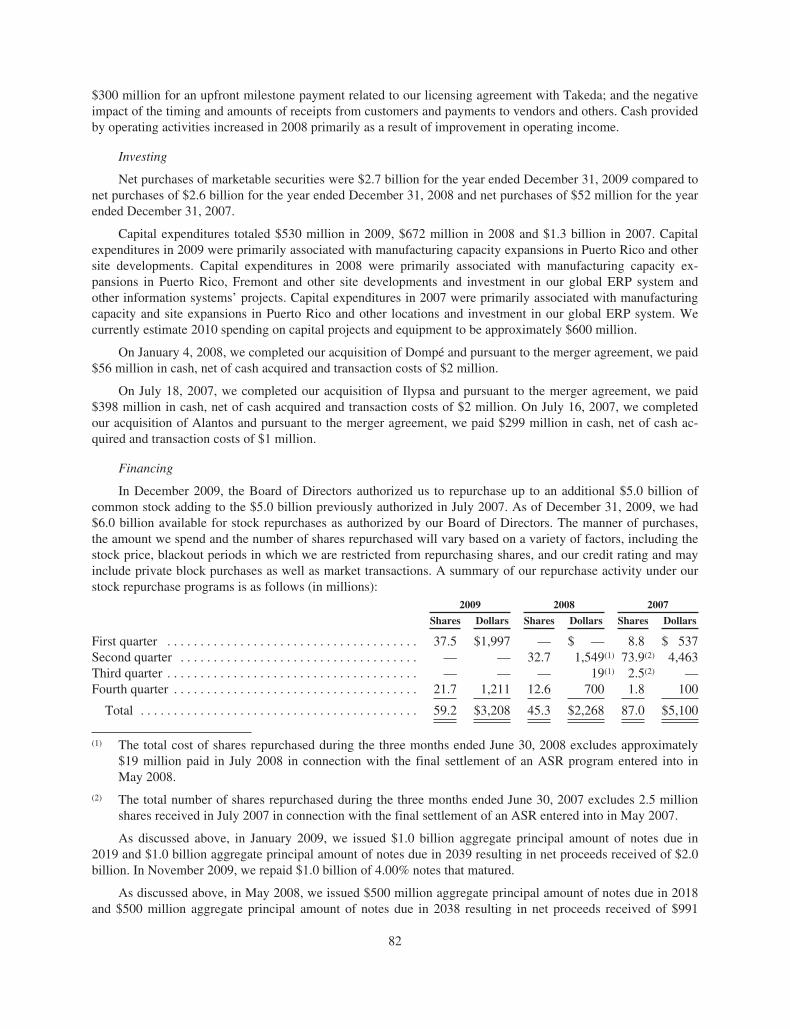
$300 million for an upfront milestone payment related to our licensing agreement with Takeda; and the negativeimpact of the timing and amounts of receipts from customers and payments to vendors and others. Cash providedby operating activities increased in 2008 primarily as a result of improvement in operating income.
Investing
Net purchases of marketable securities were $2.7 billion for the year ended December 31, 2009 compared tonet purchases of $2.6 billion for the year ended December 31, 2008 and net purchases of $52 million for the yearended December 31, 2007.
Capital expenditures totaled $530 million in 2009, $672 million in 2008 and $1.3 billion in 2007. Capitalexpenditures in 2009 were primarily associated with manufacturing capacity expansions in Puerto Rico and othersite developments. Capital expenditures in 2008 were primarily associated with manufacturing capacity ex-pansions in Puerto Rico, Fremont and other site developments and investment in our global ERP system andother information systems’ projects. Capital expenditures in 2007 were primarily associated with manufacturingcapacity and site expansions in Puerto Rico and other locations and investment in our global ERP system. Wecurrently estimate 2010 spending on capital projects and equipment to be approximately $600 million.
On January 4, 2008, we completed our acquisition of Dompé and pursuant to the merger agreement, we paid$56 million in cash, net of cash acquired and transaction costs of $2 million.
On July 18, 2007, we completed our acquisition of Ilypsa and pursuant to the merger agreement, we paid$398 million in cash, net of cash acquired and transaction costs of $2 million. On July 16, 2007, we completedour acquisition of Alantos and pursuant to the merger agreement, we paid $299 million in cash, net of cash ac-quired and transaction costs of $1 million.
Financing
In December 2009, the Board of Directors authorized us to repurchase up to an additional $5.0 billion ofcommon stock adding to the $5.0 billion previously authorized in July 2007. As of December 31, 2009, we had$6.0 billion available for stock repurchases as authorized by our Board of Directors. The manner of purchases,the amount we spend and the number of shares repurchased will vary based on a variety of factors, including thestock price, blackout periods in which we are restricted from repurchasing shares, and our credit rating and mayinclude private block purchases as well as market transactions. A summary of our repurchase activity under ourstock repurchase programs is as follows (in millions):
2009 2008 2007
Shares Dollars Shares Dollars Shares Dollars
First quarter . . . . . . . . . . . . . . . . . . . . . . . . . . . . . . . . . . . . . . 37.5 $1,997 — $ — 8.8 $ 537Second quarter . . . . . . . . . . . . . . . . . . . . . . . . . . . . . . . . . . . . — — 32.7 1,549(1) 73.9(2) 4,463Third quarter . . . . . . . . . . . . . . . . . . . . . . . . . . . . . . . . . . . . . . — — — 19(1) 2.5(2) —Fourth quarter . . . . . . . . . . . . . . . . . . . . . . . . . . . . . . . . . . . . . 21.7 1,211 12.6 700 1.8 100
Total . . . . . . . . . . . . . . . . . . . . . . . . . . . . . . . . . . . . . . . . . . 59.2 $3,208 45.3 $2,268 87.0 $5,100
(1) The total cost of shares repurchased during the three months ended June 30, 2008 excludes approximately$19 million paid in July 2008 in connection with the final settlement of an ASR program entered into inMay 2008.
(2) The total number of shares repurchased during the three months ended June 30, 2007 excludes 2.5 millionshares received in July 2007 in connection with the final settlement of an ASR entered into in May 2007.
As discussed above, in January 2009, we issued $1.0 billion aggregate principal amount of notes due in2019 and $1.0 billion aggregate principal amount of notes due in 2039 resulting in net proceeds received of $2.0billion. In November 2009, we repaid $1.0 billion of 4.00% notes that matured.
As discussed above, in May 2008, we issued $500 million aggregate principal amount of notes due in 2018and $500 million aggregate principal amount of notes due in 2038 resulting in net proceeds received of $991
82
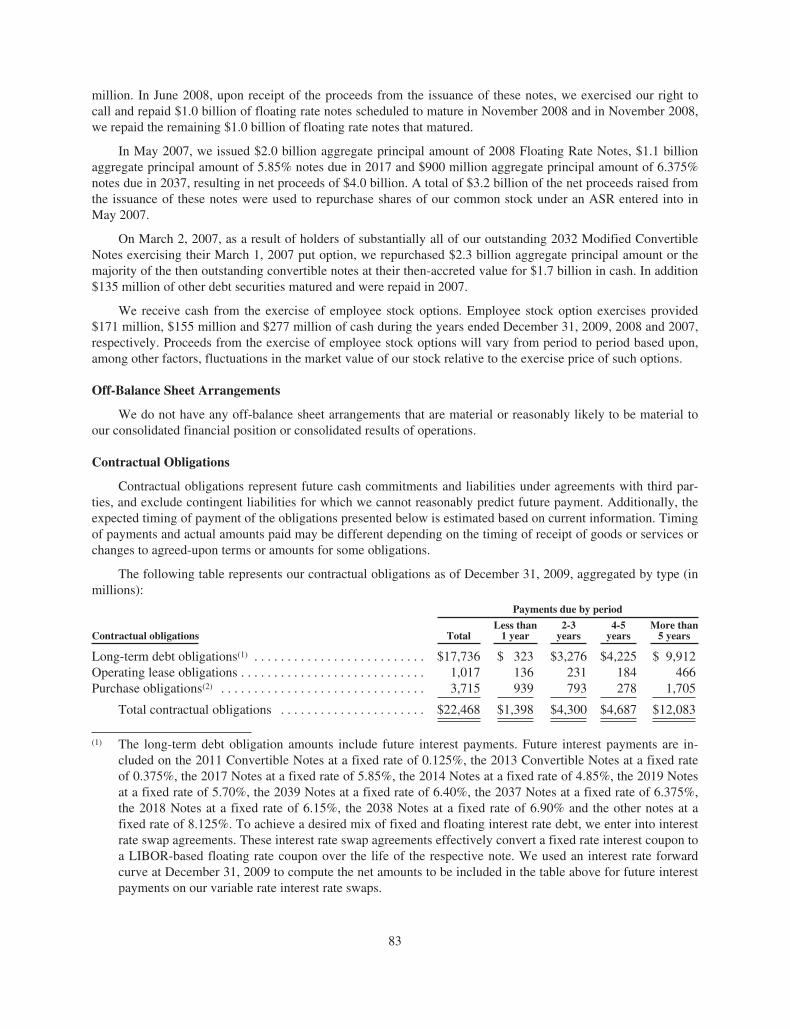
million. In June 2008, upon receipt of the proceeds from the issuance of these notes, we exercised our right tocall and repaid $1.0 billion of floating rate notes scheduled to mature in November 2008 and in November 2008,we repaid the remaining $1.0 billion of floating rate notes that matured.
In May 2007, we issued $2.0 billion aggregate principal amount of 2008 Floating Rate Notes, $1.1 billionaggregate principal amount of 5.85% notes due in 2017 and $900 million aggregate principal amount of 6.375%notes due in 2037, resulting in net proceeds of $4.0 billion. A total of $3.2 billion of the net proceeds raised fromthe issuance of these notes were used to repurchase shares of our common stock under an ASR entered into inMay 2007.
On March 2, 2007, as a result of holders of substantially all of our outstanding 2032 Modified ConvertibleNotes exercising their March 1, 2007 put option, we repurchased $2.3 billion aggregate principal amount or themajority of the then outstanding convertible notes at their then-accreted value for $1.7 billion in cash. In addition$135 million of other debt securities matured and were repaid in 2007.
We receive cash from the exercise of employee stock options. Employee stock option exercises provided$171 million, $155 million and $277 million of cash during the years ended December 31, 2009, 2008 and 2007,respectively. Proceeds from the exercise of employee stock options will vary from period to period based upon,among other factors, fluctuations in the market value of our stock relative to the exercise price of such options.
Off-Balance Sheet Arrangements
We do not have any off-balance sheet arrangements that are material or reasonably likely to be material toour consolidated financial position or consolidated results of operations.
Contractual Obligations
Contractual obligations represent future cash commitments and liabilities under agreements with third par-ties, and exclude contingent liabilities for which we cannot reasonably predict future payment. Additionally, theexpected timing of payment of the obligations presented below is estimated based on current information. Timingof payments and actual amounts paid may be different depending on the timing of receipt of goods or services orchanges to agreed-upon terms or amounts for some obligations.
The following table represents our contractual obligations as of December 31, 2009, aggregated by type (inmillions):
Contractual obligations
Payments due by period
TotalLess than
1 year2-3
years4-5
yearsMore than
5 years
Long-term debt obligations(1) . . . . . . . . . . . . . . . . . . . . . . . . . . $17,736 $ 323 $3,276 $4,225 $ 9,912Operating lease obligations . . . . . . . . . . . . . . . . . . . . . . . . . . . . 1,017 136 231 184 466Purchase obligations(2) . . . . . . . . . . . . . . . . . . . . . . . . . . . . . . . 3,715 939 793 278 1,705
Total contractual obligations . . . . . . . . . . . . . . . . . . . . . . $22,468 $1,398 $4,300 $4,687 $12,083
(1) The long-term debt obligation amounts include future interest payments. Future interest payments are in-cluded on the 2011 Convertible Notes at a fixed rate of 0.125%, the 2013 Convertible Notes at a fixed rateof 0.375%, the 2017 Notes at a fixed rate of 5.85%, the 2014 Notes at a fixed rate of 4.85%, the 2019 Notesat a fixed rate of 5.70%, the 2039 Notes at a fixed rate of 6.40%, the 2037 Notes at a fixed rate of 6.375%,the 2018 Notes at a fixed rate of 6.15%, the 2038 Notes at a fixed rate of 6.90% and the other notes at afixed rate of 8.125%. To achieve a desired mix of fixed and floating interest rate debt, we enter into interestrate swap agreements. These interest rate swap agreements effectively convert a fixed rate interest coupon toa LIBOR-based floating rate coupon over the life of the respective note. We used an interest rate forwardcurve at December 31, 2009 to compute the net amounts to be included in the table above for future interestpayments on our variable rate interest rate swaps.
83
(2) Purchase obligations primarily relate to (i) our long-term supply agreements with third party manufacturers,which are based on firm commitments for the purchase of production capacity; (ii) R&D commitments(including those related to clinical trials) for new and existing products; (iii) capital expenditures; (iv) openpurchase orders for the acquisition of goods and services in the ordinary course of business and (v) ouragreement with International Business Machines Corporation (“IBM”), which we entered into on Oc-tober 22, 2008, for certain information systems’ infrastructure services. The term of the agreement is fiveyears with three one-year renewals, at our option, for a total of up to eight years. The cost to us for the initialfive-year term, is estimated to be $505 million, included in the table above is $363 million for the remainingobligation. The estimated aggregate additional cost of the three one-year renewal options not included in thetable above is approximately $219 million. Our obligation to pay certain of these amounts may be reducedbased on certain future events.
Long-term liabilities for unrecognized tax benefits (“UTBs”) (net of federal tax benefits on state taxes) andrelated accrued interest and penalty totaling approximately $1.1 billion at December 31, 2009 are not included inthe table above because, due to their nature, there is a high degree of uncertainty regarding the timing of futurecash outflows and other events that extinguish these liabilities. As of December 31, 2009, we do not have any li-abilities for UTBs classified as current liabilities.
In addition to the above table, we are contractually obligated to make potential future success-baseddevelopment, regulatory and commercial milestone payments in conjunction with collaborative agreements wehave entered into with third-parties. These payments are contingent upon the occurrence of certain future eventsand, given the nature of these events, it is unclear when, if ever, we may be required to pay such amounts. Aspayment of these amounts is not considered probable, these contingent payments have not been included in thetable above or recorded on our Consolidated Balance Sheets. Further, the timing of any future payment is notreasonable estimable. Individually, future payment of any amounts under these arrangements is not expected tobe material in any one reporting period. As of December 31, 2009, the maximum amount that may be payable inthe future under all such arrangement is approximately $1.8 billion.
Summary of Critical Accounting Policies
The preparation of our consolidated financial statements in conformity with GAAP requires management tomake estimates and assumptions that affect the amounts reported in the financial statements and the notes to thefinancial statements. Some of those judgments can be subjective and complex, and therefore, actual results coulddiffer materially from those estimates under different assumptions or conditions.
Product sales, sales deductions and returns
Revenues from sales of our products are recognized when the products are shipped and title and risk of losshave passed. Product sales are recorded net of accruals for estimated rebates, wholesaler chargebacks, cash dis-counts and other deductions (collectively, “sales deductions”) and returns, which are established at the time ofsale.
84
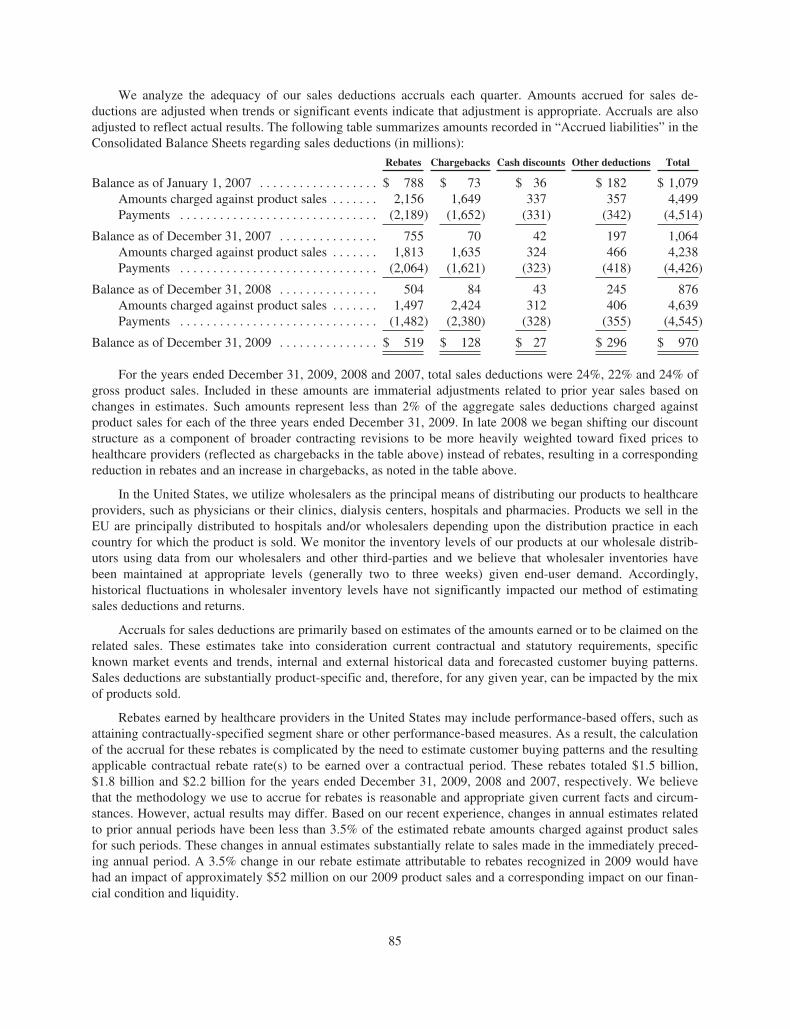
We analyze the adequacy of our sales deductions accruals each quarter. Amounts accrued for sales de-ductions are adjusted when trends or significant events indicate that adjustment is appropriate. Accruals are alsoadjusted to reflect actual results. The following table summarizes amounts recorded in “Accrued liabilities” in theConsolidated Balance Sheets regarding sales deductions (in millions):
Rebates Chargebacks Cash discounts Other deductions Total
Balance as of January 1, 2007 . . . . . . . . . . . . . . . . . . $ 788 $ 73 $ 36 $ 182 $ 1,079Amounts charged against product sales . . . . . . . 2,156 1,649 337 357 4,499Payments . . . . . . . . . . . . . . . . . . . . . . . . . . . . . . (2,189) (1,652) (331) (342) (4,514)
Balance as of December 31, 2007 . . . . . . . . . . . . . . . 755 70 42 197 1,064Amounts charged against product sales . . . . . . . 1,813 1,635 324 466 4,238Payments . . . . . . . . . . . . . . . . . . . . . . . . . . . . . . (2,064) (1,621) (323) (418) (4,426)
Balance as of December 31, 2008 . . . . . . . . . . . . . . . 504 84 43 245 876Amounts charged against product sales . . . . . . . 1,497 2,424 312 406 4,639Payments . . . . . . . . . . . . . . . . . . . . . . . . . . . . . . (1,482) (2,380) (328) (355) (4,545)
Balance as of December 31, 2009 . . . . . . . . . . . . . . . $ 519 $ 128 $ 27 $ 296 $ 970
For the years ended December 31, 2009, 2008 and 2007, total sales deductions were 24%, 22% and 24% ofgross product sales. Included in these amounts are immaterial adjustments related to prior year sales based onchanges in estimates. Such amounts represent less than 2% of the aggregate sales deductions charged againstproduct sales for each of the three years ended December 31, 2009. In late 2008 we began shifting our discountstructure as a component of broader contracting revisions to be more heavily weighted toward fixed prices tohealthcare providers (reflected as chargebacks in the table above) instead of rebates, resulting in a correspondingreduction in rebates and an increase in chargebacks, as noted in the table above.
In the United States, we utilize wholesalers as the principal means of distributing our products to healthcareproviders, such as physicians or their clinics, dialysis centers, hospitals and pharmacies. Products we sell in theEU are principally distributed to hospitals and/or wholesalers depending upon the distribution practice in eachcountry for which the product is sold. We monitor the inventory levels of our products at our wholesale distrib-utors using data from our wholesalers and other third-parties and we believe that wholesaler inventories havebeen maintained at appropriate levels (generally two to three weeks) given end-user demand. Accordingly,historical fluctuations in wholesaler inventory levels have not significantly impacted our method of estimatingsales deductions and returns.
Accruals for sales deductions are primarily based on estimates of the amounts earned or to be claimed on therelated sales. These estimates take into consideration current contractual and statutory requirements, specificknown market events and trends, internal and external historical data and forecasted customer buying patterns.Sales deductions are substantially product-specific and, therefore, for any given year, can be impacted by the mixof products sold.
Rebates earned by healthcare providers in the United States may include performance-based offers, such asattaining contractually-specified segment share or other performance-based measures. As a result, the calculationof the accrual for these rebates is complicated by the need to estimate customer buying patterns and the resultingapplicable contractual rebate rate(s) to be earned over a contractual period. These rebates totaled $1.5 billion,$1.8 billion and $2.2 billion for the years ended December 31, 2009, 2008 and 2007, respectively. We believethat the methodology we use to accrue for rebates is reasonable and appropriate given current facts and circum-stances. However, actual results may differ. Based on our recent experience, changes in annual estimates relatedto prior annual periods have been less than 3.5% of the estimated rebate amounts charged against product salesfor such periods. These changes in annual estimates substantially relate to sales made in the immediately preced-ing annual period. A 3.5% change in our rebate estimate attributable to rebates recognized in 2009 would havehad an impact of approximately $52 million on our 2009 product sales and a corresponding impact on our finan-cial condition and liquidity.
85
Wholesaler chargebacks relate to our contractual agreements to sell products to healthcare providers in theUnited States at fixed prices that are lower than the prices we charge wholesalers. When the healthcare providerspurchase our products through wholesalers at these reduced prices, the wholesaler charges us for the differencebetween the prices they pay us and the prices they sold the products to the healthcare providers. The provision forchargebacks is based on the expected sales by our wholesaler customers to healthcare providers. These charge-backs from wholesalers totaled $2.4 billion, $1.6 billion and $1.6 billion for the years ended December 31, 2009,2008 and 2007, respectively. Accruals for wholesaler chargebacks are less difficult to estimate than rebates andclosely approximate actual results since chargeback amounts are fixed at the date of purchase by the healthcareprovider and we settle these deductions generally within a few weeks of incurring the liability.
Product returns
Returns are estimated through comparison of historical return data to their related sales on a production lotbasis. Historical rates of return are determined for each product and are adjusted for known or expected changesin the marketplace specific to each product, when appropriate. Historically, sales return provisions have been in-significant, amounting to less than 1% of gross product sales. Furthermore, changes in estimates for prior yearsales return provisions have historically also been insignificant.
Inventories produced in preparation for product launches
The Company capitalizes inventories produced in preparation for product launches when the related productcandidates are considered to have a high probability of regulatory approval and the related costs are expected tobe recoverable through the commercialization of the product. In connection with the decision to capitalize suchinventory, we evaluate among other factors any identified risks or concerns with respect to the product candi-date’s safety and efficacy, the status of related discussions with regulatory authorities and the outlook forcommercial success, including the existence of current or anticipated competitive products and any reimburse-ment concerns. In addition, we evaluate any risks associated with the manufacturing of the product candidate aswell as considering the remaining shelf life of the inventory in relation to the expected launch date. Upon capital-ization, we continue to monitor any changes in these factors. In the event of any significant negativedevelopments, we may be required to impair previously capitalized costs.
At December 31, 2009, we had capitalized approximately $258 million of inventory costs related to our late-stage product candidate, Prolia™. In the United States, Prolia™ is currently being reviewed by the FDA for use inthe treatment of PMO in women. On February 19, 2010, we announced that the FDA has evaluated the content ofour Complete Response submission for Prolia™ in the treatment of PMO, which we submitted on January 25,2010, and classified it as a Class 2 resubmission. With the Class 2 designation, the FDA set a correspondingPDUFA action date of July 25, 2010. In addition in December 2009, the CHMP announced a positive opinion forthe marketing authorization of Prolia™ for the treatment of osteoporosis in postmenopausal women at increasedrisk of fractures, and for the treatment of bone loss associated with hormone ablation in men with prostate cancerat increased risk of fractures. If approved by the European Commission, we would receive marketing author-ization for Prolia™ in all EU Member States. The timing of actual launch dates would vary by country based onreimbursement authority approval of pricing which could follow the EMA approval by many months.
Income taxes
The Company provides for income taxes based on pretax income, applicable tax rates and tax planning op-portunities available in the various jurisdictions in which it operates.
We recognize the tax benefit from an uncertain tax position only if it is more likely than not that the tax posi-tion will be sustained on examination by the taxing authorities based on the technical merits of the position. Thetax benefits recognized in the financial statements on a particular tax position are measured based on the largestbenefit that has greater than a 50% likelihood of being realized upon settlement. The amount of UTBs is adjustedas appropriate for changes in facts and circumstances, such as significant amendments to existing tax law, newregulations or interpretations by the taxing authorities, new information obtained during a tax examination, or
86
resolution of an examination. We believe that our estimates for uncertain tax positions are appropriate and suffi-cient to pay assessments that may result from examinations of our tax returns. We recognize both accrued interestand penalties, where appropriate, related to UTBs in income tax expense.
Certain items are included in the Company’s tax return at different times than they are reflected in the finan-cial statements. Such timing differences create deferred tax assets and liabilities. Deferred tax assets are generallyitems that can be used as a tax deduction or credit in the tax return in future years but for which the Company hasalready recorded the tax benefit in the financial statements. The Company establishes valuation allowancesagainst its deferred tax assets when the amount of expected future taxable income is not likely to support the useof the deduction or credit. Deferred tax liabilities are either: (i) a tax expense recognized in the financial state-ments for which payment has been deferred; or (ii) an expense for which the Company has already taken adeduction on the tax return, but has not yet recognized the expense in the financial statements.
Our effective tax rate reflects the impact of undistributed foreign earnings for which no U.S. taxes have beenprovided because such earnings are intended to be invested indefinitely outside the United States based on ourprojected cash flow, working capital and long-term investment requirements of our U.S. and foreign operations.If future events, including material changes in estimates of cash, working capital and long-term investment re-quirements necessitate that certain assets associated with these earnings be repatriated to the United States, anadditional tax provision and related liability would be required at the applicable U.S. and state marginal incometax rates which could materially impact our future effective tax rate.
Our operations are subject to the tax laws, regulations and administrative practices of the United States, U.S.state jurisdictions and other countries in which we do business. Significant changes in these rules could have amaterial adverse effect on the results of operations. For example, substantial reform of U.S. tax law regarding taxon certain foreign profits could result in an increase in our effective tax rate, which could have a material adverseeffect on our financial results.
Contingencies
In the ordinary course of business, we are involved in various legal proceedings such as intellectual propertydisputes, contractual disputes, governmental investigations and class action suits. Certain of these proceedingsare discussed in Note 20, “Contingencies and commitments” to the Consolidated Financial Statements. We recordaccruals for such contingencies to the extent we conclude their occurrence is both probable and estimable. Weconsider all relevant factors when making assessments regarding these contingencies.
While it is not possible to accurately predict or determine the eventual outcome of these items, one or moreof these items currently pending could have a material adverse effect on our consolidated results of operations,financial position or cash flows.
Item 7A. QUANTITATIVE AND QUALITATIVE DISCLOSURES ABOUT MARKET RISK
We are a global biotechnology company with operations in various countries. We are exposed to marketrisks that may result from changes in interest rates, foreign currency exchange rates and prices of equity instru-ments as well as changes in the general economic conditions in the countries where we conduct business. Toreduce certain of these risks, we monitor the financial condition of our larger customers and limit our credit ex-posure by setting credit limits, requiring letters of credit and obtaining credit insurance, as we deem appropriate.In addition, we have an investment policy that limits investments to certain types of debt and money market in-struments issued by institutions primarily with investment grade credit ratings and places restriction on maturitiesand concentrations by type and issuer. We also enter into various types of foreign exchange and interest rate de-rivative hedging transactions as part of our risk management program. We do not use derivatives for speculativetrading purposes and are not a party to leveraged derivatives.
The capital and credit markets have experienced extreme volatility and disruption which has led to un-certainty and liquidity issues for both borrowers and investors. Short-term interest rates on U.S. treasuryinstruments have declined considerably while other short-term rates have fluctuated in excess of historical norms.As a result, in the discussion that follows, we have assumed a hypothetical change in interest rates of 100 basispoints from those at December 31, 2009 and 2008. Similarly, over this same period there has been extraordinary
87
volatility in the currency markets, and we have consequentially assumed a hypothetical 20% change in foreignexchange rates against the U.S. dollar based on its position relative to other currencies as of December 31, 2009and 2008.
Interest rate sensitive financial instruments
Our investment portfolio of available-for-sale debt securities at December 31, 2009 and 2008 was comprisedprimarily of U.S. treasury securities; obligations of U.S. government agencies and FDIC guaranteed bank debt;corporate debt securities; mortgage and asset backed securities; money market mutual funds; and other short-term interest bearing securities, principally comprised of commercial paper. The fair value of our investmentportfolio of debt securities was $13.3 billion and $9.4 billion at December 31, 2009 and 2008, respectively. Dura-tion is a sensitivity measure that can be used to approximate the change in the value of a security that will resultfrom a 100 basis point change in interest rates. Applying a duration model, a hypothetical 100 basis point in-crease in interest rates at December 31, 2009 and 2008 would not have resulted in a material effect on the fairvalues of these securities on these dates. In addition, a hypothetical 100 basis point decrease in interest rates atDecember 31, 2009 and 2008 would not result in a material effect on the related income or cash flows in the re-spective ensuing year.
As of December 31, 2009, we had outstanding debt with a carrying value of $10.6 billion and a fair value of$11.6 billion. As of December 31, 2008, we had outstanding debt with a carrying value of $9.4 billion and a fairvalue of $9.8 billion. Our outstanding debt at December 31, 2009 and 2008 was comprised entirely of debt withfixed interest rates. Changes in interest rates do not affect interest expense or cash flows on fixed rate debt.Changes in interest rates would, however, affect the fair values of fixed rate debt. A hypothetical 100 basis pointdecrease in interest rates relative to interest rates at December 31, 2009, would have resulted in an increase ofapproximately $760 million in the aggregate fair value of our outstanding debt on this date. A hypothetical 100basis point decrease in interest rates relative to the interest rates at December 31, 2008, would have resulted in anincrease of approximately $560 million in the aggregate fair value of our outstanding debt on this date.
To achieve a desired mix of fixed and floating interest rate debt, we have entered into interest rate swapagreements, which qualify and have been designated as fair value hedges, for certain of our fixed rate debt withnotional amounts totaling $1.5 billion and $2.6 billion at December 31, 2009 and 2008, respectively. These de-rivative contracts effectively convert a fixed rate interest coupon to a LIBOR-based floating rate coupon over thelife of the respective note. A hypothetical 100 basis point increase in interest rates relative to interest rates at De-cember 31, 2009 and 2008 would not have resulted in a material effect on the fair value of our interest rate swapagreements on these dates and would not result in a material effect on the related income or cash flows in the re-spective ensuing year.
Foreign currency sensitive instruments
Our results of operations are affected by fluctuations in the value of the U.S. dollar as compared to foreigncurrencies, predominately the Euro, as a result of the sale of our products in foreign markets. Increases and de-creases in our international product sales from movements in foreign exchange rates are partially offset by thecorresponding increases or decreases in our international operating expenses. To further reduce our net exposureto foreign exchange rate fluctuations on our results of operations, we enter into foreign currency forward and op-tion contracts.
We enter into forward and options contracts that are designated for accounting purposes as cash flow hedges ofcertain anticipated foreign currency transactions. As of December 31, 2009, we had open forward and options con-tracts, primarily Euro based, with notional amounts of $3.4 billion and $376 million, respectively. As ofDecember 31, 2008, we had open forward and options contracts, primarily Euro based, with notional amounts of$2.5 billion and $386 million, respectively. As of December 31, 2009, the net unrealized losses and at December 31,2008 the net unrealized gains on these contracts were not material. With regard to forward and option contracts thatwere open at December 31, 2009, a hypothetical 20% adverse movement in foreign exchange rates compared withthe U.S. dollar relative to exchange rates at December 31, 2009, would have resulted in a reduction in fair value ofapproximately $720 million on this date and, in the ensuing year, a reduction in income and cash flows of approx-imately $330 million. With regard to contracts that were open at December 31, 2008, a hypothetical 20% adverse
88
movement in foreign exchange rates compared with the U.S. dollar relative to exchange rates at December 31, 2008,would have resulted in a reduction in fair value of approximately $550 million on this date and, in the ensuing year,a reduction in income and cash flows of approximately $260 million.
Also at December 31, 2009 and 2008, we had open forward contracts with notional amounts totaling $414million and $472 million, respectively, that hedged fluctuations of certain assets and liabilities denominated inforeign currencies but were not designated as hedges for accounting purposes. These contracts had no materialnet unrealized gains or losses at December 31, 2009 and 2008. With regard to forward contracts that were open atDecember 31, 2009 and 2008 a hypothetical 20% adverse movement in foreign exchange rates compared withthe U.S. dollar relative to exchange rates at December 31, 2009 and 2008 would not have had a material impacton fair value on these dates or would not result in a material effect on the related income or cash flows in the re-spective ensuing year.
The analysis above does not consider the impact that hypothetical changes in foreign currency exchangerates would have on anticipated transactions or on assets and liabilities that these foreign currency sensitiveinstruments were designed to offset.
Market price sensitive instruments
As of December 31, 2009 and 2008, we were also exposed to price risk on equity securities included in ourportfolio of investments, which were acquired primarily for the promotion of business and strategic objectives.These investments are generally in small capitalization stocks in the biotechnology industry sector. Price riskrelative to our equity investment portfolio at December 31, 2009 and 2008 was not material.
Counterparty credit risks
Our financial instruments, including derivatives, are subject to counterparty credit risk which we consider aspart of the overall fair value measurement. We attempt to mitigate this risk through credit monitoring procedures.
Item 8. FINANCIAL STATEMENTS AND SUPPLEMENTARY DATA
The information required by this item is incorporated herein by reference to the financial statements andschedule listed in Item 15(a)1 and (a)2 of Part IV and included in this Form 10-K Annual Report.
Item 9. CHANGES IN AND DISAGREEMENTS WITH ACCOUNTANTS ON ACCOUNTING ANDFINANCIAL DISCLOSURES
None.
Item 9A. CONTROLS AND PROCEDURES
We maintain “disclosure controls and procedures,” as such term is defined under Exchange ActRule 13a-15(e), that are designed to ensure that information required to be disclosed in Amgen’s Exchange Actreports is recorded, processed, summarized and reported within the time periods specified in the SEC’s rules andforms, and that such information is accumulated and communicated to Amgen’s management, including its ChiefExecutive Officer and Chief Financial Officer, as appropriate, to allow timely decisions regarding required dis-closures. In designing and evaluating the disclosure controls and procedures, Amgen’s management recognizedthat any controls and procedures, no matter how well designed and operated, can provide only reasonable assur-ance of achieving the desired control objectives and in reaching a reasonable level of assurance Amgen’smanagement necessarily was required to apply its judgment in evaluating the cost-benefit relationship of possiblecontrols and procedures. We have carried out an evaluation under the supervision and with the participation ofour management, including Amgen’s Chief Executive Officer and Chief Financial Officer, of the effectiveness ofthe design and operation of Amgen’s disclosure controls and procedures. Based upon their evaluation and subjectto the foregoing, the Chief Executive Officer and Chief Financial Officer concluded that our disclosure controlsand procedures were effective as of December 31, 2009.
Management determined that, as of December 31, 2009, there were no changes in our internal control overfinancial reporting that occurred during the fiscal quarter then ended that have materially affected, or are reason-ably likely to materially affect, our internal control over financial reporting.
89
Management’s Report on Internal Control over Financial Reporting
Management of the Company is responsible for establishing and maintaining adequate internal control overfinancial reporting, as such term is defined in Rule 13a-15(f) under the Securities Exchange Act of 1934. TheCompany’s internal control over financial reporting is designed to provide reasonable assurance regarding the re-liability of financial reporting and the preparation of financial statements for external purposes in accordancewith generally accepted accounting principles in the United States. However, all internal control systems, nomatter how well designed, have inherent limitations. Therefore, even those systems determined to be effectivecan provide only reasonable assurance with respect to financial statement preparation and reporting.
Management assessed the effectiveness of the Company’s internal control over financial reporting as of De-cember 31, 2009. In making this assessment, management used the criteria set forth by the Committee ofSponsoring Organizations of the Treadway Commission (“COSO”) in Internal Control-Integrated Framework.Based on our assessment, management believes that the Company maintained effective internal control over fi-nancial reporting as of December 31, 2009, based on those criteria.
The effectiveness of the Company’s internal control over financial reporting has been audited by Ernst &Young LLP, an independent registered public accounting firm, as stated in their report appearing below, whichexpresses an unqualified opinion on the effectiveness of the Company’s internal control over financial reportingas of December 31, 2009.
90
Report of Independent Registered Public Accounting Firm
The Board of Directors and Stockholders of Amgen Inc.
We have audited Amgen Inc.’s (the “Company”) internal control over financial reporting as of De-cember 31, 2009, based on criteria established in Internal Control — Integrated Framework issued by theCommittee of Sponsoring Organizations of the Treadway Commission (the COSO criteria). Amgen Inc.’s man-agement is responsible for maintaining effective internal control over financial reporting, and for its assessmentof the effectiveness of internal control over financial reporting included in the accompanying Management’s Re-port on Internal Control over Financial Reporting. Our responsibility is to express an opinion on the Company’sinternal control over financial reporting based on our audit.
We conducted our audit in accordance with the standards of the Public Company Accounting OversightBoard (United States). Those standards require that we plan and perform the audit to obtain reasonable assuranceabout whether effective internal control over financial reporting was maintained in all material respects. Our au-dit included obtaining an understanding of internal control over financial reporting, assessing the risk that amaterial weakness exists, testing and evaluating the design and operating effectiveness of internal control basedon the assessed risk, and performing such other procedures as we considered necessary in the circumstances. Webelieve that our audit provides a reasonable basis for our opinion.
A company’s internal control over financial reporting is a process designed to provide reasonable assuranceregarding the reliability of financial reporting and the preparation of financial statements for external purposes inaccordance with generally accepted accounting principles. A company’s internal control over financial reportingincludes those policies and procedures that (1) pertain to the maintenance of records that, in reasonable detail,accurately and fairly reflect the transactions and dispositions of the assets of the company; (2) provide reasonableassurance that transactions are recorded as necessary to permit preparation of financial statements in accordancewith generally accepted accounting principles, and that receipts and expenditures of the company are being madeonly in accordance with authorizations of management and directors of the company; and (3) provide reasonableassurance regarding prevention or timely detection of unauthorized acquisition, use, or disposition of the compa-ny’s assets that could have a material effect on the financial statements.
Because of its inherent limitations, internal control over financial reporting may not prevent or detect mis-statements. Also, projections of any evaluation of effectiveness to future periods are subject to the risk thatcontrols may become inadequate because of changes in conditions, or that the degree of compliance with thepolicies or procedures may deteriorate.
In our opinion, Amgen Inc. maintained, in all material respects, effective internal control over financial re-porting as of December 31, 2009, based on the COSO criteria.
We also have audited, in accordance with the standards of the Public Company Accounting Oversight Board(United States), the Consolidated Balance Sheets as of December 31, 2009 and 2008, and the related Con-solidated Statements of Income, Stockholders’ Equity, and Cash Flows for each of the three years in the periodended December 31, 2009 and our report dated March 1, 2010 expressed an unqualified opinion thereon.
/s/ Ernst & Young LLP
Los Angeles, CaliforniaMarch 1, 2010
91
Item 9B. OTHER INFORMATION
Not applicable.
PART III
Item 10. DIRECTORS, EXECUTIVE OFFICERS AND CORPORATE GOVERNANCE OF THEREGISTRANT
Information about our Directors is incorporated by reference from the section entitled “ITEM 1 — ELEC-TION OF DIRECTORS” in our Proxy Statement for the 2010 Annual Meeting of Stockholders to be filed withthe SEC within 120 days of December 31, 2009 (the “Proxy Statement”). Information about compliance withSection 16(a) of the Securities Exchange Act of 1934 is incorporated by reference from the section entitled“OTHER MATTERS — Section 16(a) Beneficial Ownership Reporting Compliance” in our Proxy Statement.Information about our Audit Committee, members of the committee and our Audit Committee financial expertsis incorporated by reference from the section entitled “CORPORATE GOVERNANCE — Board Committees —Audit Committee” in our Proxy Statement. Information about our executive officers is contained in the dis-cussion entitled “Item 1. Business — Executive Officers of the Registrant.”
Code of Ethics
We maintain a code of ethics applicable to our principal executive officer, principal financial officer, princi-pal accounting officer or controller, and other persons performing similar functions. To view this code of ethicsfree of charge, please visit our website at www.amgen.com (This website address is not intended to function as ahyperlink, and the information contained in our website is not intended to be a part of this filing). We intend tosatisfy the disclosure requirements under Item 5.05 of Form 8-K regarding an amendment to, or waiver from, aprovision of this code of ethics, if any, by posting such information on our website as set forth above.
Item 11. EXECUTIVE COMPENSATION
Information about director and executive compensation is incorporated by reference from the sections enti-tled “EXECUTIVE COMPENSATION” and “CORPORATE GOVERNANCE” in our Proxy Statement.
92
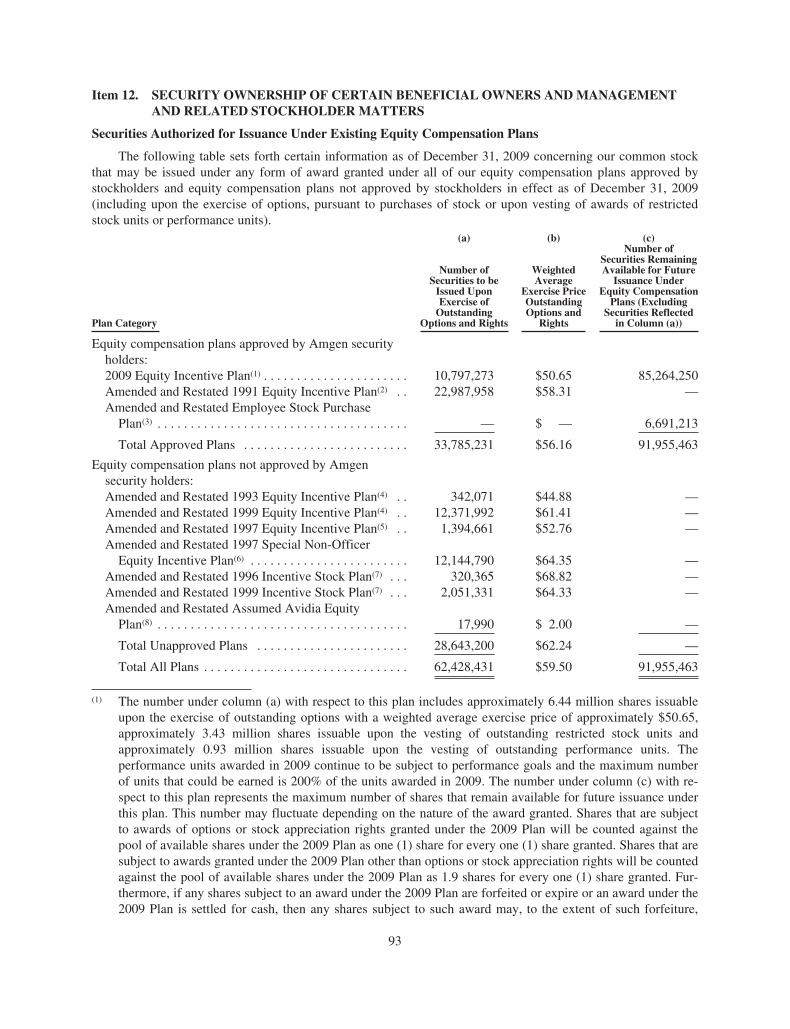
Item 12. SECURITY OWNERSHIP OF CERTAIN BENEFICIAL OWNERS AND MANAGEMENTAND RELATED STOCKHOLDER MATTERS
Securities Authorized for Issuance Under Existing Equity Compensation Plans
The following table sets forth certain information as of December 31, 2009 concerning our common stockthat may be issued under any form of award granted under all of our equity compensation plans approved bystockholders and equity compensation plans not approved by stockholders in effect as of December 31, 2009(including upon the exercise of options, pursuant to purchases of stock or upon vesting of awards of restrictedstock units or performance units).
(a) (b) (c)
Plan Category
Number ofSecurities to be
Issued UponExercise of
OutstandingOptions and Rights
WeightedAverage
Exercise PriceOutstandingOptions and
Rights
Number ofSecurities RemainingAvailable for Future
Issuance UnderEquity Compensation
Plans (ExcludingSecurities Reflected
in Column (a))
Equity compensation plans approved by Amgen securityholders:2009 Equity Incentive Plan(1) . . . . . . . . . . . . . . . . . . . . . . 10,797,273 $50.65 85,264,250Amended and Restated 1991 Equity Incentive Plan(2) . . 22,987,958 $58.31 —Amended and Restated Employee Stock Purchase
Plan(3) . . . . . . . . . . . . . . . . . . . . . . . . . . . . . . . . . . . . . . — $ — 6,691,213
Total Approved Plans . . . . . . . . . . . . . . . . . . . . . . . . . 33,785,231 $56.16 91,955,463
Equity compensation plans not approved by Amgensecurity holders:Amended and Restated 1993 Equity Incentive Plan(4) . . 342,071 $44.88 —Amended and Restated 1999 Equity Incentive Plan(4) . . 12,371,992 $61.41 —Amended and Restated 1997 Equity Incentive Plan(5) . . 1,394,661 $52.76 —Amended and Restated 1997 Special Non-Officer
Equity Incentive Plan(6) . . . . . . . . . . . . . . . . . . . . . . . . 12,144,790 $64.35 —Amended and Restated 1996 Incentive Stock Plan(7) . . . 320,365 $68.82 —Amended and Restated 1999 Incentive Stock Plan(7) . . . 2,051,331 $64.33 —Amended and Restated Assumed Avidia Equity
Plan(8) . . . . . . . . . . . . . . . . . . . . . . . . . . . . . . . . . . . . . . 17,990 $ 2.00 —
Total Unapproved Plans . . . . . . . . . . . . . . . . . . . . . . . 28,643,200 $62.24 —
Total All Plans . . . . . . . . . . . . . . . . . . . . . . . . . . . . . . . 62,428,431 $59.50 91,955,463
(1) The number under column (a) with respect to this plan includes approximately 6.44 million shares issuableupon the exercise of outstanding options with a weighted average exercise price of approximately $50.65,approximately 3.43 million shares issuable upon the vesting of outstanding restricted stock units andapproximately 0.93 million shares issuable upon the vesting of outstanding performance units. Theperformance units awarded in 2009 continue to be subject to performance goals and the maximum numberof units that could be earned is 200% of the units awarded in 2009. The number under column (c) with re-spect to this plan represents the maximum number of shares that remain available for future issuance underthis plan. This number may fluctuate depending on the nature of the award granted. Shares that are subjectto awards of options or stock appreciation rights granted under the 2009 Plan will be counted against thepool of available shares under the 2009 Plan as one (1) share for every one (1) share granted. Shares that aresubject to awards granted under the 2009 Plan other than options or stock appreciation rights will be countedagainst the pool of available shares under the 2009 Plan as 1.9 shares for every one (1) share granted. Fur-thermore, if any shares subject to an award under the 2009 Plan are forfeited or expire or an award under the2009 Plan is settled for cash, then any shares subject to such award may, to the extent of such forfeiture,
93
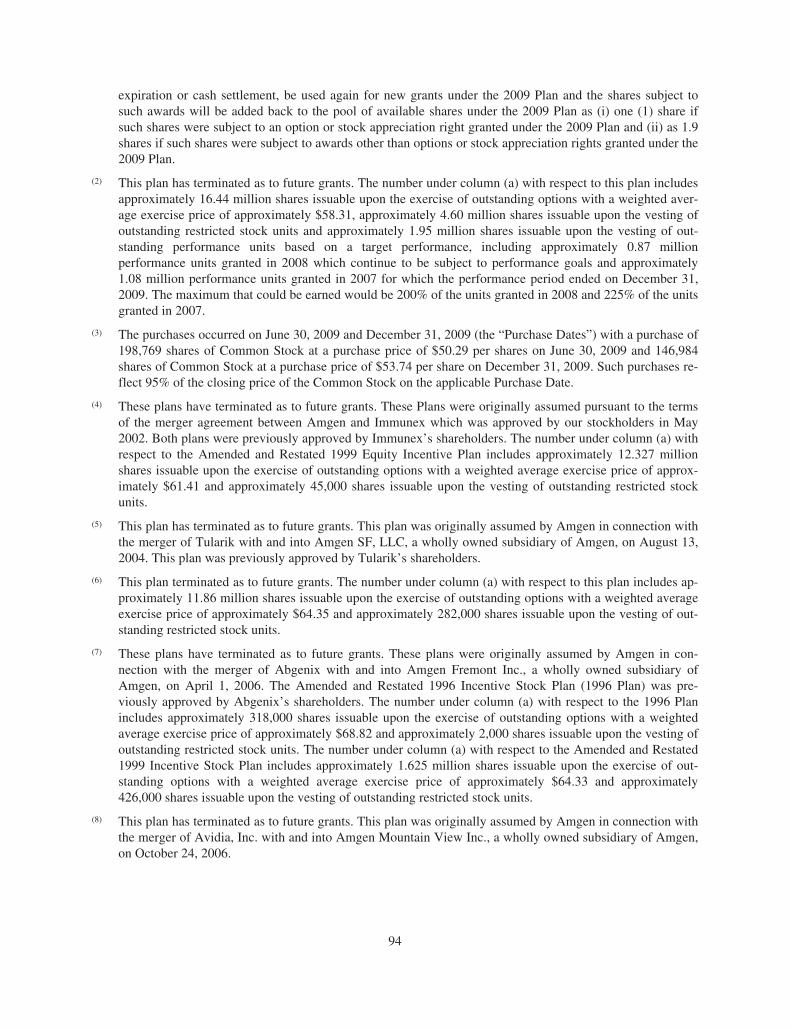
expiration or cash settlement, be used again for new grants under the 2009 Plan and the shares subject tosuch awards will be added back to the pool of available shares under the 2009 Plan as (i) one (1) share ifsuch shares were subject to an option or stock appreciation right granted under the 2009 Plan and (ii) as 1.9shares if such shares were subject to awards other than options or stock appreciation rights granted under the2009 Plan.
(2) This plan has terminated as to future grants. The number under column (a) with respect to this plan includesapproximately 16.44 million shares issuable upon the exercise of outstanding options with a weighted aver-age exercise price of approximately $58.31, approximately 4.60 million shares issuable upon the vesting ofoutstanding restricted stock units and approximately 1.95 million shares issuable upon the vesting of out-standing performance units based on a target performance, including approximately 0.87 millionperformance units granted in 2008 which continue to be subject to performance goals and approximately1.08 million performance units granted in 2007 for which the performance period ended on December 31,2009. The maximum that could be earned would be 200% of the units granted in 2008 and 225% of the unitsgranted in 2007.
(3) The purchases occurred on June 30, 2009 and December 31, 2009 (the “Purchase Dates”) with a purchase of198,769 shares of Common Stock at a purchase price of $50.29 per shares on June 30, 2009 and 146,984shares of Common Stock at a purchase price of $53.74 per share on December 31, 2009. Such purchases re-flect 95% of the closing price of the Common Stock on the applicable Purchase Date.
(4) These plans have terminated as to future grants. These Plans were originally assumed pursuant to the termsof the merger agreement between Amgen and Immunex which was approved by our stockholders in May2002. Both plans were previously approved by Immunex’s shareholders. The number under column (a) withrespect to the Amended and Restated 1999 Equity Incentive Plan includes approximately 12.327 millionshares issuable upon the exercise of outstanding options with a weighted average exercise price of approx-imately $61.41 and approximately 45,000 shares issuable upon the vesting of outstanding restricted stockunits.
(5) This plan has terminated as to future grants. This plan was originally assumed by Amgen in connection withthe merger of Tularik with and into Amgen SF, LLC, a wholly owned subsidiary of Amgen, on August 13,2004. This plan was previously approved by Tularik’s shareholders.
(6) This plan terminated as to future grants. The number under column (a) with respect to this plan includes ap-proximately 11.86 million shares issuable upon the exercise of outstanding options with a weighted averageexercise price of approximately $64.35 and approximately 282,000 shares issuable upon the vesting of out-standing restricted stock units.
(7) These plans have terminated as to future grants. These plans were originally assumed by Amgen in con-nection with the merger of Abgenix with and into Amgen Fremont Inc., a wholly owned subsidiary ofAmgen, on April 1, 2006. The Amended and Restated 1996 Incentive Stock Plan (1996 Plan) was pre-viously approved by Abgenix’s shareholders. The number under column (a) with respect to the 1996 Planincludes approximately 318,000 shares issuable upon the exercise of outstanding options with a weightedaverage exercise price of approximately $68.82 and approximately 2,000 shares issuable upon the vesting ofoutstanding restricted stock units. The number under column (a) with respect to the Amended and Restated1999 Incentive Stock Plan includes approximately 1.625 million shares issuable upon the exercise of out-standing options with a weighted average exercise price of approximately $64.33 and approximately426,000 shares issuable upon the vesting of outstanding restricted stock units.
(8) This plan has terminated as to future grants. This plan was originally assumed by Amgen in connection withthe merger of Avidia, Inc. with and into Amgen Mountain View Inc., a wholly owned subsidiary of Amgen,on October 24, 2006.
94
Security Ownership of Directors and Executive Officers and Certain Beneficial Owners
Information about security ownership of certain beneficial owners and management is incorporated by refer-ence from the sections entitled “SECURITY OWNERSHIP OF DIRECTORS AND EXECUTIVE OFFICERSand SECURITY OWNERSHIP OF CERTAIN BENEFICIAL OWNERS” in our Proxy Statement.
Item 13. CERTAIN RELATIONSHIPS AND RELATED TRANSACTIONS AND DIRECTORINDEPENDENCE
Information about certain relationships and related transactions and directors independence is incorporatedby reference from the sections entitled “CERTAIN RELATIONSHIPS AND RELATED TRANSACTIONS” and“CORPORATE GOVERNANCE — Board Independence” in our Proxy Statement.
Item 14. PRINCIPAL ACCOUNTING FEES AND SERVICES
Information about the fees for professional services rendered by our independent registered public account-ants is incorporated by reference from the section entitled “AUDIT MATTERS — Independent RegisteredPublic Accountants” in our Proxy Statement.
95
PART IV
Item 15. EXHIBITS AND FINANCIAL STATEMENT SCHEDULES
(a)1. Index to Financial Statements
The following Consolidated Financial Statements are included herein:
Pagenumber
Report of Independent Registered Public Accounting Firm . . . . . . . . . . . . . . . . . . . . . . . . . . . . . . . . . . F-1Consolidated Statements of Income for each of the three years in the period ended
December 31, 2009 . . . . . . . . . . . . . . . . . . . . . . . . . . . . . . . . . . . . . . . . . . . . . . . . . . . . . . . . . . . . . . . F-2Consolidated Balance Sheets at December 31, 2009 and 2008 . . . . . . . . . . . . . . . . . . . . . . . . . . . . . . . F-3Consolidated Statements of Stockholders’ Equity for each of the three years in the period ended
December 31, 2009 . . . . . . . . . . . . . . . . . . . . . . . . . . . . . . . . . . . . . . . . . . . . . . . . . . . . . . . . . . . . . . . F-4Consolidated Statements of Cash Flows for each of the three years in the period ended
December 31, 2009 . . . . . . . . . . . . . . . . . . . . . . . . . . . . . . . . . . . . . . . . . . . . . . . . . . . . . . . . . . . . . . . F-5Notes to Consolidated Financial Statements . . . . . . . . . . . . . . . . . . . . . . . . . . . . . . . . . . . . . . . . . . . . . F-6 - F-57
(a)2. Index to Financial Statement Schedules
The following Schedule is filed as part of this Form 10-K Annual Report:Page
number
II. Valuation Accounts . . . . . . . . . . . . . . . . . . . . . . . . . . . . . . . . . . . . . . . . . . . . . . . . . . . . . . . . . . . . . . F-58
All other schedules are omitted because they are not applicable, not required or because the required in-formation is included in the Consolidated Financial Statements or notes thereto.
(a)3. Exhibits
Exhibit No. Description
3.1 Restated Certificate of Incorporation (As Effective January 9, 2006). (Filed as an exhibit to Form10-K for the year ended December 31, 2005 on March 10, 2006 and incorporated herein byreference.)
3.2 Certificate of Amendment of the Restated Certificate of Incorporation (As Effective May 24,2007). (Filed as an exhibit to Form 10-Q for the quarter ended June 30, 2007 on August 9, 2007and incorporated herein by reference.)
3.3 Certificate of Correction of the Restated Certificate of Incorporation (As Effective May 24, 2007).(Filed as an exhibit to Form 10-Q for the quarter ended June 30, 2007 on August 9, 2007 andincorporated herein by reference.)
3.4 Certificate of Elimination of the Certificate of Designations of the Series A Junior ParticipatingPreferred Stock (As Effective December 10, 2008). (Filed as an exhibit to Form 10-K for the yearended December 31, 2008 on February 27, 2009 and incorporated herein by reference.)
3.5 Certificate of Amendment of the Restated Certificate of Incorporation (As Effective May 12,2009). (Filed as an exhibit to Form 10-Q for the quarter ended June 30, 2009 on August 10, 2009and incorporated herein by reference.)
3.6 Certificate of Correction of the Restated Certificate of Incorporation (As Effective May 12, 2009).(Filed as an exhibit to Form 10-Q for the quarter ended June 30, 2009 on August 10, 2009 andincorporated herein by reference.)
3.7 Amended and Restated Bylaws of Amgen Inc. (As Amended and Restated October 6, 2009).(Filed as an exhibit to Form 8-K filed on October 7, 2009 and incorporated herein by reference.)
96
Exhibit No. Description
4.1 Form of stock certificate for the common stock, par value $.0001 of the Company. (Filed as anexhibit to Form 10-Q for the quarter ended March 31, 1997 on May 13, 1997 and incorporatedherein by reference.)
4.2 Form of Indenture, dated January 1, 1992. (Filed as an exhibit to Form S-3 Registration Statementfiled on December 19, 1991 and incorporated herein by reference.)
4.3 Agreement of Resignation, Appointment and Acceptance dated February 15, 2008. (Filed as anexhibit to Form 10-K for the year ended December 31, 2007 on February 28, 2008 andincorporated herein by reference.)
4.4 Two Agreements of Resignation, Appointment and Acceptance in the same form as the previouslyfiled Exhibit 4.3 hereto are omitted pursuant to instruction 2 to Item 601 of Regulation S-K. Eachof these agreements, which are dated December 15, 2008, replaces the current trustee under theagreements listed as Exhibits 4.9 and 4.16, respectively, with Bank of New York Mellon. AmgenInc. hereby agrees to furnish copies of these agreements to the Securities and ExchangeCommission upon request.
4.5 First Supplemental Indenture, dated February 26, 1997. (Filed as an exhibit to Form 8-K onMarch 14, 1997 and incorporated herein by reference.)
4.6 8-1⁄8% Debentures due April 1, 2097. (Filed as an exhibit to Form 8-K filed on April 8, 1997 andincorporated herein by reference.)
4.7 Officer’s Certificate, dated as of January 1, 1992, as supplemented by the First SupplementalIndenture, dated as of February 26, 1997, establishing a series of securities entitled “81⁄8%Debentures due April 1, 2097.” (Filed as an exhibit to Form 8-K filed on April 8, 1997 andincorporated herein by reference.)
4.8 Form of Liquid Yield Option™ Note due 2032. (Filed as an exhibit to Form 8-K on March 1, 2002and incorporated herein by reference.)
4.9 Indenture, dated as of March 1, 2002. (Filed as an exhibit to Form 8-K on March 1, 2002 andincorporated herein by reference.)
4.10 First Supplemental Indenture, dated March 2, 2005. (Filed as an exhibit to Form 8-K filed onMarch 4, 2005 and incorporated herein by reference.)
4.11 Indenture, dated as of August 4, 2003. (Filed as an exhibit to Form S-3 Registration Statement onAugust 4, 2003 and incorporated herein by reference.)
4.12 Form of 4.00% Senior Note due 2009. (Filed as an exhibit to Form 8-K on November 19, 2004and incorporated herein by reference.)
4.13 Form of 4.85% Senior Notes due 2014. (Filed as an exhibit to Form 8-K on November 19, 2004and incorporated herein by reference.)
4.14 Officers’ Certificate, dated November 18, 2004, including forms of the 4.00% Senior Notes due2009 and 4.85% Senior Notes due 2014. (Filed as an exhibit to Form 8-K on November 19, 2004and incorporated herein by reference.)
4.15 Form of Zero Coupon Convertible Note due 2032. (Filed as an exhibit to Form 8-K on May 6,2005 and incorporated herein by reference.)
4.16 Indenture, dated as of May 6, 2005. (Filed as an exhibit to Form 8-K on May 6, 2005 andincorporated herein by reference.)
4.17 Indenture, dated as of February 17, 2006 and First Supplemental Indenture, dated as of June 8,2006 (including form of 0.125% Convertible Senior Note due 2011). (Filed as exhibit toForm 10-Q for the quarter ended June 30, 2006 on August 9, 2006 and incorporated herein byreference.)
97
Exhibit No. Description
4.18 Indenture, dated as of February 17, 2006 and First Supplemental Indenture, dated as of June 8,2006 (including form of 0.375% Convertible Senior Note due 2013). (Filed as exhibit toForm 10-Q for the quarter ended June 30, 2006 on August 9, 2006 and incorporated herein byreference.)
4.19 Corporate Commercial Paper - Master Note between and among Amgen Inc., as Issuer, Cede &Co., as Nominee of The Depository Trust Company, and Citibank, N.A., as Paying Agent. (Filedas an exhibit to Form 10-Q for the quarter ended March 31, 1998 on May 13, 1998 andincorporated herein by reference.)
4.20 Officers’ Certificate of Amgen Inc. dated as of May 30, 2007, including forms of the Company’sSenior Floating Rate Notes due 2008, 5.85% Senior Notes due 2017 and 6.375% Senior Notes due2037. (Filed as an exhibit to Form 8-K on May 30, 2007 and incorporated herein by reference.)
4.21 Registration Rights Agreement, dated as of May 30, 2007, among Amgen Inc. and MorganStanley & Co. Incorporated, Merrill Lynch, Pierce, Fenner & Smith Incorporated, BarclaysCapital Inc., Credit Suisse Securities (USA) LLC, Goldman, Sachs & Co., Citigroup GlobalMarkets Inc., J.P. Morgan Securities Inc. and Lehman Brothers Inc. (Filed as an exhibit toForm 8-K on May 30, 2007 and incorporated herein by reference.)
10.1+ Amgen Inc. 2009 Equity Incentive Plan. (Filed as Appendix A to Amgen Inc.’s Proxy Statementon March 26, 2009 and incorporated herein by reference.)
10.2+* Form of Stock Option Agreement and Restricted Stock Unit Agreement for the Amgen Inc. 2009Equity Incentive Plan.
10.3+* Amgen Inc. 2009 Performance Award Program (As Amended and Restated on December 4,2009).
10.4+ Form of Performance Unit Agreement for the Amgen Inc. 2009 Performance Award Program.(Filed as an exhibit to Form 10-Q for the quarter ended September 30, 2009 on November 6, 2009and incorporated herein by reference.)
10.5+ Amgen Inc. 2009 Director Equity Incentive Program. (Filed as an exhibit to Form 8-K on May 8,2009 and incorporated herein by reference.)
10.6+ Form of Grant of Non-Qualified Stock Option Agreement and Restricted Stock Unit Agreementfor the Amgen Inc. 2009 Director Equity Incentive Program. (Filed as an exhibit to Form 8-K onMay 8, 2009 and incorporated herein by reference.)
10.7+ Amgen Supplemental Retirement Plan (As Amended and Restated effective January 1, 2009.)(Filed as an exhibit to Form 10-Q for the quarter ended September 30, 2008 on November 7, 2008and incorporated herein by reference.)
10.8+ Amendment and Restatement of the Amgen Change of Control Severance Plan (As AmendedDecember 9, 2008). (Filed as an exhibit to Form 10-K for the year ended December 31, 2008 onFebruary 27, 2009 and incorporated herein by reference.)
10.9+ Amgen Inc. Executive Incentive Plan. (As Amended and Restated effective January 1, 2009.)(Filed as an exhibit to Form 10-Q for the quarter ended September 30, 2008 on November 7, 2008and incorporated herein by reference.)
10.10+ Amgen Inc. Executive Nonqualified Retirement Plan. (As Amended and Restated effectiveJanuary 1, 2009.) (Filed as an exhibit to Form 10-Q for the quarter ended September 30, 2008 onNovember 7, 2008 and incorporated herein by reference.)
10.11+ Amgen Nonqualified Deferred Compensation Plan (As Amended and Restated effective January1, 2009.) (Filed as an exhibit to Form 10-Q for the quarter ended September 30, 2008 onNovember 7, 2008 and incorporated herein by reference.)
98
Exhibit No. Description
10.12+ 2002 Special Severance Pay Plan for Amgen Employees. (Filed as an exhibit to Form 10-Q for thequarter ended June 30, 2002 on August 13, 2002 and incorporated herein by reference.)
10.13 Product License Agreement, dated September 30, 1985, and Technology License Agreement,dated, September 30, 1985 between Amgen and Ortho Pharmaceutical Corporation. (Filed as anexhibit to Form 10-Q for the quarter ended June 30, 2000 on August 1, 2000 and incorporatedherein by reference.)
10.14 Shareholders’ Agreement, dated May 11, 1984, among Amgen, Kirin Brewery Company, Limitedand Kirin-Amgen, Inc. (Filed as an exhibit to Form 10-K for the year ended December 31, 2000on March 7, 2001 and incorporated herein by reference.)
10.15 Amendment No. 1 dated March 19, 1985, Amendment No. 2 dated July 29, 1985 (effective July 1,1985), and Amendment No. 3, dated December 19, 1985, to the Shareholders’ Agreement datedMay 11, 1984. (Filed as an exhibit to Form 10-Q for the quarter ended June 30, 2000 on August 1,2000 and incorporated herein by reference.)
10.16 Amendment No. 4 dated October 16, 1986 (effective July 1, 1986), Amendment No. 5 datedDecember 6, 1986 (effective July 1, 1986), Amendment No. 6 dated June 1, 1987, AmendmentNo. 7 dated July 17, 1987 (effective April 1, 1987), Amendment No. 8 dated May 28, 1993(effective November 13, 1990), Amendment No. 9 dated December 9, 1994 (effective June 14,1994), Amendment No. 10 effective March 1, 1996, and Amendment No. 11 effective March 20,2000 to the Shareholders’ Agreement, dated May 11, 1984. (Filed as exhibits to Form 10-K for theyear ended December 31, 2000 on March 7, 2001 and incorporated herein by reference.)
10.17 Amendment No. 12 to the Shareholders’ Agreement, dated January 31, 2001. (Filed as an exhibitto Form 10-Q for the quarter ended June 30, 2005 on August 8, 2005 and incorporated herein byreference.)
10.18 Amendment No. 13 to the Shareholders’ Agreement, dated June 28, 2007 (with certainconfidential information deleted therefrom). (Filed as an exhibit to Form 10-Q for the quarterended June 30, 2007 on August 9, 2007 and incorporated herein by reference.)
10.19 Product License Agreement, dated September 30, 1985, and Technology License Agreement,dated September 30, 1985, between Kirin-Amgen, Inc. and Ortho Pharmaceutical Corporation.(Filed as an exhibit to Form 10-Q for the quarter ended June 30, 2000 on August 1, 2000 andincorporated herein by reference.)
10.20 Research, Development Technology Disclosure and License Agreement: PPO, dated January 20,1986, by and between Kirin Brewery Co., Ltd. and Amgen Inc. (Filed as an exhibit to AmendmentNo. 1 to Form S-1 Registration Statement on March 11, 1986 and incorporated herein byreference.)
10.21 Amendment Agreement, dated June 30, 1988, to Research, Development, Technology Disclosureand License Agreement: GM-CSF dated March 31, 1987, between Kirin Brewery Company,Limited and Amgen Inc. (Filed as an exhibit to Form 8 amending the Quarterly Report on Form10-Q for the quarter ended June 30, 1988 on August 25, 1988 and incorporated herein byreference.)
10.22 Assignment and License Agreement, dated October 16, 1986 (effective July 1, 1986, betweenAmgen and Kirin-Amgen, Inc. (Filed as an exhibit to Form 10-K for the year ended December 31,2000 on March 7, 2001 and incorporated herein by reference.)
10.23 G-CSF United States License Agreement, dated June 1, 1987 (effective July 1, 1986), AmendmentNo. 1, dated October 20, 1988, and Amendment No. 2, dated October 17, 1991 (effectiveNovember 13, 1990), between Kirin-Amgen, Inc. and Amgen Inc. (Filed as exhibits to Form 10-Kfor the year ended December 31, 2000 on March 7, 2001 and incorporated herein by reference.)
99
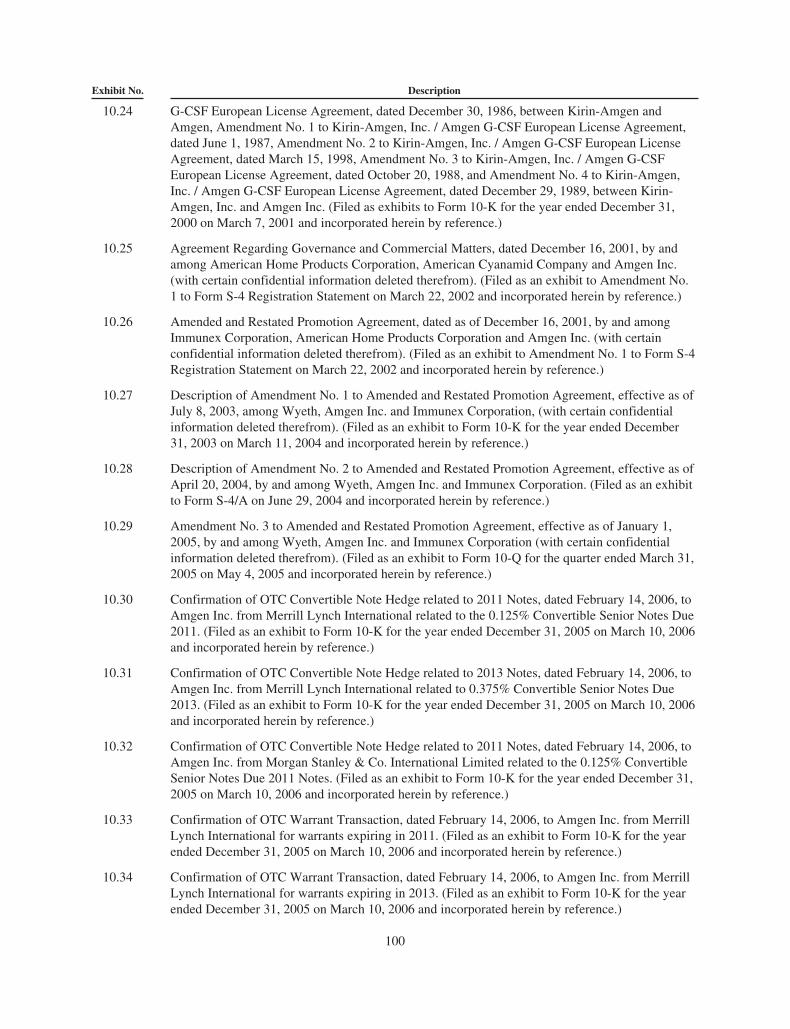
Exhibit No. Description
10.24 G-CSF European License Agreement, dated December 30, 1986, between Kirin-Amgen andAmgen, Amendment No. 1 to Kirin-Amgen, Inc. / Amgen G-CSF European License Agreement,dated June 1, 1987, Amendment No. 2 to Kirin-Amgen, Inc. / Amgen G-CSF European LicenseAgreement, dated March 15, 1998, Amendment No. 3 to Kirin-Amgen, Inc. / Amgen G-CSFEuropean License Agreement, dated October 20, 1988, and Amendment No. 4 to Kirin-Amgen,Inc. / Amgen G-CSF European License Agreement, dated December 29, 1989, between Kirin-Amgen, Inc. and Amgen Inc. (Filed as exhibits to Form 10-K for the year ended December 31,2000 on March 7, 2001 and incorporated herein by reference.)
10.25 Agreement Regarding Governance and Commercial Matters, dated December 16, 2001, by andamong American Home Products Corporation, American Cyanamid Company and Amgen Inc.(with certain confidential information deleted therefrom). (Filed as an exhibit to Amendment No.1 to Form S-4 Registration Statement on March 22, 2002 and incorporated herein by reference.)
10.26 Amended and Restated Promotion Agreement, dated as of December 16, 2001, by and amongImmunex Corporation, American Home Products Corporation and Amgen Inc. (with certainconfidential information deleted therefrom). (Filed as an exhibit to Amendment No. 1 to Form S-4Registration Statement on March 22, 2002 and incorporated herein by reference.)
10.27 Description of Amendment No. 1 to Amended and Restated Promotion Agreement, effective as ofJuly 8, 2003, among Wyeth, Amgen Inc. and Immunex Corporation, (with certain confidentialinformation deleted therefrom). (Filed as an exhibit to Form 10-K for the year ended December31, 2003 on March 11, 2004 and incorporated herein by reference.)
10.28 Description of Amendment No. 2 to Amended and Restated Promotion Agreement, effective as ofApril 20, 2004, by and among Wyeth, Amgen Inc. and Immunex Corporation. (Filed as an exhibitto Form S-4/A on June 29, 2004 and incorporated herein by reference.)
10.29 Amendment No. 3 to Amended and Restated Promotion Agreement, effective as of January 1,2005, by and among Wyeth, Amgen Inc. and Immunex Corporation (with certain confidentialinformation deleted therefrom). (Filed as an exhibit to Form 10-Q for the quarter ended March 31,2005 on May 4, 2005 and incorporated herein by reference.)
10.30 Confirmation of OTC Convertible Note Hedge related to 2011 Notes, dated February 14, 2006, toAmgen Inc. from Merrill Lynch International related to the 0.125% Convertible Senior Notes Due2011. (Filed as an exhibit to Form 10-K for the year ended December 31, 2005 on March 10, 2006and incorporated herein by reference.)
10.31 Confirmation of OTC Convertible Note Hedge related to 2013 Notes, dated February 14, 2006, toAmgen Inc. from Merrill Lynch International related to 0.375% Convertible Senior Notes Due2013. (Filed as an exhibit to Form 10-K for the year ended December 31, 2005 on March 10, 2006and incorporated herein by reference.)
10.32 Confirmation of OTC Convertible Note Hedge related to 2011 Notes, dated February 14, 2006, toAmgen Inc. from Morgan Stanley & Co. International Limited related to the 0.125% ConvertibleSenior Notes Due 2011 Notes. (Filed as an exhibit to Form 10-K for the year ended December 31,2005 on March 10, 2006 and incorporated herein by reference.)
10.33 Confirmation of OTC Warrant Transaction, dated February 14, 2006, to Amgen Inc. from MerrillLynch International for warrants expiring in 2011. (Filed as an exhibit to Form 10-K for the yearended December 31, 2005 on March 10, 2006 and incorporated herein by reference.)
10.34 Confirmation of OTC Warrant Transaction, dated February 14, 2006, to Amgen Inc. from MerrillLynch International for warrants expiring in 2013. (Filed as an exhibit to Form 10-K for the yearended December 31, 2005 on March 10, 2006 and incorporated herein by reference.)
100
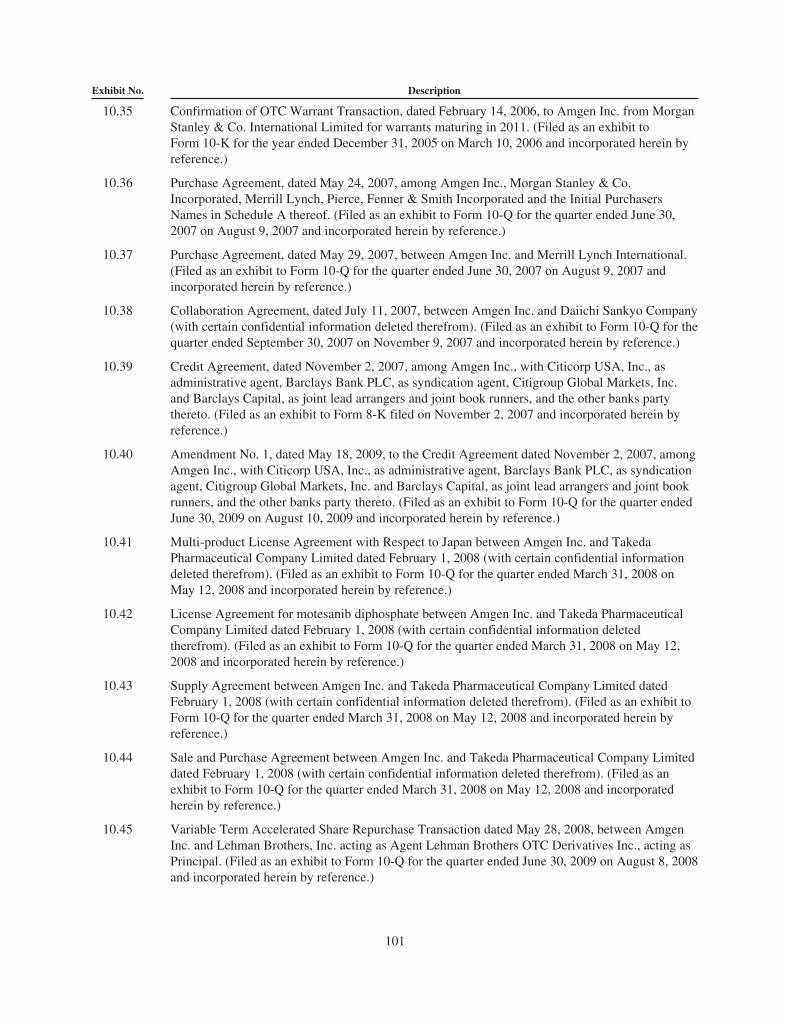
Exhibit No. Description
10.35 Confirmation of OTC Warrant Transaction, dated February 14, 2006, to Amgen Inc. from MorganStanley & Co. International Limited for warrants maturing in 2011. (Filed as an exhibit toForm 10-K for the year ended December 31, 2005 on March 10, 2006 and incorporated herein byreference.)
10.36 Purchase Agreement, dated May 24, 2007, among Amgen Inc., Morgan Stanley & Co.Incorporated, Merrill Lynch, Pierce, Fenner & Smith Incorporated and the Initial PurchasersNames in Schedule A thereof. (Filed as an exhibit to Form 10-Q for the quarter ended June 30,2007 on August 9, 2007 and incorporated herein by reference.)
10.37 Purchase Agreement, dated May 29, 2007, between Amgen Inc. and Merrill Lynch International.(Filed as an exhibit to Form 10-Q for the quarter ended June 30, 2007 on August 9, 2007 andincorporated herein by reference.)
10.38 Collaboration Agreement, dated July 11, 2007, between Amgen Inc. and Daiichi Sankyo Company(with certain confidential information deleted therefrom). (Filed as an exhibit to Form 10-Q for thequarter ended September 30, 2007 on November 9, 2007 and incorporated herein by reference.)
10.39 Credit Agreement, dated November 2, 2007, among Amgen Inc., with Citicorp USA, Inc., asadministrative agent, Barclays Bank PLC, as syndication agent, Citigroup Global Markets, Inc.and Barclays Capital, as joint lead arrangers and joint book runners, and the other banks partythereto. (Filed as an exhibit to Form 8-K filed on November 2, 2007 and incorporated herein byreference.)
10.40 Amendment No. 1, dated May 18, 2009, to the Credit Agreement dated November 2, 2007, amongAmgen Inc., with Citicorp USA, Inc., as administrative agent, Barclays Bank PLC, as syndicationagent, Citigroup Global Markets, Inc. and Barclays Capital, as joint lead arrangers and joint bookrunners, and the other banks party thereto. (Filed as an exhibit to Form 10-Q for the quarter endedJune 30, 2009 on August 10, 2009 and incorporated herein by reference.)
10.41 Multi-product License Agreement with Respect to Japan between Amgen Inc. and TakedaPharmaceutical Company Limited dated February 1, 2008 (with certain confidential informationdeleted therefrom). (Filed as an exhibit to Form 10-Q for the quarter ended March 31, 2008 onMay 12, 2008 and incorporated herein by reference.)
10.42 License Agreement for motesanib diphosphate between Amgen Inc. and Takeda PharmaceuticalCompany Limited dated February 1, 2008 (with certain confidential information deletedtherefrom). (Filed as an exhibit to Form 10-Q for the quarter ended March 31, 2008 on May 12,2008 and incorporated herein by reference.)
10.43 Supply Agreement between Amgen Inc. and Takeda Pharmaceutical Company Limited datedFebruary 1, 2008 (with certain confidential information deleted therefrom). (Filed as an exhibit toForm 10-Q for the quarter ended March 31, 2008 on May 12, 2008 and incorporated herein byreference.)
10.44 Sale and Purchase Agreement between Amgen Inc. and Takeda Pharmaceutical Company Limiteddated February 1, 2008 (with certain confidential information deleted therefrom). (Filed as anexhibit to Form 10-Q for the quarter ended March 31, 2008 on May 12, 2008 and incorporatedherein by reference.)
10.45 Variable Term Accelerated Share Repurchase Transaction dated May 28, 2008, between AmgenInc. and Lehman Brothers, Inc. acting as Agent Lehman Brothers OTC Derivatives Inc., acting asPrincipal. (Filed as an exhibit to Form 10-Q for the quarter ended June 30, 2009 on August 8, 2008and incorporated herein by reference.)
101
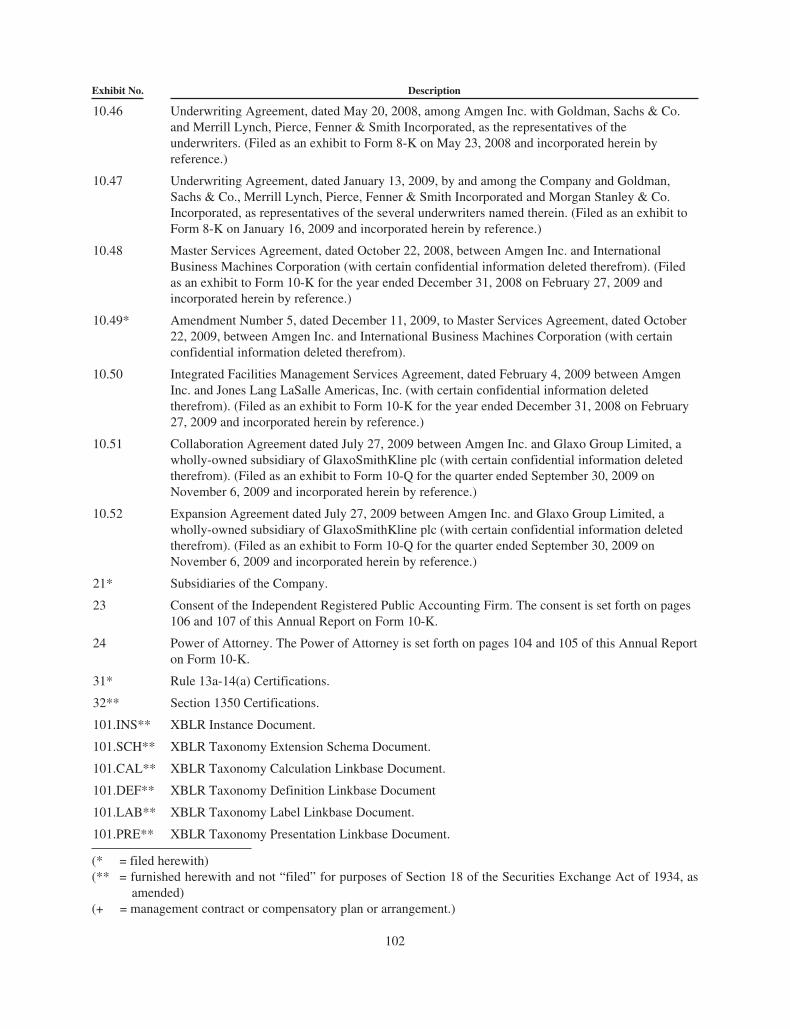
Exhibit No. Description
10.46 Underwriting Agreement, dated May 20, 2008, among Amgen Inc. with Goldman, Sachs & Co.and Merrill Lynch, Pierce, Fenner & Smith Incorporated, as the representatives of theunderwriters. (Filed as an exhibit to Form 8-K on May 23, 2008 and incorporated herein byreference.)
10.47 Underwriting Agreement, dated January 13, 2009, by and among the Company and Goldman,Sachs & Co., Merrill Lynch, Pierce, Fenner & Smith Incorporated and Morgan Stanley & Co.Incorporated, as representatives of the several underwriters named therein. (Filed as an exhibit toForm 8-K on January 16, 2009 and incorporated herein by reference.)
10.48 Master Services Agreement, dated October 22, 2008, between Amgen Inc. and InternationalBusiness Machines Corporation (with certain confidential information deleted therefrom). (Filedas an exhibit to Form 10-K for the year ended December 31, 2008 on February 27, 2009 andincorporated herein by reference.)
10.49* Amendment Number 5, dated December 11, 2009, to Master Services Agreement, dated October22, 2009, between Amgen Inc. and International Business Machines Corporation (with certainconfidential information deleted therefrom).
10.50 Integrated Facilities Management Services Agreement, dated February 4, 2009 between AmgenInc. and Jones Lang LaSalle Americas, Inc. (with certain confidential information deletedtherefrom). (Filed as an exhibit to Form 10-K for the year ended December 31, 2008 on February27, 2009 and incorporated herein by reference.)
10.51 Collaboration Agreement dated July 27, 2009 between Amgen Inc. and Glaxo Group Limited, awholly-owned subsidiary of GlaxoSmithKline plc (with certain confidential information deletedtherefrom). (Filed as an exhibit to Form 10-Q for the quarter ended September 30, 2009 onNovember 6, 2009 and incorporated herein by reference.)
10.52 Expansion Agreement dated July 27, 2009 between Amgen Inc. and Glaxo Group Limited, awholly-owned subsidiary of GlaxoSmithKline plc (with certain confidential information deletedtherefrom). (Filed as an exhibit to Form 10-Q for the quarter ended September 30, 2009 onNovember 6, 2009 and incorporated herein by reference.)
21* Subsidiaries of the Company.
23 Consent of the Independent Registered Public Accounting Firm. The consent is set forth on pages106 and 107 of this Annual Report on Form 10-K.
24 Power of Attorney. The Power of Attorney is set forth on pages 104 and 105 of this Annual Reporton Form 10-K.
31* Rule 13a-14(a) Certifications.
32** Section 1350 Certifications.
101.INS** XBLR Instance Document.
101.SCH** XBLR Taxonomy Extension Schema Document.
101.CAL** XBLR Taxonomy Calculation Linkbase Document.
101.DEF** XBLR Taxonomy Definition Linkbase Document
101.LAB** XBLR Taxonomy Label Linkbase Document.
101.PRE** XBLR Taxonomy Presentation Linkbase Document.
(* = filed herewith)(** = furnished herewith and not “filed” for purposes of Section 18 of the Securities Exchange Act of 1934, as
amended)(+ = management contract or compensatory plan or arrangement.)
102
SIGNATURES
Pursuant to the requirements of the Securities Exchange Act of 1934, the registrant has duly caused this An-nual Report to be signed on its behalf by the undersigned, thereunto duly authorized.
AMGEN INC.(Registrant)
Date: 03/01/2010 By: /S/ ROBERT A. BRADWAY
Robert A. Bradway
Executive Vice President
and Chief Financial Officer
103
EXHIBIT 24
POWER OF ATTORNEY
KNOW ALL MEN AND WOMEN BY THESE PRESENTS, that each person whose signature appears be-low constitutes and appoints Robert A. Bradway and Michael A. Kelly, or either of them, his or herattorney-in-fact, each with the power of substitution, for him or her in any and all capacities, to sign any amend-ments to this Report, and to file the same, with exhibits thereto and other documents in connection therewith,with the Securities and Exchange Commission, hereby ratifying and confirming all that each of saidattorneys-in-fact, or his or her substitute or substitutes, may do or cause to be done by virtue hereof.
Pursuant to the requirements of the Securities Exchange Act of 1934, this report has been signed below bythe following persons on behalf of the registrant and in the capacities and on the dates indicated:
Signature Title Date
/S/ KEVIN W. SHARER
Kevin W. Sharer
Chairman of the Board, ChiefExecutive Officer and President,
and Director (PrincipalExecutive Officer)
03/01/2010
/S/ ROBERT A. BRADWAY
Robert A. Bradway
Executive Vice President andChief Financial Officer
(Principal Financial Officer)
03/01/2010
/S/ MICHAEL A. KELLY
Michael A. Kelly
Vice President Finance andChief Accounting Officer
(Principal Accounting Officer)
03/01/2010
/S/ DAVID BALTIMORE
David Baltimore
Director 03/01/2010
/S/ FRANK J. BIONDI, JR.Frank J. Biondi, Jr.
Director 03/01/2010
/S/ JERRY D. CHOATE
Jerry D. Choate
Director 02/20/2010
/S/ VANCE D. COFFMAN
Vance D. Coffman
Director 03/01/2010
/S/ FRANÇOIS DE CARBONNEL
François de Carbonnel
Director 02/23/2010
/S/ FREDERICK W. GLUCK
Frederick W. Gluck
Director 03/01/2010
/S/ REBECCA M. HENDERSON
Rebecca M. Henderson
Director 03/01/2010
/S/ FRANK C. HERRINGER
Frank C. Herringer
Director 03/01/2010
104
Signature Title Date
/S/ GILBERT S. OMENN
Gilbert S. Omenn
Director 03/01/2010
/S/ JUDITH C. PELHAM
Judith C. Pelham
Director 03/01/2010
/S/ J. PAUL REASON
J. Paul Reason
Director 03/01/2010
/S/ LEONARD D. SCHAEFFER
Leonard D. Schaeffer
Director 02/17/2010
105
EXHIBIT 23
CONSENT OF INDEPENDENT REGISTERED PUBLIC ACCOUNTING FIRM
We consent to the incorporation by reference in this Annual Report (Form 10-K) of Amgen Inc. of our re-port dated March 1, 2010, with respect to the consolidated financial statements of Amgen Inc, included in the2009 Annual Report to Shareholders of Amgen Inc.
Our audits also included the financial statement schedule of Amgen Inc. listed in Item 15(a). This scheduleis the responsibility of Amgen Inc.’s management. Our responsibility is to express an opinion based on our au-dits. In our opinion, as to which the date is March 1, 2010, the financial statement schedule referred to above,when considered in relation to the basic financial statements taken as a whole, present fairly in all material re-spects the information set forth therein.
We consent to the incorporation by reference in the following Registration Statements:
• Registration Statement (Form S-8 No. 159377) pertaining to the Amgen Inc. 2009 Equity Incentive Plan;
• Registration Statement (Form S-8 No. 33-39183) pertaining to the Amended and Restated EmployeeStock Purchase Plan;
• Registration Statements (Form S-8 No. 33-39104, as amended by Form S-8 No. 333-144581) pertainingto the Amended and Restated Amgen Retirement and Savings Plan (formerly known as the AmgenRetirement and Savings Plan);
• Registration Statements (Form S-8 Nos. 33-42072 and 333-144579) pertaining to the Amgen Inc. Amend-ed and Restated 1991 Equity Incentive Plan;
• Registration Statements (Form S-8 Nos. 33-47605 and 333-144580) pertaining to the Retirement and Sav-ings Plan for Amgen Manufacturing, Limited (formerly known as the Retirement and Savings Plan forAmgen Manufacturing, Inc.);
• Registration Statements (Form S-8 Nos. 333-44727, 333-62735, 333-56672 and 333-83824) pertaining tothe Amgen Inc. Amended and Restated 1997 Special Non-Officer Equity Incentive Plan (formerly knownas the Amgen Inc. 1997 Special Non-Officer Equity Incentive Plan);
• Registration Statement (Form S-3 No. 333-19931) pertaining to debt securities of Amgen Inc.;
• Registration Statement (Form S-3 No. 333-40405) pertaining to debt securities of Amgen Inc.;
• Registration Statement (Form S-3 No. 333-53929) pertaining to the Amgen Inc. 1997 SpecialNon-Officer Equity Incentive Plan, the Amgen Inc. Amended and Restated 1991 Equity Incentive Plan,the Amended and Restated 1988 Stock Option Plan of Amgen Inc. and the Amended and Restated 1987Directors’ Stock Option Plan;
• Registration Statement (Form S-8 No. 333-81284) pertaining to the Amgen Nonqualified Deferred Com-pensation Plan;
• Registration Statements (Form S-3 No. 333-56664 and Amendment No. 1 thereto) pertaining to the Am-gen Inc. 1997 Special Non-Officer Equity Incentive Plan, the Amgen Inc. Amended and Restated 1991Equity Incentive Plan;
• Registration Statement (Form S-3 No. 333-88834) pertaining to Amgen Inc.’s Liquid Yield Option™
Notes due 2032;
• Registration Statement (Form S-3 No. 333-92450 and Amendment No. 1 thereto) pertaining to AmgenInc.’s Common Stock;
• Registration Statement (Form S-8 No. 333-92424 and Amendment No. 1 thereto) pertaining to the Am-gen Inc. Amended and Restated 1993 Equity Incentive Plan (formerly known as the ImmunexCorporation 1993 Stock Option Plan), the Amgen Inc. Amended and Restated 1999 Equity Incentive Plan(formerly known as the Immunex Corporation 1999 Stock Option Plan);
106
• Registration Statements (Form S-3 No. 333-107639 and Amendment 1 thereto) relating to debt securities,common stock and associated preferred share repurchase rights, preferred stock, warrants to purchasedebt securities, common stock or preferred stock, securities purchase contracts, securities purchase unitsand depositary shares of Amgen Inc. and in the related Prospectuses;
• Registration Statement (Form S-8 No. 333-118254) pertaining to the Amgen Inc. Amended and Restated1997 Equity Incentive Plan (formerly known as the Tularik Inc. 1997 Equity Incentive Plan, as amended);
• Registration Statement (Form S-3 No. 333-132286) relating to the potential resale of securities acquiredfrom Amgen Inc. by selling security holders in unregistered private offerings;
• Registration Statement (Form S-8 No. 333-132932) pertaining to the Amgen Inc. Amended and Restated1996 Incentive Stock Plan (formerly known as Abgenix, Inc. 1996 Incentive Stock Plan, as amended andrestated), the Amgen Inc. Amended and Restated 1999 Incentive Stock Plan (formerly known as Abgenix,Inc. 1999 Nonstatutory Stock Option Plan, as amended and restated);
• Registration Statement (Form S-8 No. 333-133002) pertaining to the Amgen Inc. Amended and Restated1999 Incentive Stock Plan (formerly known as Abgenix, Inc. 1999 Nonstatutory Stock Option Plan, asamended and restated);
• Registration Statement (Form S-8 No. 333-138325) pertaining to the Amgen Inc. Amended and RestatedAssumed Avidia Equity Incentive Plan (formerly known as the Avidia, Inc. Amended and Restated 2003Equity Incentive Plan);
• Registration Statement (Form S-4 No. 333-147482) relating to the possible exchange of unregistered Se-nior Floating Notes for registered Senior Floating Notes relating to the Prospectus of Amgen Inc. for theregistration of Senior Floating Rate Notes due 2008, 5.85% Senior Notes due 2017, 6.375% Senior NotesDue 2037; and
• Registration Statement (Form S-3 No. 333-150290) relating to debt securities, common stock, preferredstock, warrants to purchase debt securities, common stock, preferred stock or depositary shares, rights topurchase common stock or preferred stock, securities purchase contracts, securities purchase units anddepositary shares of Amgen Inc. and in the related Prospectuses.
of our report dated March 1, 2010, with respect to the consolidated financial statements of Amgen Inc. in-corporated herein by reference and our report included in the preceding paragraph with respect to the financialstatement schedule of Amgen Inc. included in this Annual Report (Form 10-K) of Amgen Inc. for the year endedDecember 31, 2009.
/s/ Ernst & Young LLP
Los Angeles, CaliforniaMarch 1, 2010
107

[THIS PAGE INTENTIONALLY LEFT BLANK]
Report of Independent Registered Public Accounting Firm
The Board of Directors and Stockholders of Amgen Inc.
We have audited the accompanying Consolidated Balance Sheets of Amgen Inc. (the “Company”) as of De-cember 31, 2009 and 2008, and the related Consolidated Statements of Income, Stockholders’ Equity, and CashFlows for each of the three years in the period ended December 31, 2009. Our audits also included the financialstatement schedule listed in the Index at Item 15(a) 2. These financial statements and schedule are the responsi-bility of the Company’s management. Our responsibility is to express an opinion on these financial statementsand schedule based on our audits.
We conducted our audits in accordance with the standards of the Public Company Accounting OversightBoard (United States). Those standards require that we plan and perform the audit to obtain reasonable assuranceabout whether the financial statements are free of material misstatement. An audit includes examining, on a testbasis, evidence supporting the amounts and disclosures in the financial statements. An audit also includes assess-ing the accounting principles used and significant estimates made by management, as well as evaluating theoverall financial statement presentation. We believe that our audits provide a reasonable basis for our opinion.
In our opinion, the financial statements referred to above present fairly, in all material respects, the con-solidated financial position of Amgen Inc. at December 31, 2009 and 2008, and the consolidated results of itsoperations and its cash flows for each of the three years in the period ended December 31, 2009, in conformitywith U.S. generally accepted accounting principles. Also, in our opinion, the related financial statement schedule,when considered in relation to the basic financial statements taken as a whole, presents fairly in all material re-spects the information set forth therein.
We also have audited, in accordance with the standards of the Public Company Accounting Oversight Board(United States), Amgen Inc.’s internal control over financial reporting as of December 31, 2009, based on criteriaestablished in Internal Control — Integrated Framework issued by the Committee of Sponsoring Organizationsof the Treadway Commission and our report dated March 1, 2010 expressed an unqualified opinion thereon.
As discussed in Note 2 to the consolidated financial statements, the Company changed its method of account-ing for convertible debt instruments with the adoption of the guidance originally issued in Financial AccountingStandards Board’s Staff Position No. APB 14-1 (codified in FASB ASC Topic 470, Debt/Capitalization of Inter-est) effective January 1, 2009.
/s/ Ernst & Young LLP
Los Angeles, CaliforniaMarch 1, 2010
F-1
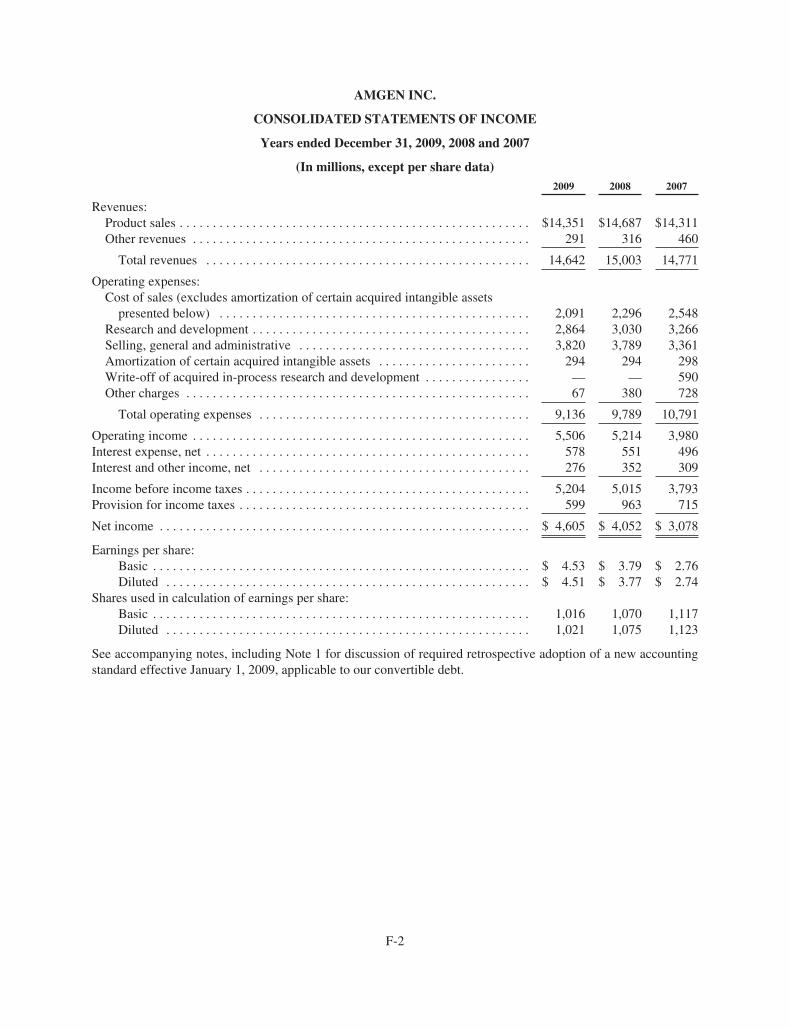
AMGEN INC.
CONSOLIDATED STATEMENTS OF INCOME
Years ended December 31, 2009, 2008 and 2007
(In millions, except per share data)2009 2008 2007
Revenues:Product sales . . . . . . . . . . . . . . . . . . . . . . . . . . . . . . . . . . . . . . . . . . . . . . . . . . . . . $14,351 $14,687 $14,311Other revenues . . . . . . . . . . . . . . . . . . . . . . . . . . . . . . . . . . . . . . . . . . . . . . . . . . . 291 316 460
Total revenues . . . . . . . . . . . . . . . . . . . . . . . . . . . . . . . . . . . . . . . . . . . . . . . . . 14,642 15,003 14,771
Operating expenses:Cost of sales (excludes amortization of certain acquired intangible assets
presented below) . . . . . . . . . . . . . . . . . . . . . . . . . . . . . . . . . . . . . . . . . . . . . . . 2,091 2,296 2,548Research and development . . . . . . . . . . . . . . . . . . . . . . . . . . . . . . . . . . . . . . . . . . 2,864 3,030 3,266Selling, general and administrative . . . . . . . . . . . . . . . . . . . . . . . . . . . . . . . . . . . 3,820 3,789 3,361Amortization of certain acquired intangible assets . . . . . . . . . . . . . . . . . . . . . . . 294 294 298Write-off of acquired in-process research and development . . . . . . . . . . . . . . . . — — 590Other charges . . . . . . . . . . . . . . . . . . . . . . . . . . . . . . . . . . . . . . . . . . . . . . . . . . . . 67 380 728
Total operating expenses . . . . . . . . . . . . . . . . . . . . . . . . . . . . . . . . . . . . . . . . . 9,136 9,789 10,791
Operating income . . . . . . . . . . . . . . . . . . . . . . . . . . . . . . . . . . . . . . . . . . . . . . . . . . . 5,506 5,214 3,980Interest expense, net . . . . . . . . . . . . . . . . . . . . . . . . . . . . . . . . . . . . . . . . . . . . . . . . . 578 551 496Interest and other income, net . . . . . . . . . . . . . . . . . . . . . . . . . . . . . . . . . . . . . . . . . 276 352 309
Income before income taxes . . . . . . . . . . . . . . . . . . . . . . . . . . . . . . . . . . . . . . . . . . . 5,204 5,015 3,793Provision for income taxes . . . . . . . . . . . . . . . . . . . . . . . . . . . . . . . . . . . . . . . . . . . . 599 963 715
Net income . . . . . . . . . . . . . . . . . . . . . . . . . . . . . . . . . . . . . . . . . . . . . . . . . . . . . . . . $ 4,605 $ 4,052 $ 3,078
Earnings per share:Basic . . . . . . . . . . . . . . . . . . . . . . . . . . . . . . . . . . . . . . . . . . . . . . . . . . . . . . . . . $ 4.53 $ 3.79 $ 2.76Diluted . . . . . . . . . . . . . . . . . . . . . . . . . . . . . . . . . . . . . . . . . . . . . . . . . . . . . . . $ 4.51 $ 3.77 $ 2.74
Shares used in calculation of earnings per share:Basic . . . . . . . . . . . . . . . . . . . . . . . . . . . . . . . . . . . . . . . . . . . . . . . . . . . . . . . . . 1,016 1,070 1,117Diluted . . . . . . . . . . . . . . . . . . . . . . . . . . . . . . . . . . . . . . . . . . . . . . . . . . . . . . . 1,021 1,075 1,123
See accompanying notes, including Note 1 for discussion of required retrospective adoption of a new accountingstandard effective January 1, 2009, applicable to our convertible debt.
F-2
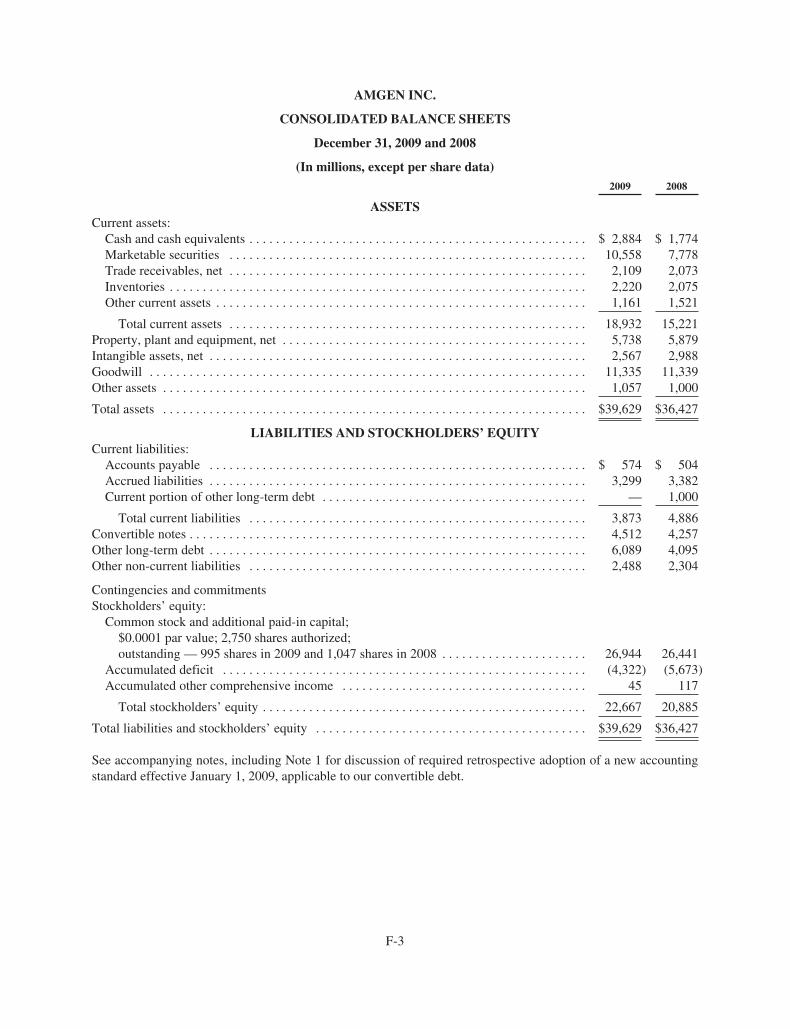
AMGEN INC.
CONSOLIDATED BALANCE SHEETS
December 31, 2009 and 2008
(In millions, except per share data)2009 2008
ASSETSCurrent assets:
Cash and cash equivalents . . . . . . . . . . . . . . . . . . . . . . . . . . . . . . . . . . . . . . . . . . . . . . . . . . . $ 2,884 $ 1,774Marketable securities . . . . . . . . . . . . . . . . . . . . . . . . . . . . . . . . . . . . . . . . . . . . . . . . . . . . . . 10,558 7,778Trade receivables, net . . . . . . . . . . . . . . . . . . . . . . . . . . . . . . . . . . . . . . . . . . . . . . . . . . . . . . 2,109 2,073Inventories . . . . . . . . . . . . . . . . . . . . . . . . . . . . . . . . . . . . . . . . . . . . . . . . . . . . . . . . . . . . . . . 2,220 2,075Other current assets . . . . . . . . . . . . . . . . . . . . . . . . . . . . . . . . . . . . . . . . . . . . . . . . . . . . . . . . 1,161 1,521
Total current assets . . . . . . . . . . . . . . . . . . . . . . . . . . . . . . . . . . . . . . . . . . . . . . . . . . . . . . 18,932 15,221Property, plant and equipment, net . . . . . . . . . . . . . . . . . . . . . . . . . . . . . . . . . . . . . . . . . . . . . . 5,738 5,879Intangible assets, net . . . . . . . . . . . . . . . . . . . . . . . . . . . . . . . . . . . . . . . . . . . . . . . . . . . . . . . . . 2,567 2,988Goodwill . . . . . . . . . . . . . . . . . . . . . . . . . . . . . . . . . . . . . . . . . . . . . . . . . . . . . . . . . . . . . . . . . . 11,335 11,339Other assets . . . . . . . . . . . . . . . . . . . . . . . . . . . . . . . . . . . . . . . . . . . . . . . . . . . . . . . . . . . . . . . . 1,057 1,000
Total assets . . . . . . . . . . . . . . . . . . . . . . . . . . . . . . . . . . . . . . . . . . . . . . . . . . . . . . . . . . . . . . . . $39,629 $36,427
LIABILITIES AND STOCKHOLDERS’ EQUITYCurrent liabilities:
Accounts payable . . . . . . . . . . . . . . . . . . . . . . . . . . . . . . . . . . . . . . . . . . . . . . . . . . . . . . . . . $ 574 $ 504Accrued liabilities . . . . . . . . . . . . . . . . . . . . . . . . . . . . . . . . . . . . . . . . . . . . . . . . . . . . . . . . . 3,299 3,382Current portion of other long-term debt . . . . . . . . . . . . . . . . . . . . . . . . . . . . . . . . . . . . . . . . — 1,000
Total current liabilities . . . . . . . . . . . . . . . . . . . . . . . . . . . . . . . . . . . . . . . . . . . . . . . . . . . 3,873 4,886Convertible notes . . . . . . . . . . . . . . . . . . . . . . . . . . . . . . . . . . . . . . . . . . . . . . . . . . . . . . . . . . . . 4,512 4,257Other long-term debt . . . . . . . . . . . . . . . . . . . . . . . . . . . . . . . . . . . . . . . . . . . . . . . . . . . . . . . . . 6,089 4,095Other non-current liabilities . . . . . . . . . . . . . . . . . . . . . . . . . . . . . . . . . . . . . . . . . . . . . . . . . . . 2,488 2,304
Contingencies and commitmentsStockholders’ equity:
Common stock and additional paid-in capital;$0.0001 par value; 2,750 shares authorized;outstanding — 995 shares in 2009 and 1,047 shares in 2008 . . . . . . . . . . . . . . . . . . . . . . 26,944 26,441
Accumulated deficit . . . . . . . . . . . . . . . . . . . . . . . . . . . . . . . . . . . . . . . . . . . . . . . . . . . . . . . (4,322) (5,673)Accumulated other comprehensive income . . . . . . . . . . . . . . . . . . . . . . . . . . . . . . . . . . . . . 45 117
Total stockholders’ equity . . . . . . . . . . . . . . . . . . . . . . . . . . . . . . . . . . . . . . . . . . . . . . . . . 22,667 20,885
Total liabilities and stockholders’ equity . . . . . . . . . . . . . . . . . . . . . . . . . . . . . . . . . . . . . . . . . $39,629 $36,427
See accompanying notes, including Note 1 for discussion of required retrospective adoption of a new accountingstandard effective January 1, 2009, applicable to our convertible debt.
F-3
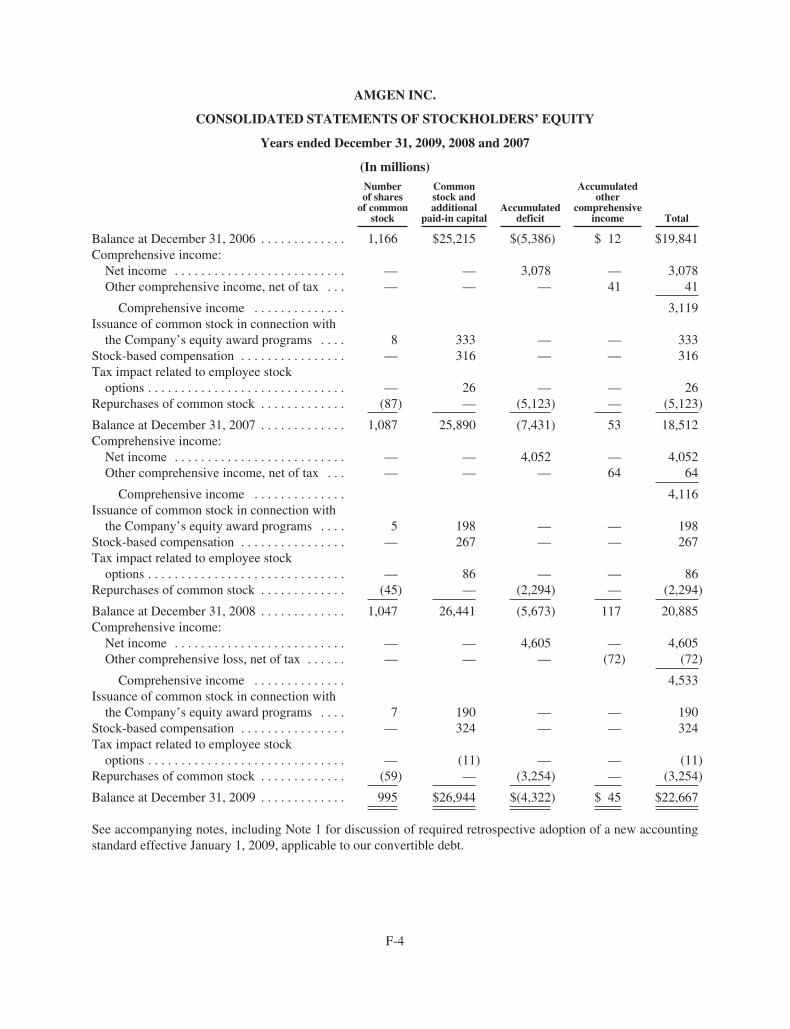
AMGEN INC.
CONSOLIDATED STATEMENTS OF STOCKHOLDERS’ EQUITY
Years ended December 31, 2009, 2008 and 2007
(In millions)Numberof shares
of commonstock
Commonstock andadditional
paid-in capitalAccumulated
deficit
Accumulatedother
comprehensiveincome Total
Balance at December 31, 2006 . . . . . . . . . . . . . 1,166 $25,215 $(5,386) $ 12 $19,841Comprehensive income:
Net income . . . . . . . . . . . . . . . . . . . . . . . . . . — — 3,078 — 3,078Other comprehensive income, net of tax . . . — — — 41 41
Comprehensive income . . . . . . . . . . . . . . 3,119Issuance of common stock in connection with
the Company’s equity award programs . . . . 8 333 — — 333Stock-based compensation . . . . . . . . . . . . . . . . — 316 — — 316Tax impact related to employee stock
options . . . . . . . . . . . . . . . . . . . . . . . . . . . . . . — 26 — — 26Repurchases of common stock . . . . . . . . . . . . . (87) — (5,123) — (5,123)
Balance at December 31, 2007 . . . . . . . . . . . . . 1,087 25,890 (7,431) 53 18,512Comprehensive income:
Net income . . . . . . . . . . . . . . . . . . . . . . . . . . — — 4,052 — 4,052Other comprehensive income, net of tax . . . — — — 64 64
Comprehensive income . . . . . . . . . . . . . . 4,116Issuance of common stock in connection with
the Company’s equity award programs . . . . 5 198 — — 198Stock-based compensation . . . . . . . . . . . . . . . . — 267 — — 267Tax impact related to employee stock
options . . . . . . . . . . . . . . . . . . . . . . . . . . . . . . — 86 — — 86Repurchases of common stock . . . . . . . . . . . . . (45) — (2,294) — (2,294)
Balance at December 31, 2008 . . . . . . . . . . . . . 1,047 26,441 (5,673) 117 20,885Comprehensive income:
Net income . . . . . . . . . . . . . . . . . . . . . . . . . . — — 4,605 — 4,605Other comprehensive loss, net of tax . . . . . . — — — (72) (72)
Comprehensive income . . . . . . . . . . . . . . 4,533Issuance of common stock in connection with
the Company’s equity award programs . . . . 7 190 — — 190Stock-based compensation . . . . . . . . . . . . . . . . — 324 — — 324Tax impact related to employee stock
options . . . . . . . . . . . . . . . . . . . . . . . . . . . . . . — (11) — — (11)Repurchases of common stock . . . . . . . . . . . . . (59) — (3,254) — (3,254)
Balance at December 31, 2009 . . . . . . . . . . . . . 995 $26,944 $(4,322) $ 45 $22,667
See accompanying notes, including Note 1 for discussion of required retrospective adoption of a new accountingstandard effective January 1, 2009, applicable to our convertible debt.
F-4
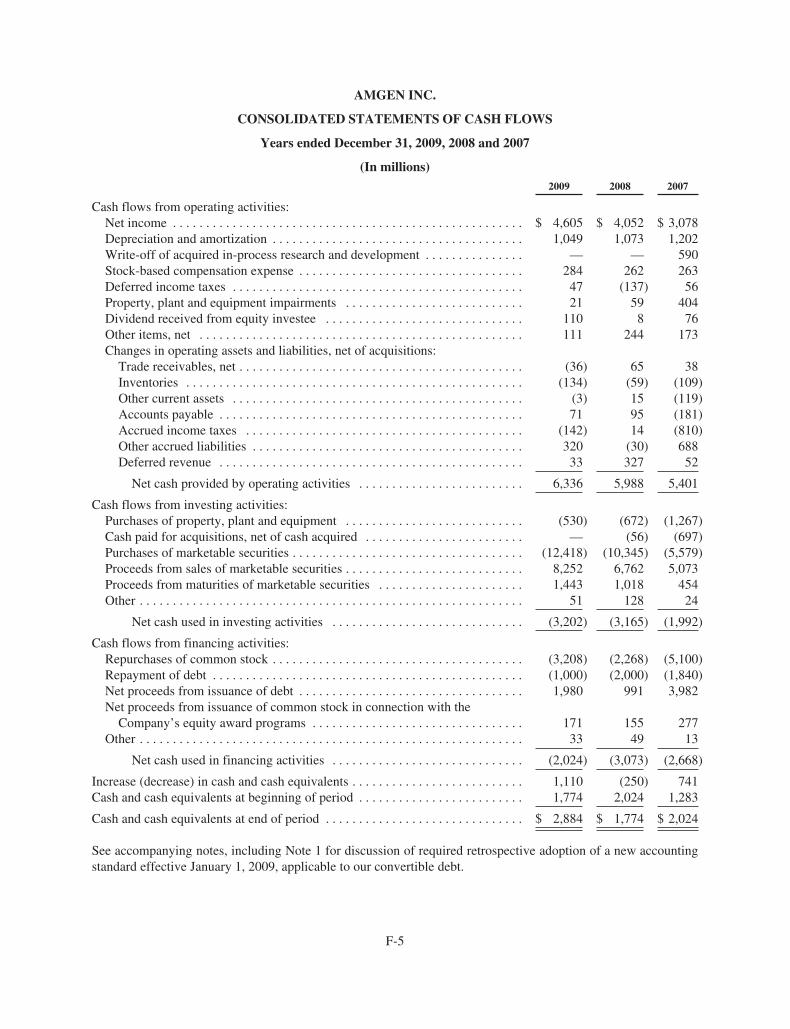
AMGEN INC.
CONSOLIDATED STATEMENTS OF CASH FLOWS
Years ended December 31, 2009, 2008 and 2007
(In millions)2009 2008 2007
Cash flows from operating activities:Net income . . . . . . . . . . . . . . . . . . . . . . . . . . . . . . . . . . . . . . . . . . . . . . . . . . . . . $ 4,605 $ 4,052 $ 3,078Depreciation and amortization . . . . . . . . . . . . . . . . . . . . . . . . . . . . . . . . . . . . . . 1,049 1,073 1,202Write-off of acquired in-process research and development . . . . . . . . . . . . . . . — — 590Stock-based compensation expense . . . . . . . . . . . . . . . . . . . . . . . . . . . . . . . . . . 284 262 263Deferred income taxes . . . . . . . . . . . . . . . . . . . . . . . . . . . . . . . . . . . . . . . . . . . . 47 (137) 56Property, plant and equipment impairments . . . . . . . . . . . . . . . . . . . . . . . . . . . 21 59 404Dividend received from equity investee . . . . . . . . . . . . . . . . . . . . . . . . . . . . . . 110 8 76Other items, net . . . . . . . . . . . . . . . . . . . . . . . . . . . . . . . . . . . . . . . . . . . . . . . . . 111 244 173Changes in operating assets and liabilities, net of acquisitions:
Trade receivables, net . . . . . . . . . . . . . . . . . . . . . . . . . . . . . . . . . . . . . . . . . . . (36) 65 38Inventories . . . . . . . . . . . . . . . . . . . . . . . . . . . . . . . . . . . . . . . . . . . . . . . . . . . (134) (59) (109)Other current assets . . . . . . . . . . . . . . . . . . . . . . . . . . . . . . . . . . . . . . . . . . . . (3) 15 (119)Accounts payable . . . . . . . . . . . . . . . . . . . . . . . . . . . . . . . . . . . . . . . . . . . . . . 71 95 (181)Accrued income taxes . . . . . . . . . . . . . . . . . . . . . . . . . . . . . . . . . . . . . . . . . . (142) 14 (810)Other accrued liabilities . . . . . . . . . . . . . . . . . . . . . . . . . . . . . . . . . . . . . . . . . 320 (30) 688Deferred revenue . . . . . . . . . . . . . . . . . . . . . . . . . . . . . . . . . . . . . . . . . . . . . . 33 327 52
Net cash provided by operating activities . . . . . . . . . . . . . . . . . . . . . . . . . 6,336 5,988 5,401
Cash flows from investing activities:Purchases of property, plant and equipment . . . . . . . . . . . . . . . . . . . . . . . . . . . (530) (672) (1,267)Cash paid for acquisitions, net of cash acquired . . . . . . . . . . . . . . . . . . . . . . . . — (56) (697)Purchases of marketable securities . . . . . . . . . . . . . . . . . . . . . . . . . . . . . . . . . . . (12,418) (10,345) (5,579)Proceeds from sales of marketable securities . . . . . . . . . . . . . . . . . . . . . . . . . . . 8,252 6,762 5,073Proceeds from maturities of marketable securities . . . . . . . . . . . . . . . . . . . . . . 1,443 1,018 454Other . . . . . . . . . . . . . . . . . . . . . . . . . . . . . . . . . . . . . . . . . . . . . . . . . . . . . . . . . . 51 128 24
Net cash used in investing activities . . . . . . . . . . . . . . . . . . . . . . . . . . . . . (3,202) (3,165) (1,992)
Cash flows from financing activities:Repurchases of common stock . . . . . . . . . . . . . . . . . . . . . . . . . . . . . . . . . . . . . . (3,208) (2,268) (5,100)Repayment of debt . . . . . . . . . . . . . . . . . . . . . . . . . . . . . . . . . . . . . . . . . . . . . . . (1,000) (2,000) (1,840)Net proceeds from issuance of debt . . . . . . . . . . . . . . . . . . . . . . . . . . . . . . . . . . 1,980 991 3,982Net proceeds from issuance of common stock in connection with the
Company’s equity award programs . . . . . . . . . . . . . . . . . . . . . . . . . . . . . . . . 171 155 277Other . . . . . . . . . . . . . . . . . . . . . . . . . . . . . . . . . . . . . . . . . . . . . . . . . . . . . . . . . . 33 49 13
Net cash used in financing activities . . . . . . . . . . . . . . . . . . . . . . . . . . . . . (2,024) (3,073) (2,668)
Increase (decrease) in cash and cash equivalents . . . . . . . . . . . . . . . . . . . . . . . . . . 1,110 (250) 741Cash and cash equivalents at beginning of period . . . . . . . . . . . . . . . . . . . . . . . . . 1,774 2,024 1,283
Cash and cash equivalents at end of period . . . . . . . . . . . . . . . . . . . . . . . . . . . . . . $ 2,884 $ 1,774 $ 2,024
See accompanying notes, including Note 1 for discussion of required retrospective adoption of a new accountingstandard effective January 1, 2009, applicable to our convertible debt.
F-5
AMGEN INC.
NOTES TO CONSOLIDATED FINANCIAL STATEMENTS
December 31, 2009
1. Summary of significant accounting policies
Business
Amgen Inc. (including its subsidiaries, referred to as “Amgen,” “the Company,” “we,” “our” and “us”) is aglobal biotechnology medicines company that discovers, develops, manufactures and markets medicines forgrievous illnesses. We concentrate on innovating novel medicines based on advances in cellular and molecularbiology and we operate in one business segment, human therapeutics.
Principles of consolidation
The consolidated financial statements include the accounts of Amgen as well as its wholly owned sub-sidiaries. We do not have any significant interests in any variable interest entities. All material intercompanytransactions and balances have been eliminated in consolidation.
Use of estimates
The preparation of financial statements in conformity with accounting principles generally accepted in the Unit-ed States (“GAAP”) requires management to make estimates and assumptions that affect the amounts reported inthe consolidated financial statements and accompanying notes. Actual results may differ from those estimates.
Financial Accounting Standards Board Accounting Standards Codification
Effective July 1, 2009, the Financial Accounting Standards Board (“FASB”) Accounting Standards Codifica-tion (“ASC” or “Codification”) became the authoritative source of GAAP. All existing FASB accountingstandards and guidance were superseded by the ASC. Instead of issuing new accounting standards in the form ofstatements, staff positions and Emerging Issues Task Force abstracts, the FASB now issues Accounting Stan-dards Updates that update the Codification. Rules and interpretive releases of the Securities and ExchangeCommission (“SEC”) under authority of federal securities laws continue to be additional sources of authoritativeGAAP for SEC registrants.
Change in method of accounting for convertible debt instruments
Effective January 1, 2009, we adopted a new accounting standard that changed the method of accounting forconvertible debt that may be partially or wholly settled in cash. As required by this new standard, we retrospectivelyapplied this change in accounting to all prior periods for which we had applicable outstanding convertible debt. Un-der this method of accounting, the debt and equity components of our convertible notes are bifurcated and accountedfor separately. The equity components of our convertible notes, including our 2011 Convertible Notes, 2013 Con-vertible Notes and 2032 Modified Convertible Notes, are included in “Common stock and additional paid-in capital”in the Consolidated Balance Sheets, with a corresponding reduction in the carrying values of these convertible notesas of the date of issuance or modification, as applicable. The reduced carrying values of our convertible notes are be-ing accreted back to their principal amounts through the recognition of non-cash interest expense. This results inrecognizing interest expense on these borrowings at effective rates approximating what we would have incurred hadwe issued nonconvertible debt with otherwise similar terms. See Note 2, “Change in method of accounting for con-vertible debt instruments” and Note 16, “Financing arrangements.”
Product sales
Product sales primarily consist of sales of Aranesp® (darbepoetin alfa), EPOGEN® (Epoetin alfa), Neu-lasta® (pegfilgrastim), NEUPOGEN® (Filgrastim) and Enbrel® (etanercept). Sales of our products are recognizedwhen shipped and title and risk of loss have passed. Product sales are recorded net of accruals for estimated re-bates, wholesaler chargebacks, discounts and other deductions (collectively “sales deductions”) and returns.
F-6
AMGEN INC.
NOTES TO CONSOLIDATED FINANCIAL STATEMENTS (Continued)
Taxes collected from customers and remitted to government authorities related to the sales of the Company’sproducts, primarily in Europe, are excluded from revenues.
We have the exclusive right to sell Epoetin alfa for dialysis, certain diagnostics and all non-human,non-research uses in the United States. We sell Epoetin alfa under the brand name EPOGEN®. We granted to Or-tho Pharmaceutical Corporation (which has assigned its rights under the product license agreement to CentocorOrtho Biotech Products, L.P. (“Centocor Ortho Biotech Products”)), a subsidiary of Johnson & Johnson (“J&J”), alicense relating to Epoetin alfa for sales in the United States for all human uses except dialysis and diagnostics.This license agreement, which is perpetual, may be terminated for various reasons, including upon mutual agree-ment of the parties, or default. The parties are required to compensate each other for Epoetin alfa sales that eitherparty makes into the other party’s exclusive market, sometimes referred to as “spillover.” Accordingly, we do notrecognize product sales we make into the exclusive market of J&J and do recognize the product sales made by J&Jinto our exclusive market. Sales in our exclusive market are derived from our sales to our customers, as adjustedfor spillover. We are employing an arbitrated audit methodology to measure each party’s spillover based on esti-mates of and subsequent adjustments thereto of third-party data on shipments to end users and their usage.
Other revenues
Other revenues primarily consist of royalty income and corporate partner revenues. Royalties from licenseesare based on third-party sales of licensed products and are recorded in accordance with contract terms whenthird-party results are reliably measurable and collectibility is reasonably assured. Royalty estimates are made inadvance of amounts collected using historical and forecasted trends. Pursuant to the license agreement with J&J,noted above, we earn a 10% royalty on net sales, as defined, of Epoetin alfa by J&J in the United States. For theyears ended December 31, 2009, 2008 and 2007, we recognized royalty income from J&J of $128 million, $126million and $182 million, respectively. Corporate partner revenues are primarily comprised of amounts earnedfrom Kirin-Amgen, Inc. (“KA”) for certain research and development (“R&D”) activities and are generallyearned as the R&D activities are performed and the amounts become due. See Note 8, “Related partytransactions.” In addition, corporate partner revenues include license fees and milestone payments associatedwith collaborations with third parties. Revenue from non-refundable, upfront license fees where we have continu-ing involvement is recognized ratably over the estimated period of ongoing involvement. Revenue associatedwith at risk performance milestones is recognized based upon the achievement of the milestone, as defined in therespective agreements. Our collaboration agreements with third parties are performed on a “best efforts” basiswith no guarantee of either technological or commercial success.
Research and development costs
R&D costs are expensed as incurred and primarily include salaries, benefits and other staff-related costs; fa-cilities and overhead costs; clinical trial and related clinical manufacturing costs; contract services and otheroutside costs; information systems’ costs and amortization of acquired technology used in R&D with alternativefuture uses. R&D expenses include costs incurred under R&D arrangements with our corporate partners, such asactivities performed on behalf of KA, and costs and cost recoveries associated with collaborative R&D andin-licensing arrangements, including upfront fees and milestones paid to collaboration partners in connectionwith technologies which have not reached technological feasibility and did not have an alternative future use. Netpayment or reimbursement of R&D costs for collaborations is recognized when the obligations are incurred or aswe become entitled to the cost recovery. See Note 7, “Collaborative arrangements.”
Selling, general and administrative costs
Selling, general and administrative (“SG&A”) expenses are primarily comprised of salaries, benefits and oth-er staff-related costs associated with sales and marketing, finance, legal and other administrative personnel;facilities and overhead costs; outside marketing, advertising and legal expenses and other general and admin-istrative costs.
F-7
AMGEN INC.
NOTES TO CONSOLIDATED FINANCIAL STATEMENTS (Continued)
SG&A expenses also include costs and cost recoveries associated with certain collaborative arrangementsincluding the co-promotion agreement with Pfizer Inc. (“Pfizer”) (formerly Wyeth). Net payment or reimburse-ment of SG&A costs for collaborations is recognized when the obligations are incurred or as we become entitledto the cost recovery. See Note 7, “Collaborative arrangements.”
Advertising costs are expensed as incurred. For the years ended December 31, 2009, 2008 and 2007, adver-tising costs were $95 million, $81 million and $93 million, respectively.
Acquired in-process research and development
For business combinations that occurred prior to January 1, 2009, under the then existing accounting rulesthe estimated fair value of acquired in-process R&D (“IPR&D”) projects, which had not reached technologicalfeasibility at the date of acquisition and which did not have an alternative future use, were immediately expensed.In 2007, we wrote-off $270 million and $320 million of acquired IPR&D related to the Ilypsa, Inc. (“Ilypsa”) andAlantos Pharmaceuticals Holding, Inc. (“Alantos”) acquisitions, respectively. Acquired IPR&D for acquisitionsprior to January 1, 2009 is considered part of total R&D expense. See Note 3, “Acquisitions.”
For business combinations that occur on or after January 1, 2009, under current GAAP the estimated fair val-ues of acquired IPR&D projects which have not reached technological feasibility at the date of acquisition arecapitalized and subsequently tested for impairment through completion of the development process, at whichpoint the capitalized amounts are amortized over their estimated useful life. If a project is abandoned rather thancompleted, all capitalized amounts are written-off immediately.
Share based payments
We have employee compensation plans under which various types of stock-based instruments are granted.All share-based payments to employees, including grants of employee stock options, are recognized in the Con-solidated Statements of Income as compensation expense (based on their estimated fair values) generally over thevesting period of the awards. See Note 4, “Employee stock-based payments.”
Income taxes
We provide for income taxes based on pretax income, applicable tax rates and tax planning opportunitiesavailable in the various jurisdictions in which we operate.
We recognize the tax benefit from an uncertain tax position only if it is more likely than not that the tax posi-tion will be sustained on examination by the taxing authorities based on the technical merits of the position. Thetax benefits recognized in the financial statements on a particular tax position are measured based on the largestbenefit that has a greater than a 50% likelihood of being realized upon settlement. The amount of unrecognizedtax benefits (“UTBs”) is adjusted as appropriate for changes in facts and circumstances, such as significantamendments to existing tax law, new regulations or interpretations by the taxing authorities, new information ob-tained during a tax examination, or resolution of an examination. We recognize both accrued interest andpenalties, where appropriate, related to UTBs in income tax expense. See Note 5, “Income taxes.”
Collaborative arrangements
Effective January 1, 2009, we adopted a new accounting standard that provides financial statement pre-sentation and disclosure guidance for collaborative arrangements, as defined, which include certain arrangementswe have entered into regarding the R&D, manufacture and/or commercialization of products and product candi-dates.
Under this standard, a collaborative arrangement is defined as a contractual arrangement that involves ajoint operating activity. These arrangements involve two or more parties who are both (i) active participants inthe activity and (ii) exposed to significant risks and rewards dependent on the commercial success of the activity.
F-8
AMGEN INC.
NOTES TO CONSOLIDATED FINANCIAL STATEMENTS (Continued)
We evaluate whether an arrangement is a collaborative arrangement at its inception based on the facts andcircumstances specific to the arrangement. We re-evaluate whether an arrangement qualifies or continues to qual-ify as a collaborative arrangement whenever there is a change in either the roles of the participants or theparticipants’ exposure to significant risks and rewards dependent on the ultimate commercial success of the en-deavor. For collaborative arrangements where it is determined that we are the principal participant, in accordancewith existing accounting rules, revenue generated and costs incurred with third parties are recorded on a grossbasis in our financial statements.
The adoption of this standard did not have a material impact on our consolidated results of operations, finan-cial position or cash flows. See Note 7, “Collaborative arrangements.”
Fair value measurement
We adopted a new accounting standard that defines fair value and establishes a framework for fair valuemeasurements effective January 1, 2008 for financial assets and liabilities and effective January 1, 2009 fornon-financial assets and liabilities that are not remeasured on a recurring basis. Under this standard, fair value isgenerally defined as the price that would be received to sell an asset or paid to transfer a liability (i.e., the “exitprice”) in an orderly transaction between market participants at the measurement date. The adoption of this ac-counting standard did not have a material impact on our consolidated results of operations, financial position orcash flows.
Effective April 1, 2009, we adopted a new accounting standard that modifies the guidance used in determin-ing whether the impairment of a debt security is other-than-temporary. Under this accounting standard, theimpairment of a debt security is considered other-than-temporary if an entity concludes that it intends to sell theimpaired security, that it is more likely than not it will be required to sell the security before the recovery of itscost basis or that it does not otherwise expect to recover the cost basis of the security. This accounting standardalso amends the presentation requirements of other-than-temporarily impaired debt securities and expands dis-closure requirements in the financial statements for investments in both debt and equity securities. The adoptionof this accounting standard did not have a material impact on our consolidated results of operations, financial po-sition or cash flows.
Effective April 1, 2009, we adopted a new accounting standard that provides additional guidance in estimat-ing fair value when the market volume and level of activity for an asset or liability have significantly decreasedand in identifying circumstances that indicate a transaction may not be orderly. The adoption of this accountingstandard did not have a material impact on our consolidated results of operations, financial position or cashflows.
Effective October 1, 2009, we adopted a new accounting standard which clarifies guidance for determiningthe fair value of a liability when a quoted price in an active market for an identical liability is not available. Thisstandard provides for the use of one or more valuation techniques, including quoted prices of identical or similarliabilities when traded as assets, quoted prices of similar liabilities and other techniques consistent with the fairvalue measurement framework, such as the amount an entity would pay to transfer the identical liability or wouldreceive to enter into the identical liability. The adoption of this standard did not have a material impact on ourconsolidated results of operations, financial position or cash flows.
See Note 18, “Fair value measurement.”
Cash equivalents
We consider cash equivalents to be only those investments which are highly liquid, readily convertible tocash and which mature within three months from date of purchase.
F-9
AMGEN INC.
NOTES TO CONSOLIDATED FINANCIAL STATEMENTS (Continued)
Available-for-sale securities
We consider our marketable security investment portfolio and marketable equity investmentsavailable-for-sale and, accordingly, these investments are recorded at fair value with unrealized gains and lossesgenerally recorded in other comprehensive income. See Note 11, “Available-for-sale securities.”
Inventories
Inventories are stated at the lower of cost or market. Cost, which includes amounts related to materials, la-bor and overhead, is determined in a manner which approximates the first-in, first-out (“FIFO”) method. TheCompany capitalizes inventories produced in preparation for product launches when the related product candi-dates are considered to have a high probability of regulatory approval and the related costs are expected to berecoverable through the commercialization of the product. See Note 12, “Inventories.”
Property, plant and equipment, net
Property, plant and equipment is recorded at cost, net of accumulated depreciation and amortization. We re-view our property, plant and equipment assets for impairment whenever events or changes in circumstancesindicate that the carrying amount of an asset may not be recoverable.
Depreciation of buildings, equipment, furniture and fixtures is provided over their estimated useful lives ona straight-line basis. Leasehold improvements are amortized on a straight-line basis over the shorter of theirestimated useful lives or lease terms. Useful lives by asset category are as follows:
Asset Category Years
Buildings and improvements . . . . . . . . . . . . . . . . . . . . . . . . . . . . . . . . . . . . . . . . . . . . . . . . . . . . . . . . . . . . . 10-40Manufacturing equipment . . . . . . . . . . . . . . . . . . . . . . . . . . . . . . . . . . . . . . . . . . . . . . . . . . . . . . . . . . . . . . . 5-12Laboratory equipment . . . . . . . . . . . . . . . . . . . . . . . . . . . . . . . . . . . . . . . . . . . . . . . . . . . . . . . . . . . . . . . . . . 8-12Furniture, fixtures and other assets . . . . . . . . . . . . . . . . . . . . . . . . . . . . . . . . . . . . . . . . . . . . . . . . . . . . . . . . 3-15
See Note 13, “Property, plant and equipment.”
Intangible assets and goodwill
Intangible assets other than goodwill are recorded at cost, net of accumulated amortization. Amortization ofintangible assets is provided over their estimated useful lives on a straight-line basis. We review our intangibleassets for impairment whenever events or changes in circumstances indicate that the carrying amount of an assetmay not be recoverable. See Note 14, “Intangible assets.”
Goodwill principally relates to our 2002 acquisition of Immunex Corporation (“Immunex”). We perform animpairment test annually and whenever events or changes in circumstances indicate that the carrying amount ofgoodwill may not be recoverable.
Derivative instruments
Effective January 1, 2009, we adopted a new accounting standard that requires additional disclosures aboutour derivative instruments and hedging activities. This standard requires that the objectives for using derivativeinstruments be disclosed to better convey the purpose of their use in terms of the risks that we are intending tomanage. This standard also requires disclosure of how derivatives and related hedged items affect our financialstatements. The adoption of this standard did not have a material impact on our consolidated results of oper-ations, financial position or cash flows. See Note 19, “Derivative instruments.”
Subsequent events
We have evaluated subsequent events through the date of issuance of our financial statements in thisForm 10-K.
F-10
AMGEN INC.
NOTES TO CONSOLIDATED FINANCIAL STATEMENTS (Continued)
Recent accounting pronouncements
In June 2009, the FASB issued a new accounting standard which amends guidance regarding consolidationof variable interest entities to address the elimination of the concept of a qualifying special purpose entity. Thisstandard also replaces the quantitative-based risks and rewards calculation for determining which enterprise has acontrolling financial interest in a variable interest entity with an approach focused on identifying which enter-prise has the power to direct the activities of the variable interest entity and the obligation to absorb losses of theentity or the right to receive benefits from the entity. Additionally, this standard requires any enterprise that holdsa variable interest in a variable interest entity to make ongoing assessments of whether it has a controlling finan-cial interest in the variable interest entity and to provide enhanced disclosures that will provide users of financialstatements with more transparent information about an enterprise’s involvement in the variable interest entity.This standard is effective for us beginning January 1, 2010. The adoption of this standard is not expected to havea material impact on our consolidated results of operations, financial position or cash flows.
In October 2009, the FASB issued a new accounting standard which amends guidance on accounting for rev-enue arrangements involving the delivery of more than one element of goods and/or services. This standardaddresses the unit of accounting for arrangements involving multiple deliverables and removes the previousseparation criteria that objective and reliable evidence of fair value of any undelivered item must exist for the de-livered item to be considered a separate unit of accounting. This standard also addresses how the arrangementconsideration should be allocated to each deliverable. Finally, this standard expands disclosures related to multi-ple element revenue arrangements. This standard is effective for us beginning January 1, 2011. The adoption ofthis standard is not expected to have a material impact on our consolidated results of operations, financial posi-tion or cash flows.
2. Change in method of accounting for convertible debt instruments
As discussed in Note 1, “Summary of significant accounting policies—Change in method of accounting forconvertible debt instruments,” effective January 1, 2009, we adopted a new accounting standard which changedthe method of accounting for certain types of convertible debt, including our 2011 Convertible Notes, 2013 Con-vertible Notes and our 2032 Modified Convertible Notes, and, as required by this standard, we retrospectivelyapplied this change in accounting to all prior periods for which we had applicable outstanding convertible debt.
F-11
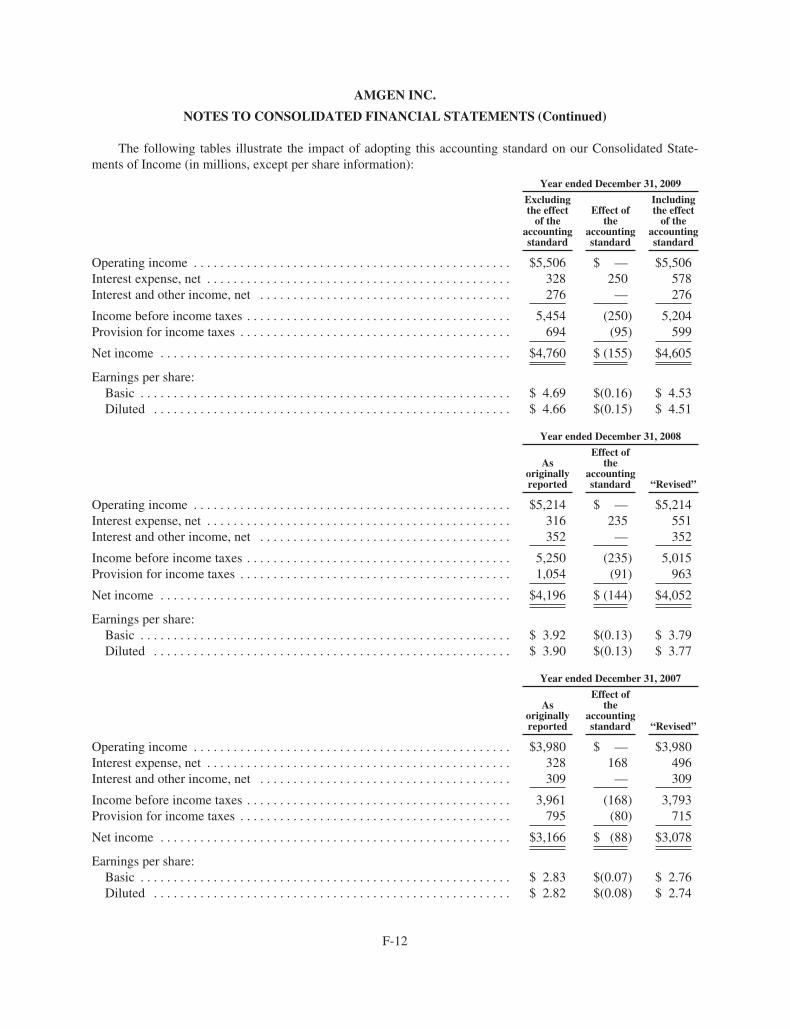
AMGEN INC.
NOTES TO CONSOLIDATED FINANCIAL STATEMENTS (Continued)
The following tables illustrate the impact of adopting this accounting standard on our Consolidated State-ments of Income (in millions, except per share information):
Year ended December 31, 2009
Excludingthe effect
of theaccountingstandard
Effect ofthe
accountingstandard
Includingthe effect
of theaccountingstandard
Operating income . . . . . . . . . . . . . . . . . . . . . . . . . . . . . . . . . . . . . . . . . . . . . . . . $5,506 $ — $5,506Interest expense, net . . . . . . . . . . . . . . . . . . . . . . . . . . . . . . . . . . . . . . . . . . . . . . 328 250 578Interest and other income, net . . . . . . . . . . . . . . . . . . . . . . . . . . . . . . . . . . . . . . 276 — 276
Income before income taxes . . . . . . . . . . . . . . . . . . . . . . . . . . . . . . . . . . . . . . . . 5,454 (250) 5,204Provision for income taxes . . . . . . . . . . . . . . . . . . . . . . . . . . . . . . . . . . . . . . . . . 694 (95) 599
Net income . . . . . . . . . . . . . . . . . . . . . . . . . . . . . . . . . . . . . . . . . . . . . . . . . . . . . $4,760 $ (155) $4,605
Earnings per share:Basic . . . . . . . . . . . . . . . . . . . . . . . . . . . . . . . . . . . . . . . . . . . . . . . . . . . . . . . . $ 4.69 $(0.16) $ 4.53Diluted . . . . . . . . . . . . . . . . . . . . . . . . . . . . . . . . . . . . . . . . . . . . . . . . . . . . . . $ 4.66 $(0.15) $ 4.51
Year ended December 31, 2008
Asoriginallyreported
Effect ofthe
accountingstandard “Revised”
Operating income . . . . . . . . . . . . . . . . . . . . . . . . . . . . . . . . . . . . . . . . . . . . . . . . $5,214 $ — $5,214Interest expense, net . . . . . . . . . . . . . . . . . . . . . . . . . . . . . . . . . . . . . . . . . . . . . . 316 235 551Interest and other income, net . . . . . . . . . . . . . . . . . . . . . . . . . . . . . . . . . . . . . . 352 — 352
Income before income taxes . . . . . . . . . . . . . . . . . . . . . . . . . . . . . . . . . . . . . . . . 5,250 (235) 5,015Provision for income taxes . . . . . . . . . . . . . . . . . . . . . . . . . . . . . . . . . . . . . . . . . 1,054 (91) 963
Net income . . . . . . . . . . . . . . . . . . . . . . . . . . . . . . . . . . . . . . . . . . . . . . . . . . . . . $4,196 $ (144) $4,052
Earnings per share:Basic . . . . . . . . . . . . . . . . . . . . . . . . . . . . . . . . . . . . . . . . . . . . . . . . . . . . . . . . $ 3.92 $(0.13) $ 3.79Diluted . . . . . . . . . . . . . . . . . . . . . . . . . . . . . . . . . . . . . . . . . . . . . . . . . . . . . . $ 3.90 $(0.13) $ 3.77
Year ended December 31, 2007
Asoriginallyreported
Effect ofthe
accountingstandard “Revised”
Operating income . . . . . . . . . . . . . . . . . . . . . . . . . . . . . . . . . . . . . . . . . . . . . . . . $3,980 $ — $3,980Interest expense, net . . . . . . . . . . . . . . . . . . . . . . . . . . . . . . . . . . . . . . . . . . . . . . 328 168 496Interest and other income, net . . . . . . . . . . . . . . . . . . . . . . . . . . . . . . . . . . . . . . 309 — 309
Income before income taxes . . . . . . . . . . . . . . . . . . . . . . . . . . . . . . . . . . . . . . . . 3,961 (168) 3,793Provision for income taxes . . . . . . . . . . . . . . . . . . . . . . . . . . . . . . . . . . . . . . . . . 795 (80) 715
Net income . . . . . . . . . . . . . . . . . . . . . . . . . . . . . . . . . . . . . . . . . . . . . . . . . . . . . $3,166 $ (88) $3,078
Earnings per share:Basic . . . . . . . . . . . . . . . . . . . . . . . . . . . . . . . . . . . . . . . . . . . . . . . . . . . . . . . . $ 2.83 $(0.07) $ 2.76Diluted . . . . . . . . . . . . . . . . . . . . . . . . . . . . . . . . . . . . . . . . . . . . . . . . . . . . . . $ 2.82 $(0.08) $ 2.74
F-12
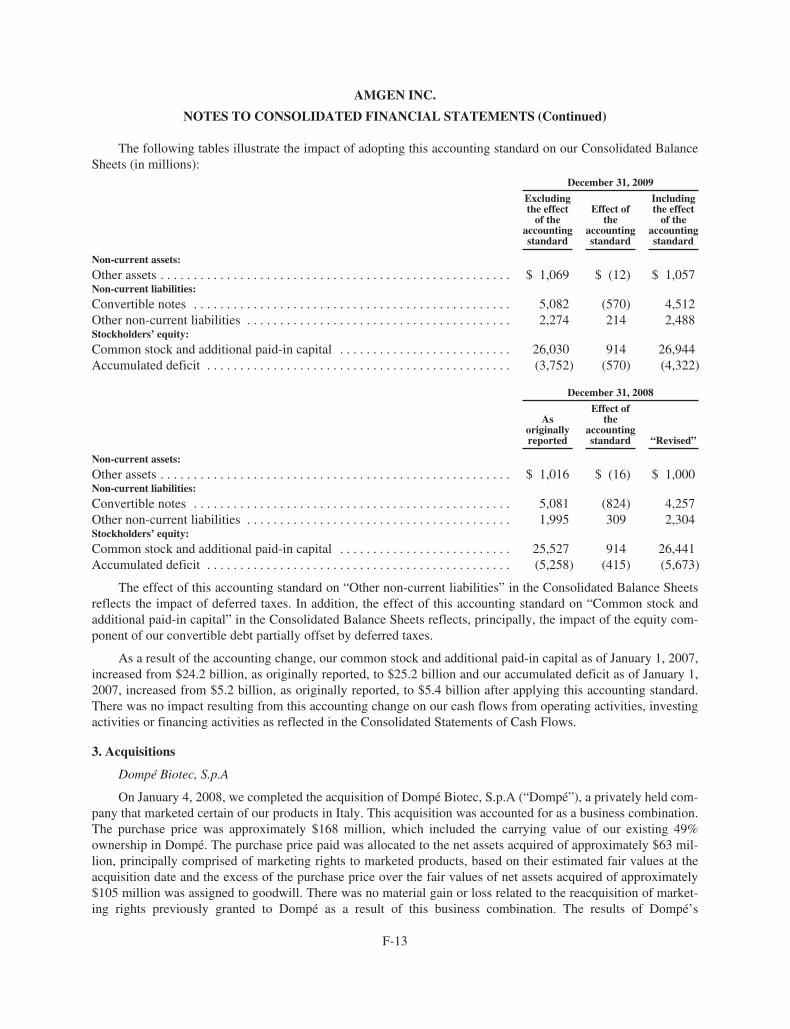
AMGEN INC.
NOTES TO CONSOLIDATED FINANCIAL STATEMENTS (Continued)
The following tables illustrate the impact of adopting this accounting standard on our Consolidated BalanceSheets (in millions):
December 31, 2009
Excludingthe effect
of theaccountingstandard
Effect ofthe
accountingstandard
Includingthe effect
of theaccountingstandard
Non-current assets:
Other assets . . . . . . . . . . . . . . . . . . . . . . . . . . . . . . . . . . . . . . . . . . . . . . . . . . . . . $ 1,069 $ (12) $ 1,057Non-current liabilities:
Convertible notes . . . . . . . . . . . . . . . . . . . . . . . . . . . . . . . . . . . . . . . . . . . . . . . . 5,082 (570) 4,512Other non-current liabilities . . . . . . . . . . . . . . . . . . . . . . . . . . . . . . . . . . . . . . . . 2,274 214 2,488Stockholders’ equity:
Common stock and additional paid-in capital . . . . . . . . . . . . . . . . . . . . . . . . . . 26,030 914 26,944Accumulated deficit . . . . . . . . . . . . . . . . . . . . . . . . . . . . . . . . . . . . . . . . . . . . . . (3,752) (570) (4,322)
December 31, 2008
Asoriginallyreported
Effect ofthe
accountingstandard “Revised”
Non-current assets:
Other assets . . . . . . . . . . . . . . . . . . . . . . . . . . . . . . . . . . . . . . . . . . . . . . . . . . . . . $ 1,016 $ (16) $ 1,000Non-current liabilities:
Convertible notes . . . . . . . . . . . . . . . . . . . . . . . . . . . . . . . . . . . . . . . . . . . . . . . . 5,081 (824) 4,257Other non-current liabilities . . . . . . . . . . . . . . . . . . . . . . . . . . . . . . . . . . . . . . . . 1,995 309 2,304Stockholders’ equity:
Common stock and additional paid-in capital . . . . . . . . . . . . . . . . . . . . . . . . . . 25,527 914 26,441Accumulated deficit . . . . . . . . . . . . . . . . . . . . . . . . . . . . . . . . . . . . . . . . . . . . . . (5,258) (415) (5,673)
The effect of this accounting standard on “Other non-current liabilities” in the Consolidated Balance Sheetsreflects the impact of deferred taxes. In addition, the effect of this accounting standard on “Common stock andadditional paid-in capital” in the Consolidated Balance Sheets reflects, principally, the impact of the equity com-ponent of our convertible debt partially offset by deferred taxes.
As a result of the accounting change, our common stock and additional paid-in capital as of January 1, 2007,increased from $24.2 billion, as originally reported, to $25.2 billion and our accumulated deficit as of January 1,2007, increased from $5.2 billion, as originally reported, to $5.4 billion after applying this accounting standard.There was no impact resulting from this accounting change on our cash flows from operating activities, investingactivities or financing activities as reflected in the Consolidated Statements of Cash Flows.
3. Acquisitions
Dompé Biotec, S.p.A
On January 4, 2008, we completed the acquisition of Dompé Biotec, S.p.A (“Dompé”), a privately held com-pany that marketed certain of our products in Italy. This acquisition was accounted for as a business combination.The purchase price was approximately $168 million, which included the carrying value of our existing 49%ownership in Dompé. The purchase price paid was allocated to the net assets acquired of approximately $63 mil-lion, principally comprised of marketing rights to marketed products, based on their estimated fair values at theacquisition date and the excess of the purchase price over the fair values of net assets acquired of approximately$105 million was assigned to goodwill. There was no material gain or loss related to the reacquisition of market-ing rights previously granted to Dompé as a result of this business combination. The results of Dompé’s
F-13
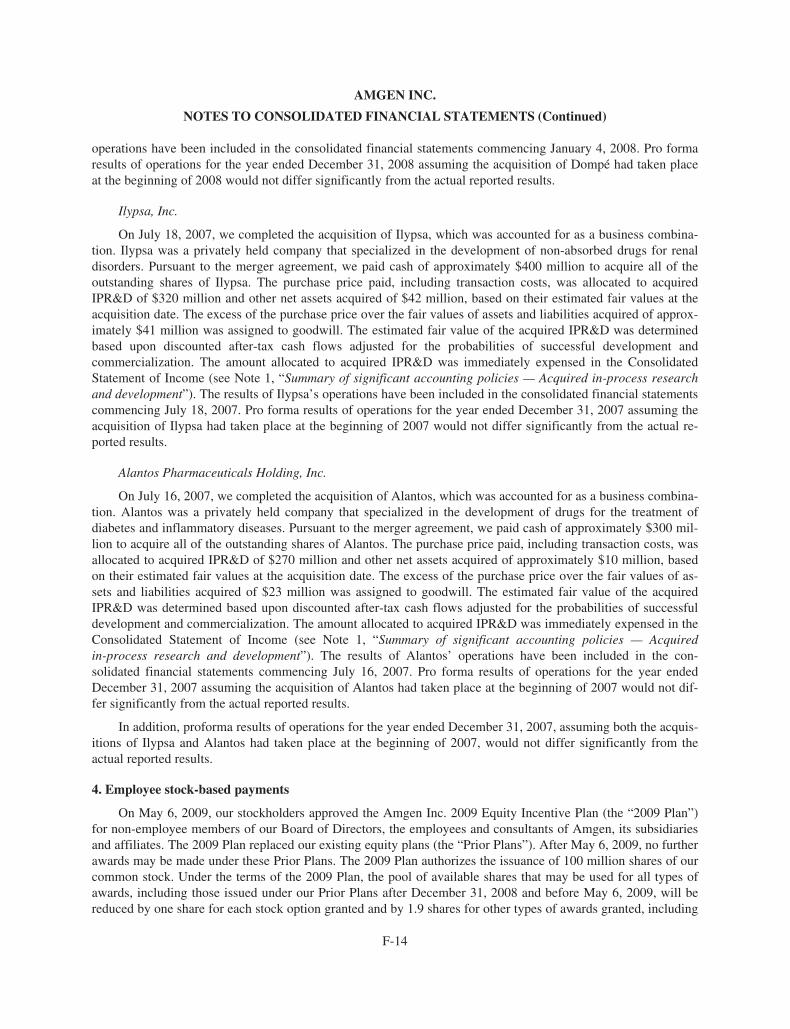
AMGEN INC.
NOTES TO CONSOLIDATED FINANCIAL STATEMENTS (Continued)
operations have been included in the consolidated financial statements commencing January 4, 2008. Pro formaresults of operations for the year ended December 31, 2008 assuming the acquisition of Dompé had taken placeat the beginning of 2008 would not differ significantly from the actual reported results.
Ilypsa, Inc.
On July 18, 2007, we completed the acquisition of Ilypsa, which was accounted for as a business combina-tion. Ilypsa was a privately held company that specialized in the development of non-absorbed drugs for renaldisorders. Pursuant to the merger agreement, we paid cash of approximately $400 million to acquire all of theoutstanding shares of Ilypsa. The purchase price paid, including transaction costs, was allocated to acquiredIPR&D of $320 million and other net assets acquired of $42 million, based on their estimated fair values at theacquisition date. The excess of the purchase price over the fair values of assets and liabilities acquired of approx-imately $41 million was assigned to goodwill. The estimated fair value of the acquired IPR&D was determinedbased upon discounted after-tax cash flows adjusted for the probabilities of successful development andcommercialization. The amount allocated to acquired IPR&D was immediately expensed in the ConsolidatedStatement of Income (see Note 1, “Summary of significant accounting policies — Acquired in-process researchand development”). The results of Ilypsa’s operations have been included in the consolidated financial statementscommencing July 18, 2007. Pro forma results of operations for the year ended December 31, 2007 assuming theacquisition of Ilypsa had taken place at the beginning of 2007 would not differ significantly from the actual re-ported results.
Alantos Pharmaceuticals Holding, Inc.
On July 16, 2007, we completed the acquisition of Alantos, which was accounted for as a business combina-tion. Alantos was a privately held company that specialized in the development of drugs for the treatment ofdiabetes and inflammatory diseases. Pursuant to the merger agreement, we paid cash of approximately $300 mil-lion to acquire all of the outstanding shares of Alantos. The purchase price paid, including transaction costs, wasallocated to acquired IPR&D of $270 million and other net assets acquired of approximately $10 million, basedon their estimated fair values at the acquisition date. The excess of the purchase price over the fair values of as-sets and liabilities acquired of $23 million was assigned to goodwill. The estimated fair value of the acquiredIPR&D was determined based upon discounted after-tax cash flows adjusted for the probabilities of successfuldevelopment and commercialization. The amount allocated to acquired IPR&D was immediately expensed in theConsolidated Statement of Income (see Note 1, “Summary of significant accounting policies — Acquiredin-process research and development”). The results of Alantos’ operations have been included in the con-solidated financial statements commencing July 16, 2007. Pro forma results of operations for the year endedDecember 31, 2007 assuming the acquisition of Alantos had taken place at the beginning of 2007 would not dif-fer significantly from the actual reported results.
In addition, proforma results of operations for the year ended December 31, 2007, assuming both the acquis-itions of Ilypsa and Alantos had taken place at the beginning of 2007, would not differ significantly from theactual reported results.
4. Employee stock-based payments
On May 6, 2009, our stockholders approved the Amgen Inc. 2009 Equity Incentive Plan (the “2009 Plan”)for non-employee members of our Board of Directors, the employees and consultants of Amgen, its subsidiariesand affiliates. The 2009 Plan replaced our existing equity plans (the “Prior Plans”). After May 6, 2009, no furtherawards may be made under these Prior Plans. The 2009 Plan authorizes the issuance of 100 million shares of ourcommon stock. Under the terms of the 2009 Plan, the pool of available shares that may be used for all types ofawards, including those issued under our Prior Plans after December 31, 2008 and before May 6, 2009, will bereduced by one share for each stock option granted and by 1.9 shares for other types of awards granted, including
F-14
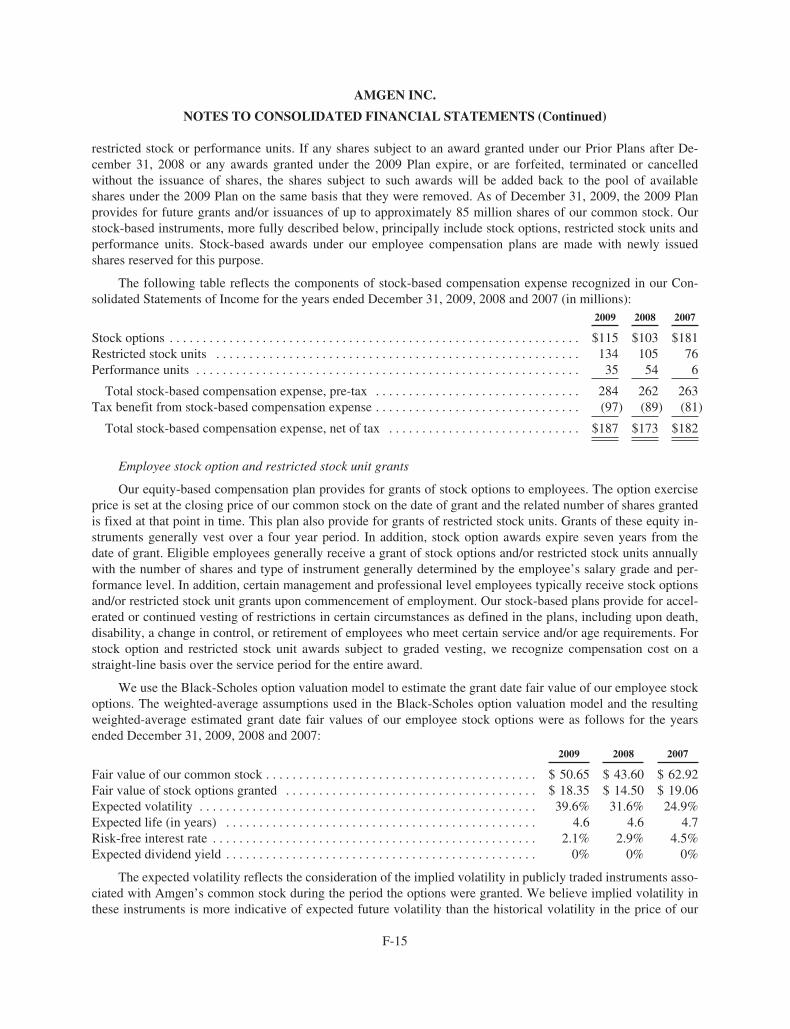
AMGEN INC.
NOTES TO CONSOLIDATED FINANCIAL STATEMENTS (Continued)
restricted stock or performance units. If any shares subject to an award granted under our Prior Plans after De-cember 31, 2008 or any awards granted under the 2009 Plan expire, or are forfeited, terminated or cancelledwithout the issuance of shares, the shares subject to such awards will be added back to the pool of availableshares under the 2009 Plan on the same basis that they were removed. As of December 31, 2009, the 2009 Planprovides for future grants and/or issuances of up to approximately 85 million shares of our common stock. Ourstock-based instruments, more fully described below, principally include stock options, restricted stock units andperformance units. Stock-based awards under our employee compensation plans are made with newly issuedshares reserved for this purpose.
The following table reflects the components of stock-based compensation expense recognized in our Con-solidated Statements of Income for the years ended December 31, 2009, 2008 and 2007 (in millions):
2009 2008 2007
Stock options . . . . . . . . . . . . . . . . . . . . . . . . . . . . . . . . . . . . . . . . . . . . . . . . . . . . . . . . . . . . . . $115 $103 $181Restricted stock units . . . . . . . . . . . . . . . . . . . . . . . . . . . . . . . . . . . . . . . . . . . . . . . . . . . . . . . 134 105 76Performance units . . . . . . . . . . . . . . . . . . . . . . . . . . . . . . . . . . . . . . . . . . . . . . . . . . . . . . . . . . 35 54 6
Total stock-based compensation expense, pre-tax . . . . . . . . . . . . . . . . . . . . . . . . . . . . . . . 284 262 263Tax benefit from stock-based compensation expense . . . . . . . . . . . . . . . . . . . . . . . . . . . . . . . (97) (89) (81)
Total stock-based compensation expense, net of tax . . . . . . . . . . . . . . . . . . . . . . . . . . . . . $187 $173 $182
Employee stock option and restricted stock unit grants
Our equity-based compensation plan provides for grants of stock options to employees. The option exerciseprice is set at the closing price of our common stock on the date of grant and the related number of shares grantedis fixed at that point in time. This plan also provide for grants of restricted stock units. Grants of these equity in-struments generally vest over a four year period. In addition, stock option awards expire seven years from thedate of grant. Eligible employees generally receive a grant of stock options and/or restricted stock units annuallywith the number of shares and type of instrument generally determined by the employee’s salary grade and per-formance level. In addition, certain management and professional level employees typically receive stock optionsand/or restricted stock unit grants upon commencement of employment. Our stock-based plans provide for accel-erated or continued vesting of restrictions in certain circumstances as defined in the plans, including upon death,disability, a change in control, or retirement of employees who meet certain service and/or age requirements. Forstock option and restricted stock unit awards subject to graded vesting, we recognize compensation cost on astraight-line basis over the service period for the entire award.
We use the Black-Scholes option valuation model to estimate the grant date fair value of our employee stockoptions. The weighted-average assumptions used in the Black-Scholes option valuation model and the resultingweighted-average estimated grant date fair values of our employee stock options were as follows for the yearsended December 31, 2009, 2008 and 2007:
2009 2008 2007
Fair value of our common stock . . . . . . . . . . . . . . . . . . . . . . . . . . . . . . . . . . . . . . . . . $ 50.65 $ 43.60 $ 62.92Fair value of stock options granted . . . . . . . . . . . . . . . . . . . . . . . . . . . . . . . . . . . . . . $ 18.35 $ 14.50 $ 19.06Expected volatility . . . . . . . . . . . . . . . . . . . . . . . . . . . . . . . . . . . . . . . . . . . . . . . . . . . 39.6% 31.6% 24.9%Expected life (in years) . . . . . . . . . . . . . . . . . . . . . . . . . . . . . . . . . . . . . . . . . . . . . . . 4.6 4.6 4.7Risk-free interest rate . . . . . . . . . . . . . . . . . . . . . . . . . . . . . . . . . . . . . . . . . . . . . . . . . 2.1% 2.9% 4.5%Expected dividend yield . . . . . . . . . . . . . . . . . . . . . . . . . . . . . . . . . . . . . . . . . . . . . . . 0% 0% 0%
The expected volatility reflects the consideration of the implied volatility in publicly traded instruments asso-ciated with Amgen’s common stock during the period the options were granted. We believe implied volatility inthese instruments is more indicative of expected future volatility than the historical volatility in the price of our
F-15
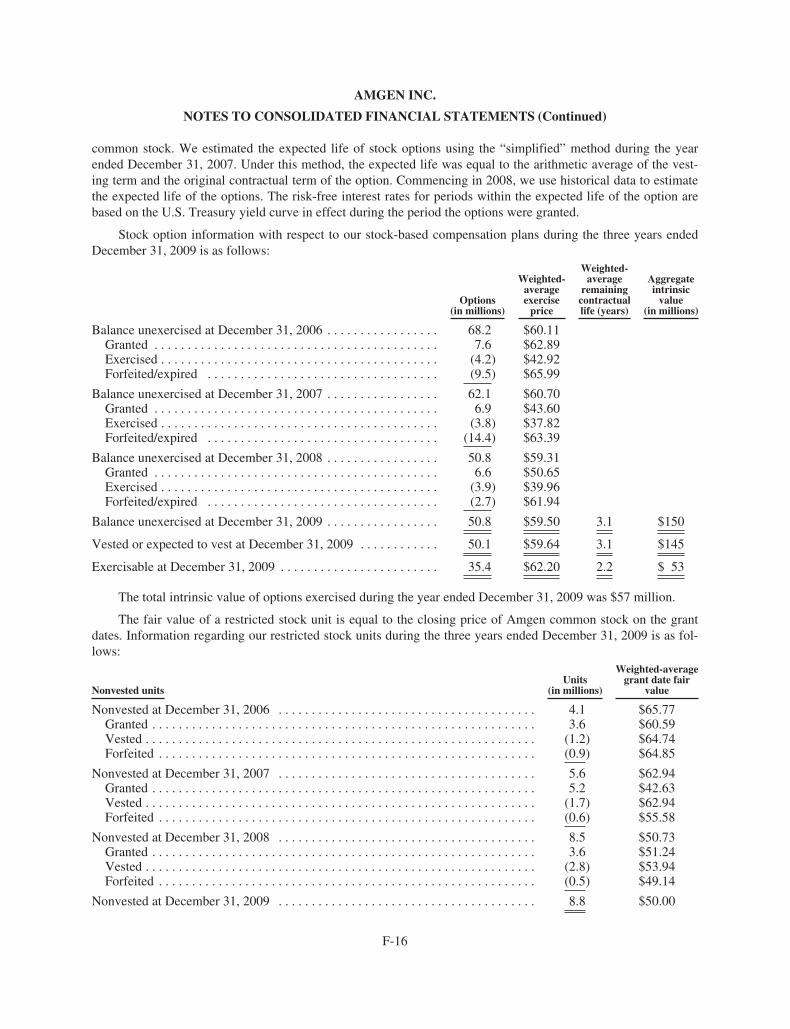
AMGEN INC.
NOTES TO CONSOLIDATED FINANCIAL STATEMENTS (Continued)
common stock. We estimated the expected life of stock options using the “simplified” method during the yearended December 31, 2007. Under this method, the expected life was equal to the arithmetic average of the vest-ing term and the original contractual term of the option. Commencing in 2008, we use historical data to estimatethe expected life of the options. The risk-free interest rates for periods within the expected life of the option arebased on the U.S. Treasury yield curve in effect during the period the options were granted.
Stock option information with respect to our stock-based compensation plans during the three years endedDecember 31, 2009 is as follows:
Options(in millions)
Weighted-averageexercise
price
Weighted-average
remainingcontractuallife (years)
Aggregateintrinsic
value(in millions)
Balance unexercised at December 31, 2006 . . . . . . . . . . . . . . . . . 68.2 $60.11Granted . . . . . . . . . . . . . . . . . . . . . . . . . . . . . . . . . . . . . . . . . . . 7.6 $62.89Exercised . . . . . . . . . . . . . . . . . . . . . . . . . . . . . . . . . . . . . . . . . . (4.2) $42.92Forfeited/expired . . . . . . . . . . . . . . . . . . . . . . . . . . . . . . . . . . . (9.5) $65.99
Balance unexercised at December 31, 2007 . . . . . . . . . . . . . . . . . 62.1 $60.70Granted . . . . . . . . . . . . . . . . . . . . . . . . . . . . . . . . . . . . . . . . . . . 6.9 $43.60Exercised . . . . . . . . . . . . . . . . . . . . . . . . . . . . . . . . . . . . . . . . . . (3.8) $37.82Forfeited/expired . . . . . . . . . . . . . . . . . . . . . . . . . . . . . . . . . . . (14.4) $63.39
Balance unexercised at December 31, 2008 . . . . . . . . . . . . . . . . . 50.8 $59.31Granted . . . . . . . . . . . . . . . . . . . . . . . . . . . . . . . . . . . . . . . . . . . 6.6 $50.65Exercised . . . . . . . . . . . . . . . . . . . . . . . . . . . . . . . . . . . . . . . . . . (3.9) $39.96Forfeited/expired . . . . . . . . . . . . . . . . . . . . . . . . . . . . . . . . . . . (2.7) $61.94
Balance unexercised at December 31, 2009 . . . . . . . . . . . . . . . . . 50.8 $59.50 3.1 $150
Vested or expected to vest at December 31, 2009 . . . . . . . . . . . . 50.1 $59.64 3.1 $145
Exercisable at December 31, 2009 . . . . . . . . . . . . . . . . . . . . . . . . 35.4 $62.20 2.2 $ 53
The total intrinsic value of options exercised during the year ended December 31, 2009 was $57 million.
The fair value of a restricted stock unit is equal to the closing price of Amgen common stock on the grantdates. Information regarding our restricted stock units during the three years ended December 31, 2009 is as fol-lows:
Nonvested unitsUnits
(in millions)
Weighted-averagegrant date fair
value
Nonvested at December 31, 2006 . . . . . . . . . . . . . . . . . . . . . . . . . . . . . . . . . . . . . . . 4.1 $65.77Granted . . . . . . . . . . . . . . . . . . . . . . . . . . . . . . . . . . . . . . . . . . . . . . . . . . . . . . . . . . 3.6 $60.59Vested . . . . . . . . . . . . . . . . . . . . . . . . . . . . . . . . . . . . . . . . . . . . . . . . . . . . . . . . . . . (1.2) $64.74Forfeited . . . . . . . . . . . . . . . . . . . . . . . . . . . . . . . . . . . . . . . . . . . . . . . . . . . . . . . . . (0.9) $64.85
Nonvested at December 31, 2007 . . . . . . . . . . . . . . . . . . . . . . . . . . . . . . . . . . . . . . . 5.6 $62.94Granted . . . . . . . . . . . . . . . . . . . . . . . . . . . . . . . . . . . . . . . . . . . . . . . . . . . . . . . . . . 5.2 $42.63Vested . . . . . . . . . . . . . . . . . . . . . . . . . . . . . . . . . . . . . . . . . . . . . . . . . . . . . . . . . . . (1.7) $62.94Forfeited . . . . . . . . . . . . . . . . . . . . . . . . . . . . . . . . . . . . . . . . . . . . . . . . . . . . . . . . . (0.6) $55.58
Nonvested at December 31, 2008 . . . . . . . . . . . . . . . . . . . . . . . . . . . . . . . . . . . . . . . 8.5 $50.73Granted . . . . . . . . . . . . . . . . . . . . . . . . . . . . . . . . . . . . . . . . . . . . . . . . . . . . . . . . . . 3.6 $51.24Vested . . . . . . . . . . . . . . . . . . . . . . . . . . . . . . . . . . . . . . . . . . . . . . . . . . . . . . . . . . . (2.8) $53.94Forfeited . . . . . . . . . . . . . . . . . . . . . . . . . . . . . . . . . . . . . . . . . . . . . . . . . . . . . . . . . (0.5) $49.14
Nonvested at December 31, 2009 . . . . . . . . . . . . . . . . . . . . . . . . . . . . . . . . . . . . . . . 8.8 $50.00
F-16
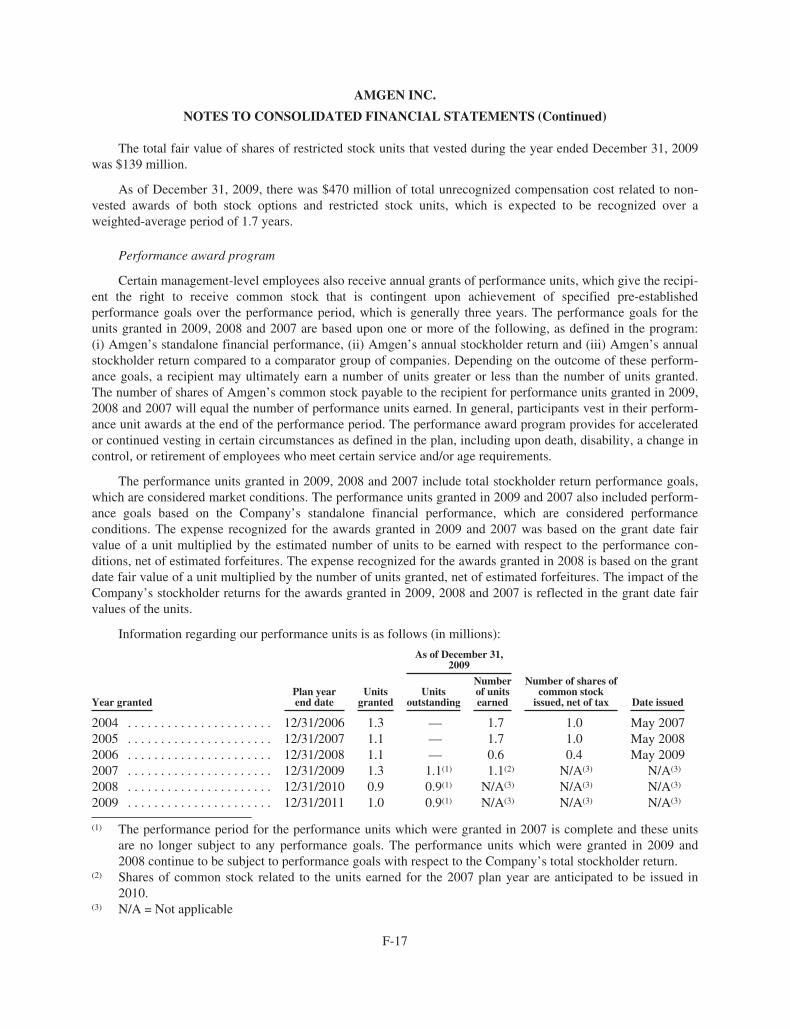
AMGEN INC.
NOTES TO CONSOLIDATED FINANCIAL STATEMENTS (Continued)
The total fair value of shares of restricted stock units that vested during the year ended December 31, 2009was $139 million.
As of December 31, 2009, there was $470 million of total unrecognized compensation cost related to non-vested awards of both stock options and restricted stock units, which is expected to be recognized over aweighted-average period of 1.7 years.
Performance award program
Certain management-level employees also receive annual grants of performance units, which give the recipi-ent the right to receive common stock that is contingent upon achievement of specified pre-establishedperformance goals over the performance period, which is generally three years. The performance goals for theunits granted in 2009, 2008 and 2007 are based upon one or more of the following, as defined in the program:(i) Amgen’s standalone financial performance, (ii) Amgen’s annual stockholder return and (iii) Amgen’s annualstockholder return compared to a comparator group of companies. Depending on the outcome of these perform-ance goals, a recipient may ultimately earn a number of units greater or less than the number of units granted.The number of shares of Amgen’s common stock payable to the recipient for performance units granted in 2009,2008 and 2007 will equal the number of performance units earned. In general, participants vest in their perform-ance unit awards at the end of the performance period. The performance award program provides for acceleratedor continued vesting in certain circumstances as defined in the plan, including upon death, disability, a change incontrol, or retirement of employees who meet certain service and/or age requirements.
The performance units granted in 2009, 2008 and 2007 include total stockholder return performance goals,which are considered market conditions. The performance units granted in 2009 and 2007 also included perform-ance goals based on the Company’s standalone financial performance, which are considered performanceconditions. The expense recognized for the awards granted in 2009 and 2007 was based on the grant date fairvalue of a unit multiplied by the estimated number of units to be earned with respect to the performance con-ditions, net of estimated forfeitures. The expense recognized for the awards granted in 2008 is based on the grantdate fair value of a unit multiplied by the number of units granted, net of estimated forfeitures. The impact of theCompany’s stockholder returns for the awards granted in 2009, 2008 and 2007 is reflected in the grant date fairvalues of the units.
Information regarding our performance units is as follows (in millions):
Year grantedPlan yearend date
Unitsgranted
As of December 31,2009
Number of shares ofcommon stock
issued, net of tax Date issuedUnits
outstanding
Numberof unitsearned
2004 . . . . . . . . . . . . . . . . . . . . . . 12/31/2006 1.3 — 1.7 1.0 May 20072005 . . . . . . . . . . . . . . . . . . . . . . 12/31/2007 1.1 — 1.7 1.0 May 20082006 . . . . . . . . . . . . . . . . . . . . . . 12/31/2008 1.1 — 0.6 0.4 May 20092007 . . . . . . . . . . . . . . . . . . . . . . 12/31/2009 1.3 1.1(1) 1.1(2) N/A(3) N/A(3)
2008 . . . . . . . . . . . . . . . . . . . . . . 12/31/2010 0.9 0.9(1) N/A(3) N/A(3) N/A(3)
2009 . . . . . . . . . . . . . . . . . . . . . . 12/31/2011 1.0 0.9(1) N/A(3) N/A(3) N/A(3)
(1) The performance period for the performance units which were granted in 2007 is complete and these unitsare no longer subject to any performance goals. The performance units which were granted in 2009 and2008 continue to be subject to performance goals with respect to the Company’s total stockholder return.
(2) Shares of common stock related to the units earned for the 2007 plan year are anticipated to be issued in2010.
(3) N/A = Not applicable
F-17
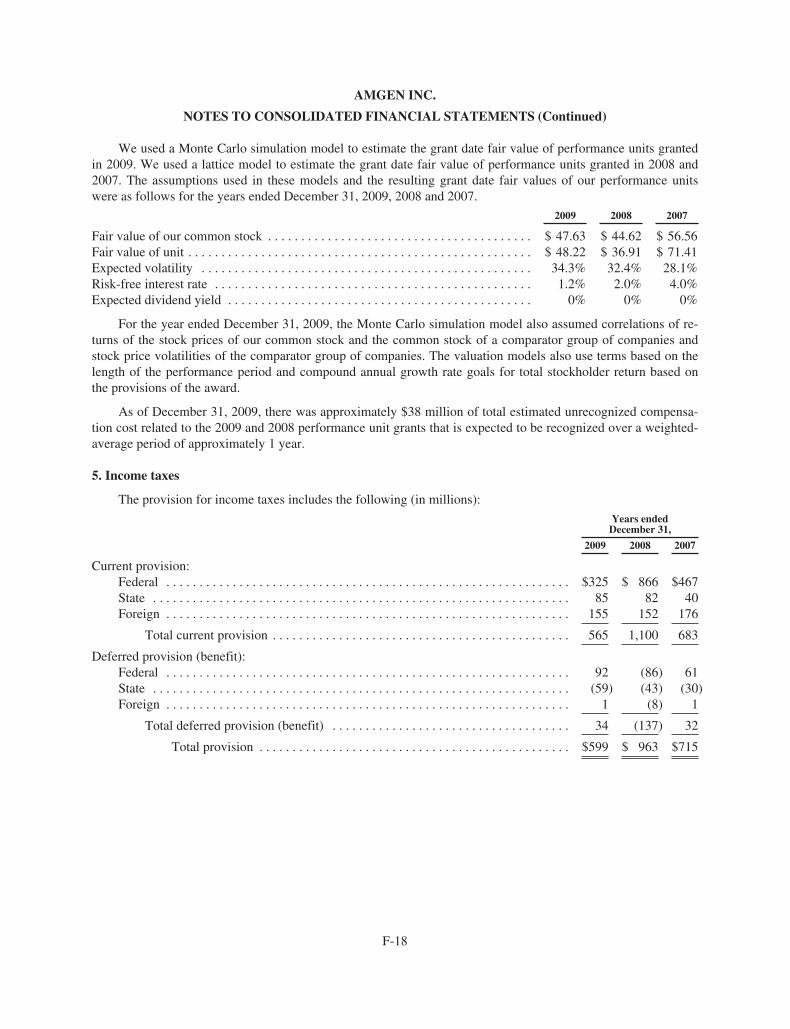
AMGEN INC.
NOTES TO CONSOLIDATED FINANCIAL STATEMENTS (Continued)
We used a Monte Carlo simulation model to estimate the grant date fair value of performance units grantedin 2009. We used a lattice model to estimate the grant date fair value of performance units granted in 2008 and2007. The assumptions used in these models and the resulting grant date fair values of our performance unitswere as follows for the years ended December 31, 2009, 2008 and 2007.
2009 2008 2007
Fair value of our common stock . . . . . . . . . . . . . . . . . . . . . . . . . . . . . . . . . . . . . . . . $ 47.63 $ 44.62 $ 56.56Fair value of unit . . . . . . . . . . . . . . . . . . . . . . . . . . . . . . . . . . . . . . . . . . . . . . . . . . . . $ 48.22 $ 36.91 $ 71.41Expected volatility . . . . . . . . . . . . . . . . . . . . . . . . . . . . . . . . . . . . . . . . . . . . . . . . . . 34.3% 32.4% 28.1%Risk-free interest rate . . . . . . . . . . . . . . . . . . . . . . . . . . . . . . . . . . . . . . . . . . . . . . . . 1.2% 2.0% 4.0%Expected dividend yield . . . . . . . . . . . . . . . . . . . . . . . . . . . . . . . . . . . . . . . . . . . . . . 0% 0% 0%
For the year ended December 31, 2009, the Monte Carlo simulation model also assumed correlations of re-turns of the stock prices of our common stock and the common stock of a comparator group of companies andstock price volatilities of the comparator group of companies. The valuation models also use terms based on thelength of the performance period and compound annual growth rate goals for total stockholder return based onthe provisions of the award.
As of December 31, 2009, there was approximately $38 million of total estimated unrecognized compensa-tion cost related to the 2009 and 2008 performance unit grants that is expected to be recognized over a weighted-average period of approximately 1 year.
5. Income taxes
The provision for income taxes includes the following (in millions):
Years endedDecember 31,
2009 2008 2007
Current provision:Federal . . . . . . . . . . . . . . . . . . . . . . . . . . . . . . . . . . . . . . . . . . . . . . . . . . . . . . . . . . . . . $325 $ 866 $467State . . . . . . . . . . . . . . . . . . . . . . . . . . . . . . . . . . . . . . . . . . . . . . . . . . . . . . . . . . . . . . . 85 82 40Foreign . . . . . . . . . . . . . . . . . . . . . . . . . . . . . . . . . . . . . . . . . . . . . . . . . . . . . . . . . . . . . 155 152 176
Total current provision . . . . . . . . . . . . . . . . . . . . . . . . . . . . . . . . . . . . . . . . . . . . . 565 1,100 683
Deferred provision (benefit):Federal . . . . . . . . . . . . . . . . . . . . . . . . . . . . . . . . . . . . . . . . . . . . . . . . . . . . . . . . . . . . . 92 (86) 61State . . . . . . . . . . . . . . . . . . . . . . . . . . . . . . . . . . . . . . . . . . . . . . . . . . . . . . . . . . . . . . . (59) (43) (30)Foreign . . . . . . . . . . . . . . . . . . . . . . . . . . . . . . . . . . . . . . . . . . . . . . . . . . . . . . . . . . . . . 1 (8) 1
Total deferred provision (benefit) . . . . . . . . . . . . . . . . . . . . . . . . . . . . . . . . . . . . 34 (137) 32
Total provision . . . . . . . . . . . . . . . . . . . . . . . . . . . . . . . . . . . . . . . . . . . . . . . $599 $ 963 $715
F-18
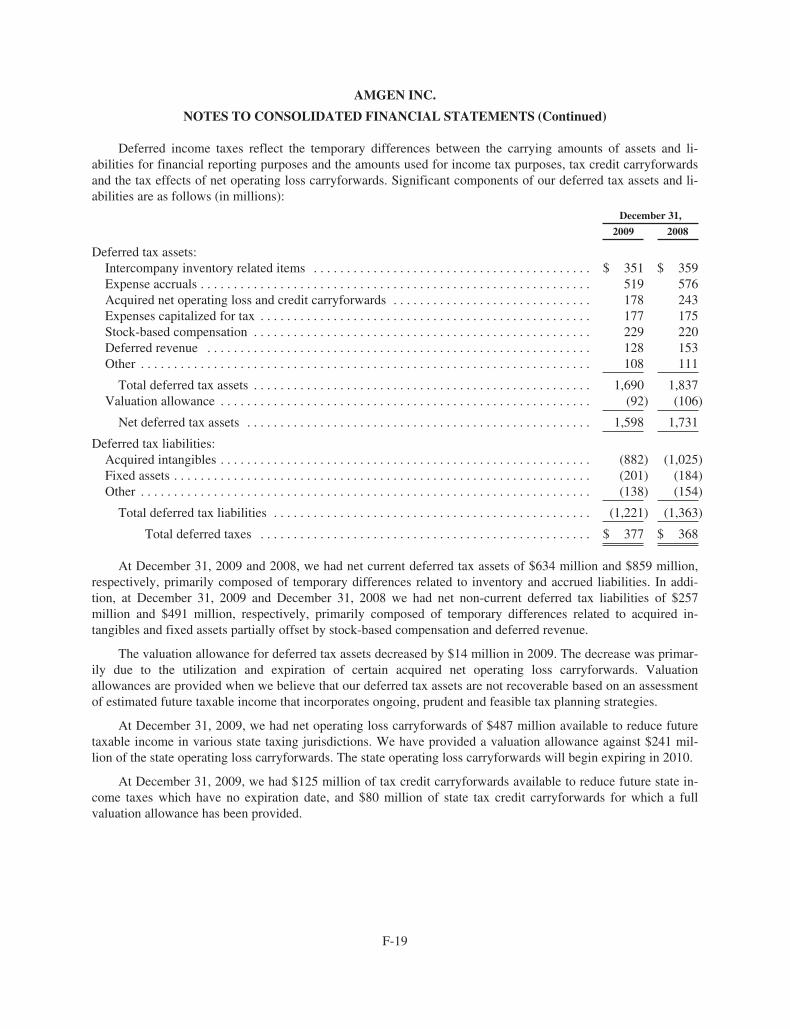
AMGEN INC.
NOTES TO CONSOLIDATED FINANCIAL STATEMENTS (Continued)
Deferred income taxes reflect the temporary differences between the carrying amounts of assets and li-abilities for financial reporting purposes and the amounts used for income tax purposes, tax credit carryforwardsand the tax effects of net operating loss carryforwards. Significant components of our deferred tax assets and li-abilities are as follows (in millions):
December 31,
2009 2008
Deferred tax assets:Intercompany inventory related items . . . . . . . . . . . . . . . . . . . . . . . . . . . . . . . . . . . . . . . . . . $ 351 $ 359Expense accruals . . . . . . . . . . . . . . . . . . . . . . . . . . . . . . . . . . . . . . . . . . . . . . . . . . . . . . . . . . . 519 576Acquired net operating loss and credit carryforwards . . . . . . . . . . . . . . . . . . . . . . . . . . . . . . 178 243Expenses capitalized for tax . . . . . . . . . . . . . . . . . . . . . . . . . . . . . . . . . . . . . . . . . . . . . . . . . . 177 175Stock-based compensation . . . . . . . . . . . . . . . . . . . . . . . . . . . . . . . . . . . . . . . . . . . . . . . . . . . 229 220Deferred revenue . . . . . . . . . . . . . . . . . . . . . . . . . . . . . . . . . . . . . . . . . . . . . . . . . . . . . . . . . . 128 153Other . . . . . . . . . . . . . . . . . . . . . . . . . . . . . . . . . . . . . . . . . . . . . . . . . . . . . . . . . . . . . . . . . . . . 108 111
Total deferred tax assets . . . . . . . . . . . . . . . . . . . . . . . . . . . . . . . . . . . . . . . . . . . . . . . . . . . 1,690 1,837Valuation allowance . . . . . . . . . . . . . . . . . . . . . . . . . . . . . . . . . . . . . . . . . . . . . . . . . . . . . . . . (92) (106)
Net deferred tax assets . . . . . . . . . . . . . . . . . . . . . . . . . . . . . . . . . . . . . . . . . . . . . . . . . . . . 1,598 1,731
Deferred tax liabilities:Acquired intangibles . . . . . . . . . . . . . . . . . . . . . . . . . . . . . . . . . . . . . . . . . . . . . . . . . . . . . . . . (882) (1,025)Fixed assets . . . . . . . . . . . . . . . . . . . . . . . . . . . . . . . . . . . . . . . . . . . . . . . . . . . . . . . . . . . . . . . (201) (184)Other . . . . . . . . . . . . . . . . . . . . . . . . . . . . . . . . . . . . . . . . . . . . . . . . . . . . . . . . . . . . . . . . . . . . (138) (154)
Total deferred tax liabilities . . . . . . . . . . . . . . . . . . . . . . . . . . . . . . . . . . . . . . . . . . . . . . . . (1,221) (1,363)
Total deferred taxes . . . . . . . . . . . . . . . . . . . . . . . . . . . . . . . . . . . . . . . . . . . . . . . . . . $ 377 $ 368
At December 31, 2009 and 2008, we had net current deferred tax assets of $634 million and $859 million,respectively, primarily composed of temporary differences related to inventory and accrued liabilities. In addi-tion, at December 31, 2009 and December 31, 2008 we had net non-current deferred tax liabilities of $257million and $491 million, respectively, primarily composed of temporary differences related to acquired in-tangibles and fixed assets partially offset by stock-based compensation and deferred revenue.
The valuation allowance for deferred tax assets decreased by $14 million in 2009. The decrease was primar-ily due to the utilization and expiration of certain acquired net operating loss carryforwards. Valuationallowances are provided when we believe that our deferred tax assets are not recoverable based on an assessmentof estimated future taxable income that incorporates ongoing, prudent and feasible tax planning strategies.
At December 31, 2009, we had net operating loss carryforwards of $487 million available to reduce futuretaxable income in various state taxing jurisdictions. We have provided a valuation allowance against $241 mil-lion of the state operating loss carryforwards. The state operating loss carryforwards will begin expiring in 2010.
At December 31, 2009, we had $125 million of tax credit carryforwards available to reduce future state in-come taxes which have no expiration date, and $80 million of state tax credit carryforwards for which a fullvaluation allowance has been provided.
F-19
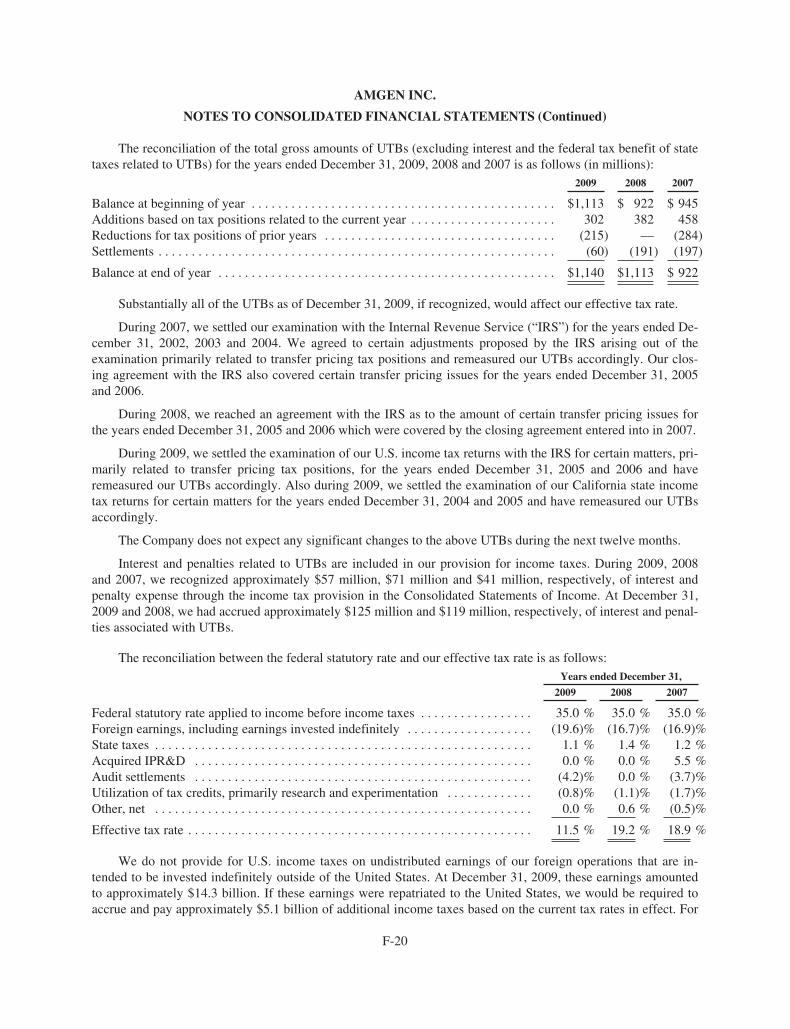
AMGEN INC.
NOTES TO CONSOLIDATED FINANCIAL STATEMENTS (Continued)
The reconciliation of the total gross amounts of UTBs (excluding interest and the federal tax benefit of statetaxes related to UTBs) for the years ended December 31, 2009, 2008 and 2007 is as follows (in millions):
2009 2008 2007
Balance at beginning of year . . . . . . . . . . . . . . . . . . . . . . . . . . . . . . . . . . . . . . . . . . . . . . $1,113 $ 922 $ 945Additions based on tax positions related to the current year . . . . . . . . . . . . . . . . . . . . . . 302 382 458Reductions for tax positions of prior years . . . . . . . . . . . . . . . . . . . . . . . . . . . . . . . . . . . (215) — (284)Settlements . . . . . . . . . . . . . . . . . . . . . . . . . . . . . . . . . . . . . . . . . . . . . . . . . . . . . . . . . . . . (60) (191) (197)
Balance at end of year . . . . . . . . . . . . . . . . . . . . . . . . . . . . . . . . . . . . . . . . . . . . . . . . . . . $1,140 $1,113 $ 922
Substantially all of the UTBs as of December 31, 2009, if recognized, would affect our effective tax rate.
During 2007, we settled our examination with the Internal Revenue Service (“IRS”) for the years ended De-cember 31, 2002, 2003 and 2004. We agreed to certain adjustments proposed by the IRS arising out of theexamination primarily related to transfer pricing tax positions and remeasured our UTBs accordingly. Our clos-ing agreement with the IRS also covered certain transfer pricing issues for the years ended December 31, 2005and 2006.
During 2008, we reached an agreement with the IRS as to the amount of certain transfer pricing issues forthe years ended December 31, 2005 and 2006 which were covered by the closing agreement entered into in 2007.
During 2009, we settled the examination of our U.S. income tax returns with the IRS for certain matters, pri-marily related to transfer pricing tax positions, for the years ended December 31, 2005 and 2006 and haveremeasured our UTBs accordingly. Also during 2009, we settled the examination of our California state incometax returns for certain matters for the years ended December 31, 2004 and 2005 and have remeasured our UTBsaccordingly.
The Company does not expect any significant changes to the above UTBs during the next twelve months.
Interest and penalties related to UTBs are included in our provision for income taxes. During 2009, 2008and 2007, we recognized approximately $57 million, $71 million and $41 million, respectively, of interest andpenalty expense through the income tax provision in the Consolidated Statements of Income. At December 31,2009 and 2008, we had accrued approximately $125 million and $119 million, respectively, of interest and penal-ties associated with UTBs.
The reconciliation between the federal statutory rate and our effective tax rate is as follows:Years ended December 31,
2009 2008 2007
Federal statutory rate applied to income before income taxes . . . . . . . . . . . . . . . . . 35.0 % 35.0 % 35.0 %Foreign earnings, including earnings invested indefinitely . . . . . . . . . . . . . . . . . . . (19.6)% (16.7)% (16.9)%State taxes . . . . . . . . . . . . . . . . . . . . . . . . . . . . . . . . . . . . . . . . . . . . . . . . . . . . . . . . . 1.1 % 1.4 % 1.2 %Acquired IPR&D . . . . . . . . . . . . . . . . . . . . . . . . . . . . . . . . . . . . . . . . . . . . . . . . . . . 0.0 % 0.0 % 5.5 %Audit settlements . . . . . . . . . . . . . . . . . . . . . . . . . . . . . . . . . . . . . . . . . . . . . . . . . . . (4.2)% 0.0 % (3.7)%Utilization of tax credits, primarily research and experimentation . . . . . . . . . . . . . (0.8)% (1.1)% (1.7)%Other, net . . . . . . . . . . . . . . . . . . . . . . . . . . . . . . . . . . . . . . . . . . . . . . . . . . . . . . . . . 0.0 % 0.6 % (0.5)%
Effective tax rate . . . . . . . . . . . . . . . . . . . . . . . . . . . . . . . . . . . . . . . . . . . . . . . . . . . . 11.5 % 19.2 % 18.9 %
We do not provide for U.S. income taxes on undistributed earnings of our foreign operations that are in-tended to be invested indefinitely outside of the United States. At December 31, 2009, these earnings amountedto approximately $14.3 billion. If these earnings were repatriated to the United States, we would be required toaccrue and pay approximately $5.1 billion of additional income taxes based on the current tax rates in effect. For
F-20
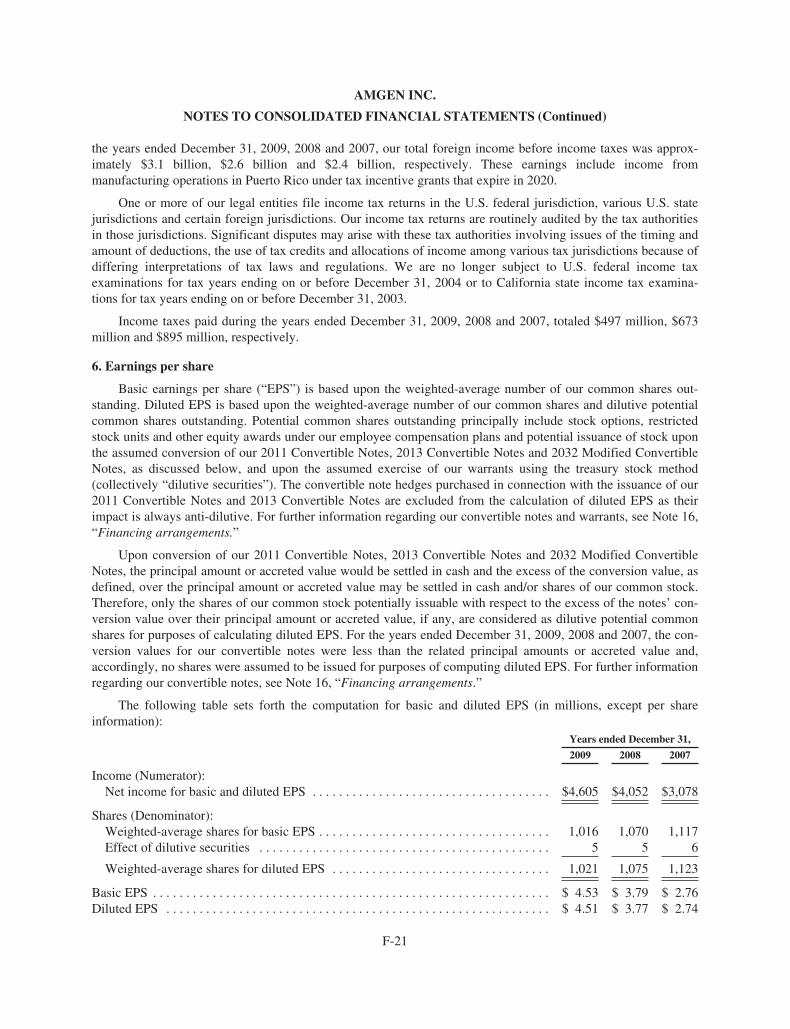
AMGEN INC.
NOTES TO CONSOLIDATED FINANCIAL STATEMENTS (Continued)
the years ended December 31, 2009, 2008 and 2007, our total foreign income before income taxes was approx-imately $3.1 billion, $2.6 billion and $2.4 billion, respectively. These earnings include income frommanufacturing operations in Puerto Rico under tax incentive grants that expire in 2020.
One or more of our legal entities file income tax returns in the U.S. federal jurisdiction, various U.S. statejurisdictions and certain foreign jurisdictions. Our income tax returns are routinely audited by the tax authoritiesin those jurisdictions. Significant disputes may arise with these tax authorities involving issues of the timing andamount of deductions, the use of tax credits and allocations of income among various tax jurisdictions because ofdiffering interpretations of tax laws and regulations. We are no longer subject to U.S. federal income taxexaminations for tax years ending on or before December 31, 2004 or to California state income tax examina-tions for tax years ending on or before December 31, 2003.
Income taxes paid during the years ended December 31, 2009, 2008 and 2007, totaled $497 million, $673million and $895 million, respectively.
6. Earnings per share
Basic earnings per share (“EPS”) is based upon the weighted-average number of our common shares out-standing. Diluted EPS is based upon the weighted-average number of our common shares and dilutive potentialcommon shares outstanding. Potential common shares outstanding principally include stock options, restrictedstock units and other equity awards under our employee compensation plans and potential issuance of stock uponthe assumed conversion of our 2011 Convertible Notes, 2013 Convertible Notes and 2032 Modified ConvertibleNotes, as discussed below, and upon the assumed exercise of our warrants using the treasury stock method(collectively “dilutive securities”). The convertible note hedges purchased in connection with the issuance of our2011 Convertible Notes and 2013 Convertible Notes are excluded from the calculation of diluted EPS as theirimpact is always anti-dilutive. For further information regarding our convertible notes and warrants, see Note 16,“Financing arrangements.”
Upon conversion of our 2011 Convertible Notes, 2013 Convertible Notes and 2032 Modified ConvertibleNotes, the principal amount or accreted value would be settled in cash and the excess of the conversion value, asdefined, over the principal amount or accreted value may be settled in cash and/or shares of our common stock.Therefore, only the shares of our common stock potentially issuable with respect to the excess of the notes’ con-version value over their principal amount or accreted value, if any, are considered as dilutive potential commonshares for purposes of calculating diluted EPS. For the years ended December 31, 2009, 2008 and 2007, the con-version values for our convertible notes were less than the related principal amounts or accreted value and,accordingly, no shares were assumed to be issued for purposes of computing diluted EPS. For further informationregarding our convertible notes, see Note 16, “Financing arrangements.”
The following table sets forth the computation for basic and diluted EPS (in millions, except per shareinformation):
Years ended December 31,
2009 2008 2007
Income (Numerator):Net income for basic and diluted EPS . . . . . . . . . . . . . . . . . . . . . . . . . . . . . . . . . . . . $4,605 $4,052 $3,078
Shares (Denominator):Weighted-average shares for basic EPS . . . . . . . . . . . . . . . . . . . . . . . . . . . . . . . . . . . 1,016 1,070 1,117Effect of dilutive securities . . . . . . . . . . . . . . . . . . . . . . . . . . . . . . . . . . . . . . . . . . . . 5 5 6
Weighted-average shares for diluted EPS . . . . . . . . . . . . . . . . . . . . . . . . . . . . . . . . . 1,021 1,075 1,123
Basic EPS . . . . . . . . . . . . . . . . . . . . . . . . . . . . . . . . . . . . . . . . . . . . . . . . . . . . . . . . . . . . $ 4.53 $ 3.79 $ 2.76Diluted EPS . . . . . . . . . . . . . . . . . . . . . . . . . . . . . . . . . . . . . . . . . . . . . . . . . . . . . . . . . . $ 4.51 $ 3.77 $ 2.74
F-21
AMGEN INC.
NOTES TO CONSOLIDATED FINANCIAL STATEMENTS (Continued)
For the years ended December 31, 2009, 2008 and 2007, there were employee stock options, calculated on aweighted average basis, to purchase 42 million, 45 million and 48 million shares of our common stock, re-spectively, with exercise prices greater than the average market prices of our common stock for these periods thatare not included in the computation of diluted EPS as their impact would have been anti-dilutive. In addition,shares of our common stock, which may be issued upon conversion of our convertible debt or upon exercise ofour warrants, are not included in any of the periods presented above as their impact on diluted EPS would alsohave been anti-dilutive.
7. Collaborative arrangements
From time to time, we enter into collaborative arrangements for the R&D, manufacture and/or commerciali-zation of products and product candidates. These collaborations generally provide for non-refundable, upfrontlicense fees, R&D and commercial performance milestone payments, cost sharing, royalty payments and/or profitsharing. Our collaboration agreements with third parties are performed on a “best efforts” basis with no guaran-tee of either technological or commercial success. Each collaboration is unique in nature and our significantarrangements are discussed below except for our arrangements with KA, which are discussed in Note 8, “Relatedparty transactions.”
Pfizer Inc. (formerly Wyeth)
Amgen and Pfizer are in a collaboration agreement to co-promote ENBREL in the United States and Cana-da. The rights to market ENBREL outside of the United States and Canada are reserved to Pfizer. Under theagreement, a management committee comprised of equal representation from Amgen and Pfizer is responsiblefor overseeing the marketing and sales of ENBREL, including strategic planning, the approval of an annual mar-keting plan and product pricing. Pfizer and Amgen share in the agreed upon selling and marketing expensesapproved by the joint management committee. In addition, we pay Pfizer a percentage of the annual gross profitson our ENBREL sales in the United States and Canada attributable to all approved indications for ENBREL on ascale that increases as gross profits increase, however, we maintain a majority share of ENBREL profits.
We have determined that we are the principal participant in the collaboration with Pfizer to market EN-BREL in the United States and Canada. Accordingly, we record our product sales of ENBREL to third parties netof estimated returns, rebates and other deductions. For the years ended December 31, 2009, 2008 and 2007, EN-BREL sales aggregated $3.5 billion, $3.6 billion and $3.2 billion, respectively. During the years endedDecember 31, 2009, 2008 and 2007, the Pfizer profit share expense was $1,163 million, $1,195 million and $984million, respectively, and is included in “Selling, general and administrative” expense in the Consolidated State-ments of Income. The Pfizer profit share expense for 2007 excludes recoveries of certain expenses recorded aspart of our restructuring, as discussed in Note 9, “Restructuring.” In addition, cost recoveries from Pfizer fortheir share of the selling and marketing co-promotion expense were $75 million, $77 million and $74 million forthe years ended December 31, 2009, 2008 and 2007, respectively, and are included in “Selling, general and ad-ministrative” expense in the Consolidated Statements of Income.
GlaxoSmithKline plc
In July 2009, we entered into a collaboration agreement with GlaxoSmithKline plc (“GSK”) for the commer-cialization of our late-stage product candidate, denosumab, in Europe, Australia, New Zealand and Mexico (the“Primary Territories”) for osteoporosis indications. We will commercialize denosumab for all indications in theUnited States and Canada and for oncology indications in the Primary Territories. We have determined that weare the principal participant in the Primary Territories. Accordingly, we will record product sales to third partiesnet of estimated returns, rebates and other deductions. GSK will commercialize denosumab for all indications incountries where we do not currently have a commercial presence, including China, Brazil, India, Taiwan andSouth Korea (the “Expansion Territories”). In the Expansion Territories, GSK will be responsible for all
F-22

AMGEN INC.
NOTES TO CONSOLIDATED FINANCIAL STATEMENTS (Continued)
development and commercialization costs and will purchase denosumab from us to meet demand. We will recordproduct sales to GSK for their purchase of denosumab in the Expansion Territories. We have the option of ex-panding our role in the commercialization of denosumab in the Primary Territories and certain of the ExpansionTerritories in the future.
In the Primary Territories, we will share equally in commercialization profits and losses related to thecollaboration after accounting for expenses, including an amount payable to us in recognition of our discoveryand development of denosumab that will decline as certain sales thresholds are met. GSK will also be responsiblefor bearing a portion of the cost of certain specified development activities. During the year ended December 31,2009, we had no product sales of denosumab. During the year ended December 31, 2009, cost recoveries fromGSK were $29 million and are included in “Selling, general and administrative” expense in the ConsolidatedStatement of Income. Under this agreement, we also received an initial payment of $45 million and may receiveadditional amounts upon the achievement of certain commercial milestones. The initial payment of $45 million isbeing amortized over our estimated period of continuing involvement of approximately 13 years and is recog-nized as revenue in “Other revenue” in our Consolidated Statement of Income. As of December 31, 2009, noamounts have been recognized with respect to the commercial milestones.
Takeda Pharmaceutical Company Limited
In February 2008, we entered into a collaboration agreement with Takeda Pharmaceutical Company Limited(“Takeda”), which provides them the exclusive rights to develop and commercialize for the Japanese market upto 12 clinical stage molecules, including Vectibix® (collectively the “products”), from our pipeline across a rangeof therapeutic areas, including oncology and inflammation. Under this agreement, Amgen received an upfrontpayment of $200 million and may receive additional amounts upon the achievement of various success-baseddevelopment and regulatory approval milestones. In addition, Takeda is obligated to pay Amgen up to an addi-tional $190 million of future worldwide development costs for the products through 2012 and a reduced amountof such costs, thereafter. Takeda will be solely responsible for all development and commercialization costs ofthese products in Japan and we will receive royalties on future sales of these products in Japan. Amgen has theright to participate in the promotion of the products in Japan.
In February 2008, we also entered into a collaboration agreement with Takeda for the worldwide develop-ment and commercialization of our product candidate, motesanib, in the oncology area. Under this agreement, theparties will share responsibility for the development of motesanib outside Japan and Takeda shall be responsiblefor development in Japan. Amgen shall be responsible for commercialization of motesanib in North America andTakeda shall be responsible for commercialization outside of North America. Each party has the right to partic-ipate in the commercialization of motesanib in the other party’s territory. Under this agreement, Amgen receivedan upfront payment of $100 million and may receive additional amounts upon the achievement of varioussuccess-based regulatory approval and sales milestones. In addition, Takeda is obligated to pay 60% of futureworldwide development costs (excluding Japan, for which Takeda shall bear 100% of such costs), and the partieswill share equally all other costs and profits resulting from the commercialization of motesanib outside Japan. Ifapproved for sale, Amgen will receive royalties on future sales of motesanib in Japan.
During the years ended December 31, 2009 and 2008, cost recoveries from Takeda were $112 million and$120 million, respectively, and are included in “Research and development” expense in the Consolidated State-ments of Income. The upfront payments, aggregating $300 million, are being amortized over our estimatedperiod of continuing involvement of approximately 20 years and are recognized as revenue in “Other revenues”in our Consolidated Statements of Income, of which $15 million and $14 million were recognized for the yearsended December 31, 2009 and 2008, respectively.
F-23
AMGEN INC.
NOTES TO CONSOLIDATED FINANCIAL STATEMENTS (Continued)
Daiichi Sankyo Company, Limited
In July 2007, we entered into a collaboration and license agreement with Daiichi Sankyo Company, Limited(“Daiichi Sankyo”), which provides them the exclusive rights to develop and commercialize our late-stage prod-uct candidate, denosumab, in Japan in postmenopausal osteoporosis, oncology and certain other indications. Aspart of the agreement, Amgen received exclusive worldwide rights to certain Daiichi Sankyo intellectual propertyto the extent applicable to denosumab. Under the terms of the agreement, Daiichi Sankyo assumed all related de-velopment and commercialization costs in Japan and agreed to reimburse Amgen for certain worldwidedevelopment costs related to denosumab. As of December 31, 2009, Daiichi Sankyo has substantially satisfied itsobligations to reimburse Amgen for these costs. If approved for sale, Amgen will receive royalties on future salesof denosumab in Japan. Pursuant to the terms of the agreement, Daiichi Sankyo may receive milestone paymentsfrom Amgen aggregating $60 million dependent on various regulatory approvals of denosumab. During the yearsended December 31, 2009, 2008 and 2007, cost recoveries from Daiichi Sankyo were $64 million, $60 millionand $40 million, respectively, and are included in “Research and development” expense in the ConsolidatedStatements of Income.
Other
We have various other collaborations in addition to those discussed above including our collaborations withArray BioPharma Inc. (“Array”), Kyowa Hakko Kirin Co. Ltd (“Kyowa Hakko”) and Cytokinetics, Inc.(“Cytokinetics”), discussed below.
We entered into our collaboration agreement with Array in December 2009, which granted us exclusiveworldwide rights to Array’s small-molecule glucokinase activator program, including ARRY-403, currently be-ing tested in a phase 1 clinical trial in patients with Type 2 diabetes. In connection with entering the agreement,we paid Array $60 million which we expensed when paid.
We entered into our collaboration agreement with Kyowa Hakko in March 2008, which granted us an ex-clusive license to develop and commercialize Kyowa Hakko’s humanized monoclonal antibody KW-0761worldwide, except in Japan, Korea, China and Taiwan. KW-0761 is being studied in inflammation and oncologysettings and at the time the agreement was entered into was in a phase 1 clinical trial. In connection with enteringthe agreement, we paid Kyowa Hakko $100 million which we expensed when paid.
We entered into a collaboration agreement with Cytokinetics in December 2006, to discover, develop andcommercialize novel small-molecule therapeutics that activate cardiac muscle contractility for potential applica-tions in the treatment of heart failure. In addition, Amgen obtained an option to participate in future developmentand commercialization of Cytokinetics’ lead drug candidate arising from this program, CK-1827452, which atthe time the agreement was entered into was in phase 1 clinical trials. The collaboration is worldwide, excludingJapan. In connection with entering into the agreement, we paid Cytokinetics $42 million. In 2009, we exercisedan option under the agreement and paid Cytokinetics an additional $50 million, to assume responsibility fordevelopment and commercialization of the lead drug candidate and related compounds, subject to certain partic-ipation rights of Cytokinetics. Both payments were expensed when paid.
Pursuant to the terms of these agreements, we may also be required to pay additional amounts upon the ach-ievement of various success-based development, regulatory and commercial milestones which in the aggregateare significant. In addition, if any products related to these collaborations are approved for sale, we would be re-quired to pay royalties on future sales. The payment of these amounts, however, is contingent upon theoccurrence of various future events. Given their nature, these payments are not considered probable as the occur-rence of the related events has a high degree of uncertainty and many of the events may never occur. Further, thetiming of any future payments is not reasonably estimable. Individually, future payment of any amounts underthese arrangements is not expected to be material in any one reporting period.
F-24
AMGEN INC.
NOTES TO CONSOLIDATED FINANCIAL STATEMENTS (Continued)
8. Related party transactions
We own a 50% interest in KA, a corporation formed in 1984 with Kirin Holdings Company, Limited(“Kirin”) for the development and commercialization of certain products based on advanced biotechnology. Weaccount for our interest in KA under the equity method and include our share of KA’s profits or losses in“Selling, general and administrative” expense in the Consolidated Statements of Income. For the years endedDecember 31, 2009, 2008 and 2007, our share of KA’s profits were $72 million, $72 million and $51 million, re-spectively. At December 31, 2009 and 2008, the carrying value of our equity method investment in KA, net ofdividends received, was $318 million and $356 million, respectively, and is included in non-current “Other as-sets” in the Consolidated Balance Sheets. The amount of dividends received were $110 million and $8 millionfor the years ended December 31, 2009 and 2008, respectively. KA’s revenues consist of royalty income relatedto its licensed technology rights. All of our rights to manufacture and market certain products includingdarbepoetin alfa, pegfilgrastim, granulocyte colony-stimulating factor (“G-CSF”), recombinant human eryth-ropoietin and romiplostim are pursuant to exclusive licenses from KA, which we currently market under thebrand names Aranesp®, Neulasta®, NEUPOGEN®, EPOGEN® and Nplate®, respectively. KA receives royaltyincome from us, as well as from Kirin, J&J and F. Hoffmann-La Roche Ltd. (“Roche”) under separate product li-cense agreements for certain geographic areas outside of the United States. During the years ended December 31,2009, 2008 and 2007, KA earned royalties from us of $327 million, $321 million and $336 million, respectively.These amounts are included in “Cost of sales (excludes amortization of certain acquired intangible assets)” in theConsolidated Statements of Income. At December 31, 2009 and 2008, we owed KA $104 million and $89 mil-lion, respectively, which are included in “Accrued liabilities” in the Consolidated Balance Sheets.
KA’s expenses primarily consist of costs related to R&D activities conducted on its behalf by Amgen andKirin. KA pays Amgen and Kirin for such services at negotiated rates. During the years ended December 31,2009, 2008 and 2007, we earned revenues from KA of $102 million, $124 million and $180 million, respectively,for certain R&D activities performed on KA’s behalf. These amounts are included in “Other revenues” in theConsolidated Statements of Income. In addition, included in “Other revenues” in the Consolidated Statements ofIncome for the year ended December 31, 2007 is $45 million received from KA with respect to achieving certainregulatory filing milestones. During the years ended December 31, 2009, 2008 and 2007, we recorded costrecoveries from KA of $96 million, $82 million and $82 million, respectively, related to certain third-party costs.These amounts are included in “Research and development” expense in the Consolidated Statements of Income.
9. Restructuring
On August 15, 2007, we announced a plan to restructure our worldwide operations in order to improve ourcost structure. This restructuring plan was primarily the result of regulatory and reimbursement developmentsthat began in 2007 involving erythropoiesis-stimulating agent (“ESA”) products, including our marketed ESAproducts Aranesp® and EPOGEN®, and the resulting impact on our operations. Key components of ourrestructuring plan initially included: (i) worldwide staff reductions, (ii) rationalization of our worldwide networkof manufacturing facilities and, to a lesser degree, changes to certain R&D capital projects and (iii) abandoningleases primarily for certain R&D facilities that will not be used in our operations. Subsequently, we identifiedcertain additional initiatives designed to further assist in improving our cost structure, including outsourcing cer-tain non-core business functions, most notably certain of our information systems’ infrastructure services, as wellas abandoning leases for certain additional facilities that will no longer be used in our operations. As of De-cember 31, 2009, we have completed all of the actions and incurred all related costs included in our restructuringplan and subsequently identified initiatives.
Through December 31, 2009, we incurred $957 million of costs related to the above-noted actions. Thecharges included $213 million of separation costs associated with approximately 3,100 staff members, $476 mil-lion of asset impairments, $148 million of accelerated depreciation and $120 million of other net charges, whichinclude $165 million of loss accruals for leases, $41 million for implementation costs associated with certain cost
F-25
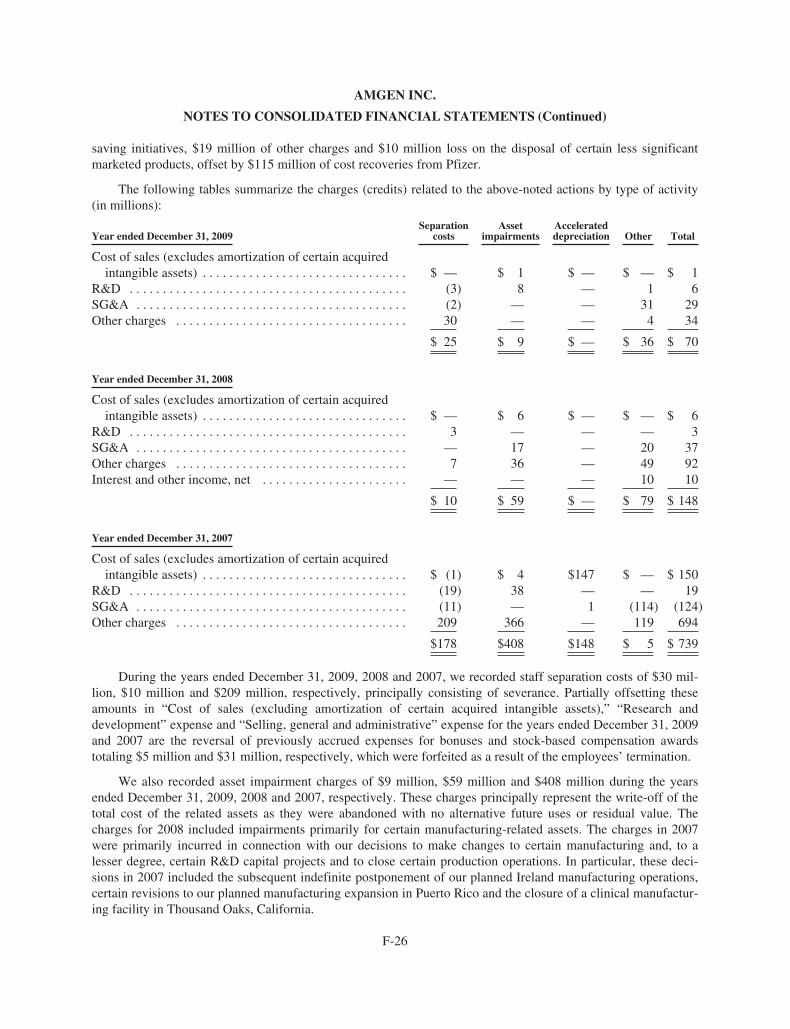
AMGEN INC.
NOTES TO CONSOLIDATED FINANCIAL STATEMENTS (Continued)
saving initiatives, $19 million of other charges and $10 million loss on the disposal of certain less significantmarketed products, offset by $115 million of cost recoveries from Pfizer.
The following tables summarize the charges (credits) related to the above-noted actions by type of activity(in millions):
Year ended December 31, 2009Separation
costsAsset
impairmentsAccelerateddepreciation Other Total
Cost of sales (excludes amortization of certain acquiredintangible assets) . . . . . . . . . . . . . . . . . . . . . . . . . . . . . . . $ — $ 1 $ — $ — $ 1
R&D . . . . . . . . . . . . . . . . . . . . . . . . . . . . . . . . . . . . . . . . . . (3) 8 — 1 6SG&A . . . . . . . . . . . . . . . . . . . . . . . . . . . . . . . . . . . . . . . . . (2) — — 31 29Other charges . . . . . . . . . . . . . . . . . . . . . . . . . . . . . . . . . . . 30 — — 4 34
$ 25 $ 9 $ — $ 36 $ 70
Year ended December 31, 2008
Cost of sales (excludes amortization of certain acquiredintangible assets) . . . . . . . . . . . . . . . . . . . . . . . . . . . . . . . $ — $ 6 $ — $ — $ 6
R&D . . . . . . . . . . . . . . . . . . . . . . . . . . . . . . . . . . . . . . . . . . 3 — — — 3SG&A . . . . . . . . . . . . . . . . . . . . . . . . . . . . . . . . . . . . . . . . . — 17 — 20 37Other charges . . . . . . . . . . . . . . . . . . . . . . . . . . . . . . . . . . . 7 36 — 49 92Interest and other income, net . . . . . . . . . . . . . . . . . . . . . . — — — 10 10
$ 10 $ 59 $ — $ 79 $ 148
Year ended December 31, 2007
Cost of sales (excludes amortization of certain acquiredintangible assets) . . . . . . . . . . . . . . . . . . . . . . . . . . . . . . . $ (1) $ 4 $147 $ — $ 150
R&D . . . . . . . . . . . . . . . . . . . . . . . . . . . . . . . . . . . . . . . . . . (19) 38 — — 19SG&A . . . . . . . . . . . . . . . . . . . . . . . . . . . . . . . . . . . . . . . . . (11) — 1 (114) (124)Other charges . . . . . . . . . . . . . . . . . . . . . . . . . . . . . . . . . . . 209 366 — 119 694
$178 $408 $148 $ 5 $ 739
During the years ended December 31, 2009, 2008 and 2007, we recorded staff separation costs of $30 mil-lion, $10 million and $209 million, respectively, principally consisting of severance. Partially offsetting theseamounts in “Cost of sales (excluding amortization of certain acquired intangible assets),” “Research anddevelopment” expense and “Selling, general and administrative” expense for the years ended December 31, 2009and 2007 are the reversal of previously accrued expenses for bonuses and stock-based compensation awardstotaling $5 million and $31 million, respectively, which were forfeited as a result of the employees’ termination.
We also recorded asset impairment charges of $9 million, $59 million and $408 million during the yearsended December 31, 2009, 2008 and 2007, respectively. These charges principally represent the write-off of thetotal cost of the related assets as they were abandoned with no alternative future uses or residual value. Thecharges for 2008 included impairments primarily for certain manufacturing-related assets. The charges in 2007were primarily incurred in connection with our decisions to make changes to certain manufacturing and, to alesser degree, certain R&D capital projects and to close certain production operations. In particular, these deci-sions in 2007 included the subsequent indefinite postponement of our planned Ireland manufacturing operations,certain revisions to our planned manufacturing expansion in Puerto Rico and the closure of a clinical manufactur-ing facility in Thousand Oaks, California.
F-26
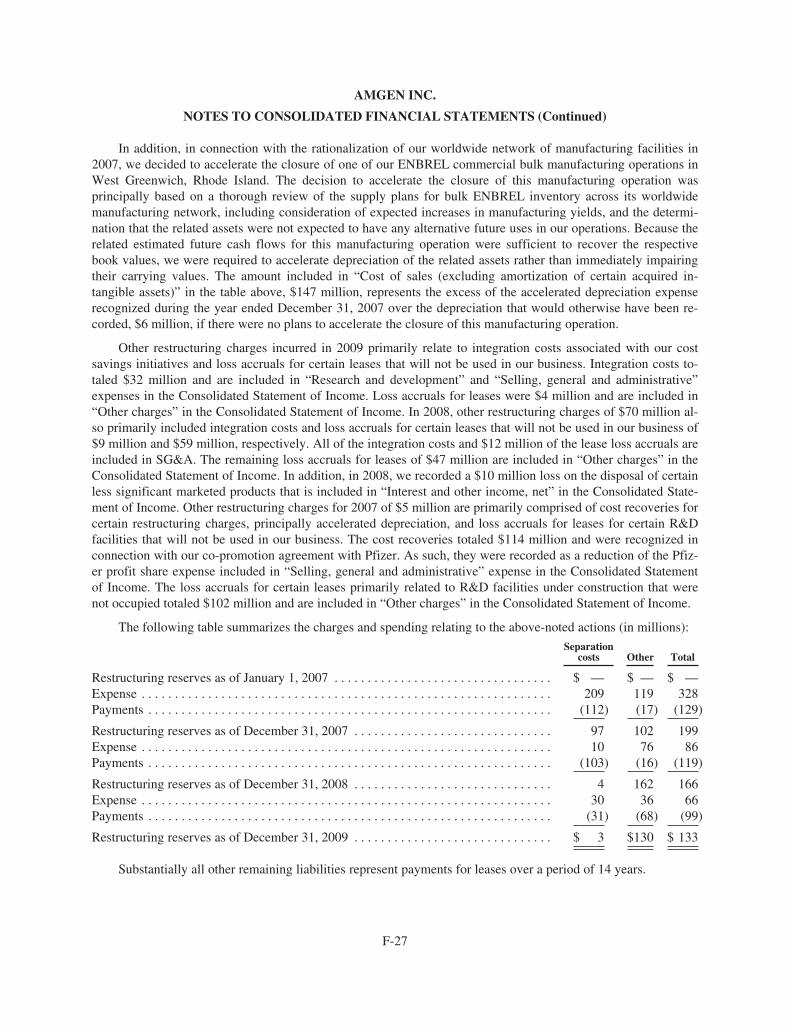
AMGEN INC.
NOTES TO CONSOLIDATED FINANCIAL STATEMENTS (Continued)
In addition, in connection with the rationalization of our worldwide network of manufacturing facilities in2007, we decided to accelerate the closure of one of our ENBREL commercial bulk manufacturing operations inWest Greenwich, Rhode Island. The decision to accelerate the closure of this manufacturing operation wasprincipally based on a thorough review of the supply plans for bulk ENBREL inventory across its worldwidemanufacturing network, including consideration of expected increases in manufacturing yields, and the determi-nation that the related assets were not expected to have any alternative future uses in our operations. Because therelated estimated future cash flows for this manufacturing operation were sufficient to recover the respectivebook values, we were required to accelerate depreciation of the related assets rather than immediately impairingtheir carrying values. The amount included in “Cost of sales (excluding amortization of certain acquired in-tangible assets)” in the table above, $147 million, represents the excess of the accelerated depreciation expenserecognized during the year ended December 31, 2007 over the depreciation that would otherwise have been re-corded, $6 million, if there were no plans to accelerate the closure of this manufacturing operation.
Other restructuring charges incurred in 2009 primarily relate to integration costs associated with our costsavings initiatives and loss accruals for certain leases that will not be used in our business. Integration costs to-taled $32 million and are included in “Research and development” and “Selling, general and administrative”expenses in the Consolidated Statement of Income. Loss accruals for leases were $4 million and are included in“Other charges” in the Consolidated Statement of Income. In 2008, other restructuring charges of $70 million al-so primarily included integration costs and loss accruals for certain leases that will not be used in our business of$9 million and $59 million, respectively. All of the integration costs and $12 million of the lease loss accruals areincluded in SG&A. The remaining loss accruals for leases of $47 million are included in “Other charges” in theConsolidated Statement of Income. In addition, in 2008, we recorded a $10 million loss on the disposal of certainless significant marketed products that is included in “Interest and other income, net” in the Consolidated State-ment of Income. Other restructuring charges for 2007 of $5 million are primarily comprised of cost recoveries forcertain restructuring charges, principally accelerated depreciation, and loss accruals for leases for certain R&Dfacilities that will not be used in our business. The cost recoveries totaled $114 million and were recognized inconnection with our co-promotion agreement with Pfizer. As such, they were recorded as a reduction of the Pfiz-er profit share expense included in “Selling, general and administrative” expense in the Consolidated Statementof Income. The loss accruals for certain leases primarily related to R&D facilities under construction that werenot occupied totaled $102 million and are included in “Other charges” in the Consolidated Statement of Income.
The following table summarizes the charges and spending relating to the above-noted actions (in millions):
Separationcosts Other Total
Restructuring reserves as of January 1, 2007 . . . . . . . . . . . . . . . . . . . . . . . . . . . . . . . . . $ — $ — $ —Expense . . . . . . . . . . . . . . . . . . . . . . . . . . . . . . . . . . . . . . . . . . . . . . . . . . . . . . . . . . . . . . 209 119 328Payments . . . . . . . . . . . . . . . . . . . . . . . . . . . . . . . . . . . . . . . . . . . . . . . . . . . . . . . . . . . . . (112) (17) (129)
Restructuring reserves as of December 31, 2007 . . . . . . . . . . . . . . . . . . . . . . . . . . . . . . 97 102 199Expense . . . . . . . . . . . . . . . . . . . . . . . . . . . . . . . . . . . . . . . . . . . . . . . . . . . . . . . . . . . . . . 10 76 86Payments . . . . . . . . . . . . . . . . . . . . . . . . . . . . . . . . . . . . . . . . . . . . . . . . . . . . . . . . . . . . . (103) (16) (119)
Restructuring reserves as of December 31, 2008 . . . . . . . . . . . . . . . . . . . . . . . . . . . . . . 4 162 166Expense . . . . . . . . . . . . . . . . . . . . . . . . . . . . . . . . . . . . . . . . . . . . . . . . . . . . . . . . . . . . . . 30 36 66Payments . . . . . . . . . . . . . . . . . . . . . . . . . . . . . . . . . . . . . . . . . . . . . . . . . . . . . . . . . . . . . (31) (68) (99)
Restructuring reserves as of December 31, 2009 . . . . . . . . . . . . . . . . . . . . . . . . . . . . . . $ 3 $130 $ 133
Substantially all other remaining liabilities represent payments for leases over a period of 14 years.
F-27
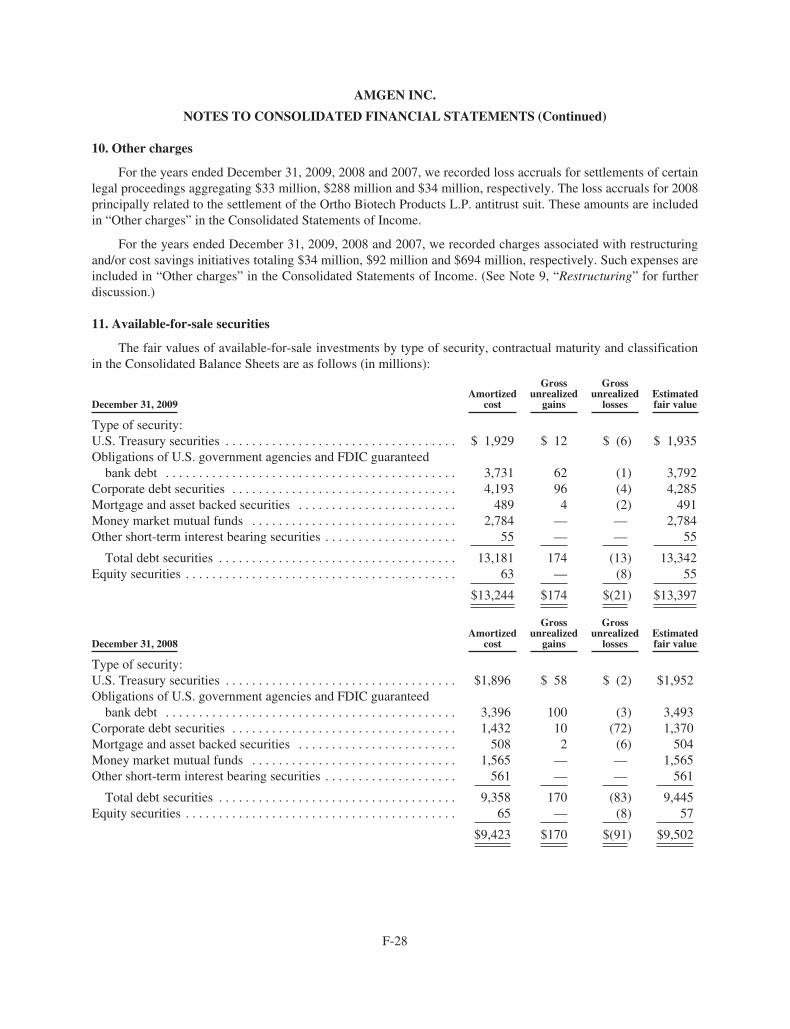
AMGEN INC.
NOTES TO CONSOLIDATED FINANCIAL STATEMENTS (Continued)
10. Other charges
For the years ended December 31, 2009, 2008 and 2007, we recorded loss accruals for settlements of certainlegal proceedings aggregating $33 million, $288 million and $34 million, respectively. The loss accruals for 2008principally related to the settlement of the Ortho Biotech Products L.P. antitrust suit. These amounts are includedin “Other charges” in the Consolidated Statements of Income.
For the years ended December 31, 2009, 2008 and 2007, we recorded charges associated with restructuringand/or cost savings initiatives totaling $34 million, $92 million and $694 million, respectively. Such expenses areincluded in “Other charges” in the Consolidated Statements of Income. (See Note 9, “Restructuring” for furtherdiscussion.)
11. Available-for-sale securities
The fair values of available-for-sale investments by type of security, contractual maturity and classificationin the Consolidated Balance Sheets are as follows (in millions):
December 31, 2009Amortized
cost
Grossunrealized
gains
Grossunrealized
lossesEstimatedfair value
Type of security:U.S. Treasury securities . . . . . . . . . . . . . . . . . . . . . . . . . . . . . . . . . . . $ 1,929 $ 12 $ (6) $ 1,935Obligations of U.S. government agencies and FDIC guaranteed
bank debt . . . . . . . . . . . . . . . . . . . . . . . . . . . . . . . . . . . . . . . . . . . . 3,731 62 (1) 3,792Corporate debt securities . . . . . . . . . . . . . . . . . . . . . . . . . . . . . . . . . . 4,193 96 (4) 4,285Mortgage and asset backed securities . . . . . . . . . . . . . . . . . . . . . . . . 489 4 (2) 491Money market mutual funds . . . . . . . . . . . . . . . . . . . . . . . . . . . . . . . 2,784 — — 2,784Other short-term interest bearing securities . . . . . . . . . . . . . . . . . . . . 55 — — 55
Total debt securities . . . . . . . . . . . . . . . . . . . . . . . . . . . . . . . . . . . . 13,181 174 (13) 13,342Equity securities . . . . . . . . . . . . . . . . . . . . . . . . . . . . . . . . . . . . . . . . . 63 — (8) 55
$13,244 $174 $(21) $13,397
December 31, 2008Amortized
cost
Grossunrealized
gains
Grossunrealized
lossesEstimatedfair value
Type of security:U.S. Treasury securities . . . . . . . . . . . . . . . . . . . . . . . . . . . . . . . . . . . $1,896 $ 58 $ (2) $1,952Obligations of U.S. government agencies and FDIC guaranteed
bank debt . . . . . . . . . . . . . . . . . . . . . . . . . . . . . . . . . . . . . . . . . . . . 3,396 100 (3) 3,493Corporate debt securities . . . . . . . . . . . . . . . . . . . . . . . . . . . . . . . . . . 1,432 10 (72) 1,370Mortgage and asset backed securities . . . . . . . . . . . . . . . . . . . . . . . . 508 2 (6) 504Money market mutual funds . . . . . . . . . . . . . . . . . . . . . . . . . . . . . . . 1,565 — — 1,565Other short-term interest bearing securities . . . . . . . . . . . . . . . . . . . . 561 — — 561
Total debt securities . . . . . . . . . . . . . . . . . . . . . . . . . . . . . . . . . . . . 9,358 170 (83) 9,445Equity securities . . . . . . . . . . . . . . . . . . . . . . . . . . . . . . . . . . . . . . . . . 65 — (8) 57
$9,423 $170 $(91) $9,502
F-28
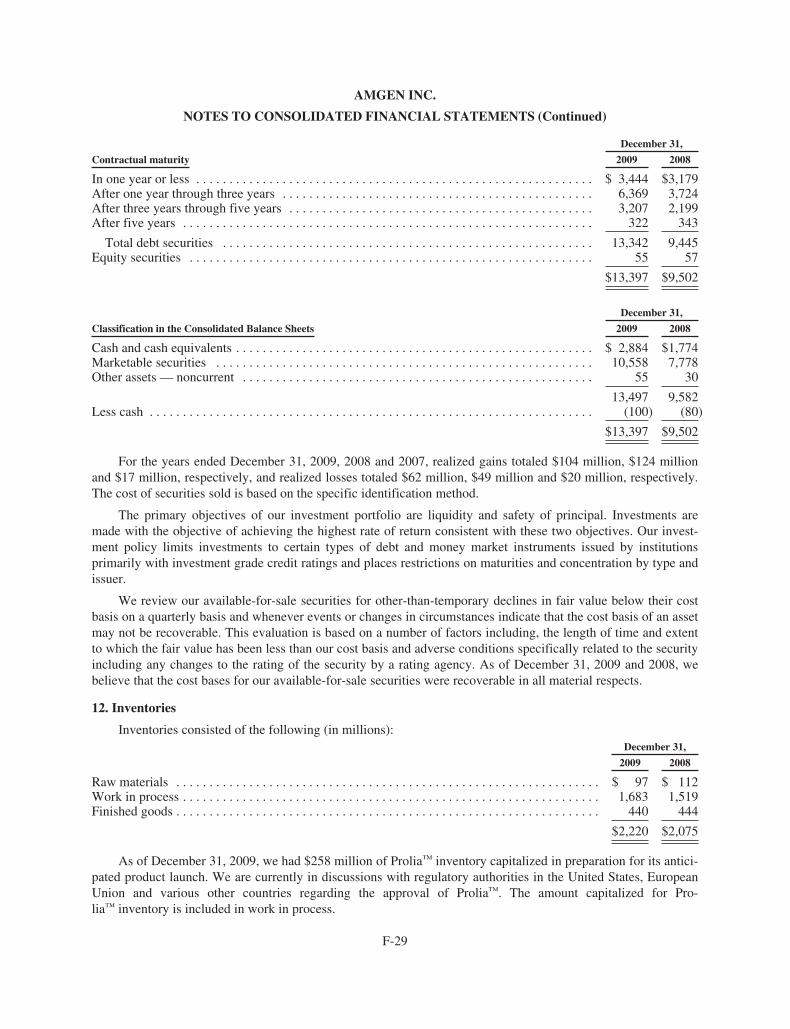
AMGEN INC.
NOTES TO CONSOLIDATED FINANCIAL STATEMENTS (Continued)
December 31,
Contractual maturity 2009 2008
In one year or less . . . . . . . . . . . . . . . . . . . . . . . . . . . . . . . . . . . . . . . . . . . . . . . . . . . . . . . . . . . . $ 3,444 $3,179After one year through three years . . . . . . . . . . . . . . . . . . . . . . . . . . . . . . . . . . . . . . . . . . . . . . . 6,369 3,724After three years through five years . . . . . . . . . . . . . . . . . . . . . . . . . . . . . . . . . . . . . . . . . . . . . . 3,207 2,199After five years . . . . . . . . . . . . . . . . . . . . . . . . . . . . . . . . . . . . . . . . . . . . . . . . . . . . . . . . . . . . . . 322 343
Total debt securities . . . . . . . . . . . . . . . . . . . . . . . . . . . . . . . . . . . . . . . . . . . . . . . . . . . . . . . . 13,342 9,445Equity securities . . . . . . . . . . . . . . . . . . . . . . . . . . . . . . . . . . . . . . . . . . . . . . . . . . . . . . . . . . . . . 55 57
$13,397 $9,502
December 31,
Classification in the Consolidated Balance Sheets 2009 2008
Cash and cash equivalents . . . . . . . . . . . . . . . . . . . . . . . . . . . . . . . . . . . . . . . . . . . . . . . . . . . . . . $ 2,884 $1,774Marketable securities . . . . . . . . . . . . . . . . . . . . . . . . . . . . . . . . . . . . . . . . . . . . . . . . . . . . . . . . . 10,558 7,778Other assets — noncurrent . . . . . . . . . . . . . . . . . . . . . . . . . . . . . . . . . . . . . . . . . . . . . . . . . . . . . 55 30
13,497 9,582Less cash . . . . . . . . . . . . . . . . . . . . . . . . . . . . . . . . . . . . . . . . . . . . . . . . . . . . . . . . . . . . . . . . . . . (100) (80)
$13,397 $9,502
For the years ended December 31, 2009, 2008 and 2007, realized gains totaled $104 million, $124 millionand $17 million, respectively, and realized losses totaled $62 million, $49 million and $20 million, respectively.The cost of securities sold is based on the specific identification method.
The primary objectives of our investment portfolio are liquidity and safety of principal. Investments aremade with the objective of achieving the highest rate of return consistent with these two objectives. Our invest-ment policy limits investments to certain types of debt and money market instruments issued by institutionsprimarily with investment grade credit ratings and places restrictions on maturities and concentration by type andissuer.
We review our available-for-sale securities for other-than-temporary declines in fair value below their costbasis on a quarterly basis and whenever events or changes in circumstances indicate that the cost basis of an assetmay not be recoverable. This evaluation is based on a number of factors including, the length of time and extentto which the fair value has been less than our cost basis and adverse conditions specifically related to the securityincluding any changes to the rating of the security by a rating agency. As of December 31, 2009 and 2008, webelieve that the cost bases for our available-for-sale securities were recoverable in all material respects.
12. Inventories
Inventories consisted of the following (in millions):December 31,
2009 2008
Raw materials . . . . . . . . . . . . . . . . . . . . . . . . . . . . . . . . . . . . . . . . . . . . . . . . . . . . . . . . . . . . . . . . $ 97 $ 112Work in process . . . . . . . . . . . . . . . . . . . . . . . . . . . . . . . . . . . . . . . . . . . . . . . . . . . . . . . . . . . . . . . 1,683 1,519Finished goods . . . . . . . . . . . . . . . . . . . . . . . . . . . . . . . . . . . . . . . . . . . . . . . . . . . . . . . . . . . . . . . . 440 444
$2,220 $2,075
As of December 31, 2009, we had $258 million of Prolia™ inventory capitalized in preparation for its antici-pated product launch. We are currently in discussions with regulatory authorities in the United States, EuropeanUnion and various other countries regarding the approval of Prolia™. The amount capitalized for Pro-lia™ inventory is included in work in process.
F-29
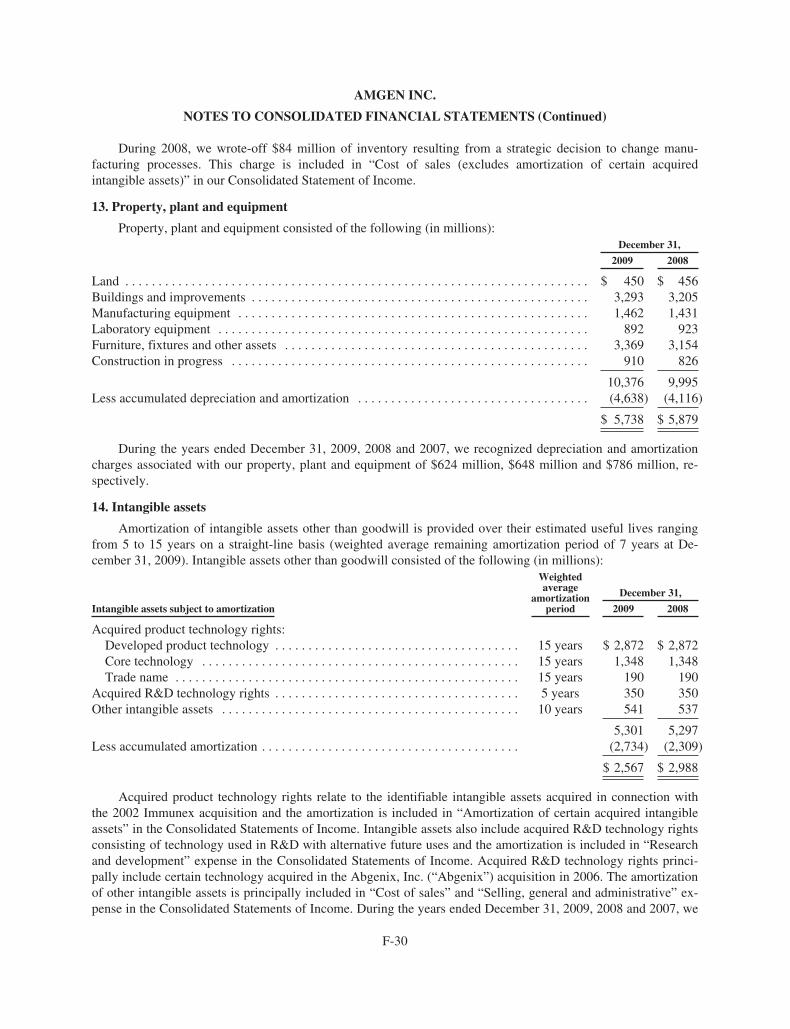
AMGEN INC.
NOTES TO CONSOLIDATED FINANCIAL STATEMENTS (Continued)
During 2008, we wrote-off $84 million of inventory resulting from a strategic decision to change manu-facturing processes. This charge is included in “Cost of sales (excludes amortization of certain acquiredintangible assets)” in our Consolidated Statement of Income.
13. Property, plant and equipment
Property, plant and equipment consisted of the following (in millions):December 31,
2009 2008
Land . . . . . . . . . . . . . . . . . . . . . . . . . . . . . . . . . . . . . . . . . . . . . . . . . . . . . . . . . . . . . . . . . . . . . . $ 450 $ 456Buildings and improvements . . . . . . . . . . . . . . . . . . . . . . . . . . . . . . . . . . . . . . . . . . . . . . . . . . . 3,293 3,205Manufacturing equipment . . . . . . . . . . . . . . . . . . . . . . . . . . . . . . . . . . . . . . . . . . . . . . . . . . . . . 1,462 1,431Laboratory equipment . . . . . . . . . . . . . . . . . . . . . . . . . . . . . . . . . . . . . . . . . . . . . . . . . . . . . . . . 892 923Furniture, fixtures and other assets . . . . . . . . . . . . . . . . . . . . . . . . . . . . . . . . . . . . . . . . . . . . . . 3,369 3,154Construction in progress . . . . . . . . . . . . . . . . . . . . . . . . . . . . . . . . . . . . . . . . . . . . . . . . . . . . . . 910 826
10,376 9,995Less accumulated depreciation and amortization . . . . . . . . . . . . . . . . . . . . . . . . . . . . . . . . . . . (4,638) (4,116)
$ 5,738 $ 5,879
During the years ended December 31, 2009, 2008 and 2007, we recognized depreciation and amortizationcharges associated with our property, plant and equipment of $624 million, $648 million and $786 million, re-spectively.
14. Intangible assets
Amortization of intangible assets other than goodwill is provided over their estimated useful lives rangingfrom 5 to 15 years on a straight-line basis (weighted average remaining amortization period of 7 years at De-cember 31, 2009). Intangible assets other than goodwill consisted of the following (in millions):
Intangible assets subject to amortization
Weightedaverage
amortizationperiod
December 31,
2009 2008
Acquired product technology rights:Developed product technology . . . . . . . . . . . . . . . . . . . . . . . . . . . . . . . . . . . . . 15 years $ 2,872 $ 2,872Core technology . . . . . . . . . . . . . . . . . . . . . . . . . . . . . . . . . . . . . . . . . . . . . . . . 15 years 1,348 1,348Trade name . . . . . . . . . . . . . . . . . . . . . . . . . . . . . . . . . . . . . . . . . . . . . . . . . . . . 15 years 190 190
Acquired R&D technology rights . . . . . . . . . . . . . . . . . . . . . . . . . . . . . . . . . . . . . 5 years 350 350Other intangible assets . . . . . . . . . . . . . . . . . . . . . . . . . . . . . . . . . . . . . . . . . . . . . 10 years 541 537
5,301 5,297Less accumulated amortization . . . . . . . . . . . . . . . . . . . . . . . . . . . . . . . . . . . . . . . (2,734) (2,309)
$ 2,567 $ 2,988
Acquired product technology rights relate to the identifiable intangible assets acquired in connection withthe 2002 Immunex acquisition and the amortization is included in “Amortization of certain acquired intangibleassets” in the Consolidated Statements of Income. Intangible assets also include acquired R&D technology rightsconsisting of technology used in R&D with alternative future uses and the amortization is included in “Researchand development” expense in the Consolidated Statements of Income. Acquired R&D technology rights princi-pally include certain technology acquired in the Abgenix, Inc. (“Abgenix”) acquisition in 2006. The amortizationof other intangible assets is principally included in “Cost of sales” and “Selling, general and administrative” ex-pense in the Consolidated Statements of Income. During the years ended December 31, 2009, 2008 and 2007, we
F-30
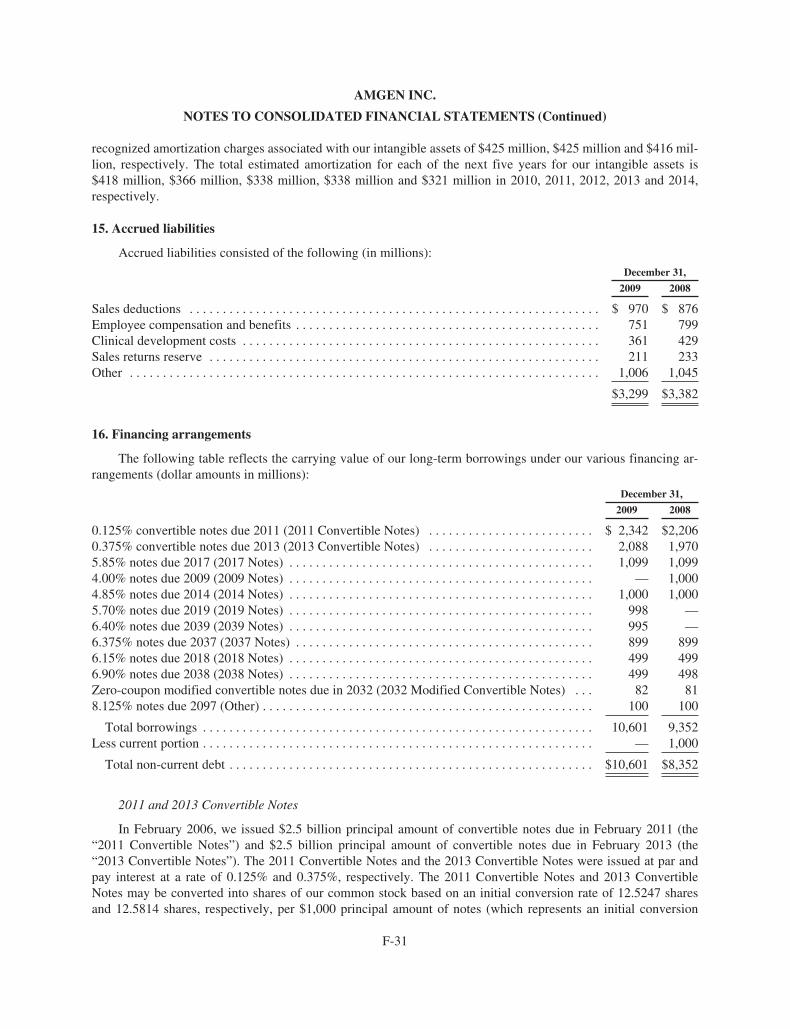
AMGEN INC.
NOTES TO CONSOLIDATED FINANCIAL STATEMENTS (Continued)
recognized amortization charges associated with our intangible assets of $425 million, $425 million and $416 mil-lion, respectively. The total estimated amortization for each of the next five years for our intangible assets is$418 million, $366 million, $338 million, $338 million and $321 million in 2010, 2011, 2012, 2013 and 2014,respectively.
15. Accrued liabilities
Accrued liabilities consisted of the following (in millions):
December 31,
2009 2008
Sales deductions . . . . . . . . . . . . . . . . . . . . . . . . . . . . . . . . . . . . . . . . . . . . . . . . . . . . . . . . . . . . . . $ 970 $ 876Employee compensation and benefits . . . . . . . . . . . . . . . . . . . . . . . . . . . . . . . . . . . . . . . . . . . . . . 751 799Clinical development costs . . . . . . . . . . . . . . . . . . . . . . . . . . . . . . . . . . . . . . . . . . . . . . . . . . . . . . 361 429Sales returns reserve . . . . . . . . . . . . . . . . . . . . . . . . . . . . . . . . . . . . . . . . . . . . . . . . . . . . . . . . . . . 211 233Other . . . . . . . . . . . . . . . . . . . . . . . . . . . . . . . . . . . . . . . . . . . . . . . . . . . . . . . . . . . . . . . . . . . . . . . 1,006 1,045
$3,299 $3,382
16. Financing arrangements
The following table reflects the carrying value of our long-term borrowings under our various financing ar-rangements (dollar amounts in millions):
December 31,
2009 2008
0.125% convertible notes due 2011 (2011 Convertible Notes) . . . . . . . . . . . . . . . . . . . . . . . . . $ 2,342 $2,2060.375% convertible notes due 2013 (2013 Convertible Notes) . . . . . . . . . . . . . . . . . . . . . . . . . 2,088 1,9705.85% notes due 2017 (2017 Notes) . . . . . . . . . . . . . . . . . . . . . . . . . . . . . . . . . . . . . . . . . . . . . . 1,099 1,0994.00% notes due 2009 (2009 Notes) . . . . . . . . . . . . . . . . . . . . . . . . . . . . . . . . . . . . . . . . . . . . . . — 1,0004.85% notes due 2014 (2014 Notes) . . . . . . . . . . . . . . . . . . . . . . . . . . . . . . . . . . . . . . . . . . . . . . 1,000 1,0005.70% notes due 2019 (2019 Notes) . . . . . . . . . . . . . . . . . . . . . . . . . . . . . . . . . . . . . . . . . . . . . . 998 —6.40% notes due 2039 (2039 Notes) . . . . . . . . . . . . . . . . . . . . . . . . . . . . . . . . . . . . . . . . . . . . . . 995 —6.375% notes due 2037 (2037 Notes) . . . . . . . . . . . . . . . . . . . . . . . . . . . . . . . . . . . . . . . . . . . . . 899 8996.15% notes due 2018 (2018 Notes) . . . . . . . . . . . . . . . . . . . . . . . . . . . . . . . . . . . . . . . . . . . . . . 499 4996.90% notes due 2038 (2038 Notes) . . . . . . . . . . . . . . . . . . . . . . . . . . . . . . . . . . . . . . . . . . . . . . 499 498Zero-coupon modified convertible notes due in 2032 (2032 Modified Convertible Notes) . . . 82 818.125% notes due 2097 (Other) . . . . . . . . . . . . . . . . . . . . . . . . . . . . . . . . . . . . . . . . . . . . . . . . . . 100 100
Total borrowings . . . . . . . . . . . . . . . . . . . . . . . . . . . . . . . . . . . . . . . . . . . . . . . . . . . . . . . . . . . 10,601 9,352Less current portion . . . . . . . . . . . . . . . . . . . . . . . . . . . . . . . . . . . . . . . . . . . . . . . . . . . . . . . . . . . — 1,000
Total non-current debt . . . . . . . . . . . . . . . . . . . . . . . . . . . . . . . . . . . . . . . . . . . . . . . . . . . . . . . $10,601 $8,352
2011 and 2013 Convertible Notes
In February 2006, we issued $2.5 billion principal amount of convertible notes due in February 2011 (the“2011 Convertible Notes”) and $2.5 billion principal amount of convertible notes due in February 2013 (the“2013 Convertible Notes”). The 2011 Convertible Notes and the 2013 Convertible Notes were issued at par andpay interest at a rate of 0.125% and 0.375%, respectively. The 2011 Convertible Notes and 2013 ConvertibleNotes may be converted into shares of our common stock based on an initial conversion rate of 12.5247 sharesand 12.5814 shares, respectively, per $1,000 principal amount of notes (which represents an initial conversion
F-31
AMGEN INC.
NOTES TO CONSOLIDATED FINANCIAL STATEMENTS (Continued)
price of approximately $79.84 and $79.48 per share, respectively). These conversion rates will be adjusted if wemake specified types of distributions or enter into certain other transactions with respect to our common stock.The 2011 Convertible Notes and 2013 Convertible Notes may only be converted: (i) during any calendar quarterif the closing price of our common stock exceeds 130% of the respective conversion price per share during a de-fined period at the end of the previous quarter, (ii) if we make specified distributions to holders of our commonstock or specified corporate transactions occur or (iii) one month prior to the respective maturity date. Upon con-version, a holder would receive the conversion value equal to the conversion rate multiplied by the volumeweighted average price of our common stock during a specified period following the conversion date. The con-version value will be paid in: (i) cash equal to the lesser of the principal amount of the note or the conversionvalue, as defined, and (ii) to the extent the conversion value exceeds the principal amount of the note, shares ofour common stock, cash or a combination of common stock and cash, at our option (the “excess conversionvalue”). As of December 31, 2009, these notes were not convertible. In addition, upon a change in control, as de-fined, the holders may require us to purchase for cash all or a portion of their notes for 100% of the principalamount of the notes plus accrued interest.
Concurrent with the issuance of the 2011 Convertible Notes and 2013 Convertible Notes, we purchased con-vertible note hedges. The convertible note hedges allow us to receive shares of our common stock and/or cashfrom the counterparties to the transactions equal to the amounts of common stock and/or cash related to the ex-cess conversion value that we would issue and/or pay to the holders of the 2011 Convertible Notes and 2013Convertible Notes upon conversion. These transactions will terminate at the earlier of the maturity dates of therelated notes or the first day none of the related notes remain outstanding due to conversion or otherwise. Thecost of the convertible note hedges aggregated approximately $1.5 billion.
Also concurrent with the issuance of the 2011 Convertible Notes and 2013 Convertible Notes, we sold war-rants to acquire shares of our common stock at an exercise price of $107.90 per share. Pursuant to thesetransactions, warrants for approximately 31.3 million shares of our common stock may be settled in May 2011and warrants for approximately 31.5 million shares of our common stock may be settled in May 2013 (the“settlement dates”). If the average price of our common stock during a defined period ending on or about the re-spective settlement dates exceeds the exercise price of the warrants, the warrants will be net settled, at our option,in cash or shares of our common stock. Proceeds received from the issuance of the warrants totaled approx-imately $774 million.
Because we have the choice of settling the convertible note hedges and warrants in cash or shares of ourcommon stock, and these contracts meet all of the applicable criteria for equity classification under the applicableaccounting standards, the cost of the convertible note hedges and net proceeds from the sale of the warrants areclassified in “Stockholders’ equity” in the Consolidated Balance Sheets. In addition, because both of these con-tracts are classified in “Stockholders’ equity” and are indexed to our common stock, they are not accounted for asderivatives.
Effective January 1, 2009, we adopted a new accounting standard that changed the method of accounting forcertain types of convertible debt and, as required by this new standard, we retrospectively applied this change inaccounting to all prior periods for which we had applicable outstanding convertible debt (see Note 2, “Change inmethod of accounting for convertible debt instruments”). Under this method of accounting, the debt and equitycomponents of our convertible notes are bifurcated and accounted for separately. The equity components of ourconvertible notes, including our 2011 Convertible Notes, 2013 Convertible Notes and 2032 Modified ConvertibleNotes (discussed below), are included in “Common stock and additional paid-in capital” in the ConsolidatedBalance Sheets, with a corresponding reduction in the carrying values of these convertible notes as of the date ofissuance or modification, as applicable. The reduced carrying values of our convertible notes are being accretedback to their principal amounts through the recognition of non-cash interest expense. This results in recognizinginterest expense on these borrowings at effective rates approximating what we would have incurred had we is-sued nonconvertible debt with otherwise similar terms.
F-32
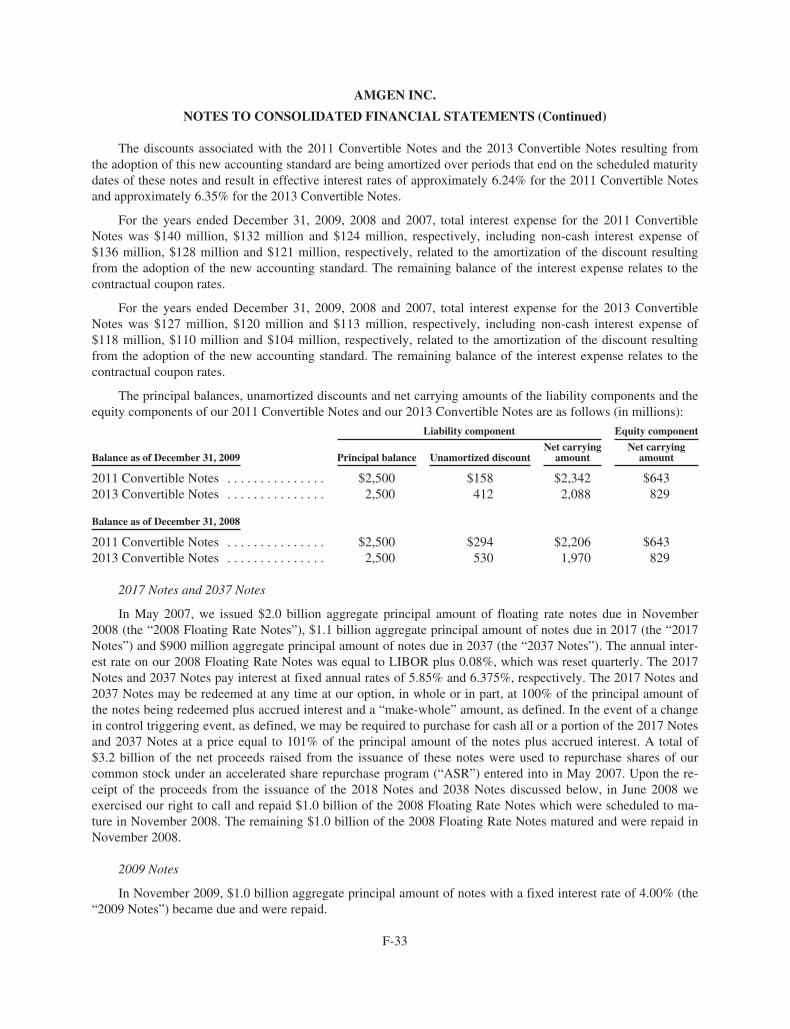
AMGEN INC.
NOTES TO CONSOLIDATED FINANCIAL STATEMENTS (Continued)
The discounts associated with the 2011 Convertible Notes and the 2013 Convertible Notes resulting fromthe adoption of this new accounting standard are being amortized over periods that end on the scheduled maturitydates of these notes and result in effective interest rates of approximately 6.24% for the 2011 Convertible Notesand approximately 6.35% for the 2013 Convertible Notes.
For the years ended December 31, 2009, 2008 and 2007, total interest expense for the 2011 ConvertibleNotes was $140 million, $132 million and $124 million, respectively, including non-cash interest expense of$136 million, $128 million and $121 million, respectively, related to the amortization of the discount resultingfrom the adoption of the new accounting standard. The remaining balance of the interest expense relates to thecontractual coupon rates.
For the years ended December 31, 2009, 2008 and 2007, total interest expense for the 2013 ConvertibleNotes was $127 million, $120 million and $113 million, respectively, including non-cash interest expense of$118 million, $110 million and $104 million, respectively, related to the amortization of the discount resultingfrom the adoption of the new accounting standard. The remaining balance of the interest expense relates to thecontractual coupon rates.
The principal balances, unamortized discounts and net carrying amounts of the liability components and theequity components of our 2011 Convertible Notes and our 2013 Convertible Notes are as follows (in millions):
Balance as of December 31, 2009
Liability component Equity component
Principal balance Unamortized discountNet carrying
amountNet carrying
amount
2011 Convertible Notes . . . . . . . . . . . . . . . $2,500 $158 $2,342 $6432013 Convertible Notes . . . . . . . . . . . . . . . 2,500 412 2,088 829
Balance as of December 31, 2008
2011 Convertible Notes . . . . . . . . . . . . . . . $2,500 $294 $2,206 $6432013 Convertible Notes . . . . . . . . . . . . . . . 2,500 530 1,970 829
2017 Notes and 2037 Notes
In May 2007, we issued $2.0 billion aggregate principal amount of floating rate notes due in November2008 (the “2008 Floating Rate Notes”), $1.1 billion aggregate principal amount of notes due in 2017 (the “2017Notes”) and $900 million aggregate principal amount of notes due in 2037 (the “2037 Notes”). The annual inter-est rate on our 2008 Floating Rate Notes was equal to LIBOR plus 0.08%, which was reset quarterly. The 2017Notes and 2037 Notes pay interest at fixed annual rates of 5.85% and 6.375%, respectively. The 2017 Notes and2037 Notes may be redeemed at any time at our option, in whole or in part, at 100% of the principal amount ofthe notes being redeemed plus accrued interest and a “make-whole” amount, as defined. In the event of a changein control triggering event, as defined, we may be required to purchase for cash all or a portion of the 2017 Notesand 2037 Notes at a price equal to 101% of the principal amount of the notes plus accrued interest. A total of$3.2 billion of the net proceeds raised from the issuance of these notes were used to repurchase shares of ourcommon stock under an accelerated share repurchase program (“ASR”) entered into in May 2007. Upon the re-ceipt of the proceeds from the issuance of the 2018 Notes and 2038 Notes discussed below, in June 2008 weexercised our right to call and repaid $1.0 billion of the 2008 Floating Rate Notes which were scheduled to ma-ture in November 2008. The remaining $1.0 billion of the 2008 Floating Rate Notes matured and were repaid inNovember 2008.
2009 Notes
In November 2009, $1.0 billion aggregate principal amount of notes with a fixed interest rate of 4.00% (the“2009 Notes”) became due and were repaid.
F-33
AMGEN INC.
NOTES TO CONSOLIDATED FINANCIAL STATEMENTS (Continued)
2014 Notes
At December 31, 2009 and 2008, we had outstanding $1.0 billion aggregate principal amount of notes with afixed interest rate of 4.85% due 2014 (the “2014 Notes”).
2019 Notes and 2039 Notes
In January 2009, we issued $1.0 billion aggregate principal amount of notes due in 2019 (the “2019 Notes”)and $1.0 billion aggregate principal amount of notes due in 2039 (the “2039 Notes”) in a registered offering. The2019 Notes and the 2039 Notes pay interest at fixed annual rates of 5.70% and 6.40%, respectively. The 2019Notes and the 2039 Notes may be redeemed at any time at our option, in whole or in part, at 100% of the princi-pal amount of the notes being redeemed plus accrued and unpaid interest, if any, and a “make-whole” amount, asdefined. Upon the occurrence of a change in control triggering event, as defined, we may be required to purchasefor cash all or a portion of the 2019 Notes and the 2039 Notes at a price equal to 101% of the principal amount ofthe notes plus accrued interest. Debt issuance costs totaled approximately $13 million and are being amortizedover the lives of the notes.
2018 Notes and 2038 Notes
In May 2008, we issued $500 million aggregate principal amount of notes due in 2018 (the “2018 Notes”)and $500 million aggregate principal amount of notes due in 2038 (the “2038 Notes”) in a registered offering.The 2018 Notes and 2038 Notes pay interest at fixed annual rates of 6.15% and 6.90%, respectively. The 2018Notes and 2038 Notes may be redeemed at any time at our option, in whole or in part, at 100% of the principalamount of the notes being redeemed plus accrued interest and a “make-whole” amount, as defined. In the eventof a change in control triggering event, as defined, we may be required to purchase for cash all or a portion of the2018 Notes and 2038 Notes at a price equal to 101% of the principal amount of the notes plus accrued interest.Debt issuance costs totaled approximately $6 million and are being amortized over the life of the notes.
2032 Modified Convertible Notes
In 2002, we issued zero-coupon 30 year convertible notes (“2032 Convertible Notes”) with an aggregateface amount of $4.0 billion and yield to maturity of 1.125% which resulted in an original issue discount of $1.1billion. The holders of the 2032 Convertible Notes had the right to require us to repurchase all or a portion oftheir notes at various put dates, including March 1, 2005 when we were required to repurchase $1.6 billion ag-gregate principal amount of 2032 Convertible Notes for their then-accreted value of $1.2 billion in cash.
In 2005, we exchanged new zero-coupon convertible notes (the “2032 Modified Convertible Notes”) and acash payment of approximately $6 million for the remaining 2032 Convertible Notes then outstanding. Becausethe 2032 Modified Convertible Notes may be partially or wholly settled in cash, they are subject to the new con-vertible debt accounting standard discussed above. The additional discount on the 2032 Modified ConvertibleNotes recognized pursuant to the retrospective application of this new accounting standard (in excess of the dis-count recognized under the contractual terms of these securities) was amortized as non-cash interest expensefrom the date the 2032 Modified Convertible Notes were issued to March 1, 2006, the date when the notes wereexpected to be put back to us. We repurchased substantially all of the outstanding 2032 Modified ConvertibleNotes on March 2, 2007 at their then accreted value of $1.7 billion.
We continue to recognize interest expense for the amortization of the discount based on the contractual ratefor the 2032 Modified Convertible Notes that remain outstanding. For years ended December 31, 2009, 2008 and2007, amortization of the discount for the 2032 Modified Convertible Notes was approximately $1 million, $1million and $4 million, respectively. As of December 31, 2009 and 2008, the equity component of the 2032Modified Convertible Notes was approximately $29 million.
F-34
AMGEN INC.
NOTES TO CONSOLIDATED FINANCIAL STATEMENTS (Continued)
Holders of the remaining outstanding 2032 Modified Convertible Notes may, subject to certain conditions,convert each of their notes based on a conversion rate of 8.8601 shares of our common stock. The conversionprice per share of the convertible notes as of any day will equal the accreted value on that day, divided by theconversion rate, or $88.01, as of December 31, 2009. If converted, the 2032 Modified Convertible Notes will besettled in cash for an amount equal to the lesser of the accreted value of the 2032 Modified Convertible Notes atthe conversion date or the conversion value, as defined, and shares of our common stock, if any, to the extent theconversion value exceeds the amount paid in cash. As of December 31, 2009, these notes were not convertibleand the accreted value exceeded the amount that would have been received upon conversion.
Other
We had $100 million of debt securities outstanding at December 31, 2009 and 2008 with a fixed interest rateof 8.125% due in 2097.
Shelf registration statements and other facilities
As of December 31, 2009, we have a commercial paper program that allows us to issue up to $2.3 billion ofunsecured commercial paper to fund our working capital needs. At December 31, 2009, no amounts were out-standing under our commercial paper program.
As of December 31, 2009, we have a $2.3 billion syndicated, unsecured, revolving credit facility which ma-tures in November 2012 and is available for general corporate purposes or as a liquidity backstop to ourcommercial paper program. Annual commitment fees for this facility are 0.045% based on our current credit rat-ing. As of December 31, 2009, no amounts were outstanding under this facility.
We have filed a shelf registration statement with the SEC, which allows us to issue an unspecified amountof debt securities; common stock; preferred stock; warrants to purchase debt securities, common stock, preferredstock or depository shares; rights to purchase common stock or preferred stock; securities purchase contracts; se-curities purchase units and depository shares. Under this registration statement, all of the securities available forissuance may be offered from time to time with terms to be determined at the time of issuance.
As of December 31, 2009, we have $400 million remaining under a shelf registration statement that was es-tablished in 1997. In connection with this shelf registration, we established a $400 million medium-term noteprogram. All of the $400 million of debt securities available for issuance may be offered from time to time underour medium-term note program with terms to be determined at the time of issuance. As of December 31, 2009,no securities were outstanding under the $400 million medium-term note program.
To achieve a desired mix of fixed and floating interest rate debt, we enter into interest rate swap agreementsthat effectively convert a fixed rate interest coupon to a LIBOR-based floating rate coupon over the life of the re-spective note. These interest rate swap agreements qualify and are designated as fair value hedges. As ofDecember 31, 2009 and 2008, we had interest rate swap agreements with an aggregate face value of $1.5 billionand $2.6 billion, respectively.
Certain of our financing arrangements contain non-financial covenants and we were in compliance with allapplicable covenants as of December 31, 2009. None of our financing arrangements contain any financial cove-nants.
F-35
AMGEN INC.
NOTES TO CONSOLIDATED FINANCIAL STATEMENTS (Continued)
Contractual maturities of long-term debt obligations
The aggregate contractual maturities of all long-term debt obligations due subsequent to December 31, 2009are as follows (in millions):
Maturity date Amount
2010 . . . . . . . . . . . . . . . . . . . . . . . . . . . . . . . . . . . . . . . . . . . . . . . . . . . . . . . . . . . . . . . . . . . . . . . . . . . . . . $ —2011(1) . . . . . . . . . . . . . . . . . . . . . . . . . . . . . . . . . . . . . . . . . . . . . . . . . . . . . . . . . . . . . . . . . . . . . . . . . . . . . 2,5002012(2) . . . . . . . . . . . . . . . . . . . . . . . . . . . . . . . . . . . . . . . . . . . . . . . . . . . . . . . . . . . . . . . . . . . . . . . . . . . . . 842013(1) . . . . . . . . . . . . . . . . . . . . . . . . . . . . . . . . . . . . . . . . . . . . . . . . . . . . . . . . . . . . . . . . . . . . . . . . . . . . . 2,5002014 . . . . . . . . . . . . . . . . . . . . . . . . . . . . . . . . . . . . . . . . . . . . . . . . . . . . . . . . . . . . . . . . . . . . . . . . . . . . . . 1,000Thereafter . . . . . . . . . . . . . . . . . . . . . . . . . . . . . . . . . . . . . . . . . . . . . . . . . . . . . . . . . . . . . . . . . . . . . . . . . . 5,100
Total . . . . . . . . . . . . . . . . . . . . . . . . . . . . . . . . . . . . . . . . . . . . . . . . . . . . . . . . . . . . . . . . . . . . . . . . . . . . $11,184
(1) This amount represents the principal amount due under the note after full accretion of the debt discount.(2) This amount represents the 2032 Modified Convertible Notes’ accreted value on March 1, 2012, the next
date on which holders may put the debt to us for repayment.
Interest costs
Interest costs are expensed as incurred, except to the extent such interest is related to construction in prog-ress, in which case interest is capitalized. Interest expense, net for the years ended December 31, 2009, 2008 and2007 was $578 million, $551 million and $496 million, respectively. Interest costs capitalized for the years endedDecember 31, 2009, 2008 and 2007 were $32 million, $22 million and $28 million, respectively. Interest paid,net of interest rate swaps, during the years ended December 31, 2009, 2008 and 2007, totaled $293 million, $303million and $258 million, respectively. Included in interest expense, net for the years ended December 31, 2009,2008 and 2007, is the impact of non-cash interest expense of $250 million, $235 million and $168 million, re-spectively, resulting from the adoption of the new accounting standard that changed the method of accounting forour convertible debt. (See above and Note 2, “Change in method of accounting for convertible debtinstruments.”)
17. Stockholders’ equity
Stock repurchase program
A summary of the activity under our stock repurchase program is as follows (in millions):
2009 2008 2007
Shares Dollars Shares Dollars Shares Dollars
First quarter . . . . . . . . . . . . . . . . . . . . . . . . . . . . . . . . . . . . . . 37.5 $1,997 — $ — 8.8 $ 537Second quarter . . . . . . . . . . . . . . . . . . . . . . . . . . . . . . . . . . . . — — 32.7 1,549(1) 73.9(2) 4,463Third quarter . . . . . . . . . . . . . . . . . . . . . . . . . . . . . . . . . . . . . . — — — 19(1) 2.5(2) —Fourth quarter . . . . . . . . . . . . . . . . . . . . . . . . . . . . . . . . . . . . . 21.7 1,211 12.6 700 1.8 100
Total . . . . . . . . . . . . . . . . . . . . . . . . . . . . . . . . . . . . . . . . . . 59.2 $3,208 45.3 $2,268 87.0 $5,100
(1) The total cost of shares repurchased during the three months ended June 30, 2008 excludes approximately$19 million paid in July 2008 in connection with the final settlement of an ASR entered into in May 2008.
(2) The total number of shares repurchased during the three months ended June 30, 2007 excludes 2.5 millionshares received in July 2007 in connection with the final settlement of an ASR entered into in May 2007.
F-36
AMGEN INC.
NOTES TO CONSOLIDATED FINANCIAL STATEMENTS (Continued)
In both July 2007 and December 2009, the Board of Directors authorized us to repurchase up to $5.0 billionof common stock of which a total of $6.0 billion remains available for stock repurchases as of December 31,2009. The manner of purchases, the amount we spend and the number of shares repurchased will vary based on avariety of factors, including the stock price, blackout periods in which we are restricted from repurchasingshares, and our credit rating and may include private block purchases as well as market transactions.
Accumulated other comprehensive income
The components of accumulated other comprehensive income (“OCI”) are as follows (in millions):
Foreigncurrency
translationCash flow
hedgesAvailable-for-sale
securities Other
Accumulated othercomprehensive
income
Balance as of January 1, 2007 . . . . . . . . . . . . . $ 45 $ (25) $ (8) $ — $ 12Other comprehensive income:
Foreign currency translation adjustments . . 30 — — — 30Unrealized (losses)/gains . . . . . . . . . . . . . . . — (32) 73 — 41Reclassification adjustments to income . . . . — — 3 — 3Income taxes . . . . . . . . . . . . . . . . . . . . . . . . (16) 12 (29) — (33)
Balance as of December 31, 2007 . . . . . . . . . . 59 (45) 39 — 53Other comprehensive income:
Foreign currency translation adjustments . . (43) — — — (43)Unrealized gains . . . . . . . . . . . . . . . . . . . . . . — 155 92 — 247Reclassification adjustments to income . . . . — — (75) — (75)Other . . . . . . . . . . . . . . . . . . . . . . . . . . . . . . . — — — (11) (11)Income taxes . . . . . . . . . . . . . . . . . . . . . . . . 9 (60) (7) 4 (54)
Balance as of December 31, 2008 . . . . . . . . . . 25 50 49 (7) 117Other comprehensive loss:
Foreign currency translation adjustments . . 25 — — — 25Unrealized (losses)/gains . . . . . . . . . . . . . . . — (213) 116 (12) (109)Reclassification adjustments to income . . . . — 8 (42) — (34)Other . . . . . . . . . . . . . . . . . . . . . . . . . . . . . . . — — — 5 5Income taxes . . . . . . . . . . . . . . . . . . . . . . . . (10) 73 (28) 6 41
Balance as of December 31, 2009 . . . . . . . . . . $ 40 $ (82) $ 95 $ (8) $ 45
Other
In addition to common stock, our authorized capital includes 5 million shares of preferred stock, $0.0001par value. At December 31, 2009 and 2008, no shares of preferred stock were issued or outstanding.
F-37
AMGEN INC.
NOTES TO CONSOLIDATED FINANCIAL STATEMENTS (Continued)
18. Fair value measurement
We use various valuation approaches in determining the fair value of our financial assets and liabilities with-in a hierarchy that maximizes the use of observable inputs and minimizes the use of unobservable inputs byrequiring that observable inputs be used when available. Observable inputs are inputs that market participantswould use in pricing the asset or liability based on market data obtained from sources independent of the Com-pany. Unobservable inputs are inputs that reflect the Company’s assumptions about the inputs that marketparticipants would use in pricing the asset or liability and are developed based on the best information availablein the circumstances. The fair value hierarchy is broken down into three levels based on the source of inputs asfollows:
Level 1 — Valuations based on unadjusted quoted prices in active markets for identical assets or liabilitiesthat the Company has the ability to access
Level 2 — Valuations for which all significant inputs are observable, either directly or indirectly, other thanlevel 1 inputs
Level 3 — Valuations based on inputs that are unobservable and significant to the overall fair valuemeasurement.
The availability of observable inputs can vary among the various types of financial assets and liabilities. Tothe extent that the valuation is based on models or inputs that are less observable or unobservable in the market,the determination of fair value requires more judgment. In certain cases, the inputs used to measure fair valuemay fall into different levels of the fair value hierarchy. In such cases, for financial statement disclosure pur-poses, the level in the fair value hierarchy within which the fair value measurement is categorized is based on thelowest level of input used that is significant to the overall fair value measurement.
U.S. Treasury securities, money market mutual funds and equity securities are valued using quoted marketprices in active markets with no valuation adjustment. Accordingly, these securities are categorized in Level 1.Obligations of U.S. government agencies and FDIC guaranteed bank debt, corporate debt securities, mortgageand asset backed securities and other short-term interest bearing securities are valued using methodologies basedon market observable inputs, principally, quoted prices of transactions of similar securities in active markets,quoted prices of recent transactions of identical or similar assets in markets that are not active, benchmark yieldsand issuer credit spreads. Accordingly, these securities are categorized in Level 2.
Our derivative assets and liabilities include interest rate swaps and foreign currency forward and option con-tracts. The fair values of these derivatives are determined using methodologies based on market observableinputs, including interest rate and volatility curves, credit spreads and foreign currency spot prices. All of thesederivative contracts are categorized in Level 2.
F-38
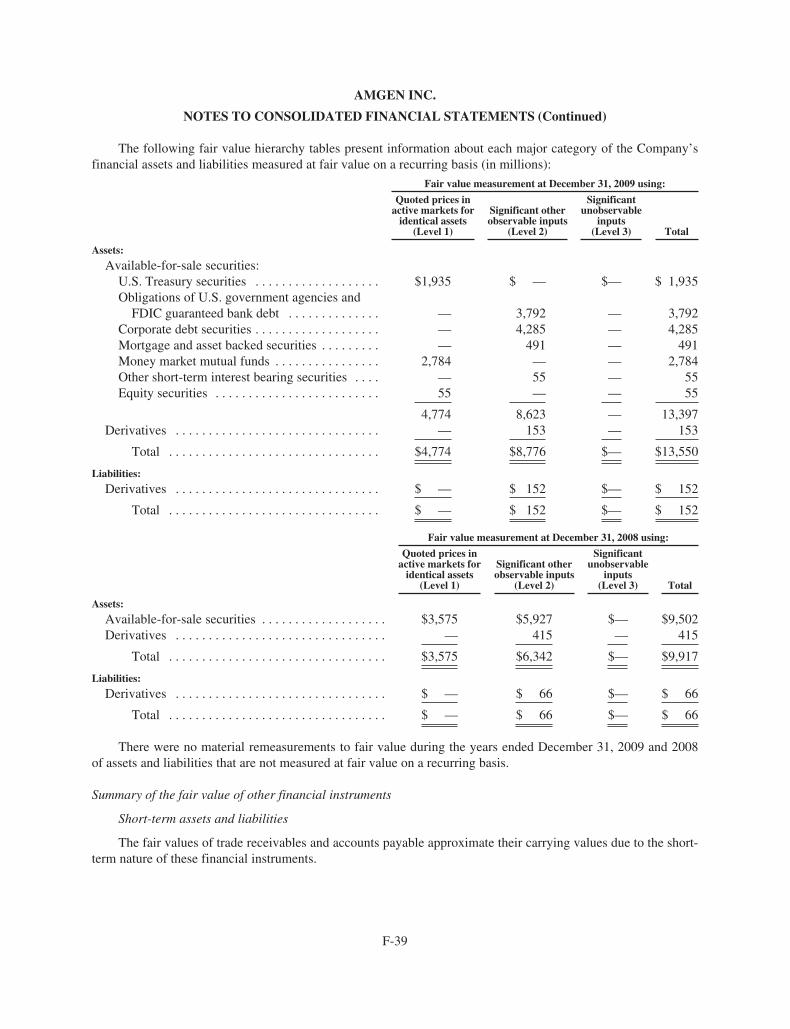
AMGEN INC.
NOTES TO CONSOLIDATED FINANCIAL STATEMENTS (Continued)
The following fair value hierarchy tables present information about each major category of the Company’sfinancial assets and liabilities measured at fair value on a recurring basis (in millions):
Fair value measurement at December 31, 2009 using:
Quoted prices inactive markets for
identical assets(Level 1)
Significant otherobservable inputs
(Level 2)
Significantunobservable
inputs(Level 3) Total
Assets:
Available-for-sale securities:U.S. Treasury securities . . . . . . . . . . . . . . . . . . . $1,935 $ — $— $ 1,935Obligations of U.S. government agencies and
FDIC guaranteed bank debt . . . . . . . . . . . . . . — 3,792 — 3,792Corporate debt securities . . . . . . . . . . . . . . . . . . . — 4,285 — 4,285Mortgage and asset backed securities . . . . . . . . . — 491 — 491Money market mutual funds . . . . . . . . . . . . . . . . 2,784 — — 2,784Other short-term interest bearing securities . . . . — 55 — 55Equity securities . . . . . . . . . . . . . . . . . . . . . . . . . 55 — — 55
4,774 8,623 — 13,397Derivatives . . . . . . . . . . . . . . . . . . . . . . . . . . . . . . . — 153 — 153
Total . . . . . . . . . . . . . . . . . . . . . . . . . . . . . . . . $4,774 $8,776 $— $13,550
Liabilities:
Derivatives . . . . . . . . . . . . . . . . . . . . . . . . . . . . . . . $ — $ 152 $— $ 152
Total . . . . . . . . . . . . . . . . . . . . . . . . . . . . . . . . $ — $ 152 $— $ 152
Fair value measurement at December 31, 2008 using:
Quoted prices inactive markets for
identical assets(Level 1)
Significant otherobservable inputs
(Level 2)
Significantunobservable
inputs(Level 3) Total
Assets:
Available-for-sale securities . . . . . . . . . . . . . . . . . . . $3,575 $5,927 $— $9,502Derivatives . . . . . . . . . . . . . . . . . . . . . . . . . . . . . . . . — 415 — 415
Total . . . . . . . . . . . . . . . . . . . . . . . . . . . . . . . . . $3,575 $6,342 $— $9,917
Liabilities:
Derivatives . . . . . . . . . . . . . . . . . . . . . . . . . . . . . . . . $ — $ 66 $— $ 66
Total . . . . . . . . . . . . . . . . . . . . . . . . . . . . . . . . . $ — $ 66 $— $ 66
There were no material remeasurements to fair value during the years ended December 31, 2009 and 2008of assets and liabilities that are not measured at fair value on a recurring basis.
Summary of the fair value of other financial instruments
Short-term assets and liabilities
The fair values of trade receivables and accounts payable approximate their carrying values due to the short-term nature of these financial instruments.
F-39
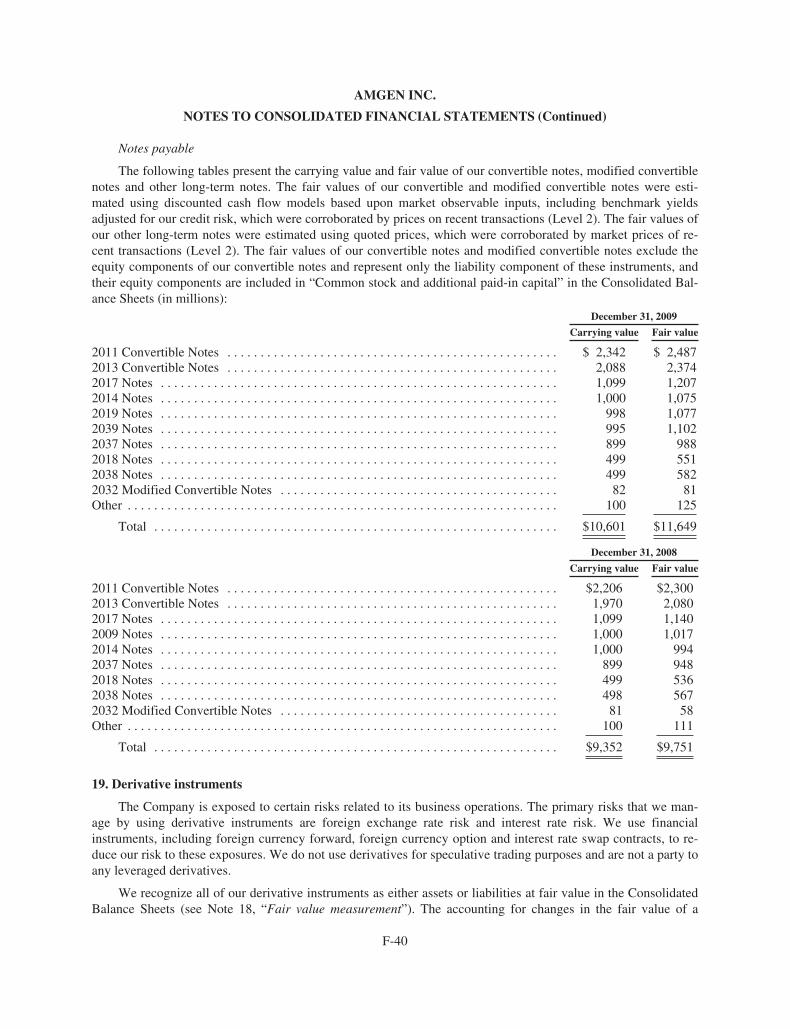
AMGEN INC.
NOTES TO CONSOLIDATED FINANCIAL STATEMENTS (Continued)
Notes payable
The following tables present the carrying value and fair value of our convertible notes, modified convertiblenotes and other long-term notes. The fair values of our convertible and modified convertible notes were esti-mated using discounted cash flow models based upon market observable inputs, including benchmark yieldsadjusted for our credit risk, which were corroborated by prices on recent transactions (Level 2). The fair values ofour other long-term notes were estimated using quoted prices, which were corroborated by market prices of re-cent transactions (Level 2). The fair values of our convertible notes and modified convertible notes exclude theequity components of our convertible notes and represent only the liability component of these instruments, andtheir equity components are included in “Common stock and additional paid-in capital” in the Consolidated Bal-ance Sheets (in millions):
December 31, 2009
Carrying value Fair value
2011 Convertible Notes . . . . . . . . . . . . . . . . . . . . . . . . . . . . . . . . . . . . . . . . . . . . . . . . . . $ 2,342 $ 2,4872013 Convertible Notes . . . . . . . . . . . . . . . . . . . . . . . . . . . . . . . . . . . . . . . . . . . . . . . . . . 2,088 2,3742017 Notes . . . . . . . . . . . . . . . . . . . . . . . . . . . . . . . . . . . . . . . . . . . . . . . . . . . . . . . . . . . . 1,099 1,2072014 Notes . . . . . . . . . . . . . . . . . . . . . . . . . . . . . . . . . . . . . . . . . . . . . . . . . . . . . . . . . . . . 1,000 1,0752019 Notes . . . . . . . . . . . . . . . . . . . . . . . . . . . . . . . . . . . . . . . . . . . . . . . . . . . . . . . . . . . . 998 1,0772039 Notes . . . . . . . . . . . . . . . . . . . . . . . . . . . . . . . . . . . . . . . . . . . . . . . . . . . . . . . . . . . . 995 1,1022037 Notes . . . . . . . . . . . . . . . . . . . . . . . . . . . . . . . . . . . . . . . . . . . . . . . . . . . . . . . . . . . . 899 9882018 Notes . . . . . . . . . . . . . . . . . . . . . . . . . . . . . . . . . . . . . . . . . . . . . . . . . . . . . . . . . . . . 499 5512038 Notes . . . . . . . . . . . . . . . . . . . . . . . . . . . . . . . . . . . . . . . . . . . . . . . . . . . . . . . . . . . . 499 5822032 Modified Convertible Notes . . . . . . . . . . . . . . . . . . . . . . . . . . . . . . . . . . . . . . . . . . 82 81Other . . . . . . . . . . . . . . . . . . . . . . . . . . . . . . . . . . . . . . . . . . . . . . . . . . . . . . . . . . . . . . . . . 100 125
Total . . . . . . . . . . . . . . . . . . . . . . . . . . . . . . . . . . . . . . . . . . . . . . . . . . . . . . . . . . . . . $10,601 $11,649
December 31, 2008
Carrying value Fair value
2011 Convertible Notes . . . . . . . . . . . . . . . . . . . . . . . . . . . . . . . . . . . . . . . . . . . . . . . . . . $2,206 $2,3002013 Convertible Notes . . . . . . . . . . . . . . . . . . . . . . . . . . . . . . . . . . . . . . . . . . . . . . . . . . 1,970 2,0802017 Notes . . . . . . . . . . . . . . . . . . . . . . . . . . . . . . . . . . . . . . . . . . . . . . . . . . . . . . . . . . . . 1,099 1,1402009 Notes . . . . . . . . . . . . . . . . . . . . . . . . . . . . . . . . . . . . . . . . . . . . . . . . . . . . . . . . . . . . 1,000 1,0172014 Notes . . . . . . . . . . . . . . . . . . . . . . . . . . . . . . . . . . . . . . . . . . . . . . . . . . . . . . . . . . . . 1,000 9942037 Notes . . . . . . . . . . . . . . . . . . . . . . . . . . . . . . . . . . . . . . . . . . . . . . . . . . . . . . . . . . . . 899 9482018 Notes . . . . . . . . . . . . . . . . . . . . . . . . . . . . . . . . . . . . . . . . . . . . . . . . . . . . . . . . . . . . 499 5362038 Notes . . . . . . . . . . . . . . . . . . . . . . . . . . . . . . . . . . . . . . . . . . . . . . . . . . . . . . . . . . . . 498 5672032 Modified Convertible Notes . . . . . . . . . . . . . . . . . . . . . . . . . . . . . . . . . . . . . . . . . . 81 58Other . . . . . . . . . . . . . . . . . . . . . . . . . . . . . . . . . . . . . . . . . . . . . . . . . . . . . . . . . . . . . . . . . 100 111
Total . . . . . . . . . . . . . . . . . . . . . . . . . . . . . . . . . . . . . . . . . . . . . . . . . . . . . . . . . . . . . $9,352 $9,751
19. Derivative instruments
The Company is exposed to certain risks related to its business operations. The primary risks that we man-age by using derivative instruments are foreign exchange rate risk and interest rate risk. We use financialinstruments, including foreign currency forward, foreign currency option and interest rate swap contracts, to re-duce our risk to these exposures. We do not use derivatives for speculative trading purposes and are not a party toany leveraged derivatives.
We recognize all of our derivative instruments as either assets or liabilities at fair value in the ConsolidatedBalance Sheets (see Note 18, “Fair value measurement”). The accounting for changes in the fair value of a
F-40
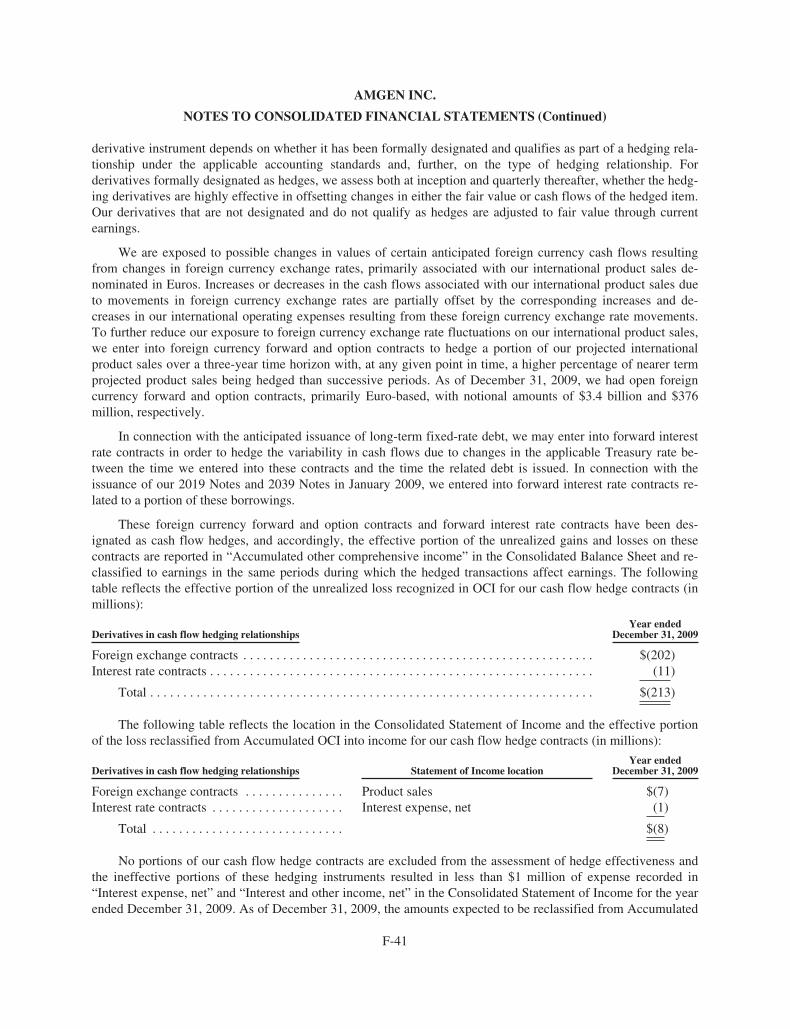
AMGEN INC.
NOTES TO CONSOLIDATED FINANCIAL STATEMENTS (Continued)
derivative instrument depends on whether it has been formally designated and qualifies as part of a hedging rela-tionship under the applicable accounting standards and, further, on the type of hedging relationship. Forderivatives formally designated as hedges, we assess both at inception and quarterly thereafter, whether the hedg-ing derivatives are highly effective in offsetting changes in either the fair value or cash flows of the hedged item.Our derivatives that are not designated and do not qualify as hedges are adjusted to fair value through currentearnings.
We are exposed to possible changes in values of certain anticipated foreign currency cash flows resultingfrom changes in foreign currency exchange rates, primarily associated with our international product sales de-nominated in Euros. Increases or decreases in the cash flows associated with our international product sales dueto movements in foreign currency exchange rates are partially offset by the corresponding increases and de-creases in our international operating expenses resulting from these foreign currency exchange rate movements.To further reduce our exposure to foreign currency exchange rate fluctuations on our international product sales,we enter into foreign currency forward and option contracts to hedge a portion of our projected internationalproduct sales over a three-year time horizon with, at any given point in time, a higher percentage of nearer termprojected product sales being hedged than successive periods. As of December 31, 2009, we had open foreigncurrency forward and option contracts, primarily Euro-based, with notional amounts of $3.4 billion and $376million, respectively.
In connection with the anticipated issuance of long-term fixed-rate debt, we may enter into forward interestrate contracts in order to hedge the variability in cash flows due to changes in the applicable Treasury rate be-tween the time we entered into these contracts and the time the related debt is issued. In connection with theissuance of our 2019 Notes and 2039 Notes in January 2009, we entered into forward interest rate contracts re-lated to a portion of these borrowings.
These foreign currency forward and option contracts and forward interest rate contracts have been des-ignated as cash flow hedges, and accordingly, the effective portion of the unrealized gains and losses on thesecontracts are reported in “Accumulated other comprehensive income” in the Consolidated Balance Sheet and re-classified to earnings in the same periods during which the hedged transactions affect earnings. The followingtable reflects the effective portion of the unrealized loss recognized in OCI for our cash flow hedge contracts (inmillions):
Derivatives in cash flow hedging relationshipsYear ended
December 31, 2009
Foreign exchange contracts . . . . . . . . . . . . . . . . . . . . . . . . . . . . . . . . . . . . . . . . . . . . . . . . . . . . . $(202)Interest rate contracts . . . . . . . . . . . . . . . . . . . . . . . . . . . . . . . . . . . . . . . . . . . . . . . . . . . . . . . . . . (11)
Total . . . . . . . . . . . . . . . . . . . . . . . . . . . . . . . . . . . . . . . . . . . . . . . . . . . . . . . . . . . . . . . . . . . $(213)
The following table reflects the location in the Consolidated Statement of Income and the effective portionof the loss reclassified from Accumulated OCI into income for our cash flow hedge contracts (in millions):
Derivatives in cash flow hedging relationships Statement of Income locationYear ended
December 31, 2009
Foreign exchange contracts . . . . . . . . . . . . . . . Product sales $(7)Interest rate contracts . . . . . . . . . . . . . . . . . . . . Interest expense, net (1)
Total . . . . . . . . . . . . . . . . . . . . . . . . . . . . . $(8)
No portions of our cash flow hedge contracts are excluded from the assessment of hedge effectiveness andthe ineffective portions of these hedging instruments resulted in less than $1 million of expense recorded in“Interest expense, net” and “Interest and other income, net” in the Consolidated Statement of Income for the yearended December 31, 2009. As of December 31, 2009, the amounts expected to be reclassified from Accumulated
F-41
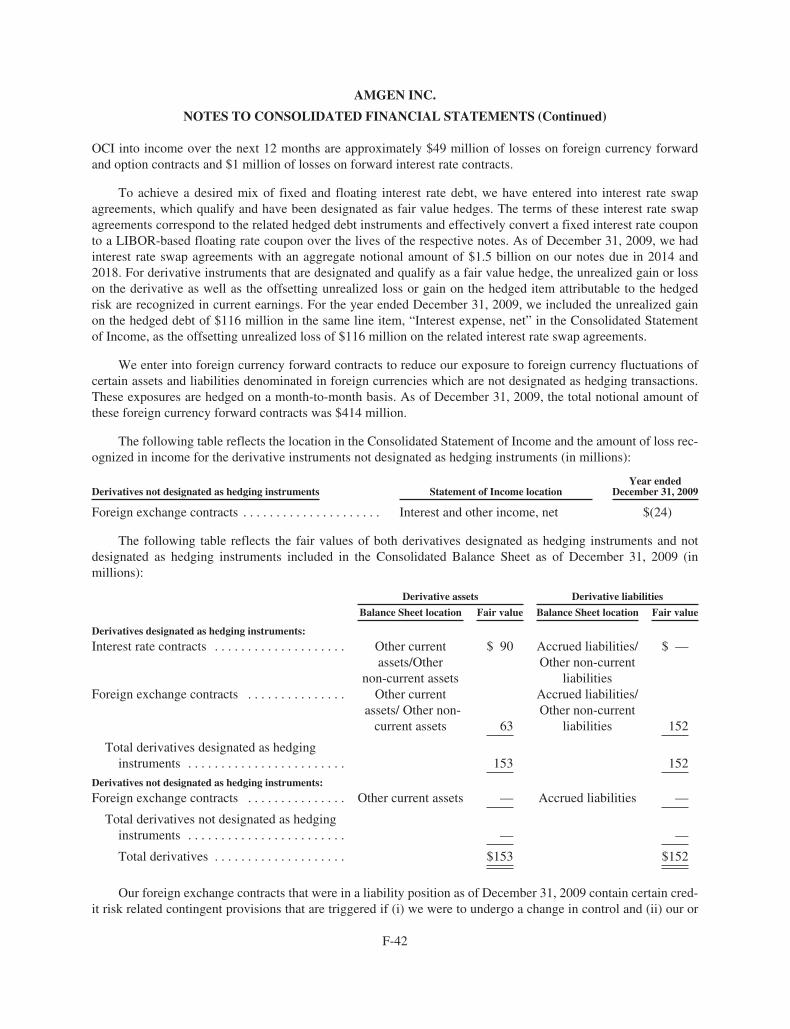
AMGEN INC.
NOTES TO CONSOLIDATED FINANCIAL STATEMENTS (Continued)
OCI into income over the next 12 months are approximately $49 million of losses on foreign currency forwardand option contracts and $1 million of losses on forward interest rate contracts.
To achieve a desired mix of fixed and floating interest rate debt, we have entered into interest rate swapagreements, which qualify and have been designated as fair value hedges. The terms of these interest rate swapagreements correspond to the related hedged debt instruments and effectively convert a fixed interest rate couponto a LIBOR-based floating rate coupon over the lives of the respective notes. As of December 31, 2009, we hadinterest rate swap agreements with an aggregate notional amount of $1.5 billion on our notes due in 2014 and2018. For derivative instruments that are designated and qualify as a fair value hedge, the unrealized gain or losson the derivative as well as the offsetting unrealized loss or gain on the hedged item attributable to the hedgedrisk are recognized in current earnings. For the year ended December 31, 2009, we included the unrealized gainon the hedged debt of $116 million in the same line item, “Interest expense, net” in the Consolidated Statementof Income, as the offsetting unrealized loss of $116 million on the related interest rate swap agreements.
We enter into foreign currency forward contracts to reduce our exposure to foreign currency fluctuations ofcertain assets and liabilities denominated in foreign currencies which are not designated as hedging transactions.These exposures are hedged on a month-to-month basis. As of December 31, 2009, the total notional amount ofthese foreign currency forward contracts was $414 million.
The following table reflects the location in the Consolidated Statement of Income and the amount of loss rec-ognized in income for the derivative instruments not designated as hedging instruments (in millions):
Derivatives not designated as hedging instruments Statement of Income locationYear ended
December 31, 2009
Foreign exchange contracts . . . . . . . . . . . . . . . . . . . . . Interest and other income, net $(24)
The following table reflects the fair values of both derivatives designated as hedging instruments and notdesignated as hedging instruments included in the Consolidated Balance Sheet as of December 31, 2009 (inmillions):
Derivative assets Derivative liabilities
Balance Sheet location Fair value Balance Sheet location Fair value
Derivatives designated as hedging instruments:
Interest rate contracts . . . . . . . . . . . . . . . . . . . . Other currentassets/Other
non-current assets
$ 90 Accrued liabilities/Other non-current
liabilities
$ —
Foreign exchange contracts . . . . . . . . . . . . . . . Other currentassets/ Other non-
current assets 63
Accrued liabilities/Other non-current
liabilities 152
Total derivatives designated as hedginginstruments . . . . . . . . . . . . . . . . . . . . . . . . 153 152
Derivatives not designated as hedging instruments:
Foreign exchange contracts . . . . . . . . . . . . . . . Other current assets — Accrued liabilities —
Total derivatives not designated as hedginginstruments . . . . . . . . . . . . . . . . . . . . . . . . — —
Total derivatives . . . . . . . . . . . . . . . . . . . . $153 $152
Our foreign exchange contracts that were in a liability position as of December 31, 2009 contain certain cred-it risk related contingent provisions that are triggered if (i) we were to undergo a change in control and (ii) our or
F-42
AMGEN INC.
NOTES TO CONSOLIDATED FINANCIAL STATEMENTS (Continued)
the surviving entity’s creditworthiness deteriorates, which is generally defined as having either a credit rating thatis below investment grade or a materially weaker creditworthiness after the change in control. If these eventswere to occur, the counterparties would have the right, but not the obligation, to close the contracts under earlytermination provisions. In such circumstances, the counterparties could request immediate settlement of thesecontracts for amounts that approximate the then current fair values of the contracts.
20. Contingencies and commitments
Contingencies
In the ordinary course of business, we are involved in various legal proceedings and other matters that arecomplex in nature and have outcomes that are difficult to predict. We record accruals for such contingencies tothe extent that we conclude that it is probable that a liability will be incurred and the amount of the related losscan be reasonably estimated.
Certain of our legal proceedings and other matters are discussed below:
Roche Matters
Amgen Inc. v. F. Hoffmann-La Roche Ltd., et al.
On November 8, 2005, Amgen filed a lawsuit in the Massachusetts District Court against F. Hoffmann-LaRoche Ltd., Roche Diagnostics GmbH and Hoffmann-La Roche, Inc. (collectively, “Roche Defendants”) seekinga declaration by the court that the importation, use, sale or offer to sell pegylated erythropoietin (alternatively re-ferred to as peg-EPO or MIRCERA®) infringes Amgen’s EPO patents. Amgen alleged infringement of six of itsU.S. Patents that claim erythropoietin products, pharmaceutical compositions and processes for making eryth-ropoietin, specifically U.S. Patent No. 5,547,933 (“the ‘933 Patent”), U.S. Patent No. 5,621,080 (“the ‘080Patent”), U.S. Patent No. 5,955,422 (“the ‘422 Patent”), U.S. Patent No. 5,756,349 (“the ‘349 Patent”), U.S. Pat-ent No. 5,618,698 (“the ‘698 Patent”) and U.S. Patent No. 5,441,868 (“the ‘868 Patent”). Amgen sought apermanent injunction preventing the Roche Defendants from making, importing, using, offering for sale or sell-ing recombinant human erythropoietin, including pegylated EPO, in the United States. The Roche Defendants’amended answer asserted that all six of the patents-in-suit were not infringed, were invalid and were unenforce-able due to inequitable conduct and counterclaimed asserting violations of federal and state antitrust laws. OnJune 5, 2007, the Massachusetts District Court entered an order dismissing the ‘080 Patent from the case.
The Massachusetts District Court conducted a jury trial on infringement and validity, a bench trial on other is-sues of validity and enforceability, and heard pre- and post-trial motions. On October 17, 2008, the MassachusettsDistrict Court entered judgment that claim 1 of the ‘422 Patent, claims 3, 7, 8, 9, 11, 12 and 14 of the ‘933 Patent,claims 1 and 2 of the ‘868 Patent, claims 6 through 9 of the ‘698 Patent and claim 7 of the ‘349 Patent are valid andenforceable, and that claim 1 of the ‘422 Patent, claims 3, 7 and 8 of the ‘933 Patent, claims 1 and 2 of the ‘868Patent, and claims 6 through 9 of the ‘698 Patent are infringed and permanently enjoined Roche from infringing the‘422 Patent, the ‘933 Patent, the ‘868 Patent and the ‘698 Patent for the remaining life of these patents.
The Roche Defendants filed an appeal with the U.S. Court of Appeals for the Federal Circuit (the “FederalCircuit Court”) and Amgen filed a cross-appeal. On September 15, 2009, the Federal Circuit Court affirmed theMassachusetts District Court’s judgment with respect to infringement of the ‘933, ‘422, ‘698 and ‘868 Patentsand vacated the holding of non-infringement of the ‘349 Patent. The Federal Circuit Court also affirmed the val-idity of Amgen’s patents except for a single issue of obviousness-type double patenting with respect to the ‘933,‘422 and ‘349 Patents. The Federal Circuit Court remanded this validity issue and the issue of infringement of the‘349 patent to the Massachusetts District Court for further proceedings.
Amgen and the Roche Defendants reached a settlement of the litigation in December 2009 and on De-cember 22, 2009, the Massachusetts District Court entered final judgment and a permanent injunction against theRoche Defendants prohibiting Roche from infringing Amgen’s patents, thus bringing the five-year patent
F-43
AMGEN INC.
NOTES TO CONSOLIDATED FINANCIAL STATEMENTS (Continued)
infringement dispute to an end. The judgment was accompanied by the Roche Defendant’s admission that the fiveAmgen patents involved in the lawsuit are valid, enforceable and infringed by the Roche Defendant’s peg-EPOproduct, and by Amgen allowing Roche to begin selling peg-EPO in the United States in mid-2014 under terms ofa limited license agreement. The settlement terms do not include any financial payments between the parties.
U.S. International Trade Commission
On April 11, 2006, Amgen filed a complaint with the U.S. International Trade Commission (“ITC”) inWashington D.C. requesting that the ITC institute an investigation of Roche’s importation of peg-EPO into theUnited States as Amgen believes that importation of peg-EPO is unlawful because peg-EPO, and the method ofits manufacture, are covered by Amgen’s EPO patents. Amgen asked the ITC to issue a permanent exclusion or-der that would prohibit importation of peg-EPO into the United States. The ITC instituted an investigation ofRoche’s importation of peg-EPO into the United States. On July 7, 2006, the Administrative Law Judge (“ALJ”)at the ITC issued a summary determination that Roche’s importation and use of peg-EPO in the United States todate are subject to a clinical trial exemption to patent infringement. On August 31, 2006, the ITC adopted theALJ’s summary determination terminating the investigation based on the clinical trial exemption to patent in-fringement liability under 35 U.S.C. 271(e)(1).
On October 11, 2006, Amgen filed a petition for review of the ITC’s decision with the Federal CircuitCourt. On March 19, 2008, the Federal Circuit Court reversed the ITC’s dismissal of the investigation onjurisdictional grounds. In response to Roche’s request for rehearing, on April 30, 2009, the Federal Circuit Courtvacated the ITC’s dismissal of the ITC investigation for non-infringement. The Court remanded the case back tothe ITC for further proceedings to determine if patent infringement had occurred and to provide a remedy, if ap-propriate. After the settlement of the dispute between the parties in December 2009, Amgen filed a motion forsummary determination of violation with a request for entry of a limited exclusion order. The Roche respondentsnotified the ITC that it was not opposing Amgen’s motion. No decision has been issued on Amgen’s motion.
Human Genome Sciences Litigations
On November 30, 2007, Human Genome Sciences (“HGS”) filed an action under 35 U.S.C. §146 againstAmgen in the Delaware District Court to review a Decision on Motions entered on July 26, 2007 and the FinalJudgment entered November 20, 2007 by the Board of Patent Appeals and Interferences in InterferenceNo. 105,240. On May 9, 2008, the Delaware District Court granted Amgen’s Motion to Dismiss and HGS filedan appeal to the Federal Circuit Court. Thereafter, HGS withdrew its appeal and on October 14, 2009, the FederalCircuit Court entered an order on HGS’ motion to dismiss HGS’ appeal.
On October 21, 2009, the Delaware District Court entered orders on stipulated motions dismissing with prej-udice HGS’ actions under 35 U.S.C. § 146 which had been filed by HGS after it had received unfavorable finaljudgments from the U.S. Patent and Trademark Office Board of Patent Appeals and Interferences on each ofInterference No. 105,380 and Interference No. 105,381.
Teva Matters
Sensipar® Abbreviated New Drug Application (“ANDA”) Litigation
On July 25, 2008, Amgen, NPS Pharmaceuticals (“NPS”) and Brigham and Women’s Hospital (“BWH”),filed a lawsuit against Teva Pharmaceuticals USA, Inc. (“Teva USA”), Teva Pharmaceutical Industries Ltd.(“Teva Ltd.”, and together with Teva USA, “Teva”) and Barr Laboratories, Inc. (“Barr”) in the Delaware DistrictCourt for infringement of four patents — U.S. Patent Nos. 6,001,068; 6,031,003; 6,313,146 and 6,211,244. Thelawsuit is based on ANDAs filed by Teva and Barr which seek approval to market generic versions of Sensipar®
(cinacalcet hydrochloride). Amgen’s filing of the lawsuit stays any U.S. Food and Drug Administration (“FDA”)approval of the Teva or Barr ANDA until September 2011, unless there is an earlier decision by the DelawareDistrict Court adverse to Amgen.
F-44
AMGEN INC.
NOTES TO CONSOLIDATED FINANCIAL STATEMENTS (Continued)
The Delaware District Court has entered a scheduling order indicating that the case will be placed in the trialpool on September 1, 2010.
Teva v. Amgen, the ‘603 Patent Litigation
On May 20, 2009, Teva Ltd. filed a lawsuit against Amgen in the U.S. District Court for the Eastern Districtof Pennsylvania alleging infringement of U.S. Patent No. 7,449,603 by its manufacture, importation, use, saleand/or offer for sale of Sensipar® (cinacalcet hydrochloride). Amgen filed an answer and counterclaims of non-infringement and patent invalidity.
Teva v. Amgen, the G-CSF Patent Litigation
On November 30, 2009, Teva USA filed a lawsuit in the U.S. District Court for the Eastern District of Penn-sylvania requesting that Amgen’s U.S. Patent Nos. 5,580,755 and 5,582,823 relating to human G-CSF andmethods for its use, be declared invalid and/or not infringed by Teva’s Filgrastim molecule. Also on No-vember 30, 2009, Teva announced that it had filed a biologics license application with the FDA seeking approvalto market its G-CSF product in the United States. On January 15, 2010, Amgen filed an answer and counter-claims seeking a declaration that Amgen’s patents are valid and will be infringed by Teva’s G-CSF product.
Kennedy Institute v. Amgen Inc. and Wyeth
On October 27, 2009, The Mathilda and Terence Kennedy Institute of Rheumatology Trust filed suit in theDelaware District Court alleging that Amgen and Wyeth have infringed U.S. Patent Number 6,270,766 by thedistribution and sale of ENBREL for the treatment of arthritis by co-administration with methotrexate.
Average Wholesale Price (“AWP”) Litigation
Amgen and Immunex are named as defendants, either separately or together, in numerous civil actionsbroadly alleging that they, together with many other pharmaceutical manufacturers, reported prices for certainproducts in a manner that allegedly inflated reimbursement under Medicare and/or Medicaid programs andcommercial insurance plans, including co-payments paid to providers who prescribe and administer the products.The complaints generally assert varying claims under the Medicare and Medicaid statutes, as well as state lawclaims for deceptive trade practices, common law fraud and various related state law claims. The complaints seekan undetermined amount of damages, as well as other relief, including declaratory and injunctive relief.
The AWP litigation was commenced against Amgen and Immunex on December 19, 2001 with the filing ofCitizens for Consumer Justice, et al. v. Abbott Laboratories, Inc., et al. Additional cases have been filed sincethat time. Most of these actions, as discussed below, have been consolidated, or are in the process of being con-solidated, in a federal Multi-District Litigation proceeding (the “MDL Proceeding”), captioned In Re:Pharmaceutical Industry Average Wholesale Price Litigation MDL No. 1456 and pending in the MassachusettsDistrict Court.
These cases have been consolidated into the MDL Proceeding, are being brought by consumer classes andcertain state and local governmental entities. These cases consist of the following:
Citizens for Consumer Justice, et al., v. Abbott Laboratories, Inc., et al.; Teamsters Health & Welfare Fundof Philadelphia, et al., v. Abbott Laboratories, Inc., et al.; Action Alliance of Senior Citizens of GreaterPhiladelphia v. Immunex Corporation; Constance Thompson, et al., v. Abbott Laboratories, Inc., et al.; Ro-nald Turner, et al., v. Abbott Laboratories, Inc., et al.; Congress of California Seniors v. AbbottLaboratories, Inc., et al.; County of Suffolk v. Abbott Laboratories, Inc., et al.; County of Westchester v.Abbott Laboratories, Inc., et al.; County of Rockland v. Abbott Laboratories, Inc., et al.; City of New York v.Abbott Laboratories, Inc., et al.; County of Nassau v. Abbott Laboratories, Inc., et al; County of Onondaga
F-45
AMGEN INC.
NOTES TO CONSOLIDATED FINANCIAL STATEMENTS (Continued)
v. Abbott Laboratories, Inc., et al.; County of Erie v. Abbott Laboratories, Inc., et al.; County of Chenangov. Abbott Laboratories, Inc., et al.; County of Chautauqua v. Abbott Laboratories, Inc., et al.; County ofTompkins v. Abbott Laboratories, Inc., et al.; County of Wayne v. Abbott Laboratories, Inc., et al.; Countyof Monroe v. Abbott Laboratories, Inc., et al.; County of Washington v. Abbott Laboratories, Inc., et al.;County of Herkimer v. Abbott Laboratories, Inc., et al.; County of Cayuga v. Abbott Laboratories, Inc., etal.; County of Allegany v. Abbott Laboratories, Inc., et al.; County of Rensselaer v. Abbott Laboratories,Inc., et al.; County of Albany v. Abbott Laboratories, Inc., et al.; County of Cattaraugus v. Abbott Labo-ratories, Inc., et al.; County of Yates v. Abbott Laboratories, Inc., et al.; County of Broome v. AbbottLaboratories, Inc., et al.; County of Warren v. Abbott Laboratories, Inc., et al.; County of Greene v. AbbottLaboratories, Inc., et al.; County of Saratoga v. Abbott Laboratories, Inc., et al.; County of St. Lawrence v.Abbott Laboratories, Inc., et al.; County of Oneida v. Abbott Laboratories, Inc., et al.; County of Genesee v.Abbott Laboratories, Inc., et al.; County of Fulton v. Abbott Laboratories, Inc., et al.; County of Steuben v.Abbott Laboratories, Inc., et al.; County of Putnam v. Abbott Laboratories, Inc., et al.; County of Niagara v.Abbott Laboratories, Inc., et al.; County of Jefferson v. Abbott Laboratories, Inc., et al.; County of Madisonv. Abbott Laboratories, Inc., et al.; County of Lewis v. Abbott Laboratories, Inc., et al.; County of Columbiav. Abbott Laboratories, Inc., et al.; County of Essex v. Abbott Laboratories, Inc., et al.; County of Cortlandv. Abbott Laboratories, Inc., et al.; County of Seneca v. Abbott Laboratories, Inc., et al.; County of Orleansv. Abbott Laboratories, Inc., et al.; County of Duchess v. Abbott Laboratories, Inc., et al.; County of Ontariov. Abbott Laboratories, Inc., et al.; County of Schuyler v. Abbott Laboratories, Inc., et al.; County of Wyom-ing v. Abbott Laboratories, Inc., et al.; State of California ex rel. Ven-A-Care of the Florida Keys, Inc. v.Abbott Laboratories, Inc., et al., State of Iowa v. Abbott Laboratories, Inc., et al.
In the MDL Proceeding, the Massachusetts District Court has set various deadlines relating to motions todismiss the complaints, discovery, class certification, summary judgment and other pre-trial issues. For the pri-vate class action cases, the Massachusetts District Court has divided the defendant companies into a Track Igroup and a Track II group. Both Amgen and Immunex are in the Track II group. On March 2, 2006, plaintiffsfiled a fourth amended master consolidated complaint, which did not include their motion for class certificationas to the Track II group. On September 12, 2006, a hearing before the Massachusetts District Court was held onplaintiffs’ motion for class certification as to the Track II group defendants, which include Amgen and Immunex.On March 7, 2008, the Track II defendants reached a tentative class settlement of the MDL Proceeding, whichwas subsequently amended on April 3, 2008. The tentative Track II settlement relates to claims against numerousdefendants, including Abbott Laboratories, Inc., Amgen Inc., Aventis Pharmaceuticals Inc., Hoechst MarionRoussel, Inc., Baxter Healthcare Corporation, Baxter International Inc., Bayer Corporation, Dey, Inc., FujisawaHealthcare, Inc., Fujisawa USA, Inc., Immunex Corporation, Pharmacia Corporation, Pharmacia & Upjohn LLC(f/k/a Pharmacia & Upjohn, Inc.), Sicor, Inc., Gensia, Inc., Gensia Sicor Pharmaceuticals, Inc., Watson Pharma-ceuticals, Inc. and ZLB Behring, L.L.C. A hearing before the Massachusetts District Court was held on April 9,2008 and on July 2, 2008, the Massachusetts District Court issued an order of preliminary approval of the TrackII defendants’ class settlement and scheduled a fairness hearing for December 16, 2008. At that hearing, theMassachusetts District Court was not satisfied with several notice requirements the plaintiffs were to have com-pleted prior to the hearing and rescheduled the fairness hearing for April 27, 2009.
At the April 27, 2009, fairness hearing, the Massachusetts District Court was still not satisfied with severalnotice requirements and refused to grant final approval of the settlement agreement until those deficiencies weresatisfied. The Massachusetts District Court held a May 28, 2009 status conference where mediation with respectto all non-settling MDL Proceeding cases was discussed. Final approval hearing of the Track II settlement beforethe Massachusetts District Court was scheduled for October 21, 2009. However, plaintiffs filed for an extensionof the final approval hearing due to continued deficiencies in executing notices.
For the state and local governmental entities in the MDL Proceeding, on July 30, 2008, the MassachusettsDistrict Court issued an order granting in part and denying in part Amgen’s renewed Motion to Dismiss the First
F-46
AMGEN INC.
NOTES TO CONSOLIDATED FINANCIAL STATEMENTS (Continued)
Amended Consolidated Complaint filed by New York City and 44 New York counties in the MDL Proceeding.The judge dismissed claims relating to all of Amgen’s products named in the New York counties’ first amend-ed complaint with the exception of claims relating to NEUPOGEN®. Subsequent to the filing of Amgen’smotion, the New York counties filed a Revised First Amended Consolidated Complaint. It is unclear what bear-ing the Massachusetts District Court’s decision will have on the revised complaint.
Certain AWP litigation cases remain part of the MDL Proceeding but are likely to be remanded. Thesecases are:
State of Iowa v. Abbott Laboratories, Inc., et al. This case was filed against Amgen and Immunex, alongwith several other pharmaceutical manufacturers, on October 9, 2007 in the U.S. District Court for the SouthernDistrict of Iowa. On October 9, 2007, Immunex was served with the complaint and on October 25, 2007, Amgenwas served with the complaint. On November 20, 2007, this case was removed to the District of Massachusettsand was transferred to the MDL Proceeding. On January 18, 2008, a status conference was held. A Joint Motionto Dismiss was filed on February 20, 2008, and the motion was granted in part, denied in part on August 29,2008. On January 22, 2009, Amgen’s motion to dismiss in part regarding EPOGEN® was granted. On Oc-tober 15, 2009, Amgen and Immunex reached a settlement with the state, and on November 9, 2009, bothcompanies were dismissed with prejudice from the matter.
Certain AWP litigation cases are not a part of the MDL Proceeding. These cases are:
Commonwealth of Pennsylvania v. TAP Pharmaceutical Products, Inc., et al. This case was filed againstAmgen in the Commonwealth Court for Pennsylvania in Harrisburg, Pennsylvania on March 10, 2004. OnMarch 10, 2005, the Commonwealth of Pennsylvania filed an amended complaint, adding Immunex, and defend-ants filed Preliminary Objections. A hearing on the Preliminary Objections was held on June 8, 2005. On July 13,2005, defendants filed a notice of removal from the Commonwealth Court for Pennsylvania to the U.S. DistrictCourt for the Eastern District of Pennsylvania (the “Pennsylvania District Court”). This case was remanded tostate court by order dated September 9, 2005. On October 11, 2006, the case was removed to the PennsylvaniaDistrict Court. Plaintiffs filed a motion to remand and on January 22, 2007, the Pennsylvania District Courtstayed the case pending transfer to the MDL Proceeding. A hearing on plaintiff’s motion to remand was held onFebruary 1, 2007. On September 1, 2007, the case was remanded to the Commonwealth Court for Pennsylvania.Currently, the parties have briefed and are awaiting the court’s ruling on the protective order to be entered in thecase. Amgen and Immunex reached a settlement with the Commonwealth of Pennsylvania on November 17,2009. On December 23, 2009, the judge granted plaintiff’s motion to discontinue with prejudice the case againstAmgen and Immunex.
County of Erie v. Abbott Laboratories, Inc., et al. This case was filed against Amgen and Immunex onMarch 8, 2005, in the Supreme Court of New York, Erie County. The complaint alleges that all defendants par-ticipated in a scheme to market the spread between the true wholesale price (i.e., selling price) and the false andinflated AWP reported, in order to increase market share, thus defrauding the county Medicaid program. OnApril 15, 2005, defendants filed a notice of removal from the state court to the U.S. District Court for the West-ern District of New York (the “New York District Court”). This case was remanded to state court by order datedJanuary 10, 2006. On September 7, 2006, the state court granted in part, and denied in part, defendants’ motionsto dismiss. Immunex’s motion to dismiss was granted and Amgen’s motion to dismiss was denied. On Oc-tober 11, 2006, this case was removed to the New York District Court. On September 1, 2007, the case wasremanded to the state court. The State of New York Litigation Coordinating Panel granted defendants’ motions tocoordinate the Erie, Oswego and Schenectady County cases.
County of Schenectady v. Abbott Laboratories, Inc., et al. This case was filed against Amgen and Immunex,along with several other pharmaceutical manufacturers, on May 9, 2006 in the Supreme Court of New York,Schenectady County. On August 21, 2006, Immunex was served with the complaint and on August 24, 2006,Amgen was served with the complaint. On October 11, 2006, this case was removed to the
F-47
AMGEN INC.
NOTES TO CONSOLIDATED FINANCIAL STATEMENTS (Continued)
U.S. District Court for the Northern District of New York. On September 1, 2007, the case was remanded to thestate court. The State of New York Litigation Coordinating Panel granted defendants’ motions to coordinate theErie, Oswego and Schenectady County cases.
County of Oswego v. Abbott Laboratories, Inc., et al. This case was filed against Amgen and Immunex,along with several other pharmaceutical manufacturers, on May 9, 2006 in the Supreme Court of New York,Oswego County. On August 21, 2006, Immunex was served with the complaint and on August 24, 2006, Amgenwas served with the complaint. On October 11, 2006, this case was removed to the U.S. District Court for theNorthern District of New York. On September 1, 2007, the case was remanded to the state court. The State ofNew York Litigation Coordinating Panel granted defendants’ motions to coordinate the Erie, Oswego and Sche-nectady County cases.
State of Kansas, ex rel Steve Six v. Amgen Inc. and Immunex Corporation. On November 3, 2008, the Stateof Kansas filed a complaint against Amgen and Immunex in the District Court of Wyandotte County, Kansas,Civil Court Division. Approximately forty other pharmaceutical manufacturers were also sued by the state. Plain-tiff Kansas alleges that the manufacturers misrepresented product pricing information reported to the state byfalsely inflating those prices. A hearing on defendants’ motion to dismiss occurred on March 5, 2009, followingwhich the court denied the motion.
Federal Securities Litigation — In re Amgen Inc. Securities Litigation
The six federal class action shareholder complaints filed against Amgen Inc., Kevin W. Sharer, Richard D.Nanula, Dennis M. Fenton, Roger M. Perlmutter, Brian M. McNamee, George J. Morrow, Edward V. Fritzky,Gilbert S. Omenn and Franklin P. Johnson, Jr., (the “Federal Defendants”) in the United States District Court forthe Central District of California (the “California Central District Court”) on April 17, 2007 (Kairalla v. AmgenInc., et al.), May 1, 2007 (Mendall v. Amgen Inc., et al., & Jaffe v. Amgen Inc., et al.), May 11, 2007 (Eldon v.Amgen Inc., et al.), May 21, 2007 (Rosenfield v. Amgen Inc., et al.) and June 18, 2007 (Public Employees’ Re-tirement Association of Colorado v. Amgen Inc., et al.) were consolidated by the California Central DistrictCourt into one action captioned In re Amgen Inc. Securities Litigation. The consolidated complaint was filed withthe California Central District Court on October 2, 2007. The consolidated complaint alleges that Amgen andthese officers and directors made false statements that resulted in: (i) deceiving the investing public regardingAmgen’s prospects and business; (ii) artificially inflating the prices of Amgen’s publicly traded securities and(iii) causing plaintiff and other members of the class to purchase Amgen publicly traded securities at inflatedprices. The complaint also makes off-label marketing allegations that, throughout the class period, the FederalDefendants improperly marketed Aranesp® and EPOGEN® for off-label uses while aware that there were allegedsafety signals with these products. The plaintiffs seek class certification, compensatory damages, legal fees andother relief deemed proper. The Federal Defendants filed a motion to dismiss on November 8, 2007. On Febru-ary 4, 2008, the California Central District Court granted in part, and denied in part, the Federal Defendants’motion to dismiss the consolidated amended complaint. Specifically, the California Central District Court grant-ed the Federal Defendants’ motion to dismiss as to individual defendants Fritzky, Omenn, Johnson, Fenton andMcNamee, but denied the Federal Defendants’ motion to dismiss as to individual defendants Sharer, Nanula,Perlmutter and Morrow.
A class certification hearing before the California Central District Court, was held on July 17, 2009 and onAugust 12, 2009, the California Central District Court granted Plaintiffs’ motion for class certification. On Au-gust 28, 2009, Amgen filed a petition for permission to appeal with the U.S. Court of Appeals for the 9th Circuit(the “9th Circuit”) under Rule 23(f), regarding the Order on Class Certification and the 9th Circuit granted Am-gen’s appeal on December 11, 2009. Amgen’s brief is due March 29, 2010 and plaintiff’s brief is due April 27,2010. On January 25, 2010, oral argument was heard on Amgen’s motion to stay the case in the California Cen-tral District Court which was granted on February 2, 2010.
F-48
AMGEN INC.
NOTES TO CONSOLIDATED FINANCIAL STATEMENTS (Continued)
State Derivative Litigation
Larson v. Sharer, et al.
The three state shareholder derivative complaints filed against Amgen Inc., Kevin W. Sharer, George J. Mor-row, Dennis M. Fenton, Brian M. McNamee, Roger M. Perlmutter, David Baltimore, Gilbert S. Omenn, Judith C.Pelham, Frederick W. Gluck, Jerry D. Choate, J. Paul Reason, Frank J. Biondi, Jr., Leonard D. Schaeffer, FrankC. Herringer, Richard D. Nanula, Willard H. Dere, Edward V. Fritzky, Franklin P. Johnson, Jr. and Donald B.Rice as defendants (the “State Defendants”) on May 1, 2007 (Larson v. Sharer, et al., & Anderson v. Sharer, etal.), and August 13, 2007 (Weil v. Sharer, et al.) in the Superior Court of the State of California, Ventura County(the “Superior Court”) were consolidated by the Superior Court under one action captioned Larson v. Sharer, etal. The consolidated complaint was filed on July 5, 2007. The complaint alleges that the State Defendantsbreached their fiduciary duties, wasted corporate assets, were unjustly enriched and violated the CaliforniaCorporations Code. Plaintiffs allege that the State Defendants failed to disclose and/or misrepresented results ofAranesp® clinical studies, marketed both Aranesp® and EPOGEN® for off-label uses and that these actions orinactions caused shareholders to suffer damages. The complaints also allege insider trading by the State Defend-ants. The plaintiffs seek treble damages based on various causes of action, reformed corporate governance,equitable and/or injunctive relief, restitution, disgorgement of profits, benefits and other compensation, and legalcosts.
An amended consolidated complaint was filed on March 13, 2008, adding Anthony Gringeri as a defendantand removing the causes of action for insider selling and misappropriation of information, violation of CaliforniaCorporations Code Section 25402 and violation of California Corporations Code Section 25403. On July 14,2008, the Superior Court dismissed without prejudice the consolidated state derivative class action. The judge al-so ordered a stay of any re-filing of an amended complaint until the federal court has determined whether anysecurities fraud occurred.
Birch v. Sharer, et al.
On January 23, 2009, a shareholder derivative lawsuit titled Birch v. Sharer, et al. was filed in Los AngelesCounty Superior Court naming Amgen Inc., Kevin W. Sharer, David Baltimore, Frank J. Biondi, Jr., Jerry D.Choate, Vance D. Coffman, Frederick W. Gluck, Frank C. Herringer, Gilbert S. Omenn, Judith C. Pelham, J.Paul Reason, Leonard D. Schaeffer and Tom Zindrick as defendants. The complaint alleges derivative claims forbreach of fiduciary duty based on a purported failure to implement adequate internal controls and to oversee theCompany’s operations, which plaintiff claims resulted in numerous lawsuits and investigations over a number ofyears. Plaintiff seeks damages on behalf of Amgen, including costs and expenses, allegedly incurred, among oth-er things, in connection with wrongful termination lawsuits and potential violations of the Health InsurancePortability and Accountability Act (“HIPPA”). On February 25, 2009, the case was reassigned to a judge in theComplex Department of the Los Angeles County Superior Court and the initial status conference has beenscheduled for May 13, 2009. Amgen and the individual defendants filed motions to dismiss on June 23, 2009.
Oral argument on Amgen and the individual defendants’ motions to dismiss were heard on September 25,2009 before the Los Angeles County Superior Court and the court granted the motions to dismiss but allowed theplaintiff an opportunity to amend her complaint by October 21, 2009. Plaintiff filed a request for dismissal with-out prejudice with the court on October 23, 2009. On October 29, 2009, Amgen received from plaintiff Birch astockholder demand on the Board of Directors to take action to remedy breaches of fiduciary duties by the direc-tors and certain executive officers of the Company. The stockholder alleged that the directors and certainexecutive officers violated their core fiduciary principles, causing Amgen to suffer damages. The stockholderdemanded that the Board of Directors take action against each of the officers and directors to recover damagesand to correct deficiencies in the Company’s internal controls that allowed the misconduct to occur. The Board ofDirectors is currently undertaking an investigation into the allegations made by the stockholder.
F-49
AMGEN INC.
NOTES TO CONSOLIDATED FINANCIAL STATEMENTS (Continued)
On February 8, 2010, plaintiff Shelly Birch filed another shareholder demand lawsuit in the Los AngelesSuperior Court against the same defendants in the original lawsuit but also adding Board of Directors membersFrancois de Carbonnel and Rebecca Henderson. The allegations in the new complaint are nearly identical tothose in the previously filed complaint.
Federal Derivative Litigation
On May 7, 2007, the shareholder derivative lawsuit of Durgin v. Sharer, et al., was filed in the CaliforniaCentral District Court and named Amgen Inc., Kevin W. Sharer, George J. Morrow, Dennis M. Fenton, Brian M.McNamee, Roger M. Perlmutter, David Baltimore, Gilbert S. Omenn, Judith C. Pelham, Frederick W. Gluck,Jerry D. Choate, J. Paul Reason, Frank J. Biondi, Jr., Leonard D. Schaeffer, Frank C. Herringer, Richard D.Nanula, Edward V. Fritzky and Franklin P. Johnson, Jr. as defendants. The complaint alleges the same claimsand requests the same relief as in the three state shareholder derivative complaints now consolidated as Larson v.Sharer, et al. The case has been stayed for all purposes until thirty days after a final ruling on the motion to dis-miss by the California Central District Court in the In re Amgen Inc. Securities Litigation action.
On September 21, 2007, the shareholder derivative lawsuit of Rosenblum v. Sharer, et al., was filed in theCalifornia Central District Court. This lawsuit was brought by the shareholder who previously made a demand onthe Amgen Board on May 14, 2007. The complaint alleges that the defendants breached their fiduciary duties,wasted corporate assets and were unjustly enriched. Plaintiffs allege that the defendants failed to disclose and/ormisrepresented results of Aranesp® clinical studies, marketed both Aranesp® and EPOGEN® for off-label usesand that these actions or inactions as well as the Amgen market strategy caused damage to the Company resultingin several inquiries, investigations and lawsuits that are costly to defend. The complaint also alleges insider trad-ing by the defendants. The plaintiffs seek treble damages based on various causes of action, reformed corporategovernance, equitable and/or injunctive relief, restitution, disgorgement of profits, benefits and other compensa-tion, and legal costs. The case was stayed for all purposes until thirty days after a final ruling on the motion todismiss by the California Central District Court in the In re Amgen Inc. Securities Litigation action.
Thereafter, on May 1, 2008, plaintiff in Rosenblum v. Sharer, et al., filed an amended complaint which re-moved Dennis Fenton as a defendant and also eliminated the claims for insider selling by defendants. On July 28,2008, the California Central District Court heard Amgen and the defendants’ motion to dismiss and motion tostay. On July 30, 2008, the California Central District Court granted Amgen and the defendants’ motion to dis-miss without prejudice and also granted a stay of the case pending resolution of the In re Amgen Inc. SecuritiesLitigation action.
ERISA Litigation
On August 20, 2007, the ERISA class action lawsuit of Harris v. Amgen Inc., et al., was filed against Am-gen and certain members of its Board of Directors in the California Central District Court. Plaintiffs claim thatAmgen and various Board members breached their fiduciary duties by failing to inform current and former em-ployees who participated in the Amgen Retirement and Savings Manufacturing Plan and the Amgen Savings Planof the alleged off-label promotion of both Aranesp® and EPOGEN® while a number of studies allegedly demon-strated safety concerns in patients using ESAs. On February 4, 2008, the California Central District Courtdismissed the complaint with prejudice as to plaintiff Harris, who had filed claims against Amgen Inc. Theclaims alleged by the second plaintiff, Ramos, were also dismissed but the court granted the plaintiff leave toamend his complaint. On February 1, 2008, the plaintiffs appealed the decision by the California Central DistrictCourt to dismiss the claims of both plaintiffs Harris and Ramos to the 9th Circuit, which remains pending beforethe 9th Circuit. On May 19, 2008, plaintiff Ramos in the Harris v. Amgen Inc., et al., action filed another lawsuitcaptioned Ramos v. Amgen Inc., et al., in the California Central District Court. The lawsuit is another ERISAclass action. The Ramos v. Amgen Inc., et al., matter names the same defendants in the Harris v. Amgen Inc., etal., matter plus four new defendants: Amgen Manufacturing Limited, Richard Nanula, Dennis Fenton and the Fi-duciary Committee. Pursuant to the parties’ stipulation, the Ramos matter has been stayed pending the outcome
F-50
AMGEN INC.
NOTES TO CONSOLIDATED FINANCIAL STATEMENTS (Continued)
of the Harris matter appeal. Oral argument before the 9th Circuit on the plaintiffs’ appeal of the California CentralDistrict Court’s dismissal of the plaintiffs’ claims occurred on May 8, 2009. On July 14, 2009, the 9th Circuit re-versed the California Central District Court’s decision and remanded the case back to the district court. In themeantime, a third ERISA class action was filed by Don Hanks on June 2, 2009 in the Central District of Cal-ifornia alleging the same ERISA violations as in the Harris and Ramos lawsuits.
On October 13, 2009, the California Central District Court granted plaintiffs Harris’ and Ramos’ motion tobe appointed interim co-lead counsel. Plaintiffs filed an amended complaint on November 11, 2009 and addedtwo additional plaintiffs, Jorge Torres and Albert Cappa. Amgen filed a motion to dismiss the amended/consolidated complaint on December 16, 2009. Plaintiffs filed their opposition on January 19, 2010. The motionto dismiss was argued on February 11, 2010 but no ruling from the California Central District Court has been is-sued.
Third-Party Payers Litigation
On June 5, 2007, the United Food & Commercial Workers Central Pennsylvania and Regional Health &Welfare Fund v. Amgen Inc. (the “United Food Matter”), on June 7, 2007 the Vista Healthplan Inc. v. Amgen Inc.(the “Vista Healthplan Matter”), on June 14, 2007, the Painters District Council No. 30 Health & Welfare Fundv. Amgen. Inc. (the “Painters Matter”), on August 8, 2007, the Ironworkers v. Amgen Inc. (the “IronworkersMatter”), on August 15, 2007, Watters (State of Michigan) v. Amgen Inc. (the “Watters Matter”), and on Au-gust 28, 2007, Sheet Metal v. Amgen Inc. (the “Sheet Metal Matter”), putative class action lawsuits, were filed bythird-party payers against Amgen in the California Central District Court. In each action, the plaintiff alleges thatAmgen marketed its anemia medicines, EPOGEN® and Aranesp®, for “off-label” uses, or uses that are not ap-proved by the FDA, and claims that, as a result, the plaintiff paid for unwarranted prescriptions. Specifically, thecomplaints allege that Amgen promoted EPOGEN® and Aranesp® for: treating cancer patients who are not onchemotherapy; treating quality of life symptoms associated with anemia, such as fatigue; and reaching hemoglo-bin targets above the FDA-approved level. Each plaintiff asserts claims under California’s consumer protectionstatutes and for breach of implied warranty and unjust enrichment and plaintiffs seek to represent a nationwideclass of individuals and entities.
On October 29, 2007, in the United Food Matter, the Vista Healthplan Matter and the Painters Matter, a mo-tion to dismiss and a motion to transfer each of the three cases were heard before California Central DistrictCourt. On November 13, 2007, the United Food Matter was transferred to the U.S. District Court for the Districtof Pennsylvania, the Vista Healthplan Matter was transferred to the U.S. District Court for the Southern Districtof Florida and the Painters Matter was transferred to the U.S. District Court for the Northern District of Illinois.On December 4, 2007, the Watters Matter was transferred to the U.S. District Court for the Eastern District ofMichigan. On January 25, 2008, the Ironworkers Matter was transferred back to the District Court of New Jersey.On February 4, 2008, the California Central District Court heard defendants’ motion to dismiss and motion totransfer the Sheet Metal Matter back to the U.S. District Court for the Middle District of Pennsylvania.
On January 10, 2008, plaintiffs in the United Food Matter brought a motion before the Judicial Panel onMulti-District Litigation (“MDL”) seeking to have the five third-party payer lawsuits consolidated into one MDLcase and assigned to the Northern District of Illinois. Defendants filed an opposition to the MDL consolidationmotion on February 3, 2008.
On January 11, 2008, the Vista Healthplan Matter was voluntarily dismissed. On April 8, 2008, the JudicialPanel on MDL granted plaintiffs’ motion in the United Food Matter to centralize the five third-party payer law-suits into one MDL case for the purpose of consolidated pre-trial proceedings and the five cases have beentransferred back to the California Central District Court. The five cases will be transferred back to their re-spective jurisdictions if and when they are set for trial. On December 17, 2008, the MDL Court granted
F-51
AMGEN INC.
NOTES TO CONSOLIDATED FINANCIAL STATEMENTS (Continued)
Defendants’ motion to dismiss without prejudice and, on January 30, 2009, plaintiffs filed an Amended Con-solidated Class Action Complaint, which is predicated on similar underlying allegations. Amgen filed its motionto dismiss the amended and consolidated MDL complaint on March 6, 2009. On June 17, 2009, the CaliforniaCentral District Court granted Amgen’s motion and dismissed the entire action with prejudice. On July 17, 2009,Plaintiffs filed a notice of appeal with the 9th Circuit. Opening briefs were filed by the Plaintiffs in the 9th Circuiton January 4, 2010. Amgen’s Opposition Brief will be filed on March 5, 2010. No date for oral argument hasbeen set.
Qui Tam Actions
A United States government filing in the Massachusetts District Court concerning the partially unsealedcomplaint filed pursuant to the Qui Tam provisions of the Federal Civil False Claims Act and on behalf of 17named states and the District of Columbia under their respective State False Claims Acts (the “MassachusettsQui Tam Action”) became public on or about May 7, 2009. The filing states that the relator in the MassachusettsQui Tam Action is a former Amgen employee. Further, the filing represents that, in addition to the MassachusettsQui Tam Action, there are currently nine other actions under the False Claim Act (“Qui Tam Actions”) pendingunder seal against Amgen, including eight pending in the U.S. District Court for the Eastern District of NewYork and one pending in the U.S. District Court for the Western District of Washington. While the Massachu-setts Qui Tam Action has been partially unsealed, the other nine Qui Tam Actions remain under seal and havenot been provided to Amgen. In the filing made public on May 7, 2009, the U.S. government represents thatthese ten Qui Tam Actions allege that Amgen engaged in a wide variety of illegal marketing practices with re-spect to various Amgen products and that these are joint civil and criminal investigations being conducted by awide variety and large number of federal and state agencies. The Massachusetts District Court held a status hear-ing on May 18, 2009 and ordered that the government make a decision whether or not to intervene in theMassachusetts Qui Tam Action by September 1, 2009.
On September 1, 2009, the U.S. government filed a notice of non-intervention and 14 states and the Districtof Columbia filed notices of intervention. The Massachusetts District Court gave the states and the private relator60 days from September 1 to file an amended complaint. Amgen filed a motion to unseal the record with regardto the Massachusetts Qui Tam Action on October 23, 2009. On October 30, 2009, 14 states and the District ofColumbia filed an amended complaint in the Massachusetts District Court entitled The United States of America,States of California, Delaware, Florida, Georgia, Hawaii, Illinois, Indiana, Louisiana, Michigan, Nevada, NewHampshire, New Mexico, New York, Tennessee and Texas and the Commonwealths of Massachusetts and Virgin-ia and the District of Columbia, ex rel Kassie Westmoreland v. Amgen Inc., Integrated Nephrology Network,AmerisourceBergen Specialty Group, ASD Healthcare and AmerisourceBergen Corporation. The relator, KassieWestmoreland, also filed a second amended complaint with the Massachusetts District Court on the same day.The complaints allege violations of the federal Anti-Kickback Statute and violations of state false claims actstatutes with regard to Amgen’s marketing of overfill in vials of Aranesp® and with regard to Amgen’s relation-ship with the Integrated Nephrology Network, a group purchasing organization. The relator’s seconded amendedcomplaint also alleges that Amgen retaliated against and wrongfully terminated Westmoreland.
At a status conference on November 17, 2009, the Massachusetts District Court ruled on the motion to un-seal, partially granting Amgen’s motion and ordering that the relator and states file all complaints byDecember 17, 2009. The judge also set a trial date of January 2011. On January 20, 2010, the states of Floridaand Texas voluntarily dismissed their complaints against Amgen. On February 1, 2010, Amgen filed motions todismiss both the multi-state complaint and the relator’s complaint and a motion to stay and sever the relator’semployment claims. On February 12, 2010, February 16, 2010 and February 18, 2010, respectively, the states ofNew Hampshire, Louisiana and Nevada voluntarily dismissed their complaints against Amgen. Plaintiffs’opposition pleadings were filed on February 22, 2010. On February 23, 2010, the state of Delaware voluntarilydismissed its complaint against Amgen. Also, on February 23, 2010, the Massachusetts District Court granted
F-52
AMGEN INC.
NOTES TO CONSOLIDATED FINANCIAL STATEMENTS (Continued)
Amgen’s motion to stay and sever the relator’s employment claims. A hearing on the motions to dismiss hasbeen scheduled by the Massachusetts District Court for March 11, 2010.
Warren General Hospital v. Amgen
On September 25, 2009, Warren General Hospital of Warren, Pennsylvania (on its behalf and all others sim-ilarly situated) filed a class action in the U.S. District Court for the District of New Jersey againstAmgen alleging Federal antitrust violations under Section 1 of the Sherman Act and Section 3 of the Clayton Actbased on Amgen’s contracting practices. The complaint seeks damages including treble damages, attorneys’ feesand costs. Amgen filed a Motion to Dismiss the complaint on December 9, 2009. Class plaintiff filed its opposi-tion on January 15, 2010 and Amgen filed its reply on February 8, 2010. The District Court has indicated that itwill decide the motion without a hearing on or after February 16, 2010.
Other
On May 10, 2007, Amgen received a subpoena from the Attorney General of the State of New York seekingdocuments related to Amgen’s promotional activities, sales and marketing activities, medical education, clinicalstudies, pricing and contracting, license and distribution agreements and corporate communications. Amgen con-tinues to fully cooperate in responding to the subpoena.
On October 25, 2007, Amgen received a subpoena from the U.S. Attorney’s Office, Eastern District of NewYork, seeking documents relating to its products. On July 29, 2009, Amgen was served with a second subpoenafrom the U.S. Attorney’s Office for the Eastern District of New York related to dosing. Amgen continues to fullycooperate with the requests. On January 6, 2010, Amgen was served with a third subpoena from the U.S. Attor-ney’s Office, Eastern District of New York, related to Average Sales Price and on February 5, 2010, Amgen wasserved with a fourth subpoena from the U.S. Attorney’s Office, Eastern District of New York, related to certainclinical trials on dosing. Amgen intends to cooperate fully with the government’s requests.
On November 1, 2007, Amgen received a subpoena from the U.S. Attorney’s Office, Western District ofWashington, for production of documents relating to its products. On July 18, 2008, Amgen received a secondsubpoena from the U.S. Attorney’s Office, Western District of Washington, pursuant to the Health InsurancePortability and Accountability Act of 1996 (18 U.S.C. 3486), which requests documents relating generally toAmgen’s collection and dissemination of information regarding clinical research on the efficacy and safety ofESAs. On May 12, 2009, Amgen was served with a third subpoena from the U.S. Attorney’s Office for theWestern District of Washington related to Johnson and Johnson clinical trials and correspondence with payers.On August 19, 2009, Amgen was served with a fourth subpoena from the U.S. Attorney’s Office for the WesternDistrict of Washington related to the ‘219 clinical trial. On December 9, 2009, Amgen received a fifth subpoenafrom the U.S. Attorney’s Office for the Western District of Washington which requested additional informationgenerally related to the compendia, reimbursement and the ‘219 clinical trial. Amgen is cooperating with thegovernment’s document requests. On February 11, 2010, Amgen received a sixth subpoena from the U.S. Attor-ney’s Office for the Western District of Washington which requested documents related to Amgen’s products andemployees. Also in 2010, a former Amgen employee was notified by the U.S. Attorney’s Office of the WesternDistrict of Washington that the former employee was a target of the investigation.
On January 14, 2008, Amgen received a subpoena from the New Jersey Attorney General’s Office for pro-duction of documents relating to one of its products. Amgen has completed its response per the terms of thesubpoena.
In the ordinary course of business, we are involved in various legal proceedings and other matters, includingthose discussed in this Note. While it is not possible to accurately predict or determine the eventual outcome ofthese items, one or more of these items currently pending could have a material adverse effect on our con-solidated results of operations, financial position or cash flows.
F-53
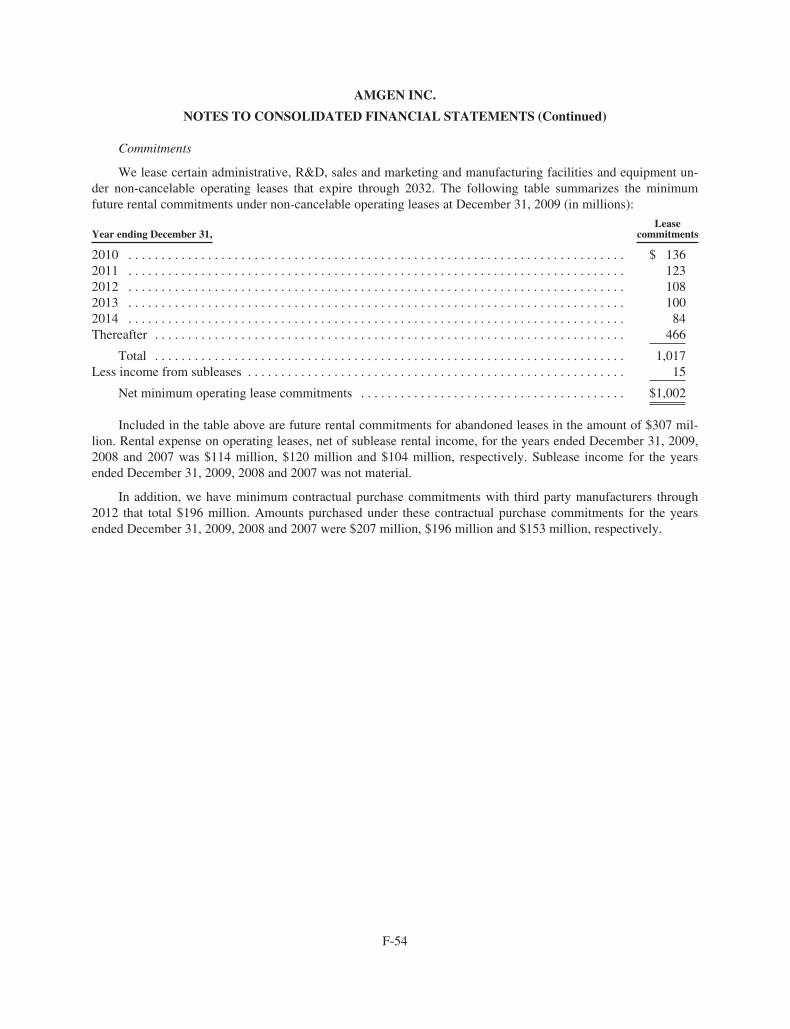
AMGEN INC.
NOTES TO CONSOLIDATED FINANCIAL STATEMENTS (Continued)
Commitments
We lease certain administrative, R&D, sales and marketing and manufacturing facilities and equipment un-der non-cancelable operating leases that expire through 2032. The following table summarizes the minimumfuture rental commitments under non-cancelable operating leases at December 31, 2009 (in millions):
Year ending December 31,Lease
commitments
2010 . . . . . . . . . . . . . . . . . . . . . . . . . . . . . . . . . . . . . . . . . . . . . . . . . . . . . . . . . . . . . . . . . . . . . . . . . . . $ 1362011 . . . . . . . . . . . . . . . . . . . . . . . . . . . . . . . . . . . . . . . . . . . . . . . . . . . . . . . . . . . . . . . . . . . . . . . . . . . 1232012 . . . . . . . . . . . . . . . . . . . . . . . . . . . . . . . . . . . . . . . . . . . . . . . . . . . . . . . . . . . . . . . . . . . . . . . . . . . 1082013 . . . . . . . . . . . . . . . . . . . . . . . . . . . . . . . . . . . . . . . . . . . . . . . . . . . . . . . . . . . . . . . . . . . . . . . . . . . 1002014 . . . . . . . . . . . . . . . . . . . . . . . . . . . . . . . . . . . . . . . . . . . . . . . . . . . . . . . . . . . . . . . . . . . . . . . . . . . 84Thereafter . . . . . . . . . . . . . . . . . . . . . . . . . . . . . . . . . . . . . . . . . . . . . . . . . . . . . . . . . . . . . . . . . . . . . . . 466
Total . . . . . . . . . . . . . . . . . . . . . . . . . . . . . . . . . . . . . . . . . . . . . . . . . . . . . . . . . . . . . . . . . . . . . . . 1,017Less income from subleases . . . . . . . . . . . . . . . . . . . . . . . . . . . . . . . . . . . . . . . . . . . . . . . . . . . . . . . . . 15
Net minimum operating lease commitments . . . . . . . . . . . . . . . . . . . . . . . . . . . . . . . . . . . . . . . . $1,002
Included in the table above are future rental commitments for abandoned leases in the amount of $307 mil-lion. Rental expense on operating leases, net of sublease rental income, for the years ended December 31, 2009,2008 and 2007 was $114 million, $120 million and $104 million, respectively. Sublease income for the yearsended December 31, 2009, 2008 and 2007 was not material.
In addition, we have minimum contractual purchase commitments with third party manufacturers through2012 that total $196 million. Amounts purchased under these contractual purchase commitments for the yearsended December 31, 2009, 2008 and 2007 were $207 million, $196 million and $153 million, respectively.
F-54
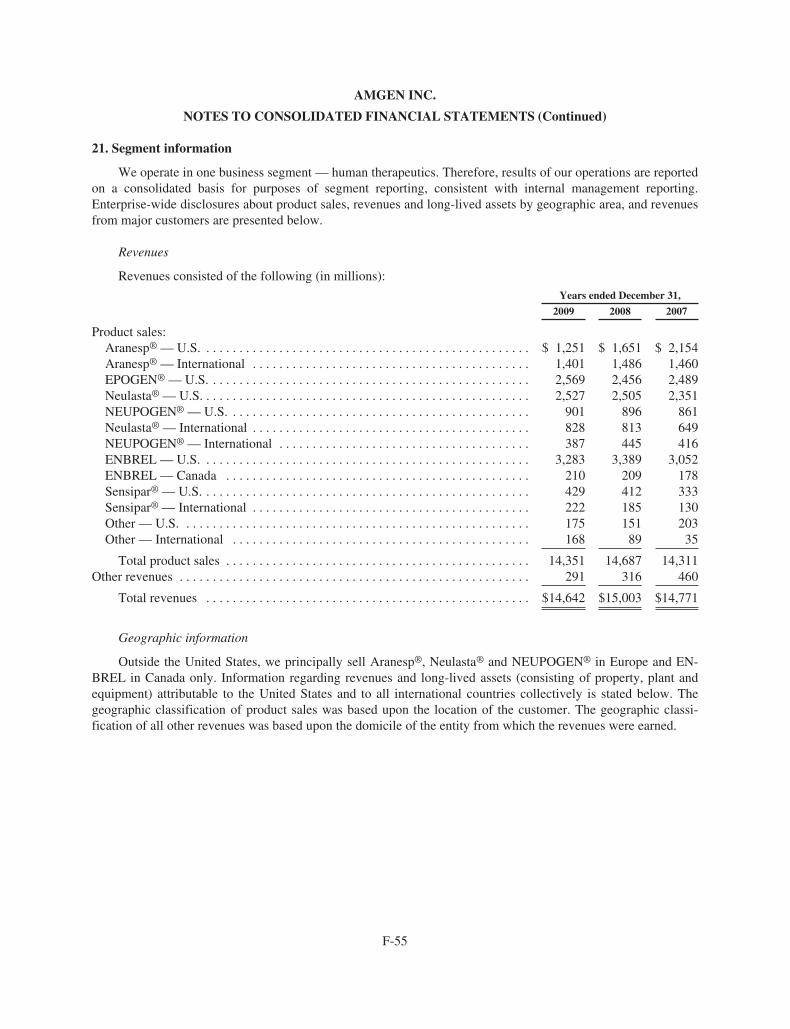
AMGEN INC.
NOTES TO CONSOLIDATED FINANCIAL STATEMENTS (Continued)
21. Segment information
We operate in one business segment — human therapeutics. Therefore, results of our operations are reportedon a consolidated basis for purposes of segment reporting, consistent with internal management reporting.Enterprise-wide disclosures about product sales, revenues and long-lived assets by geographic area, and revenuesfrom major customers are presented below.
Revenues
Revenues consisted of the following (in millions):
Years ended December 31,
2009 2008 2007
Product sales:Aranesp® — U.S. . . . . . . . . . . . . . . . . . . . . . . . . . . . . . . . . . . . . . . . . . . . . . . . . . $ 1,251 $ 1,651 $ 2,154Aranesp® — International . . . . . . . . . . . . . . . . . . . . . . . . . . . . . . . . . . . . . . . . . . 1,401 1,486 1,460EPOGEN® — U.S. . . . . . . . . . . . . . . . . . . . . . . . . . . . . . . . . . . . . . . . . . . . . . . . . 2,569 2,456 2,489Neulasta® — U.S. . . . . . . . . . . . . . . . . . . . . . . . . . . . . . . . . . . . . . . . . . . . . . . . . . 2,527 2,505 2,351NEUPOGEN® — U.S. . . . . . . . . . . . . . . . . . . . . . . . . . . . . . . . . . . . . . . . . . . . . . 901 896 861Neulasta® — International . . . . . . . . . . . . . . . . . . . . . . . . . . . . . . . . . . . . . . . . . . 828 813 649NEUPOGEN® — International . . . . . . . . . . . . . . . . . . . . . . . . . . . . . . . . . . . . . . 387 445 416ENBREL — U.S. . . . . . . . . . . . . . . . . . . . . . . . . . . . . . . . . . . . . . . . . . . . . . . . . . 3,283 3,389 3,052ENBREL — Canada . . . . . . . . . . . . . . . . . . . . . . . . . . . . . . . . . . . . . . . . . . . . . . 210 209 178Sensipar® — U.S. . . . . . . . . . . . . . . . . . . . . . . . . . . . . . . . . . . . . . . . . . . . . . . . . . 429 412 333Sensipar® — International . . . . . . . . . . . . . . . . . . . . . . . . . . . . . . . . . . . . . . . . . . 222 185 130Other — U.S. . . . . . . . . . . . . . . . . . . . . . . . . . . . . . . . . . . . . . . . . . . . . . . . . . . . . 175 151 203Other — International . . . . . . . . . . . . . . . . . . . . . . . . . . . . . . . . . . . . . . . . . . . . . 168 89 35
Total product sales . . . . . . . . . . . . . . . . . . . . . . . . . . . . . . . . . . . . . . . . . . . . . . 14,351 14,687 14,311Other revenues . . . . . . . . . . . . . . . . . . . . . . . . . . . . . . . . . . . . . . . . . . . . . . . . . . . . . 291 316 460
Total revenues . . . . . . . . . . . . . . . . . . . . . . . . . . . . . . . . . . . . . . . . . . . . . . . . . $14,642 $15,003 $14,771
Geographic information
Outside the United States, we principally sell Aranesp®, Neulasta® and NEUPOGEN® in Europe and EN-BREL in Canada only. Information regarding revenues and long-lived assets (consisting of property, plant andequipment) attributable to the United States and to all international countries collectively is stated below. Thegeographic classification of product sales was based upon the location of the customer. The geographic classi-fication of all other revenues was based upon the domicile of the entity from which the revenues were earned.
F-55
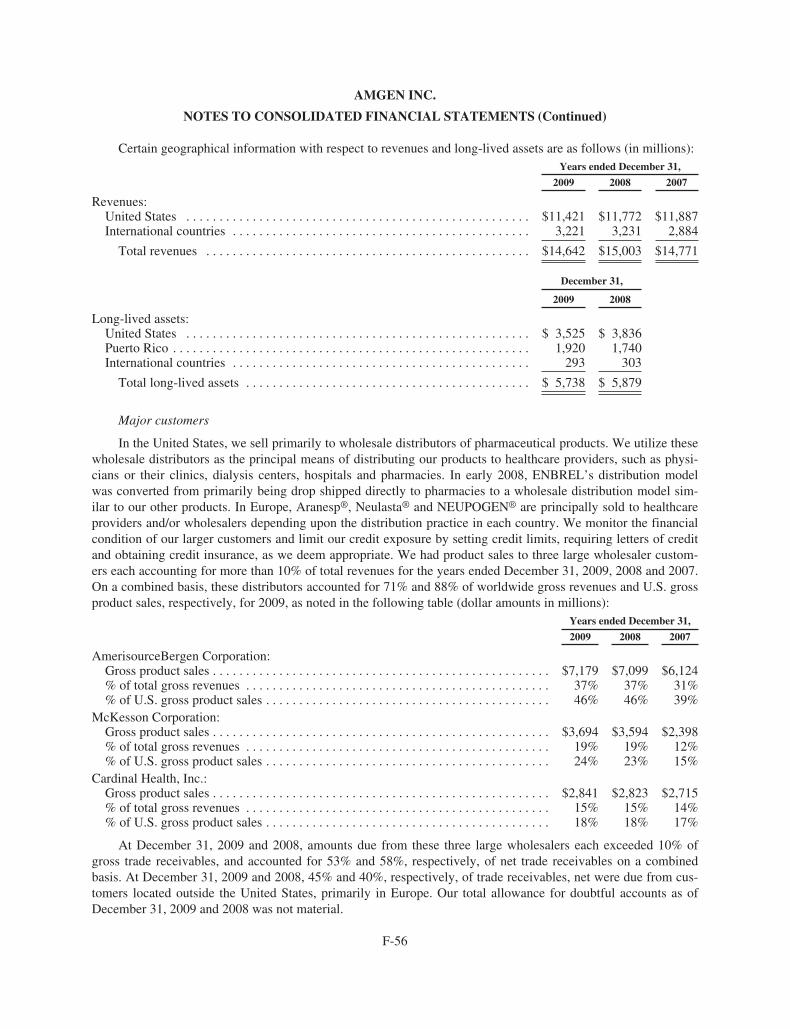
AMGEN INC.
NOTES TO CONSOLIDATED FINANCIAL STATEMENTS (Continued)
Certain geographical information with respect to revenues and long-lived assets are as follows (in millions):Years ended December 31,
2009 2008 2007
Revenues:United States . . . . . . . . . . . . . . . . . . . . . . . . . . . . . . . . . . . . . . . . . . . . . . . . . . . . $11,421 $11,772 $11,887International countries . . . . . . . . . . . . . . . . . . . . . . . . . . . . . . . . . . . . . . . . . . . . . 3,221 3,231 2,884
Total revenues . . . . . . . . . . . . . . . . . . . . . . . . . . . . . . . . . . . . . . . . . . . . . . . . . $14,642 $15,003 $14,771
December 31,
2009 2008
Long-lived assets:United States . . . . . . . . . . . . . . . . . . . . . . . . . . . . . . . . . . . . . . . . . . . . . . . . . . . . $ 3,525 $ 3,836Puerto Rico . . . . . . . . . . . . . . . . . . . . . . . . . . . . . . . . . . . . . . . . . . . . . . . . . . . . . . 1,920 1,740International countries . . . . . . . . . . . . . . . . . . . . . . . . . . . . . . . . . . . . . . . . . . . . . 293 303
Total long-lived assets . . . . . . . . . . . . . . . . . . . . . . . . . . . . . . . . . . . . . . . . . . . $ 5,738 $ 5,879
Major customers
In the United States, we sell primarily to wholesale distributors of pharmaceutical products. We utilize thesewholesale distributors as the principal means of distributing our products to healthcare providers, such as physi-cians or their clinics, dialysis centers, hospitals and pharmacies. In early 2008, ENBREL’s distribution modelwas converted from primarily being drop shipped directly to pharmacies to a wholesale distribution model sim-ilar to our other products. In Europe, Aranesp®, Neulasta® and NEUPOGEN® are principally sold to healthcareproviders and/or wholesalers depending upon the distribution practice in each country. We monitor the financialcondition of our larger customers and limit our credit exposure by setting credit limits, requiring letters of creditand obtaining credit insurance, as we deem appropriate. We had product sales to three large wholesaler custom-ers each accounting for more than 10% of total revenues for the years ended December 31, 2009, 2008 and 2007.On a combined basis, these distributors accounted for 71% and 88% of worldwide gross revenues and U.S. grossproduct sales, respectively, for 2009, as noted in the following table (dollar amounts in millions):
Years ended December 31,
2009 2008 2007
AmerisourceBergen Corporation:Gross product sales . . . . . . . . . . . . . . . . . . . . . . . . . . . . . . . . . . . . . . . . . . . . . . . . . . . $7,179 $7,099 $6,124% of total gross revenues . . . . . . . . . . . . . . . . . . . . . . . . . . . . . . . . . . . . . . . . . . . . . . 37% 37% 31%% of U.S. gross product sales . . . . . . . . . . . . . . . . . . . . . . . . . . . . . . . . . . . . . . . . . . . 46% 46% 39%
McKesson Corporation:Gross product sales . . . . . . . . . . . . . . . . . . . . . . . . . . . . . . . . . . . . . . . . . . . . . . . . . . . $3,694 $3,594 $2,398% of total gross revenues . . . . . . . . . . . . . . . . . . . . . . . . . . . . . . . . . . . . . . . . . . . . . . 19% 19% 12%% of U.S. gross product sales . . . . . . . . . . . . . . . . . . . . . . . . . . . . . . . . . . . . . . . . . . . 24% 23% 15%
Cardinal Health, Inc.:Gross product sales . . . . . . . . . . . . . . . . . . . . . . . . . . . . . . . . . . . . . . . . . . . . . . . . . . . $2,841 $2,823 $2,715% of total gross revenues . . . . . . . . . . . . . . . . . . . . . . . . . . . . . . . . . . . . . . . . . . . . . . 15% 15% 14%% of U.S. gross product sales . . . . . . . . . . . . . . . . . . . . . . . . . . . . . . . . . . . . . . . . . . . 18% 18% 17%
At December 31, 2009 and 2008, amounts due from these three large wholesalers each exceeded 10% ofgross trade receivables, and accounted for 53% and 58%, respectively, of net trade receivables on a combinedbasis. At December 31, 2009 and 2008, 45% and 40%, respectively, of trade receivables, net were due from cus-tomers located outside the United States, primarily in Europe. Our total allowance for doubtful accounts as ofDecember 31, 2009 and 2008 was not material.
F-56
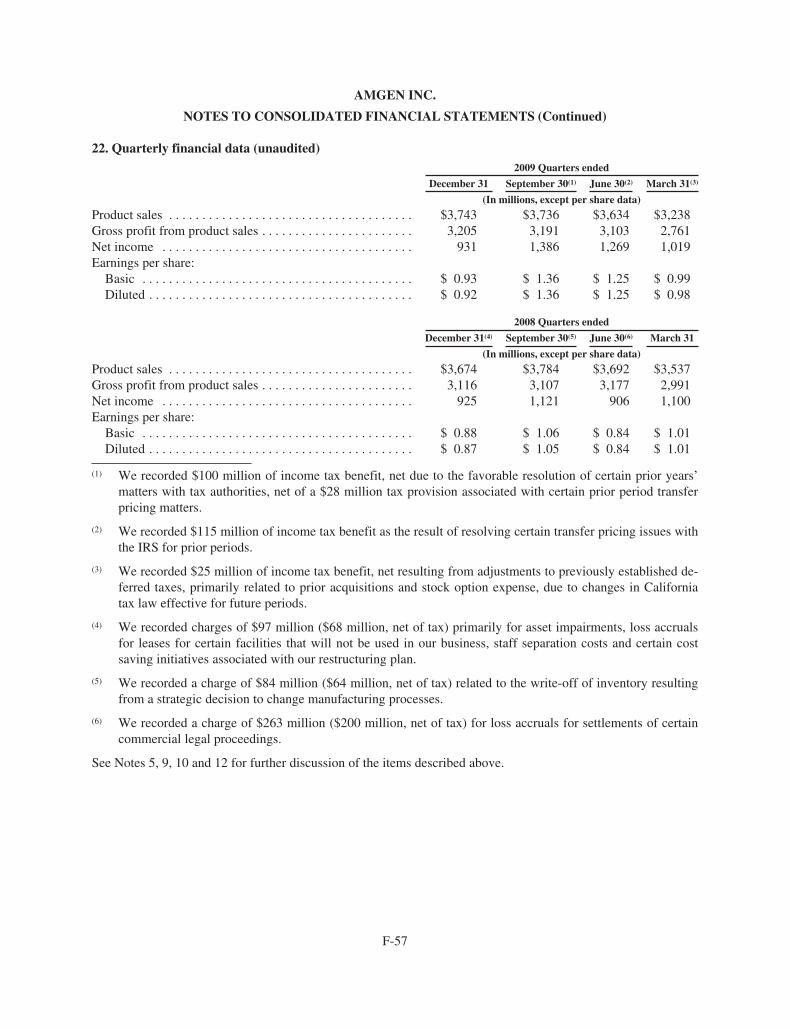
AMGEN INC.
NOTES TO CONSOLIDATED FINANCIAL STATEMENTS (Continued)
22. Quarterly financial data (unaudited)2009 Quarters ended
December 31 September 30(1) June 30(2) March 31(3)
(In millions, except per share data)
Product sales . . . . . . . . . . . . . . . . . . . . . . . . . . . . . . . . . . . . . $3,743 $3,736 $3,634 $3,238Gross profit from product sales . . . . . . . . . . . . . . . . . . . . . . . 3,205 3,191 3,103 2,761Net income . . . . . . . . . . . . . . . . . . . . . . . . . . . . . . . . . . . . . . 931 1,386 1,269 1,019Earnings per share:
Basic . . . . . . . . . . . . . . . . . . . . . . . . . . . . . . . . . . . . . . . . . $ 0.93 $ 1.36 $ 1.25 $ 0.99Diluted . . . . . . . . . . . . . . . . . . . . . . . . . . . . . . . . . . . . . . . . $ 0.92 $ 1.36 $ 1.25 $ 0.98
2008 Quarters ended
December 31(4) September 30(5) June 30(6) March 31
(In millions, except per share data)
Product sales . . . . . . . . . . . . . . . . . . . . . . . . . . . . . . . . . . . . . $3,674 $3,784 $3,692 $3,537Gross profit from product sales . . . . . . . . . . . . . . . . . . . . . . . 3,116 3,107 3,177 2,991Net income . . . . . . . . . . . . . . . . . . . . . . . . . . . . . . . . . . . . . . 925 1,121 906 1,100Earnings per share:
Basic . . . . . . . . . . . . . . . . . . . . . . . . . . . . . . . . . . . . . . . . . $ 0.88 $ 1.06 $ 0.84 $ 1.01Diluted . . . . . . . . . . . . . . . . . . . . . . . . . . . . . . . . . . . . . . . . $ 0.87 $ 1.05 $ 0.84 $ 1.01
(1) We recorded $100 million of income tax benefit, net due to the favorable resolution of certain prior years’matters with tax authorities, net of a $28 million tax provision associated with certain prior period transferpricing matters.
(2) We recorded $115 million of income tax benefit as the result of resolving certain transfer pricing issues withthe IRS for prior periods.
(3) We recorded $25 million of income tax benefit, net resulting from adjustments to previously established de-ferred taxes, primarily related to prior acquisitions and stock option expense, due to changes in Californiatax law effective for future periods.
(4) We recorded charges of $97 million ($68 million, net of tax) primarily for asset impairments, loss accrualsfor leases for certain facilities that will not be used in our business, staff separation costs and certain costsaving initiatives associated with our restructuring plan.
(5) We recorded a charge of $84 million ($64 million, net of tax) related to the write-off of inventory resultingfrom a strategic decision to change manufacturing processes.
(6) We recorded a charge of $263 million ($200 million, net of tax) for loss accruals for settlements of certaincommercial legal proceedings.
See Notes 5, 9, 10 and 12 for further discussion of the items described above.
F-57
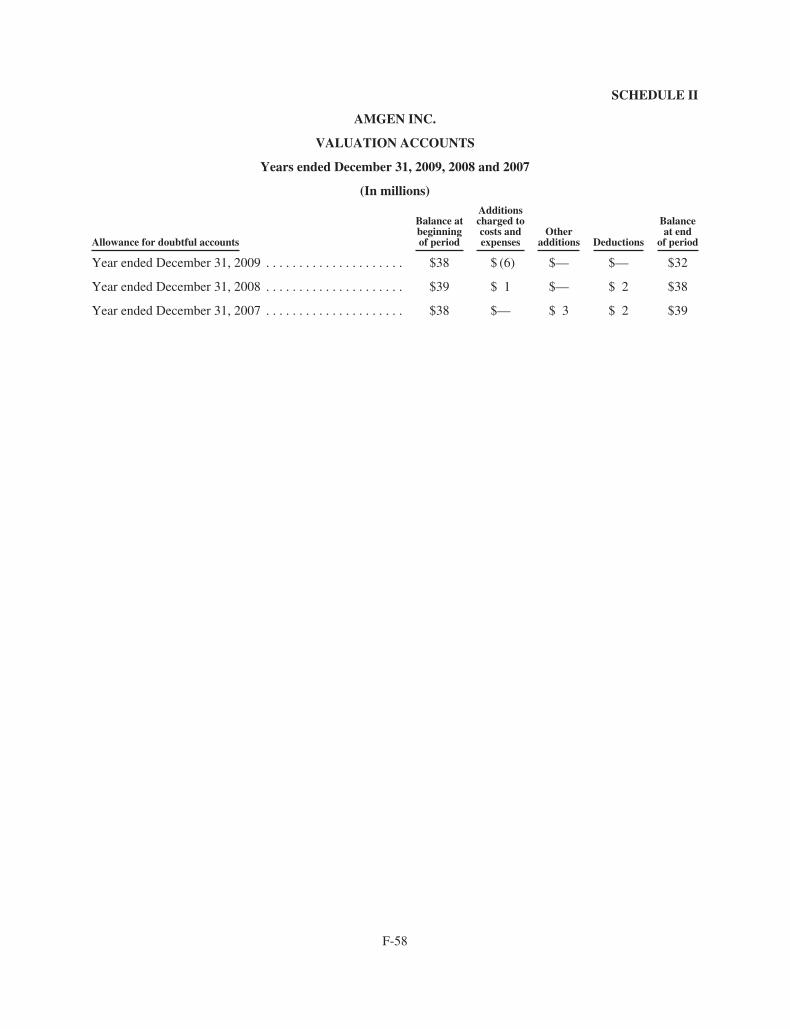
SCHEDULE II
AMGEN INC.
VALUATION ACCOUNTS
Years ended December 31, 2009, 2008 and 2007
(In millions)
Allowance for doubtful accounts
Balance atbeginningof period
Additionscharged tocosts andexpenses
Otheradditions Deductions
Balanceat end
of period
Year ended December 31, 2009 . . . . . . . . . . . . . . . . . . . . . $38 $ (6) $— $— $32
Year ended December 31, 2008 . . . . . . . . . . . . . . . . . . . . . $39 $ 1 $— $ 2 $38
Year ended December 31, 2007 . . . . . . . . . . . . . . . . . . . . . $38 $— $ 3 $ 2 $39
F-58
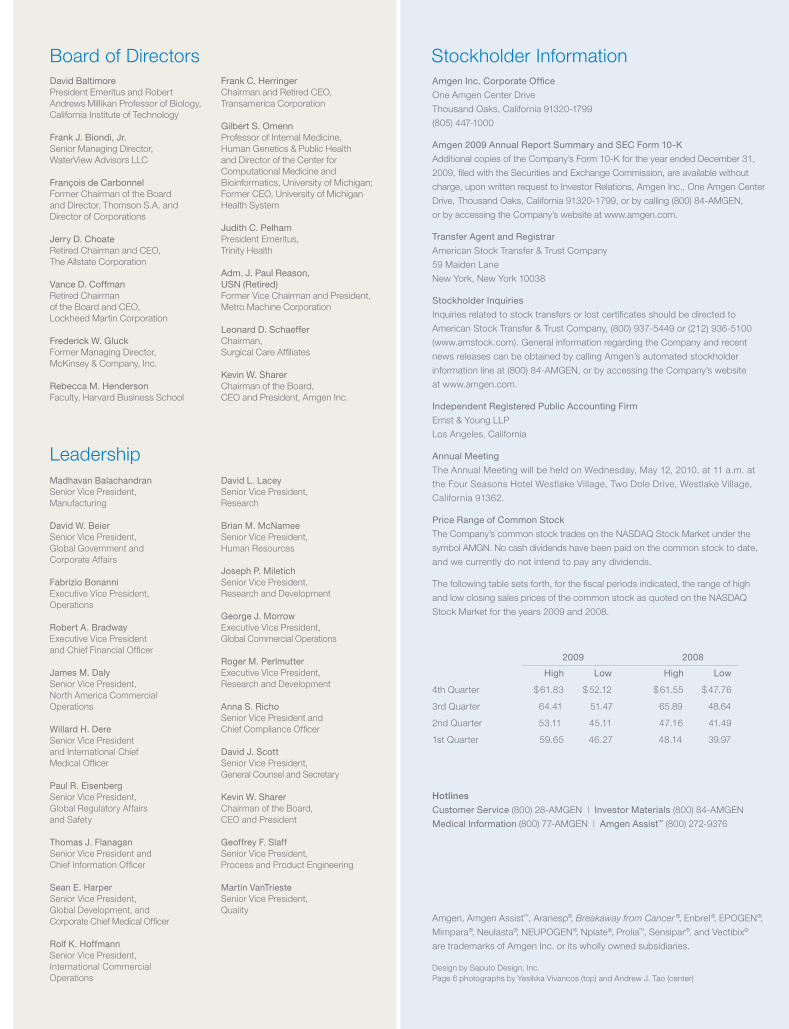
Serving Patients for 30 Years
Since 1980, Amgen has been a pioneer, leader, and innovator in medical biotechnology. Amgen medicines have helped more
than 18 million people around the world fi ght cancer, kidney disease, rheumatoid arthritis, and other serious illnesses.
With a number of novel potential new medicines in our pipeline, the next decade will mark a promising new chapter for Amgen—
and for patients. We are conducting medical research and clinical trials in our current therapeutic areas, and branching out
into new areas where fresh treatment approaches are urgently needed—areas such as bone health, cardiovascular disease,
cholesterol management, diabetes, and asthma. These are persistent and diffi cult medical issues that seriously impact the lives
of growing numbers of patients around the globe.
Biotechnology medicine plays an ever greater role in improving the lives of people everywhere, and Amgen continues to lead the
charge, in our own research laboratories and manufacturing facilities and in partnership with the industry’s foremost innovators
worldwide. Wherever biomedical innovation is happening and wherever patients need us most, that’s where Amgen will be.
Serving Patients“Both my mother and sister also had
osteoporosis, and they suffered with
hunched backs and broken bones.
I realize that I have the power to help
keep my bones strong. I go to the
gym regularly, eat well, and visit my
doctor. I want to do all I can to stay
independent.” —Louise, denosumab
clinical trial participant
Above: Louise walks in a park near
her home in Gaithersburg, Maryland.
Driving InnovationAmgen, the world’s leading biotechnology
medicines company, is among a select
few biotechs that are fully integrated—
combining innovative laboratory research
and clinical development with world-class
manufacturing and distribution capabilities.
Above: An Amgen staff member in a
research laboratory at the company’s
headquarters in Thousand Oaks,
California.
Fighting Serious Illness Research and development at Amgen
begins with science and ends with
new therapies with the potential to help
millions. Our strong, emerging pipeline
contains novel approaches for treating
diabetes, asthma, heart disease, skeletal
problems, and high cholesterol, among
other diseases and conditions.
Above: Cardiac muscle cells showing
the cardiac sarcomere, the fundamental
contractile element of the heart, the
target of an investigational therapy for
heart failure that Amgen is developing
with Cytokinetics.
Researching New Frontiers Amgen fi ghts cancer on multiple fronts
by exploring numerous biologic pathways
that play a role in cancer’s growth and
survival. One of many areas of study
that Amgen scientists are taking in
new directions is angiogenesis—the
process by which tumors induce new
blood vessel growth.
Above: A multimedia website,
angiogenesis.amgen.com, brings
to life the angiogenesis process
and the novel approaches being
taken by Amgen researchers.
Amgen Inc. Corporate Offi ce
One Amgen Center Drive
Thousand Oaks, California 91320-1799
(805) 447-1000
Amgen 2009 Annual Report Summary and SEC Form 10-K
Additional copies of the Company’s Form 10-K for the year ended December 31,
2009, fi led with the Securities and Exchange Commission, are available without
charge, upon written request to Investor Relations, Amgen Inc., One Amgen Center
Drive, Thousand Oaks, California 91320-1799, or by calling (800) 84-AMGEN,
or by accessing the Company’s website at www.amgen.com.
Transfer Agent and Registrar
American Stock Transfer & Trust Company
59 Maiden Lane
New York, New York 10038
Stockholder Inquiries
Inquiries related to stock transfers or lost certifi cates should be directed to
American Stock Transfer & Trust Company, (800) 937-5449 or (212) 936-5100
(www.amstock.com). General information regarding the Company and recent
news releases can be obtained by calling Amgen’s automated stockholder
information line at (800) 84-AMGEN, or by accessing the Company’s website
at www.amgen.com.
Independent Registered Public Accounting Firm
Ernst & Young LLP
Los Angeles, California
Annual Meeting
The Annual Meeting will be held on Wednesday, May 12, 2010, at 11 a.m. at
the Four Seasons Hotel Westlake Village, Two Dole Drive, Westlake Village,
California 91362.
Price Range of Common Stock
The Company’s common stock trades on the NASDAQ Stock Market under the
symbol AMGN. No cash dividends have been paid on the common stock to date,
and we currently do not intend to pay any dividends.
The following table sets forth, for the fi scal periods indicated, the range of high
and low closing sales prices of the common stock as quoted on the NASDAQ
Stock Market for the years 2009 and 2008.
Stockholder Information
Hotlines
Customer Service (800) 28-AMGEN | Investor Materials (800) 84-AMGEN
Medical Information (800) 77-AMGEN | Amgen Assist™ (800) 272-9376
Amgen, Amgen Assist™, Aranesp®, Breakaway from Cancer ®, Enbrel®, EPOGEN®,
Mimpara®, Neulasta®, NEUPOGEN®, Nplate®, Prolia™, Sensipar®, and Vectibix®
are trademarks of Amgen Inc. or its wholly owned subsidiaries.
Design by Saputo Design, Inc.
Page 6 photographs by Yesikka Vivancos (top) and Andrew J. Tao (center)
2009 2008
High Low High Low
4th Quarter $ 61.83 $ 52.12 $ 61.55 $ 47.76
3rd Quarter 64.41 51.47 65.89 48.64
2nd Quarter 53.11 45.11 47.16 41.49
1st Quarter 59.65 46.27 48.14 39.97
Board of Directors
Leadership
David Baltimore
President Emeritus and Robert
Andrews Millikan Professor of Biology,
California Institute of Technology
Frank J. Biondi, Jr.
Senior Managing Director,
WaterView Advisors LLC
François de Carbonnel
Former Chairman of the Board
and Director, Thomson S.A. and
Director of Corporations
Jerry D. Choate
Retired Chairman and CEO,
The Allstate Corporation
Vance D. Coffman
Retired Chairman
of the Board and CEO,
Lockheed Martin Corporation
Frederick W. Gluck
Former Managing Director,
McKinsey & Company, Inc.
Rebecca M. Henderson
Faculty, Harvard Business School
Frank C. Herringer
Chairman and Retired CEO,
Transamerica Corporation
Gilbert S. Omenn
Professor of Internal Medicine,
Human Genetics & Public Health
and Director of the Center for
Computational Medicine and
Bioinformatics, University of Michigan;
Former CEO, University of Michigan
Health System
Judith C. Pelham
President Emeritus,
Trinity Health
Adm. J. Paul Reason,
USN (Retired)
Former Vice Chairman and President,
Metro Machine Corporation
Leonard D. Schaeffer
Chairman,
Surgical Care Affi liates
Kevin W. Sharer
Chairman of the Board,
CEO and President, Amgen Inc.
Madhavan Balachandran
Senior Vice President,
Manufacturing
David W. Beier
Senior Vice President,
Global Government and
Corporate Affairs
Fabrizio Bonanni
Executive Vice President,
Operations
Robert A. Bradway
Executive Vice President
and Chief Financial Offi cer
James M. Daly
Senior Vice President,
North America Commercial
Operations
Willard H. Dere
Senior Vice President
and International Chief
Medical Offi cer
Paul R. Eisenberg
Senior Vice President,
Global Regulatory Affairs
and Safety
Thomas J. Flanagan
Senior Vice President and
Chief Information Offi cer
Sean E. Harper
Senior Vice President,
Global Development, and
Corporate Chief Medical Offi cer
Rolf K. Hoffmann
Senior Vice President,
International Commercial
Operations
David L. Lacey
Senior Vice President,
Research
Brian M. McNamee
Senior Vice President,
Human Resources
Joseph P. Miletich
Senior Vice President,
Research and Development
George J. Morrow
Executive Vice President,
Global Commercial Operations
Roger M. Perlmutter
Executive Vice President,
Research and Development
Anna S. Richo
Senior Vice President and
Chief Compliance Offi cer
David J. Scott
Senior Vice President,
General Counsel and Secretary
Kevin W. Sharer
Chairman of the Board,
CEO and President
Geoffrey F. Slaff
Senior Vice President,
Process and Product Engineering
Martin VanTrieste
Senior Vice President,
Quality
95437_Cvr_sprds_V2.indd 295437_Cvr_sprds_V2.indd 2 3/4/10 8:47 PM3/4/10 8:47 PM

Amgen 2009 Annual Report and Financial SummaryAmgen Inc.
One Amgen Center Drive
Thousand Oaks, CA 91320-1799
www.amgen.com
About Amgen
©2010 Amgen Inc. All rights reserved.
MC45347-A
Amgen discovers, develops, manufactures, and delivers
innovative human therapeutics. A biotechnology
pioneer since 1980, Amgen was one of the first
companies to realize the new science’s promise by
bringing safe and effective medicines from the lab
to the manufacturing plant to patients.
Amgen therapeutics have changed the practice of
medicine, helping millions of people around the world
in the fi ght against serious illnesses. So far, more than
18 million patients worldwide have been treated with
Amgen products.
With a broad and deep pipeline of potential new
medicines, Amgen remains committed to advancing
science to dramatically improve people’s lives.
95437_Cvr_sprds.indd 195437_Cvr_sprds.indd 1 3/4/10 1:29 PM3/4/10 1:29 PM