
Ames and California Population by Race and Gender (FY 2011) Source: ARC Web Brio, Quick facts 2010...
35
Ames and California Population by Race and Gender (FY 2011) ts 2010 Census Rev.1.25.12 White Black Hispanic Asian/PI Amer. Indian Multiracial Women 0.0% 10.0% 20.0% 30.0% 40.0% 50.0% 60.0% 70.0% 1 ote : Percentages rounded to the nearest tenth
-
Upload
archibald-bruce -
Category
Documents
-
view
214 -
download
1
Transcript of Ames and California Population by Race and Gender (FY 2011) Source: ARC Web Brio, Quick facts 2010...

Ames and California Population by Race and Gender(FY 2011)
Source: ARC Web Brio, Quick facts 2010 Census Rev.1.25.12
White Black Hispanic Asian/PI Amer. Indian Multiracial Women
ARC 0.640963855421688 0.0497991967871488
0.0867469879518072
0.201606425702811 0.00883534136546185
0.0120481927710843
0.326000000000001
CA 0.401 0.0620000000000002
0.376000000000001 0.134 0.01 0.0490000000000002
0.503
5.0%
15.0%
25.0%
35.0%
45.0%
55.0%
65.0%
1
Note : Percentages rounded to the nearest tenth

Workforce Profile by NASA Center(FY 2011)
Source: ARC Web Brio, All other centers Cognos Rev. 1.25.12
FY 2011 ARC DFRC GRC GSFC JSC KSC LARC MSFC SSC HQ NSSC
OIG
Centers & NSSC
White
Male 581 329 953 1,556 1,712 1,126 1,126 1,448 144 519 40 98 9,632
Female 217 89 370 811 829 543 413 672 82 310 56 52 4,444
Both Genders 798 418 1,323 2,367 2,541 1,669 1,539 2,120 226 829 96 150 14,076
Black
Male 29 15 91 215 134 78 94 112 16 67 5 15 871
Female 33 16 79 347 171 87 113 172 21 242 24 21 1,326
Both Genders 62 31 170 562 305 165 207 284 37 309 29 36 2,197
Hispanic
Male 56 34 47 122 195 160 43 47 3 20 0 4 731
Female 52 16 33 60 133 67 16 13 5 22 4 3 424
Both Genders 108 50 80 182 328 227 59 60 8 42 4 7 1,155
Asian or Pacific Is.
Male 156 49 80 173 140 70 90 55 4 28 1 5 851
Female 95 12 22 87 65 24 20 11 1 29 2 7 375
Both Genders 251 61 102 260 205 94 110 66 5 57 3 12 1,226
Native American
Male 7 9 5 6 13 11 11 23 1 1 0 0 87
Female 4 1 3 4 10 7 4 8 1 2 2 0 46
Both Genders 11 10 8 10 23 18 15 31 2 3 2 0 133
Multiracial
Male 10 2 8 10 14 10 7 14 1 2 1 0 79
Female 5 5 0 6 3 7 5 10 0 7 1 1 50
Both Genders 15 7 8 16 17 17 12 24 1 9 2 1 129
All Diversity 1,245 577 1,691 3,397 3,419 2,190 1,942 2,585 279 1,249 136 206 18,916
2

Ames 3 Year Comparison of Race and Gender(Turnover / Growth Rate)
FY 2011
White Hispanic Black Asian/PI Native Amer. Multiracial
Fiscal Year M F M F M F M F M F M F Total Women Percentage
2009 607 215 57 46 28 36 165 94 6 6 6 2 1268 399 31.4%2010 590 219 57 51 26 35 159 91 7 5 9 6 1255 407 32.4%2011 571 214 59 52 31 33 152 93 7 4 11 6 1233 402 32.6%
Loss/Gain -36 -1 2 6 3 -3 -13 -1 1 -2 5 4 3 0.24%
Avg. 3 Yr. Turnover % Rate -2% -0.2% -2.9% -2.7% -0.4% -13.3%
Avg. 3 Yr. Growth % Rate 1.2% 4% 3.5% 5% 19.2% 28.6% 0.2%
Source: ARC Web Brio Rev.1.25.12
Note : Percentages rounded to the nearest tenth
3

M White F M Hispanic F M Black F M Asian/P.I F M Native-Amer. F M Multiracial F Total
2009 9 9 1 2 0 0 2 5 1 0 0 0 29
2010 13 14 3 5 0 1 3 4 1 0 0 1 45
2011 14 9 4 2 3 0 0 4 0 0 1 0 37
Ames 3 Year Hires by Race and Gender (Including STEP/SCEP)
FY 2011
Note: Not including the 29 term to perm conversions Source: ARC Web Brio Rev.1.25.12 4
0
5
10
15
20
25
30
35
40
45
50
200920102011

Ames Losses by Race and Gender (Including Students)
FY 2011
Query date range 9/30/10 -9/30/11 Source: ARC Web Brio Rev.1.25.12
White Black Hispanic Asian/P.I Native-Amer. Multiracial Total
Male 26 0 2 5 0 0 33
Female 12 1 1 5 1 0 20
2.5
7.5
12.5
17.5
22.5
27.5
32.5
Male 78.8% 0.0% 6.1% 15.2% 0.0% 0.0% 100%
Female 60.0% 5.0% 5.0% 25.0% 5.0% 0.0% 100%
Note : Percentages rounded to the nearest tenth
5

Ames SES by Gender and RaceFY 2011
Source: Cognos Rev.1.25.12
White Black Hispanic Asian/P.I Native-Amer. Multiracial
Male 19 1 0 1 0 0
Female 3 0 0 2 0 0
1
3
5
7
9
11
13
15
17
19
Male 90.5% 4.8% 0.0% 4.8% 0.0% 0.0%
Female 60.0% 0.0% 0.0% 40.0% 0.0% 0.0%
Note : Percentages rounded to the nearest tenth
6

White Black Hispanic Asian/PI Amer. Indian Multiracial
Male 27 1 0 5 0 0
Women 5 0 0 2 0 0
2.5
7.5
12.5
17.5
22.5
27.5
Source: Cognos Rev.1.25.12
Ames SES,SL,ST, NEX and IPA by Gender and Race FY 2011
Male 81.8% 3.0% 0.0% 15.2% 0.0% 0.0%
Female 71.4% 0.0% 0.0% 28.6% 0.0% 0.0%
Note : Percentages rounded to the nearest tenth
7

Ames Grades 13-14-15 and 00 By GenderFY 2011
Source: Cognos Rev.1.25.12
Male 17% 39% 41% 3% 73%Female 32% 38% 28% 2% 27%
Note : Percentages rounded to the nearest tenth *Ames total population is 1245 *Ames GS 13-00 population is 1012 * The total numbers reflects GS 13-00 divide by 1012 to get the percent of total
8
GS-13 GS-14 GS-15 GS-00 *Total
Male 127 286 307 21 741
Female 87 104 75 5 271
50
150
250
350
450
550
650
750

Ames Supervisors by Race FY 2011
Source: Cognos Rev.1.25.12
White Black Hispanic Asian Native-Amer. Multiracial
Supv 101 4 8 20 1 0
ARC Pop 798 62 108 251 11 15
50
150
250
350
450
550
650
750
850
Supv. % 75% 3% 6% 15% 1% 0%ARC Pop. % 64% 5% 9% 20% 1% 1%
Note : Percentages rounded to the nearest tenth
9

White Black Hispanic Asian Native- Amer. Multiracial
Men 76 3 5 12 1 0
Women 25 1 3 8 0 0
5
15
25
35
45
55
65
75
Source: Cognos Rev.1.25.12
Ames Supervisors by Gender and RaceFY 2011
Male 78.4% 3.1% 5.2% 12.4% 1.0% 0.0%
Female 67.6% 2.7% 8.1% 21.6% 0.0% 0.0%
Note : Percentages rounded to the nearest tenth
10

Distinguished Performance Rating Ames by Gender and Race
FY 2011
0
100
200
300
400
500
600
700
800
900
Men Women White Hispanic Black Asian/ PI Native Amer. Multi-RacialDistinguished Performance 352 168 355 40 24 98 1 2
ARC Population 839 406 798 108 62 251 11 15Distinguished Performance 67.7% 32.3% 68.3% 7.7% 4.6% 18.8% 0.2% 0.4%
ARC Population 67.4% 32.6% 64.1% 8.7% 5.0% 20.2% 0.9% 1.2%
Source: Brio Rev.1.25.12 11

Source: Brio Rev.1.25.12
FY 2011 Workforce Representation by Grade
White Black Hispanic Asian/P.I Native American Multiracial Total Targ. Dis Rep.Dis Total Total
M F M F M F M F M F M F Female &
Minorities Female &
Minorities%
SES 19 3 1 0 0 0 1 2 0 0 0 0 26 0 1 7 26.90%
GS-15 240 54 7 6 16 5 42 10 2 0 0 0 382 0 12 142 37.20%
GS-14 192 61 6 7 14 7 66 24 1 2 7 3 390 3 21 198 50.80%
GS-13 79 39 8 5 13 13 25 29 1 0 1 1 214 0 13 135 63.10%
GS-12 24 15 5 9 5 5 9 12 1 1 0 0 86 0 3 62 72.10%
GS-11 13 7 0 2 4 10 4 6 1 1 0 0 48 0 4 35 72.90%
GS-10 0 3 0 0 0 1 0 1 0 0 1 0 6 1 1 6 100.00%
GS-9 1 11 1 1 2 4 2 5 0 0 1 0 28 0 0 27 96.40%
GS-8 1 4 0 2 0 3 0 1 0 0 0 0 11 0 1 10 90.90%
GS-7 2 5 0 1 2 3 3 4 0 0 0 1 21 0 2 19 90.50%
GS-6 0 4 0 0 0 1 0 0 1 0 0 0 6 0 2 6 100.00%
GS-5 1 5 1 0 0 0 0 1 0 0 0 0 8 0 1 7 87.50%
GS-4 1 3 0 0 0 0 0 0 0 0 0 0 4 0 1 3 75.00%
Other 8 3 0 0 0 0 4 0 0 0 0 0 15 7 46.70%
Total 581 217 29 33 56 52 156 95 7 4 10 5 1245 4 62 664 53.30%
12

All Organization Codes by Gender FY 2011
Source: Cognos Rev.1.25.12
0
50
100
150
200
250
Male Female Org Code A Code C Code D Code H Code I Code J Code P Code Q Code R Code S Code T Code V
Male 148 29 29 3 31 86 26 20 110 108 228 21
Female 33 73 32 21 16 70 6 5 19 36 61 34Total 181 102 61 24 47 156 32 25 129 144 289 55
13

Ames Org Comparison by Gender and Race FY 2011 (White)
0
20
40
60
80
100
120
140
160
180
Male FemaleWhite A C D H I J P Q R S T V Male 98 12 21 3 14 51 21 12 81 92 162 14
Female 20 20 19 4 9 37 3 3 11 29 41 21Both Genders 118 32 40 7 23 88 24 15 92 121 203 35
Source: Cognos Rev.1.25.12 14

Ames Org Comparison by Gender and Race FY 2011 (Black)
0
2
4
6
8
10
12
Male Female Black A C D H I J P Q R S T V
Male 4 1 3 0 4 3 0 3 3 1 5 2
Female 2 10 3 4 1 5 1 0 0 0 2 5
Both Genders 6 11 6 4 5 8 1 3 3 1 7 7
Source: Cognos Rev.1.25.12 15
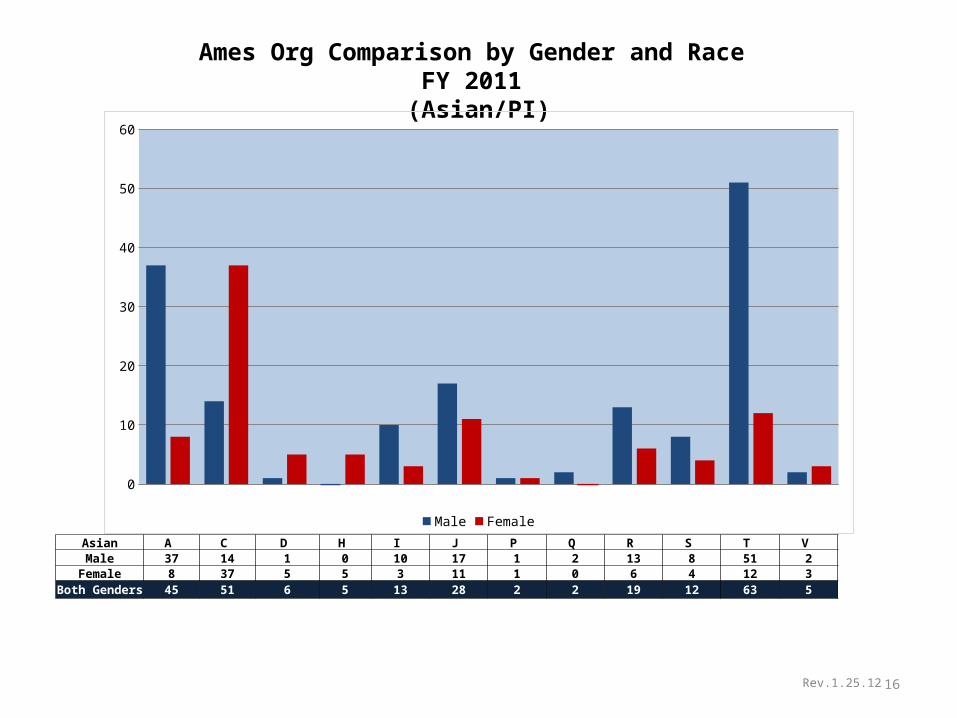
Ames Org Comparison by Gender and Race FY 2011 (Asian/PI)
Source: Cognos Rev.1.25.12
0
10
20
30
40
50
60
Male FemaleAsian A C D H I J P Q R S T V Male 37 14 1 0 10 17 1 2 13 8 51 2
Female 8 37 5 5 3 11 1 0 6 4 12 3Both Genders 45 51 6 5 13 28 2 2 19 12 63 5
16

Ames Org Comparison by Gender and Race FY 2011
(Hispanic)
Source: Cognos Rev.1.25.12
0
2
4
6
8
10
12
14
16
18
Male FemaleHispanic A C D H I J P Q R S T V
Male 8 1 4 0 2 12 3 1 9 7 6 3Female 2 6 5 5 2 17 1 2 1 2 5 4
Both Genders 10 7 9 5 4 29 4 3 10 9 11 7
17

Ames Org Comparison by Gender and Race FY 2011
(Multiracial)
Source: Cognos Rev.1.25.12
Multiracial A C D H I J P Q R S T V Male 1 0 0 0 1 1 0 1 3 0 3 0
Female 0 0 0 2 0 0 0 0 1 0 1 1Both Genders 1 0 0 2 1 1 0 1 4 0 4 1
0
0.5
1
1.5
2
2.5
3
3.5
Male Female
18

Ames Org Comparison by Gender and Race FY 2011
(Native American)
Source: Cognos Rev.1.25.12
Native Amer. A C D H I J P Q R S T V
Male 0 1 0 0 0 2 1 1 1 0 1 0Female 1 0 0 1 1 0 0 0 0 1 0 0
Both Genders 1 1 0 1 1 2 1 1 1 1 1 0
0
0.5
1
1.5
2
2.5
Male Female
19

Source: Cognos Rev.1.25.12
0
20
40
60
80
100
120
Male FemaleCode A White Black Hispanic Asian Native-Amer Multiracial
Male 98 4 8 37 0 1Female 20 2 2 8 1 0Male 66.2% 2.7% 5.4% 25.0% 0.0% 0.7%
Female 60.6% 6.1% 6.1% 24.2% 3.0% 0.0%
Code A by Gender and RaceFY 2011
20
Note : Percentages rounded to the nearest tenth

Source: Cognos Rev.1.25.12
Code C by Gender and RaceFY 2011
0
5
10
15
20
25
30
35
40
Male FemaleCode C White Black Hispanic Asian Native-Amer MultiracialMale 12 1 1 14 1 0
Female 20 10 6 37 0 0Male 41.4% 3.4% 3.4% 48.3% 3.4% 0.0%
Female 27.4% 13.7% 8.2% 50.7% 0.0% 0.0%
21
Note : Percentages rounded to the nearest tenth

Code D by Gender and RaceFY 2011
Source: Cognos Rev.1.25.12
0
5
10
15
20
25
Male FemaleCode D White Black Hispanic Asian Native-Amer MultiracialMale 21 3 4 1 0 0
Female 19 3 5 5 0 0Male 72.4% 10.3% 13.8% 3.4% 0.0% 0.0%
Female 59.4% 9.4% 15.6% 15.6% 0.0% 0.0%
22
Note : Percentages rounded to the nearest tenth

Source: Cognos Rev.1.25.12
Code H by Gender and RaceFY 2011
0
1
2
3
4
5
6
Male FemaleCode H White Black Hispanic Asian Native-Amer Multiracial
Male 3 0 0 0 0 0
Female 4 4 5 5 1 2
Male 100.0% 0.0% 0.0% 0.0% 0.0% 0.0%
Female 19.0% 19.0% 23.8% 23.8% 4.8% 9.5%
23
Note : Percentages rounded to the nearest tenth

Source: Cognos Rev.1.25.12
Code I by Gender and RaceFY 2011
0
2
4
6
8
10
12
14
16
Male FemaleCode I White Black Hispanic Asian Native-Amer MultiracialMale 14 4 2 10 0 1
Female 9 1 2 3 1 0Male 45.2% 12.9% 6.5% 32.3% 0.0% 3.2%
Female 56.3% 6.3% 12.5% 18.8% 6.3% 0.0%
24
Note : Percentages rounded to the nearest tenth

Source: Cognos Rev.1.25.12
Code J by Gender and RaceFY 2011
0
10
20
30
40
50
60
Male FemaleCode J White Black Hispanic Asian Native-Amer MultiracialMale 51 3 12 17 2 1
Female 37 5 17 11 0 0Male 59.3% 3.5% 14.0% 19.8% 2.3% 1.2%
Female 52.9% 7.1% 24.3% 15.7% 0.0% 0.0%
25
Note : Percentages rounded to the nearest tenth

Source: Cognos Rev.1.25.12
Code P by Gender and RaceFY 2011
0
5
10
15
20
25
Male FemaleCode P White Black Hispanic Asian Native-Amer MultiracialMale 21 0 3 1 1 0
Female 3 1 1 1 0 0Male 80.8% 0.0% 11.5% 3.8% 3.8% 0.0%
Female 50.0% 16.7% 16.7% 16.7% 0.0% 0.0%
26
Note : Percentages rounded to the nearest tenth

Source: Cognos Rev.1.25.12
Code Q by Gender and RaceFY 2011
0
2
4
6
8
10
12
14
Male FemaleCode Q White Black Hispanic Asian Native-Amer Multiracial
Male 12 3 1 2 1 1Female 3 0 2 0 0 0Male 60.0% 15.0% 5.0% 10.0% 5.0% 5.0%
Female 60.0% 0.0% 40.0% 0.0% 0.0% 0.0%
27
Note : Percentages rounded to the nearest tenth

Source: Cognos Rev.1.25.12
Code R by Gender and RaceFY 2011
0
10
20
30
40
50
60
70
80
90
Male FemaleCode R White Black Hispanic Asian Native-Amer MultiracialMale 81 3 9 13 1 3
Female 11 0 1 6 0 1Male 73.6% 2.7% 8.2% 11.8% 0.9% 2.7%
Female 57.9% 0.0% 5.3% 31.6% 0.0% 5.3%
28
Note : Percentages rounded to the nearest tenth

Source: Cognos Rev.1.25.12
Code S by Gender and RaceFY 2011
0
10
20
30
40
50
60
70
80
90
100
Male FemaleCode S White Black Hispanic Asian Native-Amer MultiracialMale 92 1 7 8 0 0
Female 29 0 2 4 1 0Male 85.2% 0.9% 6.5% 7.4% 0.0% 0.0%
Female 80.6% 0.0% 5.6% 11.1% 2.8% 0.0%
29
Note : Percentages rounded to the nearest tenth

Code T by Gender and RaceFY 2011
0
20
40
60
80
100
120
140
160
180
Male FemaleCode T White Black Hispanic Asian Native-Amer MultiracialMale 162 5 6 51 1 3
Female 41 2 5 12 0 1Male 71.1% 2.2% 2.6% 22.4% 0.4% 1.3%
Female 67.2% 3.3% 8.2% 19.7% 0.0% 1.6%
Source: Cognos Rev.1.25.12 30
Note : Percentages rounded to the nearest tenth

Code V by Gender and RaceFY 2011
0
5
10
15
20
25
Male Female
Code V White Black Hispanic Asian Native-Amer MultiracialMale 14 2 3 2 0 0
Female 21 5 4 3 0 1Male 66.7% 9.5% 14.3% 9.5% 0.0% 0.0%
Female 61.8% 14.7% 11.8% 8.8% 0.0% 2.9%
Source: Cognos Rev.1.25.12 31
Note : Percentages rounded to the nearest tenth

Comparison of Student Programs by Gender and Race FY 2011
PROGRAM Total Male Female White Black Asian Native Amer. Hispanic Multi Disabled
CODE S/ROTHS 9 7 2 4 0 3 0 2 0 N/ADEVELOP 18 10 8 14 1 3 0 0 0 N/AGREENE 29 19 10 0 29 0 0 0 0 N/A
HIGHER EDUC. 129 67 62 47 15 10 9 25 23 N/AiGEM 9 8 1 4 0 4 0 0 1 N/A
INSPIRE 46 31 15 15 0 30 0 1 0 2NSBRI 3 3 0 2 0 1 0 0 0 N/APSTI+ 18 3 15 5 5 1 1 6 0 N/APSTI 20 2 18 3 0 5 0 12 0 N/A
ROBOTICS ACA. 34 22 12 21 1 10 1 1 0 N/ASTI/UARC 7 4 3 4 0 3 0 0 0 N/A
SCEP/STEP 25 8 17 13 1 7 1 3 0 N/ASTEM SYMP. 67 24 43 13 29 5 5 15 0 1
EAP 172 123 49 96 6 51 0 9 10 2ACCEDP 34 17 17 9 1 16 0 2 6 N/A
INTERNAT’L 94 69 25 75 1 13 0 5 0 N/AEXPL. ACADEMY 16 9 7 12 1 2 0 1 0 N/A*SINGULARITY 80 54 26 N/A N/A N/A N/A N/A N/A N/A
Total 810 480 330 337 90 164 17 82 40 5
Note: *Singularity did not provide RNO dataSource: Dean of Student (David Morse) Rev.1.25.12 32

Note: Target Disability is included in Reportable Disability Source: Cognos Rev.1.25.12
Target Disability :8
INABILITY TO READ ORDINARY SIZE PRINT, NOT CORRECTABLE BY GLASSESBLIND IN BOTH EYESMENTAL OR EMOTIONAL ILLNESSPARTIAL PARALYSIS - ONE SIDE OF BODY, INCLUDING ONE ARM AND ONE LEG
Reportable Disability:63
SEVERE SPEECH MALFUNCTION OR INABILITY TO SPEAK, HEARING IS NORMALHARD OF HEARINGABILITY TO READ ORDINARY SIZE PRINT WITH GLASSES BUT LOSS OF PERIPHERALBLIND IN ONE EYELOSS OF ABILITY TO MOVE OR USE ONE OR BOTH FEETLOSS OF ABILITY TO MOVE OR USE ONE OR BOTH LEGSLOSS OF ABILITY TO MOVE OR USE BACKLOSS OF ABILITY TO MOVE OR USE ANY COMBINATION OF TWO OR MORE PARTS OF THE BODYHEART DISEASE, WITH NO RESTRICTION OR LIMITATION OF ACTIVITYBLOOD DISEASEDIABETESPULMONARY OR RESPIRATORY DISORDERSKIDNEY DYSFUNCTIONINGCANCER WITH COMPLETE RECOVERY. A HISTORY OF CANCER WITH COMPLETE RECOVERYLEARNING DISABILITY
Org Code A C D H I J P Q R S T V Total
Reportable Disability 6 0 3 1 0 16 0 2 9 6 16 4 63
Target Disability 0 0 0 0 0 4 0 0 1 1 2 0 8
FY 2011 Ames Type of Disabilities
33

Source: Brio Rev.1.25.12
0
10
20
30
40
50
60
70
Ames Veterans Workforce by RaceFY 2011
34
White Black Hispainic Asian/P.I Native-Amer. Multiracial
Veterans 58 10 12 12 0 1

Source: Cognos Rev.1.25.12
A C D H I J P Q R S T V
Male 5 3 1 2 1 19 3 5 5 11 22 5
Female 1 2 2 1 0 1 1 0 0 0 2 1
2.5
7.5
12.5
17.5
22.5
Ames Veterans Workforce by Organization CodeFY 2011
35


![Honda Brio Brochure [THA]](https://static.fdocuments.in/doc/165x107/55170960497959a8308b4749/honda-brio-brochure-tha.jpg)


