
American Society of Critical Care Anesthesiologists …19th Annual Meeting Friday, October 13, 2006...
167
19th Annual Meeting Friday, October 13, 2006 Hilton Chicago Chicago, Illinois Syllabus American Society of Critical Care Anesthesiologists Jointly sponsored by the American Society of Anesthesiologists (ASA). For your convenience, presented one day prior to the ASA Annual Meeting. Photo courtesy of the Chicago Convention and Tourism Bureau
Transcript of American Society of Critical Care Anesthesiologists …19th Annual Meeting Friday, October 13, 2006...

19th Annual MeetingFriday, October 13, 2006
Hilton ChicagoChicago, Illinois
Syllabus
American Society of Critical Care Anesthesiologists
Jointly sponsored by theAmerican Society of Anesthesiologists (ASA).
For your convenience, presented one day prior to the ASA Annual Meeting.
Photo courtesy of the Chicago Convention and Tourism Bureau

The Society of Critical Care Anesthesiologists Express Its Appreciation
to theFollowing Corporations Who Generously Support
the ASCCA 19th Annual Meeting
Baxter International
Hospira Worldwide, Inc.
GlaxoSmithKline

Order of Contents
2004-2006 Officers and Directors
Program InformationAccreditationLearning ObjectivesASCCA Breakfast Panels at the ASA Annual Meeting
Awards
Program Faculty
Faculty Disclosures
Abstract Presenter Disclosures
Progam Schedule

DirectorsMichael Ault, M.D.
Northwestern UniversityChicago, Illinois
Louis Brusco, Jr., M.D., FCCMSt. Luke’s-Roosevelt Hospital Center
New York City, New York
Eugene Y. Cheng, M.D.Kaiser Permanente
Santa Teresa Medical CenterSan Jose, California
Andrea Gabrielli, M.D.University of FloridaGainesville, Florida
William A. Hurford, M.D.University of Cincinnati Medical Center
Cincinnati, Ohio
Michael F. O’Connor, M.D.University of Chicago Hospitals and Clinics
Chicago, Illinois
Brain P. Kavanagh, M.B.Hospital for Sick ChildrenToronto, Ontario, Canada
PresidentStephen O. Heard, M.D.
University of Massachusetts Medical CenterWorchester, Massachusetts
President-ElectGerald A. Maccioli, M.D.Raleigh Practice CenterRaleigh, North Carolina
SecretaryHeidi B. Kummer, M.D., Ph.D.
Boston UniversityBoston, Massachusetts
TreasurerTodd Dorman, M.D.
Johns Hopkins UniversityBaltimore, Maryland
Immediate Past PresidentClifford S. Deutschman, M.D.
University of PennsylvaniaPhiladelphia, Pennsylvania
ASCCA 2004-2006 Officers
Program Information
AccreditationThis activity has been planned and implemented in accordance with the Essential Areas and Policies of theAccreditation Council for Continuing Medical Education through the joint sponsorship of the American Society ofAnesthesiologists and the American Society of Critical Care Anesthesiologists. The American Society ofAnesthesiologists is accredited by the Accreditation Council for Continuing Medical Education to sponsor continuingmedical education for physicians.
The American Society of Anesthesiologists designates this educational activity for a maximum of 7 AMA PRACategory 1 Credit(s)™. Physicians should only claim credit commensurate with the extent of their participation inthe activity.
Learning Objectives• To present an update on activities and efforts undertaken by the American Society of Critical Care
Anesthesiologists and the American Society of Anesthesiologists.
• To present current basic and clinical research relevant to the art and science of critical care anesthesia.
• To review the state of the current understanding of the complications of transfusion and their treatment.
• To discuss the management of ventilation during and after CPR events, and how it can alter physiology and recovery.
• To compare the information provided by the combination of central venous pressure monitoring and echocardiography to that obtained with a pulmonary artery catheter, and to review how this information can beused to manage patients with unstable circulations.
• To understand what the future of medical accident investigation is, and how it will help shape critical care in thefuture.
• To review the physiology of inflammation as it relates to lung injury, and the modulators that are presently believedto drive injury in a variety of clinically important lung injuries.
• To review the results from the various ARDSnet protocols that have closed, and to review the status of ongoingARDSnet studies, and to discuss their application to clinical practice.
• To learn from a critical care lifetime achievement award recipient about state-of-the-art critical care anesthesia.
• To discuss the scientific and clinical importance of posters presented at the meeting with acknowledged clinical leaders in critical care.
• To debate the role of the inflammatory response and its modulation in critical illness.

ASCCA Breakfast Panels at the ASA Annual MeetingTitle: The ICU of the FutureModerator: Stephen O. Heard, M.D.Professor and ChairUMass Memorial Medical CenterWorcester, Massachusetts
Sunday, October 15, 20067:00-8:15 a.m.Hilton Chicago - Grand Ballroom
Learning Objectives• Understand the potential role of ICU telemedicine in reducing patient morbidity and mortality• Review opportunities to improve patient care via patient care guidelines and protocols
Title: Making Perioperative Care SafeModerator: Jeanine P. Wiener-Kronish, M.D.Professor of Anesthesia and MedicineVice-Chair, Anesthesia and Perioperative Care Investigator, Cardiovascular Research Institute San Francisco, California
Wednesday, October 18, 20067:00 - 8:15 a.m.Hilton Chicago - Grand Ballroom
Lecture Objectives• Discuss the use of care bundles, creating redundancy, standardization and the importance of changing
culture, with several practical examples from successful collaboratives• Explain why protocols are useful and important, which protocols are to be used, and what outcomes are
changed by protocols
Systems Approach to Perioperative CareSean Berenholz, M.D., M.H.S.Assiant Professor of AnesthesiologyJohns Hopkins UniversityBaltimore, Maryland
Do Clinical Protocols Improve Outcomes?Daniel H. Burkhardt, III, M.D.University of CaliforniaSan Francisco, California

AwardsASCCA-FAER Research AwardThis grant, which was offered from July 2005 through June 2007, was made possible through the support of AbbottLaboratories and is known as the ASCCA-FAER-Abbott Laboratories Physician Scientist Award. The physician sci-entist award provides research funding in the amount of $75,000 per year for two years. Please see www.ascca.orgfor further details.
ASCCA-FAER-Abbott Laboratories are pleased to announce the recipient of the joint two-year research traininggrant (RTG) for new physician scientists working with a well-established mentor doing either basic science or clinicalresearch. The recipient is Pratik Pandharipande, M.B., B.S. of the Vanderbilt University School of Medicine. He isstudying "A Randomized, Double-Blind Trial in Ventilated ICU Patients Comparing Treatment with an Alpha 2Agonist Versus a Gamma Aminobutyric Acid (GABA) – Agonist to Determine Delirium Rates, Efficacy of Sedationand Analgesia, and Clinical Outcomes Including Duration of Mechanical Ventilation and 3 Month Cognitive Status."His grant will run for two years, July 2005, through June 2007.
Young Investigator AwardThis award is presented annually to the resident or fellow whose research exemplifies the Society’s mission to edu-cate anesthesiologists in the care of critically ill patients and to foster the knowledge and practice of critical caremedicine by anesthesiologists. The recipient of the Young Investigator Award will make an oral presentation of theirwork at the ASCCA Annual meeting. ASCCA is proud to announce the 2005 Young Investigator Award recipient asNilesh M. Mehta, M.D., Children’s Hospital, Boston, Massachusetts. ASCCA is also proud to announce the 2006Young Investigator Award recipient as Hannah Wunsch, M.D., M.Sc., Columbia University, New York City, NewYork.
Lifetime Achievement AwardAttendees of the ASCCA 19th Annual Meeting will honor Douglas B. Coursin, M.D., University of Wisconsin,Madison, Wisconsin, as this year’s Lifetime Achievement Award winner. This award recognizes Dr. Coursin’s distin-guished service and outstanding contributions to critical care medicine.

Program Committee and Faculty
Program CommitteeLouis Brusco, Jr., M.D., FCCMColumbia University New York City, New York
Michael F. O’Connor, M.D.University of ChicagoChicago, Illinois
FacultySteven J. Allen, M.D., FCCMUniversity of TexasHouston, Texas
Louis Brusco, Jr., M.D., FCCMColumbia University New York City, New York
Richard I. Cook, M.D.University of ChicagoChicago, Illinois
Clifford S. Deutschman, M.D., FCCMUniversity of Pennsylvania Health SystemPhiladelphia, Pennsylvania
Jeffrey M. Dodd-O, M.D.William H. Welch Medical LibraryJohns Hopkins University School of MedicineBaltimore, Maryland
Andrea Gabrielli, M.D., FCCMUniversity of FloridaGainesville, Florida
William E. Hurford, M.D., FCCMUniversity of Cincinnati Medical CenterCincinnati, Ohio
Mark J. Lema, M.D., Ph.D.Roswell Park Cancer InstituteBuffalo, New York
Philip D. Lumb, M.B., B.S.University of Southern CaliforniaLos Angeles, California
Patrick J. Neligan, M.D.University of PennsylvaniaPhiladelphia, Pennsylvania
Michael F. O’Connor, M.D.University of ChicagoChicago, Illinois
Peter Rock, M.D.University of North Carolina Chapel Hill, North Carolina
Andrew Rosenberg, M.D.University of MichiganAnn Arbor, Michigan
Aryeh Shander, M.D.Englewood HospitalEnglewood, New Jersey
Per A. Thorborg, M.D., Ph.D., FCCMOregon Health Sciences UniversityPortland, Oregon
Michael H. Wall, M.D.UT Southwestern Medical CenterDallas, Texas
Joel B. Zivot, M.D.University Hospital of ClevelandCleveland, Ohio

Program Committee and Faculty DisclosuresEach presenter is required to disclose the existence of any financial interest and/or other relationship(s) (e.g. employee, consultant grant recipient/research support he/she might have with either the manufacturer(s) of anycommercial product(s) to be discussed during his/her presentation and/or the commercial contributor(s) of the activity.)
Key
1= Nothing to Disclose2 = Salary3 = Ownership
4 = Royalties5 = Equity Position6 = Stock Options
7 = Funded Research8 = Consulting Fees9 = Honoraria10 = Other Material Support
Faculty Disclosure NotesClifford S. Deutschman, M.D., 8 Wyeth Pharmaceuticals
FCCMAryeh Shander, M.D. 7 Abbott, AstraZeneca, Ortho Biotech
8 Abbott, AstraZeneca, GlaxoSmithKline, NovoNordisk, Ortho Biotech
9 Abbott, Bayer, Hospira, NovoNordisk, Ortho Biotech
Program Committee Disclosure NotesLouis J. Brusco, Jr., M.D., FCCM 9 ESP Pharmaceuticals, Wyeth Labs, Abbott Labs, HospiraMichael F. O’Connor, M.D. 1
The following presenters have nothing to disclose (1):Steven J. Allen, M.D., FCCMRichard I. Cook, M.D.Douglas B. Coursin, M.D.Jeffrey M. Dodd-O, M.D.Andrea Gabrielli, M.D., FCCMWilliam E. Hurford, M.D., FCCMMark J. Lema, M.D., Ph.D.Philip D. Lumb, M.B., B.S.Patrick J. Neligan, M.D.Peter Rock, M.D.Andrew Rosenberg, M.D.Per A. Thorborg, M.D., Ph.D.,
FCCMMichael H. Wall, M.D.Joel B. Zivot, M.D.

Abstract Presenter DisclosuresEach presenter is required to disclose the existence of any financial interest and/or other relationship(s) (e.g. employee, consultant grant recipient/research support he/she might have with either the manufacturer(s) of anycommercial product(s) to be discussed during his/her presentation and/or the commercial contributor(s) of the activity.)
Key
1= Nothing to Disclose2 = Salary3 = Ownership
4 = Royalties5 = Equity Position6 = Stock Options
7 = Funded Research8 = Consulting Fees9 = Honoraria10 = Other Material Support
Senior Author Disclosure NotesJack H. Crawford, M.D., Ph.D. 10 iNO TherapeuticsSteven Deem, M.D. 10 Roche DiagnosticsAndrea Gabrielli, M.D. 2Tina Kunz, M.D. 10Pratik Pandharipande, M.D. 7 Hospira, Inc.
Gabriella Aschkenasy, M.D.James M. Blum, M.D.Daniel R. Brown, Ph.D., M.D.Troy Buck, M.D.Christian Byhahn, M.D.Enrico M. Camporesi, M.D.Mark A. Cesta, M.D.W. Christopher Croley, M.D.Larry Field, M.D.Gyorgy Frendl, M.D., Ph.D.Christiane G. Frick, M.D.Francesco A. Grasso, M.D.Judith Hellman, M.D.Marc Helming, M.D.Rajni K. Jutla, M.D.D. Keller, D.O.Nilesh M. Mehta, M.D.
Joseph L. Nates, M.D., M.B.A., FCCMTakefumi Nishida, M.D.Matthew Peterson, B.S.Tuhin K. Roy, M.D., Ph.D.Leif Saager, M.D.Nita D. Sahani, M.D.Aryeh Shander, M.D., FCCM, FCCPAvery Tung, M.D.Michael K. Urban, M.D., Ph.D.Jim Wong, M.D.Samrat H. Worah, M.D.Hannah Wunsch, M.D., M.Sc.Zdravka Zafirova, M.D.
The following presenters have nothing to disclose (1):

Program Schedule7:00 a.m. - 5:30 p.m. Registration
7:00 a.m. Continental Breakfast
7:45 - 7:50 a.m. Welcome and Introductions Co-Chairs: Louis Brusco, Jr., M.D., FCCM;Michael F. O’Connor, M.D.
Morning Session Lectures: First Lecture Session: Moderator – Andrew Rosenberg, M.D.7:50 - 8:20 a.m. Complications of Transfusion
Aryeh Shander, M.D.
8:20 - 8:50 a.m. Hyperventilation During and After CPRAndrea Gabrielli, M.D., FCCM
8:50 - 9:20 a.m. Inflammatory Drivers of Acute Lung InjuryJeffrey M. Dodd-O, M.D.
9:20 - 9:30 a.m. Q&A
9:30 - 9:50 a.m. Break and Poster Viewing
Second Lecture Session: Moderator – Joel B. Zivot, M.D.9:50 - 10:20 a.m. The Future of Medical Accident Investigation
Richard I. Cook, M.D.
ASCCA/SCA Joint Panel10:20 - 10:50 a.m. The Combination of CVP and Echo Is Superior to the PA Catheter in the ICU
Michael H. Wall, M.D.
10:50 - 11:20 a.m. Acute Lung Injury - Update on ARDS and ARDSNetPeter Rock, M.D.
11:20 - 11:30 a.m. Q&A
11:30 a.m. - Noon Address by the ASA President-ElectMark J. Lema, M.D., Ph.D.
12:00 Noon - 1:30 p.m. Lunch and Business Meeting
Scientific and Leadership Session 1:30 - 1:40 p.m. Presentation of Residents Travel Awards
1:40 - 1:50 p.m. Introduction of ASCCA/FAER/Research Award
1:50 - 2:30 p.m. Young Investigator Award and Presentation of Abstract
2:30 - 3:00 p.m. Recombinant Factor VIIa - Use in the OR and ICUPer Thorborg, M.D., Ph.D., FCCM
NewASCCA/SCA
Panel

3:00 - 4:00 p.m. Break, Poster Viewing and Professor Walk RoundsFacilitators: Philip D. Lumb, M.B., B.S.; Steven J. Allen, M.D., FCCM;Clifford S. Deutschman, M.D., FCCM; Michael H. Wall, M.D.
4:00 - 4:30 p.m. Lifetime Achievement Award Presentation and LecturePresenter: Clifford S. Deutschman, M.D., FCCMRecipient: Douglas B. Coursin, M.D.
4:30 - 5:30 p.m. Pro-Con “You Can’t Have Too Much Inflammation” Moderator: Patrick J. Neligan, M.D.Discussants: Clifford S. Deutschman, M.D., FCCM (Pro)William E. Hurford, M.D., FCCM (Con)

Risks and Complications of Transfusion
Aryeh Shander, M.D. Englewood Hospital
Englewood, New Jersey The history of transfusion and its complications Transfusion therapy dates back to the late fifteenth century.1 The first successful transfusion of human blood was performed in 1818 by British obstetrician James Blundell. The discovery of the ABO compatibility system by Karl Landsteiner in 1901—for which he received the 1930 Nobel Prize in Medicine—opened the modern era of blood transfusion as a therapeutic agent.2 The introduction of preservatives and anticoagulants to red blood cells (RBCs) further revolutionized transfusion therapy. Such advances in transfusion medicine meant that surgery could be performed with little risk of death from bleeding, and the observed risk of infection with hepatitis C virus (HCV) was considered acceptable when compared with the potential benefit. The 1980s brought new dangers to transfusion recipients. Risk of infection with human immunodeficiency virus (HIV) led to large-scale attempts to clear the blood supply from infectious agents. During 1996 and 1997, the US government issued reports suggesting several procedures to improve blood safety, including regulatory reform.3 By the year 2000, the list of risks associated with transfusion had grown considerably, and so had the search for ways to protect the transfusion recipient. That search continues today, but the possibility that indiscriminate use of this precious resource might have created a highly unfavorable risk to benefit ratio remains a significant concern. Blood transfusion: the global picture Currently, an estimated 80 million units of blood are donated each year worldwide.4 In the United States alone, 1 unit of blood is transfused every 25 seconds. These figures clearly demonstrate that the risks associated with transfusion represent a formidable and highly relevant issue for today’s transfusion recipients.5 Furthermore, only 43% of the nations belonging to the World Health Organization (WHO) test blood for the presence of HIV, HCV, or hepatitis B virus (HBV). Another disturbing statistic suggests that 20% of the world’s population uses 80% of the safe blood supply. Growing concerns about the increasingly unfavorable safety profile of blood transfusions means that we are now in the midst of an unprecedented global movement to minimize the inappropriate use of allogeneic blood and blood products. The hemovigilance networks Hemovigilance networks have been introduced in several countries in order to improve knowledge and increase awareness of transfusion-related morbidity and mortality. The network in France involves the mandatory reporting of untoward transfusion events from transfusion centers and hospitals to a national database. As of March 1999, approximately 7,000 events had been reported annually through this network. Two thirds of these events involved immediate reactions. A total of 185 transfusion patients experienced bacterial infection, with a mortality rate of 9.7% (22% of the total transfusion-related deaths). The rate of major reported ABO mismatch remained approximately 1:138,000 U between 1996 and 1999, accounting for six fatalities.6 These observations suggest that similar worldwide monitoring systems would not only facilitate analysis of transfusion-related incidents at a global level, but would also permit us to measure the effects of new processes or corrective actions implemented at a national level.6

Current and emerging risks of allogeneic blood transfusion - Errors in transfusion medicine and ABO incompatibility: ABO incompatibility, estimated at a rate of 1:16,000, remains a considerable risk of transfusion, leading to an estimated global morbidity and mortality rate of approximately 1:600,000.7 It usually occurs as the result of clerical or clinical error. Indeed, clerical error and the multiple handling procedures involved in a transfusion are high in the list of associated complications, and continue to be resistant to current efforts of error correction.8 Two thirds of errors occur in the clinical area (incorrect identification of the recipient to the blood unit or phlebotomy errors), and approximately 30% of errors occur in the laboratory.9 One in 33,000 units is ABO-incompatible because of error and half of those are associated with a transfusion reaction, and approximately 10% of those are fatal.10 - Transmission of infection: Current estimates indicate that the incidence of transfusion-associated HIV infection US is 1:1.5 to 2 million units, compared with approximately 1:400,000 U in 199711 (Table 1). Similar success has been achieved in the reduction of HCV infection, but the decline in the incidence of HBV has been less marked.12 Alternative sources of infection that currently pose little threat to the blood supply (such as Simian Foamy Virus13) may become more prevalent in the coming years, and might therefore represent a potential risk to the future supply of donated blood. In the US, West Nile Virus (WNV) was a major threat to the blood supply, but rapid detection and donor selection have reduced the risk considerably. Similarly, Transmission of T. Cruzii responsible for Chagas disease is becoming increasingly common. If this continues, it is likely to develop into a serious transfusion problem especially affecting of platelet transfusions. Lastly, bacterial infection remains a problem. Such infections are usually associated with platelet transfusion, but they do occur following administration of RBCs (Table 1). - Transfusion-related immune modulation: Data from a variety of sources have indicated that allogeneic transfusions are associated with a clinically significant immunosuppression known as transfusion-related immune modulation (TRIM)1 (Table 1). This is a major concern particularly for those who are already immunocompromised such as the critically ill or those undergoing major surgery. The precise mechanism has yet to be elucidated,1 but its effects are thought to be cytokine-mediated. TRIM’s clinical impact remains a highly controversial area with only a few prospective studies investigating it so far. However, the recognition that TRIM can significantly increase morbidity and mortality in allogeneically transfused patients has become a major concern for all those involved in transfusion medicine.1
- Transfusion-related acute lung injury: Transfusion-related acute lung injury (TRALI) is an acute respiratory distress syndrome that occurs within 4 hours after transfusion and is characterized by dyspnea and hypoxia caused by noncardiogenic pulmonary edema. Although its occurrence is almost certainly underreported, its estimated frequency is approximately 1 in 1000-2000 transfusions14 and about 0.02% per unit transfused averaged for all blood products with a higher incidence in cellular products.15 TRALI most likely results from several mechanisms including donor-recipient antibody-antigen reactions and reactive lipid products from donor blood cell membranes.15,16 As in other causes of acute respiratory distress syndrome, therapy is supportive.
Table 1. Incidence of complications resulting from blood transfusions11
Complication Risk of infection per unit transfused
Minor allergic reactions 1:100
Viral hepatitis B 1:60,000–1:250,000
Hemolytic reactions 1:6,000
Fatal hemolytic reactions 1:600,000
HIV infection 1:1.5–2,000,000
Mistransfusion 1:12–50,000
Bacterial infection 1:2,500
TRALI 1:5,000
Anaphylactic shock 1:500,000
Graft-versus-host disease Rare
TRIM 1:1
Abbreviations: TRALI, transfusion-related acute lung injury; TRIM, transfusion-related immune modulation.

- Blood shortage: Although not a risk per se, blood shortages have a significant impact on care. Sporadic shortages of various blood products have been reported. Blood shortage is therefore potentially life-threatening, as it has been said that “the most dangerous unit of blood is the one that is not available when most needed!” In addition, blood has a very short shelf life of 42 days. Recent figures suggest that approximately 10% of collected blood is discarded, due to an expired shelf-life (~8.5%) or lack of suitability for transfusion (~1.5%). One option to eliminate this problem is the use of frozen blood, which can be stored longer.17,18 - Increasing cost of allogeneic blood: The rising cost of allogeneic blood remains a threat to the continued availability of transfusion therapy compounds. Blood costs are steadily escalating due to the measures and techniques increasingly applied in order to ensure a greater degree of blood safety. Currently, the majority of tests cost approximately US $40 to $50 each. Clearly, such expense is not an option for developing countries. As the rise in blood costs is likely to continue, the gap between these countries and the western world will widen further, severely affecting the global ability to provide an adequate transfusion service. Outcome measures in blood transfusion The various risks and complications associated with blood transfusions are reflected by highly unfavorable outcome data reported over recent years. Areas with compelling data include infectious complications, systemic inflammatory response syndrome (SIRS), multiple organ failure (MOF), and mortality. - Infectious complications In a prospective study of 687 geriatric hip fracture patients undergoing surgery, it was observed that postoperative urinary tract, respiratory, or wound infection was 26.8% and 14.9% in transfused and non-transfused patients, respectively (p = 0.001). This effect was also present following multivariate analysis, suggesting that geriatric hip fracture patients who receive allogeneic RBC transfusions are at a higher risk of developing postoperative infection than those who are not transfused.19 Similar findings have been observed in other studies of orthopedic procedures,20 and in patients undergoing cardiac21 or colorectal surgery18 and those admitted to a trauma center.22 Another study of severely injured patients from a Level I Trauma Center has demonstrated a significantly greater infection rate among patients receiving blood that was more than 2 weeks old. Furthermore, multivariate analysis confirmed that age of blood is an independent risk factor for major infections.23 - Systemic inflammatory response syndrome Blood transfusion is associated with the development of SIRS. In a prospective study, data were collected on 9,539 patients admitted to a Level I Trauma Center. Regression analysis confirmed that the amount of blood transfused on admission correlated significantly with the risk of SIRS, with larger transfusions predictive not only of SIRS development, but also of subsequent mortality.24 - Multiple organ failure In a 55-month inception cohort study, data characterizing post-injury MOF were prospectively collected from 513 consecutive trauma patients who had an ISS greater than 15, who survived for longer than 48 hours, and who were older than 16 years of age. A dose-response relationship between early blood transfusion and subsequent development of MOF was observed. Despite inclusion of other indices of shock, blood transfusion was identified as an independent risk factor for post-injury MOF in 13 of 15 multiple regression models tested.25 - Mortality Long-term morbidity and mortality were evaluated in 1,915 cardiac surgery patients undergoing isolated coronary artery bypass graft (CABG) between July 1994 and December 1997. Survival data, as determined from the United States Social Security Death Index, revealed that transfused patients had twice the 5-year mortality of non-transfused patients (15% vs. 7%). Following correction for comorbidities and other factors, transfusion was still associated with a

70% increase in mortality.26 These results appear to indicate that transfusions of either RBCs or platelets lead to reduced long-term mortality, at least in the patient populations evaluated. The mechanism leading to poor transfusion outcome Are RBCs or white blood cells (WBCs) or both responsible for the poor outcome often associated with blood transfusions? It has been demonstrated that transfusion of packed RBCs can prime circulating neutrophils to release inflammatory cytokines, thus promoting post-injury hyperinflammation and MOF.27 These findings clearly suggest that RBCs are at least partially responsible for inducing some of the complications observed following blood transfusions. However, the results of another study imply that donor leukocytes may play a more direct role. Ten female trauma patients were transfused with 4 to 18 U of relatively fresh RBCs, and were sampled up to 1.5 years post-transfusion. In seven patients, multilineage persistence of donor leukocytes was found over a period of 6 months to 1.5 years at concentrations of 10-100 cells/µL.28 The survival of donor leukocytes in immunocompetent transfusion recipients reflects long-term microchimerism, which may result from engraftment of donor cells and mutual tolerance between recipient and donor leukocytes.28 An improved understanding of the factors influencing clearance and chimerism of transfused leukocytes may help to explain the development and severity of numerous transfusion-related complications. Techniques employed to reduce the number of leukocytes in donor blood prior to transfusion may reduce the risks faced by the transfusion recipient. Data from several studies indicate that the transfusion of leukocyte-depleted blood is associated with fewer untoward events and complications than non-leukocyte-reduced blood. In a study of elective colorectal surgery, patients receiving leukocyte-depleted blood demonstrated a significantly lower frequency of postoperative infection than those not transfused or those receiving buffy-coat-poor blood 29 (Figure 1). This suggests that the association between allogeneic blood transfusion and infection may be limited only to blood products that are not adequately depleted of immunosuppressive leukocytes using high-efficiency filters.29 Similar results have been obtained in a randomized study of cardiac surgery.30 At 60 postoperative days, the mortality rates of patients transfused with buffy-coat-poor blood and leukocyte-reduced blood were 7.8% and 3.3%, respectively (p = 0.015). Furthermore, the incidence of postoperative infection was higher among patients receiving buffy-coat-poor blood (23.0% of patients vs. 16.9% and 17.9% for fresh-filtered and stored-filtered leukocyte-depleted blood, respectively).30 Although such studies demonstrate a potential benefit with leukocyte-depleted rather than non-filtered allogeneic blood, the issue of whether or not leukocyte reduction should be universally applied is highly controversial. In a randomized controlled clinical trial of conversion to universal WBC reduction enrolling 2,780 patients randomized to receive either unmodified blood components or stored leukocyte-depleted blood, there were no differences between the groups for three primary outcome measures: in-hospital mortality, mean length of hospital stay post-transfusion, and median total hospital costs. Additionally, there were no differences in secondary outcomes (length of stay in intensive care, antibiotic usage, postoperative length of stay, and readmission rate) between the two groups.31 The authors thus concluded that there was no apparent advantage offered by conversion from selective to universal leukocyte reduction. These results confirm earlier findings from a study of colorectal surgery patients.32 Leukocyte depletion may offer benefit at higher filtration rates, i.e., depletion to 1 × 10⁴, but confirmatory data for this theory are lacking.
Figure 1. Transfusion of leukocyte-reduced blood reduces number of complications in surgery (The Lancet, 1996;348:841–845).29

Conclusions Current risks and poorly defined benefits will continue to be problems associated with blood transfusion. Infectious complications, immunological events, and a suggestion of increased risk of mortality all pose a threat to transfusion recipients, along with acute blood shortages and the rising cost of blood incurred by increasingly advanced hemovigilance techniques. The mechanisms leading to the largely unfavorable outcomes of transfusion therapy remain unclear. Current thinking points to several possibilities, including the effects of storage lesions in stored RBCs, the long-term persistence of donor leukocytes in the recipient circulation, or a combination of both. Whatever the cause of transfusion-related complications, the increasingly unfavorable safety profile associated with transfused blood has led to a global movement to minimize the inappropriate use of allogeneic blood and blood products. Although the quest for “blood substitutes” is ongoing, none are approved for clinical use in the US. In the meantime, employing blood conservation techniques is no longer an option but a vital necessity. References: 1. Blajchman MA. Immunomodulation and blood transfusion. Am J Ther, 2002;9:389-95 2. Kantha SS. The blood revolution initiated by the famous footnote of Karl Landsteiner’s 1900 paper, J Trauma 1995;40:123-5 3. Information for life. The history of transfusion medicine. http://www.bloodbook.com/trans-history.html. Accessed on July 17, 2006 4. Blood safety and voluntary donations. http://www.wpro.who.int/media_centre/fact_sheets/fs_20040610.htm. Accessed on July 17, 2006 5. Goodnough LT, Shander A, Brecher ME. Transfusion medicine: Looking to the future. Lancet 2003;361:161 6. Andreu G, Morel P, Forestier F, et al. Hemovigilance network in France: Organization and analysis of immediate transfusion incident reports from 1994 to 1998. Transfusion 2002;42:1356-64 7. Krombach J, Kampe S, Gathof BS, et al. Human error: the persisting risk of blood transfusion: A report of five cases. Analg Anesth 2002;94:154-6 8. Williamson LM, Lowe S, Love EM, et al. Serious hazards of transfusion (SHOT) initiative: Analysis of the first two annual reports. BMJ 1999;319:16-9 9. Lam HTC, Schweitzer SO, Petz L, et al. Are retrospective peer-review transfusion monitoring systems effective in reducing red blood cell utilization? Arch Pathol Lab Med 1996;120:810-16 10. Barnette RE, Fish DJ, Eisenstaedt RS. Modification of fresh-frozen plasma transfusion practices through educational intervention. Transfusion 1990;30:253-7 11. Klein HG, Dodd RY, Ness PM, et al. Current status of microbial contamination of blood components: Summary of a conference. Transfusion 1997;37:95-101 12. Busch MP, Kleinman SH, Nemo GJ. Current and emerging infectious risks of blood transfusions. JAMA 2003;289:959-62 13. Boneva RS, Grindon AJ, Orton SL, et al. Simian foamy virus infection in a blood donor. Transfusion 2002;42:886-91 14. Vamvakas EC. Transfusion-associated cancer recurrence and postoperative infection: meta-analysis of randomized, controlled clinical trials. Transfusion 1996;36:175-86 15. Shander A, Popovsky MA. Understanding the consequences of transfusion-related acute lung injury. Chest 2005;128(5 Suppl 2):598S-604S 16. American Association of Blood Banks. BPAC recommends universal leukoreduction. AABB News Briefs 1998;20(11):16 17. Lelkens CC, Noorman F, Koning JG, et al. Stability after thawing of RBCs frozen with the high- and low-glycerol method. Transfusion 2003;43:157-64 18. Torchia MG, Danzinger RG. Perioperative blood transfusion and albumin administration are independent risk factors for the development of postoperative infection after colorectal surgery. Can J Surh 2000;43:212-6 19. Koval KJ, Rosenberg AD, Zuckerman JD, et al. Does blood transfusion increase the risk of infection after hip fracture? J Orthop Trauma 1997;11:260-6

20. Fernandez MC, Gottlieb M, Menitove JE. Blood transfusion and postoperative infection in orthopedic patients. Transfusion 1992;32:318-22 21. Leal-Noval SR, Rincon-Ferrari MD, Garcia-Curiel A, et al. Transfusion of blood components and postoperative infection in patients undergoing cardiac surgery. Chest 2001;119:1461-8 22. Claridge JA, Sawyer RG, Schulman AM, et al Blood transfusions correlate with infections in trauma patients in a dose-dependent manner. Am Surg 2002;68:566-72 23. Offner PJ, Moore EE, Biffl WL, et al. Increased rate of infection associated with transfusion of old blood after sever injury. Arch Surg 2002;137:711-7 24. Malone DL, Kuls D, Napolitano LM, et al. Back to basics: Validation of the admission systemic inflammatory response syndrome score in predicting outcome in trauma. J Trauma 2001;51:458-63 25. Moore FA, Moore EE, Sauaia A. Blood transfusion. An independent risk factor for postinjury multiple organ failure. Arch Surg 1997;132:620-4 26. Engoren MC, Habib RH, Zacharias A, et al. Effect of blood transfusion on long-term survival after cardiac operation. Ann Thorac Surg 2002;74:1180-6 27. Zallen G, Moore EE, Ciesla DJ, et al. Stored red blood cells selectively activate human neutrophils to release IL-8 and secretory PLA2. Shock 2000;13:29-33 28. Lee TH, Paglieroni T, Ohto H, et al. Survival of donor leukocyte subpopulations in immunocompetent transfusion recipients: frequent long-term microchimerism in severe trauma patients. Blood 1999;93:31277-39 29. Jensen LS, Kissmeyer-Nielsen P, Wolff B, et al. Randomised comparison of leucocyte-depleted versus buffy-coat-poor blood transfusion and complications after colorectal surgery. Lancet 1996;348:841-5 30. van de Watering LM, Hermans J, Houbiers JG, et al. Beneficial effects of leukocyte depletion of transfused blood on postoperative complications in patients undergoing cardiac surgery: A randomized clinical trial. Circulation 1998;97:562-8 31. Dzik WH, Anderson JK, O’Neil EM, et al. A prospective randomized clinical trial of universal WBC reduction. Transfusion 2002;42:1114-22 32. Titlestad IL, Ebbesen LS, Ainsworth AP, et al. Leukocyte-depletion of blood components does not significantly reduce the risk of infectious complications. Results of a double-blinded, randomized study. Int J Colorectal Dis 2001;16:147-53

Hyperventilation and Low Flow States (CPR and other): Less is more
Andrea Gabrielli, M.D., FCCM University of Florida Gainesville, Florida
Introduction The importance of ventilation in resuscitation is reflected in the “ABC’s” (Airway, Breathing, Circulation), which is the recommended sequence of resuscitation practiced in a broad spectrum of illnesses including traumatic injury, unconsciousness and respiratory and cardiac arrest. Since the modern era of cardiopulmonary resuscitation began in the early 1960’s, ventilation of the lungs of a victim in shock or in cardiac arrest has become important for successful resuscitation. This assumption has been recently questioned and the role of ventilation during resuscitation has been the subject of much research for more than a decade.1 Cardiac arrest represents the most classic example of a low flow state, where chest compressions provide an average of 20% of normal output. A number of laboratory studies of CPR have shown no clear benefit to ventilation during the early stages of cardiac arrest with ventricular fibrillation.2 With the introduction of the 2000 Guidelines for Cardiopulmonary Resuscitation, a new, evidence-based approach to the science of ventilation during CPR was introduced and continues with the publication of the 2005 edition. New evidence from laboratory and clinical science has led to less emphasis being placed on the role of ventilation following a dysrhythmic cardiac arrest (arrest primarily resulting from a cardiovascular event, such as ventricular fibrillation or asystole). However, the classic airway patency, breathing and circulation CPR sequence remains a fundamental factor for the immediate survival and neurological outcome of patients after asphyxial cardiac arrest (cardiac arrest primarily resulting from respiratory arrest). Pathophysiology of respiratory failure in low flow state 1. Effects of hypoxemia and hypercarbia on pulmonary airways During respiratory and cardiac arrest, hypoxemia and hypercarbia gradually increase over time. The concentrations of both oxygen and carbon dioxide affect ventilation and gas exchange. Hypoxemia has variable effects on airway resistance, which is the frictional resistance of the airway to gas flow and is expressed by:
Airway resistance (cm H2O/L/s) = pressure difference (cm H2O) /flow rate (L/s) In general hypocapnia causes bronchoconstriction and increased resistance to flow through a direct local effect on airways, while hypercapnia causes increased airway resistance through action on the central nervous system 2. Hypoxic pulmonary vasoconstriction Hypoxic pulmonary vasoconstriction is a physiologic mechanism that minimizes venous admixture by diverting blood from underventilated, hypoxic areas of the lung to areas that are better ventilated. The greater the hypoxia, the greater the pulmonary vasoconstriction until a point is reached where vasoconstriction becomes so intense and widespread that the response becomes pathologic and pulmonary hypertension develops. 3. The relationship of blood flow and ventilation (V/Q ratio) during low flow conditions When systemic blood flow decreases, the flow of blood through the lungs decreases. In a low flow state, with less venous CO2 delivered to the lungs, less is available for elimination via exhalation and the concentration of CO2 in exhaled gas decreases. Because CO2 elimination is diminished, CO2 accumulates in venous blood and in the tissues. Thus, mixed venous PCO2 reflects primarily systemic and pulmonary perfusion and is an indicator of the tissue acid-base environment. During low flow conditions, arterial PCO2 and PO2 reflect primarily the adequacy of

alveolar ventilation. During low rates of blood flow, if alveolar ventilation is adequate, blood flowing through the pulmonary capillary bed is over-ventilated because of a large ventilation-perfusion mismatch.
For this reason, mixed venous blood gas values provide a more accurate assessment of perfusion during resuscitation. 4. Gas exchange and the transport of oxygen and carbon dioxide in blood Hemoglobin is the principle protein responsible for lung-to-tissue transport of O2 and tissue-to-lung transport of carbon dioxide. Hemoglobin transports CO2 as carbamino compound and in the form of bicarbonate. It can be appreciated from these mechanisms of CO2 exchange and O2 transport that alveolar oxygenation and ventilation, and pulmonary blood flow play crucial roles in the removal of CO2 from the tissues. Because pH and CO2 levels affect the affinity of hemoglobin for O2, these factors are important during low flow state. 5. Effect of ventilation on acid-base conditions and oxygenation
Acid-base conditions and oxygenation are important factors in resuscitation from low blood flow states such as shock and cardiac arrest. Hypoxemia and hypercarbic acidosis critically reduce the force of myocardial contractions3 make defibrillation difficult,4 and are associated with poor outcome. It has been observed that, during cardiac arrest, arterial blood gases do not reflect tissue conditions and that mixed venous blood has a level of carbon dioxide that is frequently twice the level of the arterial side.5 Mixed venous PCO2 and pH can be improved with proper ventilation and becomes worse with hypoventilation. However, there are major interactions between the mechanics of positive pressure ventilation, intrathoracic pressure and blood flow. Positive pressure ventilation can have such a profound effect on hemodynamics that over-ventilation can result in decreased blood flow and worsen tissue hypoxia and hypercarbia. 6. Respiratory and circulatory system interactions
Spontaneous ventilation plays an important role in maintaining cardiac output by enhancing venous return to the chest and heart. Venous return to the heart is greatest during inspiration because negative intrathoracic pressure creates a pressure gradient between thoracic blood vessels and those outside the chest. In contrast, assisted positive pressure ventilation with mechanical ventilators and self-inflating bags produces positive intrathoracic pressure during inspiration, reducing venous return to the chest and reducing cardiac preload and subsequent cardiac output. For a given airway pressure, pleural pressure is dependent on the compliance of the lung and chest wall. Depending on the mode of ventilation, airway pressure can be dependent on a number of variables, including inspiratory flow rate and time, tidal volume, ventilation rate and degree of intrinsic positive end-expiratory pressure (auto-PEEP). Holding all other factors constant, the higher the ventilatory rate, the greater the proportion of time with positive intrathoracic pressure and thus, the greater potential for hemodynamic compromise Deleterious Effect of Positive Pressure Ventilation in Low Flow State 1. Excessive Assisted Ventilation Can Impair Cardiac Preload and Output
A number of studies have shown that both intermittent positive pressure ventilation (PPV) and positive end-expiratory pressure (PEEP) can impair cardiac output, even in normally functioning hearts, because of reduced venous return.6
A critical factor in the development of auto-PEEP is the minute ventilation (due to excessive tidal volume, and/or increased respiratory rate) and decreased expiratory time. It has been described as a common etiology of pulseless electrical activity during resuscitation. Again, the major mechanism of cardiac output impairment is diminished cardiac preload and the effects are even more pronounced in progressively hypovolemic states.
2. Excessive Assisted Ventilation Can Lead to Brain Ischemia and Hypoxia The American Association of Neurological Surgeons now recommends that hyperventilation (PaCO2 < 35 mm Hg) should be avoided during the first 24 hours after traumatic brain injury (TBI), except when signs of brain herniation are present or when specialized monitoring is available, thus excluding the prehospital setting.7
Nevertheless, hyperventilation is not only a very common occurrence in the prehospital setting, it often remains the
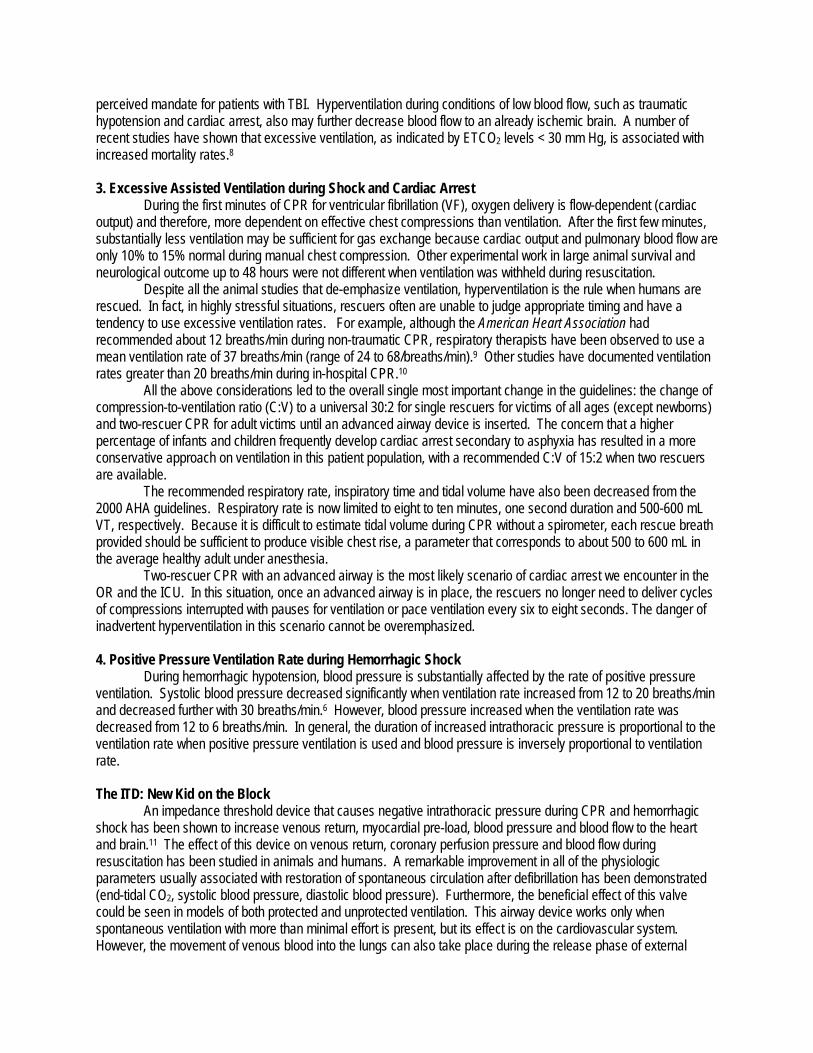
perceived mandate for patients with TBI. Hyperventilation during conditions of low blood flow, such as traumatic hypotension and cardiac arrest, also may further decrease blood flow to an already ischemic brain. A number of recent studies have shown that excessive ventilation, as indicated by ETCO2 levels < 30 mm Hg, is associated with increased mortality rates.8 3. Excessive Assisted Ventilation during Shock and Cardiac Arrest
During the first minutes of CPR for ventricular fibrillation (VF), oxygen delivery is flow-dependent (cardiac output) and therefore, more dependent on effective chest compressions than ventilation. After the first few minutes, substantially less ventilation may be sufficient for gas exchange because cardiac output and pulmonary blood flow are only 10% to 15% normal during manual chest compression. Other experimental work in large animal survival and neurological outcome up to 48 hours were not different when ventilation was withheld during resuscitation. Despite all the animal studies that de-emphasize ventilation, hyperventilation is the rule when humans are rescued. In fact, in highly stressful situations, rescuers often are unable to judge appropriate timing and have a tendency to use excessive ventilation rates. For example, although the American Heart Association had recommended about 12 breaths/min during non-traumatic CPR, respiratory therapists have been observed to use a mean ventilation rate of 37 breaths/min (range of 24 to 68/breaths/min).9 Other studies have documented ventilation rates greater than 20 breaths/min during in-hospital CPR.10
All the above considerations led to the overall single most important change in the guidelines: the change of compression-to-ventilation ratio (C:V) to a universal 30:2 for single rescuers for victims of all ages (except newborns) and two-rescuer CPR for adult victims until an advanced airway device is inserted. The concern that a higher percentage of infants and children frequently develop cardiac arrest secondary to asphyxia has resulted in a more conservative approach on ventilation in this patient population, with a recommended C:V of 15:2 when two rescuers are available.
The recommended respiratory rate, inspiratory time and tidal volume have also been decreased from the 2000 AHA guidelines. Respiratory rate is now limited to eight to ten minutes, one second duration and 500-600 mL VT, respectively. Because it is difficult to estimate tidal volume during CPR without a spirometer, each rescue breath provided should be sufficient to produce visible chest rise, a parameter that corresponds to about 500 to 600 mL in the average healthy adult under anesthesia.
Two-rescuer CPR with an advanced airway is the most likely scenario of cardiac arrest we encounter in the OR and the ICU. In this situation, once an advanced airway is in place, the rescuers no longer need to deliver cycles of compressions interrupted with pauses for ventilation or pace ventilation every six to eight seconds. The danger of inadvertent hyperventilation in this scenario cannot be overemphasized. 4. Positive Pressure Ventilation Rate during Hemorrhagic Shock
During hemorrhagic hypotension, blood pressure is substantially affected by the rate of positive pressure ventilation. Systolic blood pressure decreased significantly when ventilation rate increased from 12 to 20 breaths/min and decreased further with 30 breaths/min.6 However, blood pressure increased when the ventilation rate was decreased from 12 to 6 breaths/min. In general, the duration of increased intrathoracic pressure is proportional to the ventilation rate when positive pressure ventilation is used and blood pressure is inversely proportional to ventilation rate. The ITD: New Kid on the Block
An impedance threshold device that causes negative intrathoracic pressure during CPR and hemorrhagic shock has been shown to increase venous return, myocardial pre-load, blood pressure and blood flow to the heart and brain.11 The effect of this device on venous return, coronary perfusion pressure and blood flow during resuscitation has been studied in animals and humans. A remarkable improvement in all of the physiologic parameters usually associated with restoration of spontaneous circulation after defibrillation has been demonstrated (end-tidal CO2, systolic blood pressure, diastolic blood pressure). Furthermore, the beneficial effect of this valve could be seen in models of both protected and unprotected ventilation. This airway device works only when spontaneous ventilation with more than minimal effort is present, but its effect is on the cardiovascular system. However, the movement of venous blood into the lungs can also take place during the release phase of external

chest compression when intrathoracic pressure is low. This hybrid therapeutic strategy is based on the physiologic principle that devices that enhance negative intrathoracic pressure also enhance venous blood return to the chest and heart, thus making increased cardiac output possible. Negative airway pressure enhances blood flow and venous return to the chest, while continuous positive airway pressure ventilation inhibits venous return and blood flow but decreases lung atelectasis. These studies again emphasize the crucial relationship between ventilation mechanics and circulation. CONCLUSION During normal cardiac activity, ventilation is important because it serves to remove carbon dioxide from and provide oxygen to tissues. The effect of ventilation on tissues continues even during low flow states, although its ability to provide oxygen and remove carbon dioxide is diminished and limited by blood flow. Ventilation during the first few minutes of dysrhythmic adult cardiac arrest has been somewhat de-emphasized in favor of more effective chest compression. In addition, chest compression alone can provide some ventilation, provided the upper airway is unobstructed. Rescuers often inadvertently use excessively high ventilation rates. Studies have found that positive pressure ventilation may decrease blood flow by decreasing venous return to the heart. Excessive ventilation has a detrimental effect in cardiac arrest, hemorrhagic shock and traumatic brain injury and should be avoided. BIBLIOGRAPHY
1. Cobb LA, Eliastam M, Kerber RE, Melker R, Moss AJ, Newell L, Paraskos JA, Weaver WD, Weil M, Weisfeldt ML. Report of the American Heart Association task force on the future of cardiopulmonary resuscitation. Circulation 1992; 85:2346-2355
2. Berg RA, Kern KB, Sanders AB, Otto CW, Hilwig RW, Ewy GA. Bystander cardiopulmonary resuscitation: Is ventilation necessary? Circulation 1993; 88:1907-1915
3. Weil MH, Ruiz CE, Michaels S, Rackow EC. Acid-base determinants of survival after cardiopulmonary resuscitation. Crit Care Med 1985; 13:888-892
4. Yakaitis RW, Thomas JD, Mahaffey JE. Influence of pH and hypoxia on the success of defibrillation. Crit Care Med 1975; 3:139-142
5. Grundler W, Weil MH, Rackow EC. Arteriovenous carbon dioxide and pH gradients during cardiac arrest. Circulation 1986; 74:1071-1074
6. Pepe PE, Raedler C, Lurie KG, Wigginton JG. Emergency ventilatory management in hemorrhagic states: Elemental or detrimental? J Trauma 2003 Jun; 54(6):1048-55; discussion 1055-1057
7. Management and prognosis of severe traumatic brain injury. Brain Trauma Foundation and the American Association of Neurological Surgeons. Brain Trauma foundation, Inc. New York, 2000
8. Thomas SH, Orf J, Wedel SK, Conn AK. Hyperventilation in traumatic brain injury patients: Inconsistency between consensus guidelines and clinical practice. J Trauma 2002; 52:47-52
9. Aufderheide TP, Sigurdsson G, et al. Hyperventilation-induced hypotension during cardiopulmonary resuscitation. Circulation 2004; 109(16):1960-1965
10. Abella B, Alvarado J, Myklebust H, Edelson DP, Barry A, O’Hearn N, Vanden Hoek TL, Becker LB. JAMA 2005; 293(3):363-365
11. Lurie KG, Zielinski T, McKnite S, Aufderheide T, Voelckel W. Use of an inspiratory impedance valve improves neurologically intact survival in a porcine model of ventricular fibrillation. Circulation 2002 Jan 1; 105(1):124-129

Inflammatory Drivers of Acute Lung Injury
Jeffrey M. Dodd-O, M.D. William H. Welch Medical Library
Johns Hopkins University School of Medicine Baltimore, Maryland
1
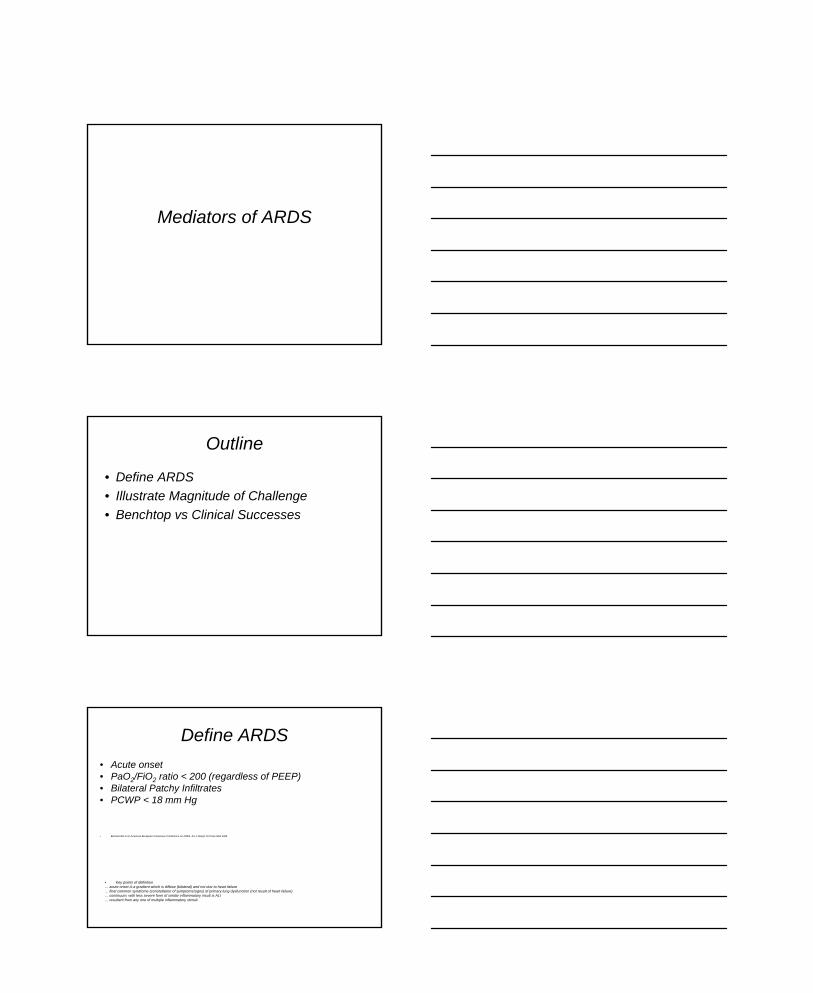
Mediators of ARDS
Outline
• Define ARDS• Illustrate Magnitude of Challenge• Benchtop vs Clinical Successes
Define ARDS
• Key points of definition… acute onset A-a gradient which is diffuse (bilateral) and not due to heart failure… final common syndrome (constellation of symptoms/signs) of primary lung dysfunction (not result of heart failure)… continuum, with less severe form of similar inflammatory insult is ALI… resultant from any one of multiple inflammatory stimuli
• Acute onset• PaO2/FiO2 ratio < 200 (regardless of PEEP)• Bilateral Patchy Infiltrates• PCWP < 18 mm Hg
• Bernard GR et al: American-European Consensus Conference on ARDS. Am J Respir Crit Care Med 1994

2
Stimulus• Direct lung injury 1-3
• Sepsis (nonpulmonary)• Multiple Transfusions• Trauma • Burns
• 1 – Arroliga AC et al, Chest 2002; 2 – Bersten AD et al, Am J Respir Crit Care Med 2002; 3) Estenssoro E et al, Crit Care Med, 2002
Stimulus
Granulocytes – Intravascular DestinationPMN - Phagocytose Basophil - secreteEsosinophil -secrete
Plasma-borne Protein Cascades
Complement System Cytokine System
Agranulocytes – Tissue Destination
Lymphocyte – Plasma CellMonocyte -> Macrophage
Peroxidase
IL-6
TNF-α
Cathepsin
Elastase
PAF
ICAM-1Nitrogen Radicals
ECP
ElastaseHistamine
MyeloperoxidaseeOxygen Radicals
Protase
EDN
C5a
Free Radicals
Elastase
IL-10
TGF-β
MBP
C3aMb Attack Complx
Phosphatase

3
Granulocytes –Neutrophils .
=> oxygen-independent (elastase, PAF, cathepsin, histamine)
=> oxygen-dependent (reactive oxygen species, myeloperoxidase)
Reactive oxygen species Myeloperoxidase
Elastase
PAFCathepsin
Histamine
Complement Activator
Eosinophils & BasophilsDegranulation Stimulated by IgE:Antigen Complex
Hydrolases
Eosinophil Cationic Protein
IL-5
IL-3
TGF-α
IL-1α
Serotonin (Basophils)
Proteases
Histamine
Tryptases
Chemotaxins
Phosphatases
Peroxidases
Leukotrienes
Monocyte/Macrophage .
Maturation of intravascular monocyte to extravascular macrophage associated with increased number of pseudopodia and phagosomes as well as redistribution of lysosomes. http://www.brookline-design.com/Illustration.htm
Nitrogen Radicals
PAF
IL-8
TNF-αIL-6
IL-1
Oxygen Radicals
Collagenase
Elastase
IL-10
IL-12 Hydrolases

4
Lymphocytes
http://asm.wku.edu/pix/cells/Lymphocyte.gif
Activate NK Cells (IgG)
Activate Neutrophils (IgG)
Activate Eosino-/Baso-phils (IgE)
Activate Complement (IgG,IgM)
Activate Macrophages (IgG)Activate Macrophages
Cytotoxic
Facilitate B-cells
IL-4
IL-2
TNF-α
Complement Pathway
C3
C3b
C3a
C5
C5a C5b-9 (MAC) Cytotoxic
Activate B-CellActivate Erythrocytes
Activate MacrophageActivate Neutrophils
Neutrophil Chemoattractant
Activate NeutrophilsDegranulate Basophils
www.biotech.spb.ru/ main.php?menu=england&list...
Antigen Presenting Cells (APC)
Cytokines
IL-2 INF-γ GMCSF
IL-4 IL-5 IL-10 IL-13 GM-CSF
IL-12IL-2
IL-2 INF-γ
IL-2
IL-2
IL-12 INF-γ
IL-2 INF-γ
IL-4
IL-1INF-γTh2 inh f
IL-10 Th1 inh f
INF-γ
GM-CSF
GM-CSF

5
Dinarello CA et al, JEM, 2005
IL-1β
Leff JA et al
• IL-1beta antagonist decreases injury in animal model of ARDS

6
TNF-α
• Activate Neutrophils, macrophages (amplifies
Inflammation)
• Neutrophil Chemoattractant (amplifies Inflammation)
• Suppresses appetite, causes fever
ICAM-1 .
• Nagase T et al, 1996 • Welty-Wolf et al (baboon gm- sepsis)

7
100
200
300
400
500
600
PaO
2 (m
m H
g)
Saline HCl ICAM Ab. (pre-HCl)
ICAM Ab/Anti Ab. (pre-HCl)
ICAM Ab/LFA Ab. (post-HCl)
Modified from Nagase T et al, Am J Resp Crit Care Med, 1996
*
* P < 0.05 vs others
ICAM
Acute Respiratory Distress Syndrome after Rituximab Infusion
Alberto J. Montero A1, John J. McCarthy A1, George Chen A1, Lawrence Rice A1
A1 Section of Hematology/Oncology, Baylor College of Medicine, Houston, Texas, USA
International Journal of Hematology Volume 82, Number 4 / November 2005/324 - 326
ARDSNet, Crit Care Med, 2002
Cytokine Inhibitor – Decrease TNF-α and IL-1β

8
GM-CSF
Phase II Sepsis Trial; ARDS 3/8 -> 5/8 placebo vs 4/10 -> 2/10 drug; No mortality difference (underpowered); Presnell JJ et al
Complement - rats
0
1
2
3
4
5
6
Lung
Per
mea
bilit
y In
dex
SHAM
VISCERAL ISCHEMIA
VISC ISCH/C1 INHIB
*
Adapted from Harkin DW et al, BJS, 2005
Zimmerman et al – Phase I Study

9
CPB-induced ARDS
• Asimakopoulos G et al
Steroids
ARDSNet, NEJM, 2006
Two Hit Hypothesis
• Patrick DA et al, J Sur Res, 1999
Spontaneous Chemiluminescence Inducible ChemiluminescenceB.

10
Lung Stretch Alone is Stimulus
0
0.5
1
1.5
2
2.5
3
3.5
Eva
ns b
lud
albu
min
ext
rava
satio
n (m
cg/m
l/lun
g)
SHAM
7 ml/kg
20 ml/kg
*
Adapted from Peng X et al, Am J Resp Crit Care Med, 2005
ARDSNet, NEJM, 2000
Initiation of Coagulation• Thrombin formation
initiated by breach in endothelium exposing underlying Tissue Factor (TF) to circulating Factor VII.
• Once complexed to TF, FVII is easily activated
• Activated FVII can now activate IX -> IXa or X -> Xa(Prothrombin -> thrombin)
• Dahlback B, J Int Med, 2005

11
Anti-inflammation/Feedback inhibit Coagulation
• Thrombin (T) in the presence of intact endothelium, acts as an anticoagulant rather than a procoagulant
• T binds to thrombomodulin(TM) on intact endothelium to activate protein C (PC)
• Activated Protein C (APC) acts as antiinflammatory by decreasing production of TNF-α, ICAM,IL-8 and C5a
• Dahlback B, J Int Med, 2005
General Inflammatory Depressant – Activated Protein C?
PROWESS, NEJM, 2001

The Future of Medical Accident Investigation
Richard I. Cook, M.D. University of Chicago
Chicago, Illinois


Big gaps are easy to identify
Small gaps may be harder to see
Handoff of care
Recognizing &reacting to apast gap
Restoring continuity
Sustaining continuity
Foreseeing& defendingagainst afuture gap
Transferform
GAP
Marker for gap
A brief look at Gaps in the Continuity of Careand how practitioners compensate for them
Copyright © 2000-2004 by R. I. Cook except as noted. Revision F(04.09.08)
!?
past
past
future
future
future
1 24
3
12
3
!
Gaps in the continuity of care are common.
Recurring, recognized gaps are partly offset bythat make up for the
discontinuities produced by gaps
An example is patient transfer between facilities.Transfer documents offset the loss ofcontinuity.
cognitive artifacts
partly
Handoffs of care are a potent source of gaps.
Example:
Defenses include artifacts (e.g. checkout logs)and activities, e.g. conversational routines thatexchange lead to exchanges of responsibilityand authority.
handoff at shift change or change inlocation.
1: Past gaps are recognized by their effects.
2: Missing / inconsistent data or unexpectedevents alert practitioners to possible gaps.
3 & 4: Practitioners usually resilient and able torestore continuity, e.g. by searching for andfinding missing data.
N.B. missing data that acts as a cue is notnecessarily the data that needs to be recoveredto restore continuity.
1: Experienced practitioners can foresee futuregaps.
2: Anticipating future gaps leads practitioners toconstruct bridges. These offset someof the expected consequences of gaps.
3: Successful bridging limits the impacts ofgaps. This has the paradoxical effect of makinggaps seem less significant.
but not all
VISN 10Cincinnati VAMC
The size of the gap doesn't determinethe potential of the gap to cause harm.
For additional materialsvisit www.ctlab.org
www.ctlab.org
Preparation of this version made possible partly through supportby the Midwest VA Patient Safety Center of Inquiry (GAPS).
patient
time
timeThis activity is a primary source of the
robustness of healthcare
transferbetweenfacilities
So
urc
es
of
resilie
nce
healt
hcare

Patient safety –2004
18 Characteristics of Complex Systems Failure
1) Complex systems are intrinsically hazardous systems.
2) Complex systems are heavily and successfully defended against failure.
3) Catastrophe requires multiple failures – a single point failure is not enough.
4) Complex systems contain changing mixtures of failures latent within them.
5) Complex systems routinely run in degraded modes.
6) Catastrophe is always just around the corner.
7) Post-accident attribution of the accident to a ‘root cause’ is fundamentally wrong.
8) Hindsight biases post-accident assessments of human performance.
9) Human operators have dual roles: as producers & as defenders against failure.
10) All practitioner actions are gambles. 11) Actions at the sharp end resolve all
ambiguity. 12) Human practitioners are the adaptable
element of complex systems. 13) Human expertise in complex systems is
constantly changing. 14) Change introduces new forms of
failure. 15) Views of ‘cause’ limit the effectiveness of
defenses against future events.
Copyright © 2000-2004 Cognitive technologies Laboratory, Revision F
16) Safety is a characteristic of systems and not of their components.
17) Failure-free operations require experience with failure.
18) People continuously create safety.
5 Characteristics of Patient Safety
1. Safety is made and broken in systems, not individuals. Safety emerges from the interaction of the components of the system. Safety does not reside in a person, device or department. Improving safety depends on learning how safety emerges from the interactions of components.
2. Progress on safety begins with understanding technical work. All progress on safety depends on precise, calibrated knowledge about how technical and organizational factors play out in real technical work.
3. Productive discussions of safety avoid confounding failure with error. Folk models that “explain” accidents confound these two distinct terms. “Failure” is the outcome itself while “error” is the result of a social process of attribution of cause. Studies of “error” are actually studies of this social process of attribution rather than studies of how failure occurs.
4. Safety is dynamic not static; it is constantly renegotiated. Systems under pressure move towards the edge of the performance envelope, shifting the tradeoff point. Risk and vulnerability change. People constantly adapt to perceived risk and vulnerability. These adaptations are only partly successful because the perceptions on which they are based are only partly calibrated. The result is that:
A. Treating safety as sacred threatens safety. B. Adding complexity makes safety harder to achieve. C. The most important safety issues are those of the future.
5. Tradeoffs are at the core of safety. Trading off between risk / hazard and other goals (e.g. production) is required for real world work. No matter how much effort is expended, people will confront irreducible uncertainty, multiple hazards, and fundamental dilemmas. Understanding safety requires understanding how people act in the face of these challenges in the environment of technical work.
Warnings about Safety 1. Treating safety as sacred threatens safety 2. Adding complexity makes success harder to
achieve 3. The most important safety issues are those of the
future
Additional details on these points appear in Cook, O'Connor, Render, Woods, "Chapter 2: Operating at the Sharp End: The Human Factors of Technical Work and Its Implications for Patient Safety" in Manuel & Nora, eds., Surgical Patient Safety: Essential Information for Surgeons in Today's Environment. (Chicago: American College of Surgeons, in press)
For more information,visit our website at www.ctlab.org
University of Chicago, [email protected] (04.09.08)

A brief look at the New Look in complex system failure,error, safety, and resilience
Copyright © 1991 - 2004 by R. I. Cookexcept as noted. All rights reserved
Organizational focus onhuman error. The reactions to failure are: blame& train, sanctions, new , , andtechnology. These interventions increasecomplexity and introduce new forms of failure.
reactions to failure
regulations rules
BadOutcome Retrospective
Review
ClassificationShift in lociof failures
More complex,brittle system
HumanError
OvertMechanical
Failure
ComplexSystemFailureRemedial
action
Quietperiod
85%
15%
0%
Cycle of Error
Work at the sharp end inevitably encounterscompeting demands for production and failure-free performance. Action resolves all dilemmas.Successful operations are the rule. Failure israre.
Increase production
Save time forsicker patients
Prepare forworkload surges
Build good relationswith staff
Avoid technicalfailure
Save budget
Invest in staffexperience for future
Avoid regulatoryscrutiny
Revision W(04.09.08)
Competing demands, dilemmas, conflicts, anduncertainty are the central features of operationsat the sharp end. Technical and organizationalconflicts overlap and interact.
Need to protectpatient safety
Need to avoidbeing sued
for malpractice
Need to maintaingood relationships
to other professionals(e.g. surgeons)
Pressure toreduce costs
Maximizepreoperativeworkup andinformation
Maximizepatient
turnover
Change surgeryto outpatient,
same dayadmission
Avoid injury to the heart
Prevent the heart muscle frombeing starved for oxygen
keep heart musclework low
provide oxygento the heart muscle
keepheartratelow
keepblood
pressurelow
keepblood
pressurehigh
keepoxygen
saturationhigh
keepoxygencarryingcapacityof blood
high
CONFLICTCONFLICT CONFLICT
Complex systems fail because of thecombination of multiple small failures, eachindividually insufficient to cause anaccident. These failures are in thesystem and their pattern changes over time.
latent
Accident
LATENTFAILURES
DEFENSES
Triggers
Modifie
dfr
om
Reason,1990
“Normal”operations
Accident / incident investigation normallystops with human error by practitioners asthe ‘cause’ of the event.
Accident Aftermath
Hours Days Weeks Months to years
Patientcentered
care
Preparingthe accident
story Formalinvestigations
Figuringout whathappened
Post-accident reviews identifyas the ‘cause’ of failure because of
. Outcome knowledge makesthe path to failure seem to have beenforeseeable - although it was not foreseen.
human error
hindsight bias
Before theAccident
After theAccident
Hindsight Bias
People make safety. Workers at the sharp endusually bridge gaps and prevent failures. Theresilience of the system is the result of thisactivity, which forms much of .
Productive approaches support this activity.
technical work
�
Organizations, Institutions,Policies, Procedures,
Regulations
Goals
ConflictsHazardsData
Behaviors
Obstacles
ReactAnt
icip
ate
Accomm
odate
Cope
Adapt
ACT
SE
E
Practitioner
Resources & Constraints
Practitioners work at the of thesystem. The of the systemgenerates resources, constraints andconflicts that shape the world of technicalwork and produce latent failures.
sharp endblunt end
Monitored Process
Organizations, Institutions,Policies, Procedures,Regulations
Practitioner
Resources & Constraints
BLUNTEND
SHARPEND
Modifie
dfr
om
Woods,1991
Expertise Errors
ResultsActions
Preparation of this version made possible partly through support bythe Agency for Healthcare Research and Quality (AHRQ) and theNational Library of Medicine (NLM).
For additional materialsvisit www.ctlab.org
The Search forSources ofResilience

Readings - A Perspective for Healthcare People – 2005 Items marked with are available in PDF at the CtL website Items marked with are ‘read first’ entry points to the subjects www.ctlab.org
Copyright © 2005 by R.I.Cook for Cognitive technologies Laboratory, Revision AA (05.11.07)
HOW COMPLEX SYSTEMS FAIL, SAFETY & ERROR Cook R, Render M, Woods D (2000). Gaps in the continuity of care
and progress on patient safety. British Medical J 320:791-4. Cook R, Woods D, Miller C (1998). Tale of Two Stories: Contrasting
Views of Patient Safety. Chicago, IL: National Patient Safety Foundation. Cook R, Woods D (1994). Operating at the Sharp End: The Complexity of Human Error. In Bogner MS, ed., Human Error in Medicine. Hillsdale, NJ: L Erlbaum, pp. 255-310. [ISBN 0-8058-1385-3] Cook R, O’Connor M (2005). Thinking about Accidents and Systems. In Thompson K, Manasse H, eds. Medication Safety: A Guide to Health Care Facilities. Bethesda, MD: ASHP, pp73-87. Nemeth C, Cook R, Woods D (2004). The Messy Details: Insights From the Study of Technical Work in Healthcare. IEEE Trans Syst Man Cybern, A 34:689-91.
Perrow C (1984). Normal Accidents: Living With High-Risk Technologies. New York: Basic Books. [ISBN 0-465-05142-1]
Rasmussen J. (1990). The role of error in organizing behavior. Ergonomics, 33: 1185-1199. Reason J (1990). Human Error. New York: Cambridge University Press. [ISBN 0-521-31419-4]
Woods D (1988). Coping with Complexity: The Psychology of Human Behavior in Complex Systems. In Goodstein L, Andersen H, Olsen S, ed.s, Tasks, Errors and Mental Models. New York: Taylor and Francis; pp. 128-148. [ISBN 0-85066-401-2] Woods DD, Cook RI (2001). From Counting Failures to Anticipating Risks: Possible Futures for Patient Safety. In Zipperer L, ed. Lessons in Patient Safety: A Primer. Chicago: NPSF, pp. 89-97. Woods DD, Cook RI (2002). Nine Steps to Move Forward from Error. Cognition, Technology & Work 4:137-44. Woods DD, Cook RI (2004). Mistaking Error. In Youngberg BJ, Hatlie MJ eds, The Patient Safety Handbook. Sudbury, MA: Jones & Bartlett, pp95-108. [0-7637-3147-1]
COGNITION
Feltovich PJ, Ford KM, Hoffman RR (1997). Expertise in Context. Cambridge MA: MIT Press. [ISBN 0-262-56110-7]
Hutchins E (1995). Cognition in the Wild. Cambridge, MA: MIT Press. [ISBN 0-262-08231-4]
Klein G (1998). Sources of Power: How People Make Decisions. Cambridge, MA: MIT Press. [ISBN 0-262-11227-21]
Nemeth C (2004). The Master Schedule: How Cognitive Artifacts Affect Distributed Cognition in Acute Care. PhD dissertation AAT 3101124 available from wwwlib.umi.com and at .
Rasmussen J (1997). Merging Paradigms: Decision Making, Management, and Cognitive Control. In Flin R, Salas E, Strub ME, Marting L, eds, Decision Making Under Stress: Emerging Paradigms and Applications. Aldershot: Ashgate. [ISBN 0-291-39856-1]
Vincente K (1999). Cognitive Work Analysis: Toward Safe, Productive, and Healthy Computer-Based Work. Hillsdale, NJ: Lawrence Erlbaum. [ISBN 0-8058-2397-2] TECHNOLOGY, ITS DISCONTENTS & IMPROVEMENT
Barley S, Orr J (1997). Between Craft and Science: Technical Work in U.S. Settings. Ithaca NY: Cornell U Press. [ISBN 0-8014-8366-2] Berg M (1997). Rationalizing Medical Work. Cambridge MA: MIT Press. [ISBN 0-262-02417-9] Billings CE (1997). Aviation Automation: The Search for a Human-Centered Approach. Mahwah, NJ: Lawrence Erlbaum. [ISBN 0-805-82126-0] Cook R, Woods D (1996). Adapting to New Technology in the Operating Room. Human Factors 38:593-613.
Nemeth C (2004). Human Factors Methods for Design. NY:CRC Press. Nemeth C, Cook R, O’Connor M, Wears R, Perry S (2004). Crafting Information Technology Solutions, Not Experiments for the ED. Academic Emergency Medicine 11:1114-7. Nemeth C, Nunnally M, O’Connor M, Klock PA, Cook R (2005). Getting to the Point: Developing IT for the Sharp End of Healthcare. Journal of Biomedical Infromatics 38:18-25.
Norman D (1988). The Design of Everyday Things. New York: Basic Books. (originally, The Psychology of Everyday Things) [ISBN 0-465-06709-3] Nunnally M, et al. (2004). Lost in Menuspace:User Interactions With Complex Medical Devices. IEEE Trans Syst Man Cybern, A 34:736-42.
Patterson ES, Cook RI, Render ML (2002). Improving Patient Safety By Identifying Side Effects From Introducing Bar Code Medication Administration. J Am Med Inform Assoc 9:540-53.
ORGANIZATIONS & RISK Bosk CL (2003). Forgive and Remember: Managing Medical Failure.
2nd ed. Chicago: University of Chicago Press. [ISBN 0-226-06678-9]
Clarke L (1999). Mission Improbable : Using Fantasy Documents to Tame Disasters. Chicago: University of Chicago Press. [ISBN 0-226-10941-0]
Cook RI (2001). The End of the Beginning – Complexity and Craftsmanship and the Era of Sustained Work on Patient Safety. Jnt Com J Qual Imprvmnt 27:507-8.
Hirschhorn L (1997). Reworking authority: leading and following in the post-modern organization Cambridge, MA: MIT Press. [ISBN 0-262-08258-6]
Rasmussen J (1997). Risk Management in a Dynamic Society: A Modeling Problem. Safety Science 27:183-213.
Reason J (1997). Managing the Risks of Organizational Accidents Aldershot: Ashgate. [ISBN 1-840-14104-2]
Rochlin G, LaPorte T, Roberts K (1987, Autumn). The Self Designing High Reliability Organization: Aircraft carrier flight operations at sea. Naval War College Review. pp. 76-90.
Wreathall J, Nemeth C (2004). Assessing Risk: The Role of Probablistic Risk Assessment (PRA) in Patient Safety Improvement. Quality and Safety in Healthcare 13:206-212.
HINDSIGHT
Caplan RA, Posner KL, Cheney FW (1991). Effect of outcome on physician judgements of the appropriateness of care. JAMA 265: 1957-1960.
Fischhoff B (1982). For those condemned to study the past: Heuristics and biases in hindsight. In Kahneman D, Slovic P, Tversky A, eds, Judgment under uncertainty: Heuristics and biases. New York: Cambridge University Press; pp. 335-354. [ISBN 0-521-28414-7]
Lipshitz R (1989). "Either a medal or a corporal": The effects of success and failure on the evaluation of decision making and decision makers. Organizational Behavior and Human Decision Processes, 44: 380-395. Woods D, Cook R (1999). Perspectives on Human Error: Hindsight Biases and Local Rationality. in Durso RS et al., eds., Handbook of Applied Cognition. New York: Wiley, pp. 141-171. [ISBN 047-19776-59]
University of Chicago, [email protected]

The Combination of CVP and Echo is Superior to the PA Catheter in the ICU
Michael H. Wall, M.D. UT Southwestern Medical Center
Dallas, Texas

ECHO 9/1/2006
Title goes here 1
Combination of CVP and Echo is Superior to PA Catheter in the ICU-
Do We Need TEE in the ICU?Michael H. Wall, MD, FCCM
Associate ProfessorVice Chairman of Clinical Affairs
Director of Cardiothoracic Anesthesiology S.T. “Buddy” Harris Distinguished Chair
in Cardiothoracic Anesthesiology
Overview
• Problems with PAC’s• Echocardiography in critical care• Echo training requirements for ICU?
Problems with PACs
• Preload assessment– Pressure vs. volume
• Knowledge • Outcome studies

ECHO 9/1/2006
Title goes here 2
Preload Assessment
• Frank-Starling effect– Preload is a determinant of stroke volume
• Defined as myocardial fiber (sarcomere) length at end diastole
• Clinically represented by end-diastolic volume (area or radius)
Preload
• Pressure and volume are related according to compliance
• So, when using PAOP as a surrogate for LVEDV you would predict that there are problems
“Does the Pulmonary capillary wedge pressure predict left ventricular preload in critically ill patients?”
• Calvin CCM 9:437,1981
• Critically ill– Sepsis and heart disease– Mechanically ventilated
• PAOP (PA Cath)• LVEDV (radionuclide angiography)• No relationship between the two• “PAOP is poor predictor of LV preload…(due to)
abnormalities in LV compliance”

ECHO 9/1/2006
Title goes here 3
Other Problems
CVP~PAD~PAOP~LAP~LVEDP~LVEDV
AirwayPressurePEEP
MitralValve
LVCompliance
PVRRVPulm V
Poor Correlation of PCWP and-• LVEDP with pulm vasc disease and PEEP
• Lorzman Arch Surg 109;270,1974
• LVEDP with mitral valve stenosis• Manjuran Am Heart J 89;207,1975
• LAP following CABG• Entress JCTA 4;558, 1990
• EDV after CABG• Ellis JTVC Surg 78;605,1974
“A Multicenter Study of Physicians Knowledge of the Pulmonary Artery Catheter”
• Iberti JAMA 264;2928,1990
• 496 physicians– Mean correct score 67%
• >50% could not correctly identify the PAOP
• Two subsequent studies with similar findings– Gnaegi CCM 25; 213, 1997– Iberti CCM 22;1674, 1994

ECHO 9/1/2006
Title goes here 4
“Pulmonary Artery Occlusion Pressure Estimation: How Confident are Anesthesiologists?”
• Jacka CCM 30;1197, 2002
• 265 US and Canadian Cardiac Anesthesiologists
• 61% correctly interpreted PAOP• 28% incorrectly interpreted PAOP• 11% were uncertain
Outcome & PAC• Gore Chest 92;721, 1987
– Observ, 3623 pts with AMI– PAC-no benefit, increased mortality
• Connors JAMA 1996 276;889, 1996– Observ, 5735 critically ill– PAC-no benefit, increased mortality
• Friese Crit Care Med 34;1597, 2006– Retro, 53,000 trauma pts– PAC-benefit in: older, more severely injured, shock
Randomized Controlled Trials• Rhodes Int Care Med 28;256, 2002
– 201 critically ill– PAC-no benefit, no increased risk
• Sandham “Canadian” NEJM 348;5,2003– 1994 high risk surgery– PAC-no benefit, higher PE (8 vs. 0)
• Richard “French” JAMA 290;2713, 2003– 676, ARDS/shock– PAC-no benefit, no increased risk

ECHO 9/1/2006
Title goes here 5
Randomized Controlled Trials
• Shah (NHLBI-”Escape”) AHA Mtg 2004– 433 hospitalized class IV CHF– PAC-no benefit, no increased risk
• Harvey (UK- “PAC-Man”) Lancet 366;472, 2005– 1014 critically ill– PAC-no benefit, no increased risk
• NHLBI ARDs-Net NEJM 354;2213, 2006– 1001 with ALI PAC vs CVP– PAC did not improve survival or organ fxn
PAC?
• Clearly there are problems with PAC• But why echo?
– And why transesophageal echo (TEE)?
Echo
• Quick real time assessment of cardiac-– Structure– Function
• Hemodynamic monitoring

ECHO 9/1/2006
Title goes here 6
Why TEE vs. TTE?
• Mechanical ventilation and difficulty positioning ICU pts makes TTE difficult
• Post-op cardiac surgery pts are often very difficult to image– Due to sternotomy/chest tubes etc
Safety of TEE
• Daniel Circ 83;817, 1991– Retrospective 10419 TEE examinations– Mortality 0.0098%
• 1 death • (Bleeding from lung tumor w esoph infiltration)
– 0.18% exam stopped• Due to cardiac/pulmonary/bleeding complications
“Prognostic value of Biventricular Function in Hypotensive Patients after Cardiac Surgery…”
• Reichert JCTVA 6;429, 1992
• TEE 60 hypotensive pts• Single mid-papillary view• TEE established cause in 47 (81%)
– Tamponade- (10%)– RV, LV or RV and LV Failure- (75%)
• Severe RV or BiV failure 80-90% mortality

ECHO 9/1/2006
Title goes here 7
“Evaluation of TEE as a Diagnostic and Therapeutic Aid in a Critical Care Setting”
• Poelaert Chest 107;774, 1995
• Critically ill pts• TEE gave additional information in 74%• TEE led to change in therapy in 44%• PAC failed to diagnose hypovolemia in 44% of
pts
“Goal-directed TEE Performed by Intensivists to Assess LV Function: Comparison to PAC”
• Benjamin JCTVA 12;10,1998
• Intensivists trained by performing 48 supervised (limited) exams
• PAC different than TEE – 55% for volume status– 39% for myocardial function
• Post-TEE recommendations different from PAC recommendations in 58% of cases
“Indications and Impact of Postoperative Transesophageal Echocardiography in Cardiac Surgical
Patients”• Schmidlin CCM 29;2143, 2001
• Retro, 301 Post-op pts• Indications
– LV fxn(34%), hypotension (29%), tamponade (14%), ischemia (9%)
• 45% of cases new diagnosis established or pathology excluded
• 73% led to change in therapy

ECHO 9/1/2006
Title goes here 8
“The hemodynamically unstable patient in the intensive care unit: Hemodynamic vs. TEE monitoring”
• Costachescu CCM 30;1214, 2002
• Prospective, 20 unstable pts after heart surgery• Intensivist made hemodynamic assessment at
0,2 and 4 hours• Then informed of TEE findings-
The hemodynamically unstable patient in the intensive care unit: Hemodynamic vs. TEE monitoring-cont
• Agreement between HD and TEE– 28-48%
• TEE– “Essential” in 34%– “Valuable” in 33%
• Inter and intra-observer variability better with TEE
“TEE in Critically Ill Patients”
• Colreavy CCM 30;989, 2002
• 255 pts, TEE by intensivists• 67% of hypotensive pts TEE dx cause• TEE caused management change (and
improvement) in 32%

ECHO 9/1/2006
Title goes here 9
“Range and Prevalence of Cardiac Abnormalities in Patients…in a Medical ICU”
• Bossone Chest 122;1121, 2002
• Prospective TTE of 500 medical ICU pts• 36% abnormalities found
– 14% had >1 abnormality• Critical abnormalities in 11%• 77% of the abnormalities were “clinically unsuspected”
• Cardiac abnormalities a/w increased ICU and Hospital LOS • No difference in mortality
Training
• National Board of Echocardiography– Perioperative TEE
• Training experience in surgical pts with CV disease• Specific Training (Fellowship or Experience) in TEE
– After 7/1/04– 300 supervised TEE– 150 TEE personally performed, interpreted and reported
• MUST do fellowship after 6/30/08• www.echoboards.org
Training
• To perform focused exam– Volume– Contractility– RWMA– Severe valvular disease– Post-CT surgery tamponade
• Would probably require less training• Would require support of Echocardiographers

ECHO 9/1/2006
Title goes here 10
“Goal-directed TEE Performed by Intensivists to Assess LV Function: Comparison to PAC”
• Benjamin JCTVA 12;10,1998
• Intensivists trained by performing 48 supervised (limited) exams
• Correct interpretation – (vs. Echocardiographer)– 87% volume status– 77% global contractility
“TEE in Critically Ill Patients”
• Colreavy CCM 30;989, 2002
• 255 pts, TEE by intensivists• Training
– One did CT fellowship– 2 did 6 months of TEE
• In first 2 years 12 intensivists diagnoses were revised by cardiologist– Last 4 years of study, not reported (None?)
Suggest• PAC
– PAOP• Useful to differentiate hydrostatic vs. permeability pulmonary edema• Not that great for measuring myocardial fiber length (Volume)
– CO and SvO2• TEE
– Good for assessing empty LV– Good for assessing contractility– May find something unexpected– Can be used for hemodynamics (SV CO PAP etc)

ECHO 9/1/2006
Title goes here 11
Integrated Evaluation of the Hemodynamically Unstable Pt
• 1-TEE and CVP/PAC• 2-CVP <12 or PAOP<18 and/or LV empty
– Fluid/Blood• 3-MAP<65, >95 and/or TEE findings
– Vasoactive drugs• 4-ScVO2<70, SvO2<65?
– Transfuse, Inc CI, Sedate, Paralyze etc
– Rivers NEJM 345;13712, 2001– Pinsky CCM 33;1119, 2005
And if that doesn’t work..
• Measure the big toe temperature!
“Start with a Subjective Assessment of Skin Temperature to Identify Hypoperfusion in ICU Patients”
• Kaplan J Trauma 50;620, 2001• 264 Surgical ICU pts
– Exclude peripheral vascular disease• Patients with cool skin all had significantly
– Lower-cardiac index, pH, SvO2, HCO3– Higher-lactate
• “cool…extremities…low bicarbonate…and high lactate…aid in identifying patients who may be hyperperfused”

ECHO 9/1/2006
Title goes here 12
TEE/CVP is Better than a PAC!

Acute Lung Injury – Update on ARDS and ARDSNet
Peter Rock, M.D. University of North Carolina Chapel Hill, North Carolina
Peter Rock, M.D. has received permission by The Publishing Division of The New England Journal of Medicine to reproduce the following articles, which appeared in The New England Journal of Medicine on May 25, 2006 and June 15, 2006.

n engl j med 354;21 www.nejm.org may 25, 2006 2273
e d i t o r i a l s
T h e n e w e ng l a nd j o u r na l o f m e dic i n e
Pulmonary-Artery Catheters — Peace at Last?Deborah Shure, M.D.
The history of the use of the pulmonary-artery catheter (PAC) illustrates a great deal about phy-sicians’ often uncritical acceptance of technology in clinical applications. In 1956, Forssmann, Cour-nand, and Richards were awarded the Nobel Prize in Physiology or Medicine for the development of heart catheterization and consequent discoveries in cardiac pathophysiology. Forssmann performed the first right heart catheterization, on himself, in 1929. The catheterization work of Cournand and Richards at the Bellevue Hospital Chest Service began in the 1940s, and it initiated a new era in cardiopulmonary physiology, providing important insights into hemodynamics, gas exchange, and heart–lung interactions. Their studies provided a sound scientific basis for the development of new approaches to diagnosis and therapy. In 1970, Swan and Ganz introduced the balloon-tipped flow-directed pulmonary-artery catheter.1 This catheter made bedside measurements of sophis-ticated hemodynamic and gas-exchange variables feasible for the first time. Its popularity was in-stantaneous, but its widespread use, without clin-ical trials to establish benefit, was decried in a then controversial and now prophetic editorial by Robin.2
The modern PAC was introduced six years be-fore the enactment of the Medical Device Amend-ments (1976) to the Food, Drug, and Cosmetic Act of 1938, which led to development of the current Center for Devices and Radiological Health of the Food and Drug Administration (FDA). If the PAC had come into commercial use just a de-cade later, it would have undergone more scru-tiny than it did in 1970 and the current contro-versy about its appropriate use might not have occurred. As it is, years have been spent in de-bating the usefulness and dangers of PACs.
In 1996, a large, prospective, observational cohort study of PAC use in critical care settings indicated that PAC use might increase mortality as well as morbidity.3 The response to this study triggered a multidisciplinary workshop sponsored by the National Heart, Lung, and Blood Institute (NHLBI) of the National Institutes of Health and the FDA, to examine the use of catheters and clin-ical outcomes.4 The workshop called for the de-velopment of educational programs by profes-sional societies and for clinical trials in several areas in which PAC use was extensive. The study reported on by Wheeler and colleagues5 in this issue of the Journal is an outgrowth of the re-sponse to the workshop report by the Acute Re-spiratory Distress Syndrome (ARDS) Clinical Tri-als Network of the NHLBI. This study is part of the Fluid and Catheter Treatment Trial (FACTT), the results of which have been reported by Wie-demann et al. (available at www.nejm.org).6
The study was well designed and executed. A factorial design was used, in which patients in a defined population with ARDS were randomly as-signed to receive either a PAC or a central venous catheter (CVC) and to either a liberal or a con-servative strategy of fluid management. The pri-mary end point was mortality at 60 days. Criti-cisms of earlier studies were addressed in this one by extensive training of study personnel in the performance and interpretation of measure-ments of vascular pressure obtained by means of the PAC, the use of rigorous algorithms to guide treatment in response to the catheter-derived data, and the use of the two strategies of fluid man-agement. A total of 1000 patients were recruited, and compliance with the study protocol was ex-cellent. No difference in 60-day mortality was found between the PAC group and the CVC group.
Copyright © 2006 Massachusetts Medical Society. All rights reserved. Downloaded from www.nejm.org by PETER ROCK MD MBA on August 17, 2006 .

T h e n e w e ng l a nd j o u r na l o f m e dic i n e
n engl j med 354;21 www.nejm.org may 25, 20062274
There was an increase in the PAC group in the frequency of atrial arrhythmia and ventricular arrhythmia, occurring during the insertion of the catheter, but this increase did not affect the primary end point.
Large-scale clinical trials, particularly those involving critically ill patients, are difficult to de-sign and perform. No study is likely to be perfect or to answer all questions. Sometimes, during the course of a study, accepted practice changes, col-oring views of the study’s relevance. Such factors may lead to some criticism of the study by Wheel-er and colleagues, but it remains a well-controlled trial that answers the important question of whether use of the PAC affects outcomes. Given our current treatment methods, there is no dif-ference in outcomes between patients with ARDS who are treated by means of a CVC and those treated by means of a PAC. This study can be added to other recent, prospective, controlled tri-als of PAC use in patients with congestive heart failure7 and those undergoing high-risk surgery,8 which have found no benefit. Thus, after 20 years, Robin2 has been vindicated.
Although the conclusion now must be that the routine use of the PAC is not necessary in ARDS, congestive heart failure, and some surgi-cal settings, this does not mean that there is no role for the PAC. In the present study, patients with severe chronic obstructive pulmonary disease (COPD), clinically significant pulmonary hyper-tension, or dependence on dialysis were excluded. It is possible, even probable, that information ob-tained by means of the PAC may be useful in the care of some of these patients. Clinical practice is rarely exclusively dichotomous; a range of re-sponses based on each patient’s situation will al-ways be appropriate. In addition, right heart cath-eterization has an established role in the diagnosis of congenital heart disease and pulmonary arte-rial hypertension. The information derived from right heart catheterization has a prognostic value in idiopathic pulmonary arterial hypertension (formerly known as primary pulmonary hyper-tension) and can be used to determine and ad-just drug treatments known to influence surviv-al.9 It can also help to distinguish pulmonary arterial hypertension from pulmonary veno-occlu-sive disease — a distinction that can have thera-peutic consequences.10
The bottom line with respect to PAC use is that it should no longer be part of the routine management of a number of conditions for which
it has been widely used. It still has a role in di-agnosis and in certain types of treatment, par-ticularly the treatment of patients with suspected pulmonary arterial hypertension and right ven-tricular dysfunction. PACs may also have a role in populations of patients not included in the study by Wheeler and colleagues, such as those with severe COPD or with conditions requiring com-plex fluid management. In any setting in which the PAC is used, the catheter should be used for the shortest time practical in order to mini-mize the possible development of infectious and thrombotic complications. We also need to keep an open mind with regard to the future. The pres-ent results are based on PAC use with current treatment. Were an effective new treatment to become available that depended on information obtained by means of a PAC, this equation could change.
Generally speaking, well-controlled trials of the use of devices are essential and must temper enthusiasm for what is new and exciting. Such studies not only provide the best possible infor-mation but also, in many ways, honor the goals of Cournand and Richards — to place medicine on a firm foundation of scientific knowledge.
This article was published at www.nejm.org on May 21, 2006.
Swan HJC, Ganz W, Forrester J, Marcus H, Diamond G, Cho-nette D. Catheterization of the heart in man with use of a flow-directed balloon-tipped catheter. N Engl J Med 1970;283:447-51.
Robin ED. The cult of the Swan-Ganz catheter: overuse and abuse of pulmonary flow catheters. Ann Intern Med 1985;103:445-9.
Connors AF Jr, Speroff T, Dawson NV, et al. The effective-ness of right heart catheterization in the initial care of critically ill patients. JAMA 1996;276:889-97.
Bernard GR, Sopko G, Cerra F, et al. Pulmonary artery cath-eterization and clinical outcomes: the National Heart, Lung, and Blood Institute and Food and Drug Administration Workshop report: consensus statement. JAMA 2000;283:2568-72.
The National Heart, Lung, and Blood Institute Acute Respi-ratory Distress Syndrome (ARDS) Clinical Trials Network. Pul-monary-artery versus central venous catheter to guide treatment of acute lung injury. N Engl J Med 2006;354:2213-24.
Idem. Comparison of two fluid management strategies in acute lung injury. (Available at www.nejm.org.)
The ESCAPE Investigators and ESCAPE Study Coordinators. Evaluation study of congestive heart failure and pulmonary ar-tery catheterization effectiveness: the ESCAPE trial. JAMA 2005;294:1625-33.
Sandham JD, Hull RD, Brant RF, et al. A randomized, con-trolled trial of the use of pulmonary-artery catheters in high-risk surgical patients. N Engl J Med 2003;348:5-14.
McLaughlin VV, Presberg KW, Doyle RL, et al. Prognosis of pulmonary arterial hypertension: ACCP evidence-based clinical practice guidelines. Chest 2004;126:Suppl:78S-92S.
Mandel J, Mark EJ, Hales CA. Pulmonary veno-occlusive dis-ease. Am J Respir Crit Care Med 2000;162:1964-73.Copyright © 2006 Massachusetts Medical Society.
1.
2.
3.
4.
5.
6.
7.
8.
9.
10.
Copyright © 2006 Massachusetts Medical Society. All rights reserved. Downloaded from www.nejm.org by PETER ROCK MD MBA on August 17, 2006 .

n engl j med 354;21 www.nejm.org may 25, 2006 2213
The new england
journal of medicine
established in 1812 may 25, 2006 vol. 354 no. 21
Pulmonary-Artery versus Central Venous Catheter to Guide Treatment of Acute Lung Injury
The National Heart, Lung, and Blood Institute Acute Respiratory Distress Syndrome (ARDS) Clinical Trials Network*
A bs tr ac t
The members of the Writing Committee (Arthur P. Wheeler, M.D., and Gordon R. Bernard, M.D., Vanderbilt University, Nashville; B. Taylor Thompson, M.D., and David Schoenfeld, Ph.D., Massachusetts General Hospital, Boston; Herbert P. Wiede-mann, M.D., Cleveland Clinic, Cleveland; Ben deBoisblanc, M.D., Louisiana State University Health Sciences Center, New Orleans; Alfred F. Connors, Jr., M.D., Case Western Reserve University at Metro-Health Medical Center, Cleveland; R. Dun-can Hite, M.D., Wake Forest University Health Sciences, Winston-Salem, N.C.; and Andrea L. Harabin, Ph.D., National Institutes of Health, Heart, Lung, and Blood Institute, Bethesda, Md.) assume responsibility for the integrity of the ar-ticle. Address reprint requests to Dr. Wheeler at T-1217 MCN, Vanderbilt Med-ical Center, Nashville, TN 37232-2650, or at [email protected].
*Participants are listed in the Appendix.
This article was published at www.nejm.org on May 21, 2006.
N Engl J Med 2006;354:2213-24.Copyright © 2006 Massachusetts Medical Society.
Background
The balance between the benefits and the risks of pulmonary-artery catheters (PACs) has not been established.
Methods
We evaluated the relationship of benefits and risks of PACs in 1000 patients with established acute lung injury in a randomized trial comparing hemodynamic man-agement guided by a PAC with hemodynamic management guided by a central venous catheter (CVC) using an explicit management protocol. Mortality during the first 60 days before discharge home was the primary outcome.
Results
The groups had similar baseline characteristics. The rates of death during the first 60 days before discharge home were similar in the PAC and CVC groups (27.4 per-cent and 26.3 percent, respectively; P = 0.69; absolute difference, 1.1 percent; 95 percent confidence interval, –4.4 to 6.6 percent), as were the mean (±SE) numbers of both ventilator-free days (13.2±0.5 and 13.5±0.5; P = 0.58) and days not spent in the in-tensive care unit (12.0±0.4 and 12.5±0.5; P = 0.40) to day 28. PAC-guided therapy did not improve these measures for patients in shock at the time of enrollment. There were no significant differences between groups in lung or kidney function, rates of hypotension, ventilator settings, or use of dialysis or vasopressors. Approximately 90 percent of protocol instructions were followed in both groups, with a 1 percent rate of crossover from CVC- to PAC-guided therapy. Fluid balance was similar in the two groups, as was the proportion of instructions given for fluid and diuretics. Dobu-tamine use was uncommon. The PAC group had approximately twice as many cathe-ter-related complications (predominantly arrhythmias).
Conclusions
PAC-guided therapy did not improve survival or organ function but was associated with more complications than CVC-guided therapy. These results, when considered with those of previous studies, suggest that the PAC should not be routinely used for the management of acute lung injury. (ClinicalTrials.gov number, NCT00281268.)
Copyright © 2006 Massachusetts Medical Society. All rights reserved. Downloaded from www.nejm.org by PETER ROCK MD MBA on August 17, 2006 .

T h e n e w e ng l a nd j o u r na l o f m e dic i n e
n engl j med 354;21 www.nejm.org may 25, 20062214
The pulmonary-artery catheter (pac) provides unique hemodynamic data, in-cluding the cardiac index and pulmonary-
artery–occlusion pressure. People who advocate the use of the PAC note that the clinician’s ability to predict intravascular pressure with the use of this catheter is poor1-3; central venous pressure, as obtained by means of the PAC, correlates imper-fectly with pulmonary-artery–occlusion pres-sure4-6; and the insertion of a PAC often changes therapy.6-8 Although many critically ill patients re-ceive PACs,9 no clear clinical benefit has been as-sociated with their use.10-12
Practitioners often misinterpret the informa-tion obtained by means of a PAC or act incorrectly even when the data obtained with the use of this catheter are unambiguous, raising questions about the catheter’s value in usual practice.13-18 A num-ber of retrospective, prospective uncontrolled, and cohort studies6,19-25 have raised questions about the safety of PACs, but because of their nonran-domized design, the results were not conclusive. Fears that the PAC could be harmful prompted calls for educational initiatives and even for a moratorium on its use until randomized trials were conducted.26-29 The results of randomized studies also cast doubt on the value of the PAC,30-35 but even these were regarded as inconclusive be-cause of the studies’ small size, population selec-tion, lack of a comparison group randomly as-signed to central venous catheter (CVC)–guided therapy, or most important, lack of an explicit management protocol.36-40 To address these un-certainties, we conducted a randomized trial of the management of acute lung injury using an explicit hemodynamic protocol guided by blood pressure, urinary output, and the results of a physi-cal examination plus data obtained with either a PAC (i.e., cardiac index and pulmonary-artery–occlusion pressure) or a CVC (i.e., central venous pressure). Oxygen delivery and central or mixed venous oxygen saturation were not used in the management protocol.
Me thods
Study Design
The protocol for this multicenter factorial study, known as the Fluid and Catheter Treatment Trial (FACTT), can be found in the Supplementary Ap-pendix, available with the full text of this article at www.nejm.org. Patients who had had acute lung
injury for 48 hours or less were randomly assigned in permuted blocks of eight to receive a PAC or a CVC with the use of an automated system. Hemo-dynamic data obtained from the catheter were combined with clinical measures for use in a stan-dardized management protocol. Patients were si-multaneously randomly assigned to a strategy of either liberal or conservative use of fluids guided by an explicit protocol (described in the Supple-mentary Appendix). Randomization was strati-fied according to hospital and the type of fluid therapy.
Inclusion Criteria
Eligible patients were receiving positive-pressure ventilation by tracheal tube and had a ratio of the partial pressure of arterial oxygen (PaO
2) to the
fraction of inspired oxygen (FIO2) below 300 (ad-
justed if the altitude exceeded 1000 m) and bilat-eral infiltrates on chest radiography consistent with the presence of pulmonary edema not due to left atrial hypertension.41 If a potential partici-pant did not have a CVC, the primary physician’s intent to insert one was required.
Exclusion Criteria
All reasons for exclusion are listed in Table 1 of the Supplementary Appendix. Major exclusion cri-teria were the presence of a PAC after the onset of acute lung injury; the presence of acute lung in-jury for more than 48 hours; an inability to ob-tain consent; the presence of chronic conditions that could independently influence survival, im-pair weaning, or compromise compliance with the protocol, such as dependence on dialysis or severe lung or neuromuscular disease; and irre-versible conditions for which the estimated six-month mortality rate exceeded 50 percent, such as advanced cancer.
Study Procedures
Ventilation according to the Acute Respiratory Distress Syndrome (ARDS) Network protocol of lower tidal volumes was begun within one hour after randomization and continued until day 28 or until the patient was breathing without assis-tance.42 The assigned catheter was inserted with-in four hours after randomization. A CVC in-serted before randomization could be used to determine intravascular pressure in the CVC group. Hemodynamic management as dictated by the protocol was started within the next 2 hours and
Copyright © 2006 Massachusetts Medical Society. All rights reserved. Downloaded from www.nejm.org by PETER ROCK MD MBA on August 17, 2006 .

pulmonary-artery or centr al venous catheter ther apy for lung injury
n engl j med 354;21 www.nejm.org may 25, 2006 2215
continued for seven days or until 12 hours after the patient was able to breathe without assistance.42 The PAC could be replaced by a CVC if hemody-namic stability (defined by the absence of the need for protocol-directed interventions for more than 24 hours) was achieved after day 3. We re-corded complications from all central catheters present during the hemodynamic-management pe-riod and for three days after their removal. For the purposes of tracking complications, each in-troducer, PAC, and CVC was considered a separate catheter. We monitored compliance with proto-col instructions twice each day: once during a morning reference period and again at a randomly selected time. A 100 percent audit of all instruc-tions conducted after the first 82 patients were enrolled showed rates of protocol compliance sim-ilar to those obtained during the random checks (data not shown).
All study personnel underwent extensive train-ing in the conduct of the protocol and the mea-surement of vascular pressure. They subsequent-ly explained the study procedures to clinicians in the intensive care unit (ICU). Vascular pressures were measured in supine patients at end expira-tion; end expiration was identified with the use of an airway-pressure signal, but the vascular pres-sures used in the protocol were not adjusted for airway pressure.43 Four main protocol variables were measured at least every four hours. Blood pressure and urinary output guided management in both groups. Pulmonary-artery–occlusion pres-sure and the cardiac index were included in the protocol in the PAC group, whereas central ve-nous pressure and clinical assessment of circula-tory effectiveness (i.e., skin temperature, appear-ance of the skin, and the rate of capillary refilling) were used in the CVC group. Lactate levels, the rate of oxygen delivery, and mixed venous and su-perior vena caval oxygen saturation were not used as protocol variables. Prompt reversal of hypoten-sion, oliguria, and ineffective circulation was the overriding goal of the protocol. The treatment of patients in shock (defined by a mean systemic arte-rial pressure of less than 60 mm Hg or the need for vasopressors) was left to the judgment of the primary physician, with the exception that wean-ing from vasopressors was conducted according to the protocol after the patient’s blood pressure had stabilized. Patients who were not in shock were prescribed fluids for oliguria and for inef-fective circulation if central venous pressure or
pulmonary-artery–occlusion pressure was below the target range. Clinicians were free to select iso-tonic crystalloid, albumin, or blood products, al-though the protocol dictated the volume of each agent administered. Patients with ineffective cir-culation who were not in shock were given do-butamine with or without furosemide if their central venous pressure or pulmonary-artery–occlusion pressure exceeded the target range. Pa-tients without hypotension who had adequate cir-culation and an intravascular pressure above the target range received furosemide. Patients who had a mean arterial pressure of at least 60 mm Hg without the use of vasopressors, a urinary output of at least 0.5 ml per kilogram of body weight per hour, and in the CVC group, adequate circu-lation on the basis of a physical examination or in the PAC group, a cardiac index of at least 2.5 liters per minute per square meter of body-surface area, received furosemide or fluids to return their intravascular pressure to the target range.
The study was approved by a protocol-review committee of the National Institutes of Health, National Heart, Lung, and Blood Institute, and the institutional review board at each participating location. Written consent was obtained from par-ticipants or legally authorized surrogates. An inde-pendent data and safety monitoring board con-ducted interim analyses after 82 patients had been enrolled and after each enrollment of approxi-mately 200 patients. Sequential stopping rules for safety and efficacy used the method of O’Brien and Fleming.
Statistical Analysis
The study had a statistical power of 90 percent to detect a reduction by 10 percentage points in the primary end point, death before hospital discharge home during the first 60 days after randomiza-tion, with the planned enrollment of 1000 patients. We assumed patients who went home alive and without the use of a ventilator before day 60 were alive at 60 days. Data on patients who were re-ceiving ventilation or in a hospital were censored on the last day of follow-up. The Kaplan–Meier method was used to estimate the mean (±SE) 60-day mortality rate, at the time of the last death occurring before 60 days. Differences in mortal-ity between the groups were assessed by a z test. The primary analysis was conducted according to the intention to treat and on the basis of treatment-group assignment. Differences in continuous vari-
Copyright © 2006 Massachusetts Medical Society. All rights reserved. Downloaded from www.nejm.org by PETER ROCK MD MBA on August 17, 2006 .

T h e n e w e ng l a nd j o u r na l o f m e dic i n e
n engl j med 354;21 www.nejm.org may 25, 20062216
ables were assessed by analysis of variance. Dif-ferences in categorical variables were assessed by the Mantel–Haenszel test. Differences between con-tinuous variables over time were assessed by re-peated-measures analysis of variance. All analy-ses were stratified according to the fluid-therapy assignment. For continuous variables, means ±SE are reported. Two-sided P values of 0.05 were con-sidered to indicate statistical significance. Analy-
sis was conducted with the use of SAS software, version 8.2.
R esult s
Enrollment and Exclusions
Screening for eligible patients was conducted at 20 North American centers between June 8, 2000, and October 3, 2005. The trial was halted on July 25, 2002, for a review by the Office of Human Re-search Protection and resumed unchanged except for the introduction of a modified consent form on July 23, 2003.44-46 Figure 1 shows the most com-mon reasons for exclusion for the 10,511 patients who were screened but not enrolled and the fol-low-up for the 513 patients who were randomly assigned to PAC-guided therapy and the 488 who were assigned to CVC-guided therapy. All exclu-sions are listed in Table 1 of the Supplementary Appendix.
Baseline Characteristics
The two groups were similar with respect to de-mographic characteristics, ICU location, cause of lung injury, coexisting illnesses, and measures of the severity of illness at baseline (Table 1). Approx-imately 37 percent of patients in the PAC group and 32 percent of patients in the CVC group (P = 0.06) met the criteria for shock, with 36 percent of patients in the PAC group receiving a vasopres-sor, as compared with 30 percent of patients in the CVC group (P = 0.05) (Table 1). Tidal volume, PaO
2:FIO
2, pH, plateau pressure, oxygenation in-
dex, lung injury score, and hemoglobin levels were similar in the two groups. Similar percentages of each group were assigned to each fluid-therapy strategy (data not shown).
Main Outcomes
The rate of death during the first 60 days after randomization was similar in the PAC group and the CVC group (27.4 percent and 26.3 percent, respectively; P = 0.69; absolute difference, 1.1 per-cent; 95 percent confidence interval, –4.4 to 6.6 percent), as were the number of ventilator-free days in the first 28 days (13.2±0.5 and 13.5±0.5, respectively; P = 0.58) (Fig. 2). CVC recipients had more ICU-free days during the first week of the study (0.88 day, vs. 0.66 day in the PAC group; P = 0.02); however, these differences were small and not significant at day 28 (12.5±0.5 vs. 12.0±0.4, P = 0.40). The number of days without various
1001 Underwent randomization
11,511 Patients screened
10,511 Excluded20.8% Had PAC15.9% Had physician decline 13.8% Had chronic lung disease10.6% Had high risk of death
within 6 mo9.3% Required dialysis8.4% Exceeded time window7.5% Had chronic liver disease6.4% Had acute MI5.8% Were unable to obtain
consent4.3% Declined to give consent3.6% Were not committed
to receiving full support2.9% Had neuromuscular
disease
513 Assigned to PAC501 Received PAC12 Did not receive PAC
0 Lost to follow-up
513 Analyzed
488 Assigned to CVC480 Received CVC
7 Crossed over to PAC 1 Had unknown status
1 Lost to follow-up(withdrew consent before study
treatment was received)
487 Analyzed1 Excluded from analysis
Figure 1. Enrollment and Outcomes.
Patients may have had more than one reason for exclusion. The exclusion criteria are listed in Table 1 of the Supplementary Appendix.
Copyright © 2006 Massachusetts Medical Society. All rights reserved. Downloaded from www.nejm.org by PETER ROCK MD MBA on August 17, 2006 .
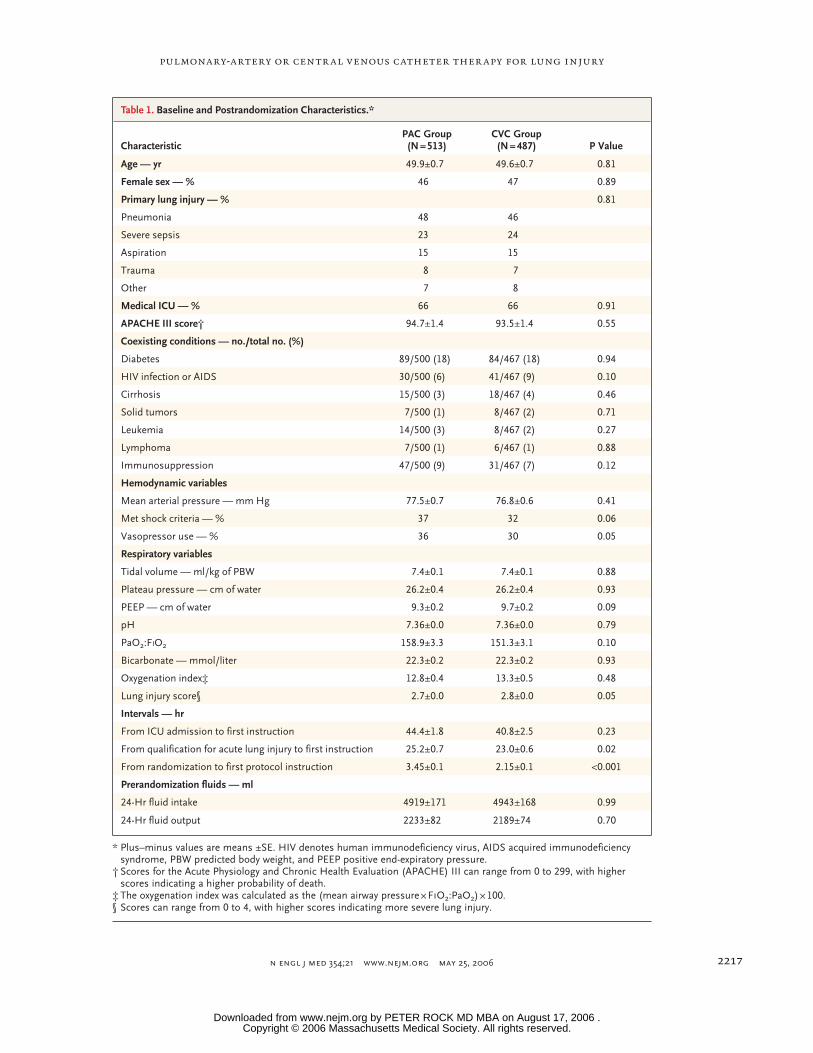
pulmonary-artery or centr al venous catheter ther apy for lung injury
n engl j med 354;21 www.nejm.org may 25, 2006 2217
Table 1. Baseline and Postrandomization Characteristics.*
CharacteristicPAC Group(N = 513)
CVC Group(N = 487) P Value
Age — yr 49.9±0.7 49.6±0.7 0.81
Female sex — % 46 47 0.89
Primary lung injury — % 0.81
Pneumonia 48 46
Severe sepsis 23 24
Aspiration 15 15
Trauma 8 7
Other 7 8
Medical ICU — % 66 66 0.91
APACHE III score† 94.7±1.4 93.5±1.4 0.55
Coexisting conditions — no./total no. (%)
Diabetes 89/500 (18) 84/467 (18) 0.94
HIV infection or AIDS 30/500 (6) 41/467 (9) 0.10
Cirrhosis 15/500 (3) 18/467 (4) 0.46
Solid tumors 7/500 (1) 8/467 (2) 0.71
Leukemia 14/500 (3) 8/467 (2) 0.27
Lymphoma 7/500 (1) 6/467 (1) 0.88
Immunosuppression 47/500 (9) 31/467 (7) 0.12
Hemodynamic variables
Mean arterial pressure — mm Hg 77.5±0.7 76.8±0.6 0.41
Met shock criteria — % 37 32 0.06
Vasopressor use — % 36 30 0.05
Respiratory variables
Tidal volume — ml/kg of PBW 7.4±0.1 7.4±0.1 0.88
Plateau pressure — cm of water 26.2±0.4 26.2±0.4 0.93
PEEP — cm of water 9.3±0.2 9.7±0.2 0.09
pH 7.36±0.0 7.36±0.0 0.79
PaO2:FIO2 158.9±3.3 151.3±3.1 0.10
Bicarbonate — mmol/liter 22.3±0.2 22.3±0.2 0.93
Oxygenation index‡ 12.8±0.4 13.3±0.5 0.48
Lung injury score§ 2.7±0.0 2.8±0.0 0.05
Intervals — hr
From ICU admission to first instruction 44.4±1.8 40.8±2.5 0.23
From qualification for acute lung injury to first instruction 25.2±0.7 23.0±0.6 0.02
From randomization to first protocol instruction 3.45±0.1 2.15±0.1 <0.001
Prerandomization fluids — ml
24-Hr fluid intake 4919±171 4943±168 0.99
24-Hr fluid output 2233±82 2189±74 0.70
* Plus–minus values are means ±SE. HIV denotes human immunodeficiency virus, AIDS acquired immunodeficiency syndrome, PBW predicted body weight, and PEEP positive end-expiratory pressure.
† Scores for the Acute Physiology and Chronic Health Evaluation (APACHE) III can range from 0 to 299, with higher scores indicating a higher probability of death.
‡ The oxygenation index was calculated as the (mean airway pressure × FIO2:PaO2) × 100.§ Scores can range from 0 to 4, with higher scores indicating more severe lung injury.
Copyright © 2006 Massachusetts Medical Society. All rights reserved. Downloaded from www.nejm.org by PETER ROCK MD MBA on August 17, 2006 .

T h e n e w e ng l a nd j o u r na l o f m e dic i n e
n engl j med 354;21 www.nejm.org may 25, 20062218
types of organ failure did not differ significantly between groups (Table 2 of the Supplementary Appendix). In the subgroup with shock at study entry, there were no significant differences be-tween groups in the mortality rate or the number of organ-failure–free days (Table 3 of the Supple-mentary Appendix). There was no interaction be-tween the type of catheter and the type of fluid therapy assigned.
Adverse Events
Complications were uncommon and were report-ed at similar rates in each group: 0.08±0.01 per catheter inserted in the PAC group and 0.06±0.01 per catheter inserted in the CVC group (P = 0.35). As compared with the CVC group, the PAC group had roughly 50 percent more catheters inserted (2.47±0.05 vs. 1.64±0.04, P<0.001) and thus had a higher total number of complications, most of which were arrhythmias (Table 2). No deaths were related to the insertion of a catheter.
Protocol Conduct and Instructions
Patients in both groups had been in the ICU for approximately two days before beginning proto-col-directed therapy (Table 1). The time from the documentation of acute lung injury to receipt of the first protocol instruction averaged about one day but was approximately two hours longer for the PAC group than the CVC group. This two-hour
difference was predominantly related to the lon-ger time needed to insert the PAC after random-ization (Table 1). Among patients assigned to re-ceive PAC-guided therapy, 12 did not receive a PAC: 5 had exclusion criteria that were discov-ered after randomization, 5 withdrew consent, 1 died before a catheter could be placed, and 1 had complete heart block during insertion. All but one patient assigned to CVC-directed therapy received a CVC, but seven also had a PAC inserted (one on day 0, two on day 1, one on day 2, two on day 3, and one on day 6).
PAC recipients received more management in-structions per day than did CVC recipients (4.8±0.1 vs. 4.4±0.2, P = 0.03). However, the PAC and CVC groups received similar proportions of protocol instructions for fluid (10±1 percent and 12±1 per-cent, respectively; P = 0.10) and diuretic adminis-tration (27±1 percent and 24±1 percent, respec-tively; P = 0.16). Dobutamine use was uncommon in both groups (7 percent in the PAC group and 2 percent in the CVC group, P<0.001). Instructions were followed at similar rates in the PAC and CVC groups (91±1 percent and 88±1 percent, re-spectively; P = 0.12).
Hemodynamics
The distribution of initial pulmonary-artery–occlu-sion pressures and central venous pressures is shown in Figure 3. Among patients in the PAC group, 29 percent had a pulmonary-artery–occlu-sion pressure of more than 18 mm Hg, 8 percent had a cardiac index below 2.5 liters per minute per square meter, and 3 percent had both values. Approximately half of all pulmonary-artery–occlu-sion pressures that exceeded 18 mm Hg were either 19 or 20 mm Hg. Figure 4 shows the mean arterial pressure, prevalence of vasopressor use, net fluid balance, mean pulmonary-artery–occlu-sion pressure, central venous pressure, heart rate, and cardiac index during the study. The propor-tion of patients in shock did not differ signifi-cantly between groups during the study. Among patients who were in shock at the time of enroll-ment, they met criteria for shock in 39 percent of reassessments in the PAC group and 40 percent of reassessments in the CVC group (P = 0.73). Those who were not in shock at enrollment met the cri-teria for shock in only 6 percent of all reassess-ments in the PAC group and 7 percent of reas-sessments in the CVC group (P = 0.42).
Prop
ortio
nof
Patie
nts
0.8
0.9
0.7
0.6
0.4
0.3
0.1
0.5
0.2
0.00 10 20 30 40 50 60
Days
Alive, CVC group
Alive, PAC group
Unassisted breathing,CVC group
Unassisted breathing,PAC group
1.0
Figure 2. Kaplan–Meier Estimates of the Probability of Survival and of Sur-vival without the Need for Assisted Ventilation during the First 60 Days after Randomization.
Copyright © 2006 Massachusetts Medical Society. All rights reserved. Downloaded from www.nejm.org by PETER ROCK MD MBA on August 17, 2006 .

pulmonary-artery or centr al venous catheter ther apy for lung injury
n engl j med 354;21 www.nejm.org may 25, 2006 2219
Lung Function
Ventilator settings and lung-function measures were similar in the two groups over time, with no significant differences in the respiratory rate, tidal volume, positive end-expiratory pressure, plateau pressure, PaO
2:FIO
2, pH, partial pressure
of arterial carbon dioxide, oxygenation index, or lung injury score (Table 4 of the Supplementary Appendix).
Metabolic and Renal Function
While the hemodynamic management protocol was in use, there were no significant differences between groups in electrolyte, albumin, or hemo-globin levels (data not shown), although a higher percentage of patients in the PAC group than in the CVC group received erythrocyte transfusions
Table 2. Catheter-Related Complications.
Complication PAC Group CVC Group
Sheath PAC CVC Total Sheath CVC Total
number of patients
Technical and mechanical complications
Difficult placement 1 8 1 10 0 2 2
Catheter malfunction 0 4 0 4 0 0 0
Pneumothorax 3 2 1 6 0 6 6
Air embolism 1 1 1 3 0 0 0
Arterial puncture 1 0 2 3 0 0 0
Arrhythmia
Atrial 3 15 0 18 0 0 0
Ventricular 4 15 0 19 1 5 6
Conduction defect 1 4 0 5 1 0 1
Bleeding and clotting
Hemothorax 2 1 0 3 1 0 1
Insertion-site bleeding 2 1 3 6 1 2 3
Thromboembolism 0 0 0 0 1 0 1
Local thrombosis 1 1 1 3 0 6 6
Infection
Local 3 2 7 12 1 8 9
Bloodstream* 1 3 1 5 0 3 3
Other 0 2 1 3 0 3 3
Total 23 59 18 100 6 35 41
* Positive blood cultures were believed to be related to the presence of the catheter. Overall, 19 percent of patients in the PAC group and 18 percent of patients in the CVC group had one or more positive blood cultures (P = 0.43).
(38 percent vs. 30 percent, P = 0.008). There were no significant differences between groups in the percentage of patients treated with kidney-replacement therapy (14 percent in the PAC group vs. 11 percent in the CVC group, P = 0.15).
Discussion
Because the PAC provides unique physiological information, it has been assumed that the use of this catheter would improve survival and decrease the duration of assisted ventilation and the rate of organ failure among patients with acute lung in-jury. Eroding this belief are observational and pro-spective trials indicating that such outcomes are not improved and may even be worsened by PAC use.19-25 Since the initiation of this study, random-
Copyright © 2006 Massachusetts Medical Society. All rights reserved. Downloaded from www.nejm.org by PETER ROCK MD MBA on August 17, 2006 .

T h e n e w e ng l a nd j o u r na l o f m e dic i n e
n engl j med 354;21 www.nejm.org may 25, 20062220
ized trials of patients undergoing high-risk sur-gery,31 patients with the acute respiratory distress syndrome and sepsis,32 those with congestive heart failure,34 and those with general critical illness33,35 have reported no benefit from PAC insertion. How-
ever, these studies were limited by the inclusion of relatively small numbers of patients and the lack of a strictly defined treatment protocol.
Prevention or reversal of organ failure is a common justification to insert a PAC, but we
Perc
enta
ge o
f Bas
elin
e M
easu
rem
ent
8
9
10
7
6
4
3
1
5
2
01 2 3 4 5 6 7 8 9 10 11 12 13 14 15 16 17 18 19 20 21 22 23 24 25 26 27 28 29 30 31 32
Pulmonary-Artery–Occlusion Pressure (mm Hg)
11
Perc
enta
ge o
f Bas
elin
e M
easu
rem
ent
8
9
10
7
6
4
3
1
5
2
01 2 3 4 5 6 7 8 9 10 11 12 13 14 15 16 17 18 19 20 21 22 23 24 25 26 27 28 29 30 31 32
Central Venous Pressure (mm Hg)
12
11
A
B
Figure 3. Distribution of Pulmonary-Artery–Occlusion Pressure (Panel A) and Central Venous Pressure (Panel B) before Receipt of the First Protocol-Mandated Instruction on Fluid Management.
A total of 29 percent of patients had a pulmonary-artery–occlusion pressure that exceeded the traditionally accepted threshold of 18 mm Hg, though the majority of these pressures were 19 or 20 mm Hg, and 97 percent of patients with an initial pulmonary-artery–occlusion pressure of more than 18 mm Hg had a normal or elevated cardiac index.
Copyright © 2006 Massachusetts Medical Society. All rights reserved. Downloaded from www.nejm.org by PETER ROCK MD MBA on August 17, 2006 .

pulmonary-artery or centr al venous catheter ther apy for lung injury
n engl j med 354;21 www.nejm.org may 25, 2006 2221
were unable to identify any reduction in the inci-dence or the duration of any type of organ failure or the need for support (e.g., vasopressors, assist-ed ventilation, or kidney-replacement therapy) by using a PAC even in the subgroup of patients with shock at study entry. Likewise, PAC-guided therapy did not hasten discharge from the ICU; if
anything, CVC use was associated with more ICU-free time during the first seven days. However, the small differences seen could be artifactual. For example, patients with a CVC might be able to be transferred from the ICU sooner than pa-tients with a PAC because CVCs are often al-lowed on regular medical–surgical floors.
CVCPACM
ean
Art
eria
l Pre
ssur
e (m
m H
g)
80
90
70
60
00 1 2 3 4 5 6 7
Day
PAC
CVC
100
Vas
opre
ssor
Use
(%)
30
20
10
00 1 2 3 4 5 6 7
Day
40N
et F
luid
Bal
ance
(ml)
3000
2000
1000
00 1 2 3 4 5 6 7
Day
PAC
CVC
5000
4000
Hea
rt R
ate
(bea
ts/m
in)
Car
diac
Inde
x (li
ters
/min
/m2 )
80
90
70
60
00 1 2 3 4 5 6 7
Day
Cardiac index
Heart rate,PAC
Heart rate,CVC
110
100
4.5
5.5
3.5
5.0
4.0
3.0
0
6.0
PAO
P an
d C
VP
(mm
Hg)
15
10
5
00 1 2 3 4 5 6 7
Day
20
CVP, CVC
CVP, PAC
PAOP
A
C
E
D
B
Figure 4. Mean Arterial Pressure (Panel A), Vasopressor Use (Panel B), Net Fluid Balance (Panel C), Pulmonary-Artery–Occlusion Pressure (PAOP) and Central Venous Pressure (CVP) (Panel D), and Heart Rate and Cardiac Index (Panel E) over Time.
Mean (±SE) values are shown for mean arterial pressure obtained closest to 8 a.m. on specified study days in Panel A. Panel C shows the mean (±SE) net cumulative fluid balance as the sum of each day’s fluid balance. Day 0 is the day of randomization. For each variable, there were no significant differences between groups in baseline (day 0) values or values obtained during the study.
Copyright © 2006 Massachusetts Medical Society. All rights reserved. Downloaded from www.nejm.org by PETER ROCK MD MBA on August 17, 2006 .

T h e n e w e ng l a nd j o u r na l o f m e dic i n e
n engl j med 354;21 www.nejm.org may 25, 20062222
The initial pulmonary-artery–occlusion pres-sure was greater than the traditional upper bound-ary of 18 mm Hg for acute lung injury in 29 per-cent of the patients. Since the cardiac index was normal in the vast majority of these patients (98 percent), cardiac failure is an unlikely explanation for the elevated pressure. On the basis of the re-sults of protocols with a conservative approach to fluid administration and protocols with a liberal approach to fluid administration, as explained by Wiedemann et al. (available at www.nejm.org),47 identification of an initially elevated pulmonary-artery–occlusion pressure did not translate into improved clinical outcomes, perhaps because both protocols mandated that diuretic therapy be given to lower the pulmonary-artery–occlusion pressure into a target range. Although uncommon, when the cardiac index was below 2.5 liters per minute per square meter, the protocol provided instruc-tions for the administration of dobutamine, an inotropic and afterload-reducing agent.
Even though serious catheter-related compli-cations were uncommon and there were no deaths related to insertion, more catheter-related com-plications occurred among patients given a PAC than among those given a CVC. These were pre-dominantly arrhythmias: roughly half were atri-al and half ventricular. Conduction block was also reported with the use of PACs but not CVCs. This observation is qualitatively similar to the increase in cardiac complications observed by Polanczyk et al. among patients undergoing noncardiac sur-gery.24 Analysis of catheter-related complications is complex. Each catheter inserted in the PAC group appeared to carry a risk similar to that of a catheter inserted in the CVC group; however, almost one and a half times as many catheters were inserted in patients in the PAC group, a finding partly explained by the insertion of an introducer through which the PAC is typically passed. Ascertainment bias in arrhythmia report-ing may also have occurred. Since we prohibited patients from having a PAC before entry, all PACs and many introducers were inserted under close observation during the study. In contrast, many CVCs were inserted before randomization; thus, arrhythmias occurring during insertion may not have been documented.
The strengths of this study include its size; randomized, multicenter design with concealed allocation; explicit methods; use of objective end points; and high rate of clinician compliance. Ex-
tensive pretrial training of study personnel in the conduct of the protocol and intravascular-pres-sure measurement, centralized review of pressure tracings, and use of airway-pressure signals to facilitate identification of end expiration most likely increased levels of accuracy and precision.43 The use of explicit protocols for hemodynamic and ventilator management, rather than usual care or general guidelines as in previous studies, makes it clear how patients were treated.
Our study had several weaknesses. One com-mon to all such trials is the inability to mask catheter assignment; however, the selection of objective end points including death and organ-failure–free days reduces the impact of this short-coming. The low rate of crossover to the other catheter group and the high rate of compliance with the protocol in both groups, as assessed by scheduled daily and additional random checks, suggest both that absence of blinding had little effect on the results and that clinical equipoise was maintained after randomization. Owing to the small number of patients and the lack of stratification, we were unable to exclude poten-tially beneficial effects of a PAC in subgroups of patients. Nevertheless, we saw no hint of improved outcomes in the PAC group, with the mortality rate nominally lower in the CVC group. Further-more, because the majority of patients were en-rolled in medical ICUs, the relevance of our re-sults to other types of patients is unclear. In addition, among others, we excluded patients with congestive heart failure, patients with severe ob-structive and restrictive lung disease, and those receiving dialysis, so our study does not provide information on the value of the PAC in those groups. Finally, it could be argued that despite extensive development by experts, iterative pilot testing, and high rates of compliance with the protocol, the hemodynamic-protocol rules used did not optimize the benefits of the PAC as com-pared with the CVC.
When considered with the results of previous randomized trials, our results suggest that the PAC is not useful for routine hemodynamic man-agement in patients with established acute lung injury and is associated with more complications than the CVC. Our results do not address the safety or benefits of the PAC as a diagnostic tool or in other conditions, such as early resuscitation from septic shock. Similarly, our data do not ad-dress the safety or efficacy of PACs when they are
Copyright © 2006 Massachusetts Medical Society. All rights reserved. Downloaded from www.nejm.org by PETER ROCK MD MBA on August 17, 2006 .

pulmonary-artery or centr al venous catheter ther apy for lung injury
n engl j med 354;21 www.nejm.org may 25, 2006 2223
used with other protocols, in patients who have had acute lung injury for more than 48 hours, or in those with concomitant diseases who were ex-cluded from our study.
Supported by contracts (NO1-HR-46054-64 and NO1-HR-16146-54) with the National Institutes of Health, National Heart, Lung, and Blood Institute.
No potential conflict of interest relevant to this article was reported.
References
Eisenberg PR, Jaffe AS, Schuster DP. Clinical evaluation compared to pulmo-nary artery catheterization in the hemo-dynamic assessment of critically ill pa-tients. Crit Care Med 1984;12:549-53.
Steingrub JS, Celoria G, Vickers-Lahti M, Teres D, Bria W. Therapeutic impact of pulmonary artery catheterization in a med-ical/surgical ICU. Chest 1991;99:1451-5.
Ferguson ND, Meade MO, Hallett DC, Stewart TE. High values of the pulmonary artery wedge pressure in patients with acute lung injury and acute respiratory distress syndrome. Intensive Care Med 2002;28: 1073-7.
Civetta JM, Gabel JC. Flow directed-pulmonary artery catheterization in sur-gical patients: indications and modifica-tions of technic. Ann Surg 1972;176:753-6.
Forrester JS, Diamond G, McHugh TJ, Swan HJC. Filling pressures in the right and left sides of the heart in acute myocar-dial infarction: a reappraisal of central-venous-pressure monitoring. N Engl J Med 1971;285:190-3.
Marinelli WA, Weinert CR, Gross CR, et al. Right heart catheterization in acute
1.
2.
3.
4.
5.
6.
lung injury: an observational study. Am J Respir Crit Care Med 1999;160:69-76.
Mimoz O, Rauss A, Rekik N, Brun-Buisson C, Lemaire F, Brochard L. Pulmo-nary artery catheterization in critically ill patients: a prospective analysis of outcome changes associated with catheter-prompt-ed changes in therapy. Crit Care Med 1994; 22:573-9.
Connors AF Jr, McCaffree DR, Gray BA. Evaluation of right-heart catheteriza-tion in the critically ill patient without acute myocardial infarction. N Engl J Med 1983;308:263-7.
Chalfin DB. The pulmonary artery catheter: economic aspects. New Horiz 1997;5:292-6.
Schultz RJ, Whitfield GF, LaMura JJ, Raciti A, Krishnamurthy S. The role of physiologic monitoring in patients with fractures of the hip. J Trauma 1985;25:309-16.
Shoemaker WC, Appel PL, Kram HB, Waxman K, Lee TS. Prospective trial of supranormal values of survivors as thera-peutic goals in high-risk surgical patients. Chest 1988;94:1176-86.
Shah MR, Hasselblad V, Stevenson
7.
8.
9.
10.
11.
12.
LW, et al. Impact of the pulmonary artery catheter in critically ill patients: meta-anal-ysis of randomized clinical trials. JAMA 2005;294:1664-70.
Gnaegi A, Feihl F, Perret C. Intensive care physicians’ insufficient knowledge of right-heart catheterization at the bedside: time to act? Crit Care Med 1997;25:213-20.
Iberti TJ, Fischer EP, Leibowitz AB, Panacek EA, Silverstein JH, Albertson TE. A multicenter study of physicians’ knowl-edge of the pulmonary artery catheter. JAMA 1990;264:2928-32.
Jacka MJ, Cohen MM, To T, Devitt JH, Byrick R. Pulmonary artery occlusion pres-sure estimation: how confident are anes-thesiologists? Crit Care Med 2002;30:1197-203.
Burns D, Burns D, Shively M. Critical care nurses’ knowledge of pulmonary ar-tery catheters. Am J Crit Care 1996;5:49-54.
Jain M, Canham M, Upadhyay D, Cor-bridge T. Variability in interventions with pulmonary artery catheter data. Intensive Care Med 2003;29:2059-62.
Ontario Intensive Care Study Group.
13.
14.
15.
16.
17.
18.
appendix
The following persons and institutions participated in the Fluid and Catheter Treatment trial: Writing Committee — A.P. Wheeler, H.P. Wiedemann, G.R. Bernard, B.T. Thompson, B. deBoisblanc, A.F. Connors, R.D. Hite, D.A. Schoenfeld, A.L. Harabin; Steering Com-mittee chair — G.R. Bernard; Clinical Coordinating Center — D.A. Schoenfeld, B.T. Thompson, N. Ringwood, C. Oldmixon, F. Molay, A. Korpak, R. Morse, D. Hayden, M. Ancukiewicz, A. Minihan; Protocol-Review Committee — J.G.N. Garcia, R. Balk, S. Emerson, M. Shasby, W. Sibbald; Data and Safety Monitoring Board — R. Spragg, G. Corbie-Smith, J. Kelley, K. Leeper, A.S. Slutsky, B. Turnbull, C. Vreim; National Heart, Lung, and Blood Institute — A.L. Harabin, D. Gail, P. Lew, M. Waclawiw; Clinical Centers — University of Wash-ington, Harborview — L. Hudson, K. Steinberg, M. Neff, R. Maier, K. Sims, C. Cooper, T. Berry-Bell, G. Carter, L. Andersson; University of Michigan — G.B. Toews, R.H. Bartlett, C. Watts, R. Hyzy, D. Arnoldi, R. Dechert, M. Purple; University of Maryland — H. Silverman, C. Shanholtz, A. Moore, L. Heinrich, W. Corral; Johns Hopkins University — R. Brower, D. Thompson, H. Fessler, S. Murray, A. Sculley; Cleveland Clinic Foundation — H.P. Wiedemann, A.C. Arroliga, J. Komara, T. Isabella, M. Ferrari; University Hospitals of Cleveland — J. Kern, R. Hejal, D. Haney; MetroHealth Medical Center — A.F. Connors; University of Colorado Health Sciences Center — E. Abraham, R. McIntyre, F. Piedalue; Denver Veterans Affairs Medical Center — C. Welch; Denver Health Medical Center — I. Douglas, R. Wolkin; St. Anthony Hospital — T. Bost, B. Sagel, A. Hawkes; Duke University — N. MacIntyre, J. Govert, W. Fulkerson, L. Mallatrat, L. Brown, S. Everett, E. VanDyne, N. Knudsen, M. Gentile; University of North Carolina — P. Rock, S. Carson, C. Schuler, L. Baker, V. Salo; Vanderbilt University — A.P. Wheeler, G.R. Bernard, T. Rice, B. Christman, S. Bozeman, T. Welch; University of Pennsylvania — P. Lanken, J. Christie, B. Fuchs, B Finkel, S. Kaplan, V. Gracias, C.W. Hanson, P. Reilly, M.B. Shapiro, R. Burke, E. O’Connor, D. Wolfe; Jefferson Medical College — J. Gottlieb, P. Park, D.M. Dillon, A. Girod, J. Furlong; LDS Hospital — A. Morris, C. Grissom, L. Weaver, J. Orme, T. Clemmer, R. Davis, J. Gleed, S. Pies, T. Graydon, S. Anderson, K. Bennion, P. Skinner; McKay–Dee Hospital — C. Lawton, J. d’Hulst, D. Hanselman; Utah Valley Regional Medical Center — K. Sundar, T. Hill, K. Ludwig, D. Nielson; University of California, San Francisco, San Francisco — M.A. Matthay, M. Eisner, B. Daniel, O. Garcia; San Francisco General — J. Luce, R. Kallet; University of California, San Francisco, Fresno — M. Peterson, J. Lanford; Baylor College of Medicine — K. Guntupalli, V. Bandi, C. Pope; Baystate Medical Center — J. Steingrub, M. Tidswell, L. Kozikowski; Louisiana State University — B. deBoisblanc, J. Hunt, C. Glynn, P. Lauto, G. Meyaski, C. Romaine; Louisiana State University–Earl K. Long — S. Brierre, C. LeBlanc, K. Reed; Alton–Ochsner Clinic Foundation — D. Taylor, C. Thompson; Tulane University Medical Center — F. Simeone, M. Johnston, M. Wright; University of Chicago — G. Schmidt, J. Hall, S. Hemmann, B. Gehlbach, A. Vinayak, W. Schweickert; Northwestern University — J. Dematte D’Amico, H. Donnelly; University of Texas Health Sciences Center — A. Anzueto, J. McCarthy, S. Kucera, J. Peters, T. Houlihan, R. Steward, D. Vines; University of Virginia — J. Truwit, M. Marshall, W. Matsumura, R. Brett; University of Pittsburgh — M. Donahoe, P. Linden, J. Puyana, L. Lucht, A. Verno; Wake Forest University — R.D. Hite, P. Morris, A. Howard, A. Nesser, S. Perez; Moses Cone Memorial Hospital — P. Wright, C. Carter-Cole, J. McLean; St. Paul’s Hospital–Vancouver — J. Russell, L. Lazowski, K. Foley; Vancouver General Hospital — D. Chittock, L. Grandolfo; Mayo Foundation — M. Murray.
Copyright © 2006 Massachusetts Medical Society. All rights reserved. Downloaded from www.nejm.org by PETER ROCK MD MBA on August 17, 2006 .

n engl j med 354;21 www.nejm.org may 25, 20062224
pulmonary-artery or centr al venous catheter ther apy for lung injury
Evaluation of right heart catheterization in critically ill patients. Crit Care Med 1992; 20:928-33.
Afessa B, Spencer S, Khan W, LaGatta M, Bridges L, Freire AX. Association of pulmonary artery catheter use with in-hospital mortality. Crit Care Med 2001;29: 1145-8.
Gore JM, Goldberg RJ, Spodick DH, Alpert JS, Dalen JE. A community-wide as-sessment of the use of pulmonary artery catheters in patients with acute myocar-dial infarction. Chest 1987;92:721-7.
Zion MM, Balkin J, Rosenmann D, et al. Use of pulmonary catheters in patients with acute myocardial infaction: analysis of experience in 5,841 patients in the SPRINT Registry. Chest 1990;98:1331-5.
Sakr Y, Vincent JL, Reinhart K, et al. Use of the pulmonary artery catheter is not associated with worse outcome in the ICU. Chest 2005;128:2722-31.
Cohen MG, Kelly RV, Kong DF, et al. Pulmonary artery catheterization in acute coronary syndromes: insights from the GUSTO IIb and GUSTO III trials. Am J Med 2005;118:482-8.
Polanczyk CA, Rohde LE, Goldman L, et al. Right heart catheterization and car-diac complications in patients undergo-ing noncardiac surgery: an observational study. JAMA 2001;286:309-14.
Connors AF Jr, Speroff T, Dawson NV, et al. The effectiveness of right heart cath-eterization in the initial care of critically ill patients. JAMA 1996;276:889-97.
Bernard GR, Sopko G, Cerra F, et al. Pulmonary artery catheterization and clini-cal outcomes: National Heart, Lung, and Blood Institute and Food and Drug Ad-ministration Workshop report: consensus statement. JAMA 2000;283:2568-72.
Robin ED. The cult of the Swan-Ganz catheter: overuse and abuse of pulmonary flow catheters. Ann Intern Med 1985;103: 445-9.
19.
20.
21.
22.
23.
24.
25.
26.
27.
Dalen JE, Bone RC. Is it time to pull the pulmonary artery catheter? JAMA 1996; 276:916-8.
Dalen JE. The pulmonary artery cath-eter — friend, foe, or accomplice? JAMA 2001;286:348-50.
Guyatt G. A randomized control trial of right-heart catheterization in critically ill patients. J Intensive Care Med 1991; 6:91-5.
Sandham JD, Hull RD, Brant RF, et al. A randomized, controlled trial of the use of pulmonary-artery catheters in high-risk surgical patients. N Engl J Med 2003; 348:5-14.
Richard C, Warszawski J, Anguel N, et al. Early use of the pulmonary artery cath-eter and outcomes in patients with shock and acute respiratory distress syndrome: a randomized controlled trial. JAMA 2003; 290:2713-20.
Harvey S, Harrison DA, Singer M, et al. Assessment of the clinical effectiveness of pulmonary artery catheters in manage-ment of patients in intensive care (PAC-Man): a randomised controlled trial. Lan-cet 2005;366:472-7.
Binanay C, Califf RM, Hasselblad V, et al. Evaluation study of congestive heart failure and pulmonary artery catheteriza-tion effectiveness: the ESCAPE trial. JAMA 2005;294:1625-33.
Rhodes A, Cusack RJ, Newman PJ, Grounds RM, Bennett ED. A randomized, controlled trial of the pulmonary artery catheter in critically ill patients. Intensive Care Med 2002;28:256-64.
Morris AH. Developing and imple-menting computerized protocols for stan-dardization of clinical decisions. Ann In-tern Med 2000;132:373-83.
Idem. Treatment algorithms and pro-tocolized care. Curr Opin Crit Care 2003; 9:236-40.
Ivanov RI, Allen J, Sandham JD, Cal-vin JE. Pulmonary artery catheterization:
28.
29.
30.
31.
32.
33.
34.
35.
36.
37.
38.
a narrative and systematic critique of ran-domized controlled trials and recommen-dations for the future. New Horiz 1997; 5:268-76.
Walker MB, Waldmann CS. The use of pulmonary artery catheters in intensive care: time for reappraisal? Clin Intensive Care 1994;5:15-9.
Angus D, Black N. Wider lessons of the pulmonary artery catheter trial. BMJ 2001;322:446.
Bernard GR, Artigas A, Brigham KL, et al. The American-European Consensus Conference on ARDS: definitions, mecha-nisms, relevant outcomes, and clinical trial coordination. Am J Respir Crit Care Med 1994;149:818-24.
The Acute Respiratory Distress Syn-drome Network. Ventilation with lower tidal volumes as compared with tradition-al tidal volumes for acute lung injury and the acute respiratory distress syndrome. N Engl J Med 2000;342:1301-8.
Rizvi K, Deboisblanc BP, Truwit JD, et al. Effect of airway pressure display on interobserver agreement in the assessment of vascular pressures in patients with acute lung injury and acute respiratory dis-tress syndrome. Crit Care Med 2005;33:98-103.
Drazen JM. Controlling research tri-als. N Engl J Med 2003;348:1377-80.
Steinbrook R. How best to ventilate? Trial design and patient safety in studies of the acute respiratory distress syndrome. N Engl J Med 2003;348:1393-401.
Steinbrook R. Trial design and patient safety — the debate continues. N Engl J Med 2003;349:629-30.
National Heart, Lung, and Blood In-stitute ARDS Clinical Trials Network. Com-parison of two fluid management strate-gies in acute lung injury. (Available at www.nejm.org.)Copyright © 2006 Massachusetts Medical Society.
39.
40.
41.
42.
43.
44.
45.
46.
47.
CLINICAL TRIAL REGISTRATION
The Journal encourages investigators to register their clinical trials in a public trials registry. The members of the International Committee of Medical Journal Editors plan to consider clinical trials for publication only if they have been registered (see N Engl J Med 2004;351:1250-1).
The National Library of Medicine’s www.clinicaltrials.gov is a free registry, open to all investigators, that meets the committee’s requirements.
Copyright © 2006 Massachusetts Medical Society. All rights reserved. Downloaded from www.nejm.org by PETER ROCK MD MBA on August 17, 2006 .

T h e n e w e ng l a nd j o u r na l o f m e dic i n e
n engl j med 354;24 www.nejm.org june 15, 20062598
sulin resistance. What are the signaling path-ways activated or inhibited by RBP4 that could affect insulin action? Do increased RBP4 levels cause or result from reductions in GLUT4 levels? Is genetic variation in the RBP4 gene associated with variation in the risk of insulin resistance or type 2 diabetes? Does the administration of a synthetic retinoid such as fenretinide, an agent that reduces the serum RBP4 level and total-body retinol levels, improve insulin sensitivity in humans?
The study by Graham et al. should prompt investigations to address these and other ques-tions to define the biologic action of RBP4 in relation to insulin resistance and diabetes. What-ever the outcome of these investigations, it will take new approaches such as those used by Gra-
ham et al. to identify unanticipated mechanisms underlying type 2 diabetes and to identify better treatments for this disease.
Dr. Polonsky reports serving as a member of the scientific advisory board and holding equity in Amylin Pharmaceuticals. No other potential conflict of interest relevant to this article was reported.
From the Department of Medicine, Washington University School of Medicine, St. Louis.
Grant SFA, Thorleifsson G, Reynidottir I, et al. Variant of transcription factor 7-like 2 (TCFL2) gene confers risk of type 2 diabetes. Nat Genet 2006;38:320-3.
Graham TE, Yang Q, Bluher M, et al. Retinol-binding pro-tein 4 and insulin resistance in lean and obese subjects and subjects with type 2 diabetes. N Engl J Med 2006;354:2552-63.
Yang Q, Graham TE, Mody N, et al. Serum retinol binding protein contributes to insulin resistance in obesity and type 2 diabetes. Nature 2005;436:356-62.Copyright © 2006 Massachusetts Medical Society.
1.
2.
3.
Fluid-Management Strategies in Acute Lung Injury — Liberal, Conservative, or Both?
Emanuel P. Rivers, M.D., M.P.H.
One of the factorial assessments carried out in the Fluids and Catheters Treatment Trial (FACTT) conducted by the National Heart, Lung, and Blood Institute Acute Respiratory Distress Syndrome (ARDS) Clinical Trials Network, the results of which are reported by Wiedemann et al. in this issue of the Journal,1 was to determine whether a conservative or a liberal strategy of fluid manage-ment was more effective in patients with estab-lished acute lung injury. Although there was no difference in mortality at 60 days between the two treatment groups, patients in the group treat-ed according to a conservative strategy of fluid management had significantly improved lung function and central nervous system function and a decreased need for sedation, mechanical venti-lation, and intensive care. These salutary effects were achieved without an increase in the frequen-cy of nonpulmonary organ failure or shock. This trial provides guidance on fluid management in critically ill patients.
The lungs provide a unique clinical window on the evolution of critical illness. Acute lung injury results from a direct or indirect inflammatory in-sult that has characteristic radiographic features and functional changes. The lungs, and their function, reflect the dynamic balance between the
primary insult and pathogenic mechanisms re-sponsible for the outcome of organ dysfunction, death, or recovery (Fig. 1). In 1942, Cuthbertson described this metabolic response as the “ebb and flow” of shock2: “During the ebb-phase or pre-resuscitation phase, there is low cardiac out-put, poor tissue perfusion, and a cold and clammy patient.” In this phase, there is an intense avid-ity for sodium and water that is a response to a decrease in intravascular volume. Vasoregulatory and myocardial dysfunction, increased metabolic demands, and impaired systemic oxygen use may also be present. These hemodynamic perturba-tions create global tissue hypoxia, which contrib-utes to inflammation3 and early respiratory de-compensation.4 The presence of these processes and their interactions provide the rationale for the use of strategies of comprehensive hemodynamic optimization in the intensive care unit (ICU).5,6
In another randomized, controlled clinical trial involving patients in the early phase of systemic inflammation,6 my hospital applied a strategy of comprehensive hemodynamic optimization5 on the patient’s arrival at the emergency department. This strategy was applied during the first six hours after the patient was admitted to the hospital and before admission to the ICU. Some observers have
Copyright © 2006 Massachusetts Medical Society. All rights reserved. Downloaded from www.nejm.org by PETER ROCK MD MBA on August 17, 2006 .

editorials
n engl j med 354;24 www.nejm.org june 15, 2006 2599
regarded this approach as “aggressive fluid re-suscitation.” Although significantly more fluid was given to these patients than to those in the control group during the first six hours after ar-rival at the hospital, the amount of fluid admin-istered during the first three days was essentially the same in the two groups. The use of our strat-egy was associated with a significant reduction in morbidity, mortality, interlukin-8 levels, and the need for mechanical ventilation.7 Thus, the timing of the titration of fluid administration (that is, during the ebb phase) after disease pre-sentation has important effects on the pathogen-esis of inflammation, therapy, and mortality.
Cuthbertson observed that “during the flow phase, which is a staccato affair, the patient strug-gles to break from the grip of the ebb-phase, which lasts about 3 days. Upon entering the flow-phase, the swollen patient has an increased cardiac output, normal tissue perfusion where diuresis occurs, and body weight falls steadily.” Bone et al. described this as the stage in which the balance between proinflammatory and anti-inflammatory mediators reaches homeostasis and there is no longer a need to continue aggressive hemodynamic support and fluid therapy.8 At the same point, the factors driving systemic conser-vation of water and sodium attenuate, and there is a mobilization of extravascular fluid.
Although these phases have been pathogeni-cally well described, the clinical landmark that separates the ebb phase from the flow phase is frequently indistinct and complex. In patients with acute lung injury in the established phase, an increase in lung water is due to changes in the direct permeability of the capillaries of the lung and systemic influences on water balance.9,10 If manipulation of the fluid balance is not per-formed, pulmonary edema, cardiovascular com-plications, respiratory insufficiency, and continu-ation of the need for ventilator support can result. Therefore, conservative fluid strategies, perhaps even with the use of diuretic provocation, along with appropriate caution to preserve organ per-fusion and avoid metabolic derangement, are ther-apeutically sound.
In the trial conducted by Wiedemann et al., the manipulation of fluid management was iso-lated as a controlled intervention. Because the transition from the ebb phase to the flow phase may be indistinct, the timing of the initiation of
conservative strategies of fluid management is very important. In this trial, the therapy was started on average 43 hours after admission to the ICU and 24 hours after the establishment of acute lung injury. Most of the patients in the study already had nearly optimized hemodynam-ics (i.e., volume-replete intravascular space and hyperdynamic circulation with a cardiac index ranging from 4.2 to 4.3 liters per minute per
Organ DysfunctionAcute lung injury
Acute Inflammatory InsultSepsis, pneumonia,aspiration, trauma,
transfusion, or other
Ebb PhaseSodium and water conservation;
hypovolemia; vasodilatation;myocardial suppression; increasedmetabolic demands; and impaired
tissue use of oxygen
Impaired fluid mobilizationand increased lung water
Established Acute Lung InjuryShock reversal and volume-replete intravascular space;
avidity for water and sodium;low plasma oncotic pressure;
increased lung water
Coexisting Conditions and Considerations
Unresolved shock andinflammation
Renal failureMyocardial dysfunctionEndocrinopathies, hypo-
thyroidism, adrenal dysfunction
Prolonged need for mecha-nical ventilation (increased antidiuretic hormone)
Preexisting hypertension(increased retention of sodium and water)
Flow PhaseConservation of fluids,diuresis, or both; close
monitoring of electrolytesand volume status
Fluid mobilization anddiscontinuation of
mechanical ventilation
Identification and treatmentof coexisting conditions
Figure 1. Factors Influencing Fluid Management in Acute Lung Injury.
Copyright © 2006 Massachusetts Medical Society. All rights reserved. Downloaded from www.nejm.org by PETER ROCK MD MBA on August 17, 2006 .

editorials
n engl j med 354;24 www.nejm.org june 15, 20062600
square meter at baseline) and thus were homog-enous in this respect. Because patients whose condition required dialysis and those with overt renal failure were excluded from the trial, it was possible to introduce conservative strategies of fluid management into the care of patients who were less vulnerable to the negative consequences of intravascular volume depletion and diuretic therapy.11 When the strategies of fluid manage-ment were compared according to whether the patients were or were not in shock at baseline, the benefits of a conservative strategy were less robust. The increase within 0.3 day in cardiovas-cular-failure–free days in the group treated with the liberal strategy, as compared with those treat-ed with the conservative strategy, suggests that caution should be used in applying a conservative strategy of fluid management during the resus-citation, or ebb, phase.
The protocol used in this trial is not identical with standard practice. In order to generalize these results and avoid mitigating the salutary findings, multiple variables must be considered when applying a conservative approach to fluid management.12 The exclusion of patients receiv-ing hemodialysis and those with overt renal in-sufficiency or heart failure, and the relatively young age of the patients included in the study — approximately 50 years of age — make this trial a departure from the reality that many cli-nicians face in the treatment of patients with acute lung injury. The clinician must also make an accurate clinical assessment of the flow phase while paying particular attention to the untoward complications that may occur with the institution of conservative strategies of fluid management and active diuresis.
Fluid may be a friend when appropriately ti-trated during the resuscitation, or ebb, phase of acute lung injury. However, excess fluid becomes an enemy when it is no longer physiologically needed. Conservative f luid management during the established phase of acute lung injury is just as important as titrated liberal administration during the acute phase of the inciting insult.
There are important benefits to the goal-directed administration and the removal of fluid during the appropriate phases. In contrast to what is true in politics, in fluid management of acute lung in-jury, it is OK to be both liberal and conservative.
Dr. Rivers reports having received fees for service on advisory boards or consulting fees from Biosite, Lilly, Hutchinson Technology, Chiron, and Edward Lifesciences; lecture fees from Phillips, Eisai Pharmaceuticals, and Edwards Lifesciences; and research support from Hutchinson Technology. No other poten-tial conflict of interest relevant to this article was reported.
This article was published at www.nejm.org on May 21, 2006.
From the Departments of Emergency Medicine and Surgery, Henry Ford Hospital, and the Department of Emergency Medicine and Surgery, Wayne State University School of Medicine — both in Detroit.
The National Heart, Lung, and Blood Institute Acute Respi-ratory Distress Syndrome (ARDS) Clinical Trials Network. Com-parison of two fluid-management strategies in acute lung injury. N Engl J Med 2006;354:2564-75.
Cuthbertson DP. Post-shock metabolic response. Lancet 1942;1:433-7.
Karimova A, Pinsky DJ. The endothelial response to oxygen deprivation: biology and clinical implications. Intensive Care Med 2001;27:19-31.
Estenssoro E, Gonzalez F, Laffaire E, et al. Shock on admis-sion day is the best predictor of prolonged mechanical ventila-tion in the ICU. Chest 2005;127:598-603.
Task Force of the American College of Critical Care Medi-cine, Society of Critical Care Medicine. Practice parameters for hemodynamic support of sepsis in adult patients in sepsis. Crit Care Med 1999;27:639-60.
Hollenberg SM, Ahrens TS, Annane D, et al. Practice param-eters for hemodynamic support of sepsis in adult patients: 2004 update. Crit Care Med 2004;32:1928-48.
Rivers E, Nguyen B, Havstad S, et al. Early goal-directed therapy in the treatment of severe sepsis and septic shock. N Engl J Med 2001;345:1368-77.
Bone RC. Immunologic dissonance: a continuing evolution in our understanding of the systemic inflammatory response syndrome (SIRS) and the multiple organ dysfunction syndrome (MODS). Ann Intern Med 1996;125:680-7.
Hemmer M, Viquerat CE, Suter PM, Vallotton MB. Urinary antidiuretic hormone excretion during mechanical ventilation and weaning in man. Anesthesiology 1980;52:395-400.
Arthur SK, Aryee PA, Amuasi J, Hesse IF, Affram RK. Im-pairment of renal sodium excretion in tropical residents — phe-nomenological analysis. Int J Biometeorol 1999;43:14-20.
Mehta RL, Pascual MT, Soroko S, Chertow GM. Diuretics, mortality, and nonrecovery of renal function in acute renal fail-ure. JAMA 2002;288:2547-53.
Huang DT, Angus DC. Designing clinical trials in acute lung injury/acute respiratory distress syndrome. Curr Opin Crit Care 2006;12:32-6.Copyright © 2006 Massachusetts Medical Society.
1.
2.
3.
4.
5.
6.
7.
8.
9.
10.
11.
12.
RECEIVE THE JOURNAL’S TABLE OF CONTENTS EACH WEEK BY E-MAIL
To receive the table of contents of the New England Journal of Medicine by e-mail every Wednesday evening and access our archives of research articles (>6 months old), you can sign up through our Web site at: www.nejm.org
Copyright © 2006 Massachusetts Medical Society. All rights reserved. Downloaded from www.nejm.org by PETER ROCK MD MBA on August 17, 2006 .

ASCCA/FAER Research Award
Winner: Pratik Pandharipande, M.D. Department of Anesthesiology
Vanderbilt University Medical Center Nashville, Tennessee

Double Blind Randomized Controlled Trial Comparing Sedation with Dexmedetomidine versus Lorazepam in Mechanically Ventilated Medical ICU Patients
Pratik Pandharipande MD*, Timothy Girard MD**, Mervyn Maze MB, Ch.B., FRCA, FRCP #, Jennifer Frizzell RN, BSN**, Ayumi Shintani PhD, MPH+, William Renfrew+, Rasheeda Stephens BE**, Miranda
Fraley BSN**, Brenda Truman-Pun RN, MSN, ACNP**, and E Wes Ely MD, MPH**, Departments of Anesthesiology*, Medicine/ Allergy, Pulmonary Critical Care** and Biostatistics+, Vanderbilt University
Medical Center and Department of Anaesthetics, Imperial College of London #
Background: Narcotics and benzodiazepines are extensively used in the intensive care unit (ICU), per the Society of Critical Care Medicine (SCCM) sedation guidelines, to minimize patient discomfort and to treat anxiety and pain. These agents have numerous adverse effects including the potential for prolonging ventilation and the development of delirium. Dexmedetomidine (dex) is an alpha 2 agonist that is approved for sedation in the ICU for up to 24 hours. The objective of this randomized controlled trial (RCT) was to compare the efficacy of sedation, prevalence of delirium and the safety profile in patients treated with dex vs. lorazepam. Method: After IRB approval, 26 consecutive adult medical ICU patients requiring mechanical ventilation were randomized to receive sedation with either dex + fentanyl or lorazepam + fentanyl for a maximum of 5 days. Exclusion criteria included significant neurologic disease or dementia, cirrhosis, active coronary artery disease, advanced heart block or active withdrawal of care at time of first visit. Blinded study drug, after an optional bolus, was titrated by the bedside nurse from 1 cc/hr (1 mg/hr lorazepam or 0.15 mcg/kg/hr dex) to a maximum of 10 cc/hr (10 mg/hr lorazepam or 1.5 mcg/kg/hr dex) to achieve the sedation target set by the patient's medical team using the Richmond Agitation Sedation Scale (RASS). Breakthrough analgesia was provided with intermittent doses of fentanyl using the behavioral pain scale. Patients were assessed twice daily by the study staff, blinded to group assignment and details of the patients' clinical and therapeutic course, for adequacy of sedation (RASS), delirium using the Confusion Assessment Method for the ICU (CAM-ICU), and other clinical outcomes. Results: We present pilot feasibility data that have not been analyzed by study group due to the blinded study design. Baseline demographics (Mean + SD whenever applicable) include age, 52+ 13 years; Caucasians, 77%; males, 46%; APACHE II, 27.6 + 6.2; ARDS/ sepsis, 46 %; COPD/pulmonary edema, 34%; and malignancy/ metabolic illness, 20%. For the group as a whole, outcomes data showed difference between actual and target RASS sedation level, 1.2 + 0.9; prevalence of delirium, 73%; duration of delirium, 2.9 + 2.7 days; ICU length of stay, 9.1 + 2.6 days; ventilator free days, 14.3 + 10.1 days; and hospital mortality 23%. Average duration of study drug infusion was 3.5 days. Cardiac (troponin and electrocardiogram), hepatic (bilirubin and alanine transferase) and endocrine (cortisol, adrenocorticotrophin hormone, testosterone, prolactin and leutinizing hormone) function, monitored during study infusion, did not show any significant change from baseline. There was one unplanned extubation requiring reintubation. One patient developed a supraventricular tachycardia after starting study infusion, which was considered unlikely to be study drug related by the patients’ medical team. Conclusion: It is feasible to perform a blinded randomized controlled trial of dexmedetomidine versus lorazepam for up to 5 days in severely ill medical ICU patients. On going enrollment will provide adequate power to assess efficacy of sedation, delirium rates and the safety profile.

Young Investigator Award and Presentation of Abstract
2005 Young Investigator Award Winner: Nilesh M. Mehta, M.D.
Division of Critical Care Medicine Department of Anesthesia
Children’s Hospital Boston, Massachusetts
2006 Young Investigator Award Winner: Hannah Wunsch, M.D., M.Sc. Department of Anesthesiology
Columbia University New York City, New York

Pharmacokinetic Considerations during Extracorporeal Membrane Oxygenation - Results from an Ex Vivo Simulation
Nilesh M. Mehta, David R. Halwick, Brenda L. Dodson, John E. Thompson & John H. Arnold Division of Critical Care Medicine, Department of Anesthesia, Children’s Hospital, Boston MA
BACKGROUND: Despite the widespread use of extracorporeal membrane oxygenation (ECMO), relatively little published data are available regarding the pharmacokinetic (PK) profiles of drugs routinely administered during this therapy. The extent of drug adherence to the circuit components and the oxygenator membrane influences its PK and this information may have important clinical implications. OBJECTIVE: To estimate the amount of drug lost (due to adherence to circuit components) during a 24-hour ex vivo ECMO simulation. We examined twelve drugs (routinely used during ECMO therapy), viz., sedatives (morphine, fentanyl), vasoactive drugs (epinephrine, dopamine), antimicrobials (ampicillin, vancomycin, cefazolin and voriconazole), anti-convulsants (fosphenytoin, phenobarbital), heparin and hydrocortisone. METHODS: Simulated closed-loop ECMO circuits were prepared in the laboratory according to our unit policy using custom neonatal tubing and a 1.5 m2 silicone membrane oxygenator (Medtronic Inc., MN, USA). Each circuit was first primed with carbon dioxide, evacuated and then de-bubbled. The circuits were prepared such that the patient ends of the arterial and venous cannulae were connected to a reservoir bag. This closed-loop design allowed continuous flow of the priming fluid around the circuit. For Phase I experiments (n=3), circuits were primed with a crystalloid solution. For Phase II experiments (n=2), blood-primed circuits were prepared, using banked human blood. Baseline drug concentrations were obtained (P0) after administering a one time dose into the priming solution. A simultaneous sample (P4) was set aside for 24 hours and tested for stability of drugs. The primed circuits were set to run for 24 hours. Samples of circuit fluid were obtained for measurement of drug concentrations at 30 minutes (P1), 3 hours (P2) and 24 hours (P3). RESULTS: Cumulative decreases in drug levels are shown in Tables 1 and 2.
TABLE 1
Drugs in crystalloid-
primed circuit AMPI
CILL
IN
CEFA
ZOLI
N
VANC
OMYC
IN
DOPA
MINE
EPIN
EPHR
INE
PHEN
OBAR
BITA
L
FOSP
HENY
TOIN
HYDR
OCOR
TISO
NE
HEPA
RIN
MORP
HINE
FENT
ANYL
(T0 – T1/2h) 30 min 16.6
% 20.7 % -- 10.5
% 16.7 % 2.6 % 18.2
% 20.9 % 9.6 % 0.5 % 4.2%
(T0 – T3h) 3 hrs 60.2
% 20.3 % 2.4 % 53.4
% 23.7 % 3.4 % 16.8
% 19 % 27.7 % 0.3 % 78%
(T0 – T24h) 24 hrs 71.8
% 21.6 % 3.2 % NA 96.7
% 4.1 % 17.6 %
24.2 %
39.8 %
17.5 % 87%
Degradation 24 hrs NA 21.9
% 0 NA 88.6 % 0 15.6
% 9.7 % 21.9 %
10.1 % 23%

TABLE 2
Drugs in blood-primed
circuit AMPI
CILL
IN
CEFA
ZOLI
N
VORI
CONA
ZOLE
EPIN
EPHR
INE
PHEN
OBAR
BITA
L
FOSP
HENY
TOIN
HEPA
RIN
MORP
HINE
FENT
ANYL
(T0 – T1/2h) 30 min 0 % 28% 35% 0 % 0 % 0% 0% 5.5% 0 %
(T0 – T3h) 3 hrs 0 % 24 % 60 % 7.8 % 0 % 4.6 % 0% 10.3
% 1.6%
(T0 – T24h) 24 hrs 15% 21 % 70 % 13 % 0% 31.3
% 53% na 100%
Degradation 24 hrs 40% 29 % 14.8% 0 % 7% 33% 10 % 0% 0%
At the end of 24 hours in the crystalloid-primed circuit, 71.8% of ampicillin, 96.7% of epinephrine, 17.6% of fosphenytoin, 39.8% of heparin, 17.5% of morphine and 17.5% of fentanyl was lost. At the end of 24 hours in the blood-primed extracorporeal circuit, 15% of ampicillin, 21% of cefazolin, 70% of voriconazole, 30% of fosphenytoin, 49% of heparin and 100% of fentanyl was lost. Phenobarbital and vancomycin activity remained unchanged during these experiments. The extent of drug loss seemed to directly correlate with their octanol-water partition coefficient. CONCLUSIONS: Our ex vivo study demonstrates exponential loss of several drugs commonly used during ECMO therapy, such as fentanyl, fosphenytoin, voriconazole and heparin. The extent of ex vivo loss of these drugs may have important clinical implications for patient outcomes and safety. Future clinical studies examining the disposition and levels of these drugs in patients on ECMO therapy are desirable. *The study was funded by the CHMC Anesthesia Foundation Inc.
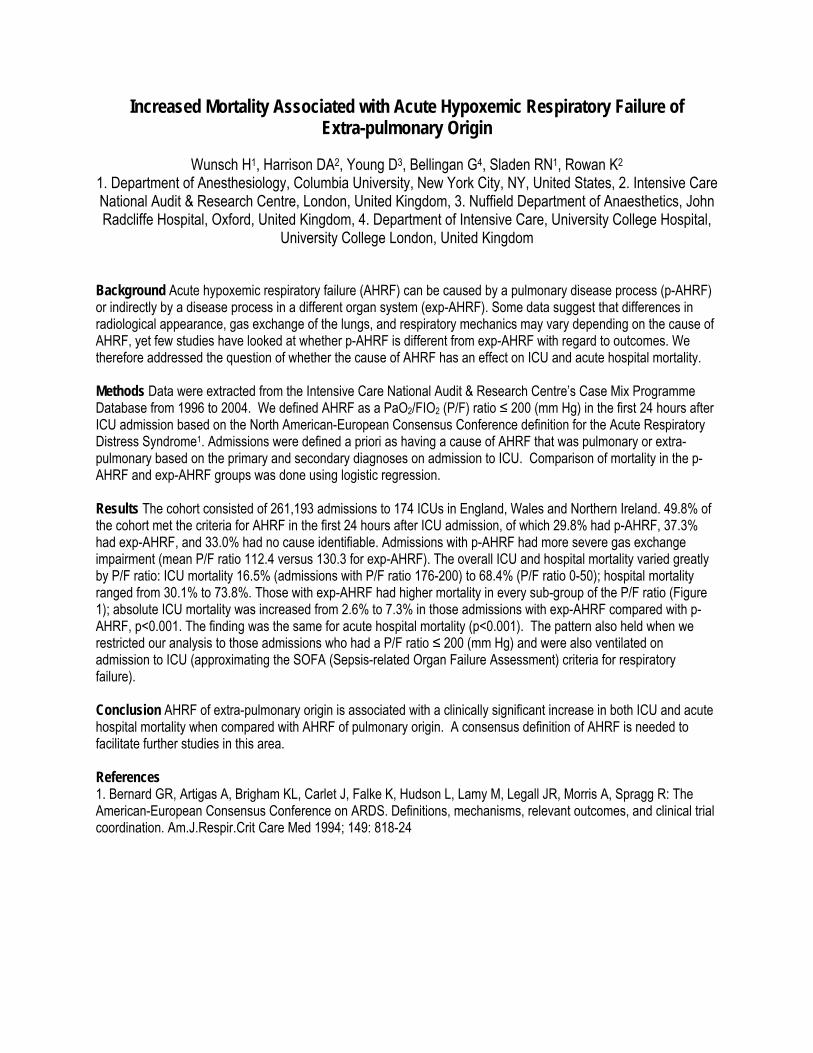
Increased Mortality Associated with Acute Hypoxemic Respiratory Failure of Extra-pulmonary Origin
Wunsch H1, Harrison DA2, Young D3, Bellingan G4, Sladen RN1, Rowan K2
1. Department of Anesthesiology, Columbia University, New York City, NY, United States, 2. Intensive Care National Audit & Research Centre, London, United Kingdom, 3. Nuffield Department of Anaesthetics, John Radcliffe Hospital, Oxford, United Kingdom, 4. Department of Intensive Care, University College Hospital,
University College London, United Kingdom
Background Acute hypoxemic respiratory failure (AHRF) can be caused by a pulmonary disease process (p-AHRF) or indirectly by a disease process in a different organ system (exp-AHRF). Some data suggest that differences in radiological appearance, gas exchange of the lungs, and respiratory mechanics may vary depending on the cause of AHRF, yet few studies have looked at whether p-AHRF is different from exp-AHRF with regard to outcomes. We therefore addressed the question of whether the cause of AHRF has an effect on ICU and acute hospital mortality. Methods Data were extracted from the Intensive Care National Audit & Research Centre’s Case Mix Programme Database from 1996 to 2004. We defined AHRF as a PaO2/FIO2 (P/F) ratio ≤ 200 (mm Hg) in the first 24 hours after ICU admission based on the North American-European Consensus Conference definition for the Acute Respiratory Distress Syndrome1. Admissions were defined a priori as having a cause of AHRF that was pulmonary or extra-pulmonary based on the primary and secondary diagnoses on admission to ICU. Comparison of mortality in the p-AHRF and exp-AHRF groups was done using logistic regression. Results The cohort consisted of 261,193 admissions to 174 ICUs in England, Wales and Northern Ireland. 49.8% of the cohort met the criteria for AHRF in the first 24 hours after ICU admission, of which 29.8% had p-AHRF, 37.3% had exp-AHRF, and 33.0% had no cause identifiable. Admissions with p-AHRF had more severe gas exchange impairment (mean P/F ratio 112.4 versus 130.3 for exp-AHRF). The overall ICU and hospital mortality varied greatly by P/F ratio: ICU mortality 16.5% (admissions with P/F ratio 176-200) to 68.4% (P/F ratio 0-50); hospital mortality ranged from 30.1% to 73.8%. Those with exp-AHRF had higher mortality in every sub-group of the P/F ratio (Figure 1); absolute ICU mortality was increased from 2.6% to 7.3% in those admissions with exp-AHRF compared with p-AHRF, p<0.001. The finding was the same for acute hospital mortality (p<0.001). The pattern also held when we restricted our analysis to those admissions who had a P/F ratio ≤ 200 (mm Hg) and were also ventilated on admission to ICU (approximating the SOFA (Sepsis-related Organ Failure Assessment) criteria for respiratory failure). Conclusion AHRF of extra-pulmonary origin is associated with a clinically significant increase in both ICU and acute hospital mortality when compared with AHRF of pulmonary origin. A consensus definition of AHRF is needed to facilitate further studies in this area. References 1. Bernard GR, Artigas A, Brigham KL, Carlet J, Falke K, Hudson L, Lamy M, Legall JR, Morris A, Spragg R: The American-European Consensus Conference on ARDS. Definitions, mechanisms, relevant outcomes, and clinical trial coordination. Am.J.Respir.Crit Care Med 1994; 149: 818-24

Figure 1. ICU and hospital mortality for pulmonary and extra-pulmonary AHRF grouped by lowest P/F ratio. ICU mortality*
10
20
30
40
50
60
70
80
0-50 51-75 76-100 101-125 126-150 151-175 176-200
P/F ratio
ICU
mor
talit
y (%
)
PulmonaryExtra-pulmonary
Acute hospital mortality*
10
20
30
40
50
60
70
80
0-50 51-75 76-100 101-125 126-150 151-175 176-200
P/F ratio
Acu
te h
ospi
tal m
orta
lity
(%)
PulmonaryExtra-pulmonary
*p-values for differences between pulmonary and extra-pulmonary mortality tested using logistic regression. p<0.001 for both ICU and acute hospital mortality.

Recombinant Factor VIIa- use in the OR and ICU
Per Thorborg, M.D., Ph.D., FCCM Oregon Health Sciences University
Portland, Oregon

1
rFVIIa - use in the OR and ICU
Per Thorborg, MD, PhD, FCCMDirector, Adult Critical Care MedicineProfessor, Dept. of Anesthesiology and Peri-Operative MedicineOregon Health & Science UniversityPortland, OR 97239
Perioperative coagulation problems:major causes
• Massive transfusion syndrome after trauma, vascular injury in major surgery
• I/R injury after delayed or insufficient fluid resuscitation in trauma
• Underlying hepatic or renal failure • Sepsis and/or DIC• Other underlying acquired coagulation defects
as anticoagulants, fibrinolytics; vit. K deficiency; CPB; head trauma; immune or pregnancy related thrombocytopenia; factor inhibitors (FVIII, FX, FV)
Massive transfusion: traditional triggers for blood products
• After 1 BV (10U PRBC), plt count and coag. factors 35% of baseline values: check PT/INR, PTT, plt and fibrinogen ( and DIC screen)
• Trigger for FFP: (A)PTT > 1.5x baseline or INR > 2.0 (4U)
• Trigger for plt: < 50K (1U/10 kg)• Trigger for cryoprecipitate: fibrinogen <
100 (10-pack for < 50, 5-pack for 50-100)source: ASA transfusion practices 1997

2
The problem with “Traditional”transfusion protocols
• The protocols we use today for perioperative blood loss were designed by hematologists [based on exchange tx equations] for use of oncologists
• Designed to correct stable coagulopathy, not massive ongoing loss, such as in perioperative bleeding or in trauma
• Most are level II data• Trauma/MT: not stable blood volume, bleeding rate not
constant (varies w/BP), replacement lags behind, initial blood replacement with (plasma free) PRBC - but actual blood loss is whole blood.
Minimizing dilutional coagulopathy in ex-sanguinating hemorrhage: a computer simulation
Hirschberg A et al J Trauma (54): 454-63
• Traditional exchange tx model not true in trauma: hypovolemia, loss/BP,…
• Ben Taub trauma registry and the Houston EMS database: 7 years >15U
• First parameter to become abnormal is PT, then Fibrinogen, last Platelets
• Suggest to give plasma earlier, 3:5 for FFP:PRBC to prevent dil. coagpathy
TF-Bearing Cell
Activated Platelet
PlateletTF
Va
VaTF VIIa Xa
X IIIIa
V Va
IIX
IIaXaVIIa
FVIIa: Mechanism of Action
Reproduced with permission from: Hoffman M, et al. Blood Coagul Fibrinolysis. 1998;9(suppl 1):S61-S65.

3
Effects of increasing the FVII dose
• Normal physiological dose is 0.2 nM/L• In FIX deficiency, 5 – 10 nM/L is required to restore
thrombin generation (in vitro)• In plt deficiency (10K) increasing the FVII dose
reduces lag time for IIa generation and plt activation (in vitro)
• A 100 mcg/kg dose gives a 50 nM/L level• Rapid thrombin generation key to building a denser
clot resistant to fibrinolysis• Supra-physiologic dose produces bypassing capacity
Conditions associated with decreased effectiveness of rFVIIa
• Particularly Acidosis (pH<7.1) and Hypothermia (< 35C) impair FVIIa/TF and FXa/FVa activity. Either (pH ↓ or t↓) present in 33% of UHC material
• Thrombin burst requires platelets, FXa, FVaand fibrinogen. Therefore reasonable to keep plt > 50K, fibrinogen > 80 and keep giving FFP if APTT > 45 (no trial support)
Effect of Acidosis on Hemostasis
A reduction in pH reduces coagulation protease activity
Meng ZH et al. J Trauma. 2003 (55): 886-91.
0
0.5
1
1.5
2
2.5
3
6.2 6.6 7 7.4 7.8 8.2 8.6 9pH
Rel
ativ
e R
ate
of II
a G
ener
atio
n

4
rFVIIa: RCT results
50, 100 mult221NoBHepatect/cirr
9040NoCMelagatran r.906YesCTF inhib rev
9016YesCFondaparin r.
9012YesCIdraparinux r.
15-9028YesCCoumad rev.
60,120 mult182NoBOLT/cirrhosis20,40,80 x 182NoBOLT/cirrhosis
8 x 100245NoBUGIB /LF20,80204NoBMajor liver res
35/70; 35/9084B; 29ST: 76-92 %BFVIIIdi /FIXdi5,20,80,16071NoCLiver bx/cirrh
Doses mcg/kg
N° ptsEffective T/PRec. gradeTrial
rFVIIa: RCT results
40,80,100100NoBHSC tx
9048NoCPelvic surgery200+100+100301Yes – 2.6UCTrauma / MT
40,80,160399Yes – T< 3hBSpont ICH
20 or 4036Yes – PCProstatectomy9020Yes - PCCardiac surg
Doses mcg/kg
N° ptsEffective T/PRec. gradeTrial
Besides the above RCTs, several other non-randomized clinical trials as well as innumerable case series, case reports
Current strength of evidence for rFVIIa usage
Grade B rec.• FVIIIdi• FIXdi
Grade B rec.• Spont. ICH
Grade C rec.• AC reversal• Prostatectomy• Cardiac surgery• Trauma (blunt)

5
Potential benefits of rFVIIa
• Rapidly Stop bleeding (in some group of pts)• Reduce transfusion of blood products• Reduce risk for volume overload• Reduce risk for MOF and ARDS (?)• Reduce ICU LOS (?)• Improved functional recovery (ICH)• Improve survival (?)• Acceptable by Jehovah Witness pts
Potential problems with rFVIIa
• Thrombogenic (?) Novo Nordisk letter of warning 11/29/05 referring to S. Mayer’s study results
• High cost [US: $1/mcg]
Cost-containment of rFVIIa / OHSU
• FDA indications: elective cases only after reimbursement allowed by insurance carrier
• Off-label indications (2002-6): CMO, Ethics committee has last word
• May 2006: Policy change removed gate keeper. Transfusion committee has now supervisory role ⇒ case review if policy dictated use is exceeded
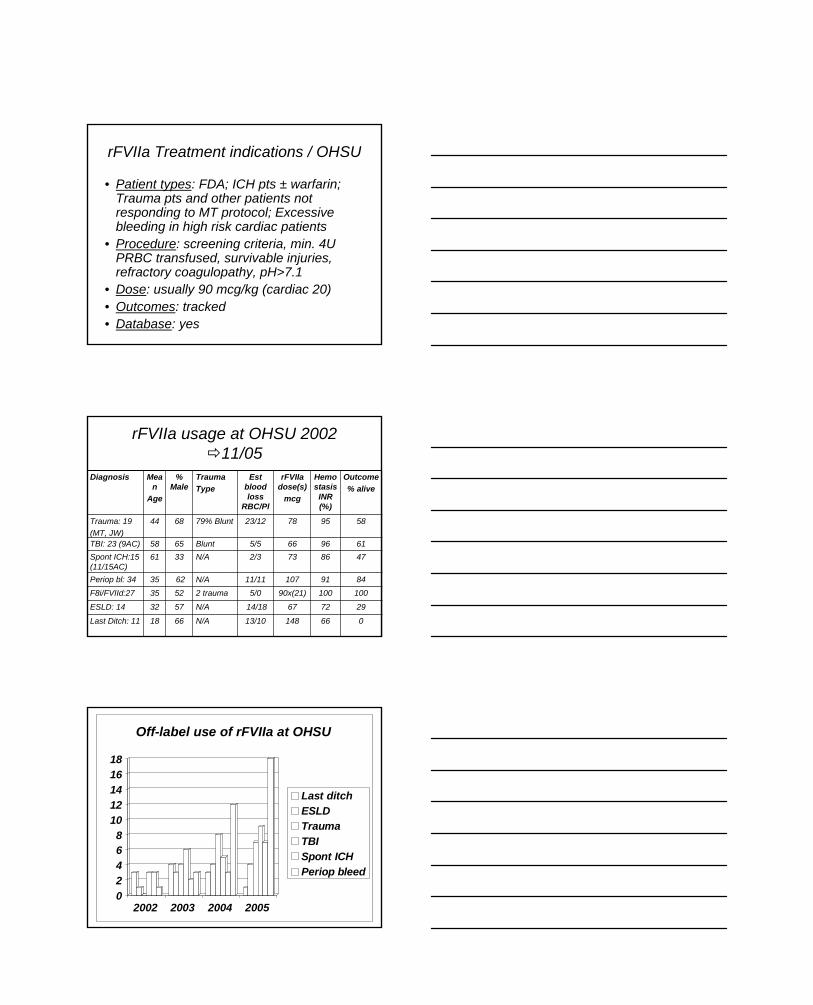
6
rFVIIa Treatment indications / OHSU
• Patient types: FDA; ICH pts ± warfarin; Trauma pts and other patients not responding to MT protocol; Excessive bleeding in high risk cardiac patients
• Procedure: screening criteria, min. 4U PRBC transfused, survivable injuries, refractory coagulopathy, pH>7.1
• Dose: usually 90 mcg/kg (cardiac 20)• Outcomes: tracked• Database: yes
rFVIIa usage at OHSU 2002 11/05
29726714/18N/A5732ESLD: 14
06614813/10N/A6618Last Ditch: 11
10010090x(21)5/02 trauma5235F8i/FVIId:27849110711/11N/A6235Periop bl: 34
4786732/3N/A3361Spont ICH:15 (11/15AC)
6196665/5Blunt6558TBI: 23 (9AC)
58957823/1279% Blunt6844Trauma: 19(MT, JW)
Outcome% alive
Hemostasis INR (%)
rFVIIa dose(s)
mcg
Est blood loss
RBC/Pl
Trauma Type
% Male
Mean
Age
Diagnosis
02468
1012141618
2002 2003 2004 2005
Off-label use of rFVIIa at OHSU
Last ditchESLDTraumaTBISpont ICHPeriop bleed

7
0%
20%
40%
60%
80%
100%
2002 2003 2004 2005
Diagnosis-associated survival after rFVIIa at OHSU
Last ditchESLDTraumaTBISpont ICHPeriop bleed
Outside of trials: monitored use
• Use in last-ditch / ESLD has decreased• Use in Trauma, TBI and Spont. ICH has
increased• Use in perioperative bleeding has
increased
rFVIIa: UHC survey 2004
• 315 pts from 21 University hospitals from 1/2002 to 5/2004 for off-label indications
• For prevention mean efficacy was 86.6% (119) while for treatment it was 52.8% (195). [Endpoint = no bleeding at 6h]
• Intracranial or surgical site bleed treatment was 65% successful while only 40-46% of GI or other bleeds were successfully treated. (Numbers not severity corrected)

8
Cost-efficacy trials for rFVIIa
• Company sponsored drug trials: Only for FDA indications (N7 vs. FEIBA)
• Ongoing study: Defining the population, outcome and cost of spont. ICH
• Cost factor a concern – when is it cost effective to use? [avoid surgery, ICU LOS, avoid costly complications, save more than X (10?) U PRBCs, avoid ARDS or MOF]
Ongoing Clinical trials - Hemophilia
USPhase IIF7 90 µg/kg once daily for 3 mosF7 270 µg/kg once daily for 3 mos
20Recombinant Factor VIIa in Secondary Bleeding Prophylaxis in Congenital HemophiliaF7HEAM-1505
USPhase IVF7 90 µg/kg q3h x 3F7 270 µg/kg single doseFEIBA 75 U/kg (open label)
24Trial of NovoSeven® in Joint BleedsHemophilia Home Treatment StudyF7HAEM-2068
Study LocationTrial PhaseDoseNTrials – Hemophilia
Ongoing Clinical Trials – off label
USPhase IIIF7a 200 µg/kg / 100 µg/kg / 100 µg/kg vs. Placebo x 3
1500rFVIIa in the Treatment of Refractory Bleeding in Severely Injured Trauma PatientsF7TRAUMA-1648
Europe, Australia, Israel, Singapore, South Africa
Phase IIIF7a 200 µg/kg / 100 µg/kg / 100 µg/kg vs. Placebo x 3
3000rFVIIa in Severely Injured Trauma Patients with Bleeding Refractory to Standard TreatmentF7TRAUMA-1711
Canada/Europe/Asia
Phase IIF7a 40 µg/kg / 80 µg/kg / 120 µg/kg 160 µg/kg / 200 µg/kg Dose Escalation vs. Placebo
96Recombinant Factor VIIa in Subjects with Brain ContusionsF7CBI-1600
JapanPhase IIF7a90Factor VIIa in Acute Intracerebral Hemorrhage
F7ICH-1602
EuropePhase IIF7a 40 µg/kg / 80 µg/kg / 160 µg/kgDose Escalation vs. Placebo
210Use of NovoSeven® in Cardiac Surgery
F7CARD-1610
EuropePhase IIF7a 200 µg/kg / 100 µg/kg x 4F7a 200 µg/kg / 100 µg/kg x1
vs. Placebo x 5
258rFVIIa in the Treatment of Active VaricealBleeding in Patients with Advanced CirrhosisF7LIVER-1533
USPhase IIF7a 30 µg/kg / 60 µg/kg / 120 µg/kgDose Escalation vs. Placebo
48Activated Recombinant Factor VII in Spinal SurgeryF7SPIN-2180
US/InternationalPhase IIIF7a 20 µg/kg / 40 µg/kg / 80 µg/kg 3 single dose arms vs. Placebo
675Recombinant Factor VIIa in Acute Intracerebral HemorrhageF7ICH-1641
Study LocationTrial PhaseDoseNTrials – Investigational Use

9
Ongoing controversies - rFVIIa
• Early vs. late treatment in massive transfusion
• Monitoring of its effect – INR does not accurately reflect the risk of bleeding, but is an indicator of drug effect. Role of TEG?
www.haemoscope.com
Thromboelastogram:Qualitative Analysis
The TEG® system documents the interaction of platelets with protein coagulation cascade from the time of placing the blood in the TEG® analyzer until initial fibrin formation, clot rate strengthening, and fibrin-platelet bonding via GPIIb/IIIa, to eventual clot lysis.
Conclusions• In addition to Trauma and ICH trial use, rFVIIa is
predominantly used in massive transfusion situations and when other therapy has failed
• Monitoring of its use has taught us not to use it in certain situations
• Monitoring of rFVIIa effect is still problematic• Risk for thrombo-embolism is very low but
probably not zero, possibly dose related?

Lifetime Achievement Award Lecture Training and Certifying the Intensivist of the Future
2006 Winner:
Douglas B. Coursin, M.D. Professor of Anesthesiology and Medicine
University of Wisconsin Madison, Wisconsin
Lecture objectives:
• Review some history of the evolution of Anesthesiology and CCM • Discuss current practice patterns and numbers • Outline several options for future training of Anesthesiologist intensivists and other intensivists
It is a pleasure and honor to present this invited lecture, thank you. Much of what I have to say will be excerpted from three sources: the recent report to Congress from the Health Resources and Service Administration (HRSA) of the Department of Health and Human Services on “The Critical Care Workforce: A Study of the Supply and Demand for Critical Care Physicians”, a letter to HRSA in response to this position paper from the leadership of the American Society of Anesthesiologists and American Board of Anesthesiology, and a recent commentary that Neal Cohen, Hannah Barrett, Julian Bion and I wrote on the Crisis in Critical Care: Training and Certifying Future Intensivists (1-3- attached as an Appendix)
Anesthesiology has a long and proud history of involvement in the development of modern Critical Care Medicine (CCM) (4). Anesthesiologists played decisive roles in the founding of CCM in the U.S. and were integral in the establishment of basic and advanced cardiac life support, respiratory therapy, and the development of mechanical ventilation, cardiovascular support devices, and a wide-ranging pharmacopoeia, including modern sedatives, analgesics, and life supporting medications (4). In 1986 the American Board of Anesthesiology became the first Member Board of the American Board of Medical Specialties to certify physicians in critical care.
The current role of anesthesiology-trained critical care physicians continues to be multimodal: clinical care, administrative and leadership as well as investigative, be it clinical, basic, or translational research (5-11). Anesthesiologists had a leading role in performing many of the recent seminal studies that have identified the beneficial role critical care physicians have in improving patient outcomes, optimizing resource utilization, identifying and providing best practices, and in developing innovative approaches to clinical critical care, including virtual critical care (12-14). The current President of the Society of Critical Care Medicine, Charles G. Durbin, MD, and the Treasurer of the American College of Chest Physicians, Jeffrey S. Vender, MD, are both board certified, practicing anesthesiologist intensivists.
However, and here is the BUT, the number of anesthesiology intensivists has plateaued or declined over the past two decades. The number of effective anesthesiologist intensivist mentors needed to attract, guide and train students, residents and fellows in CCM has also leveled off or dropped as senior leaders/role models have aged out, burned out or been called to duty in the operating room. The current number of anesthesia/CCM trainees per year in the United States hovers around 60 – 65 while surgery has about 90 – 110/year and Internal Medicine has more than 400/year; the majority of whom are in pulmonary/CCM fellowships (15). Anyone who has been a member of ASCCA for more than a year or so, or attended one of our annual meetings since the organization was founded in 1986, has heard multiple laments and discussions about the dearth of anesthesia/CCM trainees, where the future lies and how to re-energize the subspecialty (16,17). Various leaders of ASCCA and SCCM have spent considerable energies in raising the consciousness of our parent specialty, ASA, residency program directors, ABA directors, and departmental chairs about the crucial need to maintain or hopefully expand our presence in CCM (18).
So, there is recognition that there is trouble “right here in River City” when it comes to attracting, training, and retaining anesthesiologist intensivists. I have no simple answer and there may not be an Occam’s Razor to help us address this issue. I would like to spend some time, however, reviewing what we might consider doing, how likely

such approaches are to be successful, and if worth pursuing, how we might want to proceed. The shortage of intensive care physicians is more global than just our specialty; financial, logistical, and quality of life factors all play a role in challenging us to find a means to judiciously meet the needs of critically ill physicians (2,19,20). Some call for a jump up in the number of trainees, others suggest training non-physician practitioners while others call on us to re-examine more closely the use of critical care resources and the application of them before we make unnecessary leaps to increase the number and scope of critical care practitioners (2,19-24).
As an anesthesiologist, internist, and intensivist by training and certification, I am a better critical care physician because of my anesthesia training. I cannot imagine being an intensivist without it. But, that does not mean that every intensivist need be an anesthesiologist. What it does mean to me is that every intensivist needs broad based clinical training. To obtain that, we need to breakdown some of the current silo mentality that is out there between specialties and certification boards. This needs to be done at the local, regional, and national levels. It needs to start with greater integration of CCM services and elimination of artificial barriers to CCM training.
The foundation for acute care and CCM training needs to start in medical school. Students should have mandatory training in how to evaluate and initially stabilize an acutely and potentially life threateningly ill person. Timely identification and intervention has repeatedly been shown to be the most important basis of our subspecialty. Even if one cannot provide definitive care himself, recognizing the need for it and activating a system that provides it is a good place to start.
We need to reach out to other specialties and certifying organizations in CCM and CCM related specialties (surgery, medicine, neurology and pediatrics). We need to aggressively explore the means to develop integrated programs that facilitate cross-disciplinary training and patient care. The intensivist of the future may well be a pure critical care doctor, but she may also be a subspecialist or multispecialist. I find it refreshing and reinvigorating to be able to intersperse general anesthesia care along with general medicine and my intensive care practice. We need to consider pursuit of competency based training in CCM and innovative means to provide, assess and certify trainees (25). This must be developed within the duty hours and guidelines of various RRCs of the ACGME. It seems reasonable to provide fast track training for some intensivists while also providing “classical” specialty based training that then leads to CCM subspecialization for others. Strong consideration should be given to a separate, but integrated ABMS board in CCM, with meaningful support and direction from various primary specialty boards including Anesthesiology. A CCM specialty board could provide the foundation for RRC competency-based curriculum development and certification directly or through co-coordinated exam development with other specialty boards. Finally innovative training in systems and personnel management, clinical outcomes, and critical care research would go far to providing thoughtful, evidence-based intensive care. It would enhance the application and development of new knowledge, eliminate many of the barriers to meaningful multidisciplinary use of resources and facilitate presentation of single voice to speak for all intensivists.
If a group of individuals is able to promote our participation as anesthesiologist intensivists, to enhance access to superior CCM training with well-recognized certification, and finally, to ensure fair remuneration for intensive care practice, that will be a truly meaningful Lifetime Achievement.
References 1. Excerpted from a letter to Elizabeth M. Duke, PhD, Administrator, Health Resources and Services
Administration, DHSS. 2. Health Resources and Service Administration (HRSA) of DHSS report on “The Critical Care Workforce: A
Study of the Supply and Demand for Critical Care Physicians.” http://bhpr.hrsa.gov/healthworkforce/reports/criticalcare/footnotes.htm (final report)
3. Cou(r)sin DB, Barrett H, Bion JF, Cohen NH. Crisis in critical care: training and certifying future intensivists. Curr Opin Anaesthesiol 2006; 19:107-10 (see attached appendix).
4. Hanson CW 3rd, Durbin CG Jr, Maccioli GA, et al. The anesthesiologist in critical care medicine: past, present, and future. Anesthesiology 2001; 95:781-8.
5. Vender JS. Pulmonary artery catheter utilization: the use, misuse, or abuse. J Cardiothorac Vasc Anesth 2006;20:295-9.

6. Kipnis E, Sawa T, Wiener-Kronish J. Targeting mechanisms of Pseudomonas aeruginosa pathogenesis. Med Mal Infect. 2006; 36:78-91
7. Deutschman CS, et al. Sepsis-induced cholestasis, steatosis, hepatocellular injury, and impaired hepatocellular regeneration are enhanced in interleukin-6 -/- mice. Crit Care Med 2006; Aug 22; [Epub ahead of print].
8. Hotchkiss RS, et al. TAT-BH4 and TAT-Bcl-xL peptides protect against sepsis-induced lymphocyte apoptosis in vivo. J Immunol 2006; 176:5471-7.
9. Caironi P, Ichinose F, Liu R, Jones RC, Bloch KD, Zapol WM. 5-Lipoxygenase deficiency prevents respiratory failure during ventilator-induced lung injury. Am J Respir Crit Care Med. 2005; 172:334-43
10. Keegan MT, Nygren E, Afessa B, Hogan WJ, Harrison BA. Is there a role for inhaled nitric oxide as a rescue therapy in respiratory failure associated with hematologic malignancies? Am J Hematol. 2006 Jul 12; [Epub ahead of print]
11. Schwinn DA, Balser JR. Anesthesiology physician scientists in academic medicine: a wake-up call. Anesthesiology 2006; 104:170-8.
12. Pronovost PJ, Needham DM, Waters H, et al. Intensive care unit physician staffing: financial modeling of the Leapfrog standard. Crit Care Med 2004; 32:1247-53.
13. Pronovost PJ, Angus DC, Dorman T, et al. Physician staffing patterns and clinical outcomes in critically ill patients: a systematic review. JAMA 2002; 288:2151-62.
14. Breslow MJ, Rosenfeld BA, Doerfler M, et al. Effect of a multiple-site intensive care unit telemedicine program on clinical and economic outcomes: an alternative paradigm for intensivist staffing. Crit Care Med 2004; 32:31-8. Erratum in: Crit Care Med 2004; 32:1632.
1 5 . Graduate medical education. JAMA 2005; 294:1129–1143. UPDATE with JAMA 2006 1 6 . Durbin CG Jr. McLafferty CL Jr. Attitudes of anesthesiology residents toward critical care medicine
training. Anesth Analg 1993; 77:418–426. 1 7 . Longnecker DE. Navigation in uncharted waters. Is anesthesiology on course for the 21st century?
Anesthesiology 1997; 86:736–742. 18. C r i t i c a l C a r e M e d i c i n e STATEMENT OF PRINCIPLES - CRITICAL CARE PRACTICE. Approved
by the ASA House of Delegates 10/2001, under revision 8/2006 19. Angus DC, Kelley MA, Schmitz RJ, et al. Caring for the critically ill patient. Current and projected workforce
requirements for care of the critically ill and patients with pulmonary disease: can we meet the requirements of an ageing population? JAMA 2000; 284:2762–70.
20. Ewart GW, Marcus L, Gaba MM, et al. The critical care medicine crisis: a call for federal action: a white paper from the critical care professional societies. Chest 2004; 125:1518-21.
21. David Goodman Op-Ed Contributor. Too Many Doctors in the House., NY Times 7/10/2006. 22. Carr BG, Goyal M, Mark D, Gracias VH, Reilly PM, Deutschman C, Baxt WG. Multidisciplinary critical
care: right care, right now. Crit Care Med. 2006; 34:1579-80 23. Huang DT, Osborn TM, Gunnerson KJ, et al. Critical care medicine training and certification for emergency
physicians. Crit Care Med 2005; 33:2104-09. 24. Tisherman SA, Angood PB, Barie PS, Napolitano LM; for the Education Committee of the Surgery Section
of the Society of Critical Care Medicine. Structure of surgical critical care and trauma fellowships. Crit Care Med. 2006; 34:2282-86.
25. Barrett H, Bion JF. An international survey of training in adult intensive care medicine. Intensive Care Med 2005; 31:553–556.

Douglas B. Coursin, M.D., FCCM has received permission by Lippincott Williams & Wilkins to reproduce the following article: Crisis in critical care: training and certifying future intensivists. Curr Opin Anaesthesiol 2006; 19:107-10; authors: Cou(r)sin DB, Barrett H, Bion JF, Cohen NH.

EDITORIAL REVIEW
Crisis in critical care: training and certifying future intensivistsDouglas B. Coursina, Hannah Barrettb, Julian F. Bionc and Neal H. Cohend
aUniversity of Wisconsin, Madison, Wisconsin, USA, bCritical Care Medicine,University of Birmingham, Birmingham, UK, cDepartment of Anaesthesia andIntensive Care Medicine, University of Birmingham, Birmingham, UK anddUniversity of California, San Francisco, California, USA
Correspondence to Douglas B. Coursin MD, Professor of Anesthesiology andInternal Medicine, Department of Anesthesiology, B6/319 UW CSC, Madison,WI 53792–3272, USATel: +1608 263 9131 or +1608 263 8102; e-mail: [email protected]
Current Opinion in Anaesthesiology 2006, 19:107–110
# 2006 Lippincott Williams & Wilkins0952-7907
The practice of critical-care medicine (CCM) is cur-
rently exposed to significant pressures. These pressures
provide opportunities and risks, particularly for the
anesthesiologists with an interest and training in inten-
sive-care medicine. Pressures include incorporation of
advances in medical knowledge, clinical capabilities,
biotechnology, bioinformatics and therapeutic innova-
tions into clinical practice, societal and patient expecta-
tions related to availability of skilled providers, quality
of care and patient safety. High-acuity complex care has
increased the demand for critical care, which in the USA
is estimated to consume around 1% of the gross national
product [1,2]. These resources are, all too frequently,
spent at or near the end of life [3,4]. Based on evidence
of improved outcomes and resource utilization (when
dedicated intensivists provide care) governmental and
private agencies, such as the Leapfrog Group, mandate
that critical care be delivered by clinicians who are spe-
cially trained in the management of critically ill patients
[5,6•,7,8]. As a result of this mandate, hospital adminis-
trators, oversight and regulatory agencies (and in some
cases patients) increasingly call for 24/7 coverage of
intensive-care units (ICUs) by properly trained and cre-
dentialed practitioners who demonstrate continued com-
petence [9]. Neither the USA, nor most other countries,
can match this potential demand. This demand has
arisen at a time when not only are there too few inten-
sivists in training, but their hours of work are also lim-
ited by law (80 hours per week in the USA and 48 hours
per week in Europe by 2009) [10,11]. In the USA, it is
estimated that this shortage will escalate and reach
critical levels by 2007 [6•]. This shortfall will remain a
problem for at least the next several decades without a
significant change in the output of training programs, an
increased commitment to ICU care on the part of
providers and/or significant reengineering of how care
is provided [5,6•,12].
Most current predictions of need for critical-care provi-
ders are based on traditional models of ICU care. They
do not take into account a number of other issues related
to workforce needs. The current models of care vary
from one ICU to another and differ depending on the
background of the provider and the patient population.
In many ICUs, particularly those in academic and other
tertiary medical centers, a dedicated critical-care physi-
cian is physically present within the ICU for the major-
ity of each day. This physician is available to provide
ongoing monitoring, perform clinically indicated proce-
dures and direct communication and clinical manage-
ment of patients. If the ICU is ‘open’ or ‘closed’, and
if the critical-care provider has primary responsibility
for the care of all patients in the ICU, care may vary
from one hospital or ICU to another. The essential char-
acteristic of most models, however, is the unit-based
physician with special skills in the management of criti-
cally ill patients and, most notably, ‘hands-on’ delivery
of care. Despite variability in staffing patterns, the per-
sonnel needs in this model are extensive.
Several responses have been proposed to address the
real and projected shortage of critical-care-trained phy-
sicians, including increasing the number of training
placements by adding critical care to base-specialty
training programs (for example pulmonary/critical-care
fellowships). This can only provide a partial solution,
however. Alternative models of practice include teleme-
dicine and remote clinical management by specialists
supporting local clinicians [13–15]. Other provider mod-
els include expanding the role of the emergency-room
physician or hospitalist into the ICU and training acute-
care nurse practitioners as physician extenders. These
nurse-practioners would assist with some aspects of
patient care, supported by clinical protocols, to manage
certain facets of patient care more consistently and effi-
ciently [4,12,16,17].
These alternative models of care offer some creative
approaches to meeting the needs of the critically ill
patient population. The models also raise questions
about the most effective method for satisfying the
increasing demand for critical-care services. First, the
alternative models do not consistently ensure the bed-
side care by the critical-care physician – an integral com-
107

ponent of CCM [18]. Second, some of these models
mandate even more collaboration and careful transmis-
sion of information from one provider to another – with-
out losing critical pieces of data that might compromise
patient care. Finally, none of the ‘new’ models of care
has been critically evaluated, either from a clinical out-
come or cost perspective or how they might affect the
educational needs of providers. At this point, we have no
objective data to guide future training requirements,
skills, credentialing or staffing needs. The educational
needs of someone who works in a ‘virtual ICU’, and pre-
scribes care remotely, creates even greater challenges.
These new models highlight a central, but to-date
largely ignored, issue, namely the lack of uniformity of
training requirements and credentialing of critical-care
practitioners across specialties. In many countries,
CCM does not have a single departmental or specialty
base. Practitioners from anesthesia, internal medicine,
medicine subspecialties, pediatrics, surgery and surgical
subspecialties are trained using different curricula and
methods with varying periods of clinical exposure. A
recent survey of training programs in four world regions
identified 54 different training programs in 42 countries,
with a minimum mandatory training period ranging from
3 to 72 months. In 24% of countries, intensive-care med-
ical training was available solely to anesthesiologists
[19••,20]. In the USA, the American Board of Medical
Specialties currently offers certification, or special quali-
fications, for critical-care physicians in five specialties
and may well increase this number [21]. The result of
this multifaceted approach to training and credentialing
could have a number of effects. As the clinical practice
for these specialty-trained providers is often limited to
those patients with specific diagnoses, the independent
training and credentialing process can magnify the ‘silo’
mentality of practice. The current credentialing process
reinforces isolation. Despite the collaborative efforts of
organizations [such as the Society of Critical Care
Medicine (SCCM), American Society of Critical Care
Anesthesiologists (ASCCA), American College of Chest
Physicians (ACCP), American Thoracic Society (ATS)
and the primary specialty organizations] there is no
single curriculum or credentialing process. Until
recently, most residency review committees have man-
dated that critical-care physicians from that specialty
alone provide the training. This specialty-specific orien-
tation limits creativity in designing educational pro-
grams and models of care that will address the needs
of the expanding number of patients requiring critical
care.
What is the impact of these issues on the future of CCM
within anesthesiology? Historically, anesthesiologists
were the ‘founding fathers’ of intensive care; they were
integral to the development, advances and current prac-
tice of CCM [22]. Despite this important role in the
development and evolution of CCM, and in contradis-
tinction to European patterns, American anesthesiolo-
gists have increasingly turned away from the ICU as a
desirable place to work, in favor of potentially less
demanding (but more lucrative) roles in the operating
theatre or in pain management [22–25]. In several coun-
tries, however, anesthesiologists have retained a key role
in critical care and are establishing themselves as peri-
operative physicians. In the USA, the void left by
anesthesiologists in the ICU has been filled by pulmon-
ary critical-care physicians who now dominate American
intensive-care medicine [6,24]. In addition, emergency-
medicine physicians and hospitalists are increasingly
interested in making inroads into hospital-based acute
care and potentially into the critical-care arena. This
interest is despite having no national competency-
based program defining the knowledge or skills required
for this discipline [12,17].
So how should anesthesiology respond to these chal-
lenges? As hospital-based physicians, anesthesiologists
play a crucial role in the care of critically ill patients as
part of the continuum of care for the surgical patient. In
addition, from experiences in the operating room and
ICU, we are able to optimize use of limited resources,
facilitate outcome data collection and interpretation, and
integrate complex perioperative care with complemen-
tary specialists. Perhaps of equal importance, the experi-
ence and skills of anesthesiologists (and their underlying
physiology-based and pharmacology-based education)
create the foundation for developing a formal curriculum
in critical care. This curriculum may be either as part of
traditional anesthesia training or as a freestanding (mul-
tidisciplinary) training program. These special skills
include preoperative medical evaluation, particularly
for high-risk surgical patients. In addition, an under-
standing of the clinical-safety issues that arise in the
operating room, and the clinical and management stra-
tegies used to ensure a well tolerated transition from the
OR to the ICU, is necessary. Furthermore, there is a
need for the identification of patients at risk and the
provision of consultation and care for these patients to
avoid ICU admission [26]. Training must also include
epidemiology and outcomes training, management skills
and education in the ethical foundations of critical-care
practice.
To take advantage of the opportunity created by the
increasing demand for critical-care providers, however,
will require the specialty to rethink the boundaries of
practices for the specialty as a whole. Thinking should
be based on the scope of practice within anesthesiology,
to determine if the experiences and training within
108 Editorial review

every program should be the same. Several questions
arise. Should only selected programs provide the
broad-based training in perioperative care, while others
concentrate on the intraoperative care needs in a more
focused way? What would be the impact on the specialty
if training programs had different curricula and different
expectations? Is it possible for the applicants to know
enough about their practice goals to select the appropri-
ate program during the application process to fulfill their
needs? Could a trainee transfer from one program to
another to expand or limit the scope of training and sub-
sequent practice? As we confront these questions, we
must take into account the constraints of limited
resources, duty-hour directives for trainees, clinical pres-
sures for the faculty and the fiscal realities for academic
departments that attempt to support the ever-expanding
clinical demands and retain or build academic programs.
Finally, we will have to consider if the training and
expectations should be the same for those who work in
a ‘virtual ICU’ environment as the requirements for the
independent ICU physician, or the physician who works
with critical-care nurse practitioners in a ‘team model’ of
care.
An alternative approach is currently being developed by
the CoBaTrICE collaboration (competency-based
training in intensive care in Europe) [19,20]. Lead by
the European Society of Intensive Care Medicine
(ESICM), this worldwide project uses consensus tech-
niques to create an integrated training program to meet
global needs, through a competency-based core curricu-
lum linked to educational resources and assessment
guidelines. This approach permits harmonization of
outcomes, promoting free movement across national
borders. The approach can also accommodate the
many different models of training from primary speci-
alty, through multiple subspecialties, to supraspecialty
with a common curriculum combined with base-speci-
alty certification.
Critical-care medicine as a primary specialty would
allow two routes to specialist training and accreditation.
These routes would be either as a free-standing speci-
alty board (with entrance allowed via straight CCM after
graduate training) or entrance from one of the classical
primary specialties such as anesthesiology, medicine or
surgery. The competency-based approach ensures that
practitioners emerge from training with the requisite
knowledge, skills and aptitudes for well tolerated inde-
pendent practice. This approach would also, however,
require that the specialties that currently wish to ‘own’
intensive care to relinquish some autonomy and form a
multidisciplinary specialty board. This approach has
worked well in the UK and is now currently under dis-
cussion for Europe [27]. Could this be a viable alterna-
tive for the US medical community [28]?
No matter what approach is taken to address the clinical
needs of critically ill patients, CCM is, and should
remain, an integral part of the training and practice of
anesthesiologists. Anesthesiology should retain (or
regain) a leadership role in defining the contribution
that this specialty can make to critical-care practice.
The time has come for us to take on this responsibility
and opportunity in order to clarify what it means to be a
critical-care provider and how one acquires, and retains,
the skills necessary to work in the ICU environment.
AcknowledgementsDr Coursin would like to thank the following friends for their invaluableinsights and assistance: Drs David Coursin, Heidi Kummer, MichaelMurray and Richard Prielipp.
References.
Papers of particular interest, published within the annual period of review, havebeen highlighted as:• of special interest•• of outstanding interest
1 Cowan CA, Lazenby HC, Martin AB, et al. National health expenditures,1999. Health Care Financ Rev 2001; 22:77–110.
2 Halpern NA, Pastores SM, Greenstein RJ. Critical care medicine in theUnited States 1985–2000: An analysis of bed numbers, use and costs.Crit Care Med 2004; 32:1249–1259.
3 Shorr AF, Linde-Zwirble WT, Angus DC. No longer the “expensive scareunit”? Crit Care Med 2004; 32:1408–1409.
4 David Friedman MD. The view from the ICU. The alternative to doing every-thing for a dying patient. http://slate.msn.com/id/2120863/#ContinueArticle.Posted 6/14/05. [Accessed 10 October 2005].
5 Angus DC, Kelley MA, Schmitz RJ, et al. Caring for the critically ill patient.Current and projected workforce requirements for care of the critically illand patients with pulmonary disease: can we meet the requirements of anageing population? JAMA 2000; 284:2762–2770.
6�
Ewart GW, Marcus L, Gaba MM, et al. The critical care medicine crisis: acall for federal action: a white paper from the critical care professionalsocieties. Chest 2004; 125:1518–1521.
Commentary that presents an overview of the evolving shortage of physicianintensivists.
7 The Leapfrog Group. Fact Sheet: ICU staff, The Leapfrog Group for patientsafety. Available at: http://www.leapfroggroup.org/for_hospitals/leapfrog_-safety_practices/icu_physician_staffing. [Accessed 10 October 2005].
8 Pronovost PJ, Needham DM, Waters H, et al. Intensive care unit physicianstaffing: financial modeling of the Leapfrog standard. Crit Care Med 2004;32:1247–1253.
9 Blendon RJ, DesRoches CM, Brodie M, et al. Views of practicing physiciansand the public on medical errors. N Engl J Med 2002; 347:1933–1940.
10 http://www.acgme.org/acWebsite/newsRoom/newsRm_dutyHours.asp.[Accessed 10 October 2005].
11 http://www.amsa.org/hp/rwhprimer2.pdf. [Accessed 10 October 2005].
12 Huang DT, Osborn TM, Gunnerson KJ, et al. Critical care medicine trainingand certification for emergency physicians. Crit Care Med 2005; 33:2104–2109.
13 Pronovost PJ, Angus DC, Dorman T, et al. Physician staffing patterns andclinical outcomes in critically ill patients: a systematic review. JAMA 2002;288:2151–2162.
14 Rosenfeld BA, Dorman T, Breslow MJ, et al. Intensive care unit telemedicine:alternate paradigm for providing continuous intensivist care. Crit Care Med2000; 28:3925–3931.
Crisis in critical care Coursin et al. 109

15 Breslow MJ, Rosenfeld BA, Doerfler M, et al. Effect of a multiple-site inten-sive care unit telemedicine program on clinical and economic outcomes: analternative paradigm for intensivist staffing. Crit Care Med 2004; 32:31–8.Erratum in Crit Care Med 2004; 32:1632.
16 Hoffman LA, Tasota FJ, Zullo TG, et al. Outcome of care managed by anacute care nurse practitioner/attending physician team in a subacute medi-cal intensive care unit. Am J Crit Care 2005; 14:121–130.
17 Pile J. Perioperative medicine: a fundamental facet of our personality. Hospi-talist 2004; 8 (suppl.):2–3.
18 Burchardi H, Moerer O. Twenty-four hour presence of physicians in the ICU.Crit Care 2001; 5:131–137.
19��
Barrett H, Bion JF. An international survey of training in adult intensive caremedicine. Intensive Care Med 2005; 31:553–556.
This article presents the results of the first phases of the international effort bythe European Society if Intensive Care Medicine and others to establish a com-petency based training program in critical care.
20 http://www.esicm.org/PAGE_cobatrice. [Accessed 10 October 2005].
21 American Board of Medical Specialties. Annual report and reference hand-book. 2005 p. 1.
22 Hanson CW 3rd, Durbin CG Jr, Maccioli GA, et al. The anesthesiologist incritical care medicine: past, present and future. Anesthesiology 2001; 95:781–788.
23 Durbin CG Jr, McLafferty CL Jr. Attitudes of anesthesiology residents towardcritical care medicine training. Anesth Analg 1993; 77:418–426.
24 Graduate medical education. JAMA 2005; 294:1129–1143.
25 Longnecker DE. Navigation in uncharted waters. Is anesthesiology oncourse for the 21st century? Anesthesiology 1997; 86:736–742.
26 Robeznieks A. Quick assistance. Surge of popularity puts rapid-responseteams in 1,400 US hospitals. Mod Healthc 2005; 35:33.
27 http:www.IBTICM.org. [Accessed 12 October 12 2005].
28 Dorman T, Angood PB, Angus DC, et al. Guidelines for critical care medi-cine training and continuing medical education. Crit Care Med 2004; 32:263–272.
110 Editorial review

Pro-Con You Can’t Have Too Much Inflammation
Moderator: Patrick J. Neligan, M.D.
University of Pennsylvania Philadelphia, Pennsylvania
Discussants
Pro – Clifford S. Deutschman, M.D., FCCM University of Pennsylvania Health System
Philadelphia, Pennsylvania
Con – William E. Hurford, M.D., FCCM University of Cincinnati Medical Center
Cincinnati, Ohio NOTES

Poster Presentations - Numeric Basic 1 Aschkenasy, Gabriella, M.D. Adenovirus-enhanced Hsp70 Expression Protects the Lung during Acute Lung Injury by Modulating Apoptotic Cell Signaling Pathways 2 Buck, Troy, M.D. Does Enteral Nutrition with Eicosapentaenoic Acid (EPA), Gamma-linolenic Acid (GLA), and Antioxidants Impact Outcome in Patients with Acute Respiratory Distress Syndrome (ARDS)
3 Camporesi, Enrico M., M.D. Sparing of Neuronal Tissue after Ischemic Injury and a-EPO is Related to Reduced Apoptosis 4 Croley, W. Christopher, M.D. PBL/Simulation Significantly Increases Exam Scores During an M4 Critical Care Medicine Rotation 5 Frick, Christiane G., M.D. Long-term Effects of Botulinum Toxin on Neuromuscular Function 6 Gabrielli, Andrea, M.D. Load and Tolerance Strategy is Appropriate for Recommending Pressure Support Ventilation Settings: Validation Study 7 Hellman, Judith, M.D. Pulmonary Inflammatory Effects of Bacterial Lipoproteins 8 Kunz, Tina, M.D. Caspofungin Trough Concentrations in Critically Ill Surgical Patients Receiving CRRT 9 Peterson, M., B.S. Head Elevation to Reduce Ventilator Associated Pneumonia and Skin- ICU Bed Interface Pressures 10 Peterson, M., B.S. Side Turning Does Not Reliably Reduce Skin-Bed Interface Pressure 11 Sahani, Nita D., M.D. In-vivo Effects of IGF-I on Neuromuscular Transmission following Burn Injury in Mice 12 Sahani, Nita D., M.D. Skeletal Muscle Apoptosis after Immobilization: A Mechanism for Muscle Atrophy via Akt Inactivation 13 Zafirova, Zdravka, M.D. Pressure Control and Tidal Volume: What’s the Difference between a Test Lung and Human Patients? 14 Brown, Daniel R., M.D., Ph.D. Perioperative Serum Vasopressin Concentrations in Elective Thoracoabdominal Aortic Aneurysm Repair 15 Worah, Samrat H., M.D. Lidocaine But NotAmiodarone Improves Electrophysiologic Recovery of Ca 1 Pyramidal Cells From Rat Hippocampal Slices Following Hypoxia 16 Nates, Joseph L., M.D., M.B.A. Performance of the SOFA score after Modification and Automation in an Oncological Surgical ICU 17 Nates, Joseph L., M.D., M.B.A. Automating and Simplifying a Validated Severity of Illness Scoring System, the M-SOFA

35 Helming, Marc, M.D. Recovery of Critical Illness Myopathy - Effects of Immobilization and Travel Award Inflammation in Rats 36 Nishida, Takefumi, M.D. Cardiac Myocyte-Specific Endothelial Nitric Oxide Synthase (eNOS) Travel Award Overexpression Rescues Myocardial and Neuronal Function after Cardiopulmonary Resuscitation in eNOS-Deficient Mice 37 Wong, Jim, M.D. How to Make a Good Receptor Misbehave: Disrupting the ß2 Travel Award Adrenergic Receptor PDZ Binding Motif Causes the ß2 Receptor to Signal like a ß1 Receptor In Vivo 38 Mehta, Nilesh, M.D. Pharmacokinetic Considerations during Extracorporeal Membrane Young Investigator Award Oxygenation - Results from an Ex Vivo Simulation Clinical 18 Nates, Joseph L., M.D., M.B.A. Individual Clinical Productivity in an Academic Critical Care Department 19 Byhahn, Christian, M.D. Emergency Echocardiography in Pulseless Electrical Activity Victims Using Portable, Handheld Ultrasound 20 Byhahn, Christian, M.D. Supplemental Endotracheal Jet Ventilation in Spontaneously Breathing, Critically Ill Patients 21 Cesta, Mark A., M.D. Anemia in Cancer Patients is not Associated with Increased Mortality when Adjusted for Severity of Illness 22 Crawford, Jack H., M.D., Ph.D. Effects of Inhaled Nitric Oxide on Human Orthotopic Liver Transplantation 23 Deem, Steven, M.D. Effectiveness, Safety, and Outcomes of Intensive Insulin Therapy in Critically Ill Patients in a Regional Trauma Center 24 Field, Larry, M.D. Treatment of Delirium with Dexmedetomidine: A Case Series with Discussion 25 Frendl, Gyorgy, M.D., Ph.D. Advanced Critical Care Training of Senior (CA3) Anesthesia Residents through a Novel Elective Program: Looking to the Future of Anesthesia Critical Care Training - The Peri-Operative Critical Care Concept 26 Brown, Daniel R., Ph.D., M.D. Head of Bed Angle in Endotracheally Intubated Critically Ill Patients Before and After Multidisciplinary Education 27 Jutla, Rajni K., M.D. Association between Transfusion Requirement and Outcome among Neurosurgical Patients 28 Keller, D., DO Oral Temperature Correlates Well with Brain Temperature Following Subarachnoid Hemorrhage

29 Roy, Tuhin K., M.D., Ph.D. Computer Modeling of Glucose and Insulin Metabolism to Compare Insulin Infusion Algorithms for Glycemic Control in Critically Ill Patients 30 Roy, Tuhin K., M.D., Ph.D. Comparison of Two External Controllers for Glycemic Control in Critically Ill Patients 31 Saager, Leif, M.D. Computer-Guided Versus Standard Protocol for Insulin Administration in Diabetic Patients Undergoing Cardiac Surgery 32 Shander, Aryeh, M.D., FCCM Management of Acute Gastrointestinal Bleeding at ICU without Transfusion 33 Tung, Avery, M.D. Circadian Changes in ICU Glucose Levels with Tight Glycemic Control 34 Urban, Michael K., M.D., Ph.D. The One Year Incidence of Postoperative Myocardial Infarction in an Orthopedic Population 39 Blum, James M., M.D. An Open System for Development of Derived Physiologic Alarms Travel Award 40 Grasso, Francesco A., M.D. Negative Pressure Ventialtion: Better Oxygenation Less Injury Travel Award 41 Pandharipande, Pratik, M.D. Double Blind Randomized Controlled Trial Comparing Sedation with ASCCA/FAER Research Award Dexmedetomidine versus Lorazepam in Mechanically Ventilated Medical ICU Patients 42 Wunsch, Hannah, M.D., M.Sc. Increased Mortality Associated with Acute Hypoxemic Respiratory Young Investigator Award Failure of Extra-pulmonary Origin

B=Basic C=Clinical
Poster Presentations - by Author Name 1 Aschkenasy, Gabriella, M.D. (B) Adenovirus-enhanced Hsp70 Expression Protects the Lung during Acute Lung Injury by Modulating Apoptotic Cell Signaling Pathways 39 Blum, James M., M.D. (C) An Open System for Development of Derived Physiologic Alarms Travel Award 14 Brown, Daniel R., M.D., Ph.D. (B) Perioperative Serum Vasopressin Concentrations in Elective Thoracoabdominal Aortic Aneurysm Repair 26 Brown, Daniel R., M.D., Ph.D., (C) Head of Bed Angle in Endotracheally Intubated Critically Ill Patients Before and After Multidisciplinary Education 2 Buck, Troy, M.D. (B) Does Enteral Nutrition with Eicosapentaenoic Acid (EPA), Gamma-linolenic Acid (GLA), and Antioxidants Impact Outcome in Patients with Acute Respiratory Distress Syndrome (ARDS) 19 Byhahn, Christian, M.D. (C) Emergency Echocardiography in Pulseless Electrical Activity Victims Using Portable, Handheld Ultrasound 20 Byhahn, Christian, M.D. (C) Supplemental Endotracheal Jet Ventilation in Spontaneously Breathing, Critically Ill Patients
3 Camporesi, Enrico M., M.D. (B) Sparing of Neuronal Tissue after Ischemic Injury and a-EPO is Related to Reduced Apoptosis 21 Cesta, Mark A., M.D. (C) Anemia in Cancer Patients is not Associated with Increased Mortality when Adjusted for Severity of Illness 22 Crawford, Jack H., M.D., Ph.D. (C) Effects of Inhaled Nitric Oxide on Human Orthotopic Liver Transplantation 4 Croley, W. Christopher, M.D. (B) PBL/Simulation Significantly Increases Exam Scores During an M4 Critical Care Medicine Rotation 23 Deem, Steven, M.D. (C) Effectiveness, Safety, and Outcomes of Intensive Insulin Therapy in Critically Ill Patients in a Regional Trauma Center 24 Field, Larry, M.D. (C) Treatment of Delirium with Dexmedetomidine: A Case Series with Discussion 25 Frendl, Gyorgy, M.D., Ph.D. (C) Advanced Critical Care Training of Senior (CA3) Anesthesia Residents through a Novel Elective Program: Looking to the Future of Anesthesia Critical Care Training - The Peri-Operative Critical Care Concept 5 Frick, Christiane G., M.D. (B) Long-term Effects of Botulinum Toxin on Neuromuscular Function 6 Gabrielli, Andrea, M.D. (B) Load and Tolerance Strategy is Appropriate for Recommending Pressure Support Ventilation Settings: Validation Study

B=Basic C=Clinical
40 Grasso, Francesco A., M.D. (C) Negative Pressure Ventialtion: Better Oxygenation Less Injury Travel Award 7 Hellman, Judith, M.D. (B) Pulmonary Inflammatory Effects of Bacterial Lipoproteins 35 Helming, Marc, M.D. (B) Recovery of Critical Illness Myopathy - Effects of Immobilization and Travel Award Inflammation in Rats 27 Jutla, Rajni K., M.D. (C) Association between Transfusion Requirement and Outcome among Neurosurgical Patients 28 Keller, D., D.O. (C) Oral Temperature Correlates Well with Brain Temperature Following Subarachnoid Hemorrhage 8 Kunz, Tina, M.D. (B) Caspofungin Trough Concentrations in Critically Ill Surgical Patients Receiving CRRT 38 Mehta, Nilesh, M.D. (B) Pharmacokinetic Considerations during Extracorporeal Membrane Young Investigator Award Oxygenation - Results from an Ex Vivo Simulation 16 Nates, Joseph L., M.D., M.B.A. (B) Performance of the SOFA score after Modification and Automation in an Oncological Surgical ICU 17 Nates, Joseph L., M.D., M.B.A. (B) Automating and Simplifying a Validated Severity of Illness Scoring System, the M-SOFA 18 Nates, Joseph L., M.D., M.B.A. (C) Individual Clinical Productivity in an Academic Critical Care Department 36 Nishida, Takefumi, M.D. (B) Cardiac Myocyte-Specific Endothelial Nitric Oxide Synthase (eNOS) Travel Award Overexpression Rescues Myocardial and Neuronal Function after Cardiopulmonary Resuscitation in eNOS-Deficient Mice 41 Pandharipande, Pratik, M.D. (C) Double Blind Randomized Controlled Trial Comparing Sedation with ASCCA/FAER Research Award Dexmedetomidine versus Lorazepam in Mechanically Ventilated Medical ICU Patients 9 Peterson, M., B.S. (B) Head Elevation to Reduce Ventilator Associated Pneumonia and Skin- ICU Bed Interface Pressures 10 Peterson, M., B.S. (B) Side Turning Does Not Reliably Reduce Skin-Bed Interface Pressure 29 Roy, Tuhin K., M.D., Ph.D. (C) Computer Modeling of Glucose and Insulin Metabolism to Compare Insulin Infusion Algorithms for Glycemic Control in Critically Ill Patients 30 Roy, Tuhin K., M.D., Ph.D. (C) Comparison of Two External Controllers for Glycemic Control in Critically Ill Patients 31 Saager, Leif, M.D. (C) Computer-Guided Versus Standard Protocol for Insulin Administration in Diabetic Patients Undergoing Cardiac Surgery

B=Basic C=Clinical
11 Sahani, Nita D., M.D. (B) In-vivo Effects of IGF-I on Neuromuscular Transmission following Burn Injury in Mice 12 Sahani, Nita D., M.D. (B) Skeletal Muscle Apoptosis after Immobilization: A Mechanism for Muscle Atrophy via Akt Inactivation 32 Shander, Aryeh, M.D., FCCM (C) Management of Acute Gastrointestinal Bleeding at ICU without Transfusion 33 Tung, Avery, M.D. (C) Circadian Changes in ICU Glucose Levels with Tight Glycemic Control 34 Urban, Michael K., M.D., Ph.D. (C) The One Year Incidence of Postoperative Myocardial Infarction in an Orthopedic Population 37 Wong, Jim, M.D. (B) How to Make a Good Receptor Misbehave: Disrupting the ß2 Travel Award Adrenergic Receptor PDZ Binding Motif Causes the ß2 Receptor to Signal like a ß1 Receptor In Vivo 15 Worah, Samrat H., M.D. (B) Lidocaine But NotAmiodarone Improves Electrophysiologic Recovery of Ca 1 Pyramidal Cells From Rat Hippocampal Slices Following Hypoxia 42 Wunsch, Hannah, M.D., M.Sc. (C) Increased Mortality Associated with Acute Hypoxemic Respiratory Young Investigator Award Failure of Extra-pulmonary Origin 13 Zafirova, Zdravka, M.D. (B) Pressure Control and Tidal Volume: What’s the Difference between a Test Lung and Human Patients?

Adenovirus-Enhanced Hsp70 Expression Protects the Lung During Acute Lung Injury by Modulating Apoptotic Cell Signaling Pathways
Aschkenasy G1, Bromberg Z1, Raj N2, Deutschman CD2, Weiss YG1,2.
1Dept. of Anesthesiology and Critical Care Medicine and the Goldyne Savad Institute of Gene Therapy, Hadassah-Hebrew University School of Medicine, Jerusalem, 91120, Israel, 2Dept. of Anesthesiology and Critical
Care, University of Pennsylvania School of Medicine, Philadelphia, PA 19104-4283, USA
The acute respiratory distress syndrome (ARDS) is a major cause of death. ARDS involves unchecked
inflammation that damages and destroys type I and type II alveolar epithelial cells. Type II alveolar epithelial cells can proliferate to replace damaged type I alveolar epithelial cells. Recently, evidence has emerged showing the role of the apoptotic cell signaling pathway in lung development, injury and remodeling. Using the model of cecal ligation double puncture (2CLP) we have induced severe intra-abdominal sepsis that causes ARDS. This resulted in a reduction in intrapulmonary expression of the 70kD heat shock protein (Hsp70). Therapy with an adenovirus expressing Hsp70 (AdHSP) limited ARDS-induced pathophysiology and reduced 48 hour mortality by an unclear mechanism. Others have pointed to the interaction between Hsp70 and the apoptosome during apoptosis. Thus, a better understanding of the ways in which ARDS affects pulmonary apoptosis, might suggest novel therapeutic approaches to this deadly disorder.
Our studies reveal that AdHSP treatment causes an attenuation of pro-apoptotic processes and thereby results in an anti–apoptotic effect. Specifically, we demonstrate that AdHSP disrupts key enzymes and protein complexes associated with the pulmonary apoptotic pathways. These include caspases 3, 8 and 9 that play a central role in apoptotic cellular pathways. Our results using TUNEL assay, immunofluorescence staining as well as Western immunoblotting demonstrate that 2CLP-induced ARDS resulted in a higher abundance of caspases 3, 8 and 9, compared to 2CLPAdHSP treated animals and controls. Furthermore, co-immunoprecipitation studies followed by Western immunoblotting reveal the presence of complexes containing both caspases 3, 8 and 9 in 2CLP treated animals. In contrast, AdHSP treatment abolishes or disrupts these complexes. Our findings indicate that Hsp70 impairs protein interactions within the apoptotic pathway other than the apoptosome and may provide new insights into novel mechanisms by which Hsp70 modulates apoptosis.

Does Enteral Nutrition with Eicosapentaenoic Acid (EPA), Gamma-Linolenic Acid (GLA), and Antioxidants Impact Outcome in Patients with Acute Respiratory Distress
Syndrome (ARDS)
Buck, TA, Sanders, G, Elamin, E. Department of Anesthesia, University of South Florida, Tampa, Florida, USA
OBJECTIVES: Two previous studies have shown that ARDS patients fed an enteral diet containing EPA+GLA and elevated antioxidants (Oxepa) had significantly increased oxygenation, and improved clinical outcomes. We investigated the potential benefits of the same diet in patients with ARDS in addition to Multiple Organ Dysfunction (MOD), which correlates strongly with the risk of intensive care unit (ICU) mortality. METHODS: We enrolled 16 ICU patients with ARDS (as defined by the American-European Consensus Conference) as a prospective, multicenter, double-blinded, randomized controlled trial. Patients meeting entry criteria were randomized and continuously tube-fed EPA+GLA or an isonitrogenous, isocaloric standard diet at a minimum caloric delivery of 90% of basal energy expenditure for at least 4 days. MEASUREMENTS AND MAIN RESULTS: Ventilator settings were recorded and arterial blood gases were measured, at baseline and study days 4 and 7 to enable calculation of PaO2/FIO2, a marker for gas exchange and part of the Modified Lung Injury Score (LIS). Significant improvements in oxygenation (PaO2/FIO2) from baseline to study day 4 with lower ventilation variables (FIO2, positive end-expiratory pressure, and minute ventilation) occurred in patients with higher APACHE scoring at enrollment who were fed EPA+GLA compared with controls (p<.01). In addition, patients fed EPA+GLA had a decrease in their APACHE score 4 days after initiation of the enteral nutrition with decreased in length of stay in the intensive care unit (12.8 vs. 17.5 days; p = .016) compared with controls. Over all, patients who were fed EPA+GLA had a significant decrease in MOD score at 28 days after initiation of their tube feeding (p<.05). CONCLUSIONS: This preliminary report supports the previously reported benefits of EPA+GLA diet on gas exchange, and length of ICU stay. In addition, patients fed EPA+GLA had a reduction of their APACHE score within 4days of initiating the enteral nutrition with decreased MOD scores 28 days after initiation of their tube feeding. Enteral nutrition of ARDS patients with EPA+GLA diet can improve their gas exchange, in addition to decreasing their length of ICU stay and 28 days mortality.

Baseline 1 4 7
Time (days)
0
1
2
3
4
5
Mea
n In
jury
Sco
re
DietControlExperimental
Lung Injury Score

Baseline 1 4 7
Time (days)
0
2
4
6
8
10
Mea
n M
OD
S Sc
ore
DietControlExperimental
MODS Score

Sparing of Neuronal Tissue after Ischemic Injury and a-EPO is Related to Reduced Apoptosis
Price CD, Chaparro R, Kumar D, Coppola D, Camporesi EM
Departments of Anesthesiology and Pathology, University of South Florida, Tampa, Florida, United States
INTRODUCTION: Erythropoietin (EPO), both in vitro and in vivo, has demonstrated anti-apoptotic properties in models of ischemia, hypoxia, serum withdrawal, and kainite exposure. More specifically, systemic administration of EPO has been shown to reduce the amount of TUNEL positive cells and histological damage in the surrounding penumbra region of injury after the induction of a stroke-like insult in rats1. AsialoEPO (a-EPO) is a derivative of EPO that is nonerythropoietic, thereby reducing the possibility of recurrent injury in models of stroke. The goal of this study was to determine the effect of a-EPO on apoptotic-specific cellular death after ischemic brain injury in rats. METHODS: Focal cerebral ischemia was surgically induced in Sprague Dawley rats by inserting a 4.0 polypropylene suture into the region of the middle cerebral artery (MCA), occluding blood flow to the striatum. Following 90 minutes of occlusion, rats were implanted with a continuous-flow mini-pump (Alzet) and treated with asialoEPO (20 µg/kg/day) or saline control for four days. On day four, rats were perfused with saline and brains were fixed with 10% formalin, followed by TUNEL immunostaining for detection of apoptotic activity. Apoptosis was semi-qualitatively analyzed by an investigator blinded to treatment groups. RESULTS: Levels of a-EPO in CSF measured by ELISA assay were significantly higher in the a-EPO group (p<0.05). Hematocrit was not significantly different between groups (p>0.05), supporting the lack of hematopoietic activity. The saline control group (n=9) demonstrated TUNEL-positive results in an average of 24.4% of the total brain field, as compared with the a-EPO group (n=9), which demonstrated TUNEL positive results in an average of 3.2% of the total brain field (p<0.01). CONCLUSION: Qualitative analysis suggests that a continuous subcutaneous infusion of low-dose a-EPO is capable of reducing the amount of apoptotic-induced cellular death in the region of insult and surrounding areas after an ischemic stroke-like injury to the brain. REFERENCES: Siren et al. Proc. Natl. Acad. Sci. USA. 2001 (98) 4044-4049.

PBL/Simulation Significantly Increases Exam Scores During an M4 Critical Care Medicine Rotation
Croley WC, Siddall VJ, Ault ML, Rabito RK, Corbridge TC Department of Anesthesiology, Northwestern University Feinberg School of Medicine, Chicago, Illinois
Introduction: Approximately 20% of USMLE Step II questions have been identified as containing critical care medicine (CCM) content; formalized CCM curriculum only exists in approximately 45% of US medical schools. Approximately 80% of CCM rotations are offered as electives.1 The Accreditation Council for Graduate Medical Education (ACGME) now requires programs to demonstrate efforts to utilize competency-focused evaluation tools with measurable outcomes. Instructional Design: Due to the paucity of formalized critical care medicine curricula and mandates by ACGME for testing using measurable outcomes, we developed a standardized rotation incorporating Problem Based Learning (PBL), simulation and traditional lectures into a mandatory critical care clerkship. Logistical limitations necessitated splitting the group into two smaller factions. One group attended the PBL/simulation portion while the other group participated in a traditional CCM rotation. To ensure equal exposure of both groups to course contents, the groups were switched mid-rotation. Both groups attended approximately 8 hours of common lectures on relevant critical care medicine topics. The PBL/simulator sessions provided exposure to a basic framework of critical care medicine principals utilizing repetitive, focused, experiential learning, concentrating on respiratory failure, shock, and common CCM procedures. Simulation exams were administered at baseline, mid rotation, and at the conclusion of the clerkship in order to identify deficiencies within the curriculum. Observations: After review of baseline and mid-rotation exam scores, we identified a trend toward higher scores in the PBL/simulation group suggesting early exposure to PBL/simulation improves performance. Program Evaluation: This trend is likely due to the fact that interactive learning in smaller groups, using a learner-centric approach, fosters application of knowledge within a clinical context as supported by previous research by Steadman et al.2 Awareness of the gap between what is traditionally offered as mandatory rotations and what is tested on USMLE Step II served as the construct for the development of our rotation. Conclusion: Our observations promote integration of PBL/simulation into a critical care medicine rotation. Additionally, early exposure to PBL/Simulation may improve exam scores as well as clinical performance. Future studies are needed to clarify the appropriate sequence of novel educational modalities to best facilitate medical student CCM education. Group A (N=66) P< 0.0001
Mean Std. Deviation
Baseline % Correct 28.5 14.1 Mid-rotation % Correct 49.7 13.5 Difference T2-T1 21.2 17.8 Table 1. Group A= Traditional CCM Rotation Group B (N=67) P< 0.0001
Mean Std. Deviation
Baseline % Correct 25.7 13.1 Mid-rotation % Correct 60.5 16.7 Difference T2-T1 34.9 16.3 Table 2. Group B= PBL/Simulation CCM Rotation
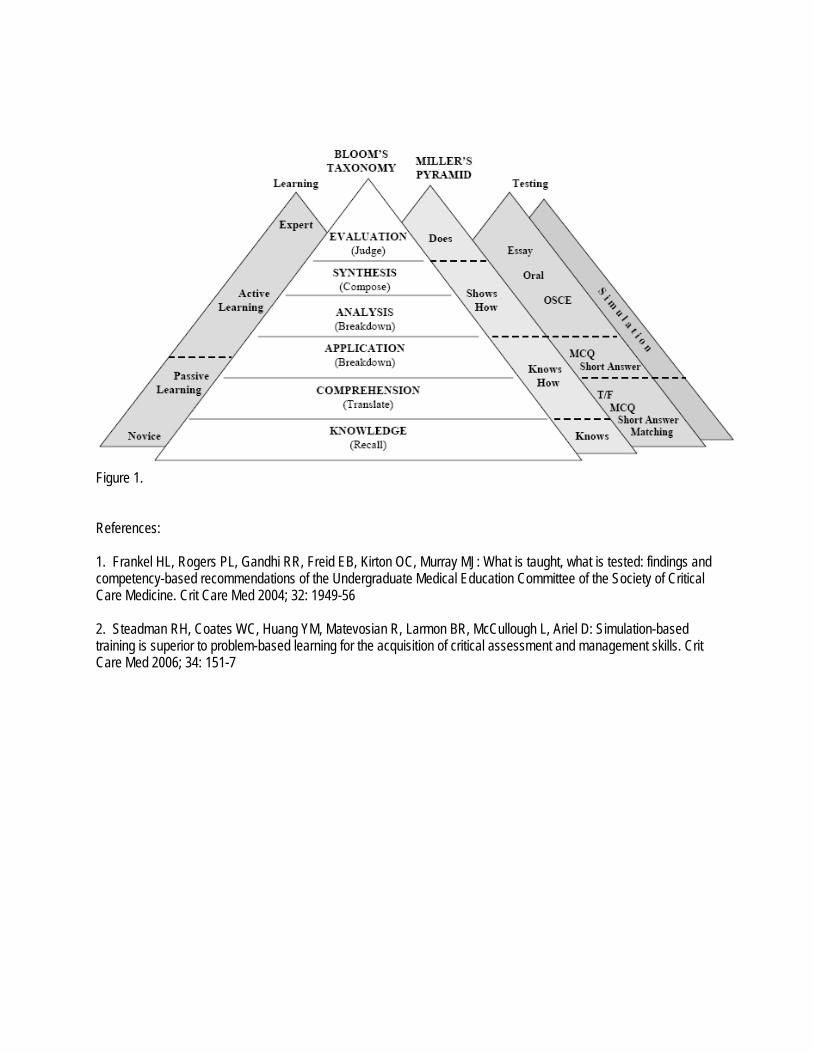
Figure 1. References: 1. Frankel HL, Rogers PL, Gandhi RR, Freid EB, Kirton OC, Murray MJ: What is taught, what is tested: findings and competency-based recommendations of the Undergraduate Medical Education Committee of the Society of Critical Care Medicine. Crit Care Med 2004; 32: 1949-56 2. Steadman RH, Coates WC, Huang YM, Matevosian R, Larmon BR, McCullough L, Ariel D: Simulation-based training is superior to problem-based learning for the acquisition of critical assessment and management skills. Crit Care Med 2006; 34: 151-7

Long-term Effects of Botulinum Toxin on Neuromuscular Function
Frick C.G., M.D., Richtsfeld M., M.D., Blobner M., M.D., Martyn J.A.J., M.D., Department of Anesthesia and Critical Care, Massachusetts General Hospital, Harvard Medical School,
Boston, Massachusetts and Klinik für Anaesthesiologie, TU München, Germany Background: Recent reports indicate an increase in the incidence of clostridium botulinum infections, particularly among drug abusers and tissue allograft recipients. Botulinum toxin has also potential application in biochemical warfare. Due to its prejunctional effects, the neurotoxin causes paralysis of the affected muscles, often requiring mechanical ventilation with or without muscle relaxants. In this study, we investigated the long-term effects of botulinum toxin on muscle function, expression of acetylcholine receptors (AChRs) and their interaction with muscle relaxant, atracurium. Methods: Male Sprague-Dawley rats (n= 31) were injected with varying doses (0.625U, 2.5U and 10U) of botulinum toxin into the tibialis cranialis muscle. Control animals (n=9) received an equivalent volume of saline. At 128 days following injection, neuromuscular function was evaluated. The effective dose (ED) of atracurium and its concentration to establish a steady-state 50% paralysis were determined. AChRs were quantitated using the 125I -bungarotoxin binding method. Results: Evoked muscle tension, tetanic muscle tension and muscle weight were decreased in a dose-dependent manner relative to the contralateral side (control) as well as to saline injected separate controls. Specific muscle tension and specific tetanic tension (tensions/ muscle mass) were not reduced. The slope of the dose-response-curve to atracurium was decreased in the 2.5U and in the 10U botulinum toxin group, but there were no differences in ED50 values between groups. The atracurium plasma concentration necessary to maintain a steady-state 50% paralysis was significantly reduced in the 10U botulinum toxin group. The concentrations of AChRs in the tibialis cranialis muscle were significantly increased in a dose-dependent manner in all experimental groups. Conclusion: Botulinum toxin causes persistent dose-dependent long-term neuromuscular dysfunction. The loss of tension generating capacity is almost exclusively related to muscle atrophy, as specific tensions did not change. The unaltered or increased sensitivity to atracurium, despite up-regulation of AChRs, suggest that the persistent prejunctional effects of botulinum toxin counteracted the receptor-mediated resistance, which is normally seen with up-regulated AChRs.
Saline 0.625 units 2.5 units 10 units control 3.2 ± 0.4 3.1 ± 0.4 2.9± 0.3 2.8± 0.4
Evoked Muscle Tension [N] botox 2.8 ± 0.5 2.4 ± 0,4* 1.7± 0,4*#† 1.3± 0,3*#†‡
control 3.4 ± 0.5 3.3 ± 0.6 3.2± 0.4 3.0± 0.7 Specific Muscle Tension [N/g] botox 3.1 ± 0.6 2.9 ± 0.5 2.9± 1.0 2.8± 0.3 control 9.6 ± 1.2 9.3 ± 1.5 8.7± 1.0 9.1± 1.4
Tetanic Muscle Tension [N] botox 8.8 ± 1.6 8.0 ± 1,1* 6.6± 1,3*#† 5.0± 1,4*#†‡
control 9.9 ± 1.2 10.2 ± 2.0 9.7± 1.1 9.5± 2.04 SpecificTetanic Tension [N/g] botox 9.5 ± 1.9 9.6 ± 1.6 11.0± 3.5 11± 4.22 control 1.0 ± 0.1 1.0 ± 0.2 0.9± 0.1 1.0± 0.3
Tibialis Muscle Mass [g] botox 0.9 ± 0.1 0.8 ± 0.1*# 0.6± 0.1*#† 0.5± 0.1*#†‡
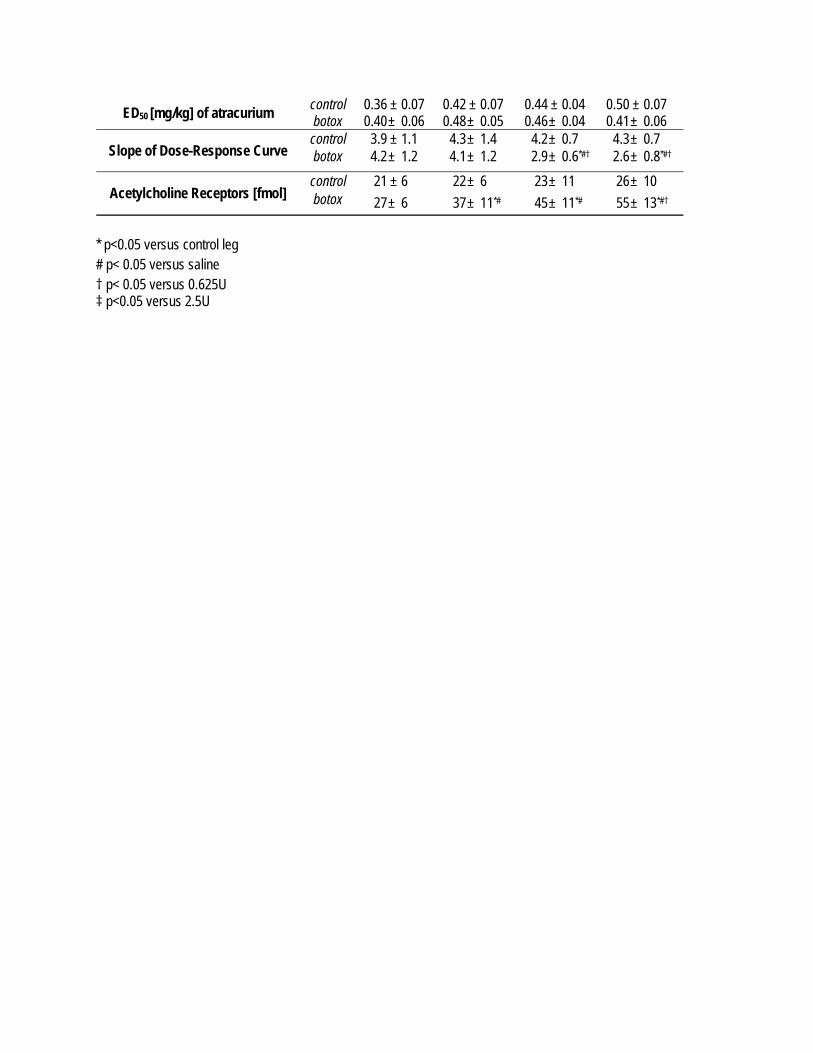
control 0.36 ± 0.07 0.42 ± 0.07 0.44 ± 0.04 0.50 ± 0.07 ED50 [mg/kg] of atracurium botox 0.40 ± 0.06 0.48 ± 0.05 0.46± 0.04 0.41± 0.06 control 3.9 ± 1.1 4.3 ± 1.4 4.2± 0.7 4.3± 0.7
Slope of Dose-Response Curve botox 4.2 ± 1.2 4.1 ± 1.2 2.9± 0.6*#† 2.6± 0.8*#† control 21 ± 6 22 ± 6 23± 11 26± 10
Acetylcholine Receptors [fmol] botox 27 ± 6 37 ± 11*# 45± 11*# 55± 13*#† * p<0.05 versus control leg # p< 0.05 versus saline † p< 0.05 versus 0.625U ‡ p<0.05 versus 2.5U

Load and Tolerance Strategy is Appropriate for Recommending Pressure Support Ventilation Settings: Validation Study
A. Gabrielli MD, N. R. Euliano PhD, V. Brennan PhD, A. J. Layon MD, M. J. Banner PhD
Univ. FL., Coll. Med., Depts. of Anesth., Physiol., and Surg., and Convergent Engineering, Gainesville, FL
Introduction: Appropriate assessments of respiratory muscle loads, reflected by power of breathing (work of breathing / min, normal 4 to 8 Joule / min in adults), and tolerance of these loads, reflected by spontaneous breathing frequency ( f ) and tidal volume (VT),1 are essential when patient-ventilator interaction is observed. Pressure support ventilation (PSV) should be applied so that muscle loads are not too high or low, predisposing to fatigue and disuse atrophy, respectively. Under some conditions in managing patients with respiratory failure, expert clinical personnel may not always be available to make timely, proper assessments for setting PSV. For these conditions, we developed a Fuzzy Logic Inference system (FIS) to make recommendations for setting PSV for patients with respiratory failure. Fuzzy logic may be defined as the process of using probability distributions instead of simple “yes / no” decisions, as in a simple rule-based system, to drive the ventilator decision making. The FIS employs an artificial neural network that allows for the non-invasive (i. e., does not require insertion of an esophageal balloon catheter), real time calculation of power of breathing (POBN).2 We performed a clinical study to validate FIS recommendations against bedside clinical evaluation. Methods: Seventy-seven intubated adults (age 59 ± 16 yrs, wt. 80 ± 24 kg) with respiratory failure receiving PSV were enrolled in an IRB approved study. Data from a combined pressure / flow sensor, positioned between the endotracheal tube and Y-piece of the ventilator breathing circuit, were directed to a respiratory monitor (NICO, Respironics) for measurements of f and VT and to a laptop computer containing special software (“GATORS Software,” Convergent Engineering) for calculations of POBN. The FIS component of the software integrated POBN (muscle load data) with f and VT (patient tolerance data) to formulate recommendations for setting PSV, which were examined prospectively for validity (accuracy) by attending physician intensivists (n = 4). Data analysis: Fisher Sign Test; alpha was set at 0.05 for significance. Results: PSV range for all subjects was 5 to 25 cm H2O. There was a mean total of 91.4% agreement (149 agree /163 recommendations, p < 0.05); between all recommendations from the FIS to increase or decrease PSV and those of the panel of experts. Discussion: Valid recommendations for setting PSV to appropriately unload the respiratory muscles were provided by the FIS. For over 90% of the time, the FIS “thought” and “decided” on a level of PSV, the same as that decided upon by attending critical care physicians who evaluated the patients at the bedside. A monitoring system employing a complimentary load (POBN) and tolerance (f and VT) strategy for assessing patients with respiratory failure appears to provide automatic and clinically valid recommendations for setting PSV. 1. Chest 1996; 89: 677-681. 2. Crit Care Med 2006; 34: 1052-1059

Pulmonary Inflammatory Effects of Bacterial Lipoproteins
Shin HS, Bagchi A, Warren HS, Graveline A, Ichinose F, Bloch KD, Hellman J Department of Anesthesia and Critical Care, Massachusetts General Hospital, Boston, Massachusetts
Background: Sepsis is initiated by interactions between microorganisms and the host’s innate immune system. Sepsis-induced acute respiratory failure is believed to result from activation of endothelial cells and leukocytes within the lungs. Toll-like receptors (TLRs) are a group of host receptors that recognize components of microorganisms and are critical in inflammation during infection. We have found that common Gram-negative bacterial lipoproteins, including peptidoglycan-associated lipoprotein (PAL) and murein (Braun’s) lipoprotein are shed into the blood of septic animals 1, 2, 3. We have characterized PAL as a potent TLR2 agonist that activates leucocytes and causes inflammation in mice 3, 4. We tested the hypothesis that bacterial lipoprotein TLR2 agonists activate pulmonary inflammatory responses. Methods: PAL was purified from E. coli K12 bacteria. Pam3Cys, a synthetic lipopeptide TLR2-agonist, and lipopolysaccharide (endotoxin, LPS), a TLR4 agonist, were purchased from commercial sources. LPS was utilized as a positive control for assays with TLR2 knockout mice. Data were analyzed by ANOVA or t-tests. P < 0.05 were considered statistically significant. Data are representative of at least 3 separate experiments. In vitro studies: Monolayers of mouse lung microvascular endothelial cells (MsLuEC) from wild-type (WT) and TLR2-knockout (KO) mice were incubated for 20h with purified PAL. IL-6 levels were quantified in culture supernatants. Human lung microvascular EC (HuLuEC) were incubated for 20h with PAL, and IL-6 and IL-8 levels were quantified in the culture supernatants. HuLuEC surface expression of E-selectin was assessed after 2h of treatment with PAL using a cell-based ELISA. In vivo studies: WT and TLR2 KO mice received Pam3Cys, PAL, LPS, or carrier (50 mM Sodium Phosphate, pH 7.4) via iv injection, and lungs were collected at intervals from 30min up to 22h. Myeloperoxidase (MPO) levels were assessed in the right lung as a reflection of neutrophil activity. RNA was isolated from the left lung, and quantitative real time RT-PCR (qPCR) was used to measure levels of mRNAs encoding selected cytokines, adhesion molecules, nitric oxide synthases 1 and 2 (NOS1 and NOS2), cyclooxygenases 1 and 2 (COX1 and COX2), and MMP9. Results: In vitro studies: Treatment with PAL increased IL-6 production by LuEC from WT mice (p < 0.0001), but did not increase IL-6 production by LuEC from TLR2 KO mice . PAL also increased the production of IL-6 and IL-8 (p < 0.001) and the surface expression of E-selectin (p < 0.001) by HuLuEC. In vivo studies: MPO levels were increased in the lungs of WT mice that were treated with Pam3Cys and PAL, but not with carrier (p < 0.01). The increase in lung MPO was attenuated in Pam3Cys and PAL treated TLR2-KO mice (p < 0.001 and p < 0.05 respectively). Treatment with PAL and Pam3Cys increased lung levels of mRNAs encoding IL-6, TNFα, E-selectin, ICAM-1, NOS2, MMP-9, and COX 2. Treatment with PAL and Pam3Cys did not increase the expression of mRNAs for NOS1 or COX1 within the 22h time frame studied. The time to peak expression of different mRNAs varied, as did the magnitude and duration of increased expression. For instance, TNFα gene expression was maximal at 30min and was still significantly increased at 22h (Figure 1). COX2 expression was also maximal at 30min, but mRNA levels rapidly returned to near baseline values (Figure 2). E-selectin and NOS2 peaked at 2h, and MMP9 mRNA levels were highest at the 22h time point (Figure 3). Conclusions: These studies show that bacterial lipoproteins activate lung microvascular EC and induce lung inflammation. Although mechanisms of acute respiratory failure in sepsis have not been fully characterized, activation of EC and leukocytes within the lungs is believed to contribute to the pathogenesis of sepsis-induced acute lung injury. Our data suggest that lipoprotein TLR2 agonists, which are abundant in the cell walls of Gram-negative bacteria, may contribute to the pathogenesis of acute lung injury in sepsis. Figures 1-3: Fold increase in lung mRNA expression following treatment with Pam3Cys

0 12 24
0
15
30
CarrierPam3Cys
Fold ΙncreaseMMP9 mRNA/18S rRNA
Figure 3
Time (h)
References: 1. J Infect Dis 2000;181:1034-1043. 2. Journal of Endotoxin Research 2001;7(1):69-72. 3. J Infect Dis 2005; 191(6):939-48. 4. J Biol Chem 2002;277(16):14274-14280.
0 12 24
0
10
20
30
Carrier
Pam3Cys
Fold ΙncreaseCOX2 mRNA/18S rRNA
30m
Figure 2
Time (h)0 12 24
0.0
62.5
125.0
CarrierPam3Cys
Fold ΙncreaseTNFα mRNA/18S rRNA
30m
Figure 1
Time (h)

Caspofungin Trough Concentrations in Critically Ill Surgical Patients receiving CRRT
Kunz T, Bingold T, Kloesel SF, Scheller B, Zwissler B, Wissing H Department of Anaesthesiology, Intensive Care and Pain Therapy, Johann Wolfgang Goethe-University
Hospital, Frankfurt am Main, Germany
In order to reach the minimum inhibitory concentrations (MIC90s) of clinically relevant fungi (Candida spp., Aspergillus spp.) (1) the dosage recommendation of the antifungal agent caspofungin targets a minimum trough concentration of ≥ 1 µg/ml from the first day of therapy on. Data of standard dosage were gathered in studies with healthy male subjects (2). Up to now, there are no data for critically ill surgical patients. In our laboratory we adapted a high performance liquid chromatography (HPLC) method (3) to measure caspofungin concentrations in plasma. Six septic surgical patients receiving mechanical ventilation, hemodynamic support and continuous renal replacement therapy (CRRT) were tracked for ten days. CRRT was performed as continuous veno venous hemodiafiltration. Material and methods: The study was authorized by the local ethics committee and the patient's legal representative. Caspofungin standard dosing was used, initially 70 mg, the following days 50 mg. Trough concentrations were taken directly before the next dosage. Results: After the first day of treatment only two patients achieved the target trough concentration of ≥ 1 µg/ml, mean was 0.78 µg/ml (SD ± 0.23). At half of the treatment days means were smaller than 1 µg/ml. Highest means were measured at day 4 (1.43 µg/ml ± 0.85) and day 8 (1.41 µg/ml ± 1.03). Two patients never reached the target concentration of 1 µg/ml.
Conclusion: In contrast to published pharmacokinetic data obtained in healthy male subjects no constant trough concentrations of ≥ 1 µg/ml were measured. Drug cumulation as observed in healthy subjects was not seen in our patients during treatment period. Whether the detected low trough concentrations of caspofungin are caused by capillary leaks due to sepsis or by additional elimination caused by CRRT should be assessed in additional studies in this group of patients with regard to efficacy. References: 1. Bartizal K et al. Antimicrob Agents Chemother (1997) 41:2326-32; 2. Stone JA et al. Antimicrob Agents Chemother (2002) 46:739-45; 3. Schwartz M et al. Analytica Chimica Acta (1997) 352:299-307. This investigator initiated study was supported by a grant of MSD.
Caspofungin trough concentrations in 6 septic surgical patients
0,00
0,50
1,00
1,50
2,00
2,50
3,00
0 2 4 6 8 10 12
treatment period (days)
C C
aspo
fung
in (µ
g/m
l)

Acknowledgement: We thank our assistant medical technician Mrs. Lengsfeld for her support in the implementation of the chemical analysis.

Head Elevation to Reduce Ventilator Associated Pneumonia and Skin-ICU Bed Interface Pressures
Peterson M, Schwab W, McCutcheon K, Gravenstein N, Caruso L
Dept. of Anesthesiology, Univ. of Florida College of Medicine, Gainesville, FL
Introduction: ICU patients are at particular risk for pressure ulcers and ventilator associated pneumonia (VAP) due to multiple predisposing factors. Current guidelines recommend that mechanically ventilated patients be kept in a semi-recumbent position with the head of bed (HOB) elevated 30-45° to prevent aspiration and VAP (1). Although there is good evidence that the semi-recumbent position has pulmonary benefits, the effect on pressure ulcer risk has not been defined. We tested the effects of elevating the HOB on the interface pressure between the skin and the support surface. Methods: With IRB approval and informed consent, healthy volunteers were positioned supine on a modern ICU bed (Total Care®, Hill-Rom, San Antonio, TX). The subjects were dressed in hospital scrubs. A 48x48 sensor array comprising a 2’x 2’ square pad was positioned under the sacrum. A calibrated interface-pressure profile was acquired for each subject in the supine position, followed by progressive elevation of the head of the bed to 10°, 20°, 30°, 45°, 60°, and 75°, using the XSensor (Calgary, Canada) interface pressure system (2). Matlab (Mathworks, Natick, MA) and Excel (Microsoft, Redmond, WA) were then used to analyze the interface pressure data. Results: Nine subjects were studied. Figure 1 presents the averaged subject data as the area over which an interface pressure greater than 30 mmHg was obtained. A Wilcoxon rank sum test showed significant differences between the supine and the elevated positions of greater than or equal to 45° for both the peak interface pressure and the affected area with a pressure greater than 30 mmHg (P < 0.05, two-tailed test). Figure 2 presents, visually, how the pressures increase over the sacral region while the HOB is elevated. Conclusion: Raising the HOB to 45° or higher to prevent pulmonary complications increases the interface pressure and the affected area between the skin and bed and may therefore increase the risk of pressure ulcers attributed to a skin-ICU bed interface pressure ≥ 30 mmHg. References: 1. Am J Respir Care Med 2005; 171:388-416. 2. http://www.xsensor.com/ Figure 1: Figure 2: Interface pressure profiles (from top left,
clockwise): Supine, HOB 45°, HOB 60°, HOB 75°. Color denotes the area where the skin-bed interface pressure exceeds 30 mmHg.
Affected Supine Area over 30 mmHg
y = -0.0026x3 + 0.378x2 - 8.0662x + 452.82R2 = 0.9987
0.00
200.00
400.00
600.00
800.00
1000.00
1200.00
0 10 20 30 40 50 60 70 80
Head Elevation (degrees)
Are
a (
cm2)
Series1 Poly. (Series1)

Side Turning Does Not Reliably Reduce Skin-Bed Interface Pressure
Peterson M, Schwab W, McCutcheon K, Gravenstein N, Caruso L Dept. of Anesthesiology, Univ. of Florida College of Medicine, Gainesville, FL
Introduction: Pressure ulcers are a source of significant morbidity in ICU patients. Frequent turning of the patient from side-to-side is used routinely to decrease the risk of pressure ulcers by unloading pressure from at risk areas. Normal capillary pressures in the body range from about 10 to 30 mmHg (1); external pressures beyond this limit may lead to reduced blood flow and accumulation of metabolites via lymphatic occlusion (2). Minimizing the skin-support surface interface pressure below 30 mmHg is thought to be beneficial, but the effectiveness of this technique is yet unclear. Methods: With IRB approval and informed consent, healthy volunteers were positioned supine on a modern ICU bed (Total Care®, Hill-Rom, San Antonio, TX). The subjects were dressed in hospital scrubs. A 48 x 48 sensor array comprising a 2’x 2’ square pad was positioned under the sacrum. With the subject supine (S), turned left (L), and turned right (R) by an experienced ICU nurse, a calibrated interface-pressure profile was acquired using the XSensor (Calgary, Canada) interface pressure system (3). Matlab (Mathworks, Natick, MA) and Excel (Microsoft, Redmond, WA) were then used to analyze the interface pressure data. Results: Nine subjects were studied. Figure 1 shows a typical L, S, and R pressure profile. The legend denotes the interface pressure (mmHg). All subjects exhibited some areas of skin that manifested an interface pressure greater than or equal to 30 mmHg throughout all turned positions (average area per subject: 84.1 cm2; range: 19.4 cm2 to 229.0 cm2); hence the pressure is never relieved as intended (see Figure 2 for example). Conclusion: Standard turning by experienced ICU nurses does not unload all areas of high skin-bed interface pressure. These areas are at risk for skin breakdown and this may help explain why pressure ulcers still occur despite using the standard preventive measure of turning every two hours. References: 1. Guyton, AC, et al. Textbook of medical physiology. 10th ed. Philadelphia: Saunders; 2000. p. 163-174. 2. Reddy NP. Effects of mechanical stresses on lymph and interstitial fluid flows. In: Bader DL, editor. Pressure
sores: clinical practice and scientific approach. London: Macmillan; 1990. p. 203-20. 3. http://www.xsensor.com/

In-vivo Effects of IGF-I on Neuromuscular Transmission following Burn Injury in Mice
Sahani N.D., M.D., Yasuhara S., M.D., Ph.D., Martyn J.A.J.,M.D. Department of Anesthesia and Critical Care, Massachusetts General Hospital, Harvard University,
Boston, MA, United States
Background: The control of muscle mass is determined by a dynamic balance between anabolic and catabolic processes. The mechanisms underlying muscle weakness following burn trauma are not thoroughly understood, although the increased proteosomal degradation leading to loss of muscle mass contributes to muscle weakness. Insulin-like growth factor-I (IGF-I) has been proposed for patients suffering from muscle wasting conditions. However, the effects of IGF-I therapy on the depressed neuromuscular transmission in skeletal muscle following burn injury has not been investigated. This in-vivo study in the mouse following body burn injury quantified muscle function with or without IGF-I therapy. Methods: After IRB approval, mini osmotic pumps were implanted subcutaneously for continuous administration of the IGF-I or saline one day prior to the induction of burn or sham burn injury to male C57BL6 mice. Burned (n=18) and sham burned (n=18) mice received either IGF-I (2 µg/kg-body wt/hr or 20 µg/kg body wt/hr) or saline via the osmotic pumps. In the burn group, a 40% body surface area burn injury was induced by immersion of the abdomen and flanks for 4 and 6 seconds respectively in 80°C water. Weight-matched and time-matched mice were sham burned by immersion in lukewarm water and served as controls. To assess the muscle function, 24 hours after the burn injury, the sciatic nerve was stimulated and the resulting contraction of the tibialis cranialis muscle recorded. A series of 100 Hz tetanic stimulation of 5 seconds with a recovery of 5 seconds after each stimulus, followed by 2 train of four stimulation with an 8 second recovery pattern was applied ten times. At the end of the stimulation program, the tibialis cranialis muscle was harvested. We analyzed the maximum force on first tetanic stimulation, the 25% and 50% fade and the fade at t/2 seconds in the first 5 tetanic stimuli. Variables were statistically analyzed using unpaired t-test with two independent factors, burn versus sham burn and IGF-I versus saline. Results: During the first tetanic stimulation, the maximum force generated did not show a significant difference between the sham-burn and burn groups. Successive tetanic stimuli, however resulted in significant fade in the burned mice receiving no IGF-I as compared to the sham burned mice. The continuous administration of IGF-I reversed the fade in the burn group compared to burn group receiving saline. Conclusion: This study demonstrates that IGF-I increases the maximum force generating capacity and reverses the fade during repetitive tetanic stimulation in burned mice. The effect of long term administration of IGF-I on muscle function following burn deserves further study.
Saline IGF-I (2µg/kg body wt/hr)
IGF-I (20 µg/kg body wt/hr)
Group Sham-burn Burn Sham-burn
Burn Sham-burn
Burn
Maximum Force on 1st tetanus (gm)
75 ± 5 73 ± 3.2 70 ± 6.5 79 ± 2.4 84 ± 2 83 ± 1.5
Time (secs) for 25% fade on 3rd tetanus
1.4 ± 0.2 0.6±0.1** 1.3 ± 0.2 0.9 ± 0.1 1.1 ± 0.1 1.5 ± 1
Time (secs) for 50% fade on 3rd tetanus
3.2 ± 0.4 1.2±0.2** 2.4 ± 0.3 2.3 ± 0.6 2.1 ± 0.1 1.5 ± 0.3
Fade at t/2 seconds on 3rd tetanus
41 ± 3.8 18±4.4 ** 30 ± 3.4 30 ± 5.9 44 ± 2.8 57 ± 12.7
Data are the mean ± SEM, ** p< 0.01 for differences between burn and sham-burn mice receiving saline.

Pressure Control and Tidal Volume: What’s the Difference between a Test Lung and Human Patients?
Zafirova Z, Tung A
Department of Anesthesia and Critical Care University of Chicago
Introduction: Most new anesthesia ventilators are equipped with both volume (VCM) and pressure (PCM) controlled modes. Intraoperative indications for PCM, however, remain unclear. We have previously shown that PCM delivers larger tidal volumes than VCM when peak airway pressure is held constant and endotracheal tube (ETT) obstruction exists (1). Tidal volumes, however, may be larger with PCM even without ETT obstruction. To determine the effect of PCM and VCM on tidal volume, we studied tidal volume delivery with the Ohmeda Aestiva 5 anesthesia ventilator in a test lung and in anesthetized patients. Methods: A test lung (Michigan Instruments, Grand Rapids, MI) was ventilated through an 8.0 endotracheal tube (ETT) using a Datex-Ohmeda Aestiva 5 anesthesia machine (Datex Ohmeda, Madison WI). The ventilator was set to VCM at a respiratory rate (RR) of 10, PEEP of 5 cmH20, I:E ratio of 1:2, and tidal volumes of 550 and 675cc. At each tidal volume, the peak airway pressure was recorded, the ventilator switched to PCM at the same airway pressure, and tidal volumes again recorded. Measurements were obtained at test lung compliances of 20 and10 cc/cmH2O. After IRB approval, an identical anesthesia machine was then used to ventilate 8 patients undergoing laparoscopic prostatectomy and intubated with an 8.0 ETT. The ventilator was set to a tidal volume of 6 cc/kg, RR of 10, PEEP of 5 cm H20, and I:E ratio of 1:2. Tidal volumes, peak, and mean airway pressures were recorded, the ventilator was changed to PCM at the same peak airway pressure, and measurements again obtained. The procedure was repeated at a set tidal volume of 8cc/kg. Statistical analysis was performed using an unpaired t-test. Results: With the test lung, tidal volumes in VCM and PCM were no different when peak airway pressure was held constant (Figure 1). In human patients, however, tidal volume delivery in PCM was significantly greater than in VCM at both 6 and 8 cc/kg (Figure 2, p<0.05). Although peak airway pressures were identical, the mean airway pressure in PCM was higher than in VCM (p<0.05). The increase in tidal volume with PCM was consistent for all patients. Conclusion: We found no difference between PCM and VCM with respect to tidal volume delivery in a test lung, but significantly greater tidal volumes with PCM in anesthetized human patients. While mathematical models of PCM and VCM explain our test lung results (2), they do not account for differences in tidal volume delivery in actual patients. One possibility is that slightly greater mean airway pressures in PCM reduce anesthetic-induced atelectasis, improving lung compliance and increasing tidal volumes. PCM should thus be considered when high airway pressures complicate intraoperative mechanical ventilation. References: 1. Anesth Analg. 2002;95:192-7. 2. J Appl Physiol 1993;74:922-933.

Figure 1:
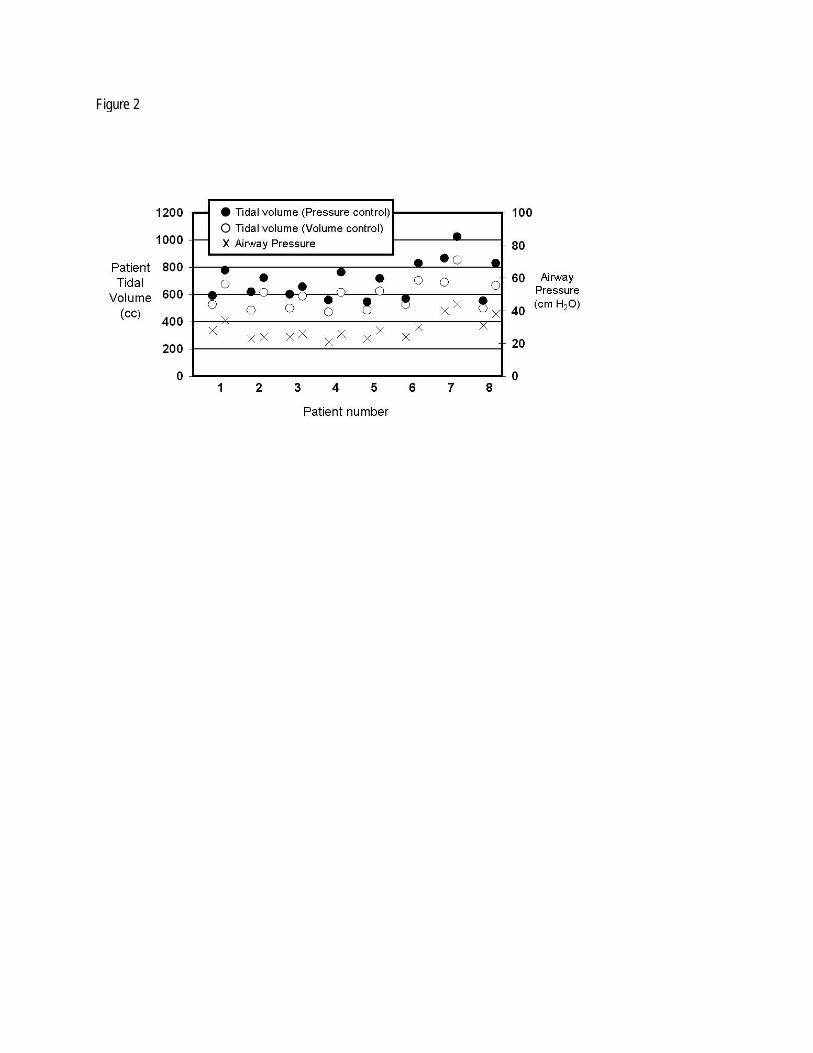
Figure 2

Skeletal Muscle Apoptosis after Immobilization: A Mechanism for Muscle Atrophy via Akt Inactivation
Sahani N.D., M.D., Tiperneni N., M.D., Yasuhara S., M.D., PhD., Kaneki M., M.D., PhD.,
Martyn J.A.J.,M.D. Department of Anesthesia, Massachusetts General Hospital, Harvard University, Boston, MA,
United States
Background: Patients are immobilized in bed following trauma, burns or critical illness resulting in disuse muscle atrophy and weakness, increasing the morbidity and delaying rehabilitation. Apoptosis has been suggested as one of the mechanisms for immobilization induced muscle atrophy. The molecular basis of immobilization leading to this phenomenon, are yet to be elucidated. Contractile activity has been demonstrated to stimulate antiapoptotic protein kinase B (Akt), which we hypothetize is decreased in the immobilized state. It is believed that Akt is involved in the insulin and IGF-I signal pathway, but the activation of Akt by muscle contraction has been controversial. Methods: Male Sprague Dawley rats, weighing 200 to 250 gms, were immobilized at the knee and ankle joints at 90 flexion or sham immobilized for either 1,4,7 and 14 days. At the scheduled time points, the animals were euthanized and the tibialis cranialis and soleus muscles were harvested and studied for apoptosis, using TUNEL and ligation-mediated polymerase chain reaction (LM-PCR) DNA ladder assay. In the second phase of this study, using the short-term sciatic nerve stimulation model, the effect of muscle contraction on Akt activity with or without IGF-I was recorded. Five minutes after the injection of IGF-I (10 µg,100 µg, 300 µg, 1 mg or 10 mg per kg body weight),a ten second tetanic stimulation was given via sciatic nerve every 30 seconds for 3 minutes to induce muscle contraction as well as single twitch stimulation every 5 seconds. At 8 minutes after injection of IGF-1, the tibialis muscle was harvested for assessment of Akt expression and phosphorylation by Western Blotting. Results: The apoptotic nuclei count by in situ TUNEL staining demonstrated increased apoptosis after 4, 7, and 14 days of immobilization, as compared to time-matched controls (sham-pinning and control group). The increase of apoptotic nuclei in the immobilized muscle was associated with muscle mass loss (Tibialis: 37.5%, 41%, 25%; and Soleus: 38%, 30.4%, 44.6% muscle weight loss at day 4, 7, and 14, respectively, p<0.05). On LM-PCR, both tibialis cranialis and soleus muscles showed increased ladder formation with cleaved DNA in the immobilized leg as compared to the sham-pinned limb or control limb at 4, 7, and 14 days after immobilization.The effect of IGF-1 on Akt activation showed augmentation of Akt activation when administered intravenously at a physiological dose of 30 g/ kg, however a high dose of 1 mg/ kg body wt only decreased the phosphorylation on short-term muscle contraction. Conclusion: Immobilization alone causes apoptosis in muscle from 4 days to 14 days after fixation of the leg. The extent of apoptosis was consistent with the reduction in the muscle mass. Since in situ TUNEL assay by itself is not sufficient to conclude that nuclei are undergoing apoptosis, we confirmed cleavage of DNA, a specific trait of apoptosis, with LM-PCR ladder assay.


05
1015202530354045
0 6 12 18 24 30 36 42 48 54 60 66 72
Hours after Cross Clamp
Mea
n V
asop
ress
in c
once
ntra
tion
(pg/
ml)
Perioperative Serum Vasopressin Concentrations in Elective Thoracoabdominal Aortic Aneurysm Repair
Daniel R. Brown, Ph.D., M.D., Mark T. Keegan, M.D., Francis X. Whalen, M.D., Tuhin K. Roy, Ph.D., M.D.,
and Michael J. Brown, M.D. Department of Anesthesiology, Mayo Clinic, Rochester, Minnesota, United States
Introductions: Animal models of vasodilatory and hemorrhagic shock are associated with increased serum vasopressin concentrations. Others have observed that while humans with septic shock have increased serum vasopressin concentrations, the increase is significantly less compared to patients with similar degrees of hypotension due to cardiogenic shock 1. The effect of major surgery on serum vasopressin concentration is unknown. The specific aim of this study was to define the temporal response of serum vasopressin to major elective surgery. Methods: Following institutional approval, we studied 11 patients undergoing elective thoracoabdominal aortic aneurysm repair not requiring cardiopulmonary bypass. Serum vasopressin concentrations were determined after induction of general anesthesia but prior to incision and at 1, 6, 12, 18, 24, 48, and 72 hours from the time of aortic cross clamp application. The need for, and timing of, vasopressor administration was also recorded. Results: Mean serum vasopressin concentrations are shown in Figure 1. Vasopressin concentrations significantly increased following aortic cross clamp application and then decreased over time. Two patients received phenylephrine for hypotension. In one case, this was not associated with an increase in vasopressin concentration. One patient received vasopressin to treat symptomatic vasodilation and this was associated with serum vasopressin concentrations higher than the highest group mean value determined at any time during this study. Discussion: The temporal vasopressin response to major elective vascular surgery is similar to that observed in animal models of hemorrhagic shock 2 and in septic humans 3. Relative vasopressin deficiency may occur during the perioperative period. Vasopressin administration during the postoperative period at doses commonly used to treat pathologic vasodilation increases measured serum vasopressin concentration. These serum concentrations were higher than the average values measured during the perioperative period or those previously reported for cardiogenic shock 1. References:
1. Landry, D., et al. Circulation 95: 1122-1125, 1997 2. Errington, M and M Silva J Physiol 227: 395-418, 1972 3. Sharshar, T, et. al. Crit Care Med 31: 1752-1758, 2003

Performance of the SOFA score after Modification and Automation in an Oncological Surgical ICU
Nates JL, Shaw A, Wakefield C, Samuels J, Price K.
Background: We developed an automated severity of illness score using a modified version of the Sequential Organ Failure Assessment (SOFA) score. Although the SOFA was not designed to be a prognostic score, attempts to use it as such have been made recently. The objective of this study was to evaluate the power of the modified SOFA score (M-SOFA) to discriminate mortality in a cohort of cancer surgical patients.
Methods: An objective automated M-SOFA score was developed including P/F ratio, number of
vasopressors, and platelets, bilirubin, and creatinine levels. No points were given for GCS or hypotension not requiring vasopressors or mechanical ventilation. All the patients older than 18-year old admitted to the ICU between 9/1/2001 and 12/31/2003 for >24 hours were included in the study. The ICU database was queried through SQL Scripts and Java programs; missing values were averaged. Regression analysis, the Hosmer-Lemeshow (H-L) goodness-of-fit test, and area under receiver operating characteristic (AUROC) curves were performed; SPSS version 11 for Mac was used for the analysis.
Results: Among the 2,347 patients included in the study, there were 58.4% males and 41.6% females,
mean age 58.2 SD ± 14.7, range 18 to 97 years-old. The mean length of stay in ICU was 3.7 days SD 7.4 days, and in hospital 14.2 SD 16.4 days. The range M-SOFA was 0-12, and the mean 1.74, SD ±1.89. The AUROC was 0.71 (CI 0.67-0.77), and the H-L goodness-of-fit test was 0.86. The hospital mortality rate was 5.4 %.
Conclusion: The M-SOFA scoring system appears to be an adequate tool for assessment of severity of
illness in this cohort, and it has good discrimination and excellent calibration in this group. We found that the discriminative power to predict mortality of M-SOFA was similar to the results previously reported using other prognostic scores in cancer patients. M-SOFA needs to be validated.

Lidocaine But Not Amiodarone Improves Electrophysiologic Recovery Of Ca 1 Pyramidal Cells From Rat Hippocampal Slices Following Hypoxia
Samrat H Worah MD*, Jean G Charchaflieh MD MPH, James E Cottrell MD, Ira S Kass PhD, Department
of Anesthesiology, SUNY Downstate Medical Center, Brooklyn, NY, United States
Background: Amiodarone is a Class III anti-arrhythmic agent, which is used clinically to treat atrial and ventricular tachyarrhythmias. Current ACLS guidelines recommend amiodarone (IIb) over lidocaine (indeterminate) in the algorithm for refractory ventricular fibrillation/pulseless ventricular tachycardia.1 Amiodarone is similar to lidocaine in its sodium channel blocking properties and hence, we expected it would demonstrate similar effects on rat hippocampal slices. We have examined the effect of lidocaine and amiodarone on the recovery of neuronal activity in the rat hippocampal neurons after hypoxia. Methods: Hippocampal slices from adult (105 - 120 days old) rats were superfused with artificial CSF equilibrated with 95% O2/5% CO2. The Schaffer collateral pathway was stimulated and the postsynaptic population spike was recorded from the CA 1 region.2,3 In the experimental groups, 3μM amiodarone or 10μM lidocaine, which are the maximum recommended therapeutic concentrations for each drug,4 were added 20 minutes prior to 3 minutes of hypoxia (95% N2/5% CO2) and were present until 10 minutes following the onset of reoxygenation. In the control group, no drug was added prior to the hypoxic insult. Results: The amiodarone group (n=7) showed a mean recovery of 28 ± 11% (±SEM), which was not significantly different from the control group (19 ± 8%, n=7). The lidocaine group (n=6) showed significantly better recovery (61 ± 11%), than either the control or the amiodarone groups (p<0.05). Conclusion: Amiodarone, at the maximally recommended therapeutic concentration, does not improve neuronal recovery following hypoxia in the rat hippocampal slice. Lidocaine improves recovery; thus amiodarone, despite its sodium channel blocking properties, may not be as beneficial during hypoxic neuronal injury. References: 1 Circul 2000;102(Suppl I):I-112 to I-128. 2 Jour of Physiol 1995;489.2:557-565. 3 Jour of Neurosur Anesth 2002;14(4):293-298. 4 Goodman & Gilman’s Pharm Bas of Therap 1996;9e:860.
Financial support for the study received from National Institutes of Health and Brooklyn Anesthesia Research.

Automating and Simplifying a Validated Severity of Illness Scoring System, the M-SOFA
Nates JL, Shaw A, Wakefield C, Samuels J, Price K.
Background: Properly assessing patients’ severity of illness has never been as essential as in these times where patient care revolves around evidence-based medicine, improving performance, and healthcare efficiency, among others. Complicated or cumbersome scoring systems requiring dedicated personnel to collect data are one of the major obstacles to achieve this goal. Our objective was to develop a simple and automated score system.
Methods: We developed this score by modifying the validated Sequential Organ Failure Assessment (M-SOFA) score; and further automating the score including P/F ratio, number of vasopressors, and platelets, bilirubin, and creatinine levels. No points were given for GCS or hypotension not requiring vasopressors or mechanical ventilation. All adult patients admitted to the ICU between 9/1/2001 and 12/31/2003 for >24 hours were included in the study. The ICU database was queried through SQL Scripts and Java programs; missing values were averaged. The analysis included the Mann-Whitney U test and the odds ratio using SPSS version 11 for Mac.
Results: A total of 3,734 patients were studied, their numbers, patients’ mortality and significance, odds ratios and their and confidence intervals are shown in the table below.
Conclusion: Our results demonstrate that it is possible to develop an automated and simple score that can be used for assessment of severity of illness in patients. The M-SOFA score was a good indicator of severity of illness in this population, showing a significant correlation with mortality. This score not only saves time and money; it also has the potential to be used in any setting and in particular for any ICU outreach program.
M-SOFA Lived Died Total Mortality
% OR (0) 95% CI
low 95% CI
high 0 781 16 797 0.020 1 468 18 486 0.037 1.88 0.95 3.72 2 374 17 391 0.043 2.22 1.11 4.44 3 275 19 294 0.065 3.37 1.71 6.65 4 169 13 182 0.071 3.75 1.77 7.94 5 71 16 87 0.184 11.00 5.31 22.77 6 42 7 49 0.143 8.14 3.20 20.70 7 24 7 31 0.226 14.24 5.46 37.11 8 11 3 14 0.214 13.31 3.48 50.92 9 3 5 8 0.625 81.35 23.97 276.13
10 3 3 6 0.500 48.81 11.20 212.65 11 1 1 1.000 12 1 1 1.000

Recovery after Critical Illness Myopathy - Effects of Immobilization and Inflammation in Rats
Helming M, Fink H, Frick C, Kochs EF, Martyn JA, Blobner M
Klinik fuer Anaesthesiologie, Klinikum rechts der Isar der TU Muenchen, Munich, Germany
Introduction: Immobilization and inflammation are pathogenetic factors in critical illness polyneuromyopathy resulting in failure of weaning from the ventilator and therefore prolonged ICU stay. In a previous, latin-square designed study we demonstrated that immobilization and inflammation decrease muscle power and muscle mass significantly. In this study we focussed on the neuromuscular recovery up to 36 days after 12 days of immobilization and inflammation. Material and Methods: 258 male Sprague-Dawley rats underwent immobilization and inflammation for a period of 12 days. Rats were randomly assigned to have either one hind limb (operated leg) immobilized by pinning knee and ankle or sham immobilized. The respective other leg served as control (control leg). The groups were further divided to receive 3 i.v. injections of either heat-inactivated Corynebacterium parvum (C.p.) or saline on days -12, -8, and -4. On day 0 animals entered the rehabilitation phase: the immobilization pins were removed, sham operated animals underwent another sham-operation and no further bacterial injections were performed. Animals were then randomly allocated to groups of 0, 4, 12, or 36 days of rehabilitation. After the respective recovery period neuromuscular function was assessed by mechanomyography of the tibialis cranialis muscle after sciatic nerve stimulation. Results: 55 rats died after C.p.-injections, another 43 rats had to be excluded due to insufficient immobilization or due to intraoperative complications. 160 rats were included (n=10 each group). Data are expressed as mean ± standard deviation.

p<0.05; # p<0.05 vs. operated leg
Conclusion: Neuromuscular weakness after inflammation recovered within 4-12 days while weakness after immobilization was not completely recovered even after 36 days. The decreased tetanic forces during early recovery after immobilization cannot be explained solely by muscular atrophy since specific tetanic forces - as an weight independent measure - were also decreased at the beginning and during 4 to 12 days of recovery. Further studies are needed to determine whether this effect is pre- or postsynaptic and to identify the underlying mechanisms.

Cardiac Myocyte-Specific Endothelial Nitric Oxide Synthase (eNOS) Overexpression Rescues Myocardial and Neuronal Function after Cardiopulmonary Resuscitation in
eNOS-Deficient Mice.
Nishida T, Searles RJ, Shigematsu M, Buys E, Janssens S, Bloch KD, Ichinose F Department of Anesthesia and Critical Care at the Massachusetts General Hospital
Background: Cardiac arrest and subsequent cardiopulmonary resuscitation (CPR) is one of the most extreme examples of whole body ischemia and reperfusion injury (IR). Despite advances in resuscitation methods, including therapeutic hypothermia, CPR following cardiac arrest is all too frequently unsuccessful.1 While protective impact of endothelial nitric oxide synthase (eNOS) on IR have been reported,2 very little information is available regarding the role of eNOS in cardiac arrest and resuscitation. To elucidate the role of eNOS in the recovery from cardiac arrest and CPR, we studied the impact of varying levels of cardiac eNOS expression on neurological and myocardial function after cardiac arrest and CPR in wild-type C57BL/6 mice (WT, n=7), eNOS-deficient mice (eNOS-/-, n=8), and eNOS-/- mice with cardiomyocyte-restricted overexpression of eNOS (eNOS-/-TG, n=7). Methods: Mice were anesthetized, mechanically ventilated, and subjected to potassium-induced cardiac arrest for 9 min with mild hypothermia (~30°C) whereupon CPR was attempted with chest compression and mechanical ventilation, as previously described.3 Mice were weaned from mechanical ventilation 2h after CPR and allowed to recover. Cardiac function was examined with a high fidelity pressure-volume catheter (SPR-839, Millar Instruments) 18h after CPR in anesthetized mice and compared with mice of that were not subjected to cardiac arrest (n=4 for each genotype). Neurological function was assessed by a neurological function scoring system (walking, corneal reflex, reflex to painful stimuli, respiration, and general appearance). To explore the mechanisms responsible for cardiac dysfunction after cardiac arrest and CPR, xanthine oxidase (XO) enzyme activity was examined in cardiac tissue homogenates at baseline and after CPR by measuring xanthine-stimulated uric acid production. Results: Pre-arrest myocardial function was similar between genotypes except that LV end-systolic pressure was higher in eNOS-/- and eNOS-/-TG than in WT. 18h after CPR, ejection fraction (EF) and maximal rate of pressure rise (dP/dtmax) decreased markedly in eNOS-/- but not in WT and eNOS-/-TG (Table). Load-independent measures of LV contractile function including preload-recruitable stroke work (PRSW) and end-systolic elastance (Ees) were markedly impaired in eNOS-/- but not in WT and eNOS-/-TG. Neurological function score was lower in NOS3-/- compared to WT and eNOS-/-TG. XO enzyme activity was markedly greater in cardiac tissue extracts of eNOS-/- compared to that of WT and eNOS-/-TG after CPR (Table). While the rate of successful restoration of spontaneous circulation was similar between the genotypes, survival rate at 18h after CPR tended to be less in eNOS-/- compared to WT and eNOS-/-TG. Conclusions: These results demonstrate that cardiac-specific eNOS overexpression rescues myocardial and neuronal function after cardiopulmonary resuscitation in eNOS-deficient mice. Protective effects of eNOS overexpression on cardiac function may be attributed to attenuated XO activation after cardiac arrest and CPR. Our observations suggest that enhancement of cardiac eNOS activity and/or inhibition of cardiac XO activation may improve outcome after cardiac arrest and CPR. Table: Myocardial and neurological function at baseline and 18h after CPR EF
(%) dP/dtmax
(mmHg/s) PRSW
(mmHg) Ees
(mmHg/μl) Neurological
score XO activity
(mU/g protein) WT 35±2 15124±1087 113±13 11±2 10 13±3 eNOS-/- 35±3 16006±966 124±14 15±2 10 29±2 eNOS-/-TG 40±4 15710±1473 132±27 11±4 10 11±5 WTCPR 37±4 14016±1953 104±11* 14±7 6.4±1.5 43±3 eNOS-/-CPR 23±5*# 5770±2033*# 52±18*# 5±3*# 3.0±0.6# 102±30*# eNOS-/-TGCPR 36±2 13552±1480 189±11 16±6 7.6±1.5 30±12
Mean±SEM. *P<0.05 vs control. #P<0.05 vs WTCPR and eNOS-/-TGCPR.

References
1. The Hypothermia after Cardiac Arrest Study Group: Mild Therapeutic Hypothermia to Improve the Neurologic Outcome after Cardiac Arrest. The New England Journal of Medicine 2002; 346: 549-56
2. Scherrer-Crosbie M, Ullrich R, Bloch KD, Nakajima H, Nasseri B, Aretz HT, Lindsey ML, Vancon AC, Huang PL, Lee RT, Zapol WM, Picard MH: Endothelial nitric oxide synthase limits left ventricular remodeling after myocardial infarction in mice. Circulation 2001; 104: 1286-91
3. Abella BS, Zhao D, Alvarado J, Hamann K, Vanden Hoek TL, Becker LB: Intra-arrest cooling improves outcomes in a murine cardiac arrest model. Circulation 2004; 109: 2786-91

How to Make a Good Receptor Misbehave: Disrupting the ß2 Adrenergic Receptor PDZ Binding Motif Causes the �2 Receptor to Signal like a ß1 Receptor In Vivo
Wong J, Chen C, Namath A, Patterson M, Fung E, Pearl N, Agrawal R, Patterson AJ
Department of Anesthesia, Stanford University School of Medicine; Stanford, CA Background: ß1 adrenergic receptors (ß 1ARs) and ß 2 adrenergic receptors (ß 2ARs) mediate the primary effects of catecholamines in mammalian heart. Acute activation of both receptor subtypes contributes to enhanced inotropic performance. Continuous activation of ß 1ARs, however, is toxic to the myocardium and contributes to the development and progression of heart failure. In contrast, continuous ß 2AR activation has been shown to protect the heart during prolonged ß 1AR stimulation.1 Continuous selective ß 2AR activation could serve as a means of enhancing cardiac inotropic performance in failing hearts without causing myocyte toxicity. Unfortunately, selective ß 2AR agonists are not available for clinical use because the ß 1AR and ß 2AR agonist binding sites are so similar. A better understanding of the intracellular signaling differences that distinguish these two receptor subtypes could lead to more effective therapeutic agents. ß 1ARs and ß 2ARs contain unique PDZ binding motifs that mediate their interactions with cytosolic scaffolding proteins after agonist-induced receptor internalization. In vitro studies suggest that disruption of the ß 2AR PDZ binding motif causes it to acquire signaling properties characteristic of the ß 1AR.2 Hypothesis: We hypothesized that ß 2AR PDZ binding motif disruption would cause ß 2ARs to behave like additional ß 1AR in vivo. We predicted that after catecholamine infusion, mice with disruption of the ß 2PDZ binding motif (ß 2PDZ mice) would demonstrate a cardiac gene expression profile consistent with continuous ß 1AR stimulation without ß 2AR-mediated protection. We predicted that the gene expression changes would include down-regulation of the ß 1AR as well as up-regulation of molecules associated with cardiac remodeling. Methods: We evaluated cardiac gene expression in 8 to 10 week-old male ß 2PDZ, ß 2AR knockout (ß 2KO), and wild type (WT) mice at baseline and after 14 days of isoproterenol infusion (continuous ß AR stimulation). We assessed cardiac gene expression using Affymetrix 430A© gene arrays. We compared gene expression profiles using GeneSpring 7.2® software. Results: ß 2PDZ and ß 2KO mice down-regulated ß 1AR gene expression after isoproterenol infusion (p=0.04 and p=0.02, t-tests). ß 2KO mice (but not the ß 2PDZ animals) attempted to up-regulate �2AR expression after isoproterenol infusion (by increasing expression of the mutated ß 2AR gene fragment)(p=0.01, t-test). ß 2PDZ and ß 2KO mice significantly increased expression of proteins associated with cardiac remodeling, such as FHL1 and type III collagen (p=0.005 and p=0.04 for ß 2PDZ; p<0.0001 and p<0.0001 for ß 2KO, t-tests) after isoproterenol infusion. Conclusions: Our cardiac gene expression data are consistent with the hypothesis that disruption of the ß 2AR PDZ binding motif causes the ß 2AR to behave like a ß 1AR in vivo. However, the data also suggest that the disruption does not entirely eliminate the effects of ß 2AR stimulation. For instance, the ß 2PDZ mice demonstrated no evidence of attempted ß 2AR up-regulation, which would be expected in the complete absence of ß 2AR signaling. The degree to which protective effects of ß 2AR stimulation (such as activation of anti-apoptotic pathways) were preserved in the ß 2PDZ mice is being evaluated. 1 Patterson AJ, Zhu W, Chow A et al. Crit Care Med 32:1041-1048, 2004. 2 Xiang Y and Kobilka B. PNAS 100(19):10776-10781, 2003.

Pharmacokinetic Considerations during Extracorporeal Membrane Oxygenation - Results from an Ex Vivo Simulation
Nilesh M. Mehta, David R. Halwick, Brenda L. Dodson, John E. Thompson & John H. Arnold Division of Critical Care Medicine, Department of Anesthesia, Children’s Hospital, Boston MA
BACKGROUND: Despite the widespread use of extracorporeal membrane oxygenation (ECMO), relatively little published data are available regarding the pharmacokinetic (PK) profiles of drugs routinely administered during this therapy. The extent of drug adherence to the circuit components and the oxygenator membrane influences its PK and this information may have important clinical implications. OBJECTIVE: To estimate the amount of drug lost (due to adherence to circuit components) during a 24-hour ex vivo ECMO simulation. We examined twelve drugs (routinely used during ECMO therapy), viz., sedatives (morphine, fentanyl), vasoactive drugs (epinephrine, dopamine), antimicrobials (ampicillin, vancomycin, cefazolin and voriconazole), anti-convulsants (fosphenytoin, phenobarbital), heparin and hydrocortisone. METHODS: Simulated closed-loop ECMO circuits were prepared in the laboratory according to our unit policy using custom neonatal tubing and a 1.5 m2 silicone membrane oxygenator (Medtronic Inc., MN, USA). Each circuit was first primed with carbon dioxide, evacuated and then de-bubbled. The circuits were prepared such that the patient ends of the arterial and venous cannulae were connected to a reservoir bag. This closed-loop design allowed continuous flow of the priming fluid around the circuit. For Phase I experiments (n=3), circuits were primed with a crystalloid solution. For Phase II experiments (n=2), blood-primed circuits were prepared, using banked human blood. Baseline drug concentrations were obtained (P0) after administering a one time dose into the priming solution. A simultaneous sample (P4) was set aside for 24 hours and tested for stability of drugs. The primed circuits were set to run for 24 hours. Samples of circuit fluid were obtained for measurement of drug concentrations at 30 minutes (P1), 3 hours (P2) and 24 hours (P3). RESULTS: Cumulative decreases in drug levels are shown in Tables 1 and 2.
TABLE 1
Drugs in crystalloid-
primed circuit AMPI
CILL
IN
CEFA
ZOLI
N
VANC
OMYC
IN
DOPA
MINE
EPIN
EPHR
INE
PHEN
OBAR
BITA
L
FOSP
HENY
TOIN
HYDR
OCOR
TISO
NE
HEPA
RIN
MORP
HINE
FENT
ANYL
(T0 – T1/2h) 30 min 16.6
% 20.7 % -- 10.5
% 16.7 % 2.6 % 18.2
% 20.9 % 9.6 % 0.5 % 4.2%
(T0 – T3h) 3 hrs 60.2
% 20.3 % 2.4 % 53.4
% 23.7 % 3.4 % 16.8
% 19 % 27.7 % 0.3 % 78%
(T0 – T24h) 24 hrs 71.8
% 21.6 % 3.2 % NA 96.7
% 4.1 % 17.6 %
24.2 %
39.8 %
17.5 % 87%
Degradation 24 hrs NA 21.9
% 0 NA 88.6 % 0 15.6
% 9.7 % 21.9 %
10.1 % 23%

TABLE 2
Drugs in blood-primed
circuit AMPI
CILL
IN
CEFA
ZOLI
N
VORI
CONA
ZOLE
EPIN
EPHR
INE
PHEN
OBAR
BITA
L
FOSP
HENY
TOIN
HEPA
RIN
MORP
HINE
FENT
ANYL
(T0 – T1/2h) 30 min 0 % 28% 35% 0 % 0 % 0% 0% 5.5% 0 %
(T0 – T3h) 3 hrs 0 % 24 % 60 % 7.8 % 0 % 4.6 % 0% 10.3
% 1.6%
(T0 – T24h) 24 hrs 15% 21 % 70 % 13 % 0% 31.3
% 53% na 100%
Degradation 24 hrs 40% 29 % 14.8% 0 % 7% 33% 10 % 0% 0%
At the end of 24 hours in the crystalloid-primed circuit, 71.8% of ampicillin, 96.7% of epinephrine, 17.6% of fosphenytoin, 39.8% of heparin, 17.5% of morphine and 17.5% of fentanyl was lost. At the end of 24 hours in the blood-primed extracorporeal circuit, 15% of ampicillin, 21% of cefazolin, 70% of voriconazole, 30% of fosphenytoin, 49% of heparin and 100% of fentanyl was lost. Phenobarbital and vancomycin activity remained unchanged during these experiments. The extent of drug loss seemed to directly correlate with their octanol-water partition coefficient. CONCLUSIONS: Our ex vivo study demonstrates exponential loss of several drugs commonly used during ECMO therapy, such as fentanyl, fosphenytoin, voriconazole and heparin. The extent of ex vivo loss of these drugs may have important clinical implications for patient outcomes and safety. Future clinical studies examining the disposition and levels of these drugs in patients on ECMO therapy are desirable. *The study was funded by the CHMC Anesthesia Foundation Inc.

Individual Clinical Productivity in an Academic Critical Care Department Joseph L. Nates MD FCCM, Karen Chen MD, Connor Burdine MBA, Natarajan Aravindan MSc MPhil PhD,
Kristen Price MD Department of Critical Care, The University of Texas M.D. Anderson Cancer Center, Houston, TX, USA
Background: Measurements of individual clinical productivity for anesthesiologists has been suggested recently. A measure called normalized clinical days per year (nCD/yr) was found to be the most useful measure in an academic anesthesiology department; no data is available for intensivists (1). We investigated the applicability of the measurements suggested by these authors in an academic critical care department, and compared it to a modified nCD/yr (MnCD/year) as an alternative measurement to evaluate full time equivalence (FTE).
Methods: Clinical activities of faculty members of our critical care department were tracked for a 12 month
period. The measurements included clinical days worked including weekends, nights, home-calls, FTE recognized by the department administration. MnCD/year and nCD/yr were calculated and then compared by FTE. Work between 6 p.m. and 7 a.m. was given a 20% extra value, and 24-hours in-house calls were given an extra 100% value. Seven night home-calls were considered equivalent to 1 day of clinical work. Any faculty member with less than 1 FTE was excluded from the calculations of clinical time. Two-way ANOVA and t-test were used for statistical analysis.
Results: Sixteen attendings provided clinical services during the study period, but only 6 faculty members
were 1 FTE, while 10 were less than 0.5 FTE or were in the department less than 6 months. Only 1 FTE faculty fully participated in all the clinical (e.g. night or weekend calls, evenings cover) and administrative (e.g. protocol development, performance improvement, committees) workload of the department. A statistically significant (P<0.002) difference was observed between the FTE with the MnCD/year (mean, 1.135 SD +0.081), and the nCD/year (mean, 0.998 SD +0.088). There was a 14% average difference in clinical time between groups, ranging from 5 to 18%.
Conclusions: The nCD/yr underestimated clinical but not the administrative workload of critical care faculty.
The MnCD/year was a better measure of clinical activity in the critical care setting. The results of this study could be used for benchmark in academic critical care departments. References: 1. Abouleish A et al. Anesthesiol 2000; 93:1509-16.
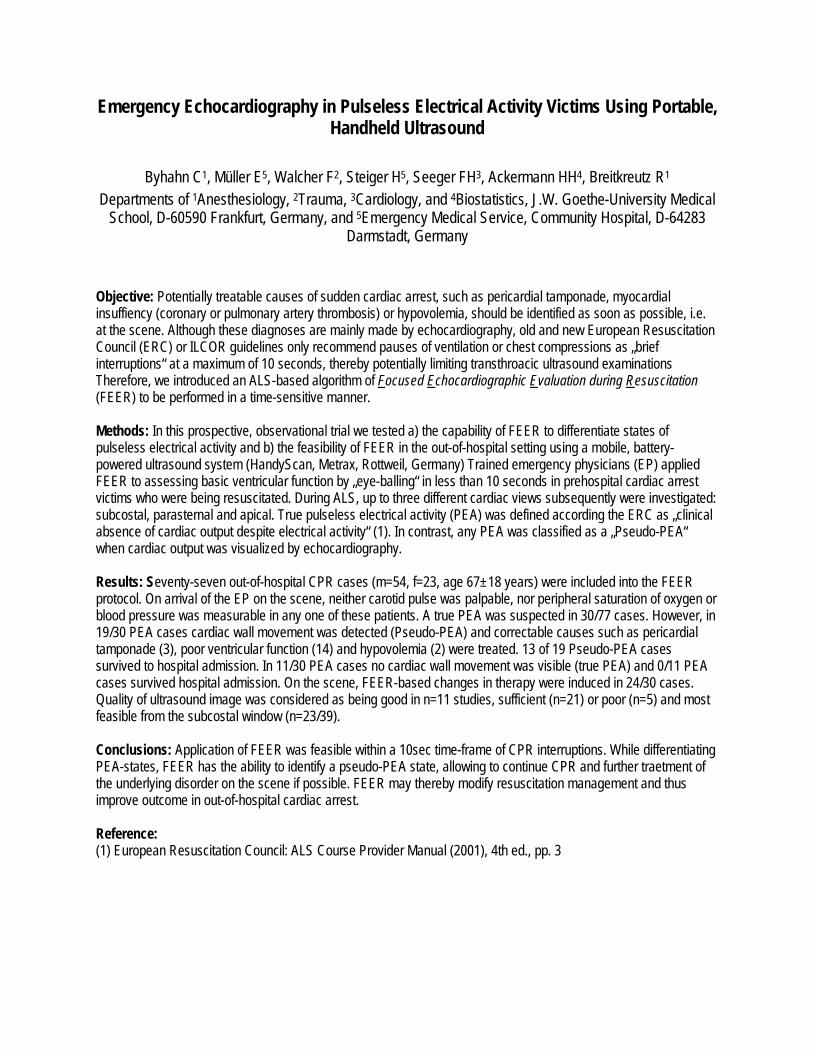
Emergency Echocardiography in Pulseless Electrical Activity Victims Using Portable, Handheld Ultrasound
Byhahn C1, Müller E5, Walcher F2, Steiger H5, Seeger FH3, Ackermann HH4, Breitkreutz R1
Departments of 1Anesthesiology, 2Trauma, 3Cardiology, and 4Biostatistics, J.W. Goethe-University Medical School, D-60590 Frankfurt, Germany, and 5Emergency Medical Service, Community Hospital, D-64283
Darmstadt, Germany
Objective: Potentially treatable causes of sudden cardiac arrest, such as pericardial tamponade, myocardial insuffiency (coronary or pulmonary artery thrombosis) or hypovolemia, should be identified as soon as possible, i.e. at the scene. Although these diagnoses are mainly made by echocardiography, old and new European Resuscitation Council (ERC) or ILCOR guidelines only recommend pauses of ventilation or chest compressions as „brief interruptions“ at a maximum of 10 seconds, thereby potentially limiting transthroacic ultrasound examinations Therefore, we introduced an ALS-based algorithm of Focused Echocardiographic Evaluation during Resuscitation (FEER) to be performed in a time-sensitive manner. Methods: In this prospective, observational trial we tested a) the capability of FEER to differentiate states of pulseless electrical activity and b) the feasibility of FEER in the out-of-hospital setting using a mobile, battery-powered ultrasound system (HandyScan, Metrax, Rottweil, Germany) Trained emergency physicians (EP) applied FEER to assessing basic ventricular function by „eye-balling“ in less than 10 seconds in prehospital cardiac arrest victims who were being resuscitated. During ALS, up to three different cardiac views subsequently were investigated: subcostal, parasternal and apical. True pulseless electrical activity (PEA) was defined according the ERC as „clinical absence of cardiac output despite electrical activity“ (1). In contrast, any PEA was classified as a „Pseudo-PEA“ when cardiac output was visualized by echocardiography. Results: Seventy-seven out-of-hospital CPR cases (m=54, f=23, age 67±18 years) were included into the FEER protocol. On arrival of the EP on the scene, neither carotid pulse was palpable, nor peripheral saturation of oxygen or blood pressure was measurable in any one of these patients. A true PEA was suspected in 30/77 cases. However, in 19/30 PEA cases cardiac wall movement was detected (Pseudo-PEA) and correctable causes such as pericardial tamponade (3), poor ventricular function (14) and hypovolemia (2) were treated. 13 of 19 Pseudo-PEA cases survived to hospital admission. In 11/30 PEA cases no cardiac wall movement was visible (true PEA) and 0/11 PEA cases survived hospital admission. On the scene, FEER-based changes in therapy were induced in 24/30 cases. Quality of ultrasound image was considered as being good in n=11 studies, sufficient (n=21) or poor (n=5) and most feasible from the subcostal window (n=23/39). Conclusions: Application of FEER was feasible within a 10sec time-frame of CPR interruptions. While differentiating PEA-states, FEER has the ability to identify a pseudo-PEA state, allowing to continue CPR and further traetment of the underlying disorder on the scene if possible. FEER may thereby modify resuscitation management and thus improve outcome in out-of-hospital cardiac arrest. Reference: (1) European Resuscitation Council: ALS Course Provider Manual (2001), 4th ed., pp. 3

Supplemental Endotracheal Jet Ventilation in Spontaneously Breathing, Critically Ill Patients
Bingold T, Kloesel S, Wullstein C*, Wissing H, Bremerich DH, Scheller B, Byhahn C
Departments of Anesthesiology and *Gerneral Surgery, J.W. Goethe-University Medical School, D-60590 Frankfurt, Germany
Objective: Patients on intensive care (ICU) are at risk of respiratory failure after major abdominal or thoracic surgery. Pulmonary atelectasis, edema, pneumonia and systemic inflammation may deteriorate respiratory function to a level that requires ventilatory support. Non-invasive ventilation (NIV; i.e., continuous positive airway pressure (CPAP) via face mask) is often effective to stabilize respiratory function and to avoid endotracheal re-intubation. However, there are various contraindications to NIV, such as recent esophageal anastomosis or anastomotic leakage after esophageal surgery. We report on two patients with contraindications to NIV and endotracheal jet ventilation applied instead. Case 1: A 76 years old patient was readmitted to the ICU in respiratory failure due to tracheo-esophageal fistula on day 8 after esophageal surgery for malignoma. A 4cm long defect of the posterior tracheal wall was treated with an 8cm long tracheal stent. The stent was placed under general anesthesia using jet ventilation. Postoperative respiratory support was provided through a size 5 laryngeal mask airway (LMA). On day 5 after tracheal stenting, pharyngeal ulcerations und bleeding occurred due to the LMA. The LMA was removed in the sedated and, with proportional pressure support, spontaneously breathing patient. Because CPAP via face mask was contraindicated, a jet catheter was bronchoscopically placed in the trachea with its tip positioned inside the tracheal stent. Spontaneous breathing was supported for 10 days with a continuous jet stream (80% of oxygen; frequency: 150/min; pressure: 1.5bar), resulting in appropriate patient’s oxygenation and CO2 elimination. Unfortunately, the patient died in the course of his ICU stay in septic shock. Case 2: A 63 years old patient was uneventfully extubated on postoperative day 1 after esophageal resection and cervical anastomosis. Because the nasogastric tube dislocated due to patient’s gagging and endoscopic reinsertion was considered contraindicated, no mask CPAP could be applied when the respiratory function deteriorated on postoperative day 2 due to early onset pneumonia. Again, a nasotracheal jet catheter was placed under flexible fiberoptic guidance, and the fully awake, non- sedated and mobilized patient received supplemental jet ventilation with 60% of oxygen, a frequency of 170/min, and a pressure of 1.5bar. Daily flexible bronchoscopy was required for five days to remove bronchial secretions. Jet ventilation was continuously applied for 12 days. The patient was transferred to a general ward on postoperative day 16 in good condition. Discussion: Both cases show that supplemental jet ventilation proved effective in managing respiratory failure in spontaneously breathing patients with contraindications to NIV. In case 1, no endotracheal tube could have been placed at all because the 8 cm long stent was too close to both, the carina and the larynx. The cuff of the endotracheal tube would have been inflated within the stent, resulting in potential life- threatening stent damage. An LMA could not be used any longer due to pharyngeal ulcerations and consecutive bleeding into the airway. In the second patient, endotracheal re-intubation was the only

alternative to the regimen applied. The nasotracheal jet catheter was well tolerated without any sedative or analgesic requirements, resulting in a cooperative, alert and satisfied patient who was mobilized within the room. Based on our data, supplemental tracheal jet ventilation should therefore be taken into consideration in patients with respiratory failure and contraindications to NIV.
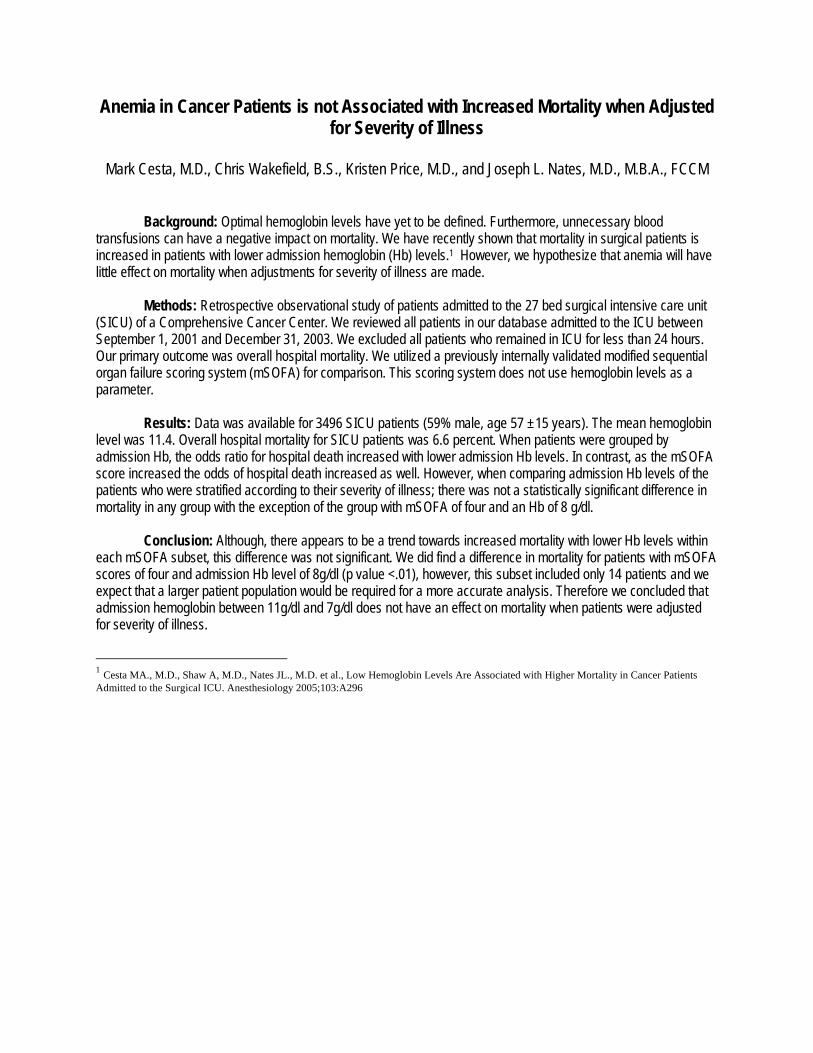
Anemia in Cancer Patients is not Associated with Increased Mortality when Adjusted for Severity of Illness
Mark Cesta, M.D., Chris Wakefield, B.S., Kristen Price, M.D., and Joseph L. Nates, M.D., M.B.A., FCCM
Background: Optimal hemoglobin levels have yet to be defined. Furthermore, unnecessary blood transfusions can have a negative impact on mortality. We have recently shown that mortality in surgical patients is increased in patients with lower admission hemoglobin (Hb) levels.1 However, we hypothesize that anemia will have little effect on mortality when adjustments for severity of illness are made.
Methods: Retrospective observational study of patients admitted to the 27 bed surgical intensive care unit
(SICU) of a Comprehensive Cancer Center. We reviewed all patients in our database admitted to the ICU between September 1, 2001 and December 31, 2003. We excluded all patients who remained in ICU for less than 24 hours. Our primary outcome was overall hospital mortality. We utilized a previously internally validated modified sequential organ failure scoring system (mSOFA) for comparison. This scoring system does not use hemoglobin levels as a parameter.
Results: Data was available for 3496 SICU patients (59% male, age 57 ±15 years). The mean hemoglobin
level was 11.4. Overall hospital mortality for SICU patients was 6.6 percent. When patients were grouped by admission Hb, the odds ratio for hospital death increased with lower admission Hb levels. In contrast, as the mSOFA score increased the odds of hospital death increased as well. However, when comparing admission Hb levels of the patients who were stratified according to their severity of illness; there was not a statistically significant difference in mortality in any group with the exception of the group with mSOFA of four and an Hb of 8 g/dl.
Conclusion: Although, there appears to be a trend towards increased mortality with lower Hb levels within
each mSOFA subset, this difference was not significant. We did find a difference in mortality for patients with mSOFA scores of four and admission Hb level of 8g/dl (p value <.01), however, this subset included only 14 patients and we expect that a larger patient population would be required for a more accurate analysis. Therefore we concluded that admission hemoglobin between 11g/dl and 7g/dl does not have an effect on mortality when patients were adjusted for severity of illness. 1 Cesta MA., M.D., Shaw A, M.D., Nates JL., M.D. et al., Low Hemoglobin Levels Are Associated with Higher Mortality in Cancer Patients Admitted to the Surgical ICU. Anesthesiology 2005;103:A296

Effects of Inhaled Nitric Oxide on Human Orthotopic Liver Transplantation JH Crawford, X Teng, TS Isbell, BK Chacko, Y Liu, P Chumley, N. Jahla, AB Smith, L Frenette, DW Wilhite,
JS Bynon, DE Eckhoff, RP Patel, JD Lang, Jr. Department of Anesthesiology, University of Alabama at Birmingham, Birmingham, AL
Hepatic ischemia-reperfusion (I-R) injury contributes significantly to organ dysfunction associated with liver transplantation. A key element in I-R injury is the acute inflammatory response that results after exposure of the reperfused tissue to leukocyte- derived reactive oxygen and nitrogen species. The acuity of this injury presents a short time course for intervention that must be addressed pre- or intra-operatively. To this end, previous studies have shown nitric oxide (NO) protects against hepatic I-R injury in animals by inhibiting inflammation, but little is known on its net effect in humans. Current technology allows for the administration NO via inhalation (iNO) and the biochemistry of NO would seem to limit its therapeutic potential to the pulmonary circulation. This reasoning has focused previous studies into the action of iNO on pulmonary pathophysiology. Experimentally however, iNO has been shown to replenish NO-mediated function in extra-pulmonary vascular beds during conditions characterized by loss of NO-bioavailability including I-R. Although the mechanisms by which iNO exerts effects outside the lung are not known these findings suggest the presence of a bioactive, circulating NO-derivative. Therefore, we hypothesized that iNO will decrease hepatic inflammation during liver transplantation. In this study, we report preliminary data from 14 patients undergoing liver transplantation who were randomized in an ongoing doubled-blinded placebo controlled clinical trial to receive either nitrogen (placebo) or iNO (80ppm) during liver transplantation. The inhaled gas was administered after the induction of anesthesia and maintained until 1 hr post reperfusion. Arterial and venous blood samples were collected for determination of plasma and red cell NO metabolites. Moreover, liver biopsies pre- and one hour post-reperfusion were collected to assess for tissue injury. Interim analysis demonstrated that iNO was devoid of toxicity and associated with increases in whole blood and plasma nitrite and nitrate. Interestingly, significant A-V nitrite gradients were observed that increased with iNO. S-nitrosothiol concentrations in the plasma did not change significantly, but increased slightly (<100nM) in the RBC. There was no significant difference in liver ischemic times between placebo and iNO groups. As expected, evaluation of liver histology indicated that reperfusion increased inflammation and leukocyte accumulation. However, histology assessed per Suzuki scoring demonstrated a significant reduction in injury with the administration of iNO (2.88 +/- 0.3 vs. 2 +/- 0 (mean +/- SEM) for placebo and iNO respectively). Of significant clinical and economic importance, patients receiving iNO were discharged earlier compared to placebo group (Figure 1). In summary, these preliminary analyses suggest that iNO represents a safe and viable therapy to limit hepatic I-R injury during transplantation. We hypothesize that iNO protects against liver I-R injury via increased circulating nitrite levels.
0
2
4
6
8
10
12
14
Placebo iNO (80ppm)
Hos
pita
l LO
S (d
ays)
Figure 1: Hospital length of stay (days) for patients treated with either placebo or iNO (80ppm) during liver transplantation. Data represent mean +/- sem. n=7 per group. *p=0.027 t-test vs. placebo.
*
0
2
4
6
8
10
12
14
Placebo iNO (80ppm)
Hos
pita
l LO
S (d
ays)
Figure 1: Hospital length of stay (days) for patients treated with either placebo or iNO (80ppm) during liver transplantation. Data represent mean +/- sem. n=7 per group. *p=0.027 t-test vs. placebo.
*

Effectiveness, Safety, and Outcomes of Intensive Insulin Therapy in Critically Ill Patients in a Regional Trauma Center
Deem S, Karir V, Daniel S, Yanez ND, Treggiari MM. Departments of Anesthesiology, Pharmacy, and
Biostatistics, Harborview Medical Center, University of Washington, Seattle, United States INTRODUCTION. Intensive insulin therapy with a goal of maintaining blood glucose < 110 mg/dL has been shown to decrease morbidity and mortality in critically ill patients. Based on these findings, sequential intensive insulin therapy protocols with progressive reduction in the blood glucose goal were implemented at Harborview Medical Center, a regional Level 1 trauma center in Seattle, WA. We investigated the effectiveness of these protocols on glucose control and effects on morbidity and mortality. METHODS. Cohort study of all patients admitted to all intensive care units (ICUs) at Harborview Medical Center from March 1, 2001 to February 28, 2005. Data were compared among three sequential time periods of implementation of the insulin protocols: 03/01/2001 to 02/28/2002 (target blood glucose goals 121-180 mg/dL, Cohort I), 03/01/2002 to 06/30/2003 (80-130 mg/dL, Cohort II), 07/01/2003 to 02/28/2005 (80-110 mg/dL, Cohort III). Multivariate analysis was used to determine independent associations between glucose control and outcomes. RESULTS. There were no differences in baseline characteristics with respect to age, gender, ethnicity, SAPS II score, body mass index, creatinine or requirement for mechanical ventilation. Data regarding implementation of the protocols, glycemic control, and outcomes for the respective cohorts appear in Table 1. Mean and maximum glucose level and severe hypoglycemia (glucose < 40 mg/dL) during the ICU stay were independent predictors of ICU mortality. Hospital mortality was predicted by these variables in addition to insulin dose and mild hypoglycemia (glucose < 65 mg/dL).
TABLE 1. Insulin administration, glycemic control, and outcome data Cohort I (n=2390) Cohort II (n=3582) Cohort III (n=4990)
Patients receiving insulin, n (%)
99 (4.14) 384 (10.72) ** 1106 (22.16)**
Daily insulin dose 68.5 +/- 82.9 53.9 +/- 58.5 ** 45.5 +/- 43.9** Mean blood glucose (pts on insulin)
207.8 +/-85.9 166.4+/- 51.9** 142.0 +/- 36.7**
Glucose <40mg/dL (on insulin), n (%)
2 (2.02) 5 (1.30) 19 (1.72)**
ICU mortality (adj. OR) 1.00 1.04 (0.81, 1.32) 1.03 (0.81, 1.30) Hospital mortality 1.00 1.11 (0.93, 1.32) 1.07 (0.91, 1.26) ICU LOS (adj. OR for median) 1.00 0.98 (0.94, 1.03) 0.96 (0.92, 0.99)*
Hospital LOS 1.00 0.94 (0.90, 0.98)** 0.91 (0.87, 9.95)** OR: Odds ratio. LOS: Length of stay. *p<0.05 **p<0.01. OR and ratio of medians are adjusted for age, SAPS II, and admitting service CONCLUSION. Intensive insulin therapy protocols substantially increased the number of patients receiving insulin and were effective in reducing average glycemic levels in ICU patients, although not to the levels specified by the protocols. There was a meaningful increase in the absolute number of episodes of severe hypoglycemia. Implementation of an intensive insulin therapy was associated with reduced ICU and hospital length of stay, but did not affect mortality.

Treatment of Delirium with Dexmedetomidine: A Case Series with Discussion
Field LC, Young CC, Patel K
Departments of Anesthesiology (LF, CF) and Surgery (KP), Divisions of Critical Care Medicine, Duke University Medical Center, Durham, NC
Delirium is a common problem, associated with significant morbidity and mortality, without a satisfactory treatment. Meta-analysis reveals a 36.8% incidence of post-operative delirium, and the incidence among mechanically ventilated intensive care unit patients has been found to be 70%-82%.1,2,3 In-hospital mortality rates of these patients are more than twice as high as for matched controls, and this relationship persist for at least one year.4,5 Haloperidol, the standard treatment, is only a grade C recommended treatment.6 We present 6 delirious patients refractory to typical treatments who were then treated successfully with dexmedetomidine infusions (0.4 – 0.7 mcg/kg/hr):
History Type of Delirium
Failed Antipsychotic Treatment
Treatment Regimen
Time to Response
60 y.o. BF multitrauma MVC sepsis/respiratory failure delirium prevents ventilator weaning
Hypoactive diagnosed ICU day 5
Haloperidol 20 mg iv q6h (x 2 days)
ICU day 7: Nightly dex-medetomidine infusion x2 + risperidone 1 mg q12h
12 hours (extubated <36 hours)
66 y.o. WM mandibular graft/trach for Ca sepsis/ARDS/flap revision sedation for agitation prevents ventilator weaning
Mixed diagnosed ICU day 29
Haloperidol 20 mg iv q6h (x 15 days)
ICU day 44: Nightly dex-medetomidine infusion x2 (Olanzapine 10 mg qd added after improvement)
12 hours (off vent <36 hours)
56 y.o. WF multitrauma MVC pneumonia extubated ICU day 26 despite ongoing delirium
Mixed diagnosed ICU day 17
Haloperidol 10 mg iv q6h + zaleplon 10 mg qhs (x 13 days)
ICU day 26: Nightly dex-medetomidine infusion x2 + risperidone 1 mg q12h
12 hours
48 y.o. WM abdominal aneurysm repair extubated ICU day 2 despite initial delirium symptoms
Hyperactive diagnosed ICU 2
Haloperidol 20 mg iv q6h (x 1 days)
ICU day 3: Single 24 hr dexmedetomidine infusion started at nighttime
24 hours
52 y.o. WM (alcoholic) reintubated postop from repair of duodenal ulcer extubated ICU day 4 reintubated ICU day 6
trachestomy ICU day 21 sedation for agitation prevents vent wean
Hyperactive diagnosed ICU day 4
Haloperidol 20 mg iv q6h (+ 20 mg boluses); Switch to respiridone 2 mg iv bid on ICU day 19 (x 21 days total)
ICU day 25: Nightly dex-medetomidine infusion x2
12 hours (off vent <36 hours)
23 y.o. WF abuse victim (poly-substance abuser) with facial & rib fractures/ pharyngeal tear trach ICU day 1 sedation for agitation prevents vent wean
Hyperactive diagnosed ICU day 4
Risperidone 1 mg q12h + haloperidol 5 mg prn (x 7 days)
ICU day 11: Nightly dex-medetomidine infusion started at nighttime + ziprasidone 20 mg q12h
12 hours (off vent < 12 hours)

Although there may be alternative reasons for the resolution of delirium in these patients (e.g. natural disease course or other change in antipsychotic regimen), the dramatic symptomatic improvement in a close temporal relationship to the start of the dexmedetomidine infusions makes the dexmedetomidine treatment the most compelling explanation. Dexmedetomidine may improve delirium by one or more mechanisms. Providing sedation and analgesia, dexmedetomidine allows for discontinuation of delirium-promoting benzodiazepines and opiates. Dexmedetomidine also allows restoration of a more normal (likely restorative) sleep pattern, which benzodiazepines and opiates disrupt.7 Dexmedetomidine augments the thalamic gating function, helping to prevent cortical sensory overload that may be contributing to delirium.7 Finally, dexmedetomidine may have specific anti-delirium receptor activity not yet described. After further study, dexmedetomidine may prove beneficial as a primary or adjunctive treatment of delirium. 1. Dyer CB, Ashton CM, Teasdale TA. Postoperative delirium: A review of 80 primary data-collection studies. Arch
Intern Med 1995;155:461-5. 2. McNicoll L, et al. L. Delirium in the intensive care unit: occurrence and clinical course in older patients. Journal of
the American Geriatrics Society 2003;51:591-8. 3. Milbrandt EB, et al. Costs associated with delirium in mechanically ventilated patients. Critical Care Medicine
2004;32:955-62. 4. Parikh, SS, Chung F. Postoperative delirium in the elderly. Anesth Analg 1995;80:1223-1232. 5. McCusker J et al. Delirium Predicts 12-Month Mortality. Arch Intern Med 2002;162:457-463 6. American Psychiatric Association. Practice guideline for the treatment of patients with delirium. Am J Psychiatry
1999;156:1S-20S. 7. Peruzzi WT. Sleep in the intensive care unit. Pharmacotherapy 2005;25:34S-9S.

Academic Year 2001-02 2002-03 2003-04 2004-05 2005 - 06 2006 - 07 Total Number
Applied % of Eligible 5
16%8
22%11
37%15
57%16
57% 15
48% 70
39%Enrolled % of Applicants 5
100%8
100%9
82%12
75%14
87.5% 12
80% 60
85.7%CC Boarded % of Participants 1
20%1
12%3
27%0
0%N/A
in training N/A
in training 5
8.3%On Staff at Site of Training % of Participants
1
20%
1
12%
3
33%
3
25%
N/A in training
N/A in training
8
13.3%On Staff at Acad emic Center% of Participants
3
60%
3
37%
5
55%
4
30%
N/A in training
N/A in training
15
25%
Advanced Critical Care Training of Senior (CA3) Anesthesia Residents through a Novel Elective Program: Looking to The Future of Anesthesia Critical Care Training -
The Peri-Operative Critical Care Concept
Frendl G, MD.PhD, Department of Anesthesia, Perioperative and Pain Medicine, Brigham and Women’s Hospital and Harvard
Medical School, Boston, MA
The Leapfrog Coalition, JCAHO and insurers are recognizing the role of critical care in delivering high quality, cost effective care for our aging population with increasingly complex medical issues (1). Critical care units covered by full time (24/7/365) intensivists deliver superior care (2). However, most hospitals are unable to meet these demands, due to the lack of enough critical care specialists. One challenge to our specialty is that close to 80% of critical care specialists come from pulmonary medicine background, with surgery and anesthesia contributing the rest. The demands for critical care expertise are increasing because of the high complexity anesthesia required to manage patients with multiple co-morbidities undergoing complex procedures (in both operating room and out-of-OR settings). The current sub-specialty allocation of our anesthesia training programs does not support meeting such demands. This structure also is likely to contribute to the continued low interest in critical care fellowships from the pool of anesthesia trainees. Therefore, in 2001 we designed a competitive, structured elective critical care course for advanced (CA3) anesthesia trainees. Our primary goal was to enhance the competence of interested anesthesia residents in the evidence-based peri-operative management of critical ill patients. Our secondary goal was to increase the interest in fellowship level critical care training of anesthesiologists. Our Critical Care Elective Program (called CA-3 SICU Elective) combines advanced level, structured teaching and self-directed learning. Structured components involve bedside learning via rounds, participation at daily (7 weekly) teaching conferences, at the weekly advanced fellows’ conference, and our CME review lectures. The participants become ATLS certified through a two-day course. Self-directed educational components include: literature reviews for bedside rounds, and a formal, one hour lecture given by the participants to staff, fellows and residents co-workers (also serves as their senior project). Daily reading and discussion time with fellows and staff completes this component. The program is competitive, and admission is based on the performance of the applicants during their mandatory critical care rotations. Results: Table I: Six-Year Summary of The SICU CA3 Elective Program Conclusion: The level of interest in advanced critical care has increased amongst anesthesia trainees (from 16% to around 50% over the past six years) reflecting their recognition of the need to institute a comprehensive peri-operative critical care training. The percentage of trainees obtaining board certification in critical care is significantly higher (8.3% [0-27%] in the four year period we were able to assess) from residents exposed to our program then of those in the population of all anesthesia trainees (4% nation-wide over the period of 12 years between 1990-2001 [1.4-8.1%]; ref.3). Programs like ours should be considered one model for enriching the critical care training of anesthesia residents. Similar programs could also be offered to non-anesthesia trainees (surgery, emergency medicine, OB-Gyn) to promote their peri-operative critical care training. Further testing is in progress to

determine how effective this form of training is in the retention of evidence-based critical care concepts for anesthesia trainees. References: 1. http://www.leapfroggroup.org/about_us/leapfrog-factsheet 2. Pronovost PJ, et al, JAMA, November 6, 2002, 288(17):2151 3. Fellowship and Residency Electronic Interactive Database, American Medical Association. <www.ama-assn.org/ama/pub/category>. Data reflect publication on January 18, 2003.

Head of Bed Angle in Endotracheally Intubated Critically Ill Patients Before and After Multidisciplinary Education
Brown DR, Roy TK, Keegan MT, and Whalen FX
Department of Anesthesiology, Mayo Clinic, Rochester, Minnesota, United States. Introduction: Head of the bed elevation (semirecumbency) greater than 30 degrees from horizontal in endotracheally intubated patients has been shown to improve patient outcomes (1) and is a quality metric for intensive care unit (ICU) performance (2). Others have shown that ICU clinicians overestimate the angle of semirecumbancy (3). The specific aim of this study was to characterize the head of bed angle in endotracheally intubated patients in a surgical ICU before and after multidisciplinary education. Methods: Following institutional approval, we studied all patients requiring invasive mechanical ventilation in a single surgical ICU during an eight week period. Without notifying care providers, devices that electronically recorded the angle of semirecumbancy every 30 seconds were mounted on each patient bed. Data were downloaded weekly for four weeks. Thereafter, education regarding the scientific rationale for semirecumbancy greater than 30 degrees was provided to all ICU nursing, respiratory therapy and physician staff. Head of bed position data were then recorded for an additional 4 week period. Results: Over 370,000 measurements were recorded in 11 episodes of mechanical ventilation before and 20 episodes after the staff education intervention. The ratio of observed to APACHE III predicted ICU mortality for the study period was 0.54. 18.6% and 21.3 % of the total measurements were >30 degrees in the pre- and post-intervention periods, respectively. The fraction of time spent above a given angle for both groups is presented in the figure below. Patients in the postintervention group had higher head of bed angles than those in the pre-intervention group. In the pre-intervention group, 50% of the time the head of the bed was at greater than 19 degrees; the corresponding angle in the post intervention group was 26 degrees. The area under the curve for fraction of time above angle as a function of angle was greater following education (0.57 compared to 0.72 pre-education). Discussion: This study confirms other observations that clinicians overestimate the angle of semirecumbancy. Educational efforts improved elevation of head of bed however in patients that are endotracheally intubated, semirecumbent positioning >30 degrees occurs only a fraction of time. These data raise concerns regarding assessing angle of semirecumbancy measured at a single time point as a quality metric. Figure
References: (1) Lancet 1999: 354: 1851-8 (2) http://www.ihi.org/IHI/Programs/Campaign/Campaign.htm (3) Intensive Care Med 2002: 28; 304-9

Association between Transfusion Requirement and Outcome Among Neurosurgical Patients
Jutla RK, Treggiari MM, Nester T, Yanez ND, Daniel S, Deem SA
Department of Anesthesiology, University of Washington, Seattle, Washington
Background and Purpose. Previous studies that used a strategy of restrictive red blood cell (RBC) transfusions in critically ill patients suggested improved patient outcomes. However, patients with neurosurgical conditions have not been adequately represented in those reports. The purpose of this study was to describe RBC transfusion practices and investigate the relationship between blood transfusion and outcomes among neurosurgical patients. Study Design and Methods. Data were collected on a cohort of patients admitted to a neurosurgical intensive care unit (ICU) at a level I trauma center. The exposure of interest was RBC transfusion at any time during the ICU stay. The primary outcomes were ICU and hospital mortality. In secondary analyses, we investigated associations between RBC transfusion and: length of ICU and hospital stay, duration of mechanical ventilation, and discharge Glasgow Coma Scale (GCS). For each outcome, we used regression analysis to investigate its association with RBC transfusion. We fit both unadjusted models and models which adjusted for potential confounders measured at ICU admission. Results. A total of 1088 patients met the inclusion criteria and were analyzed. Eighty-seven patients (8.0%) received RBCs during their ICU stay. Baseline characteristics that differed among patients transfused and not transfused were SAPS II, admission GCS, whether a patient received mechanical ventilation, admission hemoglobin and hematocrit levels, and gender. The average number of RBCs transfused was 5.6 ± 5.3 (SD) units, and the median time to first transfusion was 41 hours. The pre-transfusion hematocrit was 25.4 ± 3.8% and the pre-transfusion hemoglobin was 8.9 ± 1.4 g/dL. There were 11 (13%) reports of adverse reactions to the transfusions, which included fever, wheezing, rigors, and hives. The unadjusted OR of ICU mortality was 3.02 (95% CI: 1.71, 5.32, p<0.01), and the unadjusted OR for hospital mortality was 2.89 (95% CI: 1.81, 4.64, p<0.01). After adjusting for confounding variables, there was no association between RBC transfusion and ICU mortality (OR 1.17, 95% CI: 0.51, 2.66, p=0.71) or for hospital mortality (OR 0.93, 95% CI: 0.47, 1.82, p=0.83). The adjusted median discharge GCS was not significantly different between the two groups (p=0.61). However, the ratio of median length of ICU stay between transfused and not transfused patients differed significantly in adjusted analyses (2.33, 95% CI: 1.89, 2.89, p<0.01). The adjusted ratio of median length of hospital stay (1.56, 95% CI: 1.25, 1.95, p<0.01) and the duration of mechanical ventilation (1.48, 95% CI: 1.36, 1.63, p<0.01) differed significantly between the two groups. Conclusions. The threshold that triggers RBC transfusion is higher than expected according to evidence-based recommendations. The number of adverse events directly related to RBC transfusion is not negligible. Despite a lack of difference in mortality, RBC transfusion was independently associated with a substantial increase in length of ICU and hospital stay, and with longer duration of mechanical ventilation. These findings suggest that a randomized trial to evaluate the efficacy of RBC transfusion in this patient population is likely to be safe and would be warranted.

Oral Temperature Correlates Well with Brain Temperature Following Subarachnoid Hemorrhage
Keller D, Layon AJ, Caruso LJ
Depts. of Anesthesiology, Surgery & Medicine University of Florida Coll of Med Introduction: Hyperthermia following brain injury is associated with worsened outcome (1). Current technology allows direct monitoring of intraparenchymal temperature. This study was designed to compare brain temperature with oral or rectal temperature. Methods: Patients who suffered subarachnoid hemorrhage underwent placement of an intraparenchymal brain tissue oxygen and temperature monitor (Licox® monitor, Integra Lifesciences) as part of a research protocol following IRB approval. We retrospectively reviewed the brain temperature data and compared it to systemic temperature, measured by the oral, rectal, or axillary route. Data analysis used SPSS & Sigma Stat (SPSS for Windows version 13, 2004 & SPSS SigmaStat version 2.03, 1997). Significance was p < 0.05. Data were evaluated for normality, then the means were compared and a correlation analysis performed. Results: Nine patients were studied, with a total of 233 paired measurements. The data were not normal, so a Mann-Whitney Rank sum showed there was significant difference between brain and oral (p < 0.001) temperatures (Table). Despite this difference, oral and brain temperatures correlated well (r = 0.72, p = 0.01 Spearman’s Correlation), with the median brain slightly higher than the oral temperature (37.6 vs 37, Table & Figure). Conclusions: Oral temperature correlates well with brain temperature, with brain temperature approximately 0.6 degrees above oral temperature. Given the fairly consistent difference, oral temperature can be used to estimate brain temperature in patients with subarachnoid hemorrhage. Reference:
1. Stroke 1995;26:2040-43. N Median 25th% 75th% Brain 233 37.600 37.000 38.200 Systemic 233 37.000 36.400 37.600 Correlations
Correlation Coefficient r = 0.720 Sig. (2-tailed) . 0.01
Spearman's rho Brain vs Oral N 233 233
OralBrain
40
39
38
37
36
35
34
3535198

Computer Modeling of Glucose and Insulin Metabolism to Compare Insulin Infusion Algorithms for Glycemic Control in Critically Ill Patients
Simula DV and Roy TK
Department of Anesthesiology, Mayo Clinic, Rochester, MN 55905
Introduction: Improved outcomes have been demonstrated with tight short-term control of blood glucose utilizing intensive insulin therapy in critically ill patients [1]. Various intravenous insulin infusion algorithms have been proposed to specify adjustments in the insulin infusion rate based on serial measurements of blood glucose, but few objective comparisons have been made to evaluate their ability to achieve glycemic control. Hypothesis: Two insulin infusion algorithms used at our institution (a single column algorithm and a four column algorithm) were compared using a mathematical model. We hypothesized that the four column algorithm (with dynamic switching between columns) will be associated with more optimal glycemic control. Methods: A nonlinear time dependent mathematical model of glucose and insulin metabolism was developed and modified to allow for exogenous insulin and rescue glucose administration [2, 3]. The model was designed to account for variable delays in hepatic glucose production and pancreatic insulin secretion [4]. The ability of the two insulin infusion algorithms specified above to maintain tight glucose control was simulated in normal, Type 1 and Type 2 diabetic patients. All simulations were conducted with an initial glucose level of 250 mg/dl. Outcome measures calculated included time to target glucose level (150 mg/dL), percentage of time within range (80 to 150 mg/dL) over the first 24 hours, and mean insulin administered (units/hr). Results: Patients with Type 1 diabetes mellitus (DM) had a greater time to range and were more difficult to control with both algorithms. Glycemic control in patients with Type 2 DM was more easily attained due to the decreased insulin sensitivity but had an expectedly higher insulin requirement. During a simulated 24 hour period, the 4 column protocol provided slightly improved glycemic control in only the Type 1 DM group, with a 3.2% increase in the time spent within range (46 min) and a decrease in hypoglycemic time by 9% (120 min). This is likely due to the similarity in specified insulin infusion rates between the one and four column algorithms in the range of glucose values that occurred during the simulation.
Normal Type 1 DM Type 2 DM 1 column 4 column 1 column 4 column 1 column 4 column
Mean glucose (mg/dL) 84 84 96 97 112 112 Time to range (hr) 0.69 0.69 1.53 1.53 2.05 2.05 % Time within range 79 79 60 62 91 91 % Time below range 18.6 18.6 34.1 31.4 0.0 0.0 Mean insulin requirement (units/hr)
0.04 0.04 0.42 0.44 0.82 0.82
Discussion: A number of algorithms for glycemic control are currently in use at institutions worldwide. The use of a mathematical model provides an objective tool to predict outcome measures between various insulin infusion algorithms prior to implementation. Further simulations and ongoing clinical investigations are being conducted to generate adaptive insulin infusion algorithms to further optimize glycemic control. References [1] Van den Berghe G et al: N Engl J Med 2001; 345:1359-1367.

[2] Khoo MCK: Physiological Control Systems, pp 55-58, 124-129; ©1999 IEEE Press, Piscataway NJ. [3] Pacini G et al: Comput Methods Programs Biomed 1986; 23:113-122. [4] Li J et al: Discrete Cont Dyn-B 2001; 1:103-124.

Comparison of Two External Controllers for Glycemic Control in Critically Ill Patients
Tuhin K. Roy, M.D., Ph.D., Nicolas W. Chbat, Ph.D., Dan R. Brown, M.D., Ph.D. Departments of Anesthesiology and Biomedical Engineering, Mayo Clinic, Rochester MN USA
Background: Improved outcomes have been demonstrated with tight short-term control of blood glucose in critically ill patients [1]. Conventional insulin infusion algorithms specify infusion rates dependent on the most recent blood glucose value, but external controllers are increasingly being used to improve glycemic control compared to conventional lookup tables. We hypothesize that an advanced algorithm incorporating PID control with an anti-windup scheme will be superior to an existing heuristic controller [2] in terms of time to target glucose level, percent of time spent within a target glucose range, and mean 24 hour glucose level. Methods: A validated mathematical model of glucose and insulin metabolism was modified to allow for exogenous insulin administration [3]. The model was used to evaluate a heuristic controller [2] and an advanced PID controller incorporating an anti-windup scheme in terms of glycemic control. The anti-windup scheme was included to incorporate the saturation characteristics of the insulin infusion pump. The two controllers were tested in terms of their ability to maintain tight glucose control by simulating their behavior in normal, Type 1 and Type 2 diabetes mellitus (DM) patients. Estimates for time to target glucose level (120 mg/dl), percentage of time within range (80 to 120 mg/dl) and mean glucose levels over the first 24 hours were obtained. Results: All simulations were conducted with an initial glucose level of 180 mg/dl. In all three cases (normal, Type 1 and Type 2 DM) both external controllers were able to control blood sugar without causing hypoglycemia. Although the performance of the two controllers was similar in normal patients, the advanced controller was superior in terms of achieving and maintaining glycemic control in Type 1 DM patients. In the case of Type 2 DM patients, the advanced PID controller achieved tighter glycemic control in the specified range, whereas the heuristic controller converged to a steady state value outside the range. Insulin Infusion AlgorithmPatient Type vs Performance
Time to Target
% Time in Range
Mean/Steady State Glucose (mg/dl)
Time to Target
% Time in Range
Mean/Steady State Glucose (mg/dl)
Normal 45.5 min 82.3% 82.9/81.0 46.4 min 78.8% 82.1/81.2Type 1 DM 108.0 min 12.9% 126.6/127.1 92.1 min 92.9% 101.9/99.1Type 2 DM -- -- 132.9/128.0 248.9 min 82.0% 119.6/112.0
Heuristic Controller Anti-Windup PID Controller
Table 1 – Performance characteristics of two external controllers in terms of glycemic control Conclusions: Compared to a heuristic controller, a more sophisticated external controller incorporating PID control with an anti-windup scheme was superior in terms of glycemic control. Further modifications of the controller incorporating multiple inputs and multiple outputs are in progress to further optimize glycemic control during the perioperative period. References [1] Van den Berghe G et al: N Engl J Med 2001; 345:1359-1367. [2] Bode BW et al: Endocrine Pract 2004; 10 (Suppl 2):71-80. [3] Roy TK et al: Anesthesiology 2004; 101:403A.

Computer-Guided Versus Standard Protocol For Insulin Administration in Diabetic Patients Undergoing Cardiac Surgery
Saager L, Collins G, Burnside B, Zhang L, Tymkew H, Finkel K, Jacobsohn E, Avidan M
Department of Anesthesiology, Washington University in St. Louis, St. Louis, United States
Introduction Patients with diabetes mellitus have increased morbidity and mortality following cardiac surgery1,2. Tight blood glucose control in patients with diabetes seems to improve outcome following myocardial infarction or cardiac surgery3,4. Established protocols aim for a blood glucose level between 80 and 150 mg/dl. One of the main concerns with tight glucose control is an increased frequency of hypoglycemic episodes. Usually the adjustment to insulin dosage is based only on single blood sugar readings. There is no attempt to incorporate a trend of blood sugar results, which can be used for mathematical modeling and for predicting the extent and rapidity with which blood sugar is likely to change. Our goal was to investigate if this approach might facilitate more accurate insulin administration and tighter glucose control. Methods After IRB approval and obtaining written informed consent 40 diabetic patients undergoing cardiac surgery with cardiopulmonary bypass were assigned to one of two groups (Computer and Standard). The Endotool Glucose Management System was used to guide Insulin dosage for the computer group, whereas insulin administration in the standard group followed the local ICU protocol. The desired range for blood glucose was set between 80 and 150 mg/dl. The study started with induction of anesthesia and continued until the patients were in the ICU for 12 hours. Results There were 118 blood glucose readings in the Computer group and 101 in the Standard group in the OR. There were 223 blood glucose readings in the Computer group and 220 in the Standard group in the ICU. There were no differences between groups in baseline characteristics. In the Computer group 49% of the blood glucose readings were in the desired range versus 27% in the Standard group (p=0.001). No reading below 50 mg/dl occurred. During the first 12 hours of ICU stay 84% of the readings in the Computer group were in the desired range versus 60% in the Standard group (p<0.0001). There was one blood glucose level of 48 mg/dl in the Computer group. Discussion Computer-guided insulin administration achieved tighter blood sugar control than a Standard protocol in diabetic patients undergoing cardiac surgery in both the intra-operative and in the early postoperative periods. However, the low proportion of blood sugar recordings within the desired range in both groups in the intra-operative period reflects the difficulty in achieving tight control in diabetic patients during heart surgery with cardiopulmonary bypass. This finding is consistent with other studies investigating blood glucose control in diabetic patients undergoing cardiac surgery. One hypoglycemic episode demonstrates the potential risk of attempting aggressive glucose control. This risk may be outweighed by the theoretical beneficial effects of tight blood glucose control. References 1) Ann Thorac Surg 2002; 74 (3): 712-19 2) J Am Coll Cardiol 2002; 40(3): 418-23 3) Eur Heart J 1996; 17(9): 1337-44 4) Circulation 2004; 109(12): 1497-502.

Management of Acute Gastrointestinal Bleeding at ICU without Transfusion
Aryeh Shander, M.D., FCCM, FCCP, 1, Sung Wook Sun, M.D., Ozlem Pala, M.D. and Mazyar Javidroozi, M.D.
Anesthesiology and Critical Care Medicine, Englewood Hospital and Medical Center, Englewood, New Jersey, United States
Bloodless Medicine & Surgery (BMS) program at EHMC attracts many patients seeking to be treated without receiving any blood products. We studied mortality & morbidity in 33 severe anemic BMS patients admitted to EHMC ICU with primary diagnosis of acute GI bleeding from Jan 95 to Dec 2004 after institutional review and approval. Participation in BMS program was voluntarily and based on personal/religious believes. The program provides a specific protocol to eliminate transfusion. Patients were compared with a randomly selected cohort of 33 age-matched non-BMS patients admitted to the same ICU with same diagnosis who received transfusion without restriction at Hemoglobin (Hb) below 7 g/dL. Pearson Chi-square, Fisher’s exact test, T test, Mann-Whitney U test & logistic regression were used. Mean age and APACHE II scores of BMS vs. non-BMS patients were 59.4 vs. 61.9 yrs. old (p=.551) and 15.5 vs. 16.4 (p=.521) respectively. Median (range) of first and lowest Hb of BMS vs. non-BMS patients were 5.5 (3-10.8) vs. 7.4 (5.3-10.4) and 4.9(.6-7.8) vs. 6.1(3.4-9) g/dL. Coagulopathy was detected in 30.3% of BMS vs. 66.7% of non-BMS patients (p=.003). There was no other statistically significant demographic/clinical difference among groups (except for BMS patients receiving more H2-blockers, Iron & Folate & less Vitamin K). Non-BMS cases received a median (range) of 5 (1-17) units of PRBC. Mortality rates were: ICU Hospital Discharge to 6th month Overall 6-month BMS pts. 5 1 1 7 Non-BMS pts. 5 0 1 6 P-value 1 1 1 .757 Observed complications were: Rebleeding CHF MI Infection Respiratory
failure Re-admission to ICU in 6 month
Overall complication
BMS pts. 5 3 4 11 4 7 15 Non-BMS pts. 12 5 2 10 11 5 17 P-value .049 .708 .672 .792 .04 .523 .622 While adjusted for underlying coagulopathy & differences in medications, there was no statistically significant difference in 6-month overall complication & mortality rates among two groups (OR=.245, 95%CI .042-1.422, p=.117 & OR=.714, 95%CI .063-8.096, p=.785 respectively). Transfusion is one of the major options in management of acute GI bleeding in severe anemic patients in ICU. However, our data shows that similar treatment outcomes are achievable without any transfusions. Given its costs & risks, it might be worthy exploring other options prior to ordering blood. We acknowledge the limited number of available cases in this study that warrants further studies.

Circadian Changes in ICU Glucose Levels with Tight Glycemic Control
Tung A, O’Connor MF Department of Anesthesia and Critical Care
University of Chicago
Introduction: Use of insulin infusions to rigorously maintain normal glucose levels (“tight contol”) improves outcomes in critically ill patients (1). Although studies finding benefit from “tight” glycemic control report a 3-fold increase in the incidence of hypoglycemia (1), none have examined when these episodes occur. We hypothesized that because of circadian variation in glucose homeostasis (2), hypo and hyperglycemic episodes would be more likely to occur at specific times of day even when a “tight” control protocol is used. Methods: After IRB approval, we retrospectively examined a database of all glucose measurements made in a cardiothoracic surgery Intensive Care Unit (ICU) over a 6 month period at an academic teaching hospital. In this ICU, a protocol to control hypoglycemia has been in place for 1 year, requiring insulin infusions, hourly glucose checks, and specifying a target glucose level <150 mg/dl. Data collected included blood glucose levels, insulin doses, times of day, and total number of patients. Individual glucose measurements were then grouped by time of day. Statistical analysis was performed using the chi-square statistic for frequency of hypo and hyperglycemic episodes. Results: 7744 glucose measurements were made in 256 patients over a 6 month period from August to December, 2005. The average reading was 153 ± 63 mg/dl. 103 episodes where the blood glucose level was <60 mg/dl (1.3%), and 542 episodes where the blood glucose level was >250 mg/dl (6.9%), were observed. When these data were segregated by time of day, 42% of the hypoglycemic episodes occurred between 12am and 6am, and 36% of the hyperglycemic episodes occurred between 12pm and 6pm (Figure 1; p<0.01). Overall, blood glucose levels followed a circadian pattern with the lowest average values between 4 and 5am and the highest between 11 and 12am (Figure 2). Conclusions: Protocols using insulin infusions to produce tight glycemic control are increasingly popular in the ICU (3). We report significant circadian variation in glucose levels using such a protocol, with clustering of hypoglycemic episodes at night, and hyperglycemic episodes during the afternoon. These data indicate that circadian variation may produce hypo or hyperglycemia in critically ill patients despite insulin infusions and hourly glucose monitoring. No published protocol currently accounts for time of day (3). Our data suggest that glycemic control could be improved, and the risk of hypoglycemia reduced, if protocols governing the titration of insulin infusions in critically ill patients account for circadian variation in glucose homeostasis. References: 1. N Engl J Med. 2001;345:1359-6. 2. Diabetes Res Clin Pract. 2004;66:237-44. 3. Crit Care 2006;10(1):R19

Fig. 1
Fig. 2
100
110
120
130
140
150
160
170
180
12am 1am
2am
3am
4am
5am
6am
7am
8am
9am
10am
11am
12pm 1p
m
2pm
3pm
4pm
5pm
6pm
7pm
8pm
9pm
10pm
11pm
Average Glucose Readings (mg/dl ± sterr)

The One Year Incidence of Myocardial Infarction in an Orthopedic Population
MK Urban MDPhD, K Jules-Elysee MD, C Loughlin PA, W Kelsey BA, E Flynn BA Dept of Anesthesiology, Hospital for Special Surgery, Weil Medical College of Cornell University,
New York, NY Introduction: The introduction of Troponin I (cTnI) analysis has markedly increased our ability to detect myocardial damage. Plasma elevations in cTnI are more specific for cardiac injury and a postoperative myocardial infarction (PMI) than creatinine kinase MB isoenzyme after orthopedic surgery. Using cTnI as a marker for myocardial damage, we prospectively studied all our patients at risk for a PMI for the following: 1. the incidence of PMI; 2. the clinical consequences of a PMI in relation to the level of cTnI release; and 3. six month follow-up as to their cardiac status. Methods: During a 12 month period, 758 patients (~7600 surgical cases) with risk factors for perioperative myocardial ischemia, new onset of a postoperative arrhythmias or postoperative symptoms of myocardial ischemia, were assessed for a PMI. Serum cTnI levels were assayed every 12 hours for 24hours or until the cTnI level fell below 0.4 ng/ml, and with daily ECGs. In those patients with cTnI levels ≥ 0.4ng/ml an echocardiogram (ECHO) was performed within 48 hours of the cTnI elevation (postoperative day 3 to 5). Patients were contacted six months after discharge for evidence of adverse cardiac events (death, unstable angina, myocardial infarction, coronary revascularization). Results: Using the ESC/ACC definition of acute myocardial damage (cTn≥0.4ng/ml), the incidence of a PMI in this orthopedic population was 0.6% of all surgical cases and 6.5% of those patients at risk for a cardiac event (1). The patients were elderly (74±11 years), 24% (12/49) had a positive preoperative stress test and most, 73% (36/49) had a hip arthroplasty, although these only represented 22% of the surgical cases. Postoperatively, of the patients with elevated cTnI levels 39% (19/49) had anginal symptoms, 41% (20/49) had ECG changes indicative of ischemia, 18% (9/49) had new regional wall motion abnormalities (RWMA) on ECHO. Mean peak cTnI postoperative levels for all 49 patients was 6.4 (range0.4-52), patients with cardiac complications (18/49) 9.2±10, significant postoperative cardiac events (6/49; transfer to CCU, angioplasty) 18.1±9, and patients free of postoperative cardiac complications or RWMAs (28/49) 2.7±1.6. Fourteen patients had post hospital discharge cardiac events, including five cardiac deaths with a mean peak cTnI level of 8.5±10. Conclusions: The incidence of PMI in this orthopedic population was low in comparison to the number of patients assessed for postoperative myocardial damage, but correlated with other reports with regard to the number of patients at risk for cardiac events. The magnitude of cTnI release positively correlated with the incidence of myocardial complications. Patients undergoing hip arthroplasty are at a higher risk for a PMI. Patients with a postoperative cTnI release are at risk for post hospital discharge cardiac morbidity. 1The Joint European Society of Cardiology/American College of Cardiology Committee. Myocardial infarction redefined. J Am Col Cardiology 2000;36:959-969.

An Open System for Development of Derived Physiologic Alarms
Blum JM, Gutierrez J, Rosenberg AL University of Michigan Department of Anesthesiology, Ann Arbor, MI USA
Automated physiologic alarms are available in most commercial physiologic monitors. The raw data displayed by these monitors is frequently contaminated by artifacts.1 Consequently, the alarms generated from these variables are frequently ignored. Previous literature has described proprietary alarm systems that greatly increase the specificity of alarms using retrospective datasets for analysis. Before advanced monitors can be studied, a system that enables the study of a variety of physiologic algorithms must be developed. We report initial results of an algorithm research system that is easily portable to any networked monitor system, can operate independent of an electronic medical record, and functions using pre-existing computing technologies. METHODS The University of Michigan Medical Center uses General Electric monitors in all of the intensive care units. These monitors pass data to a common network, similar to other monitor systems. We used a commonly available software package to process the physiologic data broadcast over the network. This package then logs the data to a SQL database in a standard format. The database is then queried every minute using an SQL procedure which is easily modified for algorithm research. After processing, all data for the last eight hours is stored to an alarm database. Data from the alarm system is easily displayed using a variety of technologies. For our research system we have developed a web based reporting system. Using Microsoft C# and standard HTML, we display current alarms using a color based system representing the status of the ICU. IRB approval was obtained and data was reviewed over a 28 day period to evaluate the sensitivity of the alarms generated by the system. RESULTS Since the implementation of the system, we have logged alarms based on the most available, clinically important physiologic variables such as systolic blood pressure, mean arterial pressure, cardiac index, and central venous pressures. The most recent version of our alarm algorithm was studied over 28 days and the results are shown in table 1.
Table 1: Results of Median Values Total Events % Of Events Total True % True Events SBP < 80 mmHg for more than 15 min. 327 32 247 76 SBP < 80 mmHg for more than 30 min. 282 28 240 85 CI < 1.8 40 4 38 95 CI < 2.0 8 1 7 88 CVP > 20 202 20 66 33 MAP < 50 mmHg for more than 15 min. 122 12 67 55 MAP < 50 mmHg for more than 30 min. 31 3 25 81 CONCLUSION We have developed an easily implemented computerized system to improve the specificity physiologic alarms. Alarms can be easily viewed using standard web technologies, and alarm data can be easily exchanged in a common format. This system can be implemented for any bedside monitor, does not require specialized electronic information systems and can be used for automated physiologic alarm research as well as clinically relevant alerts.

Improved rates of true positive clinical alarms is possible with relatively simple algorithms that reduce the 'noise' inherent to beside physiologic monitors. Balancing specificity and sensitivity requires further evaluation. REFERENCES 1. Imhoff M et al. Alarm Algorithms in Critical Care Monitoring Anesth Analg. 2006 May;102(5):1525-37

Negative Pressure Ventilation– Better Oxygenation and Less Lung Injury
FA Grasso, D Engelberts, V Peltekova, C McKerlie. S Jarvis, M Post & BP Kavanagh Lung Biology Program & Critical Care Medicine, Hospital for Sick Children
Introduction: Positive pressure (PPV) is by far the most common type of ventilation used for patients with respiratory failure. Comparisons of PPV vs. Negative Pressure Ventilation (NPV) have not reported differences in oxygenation or lung injury where VT and trans-pulmonary pressure are known. Contrasting NPV and PPV could help determine the roles of VT vs. pressure in causation of ventilator-induced lung injury. Our hypothesis was that because of global (i.e. pleural) rather than focal (i.e. airway) directed distension forces, NPV would result in less lung injury – especially in conducting airways. The rationale is to compare PPV and NPV in an in vivo model of ARDS. Methods: Following animal committee approval, 9 pairs of anesthetized, saline-lavaged rabbits were ventilated for 2.5 h. The first of each pair was ventilated with PPV, and the second with NPV. In all animals, VT was 12 mL/kg and PaCO2 was maintained at 35-45 mmHg by adjusting respiratory rate. NPV was administered using a ‘body box’ device. PaO2 was targeted to between 60 and 150 mmHg by adjusting PEEP in the positive ventilation group; the accompanying NPV animal in the pair had the same level of ‘mirror-image’ end-expiratory distending pressure (external NEEP) applied. Histology scoring was performed on lung sections, and additional groups of animals were studied to measure pulmonary blood flow (PA catheter), trans-pulmonary pressure (esophageal manometry), as well as the effects of a partial NPV device (Cuirass). Results: The mortality was 2/11 (18%) and 3/12 (25%) in the positive and negative groups respectively (P=ns; all attributable to air leaks). Baseline characteristics, VT, PaCO2, and RR were similar in the two groups. NPV was associated with an higher PaO2 (430±91 vs. 78±17 mmHg, P<0.001) and a lower overall histology injury score (18.6±1.6 vs. 24.5±1.2, P<0.05). The FRC was higher in NPV(27Lung wet/dry ratio and total pulmonary blood flow values were similar in both groups. The airway epithelial injury score was worse with PPV (4.1±0.7 vs. 3.0±0.5, P<0.05). End-expiratory trans-pulmonary pressure was identical with both modes of ventilation. However, inspiratory distending trans-pulmonary pressure was significantly greater in PPV vs. NPV, especially at higher levels of end-expiratory distension (TPP 20.3±5.4 vs. 13.3±2.7 cmH2O P<0.05; at PEEP or NEEP = 10 cmH2O). Pulmonary perfusion was similar for NPV (‘body box’) vs. PPV, but was approximately 25% greater with NPV directed to the chest only (Cuirass). Conclusion: NPV results in superior oxygenation compared with PPV despite similar end-expiration trans-pulmonary distending pressure. PPV requires greater inspiratory trans-pulmonary pressure to achieve comparable VT, and in doing so causes more lung injury, especially to the conducting airways. Distending pressure or mode of ventilation appears to be more important than VT in the development and distribution of ventilator-induced lung injury. Supported by: This work is founded by: CIHR, PREA

Double Blind Randomized Controlled Trial Comparing Sedation with Dexmedetomidine versus Lorazepam in Mechanically Ventilated Medical ICU Patients
Pratik Pandharipande MD*, Timothy Girard MD**, Mervyn Maze MB, Ch.B., FRCA, FRCP #, Jennifer Frizzell RN, BSN**, Ayumi Shintani PhD, MPH+, William Renfrew+, Rasheeda Stephens BE**, Miranda
Fraley BSN**, Brenda Truman-Pun RN, MSN, ACNP**, and E Wes Ely MD, MPH**, Departments of Anesthesiology*, Medicine/ Allergy, Pulmonary Critical Care** and Biostatistics+, Vanderbilt University
Medical Center and Department of Anaesthetics, Imperial College of London #
Background: Narcotics and benzodiazepines are extensively used in the intensive care unit (ICU), per the Society of Critical Care Medicine (SCCM) sedation guidelines, to minimize patient discomfort and to treat anxiety and pain. These agents have numerous adverse effects including the potential for prolonging ventilation and the development of delirium. Dexmedetomidine (dex) is an alpha 2 agonist that is approved for sedation in the ICU for up to 24 hours. The objective of this randomized controlled trial (RCT) was to compare the efficacy of sedation, prevalence of delirium and the safety profile in patients treated with dex vs. lorazepam. Method: After IRB approval, 26 consecutive adult medical ICU patients requiring mechanical ventilation were randomized to receive sedation with either dex + fentanyl or lorazepam + fentanyl for a maximum of 5 days. Exclusion criteria included significant neurologic disease or dementia, cirrhosis, active coronary artery disease, advanced heart block or active withdrawal of care at time of first visit. Blinded study drug, after an optional bolus, was titrated by the bedside nurse from 1 cc/hr (1 mg/hr lorazepam or 0.15 mcg/kg/hr dex) to a maximum of 10 cc/hr (10 mg/hr lorazepam or 1.5 mcg/kg/hr dex) to achieve the sedation target set by the patient's medical team using the Richmond Agitation Sedation Scale (RASS). Breakthrough analgesia was provided with intermittent doses of fentanyl using the behavioral pain scale. Patients were assessed twice daily by the study staff, blinded to group assignment and details of the patients' clinical and therapeutic course, for adequacy of sedation (RASS), delirium using the Confusion Assessment Method for the ICU (CAM-ICU), and other clinical outcomes. Results: We present pilot feasibility data that have not been analyzed by study group due to the blinded study design. Baseline demographics (Mean + SD whenever applicable) include age, 52+ 13 years; Caucasians, 77%; males, 46%; APACHE II, 27.6 + 6.2; ARDS/ sepsis, 46 %; COPD/pulmonary edema, 34%; and malignancy/ metabolic illness, 20%. For the group as a whole, outcomes data showed difference between actual and target RASS sedation level, 1.2 + 0.9; prevalence of delirium, 73%; duration of delirium, 2.9 + 2.7 days; ICU length of stay, 9.1 + 2.6 days; ventilator free days, 14.3 + 10.1 days; and hospital mortality 23%. Average duration of study drug infusion was 3.5 days. Cardiac (troponin and electrocardiogram), hepatic (bilirubin and alanine transferase) and endocrine (cortisol, adrenocorticotrophin hormone, testosterone, prolactin and leutinizing hormone) function, monitored during study infusion, did not show any significant change from baseline. There was one unplanned extubation requiring reintubation. One patient developed a supraventricular tachycardia after starting study infusion, which was considered unlikely to be study drug related by the patients’ medical team. Conclusion: It is feasible to perform a blinded randomized controlled trial of dexmedetomidine versus lorazepam for up to 5 days in severely ill medical ICU patients. On going enrollment will provide adequate power to assess efficacy of sedation, delirium rates and the safety profile.

Increased Mortality Associated with Acute Hypoxemic Respiratory Failure of Extra-pulmonary Origin
Wunsch H1, Harrison DA2, Young D3, Bellingan G4, Sladen RN1, Rowan K2
1. Department of Anesthesiology, Columbia University, New York City, NY, United States, 2. Intensive Care National Audit & Research Centre, London, United Kingdom, 3. Nuffield Department of Anaesthetics, John Radcliffe Hospital, Oxford, United Kingdom, 4. Department of Intensive Care, University College Hospital,
University College London, United Kingdom
Background Acute hypoxemic respiratory failure (AHRF) can be caused by a pulmonary disease process (p-AHRF) or indirectly by a disease process in a different organ system (exp-AHRF). Some data suggest that differences in radiological appearance, gas exchange of the lungs, and respiratory mechanics may vary depending on the cause of AHRF, yet few studies have looked at whether p-AHRF is different from exp-AHRF with regard to outcomes. We therefore addressed the question of whether the cause of AHRF has an effect on ICU and acute hospital mortality. Methods Data were extracted from the Intensive Care National Audit & Research Centre’s Case Mix Programme Database from 1996 to 2004. We defined AHRF as a PaO2/FIO2 (P/F) ratio ≤ 200 (mm Hg) in the first 24 hours after ICU admission based on the North American-European Consensus Conference definition for the Acute Respiratory Distress Syndrome1. Admissions were defined a priori as having a cause of AHRF that was pulmonary or extra-pulmonary based on the primary and secondary diagnoses on admission to ICU. Comparison of mortality in the p-AHRF and exp-AHRF groups was done using logistic regression. Results The cohort consisted of 261,193 admissions to 174 ICUs in England, Wales and Northern Ireland. 49.8% of the cohort met the criteria for AHRF in the first 24 hours after ICU admission, of which 29.8% had p-AHRF, 37.3% had exp-AHRF, and 33.0% had no cause identifiable. Admissions with p-AHRF had more severe gas exchange impairment (mean P/F ratio 112.4 versus 130.3 for exp-AHRF). The overall ICU and hospital mortality varied greatly by P/F ratio: ICU mortality 16.5% (admissions with P/F ratio 176-200) to 68.4% (P/F ratio 0-50); hospital mortality ranged from 30.1% to 73.8%. Those with exp-AHRF had higher mortality in every sub-group of the P/F ratio (Figure 1); absolute ICU mortality was increased from 2.6% to 7.3% in those admissions with exp-AHRF compared with p-AHRF, p<0.001. The finding was the same for acute hospital mortality (p<0.001). The pattern also held when we restricted our analysis to those admissions who had a P/F ratio ≤ 200 (mm Hg) and were also ventilated on admission to ICU (approximating the SOFA (Sepsis-related Organ Failure Assessment) criteria for respiratory failure). Conclusion AHRF of extra-pulmonary origin is associated with a clinically significant increase in both ICU and acute hospital mortality when compared with AHRF of pulmonary origin. A consensus definition of AHRF is needed to facilitate further studies in this area. References 1. Bernard GR, Artigas A, Brigham KL, Carlet J, Falke K, Hudson L, Lamy M, Legall JR, Morris A, Spragg R: The American-European Consensus Conference on ARDS. Definitions, mechanisms, relevant outcomes, and clinical trial coordination. Am.J.Respir.Crit Care Med 1994; 149: 818-24

Figure 1. ICU and hospital mortality for pulmonary and extra-pulmonary AHRF grouped by lowest P/F ratio. ICU mortality*
10
20
30
40
50
60
70
80
0-50 51-75 76-100 101-125 126-150 151-175 176-200
P/F ratio
ICU
mor
talit
y (%
)
PulmonaryExtra-pulmonary
Acute hospital mortality*
10
20
30
40
50
60
70
80
0-50 51-75 76-100 101-125 126-150 151-175 176-200
P/F ratio
Acu
te h
ospi
tal m
orta
lity
(%)
PulmonaryExtra-pulmonary
*p-values for differences between pulmonary and extra-pulmonary mortality tested using logistic regression. p<0.001 for both ICU and acute hospital mortality.

Thinking of becoming a member of ASCCA?Joining is easy! Simply visit www.ascca.org
If you are a current member, thank you for recognizing that new member recruitment starts with you. The reasons you joined ASSCA are most likely the same reasons your associates should also be members of this leading organization that’s devoted to educating the educators in anesthesiology.
Perhaps you joined because ASCCA provides for the specialized needs of intensivists as well as the broader needs of practicing anesthesiologists, who actively practice critical care medicine, and is the sole organization dedicated to the continuation of the role of anesthesiologists in providing critical care services.
You may have also joined ASCCA for the second-to-none educational programs at the Society’s Annual Meeting.
Whatever the reasons you joined ASCCA, your colleagues share these same needs.
Please tell your colleagues to join ASCCA today at www.ascca.org

Thank you for attending the ASCCA 19th Annual Meeting!
Save these dates for upcoming ASCCA meetings:
ASCCA 20th Annual MeetingFriday, October 12, 2007San Francisco, California
ASCCA 21st Annual MeetingFriday, October 17, 2008
Orlando, Florida
ASCCA520 N. Northwest Highway
Park Ridge, Illinois 60068-2573


