AMERICAN SOCIETY OF APPRAISERS BV 201 Introduction to...
636
AMERICAN SOCIETY OF APPRAISERS BV 201: Introduction to Business Valuation - Market Approach Student Manual
Transcript of AMERICAN SOCIETY OF APPRAISERS BV 201 Introduction to...

`
AMERICAN SOCIETY OF APPRAISERS
BV 201: Introduction to Business Valuation -
Market Approach
Student Manual

BV201: Introduction to Business Valuation
BV201r v. 6.0 (11/15) Non-authoritative © 2015 American Society of Appraisers i
BV201: Introduction to Business Valuation – Market Approach
Course Hours: 24 Instruction + 3 Exam Hours = Total 27 CPE Credits (see your instructor for further details)
Course Outline The American Society of Appraisers wishes to emphasize that these course materials are NOT authoritative. They are intended to be used together with the assigned reading material and the observations of the course instructors as the basis for lectures and discussion in this course.
Concepts and valuation methods portrayed in this course are NOT:
The only valuation methods used by competent appraisers or the only conceptsconsidered by competent appraisers;
The only way the individual methods should or could be done;
Cookbook appraisal methods that may be applied to any appraisal.
Appraisals must be done with knowledge of the facts and circumstances of the subject company and all other relevant factors. A particular valuation method that is relevant and appropriate for the appraisal of one company at one point in time may or may not be appropriate for another time or another company.

BV201: Introduction to Business Valuation
BV201r v. 6.0 (11/15) Non-authoritative © 2015 American Society of Appraisers ii
Table of Contents
CHAPTER 1. INTRODUCTION
I. Course Introduction .........................................................................................................1
II. The Business Appraisal Profession .................................................................................2
III. Necessary Business Appraisal Skills and Qualifications ................................................3
IV. Course Prerequisites ........................................................................................................5
CHAPTER 2. BUSINESS VALUATION THEORY
I. Comparison with Real Estate Appraisals ........................................................................1
II. Three Approaches to Value .............................................................................................1
III. Basic Description of a Business ......................................................................................3
IV. Organizational Structure of Business ..............................................................................4
V. Financial Structure of Business .......................................................................................6
Classroom Assignment’s 1 & 2 – Calculate Net Cash Flow ..................................................10
Handout 2-1. Answers to Classroom Assignments 1 & 2 .....................................................11
VI. Basic Concept of Value .................................................................................................12
VII. Value vs. Cost vs. Price .................................................................................................12
VIII. Standards of Value ........................................................................................................14
IX. Premise of Value ...........................................................................................................17
X. Basic Variables Affecting Value ...................................................................................18
XI. The Role of IRS Rulings ...............................................................................................20
XII. The Role of Key Court Cases ........................................................................................21
XIII. The Role of Financial Accounting Standards Board Guidance ....................................21
XIV. Steps of a Business Appraisal .......................................................................................22
Classroom Assignment 3 – Revenue Ruling 59-60 ...............................................................24
Exhibit 2-1. Determining Which Appraiser to Choose .........................................................25
Exhibit 2-2. Revenue Ruling 59-60 .......................................................................................36
CHAPTER 3. DEFINING THE APPRAISAL ASSIGNMENT
I. BVS-I ................................................................................................................................1

BV201: Introduction to Business Valuation
BV201r v. 6.0 (11/15) Non-authoritative © 2015 American Society of Appraisers iii
II. Pre-Engagement Assessment ............................................................................................1
III. What is Being Appraised ..................................................................................................2
IV. The Effective Date of Appraisal .......................................................................................3
V. The Scope of the Appraisal ...............................................................................................3
VI. Engagement Letters ...........................................................................................................5
Classroom Assignment 4 – Defining the Appraisal Assignment .............................................7
VII. The Purpose and Intended Use of the Valuation ...............................................................8
VIII. Professional Obligation of the Appraiser ........................................................................9
IX. Professional Standards ....................................................................................................11
Handout 3-1, Sample Engagement Letter ..............................................................................14
CHAPTER 4. DATA GATHERING
I. Data Gathering via the Internet .........................................................................................1
II. General Information ..........................................................................................................1
III. Economic and Industry Data .............................................................................................1
Classroom Assignment 5 .........................................................................................................5
IV. Specific Data Sources .......................................................................................................5
Homework Assignment 1: Review Exhibit 4-3 ....................................................................11
Exhibit 4-1. Basic Business Valuation Bibliography ............................................................12
Exhibit 4-2. GDT - Most Recent Audit Report and Notes to Financial Statements .............15
Exhibit 4-3. GDT - History of the Company .........................................................................25
Exhibit 4-4. Sample Information Request .............................................................................34
CHAPTER 5. GENERAL ECONOMIC AND POLITICAL ANALYSIS
I. Introduction .......................................................................................................................1
II. The Globalization of Economic Factors ...........................................................................2
III. Country-Specific (National) Economic Factors ................................................................3
IV. Regional and Local Economic Factors .............................................................................4
Classroom Assignment 6 .........................................................................................................4
Handout 5-1. Example of Local Economic Analysis ...............................................................5
Exhibit 5-1. National Economic Analysis ...............................................................................6

BV201: Introduction to Business Valuation
BV201r v. 6.0 (11/15) Non-authoritative © 2015 American Society of Appraisers iv
Handout 5-2. Economic Impact on the Company .................................................................14
CHAPTER 6. INDUSTRY ANALYSIS
I. Introduction to Industry Analysis .....................................................................................1
II. Porter’s Five Forces and Generic Strategies .....................................................................2
Classroom Assignment 7 ......................................................................................................14
Exhibit 6-1. Industry Analysis ...............................................................................................15
Handout 6-1. Industry Impact on the Company ....................................................................25
CHAPTER 7. COMPANY ANALYSIS
I. Applying the Business Appraiser’s Analysis to the Company .........................................1
II. Financial Performance Analysis .......................................................................................1
III. Financial Statement Adjustments ...................................................................................11
Classroom Assignment 8 .......................................................................................................15
Handout 7-1. Normalization Adjustments and Normalized Financials.................................16
IV. Company Risk Factors ....................................................................................................17
V. Analytical Frameworks ...................................................................................................17
VI. SWOT Analysis ..............................................................................................................19
VII. Company-Specific Value Drivers ...................................................................................22
Homework Assignment 2: Calculate Ratios ........................................................................24
Handout 7-2. Ratio Solutions for Homework Assignment 7-2 .............................................24
Exhibit 7-1. SWOT Questionnaire ........................................................................................25
Exhibit 7-2. Common Value Enhancers and Detractors .......................................................35
Handout 7-3. Compound Growth Example ...........................................................................39
CHAPTER 8. OVERVIEW OF THE MARKET APPROACH
I. Introduction .......................................................................................................................1
II. Basic Principles Underlying the Market Approach ..........................................................3
III. Basic Steps of the Market Approach Process ...................................................................6
IV. ASA Standards and Definitions ........................................................................................6
Classroom Assignment 9 – Read Handout 8-1 .......................................................................9
BV201: Introduction to Business Valuation
BV201r v. 6.0 (11/15) Non-authoritative © 2015 American Society of Appraisers v
Handout 8-1. Estate of Joyce C. Hall ....................................................................................10
CHAPTER 9. GPC STEP 1—GUIDELINE SEARCH AND SELECTION
I. Overview of the Guideline Public Company Method .....................................................1
II. ASA SBVS-1 Conceptual Framework and Guidance .....................................................1
III. GPC Selection Process ....................................................................................................2
IV. Getting and Setting up the GPC Financial Statements ....................................................9
Classroom Assignments M 1-4 Selection of Guideline Public Companies (GPC) ................13
Exhibit 9-1. SIC Description .................................................................................................17
Handout 9-1. Initial Search Criteria and List of Potential Guideline Companies .................20
Handout 9-2. Potential Guideline Company Profiles ............................................................21
Handout 9-3. Potential Guideline Companies Stock Pricing ...............................................22
Handout 9-4. Potential Guideline Companies Trading Activity Analysis ............................23
Handout 9-5. Potential Guideline Companies Remaining Potential GPCs 10-K ..................24
Handout 9-6. Solutions for Eliminating Guideline Public Companies ................................25
CHAPTER 10. GPC STEP 2—NORMALIZE FINANCIAL STATEMENTS
I. GPC Step 2 – Normalize the Financial Statements .........................................................1
II. ASA SBVS-1 Guidance ..................................................................................................1
III. Accounting Translation Adjustments ..............................................................................1
Classroom Assignment M-5: Normalizing Adjustments .........................................................3
Handout 10-1. Guideline Company Financial Information .....................................................4
Handout 10-2. Normalized Guideline Company Financial Information .................................5
CHAPTER 11. GPC STEPS 3-4—CALCULATION & SELECTION OF MULTIPLES
I. ASA SBVS-1 Guidance for the Calculation and Selection of Multiples ........................1
II. GPC Step 3—Calculating Market Multiples ...................................................................1
III. Which Multiples Should Be Used? .................................................................................3
IV. Time Period for Financial Operating Metrics .................................................................8
Classroom Assignment M-6: Calculation of Multiples .........................................................10
Classroom Assignment M-7: GDT Valuation Multiples .......................................................11

BV201: Introduction to Business Valuation
BV201r v. 6.0 (11/15) Non-authoritative © 2015 American Society of Appraisers vi
V. Useful Summary Measures – Statistical Tools ..............................................................12
VI. GPC Step 4 – Selection of the Appropriate Type of Market Multiples to Use .............13
Exhibit 11-1. Explanation of Statistics and Statistical Measures ..........................................16
Handout 11-1. Solution to Classroom Assignment M-7 ......................................................29
Handout 11-2. LTM Equity Multiple Worksheet ..................................................................30
Handout 11-3. LTM MVIC Multiple Worksheet ..................................................................31
Handout 11-4. Solution to M-8 – Selection of Multiples .....................................................32
CHAPTER 12. GPC STEPS 5-6—COMPARE AND ADJUST GPC MULTIPLES
I. GPC Step 5—Comparative Analysis ..............................................................................1
II. Comparative Qualitative Factors to Consider .................................................................1
III. Comparative Quantitative Financial Performance Factors to Consider ..........................4
Classroom Assignment M-8: Comparative Analysis of GDT, Inc. ........................................9
IV. GPC Step 6—Adjusting the GPC Market Multiples – the Key Step ............................10
V. Qualitative and Quantitative Techniques for Adjusting Market Multiples ...................11
Classroom Assignment M-9: Adjusting Multiples for Size and Growth ..............................17
Exhibit 12-1. Computing Present Value-Weighted Growth ................................................18
Handout 12-1. GPC Financial Ratio Ranking Analysis.......................................................22
Handout 12-2. GPC Comparison to GDT ............................................................................23
Handout 12-3. Solution to Classroom Assignment M-10 ....................................................24
CHAPTER 13. GPC STEPS 7-9—APPLY MULTIPLES, RECONCILE AND ADJUST
I. Step 7—Apply Adjusted Multiples .................................................................................1
II. Step 8 – Reconcile the Different Indications of Value ....................................................3
III. Step 9 – Consider Applying Appropriate Discounts or Premiums .................................4
CHAPTER 14. THE MERGER AND ACQUISITION METHOD
I. Introduction .....................................................................................................................1
II. Database Inconsistencies and Analytical Issues ..............................................................4
III. Analytical Procedures ......................................................................................................7
IV. Equity Multiples ..............................................................................................................8

BV201: Introduction to Business Valuation
BV201r v. 6.0 (11/15) Non-authoritative © 2015 American Society of Appraisers vii
V. Invested Capital Multiples ...............................................................................................8
VI. Closer Examination of Common Data Sources for Small Businesses ............................9
Handout 14-1. Merger and Acquisition Method – Transactions and Conclusion of Value ..16
CHAPTER 15. RULES OF THUMB AND OTHER MARKET METHODS
I. Rules of Thumb .............................................................................................................1
II. Prior Transactions in the Subject Company’s Stock .....................................................2
III. Buy-Sell Agreement ......................................................................................................3
IV. Bona Fide Offers to Buy ..............................................................................................4
V. Analysis of Acquisitions Made by the Company .........................................................4
Appendix A. ASA Business Valuation Standards
Appendix B. Data Analysis
Appendix C. GDT Financial Information
Appendix D. PowerPoint slides
Appendix E. USPAP Standards 9 and 10
Appendix F. History of the Business Valuation Committee

BV201: Introduction to Business Valuation
BV201r v. 6.0 (11/15) Non-authoritative © 2015 American Society of Appraisers viii
BV201 List of Exhibits
2-1 Business Appraiser or Real Property – Which to Use?
2-2 Revenue Ruling 59-60
4-1 Basic Business Valuation Bibliography
4-2 GDT – Most Recent Audit Report and Notes to Financials
4-3 GDT – History of the Company
4-4 Sample Information Request
5-1 National Economic Analysis
6-1 Industry Analysis
7-1 SWOT Questionnaire
7-2 Common Value Enhancers and Detractors
9-1 SIC Description
11-1 Explanation of Statistics and Statistical Measures
12-1 Computing Present Value-Weighted Perpetual Growth
BV201: Introduction to Business Valuation
BV201r v. 6.0 (11/15) Non-authoritative © 2015 American Society of Appraisers ix
BV201 List of Handouts
2-1 Answers to Classroom Assignments 1 & 2
3-1 Sample Engagement Letter
5-1 Example of Local Economic Analysis
5-2 Economic Impact on the Company
6-1 Industry Impact on the Company
7-1 Balance Sheet and Income Statement Normalization Adjustments
7-2 Ratio Solutions for Homework Assignment 7-2
7-3 Compound Growth Example
8-1 Court Case: Estate of Joyce C. Hall
9-1 Initial Search Criteria and List of Potential Guideline Companies
9-2 Potential Guideline Company Profiles
9-3 Potential Guideline Companies Stock Pricing
9-4 Potential Guideline Companies Trading Activity Analysis
9-5 Potential Guideline Companies Remaining Potential GPCs 10-K Information
9-6 Solutions for Eliminating Guideline Public Companies
10-1 Guideline Company Financial Information
10-2 Normalized Guideline Company Financial Information
11-1 Solution to Classroom Assignment M-7
11-2 LTM Equity Multiple Worksheet
11-3 LTM MVIC Multiple Worksheet
11-4 Solution to M-8 – Selection of Multiples
12-1 GPC Financial Ratio Ranking Analysis
12-2 GPC Comparison to GDT
12-3 Solution to Classroom Assignment M-10
14-1 Merger and Acquisition Method – Transactions and Conclusion of Value

BV201: Introduction to Business Valuation
BV201r v. 6.0 (11/15) Non-authoritative © 2015 American Society of Appraisers x
BV201 List of Classroom Assignments
Classroom Assignment 1: Calculate net cash flow to equity
Classroom Assignment 2: Calculate net cash flow to invested capital
Classroom Assignment 3: Review Exhibit 2-2
Classroom Assignment 4: Defining the Appraisal Assignment
Classroom Assignment 5: Review Exhibit 4-2
Classroom Assignment 6: Review Exhibit 5-1 – Write Economic Impact
Classroom Assignment 7: Review Exhibit 6-1 – Write Industry Impact
Classroom Assignment 8: Discuss Normalization Adjustments
Classroom Assignment 9: Read Handout 8-1 and be prepared to discuss
Classroom Assignment M-1: Selection of Potential Guideline Public Companies
Classroom Assignment M-2 through M-4: Selection of Guideline Public Companies
Classroom Assignment M-5: Normalizing Adjustments
Classroom Assignment M-6: Calculate an Equity and MVIC Multiple
Classroom Assignment M-7: GDT Valuation Multiples
Classroom Assignment M-8: Comparative Analysis of GDT v. GPC’s
Classroom Assignment M-9: Adjusting Multiples for Size and Growth

BV201: Introduction to Business Valuation
BV201r v. 6.0 (11/15) Non-authoritative © 2015 American Society of Appraisers xi
BV201 List of Homework Assignments
Homework Assignment 1: Review Exhibit 4-3 for a sample history section for case study
Homework Assignment 2: Perform Financial Analysis of GDT

Chapter 1. Introduction BV201: Introduction to Business Valuation
BV201r v. 6.0 (11/15) Non-authoritative © 2015 American Society of Appraisers 1
Chapter 1. Introduction
I. Course Introduction
A. BV201 course objectives. Upon completion of the course the student should be able to:
1. Understand the basic theories underlying business valuation.
2. Understand professional business valuation standards.
3. Define an appraisal assignment.
4. Gather useful data on the economy, industry and subject company.
5. Analyze economic, industry and subject company data and understand how the analysis affects value.
6. Arrive at indicated values for a business using the market approach, including the guideline public company and merger and acquisition methods.
B. BV202 - The Introduction to Business Valuation: will cover:
1. The basic theory and application of the income approach and its various methodologies.
2. Basic capitalization models and discounting models in the context of earnings and cash flow measurements, as well as equity and invested capital assignments.
3. Fundamentals of the asset approach.
C. BV203 - Asset Approach, Discounts and Premiums:
1. Fundamentals of the asset approach.
2. Valuation adjustments, including discounts for lack of marketability and lack of control, as well as control premiums.
3. Report writing.
D. BV204 – Advanced Topics in Business Valuation is a capstone course which:
1. Pass-through entities, intangible assets, employee stock ownership plan valuation, fairness opinions, solvency opinions.
2. Value allocation in a complex capital structure.
3. Non-U.S. Cost of Capital.
4. Valuation of debt and preferred stock.
5. Litigation services.
6. Advancement and accreditation.

Chapter 1. Introduction BV201: Introduction to Business Valuation
BV201r v. 6.0 (11/15) Non-authoritative © 2015 American Society of Appraisers 2
II. The Business Appraisal Profession
A. Structure of the profession
1. Entire firms specializing in business appraisal
2. Departments of firms primarily doing other things, such as CPA firms, banks and multidisciplinary firms
3. Part-time practitioners
B. Role of the business appraiser
1. Business appraisers generally provide two types of services:
a. An objective and independent valuation of business interests.
b. An advisory, or consulting role in determining a value most beneficial to a client’s position (In such an advisory role, the appraiser may not be expressing an objective opinion of value.).
2. There is typically a presumption of objectivity in an appraisal of business interests, unless an advisory role has been previously agreed to and clearly identified to those depending upon the appraiser’s work.
C. Services offered
1. Opinions of value
a. Equity value
b. Invested capital value
c. Intangible asset value
d. Other—options, debt
2. Consultation regarding values
3. Structure terms, sometimes for several classes of investors, such as employee stock ownership plans (ESOPs) or leveraged buyouts
4. Fairness opinions
5. Solvency opinions
6. Assistance in negotiating purchases/sales
7. Mediation/arbitration of disputed valuations
8. Litigation support in disputed valuations
9. Expert testimony

Chapter 1. Introduction BV201: Introduction to Business Valuation
BV201r v. 6.0 (11/15) Non-authoritative © 2015 American Society of Appraisers 3
III. Necessary Business Appraisal Skills and Qualifications
A. Appraisal skills
B. Professional obligations for appraisal skills
1. The Uniform Standards of Professional Appraisal Practice (USPAP), discussed in more detail later in the course, obligates the appraiser to exhibit competency in performing appraisals. Competency implies that the appraiser is familiar with the specific type of property, the markets in which it sells, and analytical methods used to value the property.
2. The position of the American Institute of Certified Public Accountants (AICPA) on Professional Competence (education and qualifications) taken from the AICPA Consulting Services Practice Aid 93-3 (no longer in print but authored by the course developer of this course).
a. “01. In performing business valuation engagements, practitioners are advised to determine whether the competency provisions of rule 201, General standards of the AICPA Code of Professional Conduct, are met. Although accountants have a thorough understanding of financial statements and related matters, they also need to be proficient in the area of appraisals to competently complete an engagement. Usually, being proficient requires an in-depth knowledge of finance, economics, and security analysis for an understanding of appraisal principles and methods.”
b. “02. In order for the practitioner to obtain the competency required to accept a business valuation engagement, appropriate education is required.”
Security Analysis
Finance
Accounting
Economics
Tax
Valuation LawStrategic Planning
Research
Computer
Statistics
Oral & Written Communication
Common Sense
Appraisal Skills
Chapter 1. Introduction BV201: Introduction to Business Valuation
BV201r v. 6.0 (11/15) Non-authoritative © 2015 American Society of Appraisers 4
3. The AICPA position on due professional care taken from the AICPA Consulting Services Special Report 93-1.
a. “01. A practitioner exercises due professional care in the performance of an engagement. Due care requires diligence and critical analysis of all work performed.”
C. Appraiser professional qualifications
1. Academic background in business administration, typically in finance, including bachelors, masters or doctorate degrees.
2. Professional designations
a. ASA: Accredited Senior Appraiser. Senior member of the American Society of Appraisers accredited in business valuation. Oriented primarily toward closely held companies. For more information call (800) ASA-VALU or visit the Web site at www.bvappraisers.org. Primary requirements for certification include:
(i) Successful completion of BV201 through BV204
(ii) Peer review of one appraisal report
(iii)Five years of full-time equivalent appraisal experience
b. AM: Accredited Member. Member of the American Society of Appraisers accredited in business valuation. Primary requirements for certification include:
(i) Successful completion of BV201 through 204
(ii) Peer review of one appraisal report
(iii)Two years of full-time equivalent appraisal experience
c. CFA: Chartered Financial Analyst. Oriented primarily toward publicly traded companies and for securities analysts. For information, visit the CFA Institute Web site at www.aimr.com.
d. CBA: Certified Business Appraiser. Awarded by the Institute of Business Appraisers. Oriented primarily toward closely held companies. The IBA also offers the MCBA: Master Certified Business Appraiser designation. An MCBA must have held the CBA designation for not less than 10 years and must have 15 years full-time experience as a business appraiser. For more information, visit IBA’s Web site at www.go-iba.org.
e. ABV: Accredited in Business Valuation. Awarded by the American Institute of Certified Public Accountants to CPAs only. For more information visit the AICPA’s Web site at www.aicpa.org.
f. CBV: Chartered Business Valuator. Awarded by the Canadian Institute of Chartered Business Valuations to Canadian and foreign valuators, including those

Chapter 1. Introduction BV201: Introduction to Business Valuation
BV201r v. 6.0 (11/15) Non-authoritative © 2015 American Society of Appraisers 5
from the United States. For more information, visit the Canadian Institute of Chartered Business Valuators’ Web site at www.businessvaluators.com.
g. CVA: Certified Valuation Analyst. Awarded by the National Association of Certified Valuation Analysts, many of whom are part-time practitioner CPAs. NACVA also issues the GVA (Government Valuation Analyst) designation. For more information, visit NACVA’s Web site at www.nacva.com.
3. Continuing involvement in professional business appraisal organizations and activities
a. The American Society of Appraisers holds semi-annual national professional meetings, course offerings, and several regional meetings. ASA’s Business Valuation Committee sponsors an Advanced Valuation Conference in the fall of each year. Various local chapters sponsor conferences and seminars.
b. The ESOP Association and its Valuation Advisory Committee hold regular semiannual meetings and regional presentations.
c. NACVA holds annual national professional meetings.
d. The CFA Institute holds annual meetings and periodic seminars and publishes the proceedings from these seminars.
e. The AICPA and other organizations also offer educational opportunities in business valuation.
IV. Course Prerequisites
A. Two college-level semesters of accounting
B. One college-level semester of finance
C. One college-level semester of economics
D. Working knowledge of the U.S. public stock market
E. Understanding of statistics
Chapter 2. Business Valuation Theory BV201: Introduction to Business Valuation
BV201r v. 6.0 (11/15) Non-authoritative © 2015 American Society of Appraisers 1
Chapter 2. Business Valuation Theory
I. Comparison with Real Estate Appraisals - See Exhibit 2-1.
A. Less rigidly structured than real estate appraisal approaches and usually more complex since we are valuing a group of assets rather than a single asset
B. Follows less strictly the three-pronged real estate dictum of cost, market, and income approaches
II. The Three Approaches to Value as Applied to Business Valuation
A. Market Approach
1. Principle of substitution premise that a prudent buyer will pay no more for a property than it would cost to acquire a substitute property with the same utility
2. Comparison between subject property and similar properties that have recently sold
3. Use of guideline company transaction data
a. Publicly traded companies
b. Acquired/merged companies
4. Analysis of prior transactions in the subject company’s stock is a market approach
5. The use of rules of thumb is also a market approach. However, this should only be used as a sanity test and not an actual method
6. Strengths and weaknesses of market approach overall
a. Direct method of valuation if similar companies can be found
b. Relatively easy to get data
c. A lot of information and research on the public companies
d. Very difficult to find truly similar companies
B. Asset-Based Approach
1. Again, based on the principle of substitution
2. In business valuation, the asset-based, adjusted net asset, or adjusted balance sheet method is our version of the cost approach
a. Balance sheet analysis
b. Usually involves separate valuation of each item on the balance sheet; adjust all tangible and intangible assets and liabilities to their market values

Chapter 2. Business Valuation Theory BV201: Introduction to Business Valuation
BV201r v. 6.0 (11/15) Non-authoritative © 2015 American Society of Appraisers 2
3. Strengths and weaknesses of asset-based approach overall
a. Useful for holding company
b. Useful if company is to be liquidated
c. Does not focus on the income the assets produce as a whole
d. Does not value the unidentifiable intangible value of a business (It is difficult to know if you have captured all the intangible without valuing the company with the use of some other method.)
e. The more intangible value in a business, the more difficult the cost approach and the more relevant the income approach becomes
f. Less applicable in minority interest valuations (because minority shareholders do not control the underlying assets)
4. The following excerpt is from BVS-III:
The asset-based approach should be considered in valuations conducted at the enterprise level and involving:
1. An investment or real estate holding company 2. A business appraised on a basis other than as a going concern
Valuations of particular ownership interests in an enterprise may or may not require the use of the asset-based approach. The asset-based approach should not be the sole appraisal approach used in assignments relating to operating companies appraised as going concerns unless this approach is customarily used by sellers and buyers. In such cases, the appraiser must support the selection of this approach.
C. Income Approach
1. Closest to pure theory - fair market value is the present value of all future benefits. There is a direct relationship between the amount of income a property will earn and its value
2. Two most common methods:
a. Capitalized methodology - the two essential elements are an estimated income base and a capitalization rate (single period). Value = Benefit Stream / (discount rate - growth rate)
b. Discounted methodology - you need a projected income stream and a discount rate (multiple period). Value = (Benefit Stream in period n)/(1 +discount rate)
3. The terms discount rate, cost of capital, required rate of return, and yield rate (used in real property appraisal) all mean the same thing

Chapter 2. Business Valuation Theory BV201: Introduction to Business Valuation
BV201r v. 6.0 (11/15) Non-authoritative © 2015 American Society of Appraisers 3
4. Strengths and weaknesses of income approach overall
a. Closest to pure value theory
b. Very difficult to forecast
c. Estimates of capitalization or discount rate are difficult to make and will be discussed in detail in BV 202.
III. Basic Description of a Business
A. Definitions of a business
1. Dictionary definitions
a. A commercial or industrial enterprise and the people who constitute it
b. An organization operated with the objective of making a profit from the sale of goods or services1
c. An enterprise, commercial entity or firm, in either the private or public sector, concerned with providing products or services to satisfy customer requirements2
2. ASA Glossary definition: A commercial, industrial, service, or investment entity (or a combination thereof) pursuing an economic activity.
B. Real world view
1. Definition—A group of individuals with a plan (strategy) incorporating systems and procedures to efficiently utilize the tangible and intangible assets they have available to meet the needs and wants of their identified customer base
2. A business consists of four key components:
a. Strategy
b. Systems
c. People
d. Tangible and intangible assets
3. Highly successful businesses have the ability to get the most out of the manageable parts – the business strategy, systems and people.
1 Source: www.finet.com.hk/accounting/b.htm 2 Source: www.georgetown.edu/uis/ia/dw/GLOSSARY0816.html

Chapter 2. Business Valuation Theory BV201: Introduction to Business Valuation
BV201r v. 6.0 (11/15) Non-authoritative © 2015 American Society of Appraisers 4
IV. Organizational Structure of Business
A. Businesses can have many legal forms which vary depending upon the legal jurisdiction. Legal jurisdictions that control business entities are normally states (or their equivalent) or countries. All countries have business entities which generally have similar names and characteristics.
B. Sole proprietorship
1. The simplest legal form of business where the business operates under an individual’s legal name (can also have a fictitious name), and
2. The individual is directly responsible for all the company’s liabilities.
3. The business’ income is reported on the individual’s personal tax return as part of personal income.
C. Partnership
1. When individuals join together to carry out a business
2. Can be registered and operated under its own legal name
3. Individual partners retain liability for the company’s liabilities.
4. The business income is reported on a partnership tax return and allocated to the individual members to report on their individual tax return.
D. Limited Liability Company
1. Is a legal entity with its own legal status including its own name.
2. Has responsibility for its own legal obligations.
3. Have limits on the amount of liability or obligations that can be passed through to the owners
4. Files tax returns, but does not pay income taxes. Instead, the profit or loss is passed through to the members of the firm who pay income taxes on their own income tax returns.
E. Corporation
1. Is a legal entity with its own legal status including its own name.
2. Has responsibility for its own legal obligations and files tax returns and pays its own taxes (for C-Corps; S-Corps are pass-through entities).
3. Individual stockholders are not usually responsible for the liabilities or tax obligations of the corporation.
4. Stockholders receive dividends (if declared and paid by the corporation) as their form of annual compensation.

Chapter 2. Business Valuation Theory BV201: Introduction to Business Valuation
BV201r v. 6.0 (11/15) Non-authoritative © 2015 American Society of Appraisers 5
5. Can be a closely held corporation (private company) or a publicly traded company (stocks are regulated and sold on a stock exchange). The common differences between public and private companies are:
a. Size
b. Management depth/management succession
c. Product line diversification
d. Geographic diversification
e. Market position/market share
f. Supplier or customer dependence
g. Lack of access to capital markets
h. Private companies managed to minimize taxes, not maximize income
i. Public companies typically more growth-oriented, particularly through acquisitions
j. Short-term expectations of public companies versus long-term outlook of private companies
k. Patent or brand name importance
l. Private companies generally compare unfavorably with public companies in these areas, but that’s not always the case
6. Variations of the legal entities above
a. Legal jurisdictions often have established variations of the above types of entities.

Chapter 2. Business Valuation Theory BV201: Introduction to Business Valuation
BV201r v. 6.0 (11/15) Non-authoritative © 2015 American Society of Appraisers 6
V. Financial Structure of a Business
A. The balance sheet of a typical business appears as follows:
Current Assets Current LiabilitiesCash Accounts PayableAccounts Receivable Accrued ExpensesInventory Income Taxes PayableOther Assets Other Current Liabilities
Fixed Assets Interest Bearing DebtEquipment (includes current portionBuildings and short term notesLand payable)
Other AssetsInvestments Stockholders' EquityLife Insurance
Preferred StockIntangible Assets
Identifiable Common StockNon-identifiable
Assets Liabilities & Equity
InvestedCapital
Net WorkingCapital
B. The assets of a business typically consist of:
1. The tangible and intangible assets owned by the company, which include:
a. Operating assets—assets used in the company’s operations
b. Excess assets—assets that could be used in the operations but are owned in excess of the assets the company actually needs to operate the business (For example, unused areas of the factory or idle equipment.)
c. Non-operating assets—assets that are not and will not be used in the ordinary course of conducting business (Examples often include personal airplanes, vacation cabins, artwork and investment properties.)
2. Non-booked or unrecorded assets—the intangible or other assets that are not recorded on the company’s financial statements
a. Per GAAP, the internally generated assets of the company are expensed and not recorded on the company’s balance sheet.
b. Discarded assets that may still have value—e.g., molds, old equipment, scrap, etc.
3. Types of assets used in the business include:
a. Liquid assets—cash, accounts receivable, securities, short term notes, etc.

Chapter 2. Business Valuation Theory BV201: Introduction to Business Valuation
BV201r v. 6.0 (11/15) Non-authoritative © 2015 American Society of Appraisers 7
b. Inventory—raw materials, work in process and finished goods
c. Other current assets—additional assets that are expected to be used in the normal operating year of the company (within the next 12 months)
d. Fixed assets—generally considered to be the office and manufacturing facilities used in the business
(i) These assets are recorded at their original costs and are then depreciated over their estimated economic or tax lives.
(ii) These assets remain at their originally recorded cost basis even if their value increases, as normally expected for real properties such as office and manufacturing facilities.
e. Other assets—these assets generally include:
(i) Additional assets that are not expected to be used in the normal operating year of the company
(ii) Tangible assets not used in the operations of the business
(iii)Purchased intangible assets, intellectual property and goodwill
(iv) Long-term notes receivable
C. The liabilities of the business typically consist of:
1. Current liabilities—the short-term obligations (generally payable in 12 months or less) of the company (These obligations generally consist of accounts payable, current portion of long-term obligations, payroll payable and short-term notes payable.)
2. Long-term liabilities—the long-term obligations (generally not payable in the current operating year/the next 12 months) of the company (These obligations consist of bank debt, notes payable, mortgages payable and loans from stockholders.)
3. Liabilities of the company can be interest-bearing and non-interest-bearing obligations.
a. Interest-bearing liabilities include bank debt, mortgages payable, notes payable and may or may not include loans from stockholders.
b. Non-interest bearing liabilities include accounts payable, payroll payable, accrued expenses and often loans from stockholders
4. General characteristics of bank loans, mortgage notes and notes payable to third parties:
a. They are secured interests—specific assets are generally pledged as collateral.
b. They carry terms related to repayment schedules, interest rates and covenants.

Chapter 2. Business Valuation Theory BV201: Introduction to Business Valuation
BV201r v. 6.0 (11/15) Non-authoritative © 2015 American Society of Appraisers 8
D. The ownership equity section of the company’s balance sheet generally consists of:
1. In a sole proprietorship the owner’s investment is generally referred to as the owner’s net worth or equity. The business does not have any retained earnings in the business as the business’ profits are co-mingled with the owner’s personal assets.
2. In a partnership the partner’s direct investment is referred to as partner’s equity. Any profits retained in the business are combined with previous invested amounts into the one partner’s equity account.
3. In a corporation the ownership investment is referred to as stockholder’s equity. The stockholders’ equity:
a. Is not directly allocated to individual owners in the accounting records
b. Shareholder’s equity consists of:
(i) Paid-in capital in the form of preferred or common stock (This represents the direct investments the stockholders have made in the company.)
(ii) Preferred stocks generally have preferences on dividends and distributions from the company. Therefore common shareholders receive their dividends and distributions after the preferred shareholders.
(iii) Preferred stocks most often have a specified return on investment.
(iv) Retained earnings—the current year’s net income (less any dividends paid) plus all prior years’ retained earnings
c. The equity of the business is the owners’ interest in the property after deductions are made for all liabilities.
4. Non-financial reporting perspective on the components of the balance sheet
a. Assets listed on the balance sheet from top to bottom in order of liquidity—cash, accounts receivable, inventory, fixed assets and other assets.
b. Working capital—The difference between the total amount of current assets and current liabilities is referred to as the company’s working capital.
c. Invested capital—The sum of the stockholder’s equity or partner’s capital and the interest-bearing debt is the total invested capital in the company. Invested capital represents the financing (through the use of both equity and debt) of the non-working capital assets of the company.
(i) Interest-bearing debt is referred to as the debt capital of the business. The economic return to debt holders is interest.
(ii) The stockholder’s equity section of the balance sheet is referred to as the equity capital of the business. The economic return to equity holders is profit.

Chapter 2. Business Valuation Theory BV201: Introduction to Business Valuation
BV201r v. 6.0 (11/15) Non-authoritative © 2015 American Society of Appraisers 9
(iii)Equity capital and debt capital enjoy different rights and risks and therefore generally have very different rates of expected returns.
d. Liabilities on the balance sheet are presented differently for financial reporting and invested capital analysis purposes.
(i) For financial reporting purposes liabilities are separated into current liabilities (payable in next 12 months) and long-term liabilities. The short-term portions of long-term debts (e.g., real property mortgages) are recorded in the current assets sections along with non-interest-bearing debts like accounts payable and payroll payables.
(ii) For analyzing a company’s invested capital, the liabilities are separated into two categories: current liabilities and interest-bearing debt. Long-term debt without interest obligations normally should be adjusted to fair market value which would in effect convert some of the debt repayment to interest expense.
e. Measuring returns on invested capital
(i) The returns to equity holders and invested capital holders
(ii) Income differences relate to the return on the difference between equity and debt—interest expense.
(iii)Cash flow differences relate to the differences in income plus the differences in cash flow related to debt acquisition and repayment.
Equity Cash Flow Invested Capital Cash FlowRevenue Revenue
less Cost of sales less Cost of salesless Operating expense less Operating expense= Operating income (EBIT) = Operating income (EBIT)less Interest expense= Pretax incomeless Income taxes less Taxes on EBIT= Net income = Net Operating profit after tax (NOPAT)
plus Depreciation & amortization plus Depreciation & amortization= Gross cash flow = Gross cash flowless Increase in working capital less Increase in working capitalless Capital expenditures less Capital expenditures+/- Change in debt principal
= Equity Net Cash Flow = Invested Capital Net cash flow

Chapter 2. Business Valuation Theory BV201: Introduction to Business Valuation
BV201r v. 6.0 (11/15) Non-authoritative © 2015 American Society of Appraisers 10
(iv) Example: Assume the following:
Net Income $ 10,000,000
Depreciation $ 1,400,000
Amortization $ 200,000
Interest Expense $ 3,000,000
Income Taxes $ 3,900,000
Capital Expenditures $ 1,500,000
Increase in Working Capital $ 1,800,000
Net Increase in Long-Term Debt $ 400,000
Classroom Assignment 1: Calculate the net cash flow to equity
Classroom Assignment 2: Calculate the net cash flow to invested capital
(10 minutes to do both)

Chapter 2. Business Valuation Theory BV201: Introduction to Business Valuation
BV201r v. 6.0 (11/15) Non-authoritative © 2015 American Society of Appraisers 11
Handout 2-1
Answers to Classroom Assignments 1 & 2

Chapter 2. Business Valuation Theory BV201: Introduction to Business Valuation
BV201r v. 6.0 (11/15) Non-authoritative © 2015 American Society of Appraisers 12
VI. Basic Concept of Value
A. Definition: The concept of value is analogous to that of beauty—it is a perception. Perception of what? Perception of the future usefulness or utility (the benefits) of the subject being appraised.
B. Perception, by definition, must be associated with a person or group of persons. As such, relevant parameters that must be defined in every appraisal assignment, include the following:
1. Value to “whom”? (Answering this question defines the scope of the appraisal definition.)
2. Value for what purpose, or “why”? (Answering this question defines the function of the appraisal assignment.)
3. Value as of “when”? (Answering this question defines the effective date of the appraisal.)
VII. Value vs. Cost vs. Price
A. Value
1. Value will vary depending on the perceived value to a specific type of investor. There are strategic buyers, financial buyers, vulture buyers, ego buyers, etc. The intangible asset being purchased probably has a different value to each of them.
2. The value of any financial asset is equal to the net present value of the expected future cash flows (CF) derived from the asset,
a. Discounted at the w rate of return (k), which is also referred to as the discount rate.
b. The required rate of return will vary depending on the type of buyer.
B. Cost
1. One viable perspective on the concept of cost is the fact that it simply represents a historical fact.
2. The fact that you paid X dollars for an asset one day, one year or one decade ago has little, if any, relationship to its current value. Examples: home appreciation; new car depreciation one minute after driving it off the sales lot.
3. In a business context, the balance sheet simply represents a historical tracking of costs incurred to acquire certain assets. The book value of the stockholders’ equity account is, in fact, a misnomer. It is more properly entitled book cost.
C. Price

Chapter 2. Business Valuation Theory BV201: Introduction to Business Valuation
BV201r v. 6.0 (11/15) Non-authoritative © 2015 American Society of Appraisers 13
1. Price is a term that is used in many ways. Offering price, market price, dealer’s price, FMV price, are common variations of the term.
2. Offering price simply represents a number that a seller is asking for an asset.
a. Examples: sticker price on a new auto, store price tag on a garment.
b. The unsophisticated layperson believes that if there is a wide enough gap between the (asking) price and the cost he/she will actually pay (in effect a discount), he is receiving value. This is naïve thinking.
3. In the business valuation world, price is most commonly thought of as the value received as adjusted for the terms of the transaction. For example,
a. Owner A sells his company for $1,000,000 for cash and Owner B sells his business for $1,000,000 on a non-interest-bearing note for 10 equal annual payments of $100,000.
b. Both owners paid the same price, but the underlying value is different.
D. Appraiser’s job
1. To estimate economic value
2. Achieve the above goal by rigorously exercising the three approaches available to him/her
a. In reality, the asset-based (cost) approach references a distinct historical market—the market responsible for the creation of the historical balance sheet.
b. The market approach references actual transactions in either distinct entire company acquisitions or thousands of fractional market transactions in the public stock market.
c. Even the income approach, in one very real sense, is market-based due to the fact that the risk-free rate, the equity market premium (market again) and even the appraiser’s estimate of the company-specific risk premium, are all market derived.
E. Value determination
1. The litmus test to verify that one is reasonably determining value is to invoke the three valuation approaches.
2. By correlating the results of one approach against the other two approaches, one can reasonably (and comfortably) validate that one has received (or determined) value.
a. Example: you are buying a new car at a dealership. You are being told that you are getting a great deal because of the huge cash back rebate amounting to a sizable discount from the original sticker price. Once you drive the new vehicle off the lot, it becomes a used car. Check the blue book (in essence, one piece of evidence derived from the market approach) to verify if the recommended prices for your newly acquired used car with one-mile on it closely approximates your

Chapter 2. Business Valuation Theory BV201: Introduction to Business Valuation
BV201r v. 6.0 (11/15) Non-authoritative © 2015 American Society of Appraisers 14
Ahugely discounted@ cost. If the blue book price exceeds your purchase cost, you indeed received value—as of that moment.
VIII. Standards of Value
A. Fair market value—addresses the broadest end of the spectrum of potential buyers. It is the most common standard of value used in business appraisals today, particularly for U.S. tax-related events. Two definitions are classically given for this standard:
1. The price at which the property would change hands between a willing buyer and a willing seller, when the former is not under any compulsion to buy and the latter is not under any compulsion to sell; both parties having reasonable knowledge of relevant facts (Revenue Ruling 59-60)
2. The price, expressed in terms of cash equivalents, at which property would change hands between a hypothetical willing and able buyer and a hypothetical willing and able seller acting at arm’s length in an open and unrestricted market, when neither is under compulsion to buy or sell and when both have reasonable knowledge of the relevant facts (ASA BVS definition). (Note: In Canada, the term price should be replaced with the term highest price.)
3. Key concepts:
a. Presumed ownership change at a specific date
b. Hypothetical willing buyer, willing seller
(i) Fair market value does not contemplate specific individuals as the buyer or seller.
(ii) In most cases, the presumed hypothetical buyer is interested only in a financial return from the business (the hypothetical buyer is a financial buyer) and has no special interest, such as combining the business with similar operations already owned.
(a) However, in the limited case where the pool of willing buyers for a business consists primarily of special buyers (or strategic buyers), as can be the case in periods of intense industry consolidation, the willing buyer may be defined as a special buyer, and some level of synergistic value may be incorporated into fair market value.
c. No compulsion to transact on either party’s part
d. Reasonable knowledge by both parties
e. Cash or cash equivalent price
f. Transaction costs not included
g. Generally assumed to include a covenant not to compete. However, this can be somewhat controversial in some jurisdictions.

Chapter 2. Business Valuation Theory BV201: Introduction to Business Valuation
BV201r v. 6.0 (11/15) Non-authoritative © 2015 American Society of Appraisers 15
B. Investment value—is defined as the value to a particular buyer (or small handful of buyers).
1. By definition, this extremely small and limited market is typically characterized by a premium because of the unique synergy(ies) the perceived particular buyer would realize as a result of acquiring the asset.
2. The value that a particular investor considers, on the basis of individual investment requirements such as:
a. Differences in estimates of future earning power
b. Differences in perception of the degree of risk and the required rate of return
c. Differences in financing costs and tax status
d. Synergies with other operations owned or controlled
3. Investment value is sometimes referred to as strategic value due to the synergy aspect of the transaction. An exchange transaction is contemplated in this standard of value.
C. Fair value has two different contexts:
1. Fair value for legal purposes
a. Primarily used in dissenting stockholder actions and shareholder oppression cases
b. The definition varies from jurisdiction to jurisdiction as specified in state statutes and developed in the state’s case law precedents.
c. This standard of value is legal community-based, not economically or market-based.
2. Fair value for financial reporting purposes
a. Fair value is defined as: the price that would be received to sell an asset or paid to transfer a liability in an orderly transaction between market participants at the measurement date. (FASB ASC 820, formerly SFAS 157)
b. Fair value is now an exit price (sell-side), which means the price a company would receive if they were to sell an asset in the marketplace or paid if they were to transfer the liability. Transaction costs are excluded from fair value.
c. Market participants are buyers and sellers in the principal or most advantageous market for an asset or liability. Market participants are:
(i) Unrelated (i.e., independent) to the reporting entity
(ii) Knowledgeable about factors relevant to the asset or liability and the transaction
(iii)Have the financial and legal ability to transact

Chapter 2. Business Valuation Theory BV201: Introduction to Business Valuation
BV201r v. 6.0 (11/15) Non-authoritative © 2015 American Society of Appraisers 16
(iv) Are willing to transact without compulsion
d. The “fair value hierarchy” prioritizes the inputs used in valuation and impacts the level of disclosure, but not the valuation techniques themselves (i.e., choose the best approach first, then the highest priority inputs).
(i) Level I
(a) Quoted prices in active markets for identical assets/liabilities
(ii) Level II
(a) Observable prices for similar assets/liabilities
(b) Prices for identical assets/liabilities in an inactive market
(c) Directly observable inputs for a substantially full term of an asset/liability
(d) Market inputs derived from or corroborated by observable market data
(iii)Level III
(a) Unobservable inputs based on the reporting entity’s own assumptions about the assumptions a market participant will use
e. Fair value for financial reporting purposes and fair market value are similar concepts, although differences can exist. For example, FASB Accounting Standards Codification (“ASC”) Topic 820 specifically does not allow for blockage discounts.
f. Fair value assumes the highest and best use for an asset. Reporting entities need to determine if highest and best use for an asset is in-use or in-exchange (valuation basis), regardless of management’s intended use for the asset. (Market participant perspective)
(i) Highest and Best Use is In-Use if:
(a) Asset has maximum value in combination with other assets as a group (installed or configured)
(b) Typically non-financial assets
(ii) Highest and Best Use is In-Exchange if:
(a) Asset has maximum value on a stand-alone basis
(b) Typically financial assets
g. There are many other issues that need to be considered in determining fair value for financial reporting purposes, which are beyond the scope of this course.

Chapter 2. Business Valuation Theory BV201: Introduction to Business Valuation
BV201r v. 6.0 (11/15) Non-authoritative © 2015 American Society of Appraisers 17
D. Intrinsic value
1. The value that a prudent investor considers, on the basis of an evaluation or available facts, to be the “true” or “real” value that will become the market value when other investors reach the same conclusion
2. What the value should be based on analysis of all the fundamental factors inherent in the business or the investment
3. Does not consider extreme aspects of market conditions and behavior. (e.g., the value of any particular stock on October 20, 1987—the Monday after the computer-driven event of Black Friday)
IX. Premise of Value
A. Going concern value premise—All the foregoing definitions of value assume an ongoing business, though FMV could also be a liquidation value.
B. Liquidation value premise—The appraiser / prudent investor (buyer) assumes the business will NOT continue in its present form and will be dismantled. This dismantling is driven by the belief that the business is better off dead than alive. There are two forms of liquidation:
1. Orderly liquidation
a. The expected gross proceeds from the sale of the asset:
(i) Held under orderly sales conditions
(ii) Given a reasonable period of time in which to find purchasers
(iii)Considering a complete sale of all assets as is, where is, with the buyer assuming all costs of removal
(iv) With all sales free and clear of all liens and encumbrances
(v) With the seller not acting under compulsion
(vi) Under current economic conditions, as of a specific date

Chapter 2. Business Valuation Theory BV201: Introduction to Business Valuation
BV201r v. 6.0 (11/15) Non-authoritative © 2015 American Society of Appraisers 18
2. Forced liquidation
a. The expected gross proceeds from the sale of the asset:
(i) That could be realized at a properly advertised and conducted public auction held under forced sale conditions
(ii) With a sense of immediacy
(a) Lack of adequate time to find purchasers
(b) Fire sale values apply
(iii)Under current economic conditions, as of a specific date
3. Premise of value—value in exchange vs. value in use
a. The premise of value in exchange presupposes a proposed transaction of the property, wherein the property actually changes ownership hands. This value premise references market conditions external to the company being appraised. As such, the value standards of investment value, fair market value and liquidation value are properly classified under this premise.
b. The premise value in use does not presuppose a proposed transaction of the property, whereby the property actually changes ownership hands. It does not reference market or economic conditions external to the company being appraised. It assumes that the current economic return (profitability) of the company being appraised is of sufficient magnitude to provide a reasonable basis to a prudent investor that the company has adequate financial strength to continue operating into the future.
c. This value in use premise is sometimes (confusingly) referred to as fair market value in continued use (because no exchange market vehicle is contemplated). By definition, this premise is softer in nature than the value in exchange premise - which has hard market contours defining its shape.
X. Basic Variables Affecting Value (These are the things we analyze when we do our appraisals.)
A. Risk/return analysis - Generally, the higher the risk associated with an investment, the higher the return an investor will require to make the investment. Therefore, much of our analysis focuses on relative risk assessment (There are several different types of risk - business, financial, and liquidity.)
B. Business Risk is any threat to achieving an organization’s business objectives. It is the likelihood that an event or action may negatively affect the entity.
1. Specific types of business risks

Chapter 2. Business Valuation Theory BV201: Introduction to Business Valuation
BV201r v. 6.0 (11/15) Non-authoritative © 2015 American Society of Appraisers 19
a. Operational risk—uncertainty or volatility of operating flows: revenue, earnings and cash flows
b. Turnover risk—the decline in return on assets (ROA) due to the underutilization of assets
c. Financial risk—the fluctuation of earnings available to common shareholders, measured by calculating the degree of financial leverage and various leverage, coverage and liquidity ratios.
d. Liquidity risk—the ease with which the asset can be converted to cash (In business valuation, this is typically quantified in the discount for lack of marketability.)
e. Going concern business risks
(i) Going concern—the ability of the company to continue in operations for the foreseeable future
(ii) Going concern business risks are created by internal and external factors.
(a) External risk factors include:
(1) Economic conditions and outlook (interest rates, inflation, etc.).
(2) Industry conditions and outlook, including competitive analysis (expected growth).
(3) Market rates of return (risk free rate, equity risk premium, industry and company-specified risk).
(b) Internal risk factors
(1) Business background and current operations
(2) Earnings history of the firm (stability vs. volatility)
(3) Future earnings expectations (high growth vs. low growth).
(4) Balance sheet - financial strength (how leveraged).
(5) Qualitative factors, such as management depth, customer concentration, security of supply
(c) Examples of going concern risks:
(1) A decline in the demand for industry products, which may affect the ability of the company to continue operations

Chapter 2. Business Valuation Theory BV201: Introduction to Business Valuation
BV201r v. 6.0 (11/15) Non-authoritative © 2015 American Society of Appraisers 20
(2) A company’s inability to attract new debt or equity capital, which may affect the company’s ability to continue operations.
(3) When a company can no longer continue operations, the assets of the company are liquidated and the financial obligations are first satisfied, with the common shareholders receiving any proceeds remaining, after all other claims have been paid.
XI. The Role of IRS Rulings
A. IRS revenue rulings provide important guidelines for specific valuation issues.
B. The following IRS Revenue Rulings (RR) should be copied and filed as part of your valuation library.
1. Revenue Ruling 59-60 highlights key items to be considered in valuing a business. Exhibit 2-2.
a. Nature of the business and history of the enterprise since its inception
b. The economic outlook in general and the condition and outlook of the specific industry in particular
c. The book value of the stock and the financial condition of the business
d. The earning capacity of the company
e. The dividend paying capacity
f. Whether or not the enterprise has goodwill or other intangible value
g. Sales of the stock and size of the block of stock to be valued
h. The market price of the stocks of corporations engaged in the same or a similar line of business having their stocks actively traded in a free and open market, either on an exchange or over-the-counter
2. Revenue Ruling 65-192 states that the theory used in RR 59-60 applies to income and other taxes as well as estate and gift taxes.
3. Revenue Ruling 65-193 approves only those valuation methods that can be used to separately determine tangible and intangible asset values.
4. Revenue Procedure 66-49 deals with the methods the IRS uses to arrive at valuations.
5. Revenue Ruling 68-609 deals with the calculation of return on tangible assets and capitalization rates for intangibles when a formula approach is selected.
6. Revenue Ruling 77-12 describes the acceptable methods used for allocating a lump-sum purchase price to inventory values.

Chapter 2. Business Valuation Theory BV201: Introduction to Business Valuation
BV201r v. 6.0 (11/15) Non-authoritative © 2015 American Society of Appraisers 21
7. Revenue Ruling 77-287 provides information on valuation, for tax purposes, of securities that cannot be resold because federal security laws restrict their marketability (marketability discounts).
8. Revenue Ruling 81-253 deals with the IRS’s position on the allowance of minority discounts in valuing stock of a closely held family corporation transferred to the donor’s children for federal gift tax purposes. (Superseded by RR 93-12.)
9. Revenue Ruling 83-120 clarifies RR 59-60 with additional factors to be considered in valuing the common and preferred stock of a closely held company for gift taxes and re-capitalization purposes.
10. Revenue Ruling 85-75 states that the IRS is not bound to accept values that it accepted for estate tax returns as the basis for determining income taxes on capital gains from a later sale of the assets or depreciation expenses allowed.
11. Revenue Ruling 93-12 allows minority discounts to be applied when valuing minority interests of family members in a closely held corporation. Prior to this, the IRS used family attribution rules to disallow these minority discounts. (Supersedes RR 81-253.)
C. There are many other revenue rulings that an appraiser will have to be familiar with. For those appraisers who are not CPAs with a tax background, it is advisable that you work in conjunction with a tax specialist if your assignment involves a tax-related purpose.
XII. The Role of Key Court Cases
A. Appraisers should be aware of court cases, either federal or individual state decisions, which pertain to the type of valuation they are performing.
B. Helpful aspects of court decisions
1. Interpret standard of value.
2. Indicate important factors to consider.
3. Suggest approaches to value that are persuasive.
C. However, caution must be used in applying these decisions. Case decisions are very fact-specific and may not apply to your subject company. Judges are not valuation experts.
D. While court cases are important to study, they should not establish valuation theory. We, not court judges, are the experts. However, they often establish binding legal precedent.
XIII. The Role of Financial Accounting Standards Board (“FASB”) Guidance
A. FASB Codification Project
1. On June 30, 2009, the FASB issued FASB Statement No. 168, The FASB Accounting Standards Codification™ and the Hierarchy of Generally Accepted Accounting Principles—a replacement of FASB Statement No. 162. On the effective date of this

Chapter 2. Business Valuation Theory BV201: Introduction to Business Valuation
BV201r v. 6.0 (11/15) Non-authoritative © 2015 American Society of Appraisers 22
standard, FASB Accounting Standards Codification™ (ASC) will become the source of authoritative U.S. accounting and reporting standards for nongovernmental entities, in addition to guidance issued by the Securities and Exchange Commission (SEC). FASB ASC significantly changes the way financial statement preparers, auditors, and academics perform accounting research. Each ASC is referred to as a “Topic.” This statement is effective for financial statements issued for interim and annual periods ending after September 15, 2009.
B. Key FASB ASC Topics.
1. FASB ASC Topic 820, Fair Value Measurements and Disclosures (formerly SFAS 157)
a. Establishes a framework for “how” to apply fair value concepts. Does not provide guidance on “what” to value or “when”.
b. Discussed further in the Standards of Value section.
2. FASB ASC Topic 805 (formerly SFAS 141R) applies to business combination and performing purchase price allocation analyses.
3. FASB ASC Topic 350-20 (formerly SFAS 142) applies to impairment testing of goodwill.
4. FASB ASC Topic 718 (formerly SFAS 123R) covers stock based compensation.
5. FASB ASC Topic 360 (formerly SFAS 144) deals with impairment testing for long-lived assets such as amortizable intangible assets and property, plant and equipment. It is also referenced in FASB ASC Topic 350-30.
C. The Role of SEC Speeches
1. Appraisers should be aware of relevant speeches made by the staff of the SEC. While they may not represent authoritative guidance, they can provide useful insight as to how the SEC views important issues. Speeches are available on the SEC web site (link as of November 2009: http://www.sec.gov/news/speech.shtml).
2. However, caution must be used when reviewing these speeches, as they do not represent authoritative guidance and facts and circumstances vary in each situation. Not only do facts and circumstances vary, but market conditions and best practices change over time. Information in these speeches should not supersede the judgment and expertise of the appraiser.
XIV. Steps of a Business Appraisal
A. Define the appraisal assignment
B. Gather the data
C. Analyze the data

Chapter 2. Business Valuation Theory BV201: Introduction to Business Valuation
BV201r v. 6.0 (11/15) Non-authoritative © 2015 American Society of Appraisers 23
D. Arrive at a value conclusion
E. Write the report

Chapter 2. Business Valuation Theory BV201: Introduction to Business Valuation
BV201r v. 6.0 (11/15) Non-authoritative © 2015 American Society of Appraisers 24
Classroom Assignment 3:
Review Exhibit 2-2, Revenue Ruling 59-60, at the end
of this chapter
Chapter 2. Business Valuation Theory BV201: Introduction to Business Valuation
BV201r v. 6.0 (11/15) Non-authoritative © 2015 American Society of Appraisers 25
Exhibit 2-1
Business Appraiser or Real Property
Which to Use?

Chapter 2. Business Valuation Theory BV201: Introduction to Business Valuation
BV201r v. 6.0 (11/15) Non-authoritative © 2015 American Society of Appraisers 26
American Society of Appraisers
R E L E A S E December 18, 1991
Business Appraiser or Real Property Appraiser? Determining Which to Use
Introduction
As in so many other professions, the requirement for specialists in the appraisal field is an absolute necessity. Real property appraisers have the necessary real estate background and training to do real property appraisals. Similarly, business appraisers have the requisite business credentials and financial training to do business appraisals. While they share some common appraisal standards, the professional disciplines and the required knowledge differ. The purpose of this American Society of Appraisers Release is to assist the appraiser user in determining when a business appraisal and/or a real property appraisal is required. The release is divided into the following five sections:
I. The Basic Difference Between Business Appraisals and Real Property Appraisals
II. Knowledge and Qualifications of Business Appraisers and Real Property Appraisers
III. Similarities and Differences: Business Appraisal and Real Property Appraisal Approaches
IV. Business Appraisal or Real Property Appraisal Check List
V. Examples of Business Appraisal and/or Real Property Appraisal Situations
I. The Basic Difference Between Business Appraisals and Real Property Appraisals
There are significant differences between business appraisals and real property appraisals. The American Society of Appraisers has a major and separate appraisal discipline for each type of appraisal. The need for this distinction flows from the fact that in most cases what is being appraised is quite different.
The Standards Board of the Appraisal Foundation clearly recognizes the distinction between real property, personal property and business appraisals. In Uniform Standards of Professional Appraisal Practices, there are separate standards covering real property (Standards 1 through 6), personal property (Standards 7 and 8) and business appraisal/valuation (Standards 9 and 10).
Real property appraisal involves the valuation of land, improvements and associated rights. Business appraisal has to do with the value inherent in ownership of a commercial, industrial or
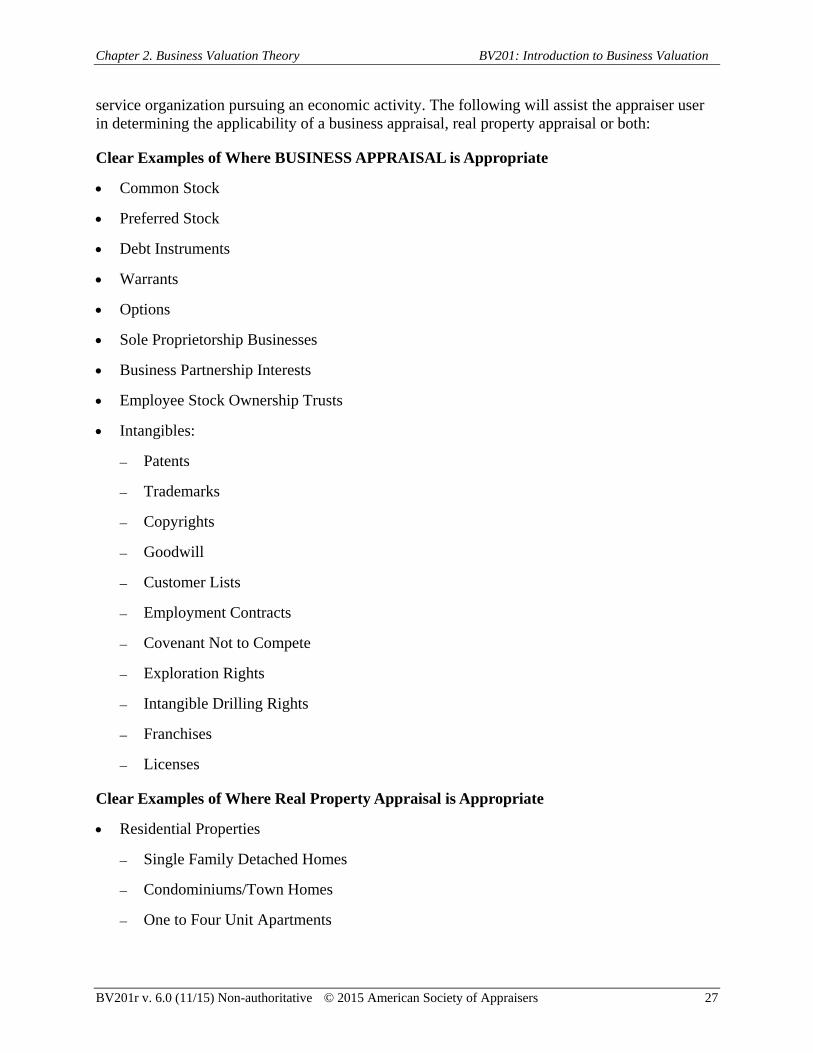
Chapter 2. Business Valuation Theory BV201: Introduction to Business Valuation
BV201r v. 6.0 (11/15) Non-authoritative © 2015 American Society of Appraisers 27
service organization pursuing an economic activity. The following will assist the appraiser user in determining the applicability of a business appraisal, real property appraisal or both:
Clear Examples of Where BUSINESS APPRAISAL is Appropriate
Common Stock
Preferred Stock
Debt Instruments
Warrants
Options
Sole Proprietorship Businesses
Business Partnership Interests
Employee Stock Ownership Trusts
Intangibles:
– Patents
– Trademarks
– Copyrights
– Goodwill
– Customer Lists
– Employment Contracts
– Covenant Not to Compete
– Exploration Rights
– Intangible Drilling Rights
– Franchises
– Licenses
Clear Examples of Where Real Property Appraisal is Appropriate
Residential Properties
– Single Family Detached Homes
– Condominiums/Town Homes
– One to Four Unit Apartments
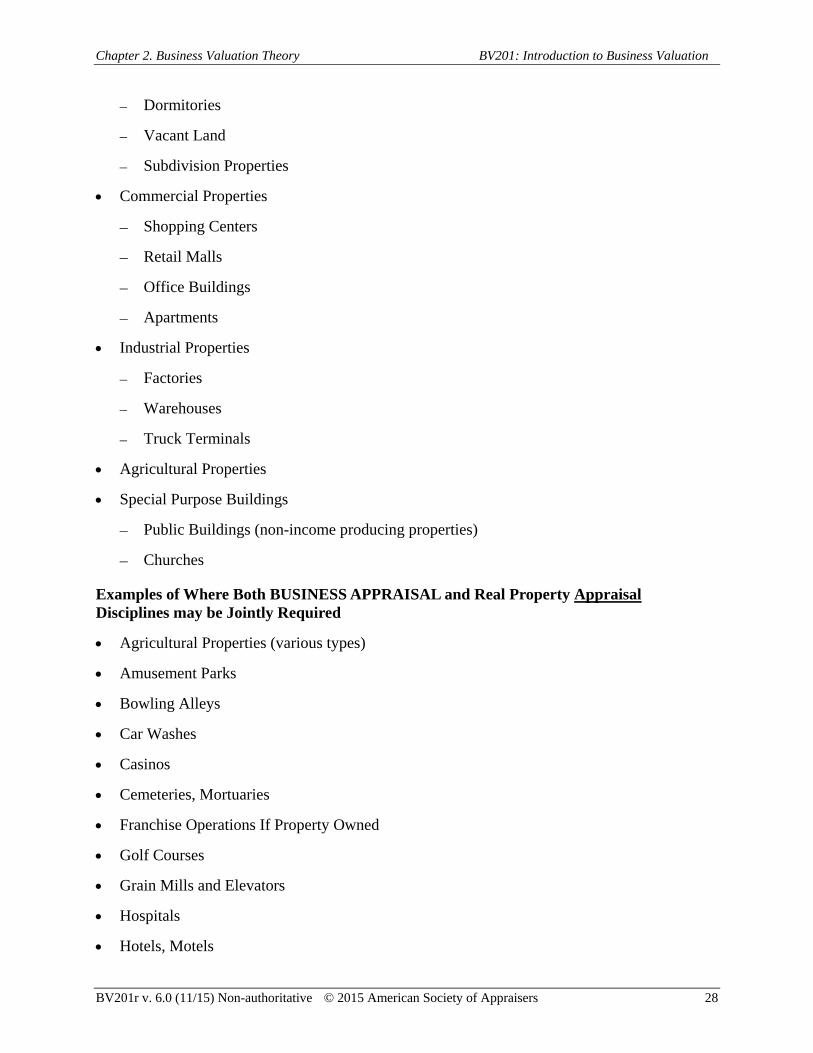
Chapter 2. Business Valuation Theory BV201: Introduction to Business Valuation
BV201r v. 6.0 (11/15) Non-authoritative © 2015 American Society of Appraisers 28
– Dormitories
– Vacant Land
– Subdivision Properties
Commercial Properties
– Shopping Centers
– Retail Malls
– Office Buildings
– Apartments
Industrial Properties
– Factories
– Warehouses
– Truck Terminals
Agricultural Properties
Special Purpose Buildings
– Public Buildings (non-income producing properties)
– Churches
Examples of Where Both BUSINESS APPRAISAL and Real Property Appraisal Disciplines may be Jointly Required
Agricultural Properties (various types)
Amusement Parks
Bowling Alleys
Car Washes
Casinos
Cemeteries, Mortuaries
Franchise Operations If Property Owned
Golf Courses
Grain Mills and Elevators
Hospitals
Hotels, Motels

Chapter 2. Business Valuation Theory BV201: Introduction to Business Valuation
BV201r v. 6.0 (11/15) Non-authoritative © 2015 American Society of Appraisers 29
Marinas
Mobile Home Parks
Nursing Homes
Private Airports
Recycling Centers
Restaurants (Going Concern)
Service Stations
Ski Resorts with Residential Land
Theatres
Time Share Ownership Interest
These businesses are distinguished by the fact that the real estate is a special purpose property and is a major asset of the business.
Many certified commercial real property appraisers have developed the necessary credentials, experience and expertise to analyze both the business values and the real estate values in the special-purpose properties listed above. Nevertheless, the purchaser of valuation services should be aware that, in the above types of assets, both the services of a business appraiser and a real property appraiser may be needed.
II. Knowledge and Qualifications of Business Appraisers and Real Property Appraisers
The business appraiser draws heavily on the theory and practice of corporate finance and securities analysis in addition to the requisite understanding of economics, business management and accounting. Typically, but not always, a business appraiser may have a business oriented degree supplemented by an advanced degree. Some of these individuals will also have certification as Certified Public Accountants (CPA) or Chartered Financial Analysts (CFA), as well as business appraisal credentials. The umbrella labeled “corporate finance” really covers the financing of all kinds of business entities, regardless of whether they happen to be in the form of a corporation, partnership or sole proprietorship. The basic thrust of business appraisal is the appraisal of an interest in an operating entity.
A real property appraiser should have detailed knowledge of real property appraisal techniques; “real property appraisers must be more or less conversant with the fields of building, civil engineering, architecture, surveying, forestry, soil science, agriculture, accounting, real estate brokerage, lending, urban land economics, government real estate regulations and real estate law” (from a 1989 paper prepared for the Wisconsin Legislature by the Wisconsin Appraisers Coalition entitled, “What Appraisers Do”). A real property appraiser also needs an understanding of the variables and characteristics of the income aspects of real estate. This includes an understanding of financing and of required rates of return and differential risks attached to various types of investments.

Chapter 2. Business Valuation Theory BV201: Introduction to Business Valuation
BV201r v. 6.0 (11/15) Non-authoritative © 2015 American Society of Appraisers 30
III. Similarities and Differences: Business Appraisal and Real Property Appraisal Approaches
Both business and real property appraisers use the three basic approaches of “cost,” “market,” and “income” in varying degrees when valuing businesses or real estate. In business appraisal, the “cost” (or “asset-based”) approach is used when an estimate of the fair market value of each of the separate individual underlying assets is required, such as in a liquidation valuation, a purchase price allocation, or where real estate is a material non-operating asset. In such cases, a real property appraisal will be required for the real estate portion of the value. Typically, however, the business is valued as a whole and/or a minority interest is valued, wherein the “market” or “income” approaches are given a great deal more weight, if not all the weight, in determining the final value amount, and a separate real property appraisal is not required.
In other words, the business appraiser can value a business using the “market” approach or “income” approaches, such as capitalization of earnings or discounted cash flow, without a separate real property appraisal, Also, in those instances where there is a fair market value lease, a real property appraisal is not necessary, since the business appraisal approaches incorporate the leasehold value. In cases where the lease is not at fair market value, it may be necessary to secure the assistance of a real property appraiser to develop a fair market rent for the operating real estate.
The business appraiser will make use of a market approach, comparing guideline companies to the subject business. He/she will also rely heavily on various income approaches to convert an earnings stream of the business into an indicated value for the business.
The real property appraiser will use the market or sales comparison approach to compare similar real estate assets. He/she will use the income approach and develop a fair rental value for the real estate assets only.
The business appraiser may need the services of a real property appraiser when a liquidation valuation is indicated and where real estate assets are either owned or leased. An appraisal for purchase price allocation will require a real estate valuation of owned real estate or for favorable leases. If there are non-operating real estate assets, there will be need for a separate real property appraisal. In many cases, where owned real estate is an operating asset, it may be most appropriate to remove this asset and value it separately, then appraise the business by setting a fair rent rate on the real estate. A real property appraiser is best equipped to do this.
IV. Business Appraisal or Real Property Appraisal Checklist
The following checklist helps determine which discipline—business appraisal or real property appraisal—is the pertinent appraisal discipline when valuing an entity. In some cases, as indicated by the checklist, both disciplines may be required.

Chapter 2. Business Valuation Theory BV201: Introduction to Business Valuation
BV201r v. 6.0 (11/15) Non-authoritative © 2015 American Society of Appraisers 31
A Business Appraisal A Real Property Appraisal
Is the entity to be appraised:
[ ] A commercial, industrial or service organization pursuing an economic activity other than the sole operation of real estate?
[ ] A residential or commercial property (such as a single family residence, apartment house or office building)?
[ ] An equity interest (such as a security in a corporation or partnership interest)?
[ ] An interest in real estate (such as tenant in common or joint tenancy)?
[ ] A fractional or minority interest (i.e., less than 100 percent of the entity)?
[ ] A whole or partial interest in real estate?
[ ] Difficult to split up (perhaps because the owners do not have a direct claim on the assets)?
[ ] Owners have a direct claim on their real estate interest?
Does the entity to be appraised:
[ ] Derive its revenues from providing goods or services? [ ] Derive its revenues from the use or leasing of real estate?
[ ] Primarily use assets such as machinery, equipment, employee skill and talent in providing goods or services, and depend on assets other than or in addition to real estate to generate earnings?
[ ] Use real estate as its primary asset?
[ ] Conduct an economic activity which is more important than the location of the real estate where the economic activity is being conducted?
[ ] Conduct an activity wherein the location of the real estate is a primary valuation factor?
[ ] Likely have a value that fluctuates with conditions in its industry (as opposed to fluctuations in the real estate market)?
[ ] Have a value which fluctuates primarily with the real estate market?
Does the entity have:
[ ] Intangible assets such as patents, trademarks, copyrights, franchises, licenses, customer lists, employment contracts, non-compete covenants and goodwill which the entity uses to generate earnings?
[ ] Assets that are primarily tangible real estate. Insignificant or no tangible assets?
[ ] Substantial assets that can be moved? [ ] Real estate and real estate related assets that cannot be moved?
[ ] A variety of tangible and intangible assets which interact to produce economic activity?
[ ] Primarily tangible real estate assets that produce the economic activity in the form of lease revenue or real estate use?
[ ] Significant operating expenses such as management, labor, marketing, advertising, research and transportation?
[ ] Operating expenses that are limited to real estate oriented expenses such as property management and maintenance?

Chapter 2. Business Valuation Theory BV201: Introduction to Business Valuation
BV201r v. 6.0 (11/15) Non-authoritative © 2015 American Society of Appraisers 32
V. Examples of Business Appraisal and/or Real Property Appraisal Situations
1. A REAL PROPERTY APPRAISAL
a) Mr. A owns fee simple title to a small shopping center that he personally manages. Mr. A is getting divorced and the value of his ownership interest in the shopping center is an issue in the dissolution of marriage action.
2. A BUSINESS APPRAISAL
a) Mr. X owns, as a sole proprietor, a retail store that bakes and sells cookies. The cookie business leases a store in Mr. A’s shopping center. Mr. X is preparing a personal financial statement for the bank and thus wishes to know the value of his business.
3. A BUSINESS APPRAISAL
a) Mr. X is interested in selling one half of his cookie store to his brother-in-law. Mr. X and his brother-in-law have agreed to hire a competent appraiser to set the price for the sale of a 50 percent interest in the cookie store.
4. A REAL PROPERTY APPRAISAL
a) Ms. L has just received her current tax assessment for her primary residence from the local assessor’s office. The estimated market value of her home and the resulting property taxes Increased 100% from the prior year. She is alarmed and seeks a market value appraisal to check the reasonableness of the assessor’s value estimate.
5. A BUSINESS APPRAISAL AND A MACHINERY & EQUIPMENT APPRAISAL
a) Mr. B owns 75 percent of the outstanding stock of B Ski Resort, Inc., which owns and operates three ski resorts. All three ski resorts are more than five years old and have operated profitably in at least three of the last five years. B Ski Resort, Inc. wishes to borrow operating funds from a national bank and will pledge accounts receivable, inventory and ski lift equipment on the loan. The real property is already pledged on an existing long-term loan. Mr. B will also personally guarantee the debt.
6. A BUSINESS APPRAISAL AND A REAL PROPERTY APPRAISAL
a) Mr. C is a limited partner owning 10 percent of the limited partnership interests in capital, income and distributions in Apartments Limited, a Limited Partnership, which has as its sole asset a 1,000 unit apartment complex. Mr. C is negotiating with the general partner of Large Apartment Limited whereby the general partner would purchase Mr. C’s limited partnership interest.
7. A BUSINESS APPRAISAL AND A REAL PROPERTY APPRAISAL
a) The valuation of 100 percent of the issued and outstanding stock of Corporation D, which was owned by Mr. D, who died. The purpose of the valuation is for Federal Estate Tax purpose. Corporation D owns 1,200 acres of farmland, all of which is leased on a sharecrop arrangement to individual farm tenants. Reference, Revenue

Chapter 2. Business Valuation Theory BV201: Introduction to Business Valuation
BV201r v. 6.0 (11/15) Non-authoritative © 2015 American Society of Appraisers 33
Ruling #59-60.
8. A BUSINESS APPRAISAL
a) Mr. D’s estate distributes the stock of Corporation D to Mr. D’s four sons in equal 25 percent interests. Shortly after receiving his distribution of 25 percent of Corporation D stock, son #1 dies, and it is now necessary to value his 25 percent interest in Corporation D for Estate Tax purposes.
9. A BUSINESS APPRAISAL
a) Mr. Z, one of the tenants sharecropping the farms, also operates a custom farming business in which he performs various farming tasks for the operators of farms for a fee. Mr. Z is interested in bringing his son into an ownership position in this company which was incorporated two years ago. The corporation owns no land but stores machinery on the rented farm. It has elected to be taxed under Chapter “S” of the Internal Revenue Code.
10. A BUSINESS APPRAISAL
a) The F & F Limited Partnership owns four video rental stores, all located in the same city. Mr. F3 is a limited partner in the F & F Limited Partnership. He owns 10 percent of the capital and has a right to receive 10 percent of the distributions and 10 percent of the net income and expense. Mr. F3 intends to gift his limited partnership interest in F & F Limited Partnership to his daughter.
11. A REAL PROPERIY APPRAISAL
a) Mr. C is a speculative office developer. He has purchased five acres of vacant land and desires to construct a 25,000 square foot suburban office building. He has approached Main Street Savings and Loan regarding an interim construction loan, as well as a permanent mortgage loan. The S8cL has indicated that any loan approval would be subject to a market value appraisal.
12. A BUSINESS APPRAISAL
a) Mr. G owns 1 million shares out of the 100 million shares outstanding of the G Corporation, whose stock is publicly traded on the New York Stock Exchange. Mr. G serves as Chairman of the Board of the company. The closing price for Mr. G’s stock on December 31, 19SO was $10 per share. Mr. G gifted 10,000 shares to each of three children on December 31, 1990. One of the children is a minor, one is an officer and the third is an employee but not an officer or director of G Corporation.
13. A REAL PROPERTY APPRAISAL
a) Attorney A represents ABC Limited Partnership, whose general partner has just placed the partnership into Chapter 11 bankruptcy. The sole asset of the partnership is a 1,200 acre parcel of unimproved land. The first lien holder is claiming that there is no equity in the partnership, and thus he should be allowed to complete foreclosure and take ownership possession of the real property asset. Attorney A needs a market value appraisal to ascertain the merits of the first lienholder’s claim.

Chapter 2. Business Valuation Theory BV201: Introduction to Business Valuation
BV201r v. 6.0 (11/15) Non-authoritative © 2015 American Society of Appraisers 34
14. A BUSINESS APPRAISAL
a) Lawyer H is a senior partner in the H, X, Y & Z law firm, which has four partners and six associates. The law firm leases its office facilities from an independent third party. The firm is actively involved in various facets of the practice of law, and its attorneys consider themselves to be general practitioners. Mr. H is getting divorced, and the value of his interest in the partnership is an issue in the dissolution of marriage action.
15. A REAL PROPERTY APPRAISAL
a) Mr. P owns a 15 unit apartment complex 200 feet from a mayor highway. Plans call for the state to widen the highway, which will then come within 15 feet of Mr. P’s apartment complex. Mr. P needs an appraisal to determine the fair market value of the property which the state is taking, as well as a determination of the loss in value of his remaining property.
16. A BUSINESS APPRAISAL
a) An employee stock ownership plan owns 13 percent of the issued and outstanding common stock of Corporation A. Corporation A is actively involved in the manufacture of snow shovels. Adjacent to the company’s manufacturing facility is a 12 acre parcel of undeveloped land which the company intends to use for future plant expansion.
b) Reference Foltz vs. U.S. News. where the court held that it was proper to value the minority interest owned by the profit sharing plan using an earnings approach without separately valuing the excess land, as the minority shareholders had no right to either force the company to sell such land or order the distribution of proceeds even if the land was sold. Further reference Revenue Ruling #59-60 (2) (a) and Department of Labor adequate consideration guidelines.
17. A REAL PROPERTYAPPRAISAL
a) Mr. T, Mr. C and Mr. D each own a 33-1/3 percent undivided interest in a 200 acre parcel of farmland. Due to a disagreement, Mr. T and Mr. C wish to buy out Mr. D’s undivided 33-1/3 percent interest and need to obtain a fair market value appraisal of Mr. D’s interest. The applicable state law dictates that Mr. D will receive a pro-rata share of the total value.
18. A BUSINESS APPRAISAL AND A REAL PROPERTY APPRAISAL
a) A restaurant owner operates a successful restaurant on a parcel of real estate that she owns. She wants to sell both the restaurant as a going concern and the real estate. The real property appraiser will typically separately value the real estate and establish a fair market rent. The business appraiser will use the fair rent figure provided by the real property appraiser to value the business. When he substitutes fair rent, the business appraiser will remove all real estate assets and expenses connected with the ownership of the real estate.

Chapter 2. Business Valuation Theory BV201: Introduction to Business Valuation
BV201r v. 6.0 (11/15) Non-authoritative © 2015 American Society of Appraisers 35
19. A BUSINESS APPRAISAL AND A REAL PROPERTY APPRAISAL
a) A casino owner and his spouse are pursuing marital dissolution in a community property state. They own several casinos, hotels and restaurants. The business appraiser will work in concert with the real property appraiser to issue one report following the standards set forth in the Uniform Standards of Professional Appraisal Practice (USPAP). The business appraisal expert will focus on the statistical testing of the casinos’ cash flow streams using regression analysis, and the development of the discount and capitalization rates using public market comparables and the Capital Asset Pricing Model (CAPM). The real property appraiser will focus on the hotels and their locations while also reviewing the results of the casinos’ operating forecasts, and relating them to the hotel forecasts. The real property appraiser will establish the fair market value rent for the facilities, including the restaurants, and the business appraiser will use this rent in determining the business value of the business facilities. The real property appraiser and business appraiser will jointly summarize their valuation study and value conclusions in a thorough report. Both the real property appraiser and business appraiser will sign the report as individuals.
For more information, contact: American Society of Appraisers 555 Herndon Pkwy, Ste 125 Herndon, VA 20170 (703) 478-2228 • FAX (703) 742-8471

Chapter 2. Business Valuation Theory BV201: Introduction to Business Valuation
BV201r v. 6.0 (11/15) Non-authoritative © 2015 American Society of Appraisers 36
Exhibit 2-2
Revenue Ruling 59-60

Chapter 2. Business Valuation Theory BV201: Introduction to Business Valuation
BV201r v. 6.0 (11/15) Non-authoritative © 2015 American Society of Appraisers 37
IRS Revenue Ruling 59-60
Rev. Rul. 59-60, 1959-1 CB 237 -- IRC Sec. 2031 (Also Section 2512.) (Also Part II, Sections 811(k), 1005, Regulations 105, Section 81.10.)
Reference(s): Code Sec. 2031 Reg § 20.2031-2
In valuing the stock of closely held corporations, or the stock of corporations where market quotations are not available, all other available financial data, as well as all relevant factors affecting the fair market value must be considered for estate tax and gift tax purposes. No general formula may be given that is applicable to the many different valuation situations arising in the valuation of such stock. However, the general approach, methods, and factors which must be considered in valuing such securities are outlined.
Revenue Ruling 54-77, C.B. 1954-1, 187, superseded.
Full Text:
Section 1. Purpose.
The purpose of this Revenue Ruling is to outline and review in general the approach, methods and factors to be considered in valuing shares of the capital stock of closely held corporations for estate tax and gift tax purposes. The methods discussed herein will apply likewise to the valuation of corporate stocks on which market quotations are either unavailable or are of such scarcity that they do not reflect the fair market value.
Sec. 2. Background and Definitions.
.01 All valuations must be made in accordance with the applicable provisions of the Internal Revenue Code of 1954 and the Federal Estate Tax and Gift Tax Regulations. Sections 2031(a), 2032 and 2512(a) of the 1954 Code (sections 811 and 1005 of the 1939 Code) require that the property to be included in the gross estate, or made the subject of a gift, shall be taxed on the basis of the value of the property at the time of death of the decedent, the alternate date if so elected, or the date of gift.
.02 Section 20.2031-1(b) of the Estate Tax Regulations (section 81.10 of the Estate Tax Regulations 105) and section 25.2512-1 of the Gift Tax Regulations (section 86.19 of Gift Tax Regulations 108) define fair market value, in effect, as the price at which the property would change hands between a willing buyer and a willing seller when the former is not under any compulsion to buy and the latter is not under any compulsion to sell, both parties having reasonable knowledge of relevant facts. Court decisions frequently state in addition that the hypothetical buyer and seller are assumed to be able, as well as willing, to trade and to be well informed about the property and concerning the market for such property.
.03 Closely held corporations are those corporations the shares of which are owned by a relatively limited number of stockholders. Often the entire stock issue is held by one family. The result of this situation is that little, if any, trading in the shares takes place. There is, therefore, no established market for the stock and such sales as occur at irregular intervals seldom reflect all of the elements of a representative transaction as defined by the term “fair market value.”
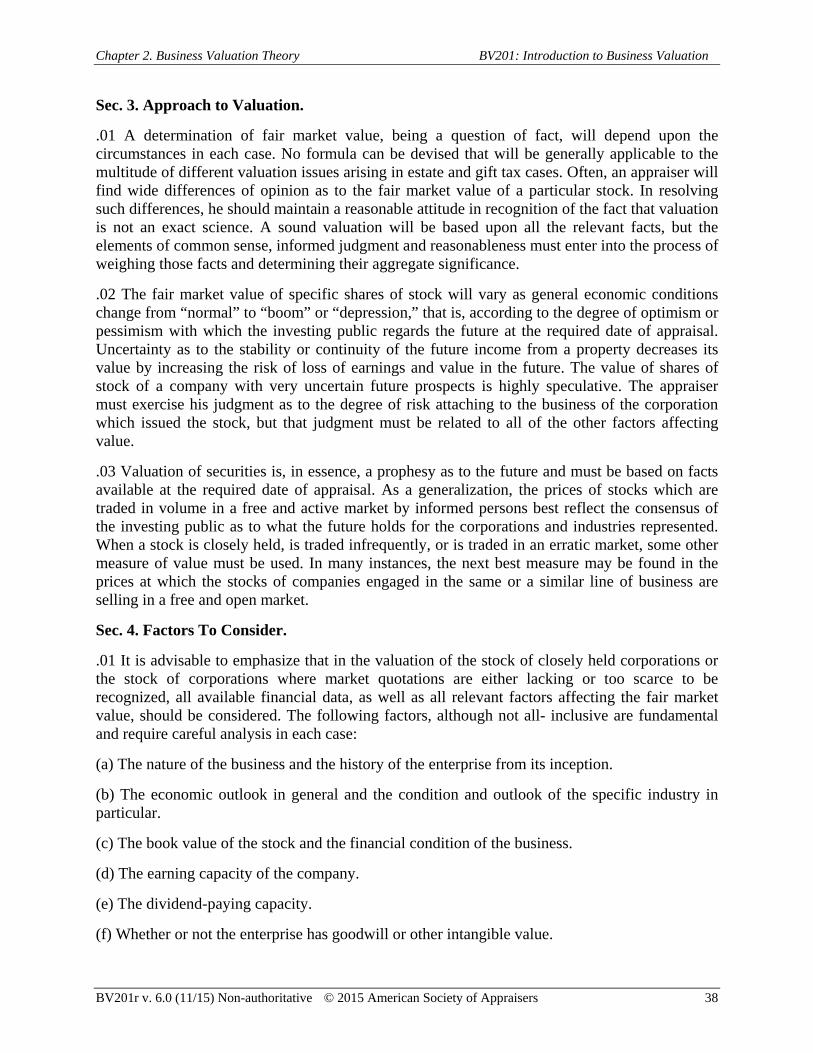
Chapter 2. Business Valuation Theory BV201: Introduction to Business Valuation
BV201r v. 6.0 (11/15) Non-authoritative © 2015 American Society of Appraisers 38
Sec. 3. Approach to Valuation.
.01 A determination of fair market value, being a question of fact, will depend upon the circumstances in each case. No formula can be devised that will be generally applicable to the multitude of different valuation issues arising in estate and gift tax cases. Often, an appraiser will find wide differences of opinion as to the fair market value of a particular stock. In resolving such differences, he should maintain a reasonable attitude in recognition of the fact that valuation is not an exact science. A sound valuation will be based upon all the relevant facts, but the elements of common sense, informed judgment and reasonableness must enter into the process of weighing those facts and determining their aggregate significance.
.02 The fair market value of specific shares of stock will vary as general economic conditions change from “normal” to “boom” or “depression,” that is, according to the degree of optimism or pessimism with which the investing public regards the future at the required date of appraisal. Uncertainty as to the stability or continuity of the future income from a property decreases its value by increasing the risk of loss of earnings and value in the future. The value of shares of stock of a company with very uncertain future prospects is highly speculative. The appraiser must exercise his judgment as to the degree of risk attaching to the business of the corporation which issued the stock, but that judgment must be related to all of the other factors affecting value.
.03 Valuation of securities is, in essence, a prophesy as to the future and must be based on facts available at the required date of appraisal. As a generalization, the prices of stocks which are traded in volume in a free and active market by informed persons best reflect the consensus of the investing public as to what the future holds for the corporations and industries represented. When a stock is closely held, is traded infrequently, or is traded in an erratic market, some other measure of value must be used. In many instances, the next best measure may be found in the prices at which the stocks of companies engaged in the same or a similar line of business are selling in a free and open market.
Sec. 4. Factors To Consider.
.01 It is advisable to emphasize that in the valuation of the stock of closely held corporations or the stock of corporations where market quotations are either lacking or too scarce to be recognized, all available financial data, as well as all relevant factors affecting the fair market value, should be considered. The following factors, although not all- inclusive are fundamental and require careful analysis in each case:
(a) The nature of the business and the history of the enterprise from its inception.
(b) The economic outlook in general and the condition and outlook of the specific industry in particular.
(c) The book value of the stock and the financial condition of the business.
(d) The earning capacity of the company.
(e) The dividend-paying capacity.
(f) Whether or not the enterprise has goodwill or other intangible value.

Chapter 2. Business Valuation Theory BV201: Introduction to Business Valuation
BV201r v. 6.0 (11/15) Non-authoritative © 2015 American Society of Appraisers 39
(g) Sales of the stock and the size of the block of stock to be valued.
(h) The market price of stocks of corporations engaged in the same or a similar line of business having their stocks actively traded in a free and open market, either on an exchange or over-the-counter.
.02 The following is a brief discussion of each of the foregoing factors:
(a) The history of a corporate enterprise will show its past stability or instability, its growth or lack of growth, the diversity or lack of diversity of its operations, and other facts needed to form an opinion of the degree of risk involved in the business. For an enterprise which changed its form of organization but carried on the same or closely similar operations of its predecessor, the history of the former enterprise should be considered. The detail to be considered should increase with approach to the required date of appraisal, since recent events are of greatest help in predicting the future; but a study of gross and net income, and of dividends covering a long prior period, is highly desirable. The history to be studied should include, but need not be limited to, the nature of the business, its products or services, its operating and investment assets, capital structure, plant facilities, sales records and management, all of which should be considered as of the date of the appraisal, with due regard for recent significant changes. Events of the past that are unlikely to recur in the future should be discounted, since value has a close relation to future expectancy.
(b) A sound appraisal of a closely held stock must consider current and prospective economic conditions as of the date of appraisal, both in the national economy and in the industry or industries with which the corporation is allied. It is important to know that the company is more or less successful than its competitors in the same industry, or that it is maintaining a stable position with respect to competitors. Equal or even greater significance may attach to the ability of the industry with which the company is allied to compete with other industries. Prospective competition which has not been a factor in prior years should be given careful attention. For example, high profits due to the novelty of its product and the lack of competition often lead to increasing competition. The public’s appraisal of the future prospects of competitive industries or of competitors within an industry may be indicated by price trends in the markets for commodities and for securities. The loss of the manager of a so-called “one-man” business may have a depressing effect upon the value of the stock of such business, particularly if there is a lack of trained personnel capable of succeeding to the management of the enterprise. In valuing the stock of this type of business, therefore, the effect of the loss of the manager on the future expectancy of the business, and the absence of management-succession potentialities are pertinent factors to be taken into consideration. On the other hand, there may be factors which offset, in whole or in part, the loss of the manager’s services. For instance, the nature of the business and of its assets may be such that they will not be impaired by the loss of the manager. Furthermore, the loss may be adequately covered by life insurance, or competent management might be employed on the basis of the consideration paid for the former manager’s services. These, or other offsetting factors, if found to exist, should be carefully weighed against the loss of the manager’s services in valuing the stock of the enterprise.
(c) Balance sheets should be obtained, preferably in the form of comparative annual statements for two or more years immediately preceding the date of appraisal, together with a balance sheet at the end of the month preceding that date, if corporate accounting will permit. Any balance

Chapter 2. Business Valuation Theory BV201: Introduction to Business Valuation
BV201r v. 6.0 (11/15) Non-authoritative © 2015 American Society of Appraisers 40
sheet descriptions that are not self-explanatory, and balance sheet items comprehending diverse assets or liabilities, should be clarified in essential detail by supporting supplemental schedules. These statements usually will disclose to the appraiser (1) liquid position (ratio of current assets to current liabilities); (2) gross and net book value of principal classes of fixed assets; (3) working capital; (4) long-term indebtedness; (5) capital structure; and (6) net worth. Consideration also should be given to any assets not essential to the operation of the business, such as investments in securities, real estate, etc. In general, such nonoperating assets will command a lower rate of return than do the operating assets, although in exceptional cases the reverse may be true. In computing the book value per share of stock, assets of the investment type should be revalued on the basis of their market price and the book value adjusted accordingly. Comparison of the company’s balance sheets over several years may reveal, among other facts, such developments as the acquisition of additional production facilities or subsidiary companies, improvement in financial position, and details as to recapitalizations and other changes in the capital structure of the corporation. If the corporation has more than one class of stock outstanding, the charter or certificate of incorporation should be examined to ascertain the explicit rights and privileges of the various stock issues including: (1) voting powers, (2) preference as to dividends, and (3) preference as to assets in the event of liquidation.
(d) Detailed profit-and-loss statements should be obtained and considered for a representative period immediately prior to the required date of appraisal, preferably five or more years. Such statements should show (1) gross income by principal items; (2) principal deductions from gross income including major prior items of operating expenses, interest and other expense on each item of long-term debt, depreciation and depletion if such deductions are made, officers’ salaries, in total if they appear to be reasonable or in detail if they seem to be excessive, contributions (whether or not deductible for tax purposes) that the nature of its business and its community position require the corporation to make, and taxes by principal items, including income and excess profits taxes; (3) net income available for dividends; (4) rates and amounts of dividends paid on each class of stock; (5) remaining amount carried to surplus; and (6) adjustments to, and reconciliation with, surplus as stated on the balance sheet. With profit and loss statements of this character available, the appraiser should be able to separate recurrent from nonrecurrent items of income and expense, to distinguish between operating income and investment income, and to ascertain whether or not any line of business in which the company is engaged is operated consistently at a loss and might be abandoned with benefit to the company. The percentage of earnings retained for business expansion should be noted when dividend-paying capacity is considered. Potential future income is a major factor in many valuations of closely-held stocks, and all information concerning past income which will be helpful in predicting the future should be secured. Prior earnings records usually are the most reliable guide as to the future expectancy, but resort to arbitrary five-or-ten-year averages without regard to current trends or future prospects will not produce a realistic valuation. If, for instance, a record of progressively increasing or decreasing net income is found, then greater weight may be accorded the most recent years’ profits in estimating earning power. It will be helpful, in judging risk and the extent to which a business is a marginal operator, to consider deductions from income and net income in terms of percentage of sales. Major categories of cost and expense to be so analyzed include the consumption of raw materials and supplies in the case of manufacturers, processors and fabricators; the cost of purchased merchandise in the case of merchants; utility services; insurance; taxes; depletion or depreciation; and interest.
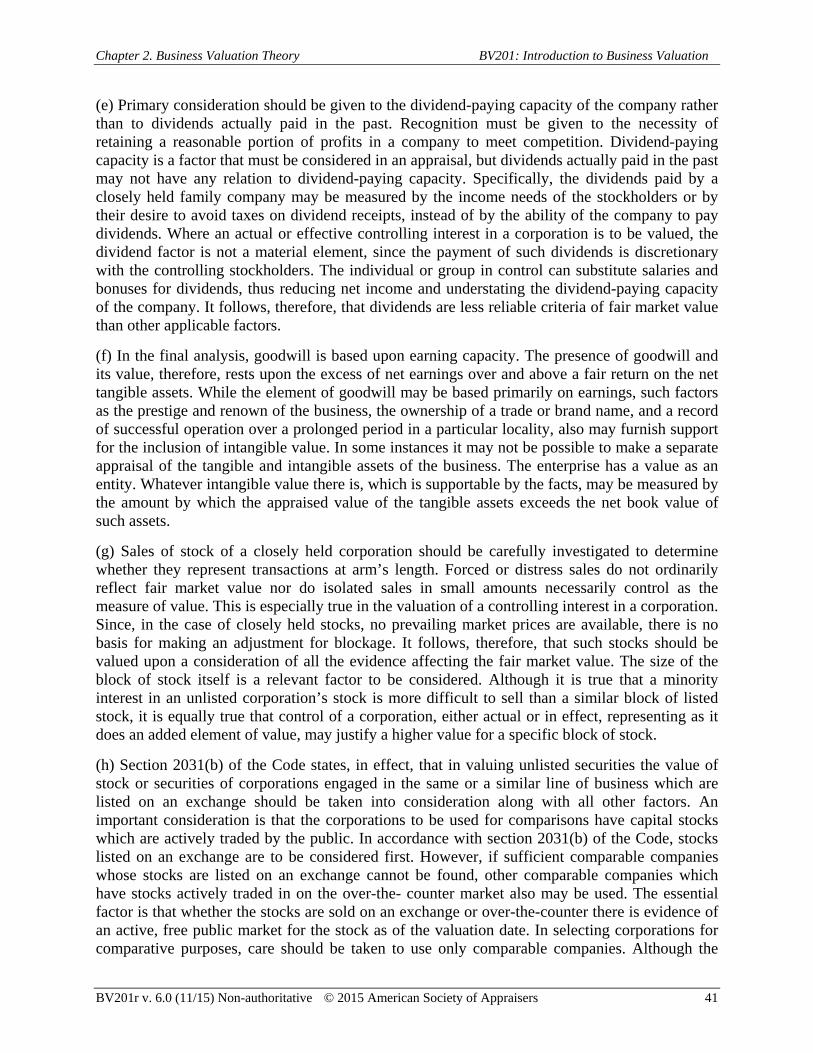
Chapter 2. Business Valuation Theory BV201: Introduction to Business Valuation
BV201r v. 6.0 (11/15) Non-authoritative © 2015 American Society of Appraisers 41
(e) Primary consideration should be given to the dividend-paying capacity of the company rather than to dividends actually paid in the past. Recognition must be given to the necessity of retaining a reasonable portion of profits in a company to meet competition. Dividend-paying capacity is a factor that must be considered in an appraisal, but dividends actually paid in the past may not have any relation to dividend-paying capacity. Specifically, the dividends paid by a closely held family company may be measured by the income needs of the stockholders or by their desire to avoid taxes on dividend receipts, instead of by the ability of the company to pay dividends. Where an actual or effective controlling interest in a corporation is to be valued, the dividend factor is not a material element, since the payment of such dividends is discretionary with the controlling stockholders. The individual or group in control can substitute salaries and bonuses for dividends, thus reducing net income and understating the dividend-paying capacity of the company. It follows, therefore, that dividends are less reliable criteria of fair market value than other applicable factors.
(f) In the final analysis, goodwill is based upon earning capacity. The presence of goodwill and its value, therefore, rests upon the excess of net earnings over and above a fair return on the net tangible assets. While the element of goodwill may be based primarily on earnings, such factors as the prestige and renown of the business, the ownership of a trade or brand name, and a record of successful operation over a prolonged period in a particular locality, also may furnish support for the inclusion of intangible value. In some instances it may not be possible to make a separate appraisal of the tangible and intangible assets of the business. The enterprise has a value as an entity. Whatever intangible value there is, which is supportable by the facts, may be measured by the amount by which the appraised value of the tangible assets exceeds the net book value of such assets.
(g) Sales of stock of a closely held corporation should be carefully investigated to determine whether they represent transactions at arm’s length. Forced or distress sales do not ordinarily reflect fair market value nor do isolated sales in small amounts necessarily control as the measure of value. This is especially true in the valuation of a controlling interest in a corporation. Since, in the case of closely held stocks, no prevailing market prices are available, there is no basis for making an adjustment for blockage. It follows, therefore, that such stocks should be valued upon a consideration of all the evidence affecting the fair market value. The size of the block of stock itself is a relevant factor to be considered. Although it is true that a minority interest in an unlisted corporation’s stock is more difficult to sell than a similar block of listed stock, it is equally true that control of a corporation, either actual or in effect, representing as it does an added element of value, may justify a higher value for a specific block of stock.
(h) Section 2031(b) of the Code states, in effect, that in valuing unlisted securities the value of stock or securities of corporations engaged in the same or a similar line of business which are listed on an exchange should be taken into consideration along with all other factors. An important consideration is that the corporations to be used for comparisons have capital stocks which are actively traded by the public. In accordance with section 2031(b) of the Code, stocks listed on an exchange are to be considered first. However, if sufficient comparable companies whose stocks are listed on an exchange cannot be found, other comparable companies which have stocks actively traded in on the over-the- counter market also may be used. The essential factor is that whether the stocks are sold on an exchange or over-the-counter there is evidence of an active, free public market for the stock as of the valuation date. In selecting corporations for comparative purposes, care should be taken to use only comparable companies. Although the

Chapter 2. Business Valuation Theory BV201: Introduction to Business Valuation
BV201r v. 6.0 (11/15) Non-authoritative © 2015 American Society of Appraisers 42
only restrictive requirement as to comparable corporations specified in the statute is that their lines of business be the same or similar, yet it is obvious that consideration must be given to other relevant factors in order that the most valid comparison possible will be obtained. For illustration, a corporation having one or more issues of preferred stock, bonds or debentures in addition to its common stock should not be considered to be directly comparable to one having only common stock outstanding. In like manner, a company with a declining business and decreasing markets is not comparable to one with a record of current progress and market expansion.
Sec. 5. Weight to Be Accorded Various Factors.
The valuation of closely held corporate stock entails the consideration of all relevant factors as stated in section 4. Depending upon the circumstances in each case, certain factors may carry more weight than others because of the nature of the company’s business. To illustrate:
(a) Earnings may be the most important criterion of value in some cases whereas asset value will receive primary consideration in others. In general, the appraiser will accord primary consideration to earnings when valuing stocks of companies which sell products or services to the public; conversely, in the investment or holding type of company, the appraiser may accord the greatest weight to the assets underlying the security to be valued.
(b) The value of the stock of a closely held investment or real estate holding company, whether or not family owned, is closely related to the value of the assets underlying the stock. For companies of this type the appraiser should determine the fair market values of the assets of the company. Operating expenses of such a company and the cost of liquidating it, if any, merit consideration when appraising the relative values of the stock and the underlying assets. The market values of the underlying assets give due weight to potential earnings and dividends of the particular items of property underlying the stock, capitalized at rates deemed proper by the investing public at the date of appraisal. A current appraisal by the investing public should be superior to the retrospective opinion of an individual. For these reasons, adjusted net worth should be accorded greater weight in valuing the stock of a closely held investment or real estate holding company, whether or not family owned, than any of the other customary yardsticks of appraisal, such as earnings and dividend paying capacity.
Sec. 6. Capitalization Rates.
In the application of certain fundamental valuation factors, such as earnings and dividends, it is necessary to capitalize the average or current results at some appropriate rate. A determination of the proper capitalization rate presents one of the most difficult problems in valuation. That there is no ready or simple solution will become apparent by a cursory check of the rates of return and dividend yields in terms of the selling prices of corporate shares listed on the major exchanges of the country. Wide variations will be found even for companies in the same industry. Moreover, the ratio will fluctuate from year to year depending upon economic conditions. Thus, no standard tables of capitalization rates applicable to closely held corporations can be formulated. Among the more important factors to be taken into consideration in deciding upon a capitalization rate in a particular case are: (1) the nature of the business; (2) the risk involved; and (3) the stability or irregularity of earnings.

Chapter 2. Business Valuation Theory BV201: Introduction to Business Valuation
BV201r v. 6.0 (11/15) Non-authoritative © 2015 American Society of Appraisers 43
Sec. 7. Average of Factors.
Because valuations cannot be made on the basis of a prescribed formula, there is no means whereby the various applicable factors in a particular case can be assigned mathematical weights in deriving the fair market value. For this reason, no useful purpose is served by taking an average of several factors (for example, book value, capitalized earnings and capitalized dividends) and basing the valuation on the result. Such a process excludes active consideration of other pertinent factors, and the end result cannot be supported by a realistic application of the significant facts in the case except by mere chance.
Sec. 8. Restrictive Agreements.
Frequently, in the valuation of closely held stock for estate and gift tax purposes, it will be found that the stock is subject to an agreement restricting its sale or transfer. Where shares of stock were acquired by a decedent subject to an option reserved by the issuing corporation to repurchase at a certain price, the option price is usually accepted as the fair market value for estate tax purposes. See Rev. Rul. 54-76, C.B. 1954-1, 194. However, in such case the option price is not determinative of fair market value for gift tax purposes. Where the option, or buy and sell agreement, is the result of voluntary action by the stockholders and is binding during the life as well as at the death of the stockholders, such agreement may or may not, depending upon the circumstances of each case, fix the value for estate tax purposes. However, such agreement is a factor to be considered, with other relevant factors, in determining fair market value. Where the stockholder is free to dispose of his shares during life and the option is to become effective only upon his death, the fair market value is not limited to the option price. It is always necessary to consider the relationship of the parties, the relative number of shares held by the decedent, and other material facts, to determine whether the agreement represents a bonafide business arrangement or is a device to pass the decedent’s shares to the natural objects of his bounty for less than an adequate and full consideration in money or money’s worth. In this connection see Rev. Rul. 157 C.B. 1953-2, 255, and Rev. Rul. 189, C.B. 1953-2, 294.
Sec. 9. Effect on Other Documents.
Revenue Ruling 54-77, C.B. 1954-1, 187, is hereby superseded.

Chapter 3. Defining the Appraisal Assignment BV201: Introduction to Business Valuation
BV201r v. 6.0 (11/15) Non-authoritative © 2015 American Society of Appraisers 1
Chapter 3. Defining the Appraisal Assignment
I. BVS-I States the Following:
In developing a business valuation, an appraiser must identify and define:
1. The business, business ownership interest or security to be valued
2. The effective date of the appraisal
3. The standard of value
4. The purpose and the intended use of the valuation
5. The nature and scope of the assignment must be defined. Acceptable scopes of work
will generally be one of three types. Other scopes of work should be explained and
described.
II. Pre-Engagement Assessment
A. The appraiser must specifically define the assignment in order to determine whether or not to accept the project and to quote a fee.
1. Assess the complexity of the project.
a. Size of the business, more than one line of business, interrelated entities
b. Type and availability of financial information
c. Capital structure—degree of leverage, financially distressed, etc.
d. Non-operating assets and liabilities
e. Minority versus control interest
f. Start-up company
g. Preliminary assessment of possible appropriate valuation methodologies and obvious difficulties in applying those methods
2. Assess the appraiser’s ability to perform the assignment.
a. Does the appraiser meet the necessary competency requirements?
B. The appraiser must identify issues related to independence and conflict of interest that could reflect on his/her objectivity and credibility.
1. All appraisers should be viewed as independent of their clients.
2. Independence is not the same as a conflict of interest.
a. Independence—freedom from control or influence of another or others

Chapter 3. Defining the Appraisal Assignment BV201: Introduction to Business Valuation
BV201r v. 6.0 (11/15) Non-authoritative © 2015 American Society of Appraisers 2
b. Conflict of interest—any interest, financial or otherwise, any business or professional activity, or any obligation that is incompatible with the proper discharge of an appraiser’s duties in the public interest
3. Before accepting the assignment, you must determine if you have a potential conflict and disclose such to the client.
a. BVS VIII; Paragraph IIIA
b. USPAP Ethics Rule: Conduct
c. USPAP Standard 10-3
4. Appraisers working for accounting firms are subject to specific independence rules.
a. SEC registrant—Sarbanes-Oxley Act of 2002 describes services that an audit firm may provide to an audit client.
(i) Sarbanes-Oxley generally prohibits the performance of appraisal and valuation services related to the audit client’s financial reports.
(ii) However, the regulations expressly state that accounting firms are not prohibited from performing non-financial statement valuation work, specifically including tax-only valuations.
b. Non-SEC RegistrantC(AICPA Code of Professional Conduct, The general requirements are:
(i) All significant matters of judgment are determined or approved by the client.
(ii) The client is in a position to have an informed judgment on the results of the valuation.
(iii)The client accepts responsibility for the valuation.
III. What is Being Appraised
A. The type of business
1. Corporation
a. C-Corp or S-Corp
b. State of incorporation
2. Limited Liability Company
a. State of formation
3. Partnership—general partnership or limited partnership
a. State of formation

Chapter 3. Defining the Appraisal Assignment BV201: Introduction to Business Valuation
BV201r v. 6.0 (11/15) Non-authoritative © 2015 American Society of Appraisers 3
4. Sole proprietorship
B. The nature of the business interest
1. Stock—common or preferred
2. Assets that make up the business
3. Invested capital
4. Specific intangible assets
5. Options or warrants
C. The level of the ownership interest
1. Controlling interest—there can be various levels of control
2. Minority interest—generally cannot influence operations
IV. The Effective Date of the Appraisal
A. Every valuation is as of a specific point in time. The value at an earlier or later date may be different.
B. Only information that is known or knowable as of the specific valuation date should be incorporated into a business valuation.
C. The valuation date should be specifically defined at the time of engagement. The valuation date is different from:
1. The date of engagement
2. The date of field work
3. The date the report is produced
D. It is generally easiest if the valuation date coincides with the date of the company’s reported financial statements.
1. Interim valuation dates may require the use of internal financials, which may not be in the same format as reported financials.
2. Interim financial statements may reflect very different financial conditions for a seasonal company than end-of-year financial statements.
V. The Scope of the Appraisal
A. In BVS-1, the ASA Business Valuation Standards identify three possible scopes for appraisal work.
1. Appraisal

Chapter 3. Defining the Appraisal Assignment BV201: Introduction to Business Valuation
BV201r v. 6.0 (11/15) Non-authoritative © 2015 American Society of Appraisers 4
a. The objective of an appraisal is to express an unambiguous opinion as to the value of the business, business ownership interest, or security, which opinion is supported by all procedures that the appraiser deems to be relevant to the valuation.
b. An appraisal has the following qualities:
(i) Its conclusion of value is expressed as either a single dollar amount or a range.
(ii) It considers all relevant information as of the appraisal date available to the appraiser at the time of performance of the valuation.
(iii)The appraiser conducts appropriate procedures to collect and analyze all information expected to be relevant to the valuation.
(iv) The valuation considers all conceptual approaches deemed to be relevant by the appraiser.
2. Limited appraisal
a. The objective of a limited appraisal is to express an estimate as to the value of a business, business ownership interest, or security. The development of this estimate excludes some additional procedures that are required in an appraisal.
b. A limited appraisal has the following qualities:
(i) Its conclusion of value is expressed as either a single dollar amount or a range.
(ii) It is based upon consideration of limited relevant information.
(iii)The appraiser conducts only limited procedures to collect and analyze the information that such appraiser considers necessary to support the conclusion presented.
(iv) The valuation is based upon the conceptual approach or approaches deemed by the appraiser to be most appropriate.
3. Calculation
a. The objective of a calculation is to provide an approximate indication of value based upon the performance of limited procedures agreed upon by the appraiser and the client.
b. A calculation has the following qualities:
(i) Results may be expressed either as a single dollar amount or a range.
(ii) May be based upon consideration of only limited relevant information.
(iii)The appraiser performs limited information and analysis procedures.

Chapter 3. Defining the Appraisal Assignment BV201: Introduction to Business Valuation
BV201r v. 6.0 (11/15) Non-authoritative © 2015 American Society of Appraisers 5
(iv) The calculation may be based upon conceptual approaches agreed upon with the client.
B. USPAP and the scope of appraisal work
1. USPAP also has certain minimum requirements to determine if what you are doing is an appraisal as opposed to a calculation or consulting. (AO-21)
2. Hypothetical appraisals are permissible and must state that they are hypothetical and what the hypothetical assumptions are. The important point is not to mislead the client about what you are doing. They cannot be so outside of reality that the condition (s) really could not exist.
C. The scope of the valuation report
1. Distinguish between the scope of the appraisal work and the scope of the appraisal report.
2. In certain circumstances, it may be acceptable to perform a full appraisal, but issue some form of limited report.
VI. Engagement Letters
A. The engagement letter should contain an explanation of the assignment in sufficient detail to ensure that there can be no misunderstanding between the appraiser and the client.
1. The obligations of each party should be spelled out.
a. The client must provide financial and operating information as well as access to facilities and people.
b. The analyst must perform certain predetermined functions.
2. The procedures to be followed if there is a breakdown on either side of the project should be indicated.
3. An important reason for documenting the initial assignment is because the assignment may change at a later date.
a. Many valuation assignments are subject to change, sometimes several times, particularly in the context of litigation.
b. A follow-up letter to the client should document any subsequent changes made to the engagement, including additional requirements and limiting conditions not contemplated in the original arrangement.
B. Suggested content
1. Name of client retaining the appraiser
2. Identification of the company and ownership interest to be valued
3. Appraisal date

Chapter 3. Defining the Appraisal Assignment BV201: Introduction to Business Valuation
BV201r v. 6.0 (11/15) Non-authoritative © 2015 American Society of Appraisers 6
4. Standard of value and definition of the standard of value
5. Purpose and intended use of the appraisal
6. Scope of the appraisal work
7. Scope of the appraisal report and documentation
a. Many situations can be satisfied with relatively simple reports and little or no supportive, documentary evidence.
b. However, the end result must effectively meet the client’s requirements.
c. The end result must also meet the standards established for reports developed by ASA and in USPAP.
d. In any case, there should be a clear understanding at the outset of what will be provided at the conclusion of the project.
8. Which professional standards are to be followed (USPAP, BVS)
9. If applicable, due date
a. Including oral conclusions provided in advance of the written report
b. It is wise to tie due dates to timely delivery of required information by the client.
c. In the minds of most clients, a late report is a poor quality report.
10. Fee arrangements
a. Not all engagements call for a set fee.
b. However, it should be made absolutely clear:
(i) Who will be responsible for payment of the fee?
(ii) Under what terms the fee will be paid?
c. Retainer requirements
d. Appraiser’s right to disengage if not paid or for other reasons
11. Countersignature—It is a good idea to ask the client to initial or sign a copy of the letter and return it for incorporation in the appraiser’s files.
12. For potential litigation support engagements:
a. Often, valuation assignments are tied to litigation support or may later be subject to dispute.
b. It is advisable to address issues such as required notifications, appraiser availability for court appearances and the fact that additional fees will apply.

Chapter 3. Defining the Appraisal Assignment BV201: Introduction to Business Valuation
BV201r v. 6.0 (11/15) Non-authoritative © 2015 American Society of Appraisers 7
13. Liability—the extent to which it is accepted should be defined in the engagement letter or in attached materials.
a. In an increasingly litigious world, appraisers should take steps to protect themselves against legal actions flowing from valuation opinions.
14. It is probably best to attach to the engagement letter:
a. A statement of anticipated general assumptions and limiting conditions (USPAP says that specific limiting conditions should be attached to the engagement letter. Things such as limited scope, research and data.)
b. Language dealing with indemnification and the requirement to hold harmless
c. Any unique terms and conditions governing the assignment
15. Business appraisers who are also CPAs should additionally disclose that they are not auditing, reviewing or compiling financial data, or expressing an opinion on such.
16. Consider additional language relating to assumptions regarding the reliability of company and third-party data.
17. Have your engagement letter reviewed by an attorney since it is a binding contract.
Classroom Assignment 4 —Defining the Appraisal Assignment (10 minutes)
An attorney calls you and says one of the shareholders of General Delivery Trucking, Inc. died on September 30 of this year and an appraisal of the 250,000 shares of General Delivery Trucking, Inc. owned by the shareholder is required for determination of the applicable federal estate taxes to be paid.
What other information do you need to properly define the assignment, including the fee?

Chapter 3. Defining the Appraisal Assignment BV201: Introduction to Business Valuation
BV201r v. 6.0 (11/15) Non-authoritative © 2015 American Society of Appraisers 8
VII. The Purpose and Intended Use of the Valuation
A. Appraisers should understand and disclose the purpose of the valuation.
1. The purpose may determine the standard of value.
2. The purpose may affect the choice or presentation of valuation methods.
a. No single valuation method is universally applicable to all appraisal purposes.
b. The sophistication of the intended user is an important consideration in choosing methods and reporting your conclusions.
3. Stating the purpose of the valuation indirectly communicates your independence and objectivity. (You have nothing to hide about why you are doing the appraisal!)
B. The purpose of the valuation affects the standard of value.
1. Buying/selling/merging—any of the above standards of value could be used.
2. Tax-related valuation—typically based on fair market value
a. Estate, gift and inheritance taxes
b. S-corporation elections
c. Charitable contributions
d. Ad valorem taxes (property taxes)
e. Transfer pricing
f. Change of ownership
3. Financial reporting—Most engagements relate to purchase price allocation and impairment of goodwill calculations using the financial reporting standard of fair value.
4. ESOPs
a. Based on fair market value (adequate consideration)
b. Minority values for ESOP shares could be different than for non-ESOP shares because of marketability differences.
5. Going public—fair market value
6. Dissenting stockholder/shareholder oppression actions—almost all state statutes specify fair value. Interpretation varies from state to state.
7. Divorces/corporate or partnership dissolutions—clear-cut statutory standards of value are often lacking
Chapter 3. Defining the Appraisal Assignment BV201: Introduction to Business Valuation
BV201r v. 6.0 (11/15) Non-authoritative © 2015 American Society of Appraisers 9
8. Fairness opinions
9. Damage cases—must carefully research case law in each case.
a. Antitrust
b. Breach of contract
c. Condemnation (eminent domain)
d. Insurance casualty claims (business interruption or termination)
e. Lost profits
f. Lost business opportunity
g. Commercial reasonableness
h. Intellectual property infringement
10. Buy/sell agreements—value standard is often arbitrary
VIII. Professional Obligation of the Appraiser
A. The following definition of a profession suggests specific obligations for any professional:
A calling requiring specialized knowledge and often long and intensive preparation, including instruction in skills and methods as well as in the scientific, historical or scholarly principles underlying such skills and methods, maintaining by force of organization or concerted opinion high standards of achievement and conduct, and committing its members to continued study and to a kind of work which has for its prime purpose the rendering of a public service.1
B. Business valuation is a profession with the following four characteristics:
1. Recognized and coherent body of specialized knowledge
The members of the Society are engaged in a professional activity. A profession is based on an organized body of specific knowledge—knowledge not possessed by laymen. It requires a high degree of intelligence and considerable expenditure of time and effort to acquire it and to become adept in its application.2
a. Business valuation derives its theoretical validity from established principles of economics, finance and business management. Its skills and methods are those of
1Lawyers Title Insurance Corp v. Hoffman, 245 Neb.507, 513 N.W 2d 521 (1994) Italics added. 2American Society of Appraisers, “Professional Character of Appraisal Practice”, Principles of Appraisal
Practice and Code of Ethics, Section 3.5.

Chapter 3. Defining the Appraisal Assignment BV201: Introduction to Business Valuation
BV201r v. 6.0 (11/15) Non-authoritative © 2015 American Society of Appraisers 10
economic, financial and organizational analysis, as recognized by academic and professionally practicing scholars in these respective fields.
b. For purposes of testimony in most federal, state and local courts in the United States, appropriate academic background and accreditation by ASA or another professional society are usually considered prima facie evidence of expert status.
2. High standards of achievements and conduct
The purpose of the Uniform Standards of Professional Appraisal Practice (USPAP) is to promote and maintain a high level of public trust in appraisal practice by establishing requirements for appraisers. It is essential that appraisers develop and communicate their analyses, opinions, and conclusions to intended users of their services in a manner that is meaningful and not misleading.3
The American Society of Appraisers, in its Principles of Appraisal Practice and Code of Ethics, and the Appraisal Foundation, in its Uniform Standards of Professional Appraisal Practice (USPAP), have established authoritative principles and a code of professional ethics. The American Society of Appraisers Business Valuation Standards incorporates the Principles of Appraisal Practice and Code of Ethics and the relevant portions of USPAP, either explicitly or by reference, and are designed to clarify them and provide additional requirements specifically applicable to the valuation of businesses, business ownership interests, and securities.4
3. Maintained by force of organization
A member of the Society, having knowledge of an act by another member, which, in his opinion, is in violation of the ethical principles incorporated in the Principles of Appraisal Practice and Code of Ethics of the Society, has the obligation to report the matter in accordance with the procedure specified in the Constitution and Bylaws.5
In accordance with a resolution passed by the ASA Board of Governors on July 20, 2001, any member disciplined by the Board of Governors in the form of censure, suspension, or expulsion shall be identified by name, city, state, chapter affiliation, discipline and specialty(s) in ASA’s Newsline and on the ASA Web site.6
3Appraisal Foundation, “Preamble”, Uniform Standards of Professional Appraisal Practice, 201011 ed.,
line 150153. 4American Society of Appraisers Business Valuation Committee, AGeneral Preamble,@ American Society
of Appraisers Business Valuation Standards, 2002, p. 3. 5American Society of Appraisers, AAppraiser=s Obligation to Other Appraisers and to the Society.@
Principles of Appraisal Practice and Code of Ethics, Section 5.2. 6AEthics Notices,@ American Society of Appraisers Web site, www.appraisers.org

Chapter 3. Defining the Appraisal Assignment BV201: Introduction to Business Valuation
BV201r v. 6.0 (11/15) Non-authoritative © 2015 American Society of Appraisers 11
4. Continued study and contribution to the profession
a. The American Society of Appraisers accredits its members for a specified period of time only, usually in five-year intervals.
b. Maintaining one’s accreditation requires documentation of participation in continued professional education and/or contributions to the profession in the form of written articles, public presentations on appraisal-related topics, or teaching appropriate academic or professional courses at advanced educational levels.
IX. Professional Standards
A. Professional standards codify the knowledge and techniques necessary for the competent practice of business valuation. (We will discuss two sources here—The Appraisal Foundation and ASA. The Institute of Business Appraisers, the National Association of Certified Valuation Analysts, the International Valuation Standards Committee and the American Institute of CPAs also have standards, but they will not be discussed here.)
B. Uniform Standards of Professional Appraisal Practice (USPAP)
1. Background
a. In 1987, nine of the leading U.S. professional appraisal organizations formed The Appraisal Foundation and adopted the first self-regulatory document for appraisers, entitled Uniform Standards of Professional Appraisal Practice.
b. Eight of the nine founding organizations are composed entirely of real estate appraisers; the American Society of Appraisers is the only multidiscipline society.
c. The Appraisal Foundation; (202) 347-7722; http://www.appraisalfoundation.org
2. Structure of The Appraisal Foundation
a. The Appraisal Foundation serves as the parent organization for three independent boards. The Foundation’s board of trustees finances the boards and appoints their members.
b. The Appraisal Standards Board (ASB) is responsible for maintaining and updating USPAP.
c. The Appraisal Qualifications Board (AQB) establishes qualification criteria for state licensing, certification and recertification of appraisers.
(i) The Federal Institutions Reform, Recovery and Enforcement Act of 1989 (FIRREA) mandates that all state-certified real estate appraisers must meet the minimum education, experience and examination requirements promulgated by the AQB.
(ii) The AQB has continued to work on voluntary criteria for disciplines other than real property including personal property appraisers.
Chapter 3. Defining the Appraisal Assignment BV201: Introduction to Business Valuation
BV201r v. 6.0 (11/15) Non-authoritative © 2015 American Society of Appraisers 12
d. The Appraisal Practices Board (APB) has the responsibility of identifying and issuing opinions on recognized valuation methods and techniques, which may apply to all disciplines within the Appraisal Foundation
e. Contents of USPAP
(i) Prefatory material contains, among other things, an ethics rule and a competency rule.
(ii) Standards 1, 2, 3 and 6 deal with real estate and fixed asset appraisal.
(iii)Standards 4 and 5 have been retired.
(iv) Standard 3 deals with reviewing an appraisal, originally for real estate. As of 2004, Standard 3 is also applicable to reviewing business appraisals.
(iii)Standards 7 and 8 deal with personal property appraisals.
(iv) Standards 9 and 10 deal with business appraisals. – See Appendix E
(v) The Appraisal Foundation has also issued statements on standards and advisory opinions, which clarify issues in implementing and adhering to the standards.
f. Compliance with USPAP
(v) FIRREA requires that real estate appraisals used in conjunction with federally related transactions be performed in accordance with USPAP. More than 85,000 state-certified and licensed real property appraisers are currently required to adhere to USPAP.
(vi) Many other appraisers are also bound to comply with USPAP through affiliations with professional appraisal organizations.
(vii) Since ASA is a sponsoring organization of the Appraisal Foundation, all ASAs, AMs, FASAs, Candidates and Associates of ASA must take a course on USPAP and follow USPAP when performing a comprehensive appraisal and presenting a formal opinion of value as the primary objective of an appraisal engagement.
g. ASA’s Business Valuation Standards – See Appendix A
(i) The following business valuation standards have been adopted by the Business Valuation Committee of the American Society of Appraisers and approved by ASA’s board of governors. The Business Valuation Committee is the policy-making arm of ASA in the business valuation discipline (for more information, visit www.bvappraisers.org).
(a) Preamble

Chapter 3. Defining the Appraisal Assignment BV201: Introduction to Business Valuation
BV201r v. 6.0 (11/15) Non-authoritative © 2015 American Society of Appraisers 13
(b) Standards
(1) BVS-I. General Requirements for Developing a Business Valuation
(2) BVS-II. Financial Statement Adjustments
(3) BVS-III. Asset-Based Approach to Business Valuation
(4) BVS-IV. Income Approach to Business Valuation
(5) BVS-V. Market Approach to Business Valuation
(6) BVS-VI. Reaching a Conclusion of Value
(7) BVS-VII. Valuation Discounts and Premiums
(8) BVS-VIII. Comprehensive, Written Business Valuation Report
(9) BVS-IX. Intangible Asset Valuation
(b) Glossary
(c) Statements on Business Valuation Standards (SBVS)
(1) SBVS-1. The Guideline Public Company Method
(2) SVBS-2. Guideline Transaction Method
(d) Advisory Opinions (AO)
(1) AO-1. Financial Consultation and Advisory Services
(e) Procedural Guidelines (PG)
(1) PG-1. Litigation Support: Role of the Independent Financial Expert
(2) PG-2. Valuation of Partial Ownership Interests
(ii) These standards must be followed for the valuation of a business, business ownership interests, or securities by all members of the American Society of Appraisers, whether they are Candidates, AMs, ASAs, or FASAs, and regardless of their discipline affiliation.

Chapter 3. Defining the Appraisal Assignment BV201: Introduction to Business Valuation
BV201r v. 6.0 (11/15) Non-authoritative © 2015 American Society of Appraisers 14
Handout 3-1
Sample Engagement Letter

Chapter 4. Data Gathering BV201: Introduction to Business Valuation
BV201r v. 6.0 (11/15) Non-authoritative © 2015 American Society of Appraisers 1
Chapter 4. Data Gathering
I. Data Gathering via the Internet
A. The Internet is a specialized type of vendor because it places no limitations on who can contribute to it or on the content of the offerings.
1. Consequently, there is an erroneous tendency for users to consider all sources of data from the Internet equivalent in quality, which is not the case.
2. Internet-based data are also very dynamic. Information available today may not be available next week and may not have been available last month. Therefore, one should use a significant amount of discretion in accepting, using and documenting Internet-based data in the data-gathering process.
B. Tips specific to business appraisers
1. Remember that the Internet is very fluid. Information found and used today may not be available, or may have changed, when needed in the future (in defending a valuation in court or before the IRS, for example). Preserve your Internet-based research electronically or in hard copy format.
2. As in any source of information, be sure to give credit where credit is due.
3. Consider bookmarking or otherwise documenting Internet sources for future reference and use in subsequent research projects.
II. General Information
A. Basic Bibliography – See Exhibit 4-1.
III. Economic and Industry Data
A. Economic data
1. All information gathered should be “known or knowable” as of the valuation date.
2. Focus should be on current and expected conditions relevant to the industry and subject company.
3. Type of business dictates the type of economic research
a. Example: Retail—personal income
b. Example: Animal feed manufacturers—commodity prices, government programs
4. National economy
5. Regional or local economy
6. International markets

Chapter 4. Data Gathering BV201: Introduction to Business Valuation
BV201r v. 6.0 (11/15) Non-authoritative © 2015 American Society of Appraisers 2
B. Industry Data
1. All information gathered should be “known or knowable” as of the valuation date.
2. Industry trends in growth, structure, technology, regulation, etc.
3. Industry financial performance
4. Competition
5. Public companies
C. Subject Company Data – See Exhibit 4-4 for Sample ‘Information Request’
1. All information gathered should be “known or knowable” as of the valuation date.
2. Financial data
a. Financials for five fiscal years, or relevant period
b. Income tax returns—same five fiscal years, or relevant period. Is there something “magical” about five years? NO! The key is to capture the business cycle so as to not slant the historical analysis or warp the view of the future.
c. Interim financials
d. Detailed depreciation schedule
e. Budgets or forecasts—may want historical budgets to see how company’s actual performance compared with budget (measure quality of management)
f. Other financial data
3. Product and market data
a. Marketing literature—Web site, brochures, price lists, etc.
b. Location(s) of company operations
4. Customer list and supplier list
5. List of patents, copyrights, trademarks and expiration dates
6. Sales forecasts by product line and sales division
7. List of major competitors, their locations, and their relative strengths and weaknesses
8. List of trade associations
9. Survey of geographic market
10. Personnel
a. Organization chart
b. Brief résumé on key personnel

Chapter 4. Data Gathering BV201: Introduction to Business Valuation
BV201r v. 6.0 (11/15) Non-authoritative © 2015 American Society of Appraisers 3
c. Employment agreements
d. Covenants not to compete
e. Union contracts
f. Compensation schedule for owners, officers and directors—include all perks in the schedule.
g. Schedule of life insurance policies on key personnel
h. Pension and profit-sharing plans and employee handbook
B. Other business records
1. Organizational documents
a. If corporation—articles of incorporation, bylaws, amendments and minutes
b. If partnership—partnership agreement and amendments
c. If LLC—articles of organization and LLC member’s agreement
2. List of stockholders, members or partners and what each owns
3. Any details on prior stock sales
4. Buy/sell agreements, options, etc.
5. Loan documents
6. Shareholder and board minutes
7. Major contracts
a. Supply contracts
b. Distributor agreements
c. Lease agreements
d. Guaranteed sales contracts
8. Copies of previous appraisals and/or appraisals of specific assets
9. Information on contingent liabilities
C. The management interview
1. The main purpose is to assess risk and qualitative factors.
2. Prepare a list of questions in advance.
3. Persons to interview might include:
a. Client and client’s attorney

Chapter 4. Data Gathering BV201: Introduction to Business Valuation
BV201r v. 6.0 (11/15) Non-authoritative © 2015 American Society of Appraisers 4
b. Company managers; president; chief financial officer; managers of sales, production and personnel
c. Company advisers: accountant, attorney, banker
d. Members of company board of directors
e. Customers or suppliers with management permission
4. Topics to discuss with management
a. History of the company
b. Operations
(i) Products and services
(ii) Seasonal or cyclical sales patterns
(iii)Supplier base
(iv) Customer base
(v) Facilities
(vi) Marketing and distribution strategies
(vii) Manufacturing or distribution capacity
(viii)Management, employees, key personnel, succession plans
(ix) Plans for the future, new product development
c. Environment
(i) Economic and industry factors affecting company
(ii) Competition
(iii)Regulatory issues
(iv) Legal proceedings
d. Financial condition and performance
(i) Reasons for identified trends
(ii) Capital expenditures
(iii)Company’s present and future use of debt
Chapter 4. Data Gathering BV201: Introduction to Business Valuation
BV201r v. 6.0 (11/15) Non-authoritative © 2015 American Society of Appraisers 5
(iv) Details of past transactions in company stock
(v) Contingent liabilities
e. Other information of which the appraiser may not be aware
5. Sample management questionnaires can be found in various valuation books
6. Information gathered during the management interview is frequently a major portion of the description or history of the company section of a report.
Classroom Assignment 5: Review Exhibit 4-2 at the end of this chapter. (10 minutes)
IV. Specific Data Sources
A. Specific economic, industry, and guideline company information sources, both print and electronic.
B. Economic data
1. General economy
a. Internet sources: U.S. Bureau of Census and Department of Commerce (http://www.bea.doc.gov; http://www.bls.gov; http://www.whitehouse.gov/fsbr/esbr.html) –[free sites]
b. Business Week’s “Economic Trends” and “Business Outlook” columns and the Wall Street Journal’s weekly “Tracking the Economy Statistics”
c. Government publications, including the Federal Reserve Bulletin, Survey of Current Business, and Economic Report of the President
2. Sources for regional economic data
a. Federal Reserve’s bi-annual Beige Book report, available from their website, http://www.federalreserve.gov/FOMC/BeigeBook/
b. Bureau of Labor Statistics has historical economic and demographic data by region, state, and MSAs (or “Metropolitan Statistical Area”); http://www.bls.gov/home.htm
c. State, county, or local government economic development departments. For example, New York State’s development agency, Empire State Development provides statewide and localized economic and demographic data on their Web site, http://www.nylovesbiz.com/nysdc/default.asp
d. Local or regional chambers of commerce
C. Industry data
1. General business periodicals/publications
Chapter 4. Data Gathering BV201: Introduction to Business Valuation
BV201r v. 6.0 (11/15) Non-authoritative © 2015 American Society of Appraisers 6
a. Available in both electronic and print formats. Check the Guide to Business Periodicals (for print sources), which is available at most libraries.
b. Business Week and Forbes produce special issues each January that cover many industries.
2. Standard & Poor’s (S&P’s)—Most libraries carry S&P’s Value Line Investment Survey, Industry Reports, and Industry Surveys.
3. Government publications—The U.S. Department of Commerce tracks industry statistics and makes most of them available on the Internet and through government depository libraries.
4. Trade associations
a. Industry data availability varies considerably in both quality and price from trade association to trade association, but can be a very good source. Thomson offers an Encyclopedia of Associations [fee based]. Also the American Society of Association Executives’ website provides an industry-based trade association search engine (www.asaenet.org)—[free site].
b. Some trade associations provide data for free, others are fee-based. On occasion, the subject business entity may already have trade association reports, or can obtain them as a member of a trade organization for free or at reduced fee.
5. Trade magazines
a. Many are available electronically through databases such as the Trade and Industry Index on Dialog, or on electronic versions on the Internet.
b. Management of the subject company may be able to point the appraiser to useful periodicals.
6. SEC Form 10–Ks for publicly traded companies
7. Brokerage reports
a. These are available from individual brokerage firms, but distribution policies vary.
b. They are also available through Dialog on the Investext database. Some business-oriented libraries also offer access to Investext.
8. Industry financial ratios
a. Risk Management Associates’ (RMA) Annual Statement Studies, Troy’s Almanac of Business and Industrial Financial Ratios, and Financial Statement Studies of the Small Business are available in print form, as are most industry ratios produced by trade associations.
b. Internet-based sources include
Chapter 4. Data Gathering BV201: Introduction to Business Valuation
BV201r v. 6.0 (11/15) Non-authoritative © 2015 American Society of Appraisers 7
(i) Risk Management Associates’ (RMA) Annual Statement Studies (http://www.rma.com)
(ii) Integra Information (http://www.integrainfo.com)
(iii)BizMiner (http://www.bizminer.com)
c. The use of some third party statistics in valuation analysis requires the permission of the information provider, as is the case with RMA.
d. Care should be taken when using third party anonymous industry data. Without access to source documents, the reliability and relevance of peer group data can be suspect. Be sure to understand the basis of reporting, source of information, and definitions used in the analysis and reporting of information.
9. Third party providers of industry research
a. Valuation Resources (http://www.valuationresources.com) —The Web site lists online resources on more than 70 specific industries. The site is free—some links are not.
b. Industry Research (http://www.industryresearch.com)—The Web site provides industry summary reports and offers custom research and report writing. [Fee based]
c. First Research (http://www.firstresearch.com)—The Web site offers summary information on various industries, as well as industry-specific bibliographies for further research. [Fee based]
d. IBISWorld (http://www.ibisworld.com) – The Web site provides industry research reports on various industries. [Fee based]
D. Data on publicly traded guideline companies
1. To identify standard industrial classification (SIC) code or North American Industry Classification System (NAICS) code
a. Standard Industrial Classification Manual (also available on the Internet at http://www.osha.gov/oshstats/sicser.html) [Free]
b. NAICS Manual (also available on the Internet at http://www.census.gov/epcd/www/naics.html) Free. Site also includes SIC to NAICS conversion table.
2. Places to find lists of potential guideline companies
a. Electronic sources
(i) Hoovers—(http://www.hoovers.com). Basic information and search capabilities are free; detailed data available by subscription.

Chapter 4. Data Gathering BV201: Introduction to Business Valuation
BV201r v. 6.0 (11/15) Non-authoritative © 2015 American Society of Appraisers 8
(ii) Edgar—(http://www.sec.gov/edgar) now offers the ability to search by SIC Code. [Free]
(iii)Pitchbook – (http://www.pitchbook.com)
(iv) FetchXL – (http://www.tagnifi.com/fetchxl)
b. Print sources
(i) Standard & Poor’s Corporation Records: Index of Companies by SIC code—lists public companies by SIC code
(ii) Directory of Companies Required to File Annual Reports with the SEC
(iii)Mergent’s manuals
(iv) Value Line Investment Survey (http://www.valueline.com)
(v) Standard & Poor’s Register Indexes—list public and private companies by SIC code
3. Where to get financial information and further description
a. Primary data—Form 10K and annual reports—these original source documents provide the best descriptions and most reliable financial data.
(i) Directly from the company—often available at the company’s Web site.
(ii) Security and Exchange Commission—EDGAR (Electronic Data Gathering Analysis and Retrieval). An online searchable database of public filings searchable by company, industry or key word (http://www.sec.gov/edgar.shtml)
(a) SEC filings are available at several Internet sites, some at no charge and some for a fee.
(b) While data are generally reliable, realize that non- SEC sites used to access SEC data should be considered secondary data.
(c) One such site, http://www.pwcglobal.com/edgarscan, is free and offers SEC filings on public companies. It will also list the companies by SIC code, through which you can access other potential guideline entities.
(iii)Document retrieval companies such as Disclosure Info Center or Mergent’s Docutronics
b. Secondary data
(i) Disclosure—online through Dialog or CompuServe

Chapter 4. Data Gathering BV201: Introduction to Business Valuation
BV201r v. 6.0 (11/15) Non-authoritative © 2015 American Society of Appraisers 9
(ii) Standard & Poor’s Corporation Records—print or online—selected data are available online through S&P’s Corporate Descriptions through Dialog or S&P Online through CompuServe
(iii)Mergent’s manuals—print only—selected data are available online through Dialog
(iv) Media General Financial Services (http://www.mgfs.com). [Fee based]
(v) Value Line Investment Survey—print—selected data are available on diskette and online through CompuServe
(vi) Other online public company data providers, such as Hoovers (http://www.hoovers.com). [Fee based]
c. Forecasted data
(i) Institutional Brokers Estimate System (I/B/E/S)—earnings estimates; now owned by Thomson and found online at www.firstcall.com.
(ii) Zacks Investment Research—earnings estimates (http://www.zacks.com)
(iii)Value Line—some financial statement projections
(iv) Analyst’s research reports—earnings estimates. Some have additional financial projections.
(v) Standard & Poor’s Earnings Guide—earnings estimates
E. Data on acquired companies
1. Places to find lists of suspect companies (also contains some secondary financial data)
a. Electronic sources
(i) ThomsonSecurities Data Corporation (SDC) Merger and Acquisition Corporate Transactions database is available via direct dial-up to SDC or through Dialog. SDC will run the search for you at your request. [Fee based].
(ii) DoneDeals database—available online at http://donedeals.nvst.com. [Fee based]
(iii)Mergerstat database (www.mergerstat.com) [Fee based]
b. Small companies
(i) BIZCOMPS; available through BV Resources (http://www.bvresources.com). [Fee based]

Chapter 4. Data Gathering BV201: Introduction to Business Valuation
BV201r v. 6.0 (11/15) Non-authoritative © 2015 American Society of Appraisers 10
(ii) Institute of Business Appraisers; (http://www. go-iba.org). Free to members with certain limitations.
(iii)Pratt’s Stats; available through BV Resources (http://www.BVResources.com). [Fee based]
2. Where to get original source financial data
a. Publicly traded companies
(i) SEC Forms
(a) 10-K: Annual Statement
(b) 10-Q: Quarterly Statement
(c) 8-K: Material Occurrence Statement—Once you know of a transaction, the 8-K will contain the specific terms of the deal, assuming the transaction was large enough to warrant filing an 8-K.
(ii) Public Stats – Public Company Mergers and Acquisitions Transaction Database
b. Private companies
(i) Call acquired or acquiring company directly
(ii) Form 8-K, 10-K, or 10-Q of acquirer, if public or if the company has publicly traded debt.
(iii)Business brokers
F. Lack of marketability discounts (covered in BV 203)
1. Restricted or letter stock evidence
2. Studies of private transactions prior to public offerings (IPO Studies)
G. Lack of control discounts (covered in BV 203)
1. Look at premiums paid in acquisitions and convert to a lack of control discount
a. Control Premium Studies
H. Executive compensation data
1. Industry financial ratios
b. Risk Management Associates, Annual Statement Studies
c. Leo Troy, Troy’s Almanac of Business and Industrial Ratios
d. Financial Research Associates, Financial Statement Studies of the Small Business

Chapter 4. Data Gathering BV201: Introduction to Business Valuation
BV201r v. 6.0 (11/15) Non-authoritative © 2015 American Society of Appraisers 11
2. Trade associations
3. Employment agencies
4. Economic Research Institute, Salary Assessor
5. Public company proxy statements
I. Tax court cases
1. Research Institute of America
2. Commerce Clearing House
3. West Law (West Publishing)
4. Lexis
5. Klienrock’s Tax Library
6. Business Valuation Update and Web site: http://www.bvlibrary.com. This Web site also provides a searchable database of relevant state court cases. [Fee based]
7. Financial Valuation Group: http://www.fvginternational.com. This Web site has many of the recent significant tax court cases online in a searchable format. Newsletter available by e-mail.
Homework Assignment 1: Review Exhibit 4-3 for a sample history section for the GDT, Inc. Case Study.

Chapter 4. Data Gathering BV201: Introduction to Business Valuation
BV201r v. 6.0 (11/15) Non-authoritative © 2015 American Society of Appraisers 12
Exhibit 4-1
Basic Business Valuation Bibliography

Chapter 4. Data Gathering BV201: Introduction to Business Valuation
BV201r v. 6.0 (11/15) Non-authoritative © 2015 American Society of Appraisers 13
Business Valuation Resources
SAMPLE OF BOOKS, PERIODICALS, AND MORE
Appraisal Foundation. Annual. Uniform Standards of Professional Appraisal Practice. Washington, DC: Appraisal Foundation.
Brown, Ronald. 2008. Valuing Professional Practices and Licenses: A Guide for the Matrimonial Practitioner. New York: Aspen Law & Business (published annually).
Business Valuation Review. Herndon, VA: American Society of Appraisers, quarterly.
Damodaran, Aswath. 1994. Damodaran on Valuation: Security Analysis for Investment and Corporate Finance. New York: John Wiley & Sons.
Executive Compensation Assessor. Redmond,WA: Economic Research Institute, quarterly (www.erieri.com).
FactSet Mergerstat, LLC. Annual. Mergerstat Review. Santa Monica, CA: FactSet Mergerstat.
——. LLC. Annual. Control Premium Study. Santa Monica, CA: FactSet Mergerstat.
Fishman, Jay E., Shannon P. Pratt, J. Clifford Griffiths, and D. Keith Wilson. Annual. Guide to Business Valuations. Fort Worth, TX: Practitioners Publishing Co.
Fishman, Jay E., Shannon P. Pratt, and William J.Morrison. 2013. Standards of Value: Theory and Applications Second Edition. Hoboken, NJ: Wiley Finance
Grabowski, Roger, and David King. 1996. New Evidence on Size Effects and Rates of Return. Business Valuation Review (September): Vol 15, pp. 103–115.
Hitchner, James R. 1996. Tax Court Reviews Nine Factors for Selecting Marketability Discounts. CPA Expert (Winter): 11–13.
Johnson, Bruce A., Spencer J. Jefferies, and James R. Park. 2006. Comprehensive Guide for the Valuation of Family Limited Partnerships 4th Edition, Dallas, TX: Partnership Profiles.
Feder, Robert E., Rosoff, Charles T., Tadri, Aleza., 2014. Valuation Strategies in Divorce. 5th ed. Wolters Kluwer Law & Business.
Laro, David and Shannon P. Pratt. 2005. Business Valuation and Taxes: Procedure, Law, and Perspective. Hoboken, NJ: John Wiley & Sons.
Mercer, Capital. 2010. Valuation for Impairment Testing Second Edition. Memphis: Peabody Publishing.
Mercer, Z. Christopher. 1991. Valuing Financial Institutions. Burr Ridge, IL: Irwin Professional Publishing.
Mercer, Z. Christopher, and Terry S. Brown. 1999. Fair Market Value vs. the Real World. Business Valuation Review. (March/April): Vol. 18, No.1, pp 16-25.

Chapter 4. Data Gathering BV201: Introduction to Business Valuation
BV201r v. 6.0 (11/15) Non-authoritative © 2015 American Society of Appraisers 14
Mercer, Z. Christopher, and Travis W. Harms. 2007. Business Valuation An Integrated Theory, 2nd ed. Hoboken, NJ: John Wiley & Sons.
Morningstar, Inc. Annual. Cost of Capital Quarterly. Chicago: Morningstar.
——. Annual. Stocks, Bonds, Bills and Inflation. Chicago: Morningstar.
Nath, Eric W. 1990. Control Premiums and Minority Interest Discounts in Private Companies. Business Valuation Review (June): 39–46.
Pratt, Shannon P. 2003. Business Valuation Body of Knowledge: Exam Review and Professional Reference Second Edition. New York: John Wiley & Sons.
Pratt, Shannon P. and Roger Grabowski. 2008. Cost of Capital: Estimation and Applications. New York: John Wiley & Sons.
Pratt, Shannon P., Robert F. Reilly, and Robert P. Schweihs. 1998. Valuing Small Businesses and Professional Practices. New York: McGraw-Hill.
Pratt, Shannon P and Alina Niculita, 2008. Valuing a Business: The Analysis and Appraisal of Closely Held Companies, 5th ed. New York: McGraw-Hill.
Reeves, James F., Linda A.Markwood, and Suzanne Scrivan. Annual. Guide to Family Partnerships, Forth Worth, TX: Practitioners Publishing Company.
Reilly, Robert F., and Robert P. Schweihs. 2005. Guide to ESOP Valuation and Financial Advisory Services. Portland, OR: Willamette Management Associates Partners.
Risk Management Association. Annual. Annual Statement Studies. Philadelphia: Risk Management Association.
Standard & Poor’s. Annual. Standard & Poor’s Analyst’s Handbook. New York: Standard & Poor’s.
Standard & Poor’s. Biannual. Standard & Poor’s Industry Surveys. New York: Standard & Poor’s.
Standard & Poor’s. Monthly. Standard & Poor’s Trends and Projections. New York: Standard & Poor’s.
Trugman, Gary R., Stanton L. Meltzer, David A. Rooney, et al. Annual. Guide to Divorce Engagements. Fort Worth, TX: Practitioners Publishing Co.
Trugman, Gary R. 2012. Understanding Business Valuation: A Practical Guide to Valuing Small to Medium Sized Businesses. 4th Ed. A.I.C.P.A., Durham, NC.
Chapter 4. Data Gathering BV201: Introduction to Business Valuation
BV201r v. 6.0 (11/15) Non-authoritative © 2015 American Society of Appraisers 15
Exhibit 4-2
General Delivery Trucking, Inc.
Most Recent Audit Report and Notes to Financial Statements
General Delivery Trucking, Inc. is a fictional company that will be used in various parts of this course for different types
of exercises.

Chapter 4. Data Gathering BV201: Introduction to Business Valuation
BV201r v. 6.0 (11/15) Non-authoritative © 2015 American Society of Appraisers 16
Report of Independent Public Accountants
To the Board of Directors General Deliveries Trucking, Inc.
We have audited the accompanying combined balance sheets of General Deliveries Trucking, Inc. as of December 31, 2011 and 2010 and the related combined statements of income, changes in stockholders’/members’ equity and cash flows for the years then ended. These combined financial statements are the responsibility of the Company’s management. Our responsibility is to express an opinion on these combined financial statements based on our audits.
We conducted our audits in accordance with auditing standards generally accepted in the United States of America. Those standards require that we plan and perform the audit to obtain reasonable assurance about whether the combined financial statements are free of material misstatement. An audit includes examining, on a test basis, evidence supporting the amounts and disclosures in the combined financial statements. An audit also includes assessing the accounting principles used and significant estimates made by management, as well as evaluating the overall financial statement presentation. We believe that our audits provide a reasonable basis for our opinion.
In our opinion, the combined financial statements referred to above present fairly, in all material respects, the financial position of General Deliveries Trucking, Inc. as of December 31, 2011 and 2010, and their results of operations and cash flows for the years then ended, in conformity with accounting principles generally accepted in the United States of America.
Some City, Florida April 15, 2012

Chapter 4. Data Gathering BV201: Introduction to Business Valuation
BV201r v. 6.0 (11/15) Non-authoritative © 2015 American Society of Appraisers 17
GENERAL DELIVERIES TRUCKING, INC.
NOTES TO COMBINED FINANCIAL STATEMENTS
(In Thousands)
Note 1 - Business and summary of significant accounting policies:
Business:
The Company provides transportation logistics management and distribution services for national multi-unit retail stores throughout the United States, expediting the flow of merchandise from the manufacturer to the point of sale. Such services include local pick-up, consolidation of inventory, computerized inventory control, fleet management under contract, less-than-truckload and line-haul delivery, local distribution, storage and brokerage.
Basis of presentation:
The accompanying combined financial statements include the accounts of all of the transportation operations of General Deliveries Trucking, Inc. (the “Company”). This affiliation is through common family ownership and all of the owners are either officers or employees of the companies. All significant intercompany balances and transactions have been eliminated in combination. The active companies included are Company 1, Inc. and its subsidiary, Company 2, Inc., as well as its affiliated companies, Company 3, Inc., Company 4, Inc., Company 5, Inc. and Company 6, LLC. Company 7, Inc., which is included in General Deliveries Trucking, Inc., is an inactive company.
The accounts of two partnerships, eight limited liability companies and three corporations (the uncombined affiliates), which are in the real estate and equipment leasing businesses, and are owned by the owners of the Company, have not been included in the combined financial statements since it has been determined that the Company is not the primary beneficiary of these uncombined affiliates.
Revenue recognition:
Operating revenue and related expenses are primarily recognized when the shipment is completed or allocated between reporting periods based on relative transit time in each reporting period and collectability is reasonably assured.
Cash and cash equivalents:
It is the Company’s policy to consider as cash equivalents all short-term, highly liquid investments, which are convertible to a known cash amount in a period of less than three months from the date of purchase.
Cash of approximately $9,730 and $10,222 at December 31, 2010 and 2011, respectively, is subject to withdrawal restrictions to collateralize short-term letters of credit with Insurance companies.

Chapter 4. Data Gathering BV201: Introduction to Business Valuation
BV201r v. 6.0 (11/15) Non-authoritative © 2015 American Society of Appraisers 18
Accounts receivable and allowance for uncollectible accounts:
The Company carries its receivables at amounts billed to customers less allowances for uncollectible accounts. On a periodic basis, the Company evaluates its accounts receivable and establishes an allowance for doubtful accounts based on a history of past write-offs and collections and current credit conditions. Accounts are written off when deemed uncollectible. The policy for determining the past due status of receivables is 30 days.
Property and equipment:
Property and equipment are stated at cost. Depreciation is provided using the straight-line method over estimated useful lives of three to eight years. Leasehold improvements are amortized over the shorter of the useful life of the related asset or the period of the lease. Major additions, replacements and betterments, including major engine overhauls, are capitalized, while maintenance, repairs and the cost of replacement tires, which do not extend the useful lives of these assets, are expensed as incurred.
Insurance:
The Company accrues estimated liabilities for the self-retention and deductible portions of cargo loss and damage, fleet, workers’ compensation, general liability and certain medical claims.
Income taxes:
All active entities included in the combined group are taxed as either “S” Corporations under the Internal Revenue Code (the “Code”) or limited liability companies. Accordingly, no Federal income taxes are provided by the Company; however, the Company is subject to certain state and local income taxes on its income.
Provision has been made for deferred state and local Income taxes based on temporary differences between financial statement and the tax bases of assets and liabilities using currently enacted tax rates and regulations.
Use of estimates:
The preparation of financial statements in conformity with accounting principles generally accepted in the United States of America requires management to make estimates and assumptions that affect certain reported amounts and disclosures. Accordingly, actual results could differ from those estimates.
Marketable equity securities:
Marketable equity securities are classified as available-for-sale, with net unrealized gains and losses reported as a component of stockholders’ equity. The Company values its marketable equity securities in accordance with Statement of Financial Accounting Standards No. 157 (“SFAS 157”). At December 31, 2011, marketable securities valued at $102, based on quoted market prices considered to be “LeveI1” inputs under SFAS 157, were included in other current assets.

Chapter 4. Data Gathering BV201: Introduction to Business Valuation
BV201r v. 6.0 (11/15) Non-authoritative © 2015 American Society of Appraisers 19
Note 2 - Transactions and related parties:
The Company has borrowed funds from and loaned funds to certain uncombined affiliates, officers and stockholders. The loans are noninterest bearing unsecured demand loans. Certain owners and officers have guaranteed a major portion of the borrowings obtained by the Company.
The Company also rents equipment and real estate from the uncombined affiliates under month-to-month operating leases. Payments to and on behalf of these uncombined affiliates amounted to $7,447 and $5,046 in 2011 and 2010, respectively.
Note 3 - Property and equipment:
Property and equipment, at cost, consists of the following:
2011 2010 Transportation equipment $ 152,179 $ 149,302 Leasehold improvements and other fixed assets 30,447 27,935 182,626 177,237 Less accumulated depreciation and amortization 137,425 124,226 Totals $ 45,201 $ 53,011
Depreciation and amortization expense for 2011 and 2010 was $17,879 and $19,158, respectively. Fully depreciated and amortized assets having an original cost of approximately $85,720 and $85,873 are still in use at December 31, 2011 and 2010, respectively.
Note 4 - Leases:
Capital leases:
Included in property and equipment are the following assets financed by capital leases:
2011 2010 Transportation equipment $ 19,093 $ 14,536 Less accumulated depreciation 7,629 4,658 Totals $ 11,464 $ 9,878

Chapter 4. Data Gathering BV201: Introduction to Business Valuation
BV201r v. 6.0 (11/15) Non-authoritative © 2015 American Society of Appraisers 20
Future minimum lease payments under capital leases for transportation equipment, and the present value of the minimum lease payments, are as follows:
Year Ending
December 31,
Amount 2012 $ 3,949 2013 3,363 2014 2,746 2015 2,130 2016 863 Thereafter 488 13,539 Less amount representing interest 1,538 Present value of net minimum lease payments $ 12,001
Amortization of the capital lease assets is included in depreciation and amortization.
Operating leases:
Certain of the companies lease office space, terminals and warehousing facilities under operating leases which expire at various dates through September 2031, Transportation and other equipment are leased on a month-to-month basis, Rental expense, including the operating leases with uncombined affiliates (see Note 2), amounted to $16,490 and $13,366 in 2011 and 2010, respectively.
Minimum rental commitments under the noncancelable operating leases, with remaining terms of up to 23 years, including an aggregate of $46,958 with uncombined affiliates, in years subsequent to December 31, 2011 and thereafter are payable as follows:
Year Ending
December 31, Uncombined
Affiliates
Other
Total 2012 $ 5,400 $ 9,193 $ 14,593 2013 5,400 7,095 12,495 2014 5,400 6,205 11,605 2015 5,400 6,195 11,595 2016 5,400 6,056 11,456 Thereafter 46,874 27,576 74,450 Totals $ 73,874 $ 62,320 $136,194

Chapter 4. Data Gathering BV201: Introduction to Business Valuation
BV201r v. 6.0 (11/15) Non-authoritative © 2015 American Society of Appraisers 21
Note 5 - Long-term obligations:
Long-term obligations consist of notes payable to financial institutions and obligations under capital leases due in installments through June 2015 at various interest rates ranging from 3.84% to 8.47% per annum.
Maturities of long-term obligations, including capital leases, in each of the five years subsequent to December 31, 2011 and thereafter are as follows:
Year Ending
December 31,
Amount 2012 $ 15,2782013 11,5582014 8,0482015 4,3382016 1,625Thereafter 603 Total $ 41,450
Long-term obligations are collateralized by substantially all of the Company’s equipment with a net book value of approximately $36,505 at December 31, 2011, including $14,382 of transportation equipment related to transportation agreements under which the customers, at the option of the Company, must purchase the transportation equipment and satisfy all related debt if a customer terminates their agreement. The terms of the agreements parallel the terms of the debt associated with the equipment.
Historically, the Company maintained a $7,500 revolving line of credit with Capital One Bank. In 2011, the revolving line of credit was not renewed and in 2012, Capital One approved a $4,000 revolving line of credit, expiring June 2013. The Company has never borrowed against its revolving lines of credit.
Note 6 -Income taxes:
The provision (credit) for state income taxes consists of the following:
2011 2010 Current $ 198 $ 245Deferred 269 (117) Totals $ 467 $ 128

Chapter 4. Data Gathering BV201: Introduction to Business Valuation
BV201r v. 6.0 (11/15) Non-authoritative © 2015 American Society of Appraisers 22
Deferred tax liabilities at December 31, 2011and 2010 are $470 and $201, respectively, and are principally due to depreciation.
Note 7 - Employee benefit plans:
A majority of the employees of the Company are covered by multi-employer defined benefit pension plans and post-retirement health and welfare plans. Contributions to these plans amounted to $4,992 and $5,179 in 2011 and 2010, respectively. These contributions are determined in accordance with provisions of negotiated labor contracts. The Company presently has no intention to withdraw from participation in these plans, nor is there any intention to terminate such plans.
The Company maintains a defined contribution savings plan covering all nonunion employees under Section 401 (k) of the Code. Eligible employees can elect to contribute up to 15% of their salaries, subject to Code limitations, to an investment trust. The Company voluntarily contributed $688 and $673 to the plan in 2011 and 2010, respectively, pursuant to Safe Harbour Matching Contribution elections then in effect. For 2012, the Safe Harbour Matching Contribution was elected only through April 9.
Note 8 - Litigation - stockholder:
In 1996, a former stockholder commenced an action against the other two shareholders under Florida’s Oppressed Minority Shareholder Act. In 2001, the Court found that the former stockholder was guilty of oppression and ordered him to sell his Interest In the “Company” (defined by the Court as both the combined and uncombined companies). In 2002, the Court ruled on the payments to be made to the former stockholder and directed that either the Company or the remaining shareholders be the purchaser (the “First Valuation Ruling”). The purchaser was one of the remaining shareholders. The former stockholder appealed the First Valuation Ruling and a Second Valuation Hearing was ordered. Pending the appeal, the former stockholder was paid all monies required by the First Valuation Hearing. The Second Valuation Hearing concluded in 2010 and in 2011 the Court ruled that additional amounts were due to the former stockholder. The Company and the remaining shareholders believe that the same shareholder will remain the purchaser. The Company and the remaining shareholders believe it is unlikely that the assets of the combined companies or its stock are at risk to the former stockholder and therefore no liability has been recorded. The remaining shareholders intend to appeal the second Phase 2 Ruling.
Note 9 - GDT - Vinotrans Joint Venture:
In August 2010, General Deliveries Trucking, Inc. and Vinotrans Limited, a Chinese corporation, formed a joint venture named “GDT VinoGDT Cargo Management Limited.” The business of the joint venture is to provide warehousing and value added services within China to business entities engaged in the sale of consumer products via department stores, chain stores and specialty stores in the United States. Each joint venturer has the right to appoint and has appointed 3 members to the Board of Directors of the joint venture. The initial capital contribution by each joint venturer was 2,500 RMB, which General Deliveries Trucking, Inc. contributed in March 2008. The contribution approximated $355 when paid. The Company accounts for its investment in

Chapter 4. Data Gathering BV201: Introduction to Business Valuation
BV201r v. 6.0 (11/15) Non-authoritative © 2015 American Society of Appraisers 23
the joint venture using the equity method. The Joint venture met its sales goals for 2011. The Company recorded a loss of $82 in 2011, which is the Company’s 50% share of the joint venture’s $164 loss.
Note 10- Stockholders’ equity:
Common stock consists of the following:
2011 2010General Deliveries Trucking, Inc.: Authorized 16,000,000 shares (15,000,000 common and 1,000,000 preferred); par value $.01; issued and outstanding 3,588,000 shares of common stock
$ 36 $ 36 Additional paid-in-capital 1 1 Company 1 – capital contribution 700 700 Totals $ 737 $ 737
Distributions and other:
Distributions to stockholders amounted to $13,959 in 2011 and $14,246 in 2010.
Note 11- Fair value of financial instruments:
The fair value of financial instruments at December 31, 2011 and 2010 including cash and cash equivalents, accounts receivable, accounts payable and accrued expenses approximate their carrying amounts due to their relative short-term nature. The fair value of long-term obligations approximates carrying value due to having terms similar to those it can currently obtain.
Note 12- Supplemental disclosure of cash flow Information:
Cash paid during the year for: 2011 2010
Cash paid during the year Income taxes $ 312 $ 236Interest 2,846 3,428 Supplemental schedule of noncash investing and financing activities: Transportation equipment financed with lender 5,625 6,641Insurance premiums financed with lenders 1,580 1,785
Note 13- Other information:
In 2011, three customers, each exceeding 10% of operating revenue, accounted for approximately 42% of the combined operating revenue of the Company and 41% of the Company’s combined accounts receivable. In 2010, two customers, each exceeding 10%

Chapter 4. Data Gathering BV201: Introduction to Business Valuation
BV201r v. 6.0 (11/15) Non-authoritative © 2015 American Society of Appraisers 24
of the combined operating revenue of the Company accounted for approximately 27% of the combined operating revenue of the Company and 20% of the Company’s combined accounts receivable.
The Company has a concentration of employees working under collective bargaining agreements (“CBA”) representing approximately 47% of the entire workforce. The CBAs expire in the years 2012 through 2016, of which 26% of the employees are working under CBAs that expire in 2012.
The Company maintains accounts with financial institutions whereby principally all of its cash and cash equivalent balances usually exceed the maximum coverage provided by the Federal Deposit Insurance Corporation on Insured depositor accounts.

Chapter 4. Data Gathering BV201: Introduction to Business Valuation
BV201r v. 6.0 (11/15) Non-authoritative © 2015 American Society of Appraisers 25
Exhibit 4-3
General Delivery Trucking, Inc.
History of the Company

Chapter 4. Data Gathering BV201: Introduction to Business Valuation
BV201r v. 6.0 (11/15) Non-authoritative © 2015 American Society of Appraisers 26
HISTORY OF THE COMPANY General Deliveries Trucking, Inc. was founded by John Smith, Sr. in 1952. It was this company that eventually grew to be National Truckers, Inc. and all of the General Deliveries Trucking, Inc. companies. The Company was started and continued for several years with only one truck. John Smith, Jr., Mr. Smith’s oldest son, joined The Company in 19661, at which time The Company still had only one truck. The Company expanded to a total of 20 trucks over the next eight years. John Smith, Jr. served as Chief Operating Officer of The Company from 1970 until 1978, when he became Chief Executive Officer and Chairman of the Board.2
George Smith, Mr. Smith Sr.’s younger son, began working for The Company in 1971.3 In 1978, he was elected C.O.O. and became President of The Company in 1983.4 General Deliveries Trucking, Inc. was a small local trucking operation specializing in servicing the New York City garment district. General Deliveries Trucking, Inc. entered the field of garment-on-the-hanger consolidation and ticketing in the New York City metro area in 1974. In about 1977 to 1978, General Deliveries Trucking, Inc. purchased City Delivery Co., Inc., primarily purchasing City Delivery Co. for the ICC rights that would allow General Deliveries Trucking, Inc. to expand outside the New York City area.
Mr. Smith, Sr. died in 1978. James Brown, his son-in-law, joined The Company in that same year. By that time, The Company had become involved in long and short hauling of general commodities, mostly garments, as well as in warehousing and consolidating. In about 1977, the Smith group of companies signed its first fleet management contract. The group formed General Deliveries Systems, Inc. in 1984 as a management company for General Deliveries Transportation and General Deliveries Trucking, Inc., operating entities that were “C” Corporations, in contemplation of a public offering. Because of a crash in the initial public offering market, and a change in management philosophy, The Company decided to suspend its plans for the public offering, and has remained a closely held company.
The trucking industry was deregulated in the early 1980s. General Deliveries Transportation expanded its business operations into new areas including the “Pennsylvania Corridor.” At this time, The Company covered the entire Northeast and Mid-Atlantic corridor from Baltimore north. A competitor of GDT in this market, A.P.T., Inc., had a large share of the less-than-truckload (LTL) market in this corridor. In order to slow down The GDT Entities’ growth in this market, A.P.T. claimed that several GDT companies (General Deliveries Trucking, Inc. Co., Inc., General Deliveries Transportation, Inc., City Delivery Co., Inc. and Interior Freight Lines, Inc.) and John Smith, Jr. had violated Federal antitrust regulations by attempting to monopolize the
1Securities and Exchange Commission, General Deliveries Systems, Inc. Form S-1, p. 20. 2Ibid. 3Ibid. 4Ibid.

Chapter 4. Data Gathering BV201: Introduction to Business Valuation
BV201r v. 6.0 (11/15) Non-authoritative © 2015 American Society of Appraisers 27
industry in the Pennsylvania corridor. They brought action against John Smith, Jr. and The GDT Entities.
In 1986, The U.S. District Court, Southern District of New Jersey awarded a judgment to A.P.T. against all of the GDT defendants in the amount of $39 million, a treble damage award. However, in 1987, the Second Circuit U.S. Court of Appeals reversed the judgment and dismissed A.P.T.’s complaint. During this time frame, certain of The GDT Entities were sustaining substantial losses. Between the time of the trial court judgment and the Second Circuit Court’s reversal, the defendants each filed a Chapter XI petition in the Bankruptcy Court for the District of New Jersey. As a result of this filing, some of the major customers became concerned that problems might arise out of their dealings with the bankrupt GDT companies. It was decided to transfer all of the intangibles of the GDT debtor companies to other GDT Entities outside of the bankruptcy.
On November 19, 1985, in order to give The Company the opportunity to continue operations, Always Freight Corp. was purchased as a shell corporation that had ICC rights. Always obtained the necessary financing to effectively restructure The GDT Entities outside of the Chapter XI. The intangibles included the accounts receivables, customer lists, and every contract with The GDT Entities’ customers. During the late 1980s and early 1990s, personal legal issues kept John Smith, Jr. distracted from his duties and subsequently absent from The Company. He returned to The Company in 1994.
Today, The GDT Entities, known collectively as General Deliveries Systems, Inc., transport, consolidate, provide support services, and mark and ticket merchandise. The group’s primary customers are multi-unit retail stores. The services of The GDT Entities are designed to improve productivity of customer distribution systems by expediting the flow of merchandise from local vendor pick-ups to the final point-of-sale, thereby increasing inventory turnover.
The principal active companies of The GDT Entities as of December 31, 2011 include the following:
General Deliveries Systems, Inc.
Always Freight Corp.
Caribbean Island Transport, Inc.
Logistics, Inc.
The inactive companies include:
General Deliveries Trucking, Inc.
Equity Transport, Inc.
General Deliveries Resources, Inc.
Dale Transport, Inc.
SPD, Inc.
Eastern Retail Delivery, Inc.

Chapter 4. Data Gathering BV201: Introduction to Business Valuation
BV201r v. 6.0 (11/15) Non-authoritative © 2015 American Society of Appraisers 28
City Retail Ticketing, Inc.
Candoor Freightways, Inc.
General Deliveries Ticketing, Inc.
Distribution, Inc.
HHH, Inc.
Other businesses that are part of The GDT’s entities, through common ownership, include:
Roach Realty Company
Roach Realty II
Air Transportation, Inc.
1234 15th Street Associates, LLC
Smithfam Property Associates, LLC
Smithfam Realty Corporation
Joined Plan, Inc.
TXX Leasing Inc.
Advanced Lease Funding
Contract Transport, Inc.
General Deliveries Systems, Inc. (“GDT”) was incorporated in Delaware in 1983. The Company operated as a C Corporation until January 1, 1998, at which time its tax status was changed to an S Corporation. It eventually changed back to a C corporation in 2002. GDT owns a wholly owned subsidiary, General Deliveries Transportation, Inc. General Deliveries Transportation is a Pennsylvania corporation, incorporated in 1979, and operates three divisions: the Less-Than-Truckload (LTL) division, the Truck Werks division, and the General Deliveries Consolidation division. General Deliveries Trucking, Inc. Corp., another subsidiary of GDT has been inactive for many years.
Originally, General Deliveries Trucking, Inc.’s business consisted of local trucking pickups and deliveries in the New York Metropolitan Free Zone. After deregulation by the ICC, the LTL business began. The LTL division services markets on both the east and west coasts of the U.S. and handles shipments in several coordinated stages. Shipments are picked up from customers by local drivers operating from The Company’s network of 12 terminals. Each terminal serves a specific territory. The freight is then transported to the terminal, loaded into intercity trailers, hauled by line haul drivers to the terminal servicing the delivery area, transferred to trucks and trailers, and delivered to its final destination by local drivers. Established time schedules are strictly enforced for line haul service between terminals to insure prompt service.
Truck Werks is the in-house maintenance arm of The Company, and is involved in the repair and maintenance of power units (tractors) and trailers.

Chapter 4. Data Gathering BV201: Introduction to Business Valuation
BV201r v. 6.0 (11/15) Non-authoritative © 2015 American Society of Appraisers 29
The processing of inventory received from various locations into a single truckload unit is performed by the General Deliveries Consolidation division. This division serves only to consolidate freight; it is neither a shipper nor a carrier. The efficiency which results from streamlining deliveries, increasing timeliness of delivery, and servicing a customer whose facilities cannot accommodate numerous carriers is the goal of this service.
Always Freight Corporation was incorporated in Pennsylvania in 1982. The Company is a truckload line haul common and contract carrier of general commodities, except liquid bulk. Line haul shipping is offered to customers throughout the continental United States. The line haul trucking can be between two GDT facilities, a GDT facility and a final destination, a point of pick-up and a GDT facility, or a variety of other pick-up and delivery points. Where the line haul delivery is not going to the final destination, another GDT company may provide local delivery. Always and other GDT companies provide line haul and local trucking, and operate intrastate and interstate. Until the total deregulation of the trucking market these companies were regulated by the ICC and state authorities.
Always, in addition to its other operations, provides fleet management to its customers. A fleet management arrangement is a long-term contract between The Company and a customer, allowing Always to operate dedicated equipment for that customer. The Company provides drivers, dispatching, insurance, fueling, oil and tires, maintenance and related administrative and accounting services. The customer can benefit from certain economies of scale, reduced overhead and volume purchases because the customer’s fleet is integrated into Always’s or The GDT Entities’ transportation system. By utilizing the excess capacity (generally through back hauls), revenue is generated by Always or the GDT companies, and the customer’s accounts are credited for use against future charges.
Typical fleet management agreements require Always to provide, operate, maintain, and insure a dedicated fleet of vehicles. The customer sets forth operating guidelines, and defines routes in accordance with its transportation needs, but gives operating control of the fleet to Always or The GDT Entities. Always is considered an independent contractor and is usually compensated on a cost-plus basis. Approximately 50 percent of Always’s carrier business is contract shipping with multi-location retailers. The principal retailer that Always contracts with is Federated Department Stores. Federated’s principal retail stores include Macy’s and Bloomingdales. Always also handles private fleets for K-Mart, Best Buy, and Filene’s Basement.
Caribbean Island Transport, Inc. is a C Corporation which was incorporated in New Jersey in 1985. It is a contract carrier that provides private fleet management for Marshall’s. The GDT Entities began with Marshall’s in 1980 and serviced six to eight stores. Now, Caribbean Island handles up to 1,000 stores for Marshall’s and provides store delivery throughout the country.
Always Freight provides all of The GDT Entities’ truckload revenue, while the other half of Always’s business is fleet management. Fleet management is the sole function of both Caribbean Island Transport and General Deliveries Trucking Corp. (which no longer operates). Fleet management has the potential to substantially grow with its customers. At the valuation date, The Company was optimistic about growing with customers such as K-Mart and Best Buy, as these customers had promising future prospects.
General Deliveries Systems, Inc. serves a variety of multi-unit retail customers. The five largest are listed in Table 1 for selected years:

Chapter 4. Data Gathering BV201: Introduction to Business Valuation
BV201r v. 6.0 (11/15) Non-authoritative © 2015 American Society of Appraisers 30
TABLE 1 TOP SALES BY CUSTOMER
2008 2009 2010 2011
K-Mart $32,743,896 15.32% TJX Group $34,980,705 14.45% TJX Group $29,507,267 14.63% K-Mart $68,437,880 25.76%
TJX Group 28,704,342 13.43% K-Mart 24,208,100 13.39% K-Mart 31,668,160 12.43% TJX Group 58,049,988 21.85%
Dayton Group 14,619,337 6.84% Dayton Group 18,640,237 7.70% Federated 22,674,708 8.90% Federated 48,140,310 18.12%
Federated 12,567,500 5.88% Federated 16,364,676 6.76% Dayton Group 18,343,584 7.20% Best Buy 20,191,300 7.60%
Calvin Klein 7,459,282 3.49% Limited Stores 7,964,465 3.29% Calvin Klein 9,197,269 3.61% Dayton Group 17,773,658 6.69%
Others 117,638,643 55.04% Others 139,922,817 54.41% Others 143,381,012 53.23% Others 53,081,864 19.97%
TOTAL $ 213,733,000 100.00% TOTAL $242,081,000 100.00% TOTAL $254,772,000 100.00% TOTAL $265,675,000 100.00%

Chapter 4. Data Gathering BV201: Introduction to Business Valuation
BV201r v. 6.0 (11/15) Non-authoritative © 2015 American Society of Appraisers 31
Although it would appear that a majority of revenues come from just a few companies, it is important to note that some customers have multiple chains. This fact reduces the risk of customer concentration. It should also be noted that our review of various publicly traded companies’ annual reports reflects that this is not uncommon in this industry. The GDT Entities have enjoyed a long-term relationship with many of its larger accounts.
Various agreements with major customers are in place and continuously are renewed to allow The GDT Entities to provide services to such companies as K-Mart, Federated Stores, Best Buy and others. In fact, when questioned about the importance of a good relationship with clients, John Smith stated, “I believe the average client is with me 40 years.”
Based on the facts that these large companies have been expanding their relationship with General Deliveries Trucking, Inc., and the renewal contracts, over the past several years have been extended for longer periods of time, John Smith appears to be correct. The relationship with these customers is solid and therefore, the future prospects for General Deliveries Trucking, Inc. are excellent.
The GDT Entities employ between 1,000 and 2,000 employees. The vast majority of these employees are covered under collective bargaining agreements of various union locals. The companies also use independent contractors who provide personnel in different areas of the companies’ operations. Each GDT company deals with different bargaining units. General Deliveries Transportation deals with several unions, including I.L.G.W.U. Local 102, Teamster Local 653, ILA-AFL-CIO Local 1964, and UAW Local 509. Always also deals with ILA-AFL-CIO Local 1964. Caribbean deals with Teamster Local 25. The GDT Entities have never had any labor problems.
All of the drivers have commercial licenses. Drivers for The GDT Entities receive uniforms, and new tractors to drive. Most drivers do not have to touch their freight, and are able to be home almost every night. Most of the employees are covered by multi-employer defined benefit pension plans, and post-retirement health and welfare plans. Also, The Company entered into a 401(k) plan in 1995 for salaried employees.
The Company’s solid reputation for on-time deliveries and a history of servicing the retail industry are competitive advantages for The GDT Entities. As The GDT Entities expand its facilities, more and continued good services are expected to be provided for the customers.
The senior management of The Company as of December 31, 2011 appears in Table 2.
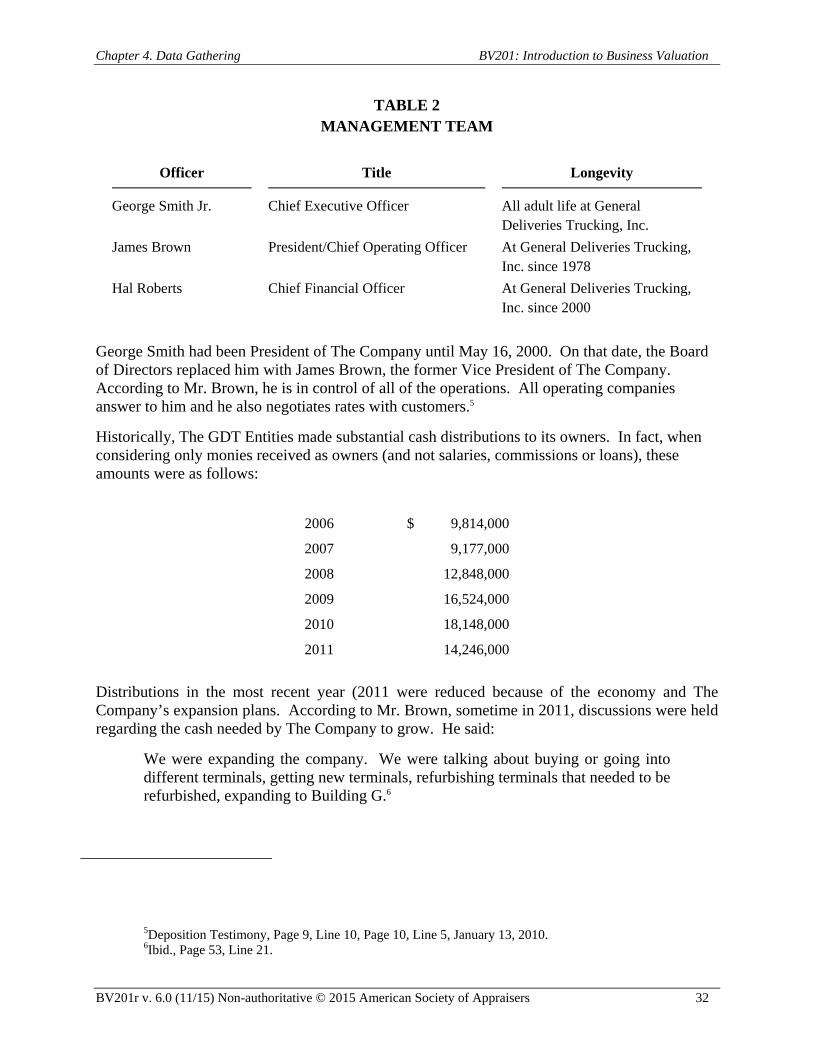
Chapter 4. Data Gathering BV201: Introduction to Business Valuation
BV201r v. 6.0 (11/15) Non-authoritative © 2015 American Society of Appraisers 32
TABLE 2 MANAGEMENT TEAM
Officer Title Longevity
George Smith Jr. Chief Executive Officer All adult life at General Deliveries Trucking, Inc.
James Brown President/Chief Operating Officer At General Deliveries Trucking, Inc. since 1978
Hal Roberts Chief Financial Officer At General Deliveries Trucking, Inc. since 2000
George Smith had been President of The Company until May 16, 2000. On that date, the Board of Directors replaced him with James Brown, the former Vice President of The Company. According to Mr. Brown, he is in control of all of the operations. All operating companies answer to him and he also negotiates rates with customers.5
Historically, The GDT Entities made substantial cash distributions to its owners. In fact, when considering only monies received as owners (and not salaries, commissions or loans), these amounts were as follows:
2006 $ 9,814,000
2007 9,177,000
2008 12,848,000
2009 16,524,000
2010 18,148,000
2011 14,246,000
Distributions in the most recent year (2011 were reduced because of the economy and The Company’s expansion plans. According to Mr. Brown, sometime in 2011, discussions were held regarding the cash needed by The Company to grow. He said:
We were expanding the company. We were talking about buying or going into different terminals, getting new terminals, refurbishing terminals that needed to be refurbished, expanding to Building G.6
5Deposition Testimony, Page 9, Line 10, Page 10, Line 5, January 13, 2010. 6Ibid., Page 53, Line 21.

Chapter 4. Data Gathering BV201: Introduction to Business Valuation
BV201r v. 6.0 (11/15) Non-authoritative © 2015 American Society of Appraisers 33
Expansion of The Company was a major priority. The GDT Entities had been experiencing rapid growth in revenues as follows:
2006 $ 193,422,000
2007 189,704,000
2008 213,733,000
2009 242,081,000
2010 254,772,000
2011 265,675,000
Looking at customer growth, increased revenues, cash distributions to the owners, and the strong financial position (soon to be discussed) of The GDT Entities, we believe that The GDT Entities are strong and positioned for solid growth.
Ownership of The GDT Entities, for purposes of this appraisal has been assumed to be consistent with the order of The Court. Each owner, John Smith, Jr., George Smith and Patricia Brown, is considered to own one-third of the entire entity.

Chapter 4. Data Gathering BV201: Introduction to Business Valuation
BV201r v. 6.0 (11/15) Non-authoritative © 2015 American Society of Appraisers 34
Exhibit 4-4
Sample Information Request
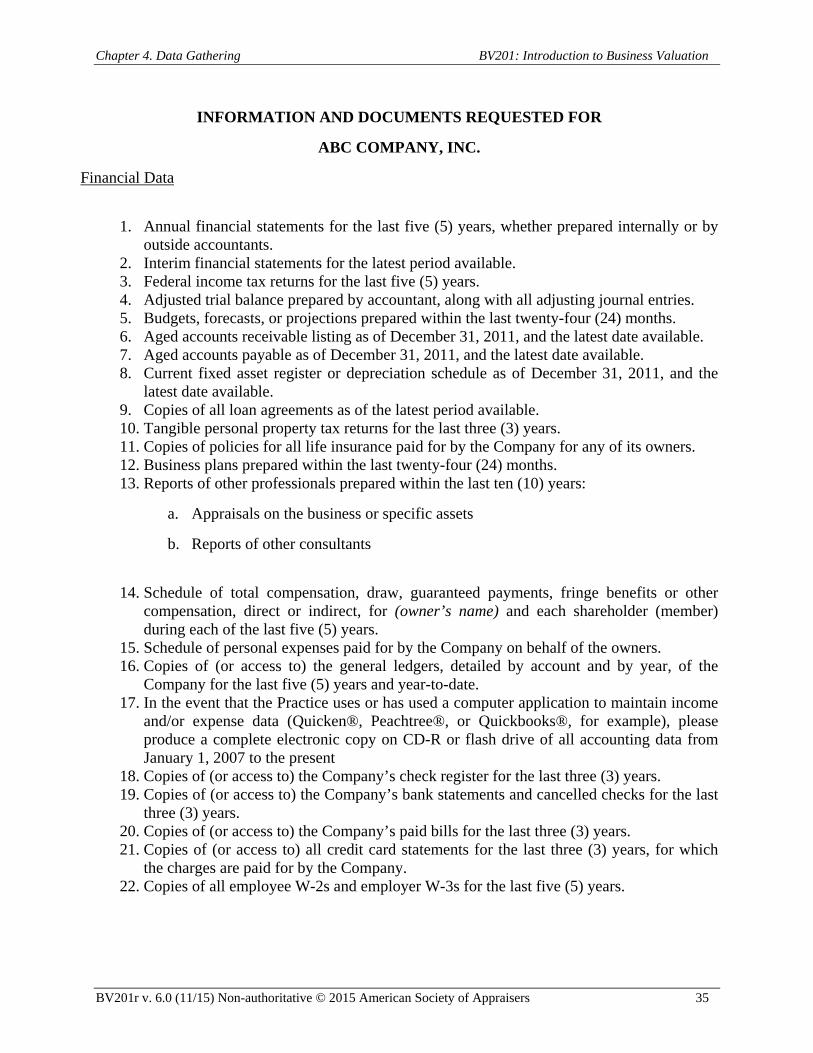
Chapter 4. Data Gathering BV201: Introduction to Business Valuation
BV201r v. 6.0 (11/15) Non-authoritative © 2015 American Society of Appraisers 35
INFORMATION AND DOCUMENTS REQUESTED FOR
ABC COMPANY, INC.
Financial Data
1. Annual financial statements for the last five (5) years, whether prepared internally or by
outside accountants. 2. Interim financial statements for the latest period available. 3. Federal income tax returns for the last five (5) years. 4. Adjusted trial balance prepared by accountant, along with all adjusting journal entries. 5. Budgets, forecasts, or projections prepared within the last twenty-four (24) months. 6. Aged accounts receivable listing as of December 31, 2011, and the latest date available. 7. Aged accounts payable as of December 31, 2011, and the latest date available. 8. Current fixed asset register or depreciation schedule as of December 31, 2011, and the
latest date available. 9. Copies of all loan agreements as of the latest period available. 10. Tangible personal property tax returns for the last three (3) years. 11. Copies of policies for all life insurance paid for by the Company for any of its owners. 12. Business plans prepared within the last twenty-four (24) months. 13. Reports of other professionals prepared within the last ten (10) years:
a. Appraisals on the business or specific assets
b. Reports of other consultants
14. Schedule of total compensation, draw, guaranteed payments, fringe benefits or other
compensation, direct or indirect, for (owner’s name) and each shareholder (member) during each of the last five (5) years.
15. Schedule of personal expenses paid for by the Company on behalf of the owners. 16. Copies of (or access to) the general ledgers, detailed by account and by year, of the
Company for the last five (5) years and year-to-date. 17. In the event that the Practice uses or has used a computer application to maintain income
and/or expense data (Quicken®, Peachtree®, or Quickbooks®, for example), please produce a complete electronic copy on CD-R or flash drive of all accounting data from January 1, 2007 to the present
18. Copies of (or access to) the Company’s check register for the last three (3) years. 19. Copies of (or access to) the Company’s bank statements and cancelled checks for the last
three (3) years. 20. Copies of (or access to) the Company’s paid bills for the last three (3) years. 21. Copies of (or access to) all credit card statements for the last three (3) years, for which
the charges are paid for by the Company. 22. Copies of all employee W-2s and employer W-3s for the last five (5) years.

Chapter 4. Data Gathering BV201: Introduction to Business Valuation
BV201r v. 6.0 (11/15) Non-authoritative © 2015 American Society of Appraisers 36
Operating Data
23. List of the main competitors of the Company. 24. List of the Company’s top five (5) suppliers, by name and dollar amount, for the last five
(5) years. 25. List of the Company’s top five (5) customers, by name and dollar amount, for the last
five (5) years. 26. List of shareholders showing the percentage owned by each person and/or entity. 27. All documents pertaining to transactions with related parties. 28. List of all key personnel including names, job description, annual salary, relevant
experience, and period the individual has been associated with the Company. 29. Capital expenditures budget for the next three (3) years.
Legal Documents
30. Copies of significant leases and loans, including stockholder loans and notes payable. 31. Copies of shareholder agreements, operating agreements, partner agreements, by-laws,
employment contracts, and any other agreements by and between the Company and any of its shareholders, directors, or related parties.
32. Copies of any buy-sell agreements and/or written offers to purchase or sell the Company. 33. List of all litigation, including pending or threatened lawsuits, or audits. 34. Copies of minutes of director and/or member meetings for the last ten (10) years. 35. Documents relating to of any significant new contracts, clients, or business arrangements. 36. Copies of all documents pertaining to employee benefit plans, including pension plans,
and profit-sharing plans. 37. All reports and correspondence of examinations issued by government agencies such as
EPA, IRS, OSHA, etc.
Company Data
38. Brief history and description of the business. Company brochure or other Company
information, if available. 39. Documents pertaining to changes in the Company’s ownership during the last five (5)
years, including copies of any business valuation reports, gift tax returns, and estate tax returns.
40. Documents relating to contingent liabilities (such as guarantees or warranties) or off balance sheet financing (such as letters of credit).

Chapter 5. General Economic and Political Analysis BV201: Introduction to Business Valuation
BV201r v. 6.0 (11/15) Non-authoritative © 2015 American Society of Appraisers 1
Chapter 5. General Economic and Political Analysis
I. Introduction
A. Business is an integral part of an economy, particularly a free market economy.
B. On the most conceptual level, businesses purchase resources in the marketplace and generate goods and services, which are sold in the marketplace.
C. Analyzing and understanding the economic environment in which a business operates is fundamental to the appraiser’s ability to assess value, as a business cannot be viewed, for valuation purposes, in isolation.
D. The economic environment is just one of several frameworks of issues that drive value, either by affecting the level of economic benefits to owners or by affecting the risk in those economic benefits occurring.
E. The economic and related political environments in which a business operates can be viewed from three perspectives:
1. The global environment
2. The national environment
3. The regional and local environment
ResourceMarkets
ProductMarkets
Businesses Households
Resources
Goods &Services
Inputs
Goods &Services
$ Costs
$ Revenue $ Consumption
$ Incomes

Chapter 5. General Economic and Political Analysis BV201: Introduction to Business Valuation
BV201r v. 6.0 (11/15) Non-authoritative © 2015 American Society of Appraisers 2
II. The Globalization of Economic Factors
A. Globalization has been defined as the growing interconnectedness of the world through cross-border flows of information, capital and people.1
B. Economic globalization creates both new opportunities and challenges for firms.
1. The opportunities include:
a. Access to new markets that were previously closed due to cost, regulation or indirect barriers
b. The ability to tap resources such as labor, capital and knowledge on a worldwide basis
c. The opportunity to participate in global production networks that are becoming prevalent in many industries such as automotive, electronics, toys and textiles
2. Challenges come from:
a. Foreign competitors entering a firm’s domestic markets
b. Domestic competitors reducing their costs through global sourcing, moving production offshore or gaining economies of scale by expanding into new markets
c. Forcing firms to become more streamlined and efficient while simultaneously extending the geographic reach of their operations
C. Global-specific risks
1. Country risk, which refers to the risk that a country won’t be able to honor its financial commitments. When a country defaults it can harm the performance of all other financial instruments in that country as well as other countries it has relations with. Country risk applies to stocks, bonds, mutual funds, options and futures that are issued within a particular country. This type of risk is most often seen in emerging markets or countries that have a severe deficit.
2. Exchange rate risk, which refers to relative changes in currency exchange rates between the subject company’s “home” currency and the currency for which the company buys from or sells into
3. Political risk, which represents the financial risk that a country’s government will suddenly change its policies (This is a major reason that second and third world countries lack foreign investment.)
1Held, David, Anthony McGrew, David Goldblatt, & Jonathan Perraton. 1999. Global Transformations:
Politics, Economics and Culture. Stanford, CA: Stanford University Press.

Chapter 5. General Economic and Political Analysis BV201: Introduction to Business Valuation
BV201r v. 6.0 (11/15) Non-authoritative © 2015 American Society of Appraisers 3
D. Implications of globalization on valuation
1. Globalization increases the complexity of risk analysis.
2. Valuation opportunities exist beyond U.S. borders.
3. Need for appraisers to understand non-U.S. conventions in financial reporting, taxation, regulation and culture on the valuation subject
III. Country-Specific (National) Economic Factors
A. Global effects aside, macroeconomic factors that affect business value are generally driven at the national level. These macroeconomic factors include:
1. General economic conditions
a. GDP
b. Consumer spending
c. Government spending
d. Business investments and inventories
e. Trade deficit
2. Inflation
3. Interest rates
4. Unemployment
5. Consumer spending and confidence
6. Equity and debt markets
7. Construction activity
8. Manufacturing activity
9. Economic growth
B. Regulatory environment
1. Taxation
2. Industry regulation
3. Employment laws
4. Trade barriers/protection

Chapter 5. General Economic and Political Analysis BV201: Introduction to Business Valuation
BV201r v. 6.0 (11/15) Non-authoritative © 2015 American Society of Appraisers 4
IV. Regional and Local Economic Factors
A. It is difficult to imagine a valuation engagement where the regional and local economy had no impact on the valuation of a business interest. The old saying, “All politics are local” is applicable to economics as well.
B. Typical regional and local economic factors’ impact:
1. Labor pool or lack thereof
2. Facility availability and cost
3. Distribution infrastructure
4. Local regulatory environment
a. Land use
b. Business regulations
c. Labor laws
d. Taxes and fees
See Handout 5-1 for a specific example of a local economic analysis.
C. Sample Economic Analysis see Exhibit 5-1
Classroom Assignment 6: Review Exhibit 5-1 and write a brief summary as to how the economy potentially impacts GDT and specifically the valuation of the Company.
(15 minutes)

Chapter 5. General Economic and Political Analysis BV201: Introduction to Business Valuation
BV201r v. 6.0 (11/15) Non-authoritative © 2015 American Society of Appraisers 5
Handout 5-1
Example of Local Economic Analysis

Chapter 5. General Economic and Political Analysis BV201: Introduction to Business Valuation
BV201r v. 6.0 (11/15) Non-authoritative © 2015 American Society of Appraisers 6
Exhibit 5-1
National Economic Analysis

Chapter 5. General Economic and Political Analysis BV201: Introduction to Business Valuation
BV201r v. 6.0 (11/15) Non-authoritative © 2015 American Society of Appraisers 7
Economic Update at a Glance2 The U.S. economy experienced its quickest growth rate this quarter since the second quarter of 2010. Unfortunately, most economists do not believe this growth rate is sustainable. To further dampen the news, the Economic Policy Institute (“EPI”) points out that, if you remove changes in private inventories (a particularly volatile part of the economy), final demand (gross domestic product (“GDP”) minus the impact of inventory changes) grew at only a 0.8% rate this quarter. Domestic demand (final demand that adds imports but subtracts exports – a measure of how much U.S.-based households, businesses, and governments are demanding) grew at only 0.9%. “This [economic] health is poor,” the EPI concluded. Consumer spending grew this quarter, but was partially financed through consumers’ savings as disposable personal income only grew modestly. This marks the fifth consecutive quarter of decline for the personal savings rate. Decreasing food and energy prices eased the growth of the Consumer Price Index (“CPI”) and Producer Price Index (“PPI”) and the Federal Open Market Committee (“FOMC”) believes that inflation will settle, over coming quarters, at levels at or below those consistent with their goal inflation rate. After dropping sharply in October, the Consumer Confidence Index® showed steady growth in November and December. Regardless, the index remains low and many are unsure whether this is a rebound from earlier declines or a sustainable shift in improving consumer optimism. The major stock market indexes experienced notable growth this quarter as market volatility – indicated by VIX3 – remained elevated. The Institute for Supply Management’s manufacturing sector index and services sector index increased slightly this quarter. While the two indexes remain at a level signifying growth, they are barely within the healthy range and indicate that growth is sluggish. Privately owned housing starts and building permits authorized were up this quarter from one year ago. Home sales continued to increase and are up from a year ago as record low mortgage interest rates, job growth, and bargain home prices are leading more consumers into the housing market. To the dismay of many homeowners, housing prices have yet to see any improvement. The consensus forecasts for GDP, personal consumption, business investments, unemployment, along with other key indicators, remain mostly positive and indicate slow growth ahead.
2 Economic Outlook Update™ 4th Quarter 2011, (Compiled Using Data Available as of December 31,
2011), Business Valuation Resources, LLC, ©2011. 3 VIX represents the ticker symbol for the Chicago Board Options Exchange Volatility Index, a popular
volatility measure of the implied volatility of 30-day options on the S&P 500 stocks.

Chapter 5. General Economic and Political Analysis BV201: Introduction to Business Valuation
BV201r v. 6.0 (11/15) Non-authoritative © 2015 American Society of Appraisers 8
Gross Domestic Product The U.S. Department of Commerce reported that the nation's economy – as indicated by GDP – increased at an annual rate of 2.8% in the fourth quarter. The fourth-quarter 2011 rate is an acceleration from the previous quarter’s rate of 1.8%. Economists noted that a GDP growth rate of 2.8%, if sustained for over a year, would put mild downward pressure on the unemployment rate. Unfortunately, very few estimates believe future growth will continue at the fourth quarter’s rate. GDP is the total market value of goods and services produced in the U.S. economy and considered the most comprehensive measure of economic growth. The U.S. Department of Commerce found that the increase in real GDP in the fourth quarter reflected positive contributions from private inventory investment, personal consumption expenditures, exports, residential fixed investment, and nonresidential fixed investment. This growth was partly offset by negative contributions from federal government spending and state and local government spending. Imports, which are a subtraction in the calculation of GDP, increased. The acceleration in real GDP in the fourth quarter primarily reflected an upturn in private inventory investment and accelerations in personal consumption expenditures and in residential fixed investment. This acceleration was partly offset by a deceleration in nonresidential fixed investment, a downturn in federal government spending, an acceleration in imports, and a larger decrease in state and local government spending. The economy grew 1.7% in 2011 after growing 3.0% in 2010. Consumer Spending Consumer spending grew at a rate of 2.0% during the fourth quarter of 2011. This is a slight acceleration from the prior quarter’s rate of 1.7%. Consumer spending – also referred to as personal consumption – accounts for approximately 70% of the U.S. GDP. What many find particularly troubling is that disposable personal income rose at only a 0.8% rate this quarter, signifying that the small growth in consumption spending was partially financed by a reduction in the personal savings rate, which fell to 3.7% of disposable personal income. This is the fifth straight quarterly decline for the personal savings rate and the lowest savings rate since the last quarter of 2007. Many economists point out that economic growth stemming from an ever-lower personal savings rate is inherently fragile. This quarter’s growth in consumer spending contributed 1.45 percentage points to the fourth-quarter GDP. Overall consumer spending increased 2.2% in 2011 after growing 2.0% in 2010. Consumer spending on durable goods – items meant to last three or more years, such as computers, cars, and machinery – increased at a rate of 14.8% this quarter, compared with a rate of 5.7% in the previous quarter. Consumer spending on durable goods increased 8.1% in 2011 after increasing 7.2% in 2010.

Chapter 5. General Economic and Political Analysis BV201: Introduction to Business Valuation
BV201r v. 6.0 (11/15) Non-authoritative © 2015 American Society of Appraisers 9
Consumer spending on nondurable goods – items such as food and gasoline – increased at a rate of 1.7% this quarter, up from a decreasing rate of 0.5% last quarter. Consumer spending on nondurable goods increased 1.7% in 2011 after increasing 2.9% in 2010. Service expenditures grew at a rate of 0.2% this quarter, down from 1.9% in the previous quarter. Consumer spending on services increased 1.4% in 2011 after growing 0.9% in 2010. According to the U.S. Department of Commerce, total retail and food service sales increased 1.9% during the fourth quarter and 6.5% over the last 12 months. Automobile and parts sales increased 5.1% during the fourth quarter and 8.8% over the last 12 months. Electronic and appliance store sales increased 1.3% this quarter and are unchanged over the last 12 months. Gasoline station sales increased 0.3% in the fourth quarter and 8.9% over the last 12 months. Food services and drinking places sales increased 2.6% this quarter and 8.4% over the last 12 months. Grocery store sales increased 0.3% this quarter and 4.7% over the last 12 months. Government Spending Total government spending declined at a rate of 4.6% in the fourth quarter of 2011. Government spending declined at a rate of 0.1% in the previous quarter. This quarter’s decline in government spending provided a negative 0.93 percentage point contribution to the fourth-quarter GDP. Total government spending decreased by 2.1% in 2011, after growing 0.7% in 2010. Federal government spending decreased at a rate of 7.3% in the fourth quarter after growing at a rate of 2.1% in the previous quarter. Federal government spending declined by 2.0% in 2011, after growing 4.5% in 2010. National defense spending decreased at a rate of 12.5% this quarter after increasing at a rate of 5.0% in the previous quarter. National defense spending declined 2.4% in 2011 after increasing 3.3% in 2010. State and local government spending declined at a rate of 2.6% in the fourth quarter after decreasing at a rate of 1.6% in the previous quarter. State and local government spending declined 2.3% in 2011 and 1.8% in 2010. Fixed Investments Business spending, also known as nonresidential fixed investment grew at a rate of 1.7% in the fourth quarter. This was a deceleration from a rate of 15.7% in the previous quarter. Business spending has now grown for eight consecutive quarters. Business spending increased 8.6% in 2011 and 4.4% in 2010. Business spending contributed 0.18 percentage points to the fourth-quarter GDP. Business spending on structures (nonresidential structures) declined at an annual rate of 7.2% in the fourth quarter. Business expenditures on equipment and software increased at an annual rate of 5.2% in the fourth quarter – the tenth consecutive quarterly increase.
Chapter 5. General Economic and Political Analysis BV201: Introduction to Business Valuation
BV201r v. 6.0 (11/15) Non-authoritative © 2015 American Society of Appraisers 10
Residential fixed investment, often considered a proxy for the housing market, increased at an annual rate of 10.9% during the fourth quarter. This comes after a rate of 1.3% in the previous quarter. This quarter’s growth in residential fixed investment made a 0.23 percentage point contribution to the fourth-quarter GDP. Residential fixed investment declined 1.4% in 2011 and 4.3% in 2010. Business Inventories Business investments in inventories increased at a faster pace in the fourth quarter than in the previous quarter. Private businesses increased inventories $56.0 billion in the fourth quarter, following increases of $2.0 billion in the third quarter and $39.1 billion in the second. The increased pace of real private inventories added 1.94 percentage points to the fourth-quarter change in GDP. Exports and Imports Net exports were a slight drag on growth this quarter, subtracting 0.11 percentage points from the fourth-quarter GDP. Exports grew at an annual rate of 4.7% in the fourth quarter, following last quarter’s rate of also 4.7%. Exports increased 6.8% in 2011 and 11.3% in 2010. Foreign imports, which are a subtraction in the calculation of GDP, increased at an annual rate of 4.4% during the fourth quarter. This follows last quarter’s rate of 1.2%. Imports increased 5.0% in 2011 and 12.5% in 2010. Energy Prices The Energy Information Administration ("EIA") reported that the spot price for a barrel of West Texas Intermediate ("WTI") crude oil was $98.83 at the end of the fourth quarter. This is a sizable increase from $78.93 per barrel at the end of the third quarter. A year ago, the spot price for a barrel of WTI crude oil was $91.83. The EIA predicts that the WTI crude oil spot price will average approximately $100.25 per barrel in 2012 and $103.75 per barrel in 2013, up from $94.86 in 2011. The regular retail gas price (conventional areas) was $3.21 per gallon at the end of the fourth quarter. This is down from $3.46 per gallon at the end of the third quarter. A year ago, the regular retail gas price was $3.02 per gallon. The EIA expects regular retail gas prices to average $3.48 per gallon in 2012 and $3.55 per gallon in 2013, compared with $3.53 in 2011. The Henry Hub natural gas spot price was $2.98 per million Btu ("MMBtu") at the end of the fourth quarter, down from $3.68 per MMBtu at the end of the third quarter. A year ago, the Henry Hub natural gas sport price was $4.22 per MMBtu.

Chapter 5. General Economic and Political Analysis BV201: Introduction to Business Valuation
BV201r v. 6.0 (11/15) Non-authoritative © 2015 American Society of Appraisers 11
The Henry Hub natural gas spot price is projected to average $3.53 per million Btu ("MMBtu") in 2012 and $4.14 per MMBtu in 2013, compared with $4.00 per MMBtu in 2011. Residential electric prices, which averaged 11.78 cents per kilowatt-hour ("kWh") in 2011, are expected to average 11.85 cents per kWh in both 2012 and 2013. Unemployment and Personal Income The U.S. Department of Labor reported that the December unemployment rate decreased slightly to 8.5% (or approximately 13.1 million unemployed) – this was the lowest unemployment rate in nearly three years. The good news is that the fall in the unemployment rate was not heavily influenced by the “discouraged-worker effect,” as was the case in previous months. Private sector employment increased by 212 thousand jobs while government jobs declined by 12 thousand for 200 thousand net new jobs. Goods-producing industries led the way by adding 48 thousand new jobs for the month, while the construction and manufacturing industries reported increases of 17 thousand and 23 thousand new jobs, respectively. Employment in the public sector has decreased 17 of the past 19 months. There were 5.6 million long-term unemployed (those jobless for 27 weeks or more), which made up 42.5% of unemployed persons at the end of December (down slightly from November). The White House Council of Economic Advisers, an agency within the Executive Office of the President, stated that December’s employment report provides further evidence that the economy is continuing to heal from the worst economic downturn since the Great Depression. The U.S. Department of Labor reported that average hourly earnings for production and nonsupervisory employees were $19.54 at the end of the fourth quarter, up 1.6% from a year ago. Average weekly earnings for production and nonsupervisory employees were $658.50 at the end of the fourth quarter, up 2.2% from a year ago. Average hourly earnings for all private employees were $23.24 at the end of the fourth quarter, up 2.0% from a year ago. Average weekly earnings for all employees were $799.46 at the end of the fourth quarter, up 2.7% from a year ago. The U.S. Department of Commerce reported that current-dollar personal income increased $82.6 billion (2.6%) in the fourth quarter, compared with an increase of $24.3 billion (0.8%) in the third. Personal current taxes increased $40.0 billion in the fourth quarter, compared with an increase of $12.3 billion in the third. Disposable personal income increased $42.7 billion (1.5%) in the fourth quarter, compared with an increase of $11.9 billion (0.4%) in the third. Real disposable personal income decreased 0.8% in the fourth quarter, compared with a decrease of 1.9% in the previous quarter. Personal outlays increased $69.9 billion (2.5%) in the fourth quarter, compared with an increase of $112.0 billion (4.1%) in the third. Personal saving – disposable personal income less personal outlays – was $429.3 billion in the fourth quarter, compared with $456.5 billion in the third.

Chapter 5. General Economic and Political Analysis BV201: Introduction to Business Valuation
BV201r v. 6.0 (11/15) Non-authoritative © 2015 American Society of Appraisers 12
The personal saving rate – saving as a percentage of disposable personal income – was 3.7% in the fourth quarter, compared with 3.9% in the third. Consumer Confidence The Conference Board's Consumer Confidence Index®, which improved in November, continued to increase in December. The Consumer Confidence Index stood at 64.5 on December 27, up from 55.2 at the end of November. While the index's reading is now above the average for the 2008 through 2009 recession, the normal non-recession value for the index is 100, so 64.5 is still a long way from normal. Consumers’ assessment of current business and labor market conditions continued to improve in December. Looking ahead, the Conference Board believes consumers are more optimistic that business conditions, employment prospects, and their financial situations will continue to get better. “While consumers are ending the year in a somewhat more upbeat mood, it is too soon to tell if this is a rebound from earlier declines or a sustainable shift in attitudes,” says Lynn Franco, Director of The Conference Board Consumer Research Center. The Consumer Confidence Index is an indicator designed to measure consumer confidence, which is the degree of optimism on the state of the economy that consumers are expressing through their activities of savings and spending. A month-on-month decreasing trend in the Consumer Confidence Index suggests consumers have a negative outlook on their ability to secure and retain good jobs, whereas a rising trend in consumer confidence indicates improvements in consumer buying patterns. Opinions on current conditions make up 40% of the index (the Present Situation Index), with expectations of future conditions comprising the remaining 60% (the Expectations Index). Manufacturing The Federal Reserve published that total industrial production increased 0.4% in December, after decreasing 0.3% in November. Increased manufacturing and mining output offset decreased utilities output. For the fourth quarter as a whole, industrial production rose at an annual rate of 3.1%, its 10th consecutive quarterly gain. At 95.3% of its 2007 average, total industrial production in December was up 2.9% from its level a year earlier. Industrial production is an output measure of the industrial sector of the economy. The industrial sector includes manufacturing, mining, and utilities. Manufacturing, an industry group included in total industrial production, grew at an annual rate of 3.9% in the fourth quarter. This is down from a rate of 5.0% in the previous quarter. Manufacturing has risen 3.7% over the past 12 months. The output of mines grew at a rate of 10.4% in the fourth quarter, up from a rate of 10.2% in the previous quarter. Mining output has increased 6.5% over the past 12 months. The output of utilities decreased at a rate of 10.5% in the fourth quarter after increasing at a rate of 10.7% in the previous quarter. The output of utilities has declined 6.6% over the past 12 months.

Chapter 5. General Economic and Political Analysis BV201: Introduction to Business Valuation
BV201r v. 6.0 (11/15) Non-authoritative © 2015 American Society of Appraisers 13
Capacity utilization averaged 78.0% during the fourth quarter. The fourth quarter figure is up from 77.8% during the third quarter. Capacity utilization is the percentage of production capacity manufacturers actually use. Capacity utilization averaged 77.3% in 2011 and 74.5% in 2010. The U.S. Census Bureau announced that new orders for manufactured durable goods in December increased $6.2 billion (3.0%) to $214.5 billion. This increase, up five of the last six months, followed a 4.3% November increase. Excluding the volatile transportation orders, new orders increased 2.1%. Excluding defense, new orders increased 3.5%. New orders for nondefense goods excluding volatile aircraft orders – an indicator of business spending strength – rose 2.9% in December. Orders for transportation equipment, up for two consecutive months, had the largest December increase at 5.5%. The Institute for Supply Management (“ISM”) reported that their monthly Manufacturing Index (known as PMI) was at 53.9% at the end of the fourth quarter, up from 52.5% at the end of the prior quarter. The December reading was the index’s highest reading since June. New orders for December increased to their highest level since April 2011. ISM's manufacturing employment index also climbed in December, representing only the second increase in six months. The reading at the end of the fourth quarter is still within a range signifying growth in the manufacturing sector, though at a lethargic pace. A reading above 50% indicates that the manufacturing economy is generally expanding; below 50% indicates that it is generally contracting. A PMI in excess of 42.5% over a period of time generally indicates an expansion of the overall economy. Therefore, the December PMI indicates expansion in the manufacturing sector for the 29th consecutive month, as well as growth in the overall economy for the 21st consecutive month. The average PMI reading for the last 12 months was 55.2%, with the high being 59.9% and the low being 51.4%. Services The ISM reported that their Non-Manufacturing Index (“NMI”) increased to 53.0% at the end of the fourth quarter from 52.6% at the end of the third. NMI measures the strength of the services sector. The December reading is below the 12-month average of 54.5%. Regardless, the September reading remains at a level signifying growth, albeit sluggish. A reading above 50% indicates the non-manufacturing sector economy is generally expanding, whereas a reading below 50% indicates the non-manufacturing sector is generally contracting. The reading in December indicates continued growth for the 25th consecutive month in the non-manufacturing sector.

Chapter 5. General Economic and Political Analysis BV201: Introduction to Business Valuation
BV201r v. 6.0 (11/15) Non-authoritative © 2015 American Society of Appraisers 14
Handout 5-2
Economic Impact on the Company

Chapter 6. Industry Analysis BV201: Introduction to Business Valuation
BV201r v. 6.0 (11/15) Non-authoritative © 2015 American Society of Appraisers 1
Chapter 6. Industry Analysis
I. Introduction to Industry Analysis
A. Every company operates within the context of an industry. Some industries are very clearly delineated, as in the case of fast food restaurants, while others are harder to define, such as testing laboratories. The key to the understanding the testing lab industry would really involve identification of the specific segments served by that industry. For example, major sub-areas would be medical diagnostic labs, concrete core sampling labs, metallurgical structural testing labs, software testing labs, etc. Each of the sub-industry segments is characterized by very different value drivers and influences.
1. Medical labs are driven by the physicians and hospitals.
2. Concrete testing labs are driven by the amount of construction activity.
3. Metallurgical structural testing would be driven by areas like nuclear power plant construction, aerospace activity and manufactured products that must endure high stress levels.
4. Software testing would really depend on the amount of new software being written and the quality of the software used for writing the software.
B. Understanding the industry and the macroeconomic and microeconomic factors that affect the industry, and therefore the company being analyzed, is extremely important to making value-based decisions or placing a value on a particular company within the context of that industry.
C. To effectively analyze an industry, it is recommended that the analyst use a structured analytical process to ensure no material factors affecting the subject company are overlooked or not understood in their proper context.
D. One structure for analyzing an industry was outlined by Michael Porter.
1. Porter’s five forces and strategy models are the classic models utilized to understand an industry and the forces that influence a company and its strategies.
2. Only by understanding these forces, including the company’s competitors, can the analyst properly determine the company’s risk from its competitors and within the industry.

Chapter 6. Industry Analysis BV201: Introduction to Business Valuation
BV201r v. 6.0 (11/15) Non-authoritative © 2015 American Society of Appraisers 2
II. Porter’s Five Forces and Generic Strategies
A. Introduction
B. Five forces analysis
1. Threat of new entrants
a. Market conditions affecting impact of the threat of new entrants:
(i) Economies of scale
(ii) Product differentiation
(iii)Capital requirements
(iv) Switching costs to buyers
(v) Access to distribution channels
(vi) Other cost advantages
(vii) Government policies
b. Barriers to entry are unique industry characteristics that define the industry. Barriers reduce the rate of entry of new firms, thus maintaining a level of profits for those already in the industry. From a strategic perspective, barriers can be created or exploited to enhance a firm’s competitive advantage. Barriers to entry arise from several sources:
Rivalry Among Existing FirmsRivalry Among Existing Firms
Threat of NewEntrants
Threat of NewEntrants
Bargaining Powerof Customers
Bargaining Powerof Customers
Threat of SubstituteProducts or ServicesThreat of SubstituteProducts or Services
Bargaining Powerof Suppliers
Bargaining Powerof Suppliers

Chapter 6. Industry Analysis BV201: Introduction to Business Valuation
BV201r v. 6.0 (11/15) Non-authoritative © 2015 American Society of Appraisers 3
(i) Government creates barriers. Although the principal role of the government in a market is to preserve competition through antitrust actions, government also restricts competition through the granting of monopolies and through regulation. Industries such as utilities are considered natural monopolies because it has been more efficient to have one electric company provide power to a locality than to permit many electric companies to compete in a local market. To restrain utilities from exploiting this advantage, government permits a monopoly, but regulates the industry. Illustrative of this kind of barrier to entry is the local cable company. The franchise to a cable provider may be granted by competitive bidding, but once the franchise is awarded by a community, a monopoly is created. Local governments were not effective in monitoring price gouging by cable operators, so the federal government has enacted legislation to review and restrict prices.
(ii) Patents and proprietary knowledge serve to restrict entry into an industry. Ideas and knowledge that provide competitive advantages are treated as private property when patented, preventing others from using the knowledge and thus creating a barrier to entry.
(iii)Asset specificity inhibits entry into an industry. Asset specificity is the extent to which the firm’s assets can be utilized to produce a different product. When an industry requires highly specialized technology or plant and equipment, potential entrants are reluctant to commit to acquiring specialized assets that cannot be sold or converted into other uses if the venture fails. Asset specificity provides a barrier to entry for two reasons: First, when firms already hold specialized assets they fiercely resist efforts by others to take their market share. Second, new entrants can anticipate aggressive rivalry.
(iv) Organizational economies of scale. The most cost-efficient level of production is the point at which unit costs for production are at minimum. If the level of efficiency for firms in an industry is known, then one can determine the amount of market share necessary for low-cost entry or cost parity with rivals. For example, in long- distance communications roughly 10% of the market is necessary to reach the most cost-efficient level of production. If sales for a long-distance operator fail to reach 10% of the market, the firm is not competitive.
c. Barriers to exit are functionally similar to barriers to entry. Exit barriers limit the ability of a firm to leave the market and can exacerbate rivalry; unable to leave the industry, a firm must compete. Some of an industry’s entry and exit barriers can be summarized as follows:

Chapter 6. Industry Analysis BV201: Introduction to Business Valuation
BV201r v. 6.0 (11/15) Non-authoritative © 2015 American Society of Appraisers 4
Easy to Enter if there is:
Common technology Little brand franchise Access to distribution channels Low scale threshold
Difficult to Enter if there is:
Patented or proprietary know-how Difficulty in brand switching Restricted distribution channels High scale threshold
Easy to Exit if there are:
Salable assets Low exit costs Independent businesses
Difficult to Exit if there are:
Specialized assets High exit costs Interrelated businesses
2. Threat of substitute products or services
a. In Porter’s model, substitute products refer to products in other industries. To the economist, a threat of substitutes exists when a product’s demand is affected by the price change of a substitute product. A product’s price elasticity is affected by substitute products. As more substitutes become available, the demand becomes more elastic since customers have more alternatives. A close substitute product constrains the ability of firms in an industry to raise prices.
b. Market conditions affecting impact of substitutes:
(i) Relative price of substitutes
(ii) Relative quality of substitutes
(iii)Switching costs to customers
3. Bargaining power of buyers (customers)
a. Market conditions affecting impact of buyer bargaining power:
(i) Number of buyers relative to suppliers
(ii) Product differentiation
(iii)Switching costs to use other product
(iv) Customer’s profit margins
(v) Customer’s use of multiple sources
(vi) Customer’s threat of backward integration

Chapter 6. Industry Analysis BV201: Introduction to Business Valuation
BV201r v. 6.0 (11/15) Non-authoritative © 2015 American Society of Appraisers 5
(vii) Customer’s threat of forward integration
(viii) Importance of product to customer
(ix) Customer’s volume
b. Customers are powerful if:
(i) Customers are concentrated—there are a few customers with significant market share. (Example: DOD purchases from defense contractors)
(ii) Customers purchase a significant proportion of output—distribution of purchases or if the product is standardized. (Example: Circuit City and Sears’ large retail market provides power over appliance manufacturers.)
(iii)Customers possess a credible backward integration threat— can threaten to buy producing firm or rival. (Example: Large auto manufacturers’ purchases of tires.)
c. Customers are weak if:
(i) Suppliers threaten forward integration—a supplier can take over / own distribution or retailing channels. (Example: Movie-producing companies have integrated forward to acquire theaters.)
(ii) Significant customer switching costs—products not standardized and customer cannot easily switch to another product. (Example: IBM’s 360 system strategy in the 1960s.)
(iii)Customers are fragmented (many, different)—no customer has any particular influence on product or price. (Example: Most consumer products.)
(iv) Suppliers supply critical portions of customers’ input—distribution of purchases. (Example: Intel’s relationship with PC manufacturers.)
4. Bargaining power of suppliers
a. Market conditions affecting impact of supplier bargaining power:
(i) Supplier integration
(ii) Availability of substitute products
(iii)Importance of supplier’s input to buyer
(iv) Supplier’s product differentiation
(v) Importance of industry to suppliers
(vi) Customer’s switching costs to other input
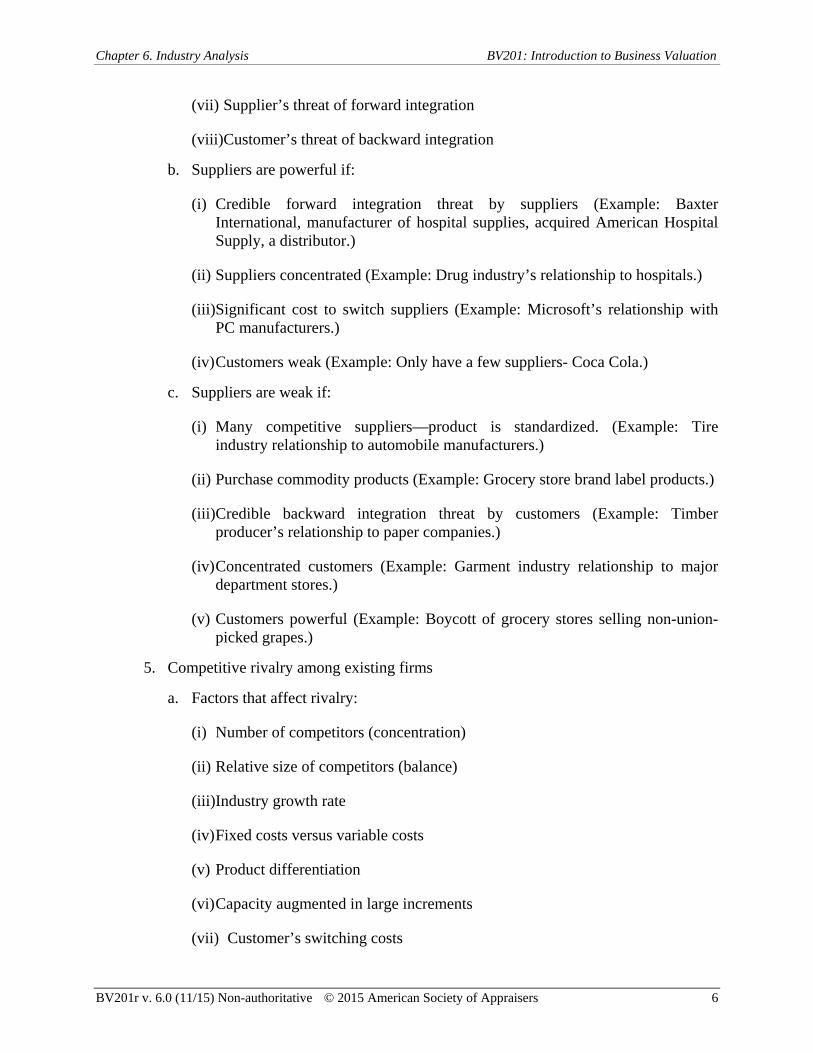
Chapter 6. Industry Analysis BV201: Introduction to Business Valuation
BV201r v. 6.0 (11/15) Non-authoritative © 2015 American Society of Appraisers 6
(vii) Supplier’s threat of forward integration
(viii)Customer’s threat of backward integration
b. Suppliers are powerful if:
(i) Credible forward integration threat by suppliers (Example: Baxter International, manufacturer of hospital supplies, acquired American Hospital Supply, a distributor.)
(ii) Suppliers concentrated (Example: Drug industry’s relationship to hospitals.)
(iii)Significant cost to switch suppliers (Example: Microsoft’s relationship with PC manufacturers.)
(iv) Customers weak (Example: Only have a few suppliers- Coca Cola.)
c. Suppliers are weak if:
(i) Many competitive suppliers—product is standardized. (Example: Tire industry relationship to automobile manufacturers.)
(ii) Purchase commodity products (Example: Grocery store brand label products.)
(iii)Credible backward integration threat by customers (Example: Timber producer’s relationship to paper companies.)
(iv) Concentrated customers (Example: Garment industry relationship to major department stores.)
(v) Customers powerful (Example: Boycott of grocery stores selling non-union-picked grapes.)
5. Competitive rivalry among existing firms
a. Factors that affect rivalry:
(i) Number of competitors (concentration)
(ii) Relative size of competitors (balance)
(iii)Industry growth rate
(iv) Fixed costs versus variable costs
(v) Product differentiation
(vi) Capacity augmented in large increments
(vii) Customer’s switching costs

Chapter 6. Industry Analysis BV201: Introduction to Business Valuation
BV201r v. 6.0 (11/15) Non-authoritative © 2015 American Society of Appraisers 7
(viii) Diversity of competitors
(ix) Exit barriers
(x) Strategic stakes
b. Competitive responses to rivalry:
(i) Changing prices—raising or lowering prices to gain a temporary advantage
(ii) Improving product differentiation—improving features, implementing innovations in the manufacturing process and in the product itself
(iii)Creatively using channels of distribution—using vertical integration or using a distribution channel that is novel to the industry (For example, with high-end jewelry stores reluctant to carry its watches, Timex moved into drugstores and other nontraditional outlets and cornered the low- to mid-price watch market.)
(iv) Exploiting relationships with suppliers (For example, from the 1950s to the 1970s, Sears, Roebuck and Co. dominated the retail household appliance market. Sears set high quality standards and required suppliers to meet its demands for product specifications and price.)
c. The intensity of rivalry is influenced by the following industry characteristics:
(i) A large number of firms increase rivalry because more firms must compete for the same customers and resources. The rivalry intensifies if the firms have similar market share, leading to a struggle for market leadership.
(ii) Slow market growth causes firms to fight for market share. In a growing market, firms are able to improve revenues simply because of the expanding market. In the latter case, a smaller piece of a larger pie has more calories, if the pie grows faster than the proportion of the piece.
(iii)High fixed costs result in an economy of scale effect that increases rivalry. When total costs are mostly fixed costs, the firm must produce near capacity to attain the lowest unit costs. Since the firm must sell this large quantity of product, high levels of production lead to a fight for market share, resulting in increased rivalry.
(iv) High storage costs or highly perishable products cause a producer to sell goods as soon as possible. If other producers are attempting to unload at the same time, competition for customers intensifies.
(v) Low switching costs increase rivalry. When a customer can freely switch from one product to another, there is a greater struggle to capture customers.
(vi) Low levels of product differentiation are associated with higher levels of rivalry. Brand identification, on the other hand, tends to constrain rivalry.

Chapter 6. Industry Analysis BV201: Introduction to Business Valuation
BV201r v. 6.0 (11/15) Non-authoritative © 2015 American Society of Appraisers 8
(vii) Strategic stakes are high when a firm is losing market position or has potential for great gains. This intensifies rivalry.
(viii)High exit barriers place a high cost on abandoning the product. The firm must compete. High exit barriers cause a firm to remain in an industry, even when the venture is not profitable. A common exit barrier is asset specificity. When the plant and equipment required for manufacturing a product are highly specialized, these assets cannot easily be sold to other buyers in another industry.
(ix) A diversity of rivals with different cultures, histories and philosophies makes an industry unstable. There is greater possibility for mavericks and for misjudging rivals’ moves. Rivalry is volatile and can be intense. The hospital industry, for example, is populated by hospitals that historically are community or charitable institutions, by hospitals that are associated with religious organizations or universities, and by hospitals that are for-profit enterprises. This mix of philosophies about mission has lead occasionally to fierce local struggles by hospitals over who will get expensive diagnostic and therapeutic services. At other times, local hospitals are highly cooperative with one another on issues such as community disaster planning.
(x) Industry shakeout. A growing market and the potential for high profits induce new firms to enter a market and incumbent firms to increase production. A point is reached where the industry becomes crowded with competitors, and demand cannot support the new entrants and the resulting increased supply. The industry may become crowded if its growth rate slows and the market becomes saturated, creating a situation of excess capacity with too many goods chasing too few buyers. A shakeout ensues, with intense competition, price wars, and company failures. Additionally, market stability and changes in supply and demand affect rivalry. Cyclical demand tends to create cut-throat competition.
C. Generic Strategies for effectively competing in light of the five forces
1. Overall cost leadership
a. Overall cost leadership as a strategy requires that management pursue a course of action that:
(i) Aggressively constructs facilities that are of a scale to have maximum efficiency
(ii) Focuses on cost reductions gained through experience
(iii)Includes tight control on costs and overhead
(iv) Eliminates marginal customer accounts
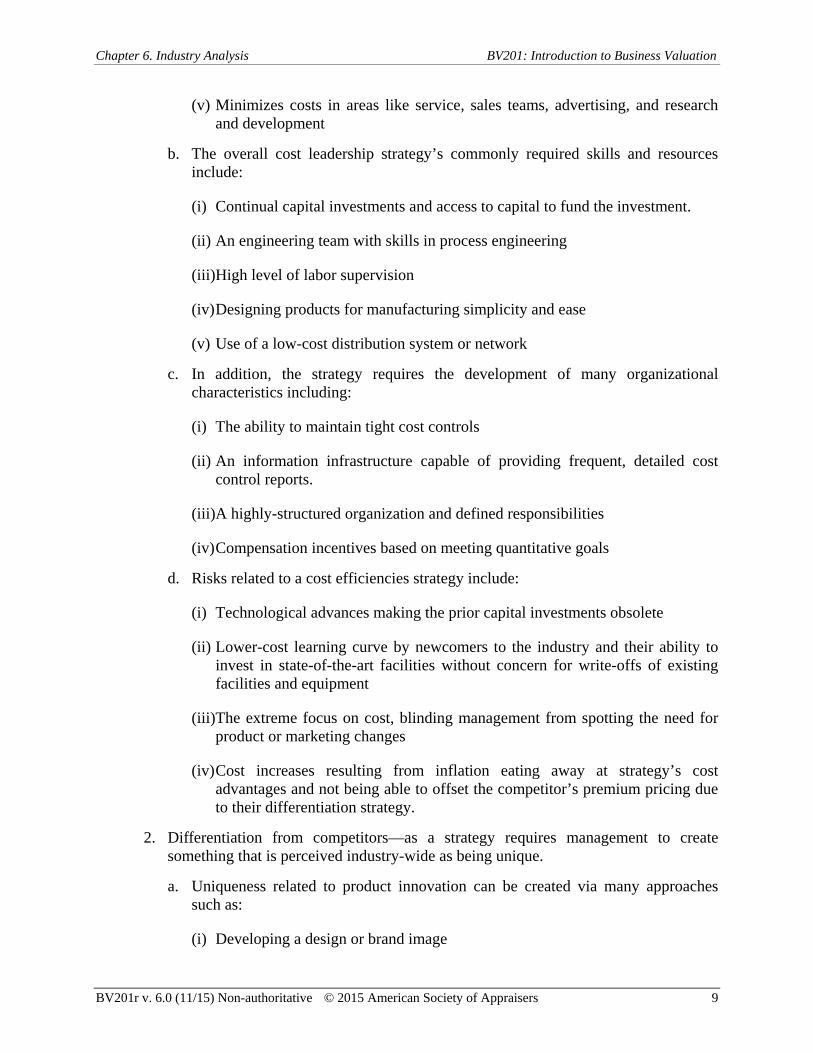
Chapter 6. Industry Analysis BV201: Introduction to Business Valuation
BV201r v. 6.0 (11/15) Non-authoritative © 2015 American Society of Appraisers 9
(v) Minimizes costs in areas like service, sales teams, advertising, and research and development
b. The overall cost leadership strategy’s commonly required skills and resources include:
(i) Continual capital investments and access to capital to fund the investment.
(ii) An engineering team with skills in process engineering
(iii)High level of labor supervision
(iv) Designing products for manufacturing simplicity and ease
(v) Use of a low-cost distribution system or network
c. In addition, the strategy requires the development of many organizational characteristics including:
(i) The ability to maintain tight cost controls
(ii) An information infrastructure capable of providing frequent, detailed cost control reports.
(iii)A highly-structured organization and defined responsibilities
(iv) Compensation incentives based on meeting quantitative goals
d. Risks related to a cost efficiencies strategy include:
(i) Technological advances making the prior capital investments obsolete
(ii) Lower-cost learning curve by newcomers to the industry and their ability to invest in state-of-the-art facilities without concern for write-offs of existing facilities and equipment
(iii)The extreme focus on cost, blinding management from spotting the need for product or marketing changes
(iv) Cost increases resulting from inflation eating away at strategy’s cost advantages and not being able to offset the competitor’s premium pricing due to their differentiation strategy.
2. Differentiation from competitors—as a strategy requires management to create something that is perceived industry-wide as being unique.
a. Uniqueness related to product innovation can be created via many approaches such as:
(i) Developing a design or brand image

Chapter 6. Industry Analysis BV201: Introduction to Business Valuation
BV201r v. 6.0 (11/15) Non-authoritative © 2015 American Society of Appraisers 10
(ii) Technology leadership
(iii)Product features provided
(iv) Level of or type of customer service provided
(v) A strong dealer network
b. Highly successful product innovators generally differentiate themselves by using more than one approach. The differentiation strategy’s commonly required skills and resources include:
(i) Possessing high-quality marketing skills
(ii) Strong product-engineering capabilities
(iii)A creative flair
(iv) A highly competent basic research team
(v) A reputation for technological or quality leadership
(vi) Known tradition in the industry or a unique combination of skills drawn from related industries
(vii) A high level of cooperation from the channel of distribution
c. In addition, the differentiation strategy requires the development of many organizational characteristics including:
(i) Incentives based on subjective measures instead of definitive quantitative goals
(ii) A high level of cooperation and coordination among the research and development, product development and marketing departments
(iii)Facilities and amenities capable of attracting scientists, engineers, creative individuals, or a highly skilled labor force
d. The risks associated with the strategy of differentiation include:
(i) The cost differential between the low-cost providers and the differentiated innovators becomes greater than the firm’s ability to maintain its brand loyalty. Customers, at some point, are willing to sacrifice image, features or service to benefit from large cost savings.
(ii) Customers’ needs change, and they are no longer attracted to the company because of its differentiating characteristics.

Chapter 6. Industry Analysis BV201: Introduction to Business Valuation
BV201r v. 6.0 (11/15) Non-authoritative © 2015 American Society of Appraisers 11
(iii)Imitation by competitors narrows or eliminates the perceived differentiation. This is especially true as industries mature and can be seen today in several industries, such as the software industry, furniture industry, automobile industry, and so forth.
3. Focus on a particular customer group, segment of the product line or geographic area as a strategy, is based on being able to serve its highly focused target group more effectively or efficiently than its competitors. The competitors are assumed to be marketing to a more diverse market, geographic market, or with a broader product line.
a. A focus strategy will require a combination of the same skills, resources and organizational characteristics that are required for the product innovation strategy. Each of these strategies often needs very different styles of leadership and usually evolves into its own unique corporate culture. In addition, each of these strategies requires the use of different performance measures. Being a cost-efficient provider would necessitate a focus on performance measures related to manufacturing, while a strategy based on product innovation would focus on performance measures related to customer satisfaction and perceptions.
b. The strategy, based on a focus on a particular customer group, segment of the product line, or geographic area, has the following risks:
(i) The cost advantages of serving an extremely focused target market become less than the cost savings of the low-cost provider serving a broad market.
(ii) The differences in the products or services desired by the target market and those desired by the marketplace as a whole narrow or are eliminated.
(iii)Competitors identify a submarket within the company’s target market and effectively out-focus the company.
D. Correlation of the five forces and the generic strategies: The generic strategies each have attributes that can serve to defend against competitive forces. The following table compares some characteristics of the generic strategies in the context of Porter’s five forces.
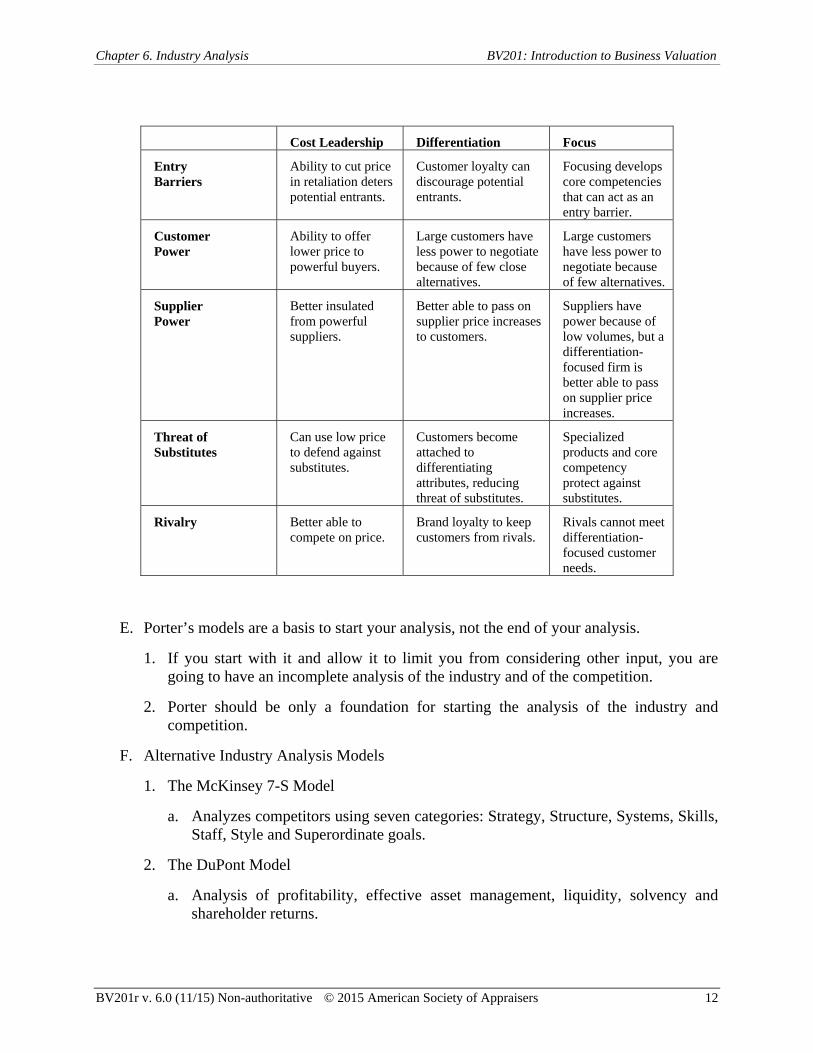
Chapter 6. Industry Analysis BV201: Introduction to Business Valuation
BV201r v. 6.0 (11/15) Non-authoritative © 2015 American Society of Appraisers 12
Cost Leadership Differentiation Focus
Entry Barriers
Ability to cut price in retaliation deters potential entrants.
Customer loyalty can discourage potential entrants.
Focusing develops core competencies that can act as an entry barrier.
Customer Power
Ability to offer lower price to powerful buyers.
Large customers have less power to negotiate because of few close alternatives.
Large customers have less power to negotiate because of few alternatives.
Supplier Power
Better insulated from powerful suppliers.
Better able to pass on supplier price increases to customers.
Suppliers have power because of low volumes, but a differentiation-focused firm is better able to pass on supplier price increases.
Threat of Substitutes
Can use low price to defend against substitutes.
Customers become attached to differentiating attributes, reducing threat of substitutes.
Specialized products and core competency protect against substitutes.
Rivalry Better able to compete on price.
Brand loyalty to keep customers from rivals.
Rivals cannot meet differentiation-focused customer needs.
E. Porter’s models are a basis to start your analysis, not the end of your analysis.
1. If you start with it and allow it to limit you from considering other input, you are going to have an incomplete analysis of the industry and of the competition.
2. Porter should be only a foundation for starting the analysis of the industry and competition.
F. Alternative Industry Analysis Models
1. The McKinsey 7-S Model
a. Analyzes competitors using seven categories: Strategy, Structure, Systems, Skills, Staff, Style and Superordinate goals.
2. The DuPont Model
a. Analysis of profitability, effective asset management, liquidity, solvency and shareholder returns.

Chapter 6. Industry Analysis BV201: Introduction to Business Valuation
BV201r v. 6.0 (11/15) Non-authoritative © 2015 American Society of Appraisers 13
b. Highlights the important interplay between effective asset management and firm profitability, which also assists the analyst as an additional tool in risk assessment.1
G. Sample Industry Analysis – see Exhibit 6-1.
1 Hitchner, James. Financial Valuation Applications and Models, 3rd Ed. John Wiley & Sons, Inc., Hoboken, New Jersey, 2011.

Chapter 6. Industry Analysis BV201: Introduction to Business Valuation
BV201r v. 6.0 (11/15) Non-authoritative © 2015 American Society of Appraisers 14
Classroom Assignment 7: Review Exhibit 6-1 and write a brief summary as to how the industry potentially impacts GDT and specifically the valuation of the Company. Also, consider the impact of Porter’s Five Forces on GDT and be prepared to discuss.
(15 minutes)

Chapter 6. Industry Analysis BV201: Introduction to Business Valuation
BV201r v. 6.0 (11/15) Non-authoritative © 2015 American Society of Appraisers 15
Exhibit 6-1
Industry Analysis
Chapter 6. Industry Analysis BV201: Introduction to Business Valuation
BV201r v. 6.0 (11/15) Non-authoritative © 2015 American Society of Appraisers 16
Industry Overview2 The U.S. general freight trucking industry includes about 65,000 establishments (single-location companies and units of multi-location companies) with combined annual revenue of $125 billion. Major companies include Con-way, JB Hunt, Schneider National, Swift Transportation, and YRC Worldwide. The U.S. industry is fragmented: the 50 largest companies account for 40% of revenue. Major trucking companies based outside the U.S. include Norbert Dentressangle (France), Hitachi Transport System and Seino Transportation (Japan), TransForce (Canada), and Stobart Group (UK). The industry is comprised of carriers that transport commodities for shippers using a commercial motor vehicle (CMV). General freight companies, including for-hire carriers and independent owner-operators, transport a wide variety of commodities using containers or van trailers. The industry does not include companies primarily engaged in flatbed, tanker, or refrigerated trailer transport. Express delivery services and moving and storage companies are covered in separate profiles. Competitive Landscape Demand is driven by consumer spending and manufacturing output. The profitability of individual companies depends on efficient operations. Large companies have advantages in account relationships, bulk fuel purchasing, fleet size, and access to drivers. Small operations can compete effectively by providing quick turnaround, serving a local market, or transporting unusually sized goods. The industry is labor-intensive: average annual revenue per employee is $145,000. In addition to domestic consumption and production, U.S. truck transportation depends heavily on free trade through NAFTA. Trade with Canada and Mexico represents about one-third of all U.S. trade. The top gateway for truck transport between the U.S. and Canada is Detroit; the top gateway for U.S.-Mexico truck transport is Laredo, Texas. Cross-border congestion is a problem for trucking companies specializing in NAFTA-related trade. Movement to or from Canada and Mexico can often be hampered by long lines and lengthy inspection processes. Trucking competes with other forms of cargo transportation, including rail, air, and water. However, the shift toward intermodal transportation means that these modes of delivery are often more complementary than competitive. Products, Operations and Technology
2 First Research: General Freight Trucking, December 2011.
Chapter 6. Industry Analysis BV201: Introduction to Business Valuation
BV201r v. 6.0 (11/15) Non-authoritative © 2015 American Society of Appraisers 17
General trucking services include long-distance (85% of industry revenue) and local (15%) trucking. These classifications can be subdivided into truckload (TL) and less-than-truckload (LTL) services. LTL shipments have trailers dedicated to a single shipper's cargo. A trucking customer typically loads a trailer full (or nearly full); the trucker then transports the container, and a receiver unloads the contents. Shipments are usually delivered within one or two days, depending on the distance. LTL shipments are a smaller but growing part of the market. LTL carriers transport the consolidated cargo of several shippers on one truck, dropping goods off at multiple delivery points. Long-distance LTL truckers typically operate a network of terminals connected by long-distance routes. Because most shipments involve transfers at terminals, delivery times for LTL shipments are generally longer than for TL shipments. To lower delivery costs, LTL trucking companies often work with logistics companies to arrange, consolidate, time, and monitor shipments. Local trucking services, whether TL or LTL, are typically offered within a metropolitan area and involve one-day trips. Major inputs and expenses include drivers, diesel fuel, and repairs. Trucking companies often impose fuel surcharges to offset rising fuel prices. Large companies generally perform their own truck maintenance; small ones may outsource this function. Technological advances include on-truck communications between driver and dispatcher; improved entertainment offerings for drivers (satellite TV and radio); and sophisticated GPS scheduling systems that track and direct truck fleets and individual truck operations. On-board advancements include computer systems that monitor speed, maximize fuel consumption, and determine maintenance schedules. These technical advancements have increased productivity, with fewer empty miles and less waiting time between loads. Sales and Marketing A carrier's major customer is a shipper: a company seeking to have its goods transported by truck. A key link between carrier and shipper are third-party intermediaries like freight forwarders, freight brokers, and logistics providers. Freight brokers connect shippers and carriers without handling any goods. A freight forwarder typically takes possession of the goods, consolidates smaller shipments into one large shipment, and arranges transportation of the large shipment. Logistics providers manage the flow of goods to ensure sufficient warehousing and efficient distribution of goods. Major types of marketing include face-to-face visits with potential customers, referrals, and Internet advertising. Truckers pursue long-term relationships with large customers through "dedicated" contracts. Internet sales are increasingly standard in the trucking industry. Large carriers maintain sophisticated software that allow shippers to request a quote online, fill out a bill of lading, and track cargo. Smaller carriers are typically limited to promoting services online.

Chapter 6. Industry Analysis BV201: Introduction to Business Valuation
BV201r v. 6.0 (11/15) Non-authoritative © 2015 American Society of Appraisers 18
Prices depend on the type of good shipped, the route taken, and the total distance traveled. Freight rates are different for truck load (TL) and less-than-truckload (LTL) shipments: TL shipments are quoted in dollar per mile, while LTL freight rates are calculated based on weight, distance, and type of freight. Pricing is relatively stable in the long-distance LTL segment of the market. Because barriers to entry are lower for local trucking services, prices tend to be more volatile in local markets. Finance and Regulation Cash flow is somewhat seasonal as many shipments are made prior to the winter holiday selling season. Receivables are typically 15 to 30 days sales. Net margins are low, typically around 2%. Bankruptcies are common in the trucking industry, and are closely correlated to the cost of diesel fuel. While fuel surcharges can help mitigate the impact of increasing fuel cost, rapid price increases can create critical cash flow problems, particularly for smaller companies. Most industry regulation, and trucking safety in particular, is managed by the Federal Motor Carrier Safety Administration (FMCSA), a division of the U.S. DOT. Truck operators must have a commercial driver's license (CDL), which requires training and education on the proper handling of commercial vehicles. Drivers must also adhere to the FMCSA's hours-of-service (HOS) regulations by recording the number of hours spent driving, on-duty but not driving, and in the truck's sleeper compartment. Daily HOS logs can be completed by paper or electronically through an electronic on-board recorder (EOBR). HOS records are provided to the driver's employer and furnished to the DOT upon request or during inspections. Other federal regulatory bodies with rules affecting the trucking industry include the Pipeline and Hazardous Materials Safety Agency (PHMSA) and the Surface Transportation Board (STB). The PHMSA oversees transportation of hazardous materials, and the STB is charged with resolving rate disputes. The trucking industry must also adhere to cargo and transportation security guidelines administered by the U.S. Department of Homeland Security. To reduce airborne pollutants, the EPA has implemented revised emission standards for diesel trucks. The EPA also inspects fuel depots and maintenance centers owned by carriers, checking for potential ground contamination or illegal disposal of toxic wastes. International Insights Major trucking companies based outside the U.S. include Norbert Dentressangle (France), Hitachi Transport System and Seino Transportation (Japan), TransForce (Canada), and Stobart Group (UK). Continuation of a worldwide economic recovery should support growth in the global trucking industry over the next several years, with rapid economic expansion in China, India, and other emerging Asian economies leading the way. Demand for trucking services is driven by consumer spending and industrial output, making large, wealthy nations such as the U.S., Japan, and Germany top markets for trucking. Traditionally, trucking companies have focused on providing service in contiguous areas.

Chapter 6. Industry Analysis BV201: Introduction to Business Valuation
BV201r v. 6.0 (11/15) Non-authoritative © 2015 American Society of Appraisers 19
However, growth in emerging markets has prompted some companies to expand overseas. Such growth is typically achieved through the acquisition of established local trucking networks in the target country. China, in particular, has attracted investments from large trucking service providers based in North America and Europe. Overseas expansion is being fueled, in part, by a trend in the shipping and logistics sector toward offering end-to-end service. By establishing operations at the source of imported goods, rather than relying on local providers at points of origin, transportation companies can better control their networks and delivery times. However, providing transportation services in less developed regions can pose significant challenges. The trucking industry in China, for example, is highly fragmented, lightly regulated, and reported to be rife with corruption. Companies expanding into less developed countries may also encounter poorly developed transportation infrastructure. Trucking companies moving into more developed nations may be challenged with meeting stringent safety and emission standards. Human Resources Trucking is a semiskilled occupation that requires some initial training and continued education. Deregulation has allowed easy entry into the industry by companies using nonunion, lower-paid drivers. Wages for the industry are about the same as the U.S. average. Many drivers belong to the Teamsters union, which negotiates a National Master Freight Agreement that sets wages and work rules for many unionized truckers. Companies hire their own drivers but also contract with independent owner-operators who drive their own tractors, typically pay all their own expenses, and are often paid on a rate-per-mile basis. The annual injury rate in the trucking industry is moderately higher than the national average. Quarterly Industry Update U.S.-Canada Truck Trade Increasing - Increasing surface trade between the U.S. and Canada is driving improvements and expansion in cross-border trucking service. Trade between the two countries by truck increased 12% by value in July 2011 compared to the same month a year ago, while trade by all surface transportation modes increased 17%. Less-than truckload carriers and intermodal transport providers have responded by working to cut transit times and build cross-border market share. U.S.-based Schneider has improved its customs processing and shipment prioritization with a new intermodal service, and several Canadian carriers are expanding into U.S. states, according to The Journal of Commerce. Michigan, Illinois, and New York are the leading traders with Canada by surface transportation, which includes goods moved by truck, rail, and pipeline. Trucking Schedule Changes Stir Debate - Several Republican leaders in the U.S. House have asked the Obama administration to nix new trucking regulations that they claim would raise costs for trucking companies. The rules would cut the number of hours truckers can spend on the road from 11 to 10 and tighten rules governing the 34-hour rest period that truckers are required to

Chapter 6. Industry Analysis BV201: Introduction to Business Valuation
BV201r v. 6.0 (11/15) Non-authoritative © 2015 American Society of Appraisers 20
take each week, according to The Washington Times. The proposed changes by the Federal Motor Carrier Safety Administration (FMCSA) were designed to reduce truck accidents by addressing driver fatigue, but trucking companies fear the changes will require them to put more trucks on the road. Some have argued that the new guidelines, which have the support of major unions, might even increase accidents if they force freight companies to hire more rookie drivers. The fight over trucking rules is one of many going in Washington between the GOP and the administration about whether more regulations on business are necessary or a detriment to economic growth. Industry Indicators The average U.S. retail price for diesel and regular gas, a major operating cost for trucking fleets, rose 13.1% and 9.3% respectively in the week ending January 16, 2012, compared to the same week in 2011. Total U.S. manufacturers' shipments, an indicator of the volume of goods shipped by truck, rose 11.5% in the first eleven months of 2011 compared to the same period in 2010. Total U.S. revenue for general freight trucking increased 8.4% in the third quarter of 2011 compared to the same period in 2010. Critical Issues Demand Tied to Economic Cycles - Profitability in the trucking industry is closely tied to the overall health of the national economy, which varies from year to year. Drops in construction spending, consumer confidence, and industrial production can negatively impact trucking profits. During the late-2000s recession, U.S. production of durable consumer goods, a leading indicator of trucking demand, dropped more than 15%. Vulnerable to Fuel Prices - Fuel costs rival labor as the trucking industry's highest operating cost. Diesel fuel can account for 20% of revenues or more. Some companies buy fuel in bulk or hedge on fuel prices. Trucking companies also charge shippers fuel surcharges. Other Business Challenges Customer Concentration - Many trucking firms receive a large portion of business from just a few big customers or customers all in the same industry. This concentration leaves trucking companies exposed to special credit or economic forces. The trend to more corporate outsourcing of trucking has intensified this, as some truckers now are virtual subsidiaries of large customers. Cross-Border Delays - Congestion at the Mexico and Canadian borders can delay international trade, complicate trucking logistics, and increase fuel and labor costs. Border congestion is rising in Mexico, and several U.S. legislative moves to increase the ease of border crossings have been delayed due to concerns over truck safety and national security.

Chapter 6. Industry Analysis BV201: Introduction to Business Valuation
BV201r v. 6.0 (11/15) Non-authoritative © 2015 American Society of Appraisers 21
Freight Theft - Every year transportation providers have billions of dollars worth of goods stolen. Truckload carriers are particularly vulnerable because their cargo can be easily identified and targeted. In addition to utilizing sophisticated technology to stop theft, experts believe cooperation between shippers and carriers can be an important aspect of crime prevention. Alternative Fuels - Increased attention to environmental concerns has led to the creation of government mandates requiring truckers to use alternative fuels. The transition to alternative fuels presents a challenge to the trucking industry, as the cost and efficiency of biodiesel has yet to match that of regular diesel fuel. Efforts by the U.S. government to make biodiesel a more viable option, including tax credits, may not fully offset higher biodiesel costs. Business Trends Decline in Small Carriers, Owner-Operators - Rising fuel costs have led to a decline in small and midsized trucking companies. Unable to negotiate bulk fuel rates, smaller carriers are more vulnerable to price hikes. Owner-operators also have less leverage when collecting fuel surcharges, and some brokers fail to pass what surcharges are collected on to drivers. Air Cargo Declining - Rising costs have caused many U.S. shippers to migrate from air shipping to other modes of transportation. Fewer flights and the high fuel costs associated with air transport have made ship and truck transport more competitive options. Joint ventures between ship and truck carriers have been successful in improving shipment reliability and shortening delivery times. Fees Increase Slightly - The general freight trucking industry has increased shipping fees around 10% over the past five years. Fee increases have been modest considering the price of diesel has fluctuated greatly during the same period. Most carriers add fuel surcharges to help offset the fuel price hikes. Industry Opportunities Conserving Fuel - Carriers and owner-operators can maximize profits by managing fuel consumption. New power management technologies allow a driver's bunk to be warmed or cooled without idling the engine. New aerodynamic fairings, advanced tire technology, and GPS routing can all help truckers reduce fuel costs. Longer Combination Vehicles (LCVs) - Carriers can increase efficiency and save on labor costs by using longer trucks. Federal regulations limit the size of combination vehicles - trucks with two or three trailers - and states limit their use to certain routes. Some states, including California, don't allow LCVs. Special driver education is required, but efficiency can be improved up to 100%. The ATA is lobbying Congress to allow greater use of LCVs, arguing that greater trucking efficiencies lead to lower fuel expenditures and less greenhouse gases. Increased Productivity Through Information Technology - Large carriers are among the most sophisticated users of transportation technology. Many in-cab systems include basic management and dispatching software. New systems incorporate bar code readers, signature capture, and

Chapter 6. Industry Analysis BV201: Introduction to Business Valuation
BV201r v. 6.0 (11/15) Non-authoritative © 2015 American Society of Appraisers 22
radio frequency identification (RFID) tagging, allowing drivers to quickly manage the transfer of goods. Experience with computer systems has led some truckers to expand into courier and logistics services for large shippers. Tablet Computers - Prompted in part by the growing popularity of tablet computers among U.S. consumers, technology firms serving the transportation industry have developed ruggedized tablets for trucking companies. Onboard computers have long been used to help manage fleets and facilitate communications with drivers and dispatchers, but the portability of tablet computers makes them useful for a wide range of applications, from capturing customer signatures to photographing damaged shipments. Federal regulations limiting the use of cell phones on commercial trucks should fuel adoption of tablets and other mobile computing devices, the use of which can be restricted to periods when trucks are idle. Key External Drivers3 Demand from manufacturing – The manufacturing sector is a significant user of industry services. Trucking serves as a gauge of the US economy, because it represents nearly 70.0% of tonnage carried by all modes of domestic freight transportation, including manufactured and retail goods. This driver is expected to increase during 2012 and is a potential opportunity for the industry. Demand from wholesale trade – The wholesale trade segment is another significant user of long-distance freight trucking. When demand for wholesale trade goes up, businesses require more of this industry’s services. This driver is expected to increase during 2012. World price of crude oil – Fuel is the industry’s second largest expense after wages. Industry operators often implement surcharges to mitigate fluctuations in the price of fuel. Crude oil is the largest component of the cost of diesel fuel in the United States. While demand may decline due to rising prices, industry revenue increases when operators charge additional fuel surcharges. This driver is expected to increase during 2012. Pervasive outsourcing of transport functions – Subcontracting transportation and other logistics services has increased in recent years. As supply chains become broader and more complex, the growing need for businesses to diversify and delegate has validated the role of third-party logisticians in every related aspect. An increase in the number of companies that outsource transportation functions increases industry revenue. This driver is expected to remain constant during 2012. External competition – Long-distance trucking is sensitive to changes in demand for competing industries, such as the Rail Transportation industry (IBISWorld report 48211). As fuel prices
3 IBISWorld IndustryReport 48412: Long-Distance Freight Trucking in the U.S., November 2011

Chapter 6. Industry Analysis BV201: Introduction to Business Valuation
BV201r v. 6.0 (11/15) Non-authoritative © 2015 American Society of Appraisers 23
rise, clients tend to seek more fuel-efficient methods of transportation like rail. This driver is expected to increase during 2012 and poses a potential threat to the industry. Demand Determinants Demand for trucking companies is largely determined by movements in industrial production, retail and wholesale sales, personal consumption and construction activity. To a lesser extent, the volume of imports and exports also impacts the demand for long-distance trucking. Following the recession, the demand for long-distance trucking plummeted. Consumers started to spend less on goods, so retailers and wholesalers moved a reduced amount of freight. Lower consumer spending also adversely affected the construction and manufacturing sectors of the economy, reducing the demand for raw material transportation. Domestic production is more important to trucking activity than the transportation of imported goods. A product produced entirely in the United States has several more freight movements during the production process than an import. For example, a domestic manufacturer will have raw materials trucked to them before shipping to a distribution center, which will then forward the package to a retailer or consumer. Imported goods eliminate the first step of this process. Certain manufacturers have switched to just-in-time inventory management, which has increased the activity of the road freight industry since consignments are getting smaller but more frequent. This has led many trucking operators and manufacturers to form close relationships that have developed into long-term contracts. Apart from government policies affecting trade barriers, the major determinant of manufacturing demand is private consumption expenditure and gross equipment expenditure. The key determinants of wholesale and retail demand are household disposable income, interest rates and prices. Similarly, the major determinants of the construction sector are shifts in disposable income; interest rates and government policies (such as tax treatment); prices; occupancy rates; and rates of return from other investment forms. Consequently, all of these factors affect demand for the Long-Distance Freight Trucking industry. In the five years to 2011, an increasing concern has been the cost advantage posed by alternative forms of ground transportation. For example, the Rail Transportation industry (IBISWorld report 48211) is not as affected by the cost of fuels because of trains’ fuel efficiency. Trucking companies, on the other hand, must offset these costs by increasing prices to a higher degree. Nevertheless, demand for trucking will not become obsolete because of its key advantage over trains: trucks can ship door-to-door. Major Markets In the five years to 2011, the industry has experienced a drop in demand across most of its markets. The decline is a result of a variety of factors, including the recession and shifts in manufacturing. Rising fuel prices have also increased competition with the Rail Transportation industry (IBISWorld report 48211). As industry operators passed higher fuel costs on to

Chapter 6. Industry Analysis BV201: Introduction to Business Valuation
BV201r v. 6.0 (11/15) Non-authoritative © 2015 American Society of Appraisers 24
customers, some of the industry’s key markets decreased use of trucks in favor of more cost-effective alternatives. Manufacturing sector – Manufacturing companies make up the largest market for the industry, representing 38.2% of industry activity. However, as more manufacturing is being outsourced overseas, the manufacturing sector has declined as a proportion of revenue since the early 2000s. The industrial production index, a proxy for manufacturing activity, grew at an average annualized rate of 0.7% in the five years to 2005. In 2008 and 2009, the index declined 3.7% and 11.1%, respectively, causing the manufacturing industry’s contribution to industry revenue to continue falling. The long-term implication for industry operators is that falling freight volumes will lead to over-capacity, which will ultimately force many firms to reduce prices. In 2011, the industry is expected to benefit from a 2.6% increase in industrial production. Retail and wholesale trade – The retail and wholesale trade sectors have been a strong source of demand over the past five years. However, this market’s proportion of industry revenue is largely tied to economic growth, including growth in the labor market and changes in disposable income. When the economy is performing well, people spend more on consumer goods and therefore, demand for transportation services increases. However, in 2008 and 2009, tough economic conditions caused consumers to spend less money, so fewer goods needed to be transported. In the next five years, IBISWorld estimates that revenue from the retail and wholesale trade markets will increase as the economy recovers and consumers spend more. Despite this factor, strong growth will be hampered by competition from rail transportation. Commodity providers – The trucking industry transports a range of commodities, including agricultural goods, gasoline and chemicals. Some operators also transport non-commodity related chemicals, such as hazardous waste. Goods that are more export-focused, including agricultural goods, grains and petroleum products, declined through 2008. Demand for the transportation of these goods continued to decline in 2009 as major economies around the world entered recession. However, the transportation of coal has bucked the trend, remaining relatively stable over the last three years. Coal is predominantly used in the production of electricity, which has been protected from the worst of the recession. Base metals have been hit especially hard due to poor performance in the downstream manufacturing sector. In 2011, the demand from this market is expected to expand as domestic economic trends improve. Other – Other market segments that use services from long distance freight trucking include government contracts and intermodal activity. Growth in revenue from government contracts has been steady over the last five years. The government uses long-distance truck companies to transport essential government consumables ranging from machinery to stationery. The intermodal market relates to the movement of containers between transportation methods. In the past five years, the long-distance trucking community has been collaborating with railroads to deliver containers in the most efficient and effective way. Consequently, this market is expected to have increased as a proportion of revenue over the past five years.

Chapter 6. Industry Analysis BV201: Introduction to Business Valuation
BV201r v. 6.0 (11/15) Non-authoritative © 2015 American Society of Appraisers 25
Handout 6-1
Industry Impact on the Company

Chapter 7. Company Analysis BV201: Introduction to Business Valuation
BV201r v. 6.0 (11/15) Non-authoritative © 2015 American Society of Appraisers 1
Chapter 7. Company Analysis
I. Applying the Business Appraiser’s Analysis to the Company
A. All analysis performed is intended to help the business appraiser understand how the identified factors affect:
1. The company’s financial performance
2. The company’s value (i.e., “k” or “g” representing the denominator in the value formula)
B. The four basic types of company analysis are:
1. General economic and political analysis
2. Industry analysis
3. Operational analysis
4. Financial analysis
II. Financial Performance Analysis
A. The Objectives of Financial Statement Analysis
1. Identify trends and what caused them.
2. Identify unusual items and why they happened.
3. Ascertain the uncertainty of income flows to the company’s various capital suppliers. (The higher the risk to any category of capital supplier, the higher the cost of that class of capital.)
4. Compare the company to an industry norm or peer group. (Analyze and explain similarities and differences.)
5. Provide a basis for comparing the subject company with guideline companies in the market approach.
6. Provide a basis for developing financial projections or assessing company projections in the income approach.
B. Types of Financial Analysis
1. Trend analysis
a. Consists of a multi-year spread of income statement, balance sheet and possibly accounting statement of cash flows. For key items, may include annual growth rates or compound growth rates for the period.
b. The goal is to identify positive and negative trends, review past growth patterns, and assess what is “normal” for the subject company.

Chapter 7. Company Analysis BV201: Introduction to Business Valuation
BV201r v. 6.0 (11/15) Non-authoritative © 2015 American Society of Appraisers 2
c. The number of periods in the spread
(i) Should depend on the specific case facts. Five years is common, but it is unrealistic to assume that five years is appropriate in every circumstance.
(ii) For a cyclical company, capturing a full business or economic cycle may be appropriate.
(iii)If there have been dramatic changes in business condition or strategy, data from even two or three years ago may be largely irrelevant to the analysis.
d. Income statement trends
(i) Review level and trend in revenue and key expense items.
(ii) Review level and trend in profitability: EBITDA, EBIT, pre-tax, net income.
(iii)Identify reclassifications, new items, nonrecurring items, non-operating items.
e. Balance sheet trends
(i) Note significant classes of assets and liabilities.
(ii) Review level and trend in working capital (current assets less current liabilities)—with and without interest-bearing debt.
(iii)Review level and trend in fixed assets.
(iv) Review level and trend in interest-bearing debt and equity.
f. Statement of cash flows trends
(i) The purpose of the statement of cash flows is to report cash inflows and outflows for a specific period and to reconcile the accrual income statement to the cash flow generated by the business.
(ii) Cash flows are classified into three categories1:
(a) Cash flow from operating activities (CFO)—cash generated/used in the firm’s normal operating activities, including revenue, expense and changes in working capital items
1For firms with significant currency conversion issues, a fourth category is required: Effect of Exchange
Rate Changes

Chapter 7. Company Analysis BV201: Introduction to Business Valuation
BV201r v. 6.0 (11/15) Non-authoritative © 2015 American Society of Appraisers 3
(b) Cash flow from investing activities (CFI)—cash used/received from acquisition or disposal of plant, equipment and other investments
(c) Cash flow from financing activities (CFF)—cash used/received from transactions with sources of capital, e.g., proceeds from borrowing or issuing equity, outflows for payment of debt principal, dividends or repurchase of equity (Interest payments are included in CFO because they are deducted as an expense on the income statement.)
(iii)Changes in balance sheet accounts as shown on the cash flow statement:
(a) An increase in an asset account is a negative cash flow and decreases cash on hand (e.g., buying a building).
(b) A decrease in an asset account is a positive cash flow and increases cash on hand (e.g., collecting a receivable).
(c) An increase in a liability account is a positive cash flow and increases cash on hand (e.g., borrowing money from a bank).
(d) A decrease in a liability account is a negative cash flow and decreases cash on hand (e.g., paying off a loan).
(iv) Usefulness of analyzing trends of a business
(a) Assess liquidity—review of trends in cash generation, receivables collection, and timing of cash flows versus accrual income
(b) Assess financial strength—trends in cash flow from operations, ability to finance capital expenditures and debt service from operating cash flow
(c) Assess financial decisions—review of fixed asset purchases/disposals and investment trends
(v) Cautions and potential pitfalls
(a) Misclassification among the three types of cash flows can distort a firm’s financial picture (e.g., abuses by Qwest and Tyco involving the classification of cash inflows as “operating cash flow” and the costs associated with them as “investment cash flow,” thereby overstating CFO).
(b) In the long run, positive cash flow from operations is necessary for survival. However, a period of high growth generally produces significant negative cash flow, which may nonetheless be a positive sign for the business.

Chapter 7. Company Analysis BV201: Introduction to Business Valuation
BV201r v. 6.0 (11/15) Non-authoritative © 2015 American Society of Appraisers 4
(c) Leasing fixed assets rather than buying them will result in different CFO. Lease expense is in CFO; purchased assets are in CFI.
2. Common-size analysis
a. Each line item on the income statement is expressed as a percentage of revenue. Each item on the balance sheet is expressed as a percentage of total assets.
b. Very useful in comparing companies, particularly companies of different size.
c. Identifies relative trends (expense relative to sales, current assets relative to total assets).
d. Helps in making projections or evaluating budgets
Current Year Current Assets Cash $ 62,362 23.7% Accounts Receivable 23,050 8.7% Inventory 12,325 4.7% Other Current Assets 2,398 0.9% Total Current Assets 100,135 38.0% Fixed Assets FF&E 498,115 188.9% Less Accum. Deprec. (426,726) (161.8%) Other Fixed Assets 1,500 0.6% Total Fixed Assets 72,889 27.6% Other Assets Purchased Goodwill (net) 25,469 9.7% Other Assets 65,193 24.7% Total Other Assets 90,662 34.4% Total Assets $ 263,686 100.0% Current Liabilities Accounts Payable $ 52,661 20.0% Lines of Credit 15,000 5.7% Current Portion LTD 1,223 0.5% Other Current Liabilities 49,875 18.9% Total Current Liabilities 118,759 45.0% Long Term Debt 32,118 12.2% Total Liabilities 150,877 57.2% Owner’s Equity 112,809 42.8% Total Liabilities & Equity $ 263,686 100.0%

Chapter 7. Company Analysis BV201: Introduction to Business Valuation
BV201r v. 6.0 (11/15) Non-authoritative © 2015 American Society of Appraisers 5
3. Ratio analysis
a. Important points about ratio analysis
(i) Ratios calculated for the subject company should express relationships that have significance, i.e., average accounts receivable collection period for a fast-food restaurant is not meaningful.
(ii) It is difficult to interpret ratios for the subject company unless they are compared with an industry average, peer group and/or guideline companies, or compared to historical trends within the company itself.
(iii)It is helpful to calculate the same ratios for historical results and for projections. Any changes in future performance can then be identified and explained.
Revenues 1,350,647$ 100.0%Cost of Goods 700,018 51.8%Gross Profit 650,629 48.2%
Salaries & Wages 298,831 22.1%Rent 61,000 4.5%Payroll Taxes 28,974 2.1%Auto & Truck Expenses 35,477 2.6%Insurance 64,355 4.8%Selling Expenses 24,795 1.8%Professional Expense 15,683 1.2%Pension & Profit Sharing 3,257 0.2%Depreciation & Amort. 58,513 4.3%Interest Expense 1,820 0.1%Other Operating Expenses 19,761 1.5% Total Operating Expenses 612,466 45.3%
Operating Income 38,163 2.8%
Net Non-operating Income 963 0.1%NIBT 39,126 2.9%
Taxes 9,857 0.7%
Net Income 29,269$ 2.2%
Current Year
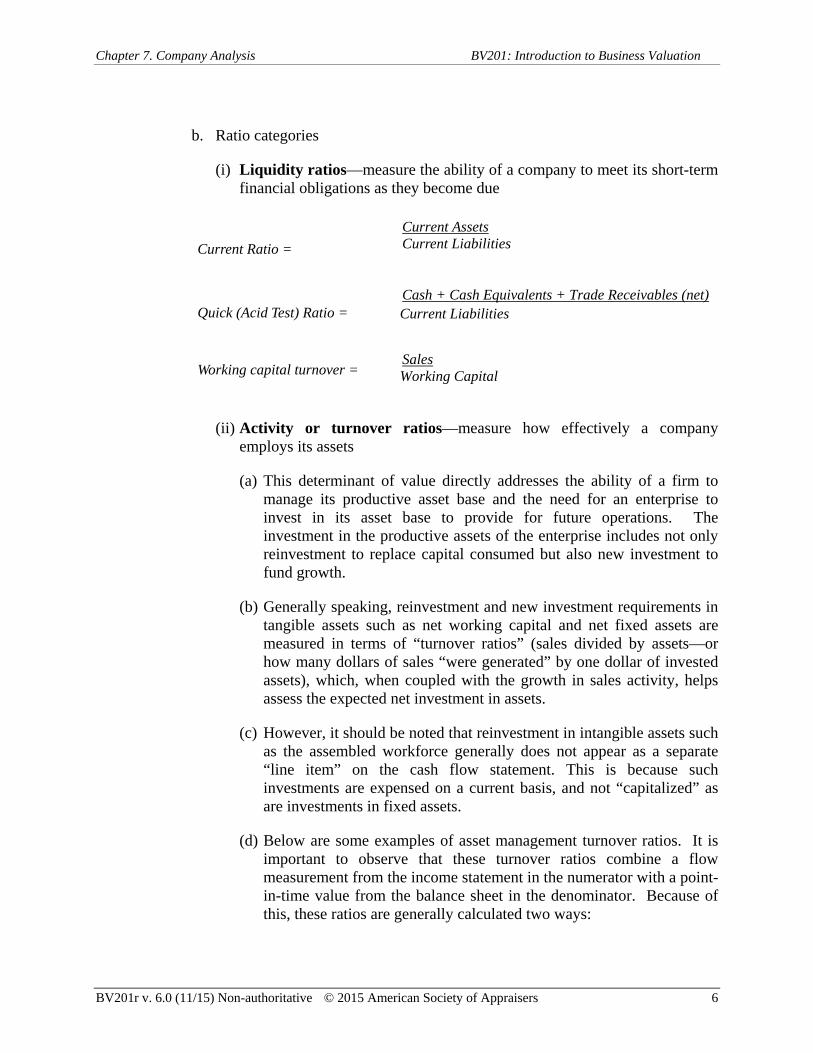
Chapter 7. Company Analysis BV201: Introduction to Business Valuation
BV201r v. 6.0 (11/15) Non-authoritative © 2015 American Society of Appraisers 6
b. Ratio categories
(i) Liquidity ratios—measure the ability of a company to meet its short-term financial obligations as they become due
Current Ratio = Current Assets Current Liabilities
Quick (Acid Test) Ratio = Cash + Cash Equivalents + Trade Receivables (net)
Current Liabilities
Working capital turnover = Sales
Working Capital
(ii) Activity or turnover ratios—measure how effectively a company employs its assets
(a) This determinant of value directly addresses the ability of a firm to manage its productive asset base and the need for an enterprise to invest in its asset base to provide for future operations. The investment in the productive assets of the enterprise includes not only reinvestment to replace capital consumed but also new investment to fund growth.
(b) Generally speaking, reinvestment and new investment requirements in tangible assets such as net working capital and net fixed assets are measured in terms of “turnover ratios” (sales divided by assets—or how many dollars of sales “were generated” by one dollar of invested assets), which, when coupled with the growth in sales activity, helps assess the expected net investment in assets.
(c) However, it should be noted that reinvestment in intangible assets such as the assembled workforce generally does not appear as a separate “line item” on the cash flow statement. This is because such investments are expensed on a current basis, and not “capitalized” as are investments in fixed assets.
(d) Below are some examples of asset management turnover ratios. It is important to observe that these turnover ratios combine a flow measurement from the income statement in the numerator with a point-in-time value from the balance sheet in the denominator. Because of this, these ratios are generally calculated two ways:

Chapter 7. Company Analysis BV201: Introduction to Business Valuation
BV201r v. 6.0 (11/15) Non-authoritative © 2015 American Society of Appraisers 7
(1) With the denominator expressed as an average of the beginning and ending balance sheet account amount (this is theoretically more correct), or
(2) With the denominator expressed only as of the ending balance sheet account amount (this is more common for many financial reporting services such as RMA).
Inventory Turnover =
Cost of Goods Sold Inventory
Accounts Receivable Turnover = ZSales Accounts Receivable
Average Collection Period = Accounts Receivable Sales per Day
Fixed Asset Turnover = ZSales Fixed Assets
Working Capital Turnover = Sales Working Capital
Total Asset Turnover = Sales Total Assets
(iii)Leverage/coverage ratios – measures the ability of the company to cover its debt obligations
(a) The extent to which debt is used in a company’s capital structure (financial risk)
(b) The company’s long-term ability to meet payments to creditors
(c) Measures financial risk, particularly when contrasted with peer group risk and/or guideline company risk
(d) This determinant of value directly addresses the utilization of “financial leverage” or the use of debt in the capital structure of the right-hand side of the balance sheet.
(e) In its broadest meaning, debt can be thought of as all capital supplied by investors other than equity holders, including trade accounts payable, accrued expenses, deferred taxes and interest-bearing debt. All of these various “stakeholders’” have claims on the future income of the business enterprise that are senior to those of the equity holders (they get their money first). Hence, financial leverage is generally measured either as a ratio of total liabilities “debt” to total assets or as a ratio of debt to equity investment.

Chapter 7. Company Analysis BV201: Introduction to Business Valuation
BV201r v. 6.0 (11/15) Non-authoritative © 2015 American Society of Appraisers 8
Total Debt/Total Assets = Total Liabilities Total Assets
Interest-Bearing Debt/Equity = Total Interest-Bearing Debt Equity
Times Interest Earned = Earnings Before Interest & Taxes (EBIT) Interest Charges
Fixed Charges Coverage = EBIT + Fixed Charges Interest Charges + Fixed Charges
Total Assets/Total Equity = Total Assets Total Equity
(iv) Profitability ratios - measure how effectively the company manages expenses and profits.
(a) This determinant of value directly addresses the ability of the enterprise to control its operating costs relative to the to its revenue stream
(b) Profitability is usually measured as a “profit margin” (the percentage ratio of profits to sales). The “bottom line” traditionally is defined as “net income after tax”, although other measures of profitability such as gross profit and operating profit are also important to consider. In addition, measures of profitability differ depending upon whether invested capital or equity is being valued.
(c) Volatility of profit margins, as with volatility in sales, is a manifestation of risk regarding future returns and therefore tends to increase the perception of investment risk and reduce value.
Gross Profit Margin = Gross Profit Sales
Operating Profit Margin = Operating Income Sales
Net Profit Margin = Net Income Sales
After Tax Return on Total Assets* = Net Income Total Assets
After Tax Return on Equity* = Net Income Available to Stockholders Stockholder’s Equity
*Can also be calculated on pre-tax basis
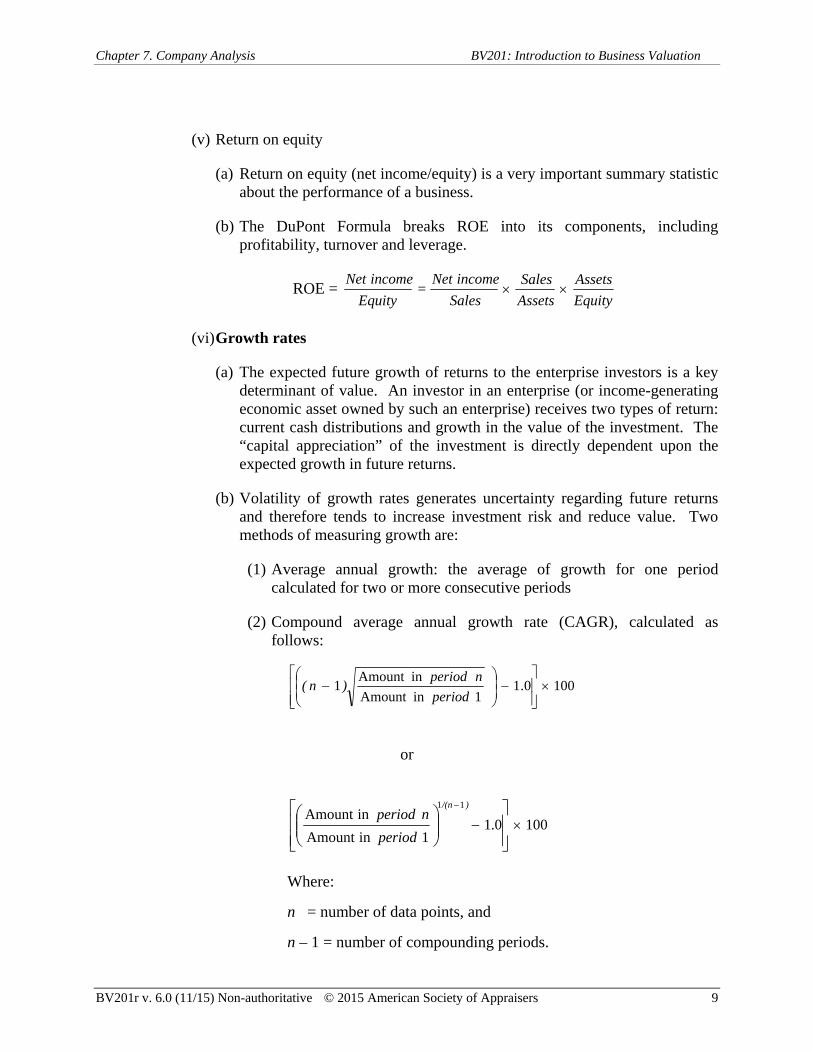
Chapter 7. Company Analysis BV201: Introduction to Business Valuation
BV201r v. 6.0 (11/15) Non-authoritative © 2015 American Society of Appraisers 9
(v) Return on equity
(a) Return on equity (net income/equity) is a very important summary statistic about the performance of a business.
(b) The DuPont Formula breaks ROE into its components, including profitability, turnover and leverage.
ROE = Equity
Assets
Assets
Sales
Sales
income Net =
Equity
income Net
(vi) Growth rates
(a) The expected future growth of returns to the enterprise investors is a key determinant of value. An investor in an enterprise (or income-generating economic asset owned by such an enterprise) receives two types of return: current cash distributions and growth in the value of the investment. The “capital appreciation” of the investment is directly dependent upon the expected growth in future returns.
(b) Volatility of growth rates generates uncertainty regarding future returns and therefore tends to increase investment risk and reduce value. Two methods of measuring growth are:
(1) Average annual growth: the average of growth for one period calculated for two or more consecutive periods
(2) Compound average annual growth rate (CAGR), calculated as follows:
1000.11inAmount
in Amount1
period
n period) n(
or
1000.11in Amount
inAmount
11
period
n period
) /(n
Where:
n = number of data points, and
n – 1 = number of compounding periods.

Chapter 7. Company Analysis BV201: Introduction to Business Valuation
BV201r v. 6.0 (11/15) Non-authoritative © 2015 American Society of Appraisers 10
(c) Average and compound growth rates are important but can be misleading because they are based only on the beginning and ending years. They say nothing about what happened in the years in between.
(vii) Equity vs. invested capital ratios
(a) When you are valuing invested capital or using an invested capital basis in the income or market approach, it is helpful to express some ratios on an invested capital basis.
(b) Instead of total return on equity, use return on invested capital
(c) Instead of pretax or net income margins on equity, use EBITDA, EBIT or NOPAT margins on invested capital.
(d) Illustrative comparison of equity and invested capital ratios:
Profitability for Equity: Profitability for Invested Capital:
Gross Profit / Sales
Operating Profit / Sales
Pre-tax Income / Sales
n/a
NIAT / Sales
Gross Cash Flow (after tax) / Sales
Gross Profit / Sales
Operating Profit / Sales
EBIT / Sales
EBITDA Cash Flow (pre tax) / Sales
NOPAT / Sales
n/a
(viii) Comparative financial analysis
Caution: Most financial ratios can be calculated in a number of ways. For example, return on assets can be calculated based on end-of-year assets or on average assets. It is also calculated with different measurements of income in the numerator.
(a) To compare the subject company to industry ratios, be sure there is consistency in how the ratios are calculated and compared to a third party source of industry financial analysis.
(b) Compare the subject company with industry averages and/or identified guideline companies.
Chapter 7. Company Analysis BV201: Introduction to Business Valuation
BV201r v. 6.0 (11/15) Non-authoritative © 2015 American Society of Appraisers 11
(c) Industry average financial data
(1) Risk Management Association (RMA) Annual Statement Studies
a. Note that RMA suggests that it is necessary to request permission to quote its financial data.
(2) Other print sources such as Troy’s Almanac of Business and Industrial Financial Ratios and Financial Statement Studies of the Small Business
(3) Online providers of data such as www.integrainfo.com & www.bizminer.com
(4) Performance analysis reports (PARs) and other analyses prepared by trade associations.
(5) Industry data prepared by trade publications
(ix) Guideline publicly traded or transaction data
(a) This is the most important comparison for the market approach.
(b) Analyze the performance of the subject company compared to the performance of chosen guideline companies.
(x) Analysis used to consider adjustments to the market multiples (market approach) or discount rate (income approach) applied to the subject company
III. Financial Statement Adjustments
A. Adjustments depend on the valuation approach and whether a minority or controlling interest is being valued.
B. Four purposes of adjustments in the market and income approaches.
1. GAAP adjustments - To more properly compare the subject company with industry counterparts or guideline companies—applicable in both control and minority valuations
a. Inventory method—Normally FIFO (first in—first out) is considered a better economic representation of the balance sheet than LIFO (last in—first out).
b. Depreciation method

Chapter 7. Company Analysis BV201: Introduction to Business Valuation
BV201r v. 6.0 (11/15) Non-authoritative © 2015 American Society of Appraisers 12
2. Non-operating or Excess Items - To separate out assets and/or liabilities not necessary for operating the business and their related income and expense—more applicable in control valuations than lack of control valuations
a. Non-operating assets—Examples include vacation homes, boats, etc., not used in core operations.
b. Excess assets—Is there excess cash or plant capacity? Is real estate owned but not used? Review the fixed asset register.
3. Nonrecurring Items - To adjust historical statements to be more representative of expected future performance (Adjust out income or expense that under normal circumstances would not be expected to occur in the future. This is applicable in both control and minority valuations.)
a. Nonrecurring items
b. Extraordinary items
c. Expense or revenue levels that have changed significantly (e.g., increased rent)
4. Discretionary Items - To adjust for discretionary expenses of the business—more applicable in control valuations than minority
a. Owners’ compensation and perks (this is not always considered to be a control adjustment)
b. Travel and entertainment
c. Above or below market rent, when property is owned by a related party
d. Others—each expense category should be reviewed.
5. Adjustments to the income statement and balance sheet illustrated on pages 13 and 14, respectively.

Chapter 7. Company Analysis BV201: Introduction to Business Valuation
BV201r v. 6.0 (11/15) Non-authoritative © 2015 American Society of Appraisers 13
Current Year $ Adjustment $ As Adjusted $ Assets Current Assets Cash and Equivalents 740,000 740,000 Accounts Receivable 2,155,409 2,155,409 Inventory 1,029,866 200,300 A 1,230,166 Prepaid Expenses 2,500 2,500
Total Current Assets 3,927,775 200,300 4,128,075
Fixed Assets Land & Building 302,865 302,865 Furniture & Fixtures 155,347 155,347 Automobiles 478,912 (100,000) B 378,912 Machinery & Equipment 759,888 759,888
Total Fixed Assets (at cost) 1,697,012 1,597,012 Accumulated Deprec. (1,298,325) 72,000 B (1,226,325)
Total Fixed Assets (net) 398,687 (28,000) 370,687
Real Estate (non-operating) 90,879 (90,879) C 0
Other Assets Goodwill (net) 95,383 95,383 Organization Costs (net) 257 257 Investments 150,000 (150,000) D 0 Patents 0 0
Total Other Assets 245,640 (150,000) 95,640
Total Assets 4,662,981 (68,579) 4,594,402
Liabilities & Equity Current Liabilities Accounts Payable 1,935,230 1,935,230 Notes Payable-Current 50,000 50,000 Accrued Expenses Payable 107,872 107,872 Income Taxes Payable 0 0
Total Current Liabilities 2,093,102 2,093,102 Long Term Debt 350,000 350,000
Total Liabilities 2,443,102 2,443,102
Equity Common Stock 2,500 2,500 Additional Paid in Capital 500,000 500,000 Retained Earnings 1,717,379 (68,579) E 1,648,800
Total Equity 2,219,879 (68,579) 2,151,300
Total Liabilities & Equity 4,662,981 (68,579) 4,594,402
A Add back LIFO reserve B Remove non-operating automobile and related depreciation. C Remove non-operating real estate D Remove non-operating investment E Summation of adjustments

Chapter 7. Company Analysis BV201: Introduction to Business Valuation
BV201r v. 6.0 (11/15) Non-authoritative © 2015 American Society of Appraisers 14
Current Year $ Adjustment $ As Adjusted $
Revenues 10,000,000$ -$ 10,000,000$
Cost of Sales: Beginning Inventory 275,000 65,000 A 340,000 Purchases 2,450,653 - 2,450,653 Less: Ending Inventory (315,000) (100,000) (415,000)
Total Cost of Sales 2,410,653 (35,000) 2,375,653
Gross Profit 7,589,347 35,000 7,624,347
Operating Expenses: Officer Compensation 726,423 (376,423) B 350,000 Salaries and Wages 1,254,000 - 1,254,000 Rent 180,000 60,000 C 240,000 Auto Expense 43,750 (25,000) D 18,750 Travel and Entertainment 76,425 (40,000) D 36,425 Other Operating Expenses 3,284,623 - 3,284,623 Depreciation and Amortization 798,503 (250,000) E 548,503
Total Operating Expenses 6,363,724 (631,423) 5,732,301
Income From Operations 1,225,623 666,423 1,892,046
Other Income (Expenses): Interest Income 26,425 (26,425) F - Gain (Loss) on Sale of Assets 33,450 (33,450) F - Interest Expense (133,458) 133,458 G - Total Other Income (Expenses) (73,583) 73,583 -
Earnings Before Taxes 1,152,040 740,006 1,892,046
Income Taxes: Federal Income Tax - - - State Income Tax - - -
Total Income Taxes - - -
Net Income 1,152,040$ 740,006$ 1,892,046$
A - Change FIFO to LIFO
B - Normalize Officer's Compensation
C - Normalize Rent to Fair Market Value
D - Adjust for Discretionary Auto and Travel and Entertainment Expenses
E - Adjust Accelerated Depreciation Method
F - Adjust Non-Operating Income (Expenses)
G - Remove Interest Expense to Determine Net Income Available to Invested Capital

Chapter 7. Company Analysis BV201: Introduction to Business Valuation
BV201r v. 6.0 (11/15) Non-authoritative © 2015 American Society of Appraisers 15
Classroom Assignment 8: Review GDT historical financial statements located in Appendix C and discuss the appropriate normalization adjustments to both the income statement and balance sheet for the Company.

Chapter 7. Company Analysis BV201: Introduction to Business Valuation
BV201r v. 6.0 (11/15) Non-authoritative © 2015 American Society of Appraisers 16
Handout 7-1
Balance Sheet and Income Statement
Normalization Adjustments and
Normalized Financials

Chapter 7. Company Analysis BV201: Introduction to Business Valuation
BV201r v. 6.0 (11/15) Non-authoritative © 2015 American Society of Appraisers 17
IV. Company Risk Factors
A. Company risk factors are organized into external and internal risk factors.
B. External risk factors are the risks that have been studied in the previous two chapters:
1. Changes in the macroeconomic environment
2. Changes in the political environment
3. Changes in the microeconomic environment
C. Internal risk factors are the factors that the company’s management has the most ability to influence or control. Examples of these risks, taken from the CPA’s auditing standards, include:
1. New personnel
2. New or revamped information systems
3. Rapid growth
4. New technology
5. New business models, products or services
6. Corporate restructuring
7. Expanded foreign operations
8. New accounting pronouncements
9. Acquisitions
10. Internal controls
11. Employee communications
V. Analytical Frameworks
A. DuPont formula
1. The DuPont formula is a three-factor analysis focusing on how well the company is managing the company’s financial returns on an enterprise investment level.
2. The DuPont formula was developed in the early 1900s at either General Motors or the DuPont Corporation. But no one disagrees that the DuPont CFO at the time made the formula famous.

Chapter 7. Company Analysis BV201: Introduction to Business Valuation
BV201r v. 6.0 (11/15) Non-authoritative © 2015 American Society of Appraisers 18
3. The three financial factors monitored via the DuPont formula are:
a. Profitability
b. Turnover
c. Leverage
4. The three financial factors summarize the effects of operational and financial management decisions on the financial return performance of the company.
a. The company’s profitability is used to monitor the effects of management decisions related to the efficiency of operations.
b. The company’s turnover is used to monitor how effectively management is using its asset investments in the company.
c. The company’s leverage is used to monitor how effectively management is controlling its financial capital structure.
5. The DuPont formula is most important for its structured analysis of a financial return, but is most well known for its breakdown of the classic formula for return on equity.
6. The structure of the formula is as follows:
Return on Equity = Profitability Asset Turnover Leverage
7. The classic formula follows:
' '
Net Income Net Income Sales Total Assets
Stockholders Equity Sales Total Assets Stockholders Equity
8. The company’s financial statements can be added to the chart to take the financial statement users from the statement themselves through the return analysis.
a. In addition, a second level can be added to the analysis to allow the analyst or management to look at “what if” scenarios and their effects on the company’s financial returns.
9. The formula can be modified to monitor financial performance. For example, financial performance can be monitored on an invested capital basis or for a particular industry’s type of revenue or asset type.
Earnings Earnings Type of Revenue Type of Asset= × ×
Type of Investment Type of Revenue Type of Asset Type of Investment

Chapter 7. Company Analysis BV201: Introduction to Business Valuation
BV201r v. 6.0 (11/15) Non-authoritative © 2015 American Society of Appraisers 19
10. Examples of modifying the formula:
a. Invested capital emphasis
ROICNOPAT Sales Total Assets
Sales Total Assets Total Invested Capital
11. Management use of the formula
a. At the enterprise level, the management team can only monitor a limited number of key items. The DuPont three factor returns allow them to monitor three of the key areas in the company: profitability, turnover and leverage.
b. Using a time series line graph for each of the items, management can quickly discover the any negative tendencies and quickly drill down into the company to take corrective action.
c. In addition to the DuPont items, management will probably want to monitor sales, EBITDA, operation cash flows and free cash flows, and the related growth rates of the items.
VI. SWOT Analysis (Strengths, Weaknesses, Opportunities and Threats)
A. One of the more common ways to assess the qualitative factors of a company is based on the SWOT analysis. There are many stories of how it developed, but none are unquestionably accepted and it is assumed by most that the method evolved through classroom teaching.
B. The following table demonstrates the most common view of the analysis’ output:
Strengths (internal) What do you do better than your competitors? What intellectual property do you own – and exercise?
Weaknesses (internal) What do the competitors do better than you do? What do you need to do to compete more effectively?
Opportunities (external) What changes are occurring in the industry or customer demands that you can take advantage of? What weaknesses of your competitors can you take advantage of?
Threats (external) What changes are occurring in the industry or in consumer demand that your competitors can take advantage of better than you can? What are your competitors doing to attract your customers?
C. Application of SWOT:
1. Analysis/audit - where are we now?

Chapter 7. Company Analysis BV201: Introduction to Business Valuation
BV201r v. 6.0 (11/15) Non-authoritative © 2015 American Society of Appraisers 20
2. Preparation for strategic plan
3. Problem-solving tool
4. Decision-making tool
5. Resource allocation tool
6. Counseling a client—personnel
7. Current situation appraisal tool (to determine whether corrections are needed)
D. The benefits of using a SWOT analysis are that it provides:
1. A framework for identifying and analyzing strengths, weaknesses, opportunities and threats
2. An impetus to analyze a situation and develop suitable strategies and tactics
3. A basis for assessing core capabilities and competences
4. The evidence for, and cultural key to, change
E. SWOT analysis should be considered in an organized framework like the one below
F. When performing a SWOT analysis, the analyst should always keep the following questions in mind for each of the four areas:
1. Strengths (the company’s core competencies and resources):
a. What does the company do well?
b. How strong is the company in the market, or what is its market position or share?
c. Does the company have a clear communicable vision or direction?
Strengths and Weaknesses Opportunities and Threats
Financial capital Industry – Marketplace
Physical capital Industry – Competitive forces
Human capital Industry – Suppliers
Customer capital Political
System capital Economic
Organizational capital Socio-cultural
Competitors
Chapter 7. Company Analysis BV201: Introduction to Business Valuation
BV201r v. 6.0 (11/15) Non-authoritative © 2015 American Society of Appraisers 21
d. Does the company have a positive corporate culture that makes for a work environment that will attract the employees desired?
e. What are the company’s definable resources (tangible and intangible)?
2. Weaknesses (the company’s liabilities in the competitive marketplace):
a. What systems could be improved at the company?
b. What does the competition do better?
c. What does the company do poorly?
d. Does the company have the financial resources to purchase needed equipment, technology or facilities?
e. Does the company have the financial resources to withstand a downturn or unforeseen negative circumstances?
f. Can the company support its growth rate?
3. Opportunities (with the company’s customers and in the marketplace):
a. What changes are taking place in the market that open up opportunities? Is the company positioned to take advantage of the opportunities?
b. Is the company entering new markets?
c. Can the company upgrade its technology to lower costs?
d. Can the company expand its geographic coverage?
e. Can the company improve its use of the Internet for marketing or customer relations?
4. Threats (what your competitors are doing and other potential challenges):
a. What obstacles / challenges is the company facing?
b. What are your competitors doing?
c. Are regulatory requirements or customer demands forcing a change in your products or services?
d. Is technology threatening your market position?
e. If there is pressure on your profit margins, what is its source?
5. One of the criticisms of the typical company SWOT analysis is that it lacks a disciplined approach to analysis and collecting management input.
6. Exhibit 7-1 provides a formal questionnaire for collecting input from management. The questionnaire has been developed using 13 capital resources, economic and

Chapter 7. Company Analysis BV201: Introduction to Business Valuation
BV201r v. 6.0 (11/15) Non-authoritative © 2015 American Society of Appraisers 22
political categories with approximately 144 underlying characteristics. The basic questionnaire provided can be modified for industry-specific application.
G. The first stage of a formal SWOT analysis is collecting input from the management team. The results must be tallied to determine the mean and standard deviation of management’s opinions which can subsequently be rank ordered according to the mean scores. There are automated systems you can use, or the questionnaires can be tallied and computed on an Excel or other financial spreadsheet.
H. The second stage of the formal analysis is to identify and understand the implications of management’s collective input. For example, if the management team states that financial resources are their primary strength, the question must be asked, “What specifically about our financial resources are strengths?” It may be the cash reserves, the borrowing capacity, etc.
I. The third stage involves exploring with management what implications these strengths, weaknesses, opportunities or threats have on the company’s:
a. Strategy
b. Risks
c. Future growth
d. Financial performance
VII. Company-Specific Value Drivers (Operational and Financial)
A. Every company has specific operational and financial value drivers.
B. Generally, these value drivers are related to the industry and to the company’s critical success factors.
C. Unless the analyst can identify the company’s specific value drivers, it will be impossible to select the appropriate guideline companies and to develop the company’s discount and capitalization rates.
D. Financial value drivers are the individual items that drive return on equity and invested capital, operating and net free cash flows.
E. Operating value drivers are the operational procedures that allow the company to successfully provide the customer with the level of service or product that:
1. Meet the customer-related critical success factors, demands or needs
2. Are set at a price point such that it provides the company with a sufficient return on equity and is acceptable to the paying customer.

Chapter 7. Company Analysis BV201: Introduction to Business Valuation
BV201r v. 6.0 (11/15) Non-authoritative © 2015 American Society of Appraisers 23
See Exhibit 7-2, Common Value Enhancers and Detractors
Appendix B contains an entire section on data analysis using many of the techniques discussed in this and the previous two chapters. This appendix is designed particularly for those students that need some additional help in applying these concepts.
Homework Assignment 2: Using the information included in Appendix C, perform a financial analysis of the company by calculating the ratios that are blank on an unadjusted basis (pages 5 and 6 of Appendix C). In calculating ratios, assume a 40% tax rate where applicable as well as end-of-year balances for applicable ratios. Be prepared to discuss your analysis in class.

Chapter 7. Company Analysis BV201: Introduction to Business Valuation
BV201r v. 6.0 (11/15) Non-authoritative © 2015 American Society of Appraisers 24
Handout 7-2
Ratio Solutions for Homework Assignment 2

Chapter 7. Company Analysis BV201: Introduction to Business Valuation
BV201r v. 6.0 (11/15) Non-authoritative © 2015 American Society of Appraisers 25
Exhibit 7-1
SWOT Questionnaire

Chapter 7. Company Analysis BV201: Introduction to Business Valuation
BV201r v. 6.0 (11/15) Non-authoritative © 2015 American Society of Appraisers 26
This SWOT Analysis questionnaire will assist the organization with a disciplined approach to understanding its strengths, weaknesses, threats and opportunities. The analysis provided will allow management to develop strategies to leverage the organization’s strengths and opportunities and to minimize the impact of the organization’s weaknesses and external negative forces.
In the questionnaire you will rank the organization’s strengths and weaknesses in six critical areas on a six-point scale from major weakness to major strength. The externally generated opportunities or and threats to the organization in seven critical areas will similarly be ranked on a six point scale from major threats to major opportunities. In addition, you will be given the opportunity to identify four major strengths and weaknesses of the organization, to identify four critical competencies of the organization and to identify four major threats and opportunities facing the organization in the next three to five years.
The resulting analysis will play a major role in setting the organization’s future strategic direction. Please thoughtfully rank every potential strength, weakness, threat or opportunity listed.
Strengths and Weaknesses
An organization’s strengths and weaknesses relate to its internal characteristics that affect its performance, especially as compared to the performance of its competitors. These characteristics will drive the organization’s competitive position in the marketplace and will affect the organization’s ability to implement its corporate strategy.
This questionnaire groups an organization’s potential strengths and weaknesses into six categories. Rank the extent that each of the organization’s characteristics is a strength or weakness.
Financial Capital
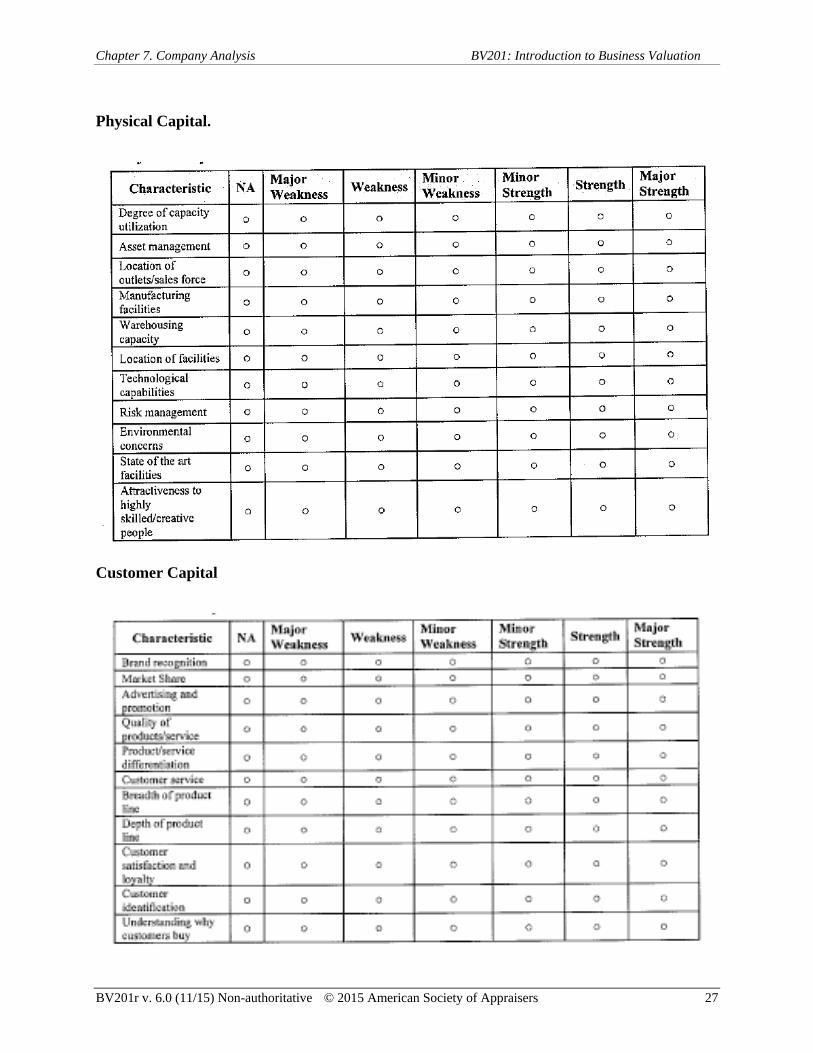
Chapter 7. Company Analysis BV201: Introduction to Business Valuation
BV201r v. 6.0 (11/15) Non-authoritative © 2015 American Society of Appraisers 27
Physical Capital.
Customer Capital

Chapter 7. Company Analysis BV201: Introduction to Business Valuation
BV201r v. 6.0 (11/15) Non-authoritative © 2015 American Society of Appraisers 28
Organizational Capital
Human Capital

Chapter 7. Company Analysis BV201: Introduction to Business Valuation
BV201r v. 6.0 (11/15) Non-authoritative © 2015 American Society of Appraisers 29
System Capital
Core Competencies
What are the four most important core competencies of the organization?
The organization’s most important core competency is:
The organization’s second most important core competency is:
The organization’s third most important core competency is:
The organization’s fourth most important core competency is:
Greatest Strengths
What are the four greatest strengths of the organization?
The organization’s greatest strength is:
The organization’s second greatest strength is:
The organization’s third greatest strength is:
The organization’s fourth greatest strength is:
Biggest Weaknesses
What are the four biggest weakness of the organization?
The organization’s biggest weakness is:
The organization’s second biggest weakness is:
The organization’s third biggest weakness is:
The organization’s fourth biggest weakness is:

Chapter 7. Company Analysis BV201: Introduction to Business Valuation
BV201r v. 6.0 (11/15) Non-authoritative © 2015 American Society of Appraisers 30
Opportunities and Threats
Every organization encounters external environmental forces that provide opportunities and threats that will affect its future performance. Identifying and understanding the organization’s future opportunities and threats is necessary to adopt a strategy or modify a strategy that takes advantage of its biggest opportunities, while minimizing its material threats. The following section of the questionnaire groups an organization’s potential opportunities and threats in to seven categories. Rank the extent that each of the following external environmental forces is an opportunity or a threat.
Industry – Marketplace

Chapter 7. Company Analysis BV201: Introduction to Business Valuation
BV201r v. 6.0 (11/15) Non-authoritative © 2015 American Society of Appraisers 31
Industry - Competitive Forces
Industry – Suppliers

Chapter 7. Company Analysis BV201: Introduction to Business Valuation
BV201r v. 6.0 (11/15) Non-authoritative © 2015 American Society of Appraisers 32
Political
Economic

Chapter 7. Company Analysis BV201: Introduction to Business Valuation
BV201r v. 6.0 (11/15) Non-authoritative © 2015 American Society of Appraisers 33
Socio-cultural
Competitors
Chapter 7. Company Analysis BV201: Introduction to Business Valuation
BV201r v. 6.0 (11/15) Non-authoritative © 2015 American Society of Appraisers 34
Biggest Opportunities
What are the four biggest opportunity of the organization?
The organization’s biggest opportunity is:
The organization’s second biggest opportunity is:
The organization’s third biggest opportunity is:
The organization’s fourth biggest opportunity is:
Biggest Threats
What are the four biggest threat of the organization?
The organization’s biggest threat is:
The organization’s second biggest threat is:
The organization’s third biggest threat is:
The organization’s fourth biggest threat is:

Chapter 7. Company Analysis BV201: Introduction to Business Valuation
BV201r v. 6.0 (11/15) Non-authoritative © 2015 American Society of Appraisers 35
Exhibit 7-2
Common Value Enhancers and Detractors

Chapter 7. Company Analysis BV201: Introduction to Business Valuation
BV201r v. 6.0 (11/15) Non-authoritative © 2015 American Society of Appraisers 36
COMMON VALUE ENHANCERS AND DETRACTORS:
Businesses generally have favorable and unfavorable characteristics that cause it to stand apart from other businesses in general or within its own industry. Rank each of the following from 1 to 3 (three being highly significant and one being a minor enhancer or detractor). If not applicable, mark with a zero.

Chapter 7. Company Analysis BV201: Introduction to Business Valuation
BV201r v. 6.0 (11/15) Non-authoritative © 2015 American Society of Appraisers 37

Chapter 7. Company Analysis BV201: Introduction to Business Valuation
BV201r v. 6.0 (11/15) Non-authoritative © 2015 American Society of Appraisers 38

Chapter 7. Company Analysis BV201: Introduction to Business Valuation
BV201r v. 6.0 (11/15) Non-authoritative © 2015 American Society of Appraisers 39
Handout 7-3
Compound Growth Example

Chapter 8. Overview of the Market Approach BV201: Introduction to Business Valuation
BV201r v. 6.0 (11/15) Non-authoritative © 2015 American Society of Appraisers 1
Chapter 8. Overview of the Market Approach
I. Introduction
A. Definition
1. The market approach is a general way of determining a value indication of a business, business ownership interest, security, or intangible asset by using one or more methods that compare the subject to similar businesses, business ownership interests, securities, or intangible assets that have been sold.
B. Overview
1. The market approach is probably the most fundamental approach in a fair market value appraisal. Since fair market value is supposed to come from the "market," it seems natural that this approach should be greatly emphasized. However, the application of this approach can, at times, be the most difficult approach to use in a business valuation.
2. In real estate appraisal, the appraiser looks for properties similar to the piece of real estate being appraised in order to compare the similarities and dissimilarities between the properties. After the comparison is made, the real estate appraiser estimates the value of the subject property using the sales price of the "comparable" properties as a starting point.
3. This concept can be illustrated using the following example. Property A sold for $200,000. It is a single-family house on a busy main road; it is on one acre of land and has three bedrooms, two baths, and a newly renovated family room. Property B sold for $175,000. It is also a single-family residence in the same neighborhood, but it is up the street off the main road on one acre of land, and it has two bedrooms, two baths, and a well-maintained interior. Property C sold for $190,000 on the same block as property B; it is also on one acre, has two bedrooms, has two-and-one-half baths, and is in relatively good shape on the inside. An appraisal of property D is requested. The comparative statistics about the properties are given in the following table.

Chapter 8. Overview of the Market Approach BV201: Introduction to Business Valuation
BV201r v. 6.0 (11/15) Non-authoritative © 2015 American Society of Appraisers 2
Property A Property B Property C Subject Property
Sales price 200,000 175,000 190,000 Unknown
Acreage 1 1 1 1
Location Main road Quiet street Quiet street Quiet street
Bedrooms 3 2 2 3
Baths 2 2 2.5 2.5
Interior New condition Good condition Good condition Good condition
All else Same Same Same Same
4. After a comparison of the features of properties A, B, and C with those of the Subject Property, it appears that the Subject Property most closely resembles property C, except the appraisal subject has an extra bedroom. Therefore, the real estate appraiser concludes that the appraised value of the Subject Property is $200,000.
5. This is a simplistic example and is not intended to make light of the role of the real estate appraiser. However, real estate sales are generally available in public records, and therefore, the real estate appraiser has a definite advantage over the business valuation analyst. The point being made is that an estimate of fair market value is an interpretation of market data indicating the worth of a property. The role of the valuation analyst is that of an interpreter, not a market maker. Our job is to use the information available in the market to estimate the value of the appraisal subject. Despite the similarities to real estate appraisal, business valuation methods are a bit different.
C. Principle of Substitution
1. The market approach is based upon the principle of substitution premise that a prudent buyer will pay no more for a property than it would cost to acquire a substitute property with the same utility. Therefore, we analyze prices at which the equity or invested capital in similar businesses has changed hands. To do this we analyze guideline company transaction data from sources such as:
a. Publicly traded companies
b. Acquired/merged companies
c. Other market approach methods include:
(i) Analysis of prior transactions in the subject company’s stock

Chapter 8. Overview of the Market Approach BV201: Introduction to Business Valuation
BV201r v. 6.0 (11/15) Non-authoritative © 2015 American Society of Appraisers 3
(ii) The use of industry-based rules of thumb
(iii)Buy-sell agreements
(iv) Bona fide offers to buy the subject company
(v) Previous acquisitions of similar businesses by the subject company
D. Strengths and Weaknesses
1. Strengths of the market approach (real and perceived) include:
a. Relatively easy to get data
b. Easy to understand and apply
c. Includes all assets (tangible and intangible)
d. Does not rely on forecasts (usually)
e. Users tend to think they are objective and reliable
f. Incorporates current market conditions—reflecting investor growth and risk expectations
2. Weaknesses of the market approach (real and perceived) include:
a. Requires comparable/guideline companies
b. Cannot be used for a variety of individual assets
c. Hidden assumptions, e.g., growth
d. In the merger and acquisition method, transactions often reflect synergies and buyer-specific value. Information about the acquired company and terms of the deal may be inadequate
II. Basic Principles Underlying the Market Approach
A. These basic principles should guide decisions made in applying the market approach.
B. Comparability – In order for the market approach to be properly applied, the subject company must be comparable to the companies that it will be compared to. Comparability is generally considered with respect to the following:
1. Industry – The guideline companies should be in the same or a very similar business as the subject.
2. Size – Size can be expressed in terms of sales, total assets or market capitalization. Numerous studies indicate that smaller companies have lower pricing multiples than larger companies, primarily because of differences in business and financial risk.
3. Growth expectations – The prices of public companies are strongly correlated with

Chapter 8. Overview of the Market Approach BV201: Introduction to Business Valuation
BV201r v. 6.0 (11/15) Non-authoritative © 2015 American Society of Appraisers 4
growth expectations. It is important to research analyst growth expectations for potential guidelines and to look at their historical growth. The subject company may have higher or lower growth expectations, but often cannot finance the same level of growth because of its more limited access to capital.
4. Business risk – Qualitative factors such as market penetration, distribution channels, and geographic diversification also have a substantial impact on comparability. Another factor is how long the company has been in business. Relatively new businesses tend to have lower multiples because there tends to be more uncertainty about their future and they are more risky.
5. Financial risk – The guideline companies should be as similar as possible in their financial metrics. It may be necessary to adjust the financial statements of both the guidelines and the subject so they are on a similar basis (e.g., eliminating non-recurring items and adjusting LIFO to FIFO inventory accounting method) before making comparisons.
6. The guideline public company method of appraisal is based on the premise that pricing multiples (a relationship between the price of a publicly traded stock and some other variable, such as earnings, sales, book value, etc.) of publicly traded companies can be used as an indicator of value to be applied in valuing the closely held appraisal subject. Using multiples of public companies in this manner is suggested in Revenue Ruling 59-60 in the famous eight factors to consider (at a minimum). The Revenue Ruling tells us to consider the market price of stocks of corporations engaged in the same or similar line of business having their stocks actively traded in a free and open market either on an exchange or over the counter.
7. The merger and acquisition method uses the same concept in establishing multiples but it uses transactions rather than a single share price.
8. The mechanics of the method require the valuation analyst to use the stock price of the public company in conjunction with some other factor (such as earnings, cash flow, book value, etc.), to create a pricing multiple. With certain adjustments, the pricing multiple is applied to the appraisal subject's similar factor to determine an estimate of value for the company. A price-to-earnings multiple would be applied to the company's earnings, a price-to-cash flow multiple would be applied to the company's cash flow, and so forth.
9. To use this method properly, the publicly traded companies that are used as surrogates must be comparable to the closely held appraisal subject. The comparable companies will not be identical to the appraisal subject but should be similar enough to provide guidance to the valuation analyst during the appraisal process. The similar companies, formerly known as "comparative companies" or "comparables," a term taken from the real estate appraisal world, are known as "guideline companies" in our world. This terminology was suggested by the Business Valuation Committee of ASA to highlight the fact that no two companies are truly comparable, but rather, that similar companies can provide guidance about other companies in the marketplace.

Chapter 8. Overview of the Market Approach BV201: Introduction to Business Valuation
BV201r v. 6.0 (11/15) Non-authoritative © 2015 American Society of Appraisers 5
10. In business valuation, the requirements for “similarity” are considered from an investment point of view. The factors that will be considered by the valuation analyst will vary from assignment to assignment. One concise list of factors to consider in determining the similarity of the guideline companies is impossible. However, some of the factors to consider have been included in the writings of Graham, Dodd, and Cottle1; Stockdale2; and Bolten, Brockardt, and Mard3. The following are some of the factors to consider, though not necessarily in any special order:
a. Past growth of sales and earnings
b. Rate of return on invested capital
c. Stability of past earnings
d. Dividend rate and record
e. Quality of management
f. Nature and prospects of the industry
g. Competitive position and individual prospects of the company
h. Basic nature of the activity
i. General types of goods or services produced
j. Relative amounts of labor and capital employed
k. Extent of materials conversion
l. Amount of investment in plant and equipment
m. Amount of investment in inventory
n. Level of technology employed
o. Level of skill required to perform the operation
p. Size
q. Financial position
r. Liquidity
1B. Graham, D. Dodd, and S. Cottle, Security Principles and Technique, 4th ed. (New York: McGraw-Hill,
1962). 2John J. Stockdale, “Comparison of Publicly Held Companies With Closely Held Business Entities,”
Business Valuation Review (December 1986), 3-9. 3Steven E. Bolten, James W. Brockardt, and Michael J. Mard, “Summary (Built-up) Capitalization Rates
for Retailers,” Business Valuation Review (March 1987), 6-13.

Chapter 8. Overview of the Market Approach BV201: Introduction to Business Valuation
BV201r v. 6.0 (11/15) Non-authoritative © 2015 American Society of Appraisers 6
s. Years in business
t. Financial market environment
u. Quality of earnings
v. Marketability of shares
w. Operating efficiency
x. Geographical diversification
y. Similarity of business model
11. Various writings have created a substantial list of attributes to consider in determining whether the guideline companies are "comparable" enough to be used as good surrogates in an appraisal. The guideline company must be "similar" and "relevant" to be used as a surrogate. Comparing the local hardware store with The Home Depot may involve similar businesses, but let's face it, where's the relevance?
12. How do we really identify guideline companies? In the real world, the search for guideline companies can be accomplished the old-fashioned way, by legwork at the library, or the modern way, sitting at your desk in front of a computer. Those of us who started in this business a long time ago did not have a choice. Today, we opt for the latter alternative. It's much faster and a lot less work.
III. Basic Steps of the Market Approach Process
A. Step 1 – Choose Guideline Companies That are Similar or Comparable to the Subject
B. Step 2 – Normalize the Financial Statements of the GPCs
C. Step 3 – Calculate Various Market Multiples
D. Step 4 – Select the Multiple(s) to be Applied to the Subject Company
E. Step 5 – Compare the Subject Company to the Guidelines
F. Step 6 – Adjust the Level of the Selected Market Multiple(s)
G. Step 7 – Apply the Adjusted Market Multiple(s) to the Subject Company
H. Step 8 – Reconcile the Different Indications of Values
I. Step 9 – Consider the Necessity of Applying Discounts/Premiums
IV. ASA Standards and Definitions
A. ASA Business Valuation Standards for the Market Approach
1. Business Valuation Standard V (BVS-V) – Market Approach to Business Valuation (last revised February 2001),

Chapter 8. Overview of the Market Approach BV201: Introduction to Business Valuation
BV201r v. 6.0 (11/15) Non-authoritative © 2015 American Society of Appraisers 7
2. Statement on Business Valuation Standard 1 (SBVS-1) – The Guideline Company Valuation Method (last revised November 2005), and
3. Statement on Business Valuation Standard 2 (SBVS-2) – The Merger and Acquisition Method (promulgated January 2004).
B. Business Valuation Standard V (BVS-V)
1. BVS-V addresses the market approach in general.
2. BVS-V, II defines the market approach as follows:
a. The market approach is a general way of determining a value indication of a business, business ownership interest, or security by using one or more methods that compare the subject to similar businesses, business ownership interests, or securities that have been sold.
b. Examples of market approach methods include the guideline company method (see SBVS-1) and the analysis of prior transactions in the ownership of the subject company.
3. BVS-V, III addresses what is a “reasonable basis for comparison,” as follows:
a. The business, business ownership interest, or security used for comparison must serve as a reasonable basis for such comparison.
b. Factors to be considered in judging whether a reasonable basis for comparison exists include:
(i) A sufficient similarity of qualitative and quantitative investment characteristics
(ii) The amount and verifiability of data known about the similar investment
(iii)Whether or not the price of the similar investment was obtained in an arm’s-length transaction, or a forced or distress sale
4. BVS-V, IV addresses the “selection of valuation ratios,” as follows:
a. Comparisons are normally made through the use of valuation ratios. The computation and use of such ratios should provide meaningful insight about the value of the subject, considering all relevant factors. Accordingly, care should be exercised with respect to issues such as:
i. The selection of the underlying data used to compute the valuation ratios
ii. The selection of the time periods and/or the averaging methods used for the underlying data
iii. The computation of the valuation ratios
iv. The timing of the price data used in the valuation ratios
Chapter 8. Overview of the Market Approach BV201: Introduction to Business Valuation
BV201r v. 6.0 (11/15) Non-authoritative © 2015 American Society of Appraisers 8
v. How the valuation ratio or ratios were selected and applied to the subject’s underlying data
b. In general, comparisons should be made by using comparable definitions of the components of the valuation ratios. However, where appropriate, valuation ratios based on components that are reasonably representative of ongoing results may be used.
5. BVS-V, V discusses “rules of thumb,” as follows:
a. Rules of thumb may provide insight on the value of a business, business ownership interest, or security. However, value indications derived from the use of rules of thumb should not be given substantial weight unless they are supported by other valuation methods and it can be established that knowledgeable buyers and sellers place substantial reliance on them.
C. ASA Glossary of Terms
1. The ASA Business Valuation Standards include a glossary of terms. The following terms from this glossary are important in the market approach:
a. Capitalization – a conversion of a single period of economic benefits into value
b. Capitalization factor – any multiple or divisor used to convert anticipated economic benefits of a single period into value
c. Capitalization of earnings method – a method within the income approach whereby economic benefits for a representative single period are converted to value through division by a capitalization rate
d. Capitalization rate – any divisor (usually expressed as a percentage) used to convert anticipated economic benefits of a single period into value
e. Market (market-based) approach – a general way of determining a value indication of a business, business ownership interest, security, or intangible asset by using one or more methods that compare the subject to similar businesses, business ownership interests, securities or intangible assets that have been sold
f. Market multiple – the market value of a company’s stock or invested capital divided by a company measure (such as economic benefits, number of customers)
g. Multiple – the inverse of the capitalization rate
h. Price/earnings multiple – the price of a share of stock divided by its earnings per share
i. Valuation ratio – a fraction in which a value or price serves as the numerator and financial, operating, or physical data serves as the denominator
j. Guideline public company method – a method within the market approach whereby market multiples are derived from market prices of stocks of companies

Chapter 8. Overview of the Market Approach BV201: Introduction to Business Valuation
BV201r v. 6.0 (11/15) Non-authoritative © 2015 American Society of Appraisers 9
that are engaged in the same or similar lines of business, and that are actively traded on a free and open market.
k. Merger and acquisition method – a method within the market approach whereby pricing multiples are derived from transactions of significant interests in companies engaged in the same or similar lines of business
l. Rule of thumb – a mathematical formula developed from the relationship between price and certain variables based on experience, observation, hearsay or a combination of these; usually industry specific
m. Market capitalization of equity – the share price of a publicly traded stock multiplied by the number of shares outstanding
n. Market capitalization of invested capital – the market capitalization of equity plus the market value of the debt component of invested capital
Classroom Assignment 9: Read Handout 8-1, Estate of Joyce C. Hall and be prepared to discuss. (25 minutes)

Chapter 8. Overview of the Market Approach BV201: Introduction to Business Valuation
BV201r v. 6.0 (11/15) Non-authoritative © 2015 American Society of Appraisers 10
Handout 8-1
Estate of Joyce C. Hall

Chapter 9. GPC Step 1 BV201: Introduction to Business Valuation
BV201r v. 6.0 (11/15) Non-authoritative © 2015 American Society of Appraisers 1
Chapter 9. GPC Step 1 – Guideline Search and Selection
I. Overview of the Guideline Public Company Method
A. ASA’s BV Standards glossary defines this method as a method within the market approach whereby market multiples are derived from market prices of stocks of companies that are engaged in the same or similar lines of business and that are actively traded on a free and open market.
B. The essential characteristics of this appraisal method are:
1. Share prices of similar, actively traded publicly owned companies are applied to the subject company through valuation multiples.
2. Normally it is possible to select transactions on the date of value, or close to the date of value, assuring timeliness of the evidence.
II. ASA SBVS-1 Conceptual Framework for the GPC Method and Guidance for the Search for and Selection of GPCs
A. SBVS-1 addresses the guideline company valuation method for transactions involving either minority interests or control interests under the market approach.
1. SBVS-1, I explains that the purpose of the statement is to define and describe the requirements for the use of the guideline company valuation method, under Standard BVS – V, the Market Approach to Business Valuation.
2. SBVS-1, II provides the conceptual framework for the use of the guideline company valuation method as follows:
a. Market transactions in securities can provide objective, empirical data for developing valuation ratios for use in business valuation.
b. The development of valuation multiples from guideline companies should be considered in the valuation of businesses, business ownership interests, and securities to the extent that adequate information is available.
c. Guideline public companies are those that provide a reasonable basis for comparison to the investment characteristics of the company being valued.
3. SBVS-1, III provides guidance on the search for a selection of guideline companies as follows:
a. A thorough, objective search for guideline public companies is required to establish the credibility of the valuation analysis. The procedure must include criteria for screening and selecting guideline public companies.
b. Guideline public company empirical data can be found in market based valuation ratios of guideline public companies that are engaged in the same or similar lines of business, and that are actively traded on a free and open market.
Chapter 9. GPC Step 1 BV201: Introduction to Business Valuation
BV201r v. 6.0 (11/15) Non-authoritative © 2015 American Society of Appraisers 2
III. GPC Selection Process
A. The first step under the GPC method is to identify a group of publicly traded or acquired guideline companies which can be examined to derive valuation ratios/multiples that may be applied to the subject company data. Rarely are the guideline publicly traded companies strictly comparable to the subject. Since the appraiser is interested in comparability from an investment perspective, we need to find similar companies.
B. The following list of questions touches the tip of the iceberg when it comes to identifying possible GPCs. Ask the following:
1. What is the Business of the Subject Company.
2. What industry does the company participate in?
a. Is the industry concentrated or fragmented?
b. Is the industry capital intensive?
3. Is the company in one, two or more lines of business?
a. If it has more than one line of business, how important are each of the business segments to the overall performance of the company? (Probably the most important measure of performance is profitability.)
b. How closely related are these businesses?
4. What is the nature of the market?
5. What are the nature, level, and basis of competition?
a. Is the company a market leader/follower?
b. Does the company have distinctive competencies?
6. Does the company have advantageous intellectual capital?
7. Does the company operate locally, regionally, nationally or globally?
8. What has the financial performance of the company been like?
C. Your procedures for employing the guideline public company method may go something like the following:
1. Creating a List of Potential Guideline Companies
a. The first step in each guideline public company analysis is to generate a list of potential guideline companies. It is important to consider as many potential guideline companies as possible, and that means that you must perform a thorough and comprehensive search to locate as many as possible.

Chapter 9. GPC Step 1 BV201: Introduction to Business Valuation
BV201r v. 6.0 (11/15) Non-authoritative © 2015 American Society of Appraisers 3
2. Consider, at a minimum, these four sources for learning about or finding potential guideline companies:
a. Management
(i) A management interview is a useful part of every valuation assignment. While you are asking management everything that was on your questionnaire, make sure to specifically ask about any publicly traded competitors. Good managers have a real handle on their competitive environment and will know who their public competitors are. This is a good starting point for each guideline company search. This will also be very helpful because many databases that classify companies by SIC code use different codes for the same company. If you perform a search of a database and you do not come up with a company that management told you about, see what SIC code that company is categorized under and expand your search. You may find other companies there as well.
b. SIC or NAICS code search (we are going to refer to these as SIC but NAICS can be substituted)
(i) An intuitive starting point when you are back at your computer is an SIC code search. If you do not know the SIC code for the subject or are not sure if your subject is correctly defined, there are many sources for SIC code information. The Occupational Safety and Health Administration (OSHA) website site lists all SIC codes. This website allows you to review two, three, and four digit SIC code descriptions, which is helpful in determining the subject's SIC code.
(ii) Remember that the goal of this exercise is to locate companies that are in a same or similar industry as the subject company. Using the information available on this site, you can research other SIC codes to determine if you
could possibly use multiple codes to search for guideline companies.
(iii)A useful tool on this page is the "SIC Search." This search allows a user to search SIC codes by keyword. If the subject manufactures metal pipe, for instance, you may want to search on "metal pipe." In addition to the subject company's SIC code, you have codes for all businesses that deal with metal
pipe.
(iv) Now that you have an SIC code or group of SIC codes, you can use one of many search engines to find companies by industry code. The question becomes which one to use. There are many free Web sites that allow you to get information about guideline companies. There are also many fee-based websites that charge without mercy. Basically, it works out that the higher the fees, the more services you sometimes get. The free sites have most of the same information; it's just not packaged as well.

Chapter 9. GPC Step 1 BV201: Introduction to Business Valuation
BV201r v. 6.0 (11/15) Non-authoritative © 2015 American Society of Appraisers 4
(v) For free (or almost free) public company information, you can try out some of these sites:
(a) Securities Exchange Commission (www.sec.gov/edgar/searchedgar/webusers.htm)
(b) EDGAROnline (www.edgaronline.com)
(c) 10K Wizard (www.10kwizard.com)
(d) Each of these sites provides EDGAR filings with minimal or no charge. However, keep in mind that the search should also be performed with keywords, and not just SIC codes because many of these databases used the primary SIC code that appears in the header of the 10K that is filed by the company.
(e) These sites change regularly.
(f) EDGAROnline is available by subscription. Once you have subscribed, you can search by company name, ticker symbol, or SIC code. Simply plugging SIC code(s) into this search engine results in a list of companies in the subject's classification. It is always a good idea to print your search so that your work file includes sufficient documentation to support your work. You can print the screens as you go along.
(g) An alternative to using EDGAROnline is 10K Wizard. In addition to searching by SIC Code, 10K Wizard allows you to search by their own industry categorizations. The SIC Code search takes only a few minutes, and allows the analyst to quickly and easily develop a list of potential guideline companies. Previously, this search could take hours and sometimes days, in the library. The companies that show up in your search will be based on the SIC Code that is listed in the documents filed by the public company with the SEC.
(h) If the subject has one major business and a number of relatively small businesses, then the value of the overall company will be driven by the major business segment. If, on the other hand, the subject comprises numerous businesses which are relatively large, then its value is really that of a composite company. Finding comparable companies can be tricky. In the first case, the valuator should try to find companies engaged primarily in one business (sometimes referred to as “pure play” companies); the business being that of the subject. In the latter case, it is unlikely that other companies could be found with the same type of mix as the subject; therefore, pure play companies in all of the subject’s lines of business should be found.

Chapter 9. GPC Step 1 BV201: Introduction to Business Valuation
BV201r v. 6.0 (11/15) Non-authoritative © 2015 American Society of Appraisers 5
c. Online databases
(i) There are a multitude of financial advice webpages in existence that will provide some type of industry analysis. These tools should not be substituted for performing a thorough industry analysis, but can serve as a useful tool in locating guideline companies. For instance, Hoover’s Online (www.hoovers.com) provides free industry lists on its website. However, these industry lists are nothing more than company names. Do not depend on these types of services as a sole source for locating guideline companies, but they do help to expand a potential guideline companies list.
(ii) Some of the more sophisticated databases allow you to put in a greater search criteria than those which were just described. For example, using a database such as Standard & Poor's or Disclosure, you can enter your search criteria, which may include the SIC Code, country of location, and maximum sales volume.
d. Industry research
(i) As previously discussed, an analyst should have a thorough understanding of the valuation subject and its industry. In performing your industry analysis, you will frequently become aware of publicly traded companies in the subject company’s industry. Trade journals and published industry reports are excellent tools for locating potential guideline companies. Another great source of information is industry experts. Business brokers, financial analysts, accountants and industry consultants can be excellent sources of information.
3. Get the Business Description
a. After the possible guideline companies are identified by the initial set of criteria, we used to examine the corporate description included in databases such as Standard & Poor's. Now, we look at the business descriptions that are included in the company's Form 10-K. Since access to the 10-K is free, we can view a more in-depth description than we used to do by looking at the databases. This allows us to look at the narrative about the possible guideline company to further determine if the company appears to be similar enough to use in our analysis.
b. From this description, you can find the business purpose, products, market segments, and many other significant pieces of information. You can use this information to perform a qualitative analysis of the potential guideline company.
c. Search engines can also be a valuable tool when finding information about the guideline companies. A quick search on a company name can turn up valuable information that may not have been picked up by a major news service. In addition to getting the 10-K, we generally will visit the company's Web site.

Chapter 9. GPC Step 1 BV201: Introduction to Business Valuation
BV201r v. 6.0 (11/15) Non-authoritative © 2015 American Society of Appraisers 6
4. Size Criteria
a. You can still use public company data when applying the market approach to smaller companies. The standards do not differentiate between valuing large and small companies. Your budget with the client certainly cannot influence the work you are required to do when you perform a valuation engagement.
b. It is generally a good idea to place a size restriction as part of the criteria used to select guideline companies. What should that size restriction be? It depends! In a perfect world, some appraisers say that the guideline companies should be no more than 10 times the sales revenues of the valuation subject. However, this is not a perfect world. There will be times that others increase the size restriction to 20 or 25 times revenue. There are even times that others will go higher.
c. For a company with $100 million in revenues, a guideline company with $4 billion may be appropriate. In fact, large companies will have fewer restrictions placed on them for size. But what about a $25 million sales company? Would a $2 billion sales company be a good guideline company?
d. An interesting fact that you should be aware of is that at the time that this course was being updated, there were 1,947 companies listed on a public stock exchange with revenues of $10 million or less. There are a lot of small public companies. The problem with many of these companies is that they may be too thinly traded to be used as a good guideline company.
e. There are many valuation analysts who believe that no size restriction should be placed on the guideline company search criteria. The size differential should be made up in the multiple because of the risk factors relative to the size differential.
f. You might have difficult time comparing Microsoft with a small software developer. Here also, common sense must be applied. If the guideline companies are too big, they lose relevance to the appraisal subject. It is not so much that they are too big, but rather the much larger companies tend to have a very different business model and are frequently much more diversified.
g. A size adjustment will be discussed later in the course.
5. Active Trading and Penny Stocks
a. Once you have located possible guideline companies, it is generally a good idea to test these companies to see if their stocks are actively traded, and while you're at it, make sure that these stocks are not penny stocks.
b. According to Revenue Ruling 59-60, guideline companies should have their stock actively traded in the market. Active trading is essential if the market forces are to interact in the manner necessary to reach the equilibrium point in the market known as fair market value.
c. Greater market activity increases the possibility that fair market value will be achieved because many of the personal motivations of particular buyers and

Chapter 9. GPC Step 1 BV201: Introduction to Business Valuation
BV201r v. 6.0 (11/15) Non-authoritative © 2015 American Society of Appraisers 7
sellers would have been eliminated by offsetting their unique situations in arriving at the equilibrium point.
d. The question is what does active trading mean? Most valuation textbooks do not provide an explanation of active trading. There really cannot be a definitive level of trading for each situation. Certain industries trade more frequently than others.
e. The problem with using stocks that are thinly traded is that the analyst must be able to investigate whether the trading that took place is among market participants or possibly insiders. If insiders are involved, they may have knowledge that the hypothetical individual may not have, and therefore, the true definition of fair market value may be violated. Many data sources provide information about insider trading, so this can be investigated.
f. With that being said, if you have many companies that are thinly traded, it may still be better than having no guideline companies at all. It may come down to how much weight do you place on the conclusions derived using this method. Even if you cannot use the guideline company method for this reason, it may serve as a good sanity check on the income approach.
6. Stock Pricing Reports
a. Before selecting guideline companies from the pool of businesses that comprises our initial list, we check the stock price and trading activity of each. A pricing report can tell you many important things about a company. From this report you can see if a business has a very low stock price and would be classified as a penny stock. There is often speculation in the market for penny stocks, which may limit the quality of the pricing multiples.
b. Stock price volatility is another factor that can be seen on a stock pricing history. Highly volatile stocks, or stocks that have high swings in stock value, will suggest that you should take a closer look at that company. Large price swings could indicate changes in the economy, industry, or company, and you will need to understand these factors to properly apply guideline company multiples.
c. Trading activity can also be calculated with the assistance of a stock pricing report. Calculating the average trading over a certain period will allow the analyst to see if the stock is trading regularly, or if it is thinly traded. If some of the company’s shares are owned by insiders, you might want to subtract those shares to get an average float for this calculation.
d. Many of the small public companies are relatively "thinly traded." Little activity makes it a bit more uncomfortable for the valuation analyst, but it does not mean that the company cannot be used. After all, what is the alternative? In general, thinly traded data can be used, albeit cautiously, if the valuation analyst can determine adequate information about the thin trading.
e. In order to learn more about a company's trading activity, we will search the public documents filed with the SEC, look for press releases and other announcements, and even go as far as to call the investor relations people in the
Chapter 9. GPC Step 1 BV201: Introduction to Business Valuation
BV201r v. 6.0 (11/15) Non-authoritative © 2015 American Society of Appraisers 8
company to inquire whether there is anything special about the stock transactions that would disqualify the activity from being used in this analysis. Often, the thin trading takes place among insiders. This information can be used if it is determined that the logical market for the appraisal subject is insiders.
f. There are many times when a valuation analyst must struggle to decide who the logical players in the market are. A fractional interest in a closely held business may be worth more in the hands of an insider than in those of an outside investor. As a matter of fact, there are many times when there may not be a market for a minority interest in a closely held business, other than for the other shareholders of the company. Swing votes and insider knowledge may create value for the insiders that an outsider would not be privy to. Remember, one of the components of fair market value is that the willing buyer and willing seller must have knowledge about the subject property.
7. For Those That Pass Muster . . .
a. For those companies that pass muster, we now download financial information that is included as part of the Form 10-K filed with the SEC from EDGAR or a similar database. In fact, we will generally download the entire Form 10-K so that we can gain a thorough understanding about the public company. This will allow us to take a much more detailed look at the company to determine its level of comparability to the appraisal subject. This can be accomplished by comparing financial ratios and other attributes of the guideline companies with those of the appraisal subject. Before we can do this, certain adjustments may be necessary to the guideline company data. These will be discussed in the next chapter.
8. Data Sources for Publicly Traded Company Research
a. The primary data sources for guideline public company information are the following (each is filed with the SEC on a periodic basis):
(i) The 10K provides a narrative on company’s operations, competition, customer base, industry and employment force, as well as the financial statements for the prior two years.
(ii) The 10Q is the quarterly financial statement filed with the SEC on a quarterly basis. Necessary if a latest 12-month (LTM) analysis is to be performed.
(iii)8K is filed with the SEC to mark significant events in the company such as a change in key personnel, major acquisitions, divestitures, etc.
b. There are a variety of other sources of financial statement information on public companies; virtually all provide data in electronic format. Besides EDGAR (the SEC Web site), these include: Standard & Poor’s, Compustat, OneSource, EdgarScan, Hoovers, Value Line, Reuters, Bloomberg, Thomson, Dialogue, Yahoo!Finance, 10K Wizard, Capital IQ, Fetch XL, and Mergent (formerly Moody’s).

Chapter 9. GPC Step 1 BV201: Introduction to Business Valuation
BV201r v. 6.0 (11/15) Non-authoritative © 2015 American Society of Appraisers 9
c. The advantage of using electronic sources is that the data can be downloaded into a spreadsheet or some other computer program, eliminating the need for manual data entry. This can speed the analysis as well as reduce the potential for data entry errors. In addition, many of these providers put the companies’ data in a standard format; this facilitates cross-comparisons.
d. The negative side of using any electronic sources is in the existence of data errors; while infrequent, there are data entry errors in these sources. (The exception to this is with EDGAR. Since the electronic documents filed with the SEC are now the official documents, they are, by definition, without error.)
e. With the standardization of data comes the loss of detail. This can be important for certain companies which have unique product or service mixes. Sales and profit information by product line is often shown in the written financial statements. Much of this detail and precision are lost when the information is placed onto electronic media. Further, when a company’s written data is put into a standard format, the data entry clerk might misinterpret some of the information and categorize it incorrectly.
f. Each of these electronic sources has certain advantages and disadvantages apart from the general issues discussed above. Some of these data sets have a large amount of textual information (such as footnotes, names of auditors, detailed business descriptions, etc.), but have a limited number of numeric concepts. This can be useful when the valuator is trying to identify and obtain basic financial statement data on guideline companies. Other electronic data providers have very limited textual information, but a large number of pre-calculated financial ratios as well as sophisticated analytical capabilities which allow users to create their own financial measures.
g. With the exception of EDGAR, the SEC, and the company itself, this type of data can be quite costly. Some of these data sets are available through large public or university libraries. Of course, the information is almost always subject to copyright restrictions.
h. There are multiple sources for stock price data separate from the financial statement information; many of these are without cost. The simplest place to obtain most stock price information is from a local newspaper or from an on-line service (such as AOL, Bloomberg, BigCharts or Yahoo!Finance). You may want to search for GPCs on more than one database.
IV. Getting and Setting Up the GPC Financial Statements
A. Part of using public company information in the valuation process requires the valuation analyst to obtain and analyze the financial and operating data of the guideline companies. The valuation analyst will use this information to ensure that the appraisal subject can be properly compared with these other companies. Sometimes, there will be differences in the manner in which the publicly traded company reports its financial results, or non-recurring events may have taken place that require the valuation analyst to recompute the
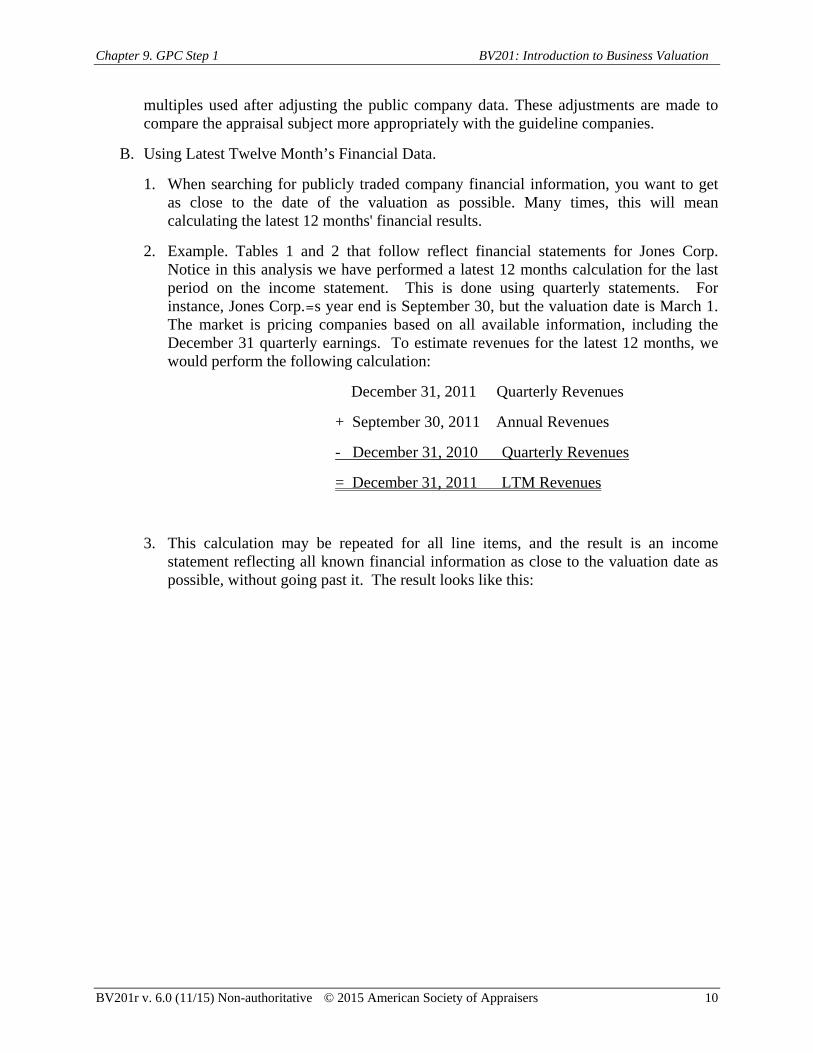
Chapter 9. GPC Step 1 BV201: Introduction to Business Valuation
BV201r v. 6.0 (11/15) Non-authoritative © 2015 American Society of Appraisers 10
multiples used after adjusting the public company data. These adjustments are made to compare the appraisal subject more appropriately with the guideline companies.
B. Using Latest Twelve Month’s Financial Data.
1. When searching for publicly traded company financial information, you want to get as close to the date of the valuation as possible. Many times, this will mean calculating the latest 12 months' financial results.
2. Example. Tables 1 and 2 that follow reflect financial statements for Jones Corp. Notice in this analysis we have performed a latest 12 months calculation for the last period on the income statement. This is done using quarterly statements. For instance, Jones Corp.=s year end is September 30, but the valuation date is March 1. The market is pricing companies based on all available information, including the December 31 quarterly earnings. To estimate revenues for the latest 12 months, we would perform the following calculation:
December 31, 2011 Quarterly Revenues
+ September 30, 2011 Annual Revenues
- December 31, 2010 Quarterly Revenues
= December 31, 2011 LTM Revenues
3. This calculation may be repeated for all line items, and the result is an income statement reflecting all known financial information as close to the valuation date as possible, without going past it. The result looks like this:

Chapter 9. GPC Step 1 BV201: Introduction to Business Valuation
BV201r v. 6.0 (11/15) Non-authoritative © 2015 American Society of Appraisers 11
TABLE 1 JONES CORP.
INCOME STATEMENT FOR YEARS ENDED
September 30, LTM
2009 2010 Dec. 31, 2011
(In Thousands of Dollars)
Revenues 466,795 492,414 876,642 Cost of Goods Sold 406,648 426,005 751,437
Gross Profit 60,147 66,409 125,205 Operating Expenses 23,754 31,981 45,039
Operating Income 36,393 34,428 80,166 Other Income 975 1,995 1,765 Interest Expense 86 274 4,404
Income Before Income Taxes 37,282 36,149 77,527 Provision for Income Taxes 14,345 15,838 32,372
Net Income 22,937 20,311 45,155
Earnings Per Share 0.68 0.59 1.12
The last column of the balance sheet reflects the balance sheet of the latest quarter prior to the valuation date.

Chapter 9. GPC Step 1 BV201: Introduction to Business Valuation
BV201r v. 6.0 (11/15) Non-authoritative © 2015 American Society of Appraisers 12
TABLE 2 JONES CORP.
BALANCE SHEET AS OF
September 30, Dec. 31,
2009 2010 2011
(In Thousands of Dollars)
Cash and Equivalents
$ $ $
Marketable Securities
5,517 17,224 -
Accounts Receivable
61,622 69,318 110,468
Inventories
57,321 79,017 221,417
Other Current Assets
7,278 9,932 16,174
Total Current Assets
155, 191,397
Net Property, Plant and Equipment 26,517 35,868 108,506 Intangible Assets
- 408 50,363
Deposits and Other Assets 1,993 1,963 3,325 Total Assets
184, $
Current Portion of Interest Bearing Debt 672 10
8,09
1 Accounts Payable
41,272 55,928 95,046
Other Current Liabilities
22,741 25,048 43,920
Total Current Liabilities
64,6 80,98 147,
Long-Term Interest Bearing Debt 2,58 142 45,1 Other Long-Term Liabilities 1,219 2,105 3,914
Total Long-Term Liabilities 3,80
6 2,247 49,0
60 Total Liabilities
68,4 83,23 196,
Stockholders' Equity
115,863 146,403 391,562
Total Liabilities and Equity 184, 229,636 587, Common Shares Outstanding at End of Year (000) 33,688 34,646 40,290

Chapter 9. GPC Step 1 BV201: Introduction to Business Valuation
BV201r v. 6.0 (11/15) Non-authoritative © 2015 American Society of Appraisers 13
C. We typically present financial statements for the guideline companies for periods similar to those that we have for the subject. Doing so allows us to look at trends in operating performance of the guideline companies over as much time as possible. These trends, among other things, will indicate a level of comparability. For instance, if all of the guideline companies experience a sales decline, but the subject company's sales do not, it may indicate that the subject company is not sensitive to similar economic factors. Another tool that will help us in this analysis is a financial ratio analysis. Comparative financial ratio analysis allows us to look at what some businesses do better, or worse, than others and gives us a quantitative basis to compare subject to guidelines
Classroom Assignment M-1: Selection of Potential Guideline Public Companies (GPC) (10 minutes)
GPC Selection Criteria
Using the financial statements included in Appendix C and the SIC descriptions included in Exhibit 9-1, list the criteria for the selection of GPCs. Write your criteria in the space allotted below.
Selection Criteria

Chapter 9. GPC Step 1 BV201: Introduction to Business Valuation
BV201r v. 6.0 (11/15) Non-authoritative © 2015 American Society of Appraisers 14
Classroom Assignment M-2: Selection of the Guideline Public Companies (15 minutes)
The initial search for GPCs has been completed. Review Handout 9-2 and begin to narrow down the list of possible GPC candidates. Write the reasons for including or excluding a potential GPC.

Chapter 9. GPC Step 1 BV201: Introduction to Business Valuation
BV201r v. 6.0 (11/15) Non-authoritative © 2015 American Society of Appraisers 15
Classroom Assignment M-3: Selection of the Guideline Public Companies (continued) (15 minutes)
After narrowing down the number of potential GPCs, using the brief descriptions of the GPCs that were provided, now review Handout 9-3, Potential GPC: Stock Pricing and Handout 9-4. Use this information to determine if any of these potential GPCs should be eliminated. List which companies and the reasons for elimination.

Chapter 9. GPC Step 1 BV201: Introduction to Business Valuation
BV201r v. 6.0 (11/15) Non-authoritative © 2015 American Society of Appraisers 16
Classroom Assignment M-4: Selection of the Guideline Public Companies (15 minutes)
Based on the remaining potential GPCs, you have now downloaded the entire Form 10-K or other pertinent documents. Review Handout 9-5 and narrow down your potential GPCs further.
Which additional companies did you eliminate? Why?

Chapter 9. GPC Step 1 BV201: Introduction to Business Valuation
BV201r v. 6.0 (11/15) Non-authoritative © 2015 American Society of Appraisers 17
Exhibit 9-1
SIC Description

Chapter 9. GPC Step 1 BV201: Introduction to Business Valuation
BV201r v. 6.0 (11/15) Non-authoritative © 2015 American Society of Appraisers 18

Chapter 9. GPC Step 1 BV201: Introduction to Business Valuation
BV201r v. 6.0 (11/15) Non-authoritative © 2015 American Society of Appraisers 19

Chapter 9. GPC Step 1 BV201: Introduction to Business Valuation
BV201r v. 6.0 (11/15) Non-authoritative © 2015 American Society of Appraisers 20
Handout 9-1
Initial Search Criteria and
List of Potential Guideline Companies

Chapter 9. GPC Step 1 BV201: Introduction to Business Valuation
BV201r v. 6.0 (11/15) Non-authoritative © 2015 American Society of Appraisers 21
Handout 9-2
Potential Guideline Company Profiles

Chapter 9. GPC Step 1 BV201: Introduction to Business Valuation
BV201r v. 6.0 (11/15) Non-authoritative © 2015 American Society of Appraisers 22
Handout 9-3
Potential Guideline Companies
Stock Pricing & Trading Activity

Chapter 9. GPC Step 1 BV201: Introduction to Business Valuation
BV201r v. 6.0 (11/15) Non-authoritative © 2015 American Society of Appraisers 23
Handout 9-4
Potential Guideline Companies
Trading Activity Analysis

Chapter 9. GPC Step 1 BV201: Introduction to Business Valuation
BV201r v. 6.0 (11/15) Non-authoritative © 2015 American Society of Appraisers 24
Handout 9-5
Potential Guideline Companies
Remaining Potential GPCs 10-K Information

Chapter 9. GPC Step 1 BV201: Introduction to Business Valuation
BV201r v. 6.0 (11/15) Non-authoritative © 2015 American Society of Appraisers 25
Handout 9-6
Solutions for Eliminating Guideline Public Companies

Chapter 10. GPC Step 2 BV201: Introduction to Business Valuation
BV201r v. 6.0 (11/15) Non-authoritative © 2015 American Society of Appraisers 1
Chapter 10. GPC Step 2 – Normalize Financial Statements
I. GPC Step 2 – Normalize the Financial Statements of the Guideline Companies
A. The historical financial performance statements of the guideline companies may need to be adjusted in order to make them more relevant to the assessment of value. The second step in the market approach is to review the financial statements of the guideline companies and “normalize” them by making the following adjustments:
1. Accounting Translation Adjustments (Comparability) – changes so that the financial statements can be made comparable to the other GPCs and to the subject company accounting, These adjustments are intended to place the GPCs and the subject company on the same basis of accounting.
2. Extraordinary/Nonrecurring Adjustments (Predictability) – changes so that the past history of financial performance can be made more predictive of future financial performance, and
3. Nonessential Operating or Excess Asset Adjustments (Core Operations) – changes so that the past financial performance reflects only the economic performance of the core operations which are expected to continue on an indefinite basis, and sometimes those non-core operations which are also expected to continue on an indefinite basis.
B. With the financial statements normalized, the valuation analyst can now (1) calculate the various market multiples using adjusted operating metrics for the denominators and (2) perform the essential comparative analysis between the GPCs and the subject company which will allow the final application of adjusted market multiples to derive indications of value.
II. ASA SBVS-1 Guidance Concerning Analyzing GPCs and Normalizing Financial Statements
A. SBVS-1, IV provides guidance on analysis of the guideline companies as follows:
1. It is necessary to obtain and analyze the financial and operating data on the guideline companies.
2. Adjustments to the financial data of the subject company and guideline companies should be considered to minimize the difference in accounting treatments and eliminate unusual or nonrecurring items.
III. Accounting Translation Adjustments (Comparability)
A. These adjustments are made to the historical financial statements to make them more comparable to peer group accounting by adjusting for such issues as LIFO-FIFO, accelerated versus straight-line depreciation, cash versus accrual, differences in accounting from country to country, and etc. The following are examples:

Chapter 10. GPC Step 2 BV201: Introduction to Business Valuation
BV201r v. 6.0 (11/15) Non-authoritative © 2015 American Society of Appraisers 2
1. Inventory Accounting
a. Differences in inventory accounting (LIFO to FIFO) are common. The following is an example.
Tax Rate: 40%
200A 200B 200C 200D 200ESummary
LIFO Reserve 40,100 42,600 45,400 47,200 49,400Adjustment to Cost of Goods Sold (2,500) (2,800) (1,800) (2,200)Adjustment to Earnings Before Tax 2,500 2,800 1,800 2,200
DetailsBeginning LIFO Inventory 37,985 51,364 49,793 51,628Purchases 157,882 132,878 127,211 110,090Ending LIFO Inventory 37,985 51,364 49,793 51,628 48,529LIFO Cost of Goods Sold 170,650 144,503 134,449 125,376 113,189
LIFO Reserve 40,100 42,600 45,400 47,200 49,400
Beginning FIFO Inventory 78,085 93,964 95,193 98,828Purchases 157,882 132,878 127,211 110,090Ending FIFO Inventory 78,085 93,964 95,193 98,828 97,929FIFO Cost of Goods Sold 142,003 131,649 123,576 110,989
(i) To adjust the balance sheet from LIFO to FIFO at year-end 200E, the accounting entry would be:
Debit: Inventory 49,400 (LIFO reserve)
Credit: Deferred taxes 19,760 (LIFO reserve x 40%)
Retained earnings 29,640 (LIFO reserve at YE 200E x (1 – 40%))
(The adjustment to RE includes the impact on 200E earnings.)
(ii) Thus, if asked to adjust YE 200E inventory from LIFO to FIFO, the calculation would be:
Ending 200E LIFO inventory 48,529 Plus: YE 200E LIFO reserve 49,400 Equals: Ending 200E FIFO inventory 97,929

Chapter 10. GPC Step 2 BV201: Introduction to Business Valuation
BV201r v. 6.0 (11/15) Non-authoritative © 2015 American Society of Appraisers 3
(iii) If asked to calculate the adjustment to retained earnings (tax affected), the calculation would be:
YE 200E LIFO reserve 49,400 Times: (1 – 40%) 60% Equals: Tax-affected adjustment to retained earnings 29,640
(iv) If asked to calculate the impact on 200E net income of an adjustment from LIFO to FIFO, the calculation would be:
Change in LIFO reserve during 200E 2,200 Times: (1 – 40%) 60% Equals: 200E net income adjustment 1,320
Classroom Assignment M-5: Normalizing Adjustments (10 minutes)
Review Handout 10-1 to see what obvious adjustments may require investigation for normalizing the GPCs.
What items may need to be adjusted for the GPCs?

Chapter 10. GPC Step 2 BV201: Introduction to Business Valuation
BV201r v. 6.0 (11/15) Non-authoritative © 2015 American Society of Appraisers 4
Handout 10-1
Guideline Company Financial Information

Chapter 10. GPC Step 2 BV201: Introduction to Business Valuation
BV201r v. 6.0 (11/15) Non-authoritative © 2015 American Society of Appraisers 5
Handout 10-2
Normalized Guideline Company Financial Information
BV201r v. 6.0 (11/15) Non-authoritative © 2015 American Society of Appraisers 1
Chapter 11. GPC Steps 3-4 – Calculation and Selection of Multiples
I. ASA SBVS-1 Guidance for the Calculation and Selection of Multiples
A. SBVS-1, V provides guidance concerning the use of multiples (valuation ratios) as follows:
1. Comparisons are made through the use of valuation ratios. The computation and use of such ratios should provide meaningful insight about the value of the subject, considering all relevant factors. Accordingly, care should be exercised with respect to issues such as:
a. Selection of the underlying data used to compute the valuation ratios
b. Selection of the time periods and/or the averaging methods used for the underlying data
c. Computation of the valuation ratios
d. Timing of the price data used in the valuation ratios
e. How the valuation ratio or ratios were selected and applied to the subject’s underlying data
2. In general, comparisons should be made by using comparable definitions of the components of the valuation ratios. However, where appropriate, valuation ratios based on components that are reasonably representative of ongoing results may be used.
3. Several valuation ratios may be selected for application to the subject company. These ratios may require adjustment for differences in qualitative and quantitative factors between guideline public companies and the subject. One or more indications of value may result. The appraiser must consider the relative importance or weight accorded to each of the indications of value used in arriving at the opinion or conclusion of value.
II. GPC Step 3 – Calculating Market Multiples
Numerator = Price / Denominator = Financial Metric
A. The third step in the GPC method is to calculate the various market multiples to be used in the appraisal process (this market value measure is also referred to as a valuation ratio). Market multiples may take many forms:
1. The numerator (i.e., price) can be on an equity or invested capital basis:
a. Equity price = market capitalization (number of shares x price per share),
b. Invested capital price = market capitalization + interest-bearing debt;

BV201r v. 6.0 (11/15) Non-authoritative © 2015 American Society of Appraisers 2
c. The denominator can use a variety of financial performance metrics on a pretax or after-tax basis such as operating earnings, net income, cash flow; and
d. The analyst must also choose what time period he will draw the denominator’s financial performance metric from, such as trailing 12 months, five-year average, and next year’s expected.
2. The generic market based valuation ratio is:
Price/Benefit which is Benefit
MVE or
Benefit
MVIC
where
MVE is the market value of shareholders’ equity,
MVIC is the market value of invested capital and
Benefit is the appropriate balance sheet or income statement measure (e.g., sales, earnings, book value of equity, etc.)
B. Valuation multiples are considered to be usable if the valuation analyst has good information about companies that are "similar enough" to the appraisal subject and if the engagement is to value the equity or invested capital of the appraisal subject.
C. Once the multiples are derived from the marketplace, they must be adjusted for the differences between the valuation subject and the guideline companies. The multiple that will ultimately be used for the appraisal subject will probably not be exactly the same as that which was derived from the guideline companies.
1. Risk and other characteristics generally play an important part in the process of adjusting the multiples.
2. For example, if the publicly traded guideline companies have price-to-earnings multiples of 15 (assume an incredible coincidence and that all companies were the same), and the closely held company that is being appraised is considered to be more risky, the logical conclusion is that the closely held company would be worth less. Therefore, a lower multiple would be used. This is discussed further in Chapter 12.
D. Following are some of the more commonly used equity multiples:
1. Price to net earnings
2. Price to pretax earnings
3. Price to gross cash flow
4. Price to book value
5. Price to dividend-paying capacity or dividend yield

BV201r v. 6.0 (11/15) Non-authoritative © 2015 American Society of Appraisers 3
E. The price represented in the above multiples is the equity price of the common stock of the public company. This is used when the valuation analyst chooses to value the equity directly.
F. There will be times when the valuation analyst chooses to value the invested capital of the company. This is usually done when there are significant differences in the financial leverage between the subject and guideline companies.
G. When the valuation analyst values invested capital, some of the multiples that are common include:
1. MVIC to revenues
2. MVIC to EBIT
3. MVIC to EBITDA
4. MVIC to debt-free net income (NOPAT)
5. MVIC to tangible book value and debt
H. In these instances, MVIC represents the market value of invested capital, defined as the market value of equity and the market value of debt.
I. Those valuation analysts who value small and medium-sized companies often lose sight of the reason why certain multiples are used rather than others. Comparability is probably the single most important factor in choosing a particular multiple. Sometimes, the choice of multiples depends on the availability of good data. Avoid choosing your favorite multiple and using it in every appraisal. Chances are if you stick with the same multiple all of the time, you will be wrong a good portion of the time.
III. Which Multiples Should Be Used?
A. Price to Net Earnings
1. The appropriate situation for using a price-to-net earnings multiple is
a. when the appraisal subject has relatively high income compared to its depreciation and amortization, or when depreciation represents actual or economic physical wear and tear, and
b. when the appraisal subject has normal tax rates.
c. However, this considers the fact that the depreciation and amortization must be a good representation of the actual wear and tear of the assets, so that replacements are being accounted for properly.
d. If book or tax depreciation is used, rather than economic depreciation, the company may need to replace these assets either more quickly or more slowly than the manner in which depreciation is being recorded.

BV201r v. 6.0 (11/15) Non-authoritative © 2015 American Society of Appraisers 4
e. Capital expenditures can greatly affect the cash flow of the company and, therefore, have an impact on its value. In that case, a cash flow multiple rather than an earnings multiple would be more appropriate.
2. A company with normal tax rates allows comparison to publicly traded guideline company data that is reported on an after-tax basis.
3. If the company has a unique tax structure (S corporation, limited liability corporation, IC DISC, etc. For non-tax people, an IC DISC is an interest charge domestic international sales corporations that does not pay tax. The shareholders are taxed on the income when it is distributed. Enough tax stuff.), better comparability may be achieved by using pretax earnings. Of course, a valuation analyst could also tax-affect the subject company's earnings to make them consistent with those of the guideline companies. Tax-affecting pretax earnings means that a provision for income taxes is subtracted as if the company paid these taxes in the normal course of business.
B. Price to Pretax Earnings
1. A price-to-pretax earnings multiple should be used when the subject company
a. has a relatively high income compared to its depreciation and amortization, or when depreciation represents actual physical wear and tear, but
b. has abnormal tax rates.
c. Once again, the same rules apply for the first two items. Pretax earnings should be used when taxes are different from those of the guideline companies.
d. Many analysts prefer to use pretax earnings for smaller companies since they frequently pay no taxes. Most smaller companies (and professional practices) conduct business in a manner that minimizes taxes, as opposed to maximizing shareholder wealth.
e. Comparing these companies with similar companies or industry composite data (not large public companies) will frequently be more meaningful if it is performed on a pretax basis.
C. Price to Cash Flow
1. A price-to-cash flow multiple is generally used when the appraisal subject has a relatively low level of income compared to its depreciation and amortization, or when depreciation represents a low level of physical, functional, or economic obsolescence.
2. Low levels of physical, functional, or economic depreciation generally mean that the assets will not have to be replaced in the near term. Many profitable businesses go out of business because of insufficient cash flow. On the other hand, many businesses that have high levels of depreciation and amortization are cash machines, generating very high levels of cash for the owners in comparison to low earnings. These are typical situations in which a cash flow multiple makes sense.
3. Many experienced business valuation analysts are of the belief that "cash is king."

BV201r v. 6.0 (11/15) Non-authoritative © 2015 American Society of Appraisers 5
Let's face it, the more cash you have, the more you can buy. Therefore, it seems logical that a great emphasis should be placed on cash flow. In many small companies, there is little difference between cash flow and earnings so either becomes a pretty good surrogate for the other.
D. MVIC to Sales
1. A price-to-sales (really MVIC to sales since this measure is before interest expense is deducted) multiple is generally appropriate in two situations.
a. The first situation is when the appraisal subject is "homogeneous" to the guideline companies in terms of operating expenses.
b. The second situation in which this multiple may be appropriate is when smaller businesses, particularly cash businesses, are appraised.
c. Service companies and companies that are light in tangible assets are considered to be candidates for application of a MVIC-to-sales multiple.
d. Some analysts use a price-to-sales multiple based on an equity price, rather than invested capital, under the theory that there is no major difference between the two. For smaller businesses that do not have the ability to have a lot of debt on their balance sheets, this is probably true. Just keep in mind that whichever you use, the answer needs to make sense.
E. Price to Dividend or Dividend-Paying Capacity
1. A price-to-dividend multiple is probably best utilized when the appraisal subject actually pays dividends.
2. It can also be useful when the company has the ability to pay dividends, even if it does not actually pay them.
3. Of course, dividend-paying capacity can be measured only after the valuation analyst considers the appraisal subject's ability to finance its operations and growth.
4. Revenue Ruling 59-60 tells us to consider "the dividend-paying capacity of the company." But even the Revenue Ruling suggests that this is not as important as the other factors to consider.
5. In a valuation of a minority interest, actual dividends are more important than the dividend-paying capacity, since the minority interest cannot force dividends to be paid.
6. Sometimes you may find that actual dividends paid are disguised as excess compensation.
a. For example, assume you are appraising a 45 percent interest in GRT Corp. The company has two stockholders: one owns 55 percent of the stock, and the interest that you are appraising owns the balance.

BV201r v. 6.0 (11/15) Non-authoritative © 2015 American Society of Appraisers 6
b. Compensation and bonuses are taken in proportion to the stockholdings. The salaries were $55,000 and $45,000, respectively, and the stockholders-officers received bonuses of $110,000 and $90,000.
c. The minority stockholder received a total compensation of $135,000.
d. Some professionals may argue that if the minority interest is truly a minority, the compensation should not be adjusted, since that individual cannot change the policy of the company, nor can he or she force dividends to be paid. However, if you look at the relationship between the two individuals in the above example, you may find that they run the company together, they have been friends and business partners for quite a while, and all major decisions are made jointly. In this situation, you may also find that reasonable compensation--defined as what it would take to replace the individual with someone of sufficient talent, experience, etc. to do the job that is currently being done--will be less than the sum of the salary and the bonus.
e. If reasonable compensation is deemed to be $75,000, a dividend was actually paid ($135,000 - $75,000 = $60,000).
f. In this instance, a multiple of dividends may allow you to value the minority interest directly by using multiples from the public market and adjusting them for risk.
g. Another consideration in determining the dividend-paying capacity for minority shareholder valuations is whether the minority shareholder would be considered "oppressed" under state statutes. Oppression is a legal term, and the valuation analyst should not try to make a determination without input from legal counsel. If a company has the ability to pay dividends but the controlling shareholder refuses to do so, the minority shareholders may have recourse against the controlling shareholder under the oppressed shareholder statute in that jurisdiction. This could result in a mandatory buyout at fair value, or dividends may have to be paid. What all of this means is that a minority shareholder may have legal rights, at the expense of litigation, to force dividends. This could make this multiple feasible even when dividends are not actually being paid.
F. Price to Book Value
1. A price-to-book value multiple may be appropriate when the appraisal subject is in an industry that has a meaningful relationship between the book value and the price of the company's stock. In the determination of the book value, smaller companies would use the sales price of the entire company as the "price" and only those assets that were actually to be sold.
2. The valuation analyst can use return on equity to assist in the adjustment of the price-to-book value ratio to compensate for differences in quality between the company being appraised and the guideline companies being used to assist in the development of the multiple.
G. Valuing Invested Capital Instead of Equity

BV201r v. 6.0 (11/15) Non-authoritative © 2015 American Society of Appraisers 7
1. There may be circumstances in which it makes more sense to value the invested capital of the appraisal subject instead of the equity.
2. One of the questions often posed in a valuation assignment is when to use invested capital methods.
3. If the appraisal subject's capital structure is significantly different from those of the publicly traded guideline companies, consider using an invested capital multiple.
a. For example, if the appraisal subject is highly leveraged (or operating with all equity) but the industry has a very different debt-to-equity relationship, it could make sense to eliminate the effects of leveraging to make a more meaningful comparison. This does not eliminate the financial risk of the subject company. This assumes, however, that the interest being appraised has the ability to change the capital structure of the business. A minority interest does not, and accordingly, the capital structure will generally not be altered in the valuation.
4. When an invested capital method is used, the valuation analyst will determine the value of the company's total invested capital (equity plus debt at market values) rather than just the equity.
5. When a valuation analyst values a company based on the total invested capital, some modifications are generally made during the valuation process. Some of these modifications include the following steps:
a. Add the market value of the publicly traded guideline company's equity (price per share times the number of shares outstanding) to the guideline company's market value of the interest-paying debt. The sum of these two items takes the place of the "price" in the various multiples previously discussed.
b. Interest expense reflected on the income statement is added back to the earnings (or cash flow) used in the denominator of the various multiples. If the valuation analyst is using an after-tax basis, interest expense is added back to earnings or cash flow, net of taxes, since there is a tax benefit that is derived from the deductibility of interest expense.
c. Once an estimate of value has been reached on a total-invested-capital basis, the valuation analyst then deducts the fair market value of the appraisal subject's debt to determine the value of the company's equity.
6. Market multiples are the inverse of capitalization rates and include the market’s assessment of (1) the risk-adjusted cost of capital and (2) the present value weighted expected earnings growth rate.
7. The conventional way of matching the price to the appropriate measure of inflow (i.e., revenues, earnings, cash flows) is to do it based on which providers of capital will be paid with the monies given in the denominator. For example, in price to EBIT, the price concept is market value of invested capital (MVIC). The earnings before interest payments and taxes will have to be paid to both the debt and equity holders.

BV201r v. 6.0 (11/15) Non-authoritative © 2015 American Society of Appraisers 8
8. In price to net income, price is the market value of equity only, since net income is after interest payments to debt holders and represents amounts potentially available to share holders. Another way to view this is any denominators that include interest (e.g., EBIT or EBITDA) must be matched with its corresponding numerator (e.g., MVIC).
IV. Time Period for Financial Operating Metrics (Denominator)
A. The valuation analyst must choose what period of time the financial operating metric will be taken from. There are a number of choices ranging from an average of several years’ history to an estimate of next year’s operations.
1. Latest Twelve Months (LTM)
a. As the name implies, these are the data measured over the last 12 months or the latest four quarters. Balance sheet items are shown for the latest month or quarter and income and cash flow statement items are summed over the last twelve months or four quarters. The advantage of using these data is that the very latest information is being displayed. The disadvantage is that if the latest 12 months’ data are taken from interim financial statements, these statements may lack some of the scrutiny and detail found in the annual statements.
b. Occasionally, the latest 12 months’ data may not be available. The partial year’s income and cash flow statements may then be annualized to represent a full year. For example, if the partial year contains only nine months, the income and cash flow items might be multiplied by 12/9 (1.33) to annualize them. While this may be mathematically sound, it may result in some errors in practice. The errors arise if the business whose numbers are being annualized is highly seasonal. The adjustment given in the preceding example assumes that all months are alike; that is, they contribute the same amount of revenues, profits, etc. However, if you are valuing a retailer with a large Xmas holiday season and you only have information for the nine-month period January-September, simply multiplying these nine months by 1.33 would severely understate annual sales and earnings. When you use the LTM, you do not have this seasonality problem.
2. Last Fiscal Year (LFY)
a. The data from the interim financial statements are not considered; only the data from the latest full year statement are used. The data are as detailed and scrutinized as they are likely to be. Year-end adjusting entries are included in the year-end financial statements, avoiding the mismeasurement of earnings possible when using interim financial statements—for example, inventories and cost of goods sold may not be synchronized until the annual inventory is taken. Seasonality is not a problem either. Timeliness is a concern. The time difference between the valuation date and the annual reporting date can be a year or more. Furthermore, annual reporting dates across companies can vary by up to a year, whereas interim reporting dates are usually only up to three months apart.
3. Projected Next Fiscal Year

BV201r v. 6.0 (11/15) Non-authoritative © 2015 American Society of Appraisers 9
a. Use of projected next fiscal year earnings can be very useful, but it may be difficult to get projections for all GPCs. Many of the public companies which are most comparable to closely held companies are too small to be monitored closely by analysts and projections may not be available. Also, analyst projections which are available for public companies tend to have a sell-side bias.
b. Many appraisers prefer to compute pricing ratios (particularly price/earning) using prospective information. Prospective information is particularly helpful when the most recent year’s earnings are significantly different from the earnings expected in the future, as when there have been recent acquisitions, significant nonrecurring events (for which adjustment is not possible), important technological changes, or substantial changes in market conditions.
4. Historical Averages or Weighted Averages
a. These can be useful for businesses with significant variability in historical earnings, which is expected to continue in the future.
5. Complete Business Cycle
a. The complete business cycle is usually longer than three to five years; it may be as long as 10 years. The advantage of using these measures for a stable company in a stable industry is that the margins and growth rates are probably sustainable over a very long period of time.

BV201r v. 6.0 (11/15) Non-authoritative © 2015 American Society of Appraisers 10
Classroom Assignment M-6: Calculate an Equity and MVIC Multiple
Based on the information provided below for Saia, Inc., calculate the guideline public company’s Price-to-EBT and MVIC-to-EBIT multiples.
In millions (local currency), except per shareTicker SAIA
Name Saia Inc.
Share Price as of 12/31/2011 12.48 Shares Outstanding 16.1 Debt 73 Normalized 2011 EBT 17.5 2011 Interest Expense 10.5
Calculate:
Price-to-EBT Multiple
MVIC-to-EBIT Multiple
GUIDELINE PUBLIC COMPANY METHODCALCULATION OF MULTIPLES EXAMPLE

BV201r v. 6.0 (11/15) Non-authoritative © 2015 American Society of Appraisers 11
Classroom Assignment M-7: GDT Valuation Multiples
Based on the information provided in Handouts 11-2 and 11-3, LTM Multiple Worksheets, choose which multiples to use in this valuation (which multiples, not the size of the multiple).
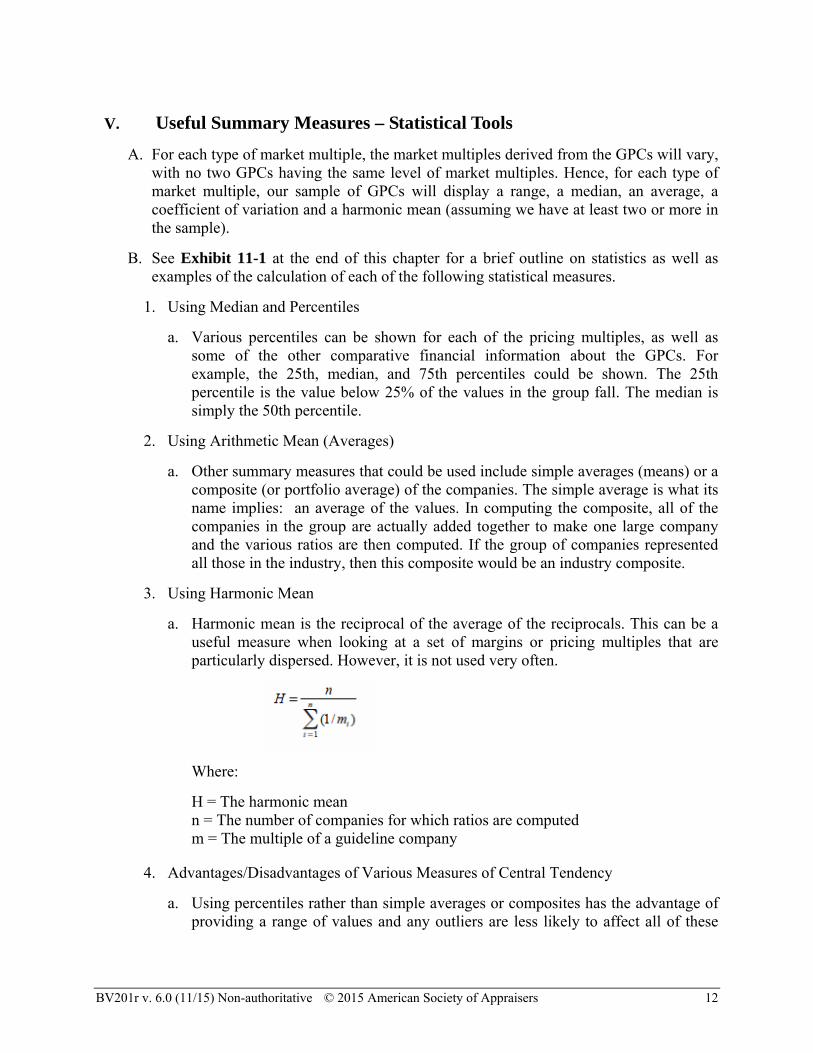
BV201r v. 6.0 (11/15) Non-authoritative © 2015 American Society of Appraisers 12
V. Useful Summary Measures – Statistical Tools
A. For each type of market multiple, the market multiples derived from the GPCs will vary, with no two GPCs having the same level of market multiples. Hence, for each type of market multiple, our sample of GPCs will display a range, a median, an average, a coefficient of variation and a harmonic mean (assuming we have at least two or more in the sample).
B. See Exhibit 11-1 at the end of this chapter for a brief outline on statistics as well as examples of the calculation of each of the following statistical measures.
1. Using Median and Percentiles
a. Various percentiles can be shown for each of the pricing multiples, as well as some of the other comparative financial information about the GPCs. For example, the 25th, median, and 75th percentiles could be shown. The 25th percentile is the value below 25% of the values in the group fall. The median is simply the 50th percentile.
2. Using Arithmetic Mean (Averages)
a. Other summary measures that could be used include simple averages (means) or a composite (or portfolio average) of the companies. The simple average is what its name implies: an average of the values. In computing the composite, all of the companies in the group are actually added together to make one large company and the various ratios are then computed. If the group of companies represented all those in the industry, then this composite would be an industry composite.
3. Using Harmonic Mean
a. Harmonic mean is the reciprocal of the average of the reciprocals. This can be a useful measure when looking at a set of margins or pricing multiples that are particularly dispersed. However, it is not used very often.
Where:
H = The harmonic mean n = The number of companies for which ratios are computed m = The multiple of a guideline company
4. Advantages/Disadvantages of Various Measures of Central Tendency
a. Using percentiles rather than simple averages or composites has the advantage of providing a range of values and any outliers are less likely to affect all of these

BV201r v. 6.0 (11/15) Non-authoritative © 2015 American Society of Appraisers 13
statistics. The average and composite measures may weight the outliers more heavily than appropriate.
b. Outliers may indicate an anomalous situation for the industry or the company (for example, one of the companies in the group might have realized a lawsuit settlement in the latest year. Its profit margins are way above what they would normally be). It should be noted, however, that while outliers may result from anomalies, these apparent anomalies should be examined; they may contain important information about trends in the industry.
5. Coefficient of Variation
a. Another approach that can be used, in conjunction with what was discussed earlier, is to compute the relative dispersions (or, size of the range of values) of the valuation measures. A measure of relative dispersion that is commonly used is the coefficient of variation. This statistic measures the dispersion of the data relative to its average value. It is computed by dividing the standard deviation of the data by their mean (average). The higher the coefficient of variation, the greater the dispersion of the data.
b. Because the coefficient of variation is scaled by the mean, it can be used to compare the dispersions of any data sets, whether or not they are similar in order of magnitude. For example, this statistic can be used to compare the dispersion of revenues to net income, even though revenues are much larger than net incomes. This is why it can be used to compare the dispersions of different valuation measures.
c. Its usefulness in the valuation process can be viewed in this way. If the companies in the guideline group are really viewed similarly by the market, then the key valuation indicator(s) used by the market to price their stocks should be also similar. The coefficient of variation can help the valuator to find this (these) key valuation indicator(s).
VI. GPC Step 4 – Selection of the Appropriate Type of Market Multiples to Use
A. Step four of the GPC method is to select the appropriate market multiples to apply to the subject company. This is a more difficult part of the GPC market method because it involves substantial informed judgment.
B. After all of the hard work of analyzing the subject company, choosing appropriate GPCs, developing a set of information that makes comparison of the companies easier, adjusting the subject’s and GPCs’ financial information for important differences, the appraiser must choose the pricing multiples on which to base his or her conclusion of value.
C. Market multiples (i.e., value indicators) are simply market-derived valuation ratios which express the value of the company relative to some other measure; the price-to-earnings ratio is a standard example of this. The point of using valuation ratios rather

BV201r v. 6.0 (11/15) Non-authoritative © 2015 American Society of Appraisers 14
than outright values is to scale the value by some relevant factor, making comparisons meaningful, irrespective of company size.
D. Choosing the Market Multiple – Industry Practices
1. This is probably the best source of information about which value measures are most important. Usually this can be discerned by reading articles which discuss recent acquisitions. For example, many acquisitions of manufacturers are discussed in terms of P/Es (price-to-earnings ratios) or price to some form of cash flows. In bank acquisitions, market-to-book ratios are very important. In service businesses, prices/sales is the driving ratio. Hospitals are sometimes priced on a revenue per bed basis. It is not unusual for an industry to have more than one key valuation ratio.
E. Choosing Equity vs. Invested Capital Market Multiples
1. Equity multiples are more appropriate when valuing a minority interest and/or when the subject and GPC group have similar capital structures. The application of equity multiples to estimate equity values is:
Subject Subject as Normalized
GPC as Adjusted
MVEEquity Value Benefit
Benefit
2. Invested capital multiples are more appropriate when valuing a control interest and/or there is dissimilarity in capital structure between the subject and the GPC. The application of MVIC to estimate equity values is:
Subject Subject as Normalized Subject at MarketValue
GPC as Adjusted
MVICEquity Value Benefit Debt
Benefit
3. If capital structures are somewhat similar across companies, then the appraiser might use both invested capital and equity multiples.
F. Choosing the Market Multiple – Close Clustering
1. It is always good analytical practice to calculate the various statistics on the sample of GPC companies and their various types of market multiples (the types of multiples X the two types of capital: equity and invested capital). These statistics include such statistics as range, percentiles, median, average, coefficient of variation and harmonic mean.
2. One method of choosing what type of market multiple to use is to observe the range and clustering of the multiples generated by the selected sample of GPCs. A good statistic to use that measures clustering is the coefficient of variation (standard deviation / mean). The smaller this statistic, the closer the data points are to the mean and the smaller the level of dispersion.
G. The inference of closely clustered multiples is that the types of multiples that tend to cluster are the ones investors tend to use to make their buy/sell decisions, and therefore

BV201r v. 6.0 (11/15) Non-authoritative © 2015 American Society of Appraisers 15
are more reliable indications of value.
H. Choosing the Market Multiple – Subject Company Circumstances
1. The appropriate ratios may be dictated by the particular situation of the subject company. For example, if the key valuation ratio for the industry appears to be price-to-earnings (where earnings are net income) and the subject company has not had and is not expected to have positive earnings for the next year or two, valuing it using the standard P/E ratio would result in a nonsensical (negative) value. A better choice might be to use a different definition of earnings or a different valuation measure altogether.
2. Furthermore, if a reading of industry literature does not yield good information on how companies are usually valued, then the owner of the subject company may be an excellent source of guidance.
I. Choosing the Market Multiple – Rules of Thumb
1. While rules of thumb should never be used as the sole way of valuing a business, they frequently embody some good industry knowledge. Most have been developed based on actual transactions. Therefore, they may provide guidance as to the multiples utilized by investors.

BV201r v. 6.0 (11/15) Non-authoritative © 2015 American Society of Appraisers 16
Exhibit 11-1
A Brief Explanation of Statistics and
Examples of the Calculation of Statistical Measures
BV201r v. 6.0 (11/15) Non-authoritative © 2015 American Society of Appraisers 17
Statistics for Valuation
Introduction
An understanding of statistical theory and its application aids business appraisers in analyzing company, industry, and market data.
Statistics are often used to:
Evaluate company performance over time and against some set of peer data
Evaluate the predictability of market multiples and other valuation variables
Central Tendency
Measurements of central tendency
Mean – Also known as the arithmetic mean, the mean is typically what is meant by the word average. The mean is perhaps the most common measure of central tendency. The mean of a variable is given by (the sum of all its values)/(the number of values).
Median – The median is a popular measure of central tendency. It is the 50th percentile of a distribution. To find the median of a number of values, first order them, and then find the observation in the middle: the median of 5, 2, 7, 9, and 4 is 5. (Note that if there is an even number of values, one takes the average of the middle two: the median of 4, 6, 8, and 10 is 7.) The median is often more appropriate than the mean in skewed distributions, or in situations with large outliers.
Mode – The mode is the most common value in a distribution and is the least often used measure of central tendency.
Central tendency in valuation
Common size or absolute dollar averages in financial trend analysis for the subject company, guideline companies and/or peer group data.
Calculation of performance multiple averages of the subject company.
Calculation of market multiple averages of guideline companies and/or peer group data.
Variation
Measures of variation
Range – The range is the simplest measure of variation to find. It is simply the highest value minus the lowest value. Since the range only uses the largest and smallest values, it is greatly affected by extreme values, that is, it is not resistant to change.
Standard deviation – The most commonly reported measure of variability or spread is the standard deviation.

BV201r v. 6.0 (11/15) Non-authoritative © 2015 American Society of Appraisers 18
The standard deviation is also called the root-mean-square deviation, which describes the way it is calculated. First, the deviations from the mean are calculated, then, the deviations are squared. Next, the mean of the deviations is calculated and finally, the square root of the mean is taken to obtain the standard deviation.
What information does the standard deviation convey? When data are approximately normally distributed, approximately 68% of the data lie within one standard deviation of the mean, approximately 95% of the data lie within two standard deviations of the mean, and approximately 99.7% of the data lie within three standard deviations of the mean.
Coefficient of variance – The coefficient of variance is the degree to which a set of data points varies. It is often called the relative standard deviation, since it takes into account the mean (average). The larger this number is, the greater the variability in your data. The coefficient of variance is calculated by dividing the standard deviation by the mean and is typically displayed as a percentage. When assessing precision, the lower the coefficient of variance percentage, the better the precision between replicates.
Graphical representations of central tendency and variation
Normal distributions
mean = 10 (constant) & standard deviation = 1.5
0
0.1
0.2
0.3
0.4
0.5
0.6
0.7
0.8
4 10 16x
dist
ribut
ion
mean = 10 (constant) & standard deviation = 1.0
0
0.1
0.2
0.3
0.4
0.5
0.6
0.7
0.8
4 10 16x
dist
ribut
ion

BV201r v. 6.0 (11/15) Non-authoritative © 2015 American Society of Appraisers 19
All three graphs have the same mean, but the standard deviation (or σ) for the first graph is larger than for the second, and the σ for the third is still smaller than for the first.
Skewed distributions – A distribution is skewed if one tail extends out further than the other. A distribution has positive skew (is skewed to the right) if the tail to the right is longer. A distribution has a negative skew (is skewed to the left) if the tail to the left is longer.
Variance in valuation
Wherever measures of central tendency are applied, measurements of variance help develop an impression of how closely concentrated around the expected value the distribution is; it is a measure of the ‘spread’ of a distribution about its average value. For example, if we calculate the mean and median price/book equity ratio, but find there is a large variance, then the “average” price/book equity ratio may be meaningless as a predictor of value.
Correlation
Regression analysis—Regression analysis is a statistical tool for the investigation of relationships between variables. Usually, one seeks to ascertain the causal effect of one variable upon another—the effect of a price increase upon demand, for example.
Correlation coefficient—A correlation coefficient is a number between -1 and 1 which measures the degree to which two variables are linearly related.
mean = 10 (constant) & standard deviation = 0.5
mean = 10 (constant) & standard deviation = 1.5
0
0.1
0.2
0.3
0.4
0.5
0.6
0.7
0.8
4 10 16x
dist
ribut
ion

BV201r v. 6.0 (11/15) Non-authoritative © 2015 American Society of Appraisers 20
If there is perfect linear relationship with positive slope between the two variables, the correlation coefficient is 1; a positive correlation exists when one variable displaying a high value(on the “X” axis) is shown to be related to a high value in the other variable (on the “Y” axis)—and vice versa.
If there is a perfect linear relationship with negative slope between the two variables, the correlation coefficient is -1; a negative correlation exists whenever one variable displaying a high value (on the “X” axis) is shown to be related to a low value on the “Y” axis—and vice versa.
A correlation coefficient of 0 means that there is no linear relationship between the variables.
Correlation in valuation
Often used to identify relationships between measurable market data and financial data in order to measure the predictive nature of the relationship between the market data and the financial data. For example, if there is a high correlation between the price/earnings ratio of publicly traded companies and the net income of those companies, then the price/earnings ratio may be a good predictor of value.
Regression Results
6.7%
1.0%
9.1%
1.3%
1.9%6.0%
2.3%
0.0
0.2
0.4
0.6
0.8
1.0
1.2
0% 2% 4% 6% 8% 10%
Dependent Variable [EBT/Sales]
Ind
epen
den
t V
aria
ble
[P
rice
/Sal
es]
Series1 Predict ed Mult iple

BV201r v. 6.0 (11/15) Non-authoritative © 2015 American Society of Appraisers 21
Examples of Calculations
Assume that we have two sets of valuation ratios
Set 1 Set 2 11.7 6.1 14.2 11.6 14.7 14.8 15.1 17.2 19.2 34.7 25th Percentile 14.2 11.6 Median 14.7 14.8 Mean 15.0 16.9 Standard Deviation 2.7 10.8 Harmonic Mean 14.6 12.4 Coefficient of Variation 0.2 0.6
Note the differences between the two sets of data. Set 2 has a wider range of data and a much larger coefficient of variation. The medians are about the same, but the mean of Set 2 is much higher and the harmonic mean is much lower.
Calculation of the Mean
The mean for Set 1 is calculated:
0.155
2.191.157.142.147.11
Calculation of the Harmonic Mean
The harmonic mean is calculated:
6.14
52.19
1
1.15
1
7.14
1
2.14
1
7.11
1
1

BV201r v. 6.0 (11/15) Non-authoritative © 2015 American Society of Appraisers 22
Calculation of the Standard Deviation
The standard deviation is calculated as:
7.2
)15(
)0.152.19()0.151.15()0.157.14()0.152.14()0.157.11( 2222
Calculation of the Coefficient of Variation
The coefficient of variation is simply: 2.7/15.0 = 0.2
Calculation of Median and Percentile
The median and 25th percentile are calculated using Microsoft’s “Percentile” function. In using this function, the data are first sorted lowest to highest (as they are above). The lowest and highest values are assumed to be the minimum and maximum of the distribution of values.
The data are then divided into the appropriate percentiles. In this case the data can be thought of as being divided into four buckets: 11.7 to 14.2, 14.2 to 14.7, 14.7 to 15.1, and 15.1 to 19.2. The endpoint of the lowest of the four buckets corresponds to the 25th percentile; in this case the value is 14.2. The middle value is the median and is 14.7.
How Statistics Can Lie
“There are three kinds of lies: lies, damned lies, and statistics.” - Benjamin Disraeli (1804-1881)
Fortunately, the science of statistics has improved dramatically since the former prime minister issued this scathing indictment. Whereas it may be possible to fool some of the people all the time with the improper use of statistics; this course is hardly well advised; any reasonable statistician can destroy arguments made through improper use of statistics, thereby impugning your entire valuation.
Types of misuses
Size matters: the inadequate or “no-data” analysis
The data analyzed must be sufficient in terms of quantity to make the statistical analysis meaningful. The mean and median of a “two data point” sample is the same and any analysis of variance is irrelevant.
Statistics are used to provide condensed information on the data set of samples; when the dataset is small, the appraiser is well advised to present the data directly and forthrightly.
Simply because data sets are small does not mean they do not have value in analysis. As business appraisers, as long as we recognize that a small dataset available is typically a haphazard sample of a larger population, we can use it to our (limited) advantage. In short, some data points are better than none, and far better than having a few and not presenting them.

BV201r v. 6.0 (11/15) Non-authoritative © 2015 American Society of Appraisers 23
The touchstone is simply to be careful about the conclusions you draw, even from rather robust datasets that may not be derived from representative probability sampling of the universe of interest. To the degree that you observed very low variance in your sample, allow yourself the luxury of some further inquiry as to why that variance might be low – is there a sample bias in the data?
The assumption of representativeness
A common mistake is to assume a higher level of representation in the dataset than is actually resident. For example, we might be tempted to assume that valuation multiples drawn from transactions involving adult health centers in California and New York are representative of the population of adult health centers. Nothing could be further from the truth; adult health centers in California and New York have exceptionally rich reimbursement schemes making them attractive acquisition candidates. This leads to an inherent (upward) bias in your sample. If you are valuing an adult health center in Alabama, the transaction data that may well be misleading to the point of uselessness.
Unless you are with able to exhibit equal-probability-of-selection sampling that underpins the representation of the data set you are using, you have an inherent problem that your data may not be representative of the larger population you wish to study.
The argument that “I used all the data points available” simply isn’t good enough, because in most cases, firm transactions occur based on non-random trigger events. In the simplest example, sales multiples for Internet companies were dramatically higher in the five years preceding 2000 than in later five years. Most of us would not fall prey to the temptation to merge these data and assume these data representative of a hypothetical transaction today, but the same problem exists in virtually every dataset. Exogenous forces, different situations and conditions, and an inherently non-representative sample of data points are the “facts of life” of a business appraiser; in using data, the business appraiser must consider the “facts and circumstances” that underpin that data.
The assumption of homogeneity
Another common mistake is to assume that there is a high level of homogeneity embedded within samples of ostensibly similar objects, such as firms. In some cases, this might be true, but in most cases, it simply is not true. The classic “business appraiser paradigm” is that firms of similar size, earnings and growth in an industry are therefore similar and the variance is attributable to value drivers and management. This paradigm, while useful, tends to lead us towards an assumption of homogeneity that may in fact not exist. For example, not all Chinese restaurants in the local area are the same – some are upscale dining establishments, where others are simply takeout restaurants. They may exhibit similar characteristics in measures of size and performance, but may be driven by different underlying dynamics; the low-end establishments driven by an influx of Chinese immigrants, and high-end establishments driven by wealth effects in the non-Chinese population. To that end, we watched an upscale Chinese restaurant of average performance double in profitability after switching owners; the new owners targeted the immigrant Chinese population with “home cooking”. The business rapidly morphed from an upscale dining establishment to essentially a catering organization providing daily food to the busy Chinese immigrant community.
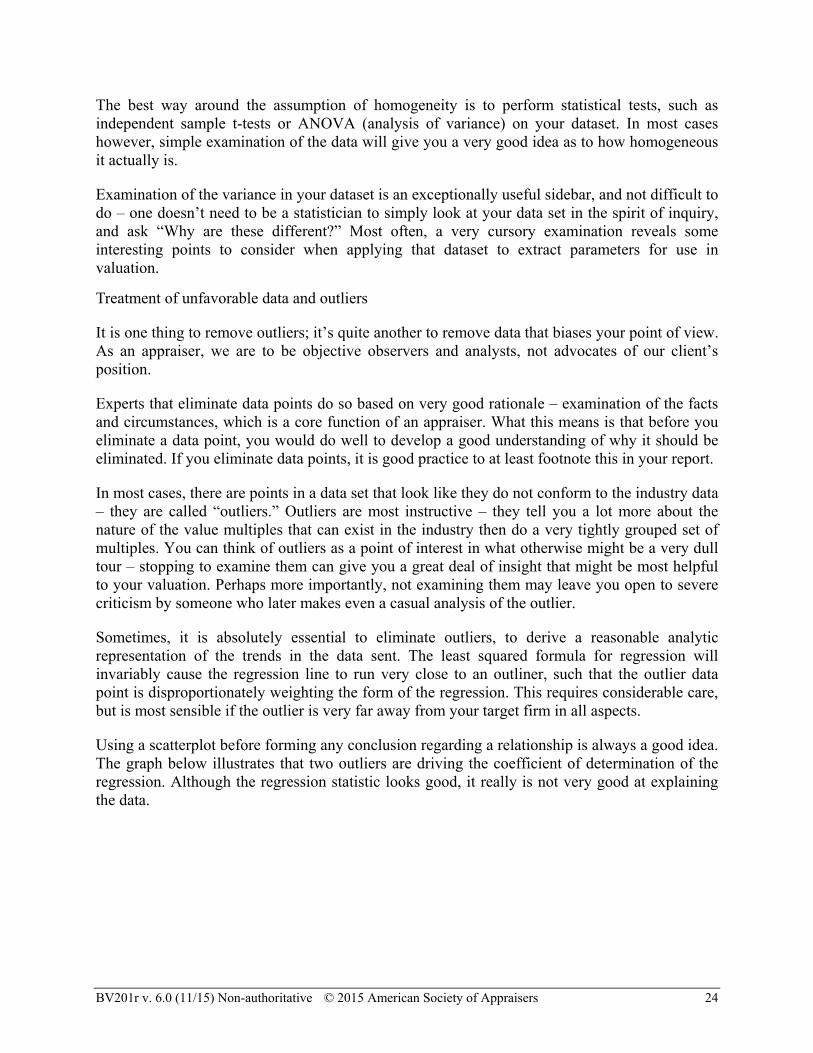
BV201r v. 6.0 (11/15) Non-authoritative © 2015 American Society of Appraisers 24
The best way around the assumption of homogeneity is to perform statistical tests, such as independent sample t-tests or ANOVA (analysis of variance) on your dataset. In most cases however, simple examination of the data will give you a very good idea as to how homogeneous it actually is.
Examination of the variance in your dataset is an exceptionally useful sidebar, and not difficult to do – one doesn’t need to be a statistician to simply look at your data set in the spirit of inquiry, and ask “Why are these different?” Most often, a very cursory examination reveals some interesting points to consider when applying that dataset to extract parameters for use in valuation.
Treatment of unfavorable data and outliers
It is one thing to remove outliers; it’s quite another to remove data that biases your point of view. As an appraiser, we are to be objective observers and analysts, not advocates of our client’s position.
Experts that eliminate data points do so based on very good rationale – examination of the facts and circumstances, which is a core function of an appraiser. What this means is that before you eliminate a data point, you would do well to develop a good understanding of why it should be eliminated. If you eliminate data points, it is good practice to at least footnote this in your report.
In most cases, there are points in a data set that look like they do not conform to the industry data – they are called “outliers.” Outliers are most instructive – they tell you a lot more about the nature of the value multiples that can exist in the industry then do a very tightly grouped set of multiples. You can think of outliers as a point of interest in what otherwise might be a very dull tour – stopping to examine them can give you a great deal of insight that might be most helpful to your valuation. Perhaps more importantly, not examining them may leave you open to severe criticism by someone who later makes even a casual analysis of the outlier.
Sometimes, it is absolutely essential to eliminate outliers, to derive a reasonable analytic representation of the trends in the data sent. The least squared formula for regression will invariably cause the regression line to run very close to an outliner, such that the outlier data point is disproportionately weighting the form of the regression. This requires considerable care, but is most sensible if the outlier is very far away from your target firm in all aspects.
Using a scatterplot before forming any conclusion regarding a relationship is always a good idea. The graph below illustrates that two outliers are driving the coefficient of determination of the regression. Although the regression statistic looks good, it really is not very good at explaining the data.

BV201r v. 6.0 (11/15) Non-authoritative © 2015 American Society of Appraisers 25
Price Versus Sales in Insurance Agencies
y = 0.8592x - 275.08
R2 = 0.7883
-
1,000
2,000
3,000
4,000
5,000
6,000
7,000
8,000
9,000
- 2,000 4,000 6,000 8,000 10,000 12,000
Sales
Pri
ce
The whole point of this graph is to show that it is always useful to take a common-sense look at the data and information you will be using.
The well-chosen representative statistic of central tendency
Normally we use some statistic of central tendency—mean (average), median, or mode—to describe the distribution of values. Which one you choose depends highly on the form of the distribution of values in the dataset. In some cases, the mean (arithmetic average) of all samples is used. More useful are typically the median (the middle value in a ranked series) or mode (the most frequent value in a series). If the distribution of a population or its sample is bell-shaped (i.e., normally distributed), then you need not be concerned about the source of the average because the mean, median, and mode will be approximately equal to one another. On the other hand, most business statistics such as market multiples often skew from a normal distribution. (The most common distribution of business statistics is the log-normal distribution.) Reporting the median generally provides a more accurate assessment of the population.
Sometimes, you have distributions of binomials – variables that can take only one state or another. In that case, the mean (average) of the sample might be worthwhile to present, but this is done in the context of what percentage of the population exhibits a particular trait (e.g., subchapter S status).
The naked statistic and measures of variability
An average value without a measure of the variability in a distribution or the degree of significance is a “naked” statistic. Assume you calculate the mean price to earnings ratio and price to revenue ratio for a group of guideline companies. Which one is the better indicator of value? Without additional analysis, you cannot tell.
Measures of variability in your dataset of statistics are critical; typically the variance, standard deviation, or coefficient of variation is used. The problem is that if your distribution varies from a normal (i.e., bell-shaped) curve, these measures are a bit less useful than they would be if you had a normal distribution. Since most business variables do not occur as normal distributions, the central limit theorem is helpful to describe the limits of the central tendency.
The gee-whiz graph
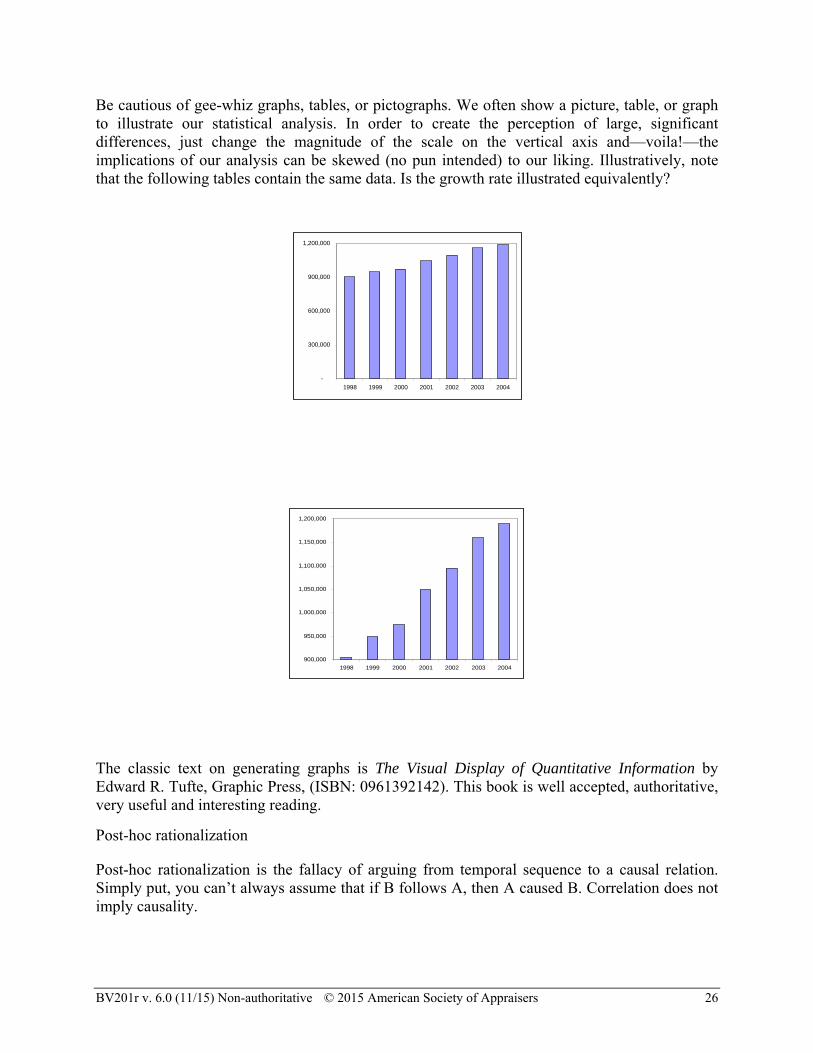
BV201r v. 6.0 (11/15) Non-authoritative © 2015 American Society of Appraisers 26
Be cautious of gee-whiz graphs, tables, or pictographs. We often show a picture, table, or graph to illustrate our statistical analysis. In order to create the perception of large, significant differences, just change the magnitude of the scale on the vertical axis and—voila!—the implications of our analysis can be skewed (no pun intended) to our liking. Illustratively, note that the following tables contain the same data. Is the growth rate illustrated equivalently?
The classic text on generating graphs is The Visual Display of Quantitative Information by Edward R. Tufte, Graphic Press, (ISBN: 0961392142). This book is well accepted, authoritative, very useful and interesting reading.
Post-hoc rationalization
Post-hoc rationalization is the fallacy of arguing from temporal sequence to a causal relation. Simply put, you can’t always assume that if B follows A, then A caused B. Correlation does not imply causality.
900,000
950,000
1,000,000
1,050,000
1,100,000
1,150,000
1,200,000
1998 1999 2000 2001 2002 2003 2004
-
300,000
600,000
900,000
1,200,000
1998 1999 2000 2001 2002 2003 2004

BV201r v. 6.0 (11/15) Non-authoritative © 2015 American Society of Appraisers 27
We all are tempted to squeeze as much as we can from limited data. The problem with small datasets that we invariably use is that correlations occur that appear very strong, yet they are not borne out when tested against a larger sample. This is the nature of small datasets, yet we are all tempted to rely upon these correlations and make something out of them, which can be very embarrassing.
There exists a bootstrapping technique for testing these correlations statistically within a small dataset. If a particular correlation you observe in a small dataset is absolutely central to your conclusion of value, we recommend that you use a bootstrapping technique to verify your correlation or test your correlation on a larger sample. This recommendation is purely the responsible use of statistics; if you aren’t comfortable doing this alone, a statistician can easily do it for you.
How to statisticulate
The act of misleading people through the use of statistics has been referred to as “statisticulation.” Some of the more common ways to statisticulate include: 1) the use of means when medians are more appropriate; 2) misuse of significant figures, e.g., on average, I sleep 6.35 hours per night (who keeps track of sleep beyond the precision of about the nearest half-hour?); 3) improper use of percentages, e.g., “there’s a 50% chance of rain on Saturday and the same on Sunday, so don’t make any plans for this weekend because there’s a 100% chance of rain.”
The general recommendation here is, “Don’t make hokum out of statistics.” This field is very well understood, highly developed, and there are excellent experts available everywhere.
The semi-attached statistic
The last, but certainly the most important method of abusing or misusing statistics is the semi-attached statistic. Use of semi-attached statistics (or information) is perhaps the principal reason why bad statistics and snake oils have thrived. Subscribers to this philosophy believe that “if you can’t prove what you want to prove, demonstrate something else and pretend they are the same thing.” Somewhere buried in the semi-attached statistic is usually a trace of truth or fact, but the rest is a whole lot of fluff. Thus, it is very difficult to pin a “lie” on a semi-attached statistic.
In his book titled Damned Lies and Statistics, author Joel Best describes four personalities in regard to how people cope with statistics.
The awestruck understand very little about statistics, but that’s of no real concern to them because statistics have magical powers, just like the products they use.
The naïve have a little more understanding of statistics, but are basically accepting of what they are told.
The cynical are very suspicious of statistics, in general, except when it comes to those that support their own beliefs. Overall, they don’t trust in numbers and feel that “you can prove anything with statistics.”

BV201r v. 6.0 (11/15) Non-authoritative © 2015 American Society of Appraisers 28
Finally, the critical take a more thoughtful approach to statistics that avoids the extremes of naïve acceptance and cynical rejection. The critical ask important questions such as “Who is the source and how do they know? How were the statistics produced? Where is the measure of variability or degree of significance? Is the statistic being properly interpreted?” Most importantly, they ask, “Does it make sense?”

BV201r v. 6.0 (11/15) Non-authoritative © 2015 American Society of Appraisers 29
Handout 11-1
Solution to Classroom Assignment M-6

BV201r v. 6.0 (11/15) Non-authoritative © 2015 American Society of Appraisers 30
Handout 11-2
LTM Equity Multiple Worksheet
BV201r v. 6.0 (11/15) Non-authoritative © 2015 American Society of Appraisers 31
Handout 11-3
LTM MVIC Multiple Worksheet

BV201r v. 6.0 (11/15) Non-authoritative © 2015 American Society of Appraisers 32
Handout 11-4
Solution to M-7 – Selection of Multiples

Chapter 12. GPC Steps 5-6 BV201: Introduction to Business Valuation
BV201r v. 6.0 (11/15) Non-authoritative © 2015 American Society of Appraisers 1
Chapter 12. GPC Steps 5-6 – Compare and Adjust GPC Multiples
I. GPC Step 5 - Comparative Analysis Between Subject Company and GPCs
A. In step five of the GPC method, the appraiser compares the qualitative and quantitative characteristics of the subject company with the characteristics of the guideline companies. Analytical tools include:
1. Qualitative SWOT analysis (strengths, weaknesses, opportunities, threats); and
2. Financial performance analysis (financial ratios, trends, comparison to industry peer groups, etc.).
B. The key factors for comparison are the assessment of relative risk and relative growth differences so that the analyst can adjust the market multiples to the appropriate level to be applied to the subject company. After these adjustments, the market multiples properly reflect the subject’s risk profile and investment outlook relative to the risk profile and investment outlook of the selected guideline companies.
II. Comparative Qualitative Factors to Consider
A. The valuator’s objective is to identify the relevant qualitative factors which differ from the GPCs and will materially affect the value of the subject company. The appraiser must also identify how these relative differences will impact value.
B. These qualitative differences will most likely relate to such factors as expected growth and the risks attributable to the appraisal subject that are different from those of the guideline companies.
C. Different risk factors considered by the valuation analyst will generally include, but will not be limited to, the following:
1. Economic risk
2. Business risk
3. Operating risk
4. Financial risk
5. Asset risk
6. Product risk
7. Market risk
8. Technological risk
9. Regulatory risk
10. Legal risk

Chapter 12. GPC Steps 5-6 BV201: Introduction to Business Valuation
BV201r v. 6.0 (11/15) Non-authoritative © 2015 American Society of Appraisers 2
D. There are many other risk factors to be considered as well, but these are some of the more important items that a valuation analyst must think about in the application of not only the market approach, but also the income approach. Each of these risk factors should be analyzed from the point of view of how the appraisal subject differs from the guideline companies. Most of the information about risk will be obtained from sources other than the financial statements.
E. Economic Risk
1. Economic risk is analyzed as part of the economic analysis performed by the valuation analyst. Revenue Ruling 59-60 suggests that consideration be given to "the economic outlook in general and the condition and outlook of the specific industry in particular." The valuation analyst must determine how the subject company will be affected by changes in the economic environment in which it operates. Economic conditions at the valuation date and how they affect the company must also be considered.
2. For example, if you were appraising an automobile dealership, consideration would have to be given to the impact that interest rates have on auto loans. If the economic forecast was that interest rates were expected to go up, one would think that car sales may be affected if people could not afford to borrow at the higher rates. However, the dealership may experience an increase in its service revenues since people may keep their cars for a longer period, requiring more maintenance.
3. To the extent that the guideline companies selected are good "comparables," economic risk will be incorporated in the pricing multiples. The adjustments to be made will more likely compensate for differences between the guideline company and the appraisal subject that are due to factors such as regional or local economic risk. The appraisal subject may operate in an area that is different from that of the guideline companies.
F. Business Risk
1. Business risk involves the analysis of the appraisal subject's business. Once again, we are interested in how the subject company differs from the guideline companies. The valuation analyst analyzes the company in terms of the risk associated with factors such as sales volatility and the volatility of the company's growth. If a company has revenues that fluctuate widely, a greater risk exists than if the company is somewhat stable. Volatile growth is obviously a greater risk as well, when you consider the cash flow needs of a growing company. If growth is volatile, it may be difficult for the company to raise the necessary capital to foster that growth. The banks may be reluctant to lend money to a company that may not be able to repay its debt next year if a reversing trend takes place.
G. Operating Risk
1. The operating risks associated with a business include such factors as the fixed versus variable cost structure of the appraisal subject. The valuation analyst must analyze the cost structure of the appraisal subject to determine how much risk the company is

Chapter 12. GPC Steps 5-6 BV201: Introduction to Business Valuation
BV201r v. 6.0 (11/15) Non-authoritative © 2015 American Society of Appraisers 3
exposed to as a result of the commitments and costs associated with the business operations. If a company has a high level of fixed costs, that may not bode well in times when revenues decrease. Obviously, if two companies are the same except that one company has higher fixed costs than the other, the company with the higher level of fixed costs would be considered to be more risky and, therefore, worth less.
H. Financial Risk
1. The financial risks associated with a company pertain to the amount of leverage the company uses and the company's ability to cover its debt payments. The valuation analyst must pay particular attention to the capital structure of similar companies to analyze the appraisal subject. Companies that are heavily leveraged can find themselves in trouble when a recession hits. To determine the level of risk of the appraisal subject, different debt structures should be analyzed when one performs the appraisal.
2. Proper capital structure plays an important part in the financial success of a business. Companies that are overcapitalized or undercapitalized are not necessarily "comparable" to companies that have a normal capital structure. A normal capital structure is one that is similar to that of other companies in the same industry. If the appraisal subject is heavily leveraged, the valuation analyst may want to consider using an invested capital approach using EBIT or EBITDA in the pricing multiples.
3. In many instances, smaller companies that are heavily indebted are structured in that manner as a result of the owner of the business choosing to finance his or her excess salary and perqs, and therefore, the interest and the liability should be treated as a non-operating item, since they do not affect the business operations of the company.
I. Asset Risk
1. Asset risk relates to the age and condition of the company's assets. Older assets represent a higher degree of risk for a company in terms of higher maintenance costs, a lower level of productivity, and functional and technological differences in available production. Not only do these items increase the level of expenditures for the company, but the future cash flow needs may also be greater due to replacement needs, which further increases the risk of the enterprise.
J. Product Risk
1. Product risk relates to a company that has little diversification in its product line or has a product line that may become extinct with the introduction of a newer product by a different company. An example of this is the effect that the iPod had on the Walkman.
K. Market Risk
1. Market risk relates to how geographically diversified the company is. If the company operates within a local marketplace, it can be greatly affected by changes in that local area. A more diversified market reduces the risk associated with a company.

Chapter 12. GPC Steps 5-6 BV201: Introduction to Business Valuation
BV201r v. 6.0 (11/15) Non-authoritative © 2015 American Society of Appraisers 4
2. An illustration of market risk is a local restaurant that operates in a community that is dependent on a military base for business. If the government decides to close the military base, what do you think will happen to the restaurant's business?
L. Technological Risk
1. New technology can adversely affect a company if it does not have the ability to keep up with other companies in the appraisal subject's industry.
2. For example, a company that is unable to automate its factory would be at a competitive disadvantage, which increases the risk of the company.
M. Regulatory Risk
1. Regulatory agencies can also adversely affect a business. Environmental regulations are probably one of the best examples of the risks that a company faces. A chemical manufacturing company can be put out of business in a very short time by the Department of Environmental Protection. This increased risk will generally cause a willing buyer to pay less for a business, since he or she must be able to generate a faster return on the investment to compensate for the possible impact of new regulations. Obviously, only those regulations that can be reasonably forecast can be considered in this analysis. Do not forget about possible cleanup costs if a problem is discovered. A valuation analyst may not be able to quantify these costs, but the increased risk will affect market multiples, discount rates, and capitalization rates.
N. Legal Risk
1. The cost of litigation in today's society can mean the end of any successful business. Even if successful, litigation can create such a financial burden on a business that it can be greatly exposed to the risk of being put out of business. Product liability claims, employee discrimination claims, antitrust litigation, and a host of other types of claims will, at times, significantly affect the value of a business enterprise by affecting future margins, capital expenditures, etc., but if these are industry wide, market prices may have already taken these issues into account.
O. Value relative to the GPCs is lowered by differences in qualitative factors that increase risk or decrease the outlook for growth. Value relative to the GPCs is raised by differences that decrease risk or increase the outlook for growth.
III. Comparative Quantitative Financial Performance Factors to Consider
A. The purpose of comparative financial analysis is to compare the financial performance of the GPCs to each other and to the financial performance of the subject company. This process assists the appraiser to identify the fundamental determinants of value which differ significantly from the industry norms and therefore will have either a positive or negative impact on value. There are two basic types of comparative financial analysis:
1. Trend analysis (comparison of the company to itself over time)
2. Peer analysis (comparison to similar companies over time)

Chapter 12. GPC Steps 5-6 BV201: Introduction to Business Valuation
BV201r v. 6.0 (11/15) Non-authoritative © 2015 American Society of Appraisers 5
B. Objectives of Comparative Financial Analysis
1. As in the analysis of qualitative factors, the key quantitative factors are the assessment of relative risk and relative growth differences. This analysis enables the valuator to adjust market multiples to the appropriate level, reflecting the relative risk profile and investment outlook of the subject compared with the risk profile and investment outlook of the GPCs.
2. It is much better to have a small number of useful pieces of information than to have pages and pages of detail; therefore the valuator must identify those financial concepts that will help him determine comparability and value.
3. The steps in this process include:
a. Identify key differences between the subject and the guideline group
b. Identify differences within the GPCs themselves
c. Discover if any single GPC or subset of GPCs is more comparable to the subject than the group overall
d. Provide support for the selection of each multiple, whether it is a mean, median, or something other than a central tendency measurement
4. Measures of Financial Performance
a. Comparative analysis should include the following types of information for both the GPCs and the subject; everything should be on the same basis for easy comparison. The concepts chosen will be a function of the industry in which the company operates, but they should include:
(i) Size Measures – Size measures include nominal sales, total assets, market capitalization, and total invested capital.
(a) As discussed extensively in BV202 (The Income Approach), size matters. In general, the larger the enterprise, the lower its cost of capital (i.e., discount rate) and therefore the higher its market capitalization multiples.
(i) Measures of Historical Growth Rates – One of the most important determinants of value is growth - growth in sales, income, cash flows or dividends. One issue that must be addressed, and often is not, is how this growth is calculated. Oftentimes investors will use past growth rates, year-to-year, or in a compound annual growth rate between two periods, as a guide to future expectations.
(a) When comparing companies, higher growth rates tend to increase value since they lower the capitalization rate (k - g) and therefore increase the market capitalization multiple. However, volatility of growth rates generates uncertainty regarding future returns and therefore tends to increase investment risk and reduce value.

Chapter 12. GPC Steps 5-6 BV201: Introduction to Business Valuation
BV201r v. 6.0 (11/15) Non-authoritative © 2015 American Society of Appraisers 6
(ii) Profit Margins – Measured as the common size percentage ratio of profits to sales, this “bottom line” traditionally is defined as net income after tax, though other measures of profitability such as gross profit and operating profit are also important to consider. In addition, measures of profitability differ depending upon whether invested capital or equity is being valued. Both the current period’s margins as well as average margins over a longer period of time (e.g., five years) should be included in the analysis.
Examples of profitability ratios:
Profitability for Equity Profitability for Invested Capital Gross Profit / Sales Gross Profit / Sales Operating Profit / Sales Operating Profit / Sales Pre-tax Income / Sales EBIT / Sales ~~~ EBITDA Cash Flow (pre-tax) /Sales NIAT / Sales NOPAT / Sales Gross Cash Flow / Sales ~~~~
(iii)Profit measures such as EBIT or EBITDA can be useful because they tend to reflect the economics of business operations better than net income and gross cash flow. Net income and gross cash flow are measures of returns to equity capital and are influenced by both the company’s tax planning and its choice of capital structure.
(a) When comparing companies, higher profit margins allow more room to adjust to changing market conditions before going into the red. Hence, returns are less risky and market multiples will be higher. However, volatility of profit margins, as with volatility in sales, generates uncertainty regarding future returns and therefore tends to increase investment risk and reduce value. Finally, net profitability is one of the components of the DuPont return on equity, and the higher that ratio, the higher the ROE.
b. Measures of Asset Management and Reinvestment – This directly addresses the need for an enterprise to manage and invest in its asset base. The investment in the productive assets of the enterprise includes not only reinvestment to replace capital consumed but new investment to fund growth.
(i) When comparing companies, higher “asset turnover ratios” indicate more efficient use of productive capital to generate sales activity. This in turn indicates that such efficiency will allow the enterprise to generate more free cash flow (i.e., dividend-paying capacity). Finally, total asset turnover is one of the components of the DuPont return on equity, and the higher that ratio, the higher the ROE.
Chapter 12. GPC Steps 5-6 BV201: Introduction to Business Valuation
BV201r v. 6.0 (11/15) Non-authoritative © 2015 American Society of Appraisers 7
c. Measures of Financial Leverage, Solvency and Liquidity – These ratios measure the utilization of “financial leverage” or the use of debt in the financial capital structure of the right-hand side of the balance sheet.
(i) The most common measures for financial leverage are the values of outstanding total debt, preferred stock (if it exists), and the market value of common equity. Book equity generally has very little to do with how stock investors view their relative position with a company. The ratio of debt to market value of equity should also be included; this is the true leverage of the company. It should be noted that the debt number shown in this section of the report should be its market value; however, on a practical basis, very few valuators estimate this and simply use the book value of the debt.
(ii) Measures of company solvency and liquidity generally provide a short-term perspective on how able the enterprise is able to meet its debt servicing requirements.
(iii)When comparing companies, higher leverage is good up to the point that the firm becomes over leveraged (i.e., when the solvency and liquidity ratios fall into the danger zone—see the Altman Z score measure of bankruptcy risk as a comprehensive measure of a firm’s financial risk). Higher leverage can be good because it is one of the components of the DuPont return on equity, and the higher that ratio, the higher the ROE. High debt, however, is more risky.
d. Measures of Returns on Investment – These financial ratios measure the productivity of the productive asset base in terms of its ability to provide a return on the financial capital. For equity capital, this productivity is the result of a combination of profitability, asset utilization and financial leverage (three determinants of value).
(i) When comparing companies, higher ROE or ROIC is good. It indicates the firm is better managing profitability, reinvestment and its financial capital.
e. Other Financial Performance Measures – Use of other measures of financial performance will be a function of what is important in the industry in which the subject company operates. For example, retailers are interested in inventory turnover, banks in loan/deposit ratios, and hospitals in revenue per bed. Sometimes ratios from industry surveys may be incorporated.
5. Questions to Ask When Researching and Analyzing GPCs
a. When researching the guideline companies and analyzing their financial performance on a comparative basis with the subject company, the appraiser should consider the following questions:
(i) Which ratios or benchmarks are most relevant for the subject company and its industry? Why?
(ii) Is there uniformity among the ratios within the guideline group?

Chapter 12. GPC Steps 5-6 BV201: Introduction to Business Valuation
BV201r v. 6.0 (11/15) Non-authoritative © 2015 American Society of Appraisers 8
(iii)Is there a variance between the average ratios within the guideline group and the averages expressed in the industry survey?
(iv) As a result of the financial analysis, can any of the GPCs be discarded?
(v) Are any of the GPCs more similar to the subject company?
(vi) Are there any upward or downward trends in any of the ratios?
(vii) What information from the economic and industry research can explain the financial performance of the GPC ratios?
(viii) Is there a trend in the implied growth rates in the market multiples?
(ix) How does that implied growth rate compare to the growth rate that was used in the income approach?
(x) What are the key differences in risk between the GPCs and the subject?
(xi) What are the key differences in growth prospects between the GPCs and the subject?
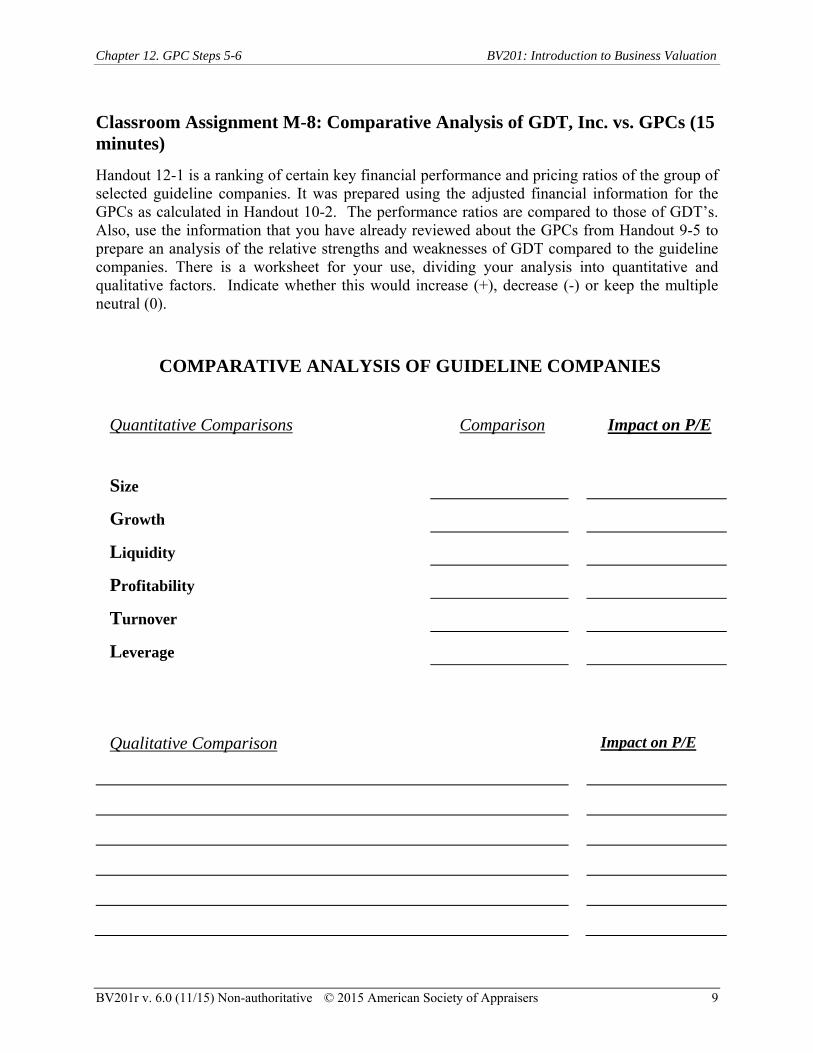
Chapter 12. GPC Steps 5-6 BV201: Introduction to Business Valuation
BV201r v. 6.0 (11/15) Non-authoritative © 2015 American Society of Appraisers 9
Classroom Assignment M-8: Comparative Analysis of GDT, Inc. vs. GPCs (15 minutes)
Handout 12-1 is a ranking of certain key financial performance and pricing ratios of the group of selected guideline companies. It was prepared using the adjusted financial information for the GPCs as calculated in Handout 10-2. The performance ratios are compared to those of GDT’s. Also, use the information that you have already reviewed about the GPCs from Handout 9-5 to prepare an analysis of the relative strengths and weaknesses of GDT compared to the guideline companies. There is a worksheet for your use, dividing your analysis into quantitative and qualitative factors. Indicate whether this would increase (+), decrease (-) or keep the multiple neutral (0).
COMPARATIVE ANALYSIS OF GUIDELINE COMPANIES
Quantitative Comparisons Comparison Impact on P/E
Size
Growth
Liquidity
Profitability
Turnover
Leverage
Qualitative Comparison Impact on P/E

Chapter 12. GPC Steps 5-6 BV201: Introduction to Business Valuation
BV201r v. 6.0 (11/15) Non-authoritative © 2015 American Society of Appraisers 10
IV. GPC Step 6 – Adjusting the GPC Market Multiples – the Key Step
A. Step six of the GPC method is the adjustment of the GPC multiples before applying them to the subject company to calculate initial indications of value. The adjustment of the market multiples is the key valuation judgment the appraiser must make in the market methods.
B. A sound understanding of the valuation theory underlying the GPC method is absolutely a prerequisite to performing this appraisal methodology in a correct manner. The key concept underlying the GPC is the recognition that market multiples are essentially the inverse of capitalization rates. Hence, embedded within each market multiple is the investment market’s estimate of both a risk-adjusted cost of capital and a present-value-weighted expected growth in the value of the investment (i.e., both k and g).
1. Should the 25th percentile, median, 90th percentile, average, harmonic mean, etc., multiple be chosen? This must be based on comparison of the subject company to the GPCs. Presumably the stronger the subject company relative to the GPCs, the greater the value and, maybe the higher the pricing multiple.
2. Be careful not to double-count. Examples:
a. Using a lower pricing multiple to account for the small size of the subject company when the multiples have already been adjusted for size
b. Using a higher multiple to account for high growth of the subject when the multiples have been adjusted for growth
c. Using a high price/earnings multiple to account for the subject’s higher than average profitability (the advantage of the higher profitability is captured by using an earnings-based pricing multiple)
3. Don’t simply use the average or median. Analysis must accompany any conclusion.
C. Market Multiples Are Capitalization Factors
1. The freely traded market values that we observe in the capital marketplace represent the market’s auction pricing of each GPC’s expected future financial performance. As discussed in Chapter 8, a market multiple or valuation ratio is, in essence, a capitalization multiple—the inverse of a capitalization rate.
2. ASA’s BV Standards Glossary defines capitalization factor as any multiple or divisor used to convert anticipated economic benefits of a single period into value. Therefore, market multiples are capitalization factors and are the inverse of capitalization rates.
Chapter 12. GPC Steps 5-6 BV201: Introduction to Business Valuation
BV201r v. 6.0 (11/15) Non-authoritative © 2015 American Society of Appraisers 11
1
( )
Market PriceMarket Multiple
Operating Performance k g
Where: k = Risk and benefit adjusted required rate of return g = Present value weighted perpetual growth rate
D. Crucial Comparative Issues Are Relative Risk and Relative Growth
1. Since market multiples are the inverse of capitalization rates, then the crucial issues for comparison between the subject company and the GPCs are the assessment of relative risk (k) and relative growth (g) differences. Therefore, the appraiser’s task is to choose the appropriate level of the valuation multiple to apply to the subject company that properly reflects its risk profile and investment outlook relative to the risk profile and investment outlook of the sample of guideline companies.
V. Qualitative and Quantitative Techniques for Adjusting Market Multiples
A. In choosing the appropriate level of the valuation multiple (i.e., adjusting the market multiple) for the subject company, we consider the qualitative and quantitative differences between the guideline companies and the subject company.
1. Qualitative Basis for Market Multiple Adjustments
a. Generally speaking, if the outlook for the subject company relative to the GPCs is for less risk and/or more growth, we will choose a multiple somewhat higher than the median. If the outlook is for average risk and/or future growth, we will choose a multiple at the median. And, if the outlook is for higher risk and/or lower growth, we will choose a multiple below the median.
b. Most valuation analysts use informed judgment when making their choice as to the amount of adjustment they apply to the GPC market multiples. This is just another way of saying that their choice is made on a qualitative basis. There is nothing wrong with this methodology, but there are some quantitative techniques that add precision to the direction and amount of market multiple adjustments.
2. Quantitative Models for Market Multiple Adjustments
a. There are several models that quantify market multiple adjustments. These models involve the following:
(i) Adjusting the multiples based upon an analysis of the correlation of changes in a financial performance metric and changes in the market multiples,
(ii) Adjusting the multiples for differences in size or other risk factors, and

Chapter 12. GPC Steps 5-6 BV201: Introduction to Business Valuation
BV201r v. 6.0 (11/15) Non-authoritative © 2015 American Society of Appraisers 12
(iii) Adjusting the multiples for differences in the outlook for growth.
(a) Observations on a correlation relationship can provide direct methods of quantifying market multiple adjustments. This type of adjustment is especially useful for adjusting book and sales multiples.
(b) On a more theoretical basis, the adjustments for growth and size can have a large impact on value. The idea behind this is to adjust the GPC pricing multiples for differences between (1) size-related risks and growth rates implicit in the GPC multiples, and (2) the size-related risk and growth rate of the subject.
(c) The size and growth adjustments are made only to income statement-based multiples because they are based on the following relationship between capitalization rates and pricing multiples:
BB gk
BenefitValue
which implies
BB gkBenefit
Value
1 or BB gk
Value
Benefit
Where:
kB is the discount rate (or WACC) related to that particular benefit stream, and gB is the expected perpetual growth rate related to the benefit stream
(d) It should be noted that Value/Benefit is simply the pricing multiple related to the Benefit.
(e) The size and growth adjustments represent ways to quantify adjustments appraisers have done judgmentally for years. Of course, these adjustments are only appropriate when the appraiser believes there are significant differences among the GPCs and the subject.
3. Adjustments Based Upon Correlation Between Performance and Multiple
a. Correlation Between ROE and Price / Book Value – The analyst may want to explore the possibility that a close correlation exists between the GPCs’ returns on equity and their price / book value of equity (where price equals market capitalization). Theoretically, there should be such a positive correlation, since higher ROE provides equity investors with higher current returns and higher reinvestment for future capital appreciation. Obviously, this relationship assumes the measures of ROE are close to normalized expected future ROE performance.

Chapter 12. GPC Steps 5-6 BV201: Introduction to Business Valuation
BV201r v. 6.0 (11/15) Non-authoritative © 2015 American Society of Appraisers 13
b. A similar graph could be constructed for invested capital with price / book value of invested capital (where price equals market capitalization) on the Y axis and ROIC (return on invested capital with return defined as EBIT or NOPAT) on the X axis.
c. Correlation between Profit Margin and Price / Sales – The analyst may want to explore the possibility that a close correlation exists between the GPCs’ profit margins (i.e., returns on sales) and their corresponding price/sales. Theoretically, there should be such a positive correlation, since higher profit margins provide equity investors with higher current returns and higher reinvestment for future capital appreciation. Obviously, this relationship assumes the profit margins are close to normalized expected future profitability performance.
d. Theoretically, the price in the price to sales ratio should be an invested capital price (total capitalization plus interest-bearing debt) and return on sales should be an invested capital return (EBIT or NOPAT). In practice, many appraisers also consider this correlation on an equity basis—with the price in the price to sales
Return on Equity
Price/
BV of
Equity
Return on Sales
Price/
Sales

Chapter 12. GPC Steps 5-6 BV201: Introduction to Business Valuation
BV201r v. 6.0 (11/15) Non-authoritative © 2015 American Society of Appraisers 14
ratio defined as total capitalization and an equity return (pretax income or net income).
e. Other Correlations – Correlations between market multiples and other operating performance metrics may also be possible. If close correlations are observed, then the valuation analyst may want to use these relationships as a method of quantifying the corresponding market multiple.
4. Adjusting the Market Multiple for Size Risk
a. Small size is associated with a number of risk factors, including:
(i) Lack of management depth
(ii) Lack of product diversification
(iii)Lack of geographic or global diversification
(iv) Reduced access to capital to fund growth
(v) Limited R&D and marketing resources
b. A number of studies examine the effect of size on equity returns, including the Duff & Phelps Risk Premium Report as well as Duff & Phelps latest publication, Valuation Handbook – Guide to Cost of Capital, which was released in March 2014. These studies will be discussed in detail in BV 202.
c. The discount rate is the place the adjustment is made because we have data quantifying the size effect on returns. There have been studies demonstrating that P/Es vary inversely with firm size; however, the data on firm size and return are readily available and well accepted. The basic equation is:
GPCsizeGPCtsizesubjecGPC gkkk
Value
Benefit
d. In this case, the ksize is the appropriate rate of return premium due to size, or size premium. It is important to note that this size premium is based on those appropriate for the buildup method, not the CAPM; that is, they should not be adjusted for beta (this process can be used with the premiums adjusted for beta, but it is much more complicated and will not be discussed here). Furthermore, in order to apply this adjustment we do not need to know either the discount or growth rates of the GPC, we just need to know the size premium differential between the two.
e. Since the base on which the size premium is computed is the same irrespective of the size of the company, the size premium differential is equal to the total return differential (where total return is only a function of size).
(i) For example, using Duff & Phelps data (which will be covered in detail in BV202), the size differential between a company in the sixth and tenth deciles
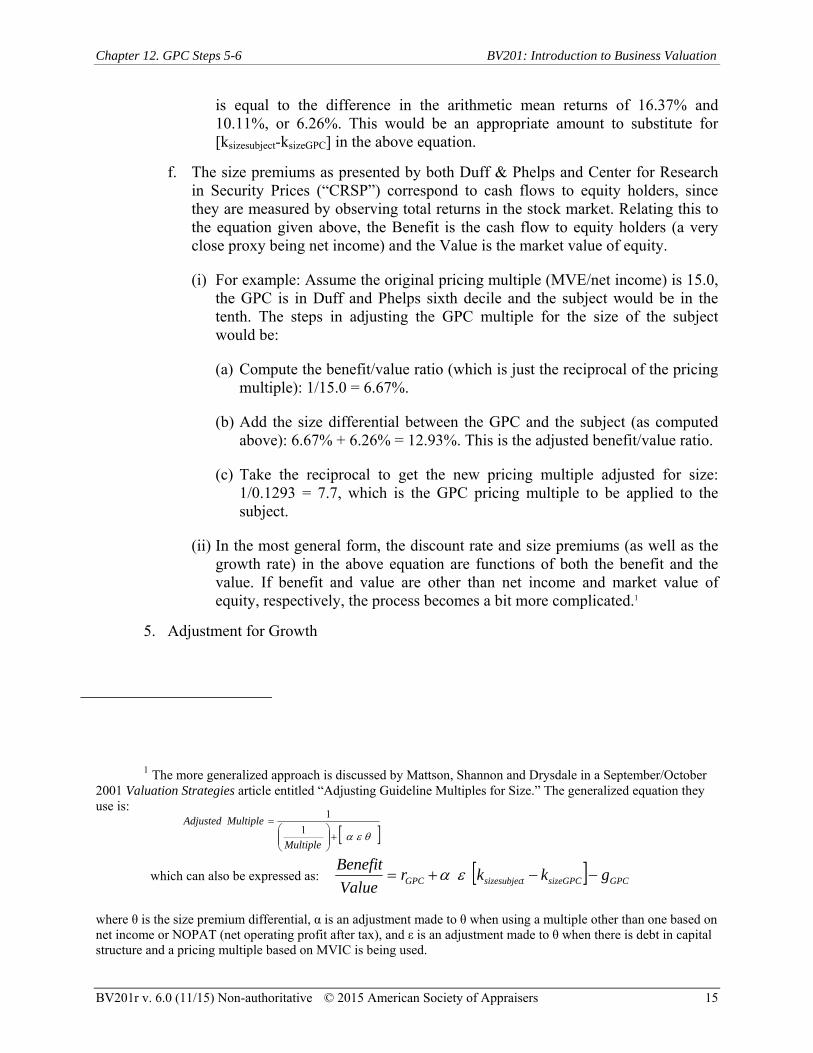
Chapter 12. GPC Steps 5-6 BV201: Introduction to Business Valuation
BV201r v. 6.0 (11/15) Non-authoritative © 2015 American Society of Appraisers 15
is equal to the difference in the arithmetic mean returns of 16.37% and 10.11%, or 6.26%. This would be an appropriate amount to substitute for [ksizesubject-ksizeGPC] in the above equation.
f. The size premiums as presented by both Duff & Phelps and Center for Research in Security Prices (“CRSP”) correspond to cash flows to equity holders, since they are measured by observing total returns in the stock market. Relating this to the equation given above, the Benefit is the cash flow to equity holders (a very close proxy being net income) and the Value is the market value of equity.
(i) For example: Assume the original pricing multiple (MVE/net income) is 15.0, the GPC is in Duff and Phelps sixth decile and the subject would be in the tenth. The steps in adjusting the GPC multiple for the size of the subject would be:
(a) Compute the benefit/value ratio (which is just the reciprocal of the pricing multiple): 1/15.0 = 6.67%.
(b) Add the size differential between the GPC and the subject (as computed above): 6.67% + 6.26% = 12.93%. This is the adjusted benefit/value ratio.
(c) Take the reciprocal to get the new pricing multiple adjusted for size: 1/0.1293 = 7.7, which is the GPC pricing multiple to be applied to the subject.
(ii) In the most general form, the discount rate and size premiums (as well as the growth rate) in the above equation are functions of both the benefit and the value. If benefit and value are other than net income and market value of equity, respectively, the process becomes a bit more complicated.1
5. Adjustment for Growth
1 The more generalized approach is discussed by Mattson, Shannon and Drysdale in a September/October
2001 Valuation Strategies article entitled “Adjusting Guideline Multiples for Size.” The generalized equation they use is:
Multiple
MultipleAdjusted1
1
which can also be expressed as: GPCsizeGPCtsizesubjecGPC gkkrValue
Benefit
where θ is the size premium differential, α is an adjustment made to θ when using a multiple other than one based on net income or NOPAT (net operating profit after tax), and ε is an adjustment made to θ when there is debt in capital structure and a pricing multiple based on MVIC is being used.
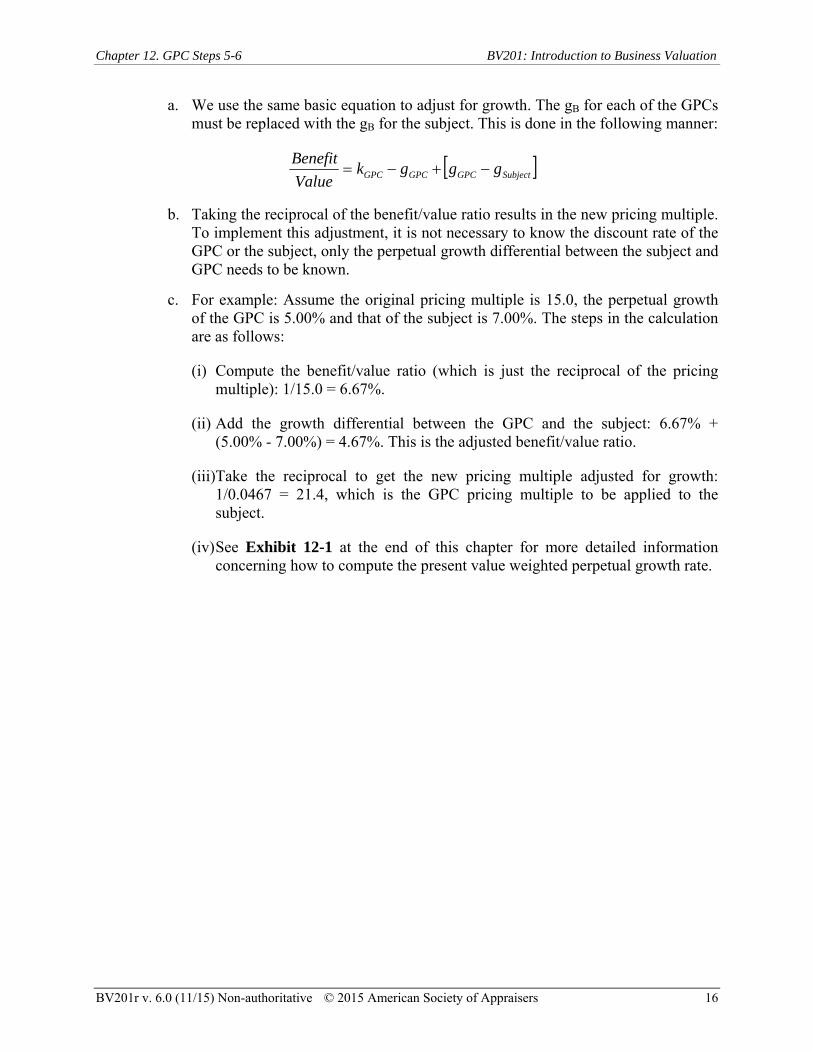
Chapter 12. GPC Steps 5-6 BV201: Introduction to Business Valuation
BV201r v. 6.0 (11/15) Non-authoritative © 2015 American Society of Appraisers 16
a. We use the same basic equation to adjust for growth. The gB for each of the GPCs must be replaced with the gB for the subject. This is done in the following manner:
SubjectGPCGPCGPC gggk
Value
Benefit
b. Taking the reciprocal of the benefit/value ratio results in the new pricing multiple. To implement this adjustment, it is not necessary to know the discount rate of the GPC or the subject, only the perpetual growth differential between the subject and GPC needs to be known.
c. For example: Assume the original pricing multiple is 15.0, the perpetual growth of the GPC is 5.00% and that of the subject is 7.00%. The steps in the calculation are as follows:
(i) Compute the benefit/value ratio (which is just the reciprocal of the pricing multiple): 1/15.0 = 6.67%.
(ii) Add the growth differential between the GPC and the subject: 6.67% + (5.00% - 7.00%) = 4.67%. This is the adjusted benefit/value ratio.
(iii)Take the reciprocal to get the new pricing multiple adjusted for growth: 1/0.0467 = 21.4, which is the GPC pricing multiple to be applied to the subject.
(iv) See Exhibit 12-1 at the end of this chapter for more detailed information concerning how to compute the present value weighted perpetual growth rate.
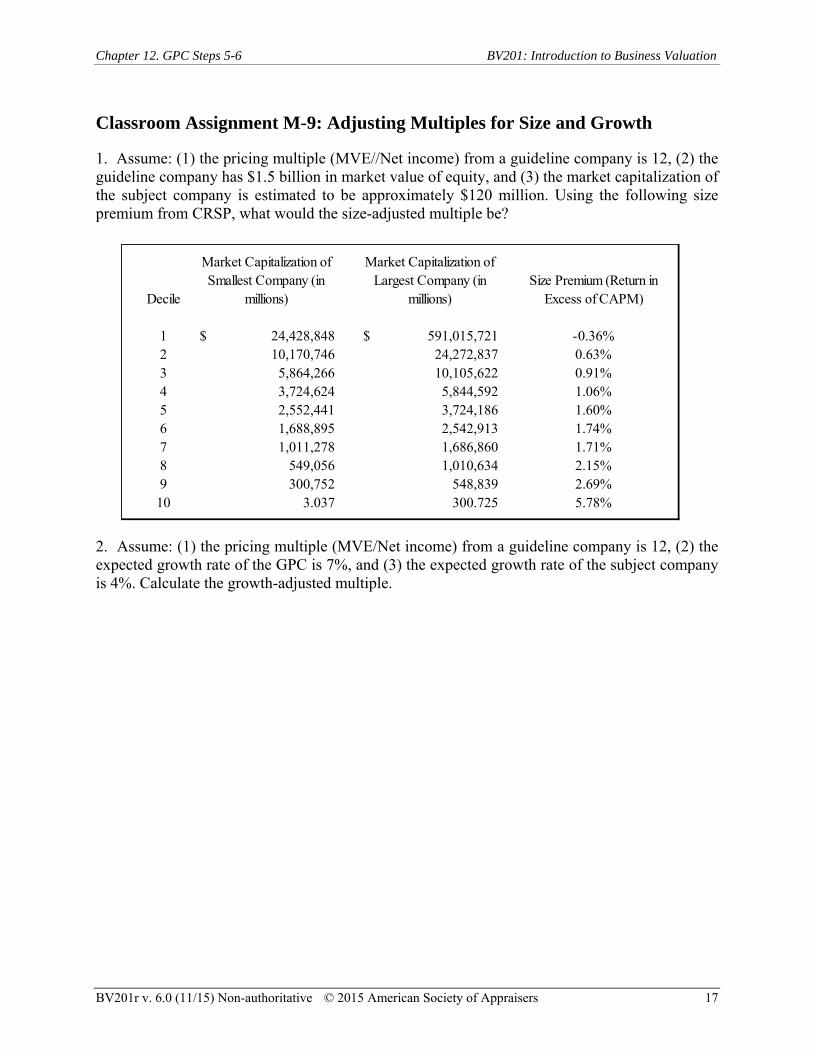
Chapter 12. GPC Steps 5-6 BV201: Introduction to Business Valuation
BV201r v. 6.0 (11/15) Non-authoritative © 2015 American Society of Appraisers 17
Classroom Assignment M-9: Adjusting Multiples for Size and Growth
1. Assume: (1) the pricing multiple (MVE//Net income) from a guideline company is 12, (2) the guideline company has $1.5 billion in market value of equity, and (3) the market capitalization of the subject company is estimated to be approximately $120 million. Using the following size premium from CRSP, what would the size-adjusted multiple be?
2. Assume: (1) the pricing multiple (MVE/Net income) from a guideline company is 12, (2) the expected growth rate of the GPC is 7%, and (3) the expected growth rate of the subject company is 4%. Calculate the growth-adjusted multiple.
Decile
Market Capitalization of Smallest Company (in
millions)
Market Capitalization of Largest Company (in
millions)Size Premium (Return in
Excess of CAPM)
1 24,428,848$ 591,015,721$ -0.36%2 10,170,746 24,272,837 0.63%3 5,864,266 10,105,622 0.91%4 3,724,624 5,844,592 1.06%5 2,552,441 3,724,186 1.60%6 1,688,895 2,542,913 1.74%7 1,011,278 1,686,860 1.71%8 549,056 1,010,634 2.15%9 300,752 548,839 2.69%10 3.037 300.725 5.78%

Chapter 12. GPC Steps 5-6 BV201: Introduction to Business Valuation
BV201r v. 6.0 (11/15) Non-authoritative © 2015 American Society of Appraisers 18
Exhibit 12-1
Computing Present Value-Weighted Perpetual Growth

Chapter 12. GPC Steps 5-6 BV201: Introduction to Business Valuation
BV201r v. 6.0 (11/15) Non-authoritative © 2015 American Society of Appraisers 19
One of the statistics generally given is growth. This is the expected growth (as opposed to the actual, historical growth in earnings per share over the next five (or so) years. This can be obtained from individual equity analysts or some of the consensus reporting services, such as Zacks or as given in Yahoo!Finance.
Three things should be noted about these estimates obtained from most consensus reporting services.
The first is that these growth figures usually represent annual growth in earnings per share for the next three to five years; these are not long-term growth estimates. In some cases, revenue growth rates may be provided.
Second, the analysts from whom these estimates are obtained are from the sell-side; meaning that they tend to be quite optimistic about the prospects for these companies, since they work for firms who want to sell the stock. Also, some of these estimates may be a “consensus” of only one analyst. Smaller companies tend to be followed by fewer analysts.
The last item of note is that not all publicly traded companies will be covered by these services. In such cases and in cases where there is only one analyst following the stock, it might be better to use industry growth estimates, if they are provided. (Of course, the implicit assumption here is that the GPC’s growth is consistent with the industry’s.)
In using these growth estimates, the appraiser assumes that the average annual growth for the next three to five years in net income, EBIT, EBITDA, etc., is the same as that for EPS. These may not be unreasonable assumptions; however, there may be certain cases where they are not appropriate.
Since the typical analysts’ growth estimate applies only for the next three to five years, an estimate must also be made for the subsequent period (years four or six and beyond), so that a blended average annual growth rate for the period from today into perpetuity can be obtained (again, the growth rate in the equations above, g, is the rate into perpetuity and three to five years is only a small part of that).
The blended growth rate, g, that is included in each of the guideline company’s pricing ratios, must satisfy the following:
)k+(1
g-k
)g+(1)g+(1CF
+)k+(1
)g+(1CF++
)k+(1
)g+(1CF+
)k+(1CF=
g-kCF=Value
52
21
41
51
41
211
111
where g1 is the annual growth rate for the first five years and g2 is the average annual growth rate for each year thereafter, into perpetuity.

Chapter 12. GPC Steps 5-6 BV201: Introduction to Business Valuation
BV201r v. 6.0 (11/15) Non-authoritative © 2015 American Society of Appraisers 20
This equation assumes two growth rates: one for the next five years and another for everything beyond five years. That is, it is the single growth rate that gives the same value as multiple growth rates. Consequently, not only are the growth rates important, but so is the discount rate.
For example: Assume a discount rate of 20%, a short-term growth rate of 15% (four years) and a long-term growth rate (beyond five years) of 5%. The steps in the calculation are:
Compute the present value of $1/year growing at 15% for the four years (we assume this first $1 has already been grown by 15%) and 5% into perpetuity:
Growth
Cash
Discount
Factor
Present
Year Rate Flow @ 20% Value
1 15% 1.00 0.8333 0.83
2 15% 1.15 0.6944 0.80
3 15% 1.32 0.5787 0.77
4 15% 1.52 0.4823 0.73
5 15% 1.75 0.4019 0.70
Perpetuity 5% 1.84 0.4019 4.92
Total Present Value 8.75
Now solve the following equation for g:
g
20.0
175.8 which implies %6.8
75.8
120.0 g
The following tables show blended growth rates given short-term (analysts) growth and long- term growth at two different discount rates.
Analysts' Using a 20% Discount RateGrowth Long-Term Growth Rate
3% 5% 7% 10%
0% 1.57% 2.77% 4.12% 6.51% 3% 3.00% 4.15% 5.43% 7.68% 5% 3.89% 5.00% 6.24% 8.40%

Chapter 12. GPC Steps 5-6 BV201: Introduction to Business Valuation
BV201r v. 6.0 (11/15) Non-authoritative © 2015 American Society of Appraisers 21
10% 5.90% 6.92% 8.05% 10.00% 15% 7.64% 8.58% 9.60% 11.35% 20% 9.15% 10.00% 10.93% 12.50% 25% 10.45% 11.23% 12.07% 13.47% 30% 11.58% 12.28% 13.04% 14.30%
Analysts' Using a 25% Discount RateGrowth Long-Term Growth Rate
3% 5% 7% 10%
0% 1.32% 2.77% 4.12% 5.36% 3% 3.00% 3.97% 5.04% 6.90% 5% 4.05% 5.00% 6.05% 7.85%
10% 6.46% 7.35% 8.33% 10.00% 15% 8.59% 9.42% 10.33% 11.86% 20% 10.45% 11.23% 12.07% 13.47% 25% 12.09% 12.80% 13.58% 14.86% 30% 13.53% 14.19% 14.90% 16.07%
An alternative to this can be employed if two pieces of information are known about the GPC. The first is the pricing multiple and the second is the related discount rate. Using the basic relationship between value and capitalization rate, the implied growth for the GPC is:
Value
Benefitkg
For example, assume we know that the MVE/net income for a GPC is 20.0 and the cost of equity (k) is equal to 12.2%, then the implied perpetual growth rate is:
g = %2.7%0.5%2.120.20
1%2.12
This is a relatively simple calculation for MVE/net income; however, it becomes much more complex when trying to determine growth for other income statement concepts, such as EBIT or revenues, when the discount rates may not be as easy to calculate. (The discount rate for EBIT or revenues is necessarily different than for net income, which is considered to be almost the same thing as net cash flow.)

Chapter 12. GPC Steps 5-6 BV201: Introduction to Business Valuation
BV201r v. 6.0 (11/15) Non-authoritative © 2015 American Society of Appraisers 22
Handout 12-1
GPC Financial Ratio Ranking Analysis

Chapter 12. GPC Steps 5-6 BV201: Introduction to Business Valuation
BV201r v. 6.0 (11/15) Non-authoritative © 2015 American Society of Appraisers 23
Handout 12-2
GPC Comparison to GDT

Chapter 12. GPC Steps 5-6 BV201: Introduction to Business Valuation
BV201r v. 6.0 (11/15) Non-authoritative © 2015 American Society of Appraisers 24
Handout 12-3
Solution to Classroom Assignment M-9

BV201r v. 6.0 (11/15) Non-authoritative © 2015 American Society of Appraisers 1
Chapter 13. GPC Steps 7-9 – Apply Multiples, Reconcile and Adjust
I. Step 7 – Apply Adjusted Multiples to Subject Company to Derive Values
A. Step seven of the GPC method is the simple application of the adjusted market multiples to the appropriate financial metrics of the subject company to derive indicated values.
Guideline Companies Price/EBTPrice/Gross Free Cash
Flow
Heartland Express, Inc. 17.22 12.02 Old Dominion Freight Line, Inc. 10.53 10.06 Saia, Inc. 11.50 4.15 Knight Transportation, Inc. 12.66 9.44 Werner Enterprises, Inc. 11.59 7.11 Celadon Group, Inc. 23.43 9.73
Median Multiple 12.13 9.59
Selected Multiple2
8.50 6.50
The selected multiples are now applied against the figures of the appraisal subject.
Price/EBTPrice/Gross Free Cash
Flow
Normalized EBT 21,762,620$ Normalized EBTDA 32,215,572$
Multiple 8.50 6.50
Operating Entity Value 184,982,270$ 209,401,218$ Net Non-operating Assets 23,668,000 23,668,000
Total Entity Equity Value1
208,650,270$ 233,069,218$
1 This example intentionally omits any calculation of valuation discounts or premiums, which are discussed inBV203.2 The selected multiple contains an implied discount from the median guideline public company multiples as thesubject company is much smaller in size, has lower growth expectations, etc. and therefore is riskier than its publiclytraded guideline counterparts.
GENERAL DELIVERY TRUCKING, INC.Application of the Guideline Public Company Method Using Equity Multiples

BV201r v. 6.0 (11/15) Non-authoritative © 2015 American Society of Appraisers 2
Guideline Companies MVIC/EBITDA MVIC/EBIT
Heartland Express, Inc. 9.69 17.22Old Dominion Freight Line, Inc. 7.96 11.05Saia, Inc. 4.20 9.80Knight Transportation, Inc. 7.60 13.36Werner Enterprises, Inc. 5.70 11.63Celadon Group, Inc. 9.25 28.36
Median Multiple 7.78 12.50
Selected Multiple2
5.00 8.75
EBITDA 44,348,620$
EBIT 25,190,620$
Multiple 5.00 8.75
Value of operating invested capital 221,743,100$ 220,417,925$
Net non-operating assets 23,668,000 23,668,000
Total value of invested capital 245,411,100$ 244,085,925$
Less: Interest-bearing debt (49,249,000) (49,249,000)
Value of equity1
196,162,100$ 194,836,925$
2 The selected multiple contains an implied discount from the median guideline public company multiples as the subject company is much smaller in size, has lower growth expectations, etc. and therefore is riskier than its publicly traded guideline counterparts.
GENERAL DELIVERY TRUCKING, INC.
Application of the Guideline Public Company Method Using Invested Capital Multiples
1 We have once again intentionally omitted valuation discounts or premiums from this example.

BV201r v. 6.0 (11/15) Non-authoritative © 2015 American Society of Appraisers 3
II. Step 8 - Reconcile the Different Indications of Values
A. If using more than one multiple, the analyst must decide which multiples will be given the most weight. For example, in a service industry, some weight should be given to a price/sales ratio and some might be given to price/operating income, with perhaps very little weight being given to the price/BV ratio. What should those weights be? Hence, step eight of the GPC method is to reconcile the different indications of value derived from the use of more than one adjusted market multiple applied to the subject company. The table below provides an example of such reconciliation.
B. Reconciliation of differing value indications derived from the same method (or even from different methods/approaches) relies upon the valuator’s judgment regarding:
1. The weighting can be explicit or implicit. The critical factor is that the weighting be the result of informed judgment and clearly explained in the report.
2. The weights are dependent upon the appraiser’s sense of relative confidence in the value indication from each type of market multiple.
3. Confidence in the value indication derived from a particular market multiple depends upon both a theoretical and practical understanding of the key determinants of value for the type of industry/company (e.g., service companies will tend to be valued on revenues, capital intensive enterprises on net income and/or book value, real estate companies on gross cash flow, etc.).
4. The factors considered in selecting multiples are also considered in the reconciliation of values and the choice of weighting method(s).
5. Contrary to common belief, Revenue Ruling 59-60 does not bar a mathematical weighting of valuation results. It bars a blind, arithmetic mean of the results that would be appropriate only by coincidence.
6. If the appraiser implicitly weighs the results and says so in the report, an explicit weighting can be elicited by a good attorney on cross examination.
Price/EBTPrice/Gross
Free Cash Flow MVIC/EBITDA MVIC/EBIT
Example Reconciliation:Indicated Equity Values 208,650,270$ 233,069,218$ 196,162,100$ 194,836,925$
Selected Weighting1
20% 10% 40% 30%
41,730,054$ 23,306,922$ 78,464,840$ 58,451,078$
Reconciled Value 201,952,893$
ROUNDED 200,000,000$ 1
Based on appraisers qualatative assessment of each method.
GENERAL DELIVERY TRUCKING, INC.GUIDELINE PUBLIC COMPANY METHOD: RECONCILIATION OF VALUE INDICATIONS

BV201r v. 6.0 (11/15) Non-authoritative © 2015 American Society of Appraisers 4
III. Step 9 – Consider Applying Appropriate Discounts and/or Premiums
A. As will be discussed in BV 203, there are a variety of different types of discounts and premiums which may apply to the subject company.
B. After reconciling the various value indications and arriving at a final single conclusion of value (or range of values), the application of any appropriate premiums or discounts finishes the valuator’s tasks under the GPC method of the market approach.

Chapter 14. The Merger and Acquisition Method BV201: Introduction to Business Valuation
BV201r v. 6.0 (11/15) Non-authoritative © 2015 American Society of Appraisers 1
Chapter 14: The Merger and Acquisition Method
I. Introduction
A. According to ASA’s Business Valuation Standards glossary, the merger and acquisition method to valuation is defined as:
Merger and acquisition method – method within the market approach whereby pricing multiples are derived from transactions of significant interests in companies engaged in the same or similar lines of business
B. Statement on Business Valuation Standard 2 (SBVS-2)
1. SBVS-2, II provides the conceptual framework for the use of the merger and acquisition method as follows:
a. Transactions involving the sale, merger or acquisition of businesses, business ownership interests, and securities can provide objective, empirical data for developing valuation multiples.
b. The development of valuation multiples from transactions of significant interests in guideline companies should be considered to the extent that sufficient information is available.
c. Guideline companies are companies that provide a reasonable basis for comparison to the investment characteristics of the company being valued. Ideal guideline companies are in the same industry as the subject company. However, if there is insufficient transaction evidence available in that industry, it may be necessary to select other companies having an underlying similarity to the subject company in terms of relevant investment characteristics such as markets, products, growth, cyclical variability and other salient factors.
2. SBVS-2, III provides guidance on the search for and selection of guideline companies as follows:
a. A thorough, objective search for transactions of significant interests in guideline companies is required to establish the credibility of the merger and acquisition method. This procedure must include criteria for screening and selecting such companies.
b. Guideline company empirical data can be found in transactions involving controlling or significant minority interests in publicly traded or closely held companies.
3. SBVS-2, IV provides guidance on analysis of the financial data of the guideline companies as follows:
a. It is necessary to obtain and analyze the financial and operating data on the guideline companies, as available.
Chapter 14. The Merger and Acquisition Method BV201: Introduction to Business Valuation
BV201r v. 6.0 (11/15) Non-authoritative © 2015 American Society of Appraisers 2
b. Adjustments to the financial data of the subject company and guideline companies should be considered to minimize the difference in accounting treatments when such differences are significant. Unusual or nonrecurring items should be analyzed and adjusted, as appropriate.
4. SBVS-2, V provides guidance concerning use of guideline valuation multiples as follows:
a. Valuation multiples are derived by relating transaction prices in guideline companies to the appropriate underlying financial, operating or physical data of the respective companies.
b. Several valuation multiples may be selected for application to the subject company. These multiples may require adjustment for differences in qualitative and quantitative factors between the guideline companies and the subject.
c. Several indications of value may result. The appraiser must consider the relative importance or weight accorded to each of the indications of value used in arriving at the opinion or conclusion of value.
5. SBVS-2, VI addresses other factors and considerations and states that adjustments may be necessary for factors that have not been considered earlier in the appraisal, such as:
a. Degree of control
b. Degree of marketability and liquidity
c. Timing differences between market transactions and the valuation date
d. Strategic or investment value issues
e. Size, depth of management, and diversification of markets, products and services
C. Types of Merger and Acquisition Transactions
1. Public company being acquired by another public company: Prospectus must be filed with the SEC, which would include sufficient data to complete an analysis.
2. Public company being acquired by a private company:
a. A prospectus must be filed by the public company.
b. Commonly seen in public company going private filing 13-E3 with the SEC.
3. Private company being acquired by a public company:
a. If the acquired private company is worth more than 10% of the public company, then the public acquirer must file an 8-K with the SEC. The 8-K will include details of the transaction.
b. If the 8-K is not available, sufficient detail on the transaction may not be available to sustain an analysis.

Chapter 14. The Merger and Acquisition Method BV201: Introduction to Business Valuation
BV201r v. 6.0 (11/15) Non-authoritative © 2015 American Society of Appraisers 3
4. Private company acquired by another private company (or private buyer):
a. There is no legal requirement for any information to be made public.
b. These transactions constitute most of the reported information on small, closely held companies.
D. Why Do We Use Databases?
1. Readily available data, easy to use
2. Moderate cost: generally $300 to $600. One-time retrievals are usually available from several sources over the Internet.
3. Analytical and graphical tools allow easy summarization
4. Most allow exports to Excel and downloads into automated valuation tools
E. Primary Public Company Databases
1. Derived from data reported to the SEC, usually on Form 8-K resulting from a material acquisition
2. Small acquisitions deemed not material are not reported and may be difficult to detect
3. Databases maintained by Bloomberg and Thomson (SDC Platinum, ONE Banker-Deals, Capital IQ) are commonly used by investment bankers, but are expensive and less used by business appraisers
4. Most common, and least expensive, databases used by appraisers are Done Deals, Mid Market Comps, Public Stats and Mergerstat
Database # Transactions
Earliest Data Typical Value Range
Value Concentration (circa 2009)
Done Deals 7,500 + 1994 $1 M - $150 M 50% under $15M
25% under $5M
Mid Market Comps
6,500 + 1994 $1M - $100M 44% under $10M
10% under $1M
Public Stats 3,600 + 1995 $1M - $1B
Mergerstat 57,000 + 2001 (back to 1980 available)
$1M up

Chapter 14. The Merger and Acquisition Method BV201: Introduction to Business Valuation
BV201r v. 6.0 (11/15) Non-authoritative © 2015 American Society of Appraisers 4
5. Primary Closely Held Company Databases
a. Data provided by secondary sources: brokers and other intermediaries
b. Most common databases used by appraisers are the IBA database, BizComps, and Pratt’s Stats
Database # Transactions Earliest
Data
Typical Value
Range
Value Concentration (circa 2009)
IBA 30,700 + 1970’s $1 M or less 88% under $500 K 46% under $100 K
BizComps 10,000 + 1993 $1M or less 61% under $500K 39% under $100K
Pratts Stats 10,000 + 1990 $100K to $1 B 47% under $1M (MVIC)
28% under $100K (MVIC)
6. Special Industry or Regional Databases
a. Goodwill Registry (Health Care Group, Plymouth Meeting, Pa.)
b. Kagan & Associates (Media, Broadcasting)
c. Business Brokers
d. Real Estate Associations (usually land-based properties)
e. Trade Associations and franchisor databases
f. Intellectual Property Databases (royalty rates)
g. Partnership Profiles (Direct Investment Spectrum)
h. International Association of Merger & Acquisition Professionals
i. Merger & Acquisitions in Canada (Crosbie & Company Inc.)
j. Zweig-White (architectural and engineering firms)
II. Database Inconsistencies and Analytical Issues
A. Inconsistencies and Problems with the Data (Read the instructions when using each database, and analyze each transaction carefully before including it in your analysis)
1. True comparability of the transaction to subject

Chapter 14. The Merger and Acquisition Method BV201: Introduction to Business Valuation
BV201r v. 6.0 (11/15) Non-authoritative © 2015 American Society of Appraisers 5
2. Merger and acquisition data often mirror “typical” company sales. Additional adjustments to the indicated price may be needed to reflect unusual risks or conditions of the subject business.
3. Addition of synergistic premium is difficult to analyze
4. Single point multiples; financial depth is often sparse. Little data is provided on market conditions or the competitive environment surrounding the sale.
5. Cannot see the trends and other risks in the business when pricing multiples are based on latest annual results:
a. A business sold after a poor, unusual year, may have a high multiple reported as a ratio of the just completed results.
b. A business sold after a particularly excellent, but unusual, year may show a low multiple of the just completed results.
c. Balance sheet issues of capital structure, working capital and variation of assets are often not reported.
B. Varied dates in similar transactions may ignore changes in economic conditions, such as “hot” industries going cool. Pricing multiples change over time in certain industries, but may be stable for long time horizons in other industries.
C. Flaws in data reporting:
1. Adjusted earnings are often inconsistently calculated by the data source.
2. Plant, property and equipment estimates may be book value, estimates of market value, or simply book value of what is sold to the buyer.
3. SIC/NAICS, other coding errors as to business definition exist. Each source carries its own glossary, which should be understood. Larger businesses may have multiple lines or divisions, but are reported in their primary category.
4. Duplicate transactions are often reported to several databases, sometimes with different results. Company name and nature of business may be reported differently for the same transaction.
5. N/A doesn’t necessarily mean zero
D. Annualizing revenue and earnings of stub periods (a procedure common to Done Deals) may yield unrealistic computations of annual performance.
E. Assets exchanged may not be well defined.
1. BizComps and IBA define property exchanged as fixed assets + goodwill (although the IBA price may include inventory, depending on industry norms).
2. Real estate is commonly not included in the property being transferred.
3. Excess, or non-operational, assets are typically not included in the sale.

Chapter 14. The Merger and Acquisition Method BV201: Introduction to Business Valuation
BV201r v. 6.0 (11/15) Non-authoritative © 2015 American Society of Appraisers 6
4. Equity and invested capital multiples are available from several databases.
5. Debt may or may not be included in calculations. Be aware of the need to subtract subject debt when interest expense is paid and debt is assumed.
F. Cash-equivalent price may be difficult to determine:
1. Terms may not be stated, or referenced at above or below market rates. Earn outs and seller financing at non-market rates can skew the reported deal price and the derived multiples.
2. Non-compete and employment-consulting agreements are noted in Pratt’s Stats, but rarely reported in other databases.
3. Recalculate your own multiples following any adjustment to the reported price.
G. Most Transactions Are for a Controlling Interest
1. If a multiple is applied to a control cash flow, a control basis value is assumed.
2. If applied to a minority cash flow, a control basis should not be assumed.
3. Do not apply discounts or premiums until the basis is determined.
H. Stock Sale
1. Deal should be labeled as a “stock sale” or the consideration transferred should be 100% of equity.
2. If less than 100% of equity was transferred, the deal value should be grossed up to 100%
a. Example: Deal value for 80% = $6.5 million
100% value = $8,125,000, or $6,500,000/80%
3. Price multiples are derived from stock sales.
I. Asset Sale
1. More common in smaller deals.
2. Need to determine precisely which assets were transferred:
a. Current assets, or at least cash and accounts receivable, are often not transferred in small asset transactions.
b. Inventory may be transferred but not reflected in the multiples.
3. Invested capital multiples are usually derived from asset sales.
Chapter 14. The Merger and Acquisition Method BV201: Introduction to Business Valuation
BV201r v. 6.0 (11/15) Non-authoritative © 2015 American Society of Appraisers 7
III. Analytical Procedures
A. Identify transactions in which the target (or acquired company) is similar to the subject using the same or similar criteria as used in the GPC methodology.
B. Obtain adequate data on the publicly reported transactions, which may include additional information from actual 8-K reports, or other SEC filings. Industry research can often yield additional information about the transaction.
C. Obtain adequate data on the closely held, or private, transactions which may entail calling the intermediary who submitted the transaction to seek additional background information and/or making inquiries of the primary buyer and seller.
D. Refine selection of relevant transactions based on additional information and quality of data. Older transactions may be less relevant if substantial economic and industry changes have occurred. Judgment must be exercised here in concluding value.
E. Adjust Numerator for Non-Cash Terms of the Deal
1. Restricted stock:
a. Common when acquirer is public company.
b. Stock may need to be discounted from the trading price on the deal date to account for any time restrictions on trading.
2. Employment agreements and non-compete agreements:
a. Common in small deals with closely held companies.
b. Selling shareholder may receive an employment agreement or consulting agreement, which allows a payout over time in return for some form of consulting. If consulting is not performed, then the payout terms on a present value basis may be considered part of the deal value.
c. Value implications of non-compete arrangements are difficult to determine if the seller has the desire and capability to compete.
3. Earnouts:
a. Contracts, which allow variable pricing, where part of the deal price is contingent on the achievement of specific operational goals such as sales or profit levels, are difficult to quantify value. The likelihood of achieving the targets must be assessed and the present value determined.
4. Seller’s note:
a. If the interest rate is not fair market, revalue the note with the going rate at the deal date.
F. Develop Market Multiples

Chapter 14. The Merger and Acquisition Method BV201: Introduction to Business Valuation
BV201r v. 6.0 (11/15) Non-authoritative © 2015 American Society of Appraisers 8
G. If your transaction search yields only one or two usable transactions, the best course of action for the appraiser is to describe the transaction search and results, but use the merger and acquisition method solely as a test of reasonableness to other valuation approaches used.
IV. Equity Multiples
A. Define the concept of equity in the transaction – ownership of what assets? Various measures of price/sales and price/earnings might be considered as invested capital multiples, with liabilities to be subtracted and adjustments for working capital. Know what the database defines as property being exchanged.
B. Price/Equity Cash Flow – Often this is difficult to accurately calculate for the acquired company
C. Price/Net Income – Useful when there is a similarity in capital intensity, depreciation methods, and tax rates
D. Price/EBT – Useful when there is a similarity in capital intensity and depreciation methods
E. Price/Discretionary Earnings:
1. Discretionary earnings, sometimes called seller’s discretionary earnings (SDE) or owner’s discretionary earnings depends on the definition by the database.
2. The BizComps database defines SDE as EBITDA + the primary owners’ compensation and perks. This is useful for smaller owner-operated businesses. Some databases will refer to this as seller’s discretionary cash flow.
3. The IBA database and others define SDE as EBIT + the primary owner’s compensation and perks. This definition does not include depreciation and amortization as an add-back, recognizing that continuing businesses will need to replace depreciating assets.
4. Adjusting for owner’s compensation and perquisites may not be meaningful for larger businesses or if the owner works part time.
F. Price/Sales – Useful when there is a uniform profit margin in the industry or when there is a strong correlation between price/sales and return on sales.
G. Price/Book – Useful when there is a strong correlation between book value of equity and return on equity balance sheet.
V. Invested Capital Multiples
A. MVIC/Invested Capital Net Cash Flow – Desirable, but difficult to calculate
B. MVIC/NOPAT – Best when there is similarity in capital intensity, depreciation methods and tax rates
Chapter 14. The Merger and Acquisition Method BV201: Introduction to Business Valuation
BV201r v. 6.0 (11/15) Non-authoritative © 2015 American Society of Appraisers 9
C. MVIC/EBIT – Best when there is similarity in capital intensity and depreciation methods, eliminates effect of tax rate disparities
D. MVIC/EBITDA – Eliminates disparities in capital intensity and depreciation methods
E. Analytical Tips
1. Analyze the data for high, mean/median and low multiples. Graphical tools available in Excel or the databases are particularly helpful, and can be copied for report narrative. However, simply using the tools without an understanding of the underlying data can be dangerous and leave unanswered questions.
2. Because the databases report multiples of latest year results, appraisers usually calculate indicated value using the subject’s latest year (or latest twelve month) results. This presumes that the latest year performance of the subject company is a proper surrogate for future performance, which can be dangerous! Growth is assumed in the transaction multiple, implying that your subject will grow at typical (or average) rates.
3. Some appraisers combine the IBA and BizComps data because they both represent “asset” transactions. There are differences, however, especially in the levels of Discretionary Earnings considered and if inventory is or is not included in the exchange price. Generally, data from various sources should be analyzed independently.
VI. Closer Examination of Common Data Sources for Small Businesses
A. Primary Public Company Databases (normally, a synopsis of the 8-K information)
1. Done Deals
a. Includes approximately 7,500 transactions, 80% of which are closely held companies acquired by public companies and reported to the SEC.
b. Deal size typically ranges from $1 million to $150 million, with about half less than $15 million.
c. Approximately 50% of the deals are stock sales; 20% are asset sales; 30% are not labeled (1994 and 1995 transactions are not categorized).
d. Contains up to 15 data points and six valuation multiples.
e. May represent multiples based on annualized stub period information (e.g., can result in very different multiples than those reported for the same transaction in other databases).

Chapter 14. The Merger and Acquisition Method BV201: Introduction to Business Valuation
BV201r v. 6.0 (11/15) Non-authoritative © 2015 American Society of Appraisers 10
Example of Done Deal Website

Chapter 14. The Merger and Acquisition Method BV201: Introduction to Business Valuation
BV201r v. 6.0 (11/15) Non-authoritative © 2015 American Society of Appraisers 11
2. Mid Market Comps
a. Includes approximately 6,500 transactions, mostly closely held companies acquired by public companies and reported to the SEC
b. Similar data to Done Deals
c. Deal size ranges from $1 million to over $100 million, with about half less than $10 million and 10% less than $1 million
d. Approximately 54% of the deals are stock sales; 20% are asset sales; 25% are not labeled
e. Contains 38 data points and six valuation multiples
Example of Mid Market Comps Data Summary
ANALYSIS OF LOW HIGH MEAN MEDIAN STD DEV
Price (Millions) 0.422 49.1 13.488 8.45 15.056
Seller’s Annualized Revenues 0.597 72.4 17.762 8.867 20.148
Seller’s Annualized Net Income -2.3 7.067 1.213 0.574 2.387
Seller’s Assets 0.121 25.1 5.289 3.4 6.346
Stockholders’ Equity -1.5 7.2 1.838 1.5 2.357
Annualized Cash Flow -1.2 6.133 1.37 0.762 1.914
Annualized EBITDA -1.7 1.2 -0.182 0.046 1.045
P/E 2.432 24.7 13.085 12.767 6.701
P/R 0.189 1.558 0.807 0.766 0.347
P/SE 2.098 24.706 9.204 6.911 7.257
P/A 0.64 7.766 3.296 2.825 2.019
P/CF 4.167 266.667 32.38 7.824 70.196
P/EBITDA 8.667 51.613 18.524 11.227 18.552

Chapter 14. The Merger and Acquisition Method BV201: Introduction to Business Valuation
BV201r v. 6.0 (11/15) Non-authoritative © 2015 American Society of Appraisers 12
Example of Mid Market Comps Graphs
0.000
10.000
20.000
30.000
40.000
50.000
0.000 1.000 2.000 3.000 4.000 5.000 6.000 7.000 8.000(1.000)(2.000)(3.000)
Pric
e (M
illion
s)
P r ic e (M illio n s ) to S e lle r 's A n n u a liz e d N e t In c o m eP r ic e (M illio n s ) to S e lle r 's A n n u a liz e d N e t In c o m e
Current Selected Records - Seller's Annualized Net Income
Regression Line: Y = 7.20 + 5.19 X R Squared = 0.68
3. Mergerstat Online Transaction Roster
a. Owned by FactSet, it contains over 57,000 transactions from 2001 forward, with 7,500 added each year.
b. On-line transactions date from 2001 to current, with earlier data available as a special request. Search criteria on industry, year and international country of target.
c. Public and private deals reported internationally.
d. “Enterprise Value” is defined as “Base Equity Price” plus “Liabilities Assumed” less cash. (“Enterprise value” is an often misinterpreted term.)
e. In addition to digging through Mergerstat’s SIC codes, selecting acquisitions made by comparable publicly traded guideline companies (Search Yahoo Finance under “competitors”) often yields additional transactions.
f. No graphical tools, although individual data can be copied into Microsoft templates or downloaded as a special request.
g. Commonly accessed through various channels, including:
(i) Alacra
(ii) FactSet
(iii)Lexis Nexis
(iv) Hoovers
h. Mergerstat is also available through BV Resources (www.BVResources.com)

Chapter 14. The Merger and Acquisition Method BV201: Introduction to Business Valuation
BV201r v. 6.0 (11/15) Non-authoritative © 2015 American Society of Appraisers 13
B. Primary Closely Held Company Databases
1. Institute of Business Appraisers – IBA Market Database
a. Represents small private company transactions with seven data points (although a new expanded version with more data points is being gathered).
b. IBA’s methodology is termed “Direct Market Data Method.” Some people say that it is best used with 15 to 20 transactions and inferential statistics. Others are not comfortable using less than 25 transactions because of the limited amount of data. It is difficult to match a subject company with a particular IBA transaction because of the lack of data.
c. Contains two primary multiples:
(i) Price/revenue
(ii) Price/discretionary earnings
(iii)Note that the IBA earnings measure is:
EBIT + One Owner’s Compensation and Perks (the primary owner).
d. Available through IBA and ValuSource online databases.
e. Property exchanged represents fixed assets (or, fixtures and equipment) plus transferable goodwill in an “asset” exchange. Terms of the deal are not reported.
(i) Inventory may be included if the industry commonly includes inventory in the exchange price. This factor requires industry research and specialized knowledge to understand the pricing multiples.
(ii) Real estate is excluded.
f. Application of the multiples results in a calculated exchange price for the subject company’s fixed assets and goodwill (and maybe inventory). Current assets (note the inventory exception, above) and other assets are added, and liabilities subtracted to arrive at an equity value indication.
g. The next page contains a partial printout of what you get from IBA. Under the data, you can use the market data analyzer to produce various graphs.

Chapter 14. The Merger and Acquisition Method BV201: Introduction to Business Valuation
BV201r v. 6.0 (11/15) Non-authoritative © 2015 American Society of Appraisers 14
2. BizComps
a. Available through BV Resources, this database is similar to the IBA database. It mainly contains transactions of small businesses.
b. Compiled by Jack Sanders, a practitioner in San Diego, Calif. Jack will provide appraisers with names of data sources (primarily business brokers) upon request for further inquiry and additional information.
c. Represents buyouts of small private companies; updated frequently
d. Deals involve smaller businesses; about two thirds of the deals involve targets with less than $500,000 in revenue.
e. 16 different data points including asking and selling price, inventory, fixed assets included in the price, rent, days on the market, and terms of the deal. The fixed assets amount reported may be book value, broker’s (or the seller’s) estimates, or a calculated value.
SIC Code: 4212 - Local Trucking Without Storage
The following is an explanation of the entries in the data table:
Business Type Principal line of business.SIC Code Principal Standard Industrial Classification number applicable to the business sold.Annual Gross Reported annual sales volume of business sold.Discretionary Earnings Reported annual earnings, excluding owner's compensation and before interest and taxes.Owner's Comp. Reported owner's compensation.Sale Price Total reported consideration; i.e. cash, liabilities assumed, etc. excluding real estate.Price/Gross Ratio of total consideration to reported annual gross.Price/Earnings Ratio of total consideration to reported annual earnings.Yr/Mo of Sale Year and month during which transaction was consummated.
Business TypeAnnual Gross
$000'sDiscret.
Earnings $000'sOwner's Comp.
$000'sSale Price
$000's Price/Gross Price/Earnings Geographic Yr/Mo of Sale
Moving & Storage Services 1,112 - - 360 0.32 - VA 8/18/10Household Moving Services 661 - - 350 0.53 - TN 8/10/10Trucking 487 - - 175 0.36 - OH 7/28/10Delivery/Courier 78 25 10 41 0.52 0.02 FL 3/1/10Delivery/Courier 750 119 35 376 0.50 - FL 2/25/10Delivery/Courier 478 158 - 395 0.83 0.01 FL 2/2/10Trucking 486 - - 290 0.60 - CA 1/22/10Trucking 1,186 - - 335 0.28 - AZ 11/9/09Trucking 881 - - 325 0.37 - AZ 10/30/09Delivery/Courier 240 70 45 112 0.47 0.01 FL 10/16/09Household Moving Services 888 - - 225 0.25 - VA 9/16/09
Delivery/Courier 41 5 - 33 0.80 0.16 OH 4/10/06Delivery/Courier 310 63 - 225 0.73 0.01 MS 4/4/06Delivery/Courier 310 82 63 225 0.73 0.01 FL 2/3/06Environmental Recycling 468 - - 200 0.43 - SC 1/23/06Delivery/Courier 369 52 36 125 0.34 0.01 FL 4/30/04Delivery/Courier 37 24 - 29 0.78 0.03 FL 4/11/04Delivery Service 72 58 - 64 0.89 0.02 AZ 1/1/04Delivery/Courier 56 30 - 50 0.89 0.03 AZ 1/1/04Trash Hauling 113 - - 90 0.80 - AZ 1/1/04Delivery/Freight 495 218 53 560 1.13 0.01 FL 7/3/03
Example of IBA Database Summary
Rows were intentionally left out of this data

Chapter 14. The Merger and Acquisition Method BV201: Introduction to Business Valuation
BV201r v. 6.0 (11/15) Non-authoritative © 2015 American Society of Appraisers 15
f. Contains two primary multiples:
(i) Price/revenue
(ii) Price/discretionary earnings*
g. *Note that the BizComps earnings measure is EBITDA + Owner’s Compensation.
h. Property exchanged represents fixed assets (or, fixtures and equipment) plus transferable goodwill in an “asset” exchange. Terms of the deal are not reported.
(i) Inventory is excluded.
(ii) Real estate is excluded.
i. Application of the multiples results in a calculated exchange price for the subject company’s assets. All current assets and other assets are added, and liabilities subtracted to arrive at an equity value indication.
3. Pratt’s Stats
a. Conceived and designed by Dr. Shannon Pratt in the mid-1990’s. Contains greater than ten thousand transactions, with over 85 data points, compiled primarily from submissions by business brokers and other intermediaries to the transaction. The submitting intermediary is normally referenced in the data, and might be contacted for additional information.
b. By MVIC, only about 47% of the transactions are for smaller businesses valued at $1 million or less, and significantly larger businesses are profiled. A companion database, Public Stats, profiles about 2,000 transactions of public companies that were acquired. Multiples for equity and for invested capital are compiled.

Chapter 14. The Merger and Acquisition Method BV201: Introduction to Business Valuation
BV201r v. 6.0 (11/15) Non-authoritative © 2015 American Society of Appraisers 16
Handout 14-1
Merger and Acquisition Method – Transactions and
Conclusion of Value

Chapter 15. Rules of Thumb and Other Market Methods BV201: Introduction to Business Valuation
BV201r v. 6.0 (11/15) Non-authoritative © 2015 American Society of Appraisers 1
Chapter 15: Rules of Thumb and Other Market Methods
I. Rules of Thumb
A. According to ASA’s Business Valuation Standards Glossary, a rule of thumb is defined as:
Rule of Thumb – a mathematical formula developed from the relationship between price and certain variables based on experience, observation, hearsay or a combination of these; usually industry-specific
B. Background on Rules of Thumb
1. Market participants often develop multiples of operating metrics based on general market or general industry transaction activity over time.
2. These rules are commonly used by business brokers and other intermediaries for a preliminary estimate of transaction value of saleable business segments (such as fixed assets and goodwill) that are going to be sold.
3. Rules of thumb are often industry-specific and represent means, medians or “most common” conditions.
4. According to BVS-V, “rules of thumb may provide insight on the value of a business, business ownership interest, or security. However, value indications derived from use of rules of thumb should not be given substantial weight unless supported by other valuation methods and it can be established that knowledgeable buyers and sellers place substantial reliance on them.”
5. Keep in mind that rules of thumb are not supported by “an amount and verifiability of data known about the similar investment,” as is stated by BVS-V.
C. Disadvantages of Rules of Thumb
1. Based on averages – not every subject company is average.
2. No access to the companies that were transacted
3. No access to the terms of the transactions
D. Typical Rules of Thumb Multiples
1. Multiple of sales (gross income)
2. Multiples of cash flow, usually referred to as seller’s discretionary cash flow (SDCF) or owner’s cash flow (OCF) or seller’s discretionary earnings (SDE) – SDCF is usually calculated as operating income before interest, depreciation and other non-cash charges, one owner’s salary and perquisites, and excluding any non-operational and non-recurring expenses
3. Multiple of some level of assets
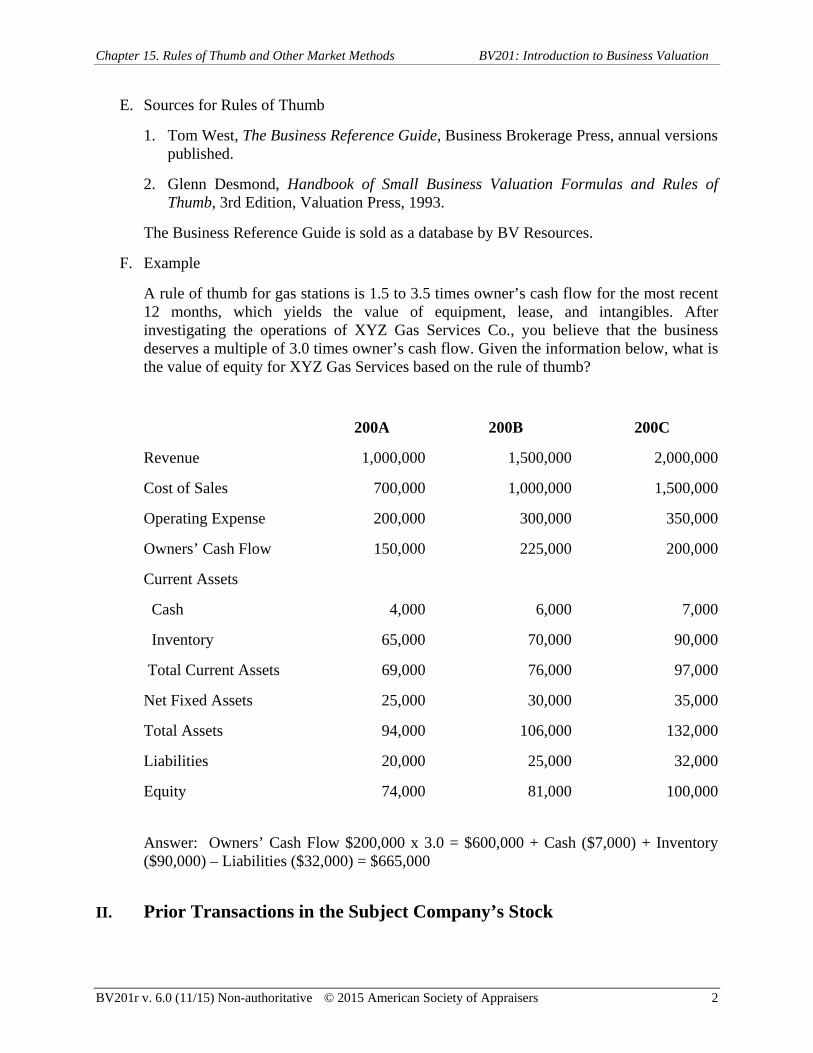
Chapter 15. Rules of Thumb and Other Market Methods BV201: Introduction to Business Valuation
BV201r v. 6.0 (11/15) Non-authoritative © 2015 American Society of Appraisers 2
E. Sources for Rules of Thumb
1. Tom West, The Business Reference Guide, Business Brokerage Press, annual versions published.
2. Glenn Desmond, Handbook of Small Business Valuation Formulas and Rules of Thumb, 3rd Edition, Valuation Press, 1993.
The Business Reference Guide is sold as a database by BV Resources.
F. Example
A rule of thumb for gas stations is 1.5 to 3.5 times owner’s cash flow for the most recent 12 months, which yields the value of equipment, lease, and intangibles. After investigating the operations of XYZ Gas Services Co., you believe that the business deserves a multiple of 3.0 times owner’s cash flow. Given the information below, what is the value of equity for XYZ Gas Services based on the rule of thumb?
200A 200B 200C
Revenue 1,000,000 1,500,000 2,000,000
Cost of Sales 700,000 1,000,000 1,500,000
Operating Expense 200,000 300,000 350,000
Owners’ Cash Flow 150,000 225,000 200,000
Current Assets
Cash 4,000 6,000 7,000
Inventory 65,000 70,000 90,000
Total Current Assets 69,000 76,000 97,000
Net Fixed Assets 25,000 30,000 35,000
Total Assets 94,000 106,000 132,000
Liabilities 20,000 25,000 32,000
Equity 74,000 81,000 100,000
Answer: Owners’ Cash Flow $200,000 x 3.0 = $600,000 + Cash ($7,000) + Inventory ($90,000) – Liabilities ($32,000) = $665,000
II. Prior Transactions in the Subject Company’s Stock
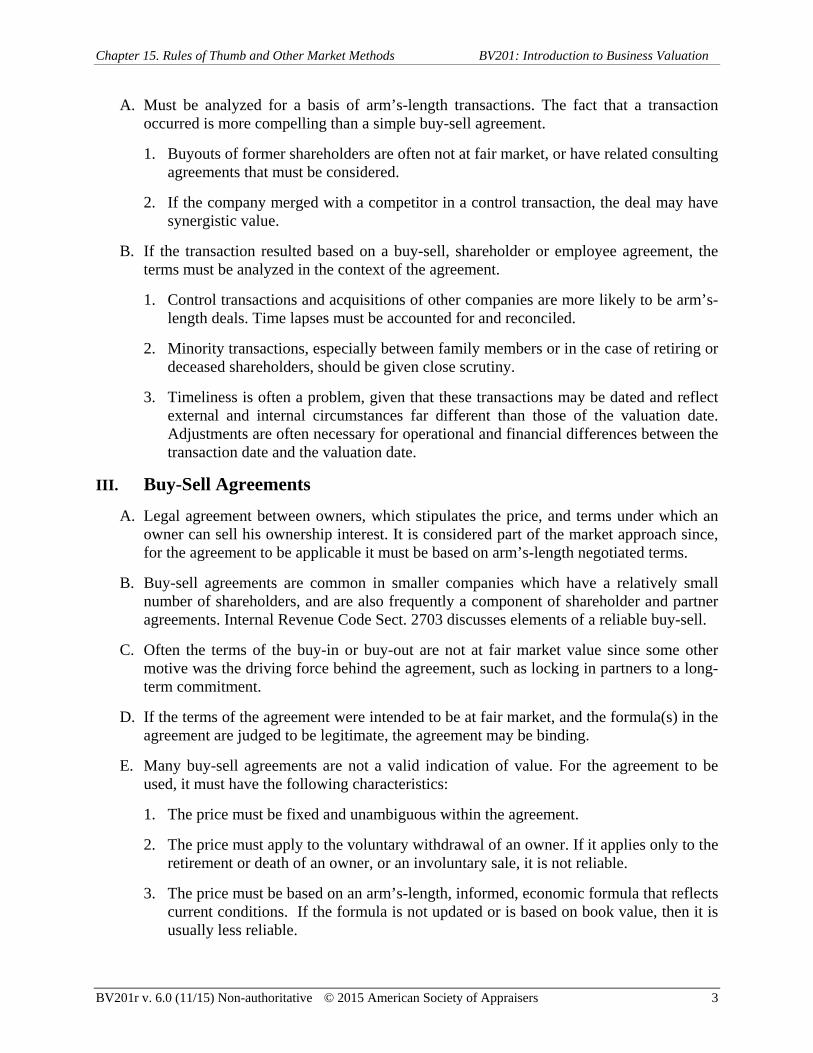
Chapter 15. Rules of Thumb and Other Market Methods BV201: Introduction to Business Valuation
BV201r v. 6.0 (11/15) Non-authoritative © 2015 American Society of Appraisers 3
A. Must be analyzed for a basis of arm’s-length transactions. The fact that a transaction occurred is more compelling than a simple buy-sell agreement.
1. Buyouts of former shareholders are often not at fair market, or have related consulting agreements that must be considered.
2. If the company merged with a competitor in a control transaction, the deal may have synergistic value.
B. If the transaction resulted based on a buy-sell, shareholder or employee agreement, the terms must be analyzed in the context of the agreement.
1. Control transactions and acquisitions of other companies are more likely to be arm’s-length deals. Time lapses must be accounted for and reconciled.
2. Minority transactions, especially between family members or in the case of retiring or deceased shareholders, should be given close scrutiny.
3. Timeliness is often a problem, given that these transactions may be dated and reflect external and internal circumstances far different than those of the valuation date. Adjustments are often necessary for operational and financial differences between the transaction date and the valuation date.
III. Buy-Sell Agreements
A. Legal agreement between owners, which stipulates the price, and terms under which an owner can sell his ownership interest. It is considered part of the market approach since, for the agreement to be applicable it must be based on arm’s-length negotiated terms.
B. Buy-sell agreements are common in smaller companies which have a relatively small number of shareholders, and are also frequently a component of shareholder and partner agreements. Internal Revenue Code Sect. 2703 discusses elements of a reliable buy-sell.
C. Often the terms of the buy-in or buy-out are not at fair market value since some other motive was the driving force behind the agreement, such as locking in partners to a long-term commitment.
D. If the terms of the agreement were intended to be at fair market, and the formula(s) in the agreement are judged to be legitimate, the agreement may be binding.
E. Many buy-sell agreements are not a valid indication of value. For the agreement to be used, it must have the following characteristics:
1. The price must be fixed and unambiguous within the agreement.
2. The price must apply to the voluntary withdrawal of an owner. If it applies only to the retirement or death of an owner, or an involuntary sale, it is not reliable.
3. The price must be based on an arm’s-length, informed, economic formula that reflects current conditions. If the formula is not updated or is based on book value, then it is usually less reliable.

Chapter 15. Rules of Thumb and Other Market Methods BV201: Introduction to Business Valuation
BV201r v. 6.0 (11/15) Non-authoritative © 2015 American Society of Appraisers 4
4. It must be binding. If remaining shareholders can reject the price, then it is not relevant. Many buy-sell agreements allow the company (or acquiring shareholders) only a right of first refusal, assuming the selling shareholder first obtains a bona fide offer for shares.
5. Appraisers consider buy-sell agreements for relevance to actual market conditions, but usually do not deem these agreements controlling unless dictated by legal requirements.
6. USPAP 2014-2015 Standards Rule 9-4(c) requires the appraiser to analyze “the effect on value, if any, of buy-sell and option agreements, investment letter stock restrictions, restrictive corporate charter or partnership agreement clauses, and similar features or factors that may influence value.”
IV. Bona Fide Offers to Buy
A. A bona fide offer is viewed as a good faith, authentic, genuine offer from a qualified buyer who has the intention and capacity of consummating the offer at the level proposed.
1. May or may not provide an arm’s-length basis, since offers can come from friendly outside buyers or insiders (e.g., family).
2. Most offers from outside buyers reflect whole company (control) situations. In public company situations with buyers wishing to acquire more than 5% of the outstanding shares, an SEC form 13D must be filed.
B. Offers for privately held companies are often not consummated, and may not be reasonable indications of value despite their bona fide status. On the other hand, a rejected, but bona fide, offer may provide insight into a minimum value.
C. Offers often reflect investment (or strategic) value considerations, such as synergies and potential economies of scale.
D. Terms are often variable, and may incorporate employment agreements and agreements not to compete.
E. Timeliness is often a problem, given that offers may be dated and reflect external and internal circumstances different than those of the valuation date.
V. Analysis of Acquisitions Made by the Company
A. Subject companies often make acquisitions of similar companies during periods of expansion.
B. The terms and multiples provide an indication of value reflecting the subject company’s owner/management view of similar property value, but may not be conclusive evidence of current value of the subject company as a whole.
C. Prior acquisitions reflect different economic and industry circumstances.

Chapter 15. Rules of Thumb and Other Market Methods BV201: Introduction to Business Valuation
BV201r v. 6.0 (11/15) Non-authoritative © 2015 American Society of Appraisers 5
D. Incorporation of the new divisions or operations may require time to absorb.
E. Economies of scale and synergies are often the result of acquisitions.

Appendix A ASA Business Valuation Standards

Page 1 ASA Business Valuation Standards© 2009 American Society of Appraisers
American Society of Appraisers
ASA Business ValuationStandards
This release of the approved ASA Business Valuation Standards of the American Society of Appraisers
contains all standards approved through November 2009, and is to be used in conjunction with the Uniform
Standards of Professional Appraisal Practice (USPAP) of The Appraisal Foundation and the Principles of
Appraisal Practice and Code of Ethics of the American Society of Appraisers. Periodic updates to these
Standards are posted to the Business Valuation Committee’s website www.bvappraisers.org.
The ASA Business Valuation Standards, including Statements on Business Valuation Standards, Advisory
Opinions and Procedural Guidelines have been published and/or revised as indicated in the following Table of
Contents.
TABLE OF CONTENTS
Item Title Effective Date Page
GENERAL PREAMBLE September 1992 4
Revised January 1994
Revised February 2001
Revised August 2002
Revised January 2004
Revised July 2008
ASA BUSINESS VALUATION STANDARDS (BVS)
(Standards provide minimum criteria for developing and reporting on
the valuation of businesses, business ownership interests, or securities)
BVS-I General Requirements for Developing a January 1992 5
Business Valuation Revised June 1993
Revised January 1994
Revised January 1996
Revised February 2001
Revised July 2008
BVS-II Financial Statement Adjustments September 1992 8
Revised January 1994
Revised February 2001
Revised July 2008
BVS-III Asset-Based Approach to January 1992 9
Business Valuation Revised January 1994
Revised February 2001
Revised August 2002
Revised July 2008
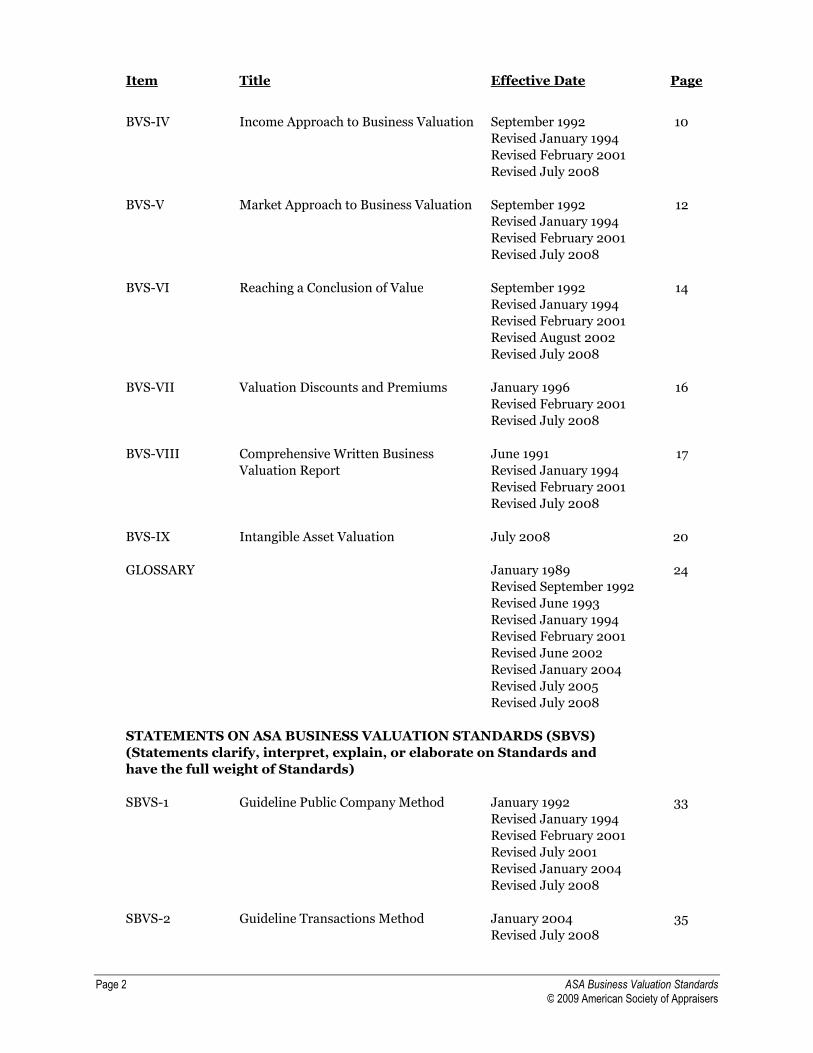
Page 2 ASA Business Valuation Standards© 2009 American Society of Appraisers
Item Title Effective Date Page
BVS-IV Income Approach to Business Valuation September 1992 10
Revised January 1994
Revised February 2001
Revised July 2008
BVS-V Market Approach to Business Valuation September 1992 12
Revised January 1994
Revised February 2001
Revised July 2008
BVS-VI Reaching a Conclusion of Value September 1992 14
Revised January 1994
Revised February 2001
Revised August 2002
Revised July 2008
BVS-VII Valuation Discounts and Premiums January 1996 16
Revised February 2001
Revised July 2008
BVS-VIII Comprehensive Written Business June 1991 17
Valuation Report Revised January 1994
Revised February 2001
Revised July 2008
BVS-IX Intangible Asset Valuation July 2008 20
GLOSSARY January 1989 24
Revised September 1992
Revised June 1993
Revised January 1994
Revised February 2001
Revised June 2002
Revised January 2004
Revised July 2005
Revised July 2008
STATEMENTS ON ASA BUSINESS VALUATION STANDARDS (SBVS)
(Statements clarify, interpret, explain, or elaborate on Standards and
have the full weight of Standards)
SBVS-1 Guideline Public Company Method January 1992 33
Revised January 1994
Revised February 2001
Revised July 2001
Revised January 2004
Revised July 2008
SBVS-2 Guideline Transactions Method January 2004 35
Revised July 2008

Page 3 ASA Business Valuation Standards© 2009 American Society of Appraisers
Item Title Effective Date Page
ADVISORY OPINIONS (AO)
(Advisory Opinions illustrate the applicability of Standards and
Statements in specific situations, offer advice for the resolution of
valuation issues, and are not binding)
AO-1 Financial Consultation and February 1997 37
Advisory Services Revised February 2001
Revised July 2008
PROCEDURAL GUIDELINES (PG)
(Procedural Guidelines suggest certain procedures that may be used in the
conduct of an assignment and are not binding)
PG-1 Litigation Support: Role of the July 2001 38
Independent Financial Expert Revised July 2008
PG-2 Valuation of Partial Ownership November 2009 43
Interests
Published by:
Business Valuation Committee
American Society of Appraisers
555 Herndon Parkway, Suite 125
Herndon, VA 20170

Page 4 ASA Business Valuation Standards© 2009 American Society of Appraisers
AMERICAN SOCIETY OF APPRAISERSASA Business Valuation Standards
General Preamble
I. The American Society of Appraisers, through its Business Valuation Committee, has adopted these
ASA Business Valuation Standards and Definitions (“the Standards”) in order to maintain and
enhance the quality of business valuations for the benefit of the business valuation profession and
users of business valuations.
II. The American Society of Appraisers, in its Principles of Appraisal Practice and Code of Ethics, and
The Appraisal Foundation, in its Uniform Standards of Professional Appraisal Practice (“USPAP”),
have established authoritative principles and a code of professional ethics. These Standards
incorporate the Principles of Appraisal Practice and Code of Ethics and the relevant portions of
USPAP, either explicitly or by reference, and are designed to clarify them and provide additional
requirements specifically applicable to the valuation of businesses, business ownership interests,
securities and intangible assets.
III. These Standards incorporate all relevant business valuation standards adopted by the American
Society of Appraisers through its Business Valuation Committee.
IV. These Standards provide minimum criteria to be followed by business appraisers in developing and
reporting the valuation of businesses, business ownership interests, securities and intangible assets.
V. If, in the opinion of the appraiser, the circumstances of a specific business valuation assignment
dictate a departure from any provision of any Standard, such departure must be disclosed and will
apply only to the specific provision.
VI. These Standards are designed to provide guidance to ASA members and to provide a structure for
regulating the development and reporting of business valuations through uniform practices and
procedures. Deviations from the Standards are not intended to form the basis of any civil liability and
should not create any presumption or evidence that a legal duty has been breached. Moreover,
compliance with these Standards does not create any special relationship between the appraiser and
any other person.

Page 5 ASA Business Valuation Standards© 2009 American Society of Appraisers
AMERICAN SOCIETY OF APPRAISERSASA Business Valuation Standards
BVS-I General Requirements for Developing aBusiness Valuation
I. Preamble
A. This Standard must be followed in all valuations of businesses, business ownership interests,securities and intangible assets developed by all members of the American Society of Appraisers,be they Candidates, Accredited Members (AM), Accredited Senior Appraisers (ASA), or Fellows(FASA).
B. The purpose of this Standard is to define and describe the general requirements for developingthe valuation of businesses, business ownership interests, securities and intangible assets.
C. This Standard incorporates the General Preamble to the ASA Business Valuation Standards.
II. Appropriate definition of the assignment
A. Business valuation is the act or process of determining the value of a business enterprise orownership interest therein.
B. In developing a valuation of a business, business ownership interest, security, or intangible asset,an appraiser must identify and define, as appropriate:
1. The client and other intended users
2. The purpose or intended use of the appraisal
3. The type of engagement as defined in BVS-I General Requirements for Developing a
Business Valuation, Section II.C
4. The business enterprise to which the valuation relates
5. The type of entity (e.g., corporation, limited liability company, partnership or other)
6. The state or jurisdiction of incorporation, if applicable
7. The principal business location (or headquarters)
8. The business interest under consideration
9. The standard of value applicable to the valuation (e.g., fair market value, fair value,
investment value, or other)
10. The premise of value (e.g., going concern, liquidation, or other)
11. The level of value (e.g., strategic control, financial control, marketable minority, or
nonmarketable minority) in the context of the standard of value, the premise of value, and
the relevant characteristics of the interest
12. The effective (or “as of”) date of the appraisal
13. Any extraordinary assumptions used in the assignment
14. Any hypothetical conditions used in the assignment

Page 6 ASA Business Valuation Standards© 2009 American Society of Appraisers
C. The nature and type of the engagement must be defined. An acceptable type of engagement willgenerally be one of the three types detailed below. Other types of engagements should beexplained and described.
1. Appraisal
a. An Appraisal is the act or process of determining the value of a business, business
ownership interest, security, or intangible asset.
b. The objective of an appraisal is to express an unambiguous opinion as to the value of a
business, business ownership interest, security or intangible asset which opinion is
supported by all procedures that the appraiser deems to be relevant to the valuation.
c. An appraisal has the following qualities:
(1) Its conclusion of value is expressed as either a single dollar amount or a range
(2) It considers all relevant information as of the appraisal date available to the
appraiser at the time of performance of the valuation
(3) The appraiser conducts appropriate procedures to collect and analyze all
information expected to be relevant to the valuation
(4) The valuation considers all conceptual approaches deemed to be relevant by the
appraiser
2. Limited appraisal
a. The objective of a limited appraisal is to express an estimate as to the value of a business,
business ownership interest, security or intangible asset. The development of this
estimate excludes some additional procedures that are required in an appraisal.
b. A limited appraisal has the following qualities:
(1) Its conclusion of value is expressed as either a single dollar amount or a range
(2) It is based upon consideration of limited relevant information
(3) The appraiser conducts only limited procedures to collect and analyze the
information that such appraiser considers necessary to support the conclusion
presented
(4) The valuation is based upon the conceptual approach(es) deemed by the
appraiser to be most appropriate
3. Calculation
a. The objective of a calculation is to provide an approximate indication of value of a
business, business ownership interest, security or intangible asset based on the
performance of limited procedures agreed upon by the appraiser and the client.
b. A calculation has the following qualities:
(1) It’s result may be expressed as either a single dollar amount or a range
(2) It may be based upon consideration of only limited relevant information
(3) The appraiser collects limited information and performs limited analysis
(4) The calculation may be based upon conceptual approaches agreed upon with the
client

Page 7 ASA Business Valuation Standards© 2009 American Society of Appraisers
III. Information collection and analysis
The appraiser shall gather, analyze and adjust the relevant information necessary to perform a
valuation appropriate to the nature or type of the engagement. Such information shall include:
A. Characteristics of the business, business ownership interest, security or intangible asset to bevalued, including rights, privileges, conditions, quantity, factors affecting control and agreementsrestricting sale or transfer
B. The nature, history and outlook of the business
C. Historical financial information for the business
D. Assets and liabilities of the business
E. The nature and conditions of relevant industries that have an impact on the business
F. Economic factors affecting the business
G. Capital markets providing relevant information; e.g., available rates of return on alternativeinvestments, relevant public stock market information and relevant merger and acquisitioninformation
H. Prior transactions involving the subject business, or involving interests in, the securities of, orintangible assets in the subject business
I. Other information deemed by the appraiser to be relevant
IV. Approaches, methods and procedures
A. The appraiser shall select and apply appropriate valuation approaches, methods and procedures.
B. The appraiser shall develop a conclusion of value pursuant to the valuation assignment asdefined, considering the relevant valuation approaches, methods and procedures, the informationavailable and appropriate premiums and discounts, if any.
V. Documentation and retention
The appraiser shall appropriately document and retain all information relied on and the work product
used in reaching a conclusion.
VI. Reporting
The appraiser shall report the appraisal conclusions to the client in an appropriate written or oral
format. Other than preliminary communications of results to a client, reporting on valuation
calculations, or reporting on engagements that do not result in conclusions of value, the report must
meet the requirements of Standard 10 of the Uniform Standards of Professional Appraisal Practice. In
the event the assignment results in a Comprehensive Written Business Valuation Report, the report
shall meet the requirements of BVS-VIII Comprehensive Written Business Valuation Report.

Page 8 ASA Business Valuation Standards© 2009 American Society of Appraisers
AMERICAN SOCIETY OF APPRAISERSASA Business Valuation Standards
BVS-II Financial Statement Adjustments
I. Preamble
A. This Standard must be followed in all valuations of businesses, business ownership interests,securities and intangible assets developed by all members of the American Society of Appraisers,be they Candidates, Accredited Members (AM), Accredited Senior Appraisers (ASA), or Fellows(FASA).
B. The purpose of this Standard is to define and describe the requirements for making financialstatement adjustments in the valuation of businesses, business ownership interests, securitiesand intangible assets.
C. This Standard applies to appraisals and may not necessarily apply to limited appraisals andcalculations as defined in BVS-I General Requirements for Developing a Business Valuation,Section II.C.
D. This Standard incorporates the General Preamble to the ASA Business Valuation Standards.
II. Conceptual framework
A. As a procedure in the valuation process, financial statements should be analyzed and, ifappropriate, adjusted. Financial statements to be analyzed include those of the subject entity andany entities used as guideline companies.
B. Financial statement adjustments are modifications to reported financial information that arerelevant and significant to the appraisal process. Adjustments may be appropriate for thefollowing reasons, among others:
1. To present financial data of the subject and guideline companies on a consistent basis
2. To adjust from reported values to current values
3. To adjust revenues and expenses to levels that are reasonably representative of continuing
results
4. To adjust for non-operating assets and liabilities, and any revenues and expenses related
to the non-operating items
C. Financial statement adjustments are made for the sole purpose of assisting the appraiser inreaching a conclusion of value.
III. Documentation of adjustments
All adjustments made should be fully described and supported.
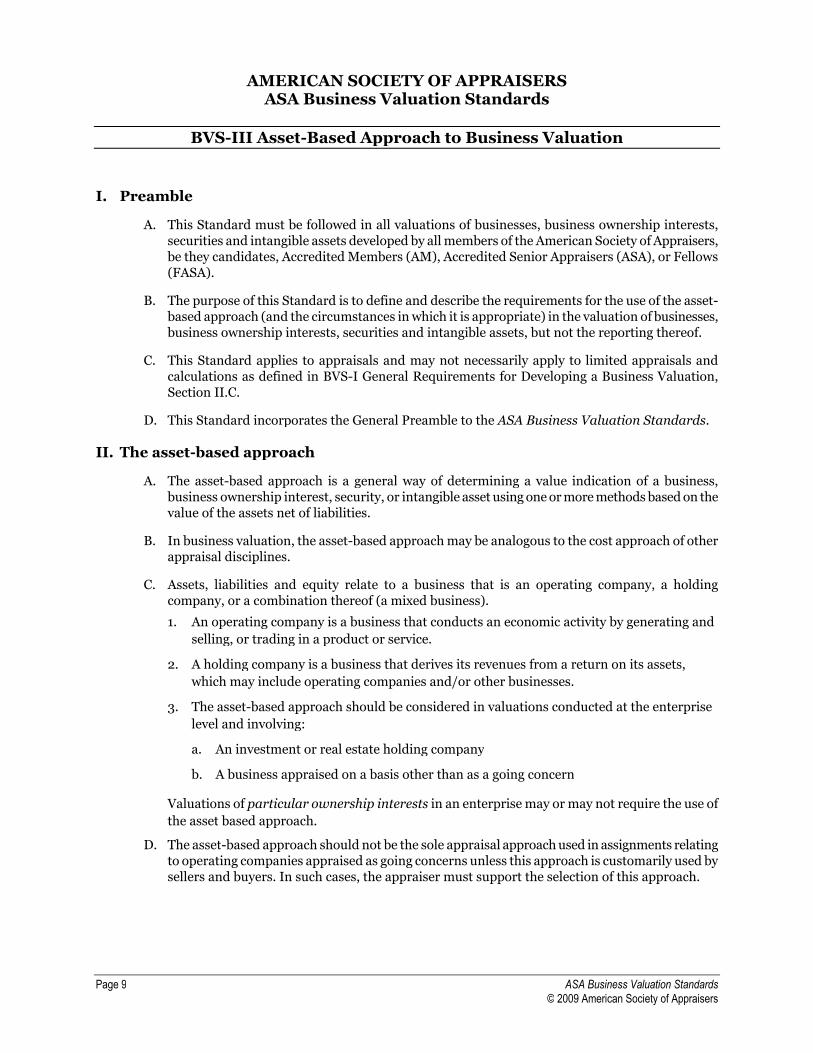
Page 9 ASA Business Valuation Standards© 2009 American Society of Appraisers
AMERICAN SOCIETY OF APPRAISERSASA Business Valuation Standards
BVS-III Asset-Based Approach to Business Valuation
I. Preamble
A. This Standard must be followed in all valuations of businesses, business ownership interests,securities and intangible assets developed by all members of the American Society of Appraisers,be they candidates, Accredited Members (AM), Accredited Senior Appraisers (ASA), or Fellows(FASA).
B. The purpose of this Standard is to define and describe the requirements for the use of the asset-based approach (and the circumstances in which it is appropriate) in the valuation of businesses,business ownership interests, securities and intangible assets, but not the reporting thereof.
C. This Standard applies to appraisals and may not necessarily apply to limited appraisals andcalculations as defined in BVS-I General Requirements for Developing a Business Valuation,Section II.C.
D. This Standard incorporates the General Preamble to the ASA Business Valuation Standards.
II. The asset-based approach
A. The asset-based approach is a general way of determining a value indication of a business,business ownership interest, security, or intangible asset using one or more methods based on thevalue of the assets net of liabilities.
B. In business valuation, the asset-based approach may be analogous to the cost approach of otherappraisal disciplines.
C. Assets, liabilities and equity relate to a business that is an operating company, a holdingcompany, or a combination thereof (a mixed business).
1. An operating company is a business that conducts an economic activity by generating and
selling, or trading in a product or service.
2. A holding company is a business that derives its revenues from a return on its assets,
which may include operating companies and/or other businesses.
3. The asset-based approach should be considered in valuations conducted at the enterprise
level and involving:
a. An investment or real estate holding company
b. A business appraised on a basis other than as a going concern
Valuations of particular ownership interests in an enterprise may or may not require the use of
the asset based approach.
D. The asset-based approach should not be the sole appraisal approach used in assignments relatingto operating companies appraised as going concerns unless this approach is customarily used bysellers and buyers. In such cases, the appraiser must support the selection of this approach.

Page 10 ASA Business Valuation Standards© 2009 American Society of Appraisers
AMERICAN SOCIETY OF APPRAISERSASA Business Valuation Standards
BVS-IV Income Approach to Business Valuation
I. Preamble
A. This Standard must be followed in all valuations of businesses, business ownership interests,securities and intangible assets developed by all members of the American Society of Appraisers,be they Candidates, Accredited Members (AM), Accredited Senior Appraisers (ASA), or Fellows(FASA).
B. The purpose of this Standard is to define and describe the requirements for the use of the incomeapproach in the valuation of businesses, business ownership interests, securities and intangibleassets, but not the reporting thereof.
C. This Standard applies to appraisals and may not necessarily apply to limited appraisals andcalculations as defined in BVS-I General Requirements for Developing a Business Valuation,Section II.C.
D. This Standard incorporates the General Preamble to the ASA Business Valuation Standards.
II. The income approach
A. The income approach is a general way of determining a value indication of a business, businessownership interest, security, or intangible asset by using one or more methods through whichanticipated benefits are converted into value.
B. Both capitalization of benefits methods and discounted future benefits methods are acceptable. Incapitalization of benefits methods, a representative benefit level is divided or multiplied by anappropriate capitalization factor to convert the benefit to value. In discounted future benefitsmethods, benefits are estimated for each of several future periods. These benefits are converted tovalue by applying an appropriate discount rate and using present value procedures.
III. Anticipated benefits
A. Anticipated benefits, as used in the income approach, are expressed in monetary terms.Anticipated benefits may be reasonably represented by such items as dividends or distributions,or various forms of earnings or cash flow.
B. Anticipated benefits should be estimated by considering such items as the nature, capitalstructure and historical performance of the related business entity, the expected future outlookfor the business entity and relevant industries, and relevant economic factors.
IV. Conversion of anticipated benefits
A. Anticipated benefits are converted to value by using procedures that consider the expected growthand timing of the benefits, the risk profile of the benefits stream and the time value of money.
B. The conversion of anticipated benefits to value normally requires the determination of acapitalization factor or discount rate. In that determination, the appraiser should consider suchfactors as the level of interest rates, the rates of return expected by investors on alternativeinvestments and the specific risk characteristics of the anticipated benefits.

Page 11 ASA Business Valuation Standards© 2009 American Society of Appraisers
C. In discounted future benefits methods, expected growth is considered in estimating the futurestream of benefits. In capitalization of benefits methods, expected growth is incorporated in thecapitalization factor.
D. The capitalization factors or discount rates should be consistent with the types of anticipatedbenefits used. For example, pre-tax factors or discount rates should be used with pre-tax benefits,common equity factors or discount rates should be used with common equity benefits and netcash flow factors or discount rates should be used with net cash flow benefits.
Page 12 ASA Business Valuation Standards© 2009 American Society of Appraisers
AMERICAN SOCIETY OF APPRAISERSASA Business Valuation Standards
BVS-V Market Approach to Business Valuation
I. Preamble
A. This Standard must be followed in all valuations of businesses, business ownership interests,securities and intangible assets developed by all members of the American Society of Appraisers,be they Candidates, Accredited Members (AM), Accredited Senior Appraisers (ASA), or Fellows(FASA).
B. The purpose of this Standard is to define and describe the requirements for the use of the marketapproach in the valuation of businesses, business ownership interests, securities and intangibleassets, but not the reporting thereof.
C. This Standard applies to appraisals and may not necessarily apply to limited appraisals andcalculations as defined in BVS-I General Requirements for Developing a Business Valuation,Section II.C.
D. This Standard incorporates the General Preamble to the ASA Business Valuation Standards.
II. The market approach
A. The market approach is a general way of determining a value indication of a business, businessownership interest, security or intangible asset by using one or more methods that compare thesubject to similar businesses, business ownership interests, securities or intangible assets thathave been sold.
B. Examples of market approach methods include the Guideline Public Company Method (seeSBVS-1) and the Guideline Transactions Method (see SBVS-2).
III. Reasonable basis for comparison
A. The business, business ownership interest, security or intangible asset used for comparison mustserve as a reasonable basis for comparison to the subject.
B. Factors to be considered in judging whether a reasonable basis for comparison exists include:
1. A sufficient similarity of qualitative and quantitative investment characteristics
2. The amount and verifiability of data known about the similar investment
3. Whether or not the price of the similar investment was observed in an arm’s-length
transaction, or in a forced or distressed sale
IV. Selection of valuation ratios
A. Comparisons are normally made through the use of valuation ratios. The computation and use ofsuch ratios should provide meaningful insight about the value of the subject, considering allrelevant factors. Accordingly, care should be exercised with respect to issues such as:
1. The selection of the underlying data used to compute the valuation ratios
2. The selection of the time periods and/or the averaging methods used for the underlying
data

Page 13 ASA Business Valuation Standards© 2009 American Society of Appraisers
3. The computation of the valuation ratios
4. The timing of the price data used in the valuation ratios (in relationship to the effective
date of the appraisal)
5. How the valuation ratios were selected and applied to the subject's underlying data
B. In general, comparisons should be made by using comparable definitions of the components ofthe valuation ratios. However, where appropriate, valuation ratios based on components that arereasonably representative of ongoing results may be used.
V. Rules of thumb
Rules of thumb may provide insight into the value of a business, business ownership interest, security
or intangible asset. However, value indications derived from the use of rules of thumb should not be
given substantial weight unless they are supported by other valuation methods and it can be
established that knowledgeable buyers and sellers place substantial reliance on them.

Page 14 ASA Business Valuation Standards© 2009 American Society of Appraisers
AMERICAN SOCIETY OF APPRAISERSASA Business Valuation Standards
BVS-VI Reaching a Conclusion of Value
I. Preamble
A. This Standard must be followed in all valuations of businesses, business ownership interests,securities and intangible assets developed by all members of the American Society of Appraisers,be they Candidates, Accredited Members (AM), Accredited Senior Appraisers (ASA), or Fellows(FASA).
B. The purpose of this Standard is to define and describe the requirements for reaching a finalconclusion of value in the valuation of businesses, business ownership interests, securities andintangible assets.
C. This Standard applies to appraisals and may not necessarily apply to limited appraisals andcalculations as defined in BVS-I General Requirements for Developing a Business Valuation,Section II.C.
D. This Standard incorporates the General Preamble to the ASA Business Valuation Standards.
II. General
A. The conclusion of value reached by the appraiser shall be based upon the applicable standard ofvalue, the purpose and intended use of the valuation, and all relevant information available as ofthe valuation date in carrying out the type of engagement for the assignment.
B. The conclusion of value reached by the appraiser will be based on value indications resulting fromone or more methods performed under one or more appraisal approaches.
III. Selection and weighting of methods
A. The selection of and reliance on appropriate methods and procedures depends on the judgment ofthe appraiser and not on any prescribed formula. One or more approaches may not be relevant toa particular situation, and more than one method under an approach may be relevant.
B. The appraiser must use informed judgment when determining the relative weight to be accordedto indications of value reached on the basis of various methods, or whether an indication of valuefrom a single method should be conclusive. The appraiser's judgment may be presented either ingeneral terms or in terms of mathematical weighting of the indicated values reflected in theconclusion. In any case, the appraiser should provide the rationale for the selection or weightingof the method or methods relied on in reaching the conclusion.
C. In assessing the relative importance of indications of value determined under each method, orwhether an indication of value from a single method should dominate, the appraiser shouldconsider factors such as:
1. The applicable standard of value
2. The purpose and intended use of the valuation
3. Whether the subject is an operating company, a real estate or investment holding
company, or a company with substantial non-operating or excess assets

Page 15 ASA Business Valuation Standards© 2009 American Society of Appraisers
4. The quality and reliability of data underlying the indication of value
5. Such other factors that, in the opinion of the appraiser, are appropriate for consideration
IV. Additional factors to consider
As appropriate for the valuation assignment as defined, and if not considered in the process of
determining and weighting the indications of value provided by various procedures, the appraiser
should separately consider the following factors in reaching a final conclusion of value:
A. Marketability or lack thereof, considering the nature of the business, the business ownershipinterest, security or intangible asset
B. The effect of relevant contractual and/or other legal restrictions
C. The condition of the market(s) in which the appraised interest might trade
D. The ability of an owner of the appraised interest to control the operation, sale, or liquidation ofthe relevant business
E. Such other factors that, in the opinion of the appraiser, are appropriate for consideration

Page 16 ASA Business Valuation Standards© 2009 American Society of Appraisers
AMERICAN SOCIETY OF APPRAISERSASA Business Valuation Standards
BVS-VII Valuation Discounts and Premiums
I. Preamble
A. This Standard must be followed in all valuations of businesses, business ownership interests,securities and intangible assets developed by all members of the American Society of Appraisers,be they Candidates, Accredited Members (AM), Accredited Senior Appraisers (ASA), or Fellows(FASA).
B. The purpose of this Standard is to define and describe the requirements for the use of discountsand premiums whenever they are applied in the valuation of businesses, business ownershipinterests, securities and intangible assets.
C. This Standard applies to appraisals and may not necessarily apply to limited appraisals andcalculations as defined in BVS-I General Requirements for Developing a Business Valuation,Section II.C.
D. This Standard incorporates the General Preamble to the ASA Business Valuation Standards.
E. This Standard applies at any time in the valuation process, whether within a method, to the valueindicated by a valuation method, or to the result of weighting or correlating methods.
II. The concepts of discounts and premiums
A. A discount has no meaning until the conceptual basis underlying the base value to which it isapplied is defined.
B. A premium has no meaning until the conceptual basis underlying the base value to which it isapplied is defined.
C. A discount or premium is warranted when characteristics affecting the value of the subjectinterest differ sufficiently from those inherent in the base value to which the discount or premiumis applied.
D. A discount or premium quantifies an adjustment to account for differences in characteristicsaffecting the value of the subject interest relative to the base value to which it is compared.
III. The application of discounts and premiums
A. The purpose, applicable standard of value, or other circumstances of an appraisal may indicatethe need to account for differences between the base value and the value of the subject interest. Ifso, appropriate discounts or premiums should be applied.
B. The base value to which the discount or premium is applied must be specified and defined.
C. Each discount or premium to be applied to the base value must be defined.
D. The primary reasons why each selected discount or premium applies to the appraised interestmust be stated.
E. The evidence considered in deriving the discount or premium must be specified.
F. The appraiser's reasoning in arriving at a conclusion regarding the size of any discount orpremium applied must be explained.

Page 17 ASA Business Valuation Standards© 2009 American Society of Appraisers
AMERICAN SOCIETY OF APPRAISERSASA Business Valuation Standards
BVS-VIII Comprehensive Written Business Valuation Report
I. Preamble
A. This Standard must be followed only in the preparation of comprehensive written businessvaluation reports developed by all members of the American Society of Appraisers, be theyCandidates, Accredited Members (AM), Accredited Senior Appraisers (ASA), or Fellows (FASA).
B. A business valuation report may be less comprehensive in content provided that the reportcomplies with the minimum content required by Standard 10.2 of USPAP.
C. The purpose of this Standard is to define and describe the requirements for the writtencommunication of the results of a business valuation, analysis, or opinion, but not the conductthereof, which may reflect the three types of engagements defined in BVS-I General Requirementsfor Developing a Business Valuation, Section II.C.
D. This Standard incorporates the General Preamble to the ASA Business Valuation Standards.
II. Signature and certification
A. An appraiser assumes responsibility for the statements made in a comprehensive written reportand accepts that responsibility by signing the report. To comply with this Standard, acomprehensive written report must be signed by the appraiser. For the purpose of this Standard,the appraiser is the individual or entity undertaking the appraisal assignment under a contractwith the client.
B. Clearly, at least one individual is responsible for the valuation conclusion(s) expressed in a report.A report must contain a certification, as required by Standard 10 of USPAP, in which theindividual(s) responsible for the valuation conclusion(s) must be identified.
III. Assumptions and limiting conditions
The following assumptions and/or limiting conditions must be stated:
A. Pertaining to bias. A report must contain a statement that the appraiser has no interest in theasset appraised, or other conflict that could cause a question as to the appraiser's independenceor objectivity; or, if such an interest or conflict exists, it must be disclosed.
B. Pertaining to data used. Where appropriate, a report must indicate that an appraiser relied ondata supplied by others, without further verification by the appraiser, as well as the sources thatwere relied on.
C. Pertaining to validity of the valuation. A report must contain a statement that a valuation isvalid only for the valuation date indicated and for the purpose stated.

Page 18 ASA Business Valuation Standards© 2009 American Society of Appraisers
IV. Definition of the valuation assignment
The precise definition of the valuation assignment is a key aspect of the report. The following are
components of such a definition and must be included in the report:
A. The business interest being valued must be clearly defined, such as “100 shares of the Class Acommon stock of the XYZ Corporation” or “a 20 percent limited partnership interest in the ABCLimited Partnership.” The existence, rights, and/or restrictions of other classes of ownership inthe subject business must also be adequately described if they are relevant to the conclusion ofvalue.
B. The purpose and use of the valuation must be clearly stated, such as “a determination of fairmarket value for ESOP purposes” or “a determination of fair value for dissenters' rightspurposes.” If a valuation is being performed pursuant to a particular statute, the statute must bereferenced.
C. The standard of value used in the valuation must be stated and defined.
D. The premise or basis of value, such as valuation on a going concern or liquidation basis, must bedefined.
E. The level of value, such as marketable minority or nonmarketable minority, must be defined.
F. The effective date and the report date must be stated.
G. Other elements as outlined in BVS-I General Requirements for Developing a Business Valuation,Section II.B, as appropriate.
V. Business description
A comprehensive written business valuation report must include a business description that covers
relevant factual matters related to the business, such as:
A. Form of organization (e.g., corporation, partnership, or other)
B. History
C. Products and/or services
D. Markets and customers
E. Management
F. Major assets, both tangible and intangible, and major liabilities
G. Outlook for the economy, industry, and business
H. Past transactional evidence of value
I. Sensitivity to seasonal or cyclical factors
J. Competition
K. Sources of information used
L. Such other factual information as may be required to present a clear description of the businessand the general context within which it operates

Page 19 ASA Business Valuation Standards© 2009 American Society of Appraisers
VI. Financial analysis
A. An analysis and discussion of a firm's financial statements is an integral part of a businessvaluation and must be included in a comprehensive written business valuation report. Exhibitssummarizing balance sheets and income statements for a period of years sufficient to the purposeof the valuation and the nature of the subject company must be included in the valuation report.
B. Any adjustments made to the reported financial data must be fully explained.
C. If projections of balance sheets or income statements are used in the valuation, key assumptionsunderlying those projections must be included and discussed.
D. If appropriate, the company's financial results in comparison to those of the industry in which itoperates must be discussed.
VII. Valuation methodology
A. The valuation method or methods selected, and the reasons for their selection, must be discussed.The steps followed in the application of the method(s) selected must be described. Thedescription of the methodology and the procedures followed must contain sufficient detail toallow the intended user of the report to understand how the appraiser reached the valuationconclusion.
B. The report must include explanations of how factors such as discount rates, capitalization rates,or valuation multiples were determined and used. The rationale and/or supporting data for anypremiums or discounts must be clearly presented.
VIII. Comprehensive written business valuation report format
The comprehensive written business valuation report must clearly communicate pertinent
information, valuation methods and conclusions in a logical progression, and must incorporate the
other specific requirements of this Standard, including the signature and certification provisions.
IX. Confidentiality of the report
No copies of the report may be furnished to persons other than the client without the client's specific
permission or direction unless ordered by a court of competent jurisdiction.

Page 20 ASA Business Valuation Standards© 2009 American Society of Appraisers
AMERICAN SOCIETY OF APPRAISERSBusiness Valuation Standards
BVS-IX Intangible Asset Valuation
I. Preamble
A. This Standard must be followed in all valuations of intangible assets developed by all members ofthe American Society of Appraisers, be they Candidates, Accredited Members (AM), AccreditedSenior Appraisers (ASA) or Fellows (FASA).
B. The purpose of this Standard is to define and describe the requirements for the valuation ofintangible assets.
C. This Standard applies to appraisals and may not necessarily apply to limited appraisals andcalculations as defined in BVS-I General Requirements for Developing a Business Valuation,Section II.C.
D. This Standard incorporates the General Preamble to the ASA Business Valuation Standards.
II. Principles
In developing an intangible asset valuation, an appraiser must:
A. Identify the intangible asset to which the valuation relates.
B. Identify and define the applicable items of BVS-I General Requirements for Developing aBusiness Valuation, Section II.B.
III. Valuation methodology
In valuing an intangible asset, the appraiser should consider appropriate approaches and methods.
Approaches that should be considered in valuing intangible assets are as follows:
A. Income Approach.
1. The appraiser should identify the economic benefits that are reasonably attributable to
the subject intangible asset, and the risks associated with realizing those benefits.
2. The appraiser should consider the economic benefit provided by the amortization of the
asset’s value for income tax purposes, where applicable.
3. The appraiser should consider whether the economic life of the intangible asset is
different from its legal or regulatory life.
B. Market Approach. The appraiser should consider relevant differences between the subject andguideline assets as well as respective market conditions.
C. Cost Approach. The appraiser should consider direct and indirect costs associated withreproduction or replacement, as the case may be, as well as any loss of value due to functional oreconomic obsolescence, or reduced life expectancy.

Page 21 ASA Business Valuation Standards© 2009 American Society of Appraisers
IV. Factors
In valuing an intangible asset, the appraiser should consider:
A. The bundle of legal rights, protections and limitations pertaining to the intangible asset to bevalued.
B. The history of the intangible asset.
C. The intangible asset’s expected remaining economic (useful) and legal life.
D. The economic benefits, direct or indirect, that the intangible asset is expected to provide to itsowner during the asset’s life.
E. Previous or existing litigation involving the intangible asset.
F. The distinction between an undivided interest and a fractional interest in the intangible assetresulting from, e.g., shared ownership or a licensing agreement.
G. The feasibility and character of potential commercial exploitation of the intangible asset.
H. Additional factors relating to the specific type of intangible asset to be valued, as appropriate.
See Appendix A below for illustrations of several intellectual property intangible assets.

Page 22 ASA Business Valuation Standards© 2009 American Society of Appraisers
APPENDIX A to BVS-IX: INTELLECTUAL PROPERTY EXAMPLES
The purpose of this Appendix is to illustrate asset type valuation factors in the context of intellectual property,
and to provide guidance to be considered in the valuation of the indicated assets.
I. Patents. A patent is a published, public document that grants an inventor or assignee specific rights
such as excluding others from making, using, or selling an invention, design or discovery within a specific
jurisdiction for a term of years. For an intangible asset such as a patent, the appraiser should consider the
following factors, as applicable (in addition to meeting all the other requirements of ASA Business
Valuation Standard BVS IX: Intangible Asset Valuation):
A. Scope of protection, such as jurisdictional coverage, status of registrations and maintenance fee
payments, breadth of patent claims and alternatives to the patented invention.
B. Risks of patent exploitation, such as infringement, invalidity, existence of technological or
economic barriers to successful commercialization, or alternative innovations that could reduce
the patent’s economic benefit.
C. Public and private information that may be available regarding the subject patent and comparable
or competing technologies, such as data from the United States Patent & Trademark Office
[USPTO], public disclosure filed with the Securities and Exchange Commission (“SEC”) and
market research.
D. In valuing a portfolio of patents, the appraiser should consider the relevant synergies enabled by
the aggregation of rights, such as:
1. Elimination of blocking patent rights
2. Obtaining design freedom, reducing the likelihood of infringement
3. Attainment of a broader, or more versatile or desirable mix of commercialization
possibilities
II. Trade Secrets. A trade secret is information that a business keeps secret in order to gain an advantage
over competitors. For an intangible asset in the nature of a trade secret, the appraiser should consider the
following factors, as applicable (in addition to meeting all the other requirements of ASA Business
Valuation Standard BVS IX: Intangible Asset Valuation):
A. The reasonableness and effectiveness of measures taken to ensure secrecy.
B. The possibility that the secret could be legitimately discovered and/or developed by competitors,
such as through independent research, development or engineering.
C. If potentially patentable, the potential benefits, costs and risks of patenting versus holding the
trade secret as a trade secret.

Page 23 ASA Business Valuation Standards© 2009 American Society of Appraisers
III. Trademarks. A trademark is a word, symbol or device that is used to denote a source of goods or
services. For an intangible asset in the nature of a trademark, the appraiser should consider the following
factors, as applicable (in addition to meeting all the other requirements of ASA Business Valuation
Standard BVS IX: Intangible Asset Valuation):
A. The ability to extend the trademark to related products or services, i.e., without infringing on the
trademarks of others.
B. The nature and extent of protections afforded by any registrations, including whether applicable
renewals are in effect.
C. Possibility of abandonment due to non-use.
D. Possibility of the mark becoming generic.
E. Public and private information that may be available regarding the subject trademark and
comparable or competing marks, such as USPTO data, public disclosure filed with the SEC,
market analysis and research and surveys.
IV. Copyrighted Works. A copyright is a creative expression, such as a writing, recording, play, or work
of art, which is protected by law against unpermitted copying. For an intangible asset in the nature of a
copyrighted work, the appraiser should consider the following factors, as applicable (in addition to
meeting all the other requirements of ASA Business Valuation Standard BVS IX: Intangible Asset
Valuation):
A. Scope of protection, such as jurisdictional coverage, status of registrations and renewals, and
whether the copyright relates to the original work or a particular derivative thereof.
B. Public and private information that may be available regarding the copyrighted work, and
comparable or competing works.
Page 24 ASA Business Valuation Standards© 2009 American Society of Appraisers
AMERICAN SOCIETY OF APPRAISERSASA Business Valuation Standards
Glossary
Preamble
The American Society of Appraisers, through its Business Valuation Committee, has adopted these Definitions
(“Definitions”) to ensure the quality of valuations by defining terms whose meanings are clear and consistently
applied for the benefit of appraisers, their clientele and other intended users.
A. These Definitions include the International Glossary of Business Valuation Terms as adopted by the
following professional societies and organizations:
American Institute of Certified Public Accountants
American Society of Appraisers
National Association of Certified Valuation Analysts
The Canadian Institute of Chartered Business Valuators
The Institute of Business Appraisers
The International Glossary of Business Valuation Terms are marked with an asterisk (*)
B. In the event that the assignment requires use of definitions that materially depart from those
contained herein, the appraiser should fully explain the reason for departure and the implications it
may have on the valuation assignment.
C. These Definitions provide guidance to ASA members by offering uniformity and consistency in the
course of applying valuation terms used in developing and reporting the valuation of businesses,
business ownership interests, securities and intangible assets.
D. Departure from these Definitions is not intended to form the basis of any civil liability and should not
create any presumption or evidence that a legal duty has been breached. Moreover, compliance with
these Definitions does not create any special relationship between the appraiser and any other person.

Page 25 ASA Business Valuation Standards© 2009 American Society of Appraisers
Definitions
Adjusted Book Value. The book value that results after asset or liability amounts are added, deleted, or
changed from their respective book amounts.
Adjusted Book Value Method.* A method within the asset approach whereby all assets and liabilities
(including off-balance sheet, intangible, and contingent) are adjusted to their fair market values (Note: In
Canada on a going concern basis).
Adjusted Net Asset Method.* See Adjusted Book Value Method.
Appraisal. See Valuation.
Appraisal Approach.* See Valuation Approach.
Appraisal Date.* See Valuation Date.
Appraisal Method.* See Valuation Method.
Appraisal Procedure.* See Valuation Procedure.
Appraised Value. The appraiser's opinion or conclusion of value.
Arbitrage Pricing Theory.* A multivariate model for estimating the cost of equity capital, which
incorporates several systematic risk factors.
Asset (Asset-Based) Approach.* A general way of determining a value indication of a business, business
ownership interest, security or intangible asset using one or more methods based on the value of the assets net
of liabilities.
Beta.* A measure of systematic risk of a stock; the tendency of a stock's price to correlate with changes in a
specific index.
Blockage Discount.* An amount or percentage deducted from the current market price of a publicly traded
stock to reflect the decrease in the per share value of a block of stock that is of a size that could not be sold in a
reasonable period of time given normal trading volume.
Book Value.* See Net Book Value.
Business.* See Business Enterprise.
Business Appraiser. A person who, by education, training and experience, is qualified to develop an
appraisal of a business, business ownership interest, security or intangible assets.
Business Enterprise.* A commercial, industrial, service, or investment entity (or a combination thereof)
pursuing an economic activity.
Business Risk.* The degree of uncertainty of realizing expected future returns of the business resulting
from factors other than financial leverage. See Financial Risk.
Business Valuation.* The act or process of determining the value of a business enterprise or ownership
interest therein.

Page 26 ASA Business Valuation Standards© 2009 American Society of Appraisers
Capital Asset Pricing Model (CAPM).* A model in which the cost of capital for any stock or portfolio of
stocks equals a risk-free rate plus a risk premium that is proportionate to the systematic risk of the stock or
portfolio.
Capitalization.* A conversion of a single period of economic benefits into value.
Capitalization Factor.* Any multiple or divisor used to convert anticipated economic benefits of a single
period into value.
Capitalization of Earnings Method.* A method within the income approach whereby economic benefits
for a representative single period are converted to value through division by a capitalization rate.
Capitalization Rate.* Any divisor (usually expressed as a percentage) used to convert anticipated economic
benefits of a single period into value.
Capital Structure.* The composition of the invested capital of a business enterprise, the mix of debt and
equity financing.
Cash Flow.* Cash that is generated over a period of time by an asset, group of assets, or business enterprise.
It may be used in a general sense to encompass various levels of specifically defined cash flows. When the term
is used, it should be supplemented by a qualifier (e.g., "discretionary" or "operating") and a specific definition
in the given valuation context.
Common Size Statements.* Financial statements in which each line is expressed as a percentage of the
total. On the balance sheet, each line item is shown as a percentage of total assets, and on the income
statement, each item is expressed as a percentage of sales.
Control.* The power to direct the management and policies of a business enterprise.
Control Premium.* An amount or a percentage by which the pro rata value of a controlling interest exceeds
the pro rata value of a non-controlling interest in a business enterprise, to reflect the power of control.
Cost Approach.* A general way of determining a value indication of an individual asset by quantifying the
amount of money required to replace the future service capability of that asset.
Cost of Capital.* The expected rate of return that the market requires in order to attract funds to a
particular investment.
Debt-Free.* Use of this term is discouraged. See Invested Capital.
Discount for Lack of Control.* An amount or percentage deducted from the pro rata share of value of 100
percent of an equity interest in a business to reflect the absence of some or all of the powers of control.
Discount for Lack of Liquidity. An amount or percentage deducted from the value of an ownership
interest to reflect the relative inability to quickly convert property to cash.
Discount for Lack of Marketability.* An amount or percentage deducted from the value of an ownership
interest to reflect the relative absence of marketability.
Discount for Lack of Voting Rights.* An amount or percentage deducted from the per share value of a
minority interest voting share to reflect the absence of voting rights.
Discount Rate.* A rate of return used to convert a future monetary sum into present value.

Page 27 ASA Business Valuation Standards© 2009 American Society of Appraisers
Discounted Cash Flow Method.* A method within the income approach whereby the present value of
future expected net cash flows is calculated using a discount rate.
Discounted Future Earnings Method.* A method within the income approach whereby the present value
of future expected economic benefits is calculated using a discount rate.
Discretionary Earnings. Earnings that may be defined, in certain applications, to reflect earnings of a
business enterprise prior to the following items:
• Income taxes
• Nonoperating income and expenses
• Nonrecurring income and expenses
• Depreciation and amortization
• Interest expense or interest income
• Owner’s total compensation for those services, which could be provided by a sole owner/manager.
Economic Benefits.* Inflows such as revenues, net income, net cash flows, etc.
Economic Life.* The period of time over which property may generate economic benefits.
Effective Date.* See Valuation Date.
Enterprise.* See Business Enterprise.
Equity.* The owner's interest in property after deduction of all liabilities.
Equity Net Cash Flows.* Those cash flows available to pay out to equity holders (in the form of dividends)
after funding operations of the business enterprise, making necessary capital investments, and increasing or
decreasing debt financing.
Equity Risk Premium.* A rate of return added to a risk-free rate to reflect the additional risk of equity
instruments over risk free instruments (a component of the cost of equity capital or equity discount rate).
Excess Earnings.* That amount of anticipated economic benefits that exceeds an appropriate rate of return
on the value of a selected asset base (often net tangible assets) used to generate those anticipated economic
benefits.
Excess Earnings Method.* A specific way of determining a value indication of a business, business
ownership interest, security or intangible asset determined as the sum of a) the value of the assets derived by
capitalizing excess earnings and b) the value of the selected asset base. Also frequently used to value intangible
assets. See Excess Earnings.
Fair Market Value.* The price, expressed in terms of cash equivalents, at which property would change
hands between a hypothetical willing and able buyer and a hypothetical willing and able seller, acting at arm’s
length in an open and unrestricted market, when neither is under compulsion to buy or sell and when both
have reasonable knowledge of the relevant facts. (Note: In Canada, the term "price" should be replaced with
the term "highest price")
Fairness Opinion.* An opinion as to whether or not the consideration in a transaction is fair from a
financial point of view.

Page 28 ASA Business Valuation Standards© 2009 American Society of Appraisers
Financial Risk.* The degree of uncertainty of realizing expected future returns of the business resulting
from financial leverage. See Business Risk.
Forced Liquidation Value.* Liquidation value, at which the asset or assets are sold as quickly as possible,
such as at an auction.
Free Cash Flow.* Use of this term is discouraged. See Net Cash Flow.
Going Concern.* An ongoing operating business enterprise.
Going Concern Value.* The value of a business enterprise that is expected to continue to operate into the
future. The intangible elements of Going Concern Value result from factors such as having a trained work
force, an operational plant, and the necessary licenses, systems, and procedures in place.
Going Concern Value. Refers to the intangible elements that result from factors such as having a trained
work force, an operational plant, and the necessary licenses, systems and procedures in place. Also refers to
the premise of value based on the concept that a business enterprise is expected to continue operations into
the future.
Goodwill.* That intangible asset arising as a result of name, reputation, customer loyalty, location, products,
and similar factors not separately identified.
Goodwill. That intangible asset arising as a result of elements such as name, reputation, customer loyalty,
location, products and related factors not separately identified and quantified.
Goodwill Value.* The value attributable to goodwill.
Goodwill Value. The value attributable to the elements of intangible assets above the identifiable tangible
and intangible assets employed in a business.
Guideline Public Company Method.* A method within the market approach whereby market multiples
are derived from market prices of stocks of companies that are engaged in the same or similar lines of
business, and that are actively traded on a free and open market.
Guideline Transactions Method. See Merger and Acquisition Method.
Holding Company. An entity that derives its returns from investments rather than from the sale of
products or services.
Hypothetical Condition. That which is contrary to what exists but is supposed for the purpose of analysis.
Income (Income-Based) Approach.* A general way of determining a value indication of a business,
business ownership interest, security, or intangible asset using one or more methods that convert anticipated
economic benefits into a present single amount.
Intangible Assets.* Non-physical assets such as franchises, trademarks, patents, copyrights, goodwill,
equities, mineral rights, securities and contracts (as distinguished from physical assets) that grant rights and
privileges, and have value for the owner.
Internal Rate of Return.* A discount rate at which the present value of the future cash flows of the
investment equals the cost of the investment.

Page 29 ASA Business Valuation Standards© 2009 American Society of Appraisers
Intrinsic Value.* The value that an investor considers, on the basis of an evaluation or available facts, to be
the "true" or "real" value that will become the market value when other investors reach the same conclusion.
When the term applies to options, it is the difference between the exercise price or strike price of an option and
the market value of the underlying security.
Invested Capital.* The sum of equity and debt in a business enterprise. Debt is typically a) all interest
bearing debt or b) long-term interest-bearing debt. When the term is used, it should be supplemented by a
specific definition in the given valuation context.
Invested Capital Net Cash Flows.* Those cash flows available to pay out to equity holders (in the form of
dividends) and debt investors (in the form of principal and interest) after funding operations of the business
enterprise and making necessary capital investments.
Investment Risk.* The degree of uncertainty as to the realization of expected returns.
Investment Value.* The value to a particular investor based on individual investment requirements and
expectations. (Note: in Canada, the term used is "Value to the Owner").
Key Person Discount.* An amount or percentage deducted from the value of an ownership interest to
reflect the reduction in value resulting from the actual or potential loss of a key person in a business
enterprise.
Levered Beta.* The beta reflecting a capital structure that includes debt.
Limited Appraisal. The act or process of determining the value of a business, business ownership interest,
security, or intangible asset with limitations in analyses, procedures, or scope.
Liquidation Value.* The net amount that would be realized if the business is terminated and the assets are
sold piecemeal. Liquidation can be either "orderly" or "forced.”
Liquidity.* The ability to quickly convert property to cash or pay a liability.
Liquidity. The ability to readily convert an asset, business, business ownership interest, security or
intangible asset into cash without significant loss of principal.
Majority Control.* The degree of control provided by a majority position.
Majority Interest.* An ownership interest greater than 50 percent of the voting interest in a business
enterprise.
Market (Market-Based) Approach.* A general way of determining a value indication of a business,
business ownership interest, security, or intangible asset by using one or more methods that compare the
subject to similar businesses, business ownership interests, securities or intangible assets that have been sold.
Market Capitalization of Equity.* The share price of a publicly traded stock multiplied by the number of
shares outstanding.
Market Capitalization of Invested Capital.* The market capitalization of equity plus the market value of
the debt component of invested capital.
Market Multiple.* The market value of a company's stock or invested capital divided by a company
measure (such as economic benefits, number of customers).

Page 30 ASA Business Valuation Standards© 2009 American Society of Appraisers
Marketability.* The ability to quickly convert property to cash at minimal cost.
Marketability. The capability and ease of transfer or salability of an asset, business, business ownership
interest, security or intangible asset.
Marketability Discount.* See Discount for Lack of Marketability.
Merger and Acquisition Method.* A method within the market approach whereby pricing multiples are
derived from transactions of significant interests in companies engaged in the same or similar lines of
business.
Mid-Year Discounting.* A convention used in the Discounted Future Earnings Method that reflects
economic benefits being generated at midyear, approximating the effect of economic benefits being generated
evenly throughout the year.
Minority Discount.* A discount for lack of control applicable to a minority interest.
Minority Interest.* An ownership interest less than 50 percent of the voting interest in a business
enterprise.
Multiple.* The inverse of the capitalization rate.
Net Assets. Total assets less total liabilities.
Net Book Value.* With respect to a business enterprise, the difference between total assets (net of
accumulated depreciation, depletion, and amortization) and total liabilities as they appear on the balance
sheet (synonymous with shareholders’ equity). With respect to a specific asset, the capitalized cost less
accumulated amortization or depreciation as it appears on the books of account of the business enterprise.
Net Cash Flows.* A form of cash flow. When the term is used, it should be supplemented by a qualifier (e.g.,
"equity" or "Invested Capital") and a specific definition in the given valuation context.
Net Income. Revenue less expenses and taxes.
Net Present Value.* The value, as of a specified date, of future cash inflows less all cash outflows (including
the cost of investment) calculated using an appropriate discount rate.
Net Tangible Asset Value.* The value of the business enterprise's tangible assets (excluding excess assets
and non-operating assets) minus the value of its liabilities. (Note: in Canada, tangible assets also include
identifiable intangible assets).
Non-Operating Assets.* Assets not necessary to ongoing operations of the business enterprise. (Note: in
Canada, the term used is "Redundant Assets").
Normalized Earnings*. Economic benefits adjusted for nonrecurring, non-economic, or other unusual
items to eliminate anomalies and/or facilitate comparisons.
Normalized Financial Statements.* Financial statements adjusted for non-operating assets and
liabilities and/or for nonrecurring, non-economic, or other unusual items to eliminate anomalies and/or
facilitate comparisons.
Operating Company. A business that conducts an economic activity by generating and selling, or trading in
a product or service.

Page 31 ASA Business Valuation Standards© 2009 American Society of Appraisers
Orderly Liquidation Value.* Liquidation value at which the asset or assets are sold over a reasonable
period of time to maximize proceeds received.
Portfolio Discount.* An amount or percentage deducted from the value of a business enterprise to reflect
the fact that it owns dissimilar operations or assets that do not fit well together.
Premise of Value.* An assumption regarding the most likely set of transactional circumstances that may be
applicable to the subject valuation; e.g., going concern, liquidation.
Present Value.* The value, as of a specified date, of future economic benefits and/or proceeds from sale,
calculated using an appropriate discount rate.
Price/Earnings Multiple.* The price of a share of stock divided by its earnings per share.
Rate of Return.* An amount of income (loss) and/or change in value realized or anticipated on an
investment, expressed as a percentage of that investment.
Redundant Assets.* See Non-Operating Assets.
Replacement Cost New.* The current cost of a similar new property having the nearest equivalent utility to
the property being valued.
Report Date.* The date conclusions are transmitted to the client.
Reproduction Cost New.* The current cost of an identical new property.
Required Rate of Return.* The minimum rate of return acceptable by investors before they will commit
money to an investment at a given level of risk.
Residual Value.* The value as of the end of the discrete projection period in a discounted future earnings
model.
Return on Equity.* The amount, expressed as a percentage, earned on a company’s common equity for a
given period.
Return on Investment.* See Return on Invested Capital and Return on Equity.
Return on Invested Capital.* The amount, expressed as a percentage, earned on a company’s total capital
for a given period.
Risk-Free Rate.* The rate of return available in the market on an investment free of default risk.
Risk Premium.* A rate of return added to a risk-free rate to reflect risk.
Rule of Thumb.* A mathematical formula developed from the relationship between price and certain
variables based on experience, observation, hearsay, or a combination of these; usually industry specific.
Special Interest Purchasers.* Acquirers who believe they can enjoy post-acquisition economies of scale,
synergies, or strategic advantages by combining the acquired business interest with their own.
Standard of Value.* The identification of the type of value being used in a specific engagement; e.g. fair
market value, fair value, investment value.

Page 32 ASA Business Valuation Standards© 2009 American Society of Appraisers
Sustaining Capital Reinvestment.* The periodic capital outlay required to maintain operations at
existing levels, net of the tax shield available from such outlays.
Systematic Risk.* The risk that is common to all risky securities and cannot be eliminated through
diversification. The measure of systematic risk in stocks is the beta coefficient.
Tangible Assets.* Physical assets (such as cash, accounts receivable, inventory, property, plant and
equipment, etc.)
Terminal Value.* See Residual Value
Transaction Method.* See Merger and Acquisition Method and Guideline Transactions Method.
Unlevered Beta.* The beta reflecting a capital structure without debt.
Unsystematic Risk.* The risk specific to an individual security that can be avoided through diversification.
Valuation.* The act or process of determining the value of a business, business ownership interest, security,
or intangible asset.
Valuation Approach.* A general way of determining a value indication of a business, business ownership
interest, security, or intangible asset using one or more valuation methods.
Valuation Date.* The specific point in time as of which the valuator's opinion of value applies (also referred
to as "Effective Date" or "Appraisal Date" or “as of” date).
Valuation Method.* Within approaches, a specific way to determine value.
Valuation Procedure.* The act, manner, and technique of performing the steps of an appraisal method.
Valuation Ratio.* A fraction in which a value or price serves as the numerator and financial, operating, or
physical data serves as the denominator.
Value to the Owner.* See Investment Value.
Voting Control.* de jure control of a business enterprise.
Weighted Average Cost of Capital (WACC). The cost of capital (discount rate) determined by the
weighted average, at market values, of the cost of all financing sources in the business enterprise's capital
structure.
Working Capital. The amount by which current assets exceed current liabilities.
Page 33 ASA Business Valuation Standards© 2009 American Society of Appraisers
AMERICAN SOCIETY OF APPRAISERSStatements on ASA Business Valuation Standards
SBVS-1 Guideline Public Company Method
I. Preamble
A. Statements clarify, interpret, explain, or elaborate on Standards. Statements have the full weightof Standards.
B. This Statement must be followed in all valuations of businesses, business ownership interests,securities and intangible assets developed by all members of the American Society of Appraisers,be they Candidates, Accredited Members (AM), Accredited Senior Appraisers (ASA), or Fellows(FASA).
C. The purpose of this Statement is to define and describe the requirements for the use of guidelinepublic companies in the valuation of businesses, business ownership interests, securities andintangible assets, when applicable, under BVS–V Market Approach to Business Valuation.
D. This Statement applies to appraisals and may not necessarily apply to limited appraisals andcalculations as defined in BVS-I General Requirements for Developing a Business Valuation,Section II.C.
E. This Statement incorporates the General Preamble to the ASA Business Valuation Standards.
II. Conceptual framework
A. Market transactions in the securities of publicly traded companies can provide objective,empirical data for developing valuation ratios for use in business valuation.
B. The development of valuation ratios from guideline public companies should be considered in thevaluation of businesses, business ownership interests, securities and intangible assets to theextent that adequate and relevant information is available.
C. Guideline public companies are companies with shares traded in the public securities marketsthat provide a reasonable basis for comparison to the investment characteristics of the company(or other interest) being valued. Ideal guideline companies are in the same industry as the subjectcompany; however, if there is insufficient market evidence available in that industry, it may benecessary to select other companies having an underlying similarity to the subject company interms of relevant investment characteristics such as markets, products, growth, cyclicalvariability, and other relevant factors.
III. Search for and selection of guideline companies
A. When using the Guideline Public Company Method, a thorough, objective search for guidelinepublic companies is required to establish the credibility of the valuation analysis.
B. The search procedure must include criteria for screening and selecting guideline publiccompanies.
C. Empirical data can be found in market-based valuation ratios of guideline public companies thatare engaged in the same business, in similar lines of business, or in businesses that share otherrelevant investment characteristics with the subject company.

Page 34 ASA Business Valuation Standards© 2009 American Society of Appraisers
IV. Financial data of guideline public companies
A. It is necessary to obtain and analyze financial and operating data on selected guideline publiccompanies, as available.
B. Adjustments to the financial data of the subject company and guideline public companies shouldbe considered to minimize differences in accounting treatments when such differences aresignificant.
C. Unusual or nonrecurring items should be analyzed and adjusted as appropriate.
V. Valuation ratios derived from guideline public companies
A. Comparisons are made through the use of valuation ratios. The computation and use of suchratios should provide meaningful insight about the value of the subject company, considering allrelevant factors. Accordingly, care should be exercised with respect to issues such as:
1. The selection of the underlying data used to compute the valuation ratios
2. The selection of the time periods and/or the averaging methods used for the underlying data
3. The computation of the valuation ratios, which may be derived by relating prices of theguideline public companies to the appropriate underlying financial, operating, or physicaldata of the respective guideline companies
4. The timing of the price data used in the valuation ratios (in relationship to the effective dateof the appraisal)
5. How the valuation ratios were selected and applied to the subject’s underlying data
B. In general, comparisons should be made using comparable definitions of the components of thevaluation ratios. However, where appropriate, valuation ratios based on components that arereasonably representative of ongoing results may be used.
C. Several valuation ratios may be selected for application to the subject company. These ratios mayrequire adjustment for differences in qualitative and quantitative factors between the guidelinepublic companies and the subject.
D. One or more indications of value may result from the use of the Guideline Public CompanyMethod. The appraiser must consider the relative importance or weight accorded to each of theindications of value used in arriving at the opinion or conclusion of value.
VI. Other factors and considerations
Adjustment may be necessary to the ratios or values for factors relating to the subject interest that
may not have been considered earlier in the appraisal, such as:
A. Degree of control
B. Degree of marketability and liquidity
C. Strategic or investment value issues
D. Size, depth of management, diversification of markets, products and services, and relative growthand risk
Page 35 ASA Business Valuation Standards© 2009 American Society of Appraisers
AMERICAN SOCIETY OF APPRAISERSStatements on ASA Business Valuation Standards
SBVS-2 Guideline Transactions Method
I. Preamble
A. Statements clarify, interpret, explain, or elaborate on Standards. Statements have the full weightof Standards.
B. This Statement must be followed in all valuations of businesses, business ownership interests,securities and intangible assets developed by all members of the American Society of Appraisers,be they Candidates, Accredited Members (AM), Accredited Senior Appraisers (ASA), or Fellows(FASA).
C. The purpose of this Statement is to define and describe the requirements for the use of guidelinetransactions in the valuation of businesses, business ownership interests, securities andintangible assets, when applicable, under BVS–V Market Approach to Business Valuation.
D. This Statement applies to appraisals and may not necessarily apply to limited appraisals andcalculations as defined in BVS-I General Requirements for Developing a Business Valuation,Section II.C.
E. This Statement incorporates the General Preamble to the ASA Business Valuation Standards.
II. Conceptual framework
A. Transactions involving the sale, merger or acquisition of businesses, business ownership interests,securities and intangible assets can provide objective, empirical data for developing valuationratios for use in business valuation.
B. The development of valuation ratios from guideline transactions of significant interests incompanies (or intangible assets, if applicable) should be considered in the valuation ofbusinesses, business ownership interests, securities and intangible assets to the extent thatsufficient and relevant information is available.
C. Guideline transactions are transactions involving companies (or interests) that provide areasonable basis for comparison to the investment characteristics of the company (or interest)being valued. Ideal guideline transactions are in the same industry as the subject company.However, if there is insufficient transactional information available in that industry, it may benecessary to select transactions involving other companies having an underlying similarity to thesubject company in terms of relevant investment characteristics such as markets, products,growth, cyclical variability and other relevant factors. Prior transactions in the company beingvalued may also be considered to be guideline transactions.
III. Search for and selection of transactions in guideline companies
A. When using the Guideline Transactions Method, a thorough, objective search for transactions ofinterests in companies similar to the company being valued is required to establish the credibilityof the valuation analysis.
B. The search procedure must include criteria for screening and selecting guideline transactions.
C. Empirical data can be developed from guideline transactions involving controlling or minorityinterests in publicly traded or closely held companies or intangible assets.
D. Empirical data can be developed from valuation ratios of guideline transactions involvingcompanies (or interests) in the same business, in similar lines of business, or in businesses thatshare other relevant investment characteristics with the subject company (or interest) whensufficient information is available regarding the transactions.
Page 36 ASA Business Valuation Standards© 2009 American Society of Appraisers
IV. Financial data of guideline companies
A. It is necessary to obtain and analyze relevant financial and operating data of the companiesinvolved in guideline transactions, as available.
B. Adjustments to the financial data of the subject company and the companies in the guidelinetransactions should be considered to minimize differences in accounting treatments when suchdifferences are significant.
C. Unusual or nonrecurring items should be analyzed and adjusted, as appropriate.
V. Valuation ratios derived from guideline transactions
A. Comparisons are made through the use of valuation ratios. The computation and use of suchratios can provide meaningful insight about the value of the subject, considering all relevantfactors. Accordingly, care should be exercised with respect to issues such as:
1. The selection of the underlying data used to compute the valuation ratios
2. The selection of the time periods and/or the averaging methods used for the underlying data
3. The computation of the valuation ratios, which may be derived by relating prices in guidelinetransactions to the appropriate underlying financial, operating, or physical data of therespective companies (or interests) involved in the transactions
4. The timing of the price data used in the valuation ratios (in relationship to the effective dateof the appraisal)
5. How the valuation ratios were selected and applied to the subject’s underlying data
B. Several valuation ratios may be selected for application to the subject company. These ratios mayrequire adjustment for differences in qualitative and quantitative factors between the companies(or interests) involved in the guideline transactions and the subject.
C. Guideline transactions typically involve a specific buyer and a specific seller. Informationregarding both the buyer and seller in a guideline transaction may be necessary in order to drawvaluation inferences from the transaction.
D. One or more indications of value may result from the use of the Guideline Transactions Method.The appraiser must consider the relative importance or weight accorded to each of the indicationsof value used in arriving at the opinion or conclusion of value.
VI. Other factors and considerations
Adjustments may be necessary to the ratios or values for factors that have not been considered earlierin the appraisal, such as:
A. Degree of control
B. Degree of marketability and/or liquidity
C. Timing differences between market transactions and the valuation date
D. Strategic or investment value issues
E. Size, depth of management, diversification of markets, products and services, and relative growthand risk

Page 37 ASA Business Valuation Standards© 2009 American Society of Appraisers
AMERICAN SOCIETY OF APPRAISERSASA Advisory Opinions
AO-1 Financial Consultation and Advisory Services
It is the opinion of the Business Valuation Committee that the ASA Business Valuation Standards and the
Uniform Standards of Professional Appraisal Practice of The Appraisal Foundation, as they apply to business
valuation issues, are intended to apply to appraisals that are formally developed and presented opinions of
value performed as the primary or ultimate objective of an appraisal engagement. These standards are not
intended to apply to financial consultation or advisory services where there is no expression of an opinion
value, or the primary or ultimate objective is not to express an opinion of value, including but not limited to,
fairness opinions, solvency opinions, pricing of securities for public offerings, feasibility studies, transfer
pricing studies, lifing studies of intangibles, estate planning or estate tax services, economic damage analysis
and quantification, litigation consulting, royalty rate studies for intangibles and similar engagements.

Page 38 ASA Business Valuation Standards© 2009 American Society of Appraisers
AMERICAN SOCIETY OF APPRAISERSProcedural Guidelines
PG-1 Litigation Support:Role of the Independent Financial Expert
I. Preamble
A. Business valuation professionals are frequently engaged as independent financial experts forpurposes of assisting in dispute resolution, litigation, or potential litigation. To preserve andenhance the quality of the services of such experts, the American Society of Appraisers, throughits Business Valuation Committee, has adopted this Procedural Guideline.
B. This Procedural Guideline incorporates, where appropriate, all relevant Business ValuationStandards and Statements on Standards adopted by the American Society of Appraisers throughits Business Valuation Committee.
C. This Procedural Guideline suggests specific procedures that may be used by experts. It is notbinding.
D. This Procedural Guideline is designed to offer guidance to ASA members providing litigation-support services. Deviations from this Procedural Guideline are not designed to be or intended tobe the basis of any civil liability, and should not create any presumption or evidence that a legalduty has been breached, or create any special relationship between the expert and any otherperson.
II. Performance of litigation support services
A. Litigation support services include any professional assistance provided to a client in a matterinvolving pending or potential litigation or dispute resolution proceedings before a trier of fact.
B. In rendering litigation support services, the expert may be retained to provide an expert opinionon the financial effects of facts and assumptions. In addition to forming an expert opinion, theexpert may value a business, project future financial results, analyze the performance of abusiness operation, interpret financial data, opine on an impaired stream of earnings, or renderother similar types of professional services.
C. In providing litigation-support services, an independent financial expert may play a role as:
1. Expert. One who is qualified by knowledge, skill, experience, training, or education inperforming business valuation services and/or related financial analyses.
2. Expert Witness. An expert who is engaged to explain technical, scientific, or specializedknowledge in order to assist the trier of fact in understanding evidence.
3. Arbitrator. An expert who serves as a trier of fact in an alternative dispute resolutioncontext.
4. Court-Appointed Expert. An expert who is engaged by a court to assist the trier of fact.
5. Consulting or Advisory Expert. An expert who is engaged to review another expert’swork product or who is engaged to advise the client, lawyer or another expert witness abouttechnical matters relating to the subject litigation, but who will not be called to testify at trial,and may or may not be independent. Accordingly, this Procedural Guideline may not apply tosuch an expert.
Page 39 ASA Business Valuation Standards© 2009 American Society of Appraisers
D. The expert should obtain a clear understanding of the type of the assignment.
E. When planning the scope of work for a particular engagement, the expert should obtain anunderstanding of the nature of the dispute, the events giving rise to the claim, as well as theeconomic context and industry outlook impacting the business and/or individual central to theassignment.
F. The expert should obtain sufficient relevant data to afford a reasonable basis for the conclusionsreached and/or recommendations made.
G. Sufficient information and documentation should be gathered by such means as inspection,inquiry, computation and analysis to ensure that the expert’s analysis and conclusion(s) areproperly supported. The expert should exercise professional judgment in determining the extentof the information and documentation necessary to support the conclusion.
H. The expert witness, arbitrator or court-appointed expert should maintain integrity, objectivityand independence.
I. The following examples represent some of the many types of cases in which an expert mayprovide litigation-support services in the area of business valuation and related financial analysis:
1. Business valuation
a. Determination of “fair value” of minority shares in dissenting stockholder and oppression
suits
b. Income, property, gift tax, and estate tax issues, including the determination of fair
market value in non-arm’s length transactions, allocation of purchase price among
different categories of assets, corporate reorganizations, rollovers, stockholder benefits,
deemed dispositions, gifts and bequests, capital gains, etc.
c. Valuation of shares held by an Employee Stock Ownership Plan
d. Separation and divorce
e. Partner/shareholder disputes
f. Business valuations
g. Buy-sell agreements
2. Quantification of financial loss or damages
a. Breach of contract and tort, including:
(1) measuring damages for lost profits and loss of goodwill
(2) defining relevant markets and calculating market share
(3) restating or reconstructing financial records
(4) developing profit and cost relationships
(5) creating pro-forma financial statements
b. Personal injury and fatality claims, including the quantification of impaired earnings
c. Insurance claims, including business interruption and disturbance losses
d. Condemnation/expropriation of business or property
e. Trespass and conversion
f. Professional malpractice
g. Anti-trust/unfair competition
h. Intellectual property-infringement damages
i. Bankruptcy and reorganization
Page 40 ASA Business Valuation Standards© 2009 American Society of Appraisers
III. Conducting the assignment
A. In performing the engagement, the expert should consider the appropriate method(s) to beadopted and procedures to be applied.
B. The expert should consider key assumptions and hypothetical conditions, determining thereasonableness and appropriateness thereof. The use of unwarranted assumptions may impairthe objectivity — actual or perceived — of the expert.
C. The expert should consider the necessity of relying on the work of a specialist. When there is suchreliance, the expert may wish to consider the specialist’s independence and competency. If theexpert relies upon a specialist, the conclusions drawn should be documented. Any written opinionor report from a specialist should be retained on file.
D. Work performed in the course of an engagement should be documented and files should bemaintained in an organized manner. The form and extent of work papers should suit thecircumstances and needs of the engagement for which they are prepared.
E. The expert should evaluate the necessity of obtaining a client representation letter and, if possibleand applicable, a representation letter from management or other representatives of theunderlying business.
F. The expert should either retain on file, or have access to, all information relied upon.
G. When the expert has determined that an engagement letter is required, the engagement lettershould be retained on file. When no engagement letter has been received, the expert’s file shouldinclude a summary of the nature and function of the assignment.
H. When the expert has determined that a client representation letter and/or a managementrepresentation letter is necessary, this (these) letter(s) should be retained on file.
I. The method(s) selected by the expert should be documented along with the reasons for selection.In addition, the specific procedures should be documented along with the reasons for selection.The expert should document key areas considered and significant assumptions made. A copy ofcalculations, explanations and documentation supporting the final conclusion should be retainedin the file.
J. The expert should follow the rules of the applicable jurisdiction.
IV. Preparation of an expert report
A. An expert report is often considered to constitute any communication, written or oral (and not indraft or preliminary form) that is prepared by an expert and that contains a conclusion pertainingto a review, analysis, or quantification of business value, damages, or economic loss and that is tobe used in litigation or arbitration proceedings.
B. It is recommended that the individual(s) responsible for the preparation of the expert report beidentified.
C. To the extent that it is both possible and appropriate, an expert report should contain, as aminimum, the following information:
1. Identity of client. The expert’s client(s) should be clearly identified.
2. Description of assignment. The expert report should contain a clear description as to the
specific nature of the expert’s assignment.

Page 41 ASA Business Valuation Standards© 2009 American Society of Appraisers
3. Effective date(s) or effective time period(s). Value(s) or damages should be expressed
as of a specific date or time period. In damage claims, the damages may relate to past, present
and/or future economic losses.
4. Intended use. If not already included in the description of the nature of the assignment, the
intended use of the expert report should be clearly stated, and use for other purposes should
be precluded.
5. Definitions. The expert report should contain the expert’s definition of key terms not
commonly defined. The expert should define or explain terms such as (but not limited to)
"damages," "economic loss," "loss of profits," "lost contribution margin."
6. Documents and information. The expert report should identify significant documents
and information relied upon and, if applicable, those reviewed but not relied upon.
7. Limitations. If the expert was unable to obtain, or was otherwise denied access to,
documents, information, and/or interviews, or where the information provided was
incomplete, this limitation should be clearly disclosed in the expert report. It may also be
appropriate to disclose the reasons for this limitation. To the extent that such limitation
would restrict the ability of the expert to form an opinion, it may be necessary to express a
qualified opinion, a disclaimer, or a denial of an opinion, depending on the specific
circumstances.
8. Relevant chronology. When relevant, the expert report should summarize the chronology
of events giving rise to the claim(s) in the litigation. The chronology of events, as set out in
the expert report, should be consistent with the effective date or time period.
9. Relevant context and financial analysis. When relevant, the expert report should
include an appropriate description of factors such as those listed in BVS VIII Comprehensive
Written Business Valuation Report, Section V, and a financial analysis such as the one
described in BVS VIII, Section VI.
10. Methodology. The expert report should contain a description of the method(s) adopted and
the reason(s) for their use.
11. Analysis. The expert report should provide adequate description in clear terms of how the
expert determined value, quantified economic losses, damages, etc.
12. Assumptions. The expert report should clearly state and identify the basis of all
assumptions, hypothetical conditions and limiting conditions that affected the analyses,
opinions and conclusions (see USPAP 10-2(a)(x)).
13. Conclusion. The expert report should clearly state the conclusions of the expert.
14. Report date. The expert report should be dated as of the day on which it is completed or
issued.
15. Exhibits, appendices, graphs, charts, schedules and tables. The use of visual aids in
the body of, or appending, the expert report should be made in an objective, unbiased and
professional manner, so that they can be properly interpreted by the trier of fact and others
connected with the litigation or arbitration.

Page 42 ASA Business Valuation Standards© 2009 American Society of Appraisers
V. Retention of work papers and report
A. The expert should retain fully-documented work papers for each engagement, whether in hardcopy or electronic copy. The expert should also retain summaries of oral reports or testimony (ora transcript of testimony) and all other data, information and documentation necessary tosupport the expert’s opinions and conclusions. Summaries of key meetings, discussions andcorrespondence should be retained on file.
B. The expert should maintain custody of the work papers, or make appropriate retention, access,and retrieval arrangements with the party having custody of those work papers. The expert shouldretain the work papers for a period of at least five (5) years after preparation, or at least two (2)years after final disposition of any judicial proceeding (including arbitration) in which testimonywas given, whichever period expires last.
C. A copy of the final issued expert report should be retained on file for a period of at least five (5)years after preparation, or at least two (2) years after final disposition of any judicial proceeding(including arbitration) in which testimony was given, whichever period expires last.

Page 43 ASA Business Valuation Standards© 2009 American Society of Appraisers
AMERICAN SOCIETY OF APPRAISERSProcedural Guidelines
PG-2 – Valuation of Partial Ownership Interests
I. Preamble
A. Business valuation professionals are frequently engaged as independent financial appraisers forpurposes of valuing fractional or partial ownership interests. To preserve and enhance the qualityof the services of such appraisers, the American Society of Appraisers, through its BusinessValuation Committee, has adopted this Procedural Guideline.
B. This Procedural Guideline incorporates, where appropriate, all relevant Business ValuationStandards and Statements on Standards adopted by the American Society of Appraisers throughits Business Valuation Committee.
C. The purpose of this Procedural Guideline is to define and describe the considerations andprocedures that may be used in valuing partial ownership interests in businesses, securities orother fractional interests in tangible or intangible property. It is not binding.
D. Deviations from this Procedural Guideline are not designed to be or intended to be the basis ofany civil liability, and should not create any presumption or evidence that a legal duty has beenbreached, or create any special relationship between the appraiser and any other person.
II. General principles
A. Partial ownership interests are interests of an enterprise or an asset of less than 100 percent.
Partial ownership interests may exist in various business entities and assets such as corporations,
limited liability companies, partnerships, and as direct fractional ownership of certain tangible
and intangible assets.
B. Partial ownership interests comprise a spectrum of positions, from nearly total control (e.g., a 95
percent stock ownership position in a corporation, or the sole general partner of a limited
partnership) to almost complete lack of control (e.g., a small block of non-voting corporate stock).
C. It is not possible to categorize partial interests in simple terms.
1. Generally, a partial ownership position in an entity or asset that is less than 50 percent may
be classified as a noncontrolling or minority interest. Similarly, an interest of greater than 50
percent often confers control. An exact 50 percent interest may have both control
characteristics (such as blocking power) and lack of control characteristics (such as inability
to proactively cause an action to be taken).
2. The degree of ownership does not always indicate the degree of control.
a. Governance documents, loan covenants, securities attributes (e.g., preferences,
voting versus non-voting, etc.) and other factors may confer control of an entity even
if the interest at issue is less than 50 percent.

Page 44 ASA Business Valuation Standards© 2009 American Society of Appraisers
b. A 60 percent limited partner may have no control over a partnership if removal of
the general partner requires a two-thirds majority vote of the limited partnership
interests.
c. A 2 percent ownership position might be in a position of limited control if there are
two other owners of 49 percent each who are at odds with one another. The same 2
percent owner would be in a completely different position if there was only one other
owner of 98 percent, or 49 other owners each owning 2 percent.
d. Three interests of one-third (33 1/3 percent) each provides yet another set of
potential valuation dynamics.
3. A complete listing of all the different potential combinations and permutations of ownership
structure and characteristics is beyond the scope of this Procedural Guideline.
D. Development of value for a partial interest can be a very different process from valuing the
underlying entity or asset as a whole. In addition, valuation of partial interests may or may not be
a direct function of the value of the underlying entity or asset as a whole.
1. It is the responsibility of the appraiser to determine if valuation of the underlying asset(s) or
entity as a whole is required in order to develop credible appraisal results for the partial
interest.
2. If ownership of a partial interest does not provide the ability to liquidate an entity, cause its
sale or gain access to any of the assets, valuation of the whole may not be relevant to the
analysis. However, if investors or market participants would nonetheless consider the value
of the whole irrespective of their inability to cause liquidation or sale of the entity or assets,
then valuation of the whole, either on a going concern or liquidation premise, may be
appropriate to consider in the analysis.
3. If ownership of a partial interest does provide the ability to cause liquidation of the
underlying entity or sale of the underlying asset, and value of the entity or asset depends
primarily on the asset-based approach, it may be appropriate to obtain qualified appraisals of
any real estate or personal property.
E. Valuation of partial ownership interests is often dependent on contractual provisions.
Consequently, rights and restrictions contained in documents such as articles of incorporation,
bylaws, partnership agreements, tenant-in-common agreements, option agreements, buy-sell
agreements or shareholder agreements may be relevant to the analysis. Similarly, value may be a
direct or indirect function of applicable laws and regulations.
F. Appraisers should be aware that the standard (type) and premise of value can have a material
effect on the value of a partial ownership interest. For example, valuation of a minority
shareholding under the “fair value” standard of value may be very different from its value under
the “fair market value” standard of value.
III. Factors to consider
A number of factors may be appropriate to consider in valuing partial ownership interests. The
following list is not intended to be all-inclusive. Items on the list may or may not be applicable in
specific valuation situations.

Page 45 ASA Business Valuation Standards© 2009 American Society of Appraisers
A. The purpose and definition of the valuation engagement in accordance with BVS–I General
Requirements for Developing a Business Valuation, including the applicable standard (type) and
premise of value.
B. Factors related to the underlying enterprise or asset, including:
1. The value of the underlying enterprise or asset, if applicable.
2. Enterprise-level or asset-level tax effects, if relevant.
C. Factors related to the subject partial interest, including:
1. Provisions in the organizational and governance documents that affect the rights,
restrictions, marketability and liquidity of the subject interest. Documents to consider may
include partnership agreements, articles of incorporation, bylaws, operating agreements,
buy-sell agreements, investment letter stock restrictions, option agreements, lock-up
requirements or others that may be relevant.
2. Applicable laws and regulations. Business examples include statutory rights to demand
dissolution of a corporation under state law, restrictions on transfer pursuant to SEC Rule
144, and many others. An asset example is included the right to partition.
3. The existing ownership structure and configuration.
4. Access to, availability of, and reliability of information regarding the underlying asset or
entity.
5. The relevant pool of potential buyers, if any.
6. Market data on transactions in similar markets, if any. Potentially similar markets might
include private placements in publicly or privately syndicated entities (including restricted
stock transactions, pre-IPO transactions, and transactions in publicly traded limited
partnerships) or tenants-in-common arrangements, etc.
7. Expected holding period for an investment in the subject interest, including consideration of
such factors as:
a. The extent to which the expected holding period may be uncertain.
b. Defined expiration or termination dates contained in the governing documents, or
other external factors, that may precipitate a foreseeable liquidation or sale of the
underlying entity.
c. Analysis of the age, health and other characteristics of the other owners and/or key
managers, which could provide information about the possible timing of a sale or
liquidation by the controlling owner(s).
d. The history of transactions (if any) involving partial (or possibly controlling)
interests of the subject enterprise or asset, including recapitalizations or stock
repurchases that have provided liquidity to shareholders.
e. The potential market for similar enterprises or assets (e.g., is the industry
consolidating?).

Page 46 ASA Business Valuation Standards© 2009 American Society of Appraisers
f. The emerging attractiveness of the entity for equity offering, sale, merger or
acquisition.
g. Provisions in the governing documents or buy-sell agreements, or under law or
regulation either prohibiting, restricting or allowing transfer of the subject interest.
h. Rights and powers attributable to the subject interest that may enable a sale of the
subject entity, asset or the interest itself, against the will of the other owners.
i. Historical actions of management and/or the directorate, which may provide
information about their policy and intentions regarding eventual sale of the entity or
asset, or receptivity to a potential sale or repurchase of partial interests.
j. The existence, depth and functioning of markets that might be available for interests
similar to the subject interest.
k. The appropriateness of considering a range of expected holding periods and exit
possibilities.
8. Expected economic benefits associated with the subject interest, which come in the form of
interim benefits (dividends or distributions) and a terminal cash flow when the investment is
sold or liquidated.
a. Expected interim dividends or distributions to the interest, which may differ from
the expected benefits (cash flows) generated by the entity or asset as a whole.
Interest-level benefits may be affected by such factors as:
(1) The history of dividends or distributions, including both timing and amounts.
(2) Current or expected future distribution policy.
(3) Preferential dividend claims.
(4) Enterprise-level and/or interest-level tax characteristics.
(5) The outlook for one-time and/or irregular dividends or distributions.
(6) Circumstances with controlling owners that may increase (or decrease) the
likelihood of future interim benefits.
b. The expected terminal cash flow at the end of the expected holding period(s), which
may be a function of such factors as:
(1) Possible future transactions involving the enterprise or asset as a whole, or
transactions in the subject interest itself.
(2) Current (valuation date) value and expected growth in value of the enterprise or
asset to the end of the expected holding period(s).
(3) Growth in value may be a function of expected earnings retention (distribution
policy) and the amount of and effectiveness of expected reinvestment in the
entity or asset.

Page 47 ASA Business Valuation Standards© 2009 American Society of Appraisers
9. Required return for investing in the subject interest. The required return may consider risks
other than risks related to the enterprise or asset as a whole, including for example:
a. The expected length and uncertainty of the holding period.
b. The likelihood of dividends or distributions (i.e., expected distribution policy).
c. The costs of due diligence efforts required to acquire the subject partial interest.
d. The costs of monitoring the investment over the expected holding period, including
issues related to the expected receipt of timely and reliable information concerning
the investment.
e. Required returns on similar investments or investments with similar investment-
specific liquidity and holding period characteristics.
f. The risk of tax liabilities from pass-through profits without guaranteed tax
distributions in entities such as limited liability companies, Subchapter S
corporations or partnerships.
g. The difficulty and cost of marketing the subject interest.
h. The risk of involuntary dilution when no preemptive rights are provided in the
articles of incorporation or bylaws of a corporation.
i. The degree of control conveyed by the subject interest.
10. Ownership-level tax effects, if relevant.
11. Prior transactions in the subject interest, entity or asset, and their relevance to a given
assignment.
D. Interaction of the factors listed above, and their cumulative impact on the degree of control,
marketability and liquidity of the subject interest.
IV.Approaches, methods and procedures
A. Appraisers should consider all three approaches to value (asset-based, income and market) when
valuing partial interests. If an approach is excluded in an assignment the appraiser should explain
the reason for such exclusion in the appraisal report.
B. It may be appropriate for the appraiser to obtain the assistance of legal counsel in order to gain a
reasonable familiarity and understanding of the legal and regulatory environment that may
influence or affect value. Similarly, it may be appropriate for the appraiser to obtain input from
counsel regarding governing documents and agreements.
C. If discounts or premiums are applied at the partial ownership level the appraiser should explain
how the discounts or premiums were developed, as required by BVS–VII Valuation Discounts and
Premiums.
D. If the income approach is used at the partial ownership level the appraiser should develop and
support any assumptions concerning the expected benefits to be received, the expected or
required holding period(s) and the appropriate required rate of return on the investment given
Page 48 ASA Business Valuation Standards© 2009 American Society of Appraisers
the risks associated with the subject ownership position. To the extent applicable the provisions of
BVS-IV Income Approach to Business Valuation should be followed.
E. If the market approach is used at the partial ownership interest level, several other sections of the
Standards may be applicable.
1. Discounts for lack of marketability (or discount rates) are sometimes developed, for example,
by reference to or analysis of restricted stocks of public companies, options on public
securities (such as long-term equity anticipation securities), pre-IPO transactions in private
companies that later went public, or other public securities. When using such methods, the
appraiser should follow the guidance of SBVS-I Guideline Public Company Method as well as
BVS-V Market Approach to Business Valuation and BVS-VII Valuation Discounts and
Premiums.
2. Similarly, appraisers using studies of transactions in the secondary market for private
partnership interests to develop discounts for lack of marketability (or discount rates) should
follow the guidance of SBVS-II Guideline Transactions Method, as well as BVS-V and BVS-
VII.
3. If transactional premium studies involving public companies (e.g., control premium studies)
are utilized by the appraiser to support discounts for lack of control (minority discounts), the
provisions of SBVS-I and BVS-VII should also be applied.
F. When reconciling the final value conclusion for a partial interest, regardless of the method(s)
employed, the appraiser may wish to consider one or more tests of reasonableness for the
concluded value of the partial interest, such as:
1. Calculating the implied internal rate of return for the subject interest at the concluded price
over the relevant range of expected holding periods, and comparing the implied internal rate
of return to expected returns of similar investments, if available.
2. Calculating the implied dividend or distribution yield for the investment based on the
expected dividend or distribution policy of the enterprise, and comparing the implied
dividend or distribution yield with expected yields on similar investments, if available.

Appendix B Data Analysis

BV201: Introduction to Business Valuation
BV201r v. 6.0 (11/15) Non-authoritative © 2014 American Society of Appraisers 1
Data Analysis This exhibit has been adapted from Understanding Business Valuation, published by the American Institute of Certified Public Accountants, and authored by Gary R. Trugman CPA/ABV, MCBA, ASA, MVS, the developer of this course. In this section, I will attempt to explain what to do with all of the data that you would have obtained during the data gathering process. This will include a discussion on how to use the data, as well as what it means. Therefore, in this section I will discuss the following:
Economic analysis Industry analysis Subject company analysis Financial analysis Financial statement adjustments
Introduction Data analysis is an important component of the valuation process. Since assessment of risk is a goal of the valuation analyst, the analysis of the information collected must be performed with a view toward the future of the business. In general, we feel more comfortable using historical information for a valuation, but we have to remember that a "willing buyer" is not interested in buying history. As valuation analysts, it is our role to assess how much the future will resemble the past. To the extent the past resembles the future, and to that extent the past is predictive of the future, only then can we value the business. Economic Analysis Revenue Ruling 59-60 tells us to consider "the economic outlook in general and the condition and outlook of the specific industry in particular." During the analysis of the economy, the valuation analyst attempts to determine the economic risks associated with the subject business. Questions regarding the demand for the company's goods or services and the sources of supply are frequently asked. The outlook for the general economic trends that might affect supply and demand for the company's goods and services should be thoroughly investigated. This analysis must be relevant to the appraisal subject, not just boilerplate. For example, if the appraisal subject is a construction company, economic factors such as interest rates, housing starts, and building permits may be important. How important are they if the appraisal subject is a cardiovascular surgery practice? Another component of the economy that should be considered by the valuation analyst is where in the economic cycle the appraisal subject is at the date of the appraisal. If the economy is in a recession, it will make a big difference whether the recession is just starting or is about to end. Depending upon where the company is in the economic cycle, the short-term and long-term projections may be radically different. Since valuation is a prophecy of the future, this would be extremely important to the "willing" buyer, since he or she would have to ride out the balance of the cycle.

BV201: Introduction to Business Valuation
BV201r v. 6.0 (11/15) Non-authoritative © 2014 American Society of Appraisers 2
The economic analysis will be used in at least two sections of the appraisal assignment. The economic outlook will be helpful in forecasting the future performance of the subject company. The economic analysis will also help the valuation analyst in performing an analysis of the economic risk that the company is exposed to. This will be one of the many considerations in the determination of (1) the pricing multiples used in the market approach and (2) the discount or capitalization rates used in the income approach. During the management interview, the valuation analyst will want to ask company representatives about how the economy impacts the business. Some businesses are cyclical with the economy, while others may be counter-cyclical; these businesses react opposite to the economy. An example of one such business is a tractor-trailer driving school. When the economy is strong, business is bad. When the economy is weak, business is good. Why? During a good economy, people are working and they are not necessarily looking to be retrained in a new field. During a bad economy, economic layoffs require people to find new employment. The issues for the valuation analyst to consider about training schools are: Is available funding for the students (if they are unemployed, they may not want to or be able to spend $2,000+ for education), and after the students complete the course, will the economy turn around so that drivers will be needed? Exhibit 1 gives you an illustration of a sample economic section from a real report.
Exhibit 1 Economy Section
The performance of every entity is influenced by the larger economic factors that operate at the national and local levels. Past performance must be evaluated in relation to the economic climate within which that business has been operating, and an intelligent assessment of future performance cannot be made without accounting for the projected forces that will impact that business in the nearer and longer terms.
NATIONAL ECONOMY1 According to advance estimates released by the Department of Commerce’s Bureau of Economic Analysis, Real Gross Domestic Product (“GDP”), the output of goods and services produced by labor and property located in the United States, increased at an annualized rate of 1.6 percent during the third quarter of 2006. This is the 20th consecutive quarterly rise in GDP subsequent to the 2001 recession, and compares to a revised increase of 2.6 percent in the second quarter of 2006. The third quarter 2006 increase represented the smallest increase since the first quarter of 2003, while the first quarter measure (5.6 percent) represented the largest quarterly increase since the third quarter of the same year. While the slowdown in GDP growth evidenced in the third quarter was anticipated by economists, it was greater than anticipated. The growth in real GDP in the third quarter reflected increases in personal consumption expenditures (“PCE”), exports, equipment and software, nonresidential structures, and state and local government spending. These factors were partly offset by a negative contribution from residential fixed investment and imports. Economists note that GDP for all of 2005 grew 3.2 percent, down from the 3.9 percent in 2004 which represented the nation’s most favorable economic performance since 1999. Although GDP growth was expected to slow in the third quarter, most economists predicted somewhat higher growth in GDP (2.0 to 2.5 percent) than the 1.6 percent preliminary estimate for the third quarter. GDP is expected to improve slightly for the remainder of 2006. Economists predict GDP growth on the order of 2.5 percent for the fourth quarter of the year. Growth for 2007 is expected to remain steady at 2.5 to 2.7 percent. Expected lackluster GDP growth is primarily the result of a cooling housing market; however, economists believe the worst of the residential decline has passed. Improvement over third quarter growth figures will stem from lower energy prices, improved trade, and consumer spending.
1
Adapted from The National Economic Review (3rd Quarter 2006), Mercer Capital. Reprinted with permission. www.mercercapital.com.

BV201: Introduction to Business Valuation
BV201r v. 6.0 (11/15) Non-authoritative © 2014 American Society of Appraisers 3
The Federal Reserve’s Open Market Committee (“FOMC”) kept its target for the federal funds rate unchanged at 5.25 percent during the third quarter. This marks the first quarter since the latter part of 2003 that the FOMC has not raised interest rates. In its staff forecast, significantly lower energy prices, sustained increases in labor income, and favorable labor market conditions were among the factors underlying a more favorable outlook during the third quarter. The staff forecast suggests that due in particular to the cooling housing market, growth would be subdued over the balance of the year. However, once the housing correction has abated, the forecast states that growth is likely to strengthen and economic expansion would probably track close to the rate of growth of the economy’s potential next year and in 2008. It was noted that core inflation has been running at an undesirably high rate, and although core inflation is expected to decline gradually, substantial uncertainty remains with this outlook. The Consumer Price Index decreased 0.5 percent to 202.9 in September. The seasonally adjusted annual rate (“SAAR”) of inflation for the third quarter of 2006 was 0.8 percent, compared to changes of negative 1.8 percent, 4.3 percent, and 5.1 percent respectively, for the last quarter of 2005 and the first two quarters of 2006. For the 12 month period ended in December 2005, inflation rose 3.4 percent. The core rate of inflation rose at a 2.7 percent SAAR during the third quarter of 2006 following increases of 2.6 percent, 2.8 percent, and 3.6 percent for the last quarter of 2005 and the first two quarters of 2006, respectively. In 2004 and 2005, the core rate of inflation advanced 2.2 percent. The Producer Price Index fell 1.3 percent in September, after increases of 0.1 percent in both July and August. The PPI fell 4.4 percent (SAAR) for the third quarter after declining 2.0 percent in the first quarter of 2006 and increasing 6.4 percent in the second quarter (all figures recently revised). The PPI increased 5.4 percent for 2005 following a 4.2 percent increase in 2004. The unemployment rate was at 4.6 percent in September, unchanged from second quarter levels and in line with estimates. The 4.6 percent third quarter rate is at its lowest level in nearly five years. September payroll increased by 51,000 jobs, following a gain of 188,000 jobs in August. Economists had expected a larger increase on the order of 120,000 for the month. Manufacturing payrolls decreased by 19,000 in September, following a decrease of 7,000 in August. Economists anticipate payroll growth for October to approach 135,000 jobs. New privately owned housing starts were at a seasonally adjusted annualized rate of 1.772 million units in September, 5.9 percent above the revised August estimate and 17.9 percent below the September 2005 level. Single-family housing starts were 1.426 million which is 4.3 percent higher than the August figure. An estimated 2.068 million privately owned housing units were started in 2005, 5.8 percent higher than in 2004, marking the highest construction volume since 1972. The seasonally adjusted annual rate of private housing units authorized by building permits was 1.619 million units in September, 6.3 percent below the revised August rate of 1.727 million units. Economic growth in the third quarter of 2006 represented a noticeable decline from first quarter results. This decrease was not unexpected by economists, although the decrease was greater than initially anticipated. Surveys of private sector economists suggest GDP is projected to grow at a 2.5 percent rate in the final quarter of 2006 and 2.5 percent to 2.7 percent for the first half of 2007. This is short of the 4.1 percent growth achieved, on average, over the past two and a half years. This deceleration in growth is expected to be at least partially due to the continuing decline in the housing sector which began in 2006. However, experts note that what consumers are not spending on construction improvements, they are instead spending on personal consumption. This somewhat mitigates the downward effect on GDP. Additionally, a respite from high fuel prices has shored up consumer spending, which, if sustained, should bolster GDP. Despite declining growth rates, economists do not foresee a high likelihood of recession in the near future. The Federal Reserve’s outlook concurs with that of the private economists by suggesting real GDP growth will continue to slow into the second half of 2006 (due to the cooling of the housing market and lower motor vehicle production) before strengthening gradually thereafter. Inflation readings were elevated during the third quarter, but inflation is not expected to be a major problem for the remainder of the year. Economists are moderately bullish on the stock market through 2007 and decidedly optimistic long-term. The Federal Reserve is expected to hold rates steady through the end of 2006, but possibly raise rates once by the middle of 2007. The goal is for interest rates to be at a low enough level to continue to spur expansion, while keeping inflation fears low. The Dow closed the third quarter at 11679.07, up 4.7 percent for the quarter. The S&P 500 index rose 5.2 percent during the quarter to close at 1335.85 following a 1.9 percent decrease in the second quarter. The NASDAQ Composite Index rose 4.0 percent during the third quarter to close at 2258.43, following a 7.2 percent decrease in the second quarter. The NASDAQ rose 1.4 percent in 2005. The broad market Wilshire 5000 index closed at 13383.30, up 4.2 percent for the quarter. The Wilshire 5000 index reflected a gain of 4.6 percent for 2005. The monthly average yields-to-maturity on the 20-year Treasury bond during the third quarter of 2006 were 5.25 percent, 5.08 percent, and 4.93 percent, respectively, for July, August, and September. Table 1 presents stock market performance for the period prior to the valuation date.

BV201: Introduction to Business Valuation
BV201r v. 6.0 (11/15) Non-authoritative © 2014 American Society of Appraisers 4
TABLE 1
CLOSING STOCK MARKET AVERAGES
November 15,
2006November 21,
2006% Change
1 Week
% Change12 Months
Dow Jones Industrial Average 12251.71 12321.59 +0.6% +13.9%Standard & Poor’s 500 1396.57 1402.81 +04% +11.8%N.Y. Stock Exchange Composite 8901.55 8918.08 +0.2% +16.2%NASDAQ Composite 2442.75 2454.84 +0.5% +9.5%NASDAQ 100 1793.82 1808.88 +0.8% +7.3%American Stock Exchange Index 2010.56 2022.19 +0.6% +17.9%Value Line (Geometric) 455.53 456.45 +0.2% +11.0%Value Line (Arithmetic) 2198.86 2204.52 +0.3% +15.7% Source: Value Line Investment Survey - Selection & Opinion, December 1, 2006: 4989.
LOCAL ECONOMY The appraisal subject has various locations in the State of Florida. Three of the four are located within Broward County, in the cities of Coral Springs, Davie, and Weston. The fourth is located in the City of Tallahassee. Gross State Product (GSP) is a measurement of the economic output of a U.S. State. It is the sum of all value added by industries within the state and serves as a counterpart to GDP. From 1997 to 2004, Florida’s GSP grew by an average annual growth rate of 4.2 percent and ranked seventh of all states in the U.S. From 2004 to 2005, the growth rate was 7.7 percent, which was the third highest in the country.2 Florida’s October 2006 unemployment rate was 3.1 percent. The rate was down 0.4 percentage points from 3.5 percent a year ago. The October rate is also 1.3 percentage points lower than the national rate of 4.4 percent. Florida’s unemployment rate has been below the national average since mid-2002.3 Florida’s economy relies heavily on tourism. About 60 million visitors visit the state every year. Other major industries include citrus fruit and juice production, banking and aerospace.4 Broward County had a population of 1,623,018, making it the second most populated county in the state. According to a report released by the U.S. Census Bureau on August 4, 2006, the total population had risen to 1.8 million people in 2005, an increase of approximately 10.9 percent. Since the 2000 census, the percentage of the population identified as non-Hispanic white has now dropped to less than half. Broward County is one of the three counties that comprise the South Florida metropolitan area.5 Coral Springs, located in Broward County, Florida had a population of 117,549 at the 2000 census. According to U.S. Census estimates of 2005, the city grew by 9.6 percent to a population of 128,804. Coral Springs was ranked 27th in Money Magazine’s 2006 list of “100 Best Places to Live,” the highest-ranked Florida city. It was also ranked among the 2006 top 10 safest places to live in the United States by Magan Quitnopress using FBI statistics. As of the 2000 census, there were 39,522 households, out of which 48.4 percent had children under the age of 18 living with them. The median income for a household in the city was $58,459, and the median income for a family was $64,193.6 Davie is also located in Broward County, Florida. As of the 2000 census, the town had a total population of 75,720. As of 2004, the population estimated by the U.S. Census Bureau was 82,579, an increase of approximately 9 percent. Davie has always had a reputation as a “western” town. It boasts a huge horse owning population and once was home to many herds of cattle. As of the 2000 census, there were 28,682 households, out of which 36.7 percent had children under the age of 18. The median income for a household in the city was $47,014 and the median income for a family was $56,290. A large number of educational institutions have campuses in Davie including Nova Southeastern University, Florida International University, Florida Atlantic University, and the University of Florida. It is also home to the Miami Dolphins Training Facility.7
2
U.S. Department of Commerce, Bureau of Economic Analysis “Gross Domestic Product (GDP) by State,” 02005, (October 26, 2006) <http://bea.gov/bea/newsrel/GSPNewsRelease.htm> (accessed November 30, 2006).
3 Florida Agency for Workforce Innovation, “Florida Employment & Unemployment,” (November 17, 2006).
4 Adapted from Chamber of Commerce information.
5 Ibid.
6 Ibid.
7 Ibid.

BV201: Introduction to Business Valuation
BV201r v. 6.0 (11/15) Non-authoritative © 2014 American Society of Appraisers 5
Weston is a city also located in Broward County, Florida. Established as a city in 1996, much of the community was developed by Arvida/JMB Partners and is located near the western developmental boundary of Broward County. As of July 2004, the city had a total population of 63,534. The town is home to an 800 year old Tequesta Indian burial mound. In 2006, CNN Money Magazine ranked Weston 20th in America in the "Biggest Earners" category, which ranks the 13 cities in America with the highest incomes. It was also ranked as the city with largest job growth in Florida and 18th largest in the nation. Business Week ranked Weston as the 11th most affordable suburb in the United States. It is jokingly referred to as "Westonzuela" due to the large number of Venezuelan immigrants who have made the city their home.8 Tallahassee is the capital of the State of Florida and the county seat of Leon County. As of 2004, the population recorded by the U.S. Census Bureau was 156,512, while the Tallahassee metro area was estimated at 255,500. Tallahassee is the home of Florida State University and Florida A&M University. In recent years, Tallahassee has seen an uptick in growth, mainly in government and research services associated with the state and Florida State University. Tallahassee is the 12th fastest growing metropolitan area in Florida. Its 12.4 percent growth rate is higher than both Miami and Tampa. As of the 2000 census, there were 63,217 households, out of which 21.8 percent had children under the age of 18 living with them. The median income for a household in the city was $30,571, and the median income for a family was $49,359. Educationally, Leon County is the highest educated county in Florida with 4.9 percent of the population possessing a Bachelor’s, Masters, professional or doctorate degree. This is well above the Florida average of 22.4 percent and the national average of 24.4 percent.9
Let me point out a few things to you about the exhibit. First, if you notice, we footnote our sources. In fact, we footnoted the fact that our national economy was adapted from a service that we subscribe to. Why recreate the wheel? It is perfectly acceptable to buy an economic report. Just make sure that you read it, modify it to fit the assignment, and do not just merely slap it into the back of the report. Also, in this appraisal, the local economy mattered as well, so we covered the parts of the state that we considered to be important to the appraisal subject. Industry Analysis The purpose of the industry analysis is to allow a comparison of the appraisal subject with the industry as a whole, as well as to allow the valuation analyst to use industry forecasts to help predict how the subject company will perform in the future. Questions frequently raised about the industry include the following: • Who makes up the industry? Are there many companies or are there very few companies
that control everything? • Is it a cyclical industry? • Is it a new industry with many new companies entering it, or is it a mature industry that
has reached its saturation point? • What are the barriers to entry, if any, into the industry? • Is this a self-contained industry, or is it dependent on another industry? • Is the industry dependent on new technology? If so, is the appraisal subject keeping up
with the industry? • Is the industry expected to change? If so, how will that affect the appraisal subject? • What is the forecast for growth within the industry? The answers to these questions are important in assessing the future of the subject company when you are considering what is happening around it. If the industry is made up of a few large
8 Ibid. 9 Ibid.

BV201: Introduction to Business Valuation
BV201r v. 6.0 (11/15) Non-authoritative © 2014 American Society of Appraisers 6
players and the company being appraised is small, there is little likelihood that the company will influence the industry. A local hardware store with $3 million in sales is most likely not going to be a major factor in an industry dominated by companies such as The Home Depot or Lowes, with billions in sales. If an industry is cyclical, as are automobile dealerships, consideration should be given to where in the economic cycle the industry is. If the economy is at the bottom of the cycle, the forecast for the next several years may look good. This will affect the forecast of future operations, as well as the risk component of the market multiples, discount rates, or capitalization rates that will be used. You also need to understand which economic factors impact the industry, and sometimes the industry(s) of its customers. For example, what is the impact of rising interest rates for an automobile dealership? Sales and leasing may go down, so this is a bad thing. However, people will keep their cars longer, and the repair bays may get busier because of the older cars needing more maintenance. This is a good thing. Don’t be quick to jump to conclusions. Sometimes, the industry analysis must extend beyond the appraisal subject to its customers. Imagine a trucking firm that provides services for major retailers without a discussion about how the trucking firm’s customers are expected to do. If the trucking firm is dependent on its customers, it would be negligent to ignore this important point. Exhibit 2 illustrates this exact situation. Keep in mind that the valuation date for this assignment was November 29, 2000.
EXHIBIT 2 Industry Section - Trucking Firm (footnotes omitted)
The trucking industry plays an integral part in the U.S. economy. Trucking services make up well more than half of the volume and revenue for goods produced in the U.S. Trucking services begin with the transport of raw materials to manufacturers and continue through shipments to distributors, retailers, and, in increasing numbers of cases, to end consumers. According to the figures that the U.S. Department of Transportation released at the end of 2000, the share of transportation related to final demand in GDP accounted for 10.6 percent in 1999. Although the trucking sector of the U.S. economy includes private carriage (enterprises which maintain fleets of trucks in order to haul the goods which they produce), the trucking industry traditionally only includes those companies engaged in the business of transporting goods for others. This industry is divided up in a variety of ways: by size of shipment, length of haul and types of services offered. There is much overlap among these divisions. These broad service markets can be defined by shipment size: truckload (TL), less than-truckload (LTL), and small package. Since the appraisal subject is not engaged in the small package delivery market, it will not be discussed. But TL and LTL are distinct subsections of the trucking industry, with different modes of operation, services offered, and cost structures. Truckload freight, the largest motor carrier market in terms of tonnage, can best be described as the hauling of full loads of general or specialized commodities over irregular routes from a shipper’s dock to a consignee’s location, typically without passing through carrier terminals to consolidate or sort freight. An LTL carrier’s primary business entails consolidating and hauling multiple shipments in a vehicle and operating a regular route system connecting local, break-bulk, and relay terminals. The Interstate Commerce Commission (I.C.C.) defines LTL traffic as shipments weighing less than 10,000 pounds. The operation typically includes five separate operations: local pick-up, sorting at a terminal facility, line haul, sorting at a destination terminal, and local delivery. Since TL carriers have no need to establish a network of terminals, start up costs for this type of operation are lower in terms of plant and equipment needs than for LTL operations. As a result, there are many more TL carriers. Low entry costs combined with ease of obtaining a license to do business create a highly competitive market. Carriers are also classified as “regional,” “interregional,” or “national,” depending on their average length of haul. Regional carriers’ average length of haul is typically under 500 miles; interregional carriers’ average length of haul is between 500 and 1,000 miles. National carriers have coverage coast to coast and their average length of haul is greater than 1,000 miles. National carriers’ average length of haul has been declining in recent years as trucking companies seek to become more efficient, reduce

BV201: Introduction to Business Valuation
BV201r v. 6.0 (11/15) Non-authoritative © 2014 American Society of Appraisers 7
costs, and retain drivers. The more business a carrier experiences in a given traffic lane (or route), resulting in a greater line haul density, the lower its incremental costs. Truckers provide a variety of services to shippers, but most enterprises will specialize in one or a few. Some companies only carry bulk liquids, for example, while others specialize in carrying only automobiles. The special nature of the equipment needed for certain types of transport require that a company specialize in one type of haulage. Besides special types of cargo, some companies offer only trucking services, while others offer a full range of services, including warehousing, fleet maintenance, and logsitics support service. Total revenue generated by for-hire trucks in the U.S. in 1999 was $249 billion. This includes: truck transportation services carriers, messengers, and warehousing and storage. Truck transportation services revenue increased from 1998 levels of $173 billion to $187 billion, which is an 8 percent increase. General freight generated 63 percent of all trucking revenues. Long-distance trucking, which is a component of general freight showed the greatest increase with a 9 percent increase over 1998 levels. Revenue from the hauling of electronics, motorized vehicles, and precision instruments increased by 14 percent. Truck transportation numbers exclude private motor carriers that operate as auxiliary establishments to non-transportation companies. Table 5 provides growth information for the various categories.
TABLE 5
REVENUES FOR TRUCK TRANSPORTATION SERVICES, AND MESSENGER AND WAREHOUSING AND STORAGE ($000): 1999
1998 1999 Growth Rate
Truck Transportation $ 173,000,000 $ 187,000,000 8.09%
Messenger Service 46,900,000 49,600,000 5.76%
Warehousing and Storage 12,100,000 12,600,000 4.13%
Total Revenues $ 232,000,000 $ 249,000,000 7.41%
Source: U.S. Census Bureau News, Annual Survey 2000.
Operating expenses in the trucking industry are fairly high. The most recent expense data from 1997 show that operating expenses as a percentage of revenues were 93 percent. Standard Industrial Classification (SIC) Code 4213 - “Trucking, ex local” had an operating profit margin of only 7 percent in 1997. Slim profit margins are not unusual in this industry. The appraiser examined data on the 100 largest Class 1 motor carriers of property that is available annually from the Department of Transportation. This gives a more current story for the industry as a whole.
1998 1999
Operating Revenues ($000) $ 34,417,005 $ 37,689,123
Operating Expenses ($000) 32,456,495 35,728,803
Operating Ratio 5.70% 5.20%
Source: Bureau of Transportation Statistics <http://www.fmcsa.dot.gov/reporting/ProductsAndReports/html/prop99.htm>.
Four companies experienced a net loss in 1998, compared with three in 1999. The industry was operating in basically a flat environment in 1999 as compared with the previous year. The fortunes of the trucking industry closely track the economy. Analysts point to economic activity and growth in production when discussing the industry’s outlook. With this in mind, the appraiser compared an index of ton-miles in the transportation sector with the index of industrial production for all industries. Ton-miles are an indicator of the amount of freight being moved in a given period of time, and the industrial production index for all industries is a good indicator of economic activity.

BV201: Introduction to Business Valuation
BV201r v. 6.0 (11/15) Non-authoritative © 2014 American Society of Appraisers 8
Trucking companies operate in a highly fragmented, price-sensitive, and competitive environment. Pricing, customer service and cost control are significant competitive factors. No single carrier has a dominant share of the market. Less-than-truckload carriers traditionally compete with other LTL truckers and, to a small extent, package carriers such as United Parcel Service. This has changed in recent years, and LTL carriers are now experiencing competition from truckload carriers and to a lesser extent rail and air. A fourth service market emerged in the trucking industry during the last decade. Logistics became especially important as customers focused on ways to reduce costs and improve quality in a competitive global environment. According to Industry Week in 1997, the logistics business was approximately a $20 - $30 billion industry and was expected to grow about 20 percent annually. Providers of logistics in the trucking industry have unique industry-specific traits that become a powerful edge in relation to competitors. By focusing on specific industries in the economy, firms can “achieve learning curve advantages in leading technological and transportation planning knowledge.” Customer service is seen to be more of a competitive factor in the future than price; although cost will always be important to shippers, “now shippers want 100 percent on time delivery, and they want the freight before noon. The focus is becoming more time definite.” To control inventory costs, shippers increasingly use just-in-time inventory techniques. This results in smaller, more frequent shipments and longer service lanes. “Shippers are emphasizing speed and consistency to support inventory reductions. Regional carriers see this as their strength.” In April 2000, six of the largest publicly traded trucking companies combined their logistics businesses to create Transplace.com, LLC. Transplace provides a “one-stop” shop for a full array of global transportation services. Also, a similar company Freightquote.com went online in May 1999. David Weinstein, partner with Anderson Consulting discussed freight marketplaces:
When freight marketplaces first came along, shippers thought they could buy transportation cheaper, playing one against another, says Weinstein. A lot of carriers were uncomfortable with that thinking and didn’t participate. However, to work, freight marketplaces need a large number of players – both shippers and carriers. They have been starved for volume, and many are still hungry.
This year, the reality of what the marketplaces can do finally sank in, says Weinstein. It’s not just cheaper freight. The real benefit will be in reducing transaction costs and automating mundane tasks. Within the logistics department, the process of arranging transportation – negotiation and interaction – is very manual.
Carriers and shippers will have to redesign their business processes and integrate information technology around these marketplaces. So they want to make sure the marketplace will be around.
The outlook for the remainder of 2000 and 2001 is for slight improvement in the industry. Despite the fact that 2000 was one of the most operationally difficult years for the trucking industry, Value Line believes that the warnings issued by numerous carriers of a potential freight-volume slowdown have been premature.
While just about every carrier reported a decline in freight volume and shipment size in the first and second quarters, subsequent accounts have varied. Some companies have reported shipments to be up sequentially, while others have experienced continued weakness in recent months.
Nonetheless, we are slightly more optimistic than we were three months ago. We now expect relatively healthy shipper demand for the remainder of 2000 and 2001, though we cannot rule out a possible slowdown.
The U.S. Department of Labor makes projections of output and employment for all sectors of the economy for 10-year periods. In its Employment Outlook: 1994-2005, the Department made the following projections for the trucking and warehousing division of the transportation sector:
The transportation division is expected to add 476,000 jobs over the 1994-2005 period. Job gains over the 1983-94 period were slightly more than 1 million. The trucking and warehousing industry accounted for more than half (575,000) of those jobs. During the projections period, trucking and warehousing is expected to increase by another 203,000 jobs, rising from 1.8 million in 1994 to 2 million in 2005, at an average annual rate of 1.8 percent. Over the 1983 - 94 historical period, employment for trucking and warehousing grew at an average annual rate of 3.6 percent, while output grew at an annual rate of 5.4 percent, indicating strong

BV201: Introduction to Business Valuation
BV201r v. 6.0 (11/15) Non-authoritative © 2014 American Society of Appraisers 9
gains in productivity. With increased use of such technologies as the global positioning system, high rates of productivity growth are expected to continue. The projected annual average growth rate for trucking and warehousing output is 5.0 percent through 2005.
Perhaps one of the most comprehensive forecasts of freight transportation is one which is provided by DRI/McGraw-Hill for the American Trucking Association. According to Martin Labbe of Martin Labbe and Associates, a transportation information consultant in Ormand Beach, Florida, if nothing else changes, it will take a 19 percent increase in the number of medium and heavy duty vehicles by 2007 to move the extra tonnage, and trucks will have to drive nearly 34 percent more total miles. DRI estimates that total tonnage of primary freight shipment in the U.S. will increase from 11.2 billion tons to 13.6 billion by 2007, an increase of 21.2 percent over 10 years, and trucks will carry 56 percent of it. The volume of freight transported in the U.S. is expected to grow more slowly in the first five years. This expectation is based on DRI’s view that average annual U.S. economic growth would remain in the 2 to 2.5 percent range, with a gradual slowing through 2002, and a moderate risk of recession through 2007.
TABLE 7
TOTAL TRANSPORTATION MARKET
1997 2007
Total Shipments (Millions of Tons) 11,203 13,576General Freight (%) 38.8% 42.6%Bulk Freight (%) 61.2% 57.4%Total Revenues ($ Billion) $ 457.3 $ 583.6General Freight (%) 72.4% 74.6%Bulk Freight (%) 27.6% 25.4%
Source: American Trucking Association Foundation, U.S. Freight Transportation Forecast...to 2007, Monitor, May/June 2000.
Trucks moved the lion’s share of freight in 1997; 6.6 billion tons or 59.5 percent of total volume of 11.2 billion tons. In terms of revenue, trucks claimed the largest share; $371.9 billion, or 81.3 percent of the total. As of 1997, bulk freight represented 61.2 percent of total volume of 6.6 billion tons moved by trucks and 27.6 percent of total revenues. By 2007, bulk freight will decline in significance to 57.4 percent of total volume, and 25.4 percent of total revenues. General freight is expected to grow from 38.8 percent of total volume to 42.6 percent by 2007. While this may seem small for a 10 year period, total revenues will increase from 72.4 percent of total freight to 74.6 percent. This translates into over $100 billion in additional revenue over the 10 year period. The industry continued to be critically important to the economy in 2000. At that time it was highly competitive and was facing high demands for efficiency, while experiencing frequent entries and exits with small carriers outnumbering a few larger firms. There were challenges and opportunities as e-commerce took hold. As trucking progressed through 2000, there were dual demands for greater efficiency and innovative services. The internet was creating substantial pressure on the capabilities of the trucking companies. The headline of the July 31, 2000 edition of Transportation Topics was “For Trucking, 1999 was the year of the Internet.” A survey done by the American Trucking Association (ATA) found that 57 percent of TL carriers and 61 percent of LTL carriers were using internet technology. That is a substantial increase from 1996, which had internet technology usage of 11 percent and 14 percent, respectively. More recently, in early 2000, the University of Michigan Trucking Industry (UMTIP) conducted a mail survey of 177 trucking companies. Their data showed that 75 percent of the respondents used the internet. A summary of their findings is contained in Table 8.

BV201: Introduction to Business Valuation
BV201r v. 6.0 (11/15) Non-authoritative © 2014 American Society of Appraisers 10
TABLE 8
FIRMS USING INTERNET FOR DOING BUSINESS 1999-2000
Segment
Total No.
of Firms in Segment
No. of Firms
Using Internet
Percent of Firms
Using Internet
TL 19 15 79%
LTL 36 26 72%
Combined 69 52 75%
Private Fleet 53 40 75%
TOTAL 177 133 75%
Source: Survey of the Transportation Management Industry Information Technology: Use,Resources, and Strategy, University of Michigan Trucking Industry Program, 2000.
According to the University of Michigan, the very reason that the internet is affecting the trucking industry stems from availability of more detailed inventories to customers and competitors about goods and services, prices and timing. These changes will result in both opportunities for improved efficiency in traditional areas of the trucking industry, as well as in the creation of the demand for new types of services. The combined convergence of global competition and the increasing use of technology has forced companies to begin outsourcing logistics or use third party logistics to manage the complexities of distribution. Third party logistics can be labeled as:
A relationship between a shipper and a third party which, compared with basic services, has more customized offerings, encompasses a broader number of service functions and is characterized by a longer-term, more mutually beneficial relationship.
According to Armstrong & Associates, Inc., a Wisconsin based consulting firm that has tracked the third party logistics industry since 1980, third party logistics was an approximately $46 billion market in the U.S. by the end of 1999, an increase of 16.5 percent compared to the previous year. It is estimated to grow to $50 billion by 2000. Additional projections forecast annual growth at 15 to 20 percent through 2003. Thomas Craig, President of LTD Management, a supply chain management consulting company, discussed future growth in the third party logistics industry:
The third party logistics market will explode-big time. Users and providers will not be able to keep up with it. There is precedence for this view. Look at what happened with manufacturing. Not long ago firms did most of their own manufacturing. Then they outsourced some components, tooling and other odd items and work. Then it exploded.
RETAIL INDUSTRY
The appraisal subject transports apparel and other consumer goods for several large multi-state retailers in the eastern U.S., to some extent the Midwest, and in California. Since the company relies on the retail sector for most of its business, it is important to review the outlook for this sector of the economy. The outlook for retailing is mixed due to the large variety of companies and retail subsectors that exist in the industry. Value Line specialty retail analyst Maurice Levenson, CFA states, “Despite the likelihood of continued intense promotional pressures in the fourth quarter, we expect the strongest retailing in the group to post higher profits, and to deliver another healthy earnings advance the following year.”
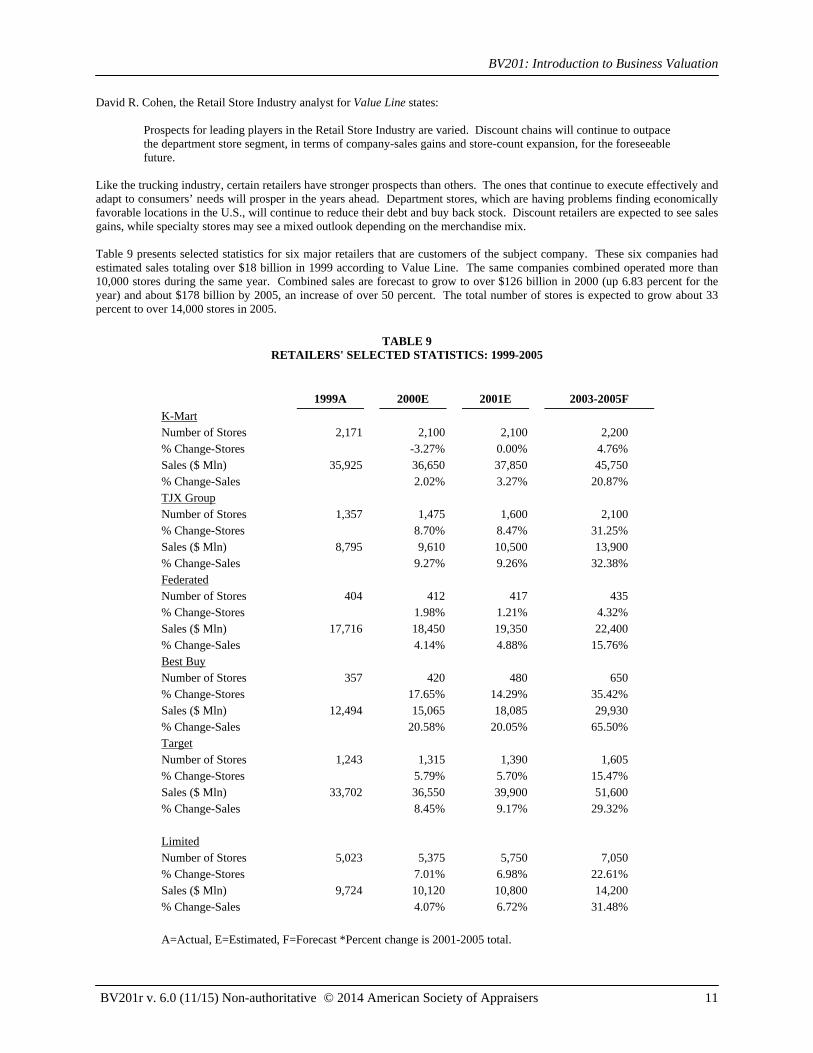
BV201: Introduction to Business Valuation
BV201r v. 6.0 (11/15) Non-authoritative © 2014 American Society of Appraisers 11
David R. Cohen, the Retail Store Industry analyst for Value Line states:
Prospects for leading players in the Retail Store Industry are varied. Discount chains will continue to outpace the department store segment, in terms of company-sales gains and store-count expansion, for the foreseeable future.
Like the trucking industry, certain retailers have stronger prospects than others. The ones that continue to execute effectively and adapt to consumers’ needs will prosper in the years ahead. Department stores, which are having problems finding economically favorable locations in the U.S., will continue to reduce their debt and buy back stock. Discount retailers are expected to see sales gains, while specialty stores may see a mixed outlook depending on the merchandise mix. Table 9 presents selected statistics for six major retailers that are customers of the subject company. These six companies had estimated sales totaling over $18 billion in 1999 according to Value Line. The same companies combined operated more than 10,000 stores during the same year. Combined sales are forecast to grow to over $126 billion in 2000 (up 6.83 percent for the year) and about $178 billion by 2005, an increase of over 50 percent. The total number of stores is expected to grow about 33 percent to over 14,000 stores in 2005.
TABLE 9
RETAILERS' SELECTED STATISTICS: 1999-2005 1999A 2000E 2001E 2003-2005F
K-Mart Number of Stores 2,171 2,100 2,100 2,200 % Change-Stores -3.27% 0.00% 4.76% Sales ($ Mln) 35,925 36,650 37,850 45,750 % Change-Sales 2.02% 3.27% 20.87% TJX Group Number of Stores 1,357 1,475 1,600 2,100 % Change-Stores 8.70% 8.47% 31.25% Sales ($ Mln) 8,795 9,610 10,500 13,900 % Change-Sales 9.27% 9.26% 32.38% Federated Number of Stores 404 412 417 435 % Change-Stores 1.98% 1.21% 4.32% Sales ($ Mln) 17,716 18,450 19,350 22,400 % Change-Sales 4.14% 4.88% 15.76% Best Buy Number of Stores 357 420 480 650 % Change-Stores 17.65% 14.29% 35.42% Sales ($ Mln) 12,494 15,065 18,085 29,930 % Change-Sales 20.58% 20.05% 65.50% Target Number of Stores 1,243 1,315 1,390 1,605 % Change-Stores 5.79% 5.70% 15.47% Sales ($ Mln) 33,702 36,550 39,900 51,600 % Change-Sales 8.45% 9.17% 29.32% Limited Number of Stores 5,023 5,375 5,750 7,050 % Change-Stores 7.01% 6.98% 22.61% Sales ($ Mln) 9,724 10,120 10,800 14,200 % Change-Sales 4.07% 6.72% 31.48%
A=Actual, E=Estimated, F=Forecast *Percent change is 2001-2005 total.

BV201: Introduction to Business Valuation
BV201r v. 6.0 (11/15) Non-authoritative © 2014 American Society of Appraisers 12
TABLE 9RETAILERS' SELECTED STATISTICS: 1999-2005
1999A 2000E 2001E 2003-2005F
Source: Value Line Investment Survey, November 17, 2000
K-Mart Corp.’s margins have been hurt due to an ongoing major restructuring. Changes at the managerial level are ahead of schedule, but Value Line believes it should “still take almost two years, before K-Mart is positioned for growth.” K-Mart will continue to convert stores into it’s Big K-Mart concept, which should stimulate some store sales growth. The TJX Companies, the leader in off-price retailing, operates under the names TJ Maxx, Marshalls, Winners (Canada), HomeGoods and A.J. Wright. “The MarMaxx combination (TJ Maxx and Marshalls) has been highly successful producing off price sales three times more than its nearest off-price rival.” According to Value Line, future growth should come from continued investments in smaller high-growth potential off-price businesses. The company’s goal is to open 130 to 140 new stores in each of 2000 and 2001. Federated Department Stores operates Macy’s, Bloomingdale’s, Sterns, Rich’s, Burdines and the Bon Marche department stores. The company is in the process of restructuring its money-losing Fingerhut subsidiary. Management hopes to bring Fingerhut back to profitability next year. The company plans to open five to eight new locations each year in the early part of the decade. Value Line believes “Profits at the department store division may well advance at a 7% - 10% annual rate through 2003-2005.” A major edge that Federated has over competitors is its strength in private label brands, especially in its women’s lines. Best Buy is the nation’s number-one specialty retailer of name-brand consumer electronics, personal computers, entertainment software and appliances. The company operates 373 stores in 36 states. In 2000, Best Buy opened 47 new stores, and in the fall will enter the lucrative metropolitan, New York area, with the opening of more than a dozen stores. This is just the beginning of its three-year 40 store strategy for the market. The ultimate goal is to open 60 new stores per year for the next five years. Target Corp. has three retail divisions: upscale discount (Target), soft goods (Mervyn’s), and department stores (Hudson’s Dayton’s and Marshall Field’s). However, Target makes up 75 percent of the corporation’s sales and profits. The company opened a record 40 Target stores in the third quarter, and according to Value Line, “We look for overall earnings gains of 13% to 15% in each of the coming 3 to 5 years.” Selling space expansion at Target increased to 9 percent in 2000, and the 2001 goal is for 11 percent expansion. The number of Super Target locations are expected to reach 30 in 2000, and 60 by the end of fiscal 2001. There are plans for at least 200 Super Target locations within the next 10 years. The Limited, Inc. operates stores under the names: Limited, Express, Lerner, Lane Bryant, Henri Bendel, Structure, Victora’s Secret, and Bath & Body Works. The company has experienced a strong third quarter compared to sluggish sales during the first half of the year. Value Line thinks, “The continuance of trend-right offerings ought to fuel sales in the upcoming holiday season and over the 3-5 year pull.” Author’s Note: I have intentionally omitted footnotes from this section. I figured that you could live without them. In the real report, there were many.
The industry analysis will vary depending upon the amount of information available, as well as the impact that it may have on the appraisal subject. Obviously, the example in Exhibit 2 had a considerable amount of information. But think about this--while valuing a trucking firm, didn't this analysis cover everything that you can think of that may have been important? I hope so. Otherwise, we spent a considerable amount of time for no reason. Subject Company Analysis Item number one on the Revenue Ruling 59-60 hit parade tells us to consider the "nature of the business and the history of the enterprise from its inception." In other words, where has the company been and how did it get there? In this situation, the valuation analyst is looking to analyze not only the company's financial statements, but also the entire business operation. Of

BV201: Introduction to Business Valuation
BV201r v. 6.0 (11/15) Non-authoritative © 2014 American Society of Appraisers 13
course, the financial statement analysis is an important component of the process, but at this stage in the valuation process, you are attempting to determine how effectively the company is being run. Also, what risk factors are associated with the company, and how would they affect the rate of return that an investor may require if a transaction was to be consummated? Some of the more common questions raised here include the following: • How does the subject company compare with the entire industry? Is it a large player or a
small player in the industry? • Is it in its infancy, or is it mature? • Has the company kept up with technology? • What percentage of market share does the subject company have? • Does the subject company distribute its products locally, regionally, nationally, or
internationally? • Are there alternative products available in the marketplace that may affect the future of
the company's goods and services? • What is the management structure of the company? Is the business highly dependent on
one or a few key people? • Is there a succession plan for management? The answers to these questions will serve dual purposes. The first purpose is to demonstrate that the valuation analyst understands the nature of the business, as well as what makes the business run. The second purpose, once again, is to perform a risk assessment of the subject company. What we are trying to do is determine whether the appraisal subject is similar or dissimilar, or more risky or less risky, than other companies in the industry. Factors that the valuation analyst will analyze include the products and services offered by the company, customer base, suppliers, management, operations, and ownership structure. A good portion of this information will fit nicely into the history and nature of the company section of the appraisal report. This will also assist the valuation analyst in developing market multiples, discount rates, and capitalization rates. Financial Analysis The purpose of the financial analysis is to review the subject company's performance with respect to other companies, its industry peers, or itself. Comparing the subject company to its peers helps the valuation analyst assess whether the company is more or less risky in relation to its peer group. Comparing the company to itself allows the valuation analyst to determine how the company has performed in the past. This can help give the valuation analyst an idea of future trends that may occur. During the financial analysis, the valuation analyst attempts to identify unusual items, nonrecurring items, and trends. An attempt should be made to explain what happened and why it happened. If there is a departure from the norms of the industry, this should also be investigated and explained.

BV201: Introduction to Business Valuation
BV201r v. 6.0 (11/15) Non-authoritative © 2014 American Society of Appraisers 14
The following analytical tools are used by the valuation analyst:
Comparative company analysis Common size financial statements Comparative industry analysis Trend analysis Operational analysis
Comparative Company Analysis Most business valuation analysts will request at least five years of financial information about the subject company. I like to request six. This way we can calculate a five-year cash flow for the subject company. The amount of data will depend on the facts and circumstances of each assignment. However, a good rule of thumb is to ask for enough years of data to cover a complete business cycle. This will allow the valuation analyst to create a spreadsheet looking for trends that may have occurred, as well as inconsistencies in the reported data. Common-Size Financial Statements The use of common-size financial statements is an excellent way to analyze the subject company with respect to other companies of different sizes. By presenting the data as percentages, the size differentials are eliminated between the subject company and its peer group. Exhibit 3 illustrates a common-size analysis taken from an actual report. In this illustration, industry information was used as a comparison to the appraisal subject.
Exhibit 3 Common-Size Financial Analysis
Another financial analysis tool is to look at a company’s common size financial statements. A common size balance sheet depicts each value as a percentage of total assets. Common size statements are used to look at trends in a company’s financial position, as well as to compare the company with industry data. In order to compare ABC Lumber to industry data, we determined the appropriate Standard Industrial Classification (SIC) code for The Company. A description of The Company and the services it provides was included in an earlier section of this report. Based on this description, we determined that The Company is best described by the following SIC code.
5031 Lumber, Plywood and Millwork
Establishments with or without yards, primarily engaged in the wholesale distribution of rough dressed and finished lumber (but not timber); plywood; reconstructed wood fiber products; doors and windows and their frames (all materials); wood fencing; and other wood or metal millwork.
We located composite industry data in the Business Profiler database compiled by Integra Information, Inc. (Integra). Integra compiles its database from 32 proprietary and publicly available sources. The database consists of information of more than 3.5 million companies in more than 950 industries. The Integra database contained composite data for 8,809 companies classified in SIC code 5031. This was further stratified by sales range. Data for 1,066 companies with sales in the range of $10 to $24.99 million was included. Table 3 presents the common size balance sheet for ABC Lumber along with comparative data for companies classified within SIC code 5031.

BV201: Introduction to Business Valuation
BV201r v. 6.0 (11/15) Non-authoritative © 2014 American Society of Appraisers 15
TABLE 3
COMMON SIZE BALANCE SHEET AS OF DECEMBER 31,
2000 2001 2002 2003 2004 2005 INTEGR
A
Current Assets Cash 5.43% 17.15% 4.95% 1.59% 8.01% 0.07% 5.32% Marketable Securities 0.00% 0.00% 0.00% 0.00% 0.00% 0.00% 0.13% Accounts Receivable 48.57% 42.21% 53.08% 45.21% 44.73% 53.52% 32.41% Inventories 37.51% 33.27% 36.03% 44.26% 38.91% 38.47% 31.81% Prepaid Expenses 0.17% 0.45% 0.00% 0.05% 0.00% 0.00% 0.00% Due from DEF Realty 0.17% 0.15% 0.17% 0.18% 0.16% 0.16% 0.00% Due from XYZ Realty 0.00% 0.00% 0.00% 3.82% 4.84% 4.86% 0.00% Other Current Assets 0.00% 0.00% 0.00% 0.00% 0.00% 0.00% 4.04%
Total Current Assets 91.84% 93.23% 94.24% 95.11% 96.65% 97.08% 73.71%
Fixed Assets
Land 0.02% 0.02% 0.02% 0.02% 0.02% 0.02% n/a Building & Improvements 4.74% 4.43% 4.80% 5.21% 4.47% 4.69% n/a Machinery & Equipment 23.67% 21.15% 21.81% 27.25% 26.31% 27.92% n/a Furniture & Fixtures 2.06% 1.92% 2.08% 2.27% 1.94% 2.04% n/a
Gross Fixed Assets 30.48% 27.52% 28.70% 34.75% 32.74% 34.66% 34.01% Accumulated Depreciation 22.32% 20.75% 22.94% 29.87% 29.38% 31.74% 16.53%
Net Fixed Assets 8.16% 6.77% 5.76% 4.89% 3.35% 2.92% 17.48%
Other Assets
Intangible Assets (Net) 0.00% 0.00% 0.00% 0.00% 0.00% 0.00% 1.36% Other Assets 0.00% 0.00% 0.00% 0.00% 0.00% 0.00% 7.45%
Total Other Assets 0.00% 0.00% 0.00% 0.00% 0.00% 0.00% 8.82%
TOTAL ASSETS 100.00% 100.00% 100.00% 100.00% 100.00% 100.00% 100.00%

BV201: Introduction to Business Valuation
BV201r v. 6.0 (11/15) Non-authoritative © 2014 American Society of Appraisers 16
TABLE 3 COMMON SIZE BALANCE SHEET
AS OF DECEMBER 31,
2000 2001 2002 2003 2004 2005 INTEGRA
Current Liabilities
Accounts Payable 25.99% 14.12% 19.78% 19.57% 18.83% 24.55% 17.54% Long-Term Debt - Current Portion 0.00% 1.09% 1.18% 3.98% 4.45% 2.66% 11.08% Notes Payable 6.44% 2.57% 6.71% 4.07% 2.29% 1.52% 0.00% Accrued Expenses 0.04% 0.04% 0.04% 0.01% 0.04% 0.01% 0.00% Payroll Taxes Payable 0.07% 12.17% 0.00% 0.00% 0.00% 0.00% 0.00% Sales Taxes Payable 0.53% 0.47% 0.46% 0.67% 0.54% 0.64% 0.00% Income Taxes Payable 0.00% 0.00% 0.13% 0.00% 0.00% 0.00% 0.00% Other Current Liabilities 0.00% 0.00% 0.00% 0.00% 0.00% 0.00% 6.68%
Total Current Liabilities 33.07% 30.45% 28.30% 28.29% 26.15% 29.39% 35.30%
Long-Term Liabilities
Long-Term Debt 0.00% 0.00% 0.00% 0.00% 0.00% 0.00% 14.88% Loans from Stockholders 31.01% 32.25% 32.98% 29.25% 36.58% 29.40% 2.24% Loan Payable - Jill Investment 0.00% 2.63% 0.00% 0.00% 0.00% 0.00% 0.00% Other Liabilities 0.00% 0.00% 0.00% 0.00% 0.00% 0.00% 1.17%
Total Long-Term Liabilities 31.01% 34.88% 32.98% 29.25% 36.58% 29.40% 18.29%
Total Liabilities 64.08% 65.33% 61.28% 57.53% 62.74% 58.79% 53.59%
Total Stockholders' Equity 35.92% 34.67% 38.72% 42.47% 37.26% 41.21% 46.41%
TOTAL LIABILITIES AND
STOCKHOLDERS' EQUITY 100.00% 100.00% 100.00% 100.00% 100.00% 100.00% 100.00%
Note: Figures may not add due to rounding.
An analysis of the common size balance sheet indicates that The Company’s current assets as a percentage of total assets has increased consistently since 2000. Overall, The Company is significantly stronger than its industry counterparts in this category. However, The Company has a much lower percentage of fixed assets than its industry peers. This is because The Company’s fixed assets are old and have been fully depreciated. However, the fixed assets are still in use by The Company. On the liability side of the balance sheet, The Company appears to be weaker than the industry composite data. Although total liabilities have decreased from 64.08 percent of assets in 2000, to 58.79 percent in 2005, this is slightly higher than the industry, which has total liabilities of 56 percent of assets. However, this is due to the greater amount of debt The Company has. The next step in the analysis was to look at The Company’s historic income statements for 2000 to 2005. The Company’s revenues have been fairly erratic over the period, decreasing from a high of $12.3 million in 2000 to a low of $10.3 million in 2003, and back up to $11.4 million in 2005. Despite the drop in revenues, The Company finished 2005 with net income of $65,058. This was very close to the 2000 net income of $66,518, which was the high for the period. Since revenues were lower in 2005 than in 2000, The Company has shown improvement in managing its expenses. The Company’s common size income statement was compared to industry composite data. This is presented in Table 4.

BV201: Introduction to Business Valuation
BV201r v. 6.0 (11/15) Non-authoritative © 2014 American Society of Appraisers 17
TABLE 4 COMMON SIZE INCOME STATEMENT
FOR THE YEARS ENDED DECEMBER 31, 2000 2001 2002 2003 2004 2005 INTEGR
A
Total Revenues 100.00% 100.00% 100.00% 100.00% 100.00% 100.00% 100.00%
Total Cost of Sales 62.72% 64.97% 67.18% 67.12% 63.67% 62.86% 91.06%
Gross Profit 37.28% 35.03% 32.82% 32.88% 36.33% 37.14% 8.94%
Total Operating Expenses 38.59% 35.61% 33.44% 33.40% 35.73% 36.30% 6.82%
Operating Income (Loss) -1.31% -0.58% -0.61% -0.52% 0.60% 0.84% 2.12%
Interest Expense 0.20% 0.46% 0.49% 0.47% 0.36% 0.35% 0.46%
Other Income 2.25% 1.44% 1.62% 1.34% 0.00% 0.08% 0.33%
Income Before Taxes 0.74% 0.40% 0.52% 0.36% 0.25% 0.58% 1.99%
Income Taxes 0.20% 0.09% 0.19% 0.11% 0.00% 0.01% 0.76%
NET INCOME 0.54% 0.31% 0.34% 0.24% 0.24% 0.57% 1.24%
Note: Figures may not add due to rounding.
The data in Table 4 indicates that The Company’s operating income as a percentage of revenue had been negative until 2004. Despite the turnaround, operating income is much lower than the industry counterparts. This is due to The Company’s extremely high percentage of operating expenses. The industry average for operating expenses is 10.26 percent of revenues, whereas The Company’s operating expenses were 36.30 percent in 2005. Over the six year period, this percentage had not changed significantly. Some of the distinction is the classification of expenses; cost of sales for ABC Lumber is significantly lower than the industry, while operating expenses are higher. However, management has indicated that their expenses might be higher than the industry because of The Company’s commitment to service. This causes a higher investment in payroll.
Financial Ratios The use of financial ratios allows the valuation analyst to analyze the subject company in terms of liquidity, performance, profitability, and leverage. These ratios are compared against industry data, guideline company data, or both, for the assessment of risk. Some ratios are more meaningful in different industries, but the analysis is essentially the same. For example, you would expect the inventory turnover ratio for a perishable food business to be greater than that for an automobile dealership. A description of some of the more common ratios follows. IMPORTANT NOTE: Some sources use average balance sheet figures whereas others use year-end data. Make certain that you are consistent in your calculations to ensure that you are using the same basis when comparing with industry sources of ratios. Also, make sure that you use the ratios from the comparative data that best match the time period of the valuation. Current Ratio = Current Assets ÷ Current Liabilities. The current ratio measures the margin of safety that management maintains to allow for the inevitable unevenness in the flow of funds through the current asset and current liability accounts. A company needs a supply of current

BV201: Introduction to Business Valuation
BV201r v. 6.0 (11/15) Non-authoritative © 2014 American Society of Appraisers 18
funds to be assured of being able to pay its bills when they come due. This ratio shows the company's ability to pay for its ongoing operations in the short term. A company's liquidity is essential to its good credit, its ability to grow with its own funds, and its ability to pay dividends to its owners. Quick Ratio = (Cash + Marketable Securities + Accounts Receivable) ÷ Current Liabilities. Quick assets include cash, marketable securities, and accounts receivable. Presumably, these items can be converted into cash quickly at approximately their stated amounts, unlike inventory, which is the principal current asset that is excluded from this calculation. The quick ratio is therefore a measure of the extent to which liquid resources are available to meet current obligations. This ratio tends to be a better measure of the company's short-term liquidity, particularly if cash needs to be generated quickly to pay bills. Cash to Current Liabilities = Cash ÷ Current Liabilities. Cash and cash equivalents are the most readily available assets with which to pay liabilities. This ratio tells the valuation analyst whether the subject company has a strong enough cash position to meet its short-term obligations. This ratio can also assist the valuation analyst in determining whether the subject company is carrying excess cash on its balance sheet. Excess cash may show a poor use of current assets by management. Accounts Payable to Inventory = Accounts Payable ÷ Inventory. Businesses generally purchase inventory on credit. The ratio of accounts payable to inventory measures the extent to which a company's inventory is financed by the suppliers of that inventory. A low ratio may indicate that management is not taking advantage of the credit terms available from suppliers. It may also indicate a high level of inventory being carried by the company, when the ratio is used in conjunction with inventory turnover ratios. Accounts Payable Payout Period = Accounts Payable ÷ (Cost of Goods Sold ÷ Number of Days). The accounts payable payout period measures the timeliness of paying suppliers. This figure is related directly to the normal credit terms of the company's purchases. This ratio allows the valuation analyst to consider the company's ability to obtain favorable terms from vendors because of good creditworthiness. Debt-to-Equity = Total Liabilities ÷ Net Worth. Debt is risky because if creditors are not paid promptly, they can take legal action to obtain payment, which, in extreme cases, can force the company into bankruptcy. The greater the extent to which a company obtains its financing from its owners, the less worry the company has in meeting its fixed obligations. The debt-to-equity ratio shows the balance that management has struck between debt and owners’ equity. A proper capital structure should include a portion of debt, since debt has a lower cost of capital. Different industries have different debt-to-equity relationships. EBIT to Total Assets = Earnings Before Interest and Taxes ÷ Total Assets. Earnings before interest and taxes (EBIT) to total assets is an important return-on-investment ratio that provides a profit analysis based on earnings before interest and income taxes. This ratio is best compared with a company's annual interest rate on borrowed funds. If the ratio of a firm's EBIT to total assets is higher than its weighted average cost of capital, the ratio is favorable.

BV201: Introduction to Business Valuation
BV201r v. 6.0 (11/15) Non-authoritative © 2014 American Society of Appraisers 19
Times Interest Earned = EBIT ÷ Interest. The times interest earned ratio measures the number of times that the earnings before interest and taxes will cover the total interest payments on debt. The result indicates the level to which income can decline without impairing the company's ability to meet its interest payments on debt. If the ratio falls below 1.0, the firm is not generating enough earnings to cover the interest due on loans. This ratio indicates the financial risk of the company. Average Collection Period = Accounts Receivable ÷ (Credit Sales ÷ 365). The average collection period can be evaluated against the credit terms offered by the company. As a rule, the collection period should not exceed 11/3 times the regular payment period; that is, if a company's typical terms call for payment in 30 days, the collection period should not exceed 40 days. Changes in the ratio indicate changes in the company's credit policy or changes in its ability to collect receivables. Inventory Turnover = Cost of Goods Sold ÷ Ending Inventory. Inventory turnover is an indication of the velocity with which merchandise dollars move through the business. An increase in the value of inventory may represent the additional stock required by an expanding business, or it may represent an accumulation of merchandise from a declining sales volume. In the latter case, the inventory turnover will decrease. A decrease in the inventory turnover ratio may therefore be a significant danger signal. Inventory Holding Period = 365 ÷ Inventory Turnover. Some of the company's products come in and go out in a matter of days; other goods may stay in stock for six months or longer. The holding period differs for different products. Business managers and owners must be concerned with a holding period that is longer than necessary because of the high costs of tying up capital in excess inventory. On the other hand, reducing inventory levels too much could result in lost sales, because certain products are not available when the customer wants them. The cost of carrying inventory has to be balanced against the profit opportunities lost by not having the product in stock, ready for sale. Other Financial Ratios. There are many other financial ratios that can be considered by the valuation analyst. Profitability ratios are one group of ratios that are often considered by the valuation analyst. Some of the ratios that will be calculated may relate to the company's equity, while others relate to the company's invested capital. Invested capital is considered to be the company's long-term debt or non-working capital debt plus the equity of the company. Since a proper capital structure will generally include an appropriate mix of debt and equity, some valuation analysts prefer to value the company in this manner. What this really does is allow the valuation analyst to value the company on an invested capital basis, eliminating differences in leverage between the subject company and the guideline companies. This becomes more important in the valuation of larger companies, since the companies being used for comparison purposes may be publicly traded and have very different capital structures. The return-on-equity ratio (also known as the Dupont analysis) is considered to be one of the most important financial ratios, since it measures profitability, turnover, and leverage all in one ratio. The Dupont formula allows the analyst to determine whether margin, leverage, or asset

BV201: Introduction to Business Valuation
BV201r v. 6.0 (11/15) Non-authoritative © 2014 American Society of Appraisers 20
utilization (or some combination thereof) are driving returns to shareholders and, when compared to industry peer group data, how management manages these issues (better, worse, or differently) than the industry. The mathematical breakdown of the return on equity ratio is as follows:
Net income =
Net Income x
Sales x
Assets
Equity Sales Assets Equity Another analytical tool used by valuation analysts is the compound growth rate. Compound growth rates are frequently used by the valuation analyst in the selection of guideline companies, pricing multiples, discount rates, and capitalization rates. Both revenues and net income (cash flow can be used also) should be analyzed by the valuation analyst. The mathematical formula for calculating compound growth as a percentage is as follows:
The compound growth rate is calculated using historical data to give an indication of future growth. However, keep in mind that the formula considers only the first and last year. Therefore, it does not calculate a change from year to year. Because of this, you must be careful in selecting the first and last years for your calculation. Ideally you want to look at the business cycle (peak to peak or valley to valley) or look at a constant trend. When looking at growth, the valuation analyst should also examine the year-to-year changes. Over a longer period of time, this is very often more meaningful than the compound growth rate. Let's look at a simple example to illustrate this concept. Assume that Smith Company had sales as follows:
Year Amount
2002 1,350,000
2003 1,675,000
2004 2,100,000
2005 2,200,750
2006 2,450,000
111 n
n amountamount

BV201: Introduction to Business Valuation
BV201r v. 6.0 (11/15) Non-authoritative © 2014 American Society of Appraisers 21
The five-year compound growth rate for Smith Company is 16.1 percent (calculated as the fourth root of $2,450,000 divided by $1,350,000, or 1.1606, then subtract 1). If you do not know how to use a financial calculator, here’s the keystrokes for an HP 12C calculator:
Enter 1,350,000 Press PV
Enter 2,450,000 Press CHS*, then FV
Enter 4 Press n
Press i
*CHS = change sign. One of the data points must be a negative.
You should get 0.160668, which you can round to 16.1 percent. If you do not have a financial calculator, you can do what I do – yell for a staff person to help. A review of the increase in sales on an annual basis indicates that the company experienced constant growth during this five-year period. But what if the sales were as follows:
Year Amount
2002 1,350,000
2003 6,450,000
2004 5,375,000
2005 3,900,000
2006 2,450,000
In this situation, the compound growth rate would be the same 16.1 percent, but look at the difference in the trend. Graphically, these trends look like this:
0
1,000,000
2,000,000
3,000,000
4,000,000
5,000,000
6,000,000
7,000,000
2002 2003 2004 2005 2006
Sal
es
Year
Compound vs Year-To-Year Growth

BV201: Introduction to Business Valuation
BV201r v. 6.0 (11/15) Non-authoritative © 2014 American Society of Appraisers 22
The solid line demonstrates the year-to-year growth while the dotted line illustrates the compound growth over the same period. Pretty different, huh? Clearly, while the beginning and ending points of this five-year period are the same in both series of numbers, the trends are dramatically different. The valuation analyst needs to pay attention to trends, not just a group of calculations. Remember that the goal is to be able to use this information to forecast the future and the risk of that future not occurring. What does the first illustration say about risk as contrasted with the second illustration? In this instance, the valuation analyst would probably not use compound growth rates, since they would have little relevance. You must pay particular attention to the information and not just go through the motions of doing a series of calculations because you read a book or you have a computer program that will calculate these ratios for you. Analysis means that you must analyze the information! Otherwise, financial analysis would be called financial calculation. Comparative Industry Analysis The purpose of a comparative analysis is to compare the subject company's operating performance with that of its peer group. This analysis is undertaken to determine the company's position with respect to its peers. Is it more or less risky than its peer group? How well does the company perform as compared with the peer group? Some of the more common sources for comparative data include the following: • Trade association surveys • Microbilt Corp.’s Integra Database • RMA Annual Statement Studies • Almanac of Business and Industrial Ratios • Financial Statement Studies • D&B Key Business Ratios • Guideline companies Comparative analysis is a useful tool for a valuation analyst to use only if the subject company can be meaningfully compared with either specific guideline companies or industry composite data. Common size financial statements and financial ratio analyses are much more meaningful if the results can be compared with guideline company results or industry data. If a company is large enough, there may be publicly traded companies that can be used for this type of analysis. For smaller companies, and even sometimes for the larger companies, it is generally worthwhile to compare the subject to some form of industry data, whether it is obtained from a trade organization or Integra. Before we move off the topic of financial ratios, one other item needs to be raised. Frequently, financial statements of the subject company have to be normalized (discussed below) for economic adjustments that are necessary to present the subject company from the point of view that the willing buyer would be purchasing. This raises an issue--should the valuation analyst use the unadjusted or the adjusted figures to perform the financial analysis and compare the results

BV201: Introduction to Business Valuation
BV201r v. 6.0 (11/15) Non-authoritative © 2014 American Society of Appraisers 23
against the industry group? The answer depends on the facts and circumstances of the appraisal, as well as the nature of the adjustments that are made. Sometimes we compare both the unadjusted and the adjusted to the industry group. How is that for being definitive? All kidding aside, when the adjustments being made are significant enough to change the outlook of the subject company, we are more likely to compare both sets of data and highlight the fact that the adjusted figures are more meaningful for that analysis. Trend Analysis The purpose of a trend analysis is to compare the subject company's performance over the past several years. The exact number of years used in the analysis depends on the facts and circumstances of each individual case. Although five years is the number commonly used, it is not always the correct number. Ideally, the period of years should cover a normal business cycle for the subject company. Certain industries may require the analysis to include many more years. There also will be times where the company has changed its operations in the near past, and as a result a shorter period will be more meaningful. Always keep in mind that more data, if meaningful, will allow the analyst to perform a more meaningful analysis. During the trend analysis, the valuation analyst attempts to identify positive and negative trends affecting the company. The valuation analyst should review this data with the goal of determining the future prospects of the company based on historical growth patterns and based on the company's normal operations. This is a good time to identify items that are nonrecurring or excess items that will be removed during the normalization process and not considered in the forecast of future net earnings or cash flows. Computer spreadsheet programs are an easy and efficient way to set up a trend analysis. The data entry can be viewed year by year to determine what is going on. It is also a good way to make sure that the data entry from year to year is consistent. For example, if there is an expense for four out of five years, what happened in the year that is blank? Did that expense not exist for a particular year or did the company have two different accountants that classified items differently? Or for that matter, did your staff person call four years “contribution expense” and the fifth year is on a separate line called “donations?” Obviously, these lines should be combined for the analysis to be meaningful. Operational Analysis The purpose of performing an operational analysis is to determine information regarding the quality and stability of the earnings or cash flow from the business. The valuation analyst should be mindful that an equity investor is concerned with the ability of the subject company to provide earnings, cash flow, or both so that he or she will obtain a return on investment (e.g., dividends). Some important components of this process include an analysis of (1) gross profit, (2) discretionary costs, and (3) financial statement consistency. Gross Profit Analysis. An analysis of the cost of goods sold will provide the valuation analyst with information about the gross profit that the company has been able to achieve. Since the selling price of the goods is dictated by competition, the company's gross profit should be in line

BV201: Introduction to Business Valuation
BV201r v. 6.0 (11/15) Non-authoritative © 2014 American Society of Appraisers 24
with the industry's. The subject company must produce an adequate volume of sales if it is to cover its operating expenses. A gross profit analysis is also a useful tool for determining if the inventory is properly valued or if there is unreported income. Although there is a difference between a valuation analyst and a forensic accountant, there are times when one professional may perform both functions. Let me share with you an example of how this analysis can impact an appraisal. We were valuing a pharmacy that also sold liquor. The store never took a physical inventory, and we found out from one of the owners that there was cash payroll. Our gross profit analysis is reflected in Exhibit 4.
Exhibit 4 Gross Profit Analysis
To account for the significant amounts of cash not recorded by The Company, as well as the ending inventory being calculated based on a gross profit percentage rather than a physical valuation, the valuation analyst has recalculated gross profit based on industry gross profit percentages. Using these industry averages, we can estimate the amounts of gross revenue and net income that ABC Drug Stores, Inc. should have had each year. In order to reflect the gross profit percentage of ABC Drug Stores, we have relied on industry data from Integra Information. To accurately calculate a gross profit percentage, we utilized data from both the drug store industry (SIC code 5912), and liquor store industry (SIC code 5921). The Integra data consisted of 1,050 drug stores with revenues between $2.5 million and $5 million, and 3,621 liquor stores with revenues between $250,000 and $500,000. The gross profit information appears below.
Integra Gross Margins
2002 2003 2004 2005 2006 Drug stores 28.00% 27.60% 27.30% 27.00% 26.70% Liquor stores 25.00% 24.60% 24.20% 23.80% 23.40%
The gross margin percentages shown above are then applied to the percent of revenues ABC Drugs received from the sale of drugs or liquor in each year. The breakdown of ABC Drugs' revenues by type appears below.
ABC Drug Revenue Breakdown
2002 2003 2004 2005 2006 Drug revenues 91.10% 88.09% 88.58% 87.20% 86.97% Liquor revenues 8.90% 11.91% 11.42% 12.80% 13.03%
Multiplying the revenue percentages by the industry gross margin figures in each year results in a weighted margin for drugs and liquor. Totaling the two figures in each year results in a weighted gross margin for ABC Drugs based on industry gross margins, and The Company's revenue breakdown by product type. The margin calculations appear below.

BV201: Introduction to Business Valuation
BV201r v. 6.0 (11/15) Non-authoritative © 2014 American Society of Appraisers 25
Gross Margin Percentage Calculation 2002 2003 2004 2005 2006
Drug margin subtotal 25.51 % 24.31 % 24.18 % 23.54 % 23.22 % Liquor margin subtotal 2.23 % 2.93 % 2.76 % 3.05 % 3.05 %
Gross margin percent 27.74 % 27.24 % 26.94 % 26.59 % 26.27 %
Gross margin less 10% 24.97 % 24.51 % 24.25 % 23.93 % 23.64 %
After calculating the gross profit margins relative to ABC Drug Stores, the valuation analyst applied a 10 percent discount to those figures in order to account for economic and industry-specific risk related to ABC Drug Stores. Based on The Company's operation in a low-income area, which includes a significant number of customers utilizing government prescription plans such as Medicaid, and the overall competitiveness of the retail pharmacy industry, especially within the metropolitan region in which ABC Drugs operates, a 10 percent discount was determined to be appropriate. To account for the significant amounts of cash not recorded by The Company, as well as the ending inventory being calculated based on a gross profit percentage rather than a physical valuation, the valuation analyst has recalculated gross profit based on industry gross profit percentages. Using these industry averages, we can estimate the amounts of gross revenue and net income that ABC Drug Stores, Inc. should have had each year. Using the calculated weighted gross profit margin percentages, the estimated amount of cost of goods sold, as a percent of revenues, can be calculated. These figures are as follows:
Cost of Goods Sold Percentage Calculation
2002 2003 2004 2005 2006 Revenue % 100.00 % 100.00 % 100.00 % 100.00 % 100.00 %Less: Gross profit % 24.97 % 24.51 % 24.25 % 23.93 % 23.64 %COGS % 75.03 % 75.44 % 75.75 % 76.06 % 76.36 %
The above cost of goods sold percentages are then used to calculate the gross profit adjustment necessary to reflect the approximate amount of revenue that ABC Drug Stores should have achieved in each year. The gross profit adjustment for each year is listed in the income normalization table. With the addition of the gross profit adjustment to annual historic revenues and the cash payroll adjustment, the valuation analyst has reasonably calculated the annual revenues ABC Drugs attained each year.
Let me give you a word of caution if you attempt a similar analysis to this one. You must have a good SIC or NAICS code for the subject company. I have seen too many practitioners use SIC or NAICS codes that have so many unrelated types of businesses included in the data that the results become flawed. Discretionary Costs. Several items included in the company's income statement may be discretionary and should be investigated by the valuation analyst. Some of the common items to be reviewed are repairs and maintenance (have they been deferred, or are there items that should have been capitalized?), research and development (is the company's policy to continue spending an equal amount on R&D, or is there a measurable payback for past R&D?), and advertising (is the company spending too much for too little?). An analysis of discretionary costs will almost always be performed by a willing buyer, since that individual will be interested in knowing how much of the company's expense structure can be done away with to produce the maximum return to him or her. Because of the synergies that will

BV201: Introduction to Business Valuation
BV201r v. 6.0 (11/15) Non-authoritative © 2014 American Society of Appraisers 26
be brought to the transaction by the buyer, merger and acquisition appraisals will also look to the level of discretionary costs that can be eliminated. Financial Statement Consistency. Just as an auditor looks for consistency in financial reporting, the valuation analyst should analyze the financial statements for consistency from period to period. The valuation analyst must pay particular attention to the company's accounting policies. If the company has an aggressive capital expenditure expensing policy, the company's balance sheet will be understated for those assets that were expensed rather than capitalized. Not only does this understate the value of the balance sheet, but it also destroys the usefulness of many of the financial ratios calculated, common-size analyses, and cash flow projections. Consistency should also be investigated during a trend analysis, since a review of a spreadsheet of the past several accounting periods may highlight discrepancies that exist between the reporting periods. For example, during a review of the insurance expense, the valuation analyst sees that the expense has been as follows:
2006 2005 2004 2003 2002 Insurance expense $ 47,395 $ 45,977 $ 22,984 $ 62,255 $ 39,888
Reviewing the preceding figures for consistency reveals that something happened in 2003 and 2004 that warrants further explanation. An inquiry by the valuation analyst determined that in 2003 this "cash basis" company made a $21,000 insurance payment that was for 2004. The owner decided to accelerate the expense into 2003, so that she could reduce her taxes for that year. Financial Statement Adjustments Before the valuation analyst can determine whether or not there will be the need to adjust the financial statements, he or she will have to assess the quality of the available financial information. While reviewing the historical financial statements, the valuation analyst must determine the answers to the following questions: • Are the financial statements complete with all footnotes and supplemental schedules? • Is there sufficient detail to make the information usable in the comparative analysis to the
industry and market data? • Are the financial statements prepared under GAAP (and for that matter, does it make a
difference)? Conversion of Cash or Income Tax Basis to GAAP In assessing the quality of the company's financial statement information, there may be times when adjustments are necessary to convert the information presented to GAAP. More often than not, this will prove to be an accounting exercise that may not add any value to the valuation process. A large part of the determination as to the need to make this conversion will depend on the information that the valuation analyst will be using for comparison purposes. For example, if you are valuing a medical practice that reports on a cash basis, and you are going to compare the

BV201: Introduction to Business Valuation
BV201r v. 6.0 (11/15) Non-authoritative © 2014 American Society of Appraisers 27
practice to other practices reported on a cash basis, why bother going through the exercise of converting the financial statements to an accrual basis? Most likely, the balance sheet will need to be adjusted for accounts receivable and accounts payable, but the impact on the income statement may be relatively immaterial. Analysis of Historical Balance Sheets Once the valuation analyst is pretty sure that all of the data is gathered and input into some form of spreadsheet program, he or she can use all of the analytical tools that I discussed before to try to understand more about the subject company's operations and its industry. Some of the more frequently encountered issues addressed in the historical balance sheet analysis include the following: • What is the minimum amount of cash or working capital required to operate the
company? • What is the status of accounts receivable (i.e., condition, turnover, bad debt experience,
reserve, and aging)? • What are the amounts, terms, and collectibility of officer and employee loans? • How are inventories valued? How does the company determine inventory quantity and
pricing at year end? • Does inventory cost include material, freight, labor, and overhead where applicable? • What are the company's operating and nonoperating assets and liabilities? • What is the policy for capitalization of property and equipment? • What depreciation methods and lives are used? • Have write-downs for obsolescence or costs in excess of net realizable value been made? • What are the terms of all interest-bearing debt? • What are the trends in payables and turnover ratios? • What are the terms of all long-term liabilities? • Are there any preferences for classes of stock, rights, warrants, options, etc.? Many of these questions can be answered by reading the notes to the financial statements, but many will be answered during the management interview. Analysis of Historical Income Statements The income statement analysis is also intended to answer many questions. Some of the more frequent items addressed in the analysis include: • What is the method of recognizing income and expenses? • What are the company's sources of income? • What is the breakdown of the revenues in terms of dollars and/or percentages? How have
these changed during the last five years? • Which of the company's products/services are proprietary? Does this impact income? • Which products are purchased for resale? • What are the company's main expenses? How have these changed during the last five
years?

BV201: Introduction to Business Valuation
BV201r v. 6.0 (11/15) Non-authoritative © 2014 American Society of Appraisers 28
• How are expenses allocated to inventories? • Which of the expenses are fixed, semi-fixed, or variable in relation to sales? • What are the company's gross margins by product/service? • Are there any deferred charges? If so, do they have any value? • Is depreciation included in cost of goods sold? Bardahl Analysis One of the factors that a valuation analyst is often faced with is the determination of how much working capital is required in the subject company's operations. Frequently, there may be excess working capital, which becomes a nonoperating asset. However, there may also be a deficit in the working capital, which may become a reduction in the value of the company. There are a number of ways to analyze the working capital needs of the subject company. One such way would be to review industry data about companies or groups of companies, such as from Integra. This could give you an idea as to the norm in the industry. Another way to test the working capital needs came out of a court case entitled Bardahl Manufacturing Corp.10 Normalization Adjustments Once all of the historical financial information has been analyzed, any potential adjustments should be made. Financial statement adjustments, frequently called "normalization adjustments," are intended to place the subject company's financial information on an economic basis. During this process, a "cleansing" of the financial statements takes place. This cleansing is intended to remove those items that the willing buyer would not necessarily take into consideration in assessing the income or cash flow of the company. Another reason for these adjustments is to make the subject company's financial statements more comparable to either other companies that will be used in the analysis or the industry peer group. The adjustments made to the financial statements will depend on the valuation approach and on whether a controlling interest or a minority interest is being valued. Since a minority interest may not be able to effectuate a change in the company's financial position, it may be inappropriate to make such adjustments. For example, if the minority interest cannot set the rent paid by the company to a related entity, an adjustment should probably not be made to the income stream. There may be times, however, that an adjustment of this type might be made for the minority. For example, if the rent is so far from market that it does not reflect the economic substance of the transaction, certain shareholder valuations could warrant an adjustment. The facts and circumstances of whether to make the adjustment must dictate what the analyst does, as opposed to a valuation textbook. Use common sense and good judgment. These adjustments are designed to provide better comparability to similar types of businesses or business interests. The normalization process involves adjusting items in the financial statements that are not considered to be normal operating expenses of the subject business. The result should be economic financial statements, rather than those that are GAAP or tax oriented. Most often,
10 Bardahl Manufacturing Corp. (1965), TC Memo 1965-200, PH TCM 65200, 24 CCH TCM 1030.

BV201: Introduction to Business Valuation
BV201r v. 6.0 (11/15) Non-authoritative © 2014 American Society of Appraisers 29
the normalization adjustments that are made are categorized as (1) comparability adjustments, (2) non-operating/non-recurring adjustments, or (3) discretionary adjustments. The term normalization has changed in the valuation literature recently. Z. Christopher Mercer ASA, CFA distinguishes between different types of “normalization” adjustments from the literature published previously. Mercer takes what used to be grouped as “normalization adjustments” and breaks these adjustments down into “normalizing adjustments” and “control adjustments.” In fact, he distinguishes between these two types of adjustments as follows:
• With normalizing adjustments, we attempt to adjust private company earnings to a reasonably well-run, public company equivalent basis. Normalizing adjustments can be further divided into two types to facilitate discussion and understanding. Normalization adjustments are not control adjustments.
• Control adjustments adjust private company earnings 1) for the economies
or efficiencies of the typical financial buyer; and 2) for synergies or strategies of particular buyers. Control adjustments can therefore also be divided into two types.11
Further, Mercer states that
Normalizing adjustments adjust the income statement of a private company to show the prospective purchaser the return from normal operations of the business and reveal a ‘public equivalent’ income stream. If such adjustments were not made, something other than a freely traded value indication of value would be developed by capitalizing the derived earnings stream.12
I like Mercer’s description of normalization adjustments because it begins to differentiate between the types of adjustments that we encounter in our daily practice. Exhibit 5 provides part of an internal form that our firm uses to make certain that the analyst does not overlook the obvious.
11
Mercer, Z. Christopher ASA, CFA, The Integrated Theory of Business Valuation, Peabody Publishing, LP, 2004, p. 146.
12 Ibid. p. 149. (Appraiser’s note for clarification: The reference to “capitalizing the derived earnings stream” would also apply to discounting a future benefit stream, whether cash flow or earnings, since the capitalization model is a shortcut that is derived from a discounting model.)

BV201: Introduction to Business Valuation
BV201r v. 6.0 (11/15) Non-authoritative © 2014 American Society of Appraisers 30
EXHIBIT 5 Partial Internal Checklist for Normalization
BUSINESS VALUATION INTERNAL CHECKLIST
Company Name:
Completed by: Date Completed:
INSTRUCTIONS: This form is to be completed and should become part of the workpapers. It is intended to ensure that important items are not overlooked. Only the information that is relevant to the valuation should be obtained. If the information is not relevant, write N/A in the space opposite the step. If information is missing or incomplete, the analyst should let an officer of the company know BEFORE attempting to prepare a valuation report. The “Comments” section on the last page can be used to document problems that were encountered or to highlight unusual matters for discussion with others.
BALANCE SHEET NORMALIZATION
Yes
No
N/A
Cash
1. Is there excess cash on the balance sheet?
Accounts Receivable
2. Has accounts receivable been included in the balance sheet? If not, why?
3. Did you tax effect the accounts receivable?
Inventory
4. Is inventory included in the balance sheet?
5. Is it reflected on a FIFO basis?
6. Is there any excess inventory?
Marketable Securities
7. Are these non-operating assets that should be segregated?
8. Have they been reflected at market value as of the val date?
Stockholder Receivables
9. Are these collectible?
10. Are they legitimate borrowings or just accounting adjustments?
11. Have they been written off?
Fixed Assets
12. Is there real estate included on the books of the subject company?
13. Is it a non-operating asset?
14. Has it been appraised?

BV201: Introduction to Business Valuation
BV201r v. 6.0 (11/15) Non-authoritative © 2014 American Society of Appraisers 31
15. Why hasn’t it been appraised?
16. Have all corresponding mortgages been treated consistently with the treatment of the real estate?
17. Have all real estate related expenses been segregated on the income statement for possible normalization adjustments along with rent expense?
18. Have machinery & equipment, furniture & fixtures, vehicles, etc. been appraised?
19. If not, did we use our depreciation template to estimate FMV?
20. Do we need to make a depreciation adjustment on the income statement?
21. If there is high appreciation in these assets, have we considered taxes in our analysis?
Other Assets
22. Did we write off intangibles assets that will be revalued?
23. Do we know what all of the assets represent in this category?
Accounts Payable
24. Did we include accounts payable on the balance sheet?
25. Did we tax effect it?
Notes Payable
26. Are these notes at market rates of interest?
27. Have non-interest bearing notes been reflected at FMV?
28. Are any of the notes considered to be non-operating?
29. If notes are high, did we consider using a debt-free approach?
30. Does the debt-equity relationship compare to the industry data to allow a reasonable analysis to be performed?
Stockholder Payables
31. Are these legitimate?
32. Should they be reclassified as equity?
INCOME STATEMENT NORMALIZATION
1. Was officer’s compensation adjusted?
2. If yes, did you consider if any adjustment was required due to retirement plan contributions?
3. Are there officer’s perquisites that need to be adjusted?
4. Are there any non-working family members on the books?
5. Are there any other payroll adjustments necessary (e.g. maid)?

BV201: Introduction to Business Valuation
BV201r v. 6.0 (11/15) Non-authoritative © 2014 American Society of Appraisers 32
6. Have you considered the reasonableness of the following:
a. Automobile expenses b. Travel c. Entertainment d. Non-arm’s length rent leases e. Depreciation f. Interest expense
7. Have you added back federal taxes before recalculating taxes on the adjusted income?
8. Have you added back state and local taxes before recalculating taxes on the adjusted income?
9. Have you adjusting all non-operating income/expense items?
10. Have you adjusted all non-recurring income/expense items?
11. Have you made GAAP adjustments to make the statements more comparable to the guideline companies?
Comments. (This section may be used to document problems that were encountered or to highlight unusual matters for discussion with others.)
Comparability Adjustments Certain types of adjustments are designed to make the subject company more comparable to the guideline companies or industry group being used as a means of comparison. For example, if the subject company uses last in, first out (LIFO) inventory accounting, a switch to first in, first out (FIFO) may allow the valuation analyst to compare the balance sheet of the subject company with those of the guideline companies more appropriately, if the guideline companies are using FIFO. Depreciation methods are another type of adjustment that fall into this category. In some instances, even officers’ compensation can fall into this category. This is especially true when the officers of the closely held business are taking a level of compensation out of the business that is dramatically different that the market. I will address this in more detail in a little while. Non-Operating/Non-Recurring Adjustments According to the International Glossary of Business Valuation Terms the definition of a Non-Operating Asset is an “Asset not necessary to ongoing operations of the business enterprise.” This can also be the case of a non-operating liability. Many times, these assets and/or liabilities have income and expenses associated with them. An example of a non-operating asset is a condo in Myrtle Beach, S.C. that is owned by ABC Shoes, Inc., a shoe store in Miami, FL. ABC also has a mortgage against this property, which makes this a non-operating liability. Included in the income statement is the rental income and expenses associated with the condo. If our
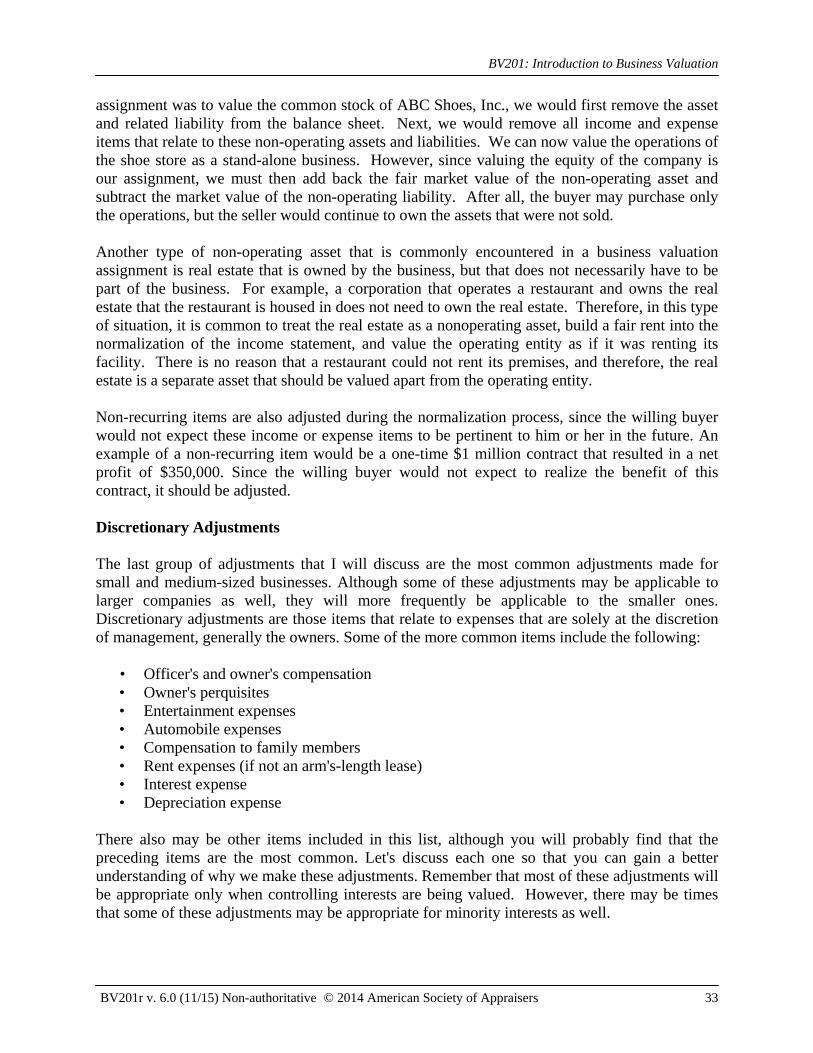
BV201: Introduction to Business Valuation
BV201r v. 6.0 (11/15) Non-authoritative © 2014 American Society of Appraisers 33
assignment was to value the common stock of ABC Shoes, Inc., we would first remove the asset and related liability from the balance sheet. Next, we would remove all income and expense items that relate to these non-operating assets and liabilities. We can now value the operations of the shoe store as a stand-alone business. However, since valuing the equity of the company is our assignment, we must then add back the fair market value of the non-operating asset and subtract the market value of the non-operating liability. After all, the buyer may purchase only the operations, but the seller would continue to own the assets that were not sold. Another type of non-operating asset that is commonly encountered in a business valuation assignment is real estate that is owned by the business, but that does not necessarily have to be part of the business. For example, a corporation that operates a restaurant and owns the real estate that the restaurant is housed in does not need to own the real estate. Therefore, in this type of situation, it is common to treat the real estate as a nonoperating asset, build a fair rent into the normalization of the income statement, and value the operating entity as if it was renting its facility. There is no reason that a restaurant could not rent its premises, and therefore, the real estate is a separate asset that should be valued apart from the operating entity. Non-recurring items are also adjusted during the normalization process, since the willing buyer would not expect these income or expense items to be pertinent to him or her in the future. An example of a non-recurring item would be a one-time $1 million contract that resulted in a net profit of $350,000. Since the willing buyer would not expect to realize the benefit of this contract, it should be adjusted. Discretionary Adjustments The last group of adjustments that I will discuss are the most common adjustments made for small and medium-sized businesses. Although some of these adjustments may be applicable to larger companies as well, they will more frequently be applicable to the smaller ones. Discretionary adjustments are those items that relate to expenses that are solely at the discretion of management, generally the owners. Some of the more common items include the following: • Officer's and owner's compensation
• Owner's perquisites • Entertainment expenses • Automobile expenses • Compensation to family members • Rent expenses (if not an arm's-length lease) • Interest expense • Depreciation expense
There also may be other items included in this list, although you will probably find that the preceding items are the most common. Let's discuss each one so that you can gain a better understanding of why we make these adjustments. Remember that most of these adjustments will be appropriate only when controlling interests are being valued. However, there may be times that some of these adjustments may be appropriate for minority interests as well.

BV201: Introduction to Business Valuation
BV201r v. 6.0 (11/15) Non-authoritative © 2014 American Society of Appraisers 34
Officer's and Owner's Compensation. Smaller businesses frequently pay their officers or owners an amount equal to what the officers need to live, or what the businesses' accountants tell them to pay to reduce taxes. A common tax-planning technique used among smaller businesses is to bonus out profit at the end of the year to eliminate taxable income. Sometimes, we see businesses that are doing so poorly that they cannot afford to pay their officers a reasonable wage. Keep in mind that the owner of a closely held business receives two forms of compensation. First, as an employee, that individual is entitled to a return on his or her labor (salary for the job being performed). Second, as an owner, a return on investment (dividends or capital appreciation). Be very careful not to confuse the two. The officer's compensation adjustment is intended to restate the economic income statement of the company to a basis that includes the amount of salary that would be necessary to attract others that are qualified to perform the duties required by the company. I usually put myself in the position of an investor who will have to hire a replacement for the present management. How much will I have to pay to replace management going forward? Many factors should be considered in the determination of reasonable compensation. Among others, consider the type of duties, education, experience, the number of hours worked, and the geographical region of the country. Where do you look for reasonable compensation? I wish someone (other than me) would write a book on that subject! If researched and analyzed properly, this can be a time consuming exercise. Reasonable compensation can be obtained from numerous sources. Some are easier to find than others. I prefer salary surveys that break out the levels of compensation by individual, rather than as a percentage of revenues. As you perform industry research, it is generally a good idea to inquire whether the trade organization has a salary survey. That is always a good starting point. Your best bet will be to compare the officers of the subject company with officers of other companies in the same industry. If the company is large enough, salary disclosure information from the proxy statements of public companies can be used. If you cannot narrow down this information from the trade associations, another good alternative is other types of salary surveys. However, I can’t really say that we go to any book on a regular basis that will be applicable to all of our valuations. In fact, there are very few books in our library that we go to for compensation information more than a handful of times throughout the year. It seems that surveys for professional salaries are more readily available than corporate salaries. We finally broke down and subscribed to the ERI - Economic Research Institute’s Salary Assessor database. However, ERI is a well known database used by the IRS in reasonable compensation determinations. Then, there are industry specific resources. Some of the more common ones that we use include: • AICPA Small CPA Firm Compensation Survey - accounting firms • BAI Bank Compensation Study - banks • DataMasters Computer Industry Salary Survey - computer geeks • LawJobs - lawyers

BV201: Introduction to Business Valuation
BV201r v. 6.0 (11/15) Non-authoritative © 2014 American Society of Appraisers 35
• In-House Counsel Average Salaries - more lawyers • General Counsel Salary Survey - more lawyers • Survey of Law Firm Economics (Altman Weil & Pensa) - a lot more lawyers • Medical Devices - Medical Device & Diagnostic Industry • PAS - Construction industry • Physicians Search - free salary information based upon a bunch of salary surveys
conducted by MGMA, AMA, etc. - did I say doctors? Other sources of compensation include business journals, specialized salary surveys published by employment agencies, and employment agencies. Don't be afraid to make telephone calls to executive recruiting firms or "headhunters" to find out what compensation a specific position would command in the marketplace. If we use headhunters, we generally call two or three firms, so that we can try to get a consensus of opinion. Make sure you carefully document your sources. As a last resort, I will use publications such as RMA Annual Statement Studies, Financial Statement Studies of Small Businesses, and similar publications or I might even go to Integra. It is not that they are bad, but they present officer's compensation as a percentage of revenues, based on the financial information that they accumulate. It is not possible to answer questions such as how many officers?; or what part of the country is the data from? This information can be useful, however, as a means of spot-checking other sources for reasonableness. Exhibit 6 shows a section from an actual report that addressed reasonable compensation. There is another example included in Exhibit 7.
Exhibit 6 Reasonable Compensation
An estimate of reasonable compensation was made for services rendered by the officers of The Company. In order to estimate this amount, several sources were reviewed. Public companies that were considered similar to ABC Company were analyzed to determine the level of compensation being paid to officers. We analyzed this data by dividing it between all of the publicly-traded guideline companies from our search under the market approach (explained later in this report) and those companies with revenues under $200 million. This was intended to get closer to the size of The Company. Data was also gathered from the ERI Executive Compensation Assessor database, a database frequently used by the Internal Revenue Service. The data compiled from these sources was as follows:
Public Co. Proxies: Percentage of Revenues (All Companies)
1997
1998
1999
Average 0.45% 0.42% 0.38%
Median 0.32% 0.29% 0.32%
Options (% of companies with options) 59.00% 52.00% 65.00%
Public Co. Proxies: Percentage of Revenues (Under $200 Million)
1997
1998
1999
Average 0.69% 0.63% 0.62%
Median 0.58% 0.64% 0.73%
Options (% of companies with options) 50.00% 33.00% 50.00%

BV201: Introduction to Business Valuation
BV201r v. 6.0 (11/15) Non-authoritative © 2014 American Society of Appraisers 36
Median Comp Per Officer
All Companies $308,447 $319,908 $361,765
Under $200 Million 260,425 241,603 232,783
Compensation for 3 Officers
All Companies $925,341 $959,724 $1,085,295
Under $200 Million 781,275 724,809 698,349
ERI (Based on $150 Million)
CEO $493,087
President 324,387
Vice President 229,324
$1,046,798
As a % of Revenues 0.70%
The ERI data is relatively close to the level of compensation indicated that is based on all of the public companies that were analyzed. Although the level of compensation is greater than the compensation for the “Under $200 million” group, the appraiser believes that the greater profitability of ABC Company can support a higher level of compensation. Also, the public companies, on occasion, provide stock options as an additional feature of officers’ compensation. As a result of this analysis, the appraiser believes that compensation can reasonably be reflected at $1.047 million for the most recent year. We have then deflated prior years by 3 percent.
Owner's Perquisites During your analysis of the company's financial statements, pay close attention to owner's perquisites. Many business owners will take as much income as they can out of their businesses, whether as salary or as fringe benefits (perqs). These perqs can range from retirement plans, life insurance, disability insurance, and health club memberships to sky boxes at sporting arenas. After all, why own a business if you can't enjoy the fruits of your labor? Well, besides the fact that many of these items are often buried so that our friends at the Internal Revenue Service (one hopes) will not find them, they are also considered to be another form of compensation to the owner of the business. Part of the normalization process involves removing those items that are considered "discretionary" and would not necessarily have to be paid to someone else who would be hired to replace the owner. If the company has a retirement plan, a health insurance plan, a life and disability insurance plan, or other fringe benefit plans that are offered to all other employees, these items may not be considered a normalization adjustment. However, if the owner is getting a greater benefit than everyone else, a partial adjustment may be required. Whether you add back these expenses may also depend on the salary survey that you use to determine reasonable compensation. Sometimes, the surveys include not only base salary information, but also total compensation, including perqs. Be careful of double counting!

BV201: Introduction to Business Valuation
BV201r v. 6.0 (11/15) Non-authoritative © 2014 American Society of Appraisers 37
Entertainment Expenses Entertainment expenses are reasonable and necessary expenses for many businesses. However, we all know that many business owners deduct entertainment expenses that really do not have anything to do with the business. There may be times when the amount of entertainment expense differs significantly from industry data. In this situation, the valuation analyst must investigate the reason for the differences. Ask yourself, would the willing buyer have to spend that much on entertainment? If you answer no, you probably need to consider an adjustment. For some reason, I see this happen frequently when we appraise medical practices. Specialists seem to have an incredible amount of entertainment on the books. When was the last time your doctor took you to lunch? Although they have some legitimate meetings with colleagues, many of the entertainment expenses are really perqs. Automobile Expenses Once again, be on the lookout for automobile expenses that are not business related. There are many businesses that require a vehicle for business use. However, the adjustments made during the normalization process are intended to remove the expenses related to non-business vehicles (such as the husband's, wife's, son's, daughter's, boyfriend's, aunt's, uncle's, or cousin's). Don't forget to look at other line items on the income statement besides automobile expenses for the total expenses attributable to the vehicle. Automobile insurance may be in insurance expense. Automobile repairs may be in repairs and maintenance. Gasoline may be in utilities. Make believe that you are playing hide and seek! Sometimes, the automobile will be a necessary business expense, but the type of vehicle may cause the expense to be excessively high. In this situation, the valuation analyst should try to estimate the normal vehicle expenses for the business. Similar companies can be a good source for this data. My all-time favorite automobile adjustment came as a result of the valuation of a two-doctor neurosurgery practice. Each doctor had a Lamborghini on the books (at an average cost of $155,000). When I questioned the doctors about the need for these expensive cars, they told me that in the event of an emergency, they needed to get to the hospital fast! Compensation for Family Members There is nothing wrong with family members working for the business, as long as they really show up and their pay is reasonable for the services that they render. Frequently the spouse is on the books so that a contribution can be made to an individual retirement account, although no services are rendered for the compensation (well, that may not be the spouse’s position on the services that are rendered! Certainly, no business services.). In other situations, children are on the books as a means to get spending money and college expenses to them in a lower tax bracket. When family members work for the business, the valuation analyst should check to see if the amount of compensation would be the same if it were paid to a non-family member. Rent Expense

BV201: Introduction to Business Valuation
BV201r v. 6.0 (11/15) Non-authoritative © 2014 American Society of Appraisers 38
Frequently, closely held businesses operate in a facility that is owned by the stockholders or a related entity and is leased to the business establishment. This is not a problem if the lease is at a market rate of rent. More often than not, the rent being charged is based on the mortgage payment that the owner is required to make. A market rental analysis should be obtained by the valuation analyst to support the fair rental value of the premises. This can be obtained from a real estate appraiser or a local realtor who is familiar with market rents in the area for that type of property. Another factor to consider, although not necessarily a normalization adjustment, is when a business is operating without a lease. Rent may be paid to an unrelated landlord at market rates, which would not require an adjustment to be made, but the risk associated with not having a lease should be built into market multiples, capitalization rates, or discount rates. Also consider the difficulty of selling the business to a willing buyer if a lease cannot be obtained. This could cause the business to be less marketable. Interest Expense An adjustment for interest expense may depend on whether the valuation analyst is valuing the equity of the company or the invested capital of the company. In an equity valuation, the interest expense adjustment may relate only to interest paid on non-operating liabilities. This could be interest on the mortgage on the condo in Myrtle Beach that we discussed previously. Since the asset was considered to be non-operating, all associated income and expenses, including interest, should be removed during the normalization process. The valuation analyst should also pay attention to sizable amounts of interest related to debt used to finance excessive compensation and perquisites. A company may be borrowing for working capital and using the proceeds of the debt to pay the owners. A willing buyer would not be expected to incur this debt, and therefore, it should be removed during the normalization process. When the valuation analyst values the invested capital of the company, the interest is added back to determine the earnings available to the invested capital holders. This can be useful when the valuation analyst values companies that have different capital structures from those of the guideline companies. This is not truly a "discretionary" adjustment, but the discretion is on the part of the valuation analyst to value the equity or the invested capital.

BV201: Introduction to Business Valuation
BV201r v. 6.0 (11/15) Non-authoritative © 2014 American Society of Appraisers 39
Minority Interest Valuations The conventional wisdom in business valuation is that the valuation analyst should not make adjustments to the financial statements that could not otherwise be made by the interest being valued. For example, the minority interest stockholder cannot determine the level of compensation for the officers of the company. However, with that being said, let’s be practical when we consider the appropriateness of the adjustments for the assignment at hand. Would it be reasonable to ignore an adjustment for officer’s compensation in the following circumstance? A parent owns and runs a business, takes $1 million out of the company as salary (when the market rate of salary is $200,000 for those services), reduces the profits of the company to $0, and the purpose of the valuation is for a 10 percent gift to the child of the owner. First of all, the answer is NO. It does not matter under fair market value whether the gift is to the child or not. Under these circumstances, a 10 percent owner, child or not, could probably bring an oppressed shareholder lawsuit in most jurisdictions against the controlling owner. Stripping the business of any dividend paying capacity for the benefit of the controlling shareholder, and denying the minority of dividends, would constitute oppression in my non-legal opinion. The legal remedy, at that point, might be for the minority shareholder to be bought out at fair value, providing a value based on the control value of the interest, rather than the minority value. This would require the valuation analyst to make the adjustment for compensation and value the entity based on its true profitability. In other circumstances, it may be necessary to make certain adjustments to make the company appear more comparable to the guideline companies. If the controlling shareholder is taking too little salary out of the company and chooses to take S corporation distributions instead, a proper comparison to publicly-traded C corporations may require a salary adjustment even for a minority valuation. What I am saying is use your head. Do not just blindly ignore adjustments because the valuation literature indications that you do not make adjustment for the minority. There may be facts and circumstances that require reasonable adjustments to be made. Exhibit 7 contains a sample normalization section of an actual valuation report.
Exhibit 7 Sample Normalization Section from a Report
The next step in the valuation process is to normalize the income statement. Table 4 reflects this normalization.

BV201: Introduction to Business Valuation
BV201r v. 6.0 (11/15) Non-authoritative © 2014 American Society of Appraisers 40
TABLE 4
NORMALIZATION OF INCOME FOR THE YEARS ENDED DECEMBER 31,
2002 2003 2004 2005
Historic Net Income (Schedule 2) $ 98,550 $ 82,213 $ 89,662 $ 26,315)
Adjustments Revenues1 16,308 7,119 27,648 Inventory Adjustment2 - - 292,272 (292,272) Smith Manufacturing3 46,741 42,715 70,555 34,723 Interest Expense4 - - 10,600 10,686 Officers' Compensation - Addback5 148,400 215,700 86,400 158,400 Officers' Compensation - Reasonable6 (205,351) (211,703) (218,250) (225,000) Professional Fees7 81,115 - - 21,399 Moving8 14,671 1,500 - - Auto Expenses - Addback9 23,433 28,045 18,611 35,042 Insurance - Automobiles10 3,515 4,703 4,824 4,658 Insurance - Other11 10,380 11,890 10,350 15,381 Credit Cards12 56,007 72,755 62,496 51,036 Payments to Susan & Greg Johnson13 44,194 25,474 15,941 21,339 Health & Company Life Insurance14 6,754 7,907 9,478 10,351 Telephone15 4,441 4,942 2,593 2,636 Miscellaneous16 7,100 11,895 8,455 8,501 Loss on Sale of Assets17 - 24,264 - - Historic Income Taxes18 58,286 43,263 41,615 (25,140)
ADJUSTED PRETAX NET INCOME $ 398,236 $ 381,871 $ 512,721 $ 166,926) Income Taxes18 149,856 143,698 192,937 (53,952)
ADJUSTED HISTORIC NET INCOME $ 248,380 $ 238,173 $ 319,784 $ (112,975)
1. John Johnson deposited monies received from a vendor in his personal account instead of in the business. This adjustment
is intended to reflect these monies as company revenues. 2. In 2004, an outside inventory service was hired to take a physical inventory. However, they missed some inventory that was
written off in 2004. The amount of the error was $292,272 and was corrected in early 2005. As a result of this error, 2004 net income was understated, and 2005 net income was overstated.
3. Smith Manufacturing was set up to do embroidery work for The Company until May 2005 when it was merged into The
Company. During conversations with Mr. Johnson, he indicated that while the market rate was about $0.10 per piece for embroidery, The Company was paying between $0.15 and $0.25 per piece. A hypothetical willing buyer would not incur this additional expense over the market rate. Therefore, this overage must be added back to bring this expense back to a fair market rate.

BV201: Introduction to Business Valuation
BV201r v. 6.0 (11/15) Non-authoritative © 2014 American Society of Appraisers 41
We were provided with a report showing all payments to Smith Manufacturing for the period 2002 through 2005. We applied a market rate percentage to the amounts based on the difference between what The Company was paying compared to what the market was paying. This was calculated as follows:
Market Piece Price $ 0.10
What The Company Paid $ 0.20
(average of $0.15 and $0.25)
Market Rate Percentage 0.10 ÷ 0.20 = 50%
This market rate percentage was then applied as follows:
2002 2003 2004 2005
Net Payments to Smith Manufacturing $93,482 $85,429 $91,111 $69,446
Market Rate Percentage 50% 50% 50% 50%
Adjustment $46,741 $41,715 $45,555 $34,723
In 2004, there was an unidentified payment of $25,000 made by The Company to Smith Manufacturing. With no support for this payment, it has been added back in its entirety. This brings the net adjustment in 2004 to $70,555.
4. This is the interest associated with the non-operating shareholder loan. It is added back as a hypothetical buyer would not
incur this expense. 5. Officer’s compensation has been added back in its entirety as a reasonable level of compensation has been determined in
number 6 below. 6. In order to estimate the amount of reasonable compensation, several sources were reviewed. Executive Compensation
Assessor, a database available from Economic Research Institute (ERI) was the first source. We searched this survey for companies classified under SIC Code 5023 in Miami, Florida, with sales between $5,000,000 and $20,000,000. We did not find any usable data in this database.
We then looked at the National Compensation Survey - December 2005 published by the U.S. Department of Labor. We reviewed data for private industry workers: mean hourly earnings for full-time and part-time workers by experience levels in Miami - Fort Lauderdale, Florida. Within this group is a subset called Management Occupations, with the highest work level in this subject being level 12. The hourly rate given was converted to an annual figure using 2,080 hours and is shown below.
$ 96.92 per hour
x 2,080 hours
$ 201,594
We also reviewed salary information located at salary.com. This database provided total compensation (salary, bonus and benefits) for a Top Operations Executive. The complete package amounted to $349,701, consisting of salary of $217,416, bonus of $65,065, with the balance representing other fringe benefits.
Finally, we reviewed Integra’s Business Profiler, which provides officer’s compensation by SIC Code as a percentage of sales. Officer’s compensation for businesses operating in SIC Code 5023 with sales between $10 and $25 million, reflected an average compensation from 295 businesses at 2.2 percent in 2005. Using The Company’s 2005 revenues results in the following:

BV201: Introduction to Business Valuation
BV201r v. 6.0 (11/15) Non-authoritative © 2014 American Society of Appraisers 42
2005 Revenues $ 11,122,116
Officer’s Compensation as % of Revenues x 2.2%
Officer’s Compensation $ 244,687
Recognizing that this SIC Code is extremely broad, we believe that compensation can be considered from this data since it includes 295 businesses within the sales range of The Company. It is also within the range of the other sources we reviewed.
As a result of our analysis, we believe that reasonable compensation should be estimated at $225,000 with prior years being deflated by 3 percent.
7. Professional fees were materially higher in 2002 and 2005 as compared to the other years. An adjustment was made to
reflect a more normal level of expense based on an average of the other years. These calculations are as follows:
2000 $ 26,913 2001 27,228 2003 30,173 2004 20,320
Total 104,634 ÷ 4 Average Expense $ 26,159
This average expense was then subtracted from the actual expense in 2002 and 2005 to arrive at the adjustment amount. This is shown below:
2002 2005
Actual Expense $ 107,274 $ 47,558
Average Expense 26,159 26,159
Adjustment Amount $ 81,115 $ 21,399
8. Moving expenses are considered non-recurring in nature and are therefore added back. 9. Auto expenses include car payments and other auto related expenses for the Johnson family, as well as other employees.
Legitimate business expenses were considered to be all expenses paid for Robert Jones (unrelated sales manager), and one car for John Johnson. Our addback is calculated as follows:
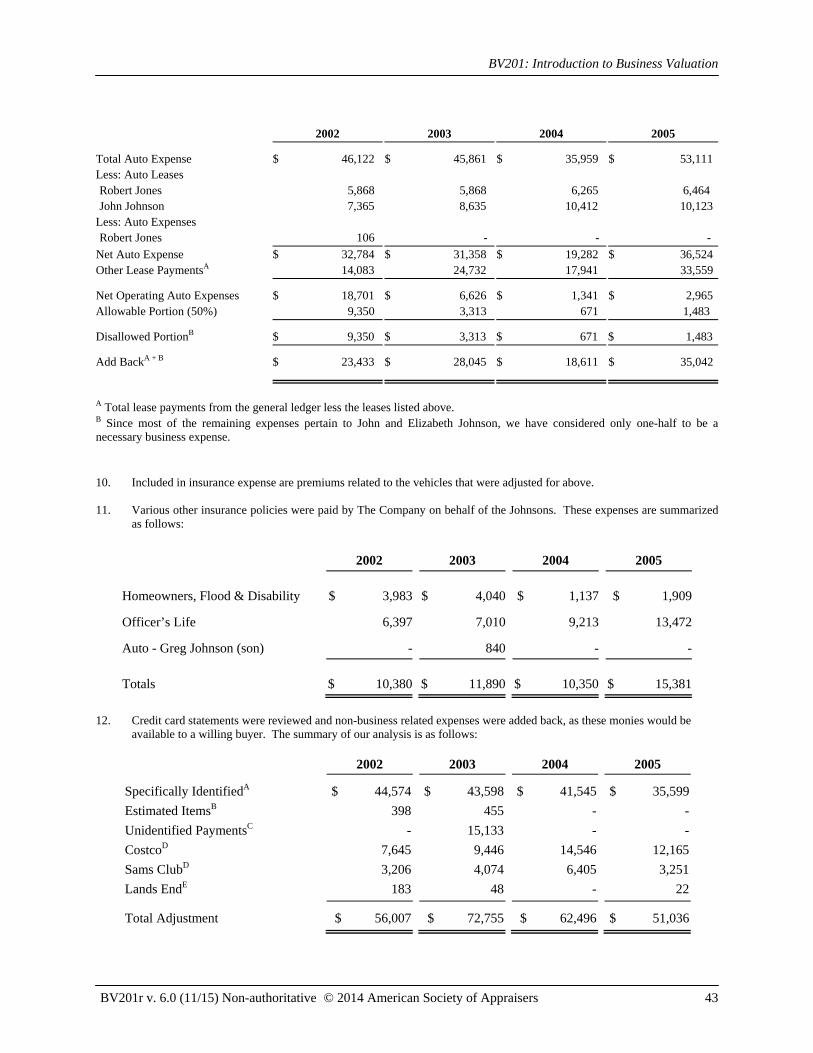
BV201: Introduction to Business Valuation
BV201r v. 6.0 (11/15) Non-authoritative © 2014 American Society of Appraisers 43
10. Included in insurance expense are premiums related to the vehicles that were adjusted for above. 11. Various other insurance policies were paid by The Company on behalf of the Johnsons. These expenses are summarized
as follows:
2002 2003 2004 2005
Homeowners, Flood & Disability $ 3,983 $ 4,040 $ 1,137 $ 1,909
Officer’s Life 6,397 7,010 9,213 13,472
Auto - Greg Johnson (son) - 840 - -
Totals $ 10,380 $ 11,890 $ 10,350 $ 15,381
12. Credit card statements were reviewed and non-business related expenses were added back, as these monies would be
available to a willing buyer. The summary of our analysis is as follows:
2002 2003 2004 2005
Specifically IdentifiedA $ 44,574 $ 43,598 $ 41,545 $ 35,599
Estimated ItemsB 398 455 - -
Unidentified PaymentsC - 15,133 - -
CostcoD 7,645 9,446 14,546 12,165
Sams ClubD 3,206 4,074 6,405 3,251
Lands EndE 183 48 - 22
Total Adjustment $ 56,007 $ 72,755 $ 62,496 $ 51,036
2002 2003 2004 2005
Total Auto Expense $ 46,122 $ 45,861 $ 35,959 $ 53,111Less: Auto Leases Robert Jones 5,868 5,868 6,265 6,464 John Johnson 7,365 8,635 10,412 10,123Less: Auto Expenses Robert Jones 106 - - -
Net Auto Expense $ 32,784 $ 31,358 $ 19,282 $ 36,524Other Lease PaymentsA 14,083 24,732 17,941 33,559
Net Operating Auto Expenses $ 18,701 $ 6,626 $ 1,341 $ 2,965Allowable Portion (50%) 9,350 3,313 671 1,483
Disallowed PortionB $ 9,350 $ 3,313 $ 671 $ 1,483
Add BackA + B $ 23,433 $ 28,045 $ 18,611 $ 35,042
A Total lease payments from the general ledger less the leases listed above. B Since most of the remaining expenses pertain to John and Elizabeth Johnson, we have considered only one-half to be a necessary business expense.

BV201: Introduction to Business Valuation
BV201r v. 6.0 (11/15) Non-authoritative © 2014 American Society of Appraisers 44
A. These items were specifically identified as being personal in nature. We reviewed every available credit card statement
with management for the years 2002 through 2005. Some of the items that were considered as non-business related were:
• Restaurants around the family residence • CVS Pharmacy • Nail salon • Animal hospital • Various clothing stores • Grocery stores near the family residence • Trips to Jamaica
B. Over 230 credit card payments and the accompanying statements were analyzed to separate personal from business
expenses. Only two statements are missing in the amounts of $478 and $628. We estimated the personal amount by the relationship between business and personal charges in those particular years.
C. The unidentified amount consists of three payments made to credit cards that were not identified as business cards.
D. In our discussion with management, it was indicated that a majority of charges at Costco and Sams Club were personal
in nature. After further discussion with management, 80 percent of charges were considered to be personal.
E. Some items purchased at Lands End (towels) were business related. In order to account for this, 50 percent was added back. Overall, this amount was immaterial.
13. Wages paid to family members would likely not be incurred by a hypothetical buyer of The Company. As a result, wages
paid to Susan and Greg Johnson have been added back, along with the associated payroll taxes.
We were provided with W-2 Forms for Susan, representing gross wages. Payroll taxes were estimated to be 8 percent of gross wages. This is calculated below.
Susan 2002 2003 2004 2005
Payroll
Gross from W-2's $ 12,000 $ 12,000 $ 3,840 $ 9,555
Taxes (8%) 960 960 307 764
Total Payroll $ 12,960 $ 12,960 $ 4,147 $ 10,319
In addition, in 2003 there were checks payable to Susan in the amount of $720 that were also added back.
We were also provided with W-2 Forms for Greg, and again, estimated payroll taxes at 8 percent of gross wages. This is calculated below.
Greg 2002 2003 2004 2005
Payroll
Gross from W-2's $ 28,920 $ 10,920 $ 10,920 $ 10,203
Taxes (8%) 2,314 874 874 816
Total Payroll $ 31,234 $ 11,794 $ 11,794 $ 11,019
It was discussed earlier that Greg received paychecks in order to receive health insurance. In addition to this, Greg received payments as a vendor for his actual services rendered. These amounts were not added back since The Company would have had to pay someone else to do what Greg did.
The total adjustment is calculated as follows:
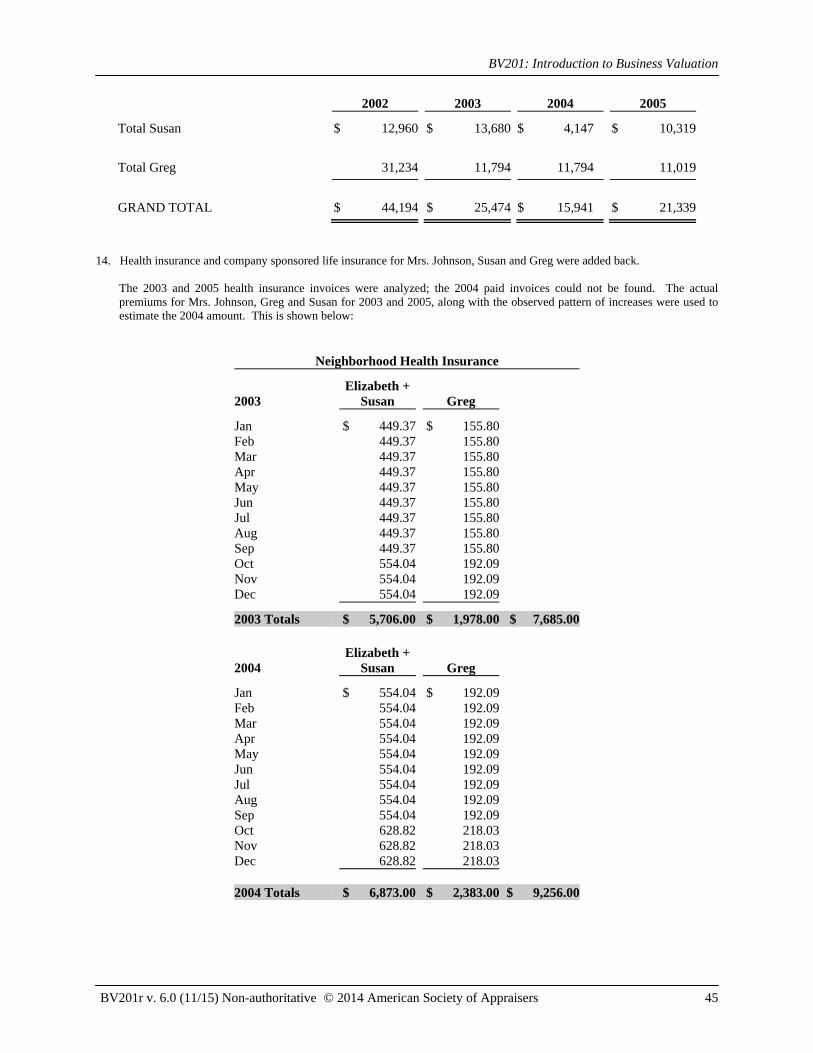
BV201: Introduction to Business Valuation
BV201r v. 6.0 (11/15) Non-authoritative © 2014 American Society of Appraisers 45
2002 2003 2004 2005
Total Susan $ 12,960 $ 13,680 $ 4,147 $ 10,319
Total Greg 31,234 11,794 11,794 11,019
GRAND TOTAL $ 44,194 $ 25,474 $ 15,941 $ 21,339
14. Health insurance and company sponsored life insurance for Mrs. Johnson, Susan and Greg were added back.
The 2003 and 2005 health insurance invoices were analyzed; the 2004 paid invoices could not be found. The actual premiums for Mrs. Johnson, Greg and Susan for 2003 and 2005, along with the observed pattern of increases were used to estimate the 2004 amount. This is shown below:
Neighborhood Health Insurance
2003
Elizabeth +Susan
Greg
Jan $ 449.37 $ 155.80 Feb 449.37 155.80 Mar 449.37 155.80 Apr 449.37 155.80 May 449.37 155.80 Jun 449.37 155.80 Jul 449.37 155.80 Aug 449.37 155.80 Sep 449.37 155.80 Oct 554.04 192.09 Nov 554.04 192.09 Dec 554.04 192.09
2003 Totals $ 5,706.00 $ 1,978.00 $ 7,685.00
2004
Elizabeth +Susan
Greg
Jan $ 554.04 $ 192.09 Feb 554.04 192.09 Mar 554.04 192.09 Apr 554.04 192.09 May 554.04 192.09 Jun 554.04 192.09 Jul 554.04 192.09 Aug 554.04 192.09 Sep 554.04 192.09 Oct 628.82 218.03 Nov 628.82 218.03 Dec 628.82 218.03
2004 Totals $ 6,873.00 $ 2,383.00 $ 9,256.00

BV201: Introduction to Business Valuation
BV201r v. 6.0 (11/15) Non-authoritative © 2014 American Society of Appraisers 46
2005
Elizabeth +Susan
Greg
Jan $ 628.82 $ 218.03 Feb 628.82 218.03 Mar 628.82 218.03 Apr 628.82 218.03 May 628.82 218.03 Jun 628.82 218.03 Jul 628.82 218.03 Aug 628.82 218.03 Sep 628.82 218.03 Oct 689.27 236.67 Nov 580.87 209.92 Dec 580.87 209.92
2005 Totals $ 7,510.00 $ 2,619.00 $ 10,129.00 An estimate was made for 2002 using the average change in premiums from 2003 to 2005, which was 15 percent.
The Company-sponsored life insurance plan only showed premiums for Mrs. Johnson and Greg of $9.25 per month for the years 2003 and 2004. The annual amount is $222, and is assumed to be the same in 2002 and 2005. This amount is added to the health insurance expense to arrive at a total adjustment as follows:
2002 2003 2004 2005
Health Insurance $ 6,532 $ 7,685 $ 9,256 $ 10,129
Life Insurance 222 222 222 222
Total Adjustment $ 6,754 $ 7,907 $ 9,478 $ 10,351
15. This adjustment reflects payments made by The Company on behalf of the Johnsons. These are non-operating expenses and
are therefore added back. The amounts are as follows:
2002 2003 2004 2005
BellSouth $ 1,993 $ 2,558 $ 2,198 $ 2,479
T-Mobile 1,106 2,076 395 158
Voicestream 1,342 - - -
Direct TV - 308 - -
Total $ 4,441 $ 4,942 $ 2,593 $ 2,636

BV201: Introduction to Business Valuation
BV201r v. 6.0 (11/15) Non-authoritative © 2014 American Society of Appraisers 47
16. The miscellaneous adjustments are as follows:
2002 2003 2004 2005
Camp HavefunA $ - $ - $ 1,705 $ -
Checks to Elizabeth JohnsonB - 3,744 - -
Checks to John Johnson & Cash
for Travel Expenses (50%)C 7,100 8,151 3,750 -
Checks to Cash in 2004D - - 3,000 -
Totals $ 7,100 $ 11,895 $ 8,455 $ 8,501
A. This is a non-operating expense and therefore added back.
B. Checks written to Elizabeth Johnson were considered personal in nature and have been added back.
C. The checks written to John Johnson are largely travel related. However, The Company’s records are relatively poor,
and therefore, we have added back 50 percent as being non-business related.
D. In 2004, there was a $3,000 check made out to cash that was signed by Elizabeth Johnson and charged to warehouse expense. Since no support for this check has been provided, the entire amount has been considered discretionary and has been added back.
17. Losses sustained from selling assets are considered to be non-recurring and have been added back to better reflect the
operating income of The Company. 18. Historic income taxes have been added back and corporate taxes have been recalculated based on the adjusted net
income.
The example shown in Exhibit 7 is a good illustration of the normalization process because it shows many of the abuses that a closely-held business owner tries to get away with. Many closely held business owners are not too terribly different that the client in this assignment. Once the financial statements have been normalized, the valuation analyst uses the adjusted information as a basis for the valuation. This information can then be used to forecast the future operating results of the business as well as analyze the economic return to the owner. The valuation analyst should not use an average of the historical figures unless the outcome reflects the anticipated financial results of the appraisal subject. Remember, valuation is a prophecy of the future! As a general rule, I like to use the adjusted figures in addition to the unadjusted figures in performing my ratio analysis. This gives me not only the unadjusted ratios that can be compared with similar data, but also the adjusted figures that can be used to assess the economic future of the company. This becomes an easy task if you use computer templates that you write yourself.

BV201: Introduction to Business Valuation
BV201r v. 6.0 (11/15) Non-authoritative © 2014 American Society of Appraisers 48
Conclusion You should have more of an idea about what to do with the data that you collect. By now, you should be getting the message that the valuation analyst performs a risk assessment with the data collected. This information can then be used in the determination of market multiples, discount rates, and capitalization rates. The data collected and analyzed is critical to the valuation process. If you are not comfortable with analyzing the gobs and gobs of data that you will be collecting, you may want to reread some financial statement analysis textbooks. I hope for your sake you are okay with this stuff. Those types of textbooks are like watching paint dry on a wall--real excitement!

Appendix C GDT Financial Information

As of December 31, 2006 2007 2008 2009 2010 2011
Assets
Current Assets: Cash 17,663,000$ 20,104,000$ 19,975,000$ 18,315,000$ 24,062,000$ 26,135,000$ Accounts Receivable 18,194,000 18,842,000 24,011,000 30,877,000 25,335,000 22,109,000 Prepaid Expenses 4,751,000 4,582,000 5,077,000 5,760,000 5,661,000 6,149,000 Prepaid Taxes - - - - 280,000 154,000 Other Current Assets 1,340,000 1,180,000 1,053,000 272,000 142,000 88,000
Total Current Assets 41,948,000 44,708,000 50,116,000 55,224,000 55,480,000 54,635,000
Property and Equipment: Building and Improvements 15,990,000 17,086,000 20,889,000 24,747,000 26,979,000 27,935,000 Machinery and Equipment 103,330,000 108,412,000 114,158,000 141,208,000 146,733,000 149,302,000
Total Cost 119,320,000 125,498,000 135,047,000 165,955,000 173,712,000 177,237,000 Less: Accumulated Depreciation (75,414,000) (85,382,000) (92,769,000) (101,062,000) (110,599,000) (124,226,000)
Net Property, Plant, and Equipment 43,906,000 40,116,000 42,278,000 64,893,000 63,113,000 53,011,000
Other Assets: Stockholder Loans 19,396,000 16,445,000 13,160,000 9,785,000 7,794,000 10,049,000 Loan Receivable 4,272,000 3,251,000 3,525,000 3,997,000 4,470,000 5,225,000
Total Other Assets 23,668,000 19,696,000 16,685,000 13,782,000 12,264,000 15,274,000
Total Assets 109,522,000$ 104,520,000$ 109,079,000$ 133,899,000$ 130,857,000$ 122,920,000$
Liabilities and Stockholder Equity
Current Liabilities: Accounts Payable 4,439,000$ 2,806,000$ 3,553,000$ 4,324,000$ 4,702,000$ 5,231,000$ Long-Term Debt - Current Portion 12,902,000 13,163,000 11,072,000 15,281,000 15,926,000 15,876,000 Accrued Expenses 16,765,000 18,312,000 20,057,000 22,356,000 20,764,000 22,159,000 Income Taxes Payable - 53,000 109,000 97,000 - -
Total Current Liabilities 34,106,000 34,334,000 34,791,000 42,058,000 41,392,000 43,266,000
Other Liabilities: Long-Term Debt 29,788,000 25,681,000 28,212,000 43,686,000 42,801,000 33,373,000 Deferred Taxes 787,000 1,035,000 934,000 891,000 318,000 201,000
Total Other Liabilities 30,575,000 26,716,000 29,146,000 44,577,000 43,119,000 33,574,000
Total Liabilities 64,681,000 61,050,000 63,937,000 86,635,000 84,511,000 76,840,000
Stockholder Equity: Common Stock 1,000 1,000 1,000 1,000 1,000 1,000 Retained Earnings - Unappropriated 44,840,000 43,469,000 45,141,000 47,263,000 46,345,000 46,079,000
Total Stockholder Equity 44,841,000 43,470,000 45,142,000 47,264,000 46,346,000 46,080,000
Total Liabilities and Stockholder Equity 109,522,000$ 104,520,000$ 109,079,000$ 133,899,000$ 130,857,000$ 122,920,000$
GENERAL DELIVERY TRUCKING, INC.
BALANCE SHEETS - AS REPORTED
1

As of December 31, 2006 2007 2008 2009 2010 2011
Assets
Current Assets: Cash 16.1% 19.2% 18.3% 13.7% 18.4% 21.3% Accounts Receivable 16.6% 18.0% 22.0% 23.1% 19.4% 18.0% Prepaid Expenses 4.3% 4.4% 4.7% 4.3% 4.3% 5.0% Prepaid Taxes 0.0% 0.0% 0.0% 0.0% 0.2% 0.1% Other Current Assets 1.2% 1.1% 1.0% 0.2% 0.1% 0.1%
Total Current Assets 38.3% 42.8% 45.9% 41.2% 42.4% 44.4%
Property and Equipment: Building and Improvements 14.6% 16.3% 19.2% 18.5% 20.6% 22.7% Machinery and Equipment 94.3% 103.7% 104.7% 105.5% 112.1% 121.5%
Total Cost 108.9% 120.1% 123.8% 123.9% 132.7% 144.2% Less: Accumulated Depreciation -68.9% -81.7% -85.0% -75.5% -84.5% -101.1%
Net Property, Plant, and Equipment 40.1% 38.4% 38.8% 48.5% 48.2% 43.1%
Other Assets: Stockholder Loans 17.7% 15.7% 12.1% 7.3% 6.0% 8.2% Loan Receivable 3.9% 3.1% 3.2% 3.0% 3.4% 4.3%
Total Other Assets 21.6% 18.8% 15.3% 10.3% 9.4% 12.4%
Total Assets 100.0% 100.0% 100.0% 100.0% 100.0% 100.0%
Liabilities and Stockholder Equity
Current Liabilities: Accounts Payable 4.1% 2.7% 3.3% 3.2% 3.6% 4.3% Long-Term Debt - Current Portion 11.8% 12.6% 10.2% 11.4% 12.2% 12.9% Accrued Expenses 15.3% 17.5% 18.4% 16.7% 15.9% 18.0% Income Taxes Payable 0.0% 0.1% 0.1% 0.1% 0.0% 0.0%
Total Current Liabilities 31.1% 32.8% 31.9% 31.4% 31.6% 35.2%
Other Liabilities: Long-Term Debt 27.2% 24.6% 25.9% 32.6% 32.7% 27.2% Deferred Taxes 0.7% 1.0% 0.9% 0.7% 0.2% 0.2%
Total Other Liabilities 27.9% 25.6% 26.7% 33.3% 33.0% 27.3%
Total Liabilities 59.1% 58.4% 58.6% 64.7% 64.6% 62.5%
Stockholder Equity: Common Stock 0.0% 0.0% 0.0% 0.0% 0.0% 0.0% Retained Earnings - Unappropriated 40.9% 41.6% 41.4% 35.3% 35.4% 37.5%
Total Stockholder Equity 40.9% 41.6% 41.4% 35.3% 35.4% 37.5%
Total Liabilities and Stockholder Equity 100.0% 100.0% 100.0% 100.0% 100.0% 100.0%
GENERAL DELIVERY TRUCKING, INC.
BALANCE SHEETS - AS REPORTED, COMMON SIZE
2

For the Years Ended December 31, 2006 2007 2008 2009 2010 2011
Revenues 193,422,000$ 189,704,000$ 213,733,000$ 242,081,000$ 254,772,000$ 265,675,000$
Gross Profit 193,422,000 189,704,000 213,733,000 242,081,000 254,772,000 265,675,000
Operating Expenses: Wages, Salaries and Fringes 82,109,000 81,086,000 88,855,000 101,162,000 111,656,000 117,527,000 Purchased Transportation and Rental 39,921,000 37,732,000 44,215,000 45,282,000 42,222,000 43,291,000 Operating Supplies and Expenses 24,831,000 30,342,000 29,860,000 31,967,000 33,942,000 43,234,000 General and Administrative 12,497,000 13,104,000 14,556,000 15,968,000 17,618,000 17,813,000 Settlement Expense 7,440,000 - - - - - Depreciation 13,288,000 13,821,000 12,842,000 14,867,000 18,119,000 19,158,000
Total Operating Expenses 180,086,000 176,085,000 190,328,000 209,246,000 223,557,000 241,023,000
Income From Operations 13,336,000 13,619,000 23,405,000 32,835,000 31,215,000 24,652,000
Other Income (Expenses): Interest Income 610,000 660,000 584,000 620,000 644,000 614,000 Gain (Loss) on Sale of Assets - - 414,000 67,000 229,000 56,000 Interest Expense (3,522,000) (2,866,000) (2,382,000) (3,255,000) (3,718,000) (3,428,000) Total Other Income (Expenses) (2,912,000) (2,206,000) (1,384,000) (2,568,000) (2,845,000) (2,758,000)
Earnings Before Taxes 10,424,000 11,413,000 22,021,000 30,267,000 28,370,000 21,894,000
Income Taxes: Income Taxes - - - - - -
Total Income Taxes - - - - - -
Net Income 10,424,000$ 11,413,000$ 22,021,000$ 30,267,000$ 28,370,000$ 21,894,000$
Change in Sales N/M -11.2% -11.7% -8.9% 5.2% 4.3%
GENERAL DELIVERY TRUCKING, INC.
RESULTS OF OPERATIONS - AS REPORTED
3

For the Years Ended December 31, 2006 2007 2008 2009 2010 2011
Revenues 100.0% 100.0% 100.0% 100.0% 100.0% 100.0%
Gross Profit 100.0% 100.0% 100.0% 100.0% 100.0% 100.0%
Operating Expenses: Wages, Salaries and Fringes 42.5% 42.7% 41.6% 41.8% 43.8% 44.2% Purchased Transportation and Rental 20.6% 19.9% 20.7% 18.7% 16.6% 16.3% Operating Supplies and Expenses 12.8% 16.0% 14.0% 13.2% 13.3% 16.3% General and Administrative 6.5% 6.9% 6.8% 6.6% 6.9% 6.7% Settlement Expense 3.8% 0.0% 0.0% 0.0% 0.0% 0.0% Depreciation 6.9% 7.3% 6.0% 6.1% 7.1% 7.2% Total Operating Expenses 93.1% 92.8% 89.1% 86.4% 87.7% 90.7%
Income From Operations 6.9% 7.2% 10.9% 13.6% 12.3% 9.3%
Other Income (Expenses): Interest Income 0.3% 0.3% 0.3% 0.3% 0.3% 0.2% Gain (Loss) on Sale of Assets 0.0% 0.0% 0.2% 0.0% 0.1% 0.0% Interest Expense -1.8% -1.5% -1.1% -1.3% -1.5% -1.3% Total Other Income (Expenses) -1.5% -1.2% -0.6% -1.0% -1.1% -1.1%Earnings Before Taxes 5.4% 6.0% 10.3% 12.6% 11.2% 8.2%
Income Taxes: Income Taxes 0.0% 0.0% 0.0% 0.0% 0.0% 0.0% Total Income Taxes 0.0% 0.0% 0.0% 0.0% 0.0% 0.0%
Net Income 5.4% 6.0% 10.3% 12.6% 11.2% 8.2%
RESULTS OF OPERATIONS - AS REPORTED, COMMON SIZE
GENERAL DELIVERY TRUCKING, INC.
4

Note: Use 40% tax rate and year-end balances where applicable.
12/31/2011 12/31/2010 12/31/2009 12/31/2008 12/31/2007
Liquidity RatiosCurrent Ratio 1.2 1.2 1.2 1.0 1.2GDT, Inc. 1.3 1.3 1.4 1.3
Quick Ratio 1.1 1.0 1.0 0.9 1.0GDT, Inc. 1.2 1.2 1.3 1.1
Activity RatiosSales/Receivables 9.6 9.9 12.3 10.7 10.4GDT, Inc. 10.1 7.8 8.9 10.1
Days in Receivables 38.0 37.0 30.0 34.0 35.0GDT, Inc. 36.3 46.6 41.0 36.3
Working Capital Turnover 46.4 37.1 49.6 512.1 48.1GDT, Inc. 18.1 18.4 13.9 18.3
Fixed Assets/Net Worth 1.5 1.6 1.8 1.9 1.9GDT, Inc. 1.4 1.4 0.9 0.9
Fixed Asset Turnover 5.7 5.5 5.3 5.0 5.1GDT, Inc. 4.0 3.7 5.1 4.7
Asset Turnover 2.7 2.2 2.5 2.6 2.6GDT, Inc. 1.9 1.8 2.0 1.8
Coverage/Leverage RatiosInterest Expense Coverage: EBIT/Interest 2.3 1.4 2.7 2.0 3.0 GDT, Inc. 8.6 10.3 10.2 5.0
Interest Bearing Debt/Total Capital (%) 36.7% 35.9% 36.8% 40.5% 40.9%GDT, Inc. 55.9% 55.5% 46.5% 47.2%
Equity/Total Capital (%) 28.2% 32.7% 32.8% 24.7% 29.9%GDT, Inc. 44.1% 44.5% 53.5% 52.8%
General Delivery Trucking, Inc. Ratio Analysis - Unadjusted

12/31/2011 12/31/2010 12/31/2009 12/31/2008 12/31/2007
Profitability Ratios (assume 40% tax rate)Net Income/Equity 9.2% 4.2% 17.3% 18.6% 13.1% GDT, Inc. 36.7% 38.4% 29.3% 15.8%
Net Income/Assets 2.6% 1.4% 5.7% 4.6% 3.9% GDT, Inc. 13.0% 13.6% 12.1% 6.6%
Net Income/Sales 1.3% 0.7% 2.5% 2.0% 1.9% GDT, Inc. 6.7% 7.5% 6.2% 3.6%
Net Income/BVIC 4.0% 2.0% 8.2% 7.0% 5.5% GDT, Inc. 16.2% 17.1% 15.6% 8.3%
EBIT/Total Assets 7.6% 7.9% 15.0% 15.3% 9.8% GDT, Inc. 24.5% 25.0% 22.4% 13.7%
EBIT/Sales 3.7% 4.2% 6.7% 6.6% 4.6% GDT, Inc. 12.6% 13.8% 11.4% 7.5%
EBITDA/BVIC 25.4% 25.4% 35.8% 42.2% 27.4% GDT, Inc. 47.8% 45.6% 44.1% 34.1%
EBITDA/Total Assets 16.5% 17.4% 24.9% 27.5% 19.4% GDT, Inc. 38.4% 36.1% 34.1% 26.9%
EBITDA/Sales 8.0% 9.2% 11.1% 11.9% 9.2% GDT, Inc. 19.7% 20.0% 17.4% 14.8%
* Based on RMA Data - NAICS 484122
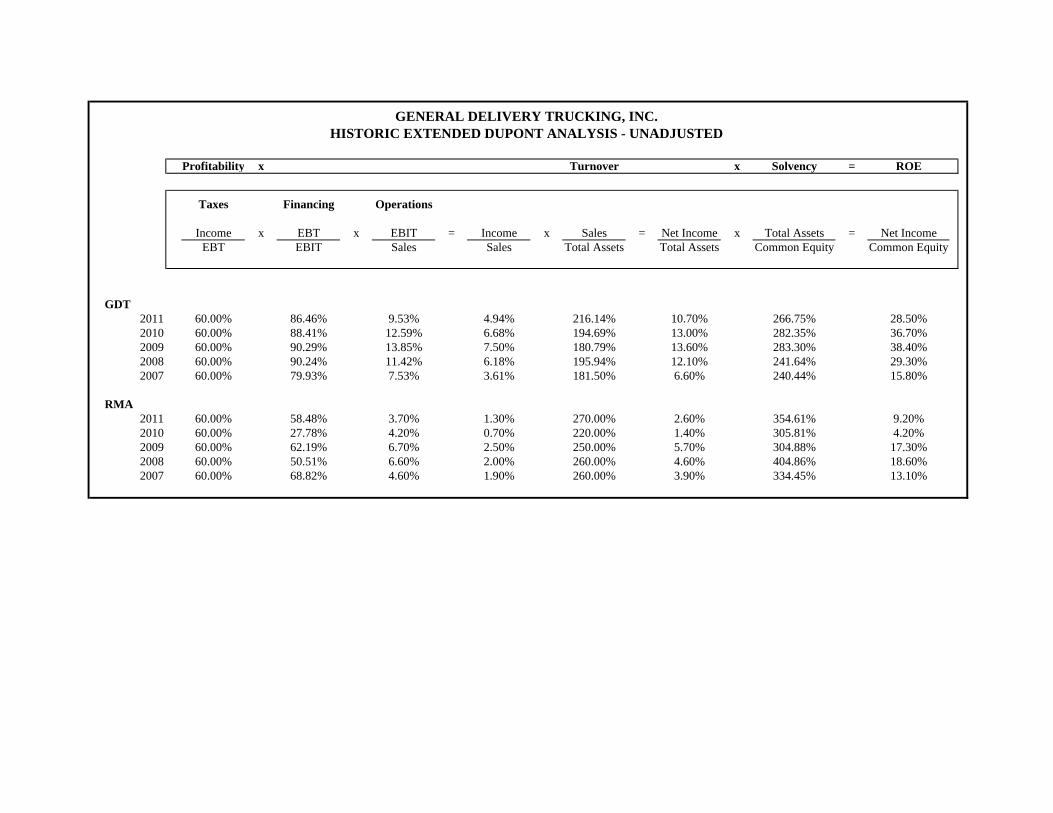
Profitability x Turnover x Solvency = ROE
Taxes Financing Operations
Income x EBT x EBIT = Income x Sales = Net Income x Total Assets = Net IncomeEBT EBIT Sales Sales Total Assets Total Assets Common Equity Common Equity
GDT2011 60.00% 86.46% 9.53% 4.94% 216.14% 10.70% 266.75% 28.50%2010 60.00% 88.41% 12.59% 6.68% 194.69% 13.00% 282.35% 36.70%2009 60.00% 90.29% 13.85% 7.50% 180.79% 13.60% 283.30% 38.40%2008 60.00% 90.24% 11.42% 6.18% 195.94% 12.10% 241.64% 29.30%2007 60.00% 79.93% 7.53% 3.61% 181.50% 6.60% 240.44% 15.80%
RMA2011 60.00% 58.48% 3.70% 1.30% 270.00% 2.60% 354.61% 9.20%2010 60.00% 27.78% 4.20% 0.70% 220.00% 1.40% 305.81% 4.20%2009 60.00% 62.19% 6.70% 2.50% 250.00% 5.70% 304.88% 17.30%2008 60.00% 50.51% 6.60% 2.00% 260.00% 4.60% 404.86% 18.60%2007 60.00% 68.82% 4.60% 1.90% 260.00% 3.90% 334.45% 13.10%
GENERAL DELIVERY TRUCKING, INC.HISTORIC EXTENDED DUPONT ANALYSIS - UNADJUSTED

Profitability x Turnover x Solvency = ROE
Taxes Financing Operations
Income x EBT x EBIT = Income x Sales = Net Income x Total Assets = Net IncomeEBT EBIT Sales Sales Total Assets Total Assets Common Equity Common Equity
GDT2011 60.00% 90.58% 12.41% 6.74% 246.80% 16.63% 349.43% 58.11%2010 60.00% 90.88% 14.54% 7.93% 214.83% 17.04% 347.96% 59.29%2009 60.00% 92.16% 15.80% 8.74% 201.54% 17.61% 358.75% 63.18%2008 60.00% 92.89% 14.56% 8.11% 231.33% 18.76% 324.68% 60.91%2007 60.00% 89.61% 13.03% 7.01% 223.64% 15.68% 356.79% 55.94%
RMA2011 60.00% 58.48% 3.70% 1.30% 270.00% 2.60% 354.61% 9.20%2010 60.00% 27.78% 4.20% 0.70% 220.00% 1.40% 305.81% 4.20%2009 60.00% 62.19% 6.70% 2.50% 250.00% 5.70% 304.88% 17.30%2008 60.00% 50.51% 6.60% 2.00% 260.00% 4.60% 404.86% 18.60%2007 60.00% 68.82% 4.60% 1.90% 260.00% 3.90% 334.45% 13.10%
GENERAL DELIVERY TRUCKING, INC.HISTORIC EXTENDED DUPONT ANALYSIS - ADJUSTED

Appendix D PowerPoint Slides

8/6/2015
1
BV201 - Introduction to Business Valuation – Market
Approach
Chapter 1

8/6/2015
2
BV201 Course Objectives
Understand the basic theories underlying business valuation.
Understand professional business valuation standards.
Define an appraisal assignment.
Gather useful data on the economy, industry and subject company.
Analyze economic, industry and subject company data and understand how the analysis affects value.
Arrive at indicated values for a business using the market approach, including the guideline public company and merger and acquisition methods.
3
BV202 Course Objectives
The basic theory and application of the income approach and its various methodologies.
Basic capitalization models and discounting models in the context of earnings and cash flow measurements, as well as equity and invested capital assignments.
Fundamentals of the asset approach.
4
8/6/2015
3
BV203 Course Objectives
Fundamentals of the asset approach.
Valuation adjustments, including discounts for lack of marketability and lack of control, as well as control premiums.
Report writing
5
BV204 Course Objectives
• Pass-Through Entities • Intangible Assets• Intangible Assets• Employee Stock Ownership Plan Valuation• Fairness Opinions• Solvency Opinions• Value Allocation in a Complex Capital Structure• Non-US Cost of Capital• Valuation of Debt and Preferred Stock• Litigation Services• Advancement and Accreditation
6

8/6/2015
4
Introduction
The Business Appraisal Profession
• Structure of the profession
• Entire firms specializing in business appraisal
• Departments of firms primarily doing other things, such as CPA firms, banks and multidisciplinary firms
• Part-time practitioners
7
Introduction
Role of the Business Appraiser
B i i ll id t t f i• Business appraisers generally provide two types of services:
1. An objective and independent valuation (opinion) of business interests
2. An advisory, or consulting (advocate), role in determining a value
8
8/6/2015
5
Introduction
Services Offered • Opinions of valuep
• Equity value
• Invested capital value
• Intangible asset value
• Other—options, debt• Consultation regarding values
St t t ti f l l f i t h• Structure terms, sometimes for several classes of investors, such as employee stock ownership plans (ESOPs) or leveraged buyouts
9
Introduction
Services Offered • Fairness opinionsp
• Solvency opinions
• Assistance in negotiating purchases/sales
• Mediation/arbitration of disputed valuations
• Litigation support in disputed valuations
• Expert testimony
10

8/6/2015
6
IntroductionNecessary Skills and Qualifications
Security AnalysisCommon Sense
Finance
Accounting
C
Statistics
Oral & Written Communication
Economics
Tax
Valuation LawStrategic Planning
Research
Computer
11
Introduction
Professional Designations
ASA/AM
CBA/MCBA
CPA/ABV
CBV
CVA
CFA
12

8/6/2015
7
Chapter 2
Business Valuation Theory
Comparison with Real Estate Appraisals
• Less rigidly structured than real estate appraisal approaches and usually more complex
• Valuing a group of assets rather than a single asset
• Follows less strictly the three-pronged real estate dictum of cost, market, and income approaches
14

8/6/2015
8
Three Approaches to Value
Market ApproachP i i l f b tit ti Principle of substitution
Comparison between subject property and similar properties that have recently sold
Use of guideline company transaction data• Both publicly traded and private companies that have been
acquired/mergedacquired/merged• Prior transactions in the subject company’s stock • Rules of Thumb – sanity test only
15
Three Approaches to Value
Market ApproachStrengths and weaknesses of the market approach
Direct method of valuation if similar companies can be found
Relatively easy to get data
A lot of information and research on the public companies
Very difficult to find truly similar companies
16
8/6/2015
9
Three Approaches to Value
Asset-Based Approach
A i b d th i i l f b tit ti• Again, based on the principle of substitution
• In BV, the asset-based, adjusted net asset, or adjustedbalance sheet method is our version of the costapproach
• Balance sheet analysis
• Separate valuation of each item on the balance sheet - adjustall tangible and intangible assets and liabilities to their marketvalues
17
Three Approaches to Value
Asset Based ApproachSt th d k f t b d hStrengths and weaknesses of asset-based approach
• Useful for holding company
• Useful if company is to be liquidated
• Does not focus on the income the assets produce as a whole
18
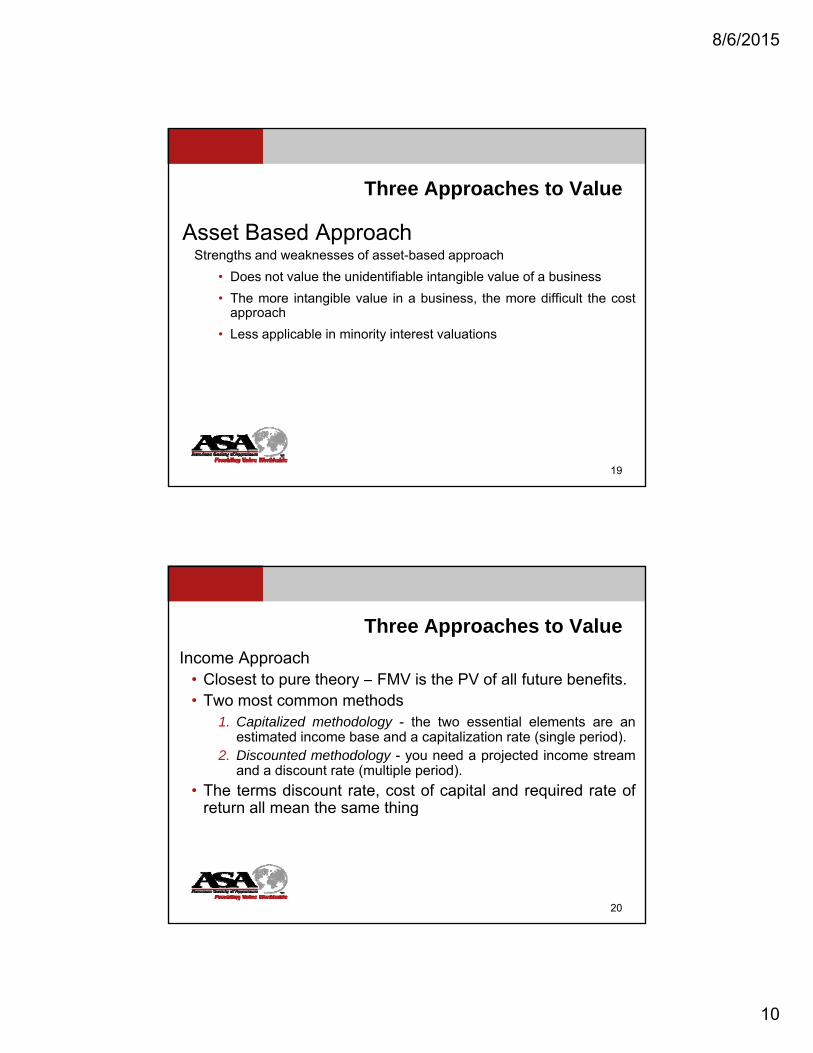
8/6/2015
10
Three Approaches to Value
Asset Based ApproachStrengths and weaknesses of asset-based approach
• Does not value the unidentifiable intangible value of a business
• The more intangible value in a business, the more difficult the costapproach
• Less applicable in minority interest valuations
19
Three Approaches to Value
Income Approach• Closest to pure theory – FMV is the PV of all future benefits.p y• Two most common methods
1. Capitalized methodology - the two essential elements are anestimated income base and a capitalization rate (single period).
2. Discounted methodology - you need a projected income streamand a discount rate (multiple period).
• The terms discount rate, cost of capital and required rate ofreturn all mean the same thingreturn all mean the same thing
20

8/6/2015
11
Three Approaches to Value
Income ApproachStrengths and weaknesses of income approachStrengths and weaknesses of income approach
• Closest to “pure” value theory
• Very difficult to forecast
• Estimates of capitalization or discount rate can be difficult to make. Discussed in more detail in BV202.
21
Approaches and Methods
22
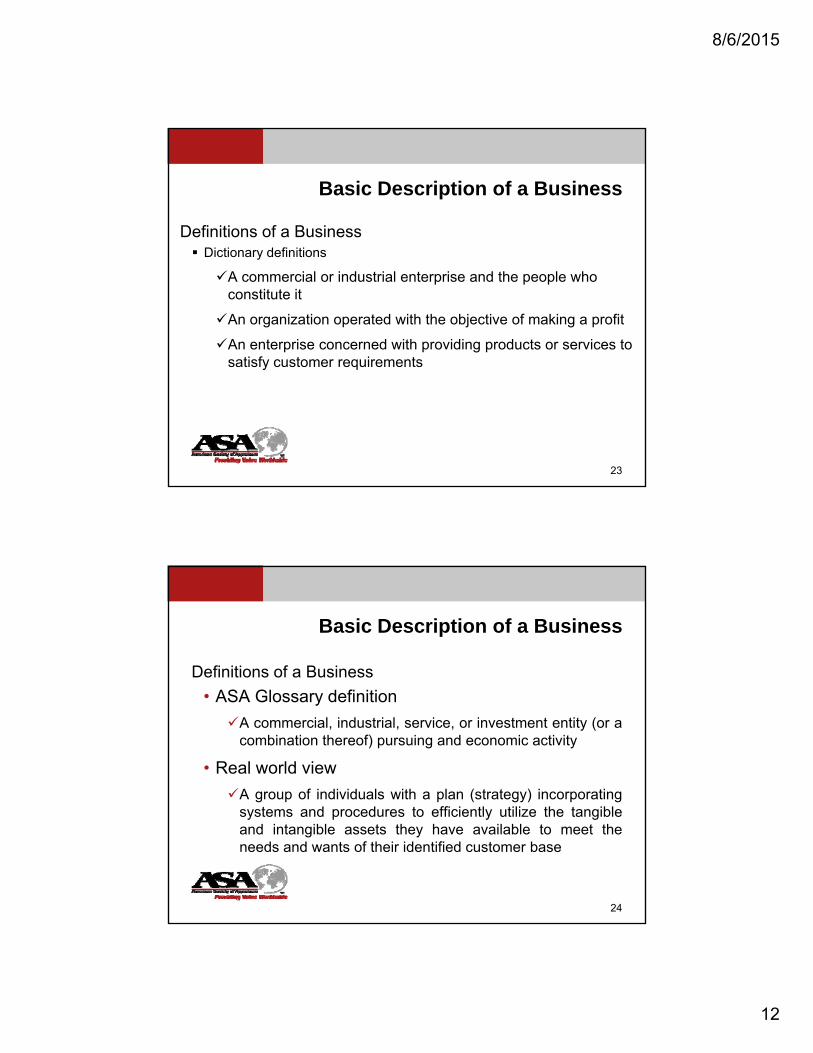
8/6/2015
12
Basic Description of a Business
Definitions of a BusinessDi i d fi i i Dictionary definitions
A commercial or industrial enterprise and the people who constitute it
An organization operated with the objective of making a profit
An enterprise concerned with providing products or services to satisfy customer requirementsy q
23
Basic Description of a Business
Definitions of a Business
• ASA Glossary definition
A commercial, industrial, service, or investment entity (or acombination thereof) pursuing and economic activity
• Real world view
A group of individuals with a plan (strategy) incorporatingsystems and procedures to efficiently utilize the tangibleand intangible assets they have available to meet theneeds and wants of their identified customer base
24
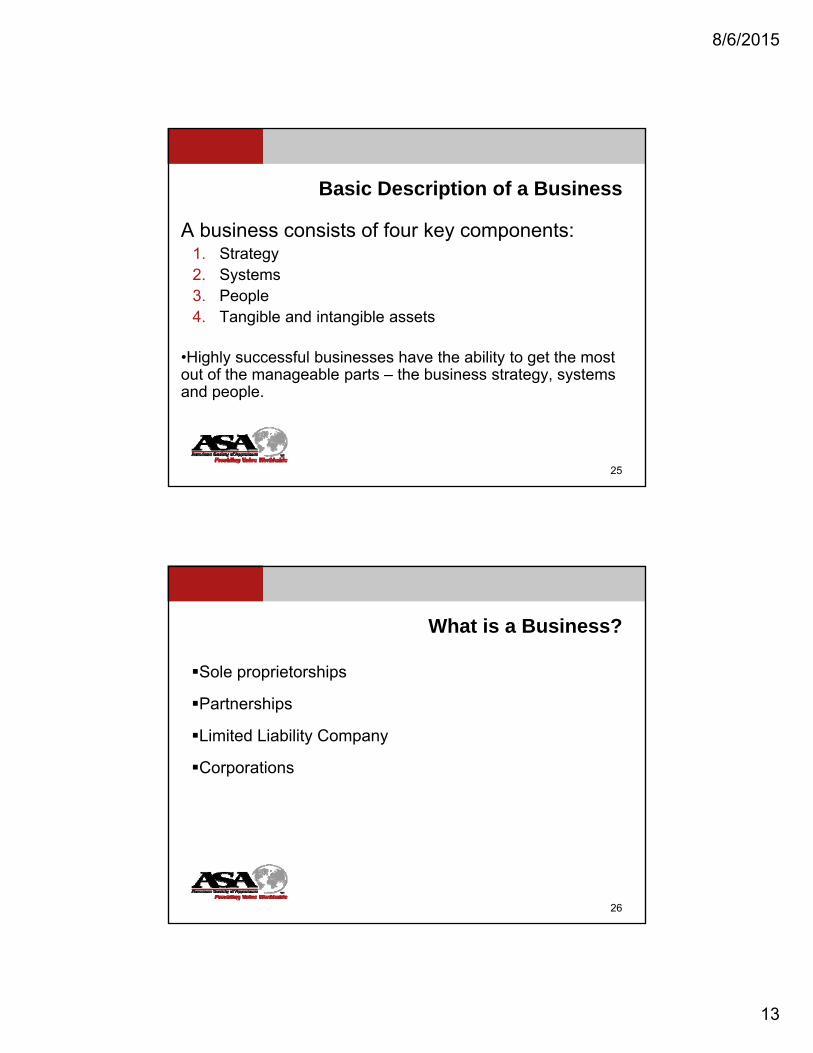
8/6/2015
13
Basic Description of a Business
A business consists of four key components:1 S1. Strategy2. Systems3. People4. Tangible and intangible assets
•Highly successful businesses have the ability to get the most out of the manageable parts – the business strategy, systems and people.
25
What is a Business?
Sole proprietorships
Partnerships
Limited Liability Company
Corporations
26

8/6/2015
14
What is a Business?
Public vs. Private Ownership
Si• Size
• Management depth/management succession
• Product line diversification
• Geographic diversification
• Market position/market share
• Supplier or customer dependence
27
What is a Business?
Public vs. Private Ownership• Lack of access to capital marketsLack of access to capital markets
• Private companies managed to minimize taxes, not maximize income
• Public companies typically more growth-oriented, particularly through acquisitions
Private companies generally compare unfavorably withpublic companies in these areas, but that’s not always thecase.
28
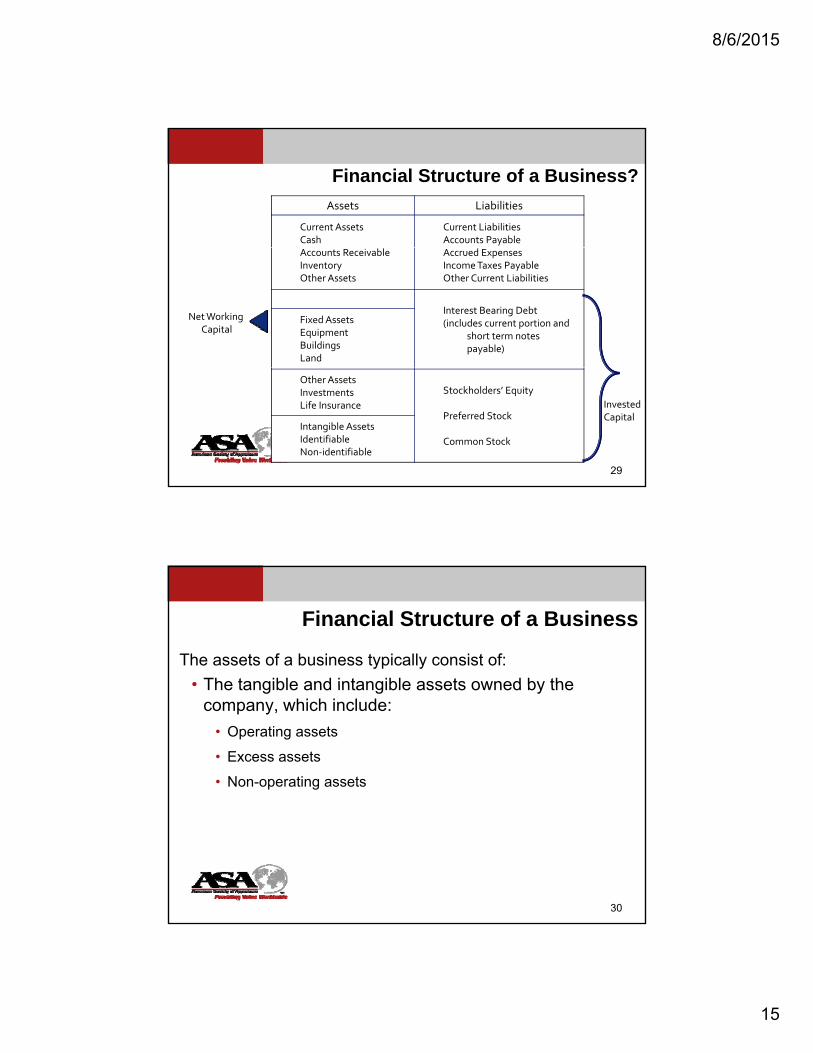
8/6/2015
15
Assets Liabilities
Current AssetsCash
Current LiabilitiesAccounts Payable
Financial Structure of a Business?
Accounts ReceivableInventoryOther Assets
Accrued ExpensesIncome Taxes PayableOther Current Liabilities
Interest Bearing Debt(includes current portion and
short term notes payable)
Fixed AssetsEquipmentBuildingsLand
Net WorkingCapital
29
Other AssetsInvestmentsLife Insurance
Stockholders’ Equity
Preferred Stock
Common Stock
Intangible AssetsIdentifiableNon‐identifiable
InvestedCapital
Financial Structure of a Business
The assets of a business typically consist of:
• The tangible and intangible assets owned by the• The tangible and intangible assets owned by the company, which include:
• Operating assets
• Excess assets
• Non-operating assets
30

8/6/2015
16
Financial Structure of a Business
The assets of a business typically consist of:
• Non-booked or unrecorded assets—the intangible or• Non-booked or unrecorded assets—the intangible or other assets that are not recorded on the company’s financial statements
• Per GAAP, the internally generated assets of the company are expensed and not recorded on the company’s balance sheet.
• Discarded assets that may still have value—e.g., molds, old equipment, scrap, etc.
31
Financial Structure of a Business
Types of assets used in the business include:
• Liquid assets—cash, accounts receivable, securities, short term notes, etc.
• Inventory—raw materials, work in process and finished goods
• Other current assets—additional assets that are expected to be used in the normal operating year of the company (the next 12 months)
32

8/6/2015
17
Financial Structure of a Business
Types of assets used in the business include:
• Fixed assets—generally considered to be the office and• Fixed assets—generally considered to be the office and manufacturing facilities used in the business.
• These assets are recorded at their original costs and are then depreciated over their estimated economic or tax lives.
33
Financial Structure of a Business
Types of assets used in the business include:
Oth t th t ll i l d• Other assets—these assets generally include:
• Additional assets that are not expected to be used in the normal operating year of the company
• Tangible assets not used in the operations of the business
• Purchased intangible assets, intellectual property and goodwill
• Long-term notes receivable
34

8/6/2015
18
Financial Structure of a Business
The liabilities of the business typically consist of:
• Current liabilities – generally payable in 12 months or less
• Long-term liabilities - generally not payable in the current operating year/the next 12 months
35
Financial Structure of a Business
Liabilities of the company can be interest-bearing and non-interest-bearing obligations.interest bearing obligations.
• Interest-bearing liabilities include bank debt, mortgages payable, notes payable and may or may not include loans from stockholders.
• Non-interest-bearing liabilities include accounts payable, payroll payable, accrued expenses and often loans from stockholders.
36

8/6/2015
19
Financial Structure of a Business
General characteristics of bank loans, mortgage notes and t bl t thi d tinotes payable to third parties:
• They are secured interests—specific assets are generally pledged as collateral.
• They carry terms related to repayment schedules, interest rates and covenants.
37
Financial Structure of a Business
The ownership equity section of the company’s balance sheet generally consists of:
• Sole proprietorship the owner’s investment is generally referred to as the owner’s net worth or equity.
• Partnership (or a limited liability company) the partner’s (member’s) direct investment is referred to as partner’s (member’s) equity (capital).
38
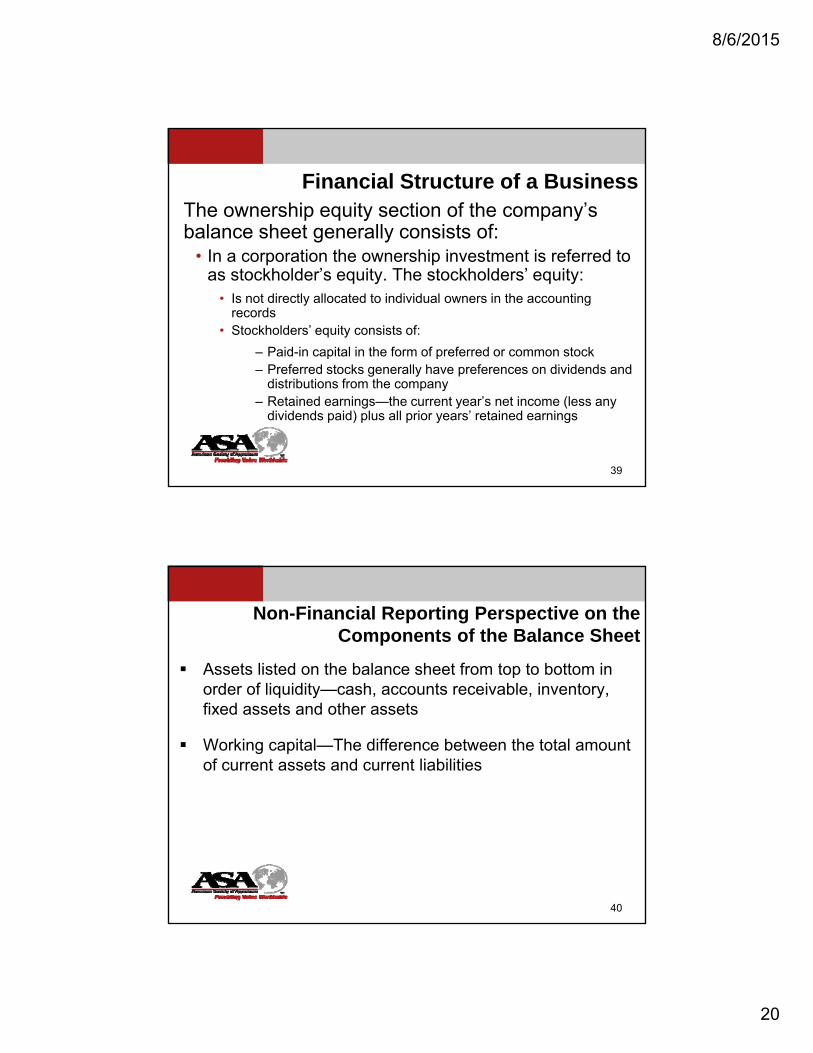
8/6/2015
20
Financial Structure of a BusinessThe ownership equity section of the company’s balance sheet generally consists of:
• In a corporation the ownership investment is referred to as stockholder’s equity. The stockholders’ equity:
• Is not directly allocated to individual owners in the accounting records
• Stockholders’ equity consists of:
– Paid-in capital in the form of preferred or common stock Preferred stocks generally have preferences on dividends and– Preferred stocks generally have preferences on dividends and distributions from the company
– Retained earnings—the current year’s net income (less any dividends paid) plus all prior years’ retained earnings
39
Non-Financial Reporting Perspective on the Components of the Balance Sheet
Assets listed on the balance sheet from top to bottom in d f li idit h t i bl i torder of liquidity—cash, accounts receivable, inventory,
fixed assets and other assets
Working capital—The difference between the total amount of current assets and current liabilities
40

8/6/2015
21
Non-Financial Reporting Perspective on the Components of the Balance Sheet
Invested capital—The sum of the stockholder’s equity or partner’s capital and the interest-bearing debtpartner s capital and the interest-bearing debt.
Interest-bearing debt is referred to as the debt capital of the business.
41
Non-Financial Reporting Perspective on the Components of the Balance Sheet
The stockholder’s equity section of the balance sheet is referred to as the equity capital of the business.
Equity capital (dividends/profit) and debt (interest) capital enjoy different rights and risks and therefore generally have very different rates of expected returns.
42

8/6/2015
22
Non-Financial Reporting Perspective on the Components of the Balance Sheet
Liabilities on the balance sheet are presented differently for financial reporting and invested capital analysis purposes.
43
Measuring Net Cash Flow
Equity Cash FlowRevenue
less Cost of salesless Operating expense
O i I (EBIT)= Operating Income (EBIT)less Interest expense= Pretax incomeless Income Taxes= Net income
plus Depreciation & amortization= Gross cash flowless Increase in working capital
44
less Increase in working capitalless Capital expenditures+/‐ Change in debt principal
= Equity Net Cash Flow

8/6/2015
23
Measuring Net Cash Flow
Invested Capital Cash FlowRevenue
less Cost of salesless Operating expense= Operating Income (EBIT)= Operating Income (EBIT)
less Taxes on EBIT= Net operating profit after tax (NOPAT)
plus Depreciation & amortization= Gross cash flowless Increase in working capital
45
g pless Capital expenditures
= Invested Capital Net cash flow
An Example
Assume the following:Net Income $ 10,000,000Depreciation $ 1 400 000Depreciation $ 1,400,000Amortization $ 200,000Interest Expense $ 3,000,000Income Taxes $ 3,900,000Capital Expenditures $ 1,500,000Increase in Working Capital $ 1,800,000Net Increase in Long-Term Debt $ 400,000
46
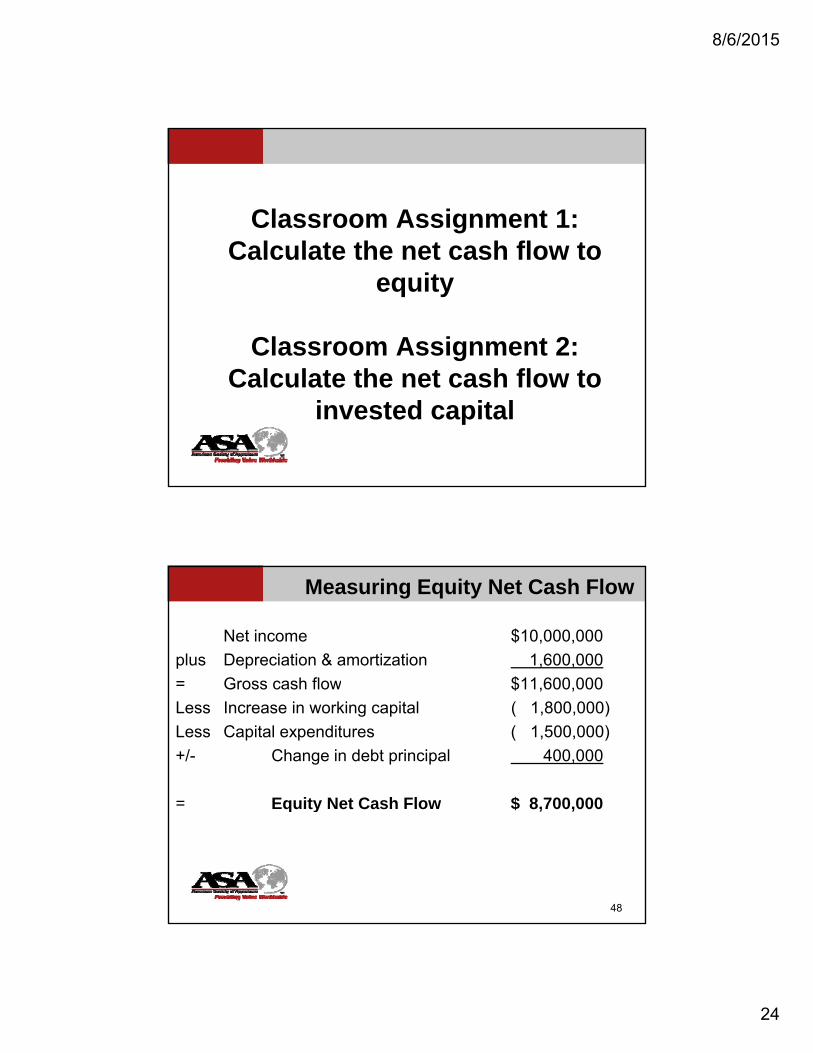
8/6/2015
24
Classroom Assignment 1: Calculate the net cash flow toCalculate the net cash flow to
equity
Classroom Assignment 2: Calculate the net cash flow to
invested capital
Measuring Equity Net Cash Flow
Net income $10,000,000
plus Depreciation & amortization 1,600,000
= Gross cash flow $11 600 000= Gross cash flow $11,600,000
Less Increase in working capital ( 1,800,000)
Less Capital expenditures ( 1,500,000)
+/- Change in debt principal 400,000
= Equity Net Cash Flow $ 8 700 000= Equity Net Cash Flow $ 8,700,000
48
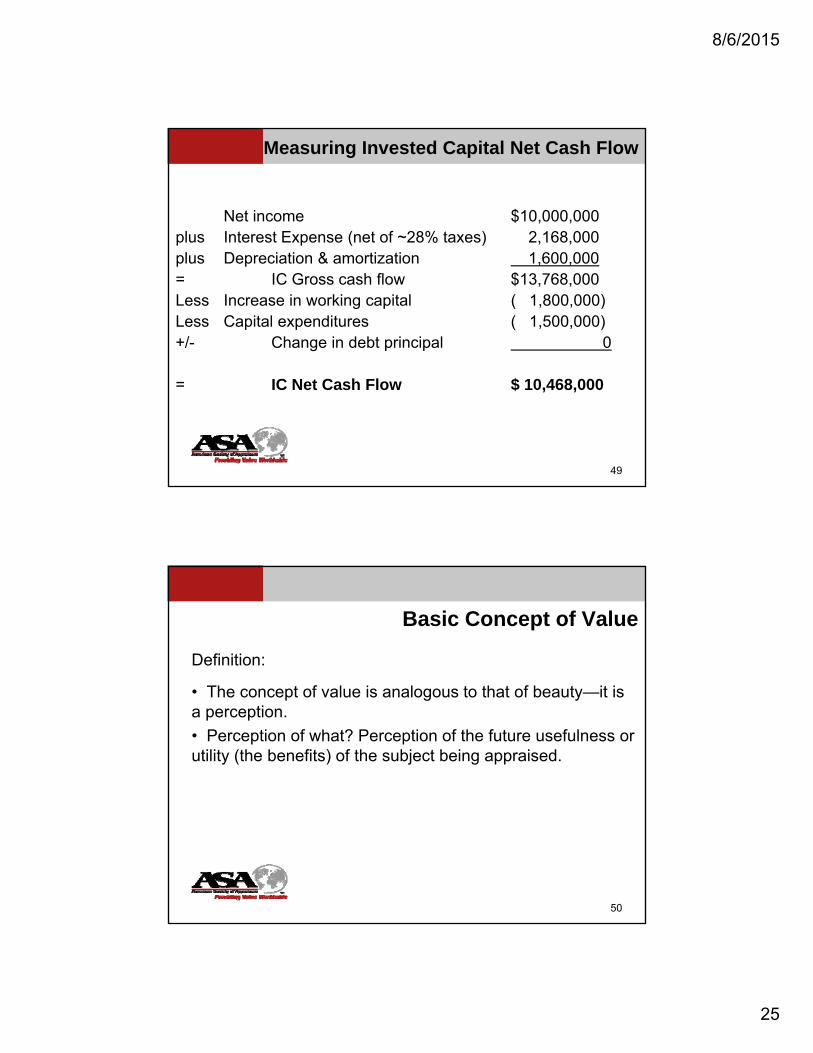
8/6/2015
25
Measuring Invested Capital Net Cash Flow
Net income $10,000,000plus Interest Expense (net of ~28% taxes) 2,168,000plus Depreciation & amortization 1,600,000= IC Gross cash flow $13,768,000Less Increase in working capital ( 1,800,000)Less Capital expenditures ( 1,500,000)+/- Change in debt principal 0
= IC Net Cash Flow $ 10,468,000
49
Basic Concept of Value
Definition:
• The concept of value is analogous to that of beauty—it is a perception.
• Perception of what? Perception of the future usefulness or utility (the benefits) of the subject being appraised.
50

8/6/2015
26
Basic Concept of Value
• Value to “whom”? (Answering this question defines the scope of the appraisal definition.)
• Value for what purpose, or “why”? (Answering this question defines the function of the appraisal assignment.)
• Value as of “when”? (Answering this question defines the effective date of the appraisal )effective date of the appraisal.)
51
Value vs. Cost vs. Price
Value• Value will vary depending on the perceived value to aValue will vary depending on the perceived value to a
specific type of investor.
• The value of any financial asset is equal to the net present value of the expected future cash flows (CF) derived from the asset,
• Discounted at the required rate of return (k), which is also referred to as the discount ratereferred to as the discount rate.
• The required rate of return will vary depending on the type of buyer.
52

8/6/2015
27
Value vs. Cost vs. Price
Cost• Simply represents a historical fact• Simply represents a historical fact.• Usually little relationship to its current value.• The balance sheet simply represents a
historical tracking of costs incurred to acquire certain assets.
53
Value vs. Cost vs. Price
Price• Offering price market price dealer’s price FMV• Offering price, market price, dealer s price, FMV
price, are common variations of the term.• Offering price simply represents a number that a
seller is asking for an asset.
54

8/6/2015
28
Value vs. Cost vs. Price
Price• In the business valuation world, price is most commonly thought ofIn the business valuation world, price is most commonly thought of
as the value received as adjusted for the terms of the transaction. For example,
• Owner A sells his company for $1,000,000 for cash and Owner B sells his business for $1,000,000 on a non-interest-bearing note for 10 equal annual payments of $100,000.
• Both owners paid the same price, but the underlying value is different.
55
Appraiser's Job
• Goal: To estimate economic value
• Achieve the above goal by rigorously exercising the three approaches available to him/her.
56

8/6/2015
29
Value Determination
• The litmus test to verify that one is reasonably determining value is to invoke the three valuation approaches.
• By correlating the results of one approach against the other two approaches, one can reasonably (and comfortably) validate that one has received (or determined) “value.”
57
Standards of Value – Fair Market Value
• Addresses the broadest end of the spectrum of potential buyers.
• It is the most common standard of value used in business appraisals today, particularly for U.S. tax-related events.
58
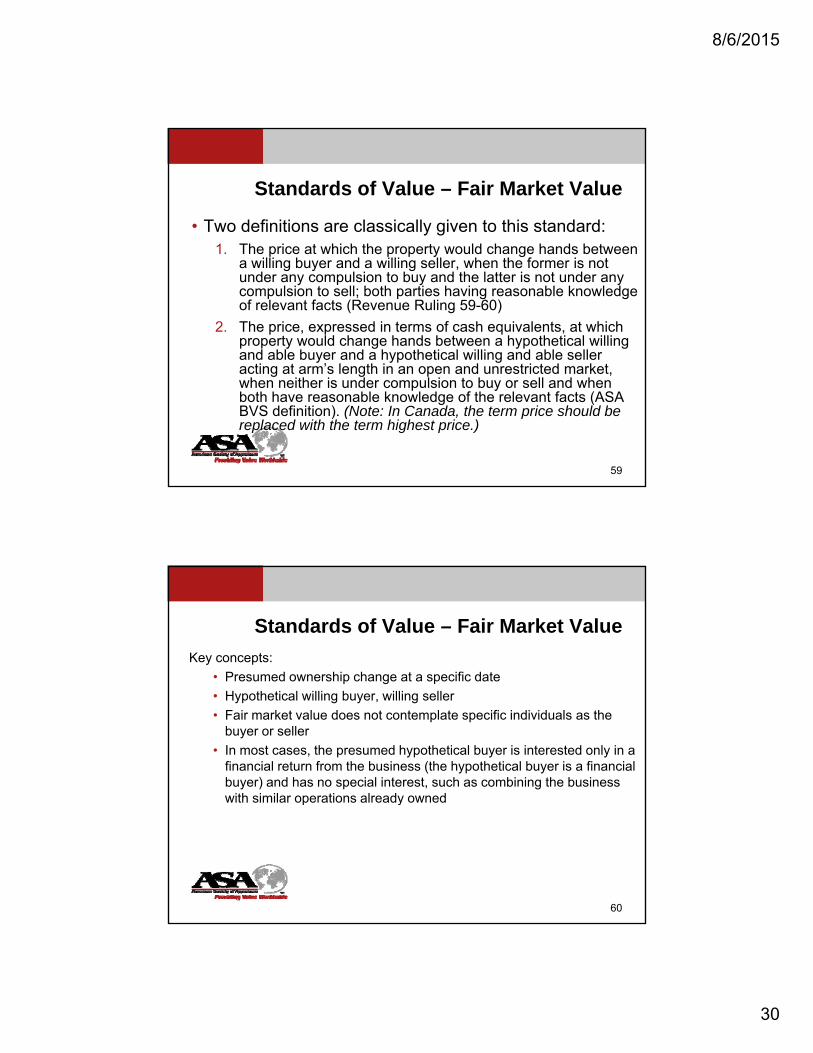
8/6/2015
30
Standards of Value – Fair Market Value
• Two definitions are classically given to this standard: 1 The price at which the property would change hands between1. The price at which the property would change hands between
a willing buyer and a willing seller, when the former is not under any compulsion to buy and the latter is not under any compulsion to sell; both parties having reasonable knowledge of relevant facts (Revenue Ruling 59-60)
2. The price, expressed in terms of cash equivalents, at which property would change hands between a hypothetical willing and able buyer and a hypothetical willing and able seller acting at arm’s length in an open and unrestricted marketacting at arm s length in an open and unrestricted market, when neither is under compulsion to buy or sell and when both have reasonable knowledge of the relevant facts (ASA BVS definition). (Note: In Canada, the term price should be replaced with the term highest price.)
59
Standards of Value – Fair Market Value
Key concepts:
• Presumed ownership change at a specific date
• Hypothetical willing buyer, willing seller
• Fair market value does not contemplate specific individuals as the buyer or seller
• In most cases, the presumed hypothetical buyer is interested only in a financial return from the business (the hypothetical buyer is a financial buyer) and has no special interest, such as combining the business with similar operations already ownedp y
60

8/6/2015
31
Standards of Value – Fair Market Value
Key concepts:• In the limited case where the pool of willing buyers for a business
consists primarily of special buyers (or strategic buyers), which may be the case in periods of intense industry consolidation, the willing buyer may be defined as a special buyer, and some level of synergistic value may be incorporated in fair market value.
• No compulsion to transact on either party’s part.
• Reasonable knowledge by both parties.
• Cash or cash equivalent price.
• Transaction costs not included.
• Generally assumed to include a covenant not to compete. However, this can be somewhat controversial in some jurisdictions.
61
Standards of Value- Investment Value
• Is defined as the value to a particular buyer (or small handful of buyers)handful of buyers)
• By definition, this extremely small and limited market is typically characterized by a premium because of the unique synergy(ies) the perceived particular buyer would realize as a result of acquiring the asset
62

8/6/2015
32
Standards of Value -Investment Value
• The value that a particular investor considers, on the basis of individual investment requirements such as:q
• Differences in estimates of future earning power• Differences in perception of the degree of risk and the
required rate of return• Differences in financing costs and tax status• Synergies with other operations owned or controlled
• Investment value is sometimes referred to asInvestment value is sometimes referred to as “strategic value” or “synergistic value” due to the synergy aspect of the transaction. An exchange transaction is contemplated in this standard of value
63
Standards of Value – Fair Value
Fair value has two different contexts:For legal purposesFor legal purposes
• Primarily used in dissenting stockholder actions and shareholder oppression cases.
• The definition varies from jurisdiction to jurisdiction as specified in state statutes and developed in the state’s case law precedents.
• This standard of value is legal community-based, not economically (or market-) based.
64
8/6/2015
33
Standards of Value – Fair Value
For financial reporting purposes
• Fair value is defined as: the price that would be received to sell an asset or paid to transfer a liability in an orderly transaction between market participants at the measurement date. (FASB ASC 820, formerly SFAS 157)
• Fair value is now an exit price (sell-side), which means the price a company would receive if they were to sell an asset p p y yin the marketplace or paid if they were to transfer the liability. Transaction costs are excluded from fair value.
65
Standards of Value- Fair value for financial reporting purposes
Market participants are buyers and sellers in the principal or t d t k t f t li bilit M k tmost advantageous market for an asset or liability. Market
participants are:
• Unrelated (i.e., independent) to the reporting entity
• Knowledgeable about factors relevant to the asset or liability and the transaction
• Have the financial and legal ability to transactHave the financial and legal ability to transact
• Are willing to transact without compulsion
66

8/6/2015
34
Standards of Value- Fair value for financial reporting purposes
The “fair value hierarchy”• Level ILevel I
• Quoted prices in active markets for identical assets/liabilities
• Level II • Observable prices for similar assets/liabilities
• Prices for identical assets/liabilities in an inactive market
• Directly observable inputs for substantially full term of asset/liability
• Market inputs derived from or corroborated by observable market data
L l III• Level III• Unobservable inputs based on the reporting entity’s own assumptions about
the assumptions a market participant will use
67
Standards of Value-Fair value for financial reporting purposes
Fair value for financial reporting purposes and fair market p g p pvalue are similar concepts, although differences can exist. For example, FASB Accounting Standards Codification (“ASC”) Topic 820 specifically does not allow for blockage discounts.
Fair value assumes the highest and best use for an asset. Reporting entities need to determine if highest and best use for an asset is in use or in exchange (valuation basis)for an asset is in-use or in-exchange (valuation basis) regardless of management’s intended use for the asset. (Market participant perspective)
68

8/6/2015
35
Standards of Value-Fair value for financial reporting purposes
Highest and Best Use is In-Use if:• Asset has maximum value in combination with other assets as a
group (installed or configured)
• Typically non-financial assets
Highest and Best Use is In-Exchange if:• Asset has maximum value on a stand-alone basis
• Typically financial assets• Typically financial assets
69
Standards of Value - Intrinsic Value
• The value that a prudent investor considers, on the basis of an evaluation or available facts, to be the "true" or "real” value that will become the market value when other investors reach the same conclusion.
• What the value should be based on analysis of all the fundamental factors inherent in the business or the investment.
• Does not consider extreme aspects of market conditions and ( f Obehavior. (e.g., the value of any particular stock on October
20, 1987 -the Monday after the computer-driven event of Black Friday).
70

8/6/2015
36
Differences in Standards of Value
Fair MarketValue Investment
Statutory Fair Value (Legal Standard/Dis
senting Shareholder)
Financial Fair Value
(Financial Reporting/FA
SB/SEC)) )
Seller Hypothetical Actual Actual Actual
Buyer Hypothetical Actual Market Based Market Based
Synergy No YesBy State Statute
Level 1 –Quoted PricesStatute Quoted Prices
Stand Alone Yes NoBy State Statute
Level 2 –Observable
Level 3 -Unobservable
71
Premise of Value
Going concern value premise• All the foregoing definitions of value assume an
ongoing business, though FMV could also be a g g , gliquidation value.
Liquidation value premise• The appraiser / prudent investor (buyer) assumes
the business will NOT continue in its present form d ill b di tl dand will be dismantled.
• This dismantling is driven by the belief that the business is better off dead than alive.
72

8/6/2015
37
Two Forms of Liquidation
Orderly LiquidationThe expected gross proceeds from the sale of the asset:The expected gross proceeds from the sale of the asset:
•Held under orderly sales conditions
•Given a reasonable period of time in which to find purchasers
•Considering a complete sale of all assets as is, where is, with the buyer assuming all costs of removal
•With all sales free and clear of all liens and encumbrances
•With the seller not acting under compulsion
•Under current economic conditions, as of a specific date
73
Two Forms of Liquidation
Forced LiquidationThe expected gross proceeds from the sale of the asset:The expected gross proceeds from the sale of the asset:
• That could be realized at a properly advertised and conducted public auction held under forced sale conditions
• With a sense of immediacy
• Lack of adequate time to find purchasers
• Fire sale values apply
• Under current economic conditions, as of a specific date
74

8/6/2015
38
Premise of Value Value in Exchange vs. Value in Use
Value in exchange presupposes a proposed transaction of the g p pp p pproperty, wherein the property actually changes ownership hands.
This value premise references market conditions external to the company being appraised.
As such the value standards of investment value fair marketAs such, the value standards of investment value, fair market value and liquidation value are properly classified under this premise.
75
Premise of Value Value in Exchange vs. Value in Use
Value in use does not presuppose a proposed transaction of the property,whereby the property actually changes ownership hands.
It does not reference market or economic conditions external to thecompany being appraised.
It assumes that the current economic return (profitability) of the companybeing appraised is of sufficient magnitude to provide a reasonable basis to aprudent investor that the company has adequate financial strength toprudent investor that the company has adequate financial strength tocontinue operating into the future.
76

8/6/2015
39
Basic Variables Affecting Value
Risk/return analysis:
•Generally, the higher the risk associated with an investment, the higher the return an investor will require to make the investment.
•Higher risk = higher discount/capitalization rate (or lower multiple) and lower value.
77
Basic Variables Affecting Value Business risk
• Business Risk is any threat to achieving an organization’s business objectives. It is the likelihood that an event or action may negatively j y g yaffect the entity.
• Operational risk-uncertainty or volatility of operating flows: revenue, earnings and cash flows
• Turnover risk-the decline in return on assets (ROA) due to the underutilization of assets
• Financial risk-the fluctuation of earnings available to common shareholders, measured by calculating the degree of financial l d i l d li idit tileverage and various leverage, coverage and liquidity ratios
• Liquidity risk-the ease with which the asset can be converted to cash (In business valuation, this is typically quantified in the discount for lack of marketability.)
78

8/6/2015
40
Basic Variables Affecting Value Going concern business risks
• Going concern-the ability of the company to continue in operations f th f bl f tfor the foreseeable future.
• Going concern business risks are created by internal and external factors.
• External risk factors include:
• Economic conditions and outlook (interest rates, inflation, etc.).
• Industry conditions and outlook, including competitive analysis y , g p y(expected growth).
• Market rates of return (risk free rate, equity risk premium, industry and company-specified risk).
79
Basic Variables Affecting Value
Internal risk factors• Business background and current operations.g p
• Earnings history of the firm (stability vs. volatility).
• Future earnings expectations (high growth vs. low growth).
• Balance sheet - financial strength (how leveraged).
• Qualitative factors such as management depth, customer concentration, security of supply.
80

8/6/2015
41
Basic Variables Affecting Value
Examples of going concern risks:
• A decline in the demand for industry products• A decline in the demand for industry products.
• A company’s inability to attract new debt or equity capital.
• When a company can no longer continue operations, then the assets of the company are liquidated and the financial obligations are first satisfied with the commonfinancial obligations are first satisfied, with the common shareholders receiving any proceeds remaining, after all other claims have been paid.
81
The Role of IRS Rulings
IRS revenue rulings provide important guidelines for specific valuation issuesspecific valuation issues.
The following IRS Revenue Rulings (RR) should be copied and filed as part of your valuation library.
• Revenue Ruling 59-60 highlights key items to be considered in valuing a business.
• Revenue Ruling 65-192 states that the theory used in RR 59-60 applies to income and other taxes as well as estate and gift taxes.
82

8/6/2015
42
Revenue Ruling 59-60
Nature of the business and history of the enterprise since its inceptioninception
The economic outlook in general and the condition and outlook of the specific industry in particular
The book value of the stock and the financial condition of the business
The earning capacity of the company
83
Revenue Ruling 59-60
The dividend paying capacity
Wh th t th t i h d ill thWhether or not the enterprise has goodwill or other intangible value
Sales of the stock and size of the block of stock to be valued
The market price of the stocks of corporations p pengaged in the same or a similar line of business having their stocks actively traded in a free and open market, either on an exchange or over-the-counter
84

8/6/2015
43
The Role of IRS Rulings
•There are many other rulings that an appraiser needs to be aware of.
•When tax appraisals are performed, it is the appraiser’s responsibility to be aware of the rules.
•It is recommended that a tax professional be consulted about these rulings.
85
Key Court Cases
•Appraisers should be aware of court case decisions that pertain
to the type of valuation they are performingto the type of valuation they are performing.
•Helpful aspects of court decisions.
• Interpret standard of value.
• Indicate important factors to consider.
• Suggest approaches to value that are persuasive.
86

8/6/2015
44
Key Court Cases
•Caution must be used in applying these decisions. Case
decisions are very fact-specific and may not apply to yourdecisions are very fact specific and may not apply to your
subject company. Judges are not valuation experts.
•While court cases are important to study, they should not
establish valuation theory. We, not court judges, are the experts.
However, they often establish binding legal precedent.
87
Steps of a Business Appraisal
1. Define the appraisal assignment
2. Gather the data
3. Analyze the data
4. Arrive at a value conclusion
5. Write the report5. Write the report
88

8/6/2015
45
Classroom Assignment 3 : gReview Exhibit 2-2 at the end of this chapter
Chapter 3p

8/6/2015
46
Defining The AssignmentBVS-I states the following:
In developing a business valuation, an appraiser must identify and d fidefine:
• The business, business ownership interest or security to be valued.
• The effective date of the appraisal.
• The standard of value.
• The purpose and the intended use of the valuation.
• The nature and scope of the assignment must be defined. Acceptable scopes of work will generally be one of three types. Other scopes of work should be explained and described.
91
Pre-Engagement
The appraiser must specifically define the assignment in order to determine whether or not to accept thein order to determine whether or not to accept the project and to quote a fee.
Assess the complexity of the project.• Size of the business, more than one line of business,
interrelated entities
• Type and availability of financial information
• Capital structure-degree of leverage, financially distressed, etc.
92

8/6/2015
47
Pre-Engagement
Assess the complexity of the project.• Non-operating assets and liabilities• Minority versus control interest • Start-up company• Preliminary assessment of possible appropriate valuation
methodologies and obvious difficulties in applying those methods
Assess the appraiser’s ability to perform the assignmentAssess the appraiser s ability to perform the assignment.• Does the appraiser meet the necessary competency
requirements?
93
Pre-Engagement
The appraiser must identify issues related to independence and conflict of interest that could reflectindependence and conflict of interest that could reflect on his or her objectivity and credibility.
• All appraisers should be viewed as independent of their clients.
• Independence is not the same as a conflict of interest.• Independence - freedom from control or influence of another or others
• Conflict of interest - any interest, financial or otherwise, any business or professional activity, or any obligation that is incompatible with the proper discharge of an appraiser’s duties in the public interest
94

8/6/2015
48
Pre-Engagement
Before accepting the assignment, you must determine if you have a potential conflict and disclose such to the client.
• BVS VIII; Paragraph IIIA
• USPAP Ethics Rule: Conduct
• USPAP Standard 10-3
• Not always easily identifiable
95
Pre-Engagement
Appraisers working for accounting firms are subject to specific independence rules.
• SEC registrant - Sarbanes-Oxley Act of 2002 describes services that an audit firm may provide to an audit client.
• Sarbanes-Oxley generally prohibits the performance of appraisal and valuation services related to the audit client’s financial reports.
• However the regulations expressly state that accounting firms• However, the regulations expressly state that accounting firms are not prohibited from performing non-financial statement valuation work, specifically including tax-only valuations.
96
8/6/2015
49
Pre-EngagementAppraisers working for accounting firms are subject to specific independence rules.p p
• Non-SEC Registrant (AICPA Code of Conduct, Interpretation 101-3, performance of other services) The general requirements are:
• All significant matters of judgment are determined or approved by the client.
• The client is in a position to have an informed judgment on the results of the valuation.
• The client accepts responsibility for the valuation.
97
What is Being Appraised?
The type of business• CorporationCorporation
• C-Corp or S-Corp
• State of incorporation
• Limited Liability Company
• State of formation
• Taxation driven by federal tax law
P t hi / l t hi li it d t hi• Partnership/general partnership or limited partnership
• State of formation
• Sole proprietorship
98

8/6/2015
50
What is Being Appraised?
The nature of the business interestStock common or preferred• Stock - common or preferred
• Assets that make up the business
• Invested capital
• Specific intangible assets
• Options or warrants
The level of the ownership interest• Control or Minority?
99
Effective Date of The Appraisal
• Every valuation is as of a specific point in time. The value at an earlier or later date may be different.at an earlier or later date may be different.
• Only information that is “known or knowable” as of the specific valuation date should be incorporated into a business valuation.
100

8/6/2015
51
Effective Date of The Appraisal
The valuation date should be specifically defined at the time of engagement. The valuation date is different from:
• The date of engagement• The date of field work• The date the report is produced
It is generally easiest if the valuation date coincides with the date of the company’s reported financial statements.
101
Scope of the Appraisal
In BVS-1, the ASA Business Valuation Standards identify three possible scopes for appraisal work.
• Appraisal• The objective of an appraisal is to express an unambiguous
opinion as to the value of the business, business ownership interest, or security, which opinion is supported by all procedures that the appraiser deems to be relevant to the valuation.
102

8/6/2015
52
Scope of the Appraisal
In BVS-1, the ASA Business Valuation Standards identify three possible scopes for appraisal work.
• Limited appraisal• The objective of a limited appraisal is to express an estimate
as to the value of a business, business ownership interest, or security. The development of this estimate excludes some additional procedures that are required in an appraisal.
103
Scope of the Appraisal
In BVS-1, the ASA Business Valuation Standards identify three possible scopes for appraisal work.p p pp
• Calculation
• The objective of a calculation is to provide an approximate indication of value based upon the performance of limited procedures agreed upon by the appraiser and the client.
104

8/6/2015
53
Engagement Letters
Should contain an explanation of the assignment in sufficient detail to ensure that there can be no misunderstanding between the appraiser and the client.
• The obligations of each party should be spelled out.
• The client must provide financial and operating information as well as access to facilities and people.
• The analyst must perform certain predetermined functions.
• The procedures to be followed if there is a breakdown on either side of the project should be indicated.
• Provision if the assignment or scope changes.
105
Suggested Content of Engagement Letters
Name of client retaining the appraiser
Id tifi ti f th d hi i t t t bIdentification of the company and ownership interest to be valued
Appraisal date
Standard of value and definition of the standard of value
Purpose and intended use of the appraisalPurpose and intended use of the appraisal
Scope of the appraisal work
106
8/6/2015
54
Contents of Engagement Letter
Scope of the appraisal report and documentation
• Many situations can be satisfied with relatively simple reports and little or no supportive, documentary evidence.
• However, the end result must effectively meet the client’s requirements.
• The end result must also meet the standards established for reports developed by ASA and in USPAP.
• In any case, there should be a clear understanding at the outset of what will be provided at the conclusion of the project.
107
Contents of Engagement Letter
Which professional standards are to be followed (USPAP, BVS)BVS)
If applicable, due date• Including oral conclusions provided in advance of the written report.
• It is wise to tie due dates to timely delivery of required information by the client.
• In the minds of most clients, a late report is a poor quality report.
108

8/6/2015
55
Contents of Engagement Letter
Fee arrangements• Not all engagements call for a set fee.Not all engagements call for a set fee.
• However, it should be made absolutely clear:
• Who will be responsible for payment of the fee?
• Under what terms the fee will be paid?
• Retainer requirements.
• Appraiser’s right to disengage if not paid or for other reasons.
109
Contents of Engagement Letter
Countersignature - It is a good idea to ask the client to initial or sign a copy of the letter and return it for incorporation inor sign a copy of the letter and return it for incorporation in the appraiser’s files.
For potential litigation support engagements:
• Often, valuation assignments are tied to litigation support or may later be subject to dispute.
• It is advisable to address issues such as required• It is advisable to address issues such as required notifications, appraiser availability for court appearances and the fact that additional fees will apply.
110

8/6/2015
56
Contents of Engagement Letter
Liability - the extent to which it is accepted should be defined in the engagement letter or in attached materials.
It is probably best to attach to the engagement letter:• A statement of anticipated general assumptions and limiting
conditions. (USPAP says that specific limiting conditions should be attached to the engagement letter. Things such as limited scope, research and data.)L d li i h i d ifi i d h i• Language dealing with indemnification and the requirement to “hold harmless.”
• Any unique terms and conditions governing the assignment.
111
Contents of Engagement Letter
Business appraisers who are also CPAs should additionally disclose that they are not auditing reviewing or compilingdisclose that they are not auditing, reviewing or compiling financial data, or expressing an opinion on such.
Consider additional language relating to assumptions regarding the reliability of company and third-party data.
Have your engagement letter reviewed by an attorney since it is a binding contract.
112

8/6/2015
57
Classroom Assignment 4: D fi i th A i l A i tDefining the Appraisal Assignment
Classroom Assignment 4- Defining the Appraisal Assignment
An attorney, Mr. Smith, calls you and says one of the h h ld f G l D li T ki I di dshareholders of General Delivery Trucking, Inc. died on
September 30 of this year and an appraisal of the 250,000 shares of GDT owned by the shareholder is required for determination of the applicable federal estate taxes to be paid.
What other information do you need to properly defineWhat other information do you need to properly define the assignment, including the fee?
114

8/6/2015
58
The Purpose and Intended Use of the Valuation
Appraisers should understand and disclose the purpose ofAppraisers should understand and disclose the purpose of the valuation.
Purpose may determine the standard of value.
Purpose may affect the choice or presentation of valuation methods.methods.
115
The Purpose and Intended Use of the Valuation
No single valuation method is universally applicable.
The sophistication of the intended user is an important consideration.
Stating the purpose of the valuation indirectly communicates your independence and objectivity. (You have nothing to hide about why you are doing the appraisal!)
116

8/6/2015
59
Purpose Affects Standard of Value
Buying/selling/merging - any of the above standards of value could be used.could be used.
Tax-related valuation - typically based on fair market value. • Estate, gift and inheritance taxes
• S-corporation elections
• Charitable contributions
• Ad valorem taxes (property taxes)
T f i i• Transfer pricing
• Change of ownership
117
Purpose Affects Standard of Value
Financial reporting - Most engagements relate to purchase price allocation and impairment ofpurchase price allocation and impairment of goodwill calculations using the financial reporting standard of fair value.
ESOPs• Based on fair market value as defined by the Department of
Labor.
• Minority values for ESOP shares could be different than for non-ESOP shares because of control and marketability differences.
118

8/6/2015
60
Purpose Affects Standard of Value
Going public -fair market value
Dissenting stockholder/shareholder oppression actions -almost all state statutes specify fair value. Interpretation varies from state to state.
Divorces/corporate or partnership dissolutions -clear-cut statutory standards of value are often lacking.
Fairness opinions
119
Purpose Affects Standard of ValueDamage cases - must carefully research case law in each case.
• AntitrustAntitrust• Breach of contract• Condemnation (eminent domain)• Insurance casualty claims (business interruption or termination)• Lost profits• Lost business opportunity• Commercial reasonableness• Intellectual property infringement
• Buy/sell agreements - value standard is often arbitrary.
120

8/6/2015
61
Professional Standards
Professional standards codify the knowledge and techniques necessary for the competent practice oftechniques necessary for the competent practice of business valuation.
Uniform Standards of Professional Appraisal Practice(USPAP)
121
Professional StandardsCompliance with USPAP
FIRREA requires that real estate appraisals used in conjunction withFIRREA requires that real estate appraisals used in conjunction with federally related transactions be performed in accordance with USPAP.
Many other appraisers are also bound to comply with USPAP through affiliations with professional appraisal organizations.
Since ASA is a sponsoring organization of the Appraisal Foundation, all ASAs, AMs, FASAs, Candidates and Associates of ASA must take a course on USPAP and follow USPAP when performing a comprehensive appraisal and presenting a formal opinion of value as the primary objective of an appraisal engagementappraisal engagement.
122

8/6/2015
62
ASA’s Business Valuation Standards
Adopted by the Business Valuation Committee of the American Society of Appraisers and approved by ASA’s board of governors.
The BVC is the policy-making arm of ASA in the business valuation disciplineThe BVC is the policy-making arm of ASA in the business valuation discipline.
Preamble
Standards• BVS-I. General Requirements for Developing a Business Valuation• BVS-II. Financial Statement Adjustments• BVS-III. Asset-Based Approach to Business Valuation• BVS-IV. Income Approach to Business Valuation• BVS-V. Market Approach to Business Valuation• BVS-VI. Reaching a Conclusion of Value• BVS-VII. Valuation Discounts and Premiums• BVS-VIII. Comprehensive, Written Business Valuation Report• BVS-IX. Intangible Asset Valuation
123
ASA’s Business Valuation StandardsGlossary
Statements on Business Valuation Standards (SBVS)• SBVS-1 The Guideline Public Company MethodSBVS 1. The Guideline Public Company Method• SVBS-2. Guideline Transaction Method
Advisory Opinions (AO)• AO-1. Financial Consultation and Advisory Services
Procedural Guidelines (PG)• PG-1. Litigation Support: Role of the Independent Financial Expert
These standards must be followed for the valuation of a business, business ownership interests, or securities by all members of the American Society of Appraisers, whether they are Associates, Candidates, AMs, ASAs, or FASAs, and regardless of their discipline affiliation.
124

8/6/2015
63
Chapter 4
Data GatheringEconomic data
Industry dataIndustry data
Subject company data
Comparative data
Other
Appendix B to this course contains a write up adapted from Appendix B to this course contains a write up adapted from Understanding Business Valuation that is a simplified version of how to use the information that was gathered. It is intended for those that feel weak in this area of practice.
126

8/6/2015
64
Economic DataAll information gathered should be “known or knowable” as of the valuation date.
F h ld b t d t d diti l t t th i d tFocus should be on current and expected conditions relevant to the industry and subject company.
Type of business dictates the type of economic research.• Example: Retail—personal income• Example: Animal feed manufacturers—commodity prices,
government programs
National economyNational economy
Regional or local economy
International markets
127
Industry Data
All information gathered should be “known or knowable” as of the valuation date.of the valuation date.
Industry trends in growth, structure, technology, regulation, etc.
Industry financial performance
Competition
Public companies
128

8/6/2015
65
Subject Company Data
All information gathered should be “known or knowable” as of the valuation date.the valuation date.
Financial data• Financials for five fiscal years, or relevant period.
• Income tax returns—same five fiscal years, or relevant period.
• Is there something “magical” about five years? NO! The key is to capture a complete business cycle so as to not slant the historical analysis or warp the view of the futureanalysis or warp the view of the future.
129
Subject Company Data
•Financial data• Interim financialsInterim financials
• Detailed depreciation schedule
• Budgets or forecasts—may want historical budgets to see how company’s actual performance compared with budget (measure quality of management)
• Other financial data
130

8/6/2015
66
Subject Company DataProduct and market data
• Marketing literature—Web site, brochures, price lists, etc.• Location(s) of company operations( ) p y p
Customer list and supplier list
List of patents, copyrights, trademarks and expiration dates
Sales forecasts by product line and sales division
List of major competitors, their locations, and their relative strengths and weaknessesstrengths and weaknesses
List of trade associations
Survey of geographic market
131
Subject Company Data
Personnel• Organization chartOrganization chart
• Brief résumé on key personnel
• Employment agreements
• Covenants not to compete
• Union contracts
• Compensation schedule for owners, officers and directors - include all perks in the schedule.
• Schedule of life insurance policies on key personnel
• Pension and profit-sharing plans and employee handbook
132

8/6/2015
67
Subject Company Data
Other business records• Organizational documentsOrganizational documents
If corporation—articles of incorporation, bylaws, amendments and minutes
If partnership—partnership agreement and amendments
If LLC—articles of organization and LLC member’s agreement
• List of stockholders, members or partners and what each owns
A d t il i t k l• Any details on prior stock sales
• Buy/sell agreements, options, etc.
133
Subject Company Data
Other business records• Shareholder and board minutesShareholder and board minutes
• Major contracts
• Copies of previous appraisals and/or appraisals of specific assets
• Information on contingent liabilities
134

8/6/2015
68
The Management Interview
The main purpose is to assess risk and qualitative factors.
Prepare a list of questions in advance.
Persons to interview might include:• Client and client’s attorney• Company managers; president; chief financial officer; managers of
sales, production and personnel• Company advisers: accountant, attorney, banker• Members of company board of directors• Customers or suppliers with management permission
135
Topics To Discuss With ManagementHistory of the company
Operationsp
• Products and services
• Seasonal or cyclical sales patterns
• Supplier base
• Customer base
• Facilities
• Marketing and distribution strategiesMarketing and distribution strategies
• Manufacturing or distribution capacity
• Management, employees, key personnel, succession plans
• Plans for the future, new product development
136
8/6/2015
69
Topics To Discuss With Management
Environment – Economic, Competitive, Legal
Financial condition and performance
Other information of which the appraiser may not be aware
137
Economic Data Sources
General economy• Internet sources: U.S. Bureau of Census and Department ofInternet sources: U.S. Bureau of Census and Department of
Commerce - free sites
• Government publications, including the Federal Reserve Bulletin, Survey of Current Business, and Economic Report of the President
Regional Economic Data• Federal Reserve’s bi-annual Beige Book report, available from their
website• Bureau of Labor Statistics• Bureau of Labor Statistics• State, county, or local government economic development
departments.• Local or regional chambers of commerce
138
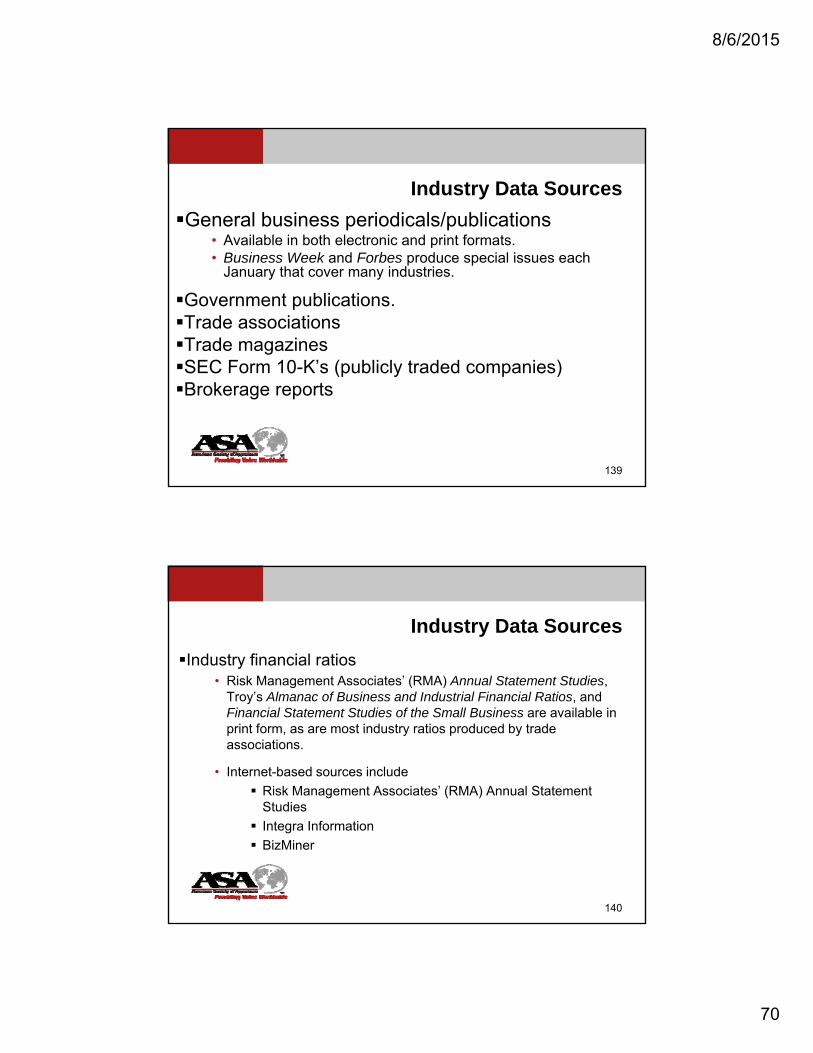
8/6/2015
70
Industry Data Sources
General business periodicals/publications• Available in both electronic and print formats.p• Business Week and Forbes produce special issues each
January that cover many industries.
Government publications.Trade associationsTrade magazinesSEC Form 10 K’s (publicly traded companies)SEC Form 10-K s (publicly traded companies)Brokerage reports
139
Industry Data Sources
Industry financial ratios• Risk Management Associates’ (RMA) Annual Statement Studies,Risk Management Associates (RMA) Annual Statement Studies,
Troy’s Almanac of Business and Industrial Financial Ratios, and Financial Statement Studies of the Small Business are available in print form, as are most industry ratios produced by trade associations.
• Internet-based sources include
Risk Management Associates’ (RMA) Annual Statement StudiesStudies
Integra Information
BizMiner
140

8/6/2015
71
Industry Data Sources
Third party providers of industry research• Valuation Resources
• Industry Research
• First Research
• IBISWorld
• Trade Associations
141
Guideline Company Data
To identify standard industrial classification (SIC) code or North American Industry Classification System (NAICS) codeNorth American Industry Classification System (NAICS) code
• Standard Industrial Classification Manual
• NAICS Manual
• Disclosure Compact/Securities and Exchange Commission (SEC) CD-ROM
142

8/6/2015
72
Guideline Company DataPlaces to find lists of potential guideline companies
• There are various electronic sources which provide guideline public company information such as FactSet, Edgar, S&P, etc. Some sources are free while other databases are fee based.
• A number of print sources also exist which provide guideline public company information such as Standard & Poor’s.
143
Data on Acquired CompaniesPlaces to find lists of suspect companies (also contains some secondary financial data)
• Print sourcesPrint sources
• Merger & Acquisition Sourcebook
• Mergerstat Review
• Small companies
• BIZCOMPS; available through BV Resources [fee based]
• Institute of Business Appraisers; Free to members with certain limitations.
• Pratt’s Stats; available through BV Resources [fee based]
• Done Deals [fee based]
144
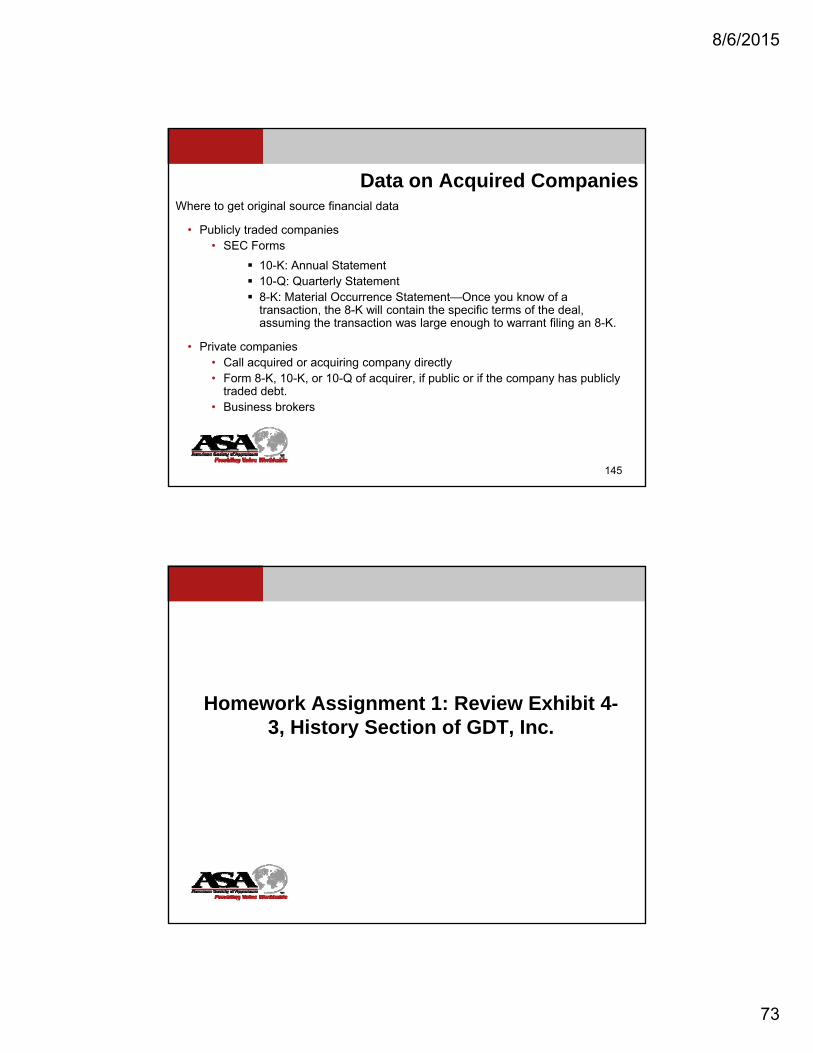
8/6/2015
73
Data on Acquired CompaniesWhere to get original source financial data
• Publicly traded companies• SEC FormsSEC Forms
10-K: Annual Statement 10-Q: Quarterly Statement 8-K: Material Occurrence Statement—Once you know of a
transaction, the 8-K will contain the specific terms of the deal, assuming the transaction was large enough to warrant filing an 8-K.
• Private companies• Call acquired or acquiring company directlyq q g p y y• Form 8-K, 10-K, or 10-Q of acquirer, if public or if the company has publicly
traded debt.• Business brokers
145
Homework Assignment 1: Review Exhibit 4-3, History Section of GDT, Inc.

8/6/2015
74
Ch t 5Chapter 5
Economic and Political Analysis
ResourceMarkets
$ Costs $ Incomes
Markets
Businesses Households
Resources
Goods &Services
Inputs
Goods &Services
ProductMarkets
$ Revenue $ Consumption
148

8/6/2015
75
Economic and Political Analysis
The economic and related political environments in which a business operates can be viewed from three perspectives:
• The global environment
• The national environment
• The regional and local environment
149
The Globalization of Economic Factors
Globalization has been defined as the growingGlobalization has been defined as the growing interconnectedness of the world through cross-border flows of information, capital and people.
Economic globalization creates both new opportunities and challenges for firms.
150

8/6/2015
76
The Globalization of Economic Factors
Opportunities include:
A t k t th t i l l d d t t• Access to new markets that were previously closed due to cost, regulation or indirect barriers;
• The ability to tap resources such as labor, capital and knowledge on a worldwide basis; and
• The opportunity to participate in global production networks that are becoming prevalent in many industries such as automotive, electronics, toys and textiles.y
151
The Globalization of Economic Factors
Challenges emanate from:
F i tit t i fi ’ d ti k t• Foreign competitors entering a firm’s domestic markets,
• Domestic competitors reducing their costs through global sourcing, moving production offshore or gaining economies of scale by expanding into new markets, thus
• Forcing firms to become more streamlined and efficient while simultaneously extending the geographic reach of their operations.
152

8/6/2015
77
The Globalization of Economic Factors
Global-Specific Risks
• Country risk, which refers to the risk that a country won't be able to honor its financial commitments.
• Exchange rate risk, which refers to relative changes in currency exchange rates between the subject company’s “home” currency and the currency for which the company buys from or sells into.
• Political risk, which represents the financial risk that a country's government will suddenly change its policies This is a major reason thatgovernment will suddenly change its policies. This is a major reason that second and third world countries lack foreign investment.
153
The Globalization of Economic Factors
Implications of Globalization on Valuation• Globalization increases the complexity of risk analysis.
• Valuation opportunities beyond US borders.
• Need for appraisers to understand non-US conventions in financial reporting, taxation, regulation, and culture on the valuation subject.
154

8/6/2015
78
National Economic Factors
Global effects aside, macroeconomic factors that affect business value are generally driven at theaffect business value are generally driven at the national level. These macroeconomic factors include:
• General economic conditions:
• GDP
• Consumer spending
G t di• Government spending
• Business investments and inventories
• Trade deficit
155
National Economic FactorsInflation
Interest rates
Unemployment
Consumer spending and confidence
Equity and debt markets
Construction activity
Manufacturing activity
Economic growth
Equity market activity and trends
Alternative market activity and trends
156

8/6/2015
79
National Economic Factors
Regulatory environment• Taxation
• Industry regulation
• Employment laws
• Trade barriers/protection
157
Regional and Local Economic Factors
It is difficult to imagine a valuation engagement where the regional and local economy have no impact on the valuation g y pof a business interest. The old saying, “All politics are local” is applicable to economics as well.
Typical regional and local economic factor impacts:• Labor pool or lack thereof• Facility availability and cost
Distribution infrastructure• Distribution infrastructure• Local regulatory environment
158

8/6/2015
80
Chapter 6
Introduction to Industry Analysis
Every company operates within the context of an industry. Some are obvious while others are difficult to defineobvious while others are difficult to define.
Industries are characterized by different value drivers and influencers.
Understand micro- and macro-economic factors that impact the industry.
A structured, analytical process, such as Michael Porter’s Five Forces, can help identify all factors which impact the industry.
160

8/6/2015
81
Industry Analysis:
Porter’s Five Forces
Rivalry Among Existing Firms
Threat of NewEntrants
Bargaining Powerof Customer
Bargaining Powerof Suppliers
Products or ServicesThreat of SubstituteProducts or Services
161
The threat of New Entrants is affected by barriers to entry, which are unique industry characteristics that define the industry
Industry Analysis:
Porter’s 5 Forces
Rivalry Among Existing Firms
Threat of NewEntrants
Bargaining Powerof Customer
Bargaining Powerof Suppliers
characteristics that define the industry. Barriers reduce the rate of entry of new firms, thus maintaining a level of profits for those already in the industry. From a strategic perspective, barriers can be created or exploited to enhance a firm's competitive advantage.
Threat of SubstituteProducts or Services
162

8/6/2015
82
Barriers to entry include:•Economies of scale•Product differentiation
Industry Analysis:
Porter’s 5 Forces
Rivalry Among Existing Firms
Threat of NewEntrants
Bargaining Powerof Customer
Bargaining Powerof Suppliers
Product differentiation•Capital requirements•Switching costs to customers•Access to distribution channels•Other cost advantages•Government policies•Incumbent’s defense of market share•Industry growth rate
Threat of SubstituteProducts or Services
163
Industry Analysis:
Porter’s 5 Forces
Rivalry Among Existing Firms
Threat of NewEntrants
Bargaining Powerof Customer
Bargaining Powerof Suppliers
Products or ServicesThreat of SubstituteProducts or Services
Substitute products refer to products in other industries. To the economist, a threat of substitutes exists when a product's demand is affected by the price change of a substitute product. As more substitutes become available, the demand becomes more elastic, since customers have more alternatives. A close substitute product constrains the ability of firms in an industry to raise prices.
164

8/6/2015
83
Industry Analysis:
Porter’s 5 Forces
Rivalry Among Existing Firms
Threat of NewEntrants
Bargaining Powerof Customer
Bargaining Powerof Suppliers
Products or ServicesThreat of SubstituteProducts or Services
Market conditions affecting impact of substitutes:•Relative price of substitutes•Relative quality of substitutes•Switching costs to customers
165
Market factors affecting impact of customer bargaining power:•Number of customers relative to suppliers•Product differentiation
Industry Analysis:
Porter’s 5 Forces
Rivalry Among Existing Firms
Threat of NewEntrants
Bargaining Powerof Customer
Bargaining Powerof Suppliers
Product differentiation•Switching costs to use other product•Customer’s profit margins•Customer’s use of multiple sources•Customer’s threat of backward integration•Supplier’s threat of forward integration•Importance of product to supplier•Customer volume
Threat of SubstituteProducts or Services
166

8/6/2015
84
Industry Analysis:
Porter’s 5 Forces
Rivalry Among Existing Firms
Threat of NewEntrants
Bargaining Powerof Customers
Bargaining Powerof Supplier
Customers are powerful if:•Customers are concentrated •Customers purchase a significant proportion of output •Customers possess a credible backward integration threat
Threat of SubstituteProducts or Services
167
Industry Analysis:
Porter’s 5 Forces
Rivalry Among Existing Firms
Threat of NewEntrants
Bargaining Powerof Customers
Bargaining Powerof Supplier
Customers are weak if:•Suppliers threaten forward integration •Significant customer switching costs •Customer are fragmented (many, different) •Suppliers supply critical portions of Customer’s input
Threat of SubstituteProducts or Services
168

8/6/2015
85
Industry Analysis:
Porter’s 5 Forces
Rivalry Among Existing Firms
Threat of NewEntrants
Bargaining Powerof Customers
Bargaining Powerof Suppliers
Threat of SubstituteProducts or Services
Market conditions affecting impact of supplier bargaining power:•Supplier integration•Availability of substitute products•Importance of supplier’s input to customer•Supplier’s product differentiation•Importance of industry to suppliers•Customer’s switching costs to other input•Supplier’s threat of forward integration•Customer’s threat of backward integration 169
Industry Analysis:
Porter’s 5 Forces
Rivalry Among Existing Firms
Threat of NewEntrants
Bargaining Powerof Customers
Bargaining Powerof Suppliers
Threat of SubstituteProducts or Services
Suppliers are strong if:•Credible forward integration threat by suppliers •Suppliers concentrated •Significant cost to switch suppliers •Customers weak
170

8/6/2015
86
Industry Analysis:
Porter’s 5 Forces
Rivalry Among Existing Firms
Threat of NewEntrants
Bargaining Powerof Customers
Bargaining Powerof Suppliers
Threat of SubstituteProducts or Services
Suppliers are weak if:•Many competitive suppliers •Purchase commodity products •Credible backward integration threat by customers •Concentrated purchasers •Customers powerful
171
Factors that affect competitive rivalry:•Number of competitors [concentration]•Relative size of competitors [balance]
Industry Analysis:
Porter’s 5 Forces
Rivalry Among Existing Firms
Threat of NewEntrants
Bargaining Powerof Customers
Bargaining Powerof Suppliers
•Industry growth rate•Fixed costs vs. variable costs•Product differentiation•Capacity augmented in large increments•Customer’s switching costs•Diversity of competitors•Exit barriers•Strategic stakes
Threat of SubstituteProducts or Services
172

8/6/2015
87
Competitive responses to rivalry:
Industry Analysis:
Porter’s 5 Forces
Rivalry Among Existing Firms
Threat of NewEntrants
Bargaining Powerof Customers
Bargaining Powerof Suppliers
p p y•Change prices•Improve product differentiation•Creatively use channels of distribution•Exploit relationships with suppliers
Threat of SubstituteProducts or Services
173
Intensity of rivalry influenced by:•Number and relative strengths of competitors•Industry growth – bigger pie or bigger slice
Industry Analysis:
Porter’s 5 Forces
Rivalry Among Existing Firms
Threat of NewEntrants
Bargaining Powerof Customers
Bargaining Powerof Suppliers
Industry growth bigger pie or bigger slice•Relative proportion of fixed costs to total costs•Storage costs•Switching costs•High exit barriers•Diversity amongst rivals•Industry shakeout
Threat of SubstituteProducts or Services
174

8/6/2015
88
Porter’s Five Forces and Generic Strategies
Generic strategies for effectively competing in light of the five forces:
• Overall cost leadership
• Differentiation from competitors
• Focus on a particular customer group, segment of the product line or geographic area
175
Porter’s Five Forces and Generic Strategies
Overall Cost Leadership• Overall cost leadership is a strategy requiring management to pursue aOverall cost leadership is a strategy requiring management to pursue a
course of action that:
• Aggressively constructs facilities that are of a scale to have maximum efficiency
• Focuses on cost reductions gained through experience
• Includes tight control on costs and overhead
• Eliminates marginal customer accounts• Eliminates marginal customer accounts
• Minimizes costs in areas like service, sales teams, advertising, and research and development
176

8/6/2015
89
Porter’s Five Forces and Generic Strategies
Overall Cost Leadership Strategy• Commonly required skills and resources include:Commonly required skills and resources include:
• Continual capital investments and access to capital to fund the investments
• An engineering team with skills in process engineering
• High level of labor supervision
• Designing products for manufacturing simplicity and ease
• Use of a low-cost distribution system or network
177
Porter’s Five Forces and Generic Strategies
Overall Cost Leadership• The strategy requires development of many organizationalThe strategy requires development of many organizational
characteristics including:
• The ability to maintain tight cost controls
• An information infrastructure capable of providing frequent, detailed cost control reports
• A highly structured organization and defined responsibilities
• Compensation incentives based on meeting quantitative goals• Compensation incentives based on meeting quantitative goals
178
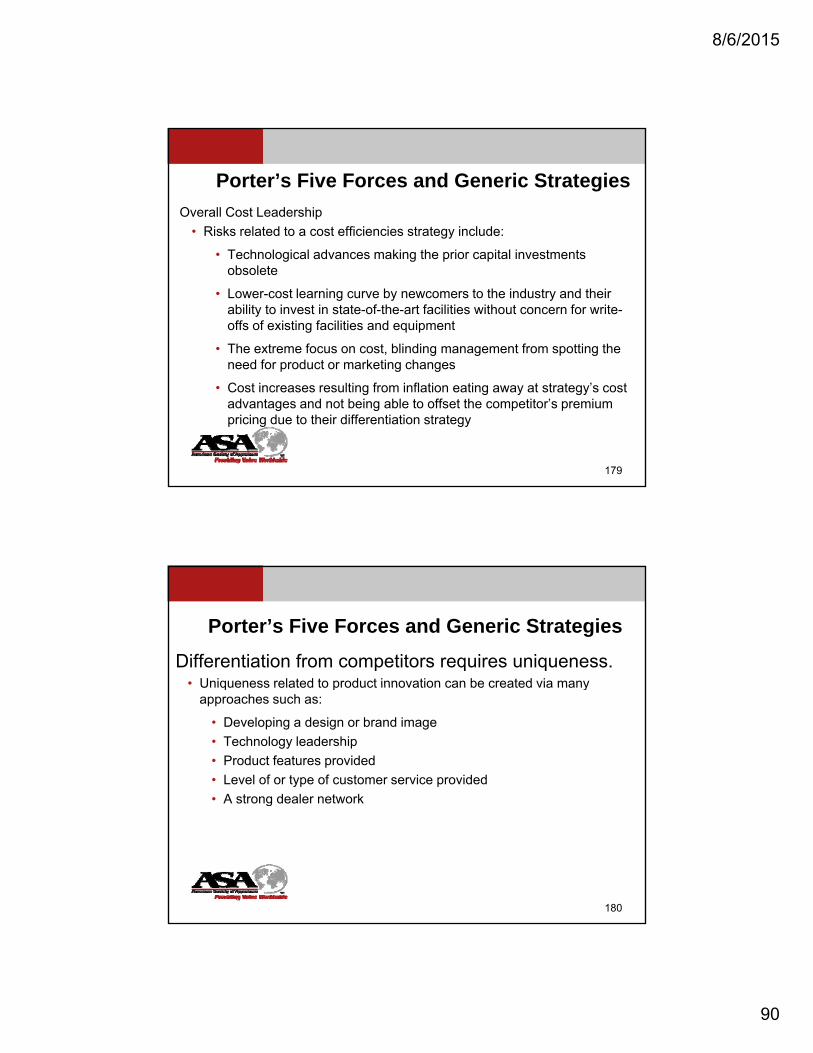
8/6/2015
90
Porter’s Five Forces and Generic Strategies
Overall Cost Leadership
• Risks related to a cost efficiencies strategy include:
• Technological advances making the prior capital investments obsolete
• Lower-cost learning curve by newcomers to the industry and their ability to invest in state-of-the-art facilities without concern for write-offs of existing facilities and equipment
• The extreme focus on cost, blinding management from spotting the need for product or marketing changesneed for product or marketing changes
• Cost increases resulting from inflation eating away at strategy’s cost advantages and not being able to offset the competitor’s premium pricing due to their differentiation strategy
179
Porter’s Five Forces and Generic Strategies
Differentiation from competitors requires uniqueness.• Uniqueness related to product innovation can be created via manyUniqueness related to product innovation can be created via many
approaches such as:
• Developing a design or brand image
• Technology leadership
• Product features provided
• Level of or type of customer service provided
• A strong dealer networkg
180

8/6/2015
91
Porter’s Five Forces and Generic Strategies
Differentiation from Competitors Strategy• Highly successful product innovators generally• Highly successful product innovators generally
differentiate themselves by using more than one approach including:
• Possessing high-quality marketing skills• Strong product-engineering capabilities• A creative flair• A highly competent basic research team• A highly competent basic research team• A reputation for technological or quality leadership
181
Porter’s Five Forces and Generic Strategies
Differentiation from Competitors Strategy• In addition, the strategy requires the development of many organizationalIn addition, the strategy requires the development of many organizational
characteristics including:
• Incentives based on subjective measures instead of definitive quantitative goals
• A high level of cooperation and coordination between the research and development, product development, and marketing departments
• Facilities and amenities capable of attracting scientists, engineers, p g gcreative individuals, or a highly skilled labor force
182

8/6/2015
92
Porter’s Five Forces and Generic Strategies
Differentiation from Competitors• The risks associated with the strategy of differentiation• The risks associated with the strategy of differentiation
include:• The cost differential between the low-cost providers and the
differentiated innovators becomes greater than the firm’s ability to maintain its brand loyalty.
• Buyers’ needs change, and they are no longer attracted to the company because of its differentiating characteristics.p y g
• Imitation by competitors narrows or eliminates the perceived differentiation.
183
Porter’s Five Forces and Generic Strategies
Focus on a particular buyer group, segment of the product line or geographic area as a strategy is based on being able to serve its highly focused target group more effectively or efficiently than its competitors.
Competitors are assumed to be marketing to a more diverse market, geographic market or with a broader product line.
184

8/6/2015
93
Porter’s Five Forces and Generic StrategiesA focus strategy requires a combination of the same skills, resources and organizational characteristics that are required for the product innovation strategy.gy
Each of these strategies often needs a very different style of leadership and usually evolve into their own unique corporate culture.
Each of these strategies requires the use of different performance measures.
Cost-efficient providers necessitate a focus on performance measuresCost efficient providers necessitate a focus on performance measures related to manufacturing, while a strategy based on product innovation would focus on performance measures related to customer satisfaction and perceptions.
185
Porter’s Five Forces and Generic StrategiesThe strategy, based on a focus on a particular buyer group, segment of the product line, or geographic area, has the following risks:
• The cost advantages of serving an extremely focused target market become less than the cost savings of the low-cost provider serving a broad market.
• The differences in the products or services desired by the target market and those desired by the marketplace as a whole narrows or are eliminated.
• Competitors identify a submarket within the company’s target market and effectively out-focus the company.
186

8/6/2015
94
Porter’s Five Forces and Generic Strategies
Correlation of the five forces and the generic strategies.
The generic strategies each have attributes that can serve to defend against competitive forces.
187
Porter’s Five Forces and Generic Strategies
Cost Leadership Differentiation Focus
Entr Ability to cut price in retaliation Customer loyalty can discourage Focusing develops core competenciesEntryBarriers
Ability to cut price in retaliation deters potential entrants.
Customer loyalty can discourage potential entrants.
Focusing develops core competencies that can act as an entry barrier.
BuyerPower
Ability to offer lower price to powerful buyers.
Large buyers have less power to negotiate because of few close alternatives.
Large buyers have less power to negotiate because of few alternatives.
SupplierPower
Better insulated from powerful suppliers.
Better able to pass on supplier price increases to customers.
Suppliers have power because of low volume, but a differentiation-focused firm is better able to pass on supplier price increases.
Th t f Can use low price to defend Customers become attached to Specialized products and coreThreat ofSubstitutes
Can use low price to defend against substitutes.
Customers become attached to differentiating attributes, reducing threat of substitutes.
Specialized products and core competency protect against substitutes.
Rivalry Better able to compete on price. Brand loyalty to keep customers from rivals.
Rivals cannot meet differentiation-focused customer needs.
188

8/6/2015
95
Chapter 7
Applying the Business Appraiser’s Analysis to the Company
The analysis performed is intended to help the businessThe analysis performed is intended to help the business appraiser understand how the identified factors affect:
• The company’s financial performance, and
• The company’s value (i.e., “k or g” the denominator in the value formula)
190

8/6/2015
96
Applying the Business Appraiser’s Analysis to the Company
The four basic types of company analysis are:The four basic types of company analysis are:1. General economic and political analysis
2. Industry analysis
3. Operational analysis
4. Financial analysis
191
Financial Performance Analysis
Identify trends and what caused them.
Identify unusual items and why they happened.
Ascertain the uncertainty of income flows to the company’s various capital suppliers.
The higher the risk to any category of capital supplier, theThe higher the risk to any category of capital supplier, the higher the cost of that class of capital.
192

8/6/2015
97
Financial Performance Analysis
Compare the company to an industry norm or peer group. (Analyze and explain similarities and differences.)
Provide a basis for comparing the subject company with guideline companies in the market approach.
Pro ide a basis for de eloping financial projections orProvide a basis for developing financial projections or assessing company projections in the income approach.
193
Trend Analysis
• Multi-year spread of income statement, balance sheet y p ,and possibly accounting statement of cash flows.
• The goal is to identify positive and negative trends, review past growth patterns, and assess what is “normal” for the subject company.
• Sales, Profit, Total Assets, Debt, Growth, etc.
194

8/6/2015
98
Trend Analysis
• The number of periods in the spread
• Should depend on the specific case facts. Five years is common, but yit is unrealistic to assume that five years is appropriate in every circumstance.
• For a cyclical company, capturing a full business or economic cycle may be appropriate.
• If there have been dramatic changes in business condition or strategy, data from even two or three years ago may be largely irrelevant to the analysis.
• Start-up Businesses
195
Income Statement Trends
▪ Review level and trend in revenue and key expense items.
▪ Review level and trend in profitability: EBITDA, EBIT, pre-tax, netReview level and trend in profitability: EBITDA, EBIT, pre tax, net income.
▪ Identify reclassifications, new items, nonrecurring items, non-operating items.
196

8/6/2015
99
Balance Sheet Trends
Note significant classes of assets and liabilities.
Review level and trend in working capital (current assets less currentReview level and trend in working capital (current assets less current liabilities)—with and without interest-bearing debt.
Review level and trend in fixed assets.
Review level and trend in interest-bearing debt and equity.
197
Statement of Cash Flows Trends• The purpose of the statement of cash flows is to report
cash inflows and outflows for a specific period and to reconcile the accrual income statement to the cash flowreconcile the accrual income statement to the cash flow generated by the business.
• Cash flows are classified into three categories:
• Cash flow from operating activities (CFO)
• Cash flow from investing activities (CFI)
• Cash flow from financing activities (CFF)
198

8/6/2015
100
Changes in Balance Sheet Accounts as shown on the Cash Flow Statement:
• An increase in an asset account is a negative cash flow andAn increase in an asset account is a negative cash flow and decreases cash on hand (e.g., buying a building).
• A decrease in an asset account is a positive cash flow and increases cash on hand (e.g., collecting a receivable).
• An increase in a liability account is a positive cash flow and increases cash on hand (e.g., borrowing money from a bank).
• A decrease in a liability account is a negative cash flow and decreases cash on hand (e g paying off a loan)decreases cash on hand (e.g., paying off a loan).
199
Usefulness of Analyzing Trends of a Business
• Assess liquidity—review of trends in cash generation, i bl ll ti d ti i f h flreceivables collection, and timing of cash flows versus
accrual income
• Assess financial strength—trends in cash flow from operations, ability to finance capital expenditures and debt service from operating cash flow
• Assess financial decisions—review of fixed assetAssess financial decisions review of fixed asset purchases/disposals and investment trends
200

8/6/2015
101
Cautions and Potential Pitfalls
• Misclassification among the three types of cash flows can distort a firm’s financial picture (e.g., abuses by Qwest and Tyco involving the l ifi ti f h i fl “ ti h fl ” d th tclassification of cash inflows as “operating cash flow” and the costs
associated with them as “investment cash flow,” thereby overstating CFO).
• In the long run, positive cash flow from operations is necessary for survival. However, a period of high growth generally produces significant negative cash flow, which may nonetheless be a positive sign for the business.
• Leasing fixed assets rather than buying them will result in different CFO. Lease expense is in CFO; purchased assets are in CFI.
201
Common-Size Analysis
Items on the balance sheet/income statement presented as percentage of assets or sales.
Very useful in comparing companies, particularly companies of different size.
Identifies relative trends (expense relative to sales, current assets relative to total assets).
Helps in making projections or evaluating budgets.
202

8/6/2015
102
Ratio Analysis
• Important points about ratio analysis
• Ratios calculated for the subject company should express• Ratios calculated for the subject company should express relationships that have significance, i.e., average accounts receivable collection period for a fast-food restaurant is not meaningful.
• It is difficult to interpret ratios for the subject company unless they are compared with an industry average, peer group and/or guideline companies, or compared to historical trends within the company itself.
• It is helpful to calculate the same ratios for historical results and for• It is helpful to calculate the same ratios for historical results and for projections. Any changes in future performance can then be identified and explained.
203
Liquidity Ratios
Measure the ability of a company to meet its short‐term financial obligations as they become due
Current Ratio = Current AssetsCurrent Liabilities
Quick (Acid Test) Ratio =Cash + Cash Equivalents + Trade Receivables (net)Current Liabilities
g y
Working capital turnover =SalesWorking Capital
204

8/6/2015
103
Activity or Turnover Ratio
•Measure how effectively a company employs its assets.
•Directly addresses the ability of a firm to manage its productive asset base and the need for an enterprise to invest in its asset base to provide for future operations.
•The investment in the productive assets of the enterprise•The investment in the productive assets of the enterprise includes not only reinvestment to replace capital consumed but also new investment to fund growth.
205
Activity or Turnover Ratio
It is important to observe that these turnover ratios combine a flow measurement from the income statementcombine a flow measurement from the income statement in the numerator with a point-in-time value from the balance sheet in the denominator. Because of this, these ratios are generally calculated two ways:
• With the denominator expressed as an average of the beginning and ending balance sheet account amount (this is theoretically more correct), or
• With the denominator expressed only as of the ending balance sheet account amount (this is more common for many financialsheet account amount (this is more common for many financial reporting services such as RMA).
206

8/6/2015
104
Activity Ratios
Inventory Turnover =Cost of Goods SoldInventoryInventory
Accounts Receivable Turnover =SalesAccounts Receivable
Average Collection Period =Accounts ReceivableSales per Day
Fixed Asset Turnover =Sales
Fixed Asset Turnover Fixed Assets
Working Capital Turnover =SalesWorking Capital
Total Asset Turnover =SalesTotal Assets
207
Leverage/Coverage Ratios
Measures the ability of the company to cover its debt obligationsobligations
The extent to which debt is used in a company’s capital structure (financial risk)
The company’s long-term ability to meet payments to creditors
Measures financial risk, particularly when contrasted with peer i k d/ id li i kgroup risk and/or guideline company risk
208

8/6/2015
105
Leverage/Coverage Ratios
Directly addresses the utilization of “financial leverage” or the use of debt in the capital structurethe use of debt in the capital structure. In its broadest meaning, debt can be thought of as all capital supplied by investors other than equity holders.
• All of these various “stakeholders’” have claims on the future income of the business enterprise that are senior to those of the equity holders (they get their money first).
• Financial leverage is generally measured either as a ratio of total liabilities “debt” to total assets or as a ratio of debtof total liabilities debt to total assets or as a ratio of debt to equity investment.
209
Leverage Ratios
Total Debt/Total Assets =Total LiabilitiesTotal AssetsTotal Assets
Interest-Bearing Debt/Equity =Total Interest-Bearing DebtEquity
Times Interest Earned =Earnings Before Interest & Taxes (EBIT)Interest Charges
Fixed Charges Coverage =EBIT + Fixed ChargesInterest Charges + Fixed Charges
Total Assets/Total Equity =Total AssetsTotal Equity
210

8/6/2015
106
Profitability Ratios
•Measure how effectively the company manages expenses d fitand profits.
•Directly addresses the ability of the enterprise to control its operating costs relative to the to its revenue stream.
•Profitability is usually measured as a “profit margin” (the percentage ratio of profits to sales).
211
Profitability Ratios
The “bottom line” traditionally is defined as “net income after tax”, although other measures of profitability such as gross profit and g p y g poperating profit are also important to consider.
In addition, measures of profitability differ depending upon whether invested capital or equity is being valued.
Volatility of profit margins, as with volatility in sales, is a manifestation of risk regarding future returns and therefore tends to increase the perception of investment risk and reduce value.
212

8/6/2015
107
Profitability Ratios
Gross Profit Margin =Gross Profit
Sales
Operating Profit Margin =Operating Income
Sales
Net Profit Margin =Net Income
Sales
N t IAfter Tax Return on Total Assets* =
Net IncomeTotal Assets
After Tax Return on Equity* =Net Income Available to Stockholders
Stockholder’s Equity
213
Return on Equity
•Return on equity (net income/equity) is a very important summary statistic about the performance of a business.
•The DuPont Formula breaks ROE into its components, including profitability, turnover and leverage.
Net income=
Net incomex
Salesx
Assets
Equity Sales Assets Equity
214
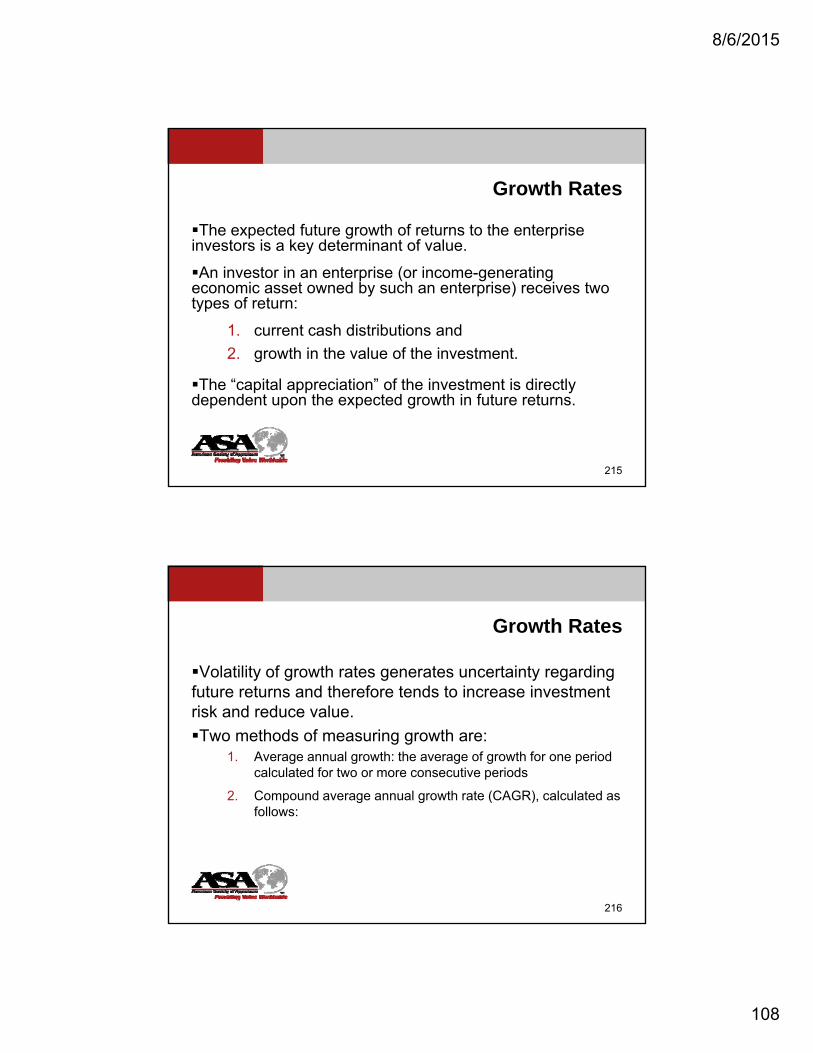
8/6/2015
108
Growth Rates
The expected future growth of returns to the enterprise investors is a key determinant of valueinvestors is a key determinant of value.
An investor in an enterprise (or income-generating economic asset owned by such an enterprise) receives two types of return:
1. current cash distributions and
2. growth in the value of the investment.
The “capital appreciation” of the investment is directly dependent upon the expected growth in future returns.
215
Growth Rates
Volatility of growth rates generates uncertainty regarding future returns and therefore tends to increase investment risk and reduce value.
Two methods of measuring growth are:1. Average annual growth: the average of growth for one period
calculated for two or more consecutive periods
2. Compound average annual growth rate (CAGR), calculated as follows:
216

8/6/2015
109
CAGR
(n 1)Amount in period n
1 0
100
OR
(n 1)Amount in period 1
1.0
100
1/(n 1)Amount in period n
1 0
100
Where:n = number of data points, andn – 1 = number of compounding periods.
217
Amount in period 1
1.0
100
Equity vs. Invested Capital
When you are valuing invested capital or using an invested capital basis in the income or market approach it is helpfulcapital basis in the income or market approach, it is helpful to express some ratios on an invested capital basis.
Instead of total return on equity, use return on invested capital.
Instead of pretax or net income margins on equity, use EBITDA EBIT or NOPAT margins on invested capitalEBITDA, EBIT or NOPAT margins on invested capital.
218

8/6/2015
110
Comparison of Ratios
Profitability for Equity: Profitability for Invested Capital:
Gross Profit / Sales
Operating Profit / Sales
Pre-tax Income / Sales
n/a
NIAT / Sales
Gross Profit / Sales
Operating Profit / Sales
EBIT / Sales
EBITDA Cash Flow (pre tax) / Sales
NOPAT / Sales
Gross Cash Flow (after tax) / Sales n/a
219
Comparative Financial Analysis
• To compare the subject company to industry ratios, be sure there is consistency in how the ratios are calculated and compared to a third party source of industry financial analysis.
• Compare the subject company with industry averages and/or identified guideline companies.
220

8/6/2015
111
Industry Average Financial Data
• Risk Management Association (RMA) Annual Statement St diStudies.
• Other print sources such as Troy’s Almanac of Business and Industrial Financial Ratios and Financial Statement Studies of the Small Business.
• Online providers of data such as Integra and Bizminer.
• Performance analysis reports (PARs) and other analyses y p ( ) yprepared by trade associations.
221
Industry Average Financial Data
• Industry data prepared by trade publications
• Guideline publicly traded or transaction data• Guideline publicly traded or transaction data
• This is the most important comparison for the market approach.
• Analyze the performance of the subject company compared to the performance of chosen guideline companies.
• Analysis used to consider adjustments to the market multiples (market approach) or discount rate (income approach) applied to the subject company
222

8/6/2015
112
Financial Statement Adjustments
Adjustments depend on the valuation approach and whether a minority or controlling interest is being valued.y g g
Four purposes of adjustments in the market and income approaches.
1. GAAP Adjustments
2. Non-operating or Excess Items
3. Nonrecurring Itemsg
4. Discretionary Items
223
Current Year $ Adjustment $ As Adjusted $
Revenues 10,000,000$ -$ 10,000,000$
Cost of Sales: Beginning Inventory 275,000 65,000 A 340,000 Purchases 2,450,653 - 2,450,653 Less: Ending Inventory (315,000) (100,000) (415,000)
Total Cost of Sales 2,410,653 (35,000) 2,375,653
Gross Profit 7,589,347 35,000 7,624,347
Operating Expenses:Officer Compensation 726,423 (376,423) B 350,000 Officer Compensation 726,423 (376,423) B 350,000
Salaries and Wages 1,254,000 - 1,254,000 Rent 180,000 60,000 C 240,000 Auto Expense 43,750 (25,000) D 18,750 Travel and Entertainment 76,425 (40,000) D 36,425 Other Operating Expenses 3,284,623 - 3,284,623 Depreciation and Amortization 798,503 (250,000) E 548,503
Total Operating Expenses 6,363,724 (631,423) 5,732,301
Income From Operations 1,225,623 666,423 1,892,046
Other Income (Expenses): Interest Income 26,425 (26,425) F - Gain (Loss) on Sale of Assets 33,450 (33,450) F - Interest Expense (133,458) 133,458 G - Total Other Income (Expenses) (73,583) 73,583 -
Earnings Before Taxes 1,152,040 740,006 1,892,046
224
Income Taxes: Federal Income Tax - - - State Income Tax - - -
Total Income Taxes - - -
Net Income 1,152,040$ 740,006$ 1,892,046$
A - Change FIFO to LIFO
B - Normalize Officer's Compensation
C - Normalize Rent to Fair Market Value
D - Adjust for Discretionary Auto and Travel and Entertainment Expenses
E - Adjust Accelerated Depreciation Method
F - Adjust Non-Operating Income (Expenses)
G - Remove Interest Expense to Determine Net Income Available to Invested Capital

8/6/2015
113
Company Risk Factors
Company risk factors are organized into external and internal risk factors.internal risk factors.
External risk factors are the risks that have been studied in the previous two chapters:
• Changes in the macroeconomic environment
• Changes in the political environment
• Changes in the microeconomic environment
225
Company Risk FactorsInternal risk factors are the factors that the company’s management has the most ability to influence or control. Examples of these risks include:
• New personnelNew personnel• New or revamped information systems• Rapid growth• New technology• New business models, products or services• Corporate restructuring• Expanded foreign operations• New accounting pronouncements• Acquisitions• Internal controls• Employee communications
226

8/6/2015
114
Analytical Framework
The three financial factors summarize the effects of operational and financial management decisions on the financial return performance of thefinancial management decisions on the financial return performance of the company. 1.The company’s profitability is used to monitor the effects of management decisions related to the efficiency of operations.2.The company’s turnover is used to monitor how effectively management is using its asset investments in the company.3.The company’s leverage is used to monitor how effectively management is controlling its financial capital structure.
227
Analytical Framework
• The DuPont formula is most important for its structured analysis of a financial return, but is most well known for its breakdown of the classic f l f t itformula for return on equity.
• The structure of the formula is as follows:
Return on Equity = Profitability x Asset Turnover x Leverage
228

8/6/2015
115
Classic DuPont Formula
Net income=
Net incomex
Salesx
Total Assets
Stockholders’ Equity
Sales Total Assets Stockholders’ Equity
229
Invested Capital Emphasis
ROIC =NOPAT
xSales
xTotal Assets
Sales Total Assets Total Invested Capital
230

8/6/2015
116
SWOT Analysis
SWOT analysis (strengths, weaknesses, opportunities and threats)
• One of the more common ways to assess the qualitative factors of a company is based on the SWOT analysis.
231
SWOT
Strengths (internal) Weaknesses (internal)
What do you do better than yourcompetitors?What intellectual property do you own –and exercise?
What do the competitors do betterthan you do?What do you need to do to competemore effectively?
Opportunities (external)
Wh t h i i th
Threats (external)
Wh t h i i thWhat changes are occurring in the industry or customer demands that you can take advantage of?What weaknesses of your competitors can you take advantage of?
What changes are occurring in the industry or in consumer demand that your competitors can take advantage of better than you can?What are your competitors doing to attract your customers?
232

8/6/2015
117
Application of SWOT
Analysis/audit - where are we now?P ti f t t i lPreparation for strategic planProblem-solving/Decision-making toolResource allocation toolCounseling a client—personnelCurrent situation appraisal tool (to determine whether corrections are needed))
233
Application of SWOT
The benefits of using a SWOT analysis are that it provides:provides:
• A framework for identifying and analyzing strengths, weaknesses, opportunities and threats
• An impetus to analyze a situation and develop suitable strategies and tactics
• A basis for assessing core capabilities and competences
The evidence for, and cultural key to, change
234

8/6/2015
118
Company Specific Value Drivers
Every company has specific operational and financial value driversdrivers.
Generally, these value drivers are related to the industry and to the company’s critical success factors.
Unless the analyst can identify the company’s specific value drivers, it will be impossible to select the appropriate guideline companies and to develop the company’s discount and capitalization ratesand capitalization rates.
235
Company Specific Value Drivers
Financial value drivers are the individual items that drive return on equity and invested capital, operating and net free cash flowscash flows.
Operating value drivers are the operational procedures that allow the company to successfully provide the customer with the level of service or product that:
• Meets the customer-related critical success factor demands or needs
• Is set at a price point such that it provides the company with a sufficient return on equity and is acceptable to the paying customer
236

8/6/2015
119
Homework Assignment 2: Using the financial information included infinancial information included in
Appendix C for GDT, Inc., perform a financial analysis of the Company. Be prepared to discuss your analysis in
class.
(Note: Assume 40% tax rate where applicable.)
Chapter 8

8/6/2015
120
Definition of the Market Approach
A general way of determining a value indication of a business, business ownership interest, security, or intangible asset by using one or more methods that compare the subject to similar businesses, business ownership interests, securities, or intangible assets that have been sold.
239
The Real Estate Grid
Property A Property B Property C Property D
Sales Price $200,000 $175,000 $190,000 Subject
Acreage 1 1 1 1
Location Main road Quiet street Quiet street Quiet street
Bedrooms 3 2 2 3
Baths 2 2 2 5 2 5Baths 2 2 2.5 2.5
Interior New condition Good condition Good condition Good condition
All Else Same Same Same Same
240

8/6/2015
121
Principle of Substitution
The market approach is based upon the principle of substitution premise that a prudent buyer will pay no moresubstitution premise that a prudent buyer will pay no more for a property than it would cost to acquire a substitute property with the same utility.
Therefore, we analyze prices at which the equity or invested capital in similar businesses has changed hands.
241
Principle of Substitution
To do this we analyze guideline company transaction data from sources such as:
• Publicly traded companies• Acquired/merged companies• Other market approach methods include:
• Analysis of prior transactions in the subject company’s stock • The use of industry-based rules of thumb • Buy-sell agreements• Bona fide offers to buy the subject companyBona fide offers to buy the subject company
• Previous acquisitions
242

8/6/2015
122
Strengths and Weaknesses
Strengths of the market approach (real and perceived) include:include:
• Relatively easy to get data
• Easy to understand and apply
• Includes all assets (tangible and intangible)
• Does not rely on forecasts (usually)
• Users tend to think they are objective and reliable
• Incorporates current market conditions—reflecting investor growth and risk expectations
243
Strengths and Weaknesses
Weaknesses of the market approach (real and perceived) include:include:
• Requires comparable/guideline companies
• Cannot be used for a variety of individual assets
• Hidden assumptions, e.g., growth
• In the merger and acquisition method, transactions often reflect synergies and buyer-specific value. Information about the acquired company and terms of the deal may be inadequate
244

8/6/2015
123
Basic Principles of the Market Approach
• Comparability
Revenue Ruling 59-60 tells us to consider
the market price of stocks of corporations engaged in the same or similar line of business having their stocks actively traded in a free and open market either on an exchange or over theopen market either on an exchange or over the counter.
245
Similarity From an Investor’s Point of View
Past growth of sales and earnings Rate of return on invested capitalStability of past earnings Dividend rate and recordQuality of managementNature and prospects of the industryCompetitive position and individual prospects of the companyBasic nature of the activityBasic nature of the activityGeneral types of goods or services produced
246

8/6/2015
124
Similarity From an Investor’s Point of View
Relative amounts of labor and capital employedExtent of materials conversionAmount of investment in plant and equipment Amount of investment in inventory Level of technology employedLevel of skill required to perform the operationSizeFinancial positionLi iditLiquidityYears in businessFinancial market environment
247
Similarity From an Investor’s Point of View
Quality of earningsM k t bilit f hMarketability of sharesOperating efficiency Geographical diversificationSimilarity of business model
248

8/6/2015
125
9 Basic Steps of the Market Process
1. Choose guideline companies.2. Normalize financial statements.2. Normalize financial statements.3. Calculate various market multiples.4. Select the appropriate valuation multiples.5. Compare the subject to the guidelines.6. Adjust the level of selected valuation multiples.7. Apply the adjusted valuation multiple.8. Reconcile the different values.9. Consider the necessity of applying discounts and
premiums. (BV204)
249
ASA StandardsAddressing the Market Approach
Business Valuation Standard V (BVS-V) - Market Approach to Business Valuation
Statement on Business Valuation Standard 1 (SBVS-1) -The Guideline Company Valuation Method
Statement on Business Valuation Standard 2 (SBVS-2) -The Merger and Acquisition Method
250

8/6/2015
126
BVS-V: Addresses the market approach in general
Contains definition of market approach
Guideline public company or prior transactions
251
BVS-V, III: What Is a Reasonable Basis for Comparison?
The business, business ownership interest, or security used for comparison must serve as a reasonable basis for such comparison.
Factors to be considered in judging whether a reasonable basis for comparisonexists include:
• A sufficient similarity of qualitative and quantitative investment characteristics
• The amount and verifiability of data known about the similar investment• Whether or not the price of the similar investment was obtained in an
arm’s-length transaction or a forced or distress sale
252

8/6/2015
127
BVS-V, IV: Selection of Valuation Ratios
Care should be exercised with respect to issues such as:Care should be exercised with respect to issues such as: • Selection of underlying data used to compute ratios
• Selection of time periods and/or averaging of methods
• How the valuation ratio or ratios were selected and applied to the subject's underlying data
253
Classroom Assignment 9: Read Handout 8 1 E t t f J C H ll d b8-1, Estate of Joyce C. Hall and be
prepared to discuss.
8/6/2015
128
Chapter 9
GPC Step 1 – Guideline Search & Selection
ASA’s BV Standards glossary defines this method as a method within the market approach whereby market multiples are derivedwithin the market approach whereby market multiples are derived from market prices of stocks of companies that are engaged in the same or similar lines of business and that are actively traded on a free and open market.
256

8/6/2015
129
Essential Characteristics of The GPCM
•Share prices of similar, actively traded publicly owned companies are applied to the subject company through valuation multiplesto the subject company through valuation multiples.
•Normally it is possible to select transactions on the date of value, or close to the date of value, assuring timeliness of the evidence.
•Much operating data are available because publicly traded companies must file very complete operating reports with market regulators.
257
GPC Selection ProcessUnderstand the Business of the Subject
Industry
Multiple lines of business?Multiple lines of business?
Nature of the market
Geographic operations—local, regional, national, global
Financial performance: SGLPTL (remember the DuPont ROE = P x T x L)
Qualitative characteristics:
• Reputation and maturity of the companyReputation and maturity of the company
• Management depth and experience
• Labor force availability, experience, turnover, etc.
258

8/6/2015
130
Sources For Finding Potential GPCs
Management
SIC or NAICS code search
Online databases
Industry research
259
Management
• Management interview is a useful part of every valuation assignment.
Whil ki t thi th t• While you are asking management everything that was on your questionnaire, make sure to specifically ask about any publicly traded competitors.
• Good managers know who their public competitors are.
260

8/6/2015
131
SIC or NAICS Code Search
261
SIC Search
262
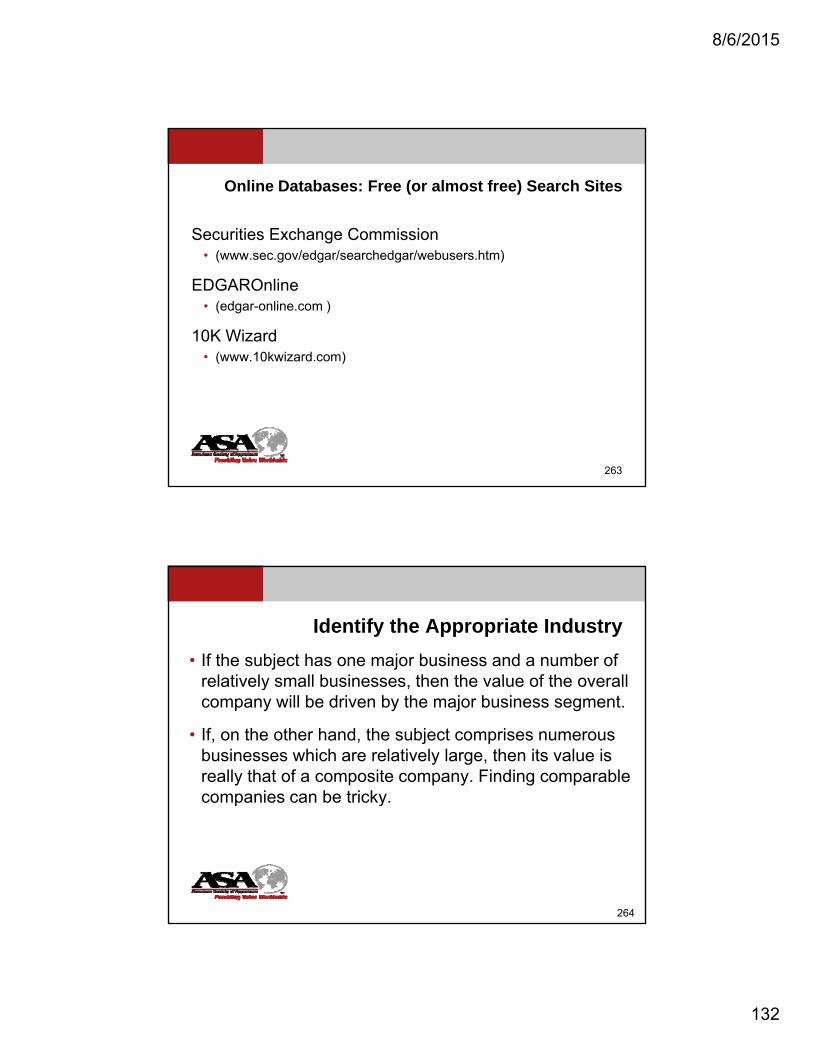
8/6/2015
132
Online Databases: Free (or almost free) Search Sites
Securities Exchange Commission • (www.sec.gov/edgar/searchedgar/webusers.htm)
EDGAROnline • (edgar-online.com )
10K Wizard• (www.10kwizard.com)
263
Identify the Appropriate Industry
• If the subject has one major business and a number of relatively small businesses, then the value of the overallrelatively small businesses, then the value of the overall company will be driven by the major business segment.
• If, on the other hand, the subject comprises numerous businesses which are relatively large, then its value is really that of a composite company. Finding comparable companies can be tricky.p y
264
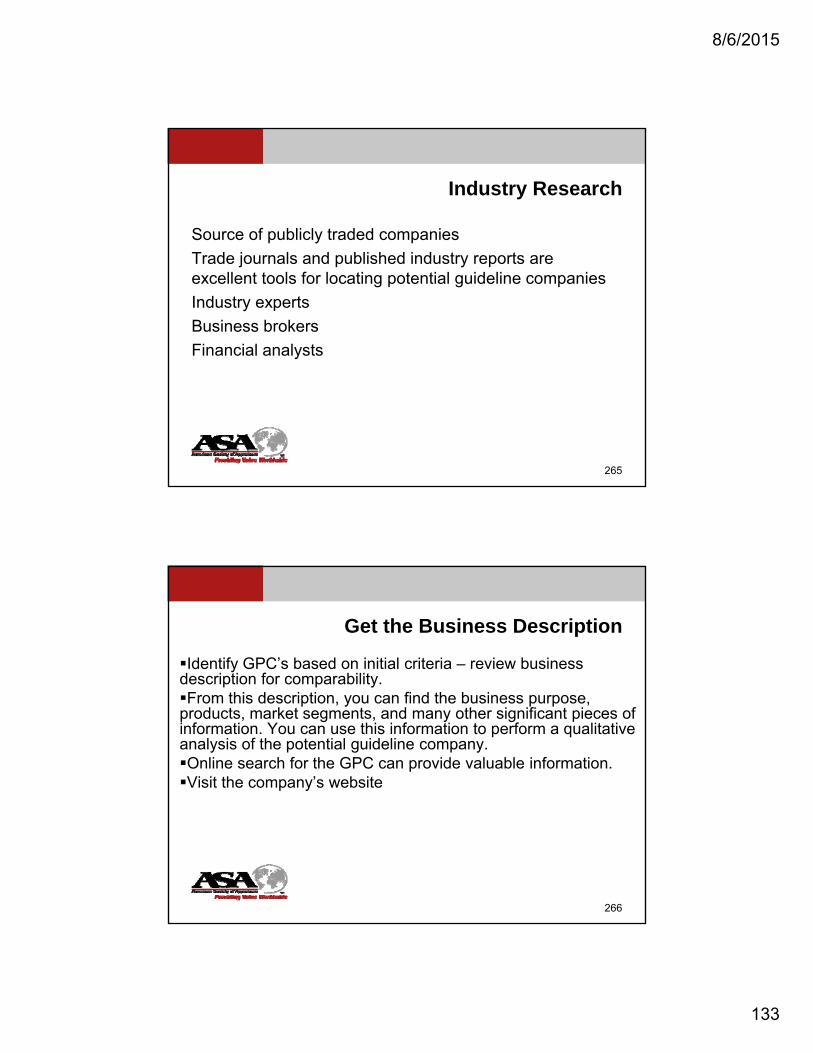
8/6/2015
133
Industry Research
Source of publicly traded companies
Trade journals and published industry reports are excellent tools for locating potential guideline companies
Industry experts
Business brokers
Financial analysts
265
Get the Business Description
Identify GPC’s based on initial criteria – review business description for comparability.p p yFrom this description, you can find the business purpose, products, market segments, and many other significant pieces of information. You can use this information to perform a qualitative analysis of the potential guideline company.Online search for the GPC can provide valuable information.Visit the company’s website
266

8/6/2015
134
Using Search Engines To Find Out More Information
267
Size Criteria
10 times smaller
10 times larger 10 times larger
More or less
Facts and circumstances must dictate

8/6/2015
135
Active Trading
Fair Market Value
Some percentage of Some percentage of outstanding stock trades over the six months to a year prior to valuation
May want to exclude insiders
Penny Stocks
Eliminates speculators
$1, $3 $5 per share

8/6/2015
136
Identify Sources for GPC Research
The primary data sources for guideline public company information are the following (each is filed with the SEC on a period basis).
Th 10 K id ti ’ ti titi• The 10-K provides narrative on company’s operations, competition, customer base, industry, employment force, as well as the financial statements for the prior two years.
• The 10-Q is the quarterly financial statement filed with the SEC on a quarterly basis. Necessary if a latest 12–month (LTM) analysis is to be performed.
• The 8-K is filed with the SEC to mark significant events in the company such as a change in key personnel major acquisitions divestitures etcsuch as a change in key personnel, major acquisitions, divestitures, etc.
271
Getting and Setting Up Financial Data
Use spreadsheets
Many services will download data into your spreadsheet
Requires flexibility as sometimes you will need to calculate information
• E.g. latest twelve months
272
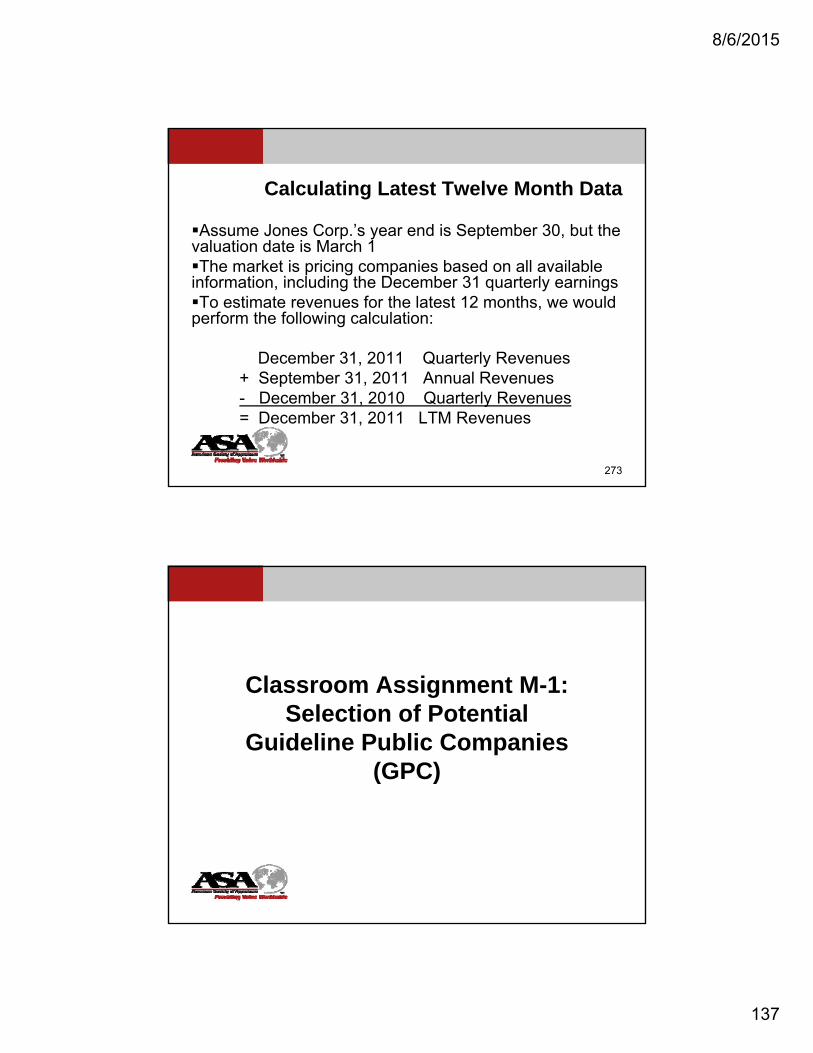
8/6/2015
137
Calculating Latest Twelve Month Data
Assume Jones Corp.’s year end is September 30, but the valuation date is March 1valuation date is March 1The market is pricing companies based on all available information, including the December 31 quarterly earningsTo estimate revenues for the latest 12 months, we would perform the following calculation:
December 31, 2011 Quarterly Revenues + September 31, 2011 Annual Revenues - December 31, 2010 Quarterly Revenues= December 31, 2011 LTM Revenues
273
Classroom Assignment M-1:Classroom Assignment M-1: Selection of Potential
Guideline Public Companies (GPC)

8/6/2015
138
Assignment M-1: Selection of potential Guideline Public Companies (GPC)GPC Selection Criteria
Using the financial statements included in Appendix C and the SIC descriptions included in Exhibit 9-1, list the criteria for the selection of GPCs. Write your criteria in the space allotted below.
Selection Criteria____________________________________________________________________
____________________________________________________________________
____________________________________________________________________
____________________________________________________________________
____________________________________________________________________
275
Solution M-1
In order to locate potential guideline public companies, the following search criteria was conducted:
1. The Company had to be located in the United States.2. The Company’s SIC Code had to be 4212 or 4213.
The search yielded 18 companies. See Handout 9-1.
276

8/6/2015
139
Assignment M-2: Selection of the Guideline Public Companies
Assignment M-2: Selection of the Guideline Public Companies
The initial for GPCs has been completed. Review Handout 9-2 and begin to narrow down the list of possible GPC candidates. Write the reasons for including or excluding a potential GPC.g g p__________________________________________________________________________
__________________________________________________________________________
__________________________________________________________________________
__________________________________________________________________________
__________________________________________________________________________
__________________________________________________________________________
__________________________________________________________________________
__________________________________________________________________________
__________________________________________________________________________
__________________________________________________________________________
__________________________________________________________________________
278

8/6/2015
140
Solution M-2
The following GPC’s were eliminated during step M-2 as eachcompany’s line of business was not considered comparable enoughto GDT to provide a meaningful comparison:
•Covenant Transportation Group, Inc. – temperature controlled•Frozen Food Express Industries, Inc. – price and temp controlled•Landstar System, Inc. – non-transportation business segment and
temp controlled•Marten Transport, Ltd. – temperature controlled
•Patriot Transportation Holding, Inc. – real estate, mining, and petroleum segments
279
p g•Quality Distribution, Inc. – focus on chemical transportation
•Universal Truckload Services, Inc. – flatbed, rail and steamship focus
Assignment M-3: Selection of the Guideline Public Companies

8/6/2015
141
Assignment M-3: Selection of the Guideline Public Companies
After narrowing down the number of potential GPCs, using thebrief descriptions of the GPCs that were provided, now reviewp p ,Handout 9-3, Potential GPC: Stock Pricing and Handout 9-4,Potential GPC: Trading Activity. Use this information todetermine which, if any, of these potential GPCs should beeliminated. List which companies and the reasons forelimination.
281
Handout 9-4
CGI CNW HTLD JBHT KNX ODFL PTSI SAIA USAK WERN YRCWJanuary 2011 146,959 828,000 483,383 1,199,600 951,000 572,923 9,718 112,436 14,745 1,185,000 6,500February 2011 113,404 1,060,400 677,446 916,700 1,105,100 794,176 5,153 95,998 52,157 788,800 10,900March 2011 98,741 948,000 459,335 895,300 1,018,400 702,565 10,345 100,207 29,319 888,300 9,800
Trading Activity AnalysisAverage Monthly Trading (Number of Shares)
, , , , , , , , , , , ,April 2011 105,501 560,200 345,489 1,098,200 1,059,800 581,634 16,445 81,546 14,445 634,000 4,500May 2011 129,849 845,500 539,069 759,500 1,270,500 497,218 11,657 129,289 14,246 692,000 7,400June 2011 129,550 543,200 678,873 877,400 981,400 604,708 51,381 189,766 121,750 554,700 12,500July 2011 172,495 668,400 593,547 948,800 1,250,100 590,753 11,238 174,936 18,745 534,000 15,600August 2011 216,704 1,347,800 1,101,029 1,557,800 1,525,100 867,613 4,315 162,349 52,580 942,400 12,100September 2011 244,217 1,038,500 1,102,852 1,285,500 911,000 805,182 4,861 141,183 61,526 806,800 145,600October 2011 210,849 1,086,100 937,560 1,363,000 913,500 694,988 8,097 126,985 48,894 735,700 133,200November 2011 141,379 832,200 595,047 1,102,200 762,100 576,980 12,720 109,874 9,994 620,900 87,300December 2011 135,524 591,300 460,168 709,700 528,800 450,204 5,446 105,264 11,255 456,000 154,100
Average Monthly Trading 153,764 862,467 664,483 1,059,475 1,023,067 644,912 12,615 127,486 37,471 736,550 49,958
Outstanding Shares 22,600,000 55,388,297 89,700,000 119,158,000 81,439,000 86,200,000 9,100,000 24,200,000 10,440,000 72,787,000 2,087,000
Average Shares Traded 0 68% 1 56% 0 74% 0 89% 1 26% 0 75% 0 14% 0 53% 0 36% 1 01% 2 39%
282
Average Shares Traded 0.68% 1.56% 0.74% 0.89% 1.26% 0.75% 0.14% 0.53% 0.36% 1.01% 2.39%
Average Trading Volume 0.94%Median Trading Volume 0.75%

8/6/2015
142
Solution M-3
Based on a review of Handout 9-3: Stock Price, we havenot eliminated any of the remaining potential guidelinep blic companiespublic companies.
Based on a review of Handout 9-4: Trading Activity,P.A.M. Transportation Services, Inc. and USA Truck, Inc.have been eliminated as potential guideline publiccompanies based on subjective judgment and that theirpercentage of average shares traded to outstanding
283
percentage of average shares traded to outstandingshares is below 0.50%.
Classroom Assignment M-4: Selection of the Guideline Public Companies
Based on the remaining potential GPCs, you have now downloaded the entire Form 10-K or other pertinent documents. Review Handout 9-5 and narrow down your potential GPCs further.y p
Which additional companies did you eliminate? Why?__________________________________________________________________________
__________________________________________________________________________
__________________________________________________________________________
__________________________________________________________________________
__________________________________________________________________________
__________________________________________________________________________
__________________________________________________________________________
__________________________________________________________________________
284

8/6/2015
143
Solution M-4Based on a review of the remaining potential guideline public companies’ Form 10-K’s, we have removed the following companies:following companies:
•Con-Way, Inc. – removed for size, 27,800 employees
•JB Hunt Transport Services, Inc. – removed for size, approximately $4.5 billion revenues
285
•YRC Worldwide, Inc. – removed for size, 32,000 employees, and international operations
Chapter 10

8/6/2015
144
GPC Step 2 - Normalization
•Before performing your search for GPCs, you should have already normalized the subject company’s financial statements
•This step requires to consider whether there are any normalization adjustments required for the GPCs
•The adjustments would include:• GAAP -Accounting Translation Adjustments (Comparability)
• Extraordinary/Nonrecurring Adjustments (Predictability)Extraordinary/Nonrecurring Adjustments (Predictability)
• Nonessential Operating or Excess Asset Adjustments (CoreOperations)
287
GAAP Accounting Translation Adjustments (Comparability)
These adjustments are made to the historical financial t t t t k th bl t th bj tstatements to make them more comparable to the subject:
• LIFO-FIFO
• Accelerated versus straight-line depreciation
• Cash versus accrual
• Revenue recognition (construction companies)
• Tax issues (S corp)• Tax issues (S-corp)
• Differences in accounting from country to country, etc.
288

8/6/2015
145
Accounting Translation Adjustments (Comparability)
Inventory Accounting • Differences in inventory accounting (LIFO to FIFO) are common.
• The following is an example.
289
An Example
290

8/6/2015
146
An Example
To adjust the balance sheet from LIFO to FIFO at year-end 200E the accounting entry would be:200E, the accounting entry would be:
Debit:
Inventory 49,400 (LIFO reserve)Credit:
Deferred taxes 19,760 (LIFO reserve x 40%)
Retained earnings 29,640 (LIFO reserve at YE 200E x (1 – 40%))
(The adjustment to RE includes the impact on 200E earnings.)(The adjustment to RE includes the impact on 200E earnings.)
291
An Example
If asked to adjust YE 200E inventory from LIFO to FIFO, the calculation would be:
Ending 200E LIFO inventory 48,529
Plus: YE 200E LIFO reserve 49,400
= Ending 200E FIFO inventory 97,929g y
292

8/6/2015
147
An Example
If asked to calculate the adjustment to retained earnings (tax affected) the calculation would be:earnings (tax affected), the calculation would be:
YE 200E LIFO reserve 49,400
Times: (1 – 40%) 60%
= Tax-affected adjustment
to retained earnings 29,640to retained earnings 29,640
293
An Example
If asked to calculate the impact on 200E net income of an adjustment from LIFO to FIFO the calculationof an adjustment from LIFO to FIFO, the calculation would be:
Change in LIFO reserve during 200E 2,200
Times: (1 – 40%) 60%
= 200E net income adjustment 1,320j ,
294

8/6/2015
148
Assignment M-5
Review Handout 10-1 to see what obvious adjustments may i i ti ti f li i th GPCrequire investigation for normalizing the GPCs.
What items may need to be adjusted for the GPCs?
295
Summary of Normalization Adjustments
•Removed non-operating income;
•Removed unusual or nonrecurring income and expense items;
•Applied taxes at each GPC’s effective corporate tax rate.
296

8/6/2015
149
Chapter 11
SBVS-1, V: Guidance for the Use of Multiples
Care should be exercised with respect to issues such as:Care should be exercised with respect to issues such as:
• Selection of the underlying data used to compute the valuation ratios
• Selection of the time periods and/or the averaging methods used for the underlying data
• Computation of the valuation ratios
• Timing of the price data used in the valuation ratios
• How the valuation ratio or ratios were selected and applied to theHow the valuation ratio or ratios were selected and applied to the subject's underlying data
304

8/6/2015
150
Calculation of MultiplesPrice/Benefit which is
MVE/Benefit orMVE/Benefit or
MVIC/Benefit
Where: MVE is the market value of shareholders’ equity, MVIC is the market value of invested capital, and Benefit is the appropriate balance sheet or income pp pstatement measure (e.g., sales, earnings, book value of equity, etc.)
299
Equity Multiples
Market value of common equity (MVE) is defined as the number of shares multiplied by the company’s closing stock price.
• Stock price should be based on an active market for the shares
• In determining how active the market is for the GPC, one should consider:
1 The numbers of shares traded1. The numbers of shares traded
2. The number of trades per day
3. The number of total shareholders and institutional shareholders
306

8/6/2015
151
Using Valuation Multiples
Equity MultiplesP i t t i
Invested Capital Multiples
MVIC tPrice to net earningsPrice to pretax earningsPrice to cash flowPrice to operating income Price to book valuePrice to dividend-paying
MVIC to revenues
MVIC to EBIT
MVIC to EBITDA
MVIC to NOPAT
MVIC to tangible book value and debt
capacity or dividend yield and debt
301
Price/Net Earnings
Relatively high income compared to its depreciation and ti tiamortization, or
When depreciation represents actual or economic physical wear and tear, and
The subject company has relatively normal tax rates
302

8/6/2015
152
Price/Pre-Tax Earnings
Relatively high income compared to its depreciation and amortization, or
When depreciation represents actual physical wear and tear, and
It has relatively abnormal tax rates
303
Price/Cash Flow
Relatively low income compared to its depreciation and amortization, or
When depreciation represents low physical, functional or economic obsolescence
304

8/6/2015
153
Price (MVIC)/Sales
When the subject company is homogeneous" to the guideline companies in terms of operating expensescompanies in terms of operating expenses
305
Price/Dividends or Dividend Paying Capacity
Best when the subject company actually pays dividendsj p y y p yUseful when the company has the ability to pay dividends and still has adequate ability to finance its operations and growthMinority interest - actual dividends are more important then the dividend paying capacity, since the minority interest cannot force dividends to be paidActual dividends paid are frequently disguised as excess compensationpThis is a commonly used methodology for minority interests
306

8/6/2015
154
Price/Book Value
May be appropriate when the subject company is in an industry that has a meaningful relationship between y gbook value and the earnings that would normally be producedThe appraiser can use the return on equity to assist in the adjustment of the price/book value ratio to fit the relative quality circumstances of the subject company
307
Invested Capital Methods (also referred to as "debt-free")
Invested Capital = Non-working capital debt + EquityInvested Capital = Non-working capital debt + Equity
If the appraisal subject's capital structure is significantly different from those of the publicly-traded guideline companies, consider using a debt free method, i.e., subject very leveraged or all equity
308

8/6/2015
155
“The Business”Assets Liabilities & Equity
Current LiabilitiesCurrent Assets Current LiabilitiesCurrent Assets
Net Working Capital
Interest-Bearing Debt
Fixed Assets
Intangible Assets (Identifiable and Goodwill)
Stockholders' Equity
Other Long-Term Assets
309
Valuing Invested Capital as Opposed to Equity
Price = Market value of the publicly-traded guideline companies' equity (price per share times the number ofcompanies equity (price per share times the number of shares outstanding) plus market value of the interest paying debt
Interest expense is added back to the earnings (or cash flow) used in the denominator of the various multiples
Value of invested capital minus the fair market value of the subject company's debt equals value of the equity
310

8/6/2015
156
Invested Capital Multiples
Market value of invested capital (MVIC) is defined as the sum of the market value of common equity, preferred equity, and interest-bearing debt.
• In calculating MVIC, some appraisers deduct cash and securities and others subtract “excess” cash (adding the cash back to the value of operations).
311
Time Period for Financial Operating Metrics
Latest 12 months (LTM)
Last fiscal year (LFY)
Projected next fiscal year
Historical averages or weighted averages
Complete business cycle
312

8/6/2015
157
Classroom Assignment M-61. Based on the information provided below for Saia, Inc., calculate the
guideline public company’s Price-to-EBT and MVIC-to-EBIT multiples.
GUIDELINEPUBLIC COMPANY METHOD
In millions (local currency), except per shareTicker SAIA
Name Saia Inc.
Share Price as of 12/31/2011 12.48 Shares Outstanding 16.1 Debt 73 Normalized 2011 EBT 17.5 2011 Interest Expense 10.5
Calculate:
GUIDELINE PUBLIC COMPANY METHODCALCULATION OF MULTIPLES EXAMPLE
313
Price-to-EBT Multiple
MVIC-to-EBIT Multiple
Solution M-6
Solution:
Determine PriceSh P i f 12/31/2011 12 48Share Price as of 12/31/2011 12.48
Shares Outstanding x 16.1
Price 201
Divided by Normalized 2011 EBT 17.5 Price-to-EBT 11.5
Price 201 Debt + 73
MVIC 274
Normalized 2011 EBT 17.5
314
2011 Interest Expense + 10.5
Normalized 2011 EBIT 28.0
MVIC / Normalized 2011 EBIT 9.8

8/6/2015
158
Solution M-7Selected Multiples:The following multiples were selected after considering thecoefficient of variation, overall dispersion of multiples, and overall
bilit f t b t th G id li P bli C icomparability features between the Guideline Public Companiesand GDT.
Equity Multiples•Price-to-EBT•Price-to-Gross Free Cash Flow
Invested Capital Multiples
315
p p•MVIC-to-EBITDA•MVIC-to-EBIT
Market Approach Example
GUIDELINE COMPANIESPRICE/
EARNINGSRATIO
PRICE/ SALES
PRICE/BOOKVALUERATIO SALES VALUE
ABC Toy Company, Inc. 8.70 55.30% 2.85
XYZ Funtime, Inc. 9.30 47.43% 4.65
Toys, Inc. 8.50 35.25% 3.65
Games Corp. 6.60 54.80% 3.90
Fun Corp. 7.80 48.20% 4.25
Median Multiple 8.50 48.20% 3.90
Selected Multiple 6.20 44.00% 2.50
316

8/6/2015
159
Market Approach Example
This example omits discounts and premiums.317
Invested Capital ExampleABC Toy Company, Inc. had a price to earnings ratio of 8.70 on December 31, 2006.
If the price of ABC’s stock was $47.50 on this date, this means that ABC's earnings would have to have been $5.46 per share.
Price/earnings = Multiple
$47.50/$5.46 = 8.70
Market value of equity = $47.50 x 1,000,000 sh.
• Assumes 1 million shares outstanding
318

8/6/2015
160
Invested Capital
ABC’s balance sheet reflects interest-bearing debt of $5 million
MVIC = $47.5 million + $5.0 million
$52.5 million / 1 million shares = $52.50/sh.
Earnings per share = $5 46Earnings per share = $5.46
Net income after taxes was $5,460,000
Assume interest expense $500,000
319
Invested Capital
Net income after taxes $ 5,460,000Add: Interest expense (net of taxes)Add: Interest expense (net of taxes)
Interest expense $ 500,000Effective tax rate x 40%Tax benefit $ 200,000 300,000
Debt-free net income $ 5,760,000
MVIC to DFNI = $52.50/$5.76 = 9.11
320

8/6/2015
161
Invested Capital
GUIDELINE COMPANIES MVIC/DFNI RATIOGUIDELINE COMPANIES MVIC/DFNI RATIO
ABC Toy Company, Inc. 9.11
XYZ Funtime, Inc. 10.15
Toys, Inc. 9.45
Games Corp. 7.30
Fun Corp. 8.90
Median Multiple 9.45
Selected Multiple 6.90
321
Invested Capital
MVIC/DFNIAftertax earnings $ 959,446Aftertax earnings $ 959,446Add: Interest (net of taxes)11 90,000Debt-free net income $ 1,049,446
Multiple x 6.90
Value of operating invested capital22 $ 7,241,177
Net nonoperating assets + 250 000Net nonoperating assets + 250,000
Total value of invested capital $ 7,491,177Rounded $ 7,500,000
1Interest expense for the year was $150,000. Effective tax rate was 40 percent.
2We have once again intentionally omitted valuation discounts or premiums from this example. 322

8/6/2015
162
Invested Capital to Equity
$Value of invested capital $ 7,500,000
Less: Interest-bearing debt 1,300,000
Value of equity $ 6,200,000
323
Useful Statistical Measures and Tools
Medians and percentiles • Less influenced by outliers• Less influenced by outliers
Averages/composites• Averages may weight outliers too heavily
Harmonic mean or the reciprocal of the average of the multiples • Useful when multiples are particularly dispersed, but seldom used
Coefficient of variationCoefficient of variation• Measures the dispersion of the multiples• Computed by dividing the standard deviation of the data by the mean
324

8/6/2015
163
Choosing the Multiple -Equity vs. Invested Capital Multiples
Equity multiple more appropriate when valuing a minority interest and/or when the subject and GPC group have similar capital structures. The application of equity multiples to estimate equity values is:
Invested capital multiples are more appropriate when valuing a control interest and/or there is dissimilarity in capital structure between the subject and the GPC. The application of MVIC to estimate equity values is:
Equity Valuesubject = MVEq
GPC as adjusted
x Benefitsubject
Benefit
325
If capital structures are somewhat similar across companies then the appraiser might use both invested capital and equity multiples.
Equity Value subject =MVIC
GPC as adjusted
x Benefit Subject as Normalized ‐ Debt Subject as Market ValueBenefit
Chapter 12

8/6/2015
164
Compare and Adjust GPC Multiples
Compare the qualitative and quantitative characteristics of the subject company with the characteristics of the guideline companies.
Analytical tools include:• Qualitative SWOT analysis (strengths, weaknesses,
opportunities, threats); and
• Financial performance analysis (financial ratios, trends, i t i d t t )comparison to industry peer groups, etc.).
327
Qualitative Risk Factors
Economic risk Business riskBusiness risk Operating risks Financial risks Asset risks Product risks Market risksMarket risks Technological risks Regulatory risks Legal risks

8/6/2015
165
Economic Risk
Revenue Ruling 59-60 . . . “the economic outlook in general and the condition and outlook of the specific industry in particular.”
Business Risk
Analyze the company in terms of the risk associated with factors such as sales volatility and the volatility of the company's growth

8/6/2015
166
Operating Risk
Include such factors as the fixed versus variable costfixed versus variable cost structure of the appraisal subject
Financial Risk
The amount of leverage that the company uses, as well as the company's ability to cover its debt payments

8/6/2015
167
Asset Risk
Relates to the age andRelates to the age and condition of the company's assets
Product Risk
Relates to a company that has little diversification in its product line or a product line that may become extinct.

8/6/2015
168
Market Risk
How geographically diversified is the company?
Technological Risk
Does the company have the ability to keep up with other companies in the appraisal subject's industry?

8/6/2015
169
Regulatory Risk
Regulatory agencies can also adversely affect a business
Legal Risk
The cost of a litigation in today's society can be the end of any successful business

8/6/2015
170
Quantitative Factors
There are two basic types of comparative financial analysis:
1. Trend analysis (comparison of the company to itself over time)
2. Peer analysis (comparison to similar companies over time)
339
Quantitative Factors to Consider
The key factors for comparison are the y passessment of relative risk and relative growth differences.
340

8/6/2015
171
Steps in the Comparative Financial Analysis
Identify key differences between the subject and theIdentify key differences between the subject and the guideline group.
Identify differences within the GPCs themselves.
Discover if any single GPC or subset of GPCs is more comparable to the subject than the group overall.
Support for the selection of each multiple.
341
Measures of Financial Performance
The concepts chosen will be a function of the industry in which the company operates, but they should include:
• Size measures • Measures of historical growth rates• Profit margins• Measures of asset management and reinvestment• Measures of financial leverage, solvency, and liquidity• Measures of returns on investment• Other financial measures
342

8/6/2015
172
Questions to Ask
Which ratios or benchmarks are most relevant for the subject and the industry?subject and the industry?
Is there uniformity among the ratios within the guideline group?
Variance between the average ratios within the guideline group and the averages expressed in the industry survey?
As a result of the financial analysis, can any of the GPCs be discarded?
343
Questions to Ask
Are any of the GPCs more similar to the subject company?
Are there any upward or downward trends in any of the ratios?
Economic and industry impact on financial performance of the GPC ratios?
344

8/6/2015
173
Questions to Ask
•Is there a trend in the implied growth rate compared with the growth rate that was used in the income approach?
•What are the key differences in risk between the GPCs and the subject?
•What are the key differences in growth prospects between the GPCs and the subject?between the GPCs and the subject?
345
Classroom Assignment M-8: C ti A l iComparative Analysis
Exercise
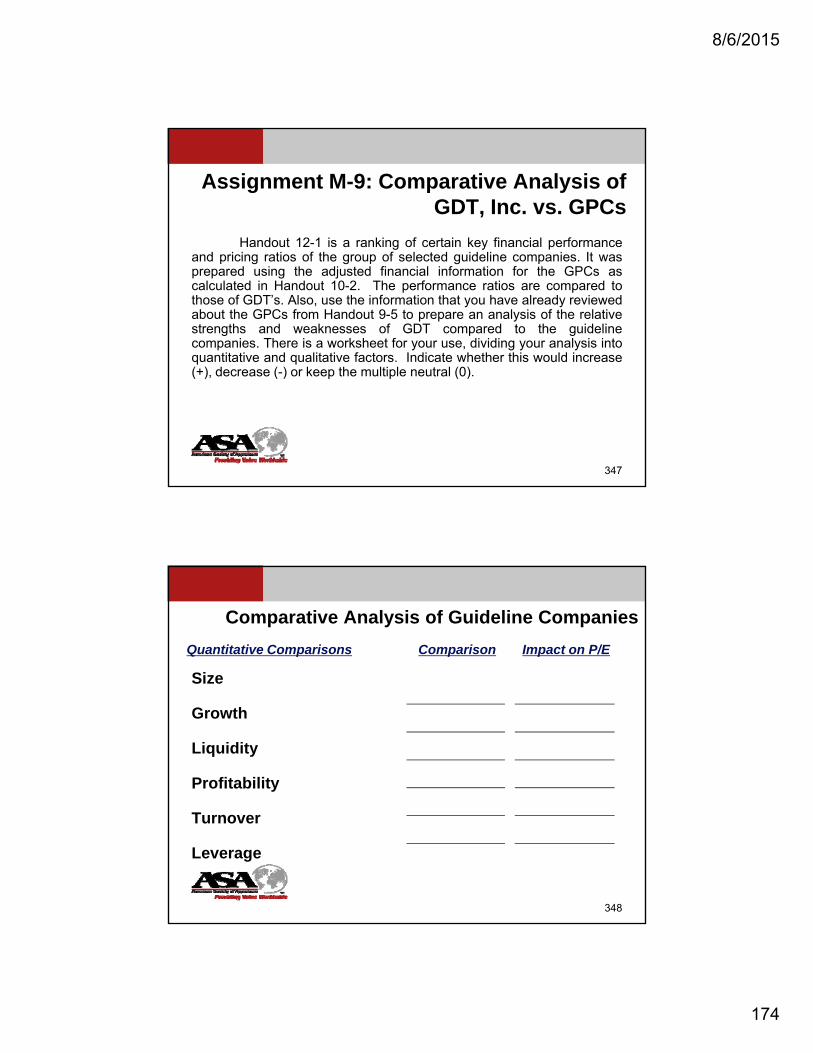
8/6/2015
174
Assignment M-9: Comparative Analysis of GDT, Inc. vs. GPCs
Handout 12-1 is a ranking of certain key financial performanceg y pand pricing ratios of the group of selected guideline companies. It wasprepared using the adjusted financial information for the GPCs ascalculated in Handout 10-2. The performance ratios are compared tothose of GDT’s. Also, use the information that you have already reviewedabout the GPCs from Handout 9-5 to prepare an analysis of the relativestrengths and weaknesses of GDT compared to the guidelinecompanies. There is a worksheet for your use, dividing your analysis intoquantitative and qualitative factors. Indicate whether this would increase( ) d ( ) k th lti l t l (0)(+), decrease (-) or keep the multiple neutral (0).
347
Quantitative Comparisons Comparison Impact on P/E
Comparative Analysis of Guideline Companies
Size
Growth
Liquidity
Profitability
Turnover
Leverage
348
8/6/2015
175
Qualitative Comparison Impact on P/E
Comparative Analysis of Guideline Companies
349
GPC Step 6: Adjusting the GPC Multiples
Should the 25th percentile, median, 90th percentile, average, harmonic mean, etc., multiple be chosen?
• Must be based on comparison of the subject Company to the GPCs.
• Presumably the stronger the subject company relative to the GPCs, the greater the value and, maybe the higher the pricing multiple.
350

8/6/2015
176
GPC Step 6: Adjusting the GPC Multiples
Be careful not to double-count.
Examples:
• Using a lower pricing multiple to account for the small size of the subject company when the multiples have already be adjusted for size
• Using a higher multiple to account for high growth of the subject when the multiples have been adjusted for growth
• Using a high price/earnings multiple to account for the subject’s higher than average profitability (the advantage of the higher profitability is captured by using an earnings-based pricing multiple)captured by using an earnings based pricing multiple)
Don’t simply use the average or median. Analysis must accompany any conclusion.
351
Market Multiples Are the Inverse of CAP Rates
Where:
k = Risk and benefit adjusted required rate of return
Market Multiple = Market Price - 1
Operating Performance (k - g)
352
j q
g = Present value weighted perpetual growth rate

8/6/2015
177
Qualitative Basis for Market Multiple Adjustments
Generally speaking, if the outlook for our subject y p g, jcompany relative to the GPCs is for less risk and/or more growth, we will choose a multiple somewhat higher than the median.
If the outlook is for average risk and/or future growth, we will choose a multiple at the median.
And, if the outlook is for higher risk and/or lower growth we will choose a multiple below the median.
353
Qualitative Basis for Market Multiple Adjustments
Most valuation analysts use “informed judgment” when ki th i h i t th t f dj t t thmaking their choice as to the amount of adjustment they
apply to the GPC market multiples.
This is just another way of saying that their choice is made on a qualitative basis.
There is nothing wrong with this methodology, but there are some quantitative techniques that add precision to thesome quantitative techniques that add precision to the direction and amount of market multiple adjustments.
354

8/6/2015
178
Quantitative Models forMarket Multiple Adjustments
Some analysts have generated valuation models that indicate both the directionSome analysts have generated valuation models that indicate both the direction and quantify the amount of market multiple adjustment. These techniques involve the following analyses:
• Correlation of changes in a financial performance metric and changes in the market multiples
• Differences in size or other risk factors
• Differences in the outlook for growth
355
Adjusting Guideline Company Multiples
Adjustments can be made for size and/or growthAdjustments can be made for size and/or growth.• These two factors can have a large impact on value.• Adjust the size-related risk premium and growth rate implicit in each
GPC multiple to the level appropriate for the subject. • Impact on value is potentially most substantial for size and growth.
356

8/6/2015
179
Adjusting Guideline Company Multiples
Size and growth adjustments are made only to the incomeSize and growth adjustments are made only to the income statement-based pricing multiples and are based on the following relationship between the capitalization rates and pricing multiples:
which impliesValue =
Benefit
Kg - gg
or
357
Value=
1
Benefit Kg - gg
Benefit= Kg - ggValue
Adjustments Based Upon Correlation Between Performance and Multiple
Correlation Between ROE and Price / Book Value
Th i ll h h ld b i i l i i hi h Theoretically, there should be a positive correlation, since higher ROE provides equity investors with higher current returns and higher reinvestment for future capital appreciation.
Assumes the measures of ROE are close to “normalized” expected future ROE performance.
358

8/6/2015
180
Adjustments Based Upon Correlation Between Performance and Multiple
Correlation Between Profit Margin and Price/Sales
Theoretically there should be such a positive correlation since Theoretically, there should be such a positive correlation, since higher profit margins provide equity investors with higher current returns and higher reinvestment for future capital appreciation.
Assumes the profit margins are close to “normalized” expected future profitability performance.
359
Return on Sales
Price/ Sales
Price /Sales
Return on Sales
Size Adjustment Process
The discount rate is the place the adjustment is made because we have data quantifying the size affect on returns.
360
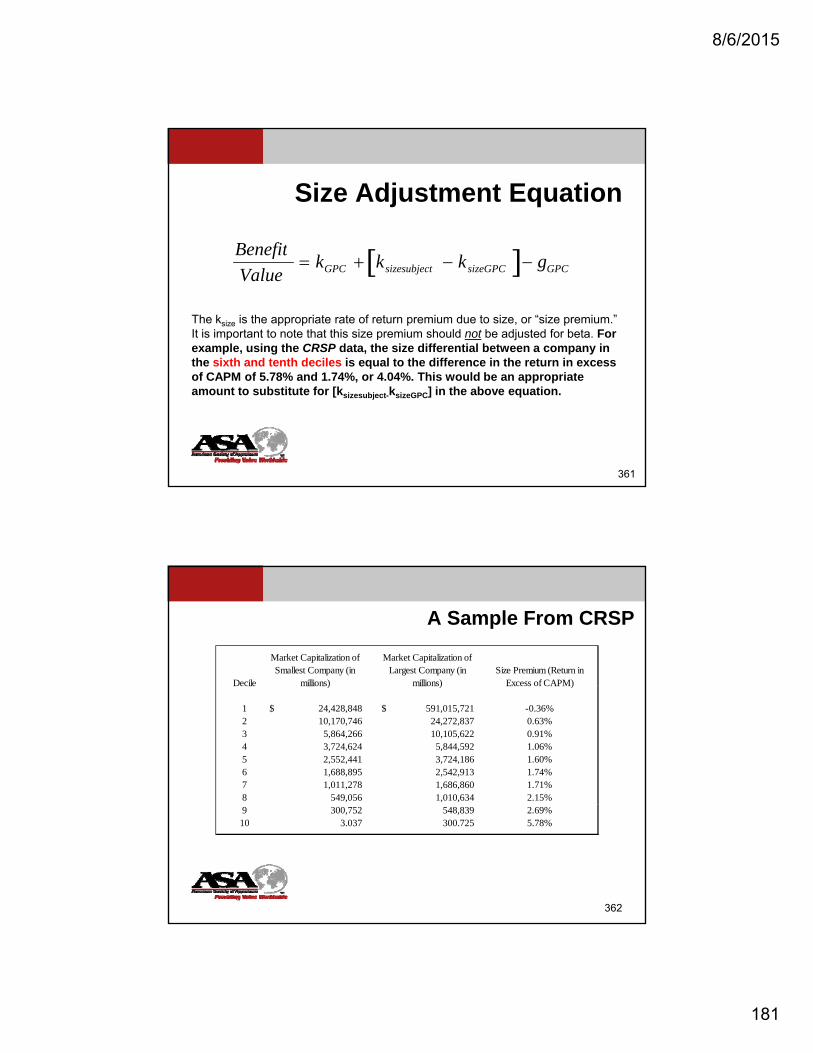
8/6/2015
181
Size Adjustment Equation
Benefit
The ksize is the appropriate rate of return premium due to size, or “size premium.” It is important to note that this size premium should not be adjusted for beta. For example, using the CRSP data, the size differential between a company in the sixth and tenth deciles is equal to the difference in the return in excess
Benefit
Value kGPC ksizesubject ksizeGPC gGPC
qof CAPM of 5.78% and 1.74%, or 4.04%. This would be an appropriate amount to substitute for [ksizesubject-ksizeGPC] in the above equation.
361
A Sample From CRSP
Decile
Market Capitalization of Smallest Company (in
millions)
Market Capitalization of Largest Company (in
millions)Size Premium (Return in
Excess of CAPM)Decile millions) millions) Excess of CAPM)
1 24,428,848$ 591,015,721$ -0.36%2 10,170,746 24,272,837 0.63%3 5,864,266 10,105,622 0.91%4 3,724,624 5,844,592 1.06%5 2,552,441 3,724,186 1.60%6 1,688,895 2,542,913 1.74%7 1,011,278 1,686,860 1.71%8 549,056 1,010,634 2.15%
362
9 300,752 548,839 2.69%10 3.037 300.725 5.78%

8/6/2015
182
Size Adjustment Example
Assume the original P/E multiple = 15.0Assume the GPC is in CRSP’s 6th decileAssume the GPC is in CRSP’s 6th decileAssume the subject is in CRSP’s 10th decile (based on another approach to value)
To adjust the P/E multiple for size:• Compute the inverse of the multiple: 1/15.0 = 6.67%.• Add the size differential between the GPC and the subject:
6 6 % 4 04% 10 1%6.67% + 4.04% = 10.71%. • Take the reciprocal to get the new pricing multiple adjusted for
size: 1/0.1071 = 9.3.
363
Adjustment for Growth
The gB for each of the GPCs must be replaced with the gB
for the subject. This is done in the following manner:
Benefit
Value kGPC gGPC gGPC gSubject
364
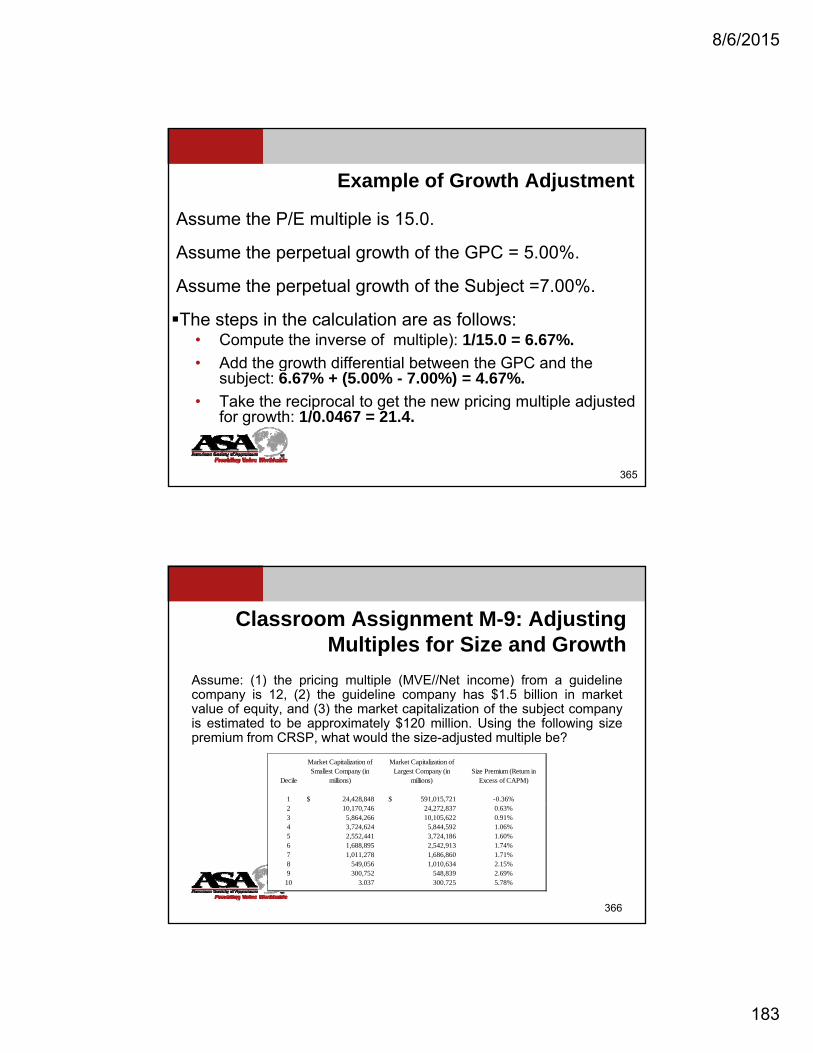
8/6/2015
183
Example of Growth Adjustment
Assume the P/E multiple is 15.0.
A th t l th f th GPC 5 00%Assume the perpetual growth of the GPC = 5.00%.
Assume the perpetual growth of the Subject =7.00%.
The steps in the calculation are as follows: • Compute the inverse of multiple): 1/15.0 = 6.67%.
• Add the growth differential between the GPC and theAdd the growth differential between the GPC and the subject: 6.67% + (5.00% - 7.00%) = 4.67%.
• Take the reciprocal to get the new pricing multiple adjusted for growth: 1/0.0467 = 21.4.
365
Classroom Assignment M-9: Adjusting Multiples for Size and Growth
Assume: (1) the pricing multiple (MVE//Net income) from a guideline( ) p g p ( ) gcompany is 12, (2) the guideline company has $1.5 billion in marketvalue of equity, and (3) the market capitalization of the subject companyis estimated to be approximately $120 million. Using the following sizepremium from CRSP, what would the size-adjusted multiple be?
Decile
Market Capitalization of Smallest Company (in
millions)
Market Capitalization of Largest Company (in
millions)Size Premium (Return in
Excess of CAPM)
1 24,428,848$ 591,015,721$ -0.36%
366
2 10,170,746 24,272,837 0.63%3 5,864,266 10,105,622 0.91%4 3,724,624 5,844,592 1.06%5 2,552,441 3,724,186 1.60%6 1,688,895 2,542,913 1.74%7 1,011,278 1,686,860 1.71%8 549,056 1,010,634 2.15%9 300,752 548,839 2.69%
10 3.037 300.725 5.78%

8/6/2015
184
Classroom Assignment M-9: Adjusting Multiples for Size and Growth (cont)
Assume: (1) the pricing multiple (MVE/Net income) from a guideline( ) p g p ( ) gcompany is 12, (2) the expected growth rate of the GPC is 7%, and (3)the expected growth rate of the subject company is 4%. Calculate thegrowth-adjusted multiple.
367
Chapter 13

8/6/2015
185
Step 7 – Apply Adjusted Multiples to Subject Company to Derive Values
Guideline Companies Price/EBTPrice/Gross Free Cash
Flow
GENERAL DELIVERY TRUCKING, INC.Application of the Guideline Public Company Method Using Equity Multiples
Heartland Express, Inc. 17.22 12.02 Old Dominion Freight Line, Inc. 10.53 10.06 Saia, Inc. 11.50 4.15 Knight Transportation, Inc. 12.66 9.44 Werner Enterprises, Inc. 11.59 7.11 Celadon Group, Inc. 23.43 9.73
Median Multiple 12.13 9.59
Selected Multiple2
8.50 6.50
The selected multiples are now applied against the figures of the appraisal subject.
369
Price/EBTPrice/Gross Free Cash
Flow
Normalized EBT 21,762,620$ Normalized EBTDA 32,215,572$
Multiple 8.50 6.50
Operating Entity Value 184,982,270$ 209,401,218$ Net Non-operating Assets 23,668,000 23,668,000
Total Entity Equity Value1
208,650,270$ 233,069,218$
Step 7 – Apply Adjusted Multiples to Subject Company to Derive Values
Guideline Companies MVIC/EBITDA MVIC/EBIT
GENERAL DELIVERY TRUCKING, INC.
Application of the Guideline Public Company Method Using Invested Capital Multiples
Heartland Express, Inc. 9.69 17.22Old Dominion Freight Line, Inc. 7.96 11.05Saia, Inc. 4.20 9.80Knight Transportation, Inc. 7.60 13.36Werner Enterprises, Inc. 5.70 11.63Celadon Group, Inc. 9.25 28.36
Median Multiple 7.78 12.50
Selected Multiple2
5.00 8.75
EBITDA 44,348,620$
EBIT 25,190,620$
370
Multiple 5.00 8.75
Value of operating invested capital 221,743,100$ 220,417,925$
Net non-operating assets 23,668,000 23,668,000
Total value of invested capital 245,411,100$ 244,085,925$ Rounded 245,000,000$ 244,000,000$
Less: Interest-bearing debt (49,249,000) (49,249,000)
Value of equity3
195,751,000$ 194,751,000$

8/6/2015
186
Reconciliation
Reconciliation of differing value indications derived from the same method (or even from differentthe same method (or even from different methods/approaches) relies upon the valuator’s judgment.
The weighting of value indications can be explicit or implicit. The critical factor is that the weighting be the result of informed judgment and clearly explained in the reportreport.
371
Weighting Differing Indications of Value
Weights are dependent upon the appraiser’s sense of relative confidence in the value indication from each type of market multiplemarket multiple.
• Confidence depends upon both a theoretical and practical understanding of the key determinants of value for the type of industry/company.
• E.g., service companies will tend to be valued on revenues, capital intensive enterprises on net income and/or book value, real estate companies on gross cash flow etcflow, etc.
Factors influencing the appraiser’s level of confidence include—industry practice, dispersion/clustering of GPC multiples, etc.
372

8/6/2015
187
Weighting Differing Indications of Value
Revenue Ruling 59-60 does not bar a mathematical weighting of valuation results. It bars a blind, arithmetic mean of the results that would be appropriate only by coincidence.
If the appraiser implicitly weighs the results and says so in the report, an explicit weighting can be elicited by a good attorney on cross examinationgood attorney on cross examination.
373
Step 8 – Reconcile the Different Indications of Values
GENERAL DELIVERY TRUCKING, INC.GUIDELINE PUBLIC COMPANY METHOD: RECONCILIATION OF VALUE INDICATIONS
Price/EBTPrice/Gross
Free Cash Flow MVIC/EBITDA MVIC/EBIT
Example Reconciliation:Indicated Equity Values 208,650,270$ 233,069,218$ 195,751,000$ 194,751,000$
Selected Weighting1
25% 25% 25% 25%
52,200,000$ 58,300,000$ 48,900,000$ 48,700,000$
374
Reconciled Value 208,100,000$
ROUNDED 200,000,000$ 1
Based on appraisers qualatative assessment of each method.

8/6/2015
188
Chapter 14
Merger and Acquisition MethodA method within the market approach whereby pricing
lti l d i d f t ti f i ifi tmultiples are derived from transactions of significant interests in companies engaged in the same or similar lines of business. (from International Glossary of Business Valuation Terms)
376

8/6/2015
189
SBVS 2, II: Conceptual Framework for the M & A
MethodMethod
Transactions involving the sale, merger or acquisition of businesses provide objective data for developing valuation multiples.
The development of valuation multiples from merger and acquisition transactions should be considered to the extent that sufficient information is available.
377
SBVS 2, II: Conceptual Framework for the M & A
MethodMethodIdeal guideline companies are in the same industry.However, if there is insufficient transaction evidenceavailable in that industry, it may be necessary toselect other companies having an underlyingsimilarity in terms of relevant investmentycharacteristics such as markets, products, growth,cyclical variability, and other salient factors.
378

8/6/2015
190
Why Do We Use Databases?
Ease
Moderate cost
Analytical tools
Easy downloading of data
… But beware of simplistic use that misunderstands… But beware of simplistic use that misunderstands the underlying transactions
379
Pros and Cons of the M&A Method
Pros:
•Easy to understandy
•Uses real transactions that have occurred in the industry
•Straightforward application
Cons:
•Difficult to find a truly comparable company
M h li it d l f t ti t l•May have limited sample of transactions to analyze
•Underlying assumptions may not be apparent based on information available (synergies, growth expectations, etc.)
380

8/6/2015
191
What if your M&A transaction search does not yield meaningful results?
If the appraiser’s transaction search yields only one or twoIf the appraiser s transaction search yields only one or twousable transactions, the best course of action is to describethe transaction search and results, but use the merger andacquisition method solely as a test of reasonableness toother valuation approaches used.
381
Key M & A DatabasesPublic Company Databases
• Done Deals• Mid Market Comps• Mergerstat• Pratt’s Public Stats • Thomson M&A Database
Private Company Databases• Institute of Business Appraisers• BizCompsp• Pratt’s Stats
Special Industry / Regional Databases
382

8/6/2015
192
Database # Transactions Earliest Data
Typical Value Range
Value Concentration
D D l 7 500 + 1994 $1 M $150 M 50% d $15M
Key M & A Databases
Done Deals 7,500 + 1994 $1 M - $150 M 50% under $15M25% under $5M
Mid Market Comps
6,500 + 1994 $1M - $100M 44% under $10M10% under $1M
000 2001 (b k 1980 $1
383
Mergerstat 57,000 + 2001 (back to 1980 available)
$1M up
Database # Transactions Earliest
Data
Typical Value
Range
Value Concentration (circa 2009)
IBA 30,700 + 1970’s $1 M or less 88% under $500 K
Key M & A Databases
, $ $46% under $100 K
BizComps 10,000 + 1993 $1M or less 61% under $500K39% under $100K
Pratts Stats 10,000 + 1990 $100K to $1 B 47% under $1M (MVIC)
384
28% under $100K (MVIC)

8/6/2015
193
Common Inconsistencies and Mistakes
Comparability to subject
Synergistic effects difficult to analyze
Single point multiples, little financial depth
385
Common Inconsistencies and Mistakes
No financial depth; cannot see trends• A business sold after a poor, unusual year, may have a high multiple
reported as a ratio of the just completed results.
• A business sold after a particularly excellent, but unusual, year may show a low multiple of the just completed results.
• Balance sheet issues of capital structure, working capital, and variation of assets are often not reported.
386

8/6/2015
194
Common Inconsistencies and Mistakes
Older data may have different internal and external factors influencing value.
• Various dates in similar transactions may pick up changes in economic conditions, such as “hot” industries going cool.
387
Common Inconsistencies and Mistakes
Flaws in data reportingFlaws in data reporting• Adjusted earnings are often inconsistently calculated by the data
source. • Plant, property and equipment estimates may be book value,
estimates of market value, or simply book value of what is sold to the buyer.
• SIC/NAICS and other coding errors as to business definition exist. • Each source carries its own glossary, which should be understood.• Duplicate transactions are often reported to several databases,Duplicate transactions are often reported to several databases,
sometimes with different results. Company name and nature of business may be reported differently for the same transaction.
• “N/A” doesn’t necessarily mean zero.
388

8/6/2015
195
Common Inconsistencies and Mistakes
Annualizing stub periods• A procedure common in Done Deals
• May yield unrealistic computations of annual performance
389
Common Inconsistencies and Mistakes
What property was exchanged?p p y g• Assets exchanged may not be well defined• BizComps and IBA define property exchanged as fixed assets +
goodwill (IBA may include inventory)• Real estate is commonly not included in the property being
transferred• Excess, or non-operational assets are typically not included in the
sale• Equity and Invested capital multiples are available from several
databases• Debt may or may not be included in calculations
390
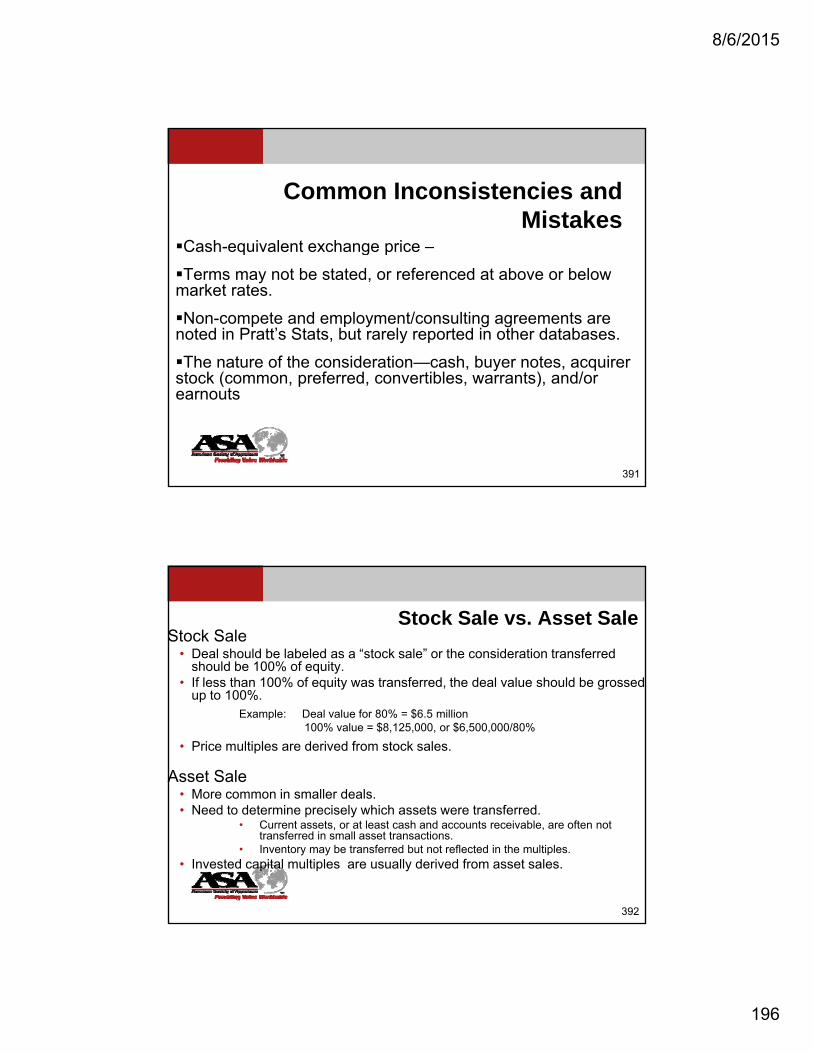
8/6/2015
196
Common Inconsistencies and Mistakes
Cash-equivalent exchange price –Cash-equivalent exchange price –
Terms may not be stated, or referenced at above or below market rates.
Non-compete and employment/consulting agreements are noted in Pratt’s Stats, but rarely reported in other databases.
The nature of the consideration—cash, buyer notes, acquirerThe nature of the consideration cash, buyer notes, acquirer stock (common, preferred, convertibles, warrants), and/or earnouts
391
Stock Sale vs. Asset SaleStock Sale
• Deal should be labeled as a “stock sale” or the consideration transferred should be 100% of equity.
• If less than 100% of equity was transferred the deal value should be grossedIf less than 100% of equity was transferred, the deal value should be grossed up to 100%.
Example: Deal value for 80% = $6.5 million100% value = $8,125,000, or $6,500,000/80%
• Price multiples are derived from stock sales.
Asset Sale• More common in smaller deals.• Need to determine precisely which assets were transferred.
• Current assets, or at least cash and accounts receivable, are often not transferred in small asset transactions.
• Inventory may be transferred but not reflected in the multiples.• Invested capital multiples are usually derived from asset sales.
392

8/6/2015
197
Analytical ProceduresIdentify transactions in which the target is similar to subject, use criteria similar to GPC.Obtain adequate data on the publicly reported transactions from q p y pSEC filings. Obtain adequate data on the private transactions. This may entail calling the intermediary to obtain additional information.Refining the initial selection based on additional information and quality of data.Develop multiples.
• EquityEquity
• Invested capital
Analyze and select multiples.
393
M&A Method Example – Handout 14-1
Market Value Ratio of Ratio of Ratio ofof Invested MVIC-to- MVIC-to- MVIC-to-
Number Source Date Capital (MVIC) Revenue Revenue EBITDA EBITDA Total Assets Total Assets Location
1 Pratt's Stats 2011 $365,000 $700,000 0.52 $66,982 5.45 2 Pratt's Stats 2011 $11,000,000 $10,379,560 1.06 $2,004,560 5.49 2,224,000$ 4.95 PA3 Pratt's Stats 2010 $1,700,000 $4,944,319 0.34 $465,776 3.65 FL4 Pratt's Stats 2010 $50,000,000 $65,404,833 0.76 $9,726,697 5.14 35,047,786$ 1.43 NC
GENERAL DELIVERY TRUCKING, INC.SAMPLE OF MARKET TRANSACTIONS
5 Pratt's Stats 2010 $66,500 $96,695 0.69 $40,852 1.63 66,500$ 1.00 MO
6 Pratt's Stats 2010 $300,000 $1,759,331 0.17 $103,390 2.90 IN7 Pratt's Stats 2010 $14,365,944 $19,226,985 0.75 $1,555,711 9.23 13,180,488$ 1.09 NC
8 Pratt's Stats 2009 $590,000 $868,018 0.68 $87,832 6.72 133,312$ 4.43 CA
9 Pratt's Stats 2009 $17,507,514 $10,482,856 1.67 $2,572,304 6.81 3,701,435$ 4.73 10 Pratt's Stats 2009 $1,400,000 $1,300,000 1.08 $500,000 2.80 1,400,000$ 1.00 GA11 Pratt's Stats 2009 $261,000 $2,763,473 0.09 $103,525 2.52 MN12 Pratt's Stats 2009 $3,872,000 $5,738,000 0.67 $551,000 7.03 OK13 Pratt's Stats 2008 $2,050,000 $6,983,209 0.29 CA14 Pratt's Stats 2008 $400,000 $800,000 0.50 $200,000 2.00 GA15 Pratt's Stats 2008 $23,500,000 $30,000,000 0.78 TX16 Pratt's Stats 2008 $14,151,000 $15,571,159 0.91 $3,356,676 4.22 8,870,739$ 1.60 WI
$ $ $
394
17 Pratt's Stats 2008 $130,000 $597,708 0.22 241,450$ 0.54 IL18 Pratt's Stats 2008 $80,000 $850,000 0.09 FL19 Pratt's Stats 2008 $1,700,000 $2,233,384 0.76 $222,231 7.65 743,120$ 2.29 TX20 Pratt's Stats 2008 $400,000 $454,351 0.88 $138,961 2.88 GA21 Pratt's Stats 2008 $795,000 $835,884 0.95 $101,024 7.87 TX
MVIC Revenue MVIC-to-Revenue
EBITDA MVIC-to-EBITDA
Total Assets MVIC-to-Total
Assets Highest 50,000,000$ 65,404,833$ 1.67 9,726,697 9.23 35,047,786 4.95 Mean 6,887,331$ 8,666,179$ 0.66 1,282,207 4.94 6,560,883 2.31
Median 1,400,000$ 2,233,384$ 0.69 222,231 5.14 1,812,000 1.52
Lowest 66,500$ 96,695$ 0.09 40,852 1.63 66,500 0.54
General Delivery Trucking, Inc. 265,675,000$ 44,348,620 107,646,000
All Transactions
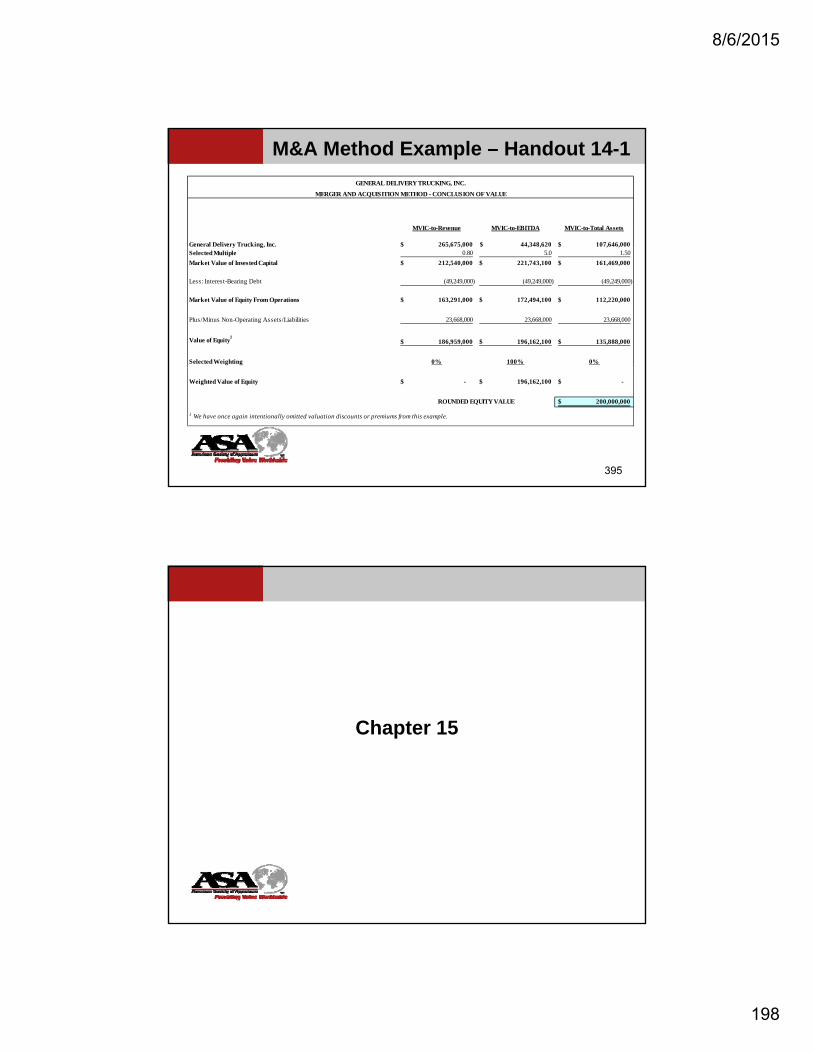
8/6/2015
198
M&A Method Example – Handout 14-1
MVIC-to-Revenue MVIC-to-EBITDA MVIC-to-Total Assets
General Delivery Trucking, Inc. 265,675,000$ 44,348,620$ 107,646,000$
MERGER AND ACQUISITION METHOD - CONCLUSION OF VALUE
GENERAL DELIVERY TRUCKING, INC.
y g, , , , , , ,Selected Multiple 0.80 5.0 1.50
Market Value of Invested Capital 212,540,000$ 221,743,100$ 161,469,000$
Less: Interest-Bearing Debt (49,249,000) (49,249,000) (49,249,000)
Market Value of Equity From Operations 163,291,000$ 172,494,100$ 112,220,000$
Plus/Minus Non-Operating Assets/Liabilities 23,668,000 23,668,000 23,668,000
Value of Equity1
186,959,000$ 196,162,100$ 135,888,000$
Selected Weighting 0% 100% 0%
395
Weighted Value of Equity -$ 196,162,100$ -$
200,000,000$
1 We have once again intentionally omitted valuation discounts or premiums from this example.
ROUNDED EQUITY VALUE
Chapter 15

8/6/2015
199
Rules of Thumb and Alternative Methodologies
Rules of thumb do not provide “an amount and verifiability of data known about the similar investment.”
Most useful as a sanity check or correlation of value• Most useful as a sanity check, or correlation of value indications from other methods
• Based on general industry transactions metrics
Disadvantages of rules of thumb• Based on averages—not every subject company is
average• No access to the companies that were transacted• No access to the terms of the transactions
397
Example
A rule of thumb for gas stations is 1.5 to 3.5 times owner’s cash flow for the most recent 12 months, which yields the value of equipment, lease, and intangibles. After investigating the operations of XYZ Gas Services Co., you believe that the business deserves a multiple of 3.0 times owner’s cash flow. Given the information on the next slide,what is the value of equity for XYZ Gas Services based on the rule of thumb?
398

8/6/2015
200
Example – Rule of Thumb
200A 200B 200CRevenue 1,000,000 1,500,000 2,000,000Cost of Sales 700,000 1,000,000 1,500,000Operating Expense 200,000 300,000 350,000Owners’ Cash Flow 150,000 225,000 200,000Current AssetsCash 4,000 6,000 7,000Inventory 65,000 70,000 90,000
Total Current Assets 69,000 76,000 97,000
399
Net Fixed Assets 25,000 30,000 35,000Total Assets 94,000 106,000 132,000Liabilities 20,000 25,000 32,000Equity 74,000 81,000 100,000
Answer
Owners’ Cash Flow $200,000 x 3.0 = $600,000
+ Cash 7,000
+ Inventory 90,000
– Liabilities (32,000)
= Equity $665,000
400

8/6/2015
201
Prior Transactionsin the Subject Company Stock
Basis of arm’s length transactions. An actual transaction is more compelling than a simple buy-sell agreement.
• Buyouts of former shareholders may not be at fair market value, or have related consulting agreements that must be considered.
• If the company merged with a competitor in a control transaction, the deal may include synergies.
401
Prior Transactionsin the Subject Company Stock
If the transaction was based on a buy-sell, shareholder, or employee agreement, the terms must be analyzed in the context of the agreement.
• Control transactions and acquisitions of other companies are more likely to be arm’s-length deals. Time lapses must be accounted for and reconciled.
• Minority transactions, especially between family members or in the case of retiring or deceased shareholders, should be given close scrutiny.
402

8/6/2015
202
Prior Transactionsin the Subject Company Stock
Timeliness is often a problem, given that these transactions may be dated and reflect external and internal circumstances far different than those of the valuation date.
403
Buy-Sell Agreements
Legal agreement between owners, which stipulates the price, and terms under which an owner can sell hisprice, and terms under which an owner can sell his ownership interest. It is considered part of the market approach since, for the agreement to be applicable, must be based on arms’ length negotiated terms.
Common in smaller companies with a relatively small number of shareholders; also common as a component of a shareholder or partners’ agreements. Section 2703 p gof the Internal Revenue Code discusses elements of a reliable buy-sell agreement.
404

8/6/2015
203
Buy-Sell Agreements
Often the terms of the buy-in or buy-out are not at fair market value since some other motive was the drivingmarket value since some other motive was the driving force behind the agreement, such as locking in partners to a long-term commitment.
If the terms of the agreement were intended to be at fair market, and the formula(s) in the agreement are judged to be legitimate, the agreement may be binding.
405
Bona Fide Offers to BuyA bona fide offer is viewed as a good faith, authentic, genuine offer from a qualified buyer who has the intention and capacity of consummating the offer at the level proposed.p p
• May or may not provide an arm’s-length basis, since offers can come from friendly outside buyers or insiders (e.g., family).
• Most offers from outside buyers reflect whole company (control) situations. In public company situations with buyers wishing to acquire more than 5% of the outstanding shares, an SEC form 13D must be filed.
• Offers for privately held companies are often not consummated andOffers for privately held companies are often not consummated, and may not be reasonable indications of value despite their bona fide status. On the other hand, a rejected, but bona fide, offer may provide insight into a minimum value.
406

8/6/2015
204
Bona Fide Offers to Buy
Offers often reflect investment (or strategic) valueOffers often reflect investment (or strategic) value considerations, such as synergies and potential economies of scale.
Terms are often variable, and may incorporate employment agreements and agreements not to compete.
Timeliness is often a problem, given that offers may be dated and reflect external and internal circumstances different than those of the valuation date.
407
Company Acquisitions
Subject companies often make acquisitions of similar companies during periods of expansion.
The terms and multiples provide an indication of value reflecting subject company’s owner/management view of similar property value, but may not be conclusive evidence of current value of the subject company as a whole.
408

8/6/2015
205
Company Acquisitions
Prior acquisitions reflect different economic and industry circumstances.
Incorporation of the new divisions or operations may require time to absorb.
Economies of scale and synergies are often the result of acquisitions.
409

Appendix E USPAP Standards 9 and 10
STANDARD 9
U-60 USPAP 2014-2015 Edition The Appraisal Foundation
STANDARD 9: BUSINESS APPRAISAL, DEVELOPMENT 1925
In developing an appraisal of an interest in a business enterprise or intangible asset, an appraiser must 1926
identify the problem to be solved, determine the scope of work necessary to solve the problem, and 1927
correctly complete the research and analyses necessary to produce a credible appraisal. 1928
Comment: STANDARD 9 is directed toward the substantive aspects of developing a credible 1929
appraisal of an interest in a business enterprise or intangible asset. 1930
In developing an appraisal of an interest in a business enterprise or intangible asset, an appraiser must: 1932
Standards Rule 9-1 1931
(a) be aware of, understand, and correctly employ those recognized approaches, methods and 1933
procedures that are necessary to produce a credible appraisal; 1934
Comment
(b) not commit a substantial error of omission or commission that significantly affects an appraisal; 1939
and 1940
: Changes and developments in the economy and in investment theory have a 1935
substantial impact on the business and intangible asset appraisal profession. Important 1936
changes in the financial arena, securities regulation, financial reporting requirements, and law 1937
may result in corresponding changes in appraisal theory and practice. 1938
Comment
(c) not render appraisal services in a careless or negligent manner, such as by making a series of 1945
errors that, although individually might not significantly affect the results of an appraisal, in the 1946
aggregate affect the credibility of those results. 1947
: An appraiser must use sufficient care to avoid errors that would significantly affect 1941
his or her opinions and conclusions. Diligence is required to identify and analyze the factors, 1942
conditions, data, and other information that would have a significant effect on the credibility 1943
of the assignment results. 1944
Comment: Perfection is impossible to attain, and competence does not require perfection. 1948
However, an appraiser must not render appraisal services in a careless or negligent manner. 1949
This Standards Rule requires an appraiser to use due diligence and due care. 1950
In developing an appraisal of an interest in a business enterprise or intangible asset, an appraiser must: 1952
Standards Rule 9-2 1951
(a) identify the client and other intended users;70
(b) identify the intended use of the appraiser’s opinions and conclusions;
1953
711954
Comment
(c) identify the standard (type) and definition of value and the premise of value; 1957
: An appraiser must not allow the intended use of an assignment or a client’s 1955
objectives to cause the assignment results to be biased. 1956
70 See Statement on Appraisal Standards No. 9, Identification of Intended Use and Intended Users. 71 See Statement on Appraisal Standards No. 9, Identification of Intended Use and Intended Users.

STANDARD 9
USPAP 2014-2015 Edition U-61 The Appraisal Foundation
(d) identify the effective date of the appraisal; 1958
(e) identify the characteristics of the subject property that are relevant to the standard (type) and 1959
definition of value and intended use of the appraisal, including: 1960
(i) the subject business enterprise or intangible asset, if applicable; 1961
(ii) the interest in the business enterprise, equity, asset, or liability to be valued; 1962
Comment
(iii) all buy-sell and option agreements, investment letter stock restrictions, restrictive 1965
corporate charter or partnership agreement clauses, and similar features or factors that 1966
may have an influence on value; 1967
: The interest to be valued may represent all ownership rights or a subset 1963
of those rights, such as a specific right to use the asset. 1964
(iv) the extent to which the interest contains elements of ownership control; and 1968
Comment
(v) the extent to which the interest is marketable and/or liquid; 1971
: The elements of control in a given situation may be affected by law, 1969
distribution of ownership interests, contractual relationships, and many other factors. 1970
Comment on (i)-(v)
The information used by an appraiser to identify the property characteristics must be from 1974
sources the appraiser reasonably believes are reliable. 1975
: An appraiser must identify the attributes of the interest being appraised, 1972
including the rights and benefits of ownership. 1973
(f) identify any extraordinary assumptions necessary in the assignment; 1976
Comment
• it is required to properly develop credible opinions and conclusions;1978
: An extraordinary assumption may be used in an assignment only if: 1977
• the appraiser has a reasonable basis for the extraordinary assumption;1979
• use of the extraordinary assumption results in a credible analysis; and1980
• the appraiser complies with the disclosure requirements set forth in USPAP for1981
extraordinary assumptions.1982
(g) identify any hypothetical conditions necessary in the assignment; and 1983
Comment
• use of the hypothetical condition is clearly required for legal purposes, for purposes1985
of reasonable analysis, or for purposes of comparison;1986
: A hypothetical condition may be used in an assignment only if: 1984
• use of the hypothetical condition results in a credible analysis; and1987
• the appraiser complies with the disclosure requirements set forth in USPAP for1988
hypothetical conditions.1989
2638
2639
2640

STANDARD 9
U-62 USPAP 2014-2015 Edition The Appraisal Foundation
(h) determine the scope of work necessary to produce credible assignment results in accordance with 1990
the SCOPE OF WORK RULE.72 1991
In developing an appraisal of an equity interest in a business enterprise with the ability to cause 1993
liquidation, an appraiser must investigate the possibility that the business enterprise may have a higher 1994
value by liquidation of all or part of the enterprise than by continued operation as is. If liquidation of all 1995
or part of the enterprise is the indicated premise of value, an appraisal of any real property or personal 1996
property to be liquidated may be appropriate. 1997
Standards Rule 9-3 1992
Comment: This Standards Rule requires the appraiser to recognize that continued operation of 1998
a business is not always the best premise of value because liquidation of all or part of the 1999
enterprise may result in a higher value. However, this typically applies only when the business 2000
equity being appraised is in a position to cause liquidation. If liquidation of all or part of the 2001
enterprise is the appropriate premise of value, the scope of work may include an appraisal of 2002
real property or tangible personal property. If so, competency in real property appraisal 2003
(STANDARD 1) or tangible personal property appraisal (STANDARD 7) is required. 2004
In developing an appraisal of an interest in a business enterprise or intangible asset, an appraiser must 2006
collect and analyze all information necessary for credible assignment results. 2007
Standards Rule 9-4 2005
(a) An appraiser must develop value opinion(s) and conclusion(s) by use of one or more approaches 2008
that are necessary for credible assignment results. 2009
(b) An appraiser must, when necessary for credible assignment results, analyze the effect on value, if 2010
any, of: 2011
(i) the nature and history of the business enterprise or intangible asset; 2012
(ii) financial and economic conditions affecting the business enterprise or intangible asset, 2013
its industry, and the general economy; 2014
(iii) past results, current operations, and future prospects of the business enterprise; 2015
(iv) past sales of capital stock or other ownership interests in the business enterprise or 2016
intangible asset being appraised; 2017
(v) sales of capital stock or other ownership interests in similar business enterprises; 2018
(vi) prices, terms, and conditions affecting past sales of similar ownership interests in the 2019
asset being appraised or a similar asset; and 2020
(vii) economic benefit of tangible and intangible assets. 2021
Comment on (i)-(vii)
72 See Advisory Opinion 28, Scope of Work Decision, Performance, and Disclosure, and Advisory Opinion 29, An Acceptable Scope of Work.
: This Standards Rule directs the appraiser to study the prospective and 2022
retrospective aspects of the business enterprise and to study it in terms of the economic and 2023
industry environment within which it operates. 2024

STANDARD 9
USPAP 2014-2015 Edition U-63 The Appraisal Foundation
(c) An appraiser must, when necessary for credible assignment results, analyze the effect on value, if 2025
any, of buy-sell and option agreements, investment letter stock restrictions, restrictive corporate 2026
charter or partnership agreement clauses, and similar features or factors that may influence 2027
value. 2028
(d) An appraiser must, when necessary for credible assignment results, analyze the effect on value, if 2029
any, of the extent to which the interest appraised contains elements of ownership control and is 2030
marketable and/or liquid. 2031
Comment
Equity interests in a business enterprise are not necessarily worth the pro rata share of the 2034
business enterprise interest value as a whole. Also, the value of the business enterprise is not 2035
necessarily a direct mathematical extension of the value of the fractional interests. The degree 2036
of control, marketability and/or liquidity or lack thereof depends on a broad variety of facts 2037
and circumstances that must be analyzed when applicable. 2038
: An appraiser must analyze factors such as holding period, interim benefits, and the 2032
difficulty and cost of marketing the subject interest. 2033
In developing an appraisal of an interest in a business enterprise or intangible asset, an appraiser must: 2040
Standards Rule 9-5 2039
(a) reconcile the quality and quantity of data available and analyzed within the approaches, 2041
methods, and procedures used; and 2042
(b) reconcile the applicability and relevance of the approaches, methods and procedures used to 2043
arrive at the value conclusion(s). 2044
Comment: The value conclusion is the result of the appraiser’s judgment and not necessarily 2045
the result of a mathematical process. 2046
STANDARD 10
U-64 USPAP 2014-2015 Edition The Appraisal Foundation
In reporting the results of an appraisal of an interest in a business enterprise or intangible asset, an 2048
appraiser must communicate each analysis, opinion, and conclusion in a manner that is not misleading. 2049
STANDARD 10: BUSINESS APPRAISAL, REPORTING 2047
Comment
STANDARD 10 does not dictate the form, format, or style of business or intangible asset 2053
appraisal reports, which are functions of the needs of intended users and appraisers. The 2054
substantive content of a report determines its compliance. 2055
: STANDARD 10 addresses the content and level of information required in a report that 2050
communicates the results of an appraisal of an interest in a business enterprise or intangible asset 2051
developed under STANDARD 9. 2052
Each written or oral appraisal report for an interest in a business enterprise or intangible asset must: 2057
Standards Rule 10-1 2056
(a) clearly and accurately set forth the appraisal in a manner that will not be misleading; 2058
(b) contain sufficient information to enable the intended user(s) to understand the report; and 2059
(c) clearly and accurately disclose all assumptions, extraordinary assumptions, hypothetical 2060
conditions, and limiting conditions used in the assignment. 2061
Each written appraisal report for an interest in a business enterprise or intangible asset must be 2063
prepared in accordance with one of the following options and prominently state which option is used: 2064
Appraisal Report or Restricted Appraisal Report. 2065
Standards Rule 10-2 2062
Comment: When the intended users include parties other than the client, an Appraisal Report 2066
must be provided. When the intended users do not include parties other than the client, a 2067
Restricted Appraisal Report may be provided. 2068
The essential difference between these options is in the content and level of information 2069
provided. The appropriate reporting option and the level of information necessary in the 2070
report are dependent on the intended use and intended users. 2071
An appraiser must use care when characterizing the type of report and level of information 2072
communicated upon completion of an assignment. An appraiser may use any other label in 2073
addition to, but not in place of, the label set forth in this Standard for the type of report 2074
provided. 2075
The report content and level of information requirements set forth in this Standard are 2076
minimums for both types of report. 2077
A party receiving a copy of an Appraisal Report or Restricted Appraisal Report does not 2078
become an intended user of the appraisal unless the appraiser identifies such party as an 2079
intended user as part of the assignment. 2080
(a) The content of an Appraisal Report must be consistent with the intended use of the appraisal 2081
and, at a minimum: 2082

STANDARD 10
USPAP 2014-2015 Edition U-65 The Appraisal Foundation
(i) state the identity of the client and any other intended users, by name or type;73
Comment: An appraiser must use care when identifying the client to ensure a clear 2084
understanding and to avoid violations of the Confidentiality section of the ETHICS 2085
RULE. In those rare instances when the client wishes to remain anonymous, an 2086
appraiser must still document the identity of the client in the workfile but may omit 2087
the client’s identity in the report. 2088
2083
(ii) state the intended use of the appraisal;74
(iii) summarize information sufficient to identify the business or intangible asset and the 2090
interest appraised; 2091
2089
Comment: The identification information must include property characteristics 2092
relevant to the type and definition of value and intended use of the appraisal. 2093
(iv) state the extent to which the interest appraised contains elements of ownership control, 2094
including the basis for that determination; 2095
(v) state the extent to which the interest appraised lacks elements of marketability and/or 2096
liquidity, including the basis for that determination; 2097
(vi) state the standard (type) and definition of value and the premise of value and cite the 2098
source of the definition; 2099
Comment: Stating the definition of value also requires any comments needed to 2100
clearly indicate to the intended users how the definition is being applied. 2101
(vii) state the effective date of the appraisal and the date of the report; 2102
Comment: The effective date of the appraisal establishes the context for the value 2103
opinion, while the date of the report indicates whether the perspective of the 2104
appraiser on the market or property as of the effective date of the appraisal was 2105
prospective, current, or retrospective. 2106
(viii) summarize the scope of work used to develop the appraisal;75
Comment: Because intended users’ reliance on an appraisal may be affected by the 2108
scope of work, the report must enable them to be properly informed and not misled. 2109
Sufficient information includes disclosure of research and analyses performed and 2110
might also include disclosure of research and analyses not performed. 2111
2107
When any portion of the work involves significant business and/or intangible asset 2112
appraisal assistance, the appraiser must summarize the extent of that assistance. The 2113
name(s) of those providing the significant business and/or intangible asset appraisal 2114
73 See Statement on Appraisal Standards No. 9, Identification of Intended Use and Intended Users. 74 See Statement on Appraisal Standards No. 9, Identification of Intended Use and Intended Users. 75 See Advisory Opinion 28, Scope of Work Decision, Performance, and Disclosure, and Advisory Opinion 29, An Acceptable Scope of
Work.

STANDARD 10
U-66 USPAP 2014-2015 Edition The Appraisal Foundation
assistance must be stated in the certification, in accordance with Standards Rule 10-2115
3.76
(ix) summarize the information analyzed, the appraisal procedures followed, and the 2117
reasoning that supports the analyses, opinions, and conclusions; exclusion of the market 2118
approach, asset-based (cost) approach, or income approach must be explained; 2119
2116
Comment: An Appraisal Report must include sufficient information to indicate that 2120
the appraiser complied with the requirements of STANDARD 9. The amount of 2121
detail required will vary with the significance of the information to the appraisal. 2122
The appraiser must provide sufficient information to enable the client and intended 2123
users to understand the rationale for the opinions and conclusions, including 2124
reconciliation in accordance with Standards Rule 9-5. 2125
(x) clearly and conspicuously: 2126
• state all extraordinary assumptions and hypothetical conditions; and2127
• state that their use might have affected the assignment results; and2128
2129
(xi) include a signed certification in accordance with Standards Rule 10-3. 2130
(b) The content of a Restricted Appraisal Report must be consistent with the intended use of the 2131
appraisal and, at a minimum: 2132
(i) state the identity of the client, by name or type;77
Comment: An appraiser must use care when identifying the client to ensure a clear 2137
understanding and to avoid violations of the Confidentiality section of the ETHICS 2138
RULE. In those rare instances when the client wishes to remain anonymous, an 2139
appraiser must still document the identity of the client in the workfile but may omit 2140
the client’s identity in the report. 2141
and state a prominent use restriction 2133
that limits use of the report to the client and warns that the rationale for how the 2134
appraiser arrived at the opinions and conclusions set forth in the report may not be 2135
understood properly without additional information in the appraiser’s workfile; 2136
The Restricted Appraisal Report is for client use only. Before entering into an 2142
agreement, the appraiser should establish with the client the situations where this 2143
type of report is to be used and should ensure that the client understands the 2144
restricted utility of the Restricted Appraisal Report. 2145
(ii) state the intended use of the appraisal;78
Comment: The intended use of the appraisal must be consistent with the limitation 2147
on use of the Restricted Appraisal Report option in this Standards Rule (i.e. client use 2148
only). 2149
2146
(iii) state information sufficient to identify the business or intangible asset and the interest 2150
appraised; 2151
76 See Advisory Opinion 31, Assignments Involving More than One Appraiser. 77 See Statement on Appraisal Standards No. 9, Identification of Intended Use and Intended Users. 78 See Statement on Appraisal Standards No. 9, Identification of Intended Use and Intended Users.

STANDARD 10
USPAP 2014-2015 Edition U-67 The Appraisal Foundation
Comment: The identification information must include property characteristics 2152
relevant to the type and definition of value and intended use of the appraisal. 2153
(iv) state the extent to which the interest appraised contains elements of ownership control, 2154
including the basis for that determination; 2155
(v) state the extent to which the interest appraised lacks elements of marketability and/or 2156
liquidity, including the basis for that determination; 2157
(vi) state the standard (type) of value and the premise of value, and cite the source of its 2158
definition; 2159
(vii) state the effective date of the appraisal and the date of the report; 2160
Comment: The effective date of the appraisal establishes the context for the value 2161
opinion, while the date of the report indicates whether the perspective of the 2162
appraiser on the market or property as of the effective date of the appraisal was 2163
prospective, current, or retrospective. 2164
(viii) state the scope of work used to develop the appraisal;79
Comment: Because the client’s reliance on an appraisal may be affected by the scope 2166
of work, the report must enable them to be properly informed and not misled. 2167
Sufficient information includes disclosure of research and analyses performed and 2168
might also include disclosure of research and analyses not performed. 2169
2165
When any portion of the work involves significant business and/or intangible asset 2170
appraisal assistance, the appraiser must state the extent of that assistance. The 2171
name(s) of those providing the significant business and/or intangible asset appraisal 2172
assistance must be stated in the certification, in accordance with Standards Rule 10-2173
3.80
(ix) state the appraisal procedures followed, state the value opinion(s) and conclusion(s) 2175
reached, and reference the workfile; exclusion of the market approach, asset-based 2176
(cost) approach, or income approach must be explained; 2177
2174
Comment: An appraiser must maintain a specific, coherent workfile in support of a 2178
Restricted Appraisal Report. The contents of the workfile must include sufficient 2179
information to indicate that the appraiser complied with the requirements of 2180
STANDARD 9 and for the appraiser to produce an Appraisal Report. 2181
(x) clearly and conspicuously: 2182
• state all extraordinary assumptions and hypothetical conditions; and2183
• state that their use might have affected the assignment results; and2184
79 See Advisory Opinion 28, Scope of Work Decision, Performance, and Disclosure and Advisory Opinion 29, An Acceptable Scope of Work.
80 See Advisory Opinion 31, Assignments Involving More than One Appraiser.

STANDARD 10
U-68 USPAP 2014-2015 Edition The Appraisal Foundation
(xi) include a signed certification in accordance with Standards Rule 10-3. 2185
Each written appraisal report for an interest in a business enterprise or intangible asset must contain a 2187
signed certification that is similar in content to the following form: 2188
Standards Rule 10-3 2186
I certify that, to the best of my knowledge and belief: 2189
— the statements of fact contained in this report are true and correct. 2190
— the reported analyses, opinions, and conclusions are limited only by the reported 2191
assumptions and limiting conditions and are my personal, impartial, and unbiased 2192
professional analyses, opinions, and conclusions. 2193
— I have no (or the specified) present or prospective interest in the property that is the 2194
subject of this report, and I have no (or the specified) personal interest with respect to 2195
the parties involved. 2196
— I have performed no (or the specified) services, as an appraiser or in any other capacity, 2197
regarding the property that is the subject of this report within the three-year period 2198
immediately preceding acceptance of this assignment. 2199
— I have no bias with respect to the property that is the subject of this report or to the 2200
parties involved with this assignment. 2201
— my engagement in this assignment was not contingent upon developing or reporting 2202
predetermined results. 2203
— my compensation for completing this assignment is not contingent upon the 2204
development or reporting of a predetermined value or direction in value that favors 2205
the cause of the client, the amount of the value opinion, the attainment of a stipulated 2206
result, or the occurrence of a subsequent event directly related to the intended use of 2207
this appraisal. 2208
— my analyses, opinions, and conclusions were developed, and this report has been 2209
prepared, in conformity with the Uniform Standards of Professional Appraisal Practice. 2210
— no one provided significant business and/or intangible asset appraisal assistance to the 2211
person signing this certification. (If there are exceptions, the name of each individual 2212
providing significant business and/or intangible asset appraisal assistance must be 2213
stated.) 2214
Comment
In an assignment that includes only assignment results developed by the business and/or 2218
intangible asset appraiser(s), any appraiser(s) who signs a certification accepts full 2219
responsibility for all elements of the certification, for the assignment results, and for the 2220
contents of the appraisal report. In an assignment that includes real property or personal 2221
property assignment results not developed by the business and/or intangible asset appraiser(s), 2222
any business and/or intangible asset appraiser(s) who signs a certification accepts full 2223
responsibility for the business and/or intangible asset elements of the certification, for the 2224
business and/or intangible asset assignment results, and for the business and/or intangible 2225
asset contents of the appraisal report. 2226
: A signed certification is an integral part of the appraisal report. An appraiser who 2215
signs any part of the appraisal report, including a letter of transmittal, must also sign this 2216
certification. 2217
When a signing appraiser(s) has relied on work done by appraisers and others who do not sign 2227
the certification, the signing appraiser is responsible for the decision to rely on their work. 2228
The signing appraiser(s) is required to have a reasonable basis for believing that those 2229
individuals performing the work are competent. The signing appraiser(s) also must have no 2230
reason to doubt that the work of those individuals is credible. 2231

STANDARD 10
USPAP 2014-2015 Edition U-69 The Appraisal Foundation
The names of individuals providing significant business and/or intangible asset appraisal 2232
assistance who do not sign a certification must be stated in the certification. It is not required 2233
that the description of their assistance be contained in the certification but disclosure of their 2234
assistance is required in accordance with Standards Rule 10-2(a)(vii) or 10-2(b)(vii), as 2235
applicable.81 2236
To the extent that it is both possible and appropriate, an oral appraisal report for an interest in a 2238
business enterprise or intangible asset must address the substantive matters set forth in Standards Rule 2239
10-2(a). 2240
Standards Rule 10-4 2237
Comment
81 See Advisory Opinion 31, Assignments Involving More than One Appraiser.
: See the RECORD KEEPING RULE for corresponding requirements. 2241
Appendix F History of the Business Valuation Committee

History of the BVC1
The Business Valuation Committee – Then and Now In December 1980, Dexter McBride, FASA and then Executive Vice President of the ASA, reached out to the credentialed IA members to inquire what the ASA could do for them and vice versa. In response to Dexter’s inquiry, ten IA ASAs responded in similar fashion: “ASA needs to consider business appraisal/valuation as a separate discipline, needs to market itself to the business valuation practitioner, needs to describe its present business valuation/appraisal members in its publications in the vernacular which is meaningful to outsiders.” Dexter’s request, and the responses from the respondents, planted the seed for the BV discipline that now is the largest discipline in the ASA. Not so surprisingly, in early 1981, those ten vocal members were appointed to a “National Ad Hoc Committee for Business Enterprise Valuation”. Those members were Jack Bakken (now FASA), John Hempstead, Mike Hill (now FASA), Fred Hintze, Jr., Jeff Jones, Yale Kramer, Scott McMullin, Shannon Pratt (now FASA), James Schilt, and Johnny Walker, FASA. 1981 Atlanta Conference Independently of the Ad Hoc Committee, Allan Lannom, Claire Donias, and Shannon Pratt were working with the ASA conference committee to offer a BV-centric program at the 1981 International Appraisers’ Conference in Atlanta. The continuous program that ran from 8:30 AM to 3:30PM was the first BV-specific education offering by the ASA. I am told it was standing room only. The First Committee Meeting In mid-summer, 1981, the members of the Ad Hoc Committee decided to meet in Denver. Five additional members were added to the committee for that meeting: Clair Donias (now FASA), Allan Lannom (now FASA), Larry Lipkin, Lynn McCrary, and Robert Myers. The 15 members of the Ad Hoc Committee represented over 20% of the 69 credentialed ASAs at the time in the IA discipline. During this initial meeting, the Ad Hoc Committee voted to change the discipline name to the Business Valuation Discipline and the committee name to the Business Valuation Committee (BVC). Jack Bakken was appointed the first chair by the others because of his name. What!?!?! Alphabetically, his name came first on the roster of the BVC members and, according to Jack’s cohorts at the time, “Emily Post, the arbiter of social behavior, had ruled that a committee formed without a chairman…was temporarily chaired by the first person on the list.” The ASA Board of Governors approved the resolutions changing the name of the discipline and the name of the committee in January, 1982. The First Advanced Business Valuation Conference
1 BV Success Issue 17-50 dated December 18, 2013 by Bob Morrison, ASA BV/IA

The First Advanced Business Valuation Conference was held in October 1982 in Philadelphia. Tuition was $250 per person. There were 72 registrants and 9 speakers. The program included eight sessions over two days. By this time, there were 78 designated BV members. Women in BV Leadership Carla Glass (now FASA) became the first woman to be elected to the BVC in 1989. She was followed by Mary McCarter (now FASA) in 1991. Carla also was the first woman to be elected as an officer of the BVC: Vice-Chair in 1993 and Chair in 1995. Today We have come a long way, baby! We now boast over 1,500 credentialed members in the BV discipline. We are the largest discipline in the ASA. The 2013 Advanced Business Valuation Conference attracted close to 300 attendees. While there are only 18 BVC members currently, there are another 10-15 BV candidates, AMs, and ASAs who volunteer on BVC and ASA committees and task forces. It is not a coincidence that the names of some of the pioneers of the BVC are the same names attached to the books and articles upon which we all rely every day. It is also not a coincidence that many of those folks are now Members of the ASA’s College of Fellows. We owe a lot of the credibility of our credential to these folks who unselfishly volunteered their time, energy, and knowledge for the betterment of the profession. Although it may not be evident, the BVC is at a crossroads. What will the next 31 years bring? How do we take our profession and, more specifically, the BVC and BV discipline of the ASA to the next level? Who will be the Bakkens, Glasses, and Pratts of that next era?