The climate science behind the numbers in the news Clare Bryden 15 June 2013.

AMERICAN ASSOCIATION OF WINE ECONOMISTS
AAWE WORKING PAPER No. 147
Business
THE BRITISH COLUMBIA WINE INDUSTRY: CAN IT COMPETE
WITH THE BIG GUYS?
Lee Cartier
Feb 2014 ISSN 2166-9112
www.wine-economics.org

The British Columbia Wine Industry: can it compete with the big guys?
Lee Cartier1
Abstract
In 1989, the Canada – United States Free Trade Agreement (FTA) was implemented and dramatically changed the course of the wine industry’s development in British Columbia (BC). The FTA forced the industry to make the transition from being highly protected, and inefficient, to a competitive market contender. Although considered initially to be a victim of the FTA, by 2010, the BC wine industry contributed $295.8 million to the BC economy, or 0.15% of provincial GDP, and provided 5,100 direct and indirect jobs; and is now considered by many to be a remarkable BC success story. This investigation traces the evolution of the industry from 2000 to 2010 by examining the structural changes that occurred in the industry’s value chain during that period. The study employs and industry cluster model to identify the relationships between the firms located in the Okanagan region. Results from the study show the growth in value added from all sectors of the value chain and identify several sources of the industry’s competitive advantage: extensive vertical integration, and a strong relationship to the tourism cluster. Conclusions are provided regarding the future challenges and opportunities facing the industry.
1 Okanagan School of Business, Okanagan College, 1000 KLO Road, Kelowna, British Columbia, V1P 1L2. E-‐mail: [email protected]

1
Introduction The year 1989 was the ‘Big Bang’ for the BC wine industry. In that year, the Canada/US Free
Trade Agreement (FTA) was signed and the industry began a massive industry transformation. In
1988, there were 3,400 acres of grapes in the Okanagan, producing 17,980 tons of grapes. One
year later, in 1989, only 1,147 acres remained, producing 3,619 tons of high quality grapes. The
ensuing industry transformation involved making the transition from a highly protected and
inefficient producer of bulk ‘vin ordinaire’ to the production of premium and super-premium
wines (Carew, 1998). In 1990, the BC Wine Act was enacted and the British Columbia Wine
Institute (BCWI) was established. The Vintners Quality Alliance (BC VQA) was introduced and
became the quality standard for BC wines1. The BC VQA program was selected as the vehicle
that would rebrand BC wine as a high quality product. In order to meet BC VQA standards, the
wine must be produced from 100% BC grapes. Wines that are a blend of BC grapes and
imported grapes or bulk wine cannot be certified as BC VQA.
With the introduction of BC VQA, everything changed. New methods of viticulture were needed
to produce vinifera grapes in high latitudes; wineries had to develop new ways of producing
exceptional wines made from high latitude grapes (cool climate oenology); new markets had to
be developed to receive these higher priced wines. The pace of innovation during this period was
remarkable, as new vineyards were planted, new wineries established and new wine varietals,
such as ‘ice wine’, were developed and introduced.
By 1999, over 3,000 acres had been replanted, bringing the total acreage to 4,184 acres, but
producing only 11,284 tons of grapes. Not only did the varieties of grape plantings change from
hybrid grapes to vinifera varieties, the reduced tonnage per acre, from 5.8 tons/acre to 2.7
tons/acre, reflected the reality that producing high quality wines put a ceiling on vineyard
production. This change radically altered the cost structure of the industry. In order to be
profitable, grape growers had to receive a much higher price for their grapes than prior to the
FTA, and wineries had to receive a much higher price for their wines.
In 2011, compared to other wine producing regions in North America, the BC wine industry is
relatively small. Data produced for the British Columbia Wine Institute is reproduced in Table 1.

2
Table 1: BC Wine Industry Comparison2
British Columbia
2011 Ontario
2009 Washington State
2010 California
2010 Acres 9,205 15,074 40,000 535,000 Number of Growers 705 500 350 4,600 Number of Wineries 229 146 655 3,364 The majority of the BC industry is located in the Okanagan region where 8,751 acres, or 88.7%
are located3. The small size of the BC industry, and its producers, places it at a comparative
disadvantage, in terms of economies of scale, relative to the US wine regions and Ontario. In
spite of this, the strong growth in the number of new Okanagan firms entering the industry
indicates their ability to achieve a competitive advantage. This research seeks to understand the
nature of that competitive advantage.
Methodology The economic analysis of the BC domestic wine industry value chain was developed entirely
from secondary data; no primary research was conducted. The labour and value added
calculations were prepared using a comprehensive economic model that was developed entirely
from secondary data sources. The main secondary sources of information used to develop the
model were provided by:
• The BC Liquor Distribution Branch (BCLDB) • The BC Wine Institute (BCWI) • The BC Ministry of Agriculture and Land (BCMAL) • The BC Wine Authority (BCWA) • BC Stats • Statistics Canada (Stats Canada)
A number of data tables were constructed from the data in these reports.
• Grape growing employment • Grape growing cost structure • Wine sales (dollars) • Wine sales (liters) • Winery labour • Winery cost structure • Retail channel sales

3
An economic model of the wine industry was then developed from the data tables. This model
provided the information required to complete the value chain analysis. The economic model
covers the 10-year period from 2000 to 2010.
Value Chain Analysis of the BC Wine industry Michael Porter’s industry cluster model was used as a framework to help understand the
competitive environment facing BC wine firms. Porter’s “competitiveness diamond” identifies
four determinates of competitive advantage: demand conditions, firm rivalry and strategy, related
and support industries, and factor conditions (Porter, 1990). This model was selected as it helps
to identify the relationships between the firms located in the Okanagan region: the interaction
between competitors; their relationships with support and related industries; and how they
interact with other firms in their associated value chains (Porter, 2003). The cluster approach to
understand industry competitiveness and rural development has also been used in other regions
(Delgado, Porter and Stern, 2010; Virkkala, 2007; Waites, 2000), and the wine industry in
California (Porter, Ketels, Miller and Bryden, 2004). Industry clusters foster innovation (Arikan,
2009), aid in opportunity recognition (Ozgen, 2011), and lead to strong regional performance
(Irshad, 2009).
The BC wine industry is comprised of three sectors:
1. the BC grape growers who produce the grapes, 2. the BC wineries that manufacture the wine, and 3. the winery retail stores that sell the finished wine.
The wine industry value chain is part of the region’s agricultural products cluster, and is
represented in Figure 1. This figure shows the relationship between the value chain sectors and
the four determinants of the agricultural products cluster.
4
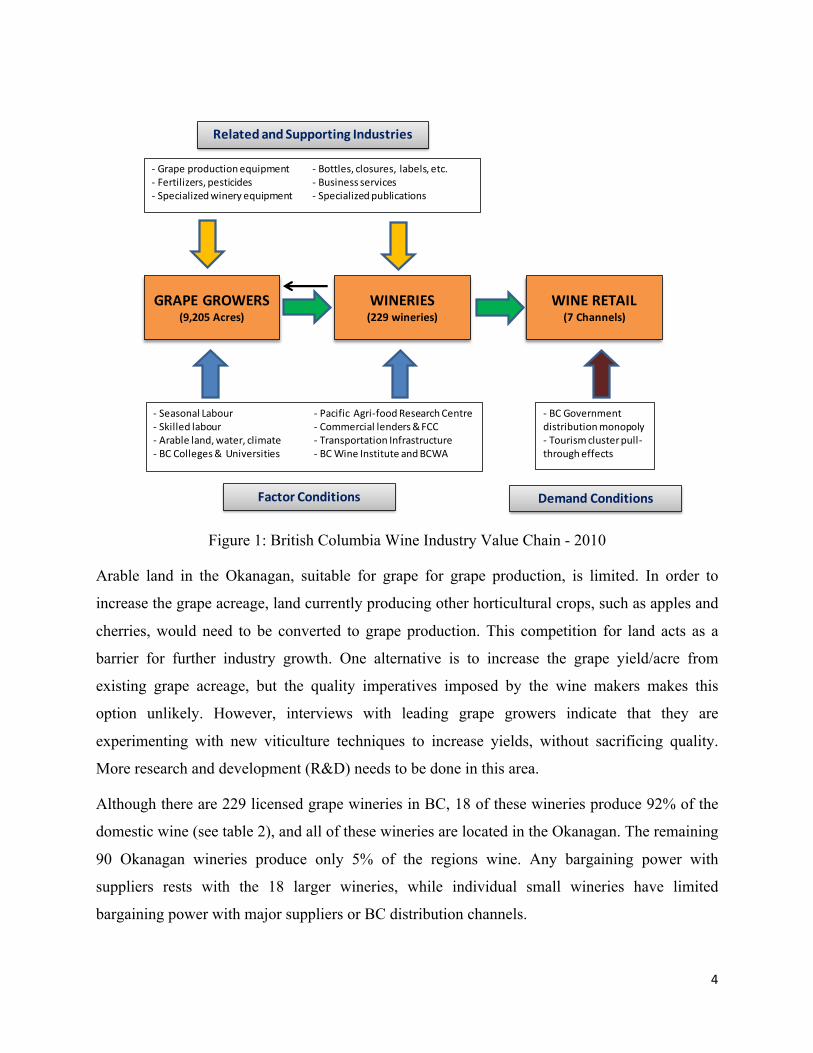
Figure 1: British Columbia Wine Industry Value Chain - 2010
Arable land in the Okanagan, suitable for grape for grape production, is limited. In order to
increase the grape acreage, land currently producing other horticultural crops, such as apples and
cherries, would need to be converted to grape production. This competition for land acts as a
barrier for further industry growth. One alternative is to increase the grape yield/acre from
existing grape acreage, but the quality imperatives imposed by the wine makers makes this
option unlikely. However, interviews with leading grape growers indicate that they are
experimenting with new viticulture techniques to increase yields, without sacrificing quality.
More research and development (R&D) needs to be done in this area.
Although there are 229 licensed grape wineries in BC, 18 of these wineries produce 92% of the
domestic wine (see table 2), and all of these wineries are located in the Okanagan. The remaining
90 Okanagan wineries produce only 5% of the regions wine. Any bargaining power with
suppliers rests with the 18 larger wineries, while individual small wineries have limited
bargaining power with major suppliers or BC distribution channels.
GRAPE GROWERS(9,205 Acres)
WINERIES(229 wineries)
WINE RETAIL(7 Channels)
-‐ Seasonal Labour-‐ Skilled labour-‐ Arable land, water, climate-‐ BC Colleges & Universities
-‐ Pacific Agri-‐foodResearch Centre-‐ Commercial lenders & FCC-‐ Transportation Infrastructure-‐ BC Wine Institute and BCWA
-‐ Grape production equipment-‐ Fertilizers, pesticides-‐ Specialized winery equipment
-‐ Bottles, closures, labels, etc. -‐ Business services-‐ Specialized publications
Related and Supporting Industries
Factor Conditions
-‐ BC Government distribution monopoly-‐ Tourism cluster pull-‐through effects
Demand Conditions
5
The retail sector is a Provincial monopoly. The BC Liquor Distribution Branch (BCLDB) is the
sole agent for the sale of all liquor products, both imported and domestic. The BCLDB sets the
price for all wine sold in the province. This price is established by applying a standard markup of
123% to the price paid to the wineries. This markup constitutes a distribution cost for the
wineries that choose to distribute through the BCLDB retail and wholesale outlets. The BCLDB
also issues licenses to six groups of independent business operators to resell wine. These agents
and licensees include the winery agency stores, cold wine and beer stores, BC VQA stores and
restaurants4.
Table 2: Okanagan Winery Groups
Number of Wineries
2010 Sales (Cases)
% of Market
Major wineries 3 2,790,786 83 Medium Sized Estate Wineries 16 301,216 9 Small Sized Estate Wineries 89 168,346 5 Total Okanagan Based Wineries 108 3,260,348 97 Non-‐Okanagan Wineries 121 105,176 3 Total Domestic Industry 229 3,365,524 100 All estate wineries, both large and small, operate their own wine shops. Wine sold though this
channel allows the winery to retain the 123% markup5. The challenge facing estate wineries
however, is how to attract customers to the ‘cellar door’ to purchase wine directly from the
winery store. There has been a tremendous amount of innovation around this marketing issue, as
winery proprietors struggle to attract visitors to wine shops located in remote areas of the
Okanagan.
The major innovation in attracting customers to the winery is the development of a strong
relationship with the Okanagan tourism cluster; this relationship has created a strong pull-
through effect for Okanagan wine. According to the Okanagan Wine Festivals Society, 250,000
tourists visited Wine Festivals events and wineries in 20106. Furthermore, demand for the
‘Okanagan wine experience’ is growing, as the number of people participating in Festival events
is steadily increasing. So to, is the number of Okanagan wineries becoming members in the
Society7. As tourists visit wineries and wine events, and become acquainted with the quality of
Okanagan wines, opportunities are created for wineries to begin exporting to other regions in

6
Canada and the world. The linkage between wine and tourism is not unique to the Okanagan.
Other wine regions in world also exploit this relationship (Mitchell and Schreiber, 2006; Mitchell
and van der Linden, 2010). Some research has been done on benchmarking wine tourism
development in the Okanagan (Getz and Brown, 2006); however, more work is needed on
differentiating the Okanagan wine tourism experience from other wine regions in North
America.
Growth and Market Structure of the BC Wine Industry Total BC wine consumption increased from 37.5 million litres in 2000 to 60.1 million litres in
20108. The domestic wine producer’s share of the market averaged 51% during this period; BC
imports as much wine as it produces locally. Although BC wine producers have not been
successful in capturing a greater share of the overall BC market, the composition of the market
changed significantly. The composition and sales of domestic wine from 2000-2010 is
represented in Figure 4.
Figure 4: BC Domestic Wine Sales9
0.0
5.0
10.0
15.0
20.0
25.0
0.0
50.0
100.0
150.0
200.0
250.0
2000 2001 2002 2003 2004 2005 2006 2007 2008 2009 2010
Litres (M
illions)
$ Millions
Year
Domestic Wine Sales
VQA (L) Cellared in Canada (L) VQA ($) Cellared in Canada ($)

7
BC VQA wines have gained considerable market share from domestic Cellared in Canada
products, almost doubling in volume sales from 15% in 2000 to 27% in 2010, while the BC
VQA share of dollar sales increased from 28% to 45%. This growth in BC VQA sales has come
from both the expansion of existing estate wineries, and the entry of new BC estate wineries.
Compound Annual Growth Rates for wine products, with a comparison to provincial GDP
growth are provided in Table 3. The dollar growth of the domestic industry has outperformed
Provincial GDP growth, and the growth of BC VQA products has significantly outpaced overall
industry growth, and growth of every other wine category.
Table 3: BC Wine Growth Rates
CAGR BC VQA ($)
12.0%
Cellared in Canada ($) 4.1% Domestic wine ($) 6.9% Wine imports ($) 5.4% Total BC wine ($) 6.1%
BC VQA (L)
11.6% Cellared in Canada (L) 3.5% Domestic wine (L) 5.2% Wine imports L) 4.5% Total BC wine (L) 4.8%
British Columbia GDP 4.5%
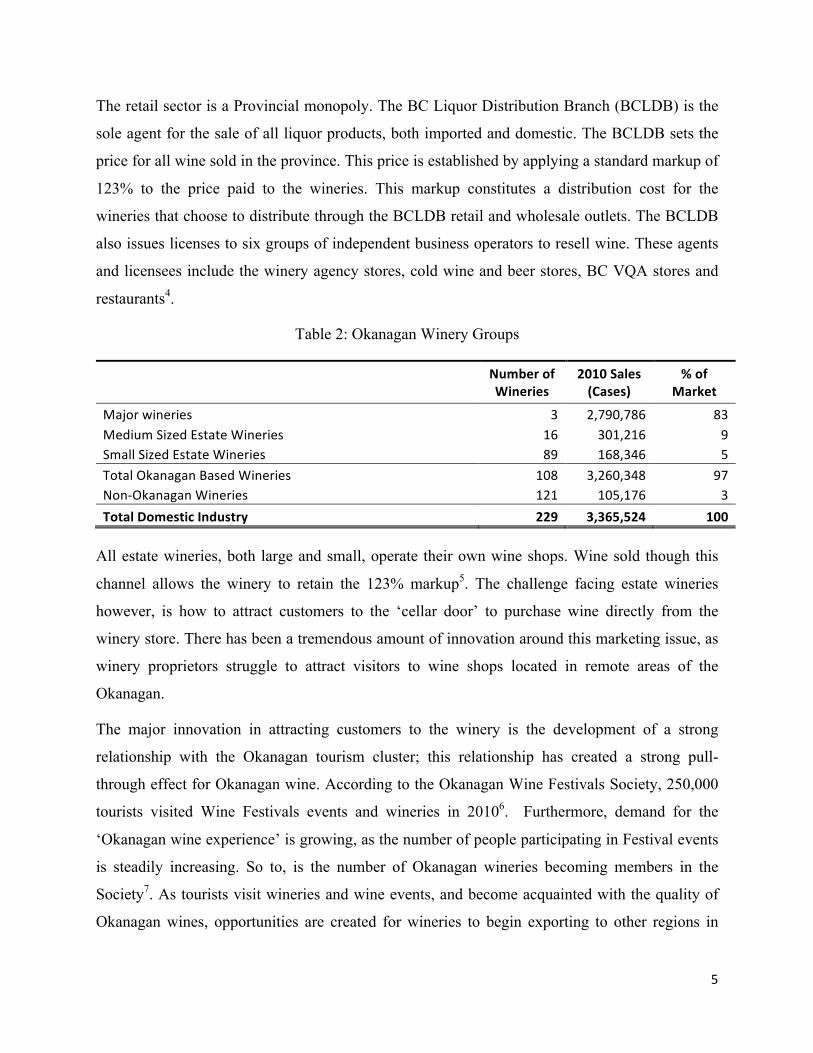
Wine industry Market Structure A strategic group map of the BC wine industry is presented in Figure 3.
8
Figure 3: Strategic Group Map for the year 2010
The two dimensions selected for the map are Perceived Value and Price per Litre. Perceived
value is the utility for the wine consumer. Utility is related to wine quality; higher utility is
associated with higher quality wines. Furthermore, quality is more than the physical
characteristics of the wine; it includes other intangible attributes such as brand (Gallo or
Yellowtail) and regional identity (Champagne or Bordeaux).
The map identifies three distinct strategic groups and the main competitors in each group. It also
reveals the competitive intensity between the groups. The closer the strategic groups are to each
other, the stronger the competitive rivalry. Examination of the map reveals that competition
between the ‘premium wine’ group and the ‘vin ordinaire’ group is very weak, whereas
competition is very strong between the ‘vin ordinaire’ and ‘mid-value wines’ strategic groups.
Low High
Percieved Value
25.1%
23.8%14.5%
13.7%
10.7%
4.7%
4.0% 2.6% 1.0%
Australia
USA
Italy
Chile
Argentina
Spain
South Africa
Germany
Other imports
Foreign Imports
Price pe
r Litre
30.00
20.00
10.00
Mid-‐value Wines
Vin ordinaire
12.4 million litres
26.1 million litres
22.8 million litres

9
The ‘premium wine’ group accounts for 12.4 million litres, and includes BC wines produced
under the BC VQA label (68.8%) and French imports (20.7%). Other competitors in this group
are New Zealand (7%) and Portugal (2.4%). The average retail price point for these wines is
$22.48/litre, with a range of $20.50 - $25.50. Some super premium wines sell at prices up to
$76.92/liter. BC VQA wines have been very successful in gaining and holding market share in
this most profitable strategic group.
The ‘mid-value wine’ group accounts for 26.1 million litres and is composed almost entirely of
imported wines. The group is quite fragmented, with no single country controlling more than
26% of the market. Australia (25.1%) and the US (23.8%) hold the largest market shares. Other
significant competitors are Italy (14.5%), Chile (13.7%), and Argentina (10.7%). The average
retail price point for these wines is $15.09/litre, with a range of $12.52 - $17.07/litre.
The ‘vin ordinaire’ group accounts for 22.8 million litres and is supplied almost exclusively by
the three largest Okanagan wineries; Okanagan medium and small size estate wineries do not
participate in this market. The wines included in this group are identified as ‘Cellared in Canada’
(CIC) product. CIC wines are a blend of wine produced from BC grapes and bulk wine or
concentrate imported from other countries. There is no minimum requirement for Canadian
grape content. These wines are branded under a number of labels and have an average retail price
point of $9.52/litre.
Value Chain Composition The BC wine industry value chain and value added contribution is provided in Figure 4.
Although value added increased from $143 million in 2000 to $296 in 2010, a CAGR of 7.5%,
the average value added contribution from each sector remained relatively constant: 9.8% from
grape growers, 24.5% from wineries, 65.7% from the retail sector.

10
Figure 4: Wine Industry Value Chain Composition
Grape Grower Sector The grape grower sector includes vineyards owned/leased by independent grape growers and
vineyards owned/leased by wineries. The composition of the vineyard ownership between 1999
and 2011 is provided in Appendix A1. Wineries owned or operated 62% of the grape acreage in
2011. The average size of the vineyard holdings is significantly larger for winery held vineyards:
29 acres for wineries compared to 6.6 acres for independent grape growers. Detailed vineyard
size distribution is provided in Appendix A2, A3, and Figure 5.
Figure 5: Vineyard Size Distribution
0%
5%
10%
15%
20%
25%
30%
35%
40%
0.00 – 3.00 3.01 – 5.00 5.01 – 10.00 10.01 – 20.00 20.01 – 40.00 > 40.00
Percen
t of T
otal
Number of Acres
Winery Owned Vineyards Independent Vineyards
11
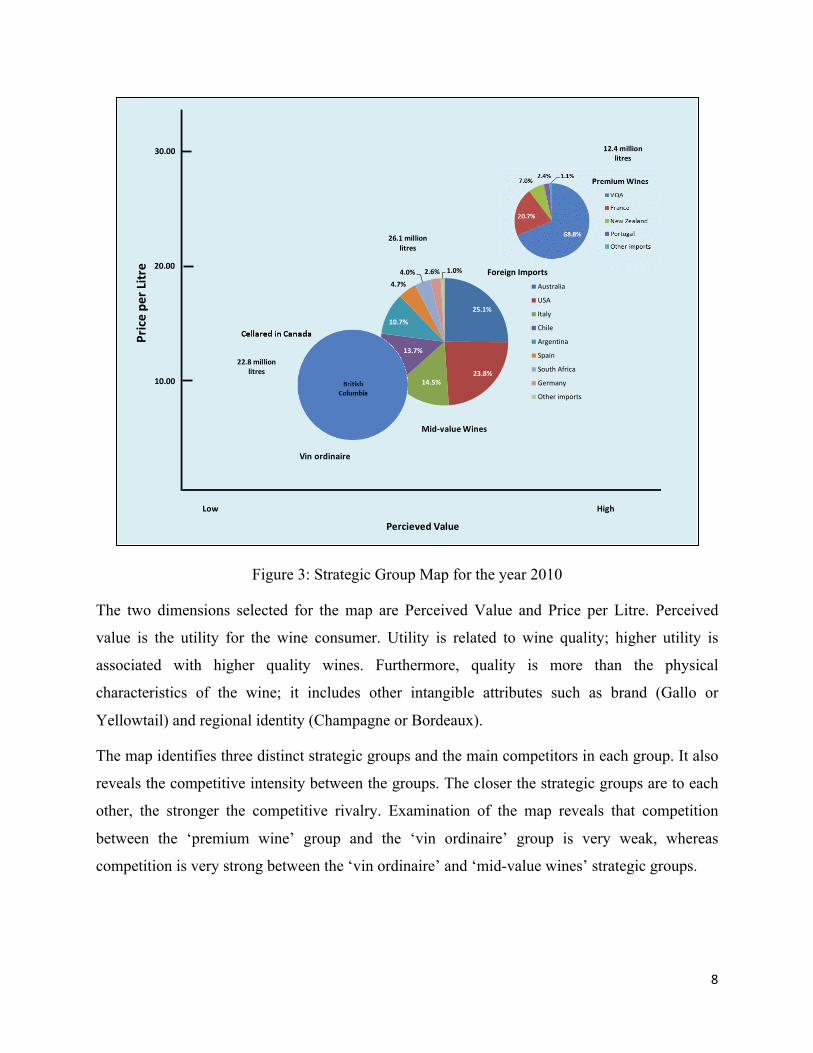
The grape acreage age composition is provided in Figure 6. The pace of new grape plantings
declined from 2000 to 2004 and then increased again through 2008.
Figure 6: Grape acreage age composition.
Grape establishment costs are very high. The cost to bring one acre of grapes into full production
can exceed $20,000/acre. Once in full production, grape cost, excluding harvest labour, can
exceed $3,800 per acre.
Grape production from BC vineyards increased from 10,022 tons in 2000 to 17,733 tons in 2010.
Average grape prices during this period increased from $1,413/ton to $2,195/ton, with red grapes
returning higher prices than white grapes, $2,481 to $1,911 respectively10. Grape production
costs are very high, averaging $1,712/ton. Production costs include the direct labour and
materials costs related to grape production and and the grape establishment costs for new grape
plantings. The cost structure and margins for the grape grower sector are provided in Figure 7.
These data do not distinguish between independent grape growers and winery owned vineyards.
0
1,000
2,000
3,000
4,000
5,000
6,000
7,000
8,000
9,000
10,000
2000 2001 2002 2003 2004 2005 2006 2007 2008 2009 2010
Acres
Year
Grape Acreage
1 year 2 Year 3 Year 4 Year > 4 Years

12
Figure 7: Grape Sector Cost Structure.
The sector losses that occurred in 2000 and 2005 reflect the high percentage of grape acreage
that was not yet in full production, rather than low grape prices returned to growers. In 2010,
17,733 tons of grapes produced 10.7 million litres of wine: 8.6 million litres of BC VQA and 2.1
million litres of non-BC VQA wine.
BC grape production capacity cannot meet demand. Currently, 9,000 acres supplies 34% of the
domestic production and 18% of the total BC market. Doubling the planted acreage to 18,000
acres could only supply 68% of the domestic wine production and 36% of total wine
consumption. British Columbia will always import wine from other countries.
Winery Sector The number of BC wineries increased from 65 in 2000 to 229 in 2010, a CAGR of 13.4%. A
summary of the composition of these wineries, by size, is provided in Table 4. These data show
that while there was some consolidation among major wineries, there was a significant increase
in the number of medium and small estate wineries.
Major winery consolidation occurred during this period through acquisition when Andrew Peller
Ltd. acquired Calona Wines Ltd. Although 19 major and medium estate wineries own 92.7% (2.8
13
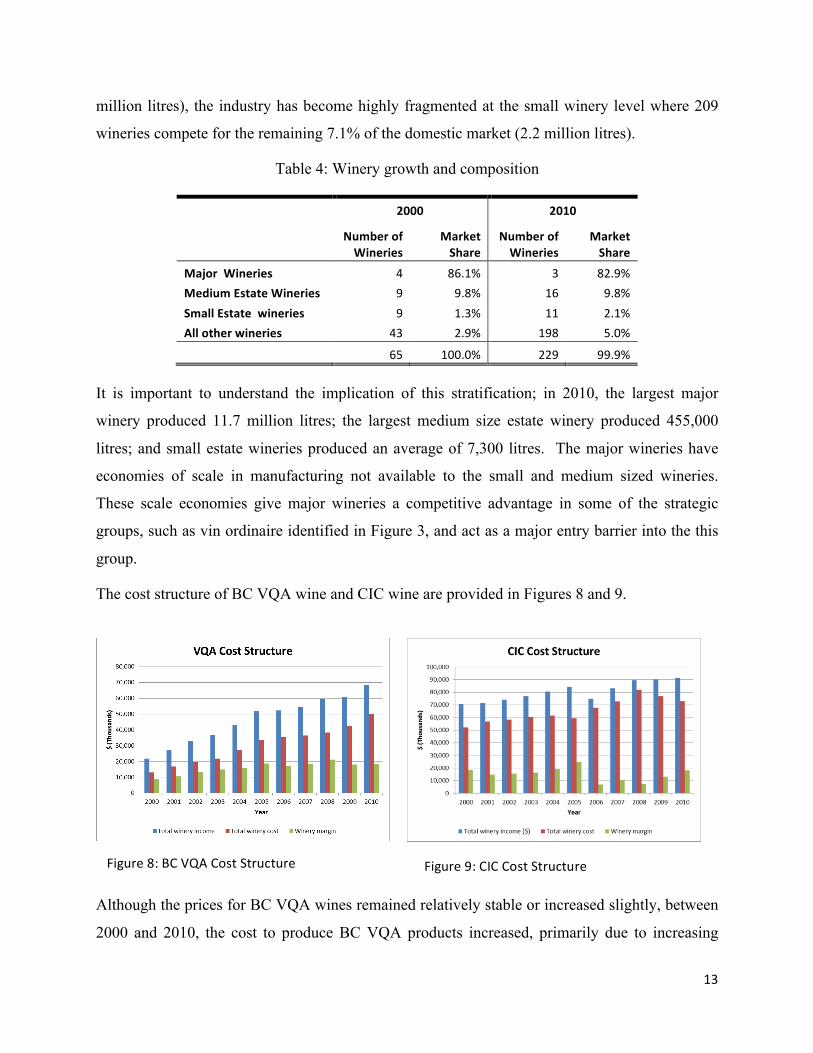
million litres), the industry has become highly fragmented at the small winery level where 209
wineries compete for the remaining 7.1% of the domestic market (2.2 million litres).
Table 4: Winery growth and composition
2000 2010
Number of Wineries
Market Share
Number of Wineries
Market Share
Major Wineries 4 86.1% 3 82.9% Medium Estate Wineries 9 9.8% 16 9.8% Small Estate wineries 9 1.3% 11 2.1% All other wineries 43 2.9% 198 5.0%
65 100.0% 229 99.9% It is important to understand the implication of this stratification; in 2010, the largest major
winery produced 11.7 million litres; the largest medium size estate winery produced 455,000
litres; and small estate wineries produced an average of 7,300 litres. The major wineries have
economies of scale in manufacturing not available to the small and medium sized wineries.
These scale economies give major wineries a competitive advantage in some of the strategic
groups, such as vin ordinaire identified in Figure 3, and act as a major entry barrier into the this
group.
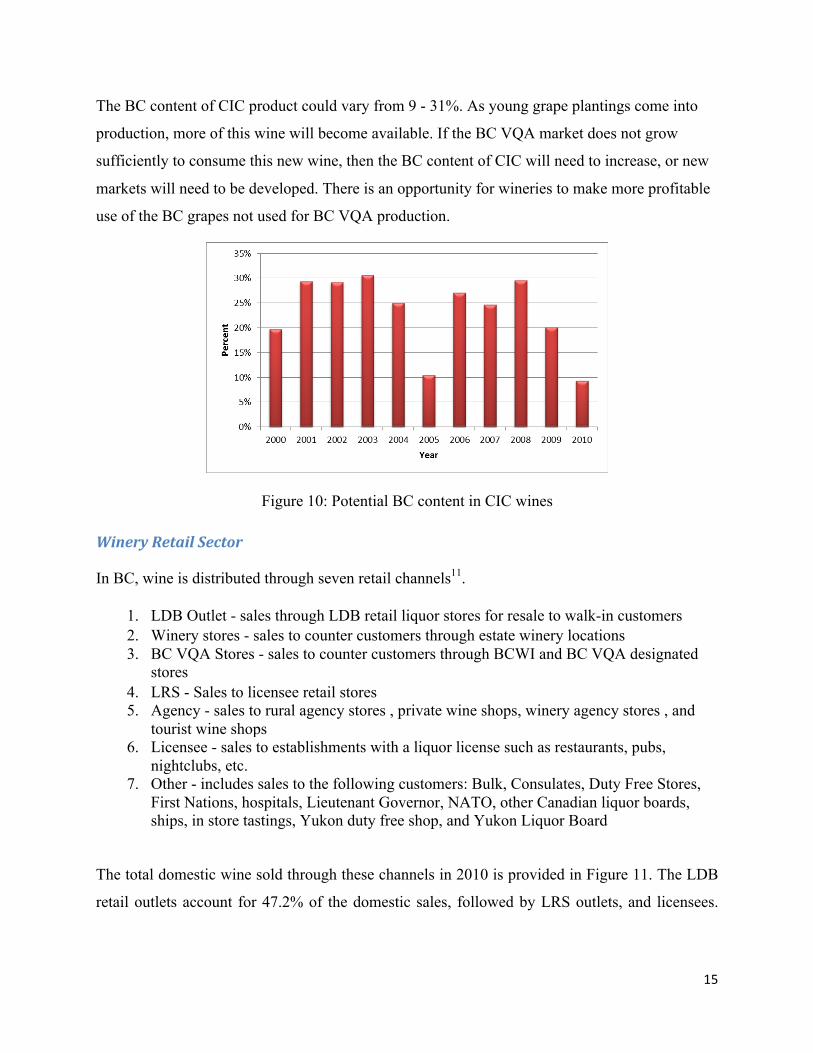
The cost structure of BC VQA wine and CIC wine are provided in Figures 8 and 9.
Although the prices for BC VQA wines remained relatively stable or increased slightly, between
2000 and 2010, the cost to produce BC VQA products increased, primarily due to increasing
Figure 8: BC VQA Cost Structure Figure 9: CIC Cost Structure

14
grape prices. These higher costs, and the monopoly structure of the retail sector, put downward
pressure on their margins. This, in turn, required those wineries producing BC VQA wines to
focus their attention on efficiency gains in manufacturing. CIC wines saw price declines in the
later part of the decade. These price declines, coupled with rising production costs, put
significant pressure on their margins, and may partially explain the consolidation and capacity
expansion that occurred during this period.
BC VQA remained far more profitable than CIC product during the decade. Table 5 shows the
per litre margins for these wines. CIC wines are produced by blending wine produced from BC
grapes with bulk wine or concentrate imported from other countries.
Table 5: Winery Cost Structure Summary
The higher cost associated with using BC grapes is a strong incentive to use imported wine rather
than local grapes. This is illustrated in Table 6. Given the low price returned for CIC product,
wine produced primarily from local grapes would have the lowest margin, and CIC produced by
rebottling bulk wine would show the highest margin.
Table 6: CIC Margin Analysis
BC Grapes Blended Imported CIC Price per litre to the winery 4.00 4.00 4.00 Average grape cost per litre 3.66 1.25 1.00 Materials cost per litre 1.81 1.72 1.71 Labour cost per litre 0.26 0.24 0.24 5.73 3.20 2.94 Margin per liter -‐1.73 0.80 1.06
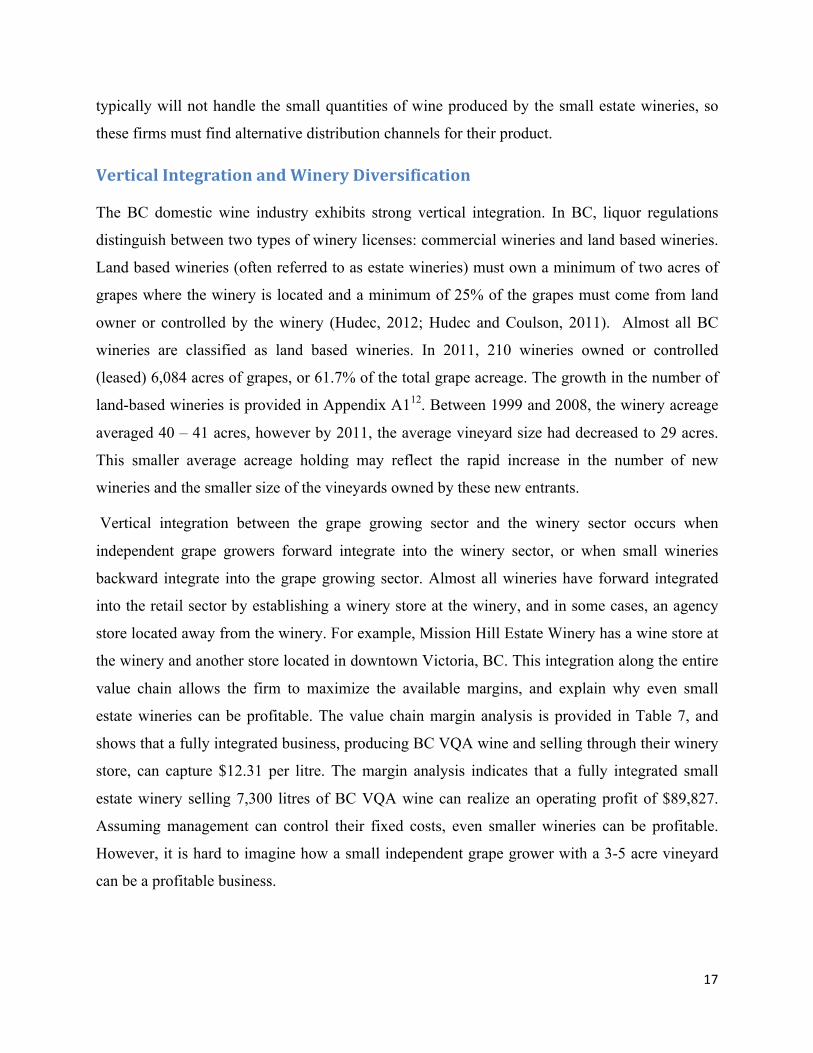
Data developed from the BCLDB market reviews and BCWI grape crush reports indicate that
more grapes are crushed than are used to produce BC VQA wines. In any year, between 2.1 and
5.3 million litres of wine is not used in BC VQA production. This wine may be used to produce
non-BC VQA wine, or blended to produce CIC product. The potential BC content in CIC
product, assuming all of the non-BC VQA wine was used for blending is shown in Figure 10.
BC VQA CIC Domestic Price per litre to the winery 8.07 4.00 5.11 Cost per litre 5.91 3.20 3.94 Margin per litre 2.16 0.80 1.17
15
The BC content of CIC product could vary from 9 - 31%. As young grape plantings come into
production, more of this wine will become available. If the BC VQA market does not grow
sufficiently to consume this new wine, then the BC content of CIC will need to increase, or new
markets will need to be developed. There is an opportunity for wineries to make more profitable
use of the BC grapes not used for BC VQA production.
Figure 10: Potential BC content in CIC wines
Winery Retail Sector In BC, wine is distributed through seven retail channels11.
1. LDB Outlet - sales through LDB retail liquor stores for resale to walk-in customers 2. Winery stores - sales to counter customers through estate winery locations 3. BC VQA Stores - sales to counter customers through BCWI and BC VQA designated
stores 4. LRS - Sales to licensee retail stores 5. Agency - sales to rural agency stores , private wine shops, winery agency stores , and
tourist wine shops 6. Licensee - sales to establishments with a liquor license such as restaurants, pubs,
nightclubs, etc. 7. Other - includes sales to the following customers: Bulk, Consulates, Duty Free Stores,
First Nations, hospitals, Lieutenant Governor, NATO, other Canadian liquor boards, ships, in store tastings, Yukon duty free shop, and Yukon Liquor Board
The total domestic wine sold through these channels in 2010 is provided in Figure 11. The LDB
retail outlets account for 47.2% of the domestic sales, followed by LRS outlets, and licensees.

16
Figure 13: Sector Composition for BC VQA -‐ 2010
Figure 12: Sector Composition for BC VQA - 2010
The remaining channels account for 11.8% of sales. Clearly, the LBD outlets control most of the
retail market in BC.
Figure 11: Retail Sector Composition - 2010
However, the composition of the retail sector is very different for BC VQA and CIC products.
Figures 12 and 13 show that while 55.1% of CIC product is sold through LDB retail outlets, only
26.2% of BC VQA wine is distributed through this channel; 61.8% is distributed through LRS
outlets, licensees, and winery stores. Furthermore, the share of BC VQA wine sold through LRS
outlets has increased from 16% in 2000, to 22% in 2010.
BC VQA channel selection and distribution is driven by two factors. First, land based wineries,
those that are located on vineyards and sell their wine through the winery store to winery visitors
and licensees are allowed to keep the 123% distribution markup. This creates a strong incentive
for estate wineries to distribute directly to the consumer. Second, the BCLDB retail outlets
17
typically will not handle the small quantities of wine produced by the small estate wineries, so
these firms must find alternative distribution channels for their product.
Vertical Integration and Winery Diversification The BC domestic wine industry exhibits strong vertical integration. In BC, liquor regulations
distinguish between two types of winery licenses: commercial wineries and land based wineries.
Land based wineries (often referred to as estate wineries) must own a minimum of two acres of
grapes where the winery is located and a minimum of 25% of the grapes must come from land
owner or controlled by the winery (Hudec, 2012; Hudec and Coulson, 2011). Almost all BC
wineries are classified as land based wineries. In 2011, 210 wineries owned or controlled
(leased) 6,084 acres of grapes, or 61.7% of the total grape acreage. The growth in the number of
land-based wineries is provided in Appendix A112. Between 1999 and 2008, the winery acreage
averaged 40 – 41 acres, however by 2011, the average vineyard size had decreased to 29 acres.
This smaller average acreage holding may reflect the rapid increase in the number of new
wineries and the smaller size of the vineyards owned by these new entrants.
Vertical integration between the grape growing sector and the winery sector occurs when
independent grape growers forward integrate into the winery sector, or when small wineries
backward integrate into the grape growing sector. Almost all wineries have forward integrated
into the retail sector by establishing a winery store at the winery, and in some cases, an agency
store located away from the winery. For example, Mission Hill Estate Winery has a wine store at
the winery and another store located in downtown Victoria, BC. This integration along the entire
value chain allows the firm to maximize the available margins, and explain why even small
estate wineries can be profitable. The value chain margin analysis is provided in Table 7, and
shows that a fully integrated business, producing BC VQA wine and selling through their winery
store, can capture $12.31 per litre. The margin analysis indicates that a fully integrated small
estate winery selling 7,300 litres of BC VQA wine can realize an operating profit of $89,827.
Assuming management can control their fixed costs, even smaller wineries can be profitable.
However, it is hard to imagine how a small independent grape grower with a 3-5 acre vineyard
can be a profitable business.

18
Table 7: Value Chain Margin Analysis
Winery Diversification Vertical integration has provided growth opportunities along the value chain, but a number of
factors are beginning to limit growth opportunities for existing medium sized estate wineries:
industry maturity, especially for BC VQA wine; availability and high cost of land suitable for
new grape plantings; and more new entrants competing for BC market share. To deal with these
limiting factors, existing estate wineries are exploring new avenues for growth.
A number of these wineries have now diversified into other industry value chains. These firms
have established restaurants at the winery. This diversification into the culinary tourism value
chain creates new opportunities to capture synergies across the wine industry, and tourism
industry value chains, and to create new opportunities to forward integrate into new export
markets.
The link to culinary arts and tourism provides a number of opportunities for innovation and
growth. Throughout the year, tourists attend a number of wine festival events. These events
typically showcase wine and food pairing activities, with both the chef and the wine maker in
attendance. In many ways, these wine festivals provide opportunities for visitors to “eat and
drink their way up and down the Okanagan Valley”. The winery restaurant offers an Okanagan
culinary experience unique to the Okanagan. When visitors come to the winery restaurant they
also visit the wine shop and purchase that ‘special’ wine they had with dinner.
Visiting a local winery to have a fine dining experience, and the opportunity to tour the vineyard
and winery, creates strong brand identity for Okanagan wines. To capitalize on this brand
recognition, these same wineries are now establishing agencies and distribution channels in the
provinces from which these visitors come, so that these same customers, after returning home,
Grape Sector
Winery Sector
Retail Sector Total
Price per litre 3.66 8.07 20.37 Labour and material cost 3.65 5.91 10.23 Operating margin per litre 0.01 2.16 10.14 12.31
Percent of margin per litre 0.1% 17.5% 82% 100%

19
can continue to purchase their ‘special’ wine at their local liquor outlet. Recent changes to
federal wine import regulations have now made it even easier for tourists to source their favorite
Okanagan wines.
Other examples of diversification include links to music, theatre, and other arts-related activities.
For example, during the summer months, The Vibrant Vine Winery hosts weekly music concerts
at the wine shop, where attendees listen to great music, socialize, and of course purchase Vibrant
Vine wines.
What relationships exist between rival firms, suppliers, customers and support industries? Business interdependence describes how Okanagan businesses relate to each other through the
buyer-supplier value chain. It looks at two aspects of this interdependence. First, it identifies
where a firm’s necessary supplies and services are produced, and second, how each business
relates to other businesses, either as competitors or partners. These relationships are discussed
under the four determinants of the industry cluster.
Demand Conditions Per capita wine consumption is increasing in Canada. Between 1993 and 2005, per capita
consumption has increased from 10.6 to 14.2 litres (Hope-Ross, 2006, as cited in Hira and
Bwenge, 2011), and is expected to continue into the future (Winesur, 2012). As these new
Canadian wine consumers enter the market, new opportunities for BC premium wines and CIC
products will continue to develop.
Firm Rivalry and Strategy The 89 small estate wineries primarily supply to the premium wine market in BC, both locally
and to the rest of the Province. The 16 medium estate wineries also supply the BC premium wine
market and compete aggressively with the small wineries for market share. They are also
beginning to export to new Canadian markets, but not to international markets. The large (major)
wineries supply both the premium wine market and the CIC market in both BC and the rest of
Canada. They compete aggressively with the small and medium wineries for the BC premium
wine market, and compete aggressively with each other for the CIC market. The small and
medium wineries do not participate in the CIC market, so they do not compete with the large

20
wineries in this market space. None of the rivals supply the mid-value wine market, which is
owned by foreign imports. Large wineries, such as Vincor International, supply this market from
their US operations and are therefore major importers to BC. It makes no sense for Vincor to
supply the mid-value market from their BC winery, since they would simply be in competition
with themselves; and clearly, the economies of scale available in their US operations give them a
competitive advantage over the small and medium estate wineries in the mid-value market.
Business model innovation occurs in making the link to tourism, early in the industry life cycle.
Firms that made this connection have been able to leverage their brand recognition through
forward integration into export to tourism markets (e.g. Alberta).
Support and Related Industries In the 2011, there were 495 independent grape growers in BC, most of which are located in the
Okanagan region. The independent growers operate 3,700 acres of vineyard, or 38% of the total
vineyard acreage. These vineyards are relatively small when compared to winery controlled
vineyards, 6.6 acres versus 29 acres respectively13.
The independent growers supply grapes, under contract, to the estate and major wineries.
Wineries producing premium wines require high quality grapes from the independent growers.
Growers unable to meet these quality standards are unable to secure a contract with the premium
wine producers. An alternative market for lower quality grapes is the major wineries that
produce CIC products. These small independent growers have little bargaining power with these
large wineries, especially when the major wineries can import bulk wine and wine grape
concentrate at $1.00/litre (the equivalent of $600/ton for grapes). As young grape planting come
into full production, grape tonnage is forecast to increase by 41,000 tons by 2015. How these
new grapes will be utilized is unclear. Although an additional 500,000 cases of wine could be
added to inventory, if the grape quality is inadequate for premium wine production, and if it costs
more than $600/ton to grow the grapes, how will might these grapes be used?
Factor Conditions Factor conditions such as: human resources, physical infrastructure, knowledge resources, and
capital resources are provided by organizations that comprise the foundation level. In the wine
industry, foundation organizations include: the BC Grape Growers Asociation (BCGG),

21
Okanagan Wine Festivals, BC Wine Institute (BCWI), BC Wine Authority (BCWA), BC LDB,
BC Ministry of Agriculture (BCMAL), Okanagan College, University of British Columbia –
Okanagan (UBCO), Pacific Agri-food Research Centre (PARC), local and regional government,
physical and natural infrastructure. These foundation organizations and infrastructure are critical
to the success of the agricultural products cluster. Industry firms look to them for a supply of
skilled workers, research and development, and other essential competitive assets. However,
Hira and Bwenge (2011) report that these foundation organizations are ineffective in supplying
essential human and knowledge resources to the cluster. For example, Okanagan College rates
1.4 on a 5 point scale for importance to the industry, UBCO and BCMAL rate only 1.9, and the
BCWI was rated the highest at 3.5 out of 5.
Conclusions This paper asks the question “Can the BC wine industry compete with the big guys?” Evidence
from this study indicates that the industry can indeed compete with the big European, U.S., and
Australian wineries. BC estate wineries have captured 69% of the BC premium wine segment,
and dominate the low priced vin-ordinaire segment.
Wineries supplying the premium wine segment may have achieved competitive advantage
through strong vertical integration. This integration allows the wineries to have strong control of
grape and wine quality, while maximizing their operating margins along the value chain. This is
somewhat different than the major wine producing regions whose wineries are not so strongly
integrated.
The strong relationship to BC tourism is another competitive advantage over imported wines.
The growth of wine tourism in the Okanagan region has created access to customers not
available to the imports, and is providing a springboard to markets outside of British Columbia.
The mid-sized estate wineries are moving aggressively in this direction as tourists become more
familiar with their wines, and the local BC market becomes more crowded.

22
Finally, BC will always import wine from other regions. The presence of these high quality
foreign wines will continue to force local wineries to become even more competitive, both in
terms of product quality, and production efficiency. The future for BC wines is bright, but not
without challenges. A number of opportunities and challenges are identified from this research.
Opportunities: Three opportunities for industry growth are identified.
1. Grow BC VQA premium wine sales: The aggressive development of linkages to wine
and culinary tourism can provide new opportunities to develop new export markets for
BC VQA wine.
2. Rebrand non-BC VQA portion of CIC wines as mid-value wines to raise the price
points and capture market share from imports: Rebranding non-BC VQA as ‘BC Wines
of Distinction’ using legal geographical indications (e.g. Okanagan Valley) could
increase BC value added by $6 – 14 million. BC Wines of distinction and geographical
indications are defined under the Agri-Food Choice and Quality Act (Wines Of Marked
Quality Regulation). The potential benefits of rebranding are: higher price points for BC
non-BC VQA wines, increased profitability and value-added in the winery sector, and
increased demand for BC grapes (both independent and winery controlled vineyards).
3. Aggressive development of the Canadian Market: Canadian per capita wine
consumption is increasing. As more Canadians begin to experience quality wines from
around the world, Okanagan wineries could capture ‘first mover advantage’ for these new
Canadian wine consumers.
Challenges: The challenges are identified under the four cluster determinants of industry competitiveness.
1. Demand Conditions (BC, Canada and International markets: The high tax and markup
structure imposed by the government retail monopoly undermines the margins available
to the wineries, and ultimately the grape growers. The presence of a strong tourism pull-
through effect, and increasing per capita wine consumption in Canada, creates not only
opportunities, but also brand building challenges for small and medium wineries.

23
2. Strategy and Rivalry (Grape growers and wineries): The industry is highly fragmented,
with limited industry goal alignment. Although cluster theory predicts relatively strong
interfirm cooperation, which leads to increased innovation, the data suggests that there is
little sharing of knowledge and innovation between small and medium wineries, and
independent grape growers.
3. Related and Supporting Industries (Suppliers): Imported bulk wine and grape
concentrate is blended with local grapes to produce CIC wines. The low cost for these
imports creates challenges for independent grape growers seeking markets for the
expected increase in grape production. There is also strong reliance on imports for critical
equipment, supplies, and specialized services.
4. Factor Conditions (Physical and knowledge infrastructure): The Okanagan region has a
limited supply of arable land suitable for producing quality grapes. Furthermore, the high
cost of this land limits vineyard expansion. Although the region has well developed post-
secondary education and research infrastructure, little of its capacity is devoted to the
wine industry. This constrains the wine industry’s knowledge development. There is also
a shortage of semi-skilled and skilled vineyard labour.
Recommendations from Industry Stakeholders Two industry workshops were held in February, 2013 to develop strategy around the
opportunities and challenges. A total of 38 participants attended representing all major
stakeholder groups. Participants were organized into work groups and each group selected one or
more strategic issues to work on. For each issue the groups were asked to identify: one or more
desired outcomes, one measurable target for each desired outcome, and one or more strategies to
achieve each desired outcome. The targets provide measurable goals to achieve and are
indicators of whether or not the strategy is working.
Throughout the workshop discussions, several overarching themes evolved around the Factor
Conditions of the Agricultural Products Cluster.
1. A general call for education and support was a highlight of most strategic issues;
especially the need for viticulture education. This indicates an overarching need for

24
applied skills, and a belief by the industry that this is a necessary requirement for industry
competitiveness and future growth.
2. A “higher profile” for the Okanagan region and its wine is also a repeated theme,
reflected by a call for an independent culinary school, a strong connection to tourism,
higher grape quality, and expansion into the BC mid-value wine segment.
3. A need for greater communication among small estate wineries, and among wineries in
general (Rival Firms on the cluster map) was a common theme. Often the request was for
facilitation, support, or leadership by better functioning Foundation Level organizations.
Acknowledgements This research received financial support from the British Columbia Wine Institute, and the
Natural Sciences and Engineering Research Council of Canada.
25
References Arikan, A. (2009). Interfirm Knowledge Exchanges and the Knowledge Creation Capability of
Clusters. Academy of Management Review, 34(4), 658-676. Carew, R. (1998). The British Columbia Wine Sector and the Canada-U.S. Free Trade
Agreement: Strengths and Opportunities. Review of Agricultural Economics-Volume 20, Number I-Pages 248-258. Retrieved from Okanagan College http://aepp.oxfordjournals.org/
Delgado, M., Porter, M. E., and Stern, S. (2010). Clusters and Entrepreneurship. Journal of
Economic Geography, 10(4), 495-518. doi: 10.1093/jeg/lbq010 Getz, D. and Brown, G. (2006). Benchmarking wine tourism development: The case of the
Okanagan Valley, British Columbia, Canada. International Journal of Wine Marketing, Vol. 18 No. 2, 2006, pp. 78-97, doi:10.1108/09547540610681077
Hira, A. and Bwenge, A. (2011). The Wine Industry in British Columbia: A Closed Wine But
Showing Potential. Publication in process. Hudec, A. (2012, February). Reforming BC Liquor Laws. Farris, Vaughn, Will and Murphy
LLP. Retrieved from: http://www.farris.com/images/uploads/ALH_PPT.pdf Hudec, A. and Coulson, S. (2011). BC Wine Law: A Brief Summary. Farris, Vaughn, Will and
Murphy LLP. Retrieved from: http://www.farris.com/images/uploads/ALH_-_Summary_of_BC_Wine_Law_for_Second_Annual_Wine_Law_Conference_in_BC.PDF
Irshad, H. (2009). Clusters – A Key to Rural Prosperity. Retrieved from the Government of
Alberta, Agriculture and Rural Development website: http://www1.agric.gov.ab.ca/$department/deptdocs.nsf/all/csi12897/$FILE/Clusters-%20A-key-to-Rural-Prosperity.pdf
Mitchell, R. and Schreiber, C. (2006). Barriers to Vertical Integration between the Wine and
Tourism Industries: The Case of Central Otago, New Zealand. 3rd International Wine Business Research Conference, Montpellier, 6-7-8 July 2006
Mitchell, R. and van der Linden, J. (2010). Adding value through cooperation: A study of the New Zealand food and wine tourism network. 5th International Academy of Wine Business Research Conference, 8-‐10 Feb. 2010 Auckland (NZ) Ozgen, E. (2011). Porter’s Diamond Model and Opportunity Recognition: A Cognitive
Perspective. Academy Of Entrepreneurship Journal, 17(2), 61-76. Porter, M, (1990). The Competitive Advantage of Nations. New York, NY: The Free Press.

26
Porter, M. (2003). The Economic Performance of Regions. Regional Studies, Vol. 37.6and7 pp. 549-578, August/October 2003. Doi:10.1080/0034340032000108688
Virkkala, S. (2007). Innovation and Networking in Peripheral Areas - A Case Study of
Emergence and Change in Rural Manufacturing. European Planning Studies, Vol. 15, No. 4, April 2007
Waits, M. (2000). The Added Value of the Industry Cluster Approach to Economic Analysis,
Strategy Development, and Service Delivery. Economic Development Quarterly, 14(1), 35-50.
Winesur (nd) Retrieved from http://www.winesur.com/news/per-capita-canadian-wine-
consumption-now-15-litres-a-year

27
Appendix A: Grape Grower Sector A1: Grape Acreage and Ownership Composition
1999 2004 2006 2008 2011 Acres of Wine Grapes 4,184 5,462 6,632 9,066 9,854 White Grape Acreage 54% 51% 48% 49% 48% Red Grape Acreage 46% 49% 52% 51% 52% Hybrid Grapes 4% 3% 2% 3% 4% Number of Vineyards 262 371 464 710 864 Number of Wineries 61 90 118 144 210 Winery Owned Acreage 59% 67% 70% 63% 62% Average Winery Holdings (acres) 41 41 40 40 29 Vineyards Number Acres % of Total B.C. Winery Owned/Operated Vineyards (210 wineries) 6,084 61.7% B.C. Independent Grower Vineyards (495 growers) 3,783 38.3%
A2: Winery Held Vineyard Size Distribution
Vineyard Size (acres) Number of Wineries
% by Number of Wineries
Total Acres by Vineyard Size % by Acreage
0.00 – 3.00 26 12.4% 50 0.8% 3.01 – 5.00 20 9.5% 85 14.0% 5.01 – 10.00 66 31.4% 477 7.8% 10.01 – 20.00 45 21.4% 661 10.9% 20.01 – 40.00 29 13.8% 848 13.9% > 40.00 24 11.5% 3,964 65.2% Totals 210 6,084 A3: Independent Grower Held Vineyard Size Distribution
Vineyard Size (acres) # of Vineyards % by Number of Vineyards
Total Acres by Vineyard Size % by Acreage
0.00 – 3.00 acres 179 33.9% 317 8.4% 3.01 – 5.00 acres 134 25.4% 532 14.1% 5.01 – 10.00 acres 140 26.5% 1,034 27.3% 10.01 – 20.00 acres 51 9.7% 656 17.3% 20.01 – 40.00 acres 15 2.8% 514 13.6% Over 40.00 acres 9 1.7% 730 19.3% Totals 528 3,783 Source: BC Wine Institute Grape Acreage Reports

28
Endnotes 1 Source: British Columbia Wine Institute: About BCWI. http://www.winebc.org/index.php. http://www.winebc.org/index.php 2 Source: 2011 B.C. Wine Grape Acreage Report, available from the British Columbia Wine Institute. http://www.winebc.org/index.php 3 The 2011 acreage report isolates the Okanagan and Similkameen regions. For this study, these regions have been combined. 4 Source: BC Liquor Distribution Branch. http://www.bcldb.com/ 5 Source: BC Liquor Distribution Branch. http://www.bcldb.com/ 6 Source: Blair Baldwin, Okanagan Wine Festivals Society 7 Source: Okanagan Wine Festival Society. http://www.thewinefestivals.com/ 8 Source: BC Liquor Distribution Branch Quarterly Market Reviews. http://www.bcldb.com/ 9 Source: BC Liquor Distribution Branch Quarterly Market Reviews. http://www.bcldb.com/ 10 Source: BC Wine Institute Grape Crush reports, available from the British Columbia Wine Institute. http://www.winebc.org/index.php 11 Source: BC Liquor Distribution Branch. http://www.bcldb.com/ 12 Source: 2011 B.C. Wine Grape Acreage Report, available from the British Columbia Wine Institute. http://www.winebc.org/index.php 13 Source: 2011 B.C. Wine Grape Acreage Report, available from the British Columbia Wine Institute. http://www.winebc.org/index.php