
América Móvil’s first quarter of 2017 financial and ... · page 2 • In peso terms, our net...
25
Carlos García-Moreno Chief Financial Officer [email protected] Daniela Lecuona Torras Investor Relations Office [email protected] América Móvil’s first quarter of 2017 financial and operating report Mexico City, April 25, 2017 - América Móvil, S.A.B. de C.V. (“América Móvil”) [BMV: AMX] [NYSE: AMX, AMOV] [LATIBEX: XAMXL], announced today its financial and operating results for the first quarter of 2017. • First quarter revenues were up 18.5% year-on-year in Mexican peso terms to 264 billion pesos, with EBITDA rising 15.8% to 72 billion pesos. At 27.1%, the EBITDA margin was slightly lower, 0.6 percentage points, than a year before. • At constant exchange rates service revenues were up 3.1% continuing their trend of steady sequential improvements seen since the second quarter of 2016. Although Mexico and Colombia made important contributions in this recovery, it was broad based. • EBITDA posted a 1.5% year-on-year increase at constant exchange rates— the first in eight quarters—representing a significant swing from the 8.1% de- crease observed in the prior quarter. Mexico, Brazil, Colombia and Peru were all important contributors to this sequential improvement. The acceleration in service revenue growth and the implementation of cost control policies over the last quarters underpinned the expansion of EBITDA. • Our wireless postpaid base was up 5.1% year-on-year at the end of March, having added 632 thousand subs in the first quarter, while the prepaid base was down 3.3% after net disconnections of 1.4 million subs, mostly as a re- sult of disconnections in the US under the SafeLink brand. Fixed-RGUs were up 1.8% year-on-year, with broadband accesses rising 6.4%. We finished the quarter with 363 million access lines. • We registered a comprehensive financing income of 30.4 billion pesos in the quarter on the back of foreign exchange gains, mostly as a result of the Mexi- can peso appreciating vs. the dollar and the euro. • With our operating profits rising 8.3% to 30.4 billion pesos, this comprehen- sive financing income helped us attain a net profit of 35.9 billion pesos in the period, up from 4.8 billion pesos a year before. • Our capital expenditures in the quarter totaled 28.6 billion pesos and we in- vested an additional 3.7 billion pesos in the acquisition of Olo in Perú and Metronet in Croacia. Substantially all of these outlays were covered by our cash flow; the remainder financed by 2.0 billion pesos in net borrowings from the market. CONTENT Highlights Relevant events Subscribers América Móvil Consolidated Mexico Argentina, Paraguay & Uruguay Brazil Chile Colombia Ecuador Peru Central America Caribbean USA Austria & CEE Glossary Currency Exchange Rates Revenues +19% YoY EBITDA +16% YoY 1Q17 Capex of MxP 29 Bn in 1Q EBITDA +1.5% at constant Fx Net profit of MxP 36Bn Service Revenues +3.1% at constant Fx Postpaid subs +5.1% YoY, RGUs +1.8% We will host our conference call to discuss 1Q17 financial and operating results on April 26 th at 9:00am Mexico City time. To access the call please log on to www.americamovil.com/investors.
Transcript of América Móvil’s first quarter of 2017 financial and ... · page 2 • In peso terms, our net...

Carlos García-MorenoChief Financial [email protected]
Daniela Lecuona TorrasInvestor Relations [email protected]
América Móvil’s first quarter of 2017 financial and operating report
Mexico City, April 25, 2017 - América Móvil, S.A.B. de C.V. (“América Móvil”) [BMV: AMX]
[NYSE: AMX, AMOV] [LATIBEX: XAMXL], announced today its financial and operating results
for the first quarter of 2017.
• First quarter revenues were up 18.5% year-on-year in Mexican peso terms to 264 billion pesos, with EBITDA rising 15.8% to 72 billion pesos. At 27.1%, the EBITDA margin was slightly lower, 0.6 percentage points, than a year before.
• At constant exchange rates service revenues were up 3.1% continuing their trend of steady sequential improvements seen since the second quarter of 2016. Although Mexico and Colombia made important contributions in this recovery, it was broad based.
• EBITDA posted a 1.5% year-on-year increase at constant exchange rates—the first in eight quarters—representing a significant swing from the 8.1% de-crease observed in the prior quarter. Mexico, Brazil, Colombia and Peru were all important contributors to this sequential improvement. The acceleration in service revenue growth and the implementation of cost control policies over the last quarters underpinned the expansion of EBITDA.
• Our wireless postpaid base was up 5.1% year-on-year at the end of March, having added 632 thousand subs in the first quarter, while the prepaid base was down 3.3% after net disconnections of 1.4 million subs, mostly as a re-sult of disconnections in the US under the SafeLink brand. Fixed-RGUs were up 1.8% year-on-year, with broadband accesses rising 6.4%. We finished the quarter with 363 million access lines.
• We registered a comprehensive financing income of 30.4 billion pesos in the quarter on the back of foreign exchange gains, mostly as a result of the Mexi-can peso appreciating vs. the dollar and the euro.
• With our operating profits rising 8.3% to 30.4 billion pesos, this comprehen-sive financing income helped us attain a net profit of 35.9 billion pesos in the period, up from 4.8 billion pesos a year before.
• Our capital expenditures in the quarter totaled 28.6 billion pesos and we in-vested an additional 3.7 billion pesos in the acquisition of Olo in Perú and Metronet in Croacia. Substantially all of these outlays were covered by our cash flow; the remainder financed by 2.0 billion pesos in net borrowings from the market.
CONTENT
Highlights
Relevant events
Subscribers
América Móvil Consolidated
Mexico
Argentina, Paraguay & Uruguay
Brazil
Chile
Colombia
Ecuador
Peru
Central America
Caribbean
USA
Austria & CEE
Glossary
Currency Exchange Rates
Revenues +19% YoYEBITDA +16% YoY
1Q17
Capex of MxP 29 Bn in 1Q
EBITDA +1.5% at constant Fx
Net profit of MxP 36Bn
Service Revenues +3.1% at constant Fx
Postpaid subs +5.1% YoY, RGUs +1.8%
We will host our conference call to discuss 1Q17 financial and operating results on April 26th at 9:00am
Mexico City time. To access the call please log on to www.americamovil.com/investors.

page 2
• In peso terms, our net debt came down to 584 billion pesos from 630 billion in December mainly as a consequence of the appreciation of the Mexican peso vs. the dollar and the euro. Our leverage ratio remained practically un-changed from the prior quarter.
Relevant Events
On March 8th, 2017, we received a resolution issued by the Federal Telecommu-nications Institute (IFT) related to its “biennial” evaluation of the asymmetrical regulations imposed on March 2014 to Telcel and Telmex. Certain asymmetrical regulations were modified and new regulations were added as follows: A) For mobile services, the main modifications have to do with wireless wholesale services and seek to ensure that any interested party can replicate Telcel’s com-mercial offers. B) For fixed services, the main modifications have to do with the legal separa-tion of Telmex access network and passive infrastructure into a legal entity that, although owned by AMX (directly or indirectly), will have certain degree of op-erational independence from AMX, including an independent Board and Man-agement. This entity will provide wholesale services associated with local loop unbundling and shared accesses to passive infrastructure. The legal separation is subject to a proposal prepared by us and to be approved by IFT. Other new mea-sures imposed on Telmex seek to ensure (a) economic replicability of Telmex’s plans and commercial offers and (b) changes to the cost model associated with the pricing of links (enlaces).
CONTENT
Highlights
Relevant events
Subscribers
América Móvil Consolidated
Mexico
Argentina, Paraguay & Uruguay
Brazil
Chile
Colombia
Ecuador
Peru
Central America
Caribbean
USA
Austria & CEE
Glossary
Currency Exchange Rates
América Móvil Fundamentals (IFRS)1Q17 1Q16
Earnings per Share (Mex$) (1) 0.55 0.07
Earning per ADR (US$) (2) 0.53 0.08
EBITDA per Share (Mex$) (3) 1.09 0.94
EBITDA per ADR (US$) 1.06 1.04
Net Income (millions of Mex$) 35,855 4,798
Average Shares Outstanding (billion) 65.79 65.91
(1) Net Income / Average Shares Outstanding (2) 20 shares per ADR (3) EBITDA / Average Shares Outstanding
Net debt/ EBITDA at 2.1x

page 3
América Móvil’s Subsidiaries as of March 2017
Country Brand BusinessEquity
Participation
Mexico Telcel wireless 100.0%
Telmex wireline 98.7%
Sección Amarilla (1) other 98.4%
Telvista other 89.4%
Argentina Claro wireless 100.0%
Telmex wireline 99.7%
Brazil Claro wireless/wireline 97.7%
Chile Claro wireless 100.0%
Telmex(1) wireline 100.0%
Colombia Claro wireless 99.4%
Telmex wireline 99.3%
Costa Rica Claro wireless 100.0%
Dominicana Claro wireless/wireline 100.0%
Ecuador Claro (2) wireless/wireline 100.0%
El Salvador Claro wireless/wireline 95.8%
Guatemala Claro wireless/wireline 99.3%
Honduras Claro wireless/wireline 100.0%
Nicaragua Claro wireless/wireline 99.6%
Panama Claro wireless/wireline 100.0%
Paraguay Claro wireless/wireline 100.0%
Peru Claro wireless/wireline 100.0%
Puerto Rico Claro wireless/wireline 100.0%
Uruguay Claro wireless/wireline 100.0%
USA Tracfone wireless 100.0%
Netherlands KPN wireless/wireline 21.1%
Austria Telekom Austria wireless/wireline 51.0%
(1) Equity Participation of Telmex Internacional of which América Móvil owns 97.87%. (2) In November, 2016 we merged our Ecuadorian wireline operations into our wireless one.
CONTENT
Highlights
Relevant events
Subscribers
América Móvil Consolidated
Mexico
Argentina, Paraguay & Uruguay
Brazil
Chile
Colombia
Ecuador
Peru
Central America
Caribbean
USA
Austria & CEE
Glossary
Currency Exchange Rates
On April 5th, 2017, we announced that our shareholders approved the payment of a dividend of MXP$0.30 (thirty peso cents) per share, payable in cash; in series “L” shares of AMX; or a combination thereof, according to the election of each share-holder. The dividend, payable in two installments, was increased from MXP$0.28 (twenty eight peso cents) per share decreed the prior year. Shareholders also ap-proved the allocation of an amount equal to three billion pesos to its share buy-back reserve for the April 2017 – April 2018 period.

page 4
Access Lines
We ended March with 362.7 million access lines, practically flat from a year be-fore, -0.7%, as our wireless base declined 1.4%. Wireless subscribers account for 77% of the total. In the postpaid wireless segment, we added 632 thousand new clients in the quar-ter. Brazil led the way with 205 thousand followed by Mexico with 177 thousand and Colombia with 87 thousand. Our postpaid subscriber base rose 5.1% over the year. In the prepaid segment, we registered net disconnections of 1.4 million subscribers, mainly as a result of clients in the U.S. failing to qualify for federal support under the SafeLink brand. In the fixed-line platform we had 82.8 million fixed RGUs, 1.8% more than in the prior year. Broadband accesses were up 6.4% after connecting 258 thousand new accesses in the quarter, most of them in Central America, Colombia and Brazil. In voice lines and in DTH units—but not in other PayTV services—we registered net disconnections in the period.
Colombia was our fastest growing operation rising 9.1% over the year followed by Central America, which was up 8.0%.
CONTENT
Highlights
Relevant events
Subscribers
América Móvil Consolidated
Mexico
Argentina, Paraguay & Uruguay
Brazil
Chile
Colombia
Ecuador
Peru
Central America
Caribbean
USA
Austria & CEE
Glossary
Currency Exchange Rates
Wireless Subscribers as of March 2017Total(1) (Thousands)
Country Mar ’17 Dec ’16 Var.% Mar ’16 Var.%
Argentina, Paraguay and Uruguay 23,848 23,749 0.4% 22,885 4.2%
Austria & CEE 20,622 20,708 -0.4% 20,530 0.4%
Brazil 60,237 60,171 0.1% 65,289 -7.7%
Central America 15,293 15,085 1.4% 15,584 -1.9%
Caribbean 5,508 5,453 1.0% 5,331 3.3%
Chile 6,710 6,628 1.2% 6,465 3.8%
Colombia 29,153 28,954 0.7% 28,340 2.9%
Ecuador 8,771 8,727 0.5% 8,665 1.2%
Mexico 72,942 72,953 0.0% 73,495 -0.8%
Peru 11,990 12,075 -0.7% 12,070 -0.7%
USA 24,745 26,070 -5.1% 25,211 -1.8%
Total Wireless Lines 279,818 280,572 -0.3% 283,865 -1.4%
(1) Includes total subscribers of all companies in which América Móvil holds an economic interest; does not consider the date in which the companies started being consolidated.
363M accesses
632k net additions in postpaid
Broadband accesses +6.4% YoY
page 5
CONTENT
Highlights
Relevant events
Subscribers
América Móvil Consolidated
Mexico
Argentina, Paraguay & Uruguay
Brazil
Chile
Colombia
Ecuador
Peru
Central America
Caribbean
USA
Austria & CEE
Glossary
Currency Exchange Rates
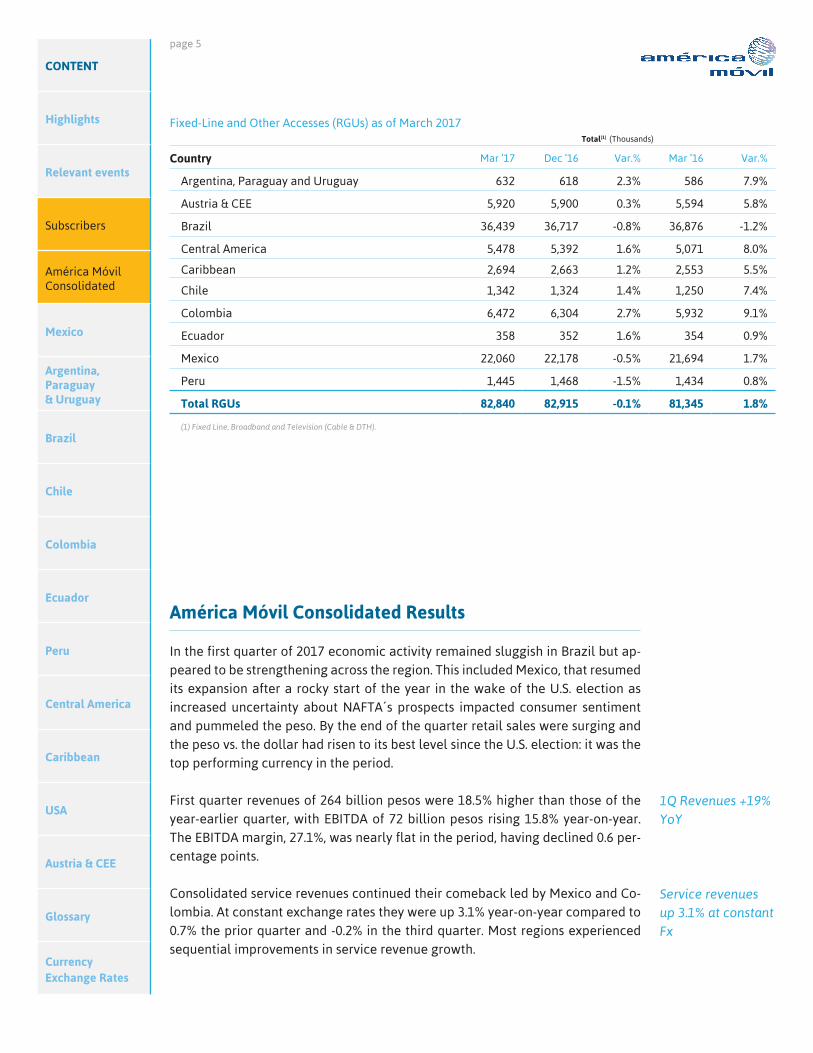
Fixed-Line and Other Accesses (RGUs) as of March 2017Total(1) (Thousands)
Country Mar ’17 Dec ’16 Var.% Mar ’16 Var.%
Argentina, Paraguay and Uruguay 632 618 2.3% 586 7.9%
Austria & CEE 5,920 5,900 0.3% 5,594 5.8%
Brazil 36,439 36,717 -0.8% 36,876 -1.2%
Central America 5,478 5,392 1.6% 5,071 8.0%
Caribbean 2,694 2,663 1.2% 2,553 5.5%
Chile 1,342 1,324 1.4% 1,250 7.4%
Colombia 6,472 6,304 2.7% 5,932 9.1%
Ecuador 358 352 1.6% 354 0.9%
Mexico 22,060 22,178 -0.5% 21,694 1.7%
Peru 1,445 1,468 -1.5% 1,434 0.8%
Total RGUs 82,840 82,915 -0.1% 81,345 1.8%
(1) Fixed Line, Broadband and Television (Cable & DTH).
América Móvil Consolidated Results
In the first quarter of 2017 economic activity remained sluggish in Brazil but ap-peared to be strengthening across the region. This included Mexico, that resumed its expansion after a rocky start of the year in the wake of the U.S. election as increased uncertainty about NAFTA´s prospects impacted consumer sentiment and pummeled the peso. By the end of the quarter retail sales were surging and the peso vs. the dollar had risen to its best level since the U.S. election: it was the top performing currency in the period.
First quarter revenues of 264 billion pesos were 18.5% higher than those of the year-earlier quarter, with EBITDA of 72 billion pesos rising 15.8% year-on-year. The EBITDA margin, 27.1%, was nearly flat in the period, having declined 0.6 per-centage points.
Consolidated service revenues continued their comeback led by Mexico and Co-lombia. At constant exchange rates they were up 3.1% year-on-year compared to 0.7% the prior quarter and -0.2% in the third quarter. Most regions experienced sequential improvements in service revenue growth.
1Q Revenues +19% YoY
Service revenues up 3.1% at constant Fx

page 6
Every single business line presented sequential improvements in the first quarter at constant exchange rates, most notably mobile data revenues, whose rate of growth shot up from 11.7% in the fourth quarter to 16.5%. Voice revenues recov-ered sequentially on both platforms, particularly on the fixed-one, although are still posting negative rates of growth.
As service-revenue growth accelerated, EBITDA continued to improve, with a significant swing from an 8.1% year-on-year decrease in the fourth quarter to an increase of 1.5% in the first quarter, the first increase in eight quarters. Mexico, Brazil, Colombia and Peru were all important contributors to this se-quential improvement, with the latter experiencing an important turnaround and Mexico recovering rapidly.
Our operating profit rose 8.3% from the year-earlier quarter to 30.4 billion and, together with financial income in the amount of 30.4 billion pesos, helped us attain a net quarterly profit of 35.9 billion pesos. Financial income stemmed from foreign exchange gains of 37.1 billion pesos that resulted for the most part from the appreciation of the Mexican peso vs. both the dollar and the euro in the period. Our net profit was equivalent to 55 peso cents per share and 53 dollar cents per ADR.
Capital expenditures totaled 28.6 billion pesos in the quarter. We invested an ad-ditional 3.7 billion pesos in the acquisition of ownership interests in Olo, in Peru, and Metronet in Croacia, and effected share buybacks in the amount of 444 mil-lion pesos. Substantially all of these outlays were covered by our cash flow; the remainder financed by 2.0 billion pesos in net borrowings from the market.
Notwithstanding our net borrowings, in peso terms our net debt came down to 584 billion pesos from 630 billion in December as a consequence of the apprecia-tion of the currency. As of March, our net debt to EBITDA (LTM) ratio was mostly unchanged relative to the previous quarter.
28+34+12+16+10Wireless Voice
Wireline Voice
Wireless Data
Wireline Data
Pay TV
28.4
33.511.8
15.9
10.4
1Q17 Service Revenues (%)
CONTENT
Highlights
Relevant events
Subscribers
América Móvil Consolidated
Mexico
Argentina, Paraguay & Uruguay
Brazil
Chile
Colombia
Ecuador
Peru
Central America
Caribbean
USA
Austria & CEE
Glossary
Currency Exchange Rates
Sequential improvements in our business lines
First increase in EBITDA in eight quarters, at constant Fx
Operating profit up 8.3% YoY
Capex of MxP 29 Bn in 1Q
Net debt down to MxP 584 Bn

page 7
CONTENT
Highlights
Relevant events
Subscribers
América Móvil Consolidated
Mexico
Argentina, Paraguay & Uruguay
Brazil
Chile
Colombia
Ecuador
Peru
Central America
Caribbean
USA
Austria & CEE
Glossary
Currency Exchange Rates
América Móvil’s Income Statement (IFRS) Millions of Mexican pesos
1Q17 1Q16 Var.%
Service Revenues 231,276 194,303 19.0%
Equipment Revenues 32,881 28,682 14.6%
Total Revenues 264,157 222,985 18.5%
Cost of Service 87,796 72,445 21.2%
Cost of Equipment 40,111 36,057 11.2%
Selling, General & Administrative Expenses 63,030 51,167 23.2%
Others 1,717 1,581 8.6%
Total Costs and Expenses 192,654 161,251 19.5%
EBITDA 71,504 61,735 15.8%
% of Total Revenues 27.1% 27.7%
Depreciation & Amortization 41,140 33,692 22.1%
EBIT 30,363 28,042 8.3%
% of Total Revenues 11.5% 12.6%
Net Interest Expense 7,155 6,947 3.0%
Other Financial Expenses -393 11,912 -103.3%
Foreign Exchange Loss -37,129 1,839 n.m.
Comprehensive Financing Cost (Income) -30,367 20,698 -246.7%
Income & Deferred Taxes 24,008 2,223 n.m.
Net Income before Minority Interest and Equity Participation in Results ofAffiliates
36,723 5,121 n.m.
EquityParticipationinResultsofAffiliates 31 37 -17.3%
Minority Interest -899 -360 -149.6%
Net Income 35,855 4,798 n.m.
n.m. Not meaningful
page 8
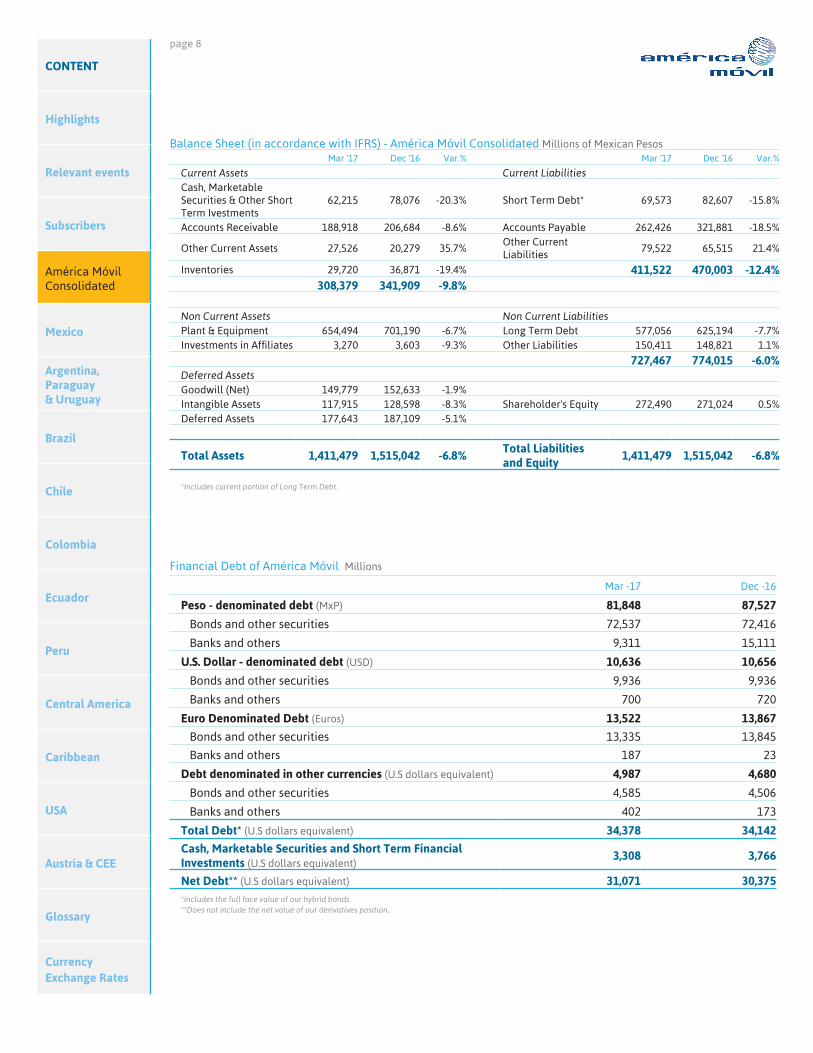
Balance Sheet (in accordance with IFRS) - América Móvil Consolidated Millions of Mexican PesosMar '17 Dec '16 Var.% Mar '17 Dec '16 Var.%
Current Assets Current LiabilitiesCash, Marketable Securities & Other Short Term Ivestments
62,215 78,076 -20.3% Short Term Debt* 69,573 82,607 -15.8%
Accounts Receivable 188,918 206,684 -8.6% Accounts Payable 262,426 321,881 -18.5%
Other Current Assets 27,526 20,279 35.7%Other Current Liabilities
79,522 65,515 21.4%
Inventories 29,720 36,871 -19.4% 411,522 470,003 -12.4%308,379 341,909 -9.8%
Non Current Assets Non Current LiabilitiesPlant & Equipment 654,494 701,190 -6.7% Long Term Debt 577,056 625,194 -7.7%InvestmentsinAffiliates 3,270 3,603 -9.3% Other Liabilities 150,411 148,821 1.1%
727,467 774,015 -6.0%Deferred AssetsGoodwill (Net) 149,779 152,633 -1.9%Intangible Assets 117,915 128,598 -8.3% Shareholder's Equity 272,490 271,024 0.5%Deferred Assets 177,643 187,109 -5.1%
Total Assets 1,411,479 1,515,042 -6.8%Total Liabilities and Equity
1,411,479 1,515,042 -6.8%
*Includes current portion of Long Term Debt.
CONTENT
Highlights
Relevant events
Subscribers
América Móvil Consolidated
Mexico
Argentina, Paraguay & Uruguay
Brazil
Chile
Colombia
Ecuador
Peru
Central America
Caribbean
USA
Austria & CEE
Glossary
Currency Exchange Rates
Financial Debt of América Móvil Millions
Mar -17 Dec -16
Peso - denominated debt (MxP) 81,848 87,527
Bonds and other securities 72,537 72,416
Banks and others 9,311 15,111
U.S. Dollar - denominated debt (USD) 10,636 10,656
Bonds and other securities 9,936 9,936
Banks and others 700 720
Euro Denominated Debt (Euros) 13,522 13,867
Bonds and other securities 13,335 13,845
Banks and others 187 23
Debt denominated in other currencies (U.S dollars equivalent) 4,987 4,680
Bonds and other securities 4,585 4,506
Banks and others 402 173
Total Debt* (U.S dollars equivalent) 34,378 34,142
Cash, Marketable Securities and Short Term Financial Investments (U.S dollars equivalent)
3,308 3,766
Net Debt** (U.S dollars equivalent) 31,071 30,375*Includes the full face value of our hybrid bonds.**Does not include the net value of our derivatives position.

page 9
CONTENT
Highlights
Relevant events
Subscribers
América Móvil Consolidated
Mexico
Argentina, Paraguay & Uruguay
Brazil
Chile
Colombia
Ecuador
Peru
Central America
Caribbean
USA
Austria & CEE
Glossary
Currency Exchange Rates
Mexico
In Mexico we gained 177 thousand postpaid subscribers in the first quarter and disconnected 188 thousand prepaid ones to end the quarter with 72.9 million, with our overall subscriber base almost unchanged relative to last December. On the fixed-line platform we ended the quarter with 22.1 million RGUs, 1.7% more than a year before, as new broadband subscribers, 398 thousand since the first quarter of 2016, more than compensated for a 31 thousand reduction in fixed-voice clients.
Revenues totaled 63.4 billion pesos in the quarter and were 2.1% lower than in the year-earlier quarter. Service revenues continued their recovery posting a 3.6% year-on-year decline in the quarter that compares to a 7.5% reduction in the fourth quarter and a 10.2% one in the third quarter. The recovery was driven by faster data-services revenue growth, particularly in mobile, with revenues that accelerated from a 5.2% year-on-year increase in the fourth quarter to a 15.9% pace in the first one. Fixed-data services revenues also rose, as they went from a 0.2% decrease to a 3.6% increase in the same period.
Importantly, mobile ARPUs have come back from 127 in the second quarter of 2016 to 129 pesos. In terms of their annual rate of change, they went from -17.7% in the second quarter of 2016 to -2.3% in the first quarter of the year. Part of the ARPU improvement lies in the shift towards more postpaid subscribers, with our postpaid base increasing 6.7% while our prepaid base fell 2.1%. But the ARPU im-provement owes a lot to changes in the commercial offerings that have reduced the life span of prepaid cards of different denominations and also enabled us to extract more revenues from data services.
EBITDA came in at 20.2 billion pesos. In relative terms it showed an even more marked recovery than did service revenues: Whereas in the first quarter EBITDA was still down 12.6% year-on-year, it had been down 23.6% in the prior quarter and 24.6% in the third quarter. Revenue growth helped the recovery but so did a number of cost reduction measures that have been implemented over the last several months.
INCOME STATEMENT (IFRS) - Mexico Millions of MxP
1Q17 1Q16 Var.%
Total Revenues 63,439 64,816 -2.1%
Total Service Revenues 49,349 51,205 -3.6%
Wireless Revenues 40,591 41,661 -2.6%
Service Revenues 28,342 29,300 -3.3%
Equipment Revenues 12,043 11,618 3.7%
Fixed Line and Other Revenues 24,787 24,833 -0.2%
EBITDA 20,235 23,143 -12.6%
% total revenues 31.9% 35.7%
EBIT 12,936 16,671 -22.4%
% 20.4% 25.7%
*Total Revenues reflect eliminations derived from both the overlap of fixed and mobile operations as well as international intercompany transactions; Wireless Revenues and Fixed Line and Other Revenues only exclude intercompany transactions with foreign subsidiaries. The sum of the parts will not equal Total Revenues.
177k postpaid net adds, RGUs +1.7% YoY
Service revenues recovery, mobile data revenues +16% YoY
ARPU improvements in 1Q
Marked recovery on EBITDA
page 10
CONTENT
Highlights
Relevant events
Subscribers
América Móvil Consolidated
Mexico
Argentina, Paraguay & Uruguay
Brazil
Chile
Colombia
Ecuador
Peru
Central America
Caribbean
USA
Austria & CEE
Glossary
Currency Exchange Rates
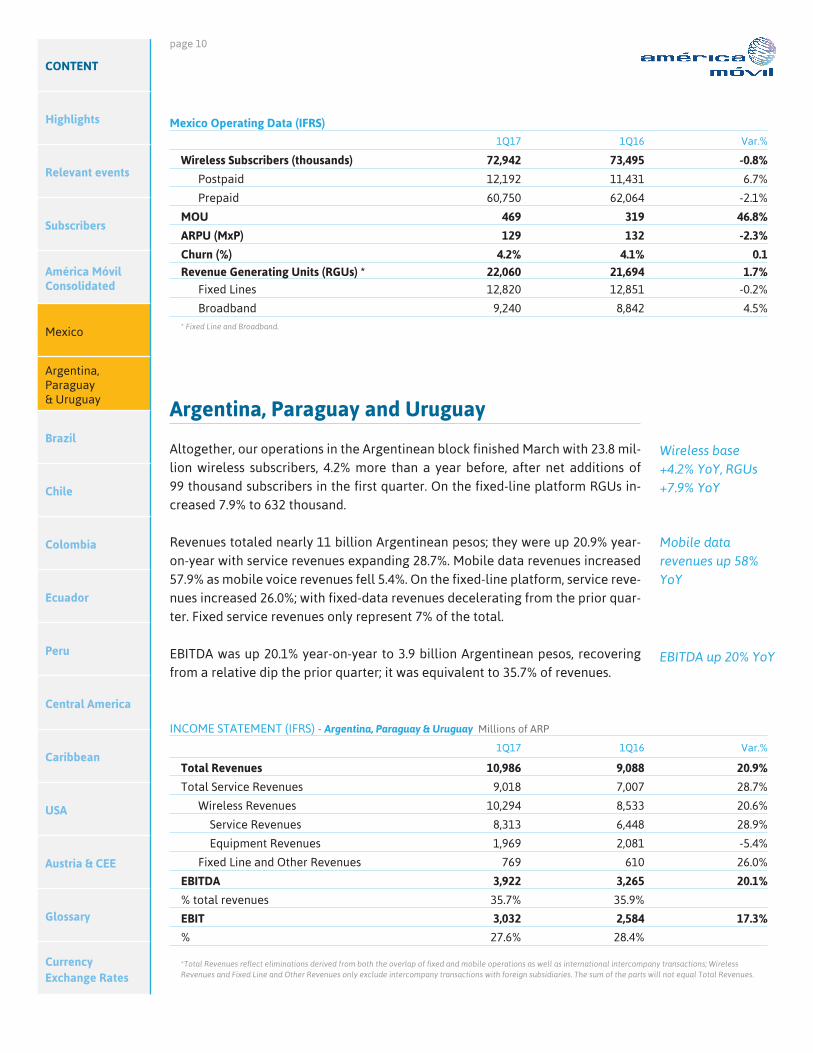
Mexico Operating Data (IFRS)
1Q17 1Q16 Var.%
Wireless Subscribers (thousands) 72,942 73,495 -0.8%
Postpaid 12,192 11,431 6.7%
Prepaid 60,750 62,064 -2.1%
MOU 469 319 46.8%
ARPU (MxP) 129 132 -2.3%
Churn (%) 4.2% 4.1% 0.1
Revenue Generating Units (RGUs) * 22,060 21,694 1.7%
Fixed Lines 12,820 12,851 -0.2%
Broadband 9,240 8,842 4.5%* Fixed Line and Broadband.
Argentina, Paraguay and Uruguay
Altogether, our operations in the Argentinean block finished March with 23.8 mil-lion wireless subscribers, 4.2% more than a year before, after net additions of 99 thousand subscribers in the first quarter. On the fixed-line platform RGUs in-creased 7.9% to 632 thousand.
Revenues totaled nearly 11 billion Argentinean pesos; they were up 20.9% year-on-year with service revenues expanding 28.7%. Mobile data revenues increased 57.9% as mobile voice revenues fell 5.4%. On the fixed-line platform, service reve-nues increased 26.0%; with fixed-data revenues decelerating from the prior quar-ter. Fixed service revenues only represent 7% of the total.
EBITDA was up 20.1% year-on-year to 3.9 billion Argentinean pesos, recovering from a relative dip the prior quarter; it was equivalent to 35.7% of revenues.
INCOME STATEMENT (IFRS) - Argentina, Paraguay & Uruguay Millions of ARP
1Q17 1Q16 Var.%
Total Revenues 10,986 9,088 20.9%
Total Service Revenues 9,018 7,007 28.7%
Wireless Revenues 10,294 8,533 20.6%
Service Revenues 8,313 6,448 28.9%
Equipment Revenues 1,969 2,081 -5.4%
Fixed Line and Other Revenues 769 610 26.0%
EBITDA 3,922 3,265 20.1%
% total revenues 35.7% 35.9%
EBIT 3,032 2,584 17.3%
% 27.6% 28.4%
*Total Revenues reflect eliminations derived from both the overlap of fixed and mobile operations as well as international intercompany transactions; Wireless Revenues and Fixed Line and Other Revenues only exclude intercompany transactions with foreign subsidiaries. The sum of the parts will not equal Total Revenues.
Wireless base +4.2% YoY, RGUs +7.9% YoY
Mobile data revenues up 58% YoY
EBITDA up 20% YoY

page 11
CONTENT
Highlights
Relevant events
Subscribers
América Móvil Consolidated
Mexico
Argentina, Paraguay & Uruguay
Brazil
Chile
Colombia
Ecuador
Peru
Central America
Caribbean
USA
Austria & CEE
Glossary
Currency Exchange Rates
Argentina, Paraguay & Uruguay Operating Data (IFRS)
1Q17 1Q16 Var.%
Wireless Subscribers (thousands) 23,848 22,885 4.2%
Postpaid 2,468 2,557 -3.5%
Prepaid 21,380 20,328 5.2%
MOU 87 97 -10.1%
ARPU (ARP) 116 94 23.9%
Churn (%) 2.0% 2.2% (0.2)
Revenue Generating Units (RGUs) * 632 586 7.9%
* Fixed Line, Broadband and Television.
Brazil
Our postpaid base continued to grow in Brazil as we added 205 thousand subs in the quarter, while we continued to disconnect prepaid clients. Hence, our post-paid base was up 9.8% year-on-year while our prepaid base was down 13.8% at the end of March. Fixed-RGUs totaled 36.4 million after net disconnections of 278 thousand units in the quarter from voice and entry-level (DTH) PayTV services.
First quarter revenues of 8.9 billion reais were slightly lower than in the year-earlier quarter because of a decline in equipment revenues, but service revenues were up 0.8%, which compared to the 2.2% decline posted the previous quarter. There were important sequential improvements in mobile revenues, with mobile data revenues switching from -1.7% in the fourth quarter to +9.7% in the first, and mobile voice revenues slowing their rate of decline from 14.1% to 8.7%. On the fixed-platform there was a sequential improvement in voice but slight decelera-tion in data revenues. PayTV revenue growth continued at an even pace, of 2.4%.
Buoyed by the sequential improvement in service revenues, EBITDA rose 5.0% over the prior year—having declined 2.4% in the fourth quarter—to reach 2.5 billion reais helped along by cost reductions associated to technical areas of the business. The EBITDA margin expanded 1.5 percentage points to 27.8%.
INCOME STATEMENT (IFRS) - Brazil Millions of BrL
1Q17 1Q16 Var.%
Total Revenues 8,905 8,954 -0.5%
Total Service Revenues 8,769 8,703 0.8%
Wireless Revenues 2,885 3,006 -4.0%
Service Revenues 2,747 2,757 -0.4%
Equipment Revenues 136 249 -45.5%
Fixed Line and Other Revenues 6,020 5,948 1.2%
EBITDA 2,475 2,357 5.0%
% total revenues 27.8% 26.3%
EBIT 280 147 90.9%
% 3.1% 1.6%
*Revenues reflect eliminations derived from both the overlap of fixed and mobile operations as well as international intercompany transactions.
205k postpaid net adds
Sequential improvements in mobile revenues, data revenues up 9.7%
EBITDA up 5.0% YoY

page 12
CONTENT
Highlights
Relevant events
Subscribers
América Móvil Consolidated
Mexico
Argentina, Paraguay & Uruguay
Brazil
Chile
Colombia
Ecuador
Peru
Central America
Caribbean
USA
Austria & CEE
Glossary
Currency Exchange Rates
Brazil Operating Data (IFRS)
1Q17 1Q16 Var.%
Wireless Subscribers (thousands) 60,237 65,289 -7.7%
Postpaid 18,515 16,869 9.8%
Prepaid 41,722 48,420 -13.8%
MOU 85 95 -10.6%
ARPU (BrL) 15 14 8.3%
Churn (%) 3.4% 3.6% (0.2)
Revenue Generating Units (RGUs) * 36,439 36,876 -1.2%* Fixed Line, Broadband and Television.
Chile
We added 82 thousand wireless subscribers in the first quarter bringing the to-tal base to 6.7 million by the end of March, 3.8% above last year; our postpaid subscriber base was up 15.4%. In addition, we had 1.3 million fixed-RGUs, 7.4% more than a year before as broadband accesses shot up 18.3%.
Revenues of 201 billion Chilean pesos were 11.1% higher than a year before, with service revenues increasing 7.9%, their best performance in six quarters, on the back of data-services revenues that expanded 17.7% on the fixed platform and 16.5% on the mobile one.
EBITDA growth continued to accelerate following the trend it has shown over the last several quarters, doubling in the first quarter relative to the year before to 26.9 billion Chilean pesos. It was equivalent to 13.4% of revenues, 6.0 per-centage points more than the prior year.
INCOME STATEMENT (IFRS) - Chile Millions of ChPL
1Q17 1Q16 Var.%
Total Revenues 200,689 180,706 11.1%
Total Service Revenues 179,180 166,022 7.9%
Wireless Revenues 131,772 118,218 11.5%
Service Revenues 110,378 102,860 7.3%
Equipment Revenues 21,509 14,684 46.5%
Fixed Line and Other Revenues 75,112 68,048 10.4%
EBITDA 26,858 13,273 102.3%
% total revenues 13.4% 7.3%
EBIT -26,904 -39,505 31.9%
% -13.4% -21.9%
*Total Revenues reflect eliminations derived from both the overlap of fixed and mobile operations as well as international intercompany transactions; Wireless Revenues and Fixed Line and Other Revenues only exclude intercompany transactions with foreign subsidiaries. The sum of the parts will not equal Total Revenues.
Postpaid base up 15% YoY
1Q Service revenues +7.9% YoY
EBITDA margin at 13%, +6.0p.p.

page 13
CONTENT
Highlights
Relevant events
Subscribers
América Móvil Consolidated
Mexico
Argentina, Paraguay & Uruguay
Brazil
Chile
Colombia
Ecuador
Peru
Central America
Caribbean
USA
Austria & CEE
Glossary
Currency Exchange Rates
Chile Operating Data (IFRS)
1Q17 1Q16 Var.%
Wireless Subscribers (thousands) 6,710 6,465 3.8%
Postpaid 1,672 1,449 15.4%
Prepaid 5,038 5,016 0.4%
MOU 139 138 0.7%
ARPU (ChP) 5,650 5,465 3.4%
Churn (%) 5.3% 5.2% 0.1
Revenue Generating Units (RGUs) * 1,342 1,250 7.4%* Fixed Line, Broadband and Television.
Colombia
We finished March with 29.2 million wireless subscriber after adding 199 thou-sand in the quarter, 87 thousand of them contract clients. The postpaid base rose 8.8% year-on-year to 6.5 million. On the fixed-line platform we had 6.5 million RGUs, 9.1% more than a year before, with landlines and broadband accesses growing 12.7% and 11.1%, respectively, and PayTV units increasing 4.7%.
The quarter’s revenues of 2.8 trillion Colombian pesos were up 1.9% over the pri-or year. After five quarters of steady sequential improvements —albeit still with negative rates of growth— Claro posted its first year-on-year increase in service revenues in several quarters, 2.1%. The latter was mostly driven by data-revenue growth: 19.7% on the mobile platform and 11.8% on the fixed one.
EBITDA reached 1.1 trillion Colombian pesos. As with service revenues, Claro’s EBITDA had shown a clear improving trend over various quarters and posted a 12.0% increase relative to the year-earlier quarter, which compares to a 12.7% decline posted then. The improvement in EBITDA results partly from overall cost control policies, but owes more to the recovery in service revenue growth. The EBITDA margin stood at 39.7% of revenues; it was up 3.6 percentage points in a year.
INCOME STATEMENT (IFRS) - Colombia Billions of COP
1Q17 1Q16 Var.%
Total Revenues 2,761 2,711 1.9%
Total Service Revenues 2,261 2,215 2.1%
Wireless Revenues 2,012 2,015 -0.1%
Service Revenues 1,507 1,502 0.3%
Equipment Revenues 495 489 1.2%
Fixed Line and Other Revenues 813 717 13.4%
EBITDA 1,096 979 12.0%
% total revenues 39.7% 36.1%
EBIT 632 545 15.9%
% 22.9% 20.1%
*Total Revenues reflect eliminations derived from both the overlap of fixed and mobile operations as well as international intercompany transactions; Wireless Revenues and Fixed Line and Other Revenues only exclude intercompany transactions with foreign subsidiaries. The sum of the parts will not equal Total Revenues.
Postpaid base +8.8% YoY
First annual increase in service revenues
EBITDA +12% YoY
page 14
CONTENT
Highlights
Relevant events
Subscribers
América Móvil Consolidated
Mexico
Argentina, Paraguay & Uruguay
Brazil
Chile
Colombia
Ecuador
Peru
Central America
Caribbean
USA
Austria & CEE
Glossary
Currency Exchange Rates
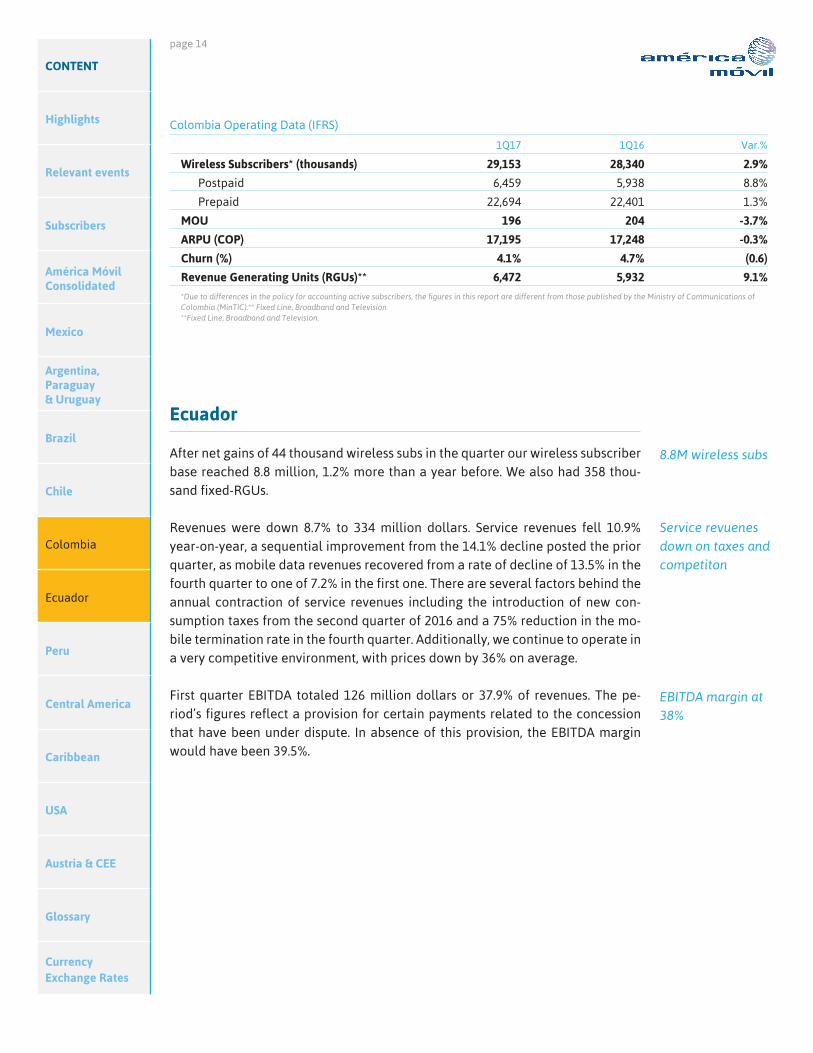
Colombia Operating Data (IFRS)
1Q17 1Q16 Var.%
Wireless Subscribers* (thousands) 29,153 28,340 2.9%
Postpaid 6,459 5,938 8.8%
Prepaid 22,694 22,401 1.3%
MOU 196 204 -3.7%
ARPU (COP) 17,195 17,248 -0.3%
Churn (%) 4.1% 4.7% (0.6)
Revenue Generating Units (RGUs)** 6,472 5,932 9.1%
*Due to differences in the policy for accounting active subscribers, the figures in this report are different from those published by the Ministry of Communications of Colombia (MinTIC).** Fixed Line, Broadband and Television**Fixed Line, Broadband and Television.
Ecuador
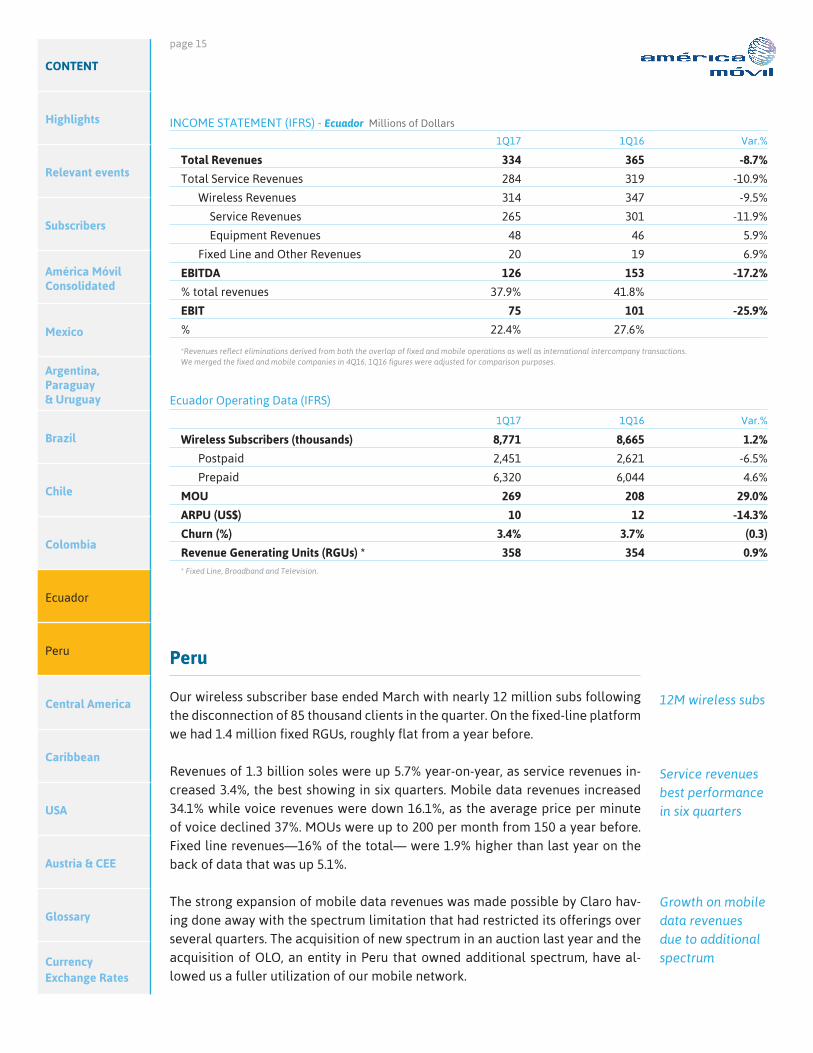
After net gains of 44 thousand wireless subs in the quarter our wireless subscriber base reached 8.8 million, 1.2% more than a year before. We also had 358 thou-sand fixed-RGUs.
Revenues were down 8.7% to 334 million dollars. Service revenues fell 10.9% year-on-year, a sequential improvement from the 14.1% decline posted the prior quarter, as mobile data revenues recovered from a rate of decline of 13.5% in the fourth quarter to one of 7.2% in the first one. There are several factors behind the annual contraction of service revenues including the introduction of new con-sumption taxes from the second quarter of 2016 and a 75% reduction in the mo-bile termination rate in the fourth quarter. Additionally, we continue to operate in a very competitive environment, with prices down by 36% on average.
First quarter EBITDA totaled 126 million dollars or 37.9% of revenues. The pe-riod’s figures reflect a provision for certain payments related to the concession that have been under dispute. In absence of this provision, the EBITDA margin would have been 39.5%.
8.8M wireless subs
Service revuenes down on taxes and competiton
EBITDA margin at 38%
page 15
CONTENT
Highlights
Relevant events
Subscribers
América Móvil Consolidated
Mexico
Argentina, Paraguay & Uruguay
Brazil
Chile
Colombia
Ecuador
Peru
Central America
Caribbean
USA
Austria & CEE
Glossary
Currency Exchange Rates
Ecuador Operating Data (IFRS)
1Q17 1Q16 Var.%
Wireless Subscribers (thousands) 8,771 8,665 1.2%
Postpaid 2,451 2,621 -6.5%
Prepaid 6,320 6,044 4.6%
MOU 269 208 29.0%
ARPU (US$) 10 12 -14.3%
Churn (%) 3.4% 3.7% (0.3)
Revenue Generating Units (RGUs) * 358 354 0.9%* Fixed Line, Broadband and Television.
Peru
Our wireless subscriber base ended March with nearly 12 million subs following the disconnection of 85 thousand clients in the quarter. On the fixed-line platform we had 1.4 million fixed RGUs, roughly flat from a year before.
Revenues of 1.3 billion soles were up 5.7% year-on-year, as service revenues in-creased 3.4%, the best showing in six quarters. Mobile data revenues increased 34.1% while voice revenues were down 16.1%, as the average price per minute of voice declined 37%. MOUs were up to 200 per month from 150 a year before. Fixed line revenues—16% of the total— were 1.9% higher than last year on the back of data that was up 5.1%.
The strong expansion of mobile data revenues was made possible by Claro hav-ing done away with the spectrum limitation that had restricted its offerings over several quarters. The acquisition of new spectrum in an auction last year and the acquisition of OLO, an entity in Peru that owned additional spectrum, have al-lowed us a fuller utilization of our mobile network.
INCOME STATEMENT (IFRS) - Ecuador Millions of Dollars
1Q17 1Q16 Var.%
Total Revenues 334 365 -8.7%
Total Service Revenues 284 319 -10.9%
Wireless Revenues 314 347 -9.5%
Service Revenues 265 301 -11.9%
Equipment Revenues 48 46 5.9%
Fixed Line and Other Revenues 20 19 6.9%
EBITDA 126 153 -17.2%
% total revenues 37.9% 41.8%
EBIT 75 101 -25.9%
% 22.4% 27.6%
*Revenues reflect eliminations derived from both the overlap of fixed and mobile operations as well as international intercompany transactions.We merged the fixed and mobile companies in 4Q16, 1Q16 figures were adjusted for comparison purposes.
12M wireless subs
Service revenues best performance in six quarters
Growth on mobile data revenues due to additional spectrum

page 16
CONTENT
Highlights
Relevant events
Subscribers
América Móvil Consolidated
Mexico
Argentina, Paraguay & Uruguay
Brazil
Chile
Colombia
Ecuador
Peru
Central America
Caribbean
USA
Austria & CEE
Glossary
Currency Exchange Rates
Helped along by the expansion of revenues, EBITDA reached an inflection point: at 278 million soles, it was up 8.8% over the prior year, the first annual increase in several quarters. The margin was equivalent to 20.7% of revenues.
At the end of March Peru suffered the worst floods in decades. Unusually heavy rains brought about by El Niño conditions drenched the northern territories of Peru. We were able to reinstate telecommunication services in the damaged ar-eas in a timely manner; yet, our quarterly results partly reflect the impact of these unfortunate events. INCOME STATEMENT (IFRS) - Peru Millions of Soles
1Q17 1Q16 Var.%
Total Revenues 1,344 1,272 5.7%
Total Service Revenues 1,165 1,127 3.4%
Wireless Revenues 1,131 1,064 6.4%
Service Revenues 941 913 3.1%
Equipment Revenues 178 143 24.1%
Fixed Line and Other Revenues 213 208 1.9%
EBITDA 278 255 8.8%
% total revenues 20.7% 20.1%
EBIT 97 90 6.8%
% 7.2% 7.1%
*Revenues reflect eliminations derived from both the overlap of fixed and mobile operations as well as international intercompany transactions.
Peru Operating Data (IFRS)
1Q17 1Q16 Var.%
Wireless Subscribers (thousands) 11,990 12,070 -0.7%
Postpaid 4,092 4,107 -0.4%
Prepaid 7,898 7,963 -0.8%
MOU 200 150 33.1%
ARPU (Sol) 26 25 3.3%
Churn (%) 5.8% 5.1% 0.7
Revenue Generating Units (RGUs) * 1,445 1,434 0.8%* Fixed Line, Broadband and Television
EBITDA inflection point: +8.8% YoY

page 17
CONTENT
Highlights
Relevant events
Subscribers
América Móvil Consolidated
Mexico
Argentina, Paraguay & Uruguay
Brazil
Chile
Colombia
Ecuador
Peru
Central America
Caribbean
USA
Austria & CEE
Glossary
Currency Exchange Rates
INCOME STATEMENT (IFRS) - Central America Millions of Dollars
1Q17 1Q16 Var.%
Total Revenues 568 551 3.0%
Total Service Revenues 524 518 1.2%
Wireless Revenues 380 374 1.6%
Service Revenues 342 340 0.6%
Equipment Revenues 37 33 11.6%
Fixed Line and Other Revenues 192 181 6.0%
EBITDA 195 191 1.9%
% total revenues 34.3% 34.7%
EBIT 64 56 14.6%
% 11.2% 10.1%
*Total Revenues reflect eliminations derived from both the overlap of fixed and mobile operations as well as international intercompany transactions; Wireless Revenues and Fixed Line and Other Revenues only exclude intercompany transactions with foreign subsidiaries. The sum of the parts will not equal Total Revenues.
Central America
All in, on the fixed-line platform RGUs expanded 8.0% in annual terms to reach 5.5 million; growth was driven by broadband accesses, up 16.6% year-on-year. On the mobile front we ended March with 15.3 million subs after adding 207 thousand new clients in the first quarter.
Revenues rose 3.0% year-over-year to 568 million dollars, with service revenues increasing 1.2%. The trend of deceleration of service revenues continued on the back of the deceleration of mobile data revenues, particularly in Guatemala on account of pricing.
EBITDA was up 1.9% annually to 195 million dollars with an EBITDA margin that stood at 34.3% of revenues.
Central America Operating Data (IFRS)
1Q17 1Q16 Var.%
Wireless Subscribers (thousands) 15,293 15,584 -1.9%
Postpaid 2,282 2,261 1.0%
Prepaid 13,011 13,323 -2.3%
MOU 140 173 -19.2%
ARPU (US$) 8 7 1.7%
Churn (%) 6.2% 6.4% (0.1)
Revenue Generating Units (RGUs) * 5,478 5,071 8.0%* Fixed Line, Broadband and Television.
207k net mobile adds, RGUs +8.0% YoY
1Q Revenues up 3.0% YoY
EBITDA margin at 34%

page 18
CONTENT
Highlights
Relevant events
Subscribers
América Móvil Consolidated
Mexico
Argentina, Paraguay & Uruguay
Brazil
Chile
Colombia
Ecuador
Peru
Central America
Caribbean
USA
Austria & CEE
Glossary
Currency Exchange Rates
INCOME STATEMENT (IFRS) - Caribbean Millions of Dollars
1Q17 1Q16 Var.%
Total Revenues 478 484 -1.1%
Total Service Revenues 421 433 -2.7%
Wireless Revenues 270 272 -0.7%
Service Revenues 218 226 -3.2%
Equipment Revenues 52 47 11.2%
Fixed Line and Other Revenues 208 212 -1.5%
EBITDA 156 147 5.5%
% total revenues 32.5% 30.5%
EBIT 90 68 32.8%
% 18.8% 14.0%*Total Revenues reflect eliminations derived from both the overlap of fixed and mobile operations as well as international intercompany transactions; Wireless Revenues and Fixed Line and Other Revenues only exclude intercompany transactions with foreign subsidiaries. The sum of the parts will not equal Total Revenues. 1Q16 figures have been adjusted to incorporate accounting changes in equipment revenues in Puerto Rico.
Caribbean
Our operations in the Caribbean had a total of 5.5 million wireless subscribers, 3.3% more than a year before, with the postpaid base increasing 5.8%. Fixed-RGUs increased 5.5% to 2.7 million.
The quarter’s revenues, 478 million dollars, declined 1.1% relative to the prior year as a result of a contraction in voice revenues in the Dominican Republic. Service revenues in Puerto Rico showed signs of improvement, but failed to com-pensate for the said effect.
EBITDA of 156 million dollars expanded 5.5% relative to the year-earlier quarter and the EBITDA margin was 32.5% up from 30.5% the year before. Growth comes from Puerto Rico where we have seen consistent improvements over the last five quarters.
Caribbean Operating Data (IFRS)
1Q17 1Q16 Var.%
Wireless Subscribers (thousands) 5,508 5,331 3.3%
Postpaid 1,811 1,712 5.8%
Prepaid 3,697 3,620 2.1%
MOU 262 280 -6.4%
ARPU (US$) 13 14 -6.5%
Churn (%) 3.6% 3.6% 0.0
Revenue Generating Units (RGUs) * 2,694 2,553 5.5%* Fixed Line, Broadband and Television.
Postapid base +5.8% YoY
1Q Revenues of USD 478M
EBITDA margin up from 31% to 33%

page 19
CONTENT
Highlights
Relevant events
Subscribers
América Móvil Consolidated
Mexico
Argentina, Paraguay & Uruguay
Brazil
Chile
Colombia
Ecuador
Peru
Central America
Caribbean
USA
Austria & CEE
Glossary
Currency Exchange Rates
United States Operating Data (IFRS)
1Q17 1Q16 Var.%
Wireless Subscribers (thousands) 24,745 25,211 -1.8%
MOU 519 501 3.5%
ARPU (US$) 23 21 11.2%
Churn (%) 5.4% 4.3% 1.0
INCOME STATEMENT (IFRS) - United States Millions of Dollars
1Q17 1Q16 Var.%
Total Revenues 1,985 1,755 13.1%
Service Revenues 1,753 1,565 12.0%
Equipment Revenues 231 190 22.0%
EBITDA 211 162 30.4%
% total revenues 10.6% 9.2%
EBIT 195 150 29.8%
% 9.8% 8.6%
United States
We ended the quarter with 24.7 million subscribers after net disconnections of 1.3 million, most of them clients from our SafeLink brand that failed to certify they were still eligible for the program under U.S. federal rules.
First quarter revenues, just shy of two billion dollars, exceeded by 13.1% those ob-tained a year before, with equipment revenues rising 22.0% and service revenues growing 12.0%. EBITDA came in at 211 million dollars and was up 30.4% from the year-earlier quarter, with an EBITDA margin of 10.6% of revenues, 1.4 percentage points more than a year before.
The annual comparison of our financials is affected by the acquisition of T-Mo-bile’s Walmart Family Plan in the third quarter of 2016. Adjusting for this, revenue growth would have been 3.8% year-on-year and EBITDA would have risen 24.6%.
25M wireless subs
1Q Revenues up 13%, EBITDA margin at 11%

page 20
CONTENT
Highlights
Relevant events
Subscribers
América Móvil Consolidated
Mexico
Argentina, Paraguay & Uruguay
Brazil
Chile
Colombia
Ecuador
Peru
Central America
Caribbean
USA
Austria & CEE
Glossary
Currency Exchange Rates
INCOME STATEMENT (IFRS) - Telekom Austria Group Millions of Euros
1Q17 1Q16 Var.%
Total Revenues 1,059 1,009 4.9%
Total Service Revenues 956 914 4.7%
Wireless Revenues 644 629 2.4%
Service Revenues 524 520 0.8%
Equipment Revenues 97 90 7.5%
Fixed Line and Other Revenues 415 381 9.0%
EBITDA 340 334 1.5%
% total revenues 32.1% 33.1%
EBIT 126 117 7.9%
% 11.9% 11.6%*Total Revenues reflect eliminations derived from both the overlap of fixed and mobile operations as well as international intercompany transactions; Wireless Revenues and Fixed Line and Other Revenues only exclude intercompany transactions with foreign subsidiaries. The sum of the parts will not equal Total Revenues. For further detail please visit www.telekomaustria.com/en/investor-relations
Telekom Austria Group
Our European operations ended March with 20.6 million wireless subscribers, 0.4% more than a year before, as the increase in postpaid subscribers more than offset the losses of the prepaid segment. Fixed-RGUs were up 5.8% year-on-year following acquisitions in Belarus and Croacia; organically, RGUs would have (ris-en) 4.5%. Group revenues were up 4.9% year-over-year to 1.1 billion euros. The annual comparison is affected by a) the acquisition of Metronet in Croatia that has been consolidated as of Febrary 1st and the acquisition of Atlant Telecom in Belarus consolidated as of December 1st; b) extraordinary items booked in Austria. Cor-recting for these, revenue growth would have increased 2.7%. Strong service revenue performance in Belarus, Croatia and Slovenia more than compensated for the elimination of international roaming tariffs within the E.U. Such move had a substantial impact in Austria given the strong inflow of tourists to visiting from other countries in the E.U.; yet, service revenues rose 0.7% over the year (excluding one-offs). On a group level, service revenues grew 2.2%, organi-cally, buoyed by data services up 10% on both platforms. First quarter EBITDA declined 1.5% relative to the prior year—proforma and strip-ping out extraordinary items—due to an increase in high-value subscriber reten-tion costs and equipment costs; reported EBITDA was up 1.5%. The EBITDA margin stood at 32.1% of revenues.
Fixed-RGUs +5.8% YoY
1Q Adjusted revenues up 2.7% YoY
Adjusted service revenues +2.2% YoY
EBITDA margin at 32% of revenues

page 21
CONTENT
Highlights
Relevant events
Subscribers
América Móvil Consolidated
Mexico
Argentina, Paraguay & Uruguay
Brazil
Chile
Colombia
Ecuador
Peru
Central America
Caribbean
USA
Austria & CEE
Glossary
Currency Exchange Rates
Telekom Austria Group Operating Data (IFRS)
1Q17 1Q16 Var.%
Wireless Subscribers (thousands) 20,622 20,530 0.4%
Postpaid 15,074 14,804 1.8%
Prepaid 5,547 5,726 -3.1%
MOU 302 298 1.3%
ARPU (Euros) 9 10 -10.4%
Churn (%) 2.0% 2.0% (0.0)
Revenue Generating Units (RGUs) * 5,920 5,594 5.8%*Fixed Line, Broadband and Television.

page 22
CONTENT
Highlights
Relevant events
Subscribers
América Móvil Consolidated
Mexico
Argentina, Paraguay & Uruguay
Brazil
Chile
Colombia
Ecuador
Peru
Central America
Caribbean
USA
Austria & CEE
Glossary
Currency Exchange Rates
Glossary of Terms
ARPU Average Revenue per User. The ratio of service revenues in a given period to the average number of wireless subscribers in the same period. It is pre-sented on a monthly basis.
ARPM Average Revenue per Minute. The ratio of service revenues to airtime traffic.
Capex Capital Expenditure. Accrued capital expenditures related to the expansion of the telecommunications infrastructure.
Churn Disconnection Rate. The ratio of wireless subscribers disconnected during a given period to the number of wireless subscribers at the beginning of that period.
EBIT Earnings Before Interest and Taxes, also known as Operating Profit.
EBIT margin The ratio of EBIT to total operating revenue.
EBITDA Earnings Before Interest, Taxes, Depreciation, and Amortization.
EBITDA margin The ratio of EBITDA to total operating revenue.
EPS (Mexican pesos) Earnings per share. Total earnings in Mexican pesos divided by total shares.
Earnings per ADR (US$) Total earnings in U.S. dollars divided by total ADRs equivalent.
Equity subscribers Subscribers weighted by the economic interest held in each company.
Gross additions Total number of subscribers acquired during the period.
Licensed pops Licensed population. Population covered by the licenses that each of the
companies manage.
LTE Long-term evolution is a 4th generation standard for wireless communica-tion of high-speed data for mobile phones and data terminals.
Market share A company’s subscriber base divided by the total number of subscribers in
that country.
MOU Minutes of Use per subscriber. The ratio of wireless traffic in a given period to the average number of wireless subscribers in that same period. It is pre-sented on a monthly basis.
Net subscriber additions The difference in the subscriber base from one period to another. It is the
different between gross additions and disconnections.

page 23
CONTENT
Highlights
Relevant events
Subscribers
América Móvil Consolidated
Mexico
Argentina, Paraguay & Uruguay
Brazil
Chile
Colombia
Ecuador
Peru
Central America
Caribbean
USA
Austria & CEE
Glossary
Currency Exchange Rates
Net debt Total short and long term debt minus cash and marketable securities.
Net debt / EBITDA The ratio of total short and long term debt minus cash and securities to trail-
ing 12-month income before interest, taxes, depreciation and amortization.
Prepaid Subscriber that may purchase airtime to recharge a cellular phone. The cli-ent does not hold a contract with the company for voice and data services.
Postpaid Subscriber that has a contract for the use of airtime. The client has no need of activating airtime, it is done so immediately.
SMS Short Message Service.
SAC Subscriber Acquisition Cost. The sum of handset subsidies, marketing ex-penses and commissions to distributors for handset activation. Handset sub-sidy is calculated as the difference between equipment cost and equipment revenues.
Wireless penetration The ratio of total wireless subscribers in any given country divided by the
total population in that country.

page 24
Exchange Rates Local Currency Units per USD
1Q17 1Q16 Var.%
Mexico
EoP 18.81 17.40 8.1%
Average 20.42 18.04 13.2%
Brazil
EoP 3.17 3.56 -11.0%
Average 3.14 3.90 -19.4%
Argentina
EoP 15.39 14.70 4.7%
Average 15.67 14.45 8.4%
Chile
EoP 664 670 -0.9%
Average 655 702 -6.6%
Colombia
EoP 2,880 3,022 -4.7%
Average 2,922 3,255 -10.2%
Guatemala
EoP 7.34 7.71 -4.8%
Average 7.43 7.68 -3.2%
Honduras
EoP 23.66 22.79 3.8%
Average 23.73 22.71 4.5%
Nicaragua
EoP 29.68 28.27 5.0%
Average 29.50 28.10 5.0%
Costa Rica
EoP 567 542 4.6%
Average 565 543 4.1%
Peru
EoP 3.25 3.33 -2.4%
Average 3.29 3.45 -4.7%
Paraguay
EoP 5,638 5,629 0.2%
Average 5,653 5,796 -2.5%
Uruguay
EoP 28.54 31.74 -10.1%
Average 28.51 31.54 -9.6%
Dominican Republic
EoP 47.37 45.84 3.3%
Average 47.08 45.74 2.9%
Austria & CEE
EoP 0.94 0.88 6.8%
Average 0.94 0.91 3.6%
CONTENT
Highlights
Relevant events
Subscribers
América Móvil Consolidated
Mexico
Argentina, Paraguay & Uruguay
Brazil
Chile
Colombia
Ecuador
Peru
Central America
Caribbean
USA
Austria & CEE
Glossary
Currency Exchange Rates

page 25
Exchange Rates Local Currency Units per MxP
1Q17 1Q16 Var.%
USA
EoP 0.05 0.06 -7.5%
Average 0.05 0.06 -11.6%
Brazil
EoP 0.17 0.20 -17.6%
Average 0.15 0.22 -28.7%
Argentina
EoP 0.82 0.84 -3.1%
Average 0.77 0.80 -4.2%
Chile
EoP 35.3 38.5 -8.3%
Average 32.1 38.9 -17.5%
Colombia
EoP 153 174 -11.8%
Average 143 180 -20.7%
Guatemala
EoP 0.39 0.44 -11.9%
Average 0.36 0.43 -14.4%
Honduras
EoP 1.26 1.31 -4.0%
Average 1.16 1.26 -7.7%
Nicaragua
EoP 1.58 1.62 -2.9%
Average 1.44 1.56 -7.2%
Costa Rica
EoP 30.16 31.16 -3.2%
Average 27.66 30.07 -8.0%
Peru
EoP 0.17 0.19 -9.7%
Average 0.16 0.19 -15.8%
Paraguay
EoP 300 323 -7.3%
Average 277 321 -13.8%
Uruguay
EoP 1.52 1.82 -16.8%
Average 1.40 1.75 -20.1%
Dominican Republic
EoP 2.52 2.63 -4.4%
Average 2.31 2.54 -9.1%
For further information please visit our website at: www.americamovil.com
América Móvil, S.A.B. de C.V. (the “Company”) quarterly reports and all other written materials may from time to time contain forward-looking statements that reflect the current views and/or expectations of the Company and its management with respect to its performance, business and future events. Forward looking statements include, without limitation, any statement that may predict, forecast, indicate or imply future results, performance, or achievements, and may contain words like “believe”, “anticipate”, “expect”, “envisages”, “will likely result”, or any other words or phrases of similar meaning. Such statements are subject to a number of risks, uncertainties and assumptions. We caution you that a number of important factors could cause actual results to differ materially from the plans, objectives, expectations, estimates and intentions expressed in this report. In no event, neither the Company nor any of its subsidiaries, affiliates, directors, officers, agents or employees shall be liable before any third party (including investors) for any investment or business decision made or action taken in reliance on the information and statements contained in this document or for any consequential, special or similar damages.
CONTENT
Highlights
Relevant events
Subscribers
América Móvil Consolidated
Mexico
Argentina, Paraguay & Uruguay
Brazil
Chile
Colombia
Ecuador
Peru
Central America
Caribbean
USA
Austria & CEE
Glossary
Currency Exchange Rates