AMÉRICA MÓVIL - America Movil · With the same conviction, at América Móvil we are investing to...
112
AMÉRICA MÓVIL 2014 ANNUAL REPORT
Transcript of AMÉRICA MÓVIL - America Movil · With the same conviction, at América Móvil we are investing to...

AMÉRICAMÓVIL
2014 ANNUAL REPORT

CONTENTS
Building 2Integrating 4Joining 6Relevant Financial Data 8Our Company at a Glance 10Letter to Our Shareholders 12
Operating ReviewAmérica Móvil 14Mexico 15Brazil 16Colombia 17Mercosur 18Ecuador and Perú 19Central America & Caribbean 20United States 20Telekom Austria 21
Board Members 22Directory 23Consolidated Financial Statements 24

Throughout history, the greatest bridges built by man have required the combination of vision, effort, perseverance, knowledge, creativity and audaci-ty, but above all, the conviction that it is possible to build them- through years of investments in its planning, design and execution- and the certainty that its benefits will be for the long-term
With the same conviction, at América Móvil we are investing to build the foundation of what will be a broad and efficient infrastructure to provide, voice, data and video; a bridge that will connect the re-gions that we serve with more coverage, capacity and speed, which will allow our clients to carry out their activities in a more productive and efficient manner These bridges will provide the infrastruc-ture that Latin America needs for its development for the next 20 or 30 years and will be fundamental to increase productivity in the region
11

the data platform of the future
Building
22
AMX1Submarine Cable
480,000Km of Fiber Optic Network
63% more than in 2010
40 billion dollars
Capex 2011-2014
These investments will allow us to have one of the most advanced telecom platforms in the world In the end, we will have built bridges that will more efficiently integrate the regions where we operate with the rest of the world and meet the growing telecommunications demands of a growing number of people
Began operations in October 2014At full capacity the cable can carry:• 846 million simultaneous calls • Transfer 53 million images
per second• Download 2 2 million songs
per second
33

more communities to modernity
Integrating
44
20142011
47%
35%
20142011
3% 9%● 2011● 2014
2014201122
%
16%
20142011
17%
27%
20142011
12%
13%
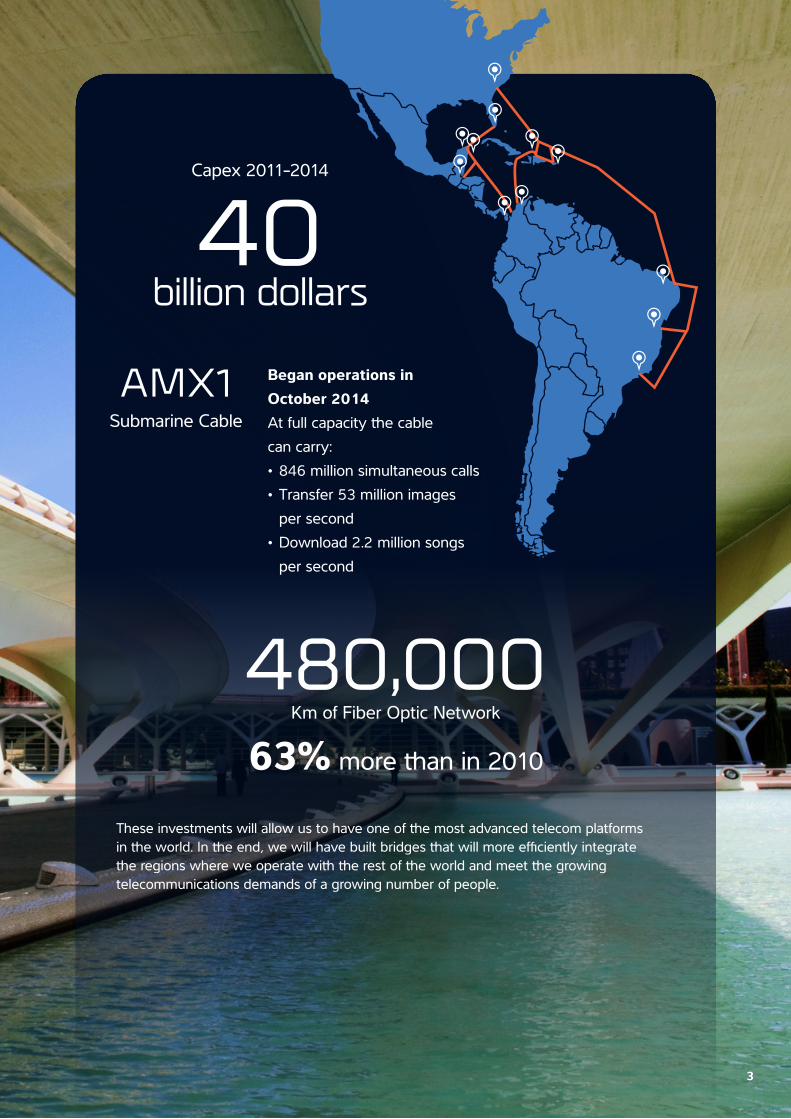
+13.3%
Telecommunications are bridg-es that contribute to economic progress, improvement in ed-ucation, business development and greater social inclusion
We see global telcos with a tendency toward integration between wireline and wireless networks The infrastructure that we are implementing opti-mizes constant innovation that has triggered the increase in
the use of our services through devices that are becoming more accessible to low income segments and paves the way for the expected growth in the coming years Our deployment of networks in the countries where we operate made us come closer to our clients and deliver the best voice quality, data speed, broadband and Pay TV services
YoY Growth of Wireless Data Revenue
● Wireless Voice 35%● Wireless Data 27%● Fixed Voice 16%● Fixed Data 13%● Pay TV 9%
Service Revenue Breakdown
Share of Business Line of Service Revenue
Pay
TV
Wire
less
Voi
ce
Fixe
d Vo
ice
Wire
less
Dat
a
Fixe
d D
ata
Voice Revenue in 2011 were about 70% of service revenues; today they are barely half of them
55

vision and commitment
Joining
66

2014
2013 290 74 364
289 78 368
66.5 21%Of our wireless
base is postpaid
12%Growth in
Pay-TV revenues
Throughout its history, América Móvil has been joining its vision and commitment to provide our clients with state-of-the-art products and services Not every company is eligible or willing to undertake the projects of the magnitude that we have carried out; it is not something that is built every day, or even every year
What we are building is a continent-wide infrastructure, a vital part without which the future of the region would be limited To make it happen, it requires a deep knowledge of the industry and a huge commitment, which is evident in the quality that we are delivering to our clients and will continue to evolve
Total Accessesmillions
● Mobile Subscribers ● Fixed RGU’s
Revenues in 2014 totaled
billion dollars
77
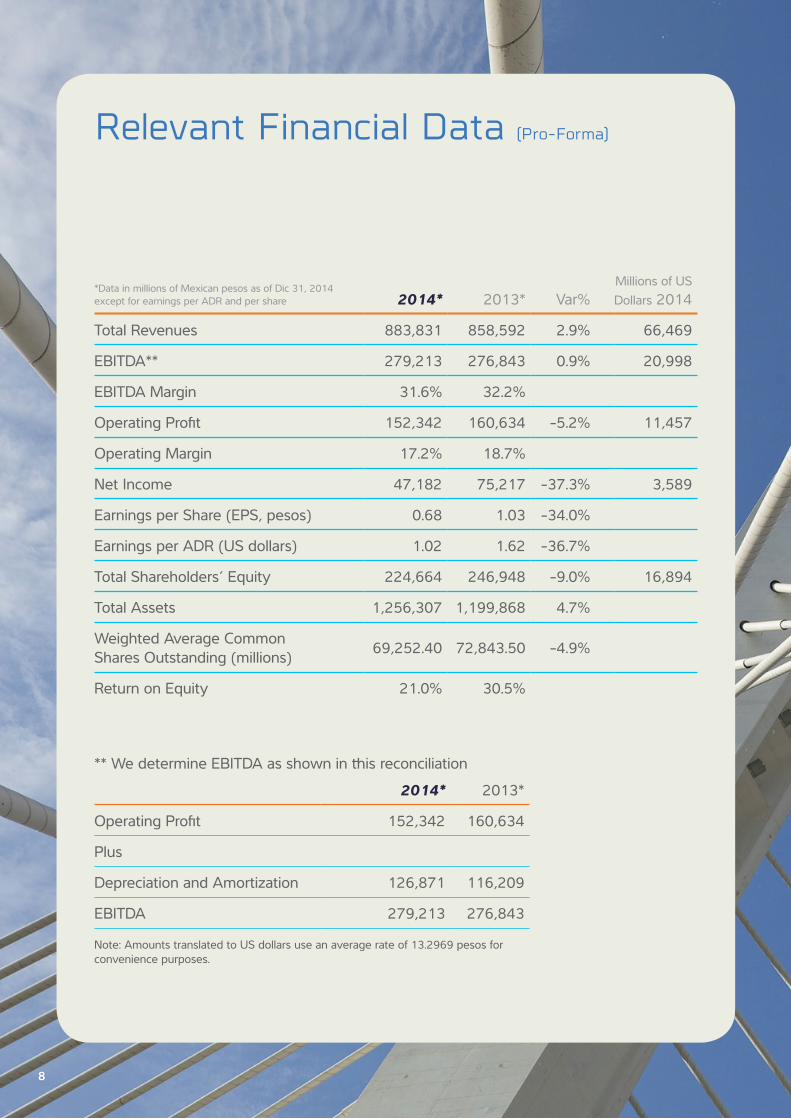
Relevant Financial Data (Pro-Forma)
*Data in millions of Mexican pesos as of Dic 31, 2014 except for earnings per ADR and per share 2014* 2013* Var%
Millions of US Dollars 2014
Total Revenues 883,831 858,592 2 9% 66,469
EBITDA** 279,213 276,843 0 9% 20,998
EBITDA Margin 31 6% 32 2%
Operating Profit 152,342 160,634 -5 2% 11,457
Operating Margin 17 2% 18 7%
Net Income 47,182 75,217 -37 3% 3,589
Earnings per Share (EPS, pesos) 0 68 1 03 -34 0%
Earnings per ADR (US dollars) 1 02 1 62 -36 7%
Total Shareholders‘ Equity 224,664 246,948 -9 0% 16,894
Total Assets 1,256,307 1,199,868 4 7%
Weighted Average Common Shares Outstanding (millions) 69,252 40 72,843 50 -4 9%
Return on Equity 21 0% 30 5%
** We determine EBITDA as shown in this reconciliation2014* 2013*
Operating Profit 152,342 160,634
Plus
Depreciation and Amortization 126,871 116,209
EBITDA 279,213 276,843
Note: Amounts translated to US dollars use an average rate of 13 2969 pesos for convenience purposes
88

99

2
3
4
9
6
1
5
3
7
8Our Company at a Glance
Mobile and fixed operations
Mobile operations
Non-controlled Entities
Our Company at a Glance
Mobile and fixed operations
Mobile operations
Non-controlled Entities
1010
10
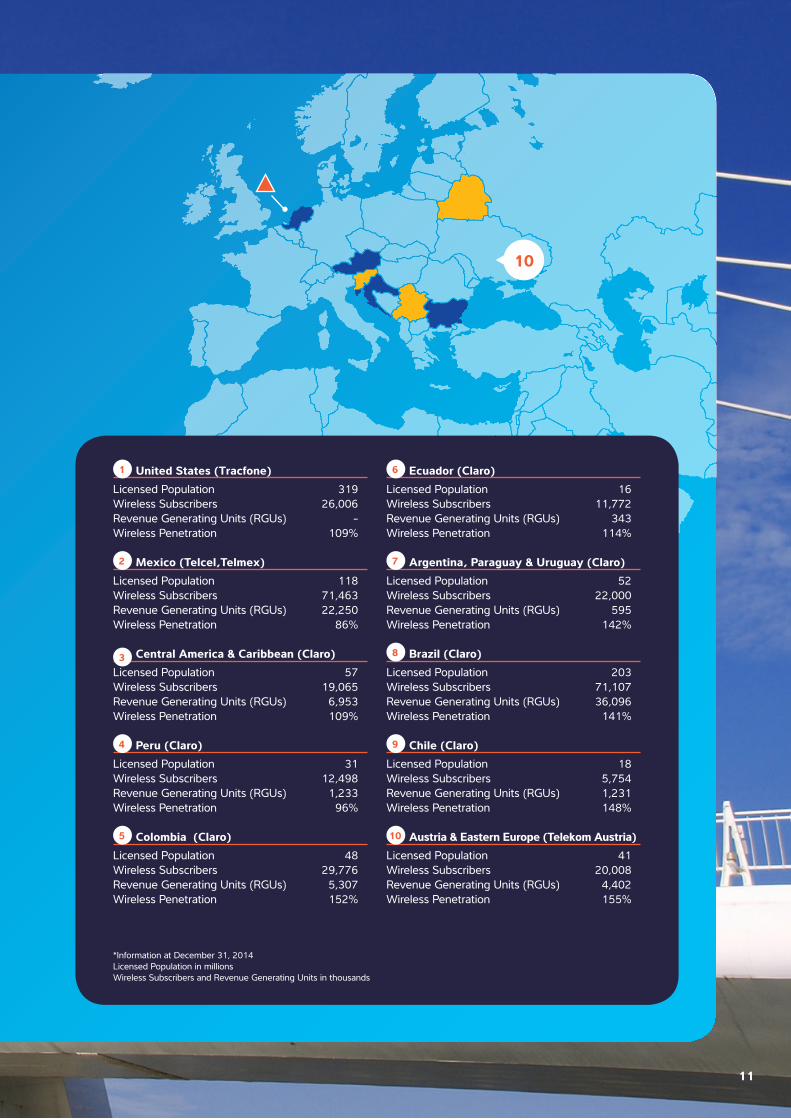
1 United States (Tracfone)Licensed Population 319Wireless Subscribers 26,006 Revenue Generating Units (RGUs) -Wireless Penetration 109%
2 Mexico (Telcel,Telmex) Licensed Population 118Wireless Subscribers 71,463 Revenue Generating Units (RGUs) 22,250 Wireless Penetration 86%
3 Central America & Caribbean (Claro) Licensed Population 57Wireless Subscribers 19,065 Revenue Generating Units (RGUs) 6,953 Wireless Penetration 109%
4 Peru (Claro) Licensed Population 31Wireless Subscribers 12,498 Revenue Generating Units (RGUs) 1,233 Wireless Penetration 96%
5 Colombia (Claro) Licensed Population 48Wireless Subscribers 29,776 Revenue Generating Units (RGUs) 5,307 Wireless Penetration 152%
6 Ecuador (Claro) Licensed Population 16Wireless Subscribers 11,772 Revenue Generating Units (RGUs) 343 Wireless Penetration 114%
7 Argentina, Paraguay & Uruguay (Claro) Licensed Population 52Wireless Subscribers 22,000 Revenue Generating Units (RGUs) 595 Wireless Penetration 142%
8 Brazil (Claro) Licensed Population 203Wireless Subscribers 71,107 Revenue Generating Units (RGUs) 36,096 Wireless Penetration 141%
9 Chile (Claro) Licensed Population 18Wireless Subscribers 5,754 Revenue Generating Units (RGUs) 1,231 Wireless Penetration 148%
10 Austria & Eastern Europe (Telekom Austria)Licensed Population 41Wireless Subscribers 20,008 Revenue Generating Units (RGUs) 4,402 Wireless Penetration 155%
*Information at December 31, 2014Licensed Population in millionsWireless Subscribers and Revenue Generating Units in thousands
1111

Letter to our Shareholders
2014 capped a five-year period during which we underwent a major transformation From being a mostly mobile wireless company we became a fully integrated one in substantially all the coun-tries where we operate Our capital expenditures soared, enabling us to significantly expand the quality and reach of our networks and thus pro-vide faster data services and new products We sought new horizons, making sizable investments in Europe including one in a company that we now consolidate
Our new investments in 2014, following on the ones made in 2012, gave us a majority stake in Telekom Austria and helped us strengthen its finances We had previously come to terms with the Austrian Government—still a major share-holder and the one controlling the company until May— under a syndicate agreement, which allowed us to consolidate the company in our
financial results from the third quarter of the year Telekom Austria was thus the first operation away from the Americas consolidated in our results
The year also commemorated the 25th anniver-sary of Telcel, our mobile operation in Mexico, and saw the culmination of the Telecoms Reform in Mexico, our home market Begun nearly two years earlier, the Reform marked a new beginning for the telecom sector, with the most sweeping regulatory changes since Telmex was privatized in 1991 It helped reshape the sector’s competi-tive situation, among other things by promoting the establishment of new Mobile Network Virtual Operators (MVNOs) that will seek to find a niche with end users
The Reform likely will lead to increased levels of investment in the sector which should allow for continued advances in wireless, fixed broadband and PayTV penetration The advent of new com-
petitors and the rapidly evolving technology pre-sent new challenges but also new opportunities
An Integrated OperatorThe rationale behind our becoming an integra-ted operator back in 2010—which predated by several years similar moves by operators in other markets, particularly in Europe—had to do with the realization that expanding and improving the fixed-line platform was key both to the delivery of faster mobile broadband services to a growing segments of the population, and to our ability to develop new products and services that are likely to be major drivers of growth in the years ahead
We integrated Telefonos de Mexico (Telmex) and Telmex Internacional, a set of fixed-line com-panies providing services in seven countries in South America which included the Brazilian entity Embratel, originally acquired by Telmex 10 years
ago And we consolidated our ownership of Net Serviços in Brazil
Immediately after these acquisitions we embarked on a huge investment program that saw us ramp up by 50% our going capital expenditures to the equivalent of 10 billion dollars per annum 2014 was the fourth year in what is to be a five-year 50 billion dollars investment effort
The results have been astounding: our fiber optic networks expanded by nearly two thirds in the period, to 480 thousand kilometers, as we built metropolitan rings and national and regional bac-kbones and set up backhaul lines to our cell sites The number of our cell sites increased by 85% as we expanded our 3G footprint and deployed new 4G LTE cell sites throughout our operations
This new fiber-optic based platform has been central to the development of mobile data ser-
12

vices, that were the most important driver of revenue growth in 2014, rising 14 6% over the year before at constant exchange rates
We invested heavily in new residential accesses, with the number of homes-passed tripling in Brazil and doubling in Colombia Our ability to provide triple play bundles in the region has been a nota-ble catalyst for growth: 70% of new RGUs come from the sale of such bundles that have literally been our beachheads We have come to repre-sent the number one fixed-broadband operator in several markets and an important one in fixed-voi-ce, which is saying a lot considering that we didn’t have much of a presence in the fixed-line market in South America at the beginning of the period
As with mobile data services, the new fiber-optic and cable-based fixed line platform was critical for PayTV and fixed-broadband Revenues derived from those services were up 12 7% and 12 0% at constant exchange rates The investments made throughout the period were key in allowing us to migrate away from voice services and more towards data services, including PayTV
But PayTV is more than IpTV or cable We have significantly strengthened our satellite PayTV capa-bilities This year we are launching a new satellite and one more in 2016, in addition to the 2 satelli-tes that we put in orbit in the last two years, taking to 8 our satellites in operation All the new satellites plus the ones to be launched this year and next are different from original satellites in our fleet, which were only meant to provide long distance service in Brazil; they now have PayTV capabilities and cover all of Latin America, not only Brazil
In the second half of 2014 our submarine cable began operations At 85 terabytes per second and 17,500 kms, this is an important investment: with 12 landing points, it links the South American markets with the U S , and all of them with Mexi-co and the Caribbean We have thus ensured that we have ample capacity to support the growth of data services throughout the region in years to come, establishing fiber optic connections all the way from our cell sites to the switches in the various regions and countries in Latin America and, finally, to the U S
Financial and Operating PerformanceOur operations had a solid performance in 2014, with fixed-line RGUs increasing 6 5% from the year before to 78 4 million RGUS and our pos-
tpaid wireless base growing 5 1% to 59 5 million subscribers Altogether we ended the year with 368 million access lines, having disconnected prepaid clients in various countries as we imple-mented a common churn policy throughout our operations
At 884 billion pesos, our operating revenues were up 2 9% year over year in peso terms and 5 3% at constant exchange rates, with an EBITDA margin of 31 6% that was slightly down—approximately half a percentage point—from the prior year
Our investment program led to the transformation of our infrastructure and ultimately or our revenue structure Mobile data revenues more than dou-bled their share of revenues, to 30%, and that of PayTV revenues, almost nil back in 2010, is now nearly 10% Both business segments were the fastest growing ones in the period whereas voice revenues, which used to represent nearly three quarters of our revenues, today account for just over half of them
From the outset America Movil has been financia-lly strong We have taken great care in maintaining a financial position that is sound and that affords us relative certainty in the midst of volatile financial markets This has enabled us to improve our credit ratings over the years They now stand among the top ones in the telecom sector globally
We have paid dividends to our shareholders since our first year of operation Throughout the last 14 years we maintained a growing dividend per share In 2014 we paid out dividends and share buybacks in the amount of 52 1 billion pesos and in 2015 shareholder distributions will include also an extraordinary dividend payment: ordinary and extraordinary dividends alone will total 36 6 billion pesos
America Movil is a strong competitor in its mar-kets The investments and acquisitions we have made over the years provided us with a telecom infrastructure that has no match in our region of operation It has been key in allowing us to maintain the preference of our clients and conti-nue to grow our customer base As was the hard, enthusiastic work from our 191,156 employees and management team distributed in 25 countries throughout the Americas and Europe We will continue to push ahead moving our company to new products and services and, we expect, to ever-greater levels of customer satisfaction
Carlos Slim DomitChairman of the Board
Daniel Hajj AboumradChief Executive Officer
13

Operating Review
América Móvil
We ended 2014 with 367 8 million access lines, 8 4% more than a year before which mostly reflects the consolidation of Telekom Austria that was carried out since July 1, 2014 The organic growth rate of our total access base was 1 2% com-pared with 2013 Altogether we had 289 4 million wireless subscribers, 34 3 million landlines, 22 6 million broadband accesses and 21 5 million Pay TV units Brazil is our largest and fastest-growing operation with 107 2 million accesses as of December, which rose 5 7% from the year before
At December 31st, we had 289 4 million wireless subscribers, practically at the same level compared with the previous year given that throughout the year we disconnected prepaid clients in various countries as we implemented a common churn policy amongst our operations As for our postpaid base, it increased 5 1% organically to 59 5 million subscribers Moreover, Brazil and Mexico each account for a fourth of our wireless client base Additionally, Colombia contributes 10% of our subscribers followed by TracFone in the US with 9% Altogether, our operations in the Argentinean block represent approximately 8%, while those in Europe and the ones in the Central America-Caribbean block each account for 7%
At year-end, we had 78 4 million RGUs, 6 5% more than a year before (proforma) It is important to highlight that nearly half of the RGUs—46%—were in Brazil, with Mexico accounting for 28%, Colombia 7%, and both Central America and Europe (Telekom Austria) slightly less than 6%
In 2014, revenues totaled 66 5 billion dollars; they were 2 9% higher in Mexican peso terms Mobile data revenues and Pay TV revenues continued to be the most important growth drivers, reflecting increases of 13 3%, and 11 9%, respective-ly Mobile voice revenues continued to deteriorate partly on account of regulatory measures
We generated EBITDA of 21 billion dollars for the full year, which translated into an EBITDA margin of 31 6%
Throughout the year we funded capital expenditures in the amount of 11 1 billion dollars and distributed 3 9 billion dollars to shareholders We acquired minority interests and subscribed new equity in the aggregate amount of 775 million dollars
América Móvil Subsidiaries as of December 2014
Country Brand Equity ParticipationMexico Telcel 100 0%
Telmex 98 7%Sección Amarilla* 98 4%
Argentina Claro 100 0%Telmex 99 7%
Brazil Claro** 94 9%Chile Claro 100 0%
Telmex* 100 0%Colombia Comcel 99 4%
Telmex 99 3%Costa Rica Claro 100 0%Dominicana Claro 100 0%Ecuador Claro 100 0%
Telmex * 98 4%El Salvador Claro 95 8%Guatemala Claro 99 3%Honduras Claro 100 0%Nicaragua Claro 99 6%Panama Claro 100 0%Paraguay Claro 100 0%Peru Claro 100 0%Puerto Rico Claro 100 0%Uruguay Claro 100 0%USA Tracfone 98 2%Mexico Telvista*** 89 4%Holland KPN 21 4%Austria TKA 59 7%
* Equity participation of Telmex Internacional of which América Móvil owns 97 79% and Telmex
** On December 31, 2014, Embratel and Net merged into Claro of which América Móvil owns 78 23% through Telmex Internacional and 16 70% through Sercotel
*** América Móvil owns directly 45% and 45% through its subsidiary Telmex
14

2013
2013
73.5
22.5
2014
2014
71.5
22.3
2013
2013
21.6
9.5
2014
2014
21.0
9.2
Operating Review
2014 marked the 25th anniversary of Telcel In 1989 we had an ambitious project to connect Mexico and every Mexican to a mobile communications system: 25 years later, this project exceeded our expectations Innovation was and still is the key word We firmly believed that we could develop our own vision of cellular telephony The massive expansion of cellular telephony through the “Amigo” prepaid system made Telcel a reference in the world The prepaid system that that we fostered transformed the industry which led to a significant growth in the number of Telcel users We also developed the Telcel 3G Internet system which led the way where mobile data was going We launched 4G LTE services in Mexico in November of 2012 and we now reach over 70 million people At year-end, Telcel served 71 5 million wire-less subscribers in Mexico; 25 years ago few people could have forecasted what has happened in telecommunications and also what Telcel has accomplished in this period
Our postpaid base continued with a positive trend reflecting an increase of 6% year-on-year On the fixed platform, TEL-MEX ended the year with 13 1 million fixed lines, including social telephony, and 9 2 million broadband accesses, up almost 3% compared with 2013
Revenues from our Mexican operations reached 20 9 billion dollars for the full year They were only up almost 1% in peso terms relative to the prior year due to decreases in voice revenues from our mobile and fixed platforms of 9 6% and 4 5%, respectively
Wireless data revenues were up 14 2% as we continued to increase the penetration of data services throughout the country on the back of a more comprehensive 3G and 4G footprint As for our fixed data revenues, they were up 9 5% year-on-year
EBITDA for the year totaled 9 2 billion dollars The increase in EBITDA resulted from the implementation of policies aimed at decreasing operational costs and of a more conservative commercial approach, including a reduced support on the sale of handsets
In August the new Federal Telecommunications Law took effect It calls for the elimination of national roaming charges for all operators and asymmetric interconnection rates for Telcel, with Telcel continuing to pay its competitors inter-connection charges but not being able to charge them at all for the same service The economic impact of the measures enacted was offset by the continued expansion of our mobile data services and a reduced support on the sale of handsets on our part relative to what we had been providing in the market for some months
The Mexican economy observed a moderate rate of growth in 2014 We expect it to be around 2%, but is set to increase in 2015 in spite of falling oil prices and may turn out to be around 50% higher than it was last year The base is there to support higher growth rates, given the investments by the private sector in energy, petrochemicals, telecoms, infrastruc-ture and housing, among others
Mexico
Subscribers(millions)
WIRELESS
FIXED
Financial Results(billion dollars)
REVENUES
EBITDA
15

2013
2013
68.7
32.7
2014
2014
65.3
36.1
2013
2013
15.4
3.6
2014
2014
15.1
3.8
Operating Review
Brazil is our largest and fastest-growing operation with 107 2 million accesses at year-end 2014, up 5 7% from 2013 This figure includes 71 1 million wireless subscribers; up 3 5% year-on-year with the postpaid segment expanding 9 3% Wireless net additions for the year totaled were 2 4 million of which more than half were postpaid On the fixed line side, RGUs were up 10 4% to 36 1 million, with the number of PayTV units climbing 10 4%, broadband accesses 13 6% and wirelines 8 7%
Revenues for the year totaled 15 1 billion dollars, an increase of 7 2% in local currency terms At local currency terms year-on-year revenues increased 7 2% with ser-vice revenues rising 7 2% Mobile data revenues increased 25 2% and those deriving from fixed data usage were up 14 4%, whereas PayTV revenues rose 16 6% Voice reve-nues declined in both platforms
EBITDA for the full year totaled 3 8 billion dollars, an increase of 14 3% in local currency terms compared with 2013 The EBITDA margin stood at 25 3% of revenues
In September 2014, Claro Brazil was granted the use of 20MHz of spectrum na¬tionwide in the 700MHz frequency for a 15-year period The spectrum will be used in conjunc-tion with our 4G-LTE network It is important to highlight that we have the broadest 4G-LTE coverage in Brazil We have opened up our networks to prepaid clients that may now benefit from better and faster value-added services
Another milestone in 2014 was that acquisition of Embratel 10 years ago At the time of the acquisition, the company only had a concession for local and long distance com-munications Today, Embratel has enhanced its telecom-munications services and IT services for SME’s and large corporations, as well as Pay TV services It is also important to highlight that at the end of 2014, Embratel, Claro and Net Serviços were fully merged into one single entity, Claro S A This was a complex project that had to integrate systems and platforms, processes and personnel This will result in operational efficiencies and greater benefits for our clients
Brazil
Subscribers(millions)
WIRELESS
FIXED
Financial Results(billion dollars)
REVENUES
EBITDA
16

2013
2013
29.0
2014
2014
29.8
2013
2013
5.8
2.6
2014
2014
5.7
2.2
4.7
5.3
Operating Review
In Colombia, we ended 2014 with nearly 30 million wireless subscribers, and 5 3 million RGUs, 4 0% more than a year before The number of fixed lines and broadband accesses increased 16 1% and 18 3%, respectively
Annual revenues topped 5 7 billion dollars with an increase of 5 2% in local currency terms Data revenues showed solid improvements growing 5 8% in mobile and 13 3% on fixed data year on year
PayTV revenues increased 13 4% while fixed voice revenues climbed 4 2 % year-on-year
EBITDA came in at 2 2 billion dollars and the EBITDA margin for year was 39 0% of revenues
Colombia
Subscribers(millions)
FIXED
Financial Results(billion dollars)
EBITDA
REVENUES WIRELESS
17

2013
2013
28.2
1.7
2014
2014
27.8
1.8
2013
2013
4.8
1.1
2014
2014
4.3
1.1
Operating Review
Our combined operations ended December with 27 7 million wireless subscribers, slightly down compared with the year before, mainly due to disconnections in our wireless prepaid subscribers in Chile that were not generating traffic For the fixed platform combined operations grew 6 6% compared to the prior year; during the period
In 2014, revenues reached 4 2 billion dollars, 20 1% more than the previous year in constant currency terms Data ser-vice revenues grew for both platforms, 29 8% for fixed and 33 4% for mobile and PayTV revenues grew 16 2%
EBITDA for the year came in at 1 1 billion dollars and was equivalent to 25 3% of revenues, 2 3 percentage points more than the prior year
In Argentina, we were granted the use of 20 MHz of spectrum nationwide in the 1,700 MHz band as well as 30 MHz in the 700 MHz band to provide 4G LTE services in the country In addition to these, we were also awarded the use of certain blocks of 5 or 10 MHz of spectrum in the 1,800 MHz band to strengthen our 3G offer Additionally, in Uru-guay we completed the deployment of our 4GLTE network
Mercosur
Subscribers(millions)
FIXED
Financial Results(billion dollars)
EBITDA
REVENUES WIRELESS
Argentina, Paraguay, Uruguay and Chile
18
2013
2013
23.9
1.3
2014
2014
24.3
1.6
2013
2013
3.5
1.4
2014
2014
3.6
1.4
Operating Review
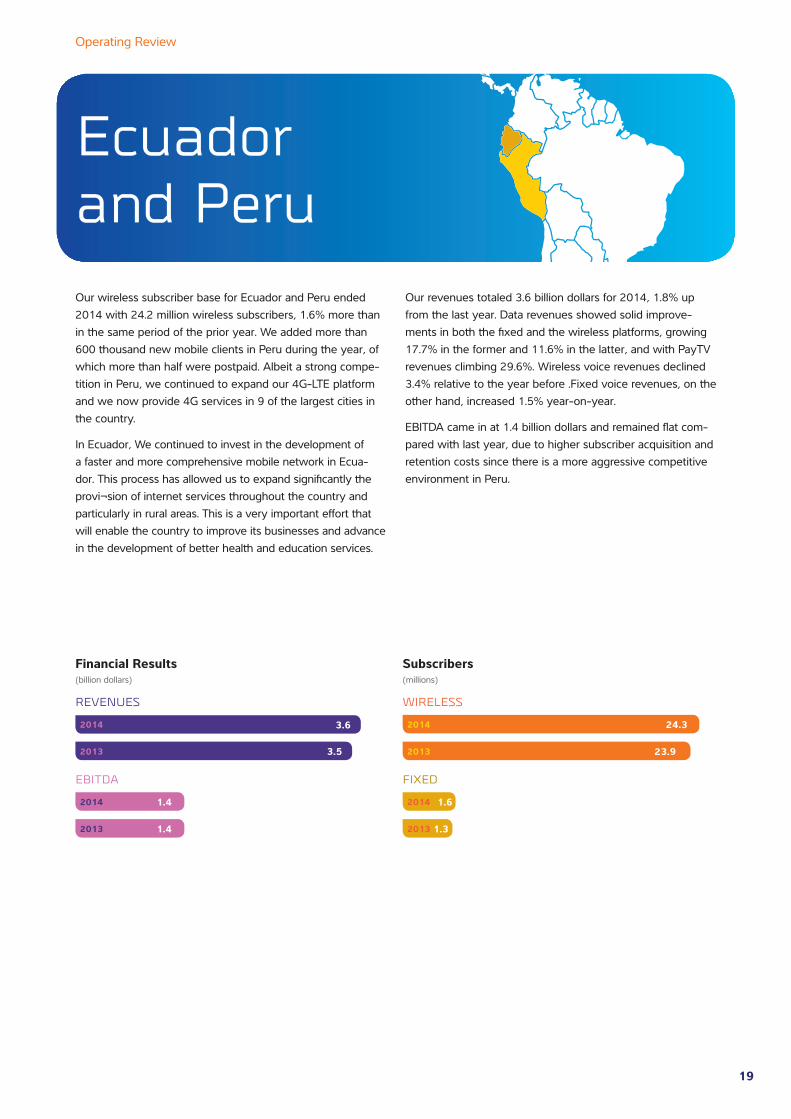
Our wireless subscriber base for Ecuador and Peru ended 2014 with 24 2 million wireless subscribers, 1 6% more than in the same period of the prior year We added more than 600 thousand new mobile clients in Peru during the year, of which more than half were postpaid Albeit a strong compe-tition in Peru, we continued to expand our 4G-LTE platform and we now provide 4G services in 9 of the largest cities in the country
In Ecuador, We continued to invest in the development of a faster and more comprehensive mobile network in Ecua-dor This process has allowed us to expand significantly the provi¬sion of internet services throughout the country and particularly in rural areas This is a very important effort that will enable the country to improve its businesses and advance in the development of better health and education services
Our revenues totaled 3 6 billion dollars for 2014, 1 8% up from the last year Data revenues showed solid improve-ments in both the fixed and the wireless platforms, growing 17 7% in the former and 11 6% in the latter, and with PayTV revenues climbing 29 6% Wireless voice revenues declined 3 4% relative to the year before Fixed voice revenues, on the other hand, increased 1 5% year-on-year
EBITDA came in at 1 4 billion dollars and remained flat com-pared with last year, due to higher subscriber acquisition and retention costs since there is a more aggressive competitive environment in Peru
Ecuador and Peru
Subscribers(millions)
WIRELESS
FIXED
Financial Results(billion dollars)
REVENUES
EBITDA
19
2013
2013
23.0
6.5
2014
2014
19.1
7.0
2013
2013
3.9
1.3
2014
2014
4.0
1.4
2013 23.7
2014 26.0
2013
2013
6.0
0.5
2014
2014
6.9
0.7
Operating Review
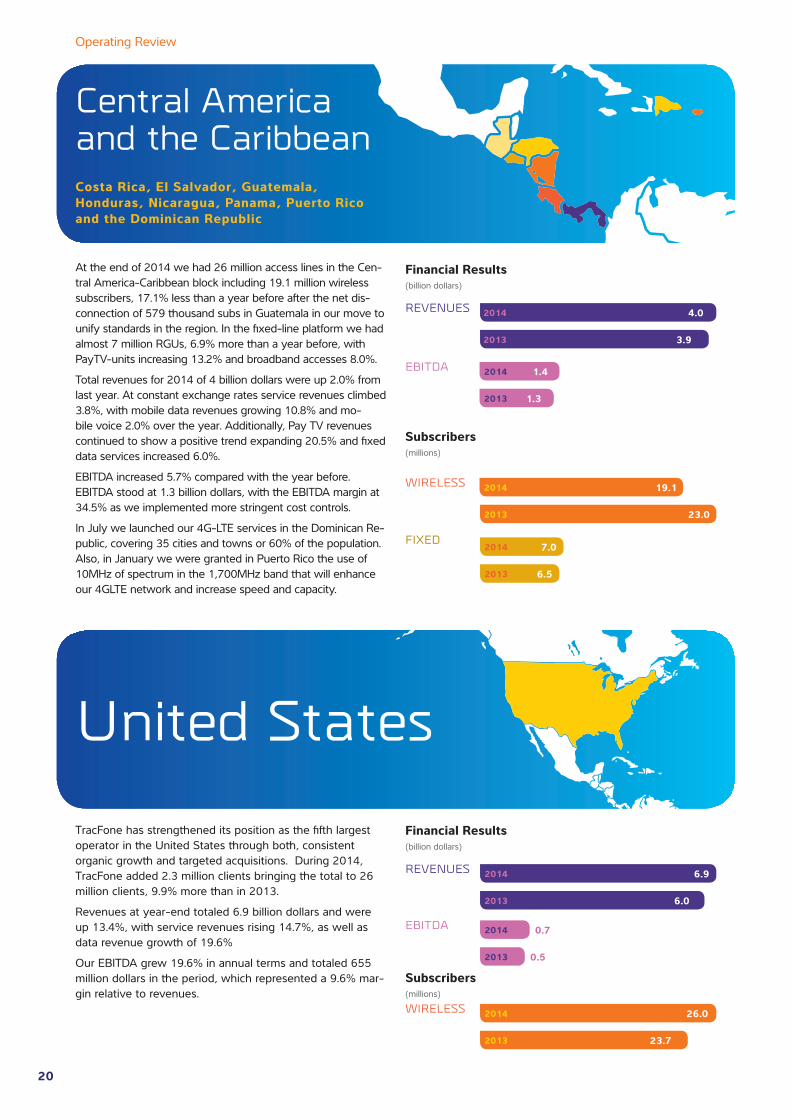
At the end of 2014 we had 26 million access lines in the Cen-tral America-Caribbean block including 19 1 million wireless subscribers, 17 1% less than a year before after the net dis-connection of 579 thousand subs in Guatemala in our move to unify standards in the region In the fixed-line platform we had almost 7 million RGUs, 6 9% more than a year before, with PayTV-units increasing 13 2% and broadband accesses 8 0%
Total revenues for 2014 of 4 billion dollars were up 2 0% from last year At constant exchange rates service revenues climbed 3 8%, with mobile data revenues growing 10 8% and mo-bile voice 2 0% over the year Additionally, Pay TV revenues continued to show a positive trend expanding 20 5% and fixed data services increased 6 0%
EBITDA increased 5 7% compared with the year before EBITDA stood at 1 3 billion dollars, with the EBITDA margin at 34 5% as we implemented more stringent cost controls
In July we launched our 4G-LTE services in the Dominican Re-public, covering 35 cities and towns or 60% of the population Also, in January we were granted in Puerto Rico the use of 10MHz of spectrum in the 1,700MHz band that will enhance our 4GLTE network and increase speed and capacity
Central America and the CaribbeanCosta Rica, El Salvador, Guatemala, Honduras, Nicaragua, Panama, Puerto Rico and the Dominican Republic
Subscribers(millions)
WIRELESS
FIXED
Financial Results(billion dollars)
REVENUES
EBITDA
TracFone has strengthened its position as the fifth largest operator in the United States through both, consistent organic growth and targeted acquisitions During 2014, TracFone added 2 3 million clients bringing the total to 26 million clients, 9 9% more than in 2013
Revenues at year-end totaled 6 9 billion dollars and were up 13 4%, with service revenues rising 14 7%, as well as data revenue growth of 19 6%
Our EBITDA grew 19 6% in annual terms and totaled 655 million dollars in the period, which represented a 9 6% mar-gin relative to revenues
United States
Subscribers(millions)
WIRELESS
Financial Results(billion dollars)
REVENUES
EBITDA
20
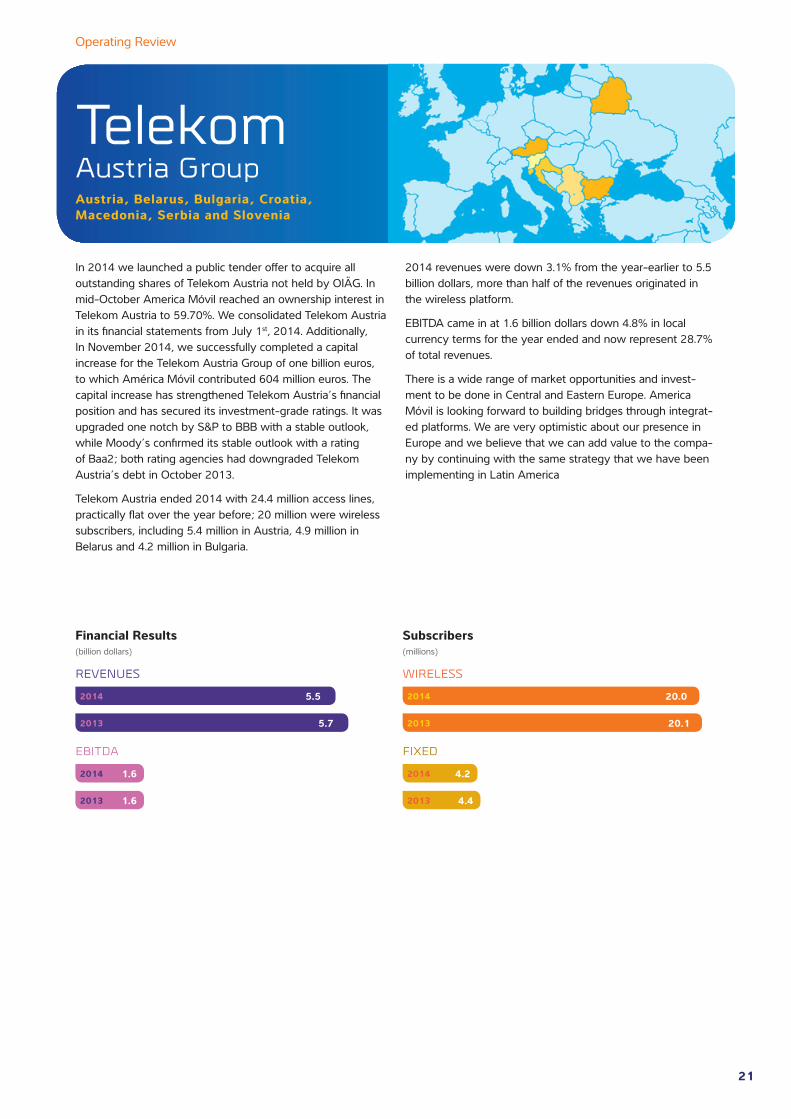
In 2014 we launched a public tender offer to acquire all outstanding shares of Telekom Austria not held by OIÄG In mid-October America Móvil reached an ownership interest in Telekom Austria to 59 70% We consolidated Telekom Austria in its financial statements from July 1st, 2014 Additionally, In November 2014, we successfully completed a capital increase for the Telekom Austria Group of one billion euros, to which América Móvil contributed 604 million euros The capital increase has strengthened Telekom Austria’s financial position and has secured its investment-grade ratings It was upgraded one notch by S&P to BBB with a stable outlook, while Moody’s confirmed its stable outlook with a rating of Baa2; both rating agencies had downgraded Telekom Austria’s debt in October 2013
Telekom Austria ended 2014 with 24 4 million access lines, practically flat over the year before; 20 million were wireless subscribers, including 5 4 million in Austria, 4 9 million in Belarus and 4 2 million in Bulgaria
2014 revenues were down 3 1% from the year-earlier to 5 5 billion dollars, more than half of the revenues originated in the wireless platform
EBITDA came in at 1 6 billion dollars down 4 8% in local currency terms for the year ended and now represent 28 7% of total revenues
There is a wide range of market opportunities and invest-ment to be done in Central and Eastern Europe America Móvil is looking forward to building bridges through integrat-ed platforms We are very optimistic about our presence in Europe and we believe that we can add value to the compa-ny by continuing with the same strategy that we have been implementing in Latin America
2013
2013
20.1
4.4
2014
2014
20.0
4.2
2013
2013
5.7
1.6
2014
2014
5.5
1.6
Austria, Belarus, Bulgaria, Croatia, Macedonia, Serbia and Slovenia
Operating Review
Telekom Austria Group
Subscribers(millions)
WIRELESS
FIXED
Financial Results(billion dollars)
REVENUES
EBITDA
21

Board MembersCarlos Slim Domit » ChairmanBorn: 1967Principal Occupation: Chairman of the Board of Directors of Telmex
Patrick Slim Domit » Vice-Chairman Born:1969Principal Occupation: Co-Chairman of América Móvil
Daniel Hajj Aboumrad Born:1966Principal Occupation : Chief Executive Officer of América Móvil
Carlos Slim HelúBorn:1940Principal Occupation: Chairman of the Board of Minera Frisco S A B de C V
Luis Alejandro Soberón Kuri Born:1960Principal Occupation: Chief Executive Officer of Corporación Interamericana de Entretenimiento, S A B de C V
Carlos Bremer Gutiérrez Born:1960Principal Occupation: Chief Executive Officer of Value Grupo Financiero S A B de C V
Juan Antonio Pérez SimónBorn: 1941Principal Occupation: Chairman of the Board and Member of the Executive Committee of Sanborn Hermanos
Ernesto Vega Velasco Born: 1937Principal Occupation: In Retirement Member of the board of directors and audit and corporate practices, planning and finance and evaluation and compensation committees of certain companies
Rafael Moisés Kalach MizrahiBorn:1946Principal Occupation: Chairman of the Board and Chief Executive Officer of Grupo Kaltex, S A de C V
Antonio Cosío PandoBorn: 1968Principal Occupation: Chief Executive Officer of Grupo Las Brisas and General Manager of Compañía Industrial Tepejí del Río S A de C V
Arturo Elías AyubBorn: 1966Principal Occupation: Head of Strategic Alliances, Communications and Institutional Relations of Telmex; Chief Executive Officer of Fundación Telmex
Oscar Von Hauske SolísBorn: 1957Principal Occupation: Chief Fixed Line Operations Officer of América Móvil
Louis C. CamilleriBorn: 1955Principal Occupation: Chief Executive Officer of Philip Morris International
Pablo Roberto González Guajardo Born:1967Principal Occupation: Chief Executive Officer of Kimberly Clark de México, S A B de C V
David Ibarra Muñoz Born: 1930Principal Occupation: Retired
Alejandro Cantú Jiménez, our General Counsel, serves as Corporate Secretary and Rafael Robles Miaja as Corporate Pro-Secretary
22
DirectoryAmérica MóvilDaniel Hajj AboumradChief Executive Officer
Carlos García Moreno ElizondoChief Financial Officer
Oscar Von Hauske SolísExecutive Director Fixed Line Operations
Ángel Alija GuerreroExecutive Director Mobile Operations
Alejandro Cantú JiménezGeneral Counsel
MexicoTelmexHéctor Slim SeadeChief Executive Officer
Carlos Robles MiajaChief Financial Officer
TelcelPatricia Raquel Hevia CotoChief Operating Officer
Salvador Cortés GómezExecutive Director of Regional Units
Fernando Ocampo CarapiaChief Financial Officer
Central AmericaJuan Antonio AguilarChief Executive Officer
Enrique Luna RoshardtChief Financial Officer
ColombiaJuan Carlos Archila CabalChief Executive Officer
Fernando González ApangoChief Financial Officer
EcuadorAlfredo Escobar San LucasChief Executive Officer
Marco Antonio Campos GarcíaChief Financial Officer
PeruHumberto Chávez LópezChief Executive Officer
Carlos SolanoChief Financial Officer
BrazilJose Antonio Guaraldi Félix President
José Formoso MartínezCEO Corporate Market Unit
Daniel Feldman BarrosCEO Residential Market Unit
Carlos Hernán Zenteno de los Santos CEO Personal Market Unit
Roberto CatalãoChief Financial Officer
ChileMauricio EscobedoChief Executive Officer
Alfonso LaraChief Financial Officer
Argentina, Uruguay & ParaguayJulio Carlos PorrasChief Executive Officer
Daniel De MarcoChief Financial Officer
Dominican RepublicOscar Peña ChacónChief Executive Officer
Francisco Marmolejo AlcántaraChief Financial Officer
Puerto RicoEnrique Ortiz de Montellano Rangel Chief Executive Officer
Ana María BetancourtChief Financial Officer
PanamaOscar BordaChief Executive Officer
Abraham HernándezChief Financial Officer
United StatesF.J. PollakChief Executive Officer
Gustavo Blanco VillanuevaChief Financial Officer
Telekom Austria Alejandro PlaterChief Executive Officer
Siegfried MayrhoferChief Financial Officer
23
Year ended December 31, 2014 with Report of Independent Registered Public Accounting Firm
ContentsReport of Independent Auditors 25Consolidated Statements of Financial Position 26Consolidated Statements of Comprehensive Income 27Consolidated Statements of Changes in Equity 28Consolidated Statements of Cash Flows 30Notes to Consolidated Financial Statements 31Glossary of Terms 108
Consolidated Financial Statements
2424
25
AMÉRICA MÓVIL, S.A.B. DE C.V. AND SUBSIDIARIES
Report of independent registered public accounting firm
The Board of Directors and Shareholders of América Móvil, S.A.B. de C.V.
We have audited the accompanying consolidated statements of financial position of América Móvil, S.A.B. de C.V. and subsidiaries as of December 31, 2013 and 2014 and the related consolidated statements of comprehensive income, changes in equity and cash flows for each of three years in the period ended December 31, 2014. These financial statements are the responsibility of the Company’s management. Our responsibility is to express an opinion on these financial statements based on our audits.
We conducted our audits in accordance with the standards of the Public Company Accounting Oversight Board (United States). Those standards require that we plan and perform the audit to obtain reasonable assurance about whether the financial statements are free of material misstatement. An audit includes examining, on a test basis, evidence supporting the amounts and disclosures in the financial statements. An audit also includes assessing the accounting principles used and significant estimates made by management, as well as evaluating the overall financial statement presentation. We believe that our audits provide a reasonable basis for our opinion.
In our opinion, the financial statements referred to above present fairly, in all material respects, the consolidated financial position of América Móvil, S.A.B. de C.V. and subsidiaries as of December 31, 2013 and 2014, and the consolidated results of their operations and their cash flows for each of the three years in the period ended December 31, 2014, in conformity with International Financial Reporting Standards, as issued by the International Accounting Standards Board.
We also have audited, in accordance with the standards of the Public Company Accounting Oversight Board (United States), América Móvil, S.A.B. de C.V. and subsidiaries’ internal control over financial reporting as of December 31, 2014, based on criteria established in Internal Control – Integrated Framework issued by the Committee of Sponsoring Organizations of the Treadway Commission (2013 Framework) and our report dated April 29, 2015, expressed an unqualified opinion thereon.
Mancera, S.C. A member practice of Ernst & Young Global Limited
C.P.C. Carlos Carrillo Contreras
Mexico City, Mexico
April 29, 2015

26
AMÉRICA MÓVIL, S.A.B. DE C.V. AND SUBSIDIARIES
Consolidated Statements of Financial Position(In thousands of Mexican pesos) Millions of At December 31, U.S. dollars 2013 2014 2014
AssetsCurrent assets: Cash and cash equivalents (Note 4) Ps. 48,163,550 Ps. 66,473,703 US$ 4,516 Accounts receivable: Subscribers, distributors, recoverable taxes and other, net (Note 5) 127,872,657 145,584,407 9,892 Related parties (Note 6) 1,346,392 1,320,107 90 Derivative financial instruments (Note 7) 10,469,316 22,536,056 1,531 Inventories, net (Note 8) 36,718,953 35,930,282 2,441 Other current assets, net (Note 9) 12,127,200 16,563,602 1,125Total current assets 236,698,068 288,408,157 19,595
Non-current assets: Property, plant and equipment, net (Note 10) 501,106,951 595,596,318 40,467 Intangibles, net (Note 11) 38,220,138 109,829,650 7,462 Goodwill (Note 11) 92,486,284 140,903,391 9,574 Investment in associated companies (Note 12) 88,887,024 49,262,581 3,347 Deferred income taxes (Note 13) 50,853,686 66,500,539 4,518 Other assets, net (Note 9) 17,340,282 27,856,033 1,893Total assets Ps. 1,025,592,433 Ps. 1,278,356,669 US$ 86,856
Liabilities and equityCurrent liabilities: Short-term debt and current portion of long-term debt (Note 14a) Ps. 25,841,478 Ps. 57,805,517 US$ 3,928 Accounts payable (Note 15a) 154,137,312 191,503,362 13,011 Accrued liabilities (Nota 15b) 36,958,922 53,968,679 3,667 Taxes payable 22,082,241 32,554,727 2,212 Derivative financial instruments (Note 7) 5,366,323 8,527,812 579 Related parties (Note 6) 2,552,337 3,087,292 210 Deferred revenues (Note 16) 27,016,340 31,464,235 2,138Total current liabilities 273,954,953 378,911,624 25,744
Long-term debt (Note 14a) 464,478,366 545,949,470 37,094 Deferred income taxes (Note 13) 1,628,409 17,469,798 1,187 Deferred revenues (Note 16) 1,105,294 1,330,757 90 Asset retirement obligations (Note 15c) 7,516,460 13,451,407 913 Employee benefits (Note 17) 66,607,874 86,604,565 5,885Total liabilities 815,291,356 1,043,717,621 70,913
Equity (Note 18): Capital stock 96,392,339 96,382,631 6,549 Retained earnings: Prior years 122,693,933 146,188,038 9,933 Profit for the year 74,624,979 46,146,370 3,135Total retained earnings 197,318,912 192,334,408 13,068
Other comprehensive loss items ( 91,310,640) ( 104,332,763) ( 7,089)Equity attributable to equity holders of the parent 202,400,611 184,384,276 12,528Non-controlling interests 7,900,466 50,254,772 3,415Total equity 210,301,077 234,639,048 15,943Total liabilities and equity Ps. 1,025,592,433 Ps. 1,278,356,669 US$ 86,856
The accompanying notes are an integral part of these consolidated financial statements.

27
AMÉRICA MÓVIL, S.A.B. DE C.V. AND SUBSIDIARIES
Consolidated Statements of Comprehensive Income(In thousands of Mexican pesos, except for earnings per share) For the year ended December31 Millions of U.S. dollars, except for earnings per share 2012 2013 2014 2014
Operating revenues: Mobile voice services Ps. 287,133,858 Ps. 265,039,903 Ps. 255,606,335 US$ 17,367 Fixed voice services 123,778,159 111,785,611 114,687,475 7,792 Mobile data voice services 136,394,772 159,589,580 194,882,905 13,241 Fixed data services 83,628,831 85,039,329 97,533,378 6,627 Paid television 56,520,982 60,829,310 68,378,623 4,646 Sales of equipment, accessories and computers 69,562,903 84,544,261 95,632,868 6,498 Other related services 18,050,140 19,273,027 21,540,236 1,464 775,069,645 786,101,021 848,261,820 57,635Operating costs and expenses: Cost of sales and services 341,123,833 358,291,177 386,102,139 26,233 Commercial, administrative and general expenses 165,631,457 167,184,570 185,683,205 12,616 Other expenses 3,579,638 4,832,685 4,928,675 335 Depreciation and amortization (Notes 9, 10 and 11) 103,584,737 101,534,833 114,993,551 7,813 613,919,665 631,843,265 691,707,570 46,997Operating income 161,149,980 154,257,756 156,554,250 10,638
Interest income (Note 14b) 3,859,086 2,925,834 7,052,271 479Interest expense (Note 14c) ( 22,267,771) ( 23,950,653) ( 31,522,523) ( 2,142)Foreign currency exchange (loss) gain, net 7,395,154 ( 19,610,465) ( 28,615,459) ( 1,944)Valuation of derivatives, interest cost from labor obligations and other financial items, net (Note 14d) ( 13,265,019) ( 8,291,535) ( 10,190,261) ( 692)Equity interest in net income (loss) of associated companies (Note 12) 761,361 36,282 ( 6,073,009) ( 413)Profit before income tax 137,632,791 105,367,219 87,205,269 5,926Income tax (Note 13) 45,983,452 30,392,731 39,707,549 2,699Net profit for the year Ps. 91,649,339 Ps. 74,974,488 Ps. 47,497,720 US$ 3,227
Net profit for the year attributable to: Equity holders of the parent Ps. 90,988,570 Ps. 74,624,979 Ps. 46,146,370 US$ 3,135 Non-controlling interests 660,769 349,509 1,351,350 92 Ps. 91,649,339 Ps. 74,974,488 Ps. 47,497,720 3,227Basic and diluted earnings per share attributable to equity holders of the parent from continuing operations Ps. 1.19 Ps. 1.02 Ps. 0.67 US$ 0.05
Other comprehensive loss items: Net other comprehensive loss that may be reclassified to profit or loss in subsequent years: Effect of translation of foreign entities Ps. ( 33,421,104) Ps. ( 26,888,282) Ps. ( 6,255,715) US$ ( 425) Effect of fair value of derivatives, net of deferred taxes ( 239,164) ( 740,740) ( 313,572) ( 21)Items that will not be reclassified to profit or loss in subsequent years: Remeasurement of defined benefit plan, net of deferred taxes 2,439,641 ( 2,438,039) ( 6,807,975) ( 463)Total other comprehensive income items for the year, net of deferred taxes ( 31,220,627) ( 30,067,061) ( 13,377,262) ( 909)Total comprehensive income for the year Ps. 60,428,712 Ps. 44,907,427 Ps. 34,120,458 US$ 2,318
Comprehensive income for the year attributable to: Equity holders of the parent Ps. 60,212,233 Ps. 45,108,504 Ps. 33,404,912 US$ 2,270 Non-controlling interests 216,479 ( 201,077) 715,546 48 Ps. 60,428,712 Ps. 44,907,427 Ps. 34,120,458 US$ 2,318
The accompanying notes are an integral part of these financial statements.

28
Effect of derivative financial instruments Total equity acquired for Remeasurement Cumulative attributable to Capital Legal Retained hedging of defined Translation equity holders Non-controlling Total stock reserve earnings purposes benefit plans adjustment of the parent interests equity
Balance at December 31, 2011 Ps. 96,419,636 Ps. 358,440 Ps. 162,057,644 Ps. ( 242,583) Ps. ( 54,303,442) Ps. 25,679,215 Ps. 229,968,910 Ps. 6,491,789 Ps. 236,460,699
Net profit for the year 90,988,570 90,988,570 660,769 91,649,339
Remeasurement of defined benefit plan, net of deferred taxes 2,377,006 2,377,006 62,635 2,439,641
Effect of fair value of derivatives, net of deferred taxes ( 253,428) ( 253,428) 14,264 ( 239,164)
Effect of translation of foreign entities ( 32,899,915) ( 32,899,915) ( 521,189) ( 33,421,104)
Comprehensive income for the year 90,988,570 ( 253,428) 2,377,006 ( 32,899,915) 60,212,233 216,479 60,428,712
Dividends ( 15,216,636) ( 15,216,636) ( 326,620) ( 15,543,256)
Repurchase of shares ( 4,795) ( 18,326,979) ( 18,331,774) ( 18,331,774)
Effect of consolidation of NET ( 155,158) ( 155,158) 3,041,699 2,886,541
Other acquisitions of non-controlling interests ( 8,749,086) ( 2,151,018) ( 10,900,104) ( 152,572) ( 11,052,676)
Balance at December 31, 2012 96,414,841 358,440 210,598,355 ( 496,011) ( 54,077,454) ( 7,220,700) 245,577,471 9,270,775 254,848,246
Net profit for the year 74,624,979 74,624,979 349,509 74,974,488
Remeasurement of defined benefit plan, net of deferred taxes ( 2,289,811) ( 2,289,811) ( 148,228) ( 2,438,039)
Effect of fair value of derivatives, net of deferred taxes ( 741,321) ( 741,321) 581 ( 740,740)
Effect of translation of foreign entities ( 26,485,343) ( 26,485,343) ( 402,939) ( 26,888,282)
Comprehensive income for the year 74,624,979 ( 741,321) ( 2,289,811) ( 26,485,343) 45,108,504 ( 201,077) 44,907,427
Dividends declared ( 15,872,527) ( 15,872,527) ( 68,465) ( 15,940,992)
Repurchase of shares ( 22,502) ( 70,923,493) ( 70,945,995) ( 70,945,995)
Other acquisitions of non-controlling interests ( 1,466,842) ( 1,466,842) ( 1,100,767) ( 2,567,609)
Balance at December 31, 2013 96,392,339 358,440 196,960,472 ( 1,237,332) ( 56,367,265) ( 33,706,043) 202,400,611 7,900,466 210,301,077
Net profit for the year 46,146,370 46,146,370 1,351,350 47,497,720
Effect of fair value of derivatives, net of deferred taxes ( 329,112) ( 329,112) 15,540 ( 313,572)
Remeasurement of defined benefit plan,
net of deferred taxes ( 6,625,463) ( 6,625,463) ( 182,512) ( 6,807,975)
Effect of translation of foreign entities ( 5,786,883) ( 5,786,883) ( 468,832) ( 6,255,715)
Comprehensive income for the year 46,146,370 ( 329,112) ( 6,625,463) ( 5,786,883) 33,404,912 715,546 34,120,458
Dividends declared ( 16,539,294) ( 16,539,294) ( 31,356) ( 16,570,650)
Repurchase of shares ( 9,708) ( 34,646,254) ( 34,655,962) ( 34,655,962)
Acquisition of non-controlling interests arising on business combination of Telekom Austria (Note 12) 9,751 45 ( 290,461) ( 280,665) 39,239,141 38,958,476
Capital stock increase in Telekom Austria (Note 12) 7,181,894 7,181,894
Other acquisitions of non-controlling interests and others 54,674 54,674 ( 4,750,919) ( 4,696,245)
Balance at December 31, 2014 Ps. 96,382,631 Ps. 358,440 Ps. 191,975,968 Ps. ( 1,556,693) Ps. ( 62,992,683) Ps. ( 39,783,387) Ps. 184,384,276 Ps. 50,254,772 Ps. 234,639,048
The accompanying notes are an integral part of these financial statements.
AMÉRICA MÓVIL, S.A.B. DE C.V. AND SUBSIDIARIES
Consolidated Statements of Changes in EquityFor the years ended December 31, 2012, 2013 and 2014(In thousands of Mexican pesos)

29
Effect of derivative financial instruments Total equity acquired for Remeasurement Cumulative attributable to Capital Legal Retained hedging of defined Translation equity holders Non-controlling Total stock reserve earnings purposes benefit plans adjustment of the parent interests equity
Balance at December 31, 2011 Ps. 96,419,636 Ps. 358,440 Ps. 162,057,644 Ps. ( 242,583) Ps. ( 54,303,442) Ps. 25,679,215 Ps. 229,968,910 Ps. 6,491,789 Ps. 236,460,699
Net profit for the year 90,988,570 90,988,570 660,769 91,649,339
Remeasurement of defined benefit plan, net of deferred taxes 2,377,006 2,377,006 62,635 2,439,641
Effect of fair value of derivatives, net of deferred taxes ( 253,428) ( 253,428) 14,264 ( 239,164)
Effect of translation of foreign entities ( 32,899,915) ( 32,899,915) ( 521,189) ( 33,421,104)
Comprehensive income for the year 90,988,570 ( 253,428) 2,377,006 ( 32,899,915) 60,212,233 216,479 60,428,712
Dividends ( 15,216,636) ( 15,216,636) ( 326,620) ( 15,543,256)
Repurchase of shares ( 4,795) ( 18,326,979) ( 18,331,774) ( 18,331,774)
Effect of consolidation of NET ( 155,158) ( 155,158) 3,041,699 2,886,541
Other acquisitions of non-controlling interests ( 8,749,086) ( 2,151,018) ( 10,900,104) ( 152,572) ( 11,052,676)
Balance at December 31, 2012 96,414,841 358,440 210,598,355 ( 496,011) ( 54,077,454) ( 7,220,700) 245,577,471 9,270,775 254,848,246
Net profit for the year 74,624,979 74,624,979 349,509 74,974,488
Remeasurement of defined benefit plan, net of deferred taxes ( 2,289,811) ( 2,289,811) ( 148,228) ( 2,438,039)
Effect of fair value of derivatives, net of deferred taxes ( 741,321) ( 741,321) 581 ( 740,740)
Effect of translation of foreign entities ( 26,485,343) ( 26,485,343) ( 402,939) ( 26,888,282)
Comprehensive income for the year 74,624,979 ( 741,321) ( 2,289,811) ( 26,485,343) 45,108,504 ( 201,077) 44,907,427
Dividends declared ( 15,872,527) ( 15,872,527) ( 68,465) ( 15,940,992)
Repurchase of shares ( 22,502) ( 70,923,493) ( 70,945,995) ( 70,945,995)
Other acquisitions of non-controlling interests ( 1,466,842) ( 1,466,842) ( 1,100,767) ( 2,567,609)
Balance at December 31, 2013 96,392,339 358,440 196,960,472 ( 1,237,332) ( 56,367,265) ( 33,706,043) 202,400,611 7,900,466 210,301,077
Net profit for the year 46,146,370 46,146,370 1,351,350 47,497,720
Effect of fair value of derivatives, net of deferred taxes ( 329,112) ( 329,112) 15,540 ( 313,572)
Remeasurement of defined benefit plan,
net of deferred taxes ( 6,625,463) ( 6,625,463) ( 182,512) ( 6,807,975)
Effect of translation of foreign entities ( 5,786,883) ( 5,786,883) ( 468,832) ( 6,255,715)
Comprehensive income for the year 46,146,370 ( 329,112) ( 6,625,463) ( 5,786,883) 33,404,912 715,546 34,120,458
Dividends declared ( 16,539,294) ( 16,539,294) ( 31,356) ( 16,570,650)
Repurchase of shares ( 9,708) ( 34,646,254) ( 34,655,962) ( 34,655,962)
Acquisition of non-controlling interests arising on business combination of Telekom Austria (Note 12) 9,751 45 ( 290,461) ( 280,665) 39,239,141 38,958,476
Capital stock increase in Telekom Austria (Note 12) 7,181,894 7,181,894
Other acquisitions of non-controlling interests and others 54,674 54,674 ( 4,750,919) ( 4,696,245)
Balance at December 31, 2014 Ps. 96,382,631 Ps. 358,440 Ps. 191,975,968 Ps. ( 1,556,693) Ps. ( 62,992,683) Ps. ( 39,783,387) Ps. 184,384,276 Ps. 50,254,772 Ps. 234,639,048
30
AMÉRICA MÓVIL, S.A.B. DE C.V. AND SUBSIDIARIES
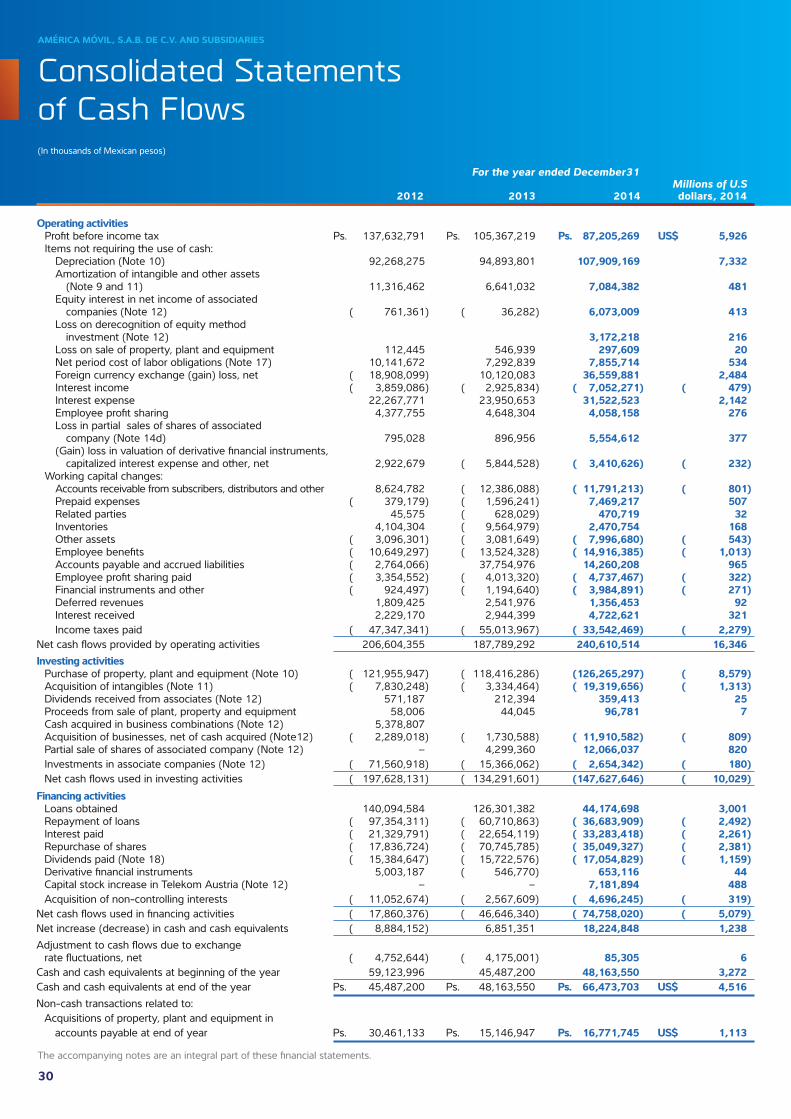
Consolidated Statements of Cash Flows(In thousands of Mexican pesos) For the year ended December31 Millions of U.S 2012 2013 2014 dollars, 2014
Operating activities Profit before income tax Ps. 137,632,791 Ps. 105,367,219 Ps. 87,205,269 US$ 5,926 Items not requiring the use of cash: Depreciation (Note 10) 92,268,275 94,893,801 107,909,169 7,332 Amortization of intangible and other assets (Note 9 and 11) 11,316,462 6,641,032 7,084,382 481 Equity interest in net income of associated companies (Note 12) ( 761,361) ( 36,282) 6,073,009 413 Loss on derecognition of equity method investment (Note 12) 3,172,218 216 Loss on sale of property, plant and equipment 112,445 546,939 297,609 20 Net period cost of labor obligations (Note 17) 10,141,672 7,292,839 7,855,714 534 Foreign currency exchange (gain) loss, net ( 18,908,099) 10,120,083 36,559,881 2,484 Interest income ( 3,859,086) ( 2,925,834) ( 7,052,271) ( 479) Interest expense 22,267,771 23,950,653 31,522,523 2,142 Employee profit sharing 4,377,755 4,648,304 4,058,158 276 Loss in partial sales of shares of associated company (Note 14d) 795,028 896,956 5,554,612 377 (Gain) loss in valuation of derivative financial instruments, capitalized interest expense and other, net 2,922,679 ( 5,844,528) ( 3,410,626) ( 232) Working capital changes: Accounts receivable from subscribers, distributors and other 8,624,782 ( 12,386,088) ( 11,791,213) ( 801) Prepaid expenses ( 379,179) ( 1,596,241) 7,469,217 507 Related parties 45,575 ( 628,029) 470,719 32 Inventories 4,104,304 ( 9,564,979) 2,470,754 168 Other assets ( 3,096,301) ( 3,081,649) ( 7,996,680) ( 543) Employee benefits ( 10,649,297) ( 13,524,328) ( 14,916,385) ( 1,013) Accounts payable and accrued liabilities ( 2,764,066) 37,754,976 14,260,208 965 Employee profit sharing paid ( 3,354,552) ( 4,013,320) ( 4,737,467) ( 322) Financial instruments and other ( 924,497) ( 1,194,640) ( 3,984,891) ( 271) Deferred revenues 1,809,425 2,541,976 1,356,453 92 Interest received 2,229,170 2,944,399 4,722,621 321 Income taxes paid ( 47,347,341) ( 55,013,967) ( 33,542,469) ( 2,279)Net cash flows provided by operating activities 206,604,355 187,789,292 240,610,514 16,346Investing activities Purchase of property, plant and equipment (Note 10) ( 121,955,947) ( 118,416,286) ( 126,265,297) ( 8,579) Acquisition of intangibles (Note 11) ( 7,830,248) ( 3,334,464) ( 19,319,656) ( 1,313) Dividends received from associates (Note 12) 571,187 212,394 359,413 25 Proceeds from sale of plant, property and equipment 58,006 44,045 96,781 7 Cash acquired in business combinations (Note 12) 5,378,807 Acquisition of businesses, net of cash acquired (Note12) ( 2,289,018) ( 1,730,588) ( 11,910,582) ( 809) Partial sale of shares of associated company (Note 12) – 4,299,360 12,066,037 820 Investments in associate companies (Note 12) ( 71,560,918) ( 15,366,062) ( 2,654,342) ( 180) Net cash flows used in investing activities ( 197,628,131) ( 134,291,601) ( 147,627,646) ( 10,029)Financing activities Loans obtained 140,094,584 126,301,382 44,174,698 3,001 Repayment of loans ( 97,354,311) ( 60,710,863) ( 36,683,909) ( 2,492) Interest paid ( 21,329,791) ( 22,654,119) ( 33,283,418) ( 2,261) Repurchase of shares ( 17,836,724) ( 70,745,785) ( 35,049,327) ( 2,381) Dividends paid (Note 18) ( 15,384,647) ( 15,722,576) ( 17,054,829) ( 1,159) Derivative financial instruments 5,003,187 ( 546,770) 653,116 44 Capital stock increase in Telekom Austria (Note 12) – – 7,181,894 488 Acquisition of non-controlling interests ( 11,052,674) ( 2,567,609) ( 4,696,245) ( 319)Net cash flows used in financing activities ( 17,860,376) ( 46,646,340) ( 74,758,020) ( 5,079)Net increase (decrease) in cash and cash equivalents ( 8,884,152) 6,851,351 18,224,848 1,238Adjustment to cash flows due to exchange rate fluctuations, net ( 4,752,644) ( 4,175,001) 85,305 6Cash and cash equivalents at beginning of the year 59,123,996 45,487,200 48,163,550 3,272Cash and cash equivalents at end of the year Ps. 45,487,200 Ps. 48,163,550 Ps. 66,473,703 US$ 4,516Non-cash transactions related to: Acquisitions of property, plant and equipment in accounts payable at end of year Ps. 30,461,133 Ps. 15,146,947 Ps. 16,771,745 US$ 1,113
The accompanying notes are an integral part of these financial statements.
31
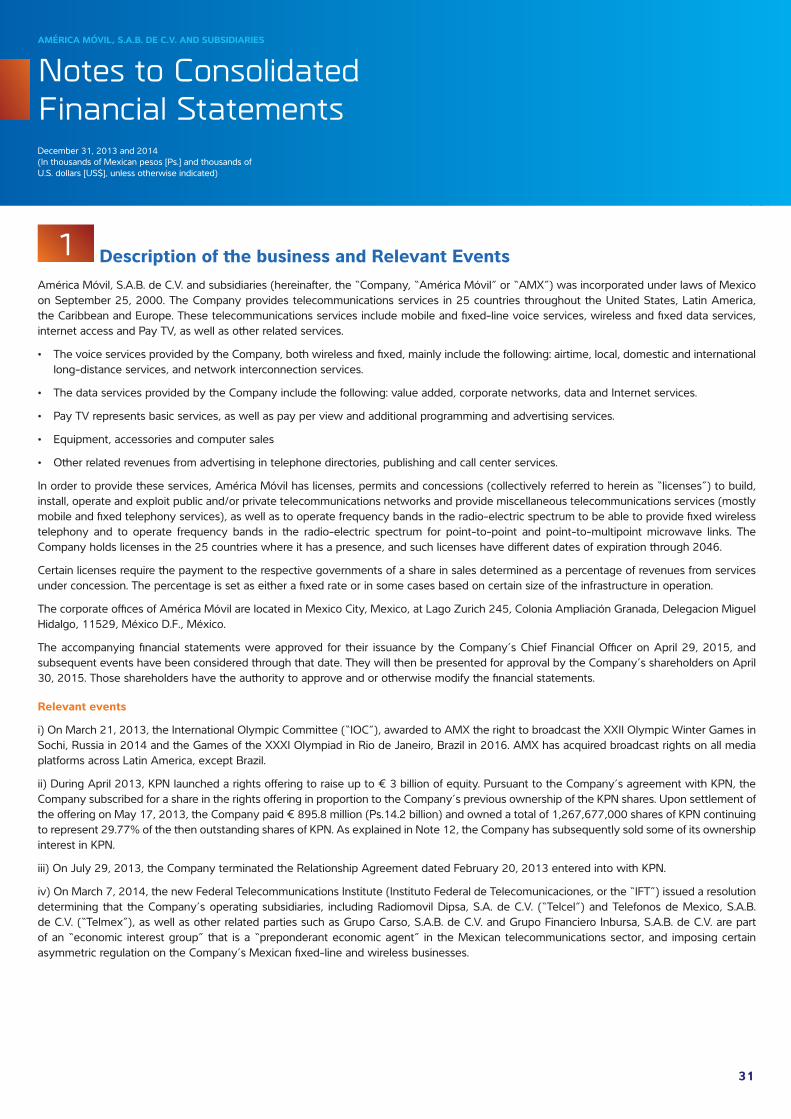
1 Description of the business and Relevant EventsAmérica Móvil, S.A.B. de C.V. and subsidiaries (hereinafter, the “Company, “América Móvil” or “AMX”) was incorporated under laws of Mexico on September 25, 2000. The Company provides telecommunications services in 25 countries throughout the United States, Latin America, the Caribbean and Europe. These telecommunications services include mobile and fixed-line voice services, wireless and fixed data services, internet access and Pay TV, as well as other related services.
• The voice services provided by the Company, both wireless and fixed, mainly include the following: airtime, local, domestic and international long-distance services, and network interconnection services.
• The data services provided by the Company include the following: value added, corporate networks, data and Internet services.
• Pay TV represents basic services, as well as pay per view and additional programming and advertising services.
• Equipment, accessories and computer sales
• Other related revenues from advertising in telephone directories, publishing and call center services.
In order to provide these services, América Móvil has licenses, permits and concessions (collectively referred to herein as “licenses”) to build, install, operate and exploit public and/or private telecommunications networks and provide miscellaneous telecommunications services (mostly mobile and fixed telephony services), as well as to operate frequency bands in the radio-electric spectrum to be able to provide fixed wireless telephony and to operate frequency bands in the radio-electric spectrum for point-to-point and point-to-multipoint microwave links. The Company holds licenses in the 25 countries where it has a presence, and such licenses have different dates of expiration through 2046.
Certain licenses require the payment to the respective governments of a share in sales determined as a percentage of revenues from services under concession. The percentage is set as either a fixed rate or in some cases based on certain size of the infrastructure in operation.
The corporate offices of América Móvil are located in Mexico City, Mexico, at Lago Zurich 245, Colonia Ampliación Granada, Delegacion Miguel Hidalgo, 11529, México D.F., México.
The accompanying financial statements were approved for their issuance by the Company’s Chief Financial Officer on April 29, 2015, and subsequent events have been considered through that date. They will then be presented for approval by the Company’s shareholders on April 30, 2015. Those shareholders have the authority to approve and or otherwise modify the financial statements.
Relevant events
i) On March 21, 2013, the International Olympic Committee (“IOC”), awarded to AMX the right to broadcast the XXII Olympic Winter Games in Sochi, Russia in 2014 and the Games of the XXXI Olympiad in Rio de Janeiro, Brazil in 2016. AMX has acquired broadcast rights on all media platforms across Latin America, except Brazil.
ii) During April 2013, KPN launched a rights offering to raise up to € 3 billion of equity. Pursuant to the Company’s agreement with KPN, the Company subscribed for a share in the rights offering in proportion to the Company’s previous ownership of the KPN shares. Upon settlement of the offering on May 17, 2013, the Company paid € 895.8 million (Ps.14.2 billion) and owned a total of 1,267,677,000 shares of KPN continuing to represent 29.77% of the then outstanding shares of KPN. As explained in Note 12, the Company has subsequently sold some of its ownership interest in KPN.
iii) On July 29, 2013, the Company terminated the Relationship Agreement dated February 20, 2013 entered into with KPN.
iv) On March 7, 2014, the new Federal Telecommunications Institute (Instituto Federal de Telecomunicaciones, or the “IFT”) issued a resolution determining that the Company’s operating subsidiaries, including Radiomovil Dipsa, S.A. de C.V. (“Telcel”) and Telefonos de Mexico, S.A.B. de C.V. (“Telmex”), as well as other related parties such as Grupo Carso, S.A.B. de C.V. and Grupo Financiero Inbursa, S.A.B. de C.V. are part of an “economic interest group” that is a “preponderant economic agent” in the Mexican telecommunications sector, and imposing certain asymmetric regulation on the Company’s Mexican fixed-line and wireless businesses.
AMÉRICA MÓVIL, S.A.B. DE C.V. AND SUBSIDIARIES
Notes to Consolidated Financial StatementsDecember 31, 2013 and 2014(In thousands of Mexican pesos [Ps.] and thousands ofU.S. dollars [US$], unless otherwise indicated)
32
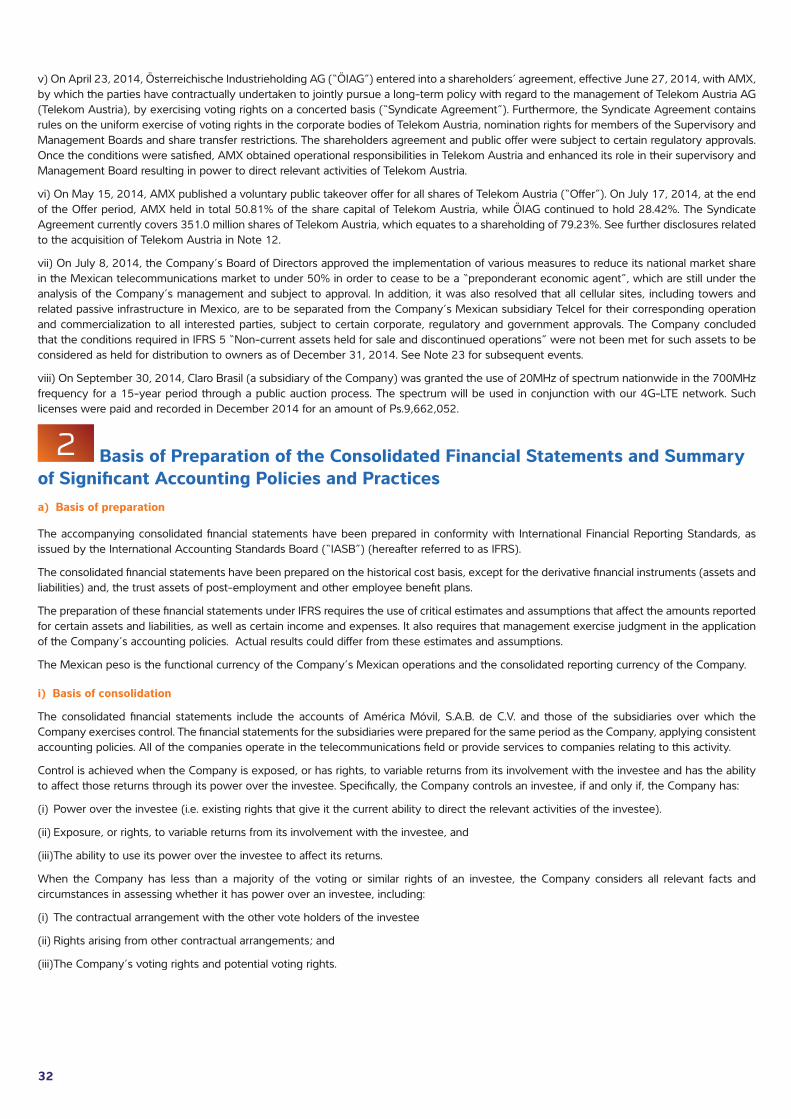
v) On April 23, 2014, Österreichische Industrieholding AG (“ÖIAG”) entered into a shareholders’ agreement, effective June 27, 2014, with AMX, by which the parties have contractually undertaken to jointly pursue a long-term policy with regard to the management of Telekom Austria AG (Telekom Austria), by exercising voting rights on a concerted basis (“Syndicate Agreement”). Furthermore, the Syndicate Agreement contains rules on the uniform exercise of voting rights in the corporate bodies of Telekom Austria, nomination rights for members of the Supervisory and Management Boards and share transfer restrictions. The shareholders agreement and public offer were subject to certain regulatory approvals. Once the conditions were satisfied, AMX obtained operational responsibilities in Telekom Austria and enhanced its role in their supervisory and Management Board resulting in power to direct relevant activities of Telekom Austria.
vi) On May 15, 2014, AMX published a voluntary public takeover offer for all shares of Telekom Austria (“Offer”). On July 17, 2014, at the end of the Offer period, AMX held in total 50.81% of the share capital of Telekom Austria, while ÖIAG continued to hold 28.42%. The Syndicate Agreement currently covers 351.0 million shares of Telekom Austria, which equates to a shareholding of 79.23%. See further disclosures related to the acquisition of Telekom Austria in Note 12.
vii) On July 8, 2014, the Company’s Board of Directors approved the implementation of various measures to reduce its national market share in the Mexican telecommunications market to under 50% in order to cease to be a “preponderant economic agent”, which are still under the analysis of the Company’s management and subject to approval. In addition, it was also resolved that all cellular sites, including towers and related passive infrastructure in Mexico, are to be separated from the Company’s Mexican subsidiary Telcel for their corresponding operation and commercialization to all interested parties, subject to certain corporate, regulatory and government approvals. The Company concluded that the conditions required in IFRS 5 “Non-current assets held for sale and discontinued operations” were not been met for such assets to be considered as held for distribution to owners as of December 31, 2014. See Note 23 for subsequent events.
viii) On September 30, 2014, Claro Brasil (a subsidiary of the Company) was granted the use of 20MHz of spectrum nationwide in the 700MHz frequency for a 15-year period through a public auction process. The spectrum will be used in conjunction with our 4G-LTE network. Such licenses were paid and recorded in December 2014 for an amount of Ps.9,662,052.
2 Basis of Preparation of the Consolidated Financial Statements and Summary of Significant Accounting Policies and Practicesa) Basis of preparation
The accompanying consolidated financial statements have been prepared in conformity with International Financial Reporting Standards, as issued by the International Accounting Standards Board (“IASB”) (hereafter referred to as IFRS).
The consolidated financial statements have been prepared on the historical cost basis, except for the derivative financial instruments (assets and liabilities) and, the trust assets of post-employment and other employee benefit plans.
The preparation of these financial statements under IFRS requires the use of critical estimates and assumptions that affect the amounts reported for certain assets and liabilities, as well as certain income and expenses. It also requires that management exercise judgment in the application of the Company’s accounting policies. Actual results could differ from these estimates and assumptions.
The Mexican peso is the functional currency of the Company’s Mexican operations and the consolidated reporting currency of the Company.
i) Basis of consolidation
The consolidated financial statements include the accounts of América Móvil, S.A.B. de C.V. and those of the subsidiaries over which the Company exercises control. The financial statements for the subsidiaries were prepared for the same period as the Company, applying consistent accounting policies. All of the companies operate in the telecommunications field or provide services to companies relating to this activity.
Control is achieved when the Company is exposed, or has rights, to variable returns from its involvement with the investee and has the ability to affect those returns through its power over the investee. Specifically, the Company controls an investee, if and only if, the Company has:
(i) Power over the investee (i.e. existing rights that give it the current ability to direct the relevant activities of the investee).
(ii) Exposure, or rights, to variable returns from its involvement with the investee, and
(iii) The ability to use its power over the investee to affect its returns.
When the Company has less than a majority of the voting or similar rights of an investee, the Company considers all relevant facts and circumstances in assessing whether it has power over an investee, including:
(i) The contractual arrangement with the other vote holders of the investee
(ii) Rights arising from other contractual arrangements; and
(iii) The Company’s voting rights and potential voting rights.

33
The Company re-assesses whether or not it controls an investee if facts and circumstances indicate that there are changes to one or more of the three elements of control. Consolidation of a subsidiary begins when the Company obtains control over the subsidiary and ceases when the Company loses control of the subsidiary. Assets, liabilities, income and expenses of a subsidiary acquired or disposed of during the year are included in the consolidated statements of comprehensive income from the date the Company gains control until the date the Company ceases to control the subsidiary.
Profit or loss and each component of other comprehensive income (“OCI”) are attributed to the equity holders of the parent of the Company and to the non-controlling interests. When necessary, adjustments are made to the financial statements of subsidiaries to bring their accounting policies into line with the Company’s accounting policies. All intercompany balances and transactions are eliminated in the consolidated financial statements.
A change in the ownership interest of a subsidiary, without a loss of control, is accounted for as an equity transaction. If the Company loses control over a subsidiary, it:
(i) Derecognizes the assets (including goodwill) and liabilities of the subsidiary;
(ii) Derecognizes the carrying amount of any non-controlling interests;
(iii) Derecognizes the cumulative translation differences recorded in equity;
(iv) Recognizes the fair value of the consideration received;
(v) Recognizes the fair value of any investment retained;
(vi) Recognizes any surplus or deficit in profit or loss; and
(vii) Reclassifies the parent’s share of components previously recognized in OCI to profit or loss or retained earnings, as appropriate, as would be required if the Company had directly disposed of the related assets or liabilities.
The financial statements for the subsidiaries were prepared for the same period as the holding company, applying consistent accounting policies. All of the companies operate in the telecommunications field or provide services to companies relating to this activity.
Non-controlling interests represent the portion of profits or losses and net assets not held by the Company. Non-controlling interests are presented separately in the consolidated statements of comprehensive income and in equity in the consolidated statements of financial position separately from América Móvil’s own equity.
Non-controlling interests refers to certain subsidiaries in which the Company does not hold 100% of the shares.
Acquisitions of non-controlling interests are accounted for as equity transactions. The difference between the book value and the subscription price for acquired shares under common control are accounted for as an equity transaction within retained earnings.
Associates:
Associates are all those entities for which the Company has significant influence over without having control. According to IAS 28, “Investments in Associates”, significant influence is the power to participate in the financial and operating policy decisions of the investee but is not control or joint control over those policies. Significant influence typically exists when an investor holds from 20% to 50% of the voting power of an investee.
The Company’s investment in associates includes goodwill identified on acquisition, net of any accumulated impairment losses.
The investments in associated companies in which the Company exercises significant influence are accounted for using the equity method, whereby América Móvil recognizes its share in the net profit (losses) and equity of the associate.
The results of operations of the subsidiaries and associates are included in the Company’s consolidated financial statements beginning as of the month following their acquisition and its share of other comprehensive income after acquisition is recognized directly in other comprehensive income.
The Company assesses at each reporting date whether there is objective evidence that investment in associates is impaired. If so, the Company calculates the amount of impairment as the difference between the recoverable amount of the associate and its carrying value.
34
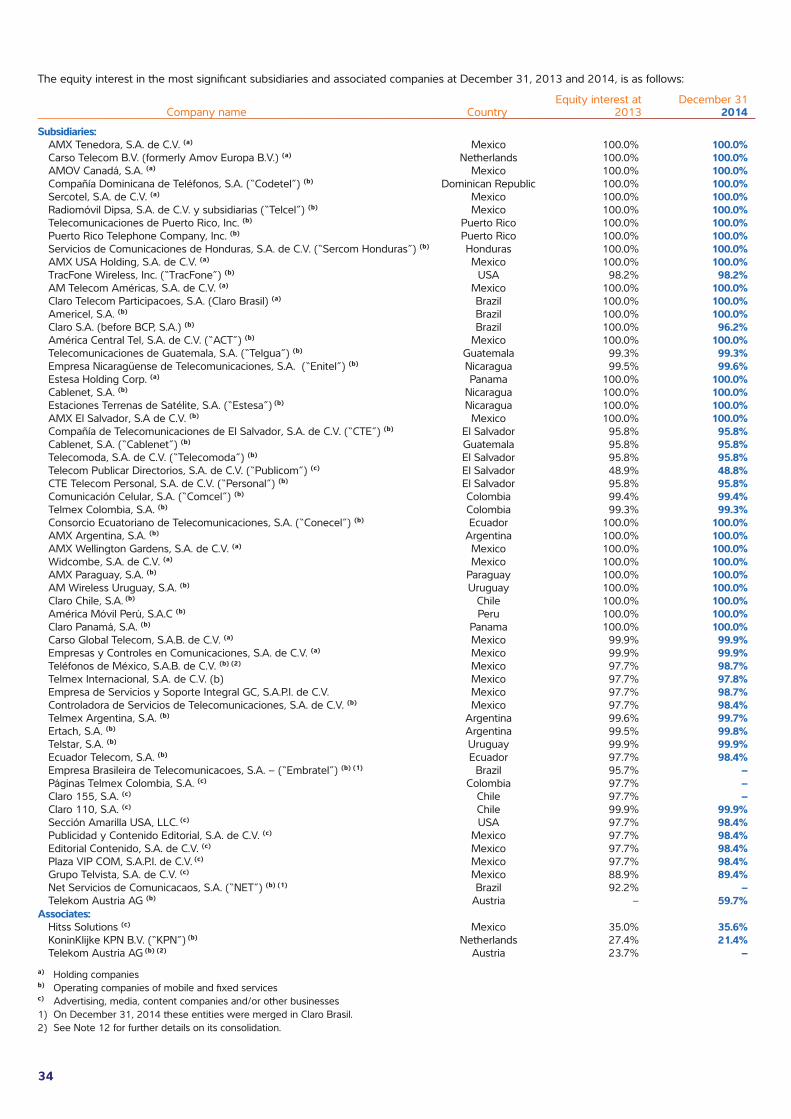
The equity interest in the most significant subsidiaries and associated companies at December 31, 2013 and 2014, is as follows:
Equity interest at December 31 Company name Country 2013 2014Subsidiaries: AMX Tenedora, S.A. de C.V. (a) Mexico 100.0% 100.0% Carso Telecom B.V. (formerly Amov Europa B.V.) (a) Netherlands 100.0% 100.0% AMOV Canadá, S.A. (a) Mexico 100.0% 100.0% Compañía Dominicana de Teléfonos, S.A. (“Codetel”) (b) Dominican Republic 100.0% 100.0% Sercotel, S.A. de C.V. (a) Mexico 100.0% 100.0% Radiomóvil Dipsa, S.A. de C.V. y subsidiarias (“Telcel”) (b) Mexico 100.0% 100.0% Telecomunicaciones de Puerto Rico, Inc. (b) Puerto Rico 100.0% 100.0% Puerto Rico Telephone Company, Inc. (b) Puerto Rico 100.0% 100.0% Servicios de Comunicaciones de Honduras, S.A. de C.V. (“Sercom Honduras”) (b) Honduras 100.0% 100.0% AMX USA Holding, S.A. de C.V. (a) Mexico 100.0% 100.0% TracFone Wireless, Inc. (“TracFone”) (b) USA 98.2% 98.2% AM Telecom Américas, S.A. de C.V. (a) Mexico 100.0% 100.0% Claro Telecom Participacoes, S.A. (Claro Brasil) (a) Brazil 100.0% 100.0% Americel, S.A. (b) Brazil 100.0% 100.0% Claro S.A. (before BCP, S.A.) (b) Brazil 100.0% 96.2% América Central Tel, S.A. de C.V. (“ACT”) (b) Mexico 100.0% 100.0% Telecomunicaciones de Guatemala, S.A. (“Telgua”) (b) Guatemala 99.3% 99.3% Empresa Nicaragüense de Telecomunicaciones, S.A. (“Enitel”) (b) Nicaragua 99.5% 99.6% Estesa Holding Corp. (a) Panama 100.0% 100.0% Cablenet, S.A. (b) Nicaragua 100.0% 100.0% Estaciones Terrenas de Satélite, S.A. (“Estesa”) (b) Nicaragua 100.0% 100.0% AMX El Salvador, S.A de C.V. (b) Mexico 100.0% 100.0% Compañía de Telecomunicaciones de El Salvador, S.A. de C.V. (“CTE”) (b) El Salvador 95.8% 95.8% Cablenet, S.A. (“Cablenet”) (b) Guatemala 95.8% 95.8% Telecomoda, S.A. de C.V. (“Telecomoda”) (b) El Salvador 95.8% 95.8% Telecom Publicar Directorios, S.A. de C.V. (“Publicom”) (c) El Salvador 48.9% 48.8% CTE Telecom Personal, S.A. de C.V. (“Personal”) (b) El Salvador 95.8% 95.8% Comunicación Celular, S.A. (“Comcel”) (b) Colombia 99.4% 99.4% Telmex Colombia, S.A. (b) Colombia 99.3% 99.3% Consorcio Ecuatoriano de Telecomunicaciones, S.A. (“Conecel”) (b) Ecuador 100.0% 100.0% AMX Argentina, S.A. (b) Argentina 100.0% 100.0% AMX Wellington Gardens, S.A. de C.V. (a) Mexico 100.0% 100.0% Widcombe, S.A. de C.V. (a) Mexico 100.0% 100.0% AMX Paraguay, S.A. (b) Paraguay 100.0% 100.0% AM Wireless Uruguay, S.A. (b) Uruguay 100.0% 100.0% Claro Chile, S.A. (b) Chile 100.0% 100.0% América Móvil Perú, S.A.C (b) Peru 100.0% 100.0% Claro Panamá, S.A. (b) Panama 100.0% 100.0% Carso Global Telecom, S.A.B. de C.V. (a) Mexico 99.9% 99.9% Empresas y Controles en Comunicaciones, S.A. de C.V. (a) Mexico 99.9% 99.9% Teléfonos de México, S.A.B. de C.V. (b) (2) Mexico 97.7% 98.7% Telmex Internacional, S.A. de C.V. (b) Mexico 97.7% 97.8% Empresa de Servicios y Soporte Integral GC, S.A.P.I. de C.V. Mexico 97.7% 98.7% Controladora de Servicios de Telecomunicaciones, S.A. de C.V. (b) Mexico 97.7% 98.4% Telmex Argentina, S.A. (b) Argentina 99.6% 99.7% Ertach, S.A. (b) Argentina 99.5% 99.8% Telstar, S.A. (b) Uruguay 99.9% 99.9% Ecuador Telecom, S.A. (b) Ecuador 97.7% 98.4% Empresa Brasileira de Telecomunicacoes, S.A. – (“Embratel”) (b) (1) Brazil 95.7% – Páginas Telmex Colombia, S.A. (c) Colombia 97.7% – Claro 155, S.A. (c) Chile 97.7% – Claro 110, S.A. (c) Chile 99.9% 99.9% Sección Amarilla USA, LLC. (c) USA 97.7% 98.4% Publicidad y Contenido Editorial, S.A. de C.V. (c) Mexico 97.7% 98.4% Editorial Contenido, S.A. de C.V. (c) Mexico 97.7% 98.4% Plaza VIP COM, S.A.P.I. de C.V. (c) Mexico 97.7% 98.4% Grupo Telvista, S.A. de C.V. (c) Mexico 88.9% 89.4% Net Servicios de Comunicacaos, S.A. (“NET”) (b) (1) Brazil 92.2% – Telekom Austria AG (b) Austria – 59.7%Associates: Hitss Solutions (c) Mexico 35.0% 35.6% KoninKlijke KPN B.V. (“KPN”) (b) Netherlands 27.4% 21.4% Telekom Austria AG (b) (2) Austria 23.7% –a) Holding companiesb) Operating companies of mobile and fixed servicesc) Advertising, media, content companies and/or other businesses1) On December 31, 2014 these entities were merged in Claro Brasil.2) See Note 12 for further details on its consolidation.

35
ii) Basis of translation of financial statements of foreign subsidiaries and associated companies
The operating revenues of foreign subsidiaries (those outside of Mexico) jointly represent approximately 63%, 65% and 66% of operating revenues of 2012, 2013 and 2014, respectively, and their total assets jointly represent approximately 70% and 78% of total assets at December 31, 2013 and 2014, respectively.
The financial statements have been converted to IFRS in the respective local currency and translated into the reporting currency.
None of the Company’s subsidiaries, with the except of Belarus (See Note 2o), operate in a hyperinflationary economic environment and the local currency is their functional currency, the translation of their financial statements prepared under IFRS and denominated in their respective local currencies, are translated as follows:
• all monetary assets and liabilities were translated at the prevailing exchange rate at the period closing;
• all non-monetary assets and liabilities at the prevailing exchange rate in effect at the period closing;
• equity accounts are translated at the prevailing exchange rate at the time the capital contributions were made and the profits were generated;
• revenues, costs and expenses are translated at the average exchange rate during the applicable period;
• the difference resulting from the translation process is recognized in equity in the caption “Effect of translation”.
• the consolidated statements of cash flows were translated using the weighted-average exchange rate for the applicable period, and the resulting difference is shown in the consolidated statement of cash flows under the heading “Adjustment to cash flows due to exchange rate fluctuations”.
The difference resulting from the translation process is recognized in equity in the caption “Effect of translation”. At December 31, 2013 and 2014, the cumulative translation loss was Ps.(33,706,043) and Ps.(39,783,387), respectively.
b) Revenue recognition
Revenues are recognized at the time the related service is rendered, provided that the revenue can be measured reliably, it is probable that the entity will receive the economic benefits associated with the transaction, the stage of completion of the transaction may be reliably measured and there is high certainty of collectability.
For postpaid plans, the amount billed to clients combines a fixed tariff for a specific quantity of services, plus the rates for the use above the specified quantities (minutes included in each plan). Costs related to these services are recognized when the service is rendered.
The Company divides its main services into seven types as presented in the consolidated statements comprehensive income, as follows:
- Mobile voice- Mobile data- Fixed voice- Fixed data- Pay TV- Sales of equipment, accessories and computers- Other related services
To recognize the multi-elements or multiple services at its fair value, the Company has established the necessary indicators and metrics that allows it to assign to each type of element its fair value. In multi-elements plans, these indicators are based on the price offered in each package, considering the offered minutes and data plans offered to the subscribers.
Voice services
• Monthly rent in post-paid plans is billed based on the associated plan and package rates, corresponding to when the services are provided. Revenues billed for services to be rendered in the future are initially recorded as deferred revenues.
• Revenues from local services are derived from charges for line installations, monthly rent for services and monthly charges for metered services based on the number of minutes. These revenues depend on the number of lines in service, the number of newly installed lines and volume of minutes.
• Revenues for interconnection services, which represent calls from other carriers entering the Company’s mobile and fixed line networks (incoming interconnection services), are recognized at the time the service is provided. Such services are invoiced based on the rates previously agreed with other carriers.
• Long-distance revenues originate from airtime or minutes used in making calls in a region or coverage areas outside of the area where the customer’s service is activated. These revenues are recognized at the time the service is provided.
• Revenues from roaming charges are related to airtime charged to customers for making or receiving calls when visiting a local service area, country or region outside the local service area where the customer’s service is activated. The related revenues are recognized at the time the service is provided based on the rates established and agreed upon by our subsidiaries with other domestic and international mobile carriers. See Note 1 on relevant events on new regulation.
36
Data
• Value-added services and other services include voice services and data transmission services (such as two-way and written messages, call information, ring tones, emergency services, among others). Revenues from such services are recognized at the time they are provided or when the services are downloaded.
• Revenues from internet services and the sale of point-to-point and point-to-multipoint links are recognized on the date of installation, which is similar to the date when the respective traffic begins.
• Revenues from corporate networks are obtained mainly from private lines and from providing virtual private network services. These revenues are recognized at the time the respective traffic begins.
Pay television
• Revenues from pay TV include payments for package deals, pay-per-view and advertising, all of which are recognized at the time the services are provided.
Sales of equipment, accessories and computers
• Sales of mobile phone equipment, accessories and computers, which are made to authorized distributors and the general public, are recognized as revenue at the time the products are delivered and accepted by the customer and the recovery of the amounts is probable. The distributors and general public do not have the right to return the products.
The majority of equipment sales are performed though distributors, though not exclusively, as a portion of these equipment sales is performed through client service centers.
Other related services
Transmission rights
• Transmission rights include exclusive rights for the transmission of the Winter Olympic Games and the Rio de Janeiro Olympics for 2016. The related costs and expenses (amortization of its investment) are recognized when the associated revenue is recognized.
Marketing revenues
• Advertising revenues earned through the publication of the telephone directory are recognized over the life of the directories.
Points programs
Points programs offer by some subsidiaries are initially recognized as deferred revenue. Upon redemption of points, the deferred revenue is cancelled and the revenue is recognized along with the cost of equipment ..
c) Cost of mobile equipment and computers
The cost of mobile equipment and computers is recognized at the time the related revenue is recognized. The costs relating to the sale of such equipment is recognized in cost of sales and services. The cost is deferred as part of other assets. See Note 9.
d) Cost of services
These costs include the cost of call terminations in the networks of other carriers, the costs to link the fixed and mobile networks, payments for long-distance services, rental costs for the use of infrastructure (links, ports and measured service), as well as message exchanges between carriers. Such costs are recognized at the time the service is received by the fixed or mobile carriers. These costs also include last-mile costs and line installation costs, which are also recognized at the time the services are received.
Last mile installation costs and decoder-related charges are capitalized at the time of installation and depreciated over the average useful life as the customer remains active in the Company.
- Commissions to distributors
Distribution agreements have three types of commissions related to postpaid plans.
Loyalty and activation commissions are accrued monthly as an expense based on statistical information about customer retention, sales volume and the number of new customers obtained by each distributor. Retention commissions are paid when customers continue for a specified period. Volume commissions are paid at the time the distributor reaches prescribed ranges of activated clients.
In all three cases the fees are recognized within commercial, administrative and general expenses, as these fees are not reflected in the price of services and products.
e) Cash and cash equivalents
Cash and cash equivalents consist of bank deposits and highly liquid investments with maturities of less than three months. These investments are stated at cost plus accrued interest, which is similar to their market value.
The Company also maintains restricted cash held as collateral to meet certain contractual obligations (see Note 9). Restricted cash is presented within other non-current financial assets given that the restrictions are long-term in nature.
37
f) Allowance for bad debts
The Company periodically recognizes a provision for doubtful accounts based mainly on its past experience, the aging of its accounts receivable, the delays in resolving its disputes with other carriers, and the market segments of its customers (governments, businesses and mass market).
Collection policies and procedures vary depending on the credit history of the customer, the credit granted, and the age of the unpaid calls among other reasons.
The evaluation of collection risk of accounts receivables with related parties is performed annually based on an examination of each related party’s financial situation and the markets in which they operate.
g) Inventories
Inventories, which are mainly composed of cellular equipment, accessories, tablets and other devices, are initially recognized at historical cost and are valued using the average cost method, without exceeding their net realizable value.
The estimate of the realizable value of inventories on-hand is based on their age and turnover.
The difference between the sales price to the end user and the subsidized cost of equipment is recognized as an expense in the “cost of sales and service” in the consolidated statements of comprehensive income, at the time of delivery, consequently, the cost of equipment includes the corresponding adjustments of its net realizable value.
h) Business combinations and goodwill
Business combinations are accounted for using the acquisition method, which in accordance with IFRS 3, “Business acquisitions”, consists in general terms as follows:
(i) Identify the acquirer
(ii) Determine the acquisition date
(iii) Value the acquired identifiable assets and assumed liabilities
(iv) Recognize the goodwill or a bargain purchase gain
For acquired subsidiaries, goodwill represents the difference between the purchase price and the fair value of the net assets acquired at the acquisition date. For acquired associates, the investment in associates includes goodwill identified on acquisition, net of any impairment loss.
Acquisition-related cost is accounted for as an expense in the “other expenses” caption in the consolidated statements of comprehensive income as they are incurred.
When the Company acquires a business, it assesses the financial assets and liabilities assumed for appropriate classification and designation in accordance with the contractual terms, economic circumstance and pertinent conditions as of the acquisition date. This includes the separation of embedded derivatives in host contracts by the acquiree.
If the business combination is achieved in stages, any previously held equity interest is remeasured at its acquisition date fair value and any resulting gain or loss is recognized in profit or loss in the “Other expenses” caption in the consolidated statements of comprehensive income.
Goodwill is initially measured as the excess of the aggregate of the fair value of the consideration transferred plus any non-controlling interest in the acquiree over the net value of the identifiable assets acquired and liabilities assumed as of the acquisition date.
If the consideration paid is less than the fair value of the net assets of the acquired company, (in the case of a bargain purchase), the difference is recognized in the consolidated statements of comprehensive income.
Goodwill is reviewed annually to determine its recoverability, or more often if circumstances indicate that the carrying value of the goodwill might not be fully recoverable.
The possible loss of value in goodwill is determined by analyzing the recovery value of the cash generating unit (or the group thereof) to which the goodwill is associated at the time it originated. If this recovery value is lower than the carrying value, an impairment loss is charged to results of operations.
For the years ended December 31, 2012, 2013 and 2014, no impairment losses were recognized for the goodwill shown in the Company’s consolidated statements of financial position.
i) Property, plant and equipment
i) Property, plant and equipment are recorded at acquisition cost, net of accumulated depreciation. Depreciation is computed on the cost of the assets using the straight line method, based on the estimated useful lives of the related assets, beginning the month after they become available for use.
Borrowing costs that are incurred for general financing for construction in progress for periods exceeding six months are capitalized as part of the cost of the asset. During 2012, 2013 and 2014 the borrowing costs that were capitalized amounted to Ps.3,152,811, Ps.3,002,576 and Ps.3,258,928, respectively.

38
In addition to the purchase price and costs directly attributable to preparing an asset in terms of its physical location and condition for use as intended by management, when required, the cost also includes the estimated costs for the dismantlement and removal of the asset, and for restoration of the site where it is located. See Note 15c).
ii) The net book value of property, plant and equipment is removed from the consolidated statements of financial position at the time the asset is sold or when no future economic benefits are expected from its use or sale. Any gains or losses on the sale of property, plant and equipment represent the difference between net proceeds of the sale, if any, and the net book value of the item at the time of sale. These gains or losses are recognized as either other operating income or operating expenses upon sale.
iii) The Company periodically assesses the residual values, useful lives and depreciation methods associated with its property, plant and equipment. If necessary, the effects of any changes in accounting estimates is recognized prospectively, at the closing of each period, in accordance with IAS 8, “Accounting Policies, Changes in Accounting Estimates and Errors”.
For property, plant and equipment made up of several components with different useful lives, the major individual components are depreciated over their individual useful lives. Maintenance costs and repairs are expensed as incurred.
Annual depreciation rates are as follows:
Telephone plant in operation and equipment: Monitoring equipment and network performance 20%-33% Base stations 20% Switching and telephone exchanges 20% Towers, antennas and engineering works 10% Measuring equipment 17% Buildings 3.33% Submarine cable 5% Other assets 10%-33%
iv) The carrying value of property, plant and equipment is reviewed whenever there are indicators of impairment in such assets. Whenever an asset’s recovery value, which is the greater of the asset’s selling price and its value in use (the present value of future cash flows), is less than the asset’s net carrying value, the difference is recognized as an impairment loss.
During the years ended December 31, 2012, 2013 and 2014, no impairment losses were recognized.
v) Inventories for operation of the plant
Inventories for the operation of telephone plants are valued using the average cost method, without exceeding their net realizable value.
The valuation of inventories for the operation of telephone plants considered obsolete, defective or slow-moving, are reduced to their estimated net realizable value. The estimate of the recovery value of inventories is based on their age and turnover.
j) Intangibles
i) Licenses
Licenses to operate wireless telecommunications networks are recorded for at acquisition cost or at fair value at its acquisition date, net of accumulated amortization.The licenses that in accordance with government requirements are categorized as automatically renewable, for a nominal cost and with substantially consistent terms, are considered by the Company as intangible assets with an indefinite useful life. Accordingly, they are not amortized. Licenses are amortized when the Company does not have a basis to conclude that they are indefinite lived. Licenses are amortized using the straight-line method over a period ranging from 5 to 20 years, which represents the usage period of the assets. The payments to the governments are recognized in the cost of service and equipment.ii) Trademarks
Trademarks are recorded at their fair value at the valuation date when acquired. The useful lives of trademarks are assessed as either finite or indefinite. Trademarks with finite useful lives are amortized using the straight-line method over a period ranging from 1 to 10 years . Trademarks with indefinite useful lives are not amortized, but are tested for impairment annually at the cash generating unit level. The assessment of indefinite life is reviewed annually to determine whether the indefinite life continues to be supportable, if not, the change in useful life from indefinite to finite is made on a prospective basis.
iii) Rights of use
Rights of use are recognized according to the amount paid for the right to carry traffic and are amortized over the period in which they are granted.
The carrying value of the Company’s licenses and trademarks with indefinite useful lives and with finite useful lives are reviewed annually and whenever there are indicators of impairment in the value of such assets. When an asset’s recoverable amount, which is the higher of the asset’s fair value, less disposal costs and its value in use (the present value of future cash flows), is less than the asset’s carrying value, the difference is recognized as an impairment loss.
iv) Customer relationships
The value of customer relations are determined and valued at the time that a new subsidiary is acquired, as determined by the Company with the assistance of independent appraisers, and is amortized over the useful life of the customer relationship on a five years.
39
During the years ended December 31, 2012, 2013 and 2014, no impairment losses were recognized for licenses, trademarks, rights of use or customer relationships.
k) Impairment in the value of long-lived assets
The Company has a policy in place for evaluating the existence of indicators of impairment in the carrying value of long-lived assets, investments in associates, goodwill and intangible assets. When there are such indicators, or in the case of assets whose nature requires an annual impairment analysis (goodwill and intangible assets with indefinite useful lives), the Company estimates the recoverable amount of the asset, which is the higher of its fair value, less disposal costs, and its value in use. Value in use is determined by discounting estimated future cash flows, applying a pre-tax discount rate that reflects the time value of money and taking into consideration the specific risks associated with the asset. When the recoverable amount of an asset is below its carrying value, impairment is considered to exist. In this case, the carrying value of the asset is reduced to the asset’s recoverable amount, recognizing the loss in results of operations for the respective period. Depreciation and/or amortization expense of future periods is adjusted based on the new carrying value determined for the asset over the asset’s remaining useful life. Impairment is computed individually for each asset. Recoverable amount is determined for an individual asset, unless the asset does not generate cash inflows that are largely independent of those from other assets or group of assets.
In the estimation of impairments, the Company uses the strategic plans established for the separate cash-generating units to which the assets are assigned. Such strategic plans generally cover a period from three to five years. For longer periods, beginning in the fifth year, projections are based on such strategic plans while applying a constant or declining expected growth rate.
Key assumptions used in value in use calculations
The forecasts were performed by the Company’s management in real terms (net of inflation) and in pesos with acquisition value as of December 31, 2014.
In developing information for financial forecasts, premises and assumptions have been included that any other market participant in similar conditions would consider.
Local synergies have not been taken into consideration that any other market participant would not have taken into consideration to prepare similar forecasted financial information.
The assumptions used to develop the financial forecasts were validated by the Company’s management for each of the cash generating unit (“CGUs”), taking into consideration the following:
- Current subscribers and expected growth.- Type of subscribers (prepaid, postpaid, fixed line, multiple services)- Market situation and penetration expectations- New products and services- Economic situation of each country- Investments in maintenance of the current assets- Investments in technology for expanding the current assets- Market consolidation and market participant synergies
The foregoing forecasts could differ from the results obtained through time; however, América Móvil prepares its estimates based on the current situation of each of the CGUs.
The recoverable amounts are based on value in use. The value in use was determined based on the method of discounted cash flows. The key assumptions used in projecting cash flows are:
- Adjusted EBITDA (which the Company defines as operating income excluding currency fluctuations plus depreciation and amortization) / margin on revenue
- Capital expenditure (“CAPEX”) / margin on revenue- Pre-tax weighted average cost of capital (“WACC”) used to discount the projected cash flows.
To determine the discount rate, América Móvil uses the WACC which was determined for each of the cash generating units in real terms and is described in following paragraphs.
The estimated discount rates to perform the IAS 36 “Impairment of assets”, impairment test for each CGU consider market participants assumptions. Market participants were selected taking into consideration the size, operations and characteristics of the business that were similar to those in América Móvil.
The discount rates represents the current market assessment of the risks specific to each CGU, taking into consideration the time value of money and individual risks of the underlying assets that have not been incorporated in the cash flow estimates. The discount rate calculation is based on the specific circumstances of the Company and its operating segments and is derived from its WACC. The WACC takes into account both debt and equity. The cost of equity is derived from the expected return on investment by América Móvil’s investors. The cost of debt is based

40
on the interest bearing borrowings América Móvil is obliged to service. Segment-specific risk is incorporated by applying individual beta factors.
The beta factors are evaluated annually based on publicly available market data.
Market participant assumptions are important because, not only do they include industry data for growth rates, management also assesses how the CGU’s position, relative to its competitors, might change over the forecasted period.
The most significant assumptions used for the 2013 and 2014 impairment evaluations are shown below:
Adjusted EBIDTA/ CAPEX/ margin on Pre-tax discount rate margin on revenues revenues (WACC)
2013:Brazil (Fixed-line, wireless and TV) 18.11% - 31.37% 15.48% - 27.07% 6.47%Puerto Rico 22.69% 5.05% 8.09%Dominican Republic 39.78% 12.47% 9.41%Mexico 33.48% - 49.74% 5.38% - 18.5% 5.35%Ecuador 49.80% 9.49% 11.78%Peru 40.36% 10.23% 6.54%El Salvador 40.62% 14.90% 8.05%Chile 12.75% 17.52% 6.00%Colombia 29.00% - 47.81% 11.63% - 16.27% 6.20%Other countries 9.40% - 44.37% 0.48%- 28.68% 8.05% - 13.61%
2014:Europe (7 countries) 27.09% 35.08% 6.92%Brazil (Fixedline, wireless and TV) 15.41%-30.53% 31.56%-41.40% 10.29%Puerto Rico 36.43% 9.24% 12.14%Dominican Republic 39.55% 16.72% 11.39%Mexico 34.51%-49.12% 4.87-12.07% 9.19%Ecuador 45.21% 9.26% 15.11%Peru 35.15% 14.14% 10.65%El Salvador 41.88% 16.89% 12.13%Chile 6.63% 34.09% 9.59%Colombia 29.50%-41.35% 13.25%-39.5% 10.55%Other countries 5.29% - 44.32% 0.73%- 30.43% 11.88%-16.67%
In the case of México, Colombia, Brazil and Europe includes Fixed and Wireless operations.
l) Leases
The determination of whether an agreement is, or contains, a lease is based on the substance of the agreement and requires an evaluation of whether performance of the agreement is dependent on the use of a specific asset and whether the agreement transfers the right of use of the asset to the Company.
Operating leases
Leases under which the lessor retains a significant portion of the risks and benefits inherent to the ownership of the leased asset are considered operating leases. Payments made under operating lease agreements are charged to results of operations on a straight-line basis over the rental period.
Finance leases
Lease agreements that transfer substantially all the risks and benefits of ownership of the leased assets to the Company are accounted for as finance leases. Accordingly, upon commencement of the lease, the asset, which is classified based on its nature, and associated debt are recorded at the lower of the fair value of the leased asset or the present value of the lease payments. Finance lease payments are apportioned between the reduction of lease liability and the finance cost so that a constant interest rate is determined on the outstanding liability balance. Finance costs are charged to results of operations over the life of the agreement.
41
m) Financial assets and liabilities
Financial assets
Financial assets are categorized, at initial recognition, as (i) financial assets at fair value through profit or loss, (ii) loans and receivables, (iii) held-to-maturity investments, (iv) available-for-sale financial assets, or as (v) derivatives designated as hedging instruments in an effective hedge, as appropriate.
- Initial recognition and measurement
Financial assets are initially recognized at fair value, plus directly attributable transactions costs, except for financial assets designated upon initial recognition at fair value through profit or loss.
- Subsequent measurement
The subsequent measurement of assets depends on their categorization as either financial assets and liabilities measured at fair value through profit and loss, loans and receivables, held to maturity or available for sale financial assets, or derivatives designated as hedging instruments in an effective hedge.
Financial assets at fair value through profit or loss
Financial assets at fair value through profit or loss include financial assets held for trading and financial assets designated upon initial recognition at fair value through profit or loss as held for trading if they are acquired for the purpose of selling or repurchasing in the short term. Derivatives, including separated embedded derivatives are also classified as held for trading unless they are designated as effective hedging instruments as defined in IAS 39. Financial assets at fair value through profit or loss are recorded in the consolidated statements of financial position at fair value with net changes in fair value in the consolidated statements of comprehensive income in the “valuation of derivatives, interest cost from labor obligations and other financial items”.
Held-to-maturity investments
Held-to-maturity investments are those that the Company has the intent and ability to hold to maturity and are recorded at cost which includes transaction costs and premiums or discounts related to investment that are amortized over the life of the investment based on its outstanding balance, less any impairment. Interest and dividends on investments classified as held-to-maturity are included within interest income.
Available-for-sale financial assets
Available-for-sale financial assets are recorded at fair value, with gains and losses, net of tax, reported in other comprehensive income. Interest and dividends on investments classified as available-for-sale are included in interest income. The fair value of investments is readily available based on market value. The currency effects of securities available for sale are recognized in the consolidated statement of comprehensive income in the period in which they occur.
Loans and receivables
Loans and receivables are non-derivative financial instruments with fixed or determinable payments that are not quoted in an active market. Loans and receivables with a relevant period (including accounts receivable to subscribers, distributors and other receivables) are measured at amortized cost using the effective interest method, less any impairment. Interest income is recognized by applying the effective interest rate, except for accounts receivable from subscribers, distributors and other in the short term when the recognition of interest would be immaterial.
This category generally applies to accounts receivable from subscribers, distributors and other receivables. For more information on receivables, refer to Note 5.
Derecognition
A financial asset (or, where applicable, a part of a financial asset or part of a group of similar financial assets) is primarily derecognized (i.e. removed from the group’s consolidated statement of financial position) when: –The rights to receive cash flows from the asset have expired, or the Company has transferred its rights to receive cash flows from the asset or has assumed an obligation to pay the received cash flows in full without material delay to a third party under a ‘pass-through’ arrangement; and either (i) the Company has transferred substantially all the risks and rewards of the asset, or (ii) the Company has neither transferred nor retained substantially all the risks and rewards of the asset, but has transferred control of the asset.
When the Company has transferred its rights to receive cash flows from an asset or has entered into a pass-through arrangement, it evaluates if and to what extent it has retained the risks and rewards of ownership. When it has neither transferred nor retained substantially all of the risks and rewards of the asset, nor transferred control of the asset, the Company continues to recognize the transferred asset to the extent of the Company’s continuing involvement. In that case, the Company also recognizes an associated liability. The transferred asset and the associated liability are measured on a basis that reflects the rights and obligations that the Company has retained.

42
Impairment of financial assets
The Company assesses, at each reporting date, whether there is any objective evidence that a financial asset or a group of financial assets is impaired. A financial asset or a group of financial assets is deemed to be impaired if, and only if, there is objective evidence of impairment as a result of one or more events that has occurred after the initial recognition of the asset (an incurred loss event) and that loss event has an impact on the estimated future cash flows of the financial asset or the group of financial assets that can be reliably estimated. Evidence of impairment may include indications that the debtors or a group of debtors is experiencing significant financial difficulty, default or delinquency in interest or principal payments, the probability that they will enter bankruptcy or other financial reorganization and when observable data indicate that there is a measurable decrease in the estimated future cash flows, such as changes in arrears or economic conditions that correlate with defaults.
Financial assets carried at amortized cost
For financial assets carried at amortized cost, the Company first assesses whether objective evidence of impairment exists individually for financial assets that are individually significant, or collectively for financial assets that are not individually significant. If the Company determines that no objective evidence of impairment exists for an individually assessed financial asset, whether significant or not, it includes the asset in a group of financial assets with similar credit risk characteristics and collectively assesses them for impairment. Assets that are individually assessed for impairment and for which an impairment loss is, or continues to be, recognized are not included in a collective assessment of impairment.
Financial liabilities
Financial liabilities are classified into the following categories based on the nature of the financial instruments contracted or issued: (i) financial liabilities measured at fair value, and (ii) financial liabilities measured at amortized cost. The Company’s financial liabilities include accounts payable to suppliers, deferred revenues, other accounts payable, loans and derivative financial instruments. Derivative financial instruments are measured at fair value; short- and long-term debt and accounts payable, are accounted for as financial liabilities and measured at amortized cost.
- Initial recognition
All financial liabilities are recognized initially at fair value and, in the case of loans and borrowings and payables, net of directly attributable transaction costs.
- Subsequent measurement
The measurement of financial liabilities depends on their classification, as described below:
- Financial liabilities at fair value through profit or loss
Financial liabilities at fair value through profit or loss include financial liabilities held for trading and financial liabilities designated upon initial recognition at fair value through profit or loss.
Financial liabilities are classified as held for trading if they are incurred for the purpose of repurchasing in the near term. This category includes derivative financial instruments entered into by the Company that are not designated as hedging instruments in hedge relationships as defined by IAS 39, “Financial Instruments: Recognition and Measurement”. Separated embedded derivatives are also classified as held for trading unless they are designated as effective hedging instruments.
Gains or losses on financial liabilities held for trading are recognized in the consolidated statements of comprehensive income.
Financial liabilities designated upon initial recognition at fair value through profit or loss are designated at the initial date of recognition, and only if the criteria in IAS 39 are satisfied. América Móvil has not designated any financial liabilities as fair value liabilities through profit or loss.
Loans and borrowings
After initial recognition, interest bearing loans and borrowings are subsequently measured at amortized cost using the effective interest rate method. Gains and losses are recognized in the consolidated statements of comprehensive income when the liabilities are derecognized as well as through the effective interest rate (“EIR”) amortization process.
Amortized cost is calculated by taking into account any discount or premium on acquisition and fees or costs that are an integral part of the EIR. The EIR amortization is included in interest income in the consolidated statements of comprehensive income.
This category generally applies to interest-bearing loans and borrowings. For more information refer Note 14.
- Derecognition
A financial liability is derecognized when the obligation under the liability is discharged or cancelled, or expires.
When an existing financial liability is replaced by another from the same lender on substantially different terms, or the terms of an existing liability are substantially modified, such an exchange or modification is treated as the derecognition of the original liability and the recognition of a new liability. The difference in the respective carrying amounts is recognized in the consolidated statements of comprehensive income.
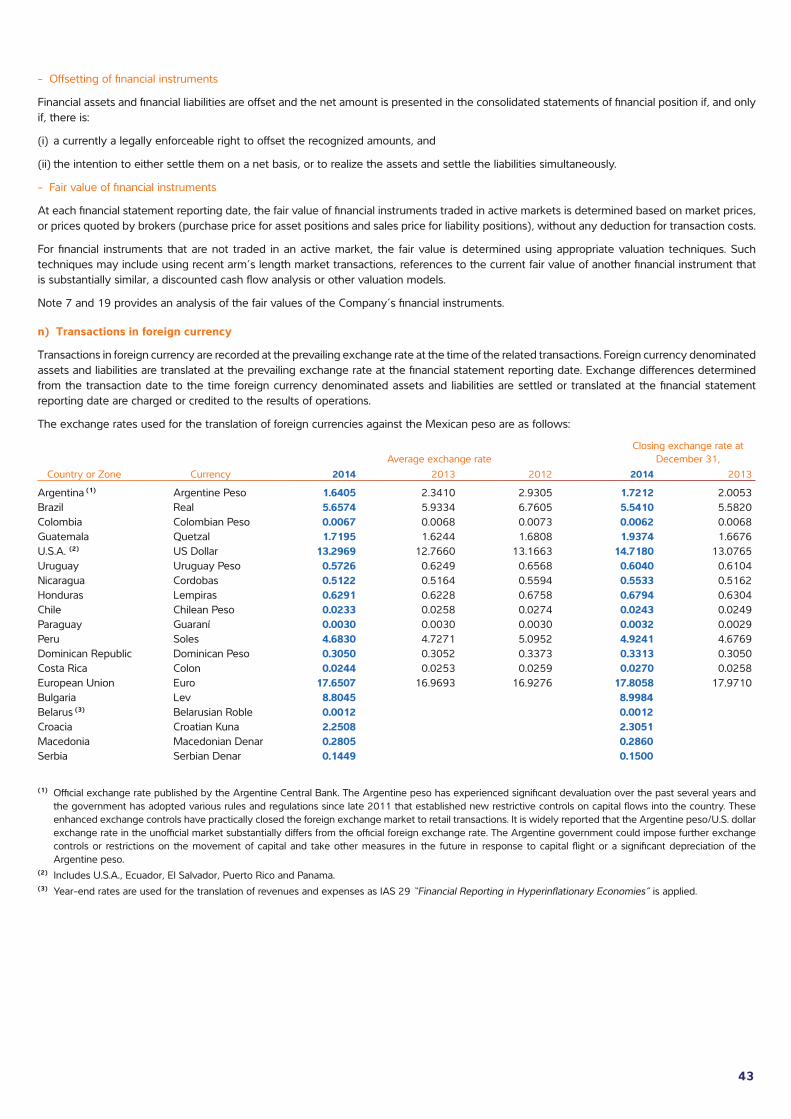
43
- Offsetting of financial instruments
Financial assets and financial liabilities are offset and the net amount is presented in the consolidated statements of financial position if, and only if, there is:
(i) a currently a legally enforceable right to offset the recognized amounts, and
(ii) the intention to either settle them on a net basis, or to realize the assets and settle the liabilities simultaneously.
- Fair value of financial instruments
At each financial statement reporting date, the fair value of financial instruments traded in active markets is determined based on market prices, or prices quoted by brokers (purchase price for asset positions and sales price for liability positions), without any deduction for transaction costs.
For financial instruments that are not traded in an active market, the fair value is determined using appropriate valuation techniques. Such techniques may include using recent arm’s length market transactions, references to the current fair value of another financial instrument that is substantially similar, a discounted cash flow analysis or other valuation models.
Note 7 and 19 provides an analysis of the fair values of the Company’s financial instruments.
n) Transactions in foreign currency
Transactions in foreign currency are recorded at the prevailing exchange rate at the time of the related transactions. Foreign currency denominated assets and liabilities are translated at the prevailing exchange rate at the financial statement reporting date. Exchange differences determined from the transaction date to the time foreign currency denominated assets and liabilities are settled or translated at the financial statement reporting date are charged or credited to the results of operations.
The exchange rates used for the translation of foreign currencies against the Mexican peso are as follows:
Closing exchange rate at Average exchange rate December 31, Country or Zone Currency 2014 2013 2012 2014 2013
Argentina (1) Argentine Peso 1.6405 2.3410 2.9305 1.7212 2.0053Brazil Real 5.6574 5.9334 6.7605 5.5410 5.5820Colombia Colombian Peso 0.0067 0.0068 0.0073 0.0062 0.0068Guatemala Quetzal 1.7195 1.6244 1.6808 1.9374 1.6676U.S.A. (2) US Dollar 13.2969 12.7660 13.1663 14.7180 13.0765Uruguay Uruguay Peso 0.5726 0.6249 0.6568 0.6040 0.6104Nicaragua Cordobas 0.5122 0.5164 0.5594 0.5533 0.5162Honduras Lempiras 0.6291 0.6228 0.6758 0.6794 0.6304Chile Chilean Peso 0.0233 0.0258 0.0274 0.0243 0.0249Paraguay Guaraní 0.0030 0.0030 0.0030 0.0032 0.0029Peru Soles 4.6830 4.7271 5.0952 4.9241 4.6769Dominican Republic Dominican Peso 0.3050 0.3052 0.3373 0.3313 0.3050Costa Rica Colon 0.0244 0.0253 0.0259 0.0270 0.0258European Union Euro 17.6507 16.9693 16.9276 17.8058 17.9710Bulgaria Lev 8.8045 8.9984Belarus (3) Belarusian Roble 0.0012 0.0012Croacia Croatian Kuna 2.2508 2.3051Macedonia Macedonian Denar 0.2805 0.2860Serbia Serbian Denar 0.1449 0.1500
(1) Official exchange rate published by the Argentine Central Bank. The Argentine peso has experienced significant devaluation over the past several years and the government has adopted various rules and regulations since late 2011 that established new restrictive controls on capital flows into the country. These enhanced exchange controls have practically closed the foreign exchange market to retail transactions. It is widely reported that the Argentine peso/U.S. dollar exchange rate in the unofficial market substantially differs from the official foreign exchange rate. The Argentine government could impose further exchange controls or restrictions on the movement of capital and take other measures in the future in response to capital flight or a significant depreciation of the Argentine peso.
(2) Includes U.S.A., Ecuador, El Salvador, Puerto Rico and Panama.(3) Year-end rates are used for the translation of revenues and expenses as IAS 29 “Financial Reporting in Hyperinflationary Economies” is applied.

44
o) Financial reporting in hyperinflationary economies
Financial statements of subsidiaries located in hyperinflationary economies are restated before translation to the reporting currency of the América Móvil and before consolidation in order to reflect the same value of money for all items. Items recognized in the consolidated statements of financial position which are not measured at the applicable year-end measuring unit are restated based on general price index. All non-monetary items measured at cost or amortized costs are restated for the changes in the general price index from the date of transaction to the reporting date. Monetary items are not restated. All items of stockholders’ equity are restated for the changes in the general price index since their addition until the end of the reporting period. All items of the comprehensive income are restated for the change in a general price index from the date of initial recognition to the reporting date. Gains and losses resulting from the net position of monetary items are reported in the consolidated statements of comprehensive income in the “foreign currency exchange (loss) gains, net” caption. The financial statements of the subsidiaries in Belarus are reported at the applicable measuring unit at the reporting date. The Company’s Belarus subsidiary accounted for 0.9% of America Movil’s consolidated assets at December 31, 2014, and 0.8% of revenues for the year ended December 31, 2014.
p) Accounts payable, accrued liabilities and provisions
Liabilities are recognized whenever (i) the Company has current obligations (legal or assumed) resulting from a past event, (ii) when it is probable the obligation will give rise to a future cash disbursement for its settlement, and (iii) the amount of the obligation can be reasonably estimated.
When the effect of the time value of money is significant, the amount of the liability is determined as the present value of the expected disbursements to settle the obligation. The discount rate is determined on a pre-tax basis and reflects current market conditions at the financial statement reporting date and, where appropriate, the risks specific to the liability. Where discounting is used, an increase in the liability is recognized as finance expense.
Contingent liabilities are recognized only when it is probable they will give rise to a future cash disbursement for their settlement. Also, contingencies are only recognized when they will generate a loss.
q) Employee benefits
The Company has defined benefit pension plans in place in its subsidiaries Radiomóvil Dipsa, S.A. de C.V., Telecomunicaciones de Puerto Rico, S.A., Teléfonos de México, Claro Brasil and Telekom Austria. Claro Brasil also has medical plans and defined contribution plans and Telekom Austria provides retirement benefits to its employees under a defined contribution plan. The Company recognizes the costs of these plans based upon independent actuarial computations, and are determined using the projected unit credit method. The latest actuarial computations were prepared as of December 31, 2014.
Mexico
The Mexican subsidiaries have the obligation to pay seniority premiums to personnel based on the Mexican Federal labor law which also establishes the obligation to make certain payments to personnel who cease to provide services under certain circumstances.
The costs of pensions, seniority premiums and severance benefits, are recognized based on calculations by independent actuaries using the projected unit credit method using financial hypotheses, net of inflation.
Puerto Rico
In Puerto Rico, the Company has noncontributing pension plans for full-time employees, which are tax qualified as they meet Employee Retirement Income Security Act of 1974 requirements.
The pension benefit is composed of two elements:
(i) An employee receives an annuity an retirement if they meet the rule of 85 (age at retirement plus accumulated years of service). The annuity is calculated by applying a percentage times years of services to the last three years of salary.
(ii) The second element is a lump-sum benefit based on years of service equivalent to approximately nine to twelve months of salary. Health care and life insurance benefits are also provided to retirees under a separate plan (post-retirement benefits).
Brazil
In Brazil, the Company provides a defined benefit plan and post-retirement medical assistance plan, and a defined contribution plan, through a pension fund that supplements the government retirement benefit, for certain employees.
Under the defined benefit plan, the Company makes monthly contributions to the pension fund equal to 17.5% of the employee’s aggregate salary. In addition, the Company contributes a percentage of the aggregate salary base for funding the post-retirement medical assistance plan for the employees who remain in the defined benefit plan. Each employee makes contributions to the pension fund based on age and salary. All newly hired employees automatically adhere to the defined contribution plan and no further admittance to the defined benefit plan is allowed. For the defined contribution plan, see Note 17.
45
Austria
In Austria the Company provides retirement benefits to its employees under defined contribution and defined benefit plans.
The Company pays contributions to publicly or privately administered pension or severance insurance plans on mandatory or contractual basis. Once the contributions have been paid, the Company has no further payment obligations. The regular contributions are recognized as employee expenses in the year in which they are due.
All other employee benefit obligations provided in Austria are unfunded defined benefit plans for which the Company records provisions which are calculated using the projected unit credit method. The future benefit obligations are measured using actuarial methods on the basis of an appropriate assessment of the discount rate, rate of employee turnover, rate of compensation increase and rate of increase in pensions.
Ecuador
The subsidiary Consorcio Ecuatoriano de Telecomunicaciones, S.A. has a pension plan, where the Company purchases an annuity for the employee and is paid by the employee by means of individual funding. The Company purchases a deferred annuity from an insurance company for which the Company pays an annual premium. This plan is classified as a defined benefit plan.
Other subsidiaries
For the rest of the Company’s subsidiaries, there are no defined benefit plans or compulsory defined contribution structures. However, the foreign subsidiaries make contributions to national pension, social security and severance plans in accordance with the percentages and rates established by the applicable payroll and labor laws of each country. Such contributions are made to the entities designated by the country and are recorded as direct labor expenses in the consolidated statements of comprehensive income as they are incurred.
Re-measurements of defined benefit plans, comprising of actuarial gains and losses, the effect of the asset ceiling, excluding net interest and the return on plan assets (excluding net interest), are recognized immediately in the consolidated statements of financial position with a corresponding debit or credit to retained earnings through OCI in the period in which they occur. Re-measurements are not reclassified to profit or loss in subsequent periods.
Past service costs are recognized in profit or loss on the earlier of:
(i) The date of the plan amendment or curtailment, and
(ii) The date that the Company recognizes restructuring-related costs
Net interest on liability for defined benefits is calculated by applying the discount rate to the net defined benefit liability or asset and it is recognized in the “valuation of derivatives, interest cost from labor obligations and other financial items” in the consolidated statements of comprehensive income. The Company recognizes the changes in the net defined benefit obligation under “cost of sales and services” and “Commercial, administrative and general expenses” in the consolidated statements of comprehensive income.
Paid absences
The Company recognizes a provision for the costs of paid absences, such as vacation time, based on the accrual method.
r) Employee profit sharing
Employee profit sharing is paid by certain subsidiaries of the Company to its eligible employees. In Mexico, until December 31, 2013, employee profit sharing was computed at the rate of 10% of the individual company taxable income, except for depreciation of historical rather than restated values, foreign exchange gains and losses, which are not included until the asset is disposed of or the liability is due and other effects of inflation are also excluded. Effective January 1, 2014, employee profit sharing in Mexico is calculated using the same taxable income for income tax, except for the following:
i) Neither tax losses from prior years nor the employee profit sharing paid during year are deductible.
ii) Payments exempt from taxes for the employees are fully deductible in the employee profit sharing computation.
Employee profit sharing is presented as an operating expense in the consolidated statements of comprehensive income.
46
s) Taxes
- Income taxes
Current income tax is presented as a short-term liability, net of prepayments made during the year.
Deferred income tax is determined using the liability method based on the temporary differences between the tax values of the assets and liabilities and their book values at the financial statement reporting date.
Deferred tax assets and liabilities are measured using the tax rates that are expected to be in effect in the period when the asset will materialize or the liability will be settled, based on the enacted tax rates (and tax legislation) that have been enacted or substantially enacted at the financial statement reporting date. The value of deferred tax assets is reviewed by the Company at each financial statement reporting date and is reduced to the extent that it is more likely than not that the Company will not have sufficient future tax profits to allow for the realization of all or a part of its deferred tax assets. Unrecognized deferred tax assets are revalued at each financial statement reporting date and are recognized when it is more likely than not that there will be sufficient future tax profits to allow for the realization of these assets.
Deferred taxes relating to items recognized outside profit or loss are also recognized outside of profit and loss. These deferred taxes are recognized together with the underlying transaction in other comprehensive income.
Deferred tax consequences on unremitted foreign earnings are accounted for as temporary differences, except to the extent that the Company is able to control the timing of the reversal of the temporary difference; and it is probable that the temporary difference will not reverse in the foreseeable future. Taxes paid on remitted foreign earnings are able to be offset against Mexican taxes, thus to the extent that a remittance is to be made, the deferred tax would be limited to the incremental difference between the Mexican tax rate and the rate of the remitting country. As of December 31, 2013 and 2014, the Company has not provided for any deferred taxes related to unremitted foreign earnings.
The Company offsets tax assets and liabilities if and only if it has a legally enforceable right to set off current tax assets and current tax liabilities and the deferred tax assets and deferred tax liabilities relate to income taxes levied by the same tax authority.
- Sales tax
Revenues, expenses and assets are recognized net of the amount of sales tax, except:
- When the sales tax incurred on a purchase of assets or services is not recoverable from the taxation authority, in which case, the sales tax is recognized as part of the cost of acquisition of the asset or as part of the expense item, as applicable.
- Receivables and payables that are stated with the amount of sales tax included.
The net amount of sales tax recoverable from, or payable to, the taxation authority is included as part of the current receivables or payables in the consolidated statements of financial position unless they are due in more than a year in which case they are classified as non-current.
t) Advertising
Advertising expenses are expensed as incurred. For the years ended December 31, 2012, 2013 and 2014, advertising expenses were Ps.22,652,826 Ps.19,699,228 and Ps.21,772,454, respectively, and are recorded in the consolidated statements of comprehensive income in the caption “Commercial, administrative and general expenses”.
u) Earnings per share
Basic and diluted earnings per share are determined by dividing net profit of the year by the weighted-average number of shares outstanding during the year (common control component of the shares are reflected for all periods presented). In determining the weighted average number of shares issued and outstanding, shares repurchased by the Company have been excluded.
v) Financial risks
The main risks associated with the Company’s financial instruments are: (i) liquidity risk, (ii) market risk (foreign currency exchange risk and interest rate risk) and (iii) credit risk and counterparty risk. The Board of Directors approves the policies submitted by management to mitigate these risks.
(i) Liquidity risk
Liquidity risk is the risk that the Company may not meet its financial obligations associated with financial instruments when they are due. The Company’s financial obligations and commitments are included in Notes 14 and 20.
(ii) Market risk
The Company is exposed to market risks from changes in interest rates and fluctuations in exchange rates of foreign currencies. The Company’s debt is denominated in foreign currencies, mainly in US dollars, other than its functional currency. In order to reduce the risks related to fluctuations in the exchange rate of foreign currency, the Company uses derivative financial instruments such as cross-currency swaps and forwards to adjust exposures resulting from foreign exchange currency. The Company does not use derivatives to hedge the exchange risk arising from having operations in different countries.
47
Additionally, the Company occasionally uses interest rate swaps to adjust its exposure to the variability of the interest rates or to reduce their financing costs. The Company’s practices vary from time to time depending on their judgments about the level of risk, expectations of change in the movements of interest rates and the costs of using derivatives. The Company may terminate or modify a derivative financial instrument at any time. See Note 7 for disclosure of the fair value of derivatives as of December 31, 2013 and 2014.
(iii) Credit risk
Credit risk represents the loss that could be recognized in case the counterparties fail to fully comply with the contractual obligations.
The financial instruments that potentially represent concentrations of credit risk are cash and short-term deposits, trade accounts receivable and financial instruments related to debt and derivatives. The Company’s policy is designed in order to limit its exposure to any one financial institution; therefore, the Company’s financial instruments are contracted with several different financial institutions located in different geographic regions.
The credit risk in accounts receivable is diversified because the Company has a broad customer base that is geographically dispersed. The Company continuously evaluates the credit conditions of its customers and does not require collateral to guarantee collection of its accounts receivable. The Company monitors on a monthly basis its collection cycle to avoid deterioration of its results of operations.
A portion of the Company’s cash surplus is invested in short- term deposits with financial institutions with high credit ratings.
(iv) Sensitivity analysis for market risks
The Company uses sensitivity analyses to measure the potential losses based on a theoretical increase of 100 basis points in interest rates and a 10% fluctuation in exchange rates:
- Exchange rate fluctuations
Should the Company’s debt at December 31, 2014 of Ps. 603,754,987, suffer a 5% increase/(decrease) in exchange rates, the debt would increase/(decrease) by Ps. 34,207,027 and Ps. (26,351,247),respectively.
- Interest rates
In the event that the Company’s agreed-upon interest rates at December 31, 2014 increased/(decreased) by 100 basis points, the increase in net interest expense would increase/decrease by Ps. 7,553,639 and Ps. (6,964,699), respectively.
(v) Concentration of risk
The Company depends on several key suppliers and sellers. During the years ended December 31, 2012, 2013 and 2014, approximately 55%, 64% and 55%, respectively, of the total cost of the cellular equipment of América Móvil represented purchases made from three suppliers, and approximately 20%, 21% and 19%, respectively, of the telephony plant equipment was purchased from two suppliers. If any of these suppliers were to cease to provide equipment and services to the Company, or to provide them in a timely manner and at a reasonable cost, the Company’s business and results of operations might be adversely affected.
(vi) Capital management
The Company manages its capital to ensure that its subsidiaries to continue as going concerns while maximizing the return to stakeholders through the optimization of their balances and debt capital to maintain the lowest cost of capital available. The Company manages its capital structure and makes adjustments according to economic conditions. To maintain the capital structure, the Company may adjust the dividend payment to shareholders or its share buyback program, for which the company holds a reserve. In addition, the Company creates a legal reserve, as required by law. See Note 18.
w) Derivative financial instruments
The Company is exposed to interest rate and foreign currency risks, which it tries to mitigate through a controlled risk management program that includes the use of derivative financial instruments. The Company principally uses cross-currency swaps and, if necessary, foreign currency forwards to offset the short-term risk of exchange rate fluctuations. For purposes of reducing the risks from changes in interest rates, the Company utilizes interest rate swaps through which it pays or receives the net amount resulting from paying or receiving a fixed rate, and from receiving or paying cash based on a variable rate, on notional amounts denominated mainly in Mexican pesos, U.S. dollars, Japanese yen, Swiss francs, Euros and Sterling pounds. For the years ended December 31, 2012, 2013 and 2014, some of the Company’s derivative financial instruments have been designated, and have qualified, as cash flow hedges.
The policy of the Company in this regard comprises: (i) the formal documentation of all transactions between the hedging instruments and hedged positions, (ii) risk management objectives, and (iii) the strategy for executing hedging transactions. This documentation also includes the relationship between the cash flows of the derivatives with those of the Company’s assets and liabilities recognized in the consolidated statement of financial position.
The effectiveness of the Company’s derivatives is evaluated prior to their designation as hedges, as well as during the hedging period, which is performed, at least quarterly, based on recognized statistical techniques. Whenever it is determined that a derivative is not highly effective as a hedge or that the derivative ceases to be a highly effective hedge, the Company ceases to apply hedge accounting for the derivative on a prospective basis.
48
Derivative financial instruments are recognized in the consolidated statement of financial position at fair value, which is obtained from the financial institutions with which the agreements are entered into, and it is the Company’s policy to compare such fair value to the valuation provided by an independent pricing provider retained by the Company. The effective portion of gains or losses on the cash flow derivatives is recognized in equity under the heading “Effect for fair value of derivatives”, and the ineffective portion is charged to results of operations of the period. Changes in the fair value of derivatives that do not qualify as hedging instruments are recognized immediately in results.
The change in fair value recognized in results of operations corresponding to derivatives that qualify as hedges is presented in the same caption of the consolidated statements of comprehensive income as the gain or loss of the hedged item (interests and foreign exchange rate).
x) Current versus non-current classification
The Company presents assets and liabilities in its consolidated statements of financial position based on current/non-current classification. An asset is current when it is:
(i) Expected to be realized or intended to be sold or consumed in the normal operating cycle;
(ii) Held primarily for the purpose of trading;
(iii) Expected to be realized within twelve months after the reporting period; or
(iv) Cash and cash equivalents unless restricted from being exchanged or used to settle a liability for at least twelve months after the reporting period.
All other assets are classified as non-current.
A liability is current when:
(v) It is expected to be settled in the normal operating cycle;
(vi) It is held primarily for the purpose of trading;
(vii) It is due to be settled within twelve months after the reporting period; or
(viii) There is no unconditional right to defer the settlement of the liability for at least twelve months after the reporting period.
The Company classifies all other liabilities as non-current.
Deferred tax assets and liabilities are classified as non-current assets and liabilities.
y) Presentation of consolidated statement of comprehensive income
The costs and expenses shown in the consolidated statements of comprehensive income are presented in combined manner (based on both their function and nature), which allows a better understanding of the components of the Company’s operating income. This classification allows for a comparison to the telecommunications industry.
The Company’s presents operating income in its consolidated statements of comprehensive income since it is a key indicator of the Company’s performance. Operating income represents operating revenues less operating costs and expenses.
The employee benefits expense recognized in 2012, 2013 and 2014 were Ps.36,712,871, Ps.33,768,356 and Ps.36,939,601 recognized as “Cost of sales and services”, respectively and Ps.48,931,454, Ps.46,164,732 and Ps.53,938,718 recognized as “Commercial, administrative and general expenses”, respectively.
z) Operating Segments
Segment information is presented based on information used by management in its decision-making processes. Segment information is presented based on the geographic areas in which the Company operates.
The management of América Móvil is responsible for making decisions regarding the resources to be allocated to the Company’s different segments, as well as evaluating the performance of each segment.
Intersegment revenues and costs, intercompany balances as well as investments in shares in consolidated entities are eliminated upon consolidation and reflected in the “eliminations” column.
None of the segments records revenue from transactions with a single external customer amounting to at least 10% or more of the revenues.
z.1) Convenience Translation
At December 31, 2014, amounts in U.S. dollars have been included in the financial statements solely for the convenience of the reader and have been translated to Mexican pesos at December 31, 2014 at an exchange rate of Ps.14.7180 pesos per U.S. dollar, which was the exchange rate at that date. Such translation should not be construed as a representation that the Mexican peso can be converted to U.S. dollars at the exchange rate in effect on December 31, 2014 or any other exchange rate.
49
z.2) Significant Accounting Judgments, Estimates and Assumptions
In preparing its consolidated financial statements, América Móvil makes estimates concerning a variety of matters. Some of these matters are highly uncertain, and its estimates involve judgments it makes based on the information available to it. In the discussion below, América Móvil has identified several of these matters for which its financial statements would be materially affected if either (1) América Móvil used different estimates that it could reasonably have used or (2) in the future América Móvil changes its estimates in response to changes that are reasonably likely to occur.
The following discussion addresses only those estimates that América Móvil considers most important based on the degree of uncertainty and the likelihood of a material impact if it used a different estimate. There are many other areas in which América Móvil uses estimates about uncertain matters, but the reasonably likely effect of changed or different estimates is not material to the financial presentation for those other areas.
Fair Value of Financial Assets and Liabilities
América Móvil has substantial financial assets and liabilities that it recognizes at their fair value, which is an estimate of the amount at which the instrument could be exchanged in a current transaction between willing parties. The methodologies and assumptions América Móvil uses to estimate an instrument’s fair value depend on the type of instrument and include (i) recognizing cash and cash equivalents and trade receivables and trade payables and other current liabilities at close to their carrying amount, (ii) recognizing quoted instruments at their price quotations on the reporting date, (iii) recognizing unquoted instruments, such as loans from banks and obligations under financial leases, by discounting future cash flows using rates for similar instruments and (iv) applying various valuation techniques, such as present value calculations, to derivative instruments. Using different methodologies or assumptions to estimate the fair value of AMX’s financial assets and liabilities could materially impact the reported financial results. See Note 19.
Estimated useful lives of plant, property and equipment
América Móvil estimates the useful lives of particular classes of plant, property and equipment in order to determine the amount of depreciation expense to be recorded in each period. América Móvil currently depreciates most of its telephone plant and equipment based on an estimated useful life determined upon the expected particular conditions of operations and maintenance in each of the countries in which it operates. The estimates are based on AMX’s historical experience with similar assets, anticipated technological changes and other factors, taking into account the practices of other telecommunications companies. América Móvil reviews estimated useful lives each year to determine whether they should be changed, and at times, it changes them for particular classes of assets. América Móvil may shorten the estimated useful life of an asset class in response to technological changes, changes in the market or other developments. This results in increased depreciation expense. See Notes 2i) and Note 10.
Impairment of Long-Lived Assets
América Móvil has large amounts of long-lived assets, including property, plant and equipment, intangible assets, investments in affiliates and goodwill, on its consolidated statement of financial position. América Móvil is required to test long-lived assets for impairment when circumstances indicate a potential impairment or, in some cases, at least on an annual basis. The impairment analysis for long-lived assets requires the Company to estimate the recovery value of the asset, which is the higher of its fair value (minus any disposal costs) and its value in use. To estimate the fair value of a long-lived asset, América Móvil typically takes into account recent market transactions or, if no such transactions can be identified, América Móvil uses a valuation model that requires the making of certain assumptions and estimates. Similarly, to estimate the value in use of long-lived assets, América Móvil typically makes various assumptions about the future prospects for the business to which the asset relates, consider market factors specific to that business and estimate future cash flows to be generated by that business. Based on this impairment analysis, including all assumptions and estimates related thereto, as well as guidance provided by IFRS relating to the impairment of long-lived assets, América Móvil determines whether it needs to take an impairment charge to reduce the net carrying value of the asset as stated on its consolidated statement of financial positiont. Assumptions and estimates about future values and remaining useful lives are complex and often subjective. They can be affected by a variety of factors, including external factors, such as industry and economic trends, and internal factors, such as changes in the Company’s business strategy and its internal forecasts. Different assumptions and estimates could materially impact the Company’s reported financial results. More conservative assumptions of the anticipated future benefits from these businesses could result in impairment charges, which would decrease net income and result in lower asset values on the consolidated statement of financial position. Conversely, less conservative assumptions could result in smaller or no impairment charges, higher net income and higher asset values. The key assumptions used to determine the recoverable amount for the Company’s CGUs, are further explained in Notes 2m) and Note 10 and Note 11.
50
Deferred Income Taxes
América Móvil is required to estimate its income taxes in each of the jurisdictions in which it operates. This process involves the jurisdiction-by-jurisdiction estimation of actual current tax exposure and the assessment of temporary differences resulting from the differing treatment of certain items, such as accruals and amortization, for tax and financial reporting purposes, as well as net operating loss carry-forwards and other tax credits. These items result in deferred tax assets and liabilities, which are included in the América Móvil’s consolidated statement of financial position. América Móvil assesses in the course of its tax planning procedures the fiscal year of the reversal of its deferred tax assets and liabilities, and if there will be future taxable profits in those periods to support the recognition of the deferred tax assets. Significant management judgment is required in determining the Company’s provisions for income taxes, deferred tax assets and liabilities. The analysis is based on estimates of taxable income in the jurisdictions in which América Móvil operates and the period over which the deferred tax assets and liabilities will be recoverable or settled. If actual results differ from these estimates, or América Móvil adjusts these estimates in future periods, its financial position and results of operations may be materially affected.
América Móvil records deferred tax assets based on the amount that it believes is probable to be realized. In assessing the future realization of deferred tax assets, the Company considers future taxable income and ongoing tax planning strategies. In the event that the estimates of projected future taxable income and benefits from tax planning strategies are lowered, or changes in current tax regulations are enacted that would impose restrictions on the timing or extent of the ability to utilize the tax benefits of net operating loss carry-forwards in the future, an adjustment to the recorded amount of deferred tax assets would be made, with a related charge to income. See Note 13.
Accruals
Accruals are recorded when, at the end of the period, the Company has a present obligation as a result of past events, whose settlement requires an outflow of resources that is considered probable and can be measured reliably. This obligation may be legal or constructive, arising from, but not limited to, regulation, contracts, common practice or public commitments, which have created a valid expectation for third parties that the Company will assume certain responsibilities. The amount recorded is the best estimation performed by the Company’s management in respect of the expenditure that will be required to settle the obligations, considering all the information available at the date of the financial statements, including the opinion of external experts, such as legal advisors or consultants. Accruals are adjusted to account for changes in circumstances for ongoing matters and the establishment of additional accruals for new matters.
If América Móvil is unable to reliably measure the obligation, no accrual is recorded and information is then presented in the notes to its consolidated financial statements. Because of the inherent uncertainties in this estimation, actual expenditures may be different from the originally estimated amount recognized. See Note 15.
América Móvil is subject to various claims and contingencies related to tax, labor and legal proceedings as described in Note 20.
Labor Obligations
América Móvil recognizes liabilities on its consolidated statement of financial position and expenses in its comprehensive income statement to reflect its obligations related to its post-retirement seniority premiums, pension and retirement plans in the countries in which it operates and offer defined contribution and benefit pension plans. The amounts the Company recognizes are determined on an actuarial basis that involves many estimates and accounts for post-retirement and termination benefits in accordance with IFRS.
América Móvil uses estimates in four specific areas that have a significant effect on these amounts: (i) the rate of return América Móvil assumes its pension plan will achieve on its investments, (ii) the rate of increase in salaries that the Company assumes it will observe in future years, (iii) the discount rates that the Company uses to calculate the present value of its future obligations and (iv) the expected rate of inflation. The assumptions América Móvil has applied are further disclosed in Note 17. These estimates are determined based on actuarial studies performed by independent experts using the projected unit-credit method.
Allowance for Dad Debts
América Móvil maintains an allowance for bad debts for estimated losses resulting from the failure of its customers, distributors and cellular operators to make required payments. The Company bases these estimates on the individual conditions of each of the markets in which it operates that may impact the collectability of accounts. In particular, in making these estimates the Company takes into account with respect to accounts (i) with customers, the number of days since the calls were made, (ii) with distributors, the number of days invoices are overdue and (iii) with cellular operators, both the number of days since the calls were made and any disputes with respect to such calls. The amount of loss, if any, that América Móvil actually experiences with respect to these accounts may differ from the amount of the allowance maintained in connection with them. See Note 5.
51
z.3) Reclassifications
The following amounts in consolidated statements of comprehensive income for the years ended December 31, 2012 and 2013 have been reclassified to conform to the presentation for the year ended December 31, 2014:
As previously 2012 Reported Reclassification As reclassified
In the Consolidated Statement of Comprehensive income: Interest income Ps. 5,776,600 Ps. ( 1,917,514) Ps. 3,859,086 Interest expense ( 24,914,596) 2,646,825 ( 22,267,771) Valuation of derivatives, interest cost from labor obligations and other financial items, net ( 12,535,708) ( 729,311) ( 13,265,019) Equipment, accessories, computer sale and other services 87,613,043 ( 87,613,043) – Sales of equipment, accessories and Computer – 69,562,903 69,562,903 Other services – 18,050,140 18,050,140 Ps. 55,939,339 Ps. – Ps. 55,939,339
In the Consolidated Statement of Cash Flows:Loss in partial sales of shares of associated company Ps. – Ps. 795,028 Ps. 795,028Interest income ( 5,776,600) 1,917,514 ( 3,859,086)Interest expense 24,914,596 ( 2,646,825) 22,267,771(Gain) loss in valuation of derivative financial instruments, capitalized interest expense and other, net 2,988,396 ( 65,717) 2,922,679 Ps. 22,126,392 Ps. – Ps. 22,126,392
As previously 2013 Reported Reclassification As reclassified
In the Consolidated Statement of Financial Position:Licenses and rights of use, net Ps. 37,053,832 Ps. ( 37,053,832) Ps. –Trademarks, net 1,166,306 ( 1,166,306) –Intangibles, net – 38,220,138 38,220,138 Ps. 38,220,138 Ps. – Ps. 38,220,138
In the Consolidated Statement of Comprehensive income: Equipment, accessories, computer sale and other services Ps. 103,817,288 Ps. ( 103,817,288) Ps. – Sales of equipment, accessories and Computer – 84,544,261 84,544,261 Other services – 19,273,027 19,273,027 Interest income 6,245,323 ( 3,319,489) 2,925,834 Interest expense ( 30,349,694) 6,399,041 ( 23,950,653) Valuation of derivatives, interest cost from labor obligations and other financial items, net ( 5,211,983) ( 3,079,552) ( 8,291,535) Ps. 74,500,934 Ps. – Ps. 74,500,934
In the Consolidated Statement of Cash Flows: Loss in partial sales of shares of associated company Ps. – Ps. 896,956 Ps. 896,956 Interest income ( 6,245,323) 3,319,489 ( 2,925,834) Interest expense 30,349,694 ( 6,399,041) 23,950,653 (Gain) loss in valuation of derivative financial instruments, capitalized interest expense and other, net ( 8,027,124) 2,182,596 ( 5,844,528) Ps. 16,077,247 Ps. – Ps. 16,077,247

52
3 New standards, interpretations and amendments thereofThe Company applied for the first time certain standards and amendments, which were effective for annual periods beginnings on or after January 1, 2014. However, the adoption of those IFRS standards and amendments did not have a significant impact on the consolidated financial statements of América Móvil.
The nature and the impact of each new standard/amendment are described below:
Investment Entities – Amendments to IFRS 10 Consolidated Financial Statements, IFRS 12 Disclosure of Interests in Other Entities and IAS 27 Separate Financial Statements.
These amendments provide an exception to the consolidation requirement for entities that meet the definition of an investment entity under IFRS 10 Consolidated Financial Statements and must be applied retrospectively, subject to certain transition relief. The exception to consolidation requires investment entities to account for subsidiaries at fair value through profit or loss. The Company determined these amendments had no impact on the Company´s consolidated results or in its consolidated statements.
Offsetting Financial Assets and Financial Liabilities — Amendments to IAS 32 Financial Instruments
These amendments clarify the meaning of ’currently has a legally enforceable right to
set-off’ and the criteria for non-simultaneous settlement mechanisms of clearing houses to qualify for offsetting and is applied retrospectively. The Company determined these amendments had no impact on the Company’s consolidated results or in its consolidated statements.
Recoverable Amount Disclosures for Non-Financial Assets — Amendments to IAS 36 Impairment of Assets
These amendments require disclosure of the recoverable amounts of the assets or cash generating units (“CGUs”) for which an impairment loss has been recognized or reversed during the period. The Company determined these amendments had no impact on the disclosures of the Company’s consolidated statements.
Novation of Derivatives and Continuation of Hedge Accounting — Amendments to IAS 39 Financial Instruments
These amendments provide relief from discontinuing hedge accounting when novation of a derivative designated as a hedging instrument meets certain criteria and retrospective application is required. The Company determined these amendments had no impact on the Company´s consolidated results or in its consolidated statements.
IFRIC 21 Levies
IFRIC 21 clarifies that an entity recognizes a liability for a levy when the activity that triggers payment, as identified by the relevant legislation, occurs. For a levy that is triggered upon reaching a minimum threshold, the interpretation clarifies that no liability should be anticipated before the specified minimum threshold is reached. The Company determined this IFRIC had no impact on the Company´s consolidated results or in its consolidated statements.
Improvements to IFRSs – 2010-2012 Cycle
In the 2010-2012 annual improvements cycle, the IASB issued seven amendments to six standards, which included an amendment to IFRS 13 Fair Value Measurement. The amendment to IFRS 13 was effective immediately and, it clarifies in the Basis for Conclusions that short-term receivables and payables with no stated interest rates can be measured at invoice amounts when the effect of discounting is immaterial. The Company determined these new improvements had no impact on the Company´s consolidated results or in its consolidated statements.
The amendments to IFRS 8 Operating segments became effective on July 1, 2014 and are applied retrospectively and clarify that an entity must disclose the judgments made by management in applying the aggregation criteria in paragraph 12 of IFRS 8, including a brief description of operating segments that have been aggregated and the economic characteristics (e.g., sales and gross margins) used to assess whether the segments are ‘similar’. The reconciliation of segment assets to total assets is only required to be disclosed if the reconciliation is reported to the chief operating decision maker, similar to the required disclosure for segment liabilities. The disclosures related to these amendment are described in Notes 2z) and 21.
The amendments to IFRS 2 Share-based payment, IFRS 3 Business combination, IAS 16 Property, Plant and Equipment, IAS 38 Intangible Assets and IAS 24 Related parties did not have an impact in the Company’s consolidated financial statements.
Improvements to IFRSs – 2011-2013 Cycle:
In the 2011-2013 annual improvements cycle, the IASB issued four amendments to four standards, which included an amendment to IFRS 1 First-time Adoption of International Financial Reporting Standards. The amendment to IFRS 1 was effective immediately and clarifies in the Basis for Conclusions that an entity may choose to apply either a current standard or a new standard that is not yet mandatory, but permits early application, provided either standard is applied consistently throughout the periods presented in the entity’s first IFRS financial statements. The Company determined these new improvements had no impact on the Company´s consolidated results or in its consolidated statements.
53
Amendments to IAS 19 Defined Benefit Plans: Employee Contributions
IAS 19 requires an entity to consider contributions from employees or third parties when accounting for defined benefit plans. Where the contributions are linked to service, they should be attributed to periods of service as a negative benefit. These amendments clarify that, if the amount of the contributions is independent of the number of years of service, an entity is permitted to recognize such contributions as a reduction in the service cost in the period in which the service is rendered, instead of allocating the contributions to the periods of service. This amendment is effective for annual periods beginning on or after July 1, 2014. The Company determined this amendment had no impact on the Company’s consolidated results or in its consolidated statements.
Standards issued but not yet effective and annual improvements
The Company has not early adopted any other IFRS interpretation or amendment that has been issued but is not yet effective.
The standards and interpretations that are issued, but not yet effective, up to the date of issuance of the Company’s financial statements are as describe below. The Company is in process of analyzing its impact in its financial statement and the relative notes.
IFRS 9 Financial Instruments
In July 2014, the IASB issued the final version of IFRS 9 Financial Instruments which reflects all phases of the financial instruments project and replaces IAS 39 Financial Instruments: Recognition and Measurement and all previous versions of IFRS 9. The standard introduces new requirements for classification and measurement, impairment, and hedge accounting. IFRS 9 is effective for annual periods beginning on or after January 1, 2018, with early application permitted. Retrospective application is required, but comparative information is not compulsory. Early application of previous versions of IFRS 9 (2009, 2010 and 2013) is permitted if the date of initial application is before February 1, 2015. The adoption of IFRS 9 will have an effect on the classification and measurement of the Company’s financial assets, but no impact on the classification and measurement of the Company’s financial liabilities.
IFRS 15 Revenue from Contracts with Customers
IFRS 15 was issued in May 2014 and establishes a new five-step model that will apply to revenue arising from contracts with customers. Under IFRS 15 revenue is recognized at an amount that reflects the consideration to which an entity expects to be entitled in exchange for transferring goods or services to a customer. The principles in IFRS 15 provide a more structured approach to measuring and recognizing revenue. The new revenue standard is applicable to all entities and will supersede all current revenue recognition requirements under IFRS. Either a full or modified retrospective application is required for annual periods beginning on or after January 1, 2017 with early adoption permitted. The Company is currently assessing the impact of IFRS 15 and plans to adopt the new standard on the required effective date.
Amendments to IFRS 11 Joint Arrangements: Accounting for Acquisitions of Interests
The amendments to IFRS 11 require that a joint operator accounting for the acquisition of an interest in a joint operation, in which the activity of the joint operation constitutes a business must apply the relevant IFRS 3 principles for business combinations accounting. The amendments also clarify that a previously held interest in a joint operation is not remeasured on the acquisition of an additional interest in the same joint operation while joint control is retained. In addition, a scope exclusion has been added to IFRS 11 to specify that the amendments do not apply when the parties sharing joint control, including the reporting entity, are under common control of the same ultimate controlling party. The amendments apply to both the acquisition of the initial interest in a joint operation and the acquisition of any additional interests in the same joint operation and are prospectively effective for annual periods beginning on or after January 1, 2016, with early adoption permitted. The Company has yet to quantify the impact these amendments will have on its financial statements.
Amendments to IAS 16 and IAS 38: Clarification of Acceptable Methods of Depreciation and Amortization
The amendments clarify the principle in IAS 16 and IAS 38 that revenue reflects a pattern of economic benefits that are generated from operating a business (of which the asset is part) rather than the economic benefits that are consumed through use of the asset. As a result, a revenue-based method cannot be used to depreciate property, plant and equipment and may only be used in very limited circumstances to amortize intangible assets. The amendments are effective prospectively for annual periods beginning on or after January 1, 2016, with early adoption permitted. These amendments are not expected to have any impact to the Company given that the Company has not used a revenue-based method to depreciate its non-current assets.
Amendments to IAS 27: Equity Method in Separate Financial Statements
The amendments will allow entities to use the equity method to account for investments in subsidiaries, joint ventures and associates in their separate financial statements. Entities already applying IFRS and electing to change to the equity method in its separate financial statements will have to apply that change retrospectively. For first-time adopters of IFRS electing to use the equity method in its separate financial statements, they will be required to apply this method from the date of transition to IFRS. The amendments are effective for annual periods beginning on or after January 1, 2016, with early adoption permitted. The Company has yet to quantify the impact these amendments will have on its financial statements.

54
4 Cash and Cash Equivalents At December 31, 2013 2014
Cash in banks Ps. 22,617,446 Ps. 38,601,071Short-term deposits 25,546,104 27,872,632 Ps. 48,163,550 Ps. 66,473,703
5 Accounts receivable from subscribers, distributors, recoverable taxes and other, neta) An analysis of accounts receivable at December 31, 2013 and 2014 is as follows:
At December 31, 2013 2014
Subscribers and distributors Ps. 96,007,977 Ps. 121,490,248Mobile phone carriers for network interconnection and other services including calling party pays 6,305,459 7,181,554Recoverable taxes 31,116,185 23,556,336Sundry debtors 14,735,135 19,041,797 148,164,756 171,269,935Less: Allowance for bad debts ( 20,292,099) ( 25,685,528)Net Ps. 127,872,657 Ps. 145,584,407
b) Changes in the allowance for bad debts were as follows:
For the years ended December31, 2012 2013 2014
Balance at beginning of year Ps. ( 23,358,822) Ps. ( 22,438,144) Ps. ( 20,292,099)Increases recorded in expenses ( 12,009,580) ( 10,417,235) ( 11,770,721)Charges against the allowance 10,534,631 14,405,151 4,978,376Translation effect 2,395,627 ( 1,841,871) 1,398,916Balance at end of year Ps. ( 22,438,144) Ps. ( 20,292,099) Ps. ( 25,685,528)
c) The following table shows the aging of accounts receivable at December 31, 2013 and 2014, for subscribers and distributors:
Unbilled services Greater than Total provided 1- 30 days 30-60 days 61-90 days 90 days
December 31, 2013 Ps. 96,007,977 Ps. 48,223,217 Ps. 21,308,236 Ps. 3,561,179 Ps. 2,439,653 Ps. 20,475,692December 31, 2014 Ps. 121,490,248 Ps. 59,703,005 Ps. 25,946,186 Ps. 3,908,512 Ps. 2,551,247 Ps. 29,381,298
In accordance with the Company’s accounting policy for the allowance for bad debts, as of December 31, 2013 and 2014, there are accounts receivable greater than 90 days that are not impaired as they are primarily due from governmental institutions. To estimate the recoverability of accounts receivable, the Company considers any change in the credit quality of the subscribers and distributors from the date the credit was granted until the end of period.
d) The following table shows the accounts receivable from subscribers and distributors included in the allowance for doubt accounts, as of December 31, 2013 and 2014:
Greater than Total 61-90 days 90 days
December 31, 2013 Ps. 20,292,099 Ps. 814,500 Ps. 19,477,599December 31, 2014 Ps. 25,685,528 Ps. 1,026,898 Ps. 24,658,630
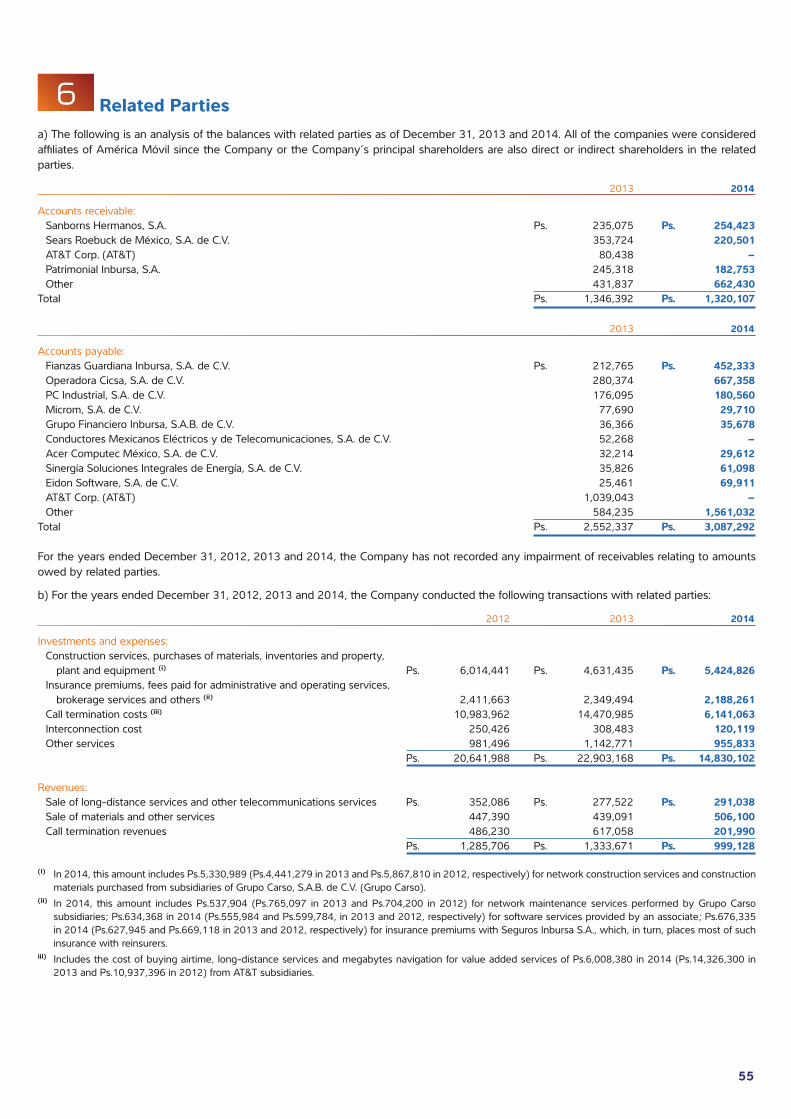
55
6 Related Partiesa) The following is an analysis of the balances with related parties as of December 31, 2013 and 2014. All of the companies were considered affiliates of América Móvil since the Company or the Company’s principal shareholders are also direct or indirect shareholders in the related parties.
2013 2014
Accounts receivable: Sanborns Hermanos, S.A. Ps. 235,075 Ps. 254,423 Sears Roebuck de México, S.A. de C.V. 353,724 220,501 AT&T Corp. (AT&T) 80,438 – Patrimonial Inbursa, S.A. 245,318 182,753 Other 431,837 662,430Total Ps. 1,346,392 Ps. 1,320,107
2013 2014
Accounts payable: Fianzas Guardiana Inbursa, S.A. de C.V. Ps. 212,765 Ps. 452,333 Operadora Cicsa, S.A. de C.V. 280,374 667,358 PC Industrial, S.A. de C.V. 176,095 180,560 Microm, S.A. de C.V. 77,690 29,710 Grupo Financiero Inbursa, S.A.B. de C.V. 36,366 35,678 Conductores Mexicanos Eléctricos y de Telecomunicaciones, S.A. de C.V. 52,268 – Acer Computec México, S.A. de C.V. 32,214 29,612 Sinergía Soluciones Integrales de Energía, S.A. de C.V. 35,826 61,098 Eidon Software, S.A. de C.V. 25,461 69,911 AT&T Corp. (AT&T) 1,039,043 – Other 584,235 1,561,032Total Ps. 2,552,337 Ps. 3,087,292
For the years ended December 31, 2012, 2013 and 2014, the Company has not recorded any impairment of receivables relating to amounts owed by related parties.
b) For the years ended December 31, 2012, 2013 and 2014, the Company conducted the following transactions with related parties:
2012 2013 2014
Investments and expenses: Construction services, purchases of materials, inventories and property, plant and equipment (i) Ps. 6,014,441 Ps. 4,631,435 Ps. 5,424,826 Insurance premiums, fees paid for administrative and operating services, brokerage services and others (ii) 2,411,663 2,349,494 2,188,261 Call termination costs (iii) 10,983,962 14,470,985 6,141,063 Interconnection cost 250,426 308,483 120,119 Other services 981,496 1,142,771 955,833 Ps. 20,641,988 Ps. 22,903,168 Ps. 14,830,102
Revenues: Sale of long-distance services and other telecommunications services Ps. 352,086 Ps. 277,522 Ps. 291,038 Sale of materials and other services 447,390 439,091 506,100 Call termination revenues 486,230 617,058 201,990 Ps. 1,285,706 Ps. 1,333,671 Ps. 999,128
(i) In 2014, this amount includes Ps.5,330,989 (Ps.4,441,279 in 2013 and Ps.5,867,810 in 2012, respectively) for network construction services and construction materials purchased from subsidiaries of Grupo Carso, S.A.B. de C.V. (Grupo Carso).
(ii) In 2014, this amount includes Ps.537,904 (Ps.765,097 in 2013 and Ps.704,200 in 2012) for network maintenance services performed by Grupo Carso subsidiaries; Ps.634,368 in 2014 (Ps.555,984 and Ps.599,784, in 2013 and 2012, respectively) for software services provided by an associate; Ps.676,335 in 2014 (Ps.627,945 and Ps.669,118 in 2013 and 2012, respectively) for insurance premiums with Seguros Inbursa S.A., which, in turn, places most of such insurance with reinsurers.
iii) Includes the cost of buying airtime, long-distance services and megabytes navigation for value added services of Ps.6,008,380 in 2014 (Ps.14,326,300 in 2013 and Ps.10,937,396 in 2012) from AT&T subsidiaries.
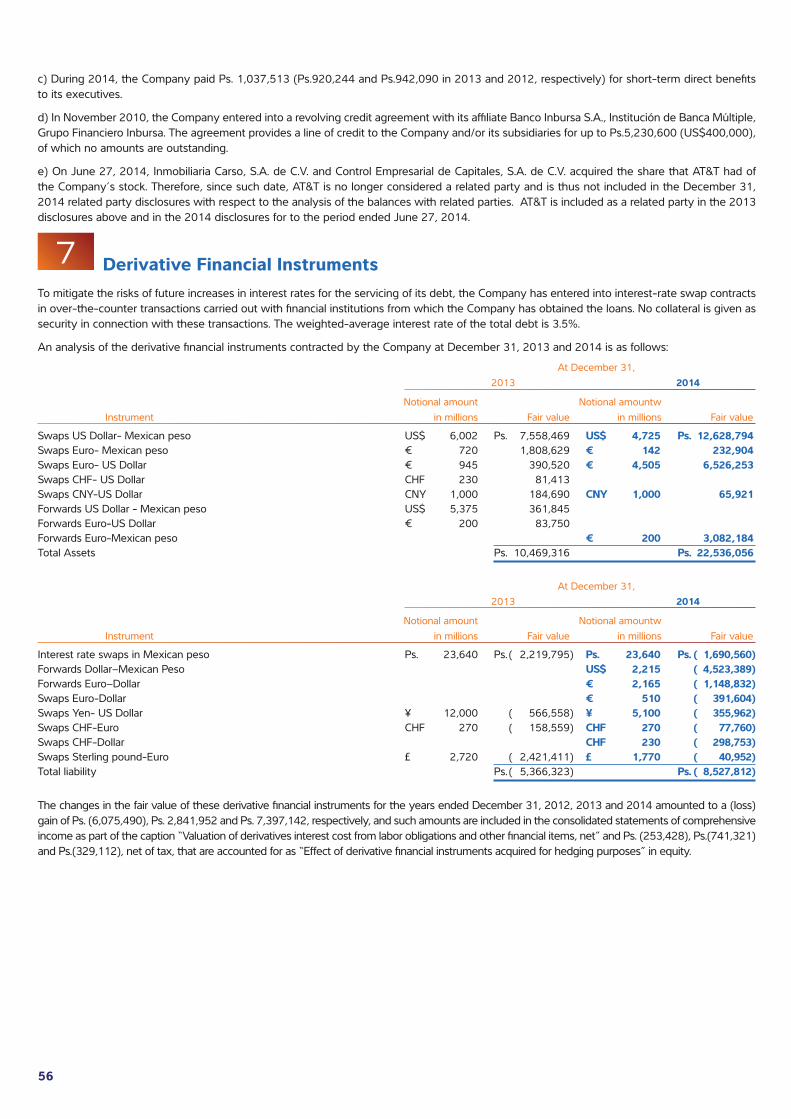
56
c) During 2014, the Company paid Ps. 1,037,513 (Ps.920,244 and Ps.942,090 in 2013 and 2012, respectively) for short-term direct benefits to its executives.
d) In November 2010, the Company entered into a revolving credit agreement with its affiliate Banco Inbursa S.A., Institución de Banca Múltiple, Grupo Financiero Inbursa. The agreement provides a line of credit to the Company and/or its subsidiaries for up to Ps.5,230,600 (US$400,000), of which no amounts are outstanding.
e) On June 27, 2014, Inmobiliaria Carso, S.A. de C.V. and Control Empresarial de Capitales, S.A. de C.V. acquired the share that AT&T had of the Company’s stock. Therefore, since such date, AT&T is no longer considered a related party and is thus not included in the December 31, 2014 related party disclosures with respect to the analysis of the balances with related parties. AT&T is included as a related party in the 2013 disclosures above and in the 2014 disclosures for to the period ended June 27, 2014.
7 Derivative Financial InstrumentsTo mitigate the risks of future increases in interest rates for the servicing of its debt, the Company has entered into interest-rate swap contracts in over-the-counter transactions carried out with financial institutions from which the Company has obtained the loans. No collateral is given as security in connection with these transactions. The weighted-average interest rate of the total debt is 3.5%.
An analysis of the derivative financial instruments contracted by the Company at December 31, 2013 and 2014 is as follows: At December 31, 2013 2014
Notional amount Notional amountw Instrument in millions Fair value in millions Fair value
Swaps US Dollar- Mexican peso US$ 6,002 Ps. 7,558,469 US$ 4,725 Ps. 12,628,794Swaps Euro- Mexican peso € 720 1,808,629 € 142 232,904Swaps Euro- US Dollar € 945 390,520 € 4,505 6,526,253Swaps CHF- US Dollar CHF 230 81,413Swaps CNY-US Dollar CNY 1,000 184,690 CNY 1,000 65,921Forwards US Dollar - Mexican peso US$ 5,375 361,845Forwards Euro-US Dollar € 200 83,750Forwards Euro-Mexican peso € 200 3,082,184Total Assets Ps. 10,469,316 Ps. 22,536,056
At December 31, 2013 2014
Notional amount Notional amountw Instrument in millions Fair value in millions Fair value
Interest rate swaps in Mexican peso Ps. 23,640 Ps. ( 2,219,795) Ps. 23,640 Ps. ( 1,690,560)Forwards Dollar–Mexican Peso US$ 2,215 ( 4,523,389)Forwards Euro–Dollar € 2,165 ( 1,148,832)Swaps Euro-Dollar € 510 ( 391,604)Swaps Yen- US Dollar ¥ 12,000 ( 566,558) ¥ 5,100 ( 355,962)Swaps CHF-Euro CHF 270 ( 158,559) CHF 270 ( 77,760)Swaps CHF-Dollar CHF 230 ( 298,753)Swaps Sterling pound-Euro £ 2,720 ( 2,421,411) £ 1,770 ( 40,952)Total liability Ps. ( 5,366,323) Ps. ( 8,527,812)
The changes in the fair value of these derivative financial instruments for the years ended December 31, 2012, 2013 and 2014 amounted to a (loss) gain of Ps. (6,075,490), Ps. 2,841,952 and Ps. 7,397,142, respectively, and such amounts are included in the consolidated statements of comprehensive income as part of the caption “Valuation of derivatives interest cost from labor obligations and other financial items, net” and Ps. (253,428), Ps.(741,321) and Ps.(329,112), net of tax, that are accounted for as “Effect of derivative financial instruments acquired for hedging purposes” in equity.

57
The maturities of the notional amount of the derivatives are as follows: Notional amount in Instrument millions 2015 2016 2017 2018 2019 Thereafter
Swaps US Dollar- Mexican peso US$ 4,756 350 350 4,025Swaps Euro- Mexican peso € 142 72 70Swaps Euro- US Dollar € 4,505 4,505Swaps CNY-US Dollar CNY 1,000 1,000Forwards Euro-Mexican peso € 200 200Total assets
Interest rate swaps in Mexican peso Ps. 23,640 3,840 4,050 15,350 400Swaps Yen- US Dollar ¥ 5,100 5,100Swaps CHF-Euro CHF 270 270Swaps CHF-Dollar CHF 230 230Swaps Euro-Dollar € 510 10 500Swaps Sterling pound-Euro £ 1,770 1,770Forwards Dollar–Mexican Peso US$ 2,215 2,215Forwards Euro–Dollar € 2,165 1,425 500 240Total liabilities
8 Inventories, NetAn analysis of inventories at December 31, 2013 and 2014 is as follows:
2013 2014
Mobile phones, accessories, cards and other materials Ps. 39,238,656 Ps. 38,946,979Less: Reserve for obsolete and slow-moving inventories ( 2,519,703) ( 3,016,697)Total Ps. 36,718,953 Ps. 35,930,282
For the years ended December 31, 2012, 2013 and 2014, the cost of inventories recognized in cost of sales was Ps.110,465,701, Ps.121,994,900 and Ps.129,634,613, respectively.
9 Other assets, Neta) An analysis of other assets at December 31, 2013 and 2014 is as follows:
2013 2014
Current portion: Advances to suppliers Ps. 7,999,148 Ps. 8,808,396 Costs of mobile equipment and computers associated with deferred revenues 3,041,371 5,061,591 Prepaid insurance 605,318 1,423,889 Other 481,363 1,269,726 Ps. 12,127,200 Ps. 16,563,602
Non-current portion: Recoverable taxes Ps. 3,269,699 Ps. 7,162,377 Advance payments for the use of fiber optics 2,765,495 2,851,089 Prepaid expenses and judicial deposits (1) 11,305,088 17,842,567Total Ps. 17,340,282 Ps. 27,856,033
For the years ended December 31, 2012, 2013 and 2014, the amortization expense for other assets was Ps.244,538, Ps.127,058 and Ps.284,088, respectively.(1) Judicial deposits represent cash pledged in order to fulfill the collateral requirements for tax contingencies in Brazil. At December 31, 2013 and 2014, the
amount for these deposits is Ps.7,305,140 and Ps.13,874,471, respectively. Based on its evaluation of the underlying contingencies, the Company believes that such amounts are recoverable.

58
10 Property, Plant and Equipment, NetAn analysis of property, plant and equipment, net at December 31, 2012, 2013 and 2014 is as follows: Business Effect of Hyperinflation Depreciation of At December 31, At December 31, 2011 Additions Retirements combinations translation restatement the year 2012Cost:Telephonic plant in operation and equipment Ps. 412,001,302 Ps. 104,467,913 Ps. ( 25,693,072) Ps. 33,113,663 Ps. ( 56,393,038) Ps. – Ps. – Ps. 467,496,768Land and buildings 55,250,523 2,434,107 ( 1,219,353) 255,018 ( 4,181,864) 52,538,431Other assets 65,455,040 9,883,676 ( 5,413,649) 40,160 ( 1,977,322) 67,987,905Construction in process and advances plant suppliers (1) 50,848,277 19,730,746 ( 21,177,560) 132,902 ( 3,588,130) 45,946,235Inventories for operation of the plant 17,995,007 11,603,283 ( 12,647,522) ( 925,663) 16,025,105Total 601,550,149 148,119,725 ( 66,151,156) 33,541,743 ( 67,066,017) – – 649,994,444
Accumulated depreciationTelephonic plant in operation and equipment 107,951,128 ( 22,753,727) ( 43,392,735) 83,905,974 Ps. 125,710,640Land and buildings 1,838,362 ( 306,881) ( 1,641,993) 1,097,460 986,948Other assets 25,687,189 ( 6,297,626) ( 3,740,236) 7,282,983 22,932,310Inventories for operation of the plant ( 13,303) ( 24,451) ( 13,830) ( 18,142) ( 69,726)Total 135,463,376 – ( 29,382,685) – ( 48,788,794) – 92,268,275 149,560,172Net Cost Ps. 466,086,773 Ps. 148,119,725 Ps. ( 36,768,471) Ps. 33,541,743 Ps. ( 18,277,223) Ps. – Ps. ( 92,268,275) Ps. 500,434,272
Business Effect of Hyperinflation Depreciation of At December 31, At December 31, 2012 Additions Retirements combinations translation restatement the year 2013Cost:Telephonic plant inoperation and equipment Ps. 467,496,768 Ps. 116,170,134 Ps. ( 17,995,021) Ps. 310 Ps. ( 55,763,545) Ps. – Ps. – Ps. 509,908,646Land and buildings 52,538,431 2,567,068 ( 3,298,197) ( 3,579,859) 48,227,443Other assets 67,987,905 22,957,505 ( 8,367,342) 87,122 ( 4,654,256) 78,010,934Construction in process and advances plantm suppliers (1) 45,946,235 13,085,094 ( 15,326,412) 1,268 ( 3,874,210) 39,831,975Inventories for operation of the plant 16,025,105 12,458,316 ( 10,142,059) ( 975,281) 17,366,081Total 649,994,444 167,238,117 ( 55,129,031) 88,700 ( 68,847,151) – – 693,345,079
Accumulated depreciationTelephonic plant in operationb and equipment 125,710,640 ( 11,006,444) ( 33,975,506) 80,867,568 161,596,258Land and buildings 986,948 ( 31,133) ( 1,322,209) 1,973,707 1,607,313Other assets 22,932,310 ( 3,380,289) ( 2,485,845) 11,994,657 29,060,833Inventories for operation of the plant ( 69,726) ( 11,121) ( 3,298) 57,869 ( 26,276)Total 149,560,172 – ( 14,428,987) – ( 37,786,858) – 94,893,801 192,238,128Net Cost Ps. 500,434,272 Ps. 167,238,117 Ps. ( 40,700,044) Ps. 88,700 Ps. ( 31,060,293) Ps. – Ps. ( 94,893,801) Ps. 501,106,951
Business Effect of Hyperinflation Depreciation of At December 31, At December 31, 2013 Additions Retirements combinations translation restatement the year 2014Cost:Telephonic plant in operation and equipment Ps. 509,908,646 Ps. 108,661,794 Ps. ( 30,933,135) Ps. 54,202,020 Ps. 634,026 Ps. 143,886 Ps. – Ps. 642,617,237Land and buildings 48,227,443 3,650,705 ( 823,850) 5,271,503 124,621 13,114 56,463,536Other assets 78,010,934 39,953,790 ( 11,426,188) 5,417,138 2,586,726 21,200 114,563,600Construction in process and advances plant suppliers (1) 39,831,975 13,543,305 ( 16,386,806) 2,600,498 ( 491,799) 10,012 39,107,185Inventories for operation of the plant 17,366,081 15,580,184 ( 12,958,645) 962,017 ( 100,923) – 20,848,714Total 693,345,079 181,389,778 ( 72,528,624) 68,453,176 2,752,651 188,212 – 873,600,272
Accumulated depreciationTelephonic plant in operation and equipment 161,596,258 ( 16,618,742) ( 2,950,031) 98,918 92,400,728 234,527,131Land and buildings 1,607,313 ( 185,421) 125,881 1,364 2,179,268 3,728,405Other assets 29,060,833 ( 3,596,940) 981,659 18,933 13,334,198 39,798,683Inventories for operation of the plant ( 26,276) ( 29,199) 10,235 – ( 5,025) ( 50,265)Total 192,238,128 – ( 20,430,302) – ( 1,832,256) 119,215 107,909,169 278,003,954Net Cost Ps. 501,106,951 Ps. 181,389,778 Ps. ( 52,098,322) Ps. 68,453,176 Ps. 4,584,907 Ps. 68,997 Ps. ( 107,909,169) Ps. 595,596,318
(1) Construction in progress includes fixed and mobile telephone facilities as well as satellite developments and fiber optic which is in the process of being installed.
The completion period of construction in progress is variable and depends upon the type of fixed assets under construction. In the case of telephone plant (switching and transmission), it takes 6 months on average; for others, it may take more than 2 years.
b) At December 31, 2013 and 2014, property, plant and equipment include the following assets under capital leases: 2013 2014
Assets under capital leases Ps. 972,601 Ps. 1,281,452Accumulated depreciation ( 367,698) ( 888,537) Ps. 604,903 Ps. 392,915

59
10 Property, Plant and Equipment, NetAn analysis of property, plant and equipment, net at December 31, 2012, 2013 and 2014 is as follows: Business Effect of Hyperinflation Depreciation of At December 31, At December 31, 2011 Additions Retirements combinations translation restatement the year 2012Cost:Telephonic plant in operation and equipment Ps. 412,001,302 Ps. 104,467,913 Ps. ( 25,693,072) Ps. 33,113,663 Ps. ( 56,393,038) Ps. – Ps. – Ps. 467,496,768Land and buildings 55,250,523 2,434,107 ( 1,219,353) 255,018 ( 4,181,864) 52,538,431Other assets 65,455,040 9,883,676 ( 5,413,649) 40,160 ( 1,977,322) 67,987,905Construction in process and advances plant suppliers (1) 50,848,277 19,730,746 ( 21,177,560) 132,902 ( 3,588,130) 45,946,235Inventories for operation of the plant 17,995,007 11,603,283 ( 12,647,522) ( 925,663) 16,025,105Total 601,550,149 148,119,725 ( 66,151,156) 33,541,743 ( 67,066,017) – – 649,994,444
Accumulated depreciationTelephonic plant in operation and equipment 107,951,128 ( 22,753,727) ( 43,392,735) 83,905,974 Ps. 125,710,640Land and buildings 1,838,362 ( 306,881) ( 1,641,993) 1,097,460 986,948Other assets 25,687,189 ( 6,297,626) ( 3,740,236) 7,282,983 22,932,310Inventories for operation of the plant ( 13,303) ( 24,451) ( 13,830) ( 18,142) ( 69,726)Total 135,463,376 – ( 29,382,685) – ( 48,788,794) – 92,268,275 149,560,172Net Cost Ps. 466,086,773 Ps. 148,119,725 Ps. ( 36,768,471) Ps. 33,541,743 Ps. ( 18,277,223) Ps. – Ps. ( 92,268,275) Ps. 500,434,272
Business Effect of Hyperinflation Depreciation of At December 31, At December 31, 2012 Additions Retirements combinations translation restatement the year 2013Cost:Telephonic plant inoperation and equipment Ps. 467,496,768 Ps. 116,170,134 Ps. ( 17,995,021) Ps. 310 Ps. ( 55,763,545) Ps. – Ps. – Ps. 509,908,646Land and buildings 52,538,431 2,567,068 ( 3,298,197) ( 3,579,859) 48,227,443Other assets 67,987,905 22,957,505 ( 8,367,342) 87,122 ( 4,654,256) 78,010,934Construction in process and advances plantm suppliers (1) 45,946,235 13,085,094 ( 15,326,412) 1,268 ( 3,874,210) 39,831,975Inventories for operation of the plant 16,025,105 12,458,316 ( 10,142,059) ( 975,281) 17,366,081Total 649,994,444 167,238,117 ( 55,129,031) 88,700 ( 68,847,151) – – 693,345,079
Accumulated depreciationTelephonic plant in operationb and equipment 125,710,640 ( 11,006,444) ( 33,975,506) 80,867,568 161,596,258Land and buildings 986,948 ( 31,133) ( 1,322,209) 1,973,707 1,607,313Other assets 22,932,310 ( 3,380,289) ( 2,485,845) 11,994,657 29,060,833Inventories for operation of the plant ( 69,726) ( 11,121) ( 3,298) 57,869 ( 26,276)Total 149,560,172 – ( 14,428,987) – ( 37,786,858) – 94,893,801 192,238,128Net Cost Ps. 500,434,272 Ps. 167,238,117 Ps. ( 40,700,044) Ps. 88,700 Ps. ( 31,060,293) Ps. – Ps. ( 94,893,801) Ps. 501,106,951
Business Effect of Hyperinflation Depreciation of At December 31, At December 31, 2013 Additions Retirements combinations translation restatement the year 2014Cost:Telephonic plant in operation and equipment Ps. 509,908,646 Ps. 108,661,794 Ps. ( 30,933,135) Ps. 54,202,020 Ps. 634,026 Ps. 143,886 Ps. – Ps. 642,617,237Land and buildings 48,227,443 3,650,705 ( 823,850) 5,271,503 124,621 13,114 56,463,536Other assets 78,010,934 39,953,790 ( 11,426,188) 5,417,138 2,586,726 21,200 114,563,600Construction in process and advances plant suppliers (1) 39,831,975 13,543,305 ( 16,386,806) 2,600,498 ( 491,799) 10,012 39,107,185Inventories for operation of the plant 17,366,081 15,580,184 ( 12,958,645) 962,017 ( 100,923) – 20,848,714Total 693,345,079 181,389,778 ( 72,528,624) 68,453,176 2,752,651 188,212 – 873,600,272
Accumulated depreciationTelephonic plant in operation and equipment 161,596,258 ( 16,618,742) ( 2,950,031) 98,918 92,400,728 234,527,131Land and buildings 1,607,313 ( 185,421) 125,881 1,364 2,179,268 3,728,405Other assets 29,060,833 ( 3,596,940) 981,659 18,933 13,334,198 39,798,683Inventories for operation of the plant ( 26,276) ( 29,199) 10,235 – ( 5,025) ( 50,265)Total 192,238,128 – ( 20,430,302) – ( 1,832,256) 119,215 107,909,169 278,003,954Net Cost Ps. 501,106,951 Ps. 181,389,778 Ps. ( 52,098,322) Ps. 68,453,176 Ps. 4,584,907 Ps. 68,997 Ps. ( 107,909,169) Ps. 595,596,318

60
c) On September 30, 2014, the Company signed the final acceptance certificate for a submarine cable system. The cable extends from the U.S. to Central America and Brazil, which provides international connectivity to all the Company subsidiaries in these geographic areas. The total investment capitalized at December 31, 2014 is Ps.4,275,682 (US$ 290,507).d) At December 31, 2014, Claro Brasil has land and buildings and other equipment that is pledged in guarantee of legal proceedings in the amount of Ps. 4,012,658 (Ps.1,619,109 in 2013).e) Relevant information related to the computation of the capitalized borrowing costs is as follows: Years ended December 31, 2012 2013 2014
Amount invested in the acquisition of qualifying assets Ps. 52,849,800 Ps. 46,686,790 Ps. 47,332,317Capitalized interest 3,152,811 3,002,756 3,258,928Capitalization rate 6.0% 6.4% 6.9%
Capitalized interest is being amortized over a period of seven years, which is the estimated useful life of the related assets.f) In January 2012, Star One entered into an agreement denominated in U.S. dollars with a manufacturer for the construction and launching of the Star One C-4 satellite. The cost of the project is estimated to be approximately Ps.4,268,220 (US$290,000). At December 31, 2013 and 2014, the amount of construction in process associated with this project amounts to and Ps.2,567,775 and Ps.3,332,567, respectively.g) On July 9, 2013, Star One signed an agreement denominated in US dollars with a manufacturer for construction and launching of the Star One D1 satellite, which will be equipped with transponders in Bands C, Ku and Ka. The cost of this project is estimated to be approximately Ps. 5,946,072 (US$ 404,000) and the launch expected in the first quarter of 2016. The Star One D1 will replace the satellite BRASILSAT B4. At December 31, 2014, the amount recorded with in Construction in progress amounts to Ps.2,661,801.
11 Intangible assetsa) An analysis of intangible assets at December 31, 2012, 2013 and 2014 is as follows:
At December 31, 2012
Acquisitions in Effect of translation Balance at business Disposals and Amortization of foreign Balance at end beginning of year Acquisitions combinations other of the year subsidiaries, net of yearLicenses and rights of use Ps. 130,061,372 Ps. 7,830,248 Ps. 12,414,914 Ps. – Ps. – Ps. ( 16,545,574) Ps. 133,760,960Accumulated amortization ( 91,530,473) – – – ( 9,482,044) 11,303,987 ( 89,708,530)Net 38,530,899 7,830,248 12,414,914 – ( 9,482,044) ( 5,241,587) 44,052,430Trademarks 12,311,880 – – – – ( 713,321) 11,598,559Accumulated amortization ( 9,305,026) – – – ( 1,589,880) 439,662 ( 10,455,244)Net 3,006,854 – – – ( 1,589,880) ( 273,659) 1,143,315Total of Intangibles, net Ps 41,537,753 Ps. 7,830,248 Ps. 12,414,914 Ps. – Ps. ( 11,071,924) Ps. ( 5,515,246) Ps. 45,195,745
Goodwill Ps. 73,038,433 Ps. – Ps. 31,347,978 Ps. ( 278,756) Ps. – Ps. ( 4,401,796) Ps. 99,705,859
At December 31, 2013
Licenses and rights of use Ps. 133,760,960 Ps. 3,334,464 Ps. – Ps. ( 2,158,796) Ps. Ps. ( 11,853,114) Ps. 123,083,514Accumulated amortization ( 89,708,530) ( 6,271,998) 9,950,846 ( 86,029,682)Net 44,052,430 3,334,464 ( 2,158,796) ( 6,271,998) ( 1,902,268) 37,053,832Trademarks 11,598,559 387,926 ( 285,879) 11,700,606Accumulated amortization ( 10,455,244) ( 241,976) 162,920 ( 10,534,300)Net 1,143,315 387,926 ( 241,976) ( 122,959) 1,166,306Total of Intangibles, net Ps. 45,195,745 Ps. 3,334,464 Ps. – Ps. ( 1,770,870) Ps ( 6,513,974) Ps. ( 2,025,227) Ps. 38,220,138
Goodwill Ps. 99,705,859 Ps. – Ps. 1,200,061 Ps. ( 3,655,164) Ps. – Ps. ( 4,764,472) Ps. 92,486,284
At December 31, 2014
Licenses and rights of use Ps. 123,083,514 Ps. 24,946,015 Ps. 27,504,303 Ps. Ps. Ps. ( 738,738) Ps. 174,795,094Accumulated amortization ( 86,029,682) ( 6,013,565) 811,998 ( 91,231,249)Net 37,053,832 24,946,015 27,504,303 ( 6,013,565) 73,260 83,563,845Trademarks 11,700,606 1,584,189 8,930,690 59,506 22,274,991Accumulated amortization ( 10,534,300) ( 300,778) 5,676 ( 10,829,402)Net 1,166,306 1,584,189 8,930,690 ( 300,778) 65,182 11,445,589Customer relationships – 15,249,879 56,288 15,306,167Accumulated amortization – ( 485,951) ( 485,951)Net 15,249,879 ( 485,951) 56,288 14,820,216Total of Intangibles, net Ps 38,220,138 Ps. 26,530,204 Ps. 51,684,872 Ps – Ps. ( 6,800,294) Ps. 194,730 Ps. 109,829,650
Goodwill Ps. 92,486,284 Ps. – Ps. 51,316,970 Ps. ( 1,642,939) Ps. – Ps. ( 1,256,924) Ps. 140,903,391
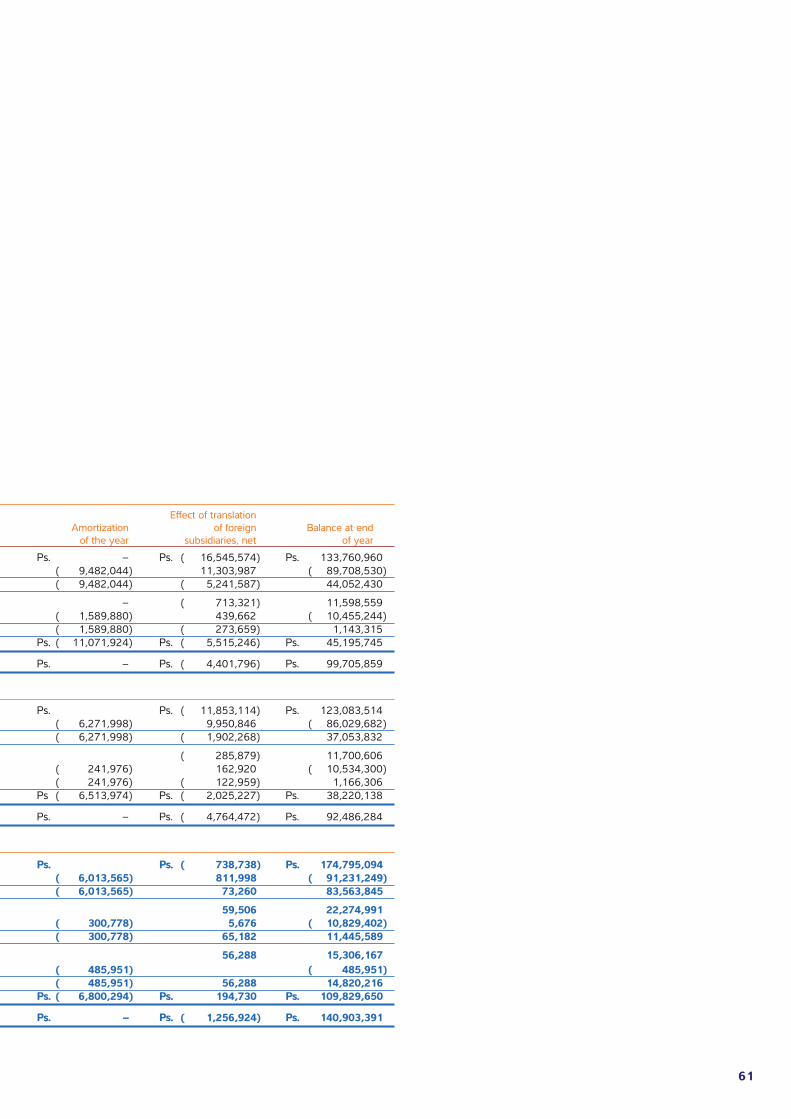
61
At December 31, 2012
Acquisitions in Effect of translation Balance at business Disposals and Amortization of foreign Balance at end beginning of year Acquisitions combinations other of the year subsidiaries, net of yearLicenses and rights of use Ps. 130,061,372 Ps. 7,830,248 Ps. 12,414,914 Ps. – Ps. – Ps. ( 16,545,574) Ps. 133,760,960Accumulated amortization ( 91,530,473) – – – ( 9,482,044) 11,303,987 ( 89,708,530)Net 38,530,899 7,830,248 12,414,914 – ( 9,482,044) ( 5,241,587) 44,052,430Trademarks 12,311,880 – – – – ( 713,321) 11,598,559Accumulated amortization ( 9,305,026) – – – ( 1,589,880) 439,662 ( 10,455,244)Net 3,006,854 – – – ( 1,589,880) ( 273,659) 1,143,315Total of Intangibles, net Ps 41,537,753 Ps. 7,830,248 Ps. 12,414,914 Ps. – Ps. ( 11,071,924) Ps. ( 5,515,246) Ps. 45,195,745
Goodwill Ps. 73,038,433 Ps. – Ps. 31,347,978 Ps. ( 278,756) Ps. – Ps. ( 4,401,796) Ps. 99,705,859
At December 31, 2013
Licenses and rights of use Ps. 133,760,960 Ps. 3,334,464 Ps. – Ps. ( 2,158,796) Ps. Ps. ( 11,853,114) Ps. 123,083,514Accumulated amortization ( 89,708,530) ( 6,271,998) 9,950,846 ( 86,029,682)Net 44,052,430 3,334,464 ( 2,158,796) ( 6,271,998) ( 1,902,268) 37,053,832Trademarks 11,598,559 387,926 ( 285,879) 11,700,606Accumulated amortization ( 10,455,244) ( 241,976) 162,920 ( 10,534,300)Net 1,143,315 387,926 ( 241,976) ( 122,959) 1,166,306Total of Intangibles, net Ps. 45,195,745 Ps. 3,334,464 Ps. – Ps. ( 1,770,870) Ps ( 6,513,974) Ps. ( 2,025,227) Ps. 38,220,138
Goodwill Ps. 99,705,859 Ps. – Ps. 1,200,061 Ps. ( 3,655,164) Ps. – Ps. ( 4,764,472) Ps. 92,486,284
At December 31, 2014
Licenses and rights of use Ps. 123,083,514 Ps. 24,946,015 Ps. 27,504,303 Ps. Ps. Ps. ( 738,738) Ps. 174,795,094Accumulated amortization ( 86,029,682) ( 6,013,565) 811,998 ( 91,231,249)Net 37,053,832 24,946,015 27,504,303 ( 6,013,565) 73,260 83,563,845Trademarks 11,700,606 1,584,189 8,930,690 59,506 22,274,991Accumulated amortization ( 10,534,300) ( 300,778) 5,676 ( 10,829,402)Net 1,166,306 1,584,189 8,930,690 ( 300,778) 65,182 11,445,589Customer relationships – 15,249,879 56,288 15,306,167Accumulated amortization – ( 485,951) ( 485,951)Net 15,249,879 ( 485,951) 56,288 14,820,216Total of Intangibles, net Ps 38,220,138 Ps. 26,530,204 Ps. 51,684,872 Ps – Ps. ( 6,800,294) Ps. 194,730 Ps. 109,829,650
Goodwill Ps. 92,486,284 Ps. – Ps. 51,316,970 Ps. ( 1,642,939) Ps. – Ps. ( 1,256,924) Ps. 140,903,391

62
b) The aggregate carrying amount of goodwill is allocated as follows:
2013 2014
Europe (7 countries) Ps. – Ps. 50,955,499Brazil (Fixed, wireless and TV) 22,483,917 22,338,319Puerto Rico 17,463,394 17,463,393Dominican Republic 14,186,724 14,186,724Mexico (includes Telmex) 10,729,462 9,734,666Ecuador 2,155,385 2,155,385Peru 2,209,484 2,230,651El Salvador 2,510,596 2,510,596Chile 2,353,463 2,308,587Colombia 14,402,035 13,063,780Other countries 3,991,824 3,955,791 Ps. 92,486,284 Ps. 140,903,391
c) The following is a description of the major changes in the ”Licenses and rights of use” caption during the years ended December 31, 2012, 2013 and 2014:
2012 Acquisitions
i) In January 2012, Telmex Colombia acquired a new TV license for a period of 8 years, expiring in 2020. The amount paid was Ps.253,927.
ii) As part of the business combination of Net Serviços de Comunicação, S.A (now Claro Brasil), the Company recognized a license for an amount of Ps.12,414,914. Given recent changes in the telecommunications law, licenses in Brazil can be renewed indefinitely at nominal cost. Thus, these licenses are considered as indefinite life intangible and are not amortized.
iii) In September 2012, Claro Brasil renewed certain contracts related with its licenses of radio frequency of 450 MHz, and such licenses cover the following states of Brazil Acre, Rondonia, Tacantins, Bahia, Paraná, Santa Catarina, Rio de Janeiro, Espíritu Santo, Sao Paulo, Amazonas, Maranha, Roraima, Amapá and Pará. Such licenses expire in October 2027.
Also Claro Brasil acquired licenses related to 4G (fourth generation) services, or broadband of 2,500 MHz to provide 4G services in Brazilian territory, except for the Brazilian state of Amazonas. Such licenses expire up to October 2027.
Additionally, the licenses of 850 MHz which were to expire during 2012 and 2013 were renewed. These renewals expire in October 2027. The amount paid for these renewals was Ps.5,710,116.
2013 Acquisitions
i) In October 2013, Claro Colombia acquired radio spectrum band 2500 Mhz to 2690 Mhz for a period of 10 years. The amount paid was Ps.815,488.
ii) Claro Brasil and its subsidiaries acquired various radio frequencies and TV licenses, for a period that ranges from 3 to 19 years. The amount paid was Ps.2,149,074.
2014 Acquisitions
i) In March 2014, Claro Colombia renewed a license for the use of the radio spectrum granted to Comunicación Celular, S.A. (Claro) in the 824.040 Mhz to 891.480 Mhz and 1.877 Mhz to 1,965 Mhz bands for a period that ends in March 2024. The amount paid was Ps.1,018,190.
ii) On September 30, 2014, Claro Brasil obtained a license to provide the cellular service in the 700 national MHz frequency band. On December 8, 2014, Anatel assigned formally to Claro Brasil the frequency band. The total consideration for the acquisition of this band was Ps.15,588,866. Claro Brasil paid Ps.9,662,144 in 2014 and the remaining amount will be paid in four equal annual installments. The frequency band expires in 2029.
iii) As a part of the business combination of Telekom Austria, the Company recognized licenses for amount of for an amount of Ps.27,504,303. Telekom Austria holds mobile telecommunication licenses provided by regulatory authorities in Austria, Croatia, Slovenia, Serbia, Bulgaria, Belarus and Macedonia. These licenses are estimated to have a remaining useful life of 10 years.
iv) In 2014, Argentina paid Ps.4,151,753 (AR$ 2,385,379) for the acquisition of 4G licenses to increase the service in all the country.
v) Additionally the Company acquired other licenses in the Dominican Republic, Brazil and others in the amount of Ps.4,187,206.
d) Amortization of licenses, rights of use and trademarks for the years ended December 31, 2012, 2013 and 2014 amounted to Ps.11,071,924, Ps.6,513,974 and Ps.6,800,294, respectively.
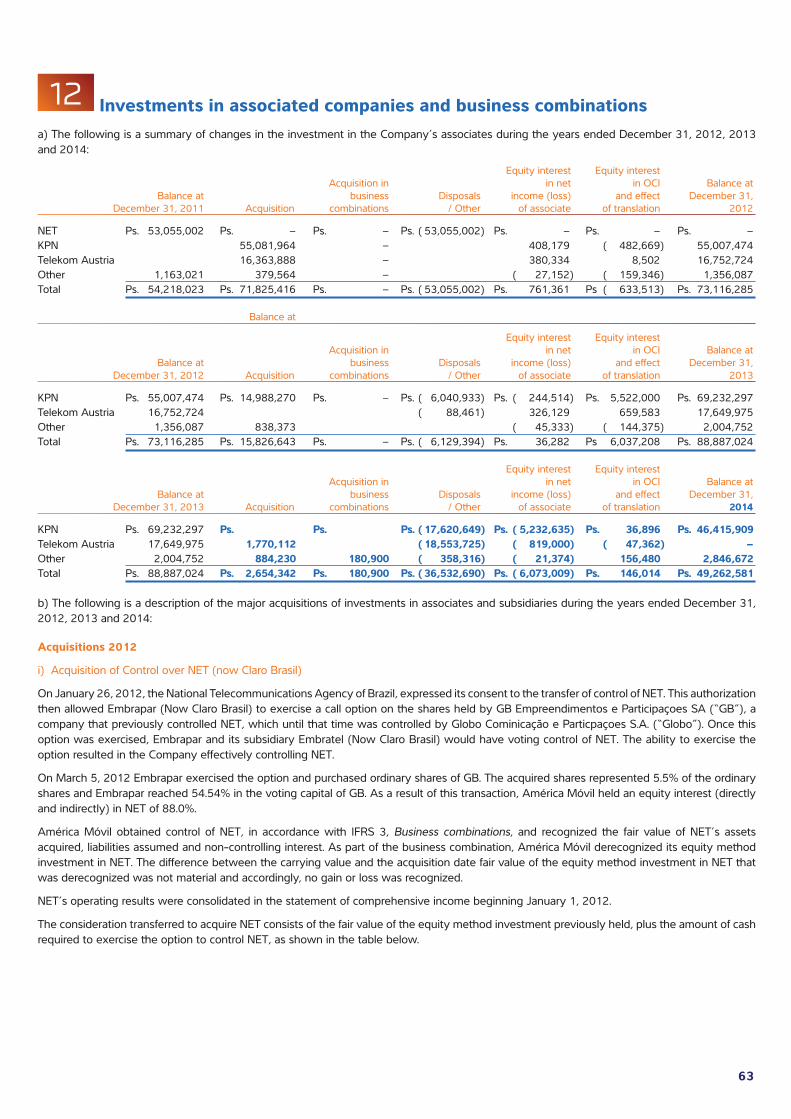
63
12 Investments in associated companies and business combinationsa) The following is a summary of changes in the investment in the Company’s associates during the years ended December 31, 2012, 2013 and 2014:
Equity interest Equity interest Acquisition in in net in OCI Balance at Balance at business Disposals income (loss) and effect December 31, December 31, 2011 Acquisition combinations / Other of associate of translation 2012
NET Ps. 53,055,002 Ps. – Ps. – Ps. ( 53,055,002) Ps. – Ps. – Ps. –KPN 55,081,964 – 408,179 ( 482,669) 55,007,474Telekom Austria 16,363,888 – 380,334 8,502 16,752,724Other 1,163,021 379,564 – ( 27,152) ( 159,346) 1,356,087Total Ps. 54,218,023 Ps. 71,825,416 Ps. – Ps. ( 53,055,002) Ps. 761,361 Ps ( 633,513) Ps. 73,116,285
Balance at
Equity interest Equity interest Acquisition in in net in OCI Balance at Balance at business Disposals income (loss) and effect December 31, December 31, 2012 Acquisition combinations / Other of associate of translation 2013
KPN Ps. 55,007,474 Ps. 14,988,270 Ps. – Ps. ( 6,040,933) Ps. ( 244,514) Ps. 5,522,000 Ps. 69,232,297Telekom Austria 16,752,724 ( 88,461) 326,129 659,583 17,649,975Other 1,356,087 838,373 ( 45,333) ( 144,375) 2,004,752Total Ps. 73,116,285 Ps. 15,826,643 Ps. – Ps. ( 6,129,394) Ps. 36,282 Ps 6,037,208 Ps. 88,887,024
Equity interest Equity interest Acquisition in in net in OCI Balance at Balance at business Disposals income (loss) and effect December 31, December 31, 2013 Acquisition combinations / Other of associate of translation 2014
KPN Ps. 69,232,297 Ps. Ps. Ps. ( 17,620,649) Ps. ( 5,232,635) Ps. 36,896 Ps. 46,415,909Telekom Austria 17,649,975 1,770,112 ( 18,553,725) ( 819,000) ( 47,362) –Other 2,004,752 884,230 180,900 ( 358,316) ( 21,374) 156,480 2,846,672Total Ps. 88,887,024 Ps. 2,654,342 Ps. 180,900 Ps. ( 36,532,690) Ps. ( 6,073,009) Ps. 146,014 Ps. 49,262,581
b) The following is a description of the major acquisitions of investments in associates and subsidiaries during the years ended December 31, 2012, 2013 and 2014:
Acquisitions 2012
i) Acquisition of Control over NET (now Claro Brasil)
On January 26, 2012, the National Telecommunications Agency of Brazil, expressed its consent to the transfer of control of NET. This authorization then allowed Embrapar (Now Claro Brasil) to exercise a call option on the shares held by GB Empreendimentos e Participaçoes SA (“GB”), a company that previously controlled NET, which until that time was controlled by Globo Cominicação e Particpaçoes S.A. (“Globo”). Once this option was exercised, Embrapar and its subsidiary Embratel (Now Claro Brasil) would have voting control of NET. The ability to exercise the option resulted in the Company effectively controlling NET.
On March 5, 2012 Embrapar exercised the option and purchased ordinary shares of GB. The acquired shares represented 5.5% of the ordinary shares and Embrapar reached 54.54% in the voting capital of GB. As a result of this transaction, América Móvil held an equity interest (directly and indirectly) in NET of 88.0%.
América Móvil obtained control of NET, in accordance with IFRS 3, Business combinations, and recognized the fair value of NET’s assets acquired, liabilities assumed and non-controlling interest. As part of the business combination, América Móvil derecognized its equity method investment in NET. The difference between the carrying value and the acquisition date fair value of the equity method investment in NET that was derecognized was not material and accordingly, no gain or loss was recognized.
NET’s operating results were consolidated in the statement of comprehensive income beginning January 1, 2012.
The consideration transferred to acquire NET consists of the fair value of the equity method investment previously held, plus the amount of cash required to exercise the option to control NET, as shown in the table below.
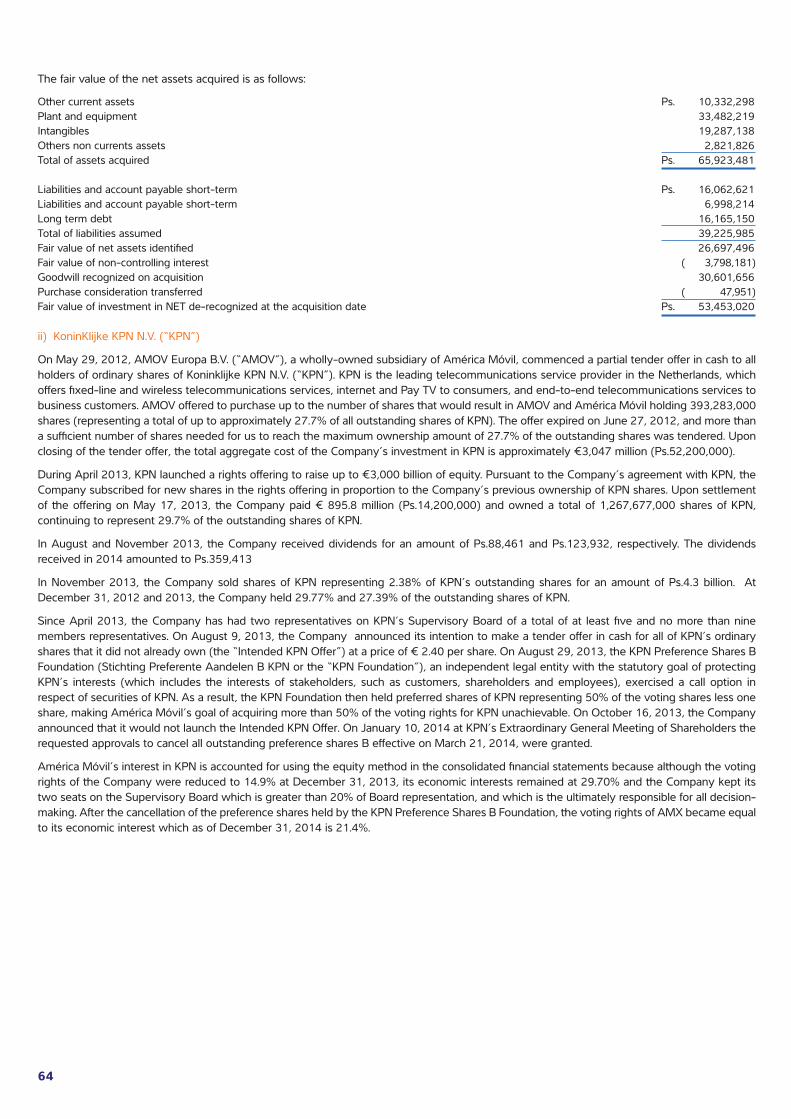
64
The fair value of the net assets acquired is as follows:
Other current assets Ps. 10,332,298Plant and equipment 33,482,219Intangibles 19,287,138Others non currents assets 2,821,826Total of assets acquired Ps. 65,923,481
Liabilities and account payable short-term Ps. 16,062,621Liabilities and account payable short-term 6,998,214Long term debt 16,165,150Total of liabilities assumed 39,225,985Fair value of net assets identified 26,697,496Fair value of non-controlling interest ( 3,798,181)Goodwill recognized on acquisition 30,601,656Purchase consideration transferred ( 47,951)Fair value of investment in NET de-recognized at the acquisition date Ps. 53,453,020
ii) KoninKlijke KPN N.V. (“KPN”)
On May 29, 2012, AMOV Europa B.V. (“AMOV”), a wholly-owned subsidiary of América Móvil, commenced a partial tender offer in cash to all holders of ordinary shares of Koninklijke KPN N.V. (“KPN”). KPN is the leading telecommunications service provider in the Netherlands, which offers fixed-line and wireless telecommunications services, internet and Pay TV to consumers, and end-to-end telecommunications services to business customers. AMOV offered to purchase up to the number of shares that would result in AMOV and América Móvil holding 393,283,000 shares (representing a total of up to approximately 27.7% of all outstanding shares of KPN). The offer expired on June 27, 2012, and more than a sufficient number of shares needed for us to reach the maximum ownership amount of 27.7% of the outstanding shares was tendered. Upon closing of the tender offer, the total aggregate cost of the Company’s investment in KPN is approximately €3,047 million (Ps.52,200,000).
During April 2013, KPN launched a rights offering to raise up to €3,000 billion of equity. Pursuant to the Company’s agreement with KPN, the Company subscribed for new shares in the rights offering in proportion to the Company’s previous ownership of KPN shares. Upon settlement of the offering on May 17, 2013, the Company paid € 895.8 million (Ps.14,200,000) and owned a total of 1,267,677,000 shares of KPN, continuing to represent 29.7% of the outstanding shares of KPN.
In August and November 2013, the Company received dividends for an amount of Ps.88,461 and Ps.123,932, respectively. The dividends received in 2014 amounted to Ps.359,413
In November 2013, the Company sold shares of KPN representing 2.38% of KPN’s outstanding shares for an amount of Ps.4.3 billion. At December 31, 2012 and 2013, the Company held 29.77% and 27.39% of the outstanding shares of KPN.
Since April 2013, the Company has had two representatives on KPN’s Supervisory Board of a total of at least five and no more than nine members representatives. On August 9, 2013, the Company announced its intention to make a tender offer in cash for all of KPN’s ordinary shares that it did not already own (the “Intended KPN Offer”) at a price of € 2.40 per share. On August 29, 2013, the KPN Preference Shares B Foundation (Stichting Preferente Aandelen B KPN or the “KPN Foundation”), an independent legal entity with the statutory goal of protecting KPN’s interests (which includes the interests of stakeholders, such as customers, shareholders and employees), exercised a call option in respect of securities of KPN. As a result, the KPN Foundation then held preferred shares of KPN representing 50% of the voting shares less one share, making América Móvil’s goal of acquiring more than 50% of the voting rights for KPN unachievable. On October 16, 2013, the Company announced that it would not launch the Intended KPN Offer. On January 10, 2014 at KPN’s Extraordinary General Meeting of Shareholders the requested approvals to cancel all outstanding preference shares B effective on March 21, 2014, were granted.
América Móvil’s interest in KPN is accounted for using the equity method in the consolidated financial statements because although the voting rights of the Company were reduced to 14.9% at December 31, 2013, its economic interests remained at 29.70% and the Company kept its two seats on the Supervisory Board which is greater than 20% of Board representation, and which is the ultimately responsible for all decision-making. After the cancellation of the preference shares held by the KPN Preference Shares B Foundation, the voting rights of AMX became equal to its economic interest which as of December 31, 2014 is 21.4%.
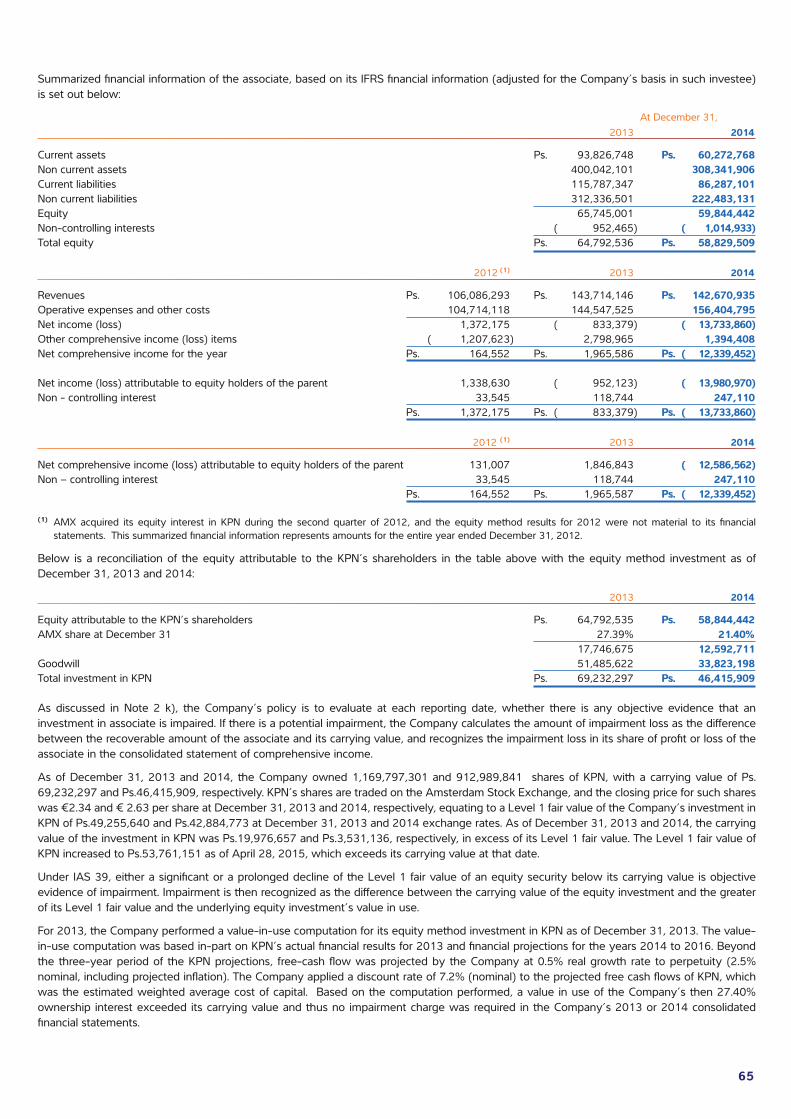
65
Summarized financial information of the associate, based on its IFRS financial information (adjusted for the Company’s basis in such investee) is set out below:
At December 31, 2013 2014
Current assets Ps. 93,826,748 Ps. 60,272,768Non current assets 400,042,101 308,341,906Current liabilities 115,787,347 86,287,101Non current liabilities 312,336,501 222,483,131Equity 65,745,001 59,844,442Non-controlling interests ( 952,465) ( 1,014,933)Total equity Ps. 64,792,536 Ps. 58,829,509
2012 (1) 2013 2014
Revenues Ps. 106,086,293 Ps. 143,714,146 Ps. 142,670,935Operative expenses and other costs 104,714,118 144,547,525 156,404,795Net income (loss) 1,372,175 ( 833,379) ( 13,733,860)Other comprehensive income (loss) items ( 1,207,623) 2,798,965 1,394,408Net comprehensive income for the year Ps. 164,552 Ps. 1,965,586 Ps. ( 12,339,452)
Net income (loss) attributable to equity holders of the parent 1,338,630 ( 952,123) ( 13,980,970)Non - controlling interest 33,545 118,744 247,110 Ps. 1,372,175 Ps. ( 833,379) Ps. ( 13,733,860)
2012 (1) 2013 2014
Net comprehensive income (loss) attributable to equity holders of the parent 131,007 1,846,843 ( 12,586,562)Non – controlling interest 33,545 118,744 247,110 Ps. 164,552 Ps. 1,965,587 Ps. ( 12,339,452)
(1) AMX acquired its equity interest in KPN during the second quarter of 2012, and the equity method results for 2012 were not material to its financial statements. This summarized financial information represents amounts for the entire year ended December 31, 2012.
Below is a reconciliation of the equity attributable to the KPN’s shareholders in the table above with the equity method investment as of December 31, 2013 and 2014:
2013 2014
Equity attributable to the KPN’s shareholders Ps. 64,792,535 Ps. 58,844,442AMX share at December 31 27.39% 21.40% 17,746,675 12,592,711Goodwill 51,485,622 33,823,198Total investment in KPN Ps. 69,232,297 Ps. 46,415,909
As discussed in Note 2 k), the Company’s policy is to evaluate at each reporting date, whether there is any objective evidence that an investment in associate is impaired. If there is a potential impairment, the Company calculates the amount of impairment loss as the difference between the recoverable amount of the associate and its carrying value, and recognizes the impairment loss in its share of profit or loss of the associate in the consolidated statement of comprehensive income.
As of December 31, 2013 and 2014, the Company owned 1,169,797,301 and 912,989,841 shares of KPN, with a carrying value of Ps. 69,232,297 and Ps.46,415,909, respectively. KPN’s shares are traded on the Amsterdam Stock Exchange, and the closing price for such shares was €2.34 and € 2.63 per share at December 31, 2013 and 2014, respectively, equating to a Level 1 fair value of the Company’s investment in KPN of Ps.49,255,640 and Ps.42,884,773 at December 31, 2013 and 2014 exchange rates. As of December 31, 2013 and 2014, the carrying value of the investment in KPN was Ps.19,976,657 and Ps.3,531,136, respectively, in excess of its Level 1 fair value. The Level 1 fair value of KPN increased to Ps.53,761,151 as of April 28, 2015, which exceeds its carrying value at that date.
Under IAS 39, either a significant or a prolonged decline of the Level 1 fair value of an equity security below its carrying value is objective evidence of impairment. Impairment is then recognized as the difference between the carrying value of the equity investment and the greater of its Level 1 fair value and the underlying equity investment’s value in use.
For 2013, the Company performed a value-in-use computation for its equity method investment in KPN as of December 31, 2013. The value-in-use computation was based in-part on KPN’s actual financial results for 2013 and financial projections for the years 2014 to 2016. Beyond the three-year period of the KPN projections, free-cash flow was projected by the Company at 0.5% real growth rate to perpetuity (2.5% nominal, including projected inflation). The Company applied a discount rate of 7.2% (nominal) to the projected free cash flows of KPN, which was the estimated weighted average cost of capital. Based on the computation performed, a value in use of the Company’s then 27.40% ownership interest exceeded its carrying value and thus no impairment charge was required in the Company’s 2013 or 2014 consolidated financial statements.
66
iii) Telekom Austria
On June 15, 2012, the Company agreed to acquire approximately 21% of the outstanding shares of Telekom Austria from Marathon Zwei Beteiligungs GmbH, a wholly-owned subsidiary of RPR Privatstiftung, a private trust established by Mr. Ronny Pecik. Under the agreement, the Company acquired 5% of the outstanding shares of Telekom Austria, and the right to acquire additional shares. On September 25, 2012, the Company exercised this right and acquired approximately 16% of the outstanding shares of Telekom Austria, after receiving the required regulatory approvals. As of September 30, 2012, the Company held 22.76% of the outstanding shares of Telekom Austria. The total aggregate costs of the Company’s investment in Telekom Austria is approximately €954 million (Ps.15,977,000). Telekom Austria provides telecommunications services in Austria, Belarus, Bulgaria, Croatia, Macedonia, Serbia and Slovenia.
The Company owned 104,875,874 shares of Telekom Austria, with a carrying value of Ps.17,649,976 as of December 31, 2013. Telekom Austria shares are traded on the Vienna Stock Exchange; however, the Company purchased its investment in Telekom Austria’s through a private transaction enabling the Company to obtain the size of the holdings it desired. The Level 1 fair value of the Company’s investment in Telekom Austria was Ps.10.4 billion as of December 31, 2013, which was Ps.7.3 billion less than its carrying value.
The Company performed a value-in-use computation for its equity method investment in Telekom Austria as of December 31, 2013. The value-in-use computation was based in-part on Telekom Austria’s actual financial results for 2013 and financial projections for the years 2014 to 2016. Beyond the three-year period of the Telekom Austria projections, free-cash flow was projected by the Company at 1.0% real growth rate to perpetuity. The Company applied a discount rate of 6.9% (nominal) to the projected free cash flows of Telekom Austria, which is the estimated weighted average cost of capital. Based on the computation performed, a value in use of the Company’s 22.33% ownership interest of Ps.20.0 billion was estimated as of December 31, 2013, respectively, thus no impairment charge was required in the Company’s 2013 consolidated financial statements.
During the period January to June 30, 2014, the Company acquired additional shares of TKA for an amount of $4,750,919 to raise its ownership to 27.2%. As explained below, during 2014 the Company obtained control and began consolidating Telekom Austria and accordingly de-recognized its equity method investment as of that date.
Other acquisitions 2012
iv) DLA, Inc. (“DLA”)
On January 6, 2012, América Móvil entered into an agreement with Claxson Interactive Group, Inc., and acquired as of such date 100% of the shares representing the capital stock of DLA, Inc. (“DLA”). The amount paid was Ps.615,927 (US$50,000). DLA is a corporation involved in the development, integration and delivery of entertainment products made for digital distribution in Latin America.
v) Simple Mobile, Inc.
On June 19, 2012, Tracfone Wireless Inc (subsidiary) acquired 100% of the operations of Simple Mobile Inc. for approximately US$118,000 (Ps.1,651,700). Simple Mobile, Inc. is a mobile virtual network operator (“MVNOs”) in the United States, with more than 2.5 million customer activations.
vi) In September 2012, the Company acquired an equity interest in other Mexican entities for an amount of Ps.379,564 .
Acquisitions - 2013
i) Corporación Interamericana de Entretenimiento, S.A.B. de C.V. (“CIE”)
On April 30, 2013 América Móvil, entered into an agreement with Corporación Interamericana de Entretenimiento, S.A.B. de C.V. (“CIE”), to acquire 100% shares of Corporación de Medios Integrales, S.A. de C.V. (“CMI”) for an amount of Ps.1,668,000 (US$131,300). CMI holds the media and advertising business within the commercial segment at CIE. The goodwill is Ps.1,200,061.
ii) Shazam Entertainment Limited (“Shazam”)
On July 8, 2013, América Móvil acquired 10.8% of shares representing the capital stock of Shazam Entertainment Limited (“Shazam”), and entered into a strategic agreement for a business development in the Americas. The amount paid was Ps.527,536.
Acquisitions - 2014
i) Telekom Austria
On July 10, 2014, the Company through share acquisition and a Shareholders´ Agreement obtained control of the telecommunications company Telekom Austria, acquiring an additional 22.79% of the outstanding shares to reach share ownership of 50.81%. The main goal for the Company was the further development of Telekom Austria. This acquisition was valuated at its fair value at the purchase date. The total purchase price was Ps. 28,637,635. Acquisition costs were expensed by the Company as incurred and recorded as a part of “Other expenses” in the consolidated statement of comprehensive income for an immaterial amount. Telekom Austria was included in operating results from July 1, 2014.
As a result the Company derecognized the investment in the associate Telekom Austria upon consolidation. As part of the recognition of its previous equity investment in Telekom Austria, the Company recognized a loss of Ps.3,172,218 recognized in the “Valuation of derivatives, interest cost from” caption on the consolidated statement of comprehensive income.
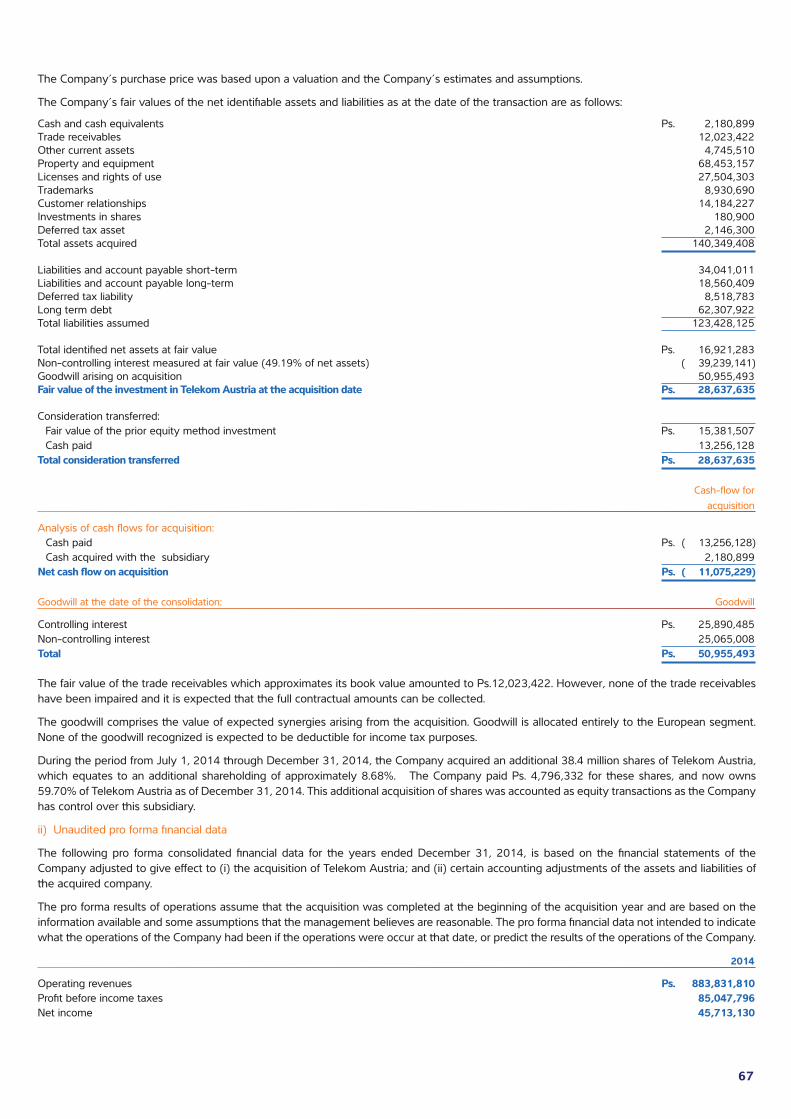
67
The Company’s purchase price was based upon a valuation and the Company’s estimates and assumptions.
The Company’s fair values of the net identifiable assets and liabilities as at the date of the transaction are as follows:
Cash and cash equivalents Ps. 2,180,899Trade receivables 12,023,422Other current assets 4,745,510Property and equipment 68,453,157Licenses and rights of use 27,504,303Trademarks 8,930,690Customer relationships 14,184,227Investments in shares 180,900Deferred tax asset 2,146,300Total assets acquired 140,349,408
Liabilities and account payable short-term 34,041,011Liabilities and account payable long-term 18,560,409Deferred tax liability 8,518,783Long term debt 62,307,922Total liabilities assumed 123,428,125
Total identified net assets at fair value Ps. 16,921,283Non-controlling interest measured at fair value (49.19% of net assets) ( 39,239,141)Goodwill arising on acquisition 50,955,493Fair value of the investment in Telekom Austria at the acquisition date Ps. 28,637,635
Consideration transferred: Fair value of the prior equity method investment Ps. 15,381,507 Cash paid 13,256,128Total consideration transferred Ps. 28,637,635
Cash-flow for acquisition
Analysis of cash flows for acquisition: Cash paid Ps. ( 13,256,128) Cash acquired with the subsidiary 2,180,899Net cash flow on acquisition Ps. ( 11,075,229)
Goodwill at the date of the consolidation: Goodwill
Controlling interest Ps. 25,890,485Non-controlling interest 25,065,008Total Ps. 50,955,493
The fair value of the trade receivables which approximates its book value amounted to Ps.12,023,422. However, none of the trade receivables have been impaired and it is expected that the full contractual amounts can be collected.
The goodwill comprises the value of expected synergies arising from the acquisition. Goodwill is allocated entirely to the European segment. None of the goodwill recognized is expected to be deductible for income tax purposes.
During the period from July 1, 2014 through December 31, 2014, the Company acquired an additional 38.4 million shares of Telekom Austria, which equates to an additional shareholding of approximately 8.68%. The Company paid Ps. 4,796,332 for these shares, and now owns 59.70% of Telekom Austria as of December 31, 2014. This additional acquisition of shares was accounted as equity transactions as the Company has control over this subsidiary.
ii) Unaudited pro forma financial data
The following pro forma consolidated financial data for the years ended December 31, 2014, is based on the financial statements of the Company adjusted to give effect to (i) the acquisition of Telekom Austria; and (ii) certain accounting adjustments of the assets and liabilities of the acquired company.
The pro forma results of operations assume that the acquisition was completed at the beginning of the acquisition year and are based on the information available and some assumptions that the management believes are reasonable. The pro forma financial data not intended to indicate what the operations of the Company had been if the operations were occur at that date, or predict the results of the operations of the Company.
2014
Operating revenues Ps. 883,831,810Profit before income taxes 85,047,796Net income 45,713,130
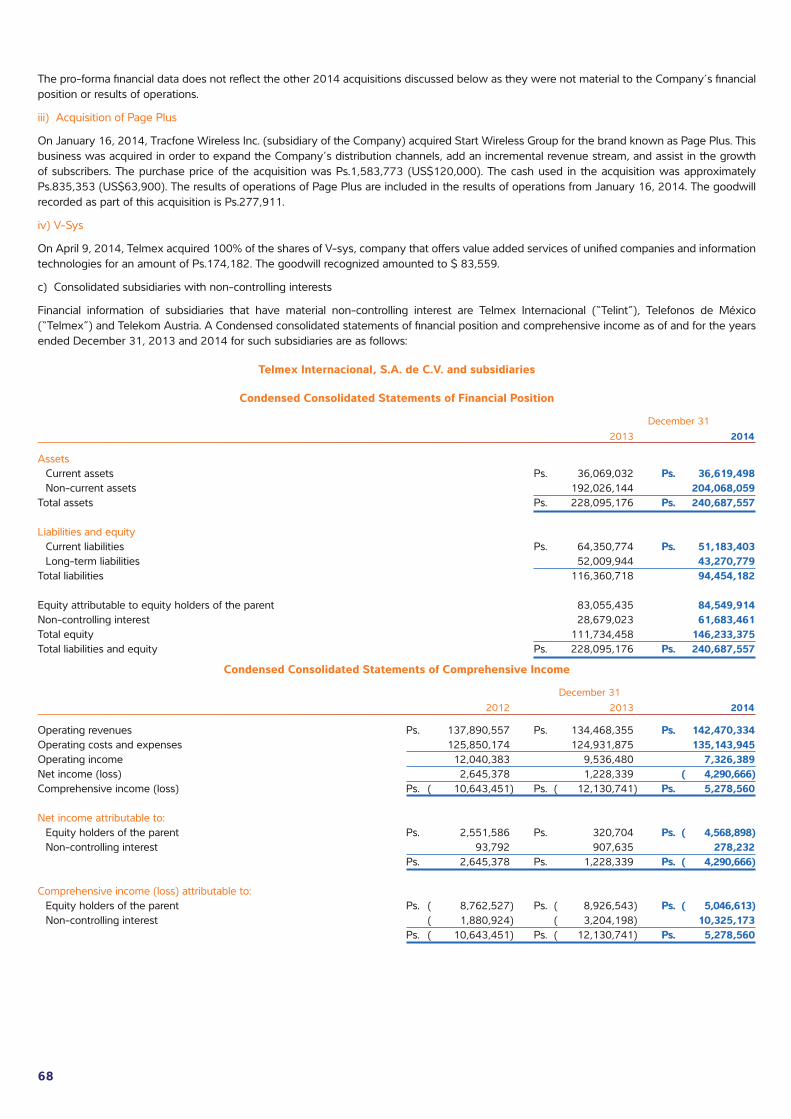
68
The pro-forma financial data does not reflect the other 2014 acquisitions discussed below as they were not material to the Company’s financial position or results of operations.
iii) Acquisition of Page Plus
On January 16, 2014, Tracfone Wireless Inc. (subsidiary of the Company) acquired Start Wireless Group for the brand known as Page Plus. This business was acquired in order to expand the Company’s distribution channels, add an incremental revenue stream, and assist in the growth of subscribers. The purchase price of the acquisition was Ps.1,583,773 (US$120,000). The cash used in the acquisition was approximately Ps.835,353 (US$63,900). The results of operations of Page Plus are included in the results of operations from January 16, 2014. The goodwill recorded as part of this acquisition is Ps.277,911.
iv) V-Sys
On April 9, 2014, Telmex acquired 100% of the shares of V-sys, company that offers value added services of unified companies and information technologies for an amount of Ps.174,182. The goodwill recognized amounted to $ 83,559.
c) Consolidated subsidiaries with non-controlling interests
Financial information of subsidiaries that have material non-controlling interest are Telmex Internacional (“Telint”), Telefonos de México (“Telmex”) and Telekom Austria. A Condensed consolidated statements of financial position and comprehensive income as of and for the years ended December 31, 2013 and 2014 for such subsidiaries are as follows:
Telmex Internacional, S.A. de C.V. and subsidiaries
Condensed Consolidated Statements of Financial Position
December 31 2013 2014
Assets Current assets Ps. 36,069,032 Ps. 36,619,498 Non-current assets 192,026,144 204,068,059Total assets Ps. 228,095,176 Ps. 240,687,557
Liabilities and equity Current liabilities Ps. 64,350,774 Ps. 51,183,403 Long-term liabilities 52,009,944 43,270,779Total liabilities 116,360,718 94,454,182
Equity attributable to equity holders of the parent 83,055,435 84,549,914Non-controlling interest 28,679,023 61,683,461Total equity 111,734,458 146,233,375Total liabilities and equity Ps. 228,095,176 Ps. 240,687,557
Condensed Consolidated Statements of Comprehensive Income
December 31 2012 2013 2014
Operating revenues Ps. 137,890,557 Ps. 134,468,355 Ps. 142,470,334Operating costs and expenses 125,850,174 124,931,875 135,143,945Operating income 12,040,383 9,536,480 7,326,389Net income (loss) 2,645,378 1,228,339 ( 4,290,666)Comprehensive income (loss) Ps. ( 10,643,451) Ps. ( 12,130,741) Ps. 5,278,560
Net income attributable to: Equity holders of the parent Ps. 2,551,586 Ps. 320,704 Ps. ( 4,568,898) Non-controlling interest 93,792 907,635 278,232 Ps. 2,645,378 Ps. 1,228,339 Ps. ( 4,290,666)
Comprehensive income (loss) attributable to: Equity holders of the parent Ps. ( 8,762,527) Ps. ( 8,926,543) Ps. ( 5,046,613) Non-controlling interest ( 1,880,924) ( 3,204,198) 10,325,173 Ps. ( 10,643,451) Ps. ( 12,130,741) Ps. 5,278,560
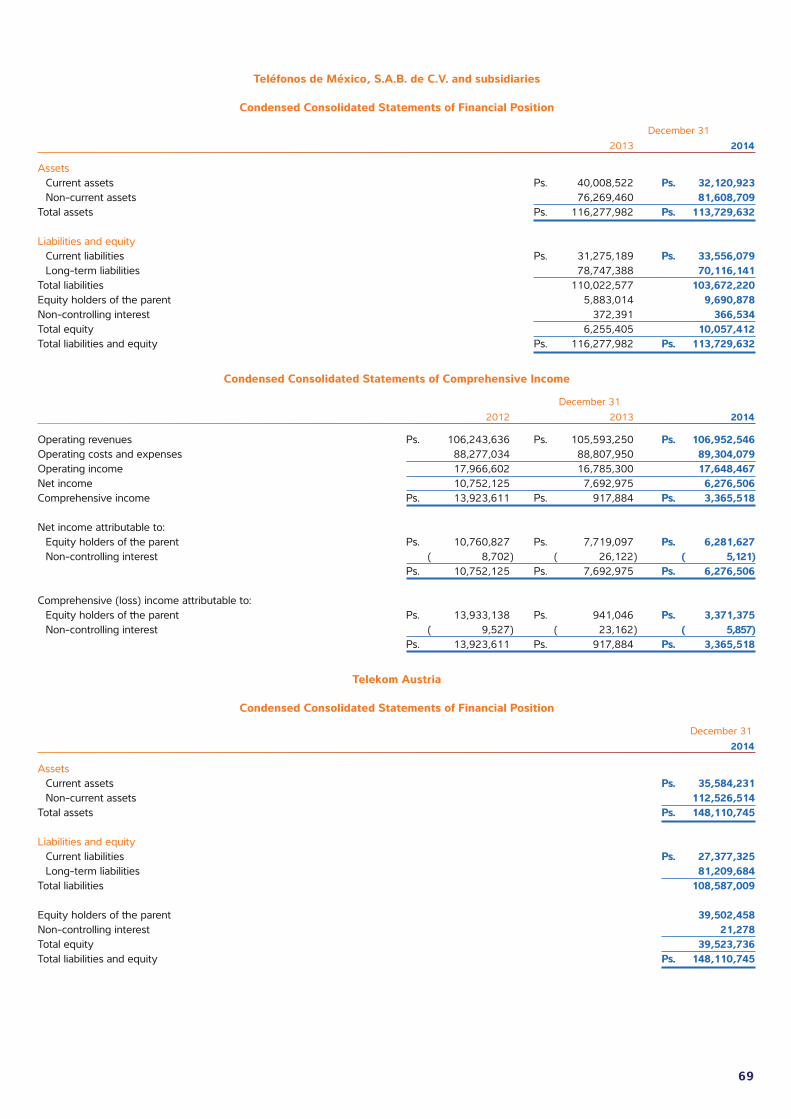
69
Teléfonos de México, S.A.B. de C.V. and subsidiaries
Condensed Consolidated Statements of Financial Position
December 31 2013 2014
Assets Current assets Ps. 40,008,522 Ps. 32,120,923 Non-current assets 76,269,460 81,608,709Total assets Ps. 116,277,982 Ps. 113,729,632
Liabilities and equity Current liabilities Ps. 31,275,189 Ps. 33,556,079 Long-term liabilities 78,747,388 70,116,141Total liabilities 110,022,577 103,672,220Equity holders of the parent 5,883,014 9,690,878Non-controlling interest 372,391 366,534Total equity 6,255,405 10,057,412Total liabilities and equity Ps. 116,277,982 Ps. 113,729,632
Condensed Consolidated Statements of Comprehensive Income
December 31 2012 2013 2014
Operating revenues Ps. 106,243,636 Ps. 105,593,250 Ps. 106,952,546Operating costs and expenses 88,277,034 88,807,950 89,304,079Operating income 17,966,602 16,785,300 17,648,467Net income 10,752,125 7,692,975 6,276,506Comprehensive income Ps. 13,923,611 Ps. 917,884 Ps. 3,365,518
Net income attributable to: Equity holders of the parent Ps. 10,760,827 Ps. 7,719,097 Ps. 6,281,627 Non-controlling interest ( 8,702) ( 26,122) ( 5,121) Ps. 10,752,125 Ps. 7,692,975 Ps. 6,276,506
Comprehensive (loss) income attributable to: Equity holders of the parent Ps. 13,933,138 Ps. 941,046 Ps. 3,371,375 Non-controlling interest ( 9,527) ( 23,162) ( 5,857) Ps. 13,923,611 Ps. 917,884 Ps. 3,365,518
Telekom Austria
Condensed Consolidated Statements of Financial Position
December 31 2014
Assets Current assets Ps. 35,584,231 Non-current assets 112,526,514Total assets Ps. 148,110,745
Liabilities and equity Current liabilities Ps. 27,377,325 Long-term liabilities 81,209,684Total liabilities 108,587,009
Equity holders of the parent 39,502,458Non-controlling interest 21,278Total equity 39,523,736Total liabilities and equity Ps. 148,110,745
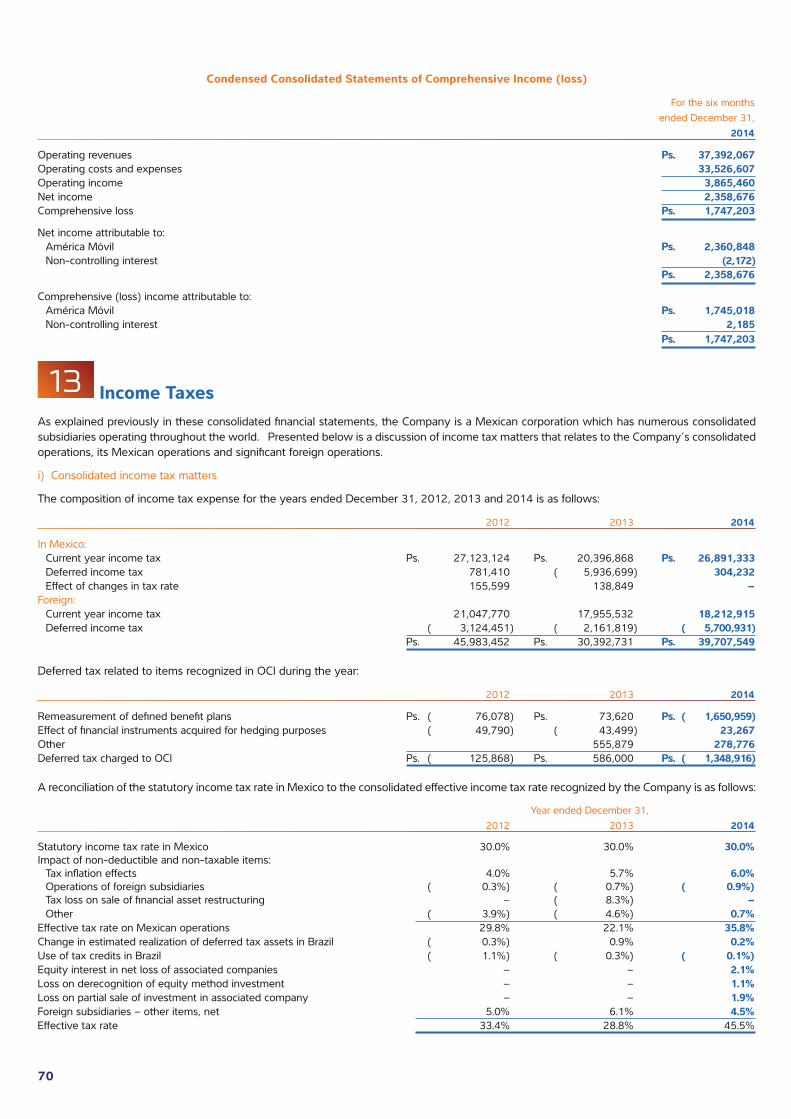
70
Condensed Consolidated Statements of Comprehensive Income (loss)
For the six months ended December 31, 2014
Operating revenues Ps. 37,392,067Operating costs and expenses 33,526,607Operating income 3,865,460Net income 2,358,676Comprehensive loss Ps. 1,747,203
Net income attributable to: América Móvil Ps. 2,360,848 Non-controlling interest (2,172) Ps. 2,358,676
Comprehensive (loss) income attributable to: América Móvil Ps. 1,745,018 Non-controlling interest 2,185 Ps. 1,747,203
13 Income TaxesAs explained previously in these consolidated financial statements, the Company is a Mexican corporation which has numerous consolidated subsidiaries operating throughout the world. Presented below is a discussion of income tax matters that relates to the Company’s consolidated operations, its Mexican operations and significant foreign operations.
i) Consolidated income tax matters
The composition of income tax expense for the years ended December 31, 2012, 2013 and 2014 is as follows:
2012 2013 2014
In Mexico: Current year income tax Ps. 27,123,124 Ps. 20,396,868 Ps. 26,891,333 Deferred income tax 781,410 ( 5,936,699) 304,232 Effect of changes in tax rate 155,599 138,849 –Foreign: Current year income tax 21,047,770 17,955,532 18,212,915 Deferred income tax ( 3,124,451) ( 2,161,819) ( 5,700,931) Ps. 45,983,452 Ps. 30,392,731 Ps. 39,707,549
Deferred tax related to items recognized in OCI during the year:
2012 2013 2014
Remeasurement of defined benefit plans Ps. ( 76,078) Ps. 73,620 Ps. ( 1,650,959)Effect of financial instruments acquired for hedging purposes ( 49,790) ( 43,499) 23,267Other 555,879 278,776Deferred tax charged to OCI Ps. ( 125,868) Ps. 586,000 Ps. ( 1,348,916)
A reconciliation of the statutory income tax rate in Mexico to the consolidated effective income tax rate recognized by the Company is as follows:
Year ended December 31, 2012 2013 2014
Statutory income tax rate in Mexico 30.0% 30.0% 30.0%Impact of non-deductible and non-taxable items: Tax inflation effects 4.0% 5.7% 6.0% Operations of foreign subsidiaries ( 0.3%) ( 0.7%) ( 0.9%) Tax loss on sale of financial asset restructuring – ( 8.3%) – Other ( 3.9%) ( 4.6%) 0.7%Effective tax rate on Mexican operations 29.8% 22.1% 35.8%Change in estimated realization of deferred tax assets in Brazil ( 0.3%) 0.9% 0.2%Use of tax credits in Brazil ( 1.1%) ( 0.3%) ( 0.1%)Equity interest in net loss of associated companies – – 2.1%Loss on derecognition of equity method investment – – 1.1%Loss on partial sale of investment in associated company – – 1.9%Foreign subsidiaries – other items, net 5.0% 6.1% 4.5%Effective tax rate 33.4% 28.8% 45.5%
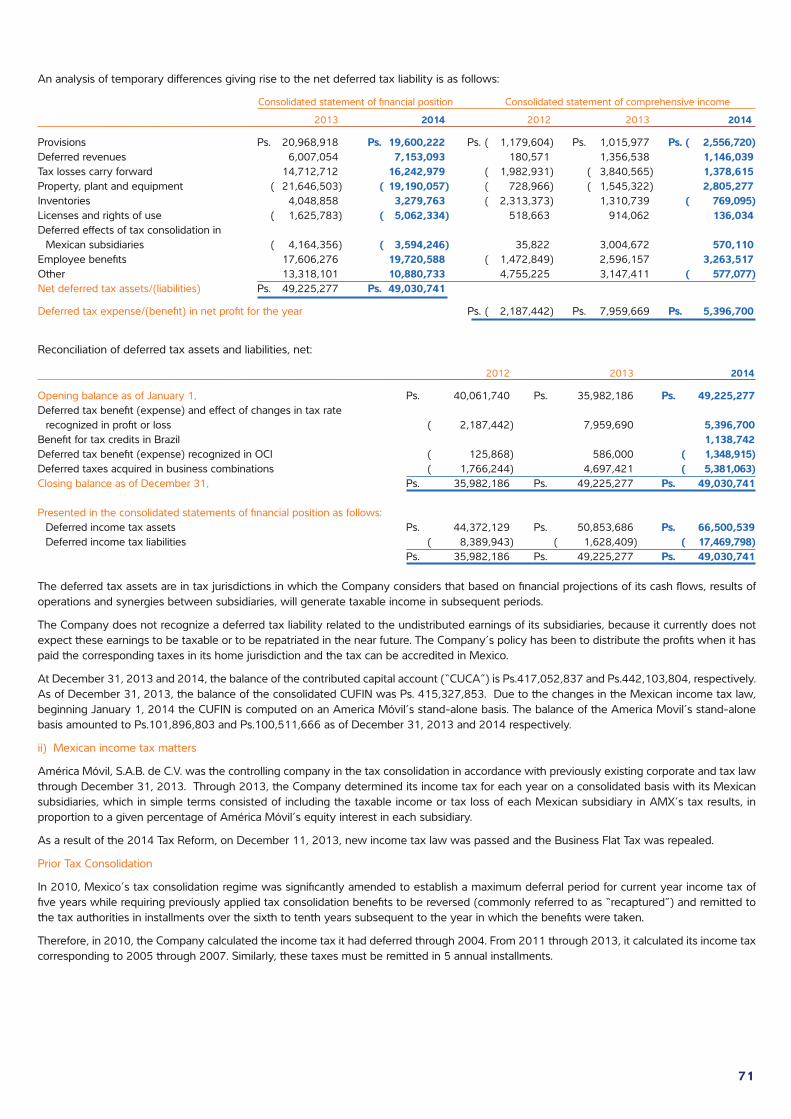
71
An analysis of temporary differences giving rise to the net deferred tax liability is as follows:
Consolidated statement of financial position Consolidated statement of comprehensive income
2013 2014 2012 2013 2014
Provisions Ps. 20,968,918 Ps. 19,600,222 Ps. ( 1,179,604) Ps. 1,015,977 Ps. ( 2,556,720)Deferred revenues 6,007,054 7,153,093 180,571 1,356,538 1,146,039Tax losses carry forward 14,712,712 16,242,979 ( 1,982,931) ( 3,840,565) 1,378,615Property, plant and equipment ( 21,646,503) ( 19,190,057) ( 728,966) ( 1,545,322) 2,805,277Inventories 4,048,858 3,279,763 ( 2,313,373) 1,310,739 ( 769,095)Licenses and rights of use ( 1,625,783) ( 5,062,334) 518,663 914,062 136,034Deferred effects of tax consolidation in Mexican subsidiaries ( 4,164,356) ( 3,594,246) 35,822 3,004,672 570,110Employee benefits 17,606,276 19,720,588 ( 1,472,849) 2,596,157 3,263,517Other 13,318,101 10,880,733 4,755,225 3,147,411 ( 577,077)Net deferred tax assets/(liabilities) Ps. 49,225,277 Ps. 49,030,741
Deferred tax expense/(benefit) in net profit for the year Ps. ( 2,187,442) Ps. 7,959,669 Ps. 5,396,700
Reconciliation of deferred tax assets and liabilities, net:
2012 2013 2014
Opening balance as of January 1, Ps. 40,061,740 Ps. 35,982,186 Ps. 49,225,277Deferred tax benefit (expense) and effect of changes in tax rate recognized in profit or loss ( 2,187,442) 7,959,690 5,396,700Benefit for tax credits in Brazil 1,138,742Deferred tax benefit (expense) recognized in OCI ( 125,868) 586,000 ( 1,348,915)Deferred taxes acquired in business combinations ( 1,766,244) 4,697,421 ( 5,381,063)Closing balance as of December 31, Ps. 35,982,186 Ps. 49,225,277 Ps. 49,030,741
Presented in the consolidated statements of financial position as follows: Deferred income tax assets Ps. 44,372,129 Ps. 50,853,686 Ps. 66,500,539 Deferred income tax liabilities ( 8,389,943) ( 1,628,409) ( 17,469,798) Ps. 35,982,186 Ps. 49,225,277 Ps. 49,030,741
The deferred tax assets are in tax jurisdictions in which the Company considers that based on financial projections of its cash flows, results of operations and synergies between subsidiaries, will generate taxable income in subsequent periods.
The Company does not recognize a deferred tax liability related to the undistributed earnings of its subsidiaries, because it currently does not expect these earnings to be taxable or to be repatriated in the near future. The Company’s policy has been to distribute the profits when it has paid the corresponding taxes in its home jurisdiction and the tax can be accredited in Mexico.
At December 31, 2013 and 2014, the balance of the contributed capital account (“CUCA”) is Ps.417,052,837 and Ps.442,103,804, respectively. As of December 31, 2013, the balance of the consolidated CUFIN was Ps. 415,327,853. Due to the changes in the Mexican income tax law, beginning January 1, 2014 the CUFIN is computed on an America Móvil’s stand-alone basis. The balance of the America Movil’s stand-alone basis amounted to Ps.101,896,803 and Ps.100,511,666 as of December 31, 2013 and 2014 respectively.
ii) Mexican income tax matters
América Móvil, S.A.B. de C.V. was the controlling company in the tax consolidation in accordance with previously existing corporate and tax law through December 31, 2013. Through 2013, the Company determined its income tax for each year on a consolidated basis with its Mexican subsidiaries, which in simple terms consisted of including the taxable income or tax loss of each Mexican subsidiary in AMX’s tax results, in proportion to a given percentage of América Móvil’s equity interest in each subsidiary.
As a result of the 2014 Tax Reform, on December 11, 2013, new income tax law was passed and the Business Flat Tax was repealed.
Prior Tax Consolidation
In 2010, Mexico’s tax consolidation regime was significantly amended to establish a maximum deferral period for current year income tax of five years while requiring previously applied tax consolidation benefits to be reversed (commonly referred to as “recaptured”) and remitted to the tax authorities in installments over the sixth to tenth years subsequent to the year in which the benefits were taken.
Therefore, in 2010, the Company calculated the income tax it had deferred through 2004. From 2011 through 2013, it calculated its income tax corresponding to 2005 through 2007. Similarly, these taxes must be remitted in 5 annual installments.
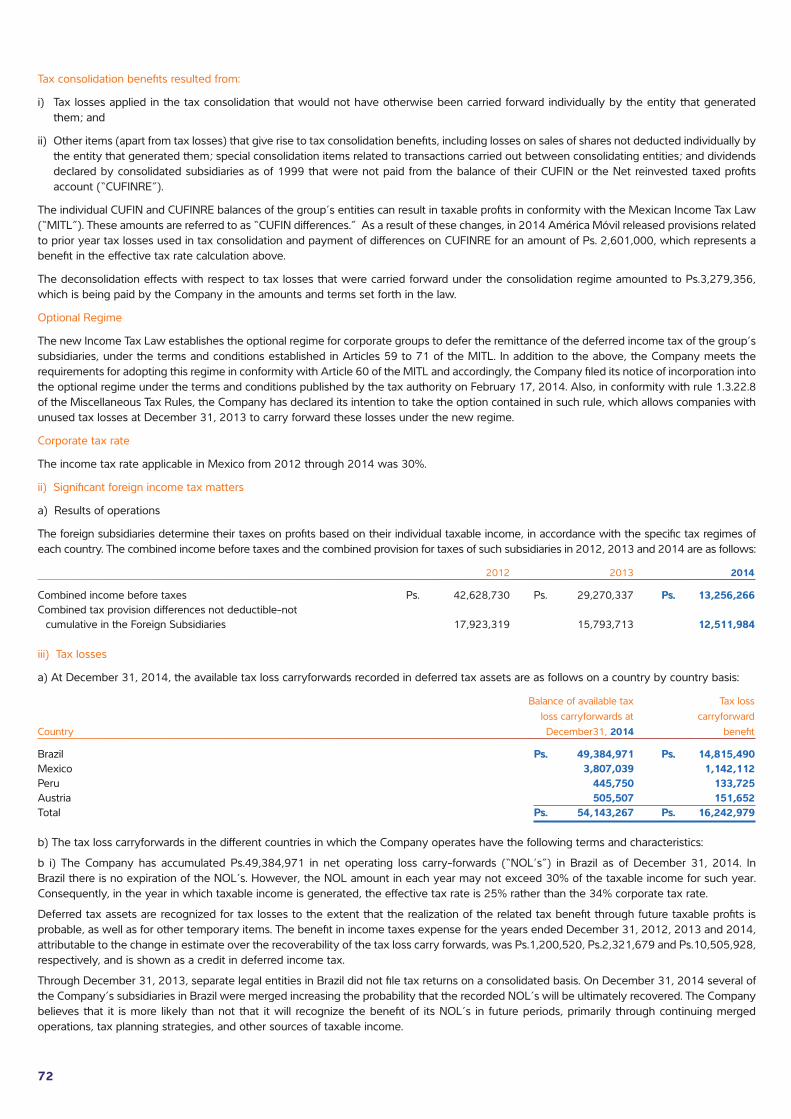
72
Tax consolidation benefits resulted from:
i) Tax losses applied in the tax consolidation that would not have otherwise been carried forward individually by the entity that generated them; and
ii) Other items (apart from tax losses) that give rise to tax consolidation benefits, including losses on sales of shares not deducted individually by the entity that generated them; special consolidation items related to transactions carried out between consolidating entities; and dividends declared by consolidated subsidiaries as of 1999 that were not paid from the balance of their CUFIN or the Net reinvested taxed profits account (“CUFINRE”).
The individual CUFIN and CUFINRE balances of the group’s entities can result in taxable profits in conformity with the Mexican Income Tax Law (“MITL”). These amounts are referred to as “CUFIN differences.” As a result of these changes, in 2014 América Móvil released provisions related to prior year tax losses used in tax consolidation and payment of differences on CUFINRE for an amount of Ps. 2,601,000, which represents a benefit in the effective tax rate calculation above.
The deconsolidation effects with respect to tax losses that were carried forward under the consolidation regime amounted to Ps.3,279,356, which is being paid by the Company in the amounts and terms set forth in the law.
Optional Regime
The new Income Tax Law establishes the optional regime for corporate groups to defer the remittance of the deferred income tax of the group’s subsidiaries, under the terms and conditions established in Articles 59 to 71 of the MITL. In addition to the above, the Company meets the requirements for adopting this regime in conformity with Article 60 of the MITL and accordingly, the Company filed its notice of incorporation into the optional regime under the terms and conditions published by the tax authority on February 17, 2014. Also, in conformity with rule 1.3.22.8 of the Miscellaneous Tax Rules, the Company has declared its intention to take the option contained in such rule, which allows companies with unused tax losses at December 31, 2013 to carry forward these losses under the new regime.
Corporate tax rate
The income tax rate applicable in Mexico from 2012 through 2014 was 30%.
ii) Significant foreign income tax matters
a) Results of operations
The foreign subsidiaries determine their taxes on profits based on their individual taxable income, in accordance with the specific tax regimes of each country. The combined income before taxes and the combined provision for taxes of such subsidiaries in 2012, 2013 and 2014 are as follows:
2012 2013 2014
Combined income before taxes Ps. 42,628,730 Ps. 29,270,337 Ps. 13,256,266Combined tax provision differences not deductible-not cumulative in the Foreign Subsidiaries 17,923,319 15,793,713 12,511,984
iii) Tax losses
a) At December 31, 2014, the available tax loss carryforwards recorded in deferred tax assets are as follows on a country by country basis:
Balance of available tax Tax loss loss carryforwards at carryforward Country December31, 2014 benefit
Brazil Ps. 49,384,971 Ps. 14,815,490Mexico 3,807,039 1,142,112Peru 445,750 133,725Austria 505,507 151,652Total Ps. 54,143,267 Ps. 16,242,979
b) The tax loss carryforwards in the different countries in which the Company operates have the following terms and characteristics:
b i) The Company has accumulated Ps.49,384,971 in net operating loss carry-forwards (“NOL’s”) in Brazil as of December 31, 2014. In Brazil there is no expiration of the NOL’s. However, the NOL amount in each year may not exceed 30% of the taxable income for such year. Consequently, in the year in which taxable income is generated, the effective tax rate is 25% rather than the 34% corporate tax rate.
Deferred tax assets are recognized for tax losses to the extent that the realization of the related tax benefit through future taxable profits is probable, as well as for other temporary items. The benefit in income taxes expense for the years ended December 31, 2012, 2013 and 2014, attributable to the change in estimate over the recoverability of the tax loss carry forwards, was Ps.1,200,520, Ps.2,321,679 and Ps.10,505,928, respectively, and is shown as a credit in deferred income tax.
Through December 31, 2013, separate legal entities in Brazil did not file tax returns on a consolidated basis. On December 31, 2014 several of the Company’s subsidiaries in Brazil were merged increasing the probability that the recorded NOL’s will be ultimately recovered. The Company believes that it is more likely than not that it will recognize the benefit of its NOL’s in future periods, primarily through continuing merged operations, tax planning strategies, and other sources of taxable income.
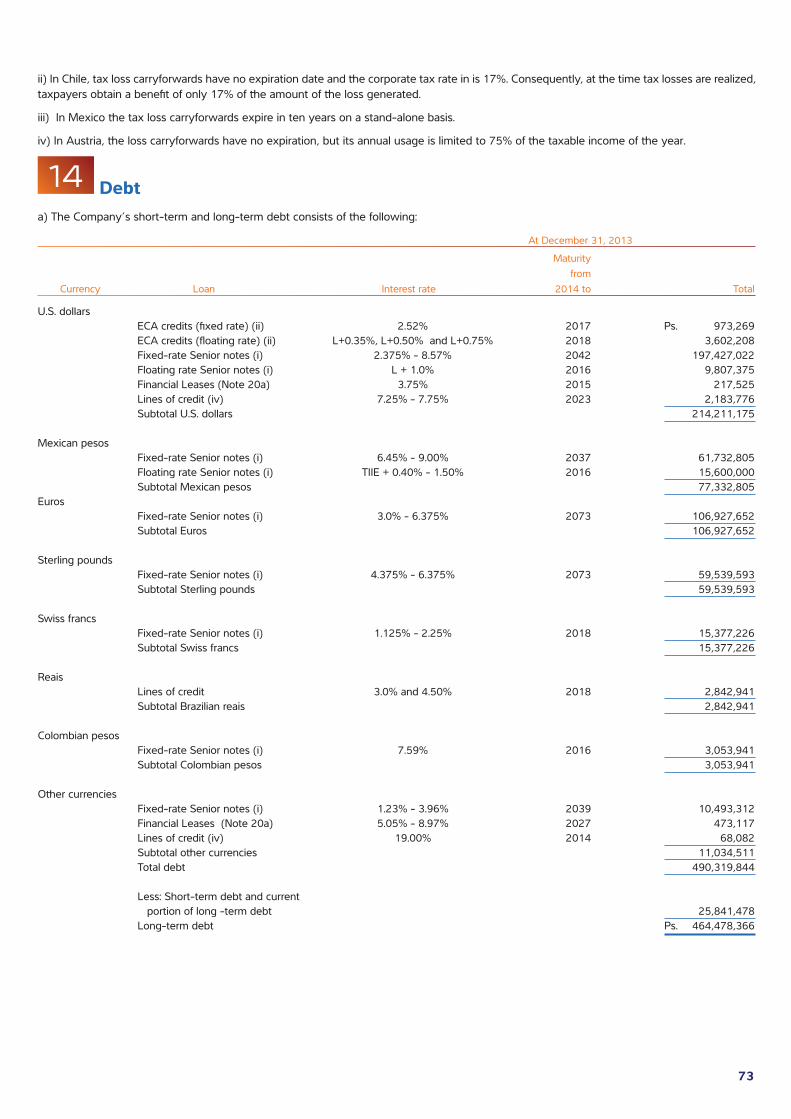
73
ii) In Chile, tax loss carryforwards have no expiration date and the corporate tax rate in is 17%. Consequently, at the time tax losses are realized, taxpayers obtain a benefit of only 17% of the amount of the loss generated.
iii) In Mexico the tax loss carryforwards expire in ten years on a stand-alone basis.
iv) In Austria, the loss carryforwards have no expiration, but its annual usage is limited to 75% of the taxable income of the year.
14 Debta) The Company’s short-term and long-term debt consists of the following:
At December 31, 2013
Maturity from Currency Loan Interest rate 2014 to Total
U.S. dollars ECA credits (fixed rate) (ii) 2.52% 2017 Ps. 973,269 ECA credits (floating rate) (ii) L+0.35%, L+0.50% and L+0.75% 2018 3,602,208 Fixed-rate Senior notes (i) 2.375% - 8.57% 2042 197,427,022 Floating rate Senior notes (i) L + 1.0% 2016 9,807,375 Financial Leases (Note 20a) 3.75% 2015 217,525 Lines of credit (iv) 7.25% - 7.75% 2023 2,183,776 Subtotal U.S. dollars 214,211,175
Mexican pesos Fixed-rate Senior notes (i) 6.45% - 9.00% 2037 61,732,805 Floating rate Senior notes (i) TIIE + 0.40% - 1.50% 2016 15,600,000 Subtotal Mexican pesos 77,332,805Euros Fixed-rate Senior notes (i) 3.0% - 6.375% 2073 106,927,652 Subtotal Euros 106,927,652
Sterling pounds Fixed-rate Senior notes (i) 4.375% - 6.375% 2073 59,539,593 Subtotal Sterling pounds 59,539,593
Swiss francs Fixed-rate Senior notes (i) 1.125% - 2.25% 2018 15,377,226 Subtotal Swiss francs 15,377,226
Reais Lines of credit 3.0% and 4.50% 2018 2,842,941 Subtotal Brazilian reais 2,842,941
Colombian pesos Fixed-rate Senior notes (i) 7.59% 2016 3,053,941 Subtotal Colombian pesos 3,053,941
Other currencies Fixed-rate Senior notes (i) 1.23% - 3.96% 2039 10,493,312 Financial Leases (Note 20a) 5.05% - 8.97% 2027 473,117 Lines of credit (iv) 19.00% 2014 68,082 Subtotal other currencies 11,034,511 Total debt 490,319,844
Less: Short-term debt and current portion of long -term debt 25,841,478 Long-term debt Ps. 464,478,366
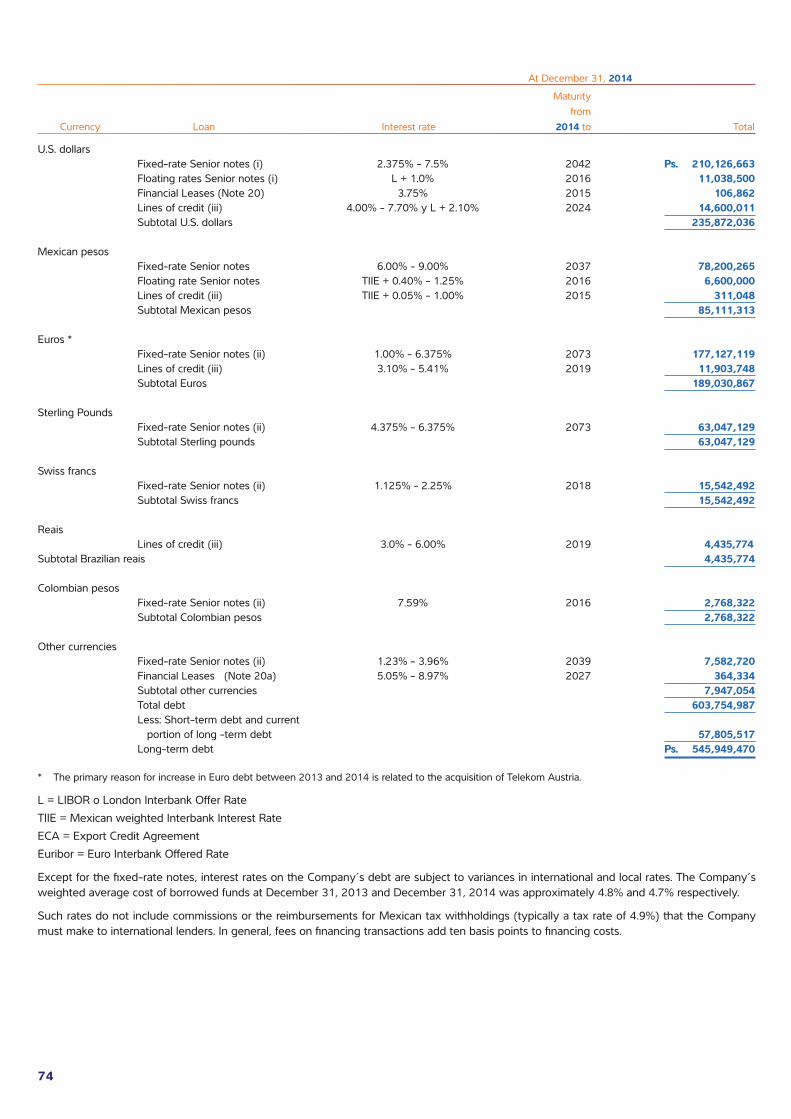
74
At December 31, 2014
Maturity from Currency Loan Interest rate 2014 to Total
U.S. dollars Fixed-rate Senior notes (i) 2.375% - 7.5% 2042 Ps. 210,126,663 Floating rates Senior notes (i) L + 1.0% 2016 11,038,500 Financial Leases (Note 20) 3.75% 2015 106,862 Lines of credit (iii) 4.00% - 7.70% y L + 2.10% 2024 14,600,011 Subtotal U.S. dollars 235,872,036
Mexican pesos Fixed-rate Senior notes 6.00% - 9.00% 2037 78,200,265 Floating rate Senior notes TIIE + 0.40% - 1.25% 2016 6,600,000 Lines of credit (iii) TIIE + 0.05% - 1.00% 2015 311,048 Subtotal Mexican pesos 85,111,313
Euros * Fixed-rate Senior notes (ii) 1.00% - 6.375% 2073 177,127,119 Lines of credit (iii) 3.10% - 5.41% 2019 11,903,748 Subtotal Euros 189,030,867
Sterling Pounds Fixed-rate Senior notes (ii) 4.375% - 6.375% 2073 63,047,129 Subtotal Sterling pounds 63,047,129
Swiss francs Fixed-rate Senior notes (ii) 1.125% - 2.25% 2018 15,542,492 Subtotal Swiss francs 15,542,492
Reais Lines of credit (iii) 3.0% - 6.00% 2019 4,435,774 Subtotal Brazilian reais 4,435,774
Colombian pesos Fixed-rate Senior notes (ii) 7.59% 2016 2,768,322 Subtotal Colombian pesos 2,768,322
Other currencies Fixed-rate Senior notes (ii) 1.23% - 3.96% 2039 7,582,720 Financial Leases (Note 20a) 5.05% - 8.97% 2027 364,334 Subtotal other currencies 7,947,054 Total debt 603,754,987 Less: Short-term debt and current portion of long -term debt 57,805,517 Long-term debt Ps. 545,949,470
* The primary reason for increase in Euro debt between 2013 and 2014 is related to the acquisition of Telekom Austria.
L = LIBOR o London Interbank Offer RateTIIE = Mexican weighted Interbank Interest RateECA = Export Credit AgreementEuribor = Euro Interbank Offered Rate
Except for the fixed-rate notes, interest rates on the Company’s debt are subject to variances in international and local rates. The Company’s weighted average cost of borrowed funds at December 31, 2013 and December 31, 2014 was approximately 4.8% and 4.7% respectively.
Such rates do not include commissions or the reimbursements for Mexican tax withholdings (typically a tax rate of 4.9%) that the Company must make to international lenders. In general, fees on financing transactions add ten basis points to financing costs.

75
An analysis of the Company’s short-term debt maturities as of December 31, 2013 and December 31, 2014, is as follows:
2013 2014
Domestic Senior Notes (Certificados Bursátiles) Ps. 9,000,000 Ps. 4,600,000International Senior Notes 13,576,670 35,315,148Lines of credit 617,295 14,814,203Financial Leases 106,862Subtotal short-term debt Ps. 23,193,965 Ps. 54,836,213Weighted average interest rate 5.0% 4.0%
An analysis of the Company’s long-term debt is as follows:
Years Amount
2016 Ps. 72,938,9222017 43,938,4042018 25,946,6152019 45,367,1332020 and thereafter 357,758,396Total Ps. 545,949,470
(i) Senior Notes
The outstanding Senior Notes at December 31, 2013 and December 31, 2014 are as follows:
(Thousands of Mexican Pesos)Currency 2013 2014
U.S. dollars Ps. 207,234,397 Ps. 221,165,164Mexican pesos 77,332,805 84,800,265Euros 106,927,652 177,127,119Sterling pounds 59,539,593 63,047,129Swiss francs 15,377,226 15,542,492Japanese yens 3,104,287 2,224,042Chinese yuans 2,159,870 2,371,767Colombian pesos 3,053,941 2,768,321Chilean pesos 5,229,155 2,986,911
During the second quarter of 2014, América Móvil issued notes for $600,000 Euros (Ps. 10,706,000) due 2018 with a coupon of 1%. Likewise, the Company issued two new notes under the program of peso-denominated notes for Ps.10,000,000 due 2019 with a coupon of 6% and for Ps.7,500,000 due 2024 with a coupon of 7.125%. The notes are registered with both the U.S. Securities and Exchange Commission and the Mexican Banking and Securities Commission (“CNBV”).
(ii) Domestic Senior Notes (Certificados Bursátiles)
At December 31, 2013 and December 31, 2014, debt under stock certificates aggregates to Ps.37,461,105 and Ps.27,428,565, respectively. In general these issues bear a fixed-rate or floating rate determined as a differential on the TIIE rate (a Mexican weighted interbank interest rate).
(iii) Lines of Credit
At December 31, 2013 and December 31, 2014, debt under Lines of Credit aggregates to Ps. 5,094,799 and Ps.30,077,192, respectively.
Likewise, the Company has two revolving syndicated facilities – one for US$ 2,500,000 and one for the Euro equivalent of US$ 2,000,000 currently outstanding. The Euro equivalent revolving syndicated facility was amended in July 2013 to increase the amount available to US $2,100,000. Loans under the facility bear interest at variable rates based on LIBOR and EURIBOR. Telekom Austria has also an unwilling revolving syndicated facility for Euros 1,000,000 at a variable rate based on LIBOR and EURIBOR.
Restrictions (TELMEX):
A portion of the debt is also subject to early maturity or repurchase at the option of the holders in the event of a change in control of the Company, as so defined in each instrument. The definition of change in control varies from instrument to instrument; however, no change in control shall be considered to have occurred as long as Carso Global Telecom or its current shareholders continue to hold the majority of the Company’s voting shares.

76
Covenants
In conformity with the credit agreements, the Company is obligated to comply with certain financial and operating commitments. Such covenants limit in certain cases, the ability of the Company or the guarantor to: pledge assets, carry out certain types of mergers, sell all or substantially all of its assets, and sell control over Telcel.
Such covenants do not restrict the ability of AMX’s subsidiaries to pay dividends or other payment distributions to AMX. The more restrictive financial covenants require the Company to maintain a consolidated ratio of debt to EBITDA (earnings before interest, tax, depreciation and amortization) that do not exceed 4 to 1, and a consolidated ratio of EBITDA to interest paid that is not below 2.5 to 1 (in accordance with the clauses included in the credit agreements). Several of the financing instruments of the Company are subject to early extinguishment or re-purchase, at the option of the debt holder in the case that a change in control occurs.
At December 31, 2013 and December 31, 2014, the Company complied with all the conditions established in its debt agreements.
At December 31, 2013 and 2014, approximately 48% and 49%, respectively, of America Movil’s total outstanding consolidated debt is guaranteed by Telcel.
b) For the years ended December 31, 2012, 2013 and 2014, the interest income was Ps., 3,859,086, Ps.2,925,834 and Ps.7,052,271, respectively.
c) For the years ended December 31, 2012, 2013 and 2014, the interest expense was Ps.(22,267,771), Ps.(23,950,653) and Ps.(31,522,523), respectively.
d) For the years ended December 31, 2012, 2013 and 2014, Valuation of derivatives and other financial items was as follows:
2012 2013 2014
Gain (loss) in valuation of derivatives Ps. ( 6,075,490) Ps. 2,841,952 Ps. 7,397,142Capitalized interest expense (Note 10 e) 3,152,811 3,002,576 3,258,928Commissions on debt ( 1,931,790) ( 1,839,467) ( 1,612,395)Interest cost of labor obligations (Note 17) ( 3,930,342) ( 3,971,100) ( 4,785,121)Interest expense on taxes ( 1,386,410) ( 4,228,155) ( 2,115,730)Loss on partial sale of shares in associated company ( 795,028) ( 896,956) ( 5,554,612)Loss on derecognition of equity method investment (Note 12) – – ( 3,172,218)Other financial cost ( 2,298,770) ( 3,200,385) ( 3,606,255) Ps. ( 13,265,019) Ps. ( 8,291,535) Ps. ( 10,190,261)
15 Accounts Payable, Accrued Liabilities and Asset Retirement Obligationsa) An analysis of the caption accounts payable and accrued liabilities is as follows:
At December 31, 2013 2014
Suppliers Ps. 98,763,285 Ps. 118,723,997Sundry creditors 42,396,889 57,932,101Interest payable 7,203,911 9,418,164Guarantee deposits from clients 2,666,481 1,974,323Dividends payable 3,106,746 3,454,777Total Ps. 154,137,312 Ps. 191,503,362
b) The balance of accrued liabilities at December 31, 2013 and 2014 are as follows:
At December 31, 2013 2014
Direct employee benefits payable Ps. 11,203,772 Ps. 20,735,930Contingencies 25,755,150 33,232,749 Ps. 36,958,922 Ps. 53,968,679
The movements in contingencies at December 31, 2013 and 2014 are as follows:
Balance at Applications Balance at December 31, Effect of Increase of December 31, 2012 translation the year Payments Reversals 2013
Contingencies Ps. 24,201,239 Ps. ( 2,902,833) Ps. 12,419,163 Ps. ( 7,907,863) Ps. ( 54,556) Ps. 25,755,150
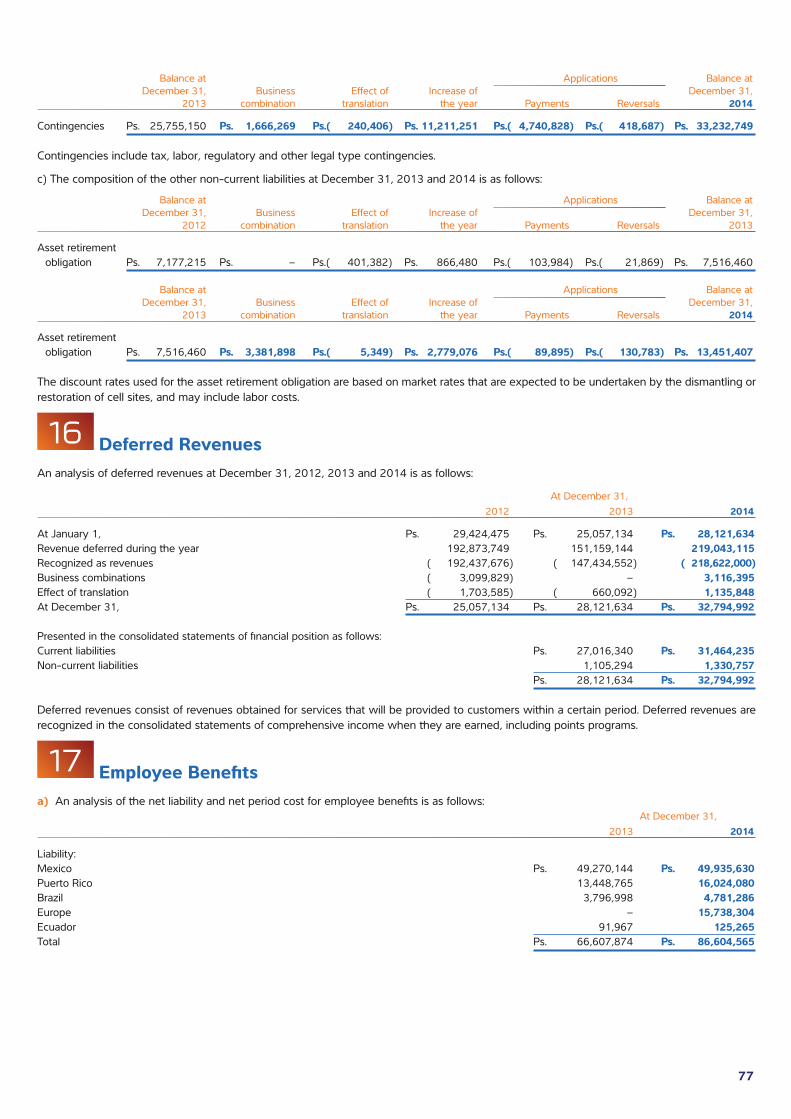
77
Balance at Applications Balance at December 31, Business Effect of Increase of December 31, 2013 combination translation the year Payments Reversals 2014
Contingencies Ps. 25,755,150 Ps. 1,666,269 Ps. ( 240,406) Ps. 11,211,251 Ps. ( 4,740,828) Ps. ( 418,687) Ps. 33,232,749
Contingencies include tax, labor, regulatory and other legal type contingencies.
c) The composition of the other non-current liabilities at December 31, 2013 and 2014 is as follows:
Balance at Applications Balance at December 31, Business Effect of Increase of December 31, 2012 combination translation the year Payments Reversals 2013
Asset retirement obligation Ps. 7,177,215 Ps. – Ps. ( 401,382) Ps. 866,480 Ps. ( 103,984) Ps. ( 21,869) Ps. 7,516,460
Balance at Applications Balance at December 31, Business Effect of Increase of December 31, 2013 combination translation the year Payments Reversals 2014
Asset retirement obligation Ps. 7,516,460 Ps. 3,381,898 Ps. ( 5,349) Ps. 2,779,076 Ps. ( 89,895) Ps. ( 130,783) Ps. 13,451,407
The discount rates used for the asset retirement obligation are based on market rates that are expected to be undertaken by the dismantling or restoration of cell sites, and may include labor costs.
16 Deferred RevenuesAn analysis of deferred revenues at December 31, 2012, 2013 and 2014 is as follows:
At December 31, 2012 2013 2014
At January 1, Ps. 29,424,475 Ps. 25,057,134 Ps. 28,121,634Revenue deferred during the year 192,873,749 151,159,144 219,043,115Recognized as revenues ( 192,437,676) ( 147,434,552) ( 218,622,000)Business combinations ( 3,099,829) – 3,116,395Effect of translation ( 1,703,585) ( 660,092) 1,135,848At December 31, Ps. 25,057,134 Ps. 28,121,634 Ps. 32,794,992
Presented in the consolidated statements of financial position as follows:Current liabilities Ps. 27,016,340 Ps. 31,464,235Non-current liabilities 1,105,294 1,330,757 Ps. 28,121,634 Ps. 32,794,992
Deferred revenues consist of revenues obtained for services that will be provided to customers within a certain period. Deferred revenues are recognized in the consolidated statements of comprehensive income when they are earned, including points programs.
17 Employee Benefitsa) An analysis of the net liability and net period cost for employee benefits is as follows: At December 31, 2013 2014
Liability:Mexico Ps. 49,270,144 Ps. 49,935,630Puerto Rico 13,448,765 16,024,080Brazil 3,796,998 4,781,286Europe – 15,738,304Ecuador 91,967 125,265Total Ps. 66,607,874 Ps. 86,604,565

78
Net period cost (benefit): For the years ended December 31, 2102 2013 2014
Mexico Ps. 8,656,797 Ps 7,602,818 Ps 8,755,823Puerto Rico 1,097,942 ( 713,271) ( 1,631,225)Brazil 384,331 384,642 436,753Europe – – 267,604Ecuador 2,602 18,650 26,759Total Ps. 10,141,672 Ps 7,292,839 Ps 7,855,714
The Company’s post-retirement obligations for seniority premiums, pension and retirement plans, and medical services in the countries in which it operates and that have defined benefit and defined contribution plans are as follows:
b) Puerto Rico
Pension plan
There is a pension investment fund committee whose responsibility is to verify that the funds are invested in the appropriate instruments as approved by the committee. No employee has either the authority to invest non change the use of funds without approval of the committee.
The following tables show the net benefit cost and liabilities for labor obligations related to the funds and costs associated with these pension and post-retirement plans at December 31, 2012, 2013 and 2014: At December 31, 2012 2013 2014
Pensions and Post-retiremen Pensions and Post-retirement Pensions and Post-retirement sum of benefits benefits sum of benefits benefits sum of benefits benefits
Projected benefit obligation: Projected benefit obligation at beginning of year Ps. 24,482,597 Ps. 9,633,990 Ps. 23,861,498 Ps. 8,958,942 Ps. 21,641,938 Ps. 5,661,898 Current service cost 196,551 84,986 190,067 77,513 127,178 40,903 Interest cost on projected benefit obligation 989,029 374,837 917,047 334,038 1,132,499 235,759 Actuarial (gain) loss 1,368,663 516,233 ( 1,874,057) ( 1,657,720) 3,255,940 773,342 Other amendments to plans ( 41,778) ( 1,755,273) ( 2,530,502) Employee contributions 124,178 153,355 191,434 Benefits paid ( 1,418,080) ( 457,160) ( 1,574,400) ( 494,681) ( 1,774,630) ( 470,202) Effect of translation ( 1,715,484) ( 1,318,122) 121,783 45,724 2,716,725 710,741P rojected benefit obligation at end of year Ps. 23,861,498 Ps. 8,958,942 Ps. 21,641,938 Ps. 5,661,898 Ps. 27,099,650 Ps. 4,613,373
Changes in plan assets:Established fund at beginning of year Ps. 13,925,231 Ps. – Ps. 13,989,605 Ps. – Ps. 13,855,071 Ps. –Expected return on plan assets 578,265 547,276 738,616Actuarial gain (loss) on plan assets in OCI 622,294 ( 479,371) ( 279,335)Contributions 1,320,525 457,160 1,371,174 494,681 1,511,541 470,202Benefits paid ( 1,408,394) ( 457,160) ( 1,574,400) ( 494,681) ( 1,774,630) ( 470,202)Actuarial loss ( 72,583) ( 70,613) ( 101,554)Effect of translation ( 975,733) 71,400 1,739,234Established fund at end of year 13,989,605 13,855,071 15,688,943Plan asset shortfall Ps. 9,871,893 Ps. 8,958,942 Ps. 7,786,867 Ps. 5,661,898 Ps. 11,410,707 Ps. 4,613,373
During 2014, the Company announced to its plan participants that a decrease in the employer portion cost related to the medical insured premiums would take effect, effective September 1, 2014. This change resulted in a decrease in the accumulated post-retirement benefit obligation of approximately Ps.2,178,264.
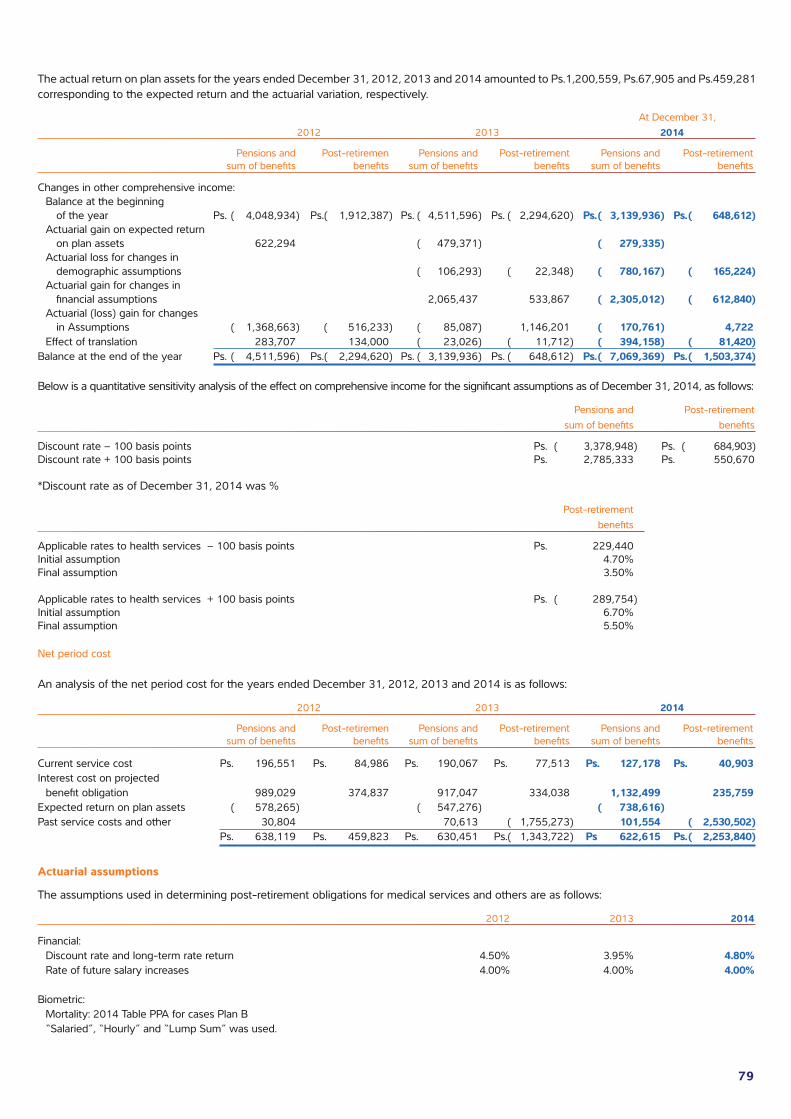
79
The actual return on plan assets for the years ended December 31, 2012, 2013 and 2014 amounted to Ps.1,200,559, Ps.67,905 and Ps.459,281 corresponding to the expected return and the actuarial variation, respectively.
At December 31, 2012 2013 2014
Pensions and Post-retiremen Pensions and Post-retirement Pensions and Post-retirement sum of benefits benefits sum of benefits benefits sum of benefits benefits
Changes in other comprehensive income: Balance at the beginning of the year Ps. ( 4,048,934) Ps. ( 1,912,387) Ps. ( 4,511,596) Ps. ( 2,294,620) Ps. ( 3,139,936) Ps. ( 648,612) Actuarial gain on expected return on plan assets 622,294 ( 479,371) ( 279,335) Actuarial loss for changes in demographic assumptions ( 106,293) ( 22,348) ( 780,167) ( 165,224) Actuarial gain for changes in financial assumptions 2,065,437 533,867 ( 2,305,012) ( 612,840) Actuarial (loss) gain for changes in Assumptions ( 1,368,663) ( 516,233) ( 85,087) 1,146,201 ( 170,761) 4,722 Effect of translation 283,707 134,000 ( 23,026) ( 11,712) ( 394,158) ( 81,420)Balance at the end of the year Ps. ( 4,511,596) Ps. ( 2,294,620) Ps. ( 3,139,936) Ps. ( 648,612) Ps. ( 7,069,369) Ps. ( 1,503,374)
Below is a quantitative sensitivity analysis of the effect on comprehensive income for the significant assumptions as of December 31, 2014, as follows:
Pensions and Post-retirement sum of benefits benefits
Discount rate – 100 basis points Ps. ( 3,378,948) Ps. ( 684,903)Discount rate + 100 basis points Ps. 2,785,333 Ps. 550,670
*Discount rate as of December 31, 2014 was %
Post-retirement benefits
Applicable rates to health services – 100 basis points Ps. 229,440Initial assumption 4.70%Final assumption 3.50%
Applicable rates to health services + 100 basis points Ps. ( 289,754)Initial assumption 6.70%Final assumption 5.50%
Net period cost
An analysis of the net period cost for the years ended December 31, 2012, 2013 and 2014 is as follows:
2012 2013 2014
Pensions and Post-retiremen Pensions and Post-retirement Pensions and Post-retirement sum of benefits benefits sum of benefits benefits sum of benefits benefits
Current service cost Ps. 196,551 Ps. 84,986 Ps. 190,067 Ps. 77,513 Ps. 127,178 Ps. 40,903Interest cost on projected benefit obligation 989,029 374,837 917,047 334,038 1,132,499 235,759Expected return on plan assets ( 578,265) ( 547,276) ( 738,616)Past service costs and other 30,804 70,613 ( 1,755,273) 101,554 ( 2,530,502) Ps. 638,119 Ps. 459,823 Ps. 630,451 Ps. ( 1,343,722) Ps 622,615 Ps. ( 2,253,840)
Actuarial assumptions
The assumptions used in determining post-retirement obligations for medical services and others are as follows:
2012 2013 2014
Financial: Discount rate and long-term rate return 4.50% 3.95% 4.80% Rate of future salary increases 4.00% 4.00% 4.00%
Biometric: Mortality: 2014 Table PPA for cases Plan B “Salaried”, “Hourly” and “Lump Sum” was used.
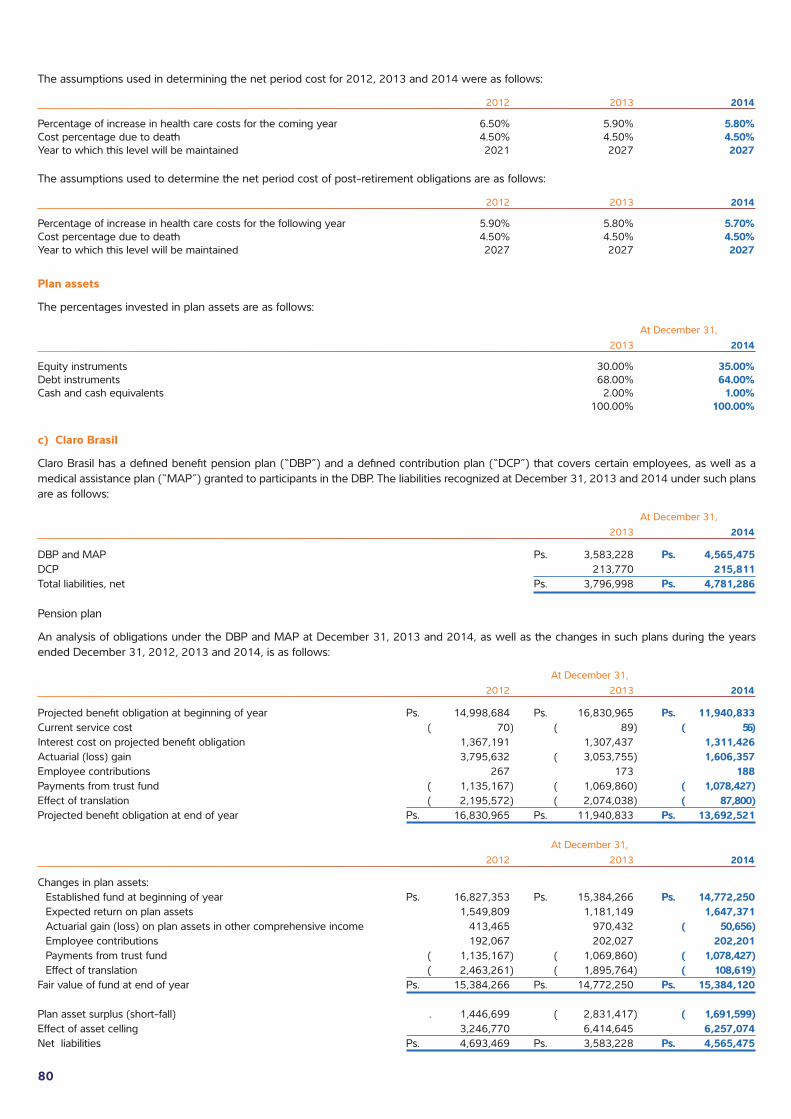
80
The assumptions used in determining the net period cost for 2012, 2013 and 2014 were as follows:
2012 2013 2014
Percentage of increase in health care costs for the coming year 6.50% 5.90% 5.80%Cost percentage due to death 4.50% 4.50% 4.50%Year to which this level will be maintained 2021 2027 2027
The assumptions used to determine the net period cost of post-retirement obligations are as follows:
2012 2013 2014
Percentage of increase in health care costs for the following year 5.90% 5.80% 5.70%Cost percentage due to death 4.50% 4.50% 4.50%Year to which this level will be maintained 2027 2027 2027
Plan assets
The percentages invested in plan assets are as follows:
At December 31, 2013 2014
Equity instruments 30.00% 35.00%Debt instruments 68.00% 64.00%Cash and cash equivalents 2.00% 1.00% 100.00% 100.00%
c) Claro Brasil
Claro Brasil has a defined benefit pension plan (“DBP”) and a defined contribution plan (“DCP”) that covers certain employees, as well as a medical assistance plan (“MAP”) granted to participants in the DBP. The liabilities recognized at December 31, 2013 and 2014 under such plans are as follows:
At December 31, 2013 2014
DBP and MAP Ps. 3,583,228 Ps. 4,565,475DCP 213,770 215,811Total liabilities, net Ps. 3,796,998 Ps. 4,781,286
Pension plan
An analysis of obligations under the DBP and MAP at December 31, 2013 and 2014, as well as the changes in such plans during the years ended December 31, 2012, 2013 and 2014, is as follows:
At December 31, 2012 2013 2014
Projected benefit obligation at beginning of year Ps. 14,998,684 Ps. 16,830,965 Ps. 11,940,833Current service cost ( 70) ( 89) ( 56)Interest cost on projected benefit obligation 1,367,191 1,307,437 1,311,426Actuarial (loss) gain 3,795,632 ( 3,053,755) 1,606,357Employee contributions 267 173 188Payments from trust fund ( 1,135,167) ( 1,069,860) ( 1,078,427)Effect of translation ( 2,195,572) ( 2,074,038) ( 87,800)Projected benefit obligation at end of year Ps. 16,830,965 Ps. 11,940,833 Ps. 13,692,521
At December 31, 2012 2013 2014
Changes in plan assets: Established fund at beginning of year Ps. 16,827,353 Ps. 15,384,266 Ps. 14,772,250 Expected return on plan assets 1,549,809 1,181,149 1,647,371 Actuarial gain (loss) on plan assets in other comprehensive income 413,465 970,432 ( 50,656) Employee contributions 192,067 202,027 202,201 Payments from trust fund ( 1,135,167) ( 1,069,860) ( 1,078,427) Effect of translation ( 2,463,261) ( 1,895,764) ( 108,619)Fair value of fund at end of year Ps. 15,384,266 Ps. 14,772,250 Ps. 15,384,120
Plan asset surplus (short-fall) . 1,446,699 ( 2,831,417) ( 1,691,599)Effect of asset celling 3,246,770 6,414,645 6,257,074Net liabilities Ps. 4,693,469 Ps. 3,583,228 Ps. 4,565,475
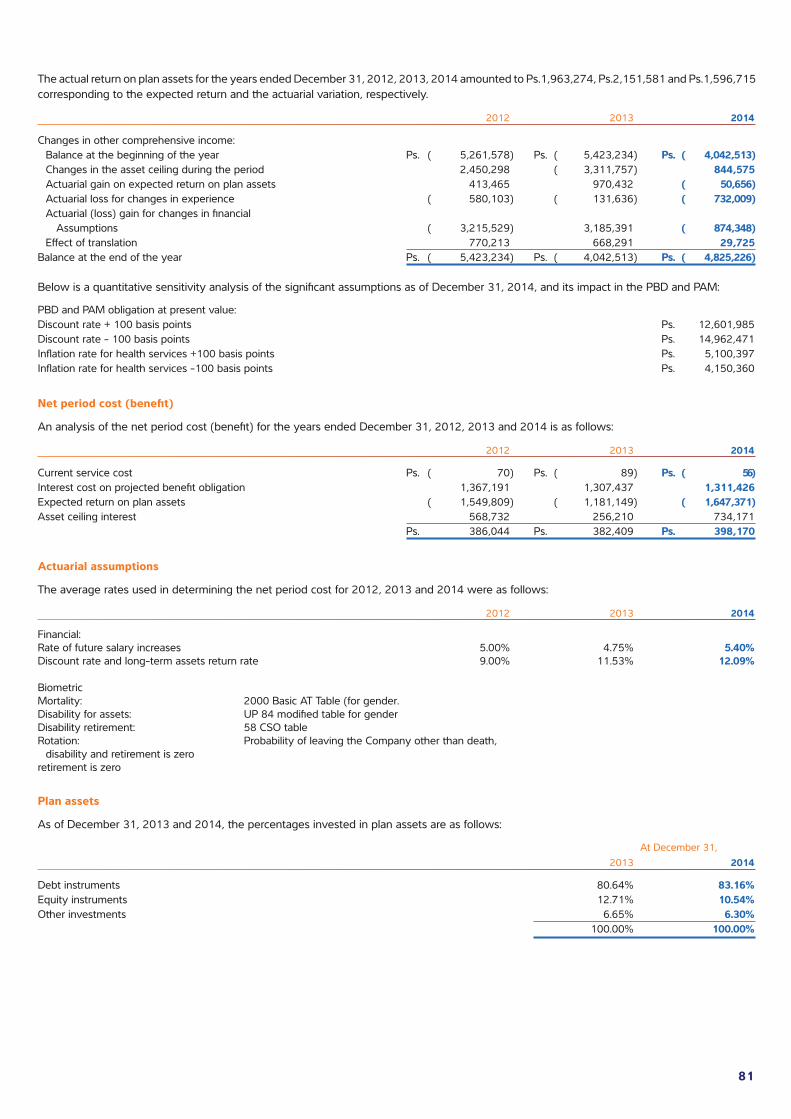
81
The actual return on plan assets for the years ended December 31, 2012, 2013, 2014 amounted to Ps.1,963,274, Ps.2,151,581 and Ps.1,596,715 corresponding to the expected return and the actuarial variation, respectively.
2012 2013 2014
Changes in other comprehensive income: Balance at the beginning of the year Ps. ( 5,261,578) Ps. ( 5,423,234) Ps. ( 4,042,513) Changes in the asset ceiling during the period 2,450,298 ( 3,311,757) 844,575 Actuarial gain on expected return on plan assets 413,465 970,432 ( 50,656) Actuarial loss for changes in experience ( 580,103) ( 131,636) ( 732,009) Actuarial (loss) gain for changes in financial Assumptions ( 3,215,529) 3,185,391 ( 874,348) Effect of translation 770,213 668,291 29,725Balance at the end of the year Ps. ( 5,423,234) Ps. ( 4,042,513) Ps. ( 4,825,226)
Below is a quantitative sensitivity analysis of the significant assumptions as of December 31, 2014, and its impact in the PBD and PAM:
PBD and PAM obligation at present value:Discount rate + 100 basis points Ps. 12,601,985Discount rate - 100 basis points Ps. 14,962,471Inflation rate for health services +100 basis points Ps. 5,100,397Inflation rate for health services -100 basis points Ps. 4,150,360
Net period cost (benefit)
An analysis of the net period cost (benefit) for the years ended December 31, 2012, 2013 and 2014 is as follows:
2012 2013 2014
Current service cost Ps. ( 70) Ps. ( 89) Ps. ( 56)Interest cost on projected benefit obligation 1,367,191 1,307,437 1,311,426Expected return on plan assets ( 1,549,809) ( 1,181,149) ( 1,647,371)Asset ceiling interest 568,732 256,210 734,171 Ps. 386,044 Ps. 382,409 Ps. 398,170
Actuarial assumptions
The average rates used in determining the net period cost for 2012, 2013 and 2014 were as follows:
2012 2013 2014
Financial:Rate of future salary increases 5.00% 4.75% 5.40%Discount rate and long-term assets return rate 9.00% 11.53% 12.09%
BiometricMortality: 2000 Basic AT Table (for gender.Disability for assets: UP 84 modified table for genderDisability retirement: 58 CSO tableRotation: Probability of leaving the Company other than death, disability and retirement is zero retirement is zero
Plan assets
As of December 31, 2013 and 2014, the percentages invested in plan assets are as follows:
At December 31, 2013 2014
Debt instruments 80.64% 83.16%Equity instruments 12.71% 10.54%Other investments 6.65% 6.30% 100.00% 100.00%
82
DCP
Claro Brasil makes contributions to the DCP through Claro Brasil Social Security Fund – Telos. Contributions are computed based on the salaries of the employees, who decide on the percentage of their contributions to the plan (between 3% and 8% of their salaries). Claro Brasil contributes the same percentage as the employee, capped at 8% of the participant’s balance. All employees are eligible to participate in this plan.
The unfunded liability represents Claro Brasil’s obligation for those participants that migrated from the DBP to the DCP. This liability is being paid over a term of 20 years as of January 1, 1999. Unpaid balances are adjusted monthly based on the yield of the asset portfolio at that date and is increased based on the General Price Index of Brazil plus 6 percentage points per year. At December 31, 2014, the balance of the DCP liability was Ps.215,811 (Ps.213,770, at December 31, 2013).
As of December 31, 2012, 2013 and 2014 the cost of labor were Ps.(1,713), Ps.2,233, and Ps.38,583 respectively.
d) Mexico (Teléfonos de México)
Pensions and seniority premiums
Telmex has an employee pension and seniority premium plan that covers most of its employees. Pensions and seniority premiums are determined based on the salary of employees in their final year of service, the number of years worked at Telmex and their age at retirement.
Telmex has established an irrevocable trust fund and makes annual contributions to that fund, which are considered deductible for purposes of income tax and employee profit sharing. The most important information related to labor obligations is as follows:
At December 31, 2012 2013 2014
Projected defined benefit obligation: Projected defined benefit obligation at beginning of year Ps. 234,225,230 Ps. 239,189,216 Ps. 250,944,184 Current service cost 5,050,926 4,538,825 4,376,926 Interest cost on projected benefit obligation 20,497,290 20,978,048 22,273,034 Actuarial (gain) loss ( 6,252,256) 2,967,200 808,732 Payments to employees ( 11,419,974) ( 11,034,105) ( 12,540,172) Payments from trust fund ( 2,912,000) ( 5,695,000) ( 5,200,000)Defined benefit obligation at end of year Ps. 239,189,216 Ps. 250,944,184 Ps. 260,662,704
At December 31, 2012 2013 2014
Changes in plan assets: Established fund at beginning of year Ps. 184,546,619 Ps. 196,734,883 Ps. 201,765,850 Expected return on plan assets 16,978,289 18,099,609 18,467,870 Actuarial loss on expected return on plan assets in other comprehensive income ( 1,878,025) ( 7,373,642) ( 3,746,454) Payments from trust fund ( 2,912,000) ( 5,695,000) ( 5,200,000)Established fund at end of year Ps. 196,734,883 Ps. 201,765,850 Ps. 211,287,266
Liability Ps. 42,454,333 Ps. 49,178,334 Ps. 49,375,438
The actual return on plan assets for the years ended December 31, 2012, 2013 and 2014 amounted to Ps. 15,100,264, Ps.10,725,967 and Ps.14,721,416 corresponding to the expected return and the actuarial variation respectively.
2012 2013 2014
Changes in other comprehensive income: Balance at the beginning of the year Ps. ( 69,596,308) Ps. ( 65,222,077) Ps. ( 75,562,919) Actuarial gain on expected return on plan assets ( 1,878,025) ( 7,373,642) ( 3,746,454) Actuarial effect of changes in assumptions 6,252,256 ( 2,967,200) ( 808,732)Balance at the end of the year Ps. ( 65,222,077) Ps. ( 75,562,919) Ps. ( 80,118,105)
In 2013, the net actuarial loss of Ps.10,340,842 is mainly comprised of an actuarial loss of Ps.7,373,642 due to the low performance of the plan assets, to the reduction in the value of the shares of the companies where the funds are managed, and in the value of the fixed yield instruments due to variances in the reference rates, and an actuarial loss of Ps.2,967,200 due to the fact that the number of retired employees differed from the estimated number at the beginning of the year, and due to the fact that the salary increases and the pensions of retired personnel were higher than those estimated at the beginning of the year.
83
In 2014, the net actuarial loss of Ps.4,555,186 is mainly comprised of an actuarial loss of Ps.3,746,454 due to the low performance of the plan assets, to the reduction in the value of the shares of the companies where the funds are managed, and in the value of the fixed yield instruments due to variances in the reference rates, and an actuarial loss of Ps.808,732 due to the fact that the number of retired employees differed from the estimated number at the beginning of the year, and due to the fact that the salary increases and the pensions of retired personnel were higher than those estimated at the beginning of the year.
Net period cost For the years ended 2012 2013 2014
Current service cost Ps. 5,050,926 Ps 4,538,825 Ps. 4,376,926Interest cost on projected benefit obligation 20,497,290 20,978,048 22,273,034Expected return on plan assets ( 16,978,289) ( 18,099,609) ( 18,467,870)Net period cost Ps. 8,569,927 Ps. 7,417,264 Ps. 8,182,090
The nominal discount rate of labor obligations used in the actuarial studies was 9.2% for all years presented. Salary increases were also estimated at 4.5% during each year. Mortality was estimated at 1.94% for both men and woman.
Below is a quantitative sensitivity analysis of the main assumptions as of December 31, 2014, and its impact in the net defined benefit obligations:
Discount rate - 100 basis points Ps . 286,691,852Discount rate + 100 basis points Ps. 235,747,974
Plan assets
The percentages invested in plan assets at December 31, 2013 and 2014 are as follows:
2013 2014
Debt instruments 46.50% 43.8%Equity instruments 53.50% 56.2% 100.00% 100.00%
As of December 31, 2014, the fair value of Telmex’s debt securities held by the plan assets was Ps.153,210 (Ps.611,672 at December 31, 2013). Also, the plan assets of Telmex include 29.6% and 30.7% of securities of the Company and other related parties at December 31, 2014 and 2013, respectively. The purchases and sales of these securities made by the plan were at market value.
In the case of Telcel and other Mexican subsidiaries, the net period cost of other benefits for the years ended December 31, 2012, 2013 and 2014 was Ps.86,870, Ps.185,554 and Ps.573,733, respectively. The balance of employee benefits of December 31, 2013 and 2014 was Ps.91,810 and Ps.560,192, respectively.
e) Europe
The liabilities recognized at December 31, 2014 are as follows:
At December 31, 2014
Long-term direct employee benefits Ps. 12,160,824Service awards 1,280,115Severance 2,164,997Pensions 121,293Other 11,075Total liabilities Ps. 15,738,304
Long-term direct employee benefits
Balance at Applications Balance at December 31, Business Effect of Increase of December 31, 2013 combination translation the year Payments Reversals 2014
Long-term direct employee benefits Ps. Ps. 11,802,035 Ps. 68,354 Ps. 1,994,823 Ps. ( 773,050) Ps. ( 931,338) Ps. 12,160,824
In 2008, a comprehensive restructuring program was initiated in Austria. The provision for restructuring includes future compensation for employees, who will no longer provide services for Telekom Austria but who cannot be laid off due to their status as civil servants. These employee contracts are onerous contracts under IAS 37, as the unavoidable cost related to the contractual obligation exceeds the future economic benefit. The restructuring program also includes social plans for employees whose employments will be terminated in a socially responsible way.
84
Furthermore, restructuring includes agreements from previous years concluded with the Austrian government relating to the voluntary transfer of civil servants with tenure, whose positions are eliminated due to technological progress, to employment with the government. Civil servants of the segment of Austria can voluntarily transfer to administrative employment with the government. After a period of six to twelve months of public service and subjects to a positive performance evaluation, the civil servants have the option to apply for a permanent transfer, in which case the right to return to Telekom Austria is forfeited. Telekom Austria bears the salary expense for these civil servants up to June 30, 2016. The civil servants are compensated for any shortfall in salary or pension payments.
Actuarial assumptions
The actuarial assumptions used to measure the obligations for service awards, severance payments and pensions are as follows:
Discount rate Rate of compensation increase-civil servants 2.0% Rate of compensation increase-civil servants 5.5% Rate of compensation increase-civil servants 3.1%s Rate of increase of pensions 4.5% Employee turnover rate* 1.6% Depending on years of service 0.0%-2.01%
Life expectancy in Austria is based on “AVÖ 2008-P – Rechnungsgrundlagen für die Pensionsversicherung – Pagler & Pagler“.
Service awards
Civil servants and certain employees (together “employees”) are eligible to receive service awards. Under these plans, eligible employees receive a cash bonus of two months’ salary after 25 years of service and four months’ salary after 40 years of service. Employees with at least 35 years of service when retiring (at the age of 65) or who are retiring based on a specific legal regulation are eligible to receive four monthly salaries. The compensation is accrued as earned over the period of service, taking into account the employee turnover rate.
The following table provides the components and a reconciliation of the changes in the provisions for service awards:
At December 31, 2014 (1)
Balance at December 31, 2013 Ps. 1,258,018Current service cost 41,452Interest cost on projected benefit obligation 42,360Actuarial gain/loss based on experience adjustment 11,307Actuarial gain/loss from changes in demographic Assumptions ( 89)Actuarial gain/loss from changes in financial Assumptions 132,529Net periodic cost Ps. 227,559Benefits paid ( 105,767)Foreign currency adjustments ( 18)Other ( 105,785)Balance at the end of the year Ps. 1,379,792Less short-term portion ( 99,677)Non-current obligation Ps. 1,280,115
(1) While the Company consolidated Telekom Austria beginning on July 1, 2014 this roll forward has been prepared for a 12 months period consistent with Telekom Austria’s published results.
Of the defined benefit obligations for service awards, less than 1% relate to other subsidiaries different to Austria as of 31 December 2013.
As of December 31, 2014, the weighted average duration of the obligation for service awards amounted to 7.3 years.
Severance
Employees starting to work for Telekom Austria in Austria on or after January 1, 2003 are covered by a defined contribution plan. Telekom Austria paid Ps.34,142 (1.53% of the salary) into this defined contribution plan (BAWAG Allianz Mitarbeitervorsorgekasse AG) in 2014.
Severance benefit obligations for employees hired before January 1, 2003 are covered by defined benefit plans. Upon termination by Telekom Austria or retirement, eligible employees receive severance payments equal to a multiple of their monthly compensation which comprises fixed compensation plus variable elements such as overtime or bonuses. Maximum severance is equal to a multiple of twelve times the eligible monthly compensation. Up to three months of benefits are paid upon termination, with any benefit in excess of that amount being paid in monthly instalments over a period not exceeding ten months. In case of death, the heirs of eligible employees receive 50% of the severance benefits.
85
The following table provides a detailed reconciliation of the changes in severance benefit obligations:
At December 31, 2014 (1)
Balance at the December 31, 2013 Ps. 1,676,776Current service cost 86,607Interest cost on projected benefit obligation 57,691Net periodic cost Ps. 144,298Actuarial gain/loss based on experience adjustment 2,297Actuarial gain/loss from changes in demographic Assumptions ( 32,175)Actuarial gain/loss from changes in financial Assumptions 475,202Recognized in Other comprehensive income Ps. 445,324Benefits paid ( 74,339)Foreign currency adjustments ( 300)Other ( 74,639)Balance at the end of the year Ps. 2,191,759Less short-term portion ( 26,762)Non-current obligation Ps. 2,164,997
(1) While the Company consolidated Telekom Austria beginning on July 1, 2014 this roll forward has been prepared for a 12 months period consistent with Telekom Austria’s published results.
Approximately 3% of the defined benefit obligations for severance relate to foreign subsidiaries as of December 31, 2014.
As of December 31, 2014, the weighted average duration of the severance benefit obligations was 16.7.
Pensions
Defined contribution pension plans
In Austria, pension benefits generally are provided by the social security system for employees and by the government for civil servants. Telekom Austria is required to assist in funding the Austrian government’s pension and health care obligations to Telekom Austria current and former civil servants and their surviving dependents. In 2014, the rate of contribution for active civil servants amounted to a maximum of 28.3% depending on the age of the civil servant. 15.75% are borne by Telekom Austria and the remaining portion is contributed by the civil servants. Contributions to the government, net of the share contributed by civil servants, amounted to Ps. 375,831 for the period from July 1 to December 31, 2014.
Additionally, Telekom Austria sponsors a defined contribution plan for employees of some of its Austrian subsidiaries. Telekom Austria contributions to this plan are based on a percentage of the compensation not exceeding 5%. The annual expenses for this plan amounted to Ps.115,442 for the period from July 1 to December 31, 2014.
Defined benefit pension plans
Telekom Austria provides defined benefits for certain former employees in Austria. All such employees are retired and were employed prior to January 1, 1975. This unfunded plan provides benefits based on a percentage of salary and years employed, not exceeding 80% of the salary before retirement, and taking into consideration the pension provided by the social security system.
f) In the case of Ecuador, the net period cost of other benefits for the years ended December 31, 2012, 2013 and 2014 was Ps. 2,602, Ps.18,650 and Ps.26,759 respectively. The balance of employee benefits at December 31, 2013 and 2014 was Ps.91,967 and Ps.125,265, respectively.
g) For the rest of the countries where the Company operates and that do not have defined benefit plans or defined contribution plans, the Company makes contributions to the respective governmental social security agencies, which are recognized in results of operations as they are incurred.
18 Shareholders’ Equity
Shares
a) At December 31, 2014 and 2013, the Company’s capital stock was represented by 68,150,000,000 (23,384,632,660 Series “AA” shares, 648,994,284 Series A shares and 44,116,373,056 Series “L” shares) and 70,475,000,000 shares (23,424,632,660 Series “AA” shares, 680,805,804 Series A shares and 46,369,561,536 Series L), respectively (these figures reflects (i) the stock split effected in June 2011; (ii) the merger with AMTEL in 2006; (iii) the placement of 8,438,193,725 Series “L” treasury shares resulting from the tender offers for Carso Global Telecom, S.A.B. de C.V. and Telmex Internacional, S.A.B. de C.V., which were completed on June 16, 2010; and (iv) the exchanges (conversiones) of Series “A” shares for Series “L” shares made by third parties through S.D. Indeval Institución para el Deposito de Valores, S.A. de C.V.).
b) The capital stock of the Company consists of a minimum fixed portion of Ps.397,873 (nominal amount), represented by 95,489,724,196 shares (including treasury shares available for placement in accordance with the provisions of the Mexican Securities Law), of which (i) 23,424,632,660 are common Series “AA” shares; (ii) 776,818,130 are common Series “A” shares; and (iii) 71,288,273,406 are Series “L” shares, all of them fully subscribed and paid.

86
c) At December 31, 2014 and 2013, the Company’s treasury shares available for placement in accordance with the provisions of the Mexican Securities Law, were represented by 27,339,724,196 shares (27,338,625,508 Series “L” shares and 1,098,688 Series A shares), 25,014,724,196 shares (25,007,472,235 Series “L” shares and 7,251,961 Series A shares), respectively (these figures reflects (i) the stock split effected in June 2011; and (ii) the placement of 8,438,193,725 Series “L” treasury shares resulting from the tender offers for Carso Global Telecom, S.A.B. de C.V. and Telmex Internacional, S.A.B. de C.V., which were completed on June 16, 2010).
d) The holders of Series “AA” and Series “A” shares are entitled to full voting rights. The holders of Series “L” shares may only vote in certain circumstances, and they are only entitled to appoint two members of the Board of Directors and their respective alternates. The matters in which the shareholders who are entitled to vote are the following: extension of the term of the Company, early dissolution of the Company, change of corporate purpose of the Company, change of nationality of the Company, transformation of the Company, a merger with another company, as well as the cancellation of the registration of the shares issued by the Company in the National Securities Registry (Registro Nacional de Valores), and any other foreign stock exchanges where they may be registered, except for quotation systems or other markets not organized as stock exchanges. Within their respective series, all shares confer the same rights to their holders. The Company’s bylaws contain restrictions and limitations related to the subscription and acquisition of Series “AA” shares by non-Mexican investors.
e) In accordance with the bylaws of the Company, Series “AA” shares must at all times represent no less than 20% and no more than 51% of the Company’s capital stock, and they also must represent at all times no less than 51% of the common shares (entitled to full voting rights, represented by Series “AA” and Series “A” shares), representing said capital stock.
Series “AA” shares may only be subscribed to or acquired by Mexican investors, Mexican corporations and/or trusts expressly empowered for such purposes in accordance with the applicable legislation in force. Series “A” shares, which may be freely subscribed, may not represent more than 19.6% of capital stock and may not exceed 49% of the common shares representing such capital. Common shares (entitled to full voting rights, represented by Series “AA” and Series “A” shares), may not represent more than 51% of the Company’s capital stock.
Lastly, the combined number of Series “L” shares, which have limited voting rights and may be freely subscribed, and Series A shares may not exceed 80% of the Company’s capital stock. For purposes of determining these restrictions, the percentages mentioned above refer only to the number of Company shares outstanding.
Dividends
f) On April 22, 2013, the Company’s shareholders approved, among others resolution, the (i) payment of a cash dividend of $0.22 pesos per share to each of the shares of its capital stock series “AA”, “A” and “L”, payable in two equal installments of $0.11 pesos; and (ii) increase the amount of funds available for the acquisition of the Company’s own shares by Ps.40 billion pursuant to Article 56 of the Mexican Securities Market Law.
g) On April 28, 2014, the Company’s shareholders approved, among others resolution, the
i) payment of a cash dividend of $0.24 pesos per share to each of the shares of its capital stock series “AA”, “A” and “L”, payable in two equal installments of $0.12 pesos; and (ii) increase the amount of funds available for the acquisition of the Company’s own shares by Ps.30 billion pursuant to Article 56 of the Mexican Securities Market Law
Retained earnings and other reserves distributed as dividends and the effects derived from capital reductions, are subject to income tax at the rate at the date of distribution, except for the restated stockholder contributions or distributions made come from the net taxed profit account (Cuenta de Utilidad Fiscal Neta or CUFIN).
The dividends paid in excess of the account are subject to income tax on a grossed-current base rate. Since 2003, this tax may be credited against income tax for the year in which the dividends are paid and the following two years against the income tax and estimated payments. The payment of dividends described above comes from the balance of the Company’s CUFIN.
Legal Reserve
According to the Mexican General Mercantile Corporation Law, companies must appropriate from the net profit of each year, at least 5% to increase the legal reserve until it reaches 20% of capital stock at par value. This reserve may not be distributed to stockholders during the existence of the Company. At December 31, 2013 and 2014, the legal reserve amounted to Ps.358,440.
Restrictions on Certain Transactions
The Company’s bylaws provide that any transfer of more than 10% of the combined A Shares and AA Shares, effected in one or more transactions by any person or group of persons acting in concert, requires prior approval by our Board of Directors. If the Board of Directors denies such approval, however, Mexican law and the Company bylaws require it to designate an alternate transferee, who must pay market price for the shares as quoted on the Mexican Stock Exchange.
Payment of Dividends
Dividends, either in cash or in kind, paid with respect to the L Shares, A Shares, L Share ADSs or A Share ADSs will generally be subject to a 10% Mexican withholding tax (provided that no Mexican withholding tax will apply to distributions of net taxable profits generated before 2014). Nonresident holders could be subject to a lower tax rate, to the extent that they eligible for benefits under an income tax treaty to which Mexico is a party.
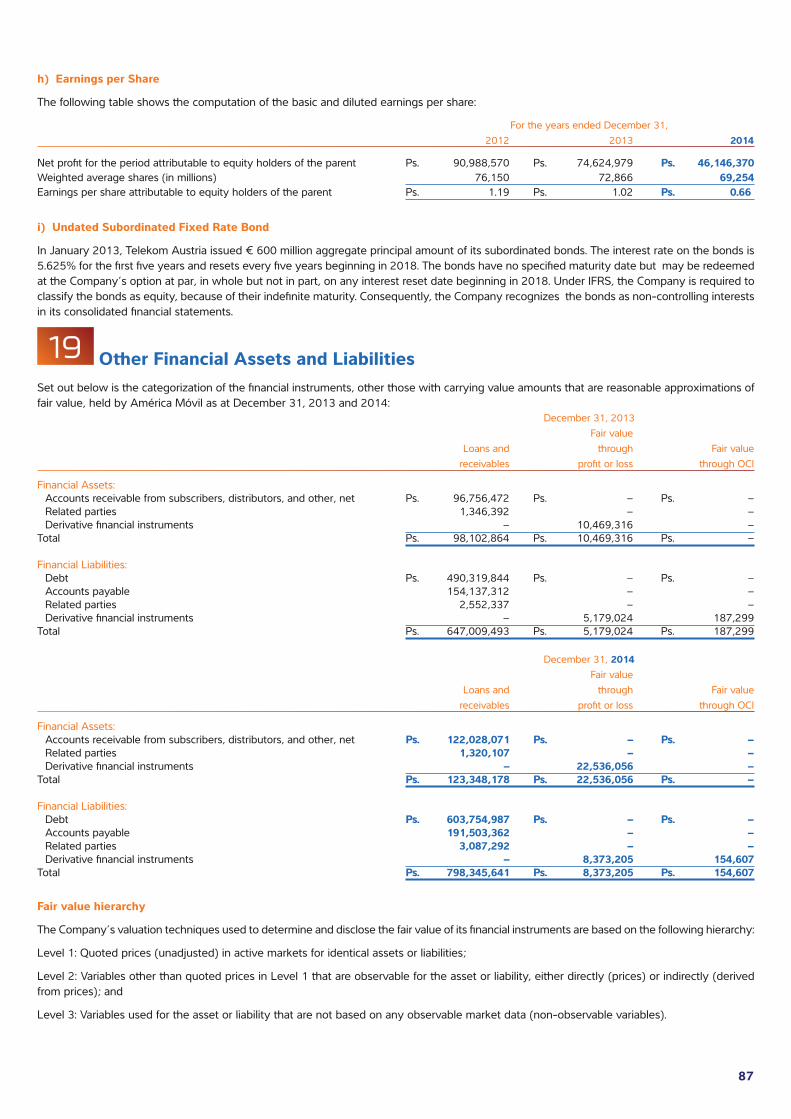
87
h) Earnings per Share
The following table shows the computation of the basic and diluted earnings per share:
For the years ended December 31, 2012 2013 2014
Net profit for the period attributable to equity holders of the parent Ps. 90,988,570 Ps. 74,624,979 Ps. 46,146,370Weighted average shares (in millions) 76,150 72,866 69,254Earnings per share attributable to equity holders of the parent Ps. 1.19 Ps. 1.02 Ps. 0.66
i) Undated Subordinated Fixed Rate Bond
In January 2013, Telekom Austria issued € 600 million aggregate principal amount of its subordinated bonds. The interest rate on the bonds is 5.625% for the first five years and resets every five years beginning in 2018. The bonds have no specified maturity date but may be redeemed at the Company’s option at par, in whole but not in part, on any interest reset date beginning in 2018. Under IFRS, the Company is required to classify the bonds as equity, because of their indefinite maturity. Consequently, the Company recognizes the bonds as non-controlling interests in its consolidated financial statements.
19 Other Financial Assets and LiabilitiesSet out below is the categorization of the financial instruments, other those with carrying value amounts that are reasonable approximations of fair value, held by América Móvil as at December 31, 2013 and 2014: December 31, 2013 Fair value Loans and through Fair value receivables profit or loss through OCI
Financial Assets: Accounts receivable from subscribers, distributors, and other, net Ps. 96,756,472 Ps. – Ps. – Related parties 1,346,392 – – Derivative financial instruments – 10,469,316 –Total Ps. 98,102,864 Ps. 10,469,316 Ps. –
Financial Liabilities: Debt Ps. 490,319,844 Ps. – Ps. – Accounts payable 154,137,312 – – Related parties 2,552,337 – – Derivative financial instruments – 5,179,024 187,299Total Ps. 647,009,493 Ps. 5,179,024 Ps. 187,299
December 31, 2014 Fair value Loans and through Fair value receivables profit or loss through OCI
Financial Assets: Accounts receivable from subscribers, distributors, and other, net Ps. 122,028,071 Ps. – Ps. – Related parties 1,320,107 – – Derivative financial instruments – 22,536,056 –Total Ps. 123,348,178 Ps. 22,536,056 Ps. –
Financial Liabilities: Debt Ps. 603,754,987 Ps. – Ps. – Accounts payable 191,503,362 – – Related parties 3,087,292 – – Derivative financial instruments – 8,373,205 154,607Total Ps. 798,345,641 Ps. 8,373,205 Ps. 154,607
Fair value hierarchy
The Company’s valuation techniques used to determine and disclose the fair value of its financial instruments are based on the following hierarchy:
Level 1: Quoted prices (unadjusted) in active markets for identical assets or liabilities;
Level 2: Variables other than quoted prices in Level 1 that are observable for the asset or liability, either directly (prices) or indirectly (derived from prices); and
Level 3: Variables used for the asset or liability that are not based on any observable market data (non-observable variables).

88
The fair value for the financial assets (other those with carrying value amounts that are reasonable approximations of fair value) and financial liabilities shown in the consolidated statement of financial position at December 31, 2013 and 2014 is as follows:
Measurement of fair value at December 31, 2013 Level 1 Level 2 Level 3 Total
Assets: Derivatives financial instruments Ps. – Ps. 10,469,316 Ps. – Ps. 10,469,316 Pension plan assets 230,393,171 – 230,393,171Total Ps. 230,393,171 Ps. 10,469,316 Ps. – Ps. 240,862,487
Liabilities: Debt Ps. 319,838,222 Ps. 200,011,820 Ps. – Ps. 519,850,042 Derivatives financial instruments 5,366,323 5,366,323Total Ps. 319,838,222 Ps. 205,378,143 Ps. – Ps. 525,216,365
Measurement of fair value at December 31, 2014 Level 1 Level 2 Level 3 Total
Assets: Derivatives financial instruments Ps. Ps. 22,536,056 Ps. – Ps. 22,536,056 Pension plan assets 242,360,329 242,360,329Total Ps. 242,360,329 Ps. 22,536,056 Ps. – Ps. 264,896,385
Liabilities: Debt Ps. 411,497,065 Ps. 229,028,589 Ps. – Ps. 640,525,654
Derivatives financial instruments 8,527,812 – 8,527,812Total Ps. 411,497,065 Ps. 237,556,401 Ps. – Ps. 649,053,466
Fair value of derivatives financial instruments are valued using valuation techniques with market observable inputs. To determine its Level 2 fair value, the Company applies valuation techniques including forward pricing and swaps models, using present value calculations. The models incorporate various inputs including credit quality of counterparties, foreign exchange spot and forward rates and interest rate curves. Fair value of debt Level 2 has been determined using a model based on present value calculation incorporating credit quality of AMX.
For the years ended December 31, 2012, 2013 and 2014, no transfers were made between Level 1 and Level 2 fair value measurement hierarchies.
20 Commitments and Contingencies
a) Leases
At December 31, 2013 and 2014, the Company has entered into several lease agreements with related parties and third parties for the buildings where its offices are located (as a lessee), as well as with the owners of premises where the Company has installed radio bases. The lease agreements generally have terms from one to fourteen years.
An analysis of the minimum rental payments for the next five years is shown below. In some cases, rental amounts are increased each year based on the National Consumer Price Index.
The Company has the following non-cancelable commitments under finance leases:
Year ended December 31 2013 2014
2014 Ps. 278,957 Ps. – 2015 246,821 266,026 2016 140,425 148,350 2017 30,552 31,319 2018 30,552 31,319 2019 59,814 31,319 2020 and thereafter – 29,994Total 787,121 538,327Less: amounts representing finance charges ( 96,479) ( 67,132)Present value of net minimum lease payments 690,642 471,195Less current portion 246,598 244,239Long-term obligations Ps. 444,044 Ps. 226,956
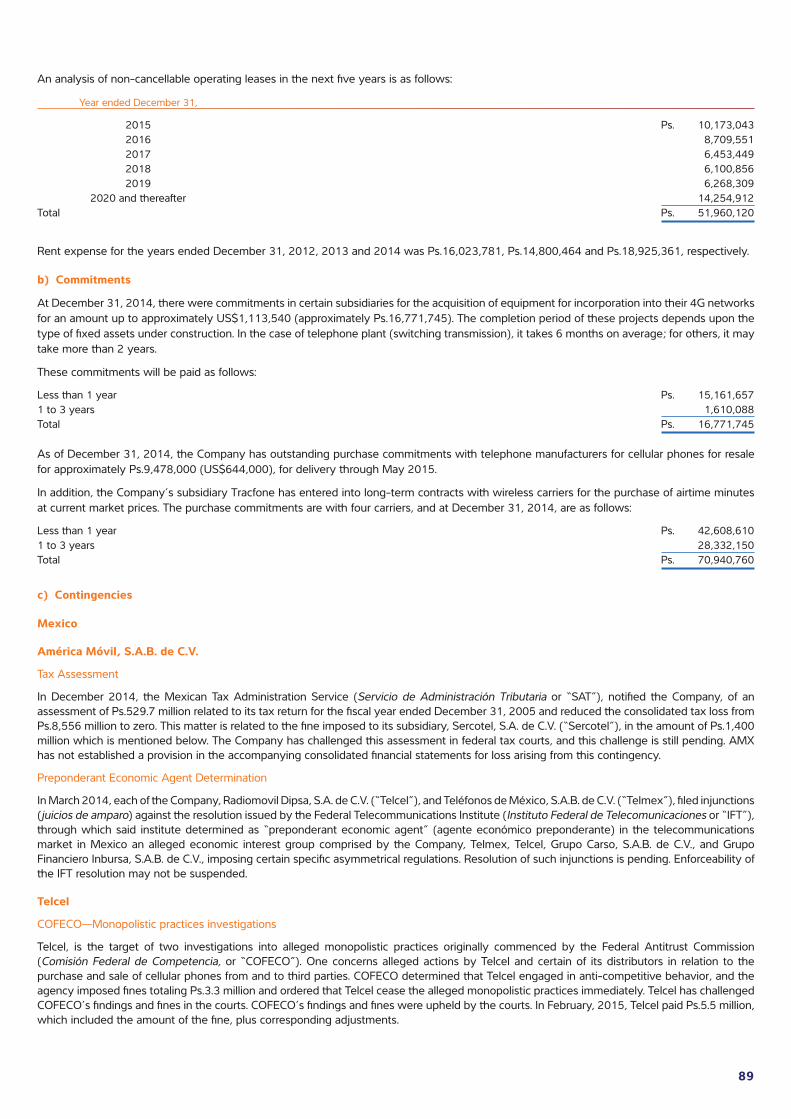
89
An analysis of non-cancellable operating leases in the next five years is as follows:
Year ended December 31,
2015 Ps. 10,173,043 2016 8,709,551 2017 6,453,449 2018 6,100,856 2019 6,268,309 2020 and thereafter 14,254,912Total Ps. 51,960,120
Rent expense for the years ended December 31, 2012, 2013 and 2014 was Ps.16,023,781, Ps.14,800,464 and Ps.18,925,361, respectively.
b) Commitments
At December 31, 2014, there were commitments in certain subsidiaries for the acquisition of equipment for incorporation into their 4G networks for an amount up to approximately US$1,113,540 (approximately Ps.16,771,745). The completion period of these projects depends upon the type of fixed assets under construction. In the case of telephone plant (switching transmission), it takes 6 months on average; for others, it may take more than 2 years.
These commitments will be paid as follows:
Less than 1 year Ps. 15,161,6571 to 3 years 1,610,088Total Ps. 16,771,745
As of December 31, 2014, the Company has outstanding purchase commitments with telephone manufacturers for cellular phones for resale for approximately Ps.9,478,000 (US$644,000), for delivery through May 2015.
In addition, the Company’s subsidiary Tracfone has entered into long-term contracts with wireless carriers for the purchase of airtime minutes at current market prices. The purchase commitments are with four carriers, and at December 31, 2014, are as follows:
Less than 1 year Ps. 42,608,6101 to 3 years 28,332,150Total Ps. 70,940,760
c) Contingencies
Mexico
América Móvil, S.A.B. de C.V.
Tax Assessment
In December 2014, the Mexican Tax Administration Service (Servicio de Administración Tributaria or “SAT”), notified the Company, of an assessment of Ps.529.7 million related to its tax return for the fiscal year ended December 31, 2005 and reduced the consolidated tax loss from Ps.8,556 million to zero. This matter is related to the fine imposed to its subsidiary, Sercotel, S.A. de C.V. (“Sercotel”), in the amount of Ps.1,400 million which is mentioned below. The Company has challenged this assessment in federal tax courts, and this challenge is still pending. AMX has not established a provision in the accompanying consolidated financial statements for loss arising from this contingency.
Preponderant Economic Agent Determination
In March 2014, each of the Company, Radiomovil Dipsa, S.A. de C.V. (“Telcel”), and Teléfonos de México, S.A.B. de C.V. (“Telmex”), filed injunctions (juicios de amparo) against the resolution issued by the Federal Telecommunications Institute (Instituto Federal de Telecomunicaciones or “IFT”), through which said institute determined as “preponderant economic agent” (agente económico preponderante) in the telecommunications market in Mexico an alleged economic interest group comprised by the Company, Telmex, Telcel, Grupo Carso, S.A.B. de C.V., and Grupo Financiero Inbursa, S.A.B. de C.V., imposing certain specific asymmetrical regulations. Resolution of such injunctions is pending. Enforceability of the IFT resolution may not be suspended.
Telcel
COFECO—Monopolistic practices investigations
Telcel, is the target of two investigations into alleged monopolistic practices originally commenced by the Federal Antitrust Commission (Comisión Federal de Competencia, or “COFECO”). One concerns alleged actions by Telcel and certain of its distributors in relation to the purchase and sale of cellular phones from and to third parties. COFECO determined that Telcel engaged in anti-competitive behavior, and the agency imposed fines totaling Ps.3.3 million and ordered that Telcel cease the alleged monopolistic practices immediately. Telcel has challenged COFECO’s findings and fines in the courts. COFECO’s findings and fines were upheld by the courts. In February, 2015, Telcel paid Ps.5.5 million, which included the amount of the fine, plus corresponding adjustments.

90
The second investigation concerns alleged monopolistic practices in the mobile termination (interconnection) market. In April 2011, COFECO imposed a fine of Ps.11,989 million against Telcel for alleged monopolistic practices that according to COFECO also constituted a repeat offense. In May 2011, Telcel filed an administrative motion for reconsideration (recurso de reconsideración) with COFECO and proposed a series of undertakings related to the alleged monopolistic practices. In May 2012, COFECO revoked the fine. As a condition to the revocation of the fine, Telcel agreed to comply with the undertakings that it proposed to COFECO. As a result of a constitutional amendment enacted in 2013, the IFT, is responsible for monitoring Telcel’s compliance with respect to such undertakings. Six mobile operators challenged the revocation of the fine through an appeal for relief (juicio de amparo). Four of such proceedings have now been resolved on terms favorable to Telcel and the remaining two are pending. One of the operators whose appeal for relief (juicio de amparo) is pending, also filed a judicial proceeding claiming alleged damages arising from the revocation of the fine and the performance of the undertakings proposed by Telcel.
The IFT is empowered to oversee compliance by Telcel of the agreed upon undertakings. In the event the IFT considers Telcel has breached any such undertakings, the IFT may impose a fine of up to 8% of Telcel’s annual revenues. Telcel believes it has complied with all of these undertakings and expects the IFT to confirm such compliance.
Mobile termination rates
Mobile termination rates for the years 2005 through 2010 between Telcel and affiliated operators Axtel and Avantel were the subject of a number of legal proceedings. The Supreme Court of Justice (Suprema Corte de Justicia de la Nación) addressed these disputes in a series of rulings during 2012 and early 2013, which generally (i) determined that the Mexican Ministry of Communications and Transportation (Secretaría de Comunicaciones y Transportes or “SCT”), does not have authority to resolve disputes over mobile termination rates; (ii) confirmed that the Federal Telecommunications Commission (Comisión Federal de Telecomunicaciones, or “COFETEL”), has authority to determine mobile termination rates based on its own cost models; (iii) for certain periods (2005-2007), confirmed the rates established by COFETEL; and (iv) for other periods (2008-2010), required COFETEL to reissue resolutions determining mobile termination rates between the parties.
On March 18, 2015, a settlement agreement has been entered into with Axtel and Avantel. Pursuant to such settlement agreement, certain disputes regarding termination rates and related interconnection matters have been finally settled between Axtel, on the one hand, and Telcel, Teléfonos de México, S.A.B. de C.V. (“Telmex”), and Teléfonos del Noroeste, S.A. de C.V. (“Telnor”), on the other.
As part of the settlement agreement, Axtel and Telcel executed interconnection services agreements. With the execution of these agreements all disputes regarding mobile termination rates and related interconnection proceedings that started in 2005 have been finally settled between the parties. In addition, disputed and outstanding amounts related to mobile termination services for the period from 2005 to 2014 have been paid.
In consideration for the execution of the settlement agreement; the execution of interconnection services agreements with Telcel for the period from 2005 to 2015; the settlement and termination of certain existing disputes and claims with Telcel, Telmex and Telnor; and the assignment to América Móvil of certain litigation rights arising from administrative and judicial proceedings existing between the parties, América Móvil paid Axtel Ps.$950 million.
Several mobile operators began proceedings with COFETEL (desacuerdos de interconexión), to establish applicable mobile termination rates and other interconnection conditions for the years 2011 to 2015. COFETEL determined rates for 2011. IFT determined rates for 2012, but has yet to determine rates for 2013 in connection with the proceedings (desacuerdos de interconexión) in which Telcel is a party. In proceedings (desacuerdos de interconexión) in which other operators are parties thereof, the IFT has determined an applicable mobile termination of Ps.0.3144 for 2013.
On March 26, 2014, the IFT issued a resolution imposing on Telcel a specified asymmetric interconnection rate it must charge to all operators for traffic to Telcel’s network for the period commencing on April 6 and ending on December 31, 2014. Telcel has filed an appeal for relief (juicio de amparo), against the IFT’s resolution.
As a result of the entering into force of the Federal Law on Telecommunications and Broadcasting (Ley Federal de Telecomunicaciones y Radiodifusión), the preponderant economic agent in the telecommunication sector (comprised, among others, by the Company, Telcel and Telmex), is precluded from charging other operators for traffic terminating in its network. Although Telcel has challenged such gratuitous asymmetric regime in courts, the enforceability of such regime is not subject of being suspended.
Telcel has begun proceedings in order to determine the mobile termination rates it must pay to other operators for the years 2015 and 2016. In accordance with applicable legislation, the parties have 60 days to agree upon such rates. Upon expiration of such term, either party may begin proceedings (desacuerdos de interconexión), with IFT to establish applicable mobile termination rates.
Any potential disparity between the mobile termination rates made available by Telcel to other operators and the rates to be established by the IFT may give rise to contractual claims among Telcel and other operators for reimbursement or payment, as the case may be, of amounts paid or owed between Telcel and such operators.
Likewise, the Company expects that these mobile termination rates will continue to be the subject of litigation and administrative proceedings. The Company cannot predict when or how these matters will be resolved. The competitive and financial effects of any resolution could be complex and difficult to predict.
As of December 31, 2014, the Company has established provisions in the accompanying financial statements for the losses AMX considered probable and estimable at such date for approximately Ps.2, 500 million.
Short Message Services (SMS)—Rates
On March 26, 2014, the IFT issued a resolution imposing on Telcel a specified SMS termination rate it must charge to all mobile operators for the period commencing on April 6 and ending on December 31, 2014. The rate was reduced from Ps.0.1537 to Ps.0.0391. Telcel has filed an appeal for relief (juicio de amparo), against the IFT’s resolution.

91
As a result of the entering into force of the Federal Law on Telecommunications and Broadcasting, the preponderant economic agent in the telecommunication sector (comprised, among others, by the Company, Telcel and Telmex), is precluded from charging other operators for SMS terminating in its network. Although Telcel has challenged such gratuitous asymmetric regime in courts, the enforceability of such regime is not subject of being suspended.
Telcel has begun proceedings in order to determine the mobile termination rates it must pay to other operators for SMS. In accordance with applicable legislation, the parties have 60 days to agree upon such rates. Upon expiration of such term, either party may begin proceedings (desacuerdos de interconexión) with IFT to establish applicable mobile termination rates.
Short Message Services (SMS)—Royalties
The SAT, notified Telcel of tax assessments totaling Ps.320 million alleging nonpayment of royalties for revenues generated by short message services during 2004 and 2005. The SAT is alleging that Telcel owes such amounts because short message services constitute concessioned services. Telcel has challenged the assessments on the grounds that short message services are value-added services that are not concessioned services. In other proceedings, COFETEL and more recently its successor, the IFT, have ruled that short text messages are subject to the interconnection regulatory regime and that such services do not constitute value-added services and are therefore concessioned services. Telcel has established a provision in the accompanying financial statements for the loss arising from these contingencies that the Company considers probable.
Class Actions
The Federal Consumer Bureau (Procuraduría Federal del Consumidor, or “Profeco”), filed an action similar to a class action in Mexican courts on behalf of customers who filed complaints before it, alleging deficiencies in the quality of Telcel’s network in 2010 and breach of customer agreements. If the action is resolved in favor of Profeco, Telcel’s customers would be entitled to compensation for damages.
Beginning in 2012, Mexican Law provides for class actions seeking compensation. These class actions may arise from antitrust, consumer, data and privacy protection issues, as well as administrative, criminal and environmental violations, and may be filed by the competent authorities or the affected groups.
Five class actions have been initiated against Telcel (i) three are related to quality of service and were filed by consumers; (ii) one also filed by consumers is related to quality of service, but in addition compares wireless voice, data and broadband international rates claiming that rates offered by Telcel are higher than international comparable rates; and (iii) one was filed by Profeco and relates to a network technical malfunction that occurred in January 2013.
The Company currently does not have enough information to determine whether these class actions could have an adverse effect on our business and results of operations if they are resolved against us. Consequently, Telcel has not established a provision in the accompanying financial statements for loss arising from these contingencies.
Carso Global Telecom
In November 2010, the SAT notified Carso Global Telecom, S.A. de C.V. (“CGT”), of an assessment of Ps.3,392 million related to the change in the scope of fiscal consolidation in 2005. SAT alleges that this change generated a reduction in the participation of CGT in its subsidiaries, resulting in increased income taxes. CGT has challenged this assessment in federal tax courts, and this challenge is still pending. AMX has not established a provision in the accompanying financial statements for loss arising from this contingency.
Sercotel
In March 2012, SAT notified Sercotel and the Company of a fine of approximately Ps.1,400 million because of the SAT’s objection to the allegedly improper tax implications of the transfer of certain accounts receivable from one of the Company’s subsidiaries to Sercotel. AMX challenged the fine by filing an administrative appeal with the tax authority which is still pending. The Company also expects SAT will issue tax assessments of Ps.2,750 million relating to the same matter.
The Company has not established a provision in the accompanying financial statements for loss arising from these contingencies.
Telmex
COFECO/IFT—Monopolistic practices investigations
Telmex and Telnor, are the target of three investigations into alleged monopolistic practices originally commenced by COFECO. In the first two investigations, it was determined that Telmex and Telnor engaged in monopolistic practices in the fixed-network interconnection services market. Telmex and Telnor have filed legal proceedings (including an appeal for relief (juicio de amparo), against these rulings and their cases are pending resolution. In the third investigation, in February 2013 COFECO determined that Telmex and Telnor engaged in monopolistic practices in the wholesale market for dedicated-link leasing (local and domestic long-distance). Telmex and Telnor challenged that resolution and their cases are still pending.
AMX cannot predict when or how these investigations will be resolved. The competitive and financial effects of any final findings by the IFT could be complex and difficult to predict. They may include monetary fines or additional regulations or restrictions that may limit our flexibility and our ability to adopt competitive market policies, any of which could materially reduce Telmex and Telnor’s revenues in future periods.
AMX has not established a provision in the accompanying financial statements for loss arising from these contingencies.
92
Proceedings Concerning Telmex’s Relationship with Dish MéxicoAs previously disclosed, in November 2008, Telmex entered into several agreements with Dish México, S. de R.L. de C.V. (“Dish México”), and its affiliates, which operate a DTH Pay TV system in Mexico, pursuant to which Telmex is currently providing billing and collection services, among others. Subject to obtaining specific government authorizations, Telmex could invest directly in a joint venture with Dish México.Telmex has been subject to investigations in the past related to these arrangements. Recently, we have received new inquiries from governmental authorities on this subject, including inquiries from the Mexican National Banking and Securities Commission (Comisión Nacional Bancaria y de Valores or “CNBV”), in the case of América Móvil, and from both the CNBV and the IFT, in the case of Telmex.In January 2015, Telmex was notified of a resolution issued by the IFT imposing a fine for an amount of Ps.14.4 million on the grounds that an alleged merger (concentración) between Telmex and Dish was not notified in November 2008. Telmex has filed an appeal for relief (juicio de amparo) against this resolution and the case is still pending. The inquiry received from the CNBV is pending and AMX cannot predict the outcome of such inquiryNotwithstanding the above, AMX is confident that our actions in connection with our relationship with this customer have been appropriate in all respects, because the arrangements were limited to providing services, providing financial support (in the form of leasing equipment and committing to locate fallback financing) and agreeing to purchase and sale options that could result in Telmex investing in the customer if specified regulatory conditions were met, including the approval from the relevant competent authorities. The Company does not believe these arrangements have at any time been material to our results, our financial condition or our compliance with our regulatory obligations.However, the 2013 constitutional amendments prohibit a preponderant economic agent from obtaining direct or indirect benefit from the free of charge mandatory “must offer, must carry” rules for cable television providers. In March 2014, the IFT determined that Telmex is part of an economic group that is a preponderant economic agent, and consequently Telmex may not benefit from these rules. We will ensure that Telmex does not benefit from any application of the “must offer, must carry” rules.AMX has not established a provision in the accompanying consolidated financial statements for loss arising from these contingencies.
BrazilIn August 2014, the Brazilian National Telecommunications Agency (Agência Nacional de Telecomunicações, or “Anatel”) approved the Company’s proposal for a corporate reorganization of certain of its subsidiaries in Brazil, aiming, among other purposes, to simplify their corporate structure and to reduce its operational costs. As result of this reorganization effective in December 2014, Empresa Brasileira de Telecomunicações S.A. (“Embratel”), Embratel Participações S.A. (“Embrapar”) and Net Serviços Comunicação, S.A. (“Net Serviços”) merged into Claro S.A. (“Claro Brasil”). Claro Brasil is the legal successor of Embrapar, Embratel and Net Serviços, but for reference purposes, this note will indicate the entity involved in each matter prior to the merger.
Tax Matters
ICMSThe Brazilian State Revenue Services have issued multiple tax assessments against Claro Brasil and Americel S.A. (“Americel”), alleging that they improperly claimed certain tax credits under the state value added tax (Imposto sobre Operações relativas à Circulação de Mercadorias e sobre Prestações de Serviços de Transporte Interestadual e Intermunicipal e de Comunicação, or “ICMS”) regime in each Brazilian state. The Company is contesting these tax assessments in multiple separate proceedings, first at the administrative level and then in thejudicial courts, and these proceedings are at various stages. The Company has received rulings in some of these cases, including some that are unfavorable, which the Company has appealed. As of December 31, 2014 The total amount of the tax assessments is approximately Ps.17,820 million (approximately R$3,216 million), including fines and interest, as of December 31, 2014. The Company has established a provision of Ps.637 million (approximately R$115 million), in the accompanying consolidated financial statements for the losses arising from these contingencies that the Company considers probable.Embratel, Primesys Soluções Empresariais S.A. (“Primesys”), Embratel TVSAT Telecomunicações S.A. (“TV SAT”) and Telmex Do Brasil Ltda. (“TdB”) received assessments in the amount of Ps.8,184 million (approximately R$1,477 million), from the tax authorities related to nonpayment of ICMS and alleged ICMS tax credits that were incorrectly taken. The Company is contesting these tax assessments in multiple separate proceedings at the administrative level and in the judicial courts. These proceedings are in different stages, and the Company cannot predict the timing of a final outcome. The Company has established a provision of Ps.272 million (approximately R$49 million) in the accompanying consolidated financial statements for the losses arising from these contingencies that the Company considers probable.Star One S.A. (“Star One”), has received tax assessments in the amount of Ps.14,118 million (approximately R$2,548 million), mainly based on the allegation that the provision of satellite capacity is subject to ICMS tax. The Company is contesting these tax assessments in multiple separate proceedings and has obtained two appealable favorable judicial decisions in two proceedings by second degree Brazilian Courts. A resolution is pending for the majority of the proceedings. The Company has not established a provision in the accompanying consolidated financial statements to cover the losses arising from this contingency.In 2011 and 2013, Net Serviços was assessed by the Secretary of the Treasury of the State of São Paulo over a tax benefit derived from reducing its ICMS tax base, alleging that Net Serviços did not include revenues from the rental of equipment (locação de equipamento) in the ICMS base. The amount of this assessment as of December 31, 2014, was Ps. 2,671 million (approximately R$482 million). The tax authority claims that from (i) January 2008 to November 2009; and (ii) January 2010 to December 2011, Net Serviços should have paid the ICMS on Pay TV services revenues at a rate of 25% instead of the rate of 10% actually applied by Net Serviços. In the tax authority’s view, Net Serviços lost the rate reduction benefit allowed by ICMS Agreement No.57/99 because Net Serviços did not include the rental of equipment in its revenues. Net Serviços based its calculation on the interpretation of the Brazilian Superior Court that the rental of equipment shall not be confused with a subscription TV service, and therefore cannot be taxed by ICMS and, consequently, Net Serviços should not lose such tax benefit. However, there is no specific precedent at the administrative or judicial levels on the issue, and it is not possible to predict the outcome of this matter. The Company has established a provision in the accompanying consolidated financial statements.

93
In 2008 and 2010, Net Brasília Ltda. (“Net Brasília”), a Net Serviços subsidiary, received tax assessment notices from the State Internal Revenue of the Distrito Federal in the amount of Ps.1,141 million (approximately R$155 million and R$51 million), respectively, as of December 2014, relating to the ICMS tax. The tax authority claims that during the period from January 2003 to June 2009 Net Brasília should have paid the ICMS on Pay TV services revenues at a rate of 25% instead of the rate of 10% actually applied by Net Brasília. In the tax authority’s view, the rate reduction benefit allowed by ICMS Agreement No. 57/99 expired on December 31, 2001. In connection with this matter in November 2014, the State of Distrito Federal enacted a law to exempt most part of ICMS if the taxpayers agreed to voluntarily pay the charged values. The exemption was so relevant that, even though the probability of loss was classified as possible, it was interesting to enter into this exemption program. The benefit caused a reduction of 96% of the tax assessment. In December 2014, Net Brasília paid Ps.72 million (approximately R$13 million) pursuant to an exemption under 2014 state legislation and closed both cases.
In October 2002, Net Rio Ltda. (“Net Rio”), a Net Serviços subsidiary, received a tax assessment notice from the State Tax Authority of the State of Rio de Janeiro in the amount of Ps.1,468 million (approximately R$265 million) relating to the ICMS tax. The tax authority alleged that, as a result of delays in the payment of its ICMS tax during the period from November and December 2001, Net Rio lost its rate reduction benefit until September 2002. Net Rio has recorded liabilities related to the period from November and December 2001 in the amount of Ps.211 million (approximately R$38 million). Based on analysis performed by legal counsel after an unfavorable decision from the lower court, Net Rio made an additional provision to the period from January to September 2002 in the amount of Ps.1,468 million (approximately R$265 million), as of December 2014.
IRPJ/ CSLL
In December 2014, the Brazilian Federal Revenue Service has issued tax assessment regarding goodwill amounts amortized by Claro Brasil between 2009 and 2012, charging Corporate Income Tax (Imposto sobre Renda de Pessoa Jurídica, or “IRPJ”), Social Contribution on Net Profit (Contribuição Social Sobre o Lucro Líquido, or “CSLL”) and penalties due to the late payment of the taxes. The total amount of the tax assessment is approximately Ps.8,771 million (approximately R$1,583 million). This contingency is considered possible and the Company has not established a provision in the accompanying consolidated financial statements to cover losses arising from it.
Claro Brasil has other ongoing tax litigations in the amount of Ps.272 million (approximately R$49 million), related to IRPJ and CSLL. The Company has not established a provision in the accompanying consolidated financial statements to cover losses arising from these contingencies.
Embratel, Star One and Embrapar have other ongoing tax litigations in the amount of Ps.3,912 million (approximately R$706 million), mainly related to incorrect deductions for purposes of IRPJ and CSLL. The Company has established a provision of Ps.1,801 million (approximately R$325 million), in the accompanying consolidated financial statements for the losses arising from these contingencies that the Company considers probable.
In 2009, Net São Paulo Ltda., a Net Serviços subsidiary merged into Net Serviços in 2013, received a tax assessment issued by the Brazilian Internal Revenue Service questioning part of the expenses considered as deductible in the calculation of IRPJ and CSLL from 2004 to 2008, amounting to Ps.3,031 million (approximately R$547 million). In October 2010, a first instance decision reduced this amount to Ps.2,056 million (approximately R$371 million). As of December 31, 2014, the total amount in dispute is Ps.2,638 million (approximately R$476 million). The Company has not established a provision in the accompanying consolidated financial statements to cover losses arising from these contingencies.
In 2012 and 2013, Net Serviços received other tax assessments in the amount of Ps.765 million (approximately R$138 million) issued by the Brazilian Internal Revenue Service, regarding the same matter and related to the period between 2007 and 2008. The Company has not established a provision in the accompanying consolidated financial statements to cover losses arising from these contingencies.
In 2014, the Refis da Copa law was enacted to partially exempt the taxes contested in legal proceedings if the taxpayers agreed to voluntarily pay the charged values with cash and tax credits arising from IRPJ and CSLL carry forwards. Pursuant to such law, in 2014 Net Serviços paid an amount of Ps.659 million (approximately R$119 million) closing the assessments received in 2009, 2012 and 2013 and representing an 80.6% reduction of the tax assessments’ updated amount.
NET Serviços has other ongoing tax litigations in the amount of Ps.471 million (approximately R$85 million), related to IRPJ and CSLL. The Company has established a provision of Ps.100 million (approximately R$18 million), in the accompanying consolidated financial statements for the losses arising from these contingencies that the Company considers probable.
PIS/COFINS
In December 2005, the Brazilian Federal Revenue Service issued tax assessments against Claro Brasil and Americel in respect of PIS (Programa de Integração Social, or “PIS”) and Brazilian Social Welfare Tax for Service Export Security (Contribuição para o Financiamento da Seguridade Social, or “COFINS”) taxes (which are levied on gross revenue), for 2000 through 2005. In addition, in March 2006, the Brazilian Federal Revenue Service issued tax assessments against ATL-Telecom Leste, S.A. (“ATL”), related to certain tax deductions taken by ATL in connection with its PIS and COFINS obligations. As discussed above, Claro Brasil is the corporate successor to ATL.
In January 2011, the Brazilian Federal Revenue Service issued tax assessments against Claro Brasil regarding allegedly improper offsetting of certain tax deductions claimed by Claro Brasil in connection with its PIS and COFINS obligations. The total amount of these tax assessments, which Americel and Claro Brasil are contesting in pending challenges, was Ps.8,417 million (approximately R$1,519 million), including fines and interest as of December 31, 2014. The Company has established a provision of Ps.50 million (approximately R$9 million), in the accompanying financial statements for the losses arising from these contingencies that the Company considers probable.
Separately, Claro Brasil and Americel have commenced lawsuits against the Brazilian Federal Revenue Service seeking a ruling on constitutional grounds that they may exclude state value added tax (ICMS) payments and interconnection fees from the base used to calculate PIS and COFINS tax obligations. Pending a final ruling and pursuant to applicable Brazilian procedure, the Company paid tax based on its position in the lawsuit, and established a provision for the disputed amounts. The total amount in dispute was approximately Ps.10,822 million (approximately R$1,953 million).

94
Embrapar, Embratel, Brasil Center Ltda. (“Brasil Center”) and TdB have tax contingencies of Ps.122 million (approximately R$22 million), mostly related to the contributions of PIS prior to 1995, which the tax authorities allege were incorrectly offset. The Company is contesting these tax assessments in proceedings that are in different stages. AMX has not established a provision in the accompanying consolidated financial statements and does not consider any loss to be probable.
Embrapar, Embratel, Brasil Center and TdB have tax contingencies of Ps.1,319 million (approximately R$238 million) as of December 31, 2014, related to the payment of COFINS. The Company is contesting these tax assessments in proceedings that are in different stages. The Company has established a provision of Ps.61 million (approximately R$11 million), in the accompanying financial statements for the losses arising from these contingencies that the Company considers probable.
FUST and FUNTTEL Funding
Anatel has issued tax assessments against Claro Brasil and Americel totaling Ps.7,165 million (approximately R$1,293 million), relating to alleged underpayment of their funding obligations for the Telecommunications System Universalization Fund (Fundo de Universalização dos Serviços de Telecomunicações, or “FUST”) and the Telecom Technologic Development Fund (Fundo para o Desenvolvimento Tecnológico das Telecomunicações, or “FUNTTEL”) from 2006 to 2010. The assessments claim that interconnection and activation fee revenues should not have been excluded from the basis used to calculate funding obligations. Claro Brasil and Americel have challenged the tax assessments, and the challenges are still pending. The Company has not made a provision in the accompanying consolidated financial statements to cover losses arising from this contingency.
Anatel and the Brazilian Ministry of Communications (Ministério das Comunicações, or MINICOM) have issued tax assessments against Embratel, Star One and Primesys totaling Ps.8,400 million (approximately R$1,516 million), relating to alleged underpayment of their funding obligations for FUST, from 2001 to 2012, and FUNTTEL, from 2001 to 2010. The assessments claim that interconnection and other revenues should not have been excluded from the basis used to calculate funding obligations. The companies have challenged the tax assessments, and such challenges are pending. The Company has not established a provision in the accompanying financial statements to cover losses arising from these contingencies. The Company has made a judicial deposit in the amount of Ps.970 million (approximately R$175 million) related to part of the contingencies relating to FUST.
ISS
The Municipal Revenue Services have issued tax assessments against Embratel, Primesys, Brasil Center and TdB totaling Ps.5,098 million (approximately R$920 million) arising from nonpayment of Brazilian Services Tax (Imposto sobre Serviços, or “ISS”) in connection with the provision of certain services. The companies have challenged the tax assessments on the grounds that such services are not subject to ISS tax, and the challenges are pending. The Company has not established a provision in the accompanying consolidated financial statements to cover losses arising from these contingencies.
Net Serviços has contingencies related to ISS (Municipality of Santo André and Campinas) in the amount of Ps.853 million (approximately R$154 million) as of December 31, 2014, unduly charging ISS over telecommunication services (subject to ICMS). Due to an unfavorable judicial decision the probability of loss was reclassified as possible. The Company has not established a provision in the accompanying financial statements to cover losses arising from these contingencies.
Claro Brasil has others ongoing tax assessments related to ISS in the amount of Ps.199 million (approximately R$36 million) as of December 31, 2014, most related to ISS over certain services considered by Claro Brasil as non- taxable. The Company has not established a provision in the accompanying financial statements to cover losses arising from these contingencies.
EBC Funding
Claro Brasil, Embratel and Americel have filed an injunction challenging a federal law that created the Brazilian Communication Company (Empresa Brasileira de Comunicação, or “EBC”) that is to be partially funded by mobile operators. If Claro Brasil and Americel are unsuccessful in their challenge, the total amount they would be required to contribute to EBC through December 31, 2014 is approximately Ps.2,643 million (approximately R$477 million). The Company has made a judicial deposit in this amount. The Company has established a provision of Ps.2,593 million (approximately R$468 million), in the accompanying consolidated financial statements for losses arising from this contingency which the Company considers probable.
TFI—Installation Inspection Fee
Anatel charged Claro Brasil and Americel the amount of Ps.10,157 million (approximately R$1,833 million) as of December 31, 2014, related to the installation inspection fee (Taxa de Fiscalização de Instalação, or “TFI”) allegedly due for the renewal of radio base stations and handsets. Claro Brasil and Americel have challenged the amount charged, arguing that there was no new equipment installation that could lead to this charge, and the challenges are still pending. The Company has not established a provision in the accompanying consolidated financial statements and does not consider any loss to be probable.
Imposto sobre Operações Financeiras (IOF)
Net Serviços and its controlled companies have centralized cash management and cash transfers made under a current intercompany account. Management determined that such transfers are not subject to financial transaction tax IOF charges. However, the Federal Revenue Service may deem such transfers to be inter-company loans. In the event such transfers are deemed to be inter-company loans, the Company may be subject to IOF, on the amount of the loans. IOF applies to loans between non-financial entities at a maximum rate of 1.5% per year where the principal amount and the term for repayment is fixed, and at a daily rate of 0.0041% on the outstanding balance, without limit on the total amount of tax payable, if the principal amount of the loan is not fixed. In view of certain adverse court decisions as to the applicability of this law, the Company has established a provision of Ps.355 million (approximately R$64 million) as of December 31, 2014.

95
Tax Credit for Income Tax Withheld Abroad
The Brazilian Federal Revenue Service has issued tax assessments in the amount of Ps.1,923 million (approximately R$347 million), against Claro Brasil alleging that it incorrectly offset tax withheld in other countries against some of its Brazilian tax obligations. During 2011, Claro Brasil terminated its challenge with respect to Ps.1,369 million (approximately R$247 million), in tax assessments and paid those amounts to the Brazilian Federal Revenue Service, to preserve the right to offset the foreign tax withheld related to such tax assessments against its Brazilian tax obligations in future years. The total amount of the tax assessments that Claro Brasil is contesting as of December 31, 2014 is approximately Ps.648 million (approximately R$117 million). The Company has not made a provision in the accompanying financial consolidated statements to cover losses arising from this contingency.
Other tax contingencies
As of December 31, 2014, the Company’s Brazilian subsidiaries are engaged in a number of additional administrative and legal proceedings challenging tax assessments, as summarized below:• Claro Brasil and Americel have other on-going tax litigations in the total amount of Ps.704 million (approximately R$127 million) as of
December 31, 2014, mostly related to the Brazilian Economic Intervention Contribution (Contribuição de Intervenção no Domínio Econômico or “CIDE”), the public price concerning the administration of numbering resources (Preço Público Relativo à Administração dos Recursos de Numeração, or “PPNUM”) and import taxes (Imposto de Importação, or “II”). The Company has established a provision of Ps.78 million (approximately R$14 million), in the accompanying financial statements for the losses arising from these contingencies that the Company considers probable.
• Embratel, Star One, TdB, and Primesys have other ongoing tax litigations in the amount of Ps.2,261 million (approximately R$408 million), mainly related to Instituto Nacional do Seguro Social, or “INSS”, Imposto Sobre Produtos Industrializados, or “IPI”, CPMF and the offsetting of IRPJ, COFINS, CSLL and Brazilian Foreign Paid Income Tax (Imposto de Renda Retido na Fonte, or “IRRF”) against allegedly improper IRPJ credits. The Company has established a provision of Ps.55 million (approximately R$10 million), in the accompanying financial statements for the losses arising from these contingencies that the Company considers probable.
• Embratel was fined Ps.1,773 million (approximately R$320 million) by the Brazilian Federal Revenue Service for not making certain filings in the correct form from 2002 through 2005. The Company is contesting this fine on various grounds. The Company has not established a provision in the accompanying financial statements to cover losses arising from this contingency.
• Embrapar, Embratel, Star One and TdB have received assessments in the total amount of Ps.1,435 million (approximately R$259 million), mainly related to allegedly nonpayment of the IRRF and CIDE and overpayments related to outbound traffic. The Company is challenging those assessments in administrative and judicial proceedings. The Company has established a provision of Ps.11 million (approximately R$2 million) in the accompanying financial statements for the losses arising from these contingencies that the Company considers probable.
Regulatory MattersAnatel Inflation-Related Adjustments
Anatel challenged the calculation of inflation-related adjustments due under the agreements it had with Tess, S.A. (“Tess”), and ATL, two of our Brazilian subsidiaries that were merged with and into Claro Brasil, which assumed their rights and obligations.Under the agreements with Anatel, 40% of the concession price was due upon execution and 60% was due in three equal annual installments (subject to inflation-related adjustments and interest), beginning in 1999. The companies made all payments, but Anatel challenged the companies’ calculation of the inflation-related adjustments related to the payment corresponding to 60% of the concession price, alleging that such calculation resulted in a shortfall, and requesting additional payment. The amount of this shortfall and the method used to calculate monetary correction are subject to judicial disputes.The companies filed declaratory and consignment actions seeking resolution of the disputes. The court of first instance ruled against ATL’s declaratory suit in October 2001 and ATL’s consignment action in September 2002. Subsequently, ATL filed appeals, which are still pending. Similarly, the court of first instance ruled against Tess’ consignment action in June 2003 and against Tess’ filing for declaratory action in February 2009. Tess also filed an appeal, which is still pending.In December 2008, Anatel charged Tess approximately Ps.1,491 million (approximately R$269 million). Tess obtained an injunction from the Federal Court of Appeals suspending payment until the pending appeal is resolved. Similarly, in March 2009, Anatel charged ATL approximately Ps.1,058 million (approximately R$191 million). ATL also obtained an injunction from the Federal Court of Appeals suspending payment until the pending appeal is resolved. In April 2013, the appeal filed by ATL with respect to the declaratory suit was denied, and Claro Brasil filed a new appeal.The Company calculated the amount of the shortfall based on a specific method and certain assumptions. If other methods or assumptions are used, the amount of damages may increase. In September 2014, Anatel calculated monetary correction in a total amount of Ps.8,866 million (approximately R$1,6 billion).The Company has established a provision of Ps.3,302 million (approximately R$596 million), in the accompanying financial statements for losses arising from these contingencies which the Company considers probable.
Consumer Protection Lawsuit (DPDC)
In July 2009, the Brazilian Federal and State Prosecutor Office, along with the Consumer Protection and Defense Agency and other Brazilian consumer protection agencies, initiated a lawsuit against Claro Brasil alleging that it has violated certain regulations governing the provision of telecommunications services. The amount claimed by the plaintiffs is Ps.1,662 million (approximately R$300 million). In September 2013, the relevant court ruled against Claro Brasil, and awarded the plaintiff Ps.166 million (approximately R$30 million). The plaintiffs and Claro Brasil challenged the ruling and those challenges are still pending.The Company has not established a provision in the accompanying financial statements to cover losses arising from this contingency, which the Company does not consider probable.

96
Implementation of the new national domestic telephone number system
As a result of alleged service disruptions caused during the implementation of a new domestic dialing system in 1999, Embratel was fined by Anatel and DPDC, and several class actions were initiated against it. The aggregate total amount of these contingencies is Ps.887 million (approximately R$160 million). The Company contested these claims and in 2014 the Company obtained a favorable decision. The fine, applied by the Rio de Janeiro’s Consumer Protection Agency, was nullified.
Administrative proceedings (PADOs)
Anatel filed several administrative proceedings (Procedimentos Administrativos de Descumprimento de Obrigação, or “PADOs”), against Claro Brasil in the amount of Ps.610 million (approximately R$110 million), because of alleged noncompliance with quality targets set by Anatel. The Company is contesting the PADOs on various grounds. The Company has established a provision of Ps.388 million (approximately R$70 million), in the accompanying consolidated financial statements for the losses arising from these contingencies that the Company considers probable.
Anatel filed several administrative proceedings (PADOs), against Embratel and Embrapar in the amount of Ps.4,305 million (approximately R$777 million), because of alleged noncompliance with quality targets set by Anatel. The Company is contesting the PADOs on various grounds. The Company has established a provision of Ps.89 million (approximately R$16 million), in the accompanying consolidated financial statements for the losses arising from these contingencies that the Company considers probable.
Other civil and labor contingencies
Claro Brasil and its subsidiaries are also party to other claims in the amount of Ps.9,846 million (approximately R$1,777 million), including claims filed by its telephone service customers and claims relating to environmental matters. The Company is contesting the cases, which are in various stages. The Company has established a provision of Ps.382 million (approximately R$69 million), in the accompanying consolidated financial statements for the losses arising from these contingencies that the Company considers probable.
Claro Brasil and its subsidiaries are party to labor claims in the amount of Ps.6,716 million (approximately R$1,212 million), filed by its current and former employees, alleging compensation for pension and other social benefits, overtime work, outsourcing and equal pay. The Company has established a provision of Ps.765 million (approximately R$138 million) in the accompanying consolidated financial statements for the losses arising from these contingencies that the Company considers probable.
Embratel and its subsidiaries are also party to other claims in the amount of Ps.4,012 million (approximately R$724 million), including claims filed by its telephone service customers and claims relating to environmental matters. The Company is contesting the cases, which are in various stages. The Company has established a provision of Ps.305 million (approximately R$55 million), in the accompanying financial statements for the losses arising from these contingencies that the Company considers probable.
Embratel and its subsidiaries are party to labor claims in the amount of Ps.4,771 million (approximately R$861 million), filed by its current and former employees, alleging compensation for pension and other social benefits, overtime work, outsourcing and equal pay. The Company has established a provision of Ps.582 million (approximately R$105 million), in the accompanying financial statements for the losses arising from these contingencies that the Company considers probable.
Net Serviços and its subsidiaries are also party to other claims in the amount of Ps.3,712 million (approximately R$670 million), including claims filed by its Pay TV, internet access and telephone service customers. The Company is contesting the cases, which are in various stages. The Company has established a provision of Ps.948 million (approximately R$171 million), in the accompanying financial statements for the losses arising from these contingencies that the Company considers probable.
Net Serviços and its subsidiaries are party to labor claims in the amount of Ps.9,215 million (approximately R$1,663 million), filed by its current and former employees, seeking additional compensation for performing high-risk activities and for overtime work and commissions. The Company has established a provision of Ps.831 million (approximately R$150 million), in the accompanying financial statements for the losses arising from these contingencies that the Company considers probable.
Disputes with third parties
Claro Brasil and Americel are parties to certain disputes with third parties in connection with former sales agents, class actions (ACP’s), real estate issues, and other matters in the aggregate amount of Ps.2,903 million (approximately R$524 million). The Company has established a provision of Ps.122 million (approximately R$22 million), in the accompanying financial statements for the losses arising from these contingencies that the Company considers probable.
Embratel, TdB, Primesys and Brasil Center are parties to a number of cases on a range of matters, including, among other things, disputes with former sales agents and disputes with former employees regarding health care payments. The cases, which are in advanced stages of the litigation process, are for claims in the amount of Ps.2,266 million (approximately R$409 million). The Company has established a provision of Ps.1,042 million (approximately R$188 million), in the accompanying financial statements for the losses arising from these contingencies that the Company considers probable.
Ecuador
ConecelTax AssessmentsDuring 2008, the Ecuadorian Internal Revenue Services (Servicios de Rentas Internas del Ecuador, or “SRI”) notified Conecel of tax assessments in the amount of Ps.2031 million (approximately US$138 million) (not including interest and penalties), relating to special consumption (ICE), value-added, income and withholding taxes for the years 2003 to 2006. In March 2008, Conecel has paid a portion of these tax assessments, including fines, and has challenged the outstanding amount with the SRI and, subsequently, with a Tax
97
Court in Guayaquil. In March 2012, such Tax Court issued a favorable resolution with respect to Ps.353 million (approximately US$24 million). Following a series of unfavorable judicial decisions, in July 2013 and May 2014, Conecel paid the outstanding portion of the tax assessments, in an aggregate amount of Ps.2,164 (approximately US$147 million), including principal and accrued interest.In 2011 and 2012, SRI notified Conecel of tax assessments in the amount of 1,751 million (approximately US$119 million), relating to income taxes for the 2007, 2008 and 2009 fiscal years. Conecel began certain judicial proceedings challenging the tax assessments and final resolutions for the challenges to the resolutions relating to the years 2008 and 2009 are still pending. The National Court of Justice, however, issued a final ruling in connection with Conecel’s income tax for the year 2007 and determined that Conecel had to pay Ps.706 million (approximately US$48 million), including principal and accrued interest.The Company has established a provision of Ps.235 million (approximately US$16 million) in the accompanying financial statements for the loss arising from these contingencies that AMX considers probable.
Fine imposed by the SCPMIn February 2014, following a regulatory claim filed in 2012 by the state-owned operator, Superintendency of Control of Market Power (Superintendencia de Control del Poder del Mercado or “SCPM”), imposed a fine on Conecel of Ps.2,037 million (US$138 million), for alleged monopolistic practices related to five locations which the state-owned operator argues that Conecel has exclusive rights to deploy its network preventing others from doing so. In March 2014, Conecel challenged the fine and posted a guarantee for 50% of its value. Through a judicial order issued during the same month, the competent court admitted Conecel’s lawsuit and suspended the effects of the contested fine. A final resolution is still pending.The Company has not established a provision in the accompanying financial statements to cover losses arising from this contingency.
PeruOSIPTEL—Monopolistic practices investigationsAlong with another mobile operator, América Móvil Perú, S.A.C. (“Claro Perú”), was the target of an investigation into alleged monopolistic practices conducted by the Peruvian National Regulatory Authority (Organismo Supervisor de la Inversión Privada en Telecomunicaciones, or “OSIPTEL”), related to mobile international long distance rates.OSIPTEL fined Claro Peru Ps.2 million (US$118,000) for monopolistic practices (price-squeezing in long distance tariffs). Although the fine is well below the maximum amount established by law, Claro Peru appealed the decision before the Administrative Tribunal in OSIPTEL, considering that the fine is unjustified and the decision has serious inconsistencies. If necessary, Claro Perú would also seek to challenge the resolution in Courts.The Company has not established a provision in the accompanying consolidated financial statements to cover losses arising from this contingency.Bulgaria
MobiltelTax AssessmentIn June 2014, the Bulgarian tax authorities issued a tax assessment regarding accounting of brand name and customer base amortized by Mobiltel EAD (“Mobiltel”) for the years 2006 and 2007. The total amount of the tax assessment is approximately Ps.338 million (approximately €€ 19 million). Mobiltel initiated administrative proceedings with the highest Bulgarian tax authority challenging the resolution. On December 1, 2014, Mobiltel was notified that the resolution was upheld. Mobiltel challenged the resolution before the competent judicial courts and such challenge is pending. Mobiltel issued a bank guarantee covering up to Ps.410 million (approximately € 23 million). In case of an unfavorable decision by the competent judicial courts, Mobiltel might face a further potential additional claim for the years 2008 to 2012 in the amount of up to Ps.1,318 million (approximately €74 million).
21 SegmentsAmérica Móvil operates in different countries. As mentioned in Note 1, the Company has operations in Mexico, Guatemala, Nicaragua, Ecuador, El Salvador, Costa Rica, Brazil, Argentina, Colombia, United States, Honduras, Chile, Peru, Paraguay, Uruguay, Dominican Republic, Puerto Rico, Panama, Austria, Croatia, Bulgaria, Belarus, Macedonian, Serbia and Slovenia. The accounting policies for the segments are the same as those described in Note 2.
The CEO, who is the Chief Operating Decision Maker (“CODM”), analyzes the financial and operating information by geographical segment, except for Mexico, which shows América Móvil (Corporate and Telcel) and Telmex as two segments. All significant operating segments that (i) represent more than 10% of consolidated revenues, (ii) more than the absolute amount of its reported 10% of profits or loss and (iii) more than 10% of consolidated assets, are presented separately.
The Company has aggregated operating segments into the following reporting segments for purposes of its consolidated financial statements: Southern cone includes Argentina, Chile, Paraguay and Uruguay; Andean includes Ecuador and Peru.
The Company is of the view that the quantitative and qualitative aspects of the aggregated operating segments are similar in nature for all periods presented. In evaluating the appropriateness of aggregating operating segments, the key qualitative indicators include but not were limited to: (i) all entities provide telecommunications services, (ii) similarities of customer bases and services, (iii) the methods to distribute services are the same, based on telephone plant in both cases, wireless and fixed lines, (iv) similarities of governments and regulatory entities that oversee the activities and services that telecom companies, (v) inflation trends and (vi) currency trends.
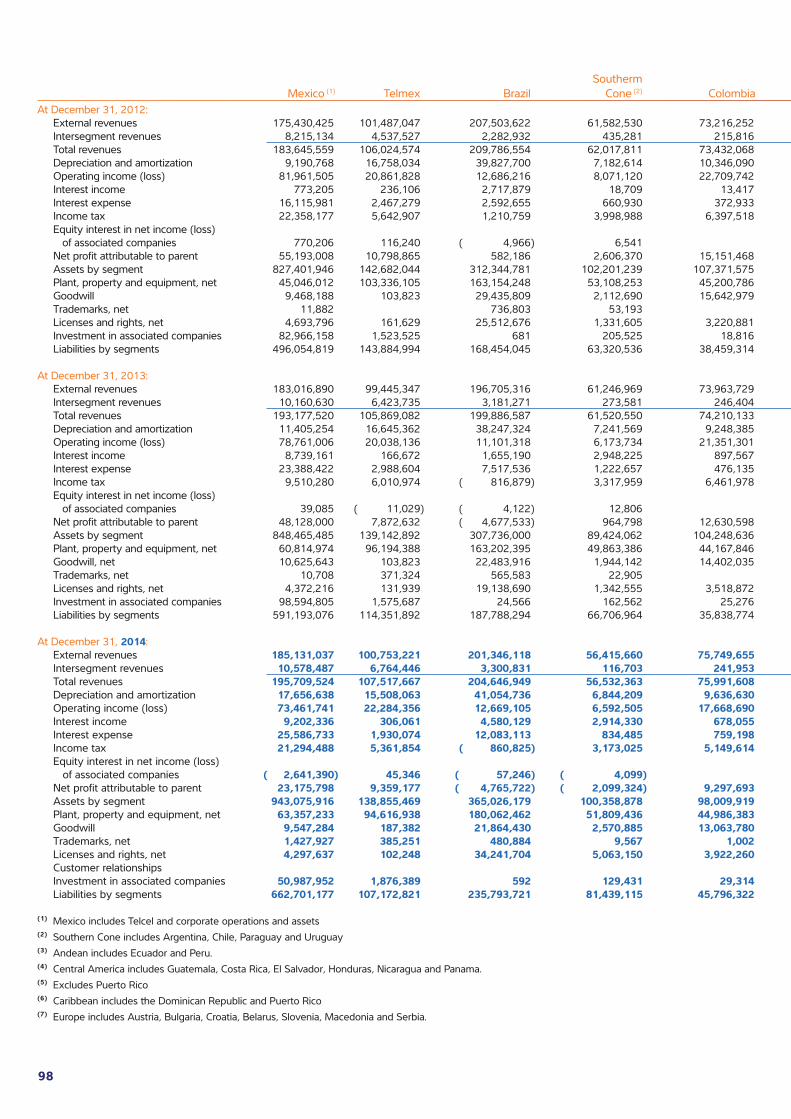
98
Southerm Central- Consolidated Mexico (1) Telmex Brazil Cone (2) Colombia Andean (3) America (4) U.S.A.(5) Caribbean (6) Europe Eliminations totalAt December 31, 2012: External revenues 175,430,425 101,487,047 207,503,622 61,582,530 73,216,252 42,326,250 22,940,389 63,143,785 27,439,345 775,069,645 Intersegment revenues 8,215,134 4,537,527 2,282,932 435,281 215,816 169,038 107,089 2,099 ( 15,964,916) Total revenues 183,645,559 106,024,574 209,786,554 62,017,811 73,432,068 42,495,288 23,047,478 63,143,785 27,441,444 ( 15,964,916) 775,069,645 Depreciation and amortization 9,190,768 16,758,034 39,827,700 7,182,614 10,346,090 4,689,847 9,609,151 443,848 5,536,792 ( 107) 103,584,737 Operating income (loss) 81,961,505 20,861,828 12,686,216 8,071,120 22,709,742 13,176,907 ( 3,497,129) 1,827,830 2,882,513 469,448 161,149,980 Interest income 773,205 236,106 2,717,879 18,709 13,417 30,777 34,976 131 33,966 ( 80) 3,859,086 Interest expense 16,115,981 2,467,279 2,592,655 660,930 372,933 72,206 16,942 323 ( 31,478) 22,267,771 Income tax 22,358,177 5,642,907 1,210,759 3,998,988 6,397,518 3,708,410 1,119,312 845,900 701,481 45,983,452 Equity interest in net income (loss) of associated companies 770,206 116,240 ( 4,966) 6,541 ( 45,635) ( 81,025) 761,361 Net profit attributable to parent 55,193,008 10,798,865 582,186 2,606,370 15,151,468 9,303,620 ( 4,895,158) 1,063,311 1,356,784 ( 171,884) 90,988,570 Assets by segment 827,401,946 142,682,044 312,344,781 102,201,239 107,371,575 68,433,805 50,569,456 20,838,444 66,978,458 ( 711,137,065) 987,684,683 Plant, property and equipment, net 45,046,012 103,336,105 163,154,248 53,108,253 45,200,786 25,791,457 35,176,900 1,630,494 27,990,017 500,434,272 Goodwill 9,468,188 103,823 29,435,809 2,112,690 15,642,979 5,082,613 4,740,253 1,469,387 31,650,117 99,705,859 Trademarks, net 11,882 736,803 53,193 1,596 134,009 205,832 1,143,315 Licenses and rights, net 4,693,796 161,629 25,512,676 1,331,605 3,220,881 4,300,618 2,650,808 2,180,417 44,052,430 Investment in associated companies 82,966,158 1,523,525 681 205,525 18,816 16,782 ( 11,615,202) 73,116,285 Liabilities by segments 496,054,819 143,884,994 168,454,045 63,320,536 38,459,314 20,608,834 26,307,510 19,042,295 30,985,410 ( 274,281,320) 732,836,437
At December 31, 2013: External revenues 183,016,890 99,445,347 196,705,316 61,246,969 73,963,729 44,943,680 24,106,372 77,166,979 25,505,739 786,101,021 Intersegment revenues 10,160,630 6,423,735 3,181,271 273,581 246,404 169,338 112,813 2,815 ( 20,570,587) Total revenues 193,177,520 105,869,082 199,886,587 61,520,550 74,210,133 45,113,018 24,219,185 77,166,979 25,508,554 ( 20,570,587) 786,101,021 Depreciation and amortization 11,405,254 16,645,362 38,247,324 7,241,569 9,248,385 5,035,188 8,377,356 509,104 4,825,291 101,534,833 Operating income (loss) 78,761,006 20,038,136 11,101,318 6,173,734 21,351,301 11,910,251 ( 1,129,337) 938,885 4,478,012 634,450 154,257,756 Interest income 8,739,161 166,672 1,655,190 2,948,225 897,567 766,272 154,830 130,229 300,688 ( 12,833,000) 2,925,834 Interest expense 23,388,422 2,988,604 7,517,536 1,222,657 476,135 232,765 148,356 121 43,194 ( 12,067,137) 23,950,653 Income tax 9,510,280 6,010,974 ( 816,879) 3,317,959 6,461,978 4,592,131 ( 115,610) 39,182 1,392,716 30,392,731 Equity interest in net income (loss) of associated companies 39,085 ( 11,029) ( 4,122) 12,806 ( 458) 36,282 Net profit attributable to parent 48,128,000 7,872,632 ( 4,677,533) 964,798 12,630,598 7,826,900 ( 1,132,279) 1,192,188 1,520,279 299,396 74,624,979 Assets by segment 848,465,485 139,142,892 307,736,000 89,424,062 104,248,636 73,556,522 52,129,267 23,343,580 65,984,117 ( 678,438,128) 1,025,592,433 Plant, property and equipment, net 60,814,974 96,194,388 163,202,395 49,863,386 44,167,846 24,348,547 34,133,513 1,831,731 26,550,171 501,106,951 Goodwill, net 10,625,643 103,823 22,483,916 1,944,142 14,402,035 5,046,380 4,757,332 1,472,896 31,650,117 92,486,284 Trademarks, net 10,708 371,324 565,583 22,905 143 5 195,638 1,166,306 Licenses and rights, net 4,372,216 131,939 19,138,690 1,342,555 3,518,872 3,750,190 2,607,825 2,191,545 37,053,832 Investment in associated companies 98,594,805 1,575,687 24,566 162,562 25,276 16,651 ( 11,512,523) 88,887,024 Liabilities by segments 591,193,076 114,351,892 187,788,294 66,706,964 35,838,774 23,281,476 24,398,597 20,546,879 23,411,304 ( 272,225,900) 815,291,356
At December 31, 2014: External revenues 185,131,037 100,753,221 201,346,118 56,415,660 75,749,655 47,638,268 26,911,181 91,097,363 25,827,251 37,392,066 848,261,820 Intersegment revenues 10,578,487 6,764,446 3,300,831 116,703 241,953 163,908 111,963 14,521 ( 21,292,812) Total revenues 195,709,524 107,517,667 204,646,949 56,532,363 75,991,608 47,802,176 27,023,144 91,097,363 25,841,772 37,392,066 ( 21,292,812) 848,261,820 Depreciation and amortization 17,656,638 15,508,063 41,054,736 6,844,209 9,636,630 5,409,431 8,497,557 564,952 4,923,004 4,916,757 ( 18,426) 114,993,551 Operating income (loss) 73,461,741 22,284,356 12,669,105 6,592,505 17,668,690 12,131,925 ( 212,229) 1,519,741 4,923,349 5,228,573 286,494 156,554,250 Interest income 9,202,336 306,061 4,580,129 2,914,330 678,055 1,118,629 182,037 162,890 459,998 134,899 ( 12,687,093) 7,052,271 Interest expense 25,586,733 1,930,074 12,083,113 834,485 759,198 413,769 154,958 54,609 1,446,442 ( 11,740,858) 31,522,523 Income tax 21,294,488 5,361,854 ( 860,825) 3,173,025 5,149,614 4,290,993 1,244,570 699,237 1,442,656 ( 2,088,063) 39,707,549 Equity interest in net income (loss) of associated companies ( 2,641,390) 45,346 ( 57,246) ( 4,099) ( 3,415,620) ( 6,073,009) Net profit attributable to parent 23,175,798 9,359,177 ( 4,765,722) ( 2,099,324) 9,297,693 6,994,299 ( 1,306,575) 1,245,720 3,505,502 2,319,109 ( 1,579,307) 46,146,370 Assets by segment 943,075,916 138,855,469 365,026,179 100,358,878 98,009,919 82,779,795 57,727,606 33,018,415 72,259,136 187,958,436 ( 800,713,080) 1,278,356,669 Plant, property and equipment, net 63,357,233 94,616,938 180,062,462 51,809,436 44,986,383 26,529,773 34,803,570 3,604,645 26,481,689 69,344,189 595,596,318 Goodwill 9,547,284 187,382 21,864,430 2,570,885 13,063,780 4,386,035 4,936,560 1,741,418 31,650,117 50,955,500 140,903,391 Trademarks, net 1,427,927 385,251 480,884 9,567 1,002 29 212,465 8,928,464 11,445,589 Licenses and rights, net 4,297,637 102,248 34,241,704 5,063,150 3,922,260 3,645,244 2,387,686 3,047,521 26,856,395 83,563,845 Customer relationships 1,088,540 13,731,676 14,820,216 Investment in associated companies 50,987,952 1,876,389 592 129,431 29,314 18,737 812,895 ( 4,592,729) 49,262,581 Liabilities by segments 662,701,177 107,172,821 235,793,721 81,439,115 45,796,322 26,833,960 27,219,970 29,029,234 31,476,106 122,601,259 ( 326,346,064) 1,043,717,621
(1) Mexico includes Telcel and corporate operations and assets(2) Southern Cone includes Argentina, Chile, Paraguay and Uruguay(3) Andean includes Ecuador and Peru.(4) Central America includes Guatemala, Costa Rica, El Salvador, Honduras, Nicaragua and Panama.(5) Excludes Puerto Rico(6) Caribbean includes the Dominican Republic and Puerto Rico(7) Europe includes Austria, Bulgaria, Croatia, Belarus, Slovenia, Macedonia and Serbia.
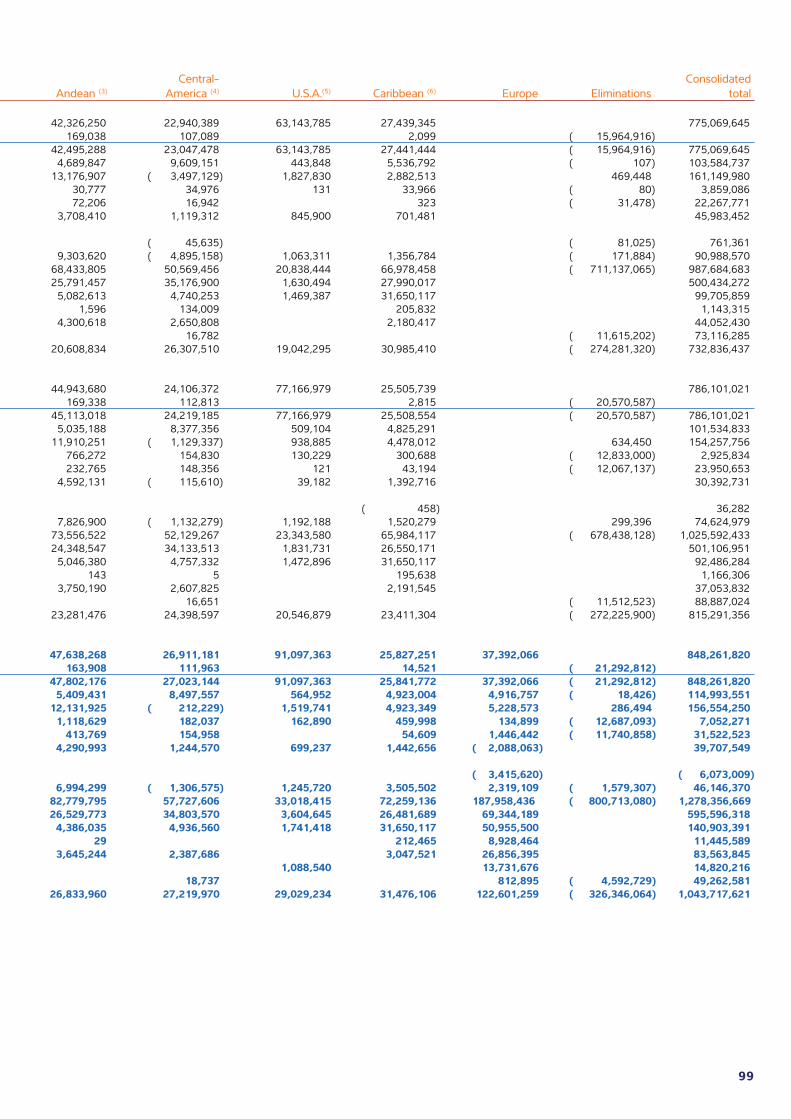
99
Southerm Central- Consolidated Mexico (1) Telmex Brazil Cone (2) Colombia Andean (3) America (4) U.S.A.(5) Caribbean (6) Europe Eliminations totalAt December 31, 2012: External revenues 175,430,425 101,487,047 207,503,622 61,582,530 73,216,252 42,326,250 22,940,389 63,143,785 27,439,345 775,069,645 Intersegment revenues 8,215,134 4,537,527 2,282,932 435,281 215,816 169,038 107,089 2,099 ( 15,964,916) Total revenues 183,645,559 106,024,574 209,786,554 62,017,811 73,432,068 42,495,288 23,047,478 63,143,785 27,441,444 ( 15,964,916) 775,069,645 Depreciation and amortization 9,190,768 16,758,034 39,827,700 7,182,614 10,346,090 4,689,847 9,609,151 443,848 5,536,792 ( 107) 103,584,737 Operating income (loss) 81,961,505 20,861,828 12,686,216 8,071,120 22,709,742 13,176,907 ( 3,497,129) 1,827,830 2,882,513 469,448 161,149,980 Interest income 773,205 236,106 2,717,879 18,709 13,417 30,777 34,976 131 33,966 ( 80) 3,859,086 Interest expense 16,115,981 2,467,279 2,592,655 660,930 372,933 72,206 16,942 323 ( 31,478) 22,267,771 Income tax 22,358,177 5,642,907 1,210,759 3,998,988 6,397,518 3,708,410 1,119,312 845,900 701,481 45,983,452 Equity interest in net income (loss) of associated companies 770,206 116,240 ( 4,966) 6,541 ( 45,635) ( 81,025) 761,361 Net profit attributable to parent 55,193,008 10,798,865 582,186 2,606,370 15,151,468 9,303,620 ( 4,895,158) 1,063,311 1,356,784 ( 171,884) 90,988,570 Assets by segment 827,401,946 142,682,044 312,344,781 102,201,239 107,371,575 68,433,805 50,569,456 20,838,444 66,978,458 ( 711,137,065) 987,684,683 Plant, property and equipment, net 45,046,012 103,336,105 163,154,248 53,108,253 45,200,786 25,791,457 35,176,900 1,630,494 27,990,017 500,434,272 Goodwill 9,468,188 103,823 29,435,809 2,112,690 15,642,979 5,082,613 4,740,253 1,469,387 31,650,117 99,705,859 Trademarks, net 11,882 736,803 53,193 1,596 134,009 205,832 1,143,315 Licenses and rights, net 4,693,796 161,629 25,512,676 1,331,605 3,220,881 4,300,618 2,650,808 2,180,417 44,052,430 Investment in associated companies 82,966,158 1,523,525 681 205,525 18,816 16,782 ( 11,615,202) 73,116,285 Liabilities by segments 496,054,819 143,884,994 168,454,045 63,320,536 38,459,314 20,608,834 26,307,510 19,042,295 30,985,410 ( 274,281,320) 732,836,437
At December 31, 2013: External revenues 183,016,890 99,445,347 196,705,316 61,246,969 73,963,729 44,943,680 24,106,372 77,166,979 25,505,739 786,101,021 Intersegment revenues 10,160,630 6,423,735 3,181,271 273,581 246,404 169,338 112,813 2,815 ( 20,570,587) Total revenues 193,177,520 105,869,082 199,886,587 61,520,550 74,210,133 45,113,018 24,219,185 77,166,979 25,508,554 ( 20,570,587) 786,101,021 Depreciation and amortization 11,405,254 16,645,362 38,247,324 7,241,569 9,248,385 5,035,188 8,377,356 509,104 4,825,291 101,534,833 Operating income (loss) 78,761,006 20,038,136 11,101,318 6,173,734 21,351,301 11,910,251 ( 1,129,337) 938,885 4,478,012 634,450 154,257,756 Interest income 8,739,161 166,672 1,655,190 2,948,225 897,567 766,272 154,830 130,229 300,688 ( 12,833,000) 2,925,834 Interest expense 23,388,422 2,988,604 7,517,536 1,222,657 476,135 232,765 148,356 121 43,194 ( 12,067,137) 23,950,653 Income tax 9,510,280 6,010,974 ( 816,879) 3,317,959 6,461,978 4,592,131 ( 115,610) 39,182 1,392,716 30,392,731 Equity interest in net income (loss) of associated companies 39,085 ( 11,029) ( 4,122) 12,806 ( 458) 36,282 Net profit attributable to parent 48,128,000 7,872,632 ( 4,677,533) 964,798 12,630,598 7,826,900 ( 1,132,279) 1,192,188 1,520,279 299,396 74,624,979 Assets by segment 848,465,485 139,142,892 307,736,000 89,424,062 104,248,636 73,556,522 52,129,267 23,343,580 65,984,117 ( 678,438,128) 1,025,592,433 Plant, property and equipment, net 60,814,974 96,194,388 163,202,395 49,863,386 44,167,846 24,348,547 34,133,513 1,831,731 26,550,171 501,106,951 Goodwill, net 10,625,643 103,823 22,483,916 1,944,142 14,402,035 5,046,380 4,757,332 1,472,896 31,650,117 92,486,284 Trademarks, net 10,708 371,324 565,583 22,905 143 5 195,638 1,166,306 Licenses and rights, net 4,372,216 131,939 19,138,690 1,342,555 3,518,872 3,750,190 2,607,825 2,191,545 37,053,832 Investment in associated companies 98,594,805 1,575,687 24,566 162,562 25,276 16,651 ( 11,512,523) 88,887,024 Liabilities by segments 591,193,076 114,351,892 187,788,294 66,706,964 35,838,774 23,281,476 24,398,597 20,546,879 23,411,304 ( 272,225,900) 815,291,356
At December 31, 2014: External revenues 185,131,037 100,753,221 201,346,118 56,415,660 75,749,655 47,638,268 26,911,181 91,097,363 25,827,251 37,392,066 848,261,820 Intersegment revenues 10,578,487 6,764,446 3,300,831 116,703 241,953 163,908 111,963 14,521 ( 21,292,812) Total revenues 195,709,524 107,517,667 204,646,949 56,532,363 75,991,608 47,802,176 27,023,144 91,097,363 25,841,772 37,392,066 ( 21,292,812) 848,261,820 Depreciation and amortization 17,656,638 15,508,063 41,054,736 6,844,209 9,636,630 5,409,431 8,497,557 564,952 4,923,004 4,916,757 ( 18,426) 114,993,551 Operating income (loss) 73,461,741 22,284,356 12,669,105 6,592,505 17,668,690 12,131,925 ( 212,229) 1,519,741 4,923,349 5,228,573 286,494 156,554,250 Interest income 9,202,336 306,061 4,580,129 2,914,330 678,055 1,118,629 182,037 162,890 459,998 134,899 ( 12,687,093) 7,052,271 Interest expense 25,586,733 1,930,074 12,083,113 834,485 759,198 413,769 154,958 54,609 1,446,442 ( 11,740,858) 31,522,523 Income tax 21,294,488 5,361,854 ( 860,825) 3,173,025 5,149,614 4,290,993 1,244,570 699,237 1,442,656 ( 2,088,063) 39,707,549 Equity interest in net income (loss) of associated companies ( 2,641,390) 45,346 ( 57,246) ( 4,099) ( 3,415,620) ( 6,073,009) Net profit attributable to parent 23,175,798 9,359,177 ( 4,765,722) ( 2,099,324) 9,297,693 6,994,299 ( 1,306,575) 1,245,720 3,505,502 2,319,109 ( 1,579,307) 46,146,370 Assets by segment 943,075,916 138,855,469 365,026,179 100,358,878 98,009,919 82,779,795 57,727,606 33,018,415 72,259,136 187,958,436 ( 800,713,080) 1,278,356,669 Plant, property and equipment, net 63,357,233 94,616,938 180,062,462 51,809,436 44,986,383 26,529,773 34,803,570 3,604,645 26,481,689 69,344,189 595,596,318 Goodwill 9,547,284 187,382 21,864,430 2,570,885 13,063,780 4,386,035 4,936,560 1,741,418 31,650,117 50,955,500 140,903,391 Trademarks, net 1,427,927 385,251 480,884 9,567 1,002 29 212,465 8,928,464 11,445,589 Licenses and rights, net 4,297,637 102,248 34,241,704 5,063,150 3,922,260 3,645,244 2,387,686 3,047,521 26,856,395 83,563,845 Customer relationships 1,088,540 13,731,676 14,820,216 Investment in associated companies 50,987,952 1,876,389 592 129,431 29,314 18,737 812,895 ( 4,592,729) 49,262,581 Liabilities by segments 662,701,177 107,172,821 235,793,721 81,439,115 45,796,322 26,833,960 27,219,970 29,029,234 31,476,106 122,601,259 ( 326,346,064) 1,043,717,621
(1) Mexico includes Telcel and corporate operations and assets(2) Southern Cone includes Argentina, Chile, Paraguay and Uruguay(3) Andean includes Ecuador and Peru.(4) Central America includes Guatemala, Costa Rica, El Salvador, Honduras, Nicaragua and Panama.(5) Excludes Puerto Rico(6) Caribbean includes the Dominican Republic and Puerto Rico(7) Europe includes Austria, Bulgaria, Croatia, Belarus, Slovenia, Macedonia and Serbia.
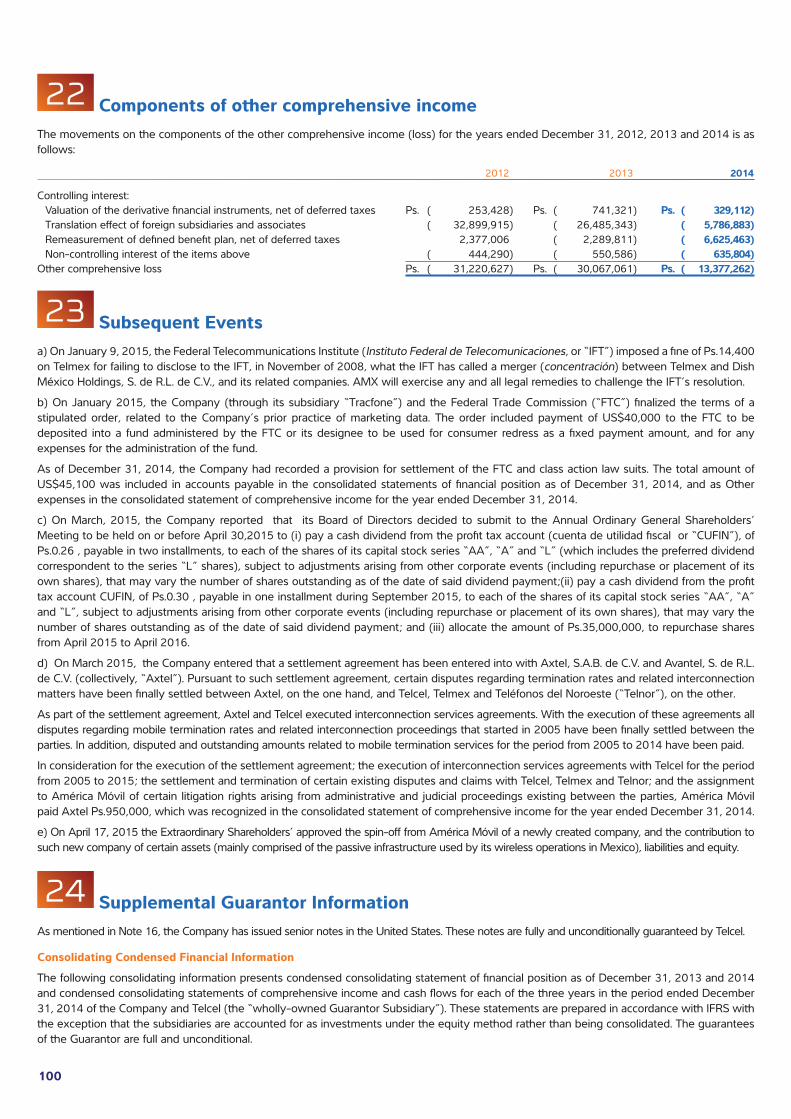
100
22 Components of other comprehensive incomeThe movements on the components of the other comprehensive income (loss) for the years ended December 31, 2012, 2013 and 2014 is as follows:
2012 2013 2014
Controlling interest: Valuation of the derivative financial instruments, net of deferred taxes Ps. ( 253,428) Ps. ( 741,321) Ps. ( 329,112) Translation effect of foreign subsidiaries and associates ( 32,899,915) ( 26,485,343) ( 5,786,883) Remeasurement of defined benefit plan, net of deferred taxes 2,377,006 ( 2,289,811) ( 6,625,463) Non-controlling interest of the items above ( 444,290) ( 550,586) ( 635,804)Other comprehensive loss Ps. ( 31,220,627) Ps. ( 30,067,061) Ps. ( 13,377,262)
23 Subsequent Eventsa) On January 9, 2015, the Federal Telecommunications Institute (Instituto Federal de Telecomunicaciones, or “IFT”) imposed a fine of Ps.14,400 on Telmex for failing to disclose to the IFT, in November of 2008, what the IFT has called a merger (concentración) between Telmex and Dish México Holdings, S. de R.L. de C.V., and its related companies. AMX will exercise any and all legal remedies to challenge the IFT’s resolution.
b) On January 2015, the Company (through its subsidiary “Tracfone”) and the Federal Trade Commission (“FTC”) finalized the terms of a stipulated order, related to the Company’s prior practice of marketing data. The order included payment of US$40,000 to the FTC to be deposited into a fund administered by the FTC or its designee to be used for consumer redress as a fixed payment amount, and for any expenses for the administration of the fund.
As of December 31, 2014, the Company had recorded a provision for settlement of the FTC and class action law suits. The total amount of US$45,100 was included in accounts payable in the consolidated statements of financial position as of December 31, 2014, and as Other expenses in the consolidated statement of comprehensive income for the year ended December 31, 2014.
c) On March, 2015, the Company reported that its Board of Directors decided to submit to the Annual Ordinary General Shareholders’ Meeting to be held on or before April 30,2015 to (i) pay a cash dividend from the profit tax account (cuenta de utilidad fiscal or “CUFIN”), of Ps.0.26 , payable in two installments, to each of the shares of its capital stock series “AA”, “A” and “L” (which includes the preferred dividend correspondent to the series “L” shares), subject to adjustments arising from other corporate events (including repurchase or placement of its own shares), that may vary the number of shares outstanding as of the date of said dividend payment;(ii) pay a cash dividend from the profit tax account CUFIN, of Ps.0.30 , payable in one installment during September 2015, to each of the shares of its capital stock series “AA”, “A” and “L”, subject to adjustments arising from other corporate events (including repurchase or placement of its own shares), that may vary the number of shares outstanding as of the date of said dividend payment; and (iii) allocate the amount of Ps.35,000,000, to repurchase shares from April 2015 to April 2016.
d) On March 2015, the Company entered that a settlement agreement has been entered into with Axtel, S.A.B. de C.V. and Avantel, S. de R.L. de C.V. (collectively, “Axtel”). Pursuant to such settlement agreement, certain disputes regarding termination rates and related interconnection matters have been finally settled between Axtel, on the one hand, and Telcel, Telmex and Teléfonos del Noroeste (“Telnor”), on the other.
As part of the settlement agreement, Axtel and Telcel executed interconnection services agreements. With the execution of these agreements all disputes regarding mobile termination rates and related interconnection proceedings that started in 2005 have been finally settled between the parties. In addition, disputed and outstanding amounts related to mobile termination services for the period from 2005 to 2014 have been paid.
In consideration for the execution of the settlement agreement; the execution of interconnection services agreements with Telcel for the period from 2005 to 2015; the settlement and termination of certain existing disputes and claims with Telcel, Telmex and Telnor; and the assignment to América Móvil of certain litigation rights arising from administrative and judicial proceedings existing between the parties, América Móvil paid Axtel Ps.950,000, which was recognized in the consolidated statement of comprehensive income for the year ended December 31, 2014.
e) On April 17, 2015 the Extraordinary Shareholders’ approved the spin-off from América Móvil of a newly created company, and the contribution to such new company of certain assets (mainly comprised of the passive infrastructure used by its wireless operations in Mexico), liabilities and equity.
24 Supplemental Guarantor InformationAs mentioned in Note 16, the Company has issued senior notes in the United States. These notes are fully and unconditionally guaranteed by Telcel.
Consolidating Condensed Financial Information
The following consolidating information presents condensed consolidating statement of financial position as of December 31, 2013 and 2014 and condensed consolidating statements of comprehensive income and cash flows for each of the three years in the period ended December 31, 2014 of the Company and Telcel (the “wholly-owned Guarantor Subsidiary”). These statements are prepared in accordance with IFRS with the exception that the subsidiaries are accounted for as investments under the equity method rather than being consolidated. The guarantees of the Guarantor are full and unconditional.

101
The Company’s consolidating condensed financial information for the (i) Company; (ii) its wholly-owned subsidiary Telcel (on standalone basis), which is a wholly and unconditional guarantor under the Senior Notes; (iii) the combined non-guarantor subsidiaries; iv) eliminations and v) the Company’s consolidated financial statements are as follows:
As of December 31, 2013 Wholly-owned Combined Guarantor non-guarantor Consolidated Parent Subsidiary Subsidiaries Eliminations Total
Assets: Cash and cash equivalents Ps. 15,818,207 Ps. 1,227,994 Ps. 31,117,349 Ps. – Ps. 48,163,550 Accounts receivable, net 44,885,269 12,962,566 80,494,138 138,341,973 Related parties 147,109,666 15,509,108 165,344,115 Ps. ( 326,616,497) 1,346,392 Inventories, net 448,408 19,933,734 16,373,268 ( 36,457) 36,718,953 Other current assets 607,696 11,519,504 12,127,200 Property, plant and equipment, net 8,852,264 36,416,986 455,837,701 501,106,951 Investments in associated companies 610,075,358 109,257,851 96,096,875 ( 726,543,060) 88,887,024 Intangible assets and other non-current assets, net 6,925,695 12,869,281 179,105,414 198,900,390Total assets Ps. 834,114,867 Ps. 208,785,216 Ps. 1,035,888,364 Ps. ( 1,053,196,014) Ps. 1,025,592,433
Liabilities: Short-term debt and current portion of long-term debt Ps. 14,228,350 Ps. – Ps. 12,216,885 Ps. ( 603,757) Ps. 25,841,478 Current liabilities 186,048,150 199,125,611 184,541,352 ( 321,601,637) 248,113,476 Long-term debt 425,530,317 38,948,049 464,478,366 Other non-current liabilities 5,907,439 2,486,212 72,911,945 ( 4,447,560) 76,858,036Total liabilities 631,714,256 201,611,823 308,618,231 ( 326,652,954) 815,291,356
Equity attributable to equity holders of the parent 202,400,611 7,173,393 717,119,500 ( 724,292,893) 202,400,611Non-controlling interests 10,150,633 ( 2,250,167) 7,900,466Total equity 202,400,611 7,173,393 727,270,133 ( 726,543,060) 210,301,077Total liabilities and equity Ps. 834,114,867 Ps. 208,785,216 Ps. 1,035,888,364 Ps. ( 1,053,196,014) Ps. 1,025,592,433
As of December 31, 2014 Wholly-owned Combined Guarantor non-guarantor Consolidated Parent Subsidiary Subsidiaries Eliminations Total
Assets: Cash and cash equivalents Ps. 25,654,314 Ps. 1,394,691 Ps. 39,424,698 Ps. – Ps. 66,473,703 Accounts receivable, net 77,630,240 13,395,305 77,094,918 168,120,463 Related parties 157,743,960 18,122,176 464,962,866 ( 639,508,895) 1,320,107 Inventories, net 230,922 17,502,817 18,223,696 ( 27,153) 35,930,282 Other current assets 776,380 15,787,222 16,563,602 Property, plant and equipment, net 6,346,798 31,545,761 557,703,759 595,596,318 Investments in associated companies 639,676,336 90,638,813 72,404,950 ( 753,457,518) 49,262,581 Intangible assets and other non-current assets, net 1,644,636 14,307,317 329,137,660 345,089,613Total assets Ps. 908,927,206 Ps. 187,683,260 Ps. 1,574,739,769 Ps. ( 1,392,993,566) Ps. 1,278,356,669
Liabilities: Short-term debt and current portion of long-term debt Ps. 31,749,264 Ps. – Ps. 26,848,979 Ps. ( 792,726) Ps. 57,805,517 Current liabilities 249,303,984 164,548,238 541,189,823 ( 633,935,938) 321,106,107 Long-term debt 445,485,243 100,464,227 545,949,470 Other non-current liabilities ( 1,995,561) 19,807 125,639,665 ( 4,807,384) 118,856,527Total liabilities 724,542,930 164,568,045 794,142,694 ( 639,536,048) 1,043,717,621
Equity attributable to equity holders of the parent 184,384,276 23,115,215 727,990,597 ( 751,105,812) 184,384,276Non-controlling interests 52,606,478 ( 2,351,706) 50,254,772Total equity 184,384,276 23,115,215 780,597,075 ( 753,457,518) 234,639,048Total liabilities and equity Ps. 908,927,206 Ps. 187,683,260 Ps. 1,574,739,769 Ps. ( 1,392,993,566) Ps. 1,278,356,669
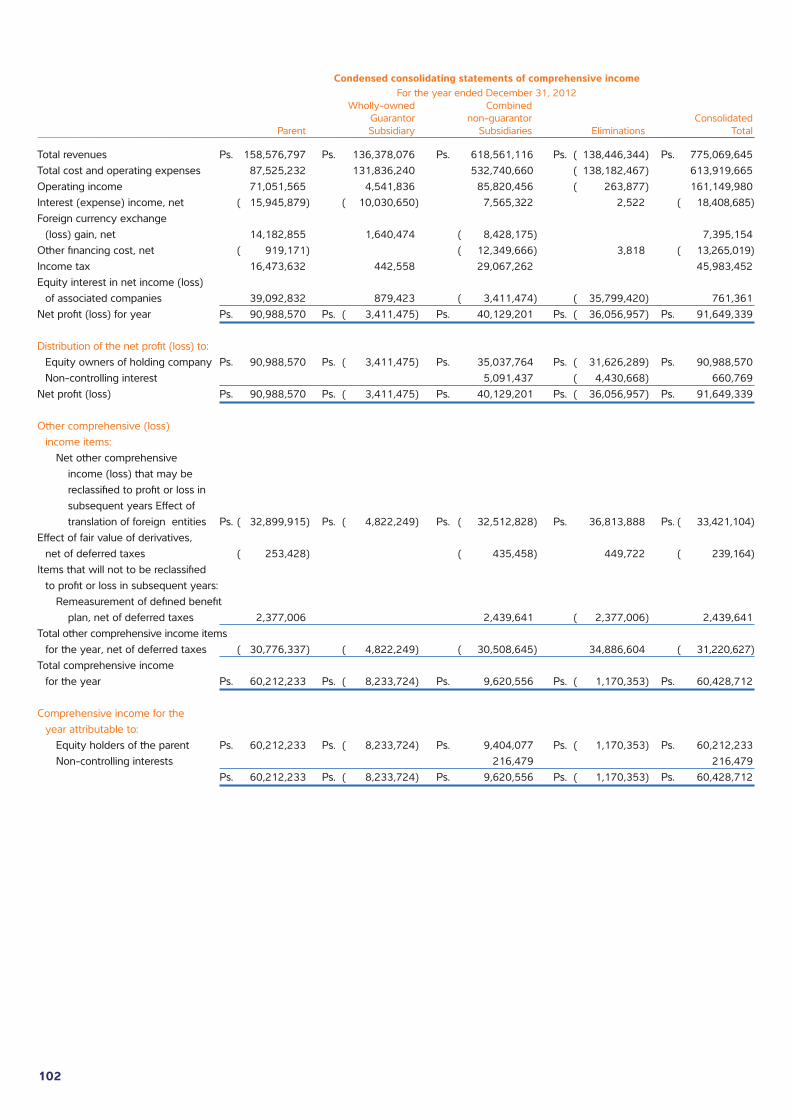
102
Condensed consolidating statements of comprehensive income For the year ended December 31, 2012 Wholly-owned Combined Guarantor non-guarantor Consolidated Parent Subsidiary Subsidiaries Eliminations Total
Total revenues Ps. 158,576,797 Ps. 136,378,076 Ps. 618,561,116 Ps. ( 138,446,344) Ps. 775,069,645Total cost and operating expenses 87,525,232 131,836,240 532,740,660 ( 138,182,467) 613,919,665Operating income 71,051,565 4,541,836 85,820,456 ( 263,877) 161,149,980Interest (expense) income, net ( 15,945,879) ( 10,030,650) 7,565,322 2,522 ( 18,408,685)Foreign currency exchange (loss) gain, net 14,182,855 1,640,474 ( 8,428,175) 7,395,154Other financing cost, net ( 919,171) ( 12,349,666) 3,818 ( 13,265,019)Income tax 16,473,632 442,558 29,067,262 45,983,452Equity interest in net income (loss) of associated companies 39,092,832 879,423 ( 3,411,474) ( 35,799,420) 761,361Net profit (loss) for year Ps. 90,988,570 Ps. ( 3,411,475) Ps. 40,129,201 Ps. ( 36,056,957) Ps. 91,649,339
Distribution of the net profit (loss) to: Equity owners of holding company Ps. 90,988,570 Ps. ( 3,411,475) Ps. 35,037,764 Ps. ( 31,626,289) Ps. 90,988,570 Non-controlling interest 5,091,437 ( 4,430,668) 660,769Net profit (loss) Ps. 90,988,570 Ps. ( 3,411,475) Ps. 40,129,201 Ps. ( 36,056,957) Ps. 91,649,339
Other comprehensive (loss) income items: Net other comprehensive income (loss) that may be reclassified to profit or loss in subsequent years Effect of translation of foreign entities Ps. ( 32,899,915) Ps. ( 4,822,249) Ps. ( 32,512,828) Ps. 36,813,888 Ps. ( 33,421,104)Effect of fair value of derivatives, net of deferred taxes ( 253,428) ( 435,458) 449,722 ( 239,164)Items that will not to be reclassified to profit or loss in subsequent years: Remeasurement of defined benefit plan, net of deferred taxes 2,377,006 2,439,641 ( 2,377,006) 2,439,641Total other comprehensive income items for the year, net of deferred taxes ( 30,776,337) ( 4,822,249) ( 30,508,645) 34,886,604 ( 31,220,627)Total comprehensive income for the year Ps. 60,212,233 Ps. ( 8,233,724) Ps. 9,620,556 Ps. ( 1,170,353) Ps. 60,428,712
Comprehensive income for the year attributable to: Equity holders of the parent Ps. 60,212,233 Ps. ( 8,233,724) Ps. 9,404,077 Ps. ( 1,170,353) Ps. 60,212,233 Non-controlling interests 216,479 216,479 Ps. 60,212,233 Ps. ( 8,233,724) Ps. 9,620,556 Ps. ( 1,170,353) Ps. 60,428,712

103
Condensed consolidating statements of comprehensive income For the year ended December 31, 2013
Wholly-owned Combined Guarantor non-guarantor Consolidated Parent Subsidiary Subsidiaries Eliminations Total
Total revenues Ps. 177,392,370 Ps. 147,484,740 Ps. 634,406,203 Ps. ( 173,182,292) Ps. 786,101,021Total cost and operating expenses 103,305,197 145,880,447 552,650,315 ( 169,992,694) 631,843,265Operating income 74,087,173 1,604,293 81,755,888 ( 3,189,598) 154,257,756Interest (expense) income, net ( 19,499,075) ( 10,232,219) 8,795,367 ( 88,892) ( 21,024,819)Foreign currency exchange (loss) gain, net ( 5,715,711) ( 205,605) ( 13,689,149) ( 19,610,465)Other financing cost, net 4,407,649 ( 12,713,117) 13,933 ( 8,291,535)Income tax 9,420,673 ( 1,473,226) 22,445,284 30,392,731Equity interest in net income of associated companies 30,765,616 ( 41,170) ( 7,401,474) ( 23,286,690) 36,282Net profit (loss) for year Ps. 74,624,979 Ps. ( 7,401,475) Ps. 34,302,231 Ps. ( 26,551,247) Ps. 74,974,488
Distribution of the net profit (loss) to: Equity owners of holding company Ps. 74,624,979 Ps. ( 7,401,475) Ps. 33,737,205 Ps. ( 26,335,730) Ps. 74,624,979 Non-controlling interest 565,026 ( 215,517) 349,509Net profit (loss) Ps. 74,624,979 Ps. ( 7,401,475) Ps. 34,302,231 Ps. ( 26,551,247) Ps. 74,974,488
Other comprehensive income items:Net other comprehensive income (loss) that may be reclassified to profit or loss in subsequent years Effect of translation of foreign entities Ps. ( 26,485,343) Ps. ( 3,442,578) Ps. ( 26,485,343) Ps. 29,524,982 Ps. ( 26,888,282)Effect of fair value of derivatives, net of deferred taxes ( 741,321) ( 658,570) ( 833,613) 1,492,764 ( 740,740)Items that will not to be reclassified to profit or loss in subsequent years:Remeasurement of defined benefit plan, net of deferred taxes ( 2,289,811) ( 3,874,354) 3,726,126 ( 2,438,039)Total other comprehensive loss items for the year ( 29,516,475) ( 4,101,148) ( 31,193,310) 34,743,872 ( 30,067,061)Total comprehensive income for the year Ps. 45,108,504 Ps. ( 11,502,623) Ps. 3,108,921 Ps. 8,192,625 Ps. 44,907,427
Comprehensive income for the year attributable to: Equity holders of the parent Ps. 45,108,504 Ps. ( 11,502,623) Ps. 3,309,998 Ps. 8,192,625 Ps. 45,108,504 Non-controlling interests ( 201,077) ( 201,077) Ps. 45,108,504 Ps. ( 11,502,623) Ps. 3,108,921 Ps. 8,192,625 Ps. 44,907,427

104
Condensed consolidating statements of comprehensive income For the year ended December 31, 2014 Wholly-owned Combined Guarantor non-guarantor Consolidated Parent Subsidiary Subsidiaries Eliminations Total
Total revenues Ps. 177,253,309 Ps. 160,813,209 Ps. 684,868,563 Ps. ( 174,673,261) Ps. 848,261,820Total cost and operating expenses 128,116,283 141,434,298 604,910,204 ( 182,753,215) 691,707,570Operating income 49,137,026 19,378,911 79,958,359 8,079,954 156,554,250Interest (expense) income, net ( 28,644,460) ( 9,557,003) 13,877,738 ( 146,527) ( 24,470,252)Foreign currency exchange (loss) gain, net ( 9,171,796) ( 1,067,727) ( 18,375,936) ( 28,615,459)Other financing cost, net 5,940,256 ( 16,135,030) 4,513 ( 10,190,261)Income tax 9,988,723 4,917,194 24,801,632 39,707,549Equity interest in net income of associated companies 38,649,910 ( 4,185,854) ( 348,866) ( 40,188,199) ( 6,073,009)Net profit (loss) for year Ps. 45,922,213 Ps. ( 348,867) Ps. 34,174,633 Ps. ( 32,250,259) Ps. 47,497,720
Distribution of the net profit (loss) to:Equity owners of holding company Ps. 45,922,213 Ps. ( 348,867) Ps. 32,717,012 Ps. ( 32,143,988) Ps. 46,146,370Non-controlling interest 1,457,621 ( 106,271) 1,351,350Net profit (loss) Ps. 45,922,213 Ps. ( 348,867) Ps. 34,174,633 Ps. ( 32,250,259) Ps. 47,497,720
Other comprehensive income items:Net other comprehensive income (loss) to be reclassified to profit or loss in subsequent years: Effect of translation of foreign entities Ps. ( 5,786,883) Ps. 2,718,279 Ps. ( 1,209,846) Ps. ( 1,977,265) Ps. ( 6,255,715) Effect of fair value of derivatives, net of deferred taxes ( 329,112) ( 815,484) ( 366,195) 1,197,219 ( 313,572)
Items not to be reclassified to profit or loss in subsequent years: Remeasurement of defined benefit plan, net of income tax effect ( 6,625,463) ( 6,512,408) 6,329,896 ( 6,807,975)
Total other comprehensive income items for the period ( 12,741,458) 1,902,795 ( 8,088,449) 5,549,850 ( 13,377,262)Total comprehensive income for the period Ps. 33,180,755 Ps. 1,553,928 Ps. 26,086,184 Ps. ( 26,700,409) Ps. 34,120,458Comprehensive income for the period attributable to: Equity holders of the parent Ps. 33,180,755 Ps. 1,553,928 Ps. 25,370,638 Ps. ( 26,700,409) Ps. 33,404,912 Non-controlling interests 715,546 715,546 Ps. 33,180,755 Ps. 1,553,928 Ps. 26,086,184 Ps. ( 26,700,409) Ps. 34,120,458
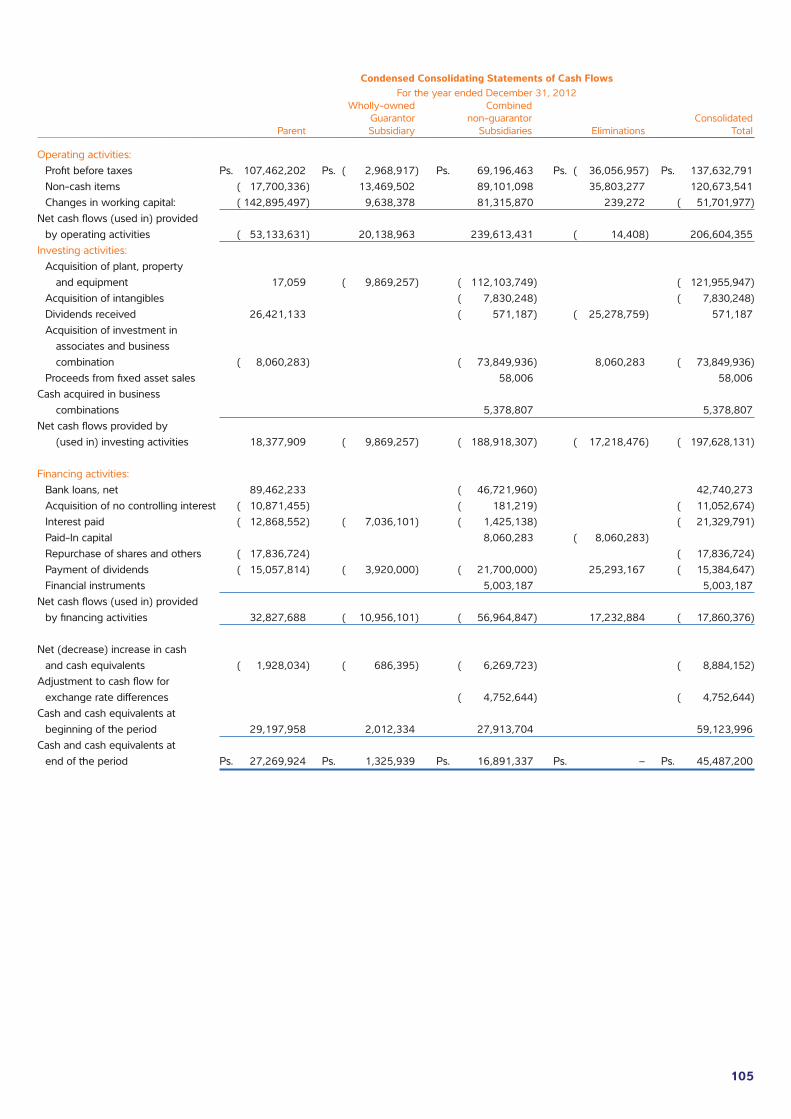
105
Condensed Consolidating Statements of Cash Flows For the year ended December 31, 2012 Wholly-owned Combined Guarantor non-guarantor Consolidated Parent Subsidiary Subsidiaries Eliminations Total
Operating activities: Profit before taxes Ps. 107,462,202 Ps. ( 2,968,917) Ps. 69,196,463 Ps. ( 36,056,957) Ps. 137,632,791 Non-cash items ( 17,700,336) 13,469,502 89,101,098 35,803,277 120,673,541 Changes in working capital: ( 142,895,497) 9,638,378 81,315,870 239,272 ( 51,701,977)Net cash flows (used in) provided by operating activities ( 53,133,631) 20,138,963 239,613,431 ( 14,408) 206,604,355Investing activities: Acquisition of plant, property and equipment 17,059 ( 9,869,257) ( 112,103,749) ( 121,955,947) Acquisition of intangibles ( 7,830,248) ( 7,830,248) Dividends received 26,421,133 ( 571,187) ( 25,278,759) 571,187 Acquisition of investment in associates and business combination ( 8,060,283) ( 73,849,936) 8,060,283 ( 73,849,936) Proceeds from fixed asset sales 58,006 58,006Cash acquired in business combinations 5,378,807 5,378,807Net cash flows provided by (used in) investing activities 18,377,909 ( 9,869,257) ( 188,918,307) ( 17,218,476) ( 197,628,131)
Financing activities: Bank loans, net 89,462,233 ( 46,721,960) 42,740,273 Acquisition of no controlling interest ( 10,871,455) ( 181,219) ( 11,052,674) Interest paid ( 12,868,552) ( 7,036,101) ( 1,425,138) ( 21,329,791) Paid-In capital 8,060,283 ( 8,060,283) Repurchase of shares and others ( 17,836,724) ( 17,836,724) Payment of dividends ( 15,057,814) ( 3,920,000) ( 21,700,000) 25,293,167 ( 15,384,647) Financial instruments 5,003,187 5,003,187Net cash flows (used in) provided by financing activities 32,827,688 ( 10,956,101) ( 56,964,847) 17,232,884 ( 17,860,376)
Net (decrease) increase in cash and cash equivalents ( 1,928,034) ( 686,395) ( 6,269,723) ( 8,884,152)Adjustment to cash flow for exchange rate differences ( 4,752,644) ( 4,752,644)Cash and cash equivalents at beginning of the period 29,197,958 2,012,334 27,913,704 59,123,996Cash and cash equivalents at end of the period Ps. 27,269,924 Ps. 1,325,939 Ps. 16,891,337 Ps. – Ps. 45,487,200

106
Condensed Consolidating Statements of Cash Flows For the year ended December 31, 2013 Wholly-owned Combined Guarantor non-guarantor Consolidated Parent Subsidiary Subsidiaries Eliminations Total
Operating activities: Profit before taxes Ps. 84,045,652 Ps. ( 8,874,701) Ps. 56,747,515 Ps. ( 26,551,247) Ps. 105,367,219 Non-cash items 43,845,079 15,791,372 63,265,973 23,286,691 146,189,115 Changes in working capital: ( 34,873,416) 7,885,804 ( 40,043,987) 3,264,556 ( 63,767,042)Net cash flows (used in) provided by operating activities 93,017,315 14,802,475 79,969,501 187,789,292
Investing activities: Acquisition of plant, property and equipment 69,274 ( 16,044,251) ( 102,441,309) ( 118,416,286) Acquisition of licenses ( 3,334,464) ( 3,334,464) Dividends received 212,394 212,394 Acquisition of non-controlling interest ( 341,966) ( 1,730,588) 341,966 ( 1,730,588) Fixed asset sales 44,045 44,045 Acquisition of investments in associates and business combination ( 15,366,062) ( 15,366,062) Partial sale of shares of associated company 4,299,360 4,299,360Net cash flows provided by (used in) investing activities ( 272,692) ( 16,044,251) ( 118,316,624) 341,966 ( 134,291,601)
Financing activities: Bank loans, net 70,907,667 ( 5,317,148) 65,590,519 Acquisition of no controlling interest ( 72,016,331) 69,448,722 ( 2,567,609) Interest paid ( 16,839,948) 1,143,831 ( 6,958,002) ( 22,654,119) Paid-In capital 341,966 ( 341,966) Repurchase of shares and others ( 70,745,785) ( 70,745,785) Payment of dividends ( 15,501,944) ( 220,632) ( 15,722,576) Financial instruments ( 546,770) ( 546,770)Net cash flows (used in) provided by financing activities ( 104,196,341) 1,143,831 56,748,136 ( 341,966) ( 46,646,340)Net (decrease) increase in cash and cash equivalents ( 11,451,717) ( 97,945) 18,401,013 6,851,351Adjustment to cash flow for exchange rate differences ( 4,175,001) ( 4,175,001)Cash and cash equivalents at beginning of the period 27,269,924 1,325,939 16,891,337 45,487,200Cash and cash equivalents at end of the period Ps. 15,818,207 Ps. 1,227,994 Ps. 31,117,349 Ps. – Ps. 48,163,550
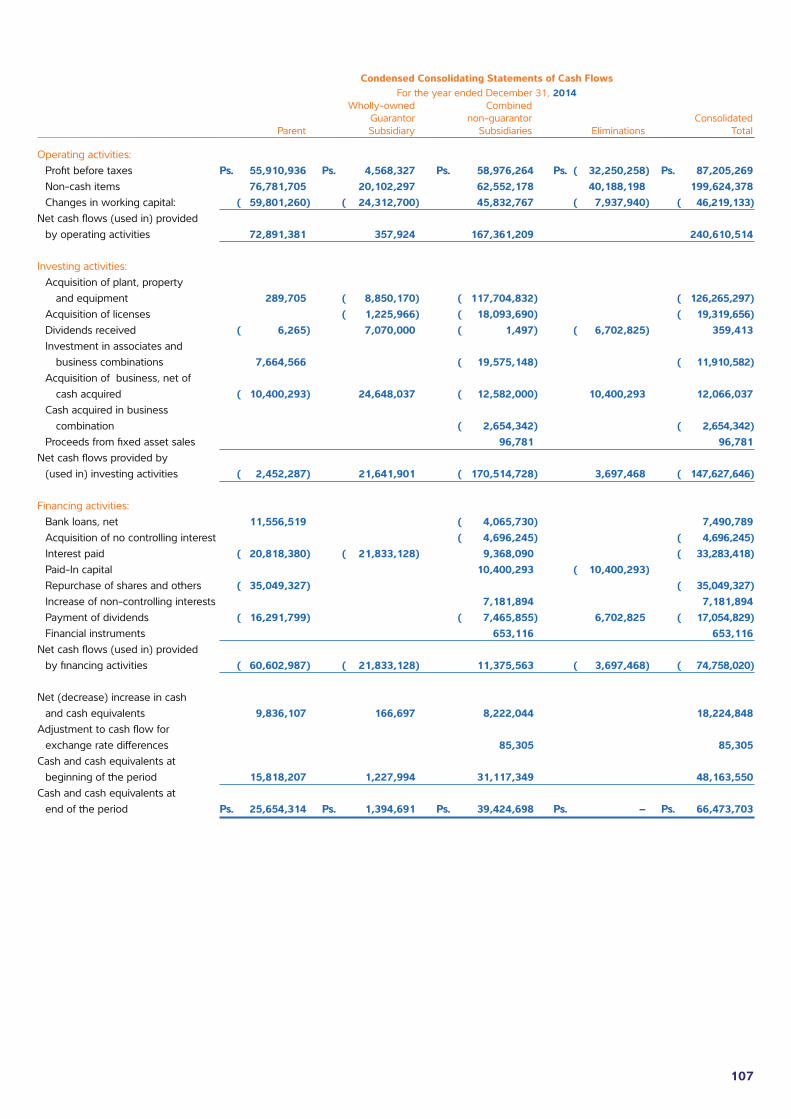
107
Condensed Consolidating Statements of Cash Flows For the year ended December 31, 2014 Wholly-owned Combined Guarantor non-guarantor Consolidated Parent Subsidiary Subsidiaries Eliminations Total
Operating activities: Profit before taxes Ps. 55,910,936 Ps. 4,568,327 Ps. 58,976,264 Ps. ( 32,250,258) Ps. 87,205,269 Non-cash items 76,781,705 20,102,297 62,552,178 40,188,198 199,624,378 Changes in working capital: ( 59,801,260) ( 24,312,700) 45,832,767 ( 7,937,940) ( 46,219,133)Net cash flows (used in) provided by operating activities 72,891,381 357,924 167,361,209 240,610,514
Investing activities: Acquisition of plant, property and equipment 289,705 ( 8,850,170) ( 117,704,832) ( 126,265,297) Acquisition of licenses ( 1,225,966) ( 18,093,690) ( 19,319,656) Dividends received ( 6,265) 7,070,000 ( 1,497) ( 6,702,825) 359,413 Investment in associates and business combinations 7,664,566 ( 19,575,148) ( 11,910,582) Acquisition of business, net of cash acquired ( 10,400,293) 24,648,037 ( 12,582,000) 10,400,293 12,066,037 Cash acquired in business combination ( 2,654,342) ( 2,654,342) Proceeds from fixed asset sales 96,781 96,781Net cash flows provided by (used in) investing activities ( 2,452,287) 21,641,901 ( 170,514,728) 3,697,468 ( 147,627,646)
Financing activities: Bank loans, net 11,556,519 ( 4,065,730) 7,490,789 Acquisition of no controlling interest ( 4,696,245) ( 4,696,245) Interest paid ( 20,818,380) ( 21,833,128) 9,368,090 ( 33,283,418) Paid-In capital 10,400,293 ( 10,400,293) Repurchase of shares and others ( 35,049,327) ( 35,049,327) Increase of non-controlling interests 7,181,894 7,181,894 Payment of dividends ( 16,291,799) ( 7,465,855) 6,702,825 ( 17,054,829) Financial instruments 653,116 653,116Net cash flows (used in) provided by financing activities ( 60,602,987) ( 21,833,128) 11,375,563 ( 3,697,468) ( 74,758,020)
Net (decrease) increase in cash and cash equivalents 9,836,107 166,697 8,222,044 18,224,848Adjustment to cash flow for exchange rate differences 85,305 85,305Cash and cash equivalents at beginning of the period 15,818,207 1,227,994 31,117,349 48,163,550Cash and cash equivalents at end of the period Ps. 25,654,314 Ps. 1,394,691 Ps. 39,424,698 Ps. – Ps. 66,473,703
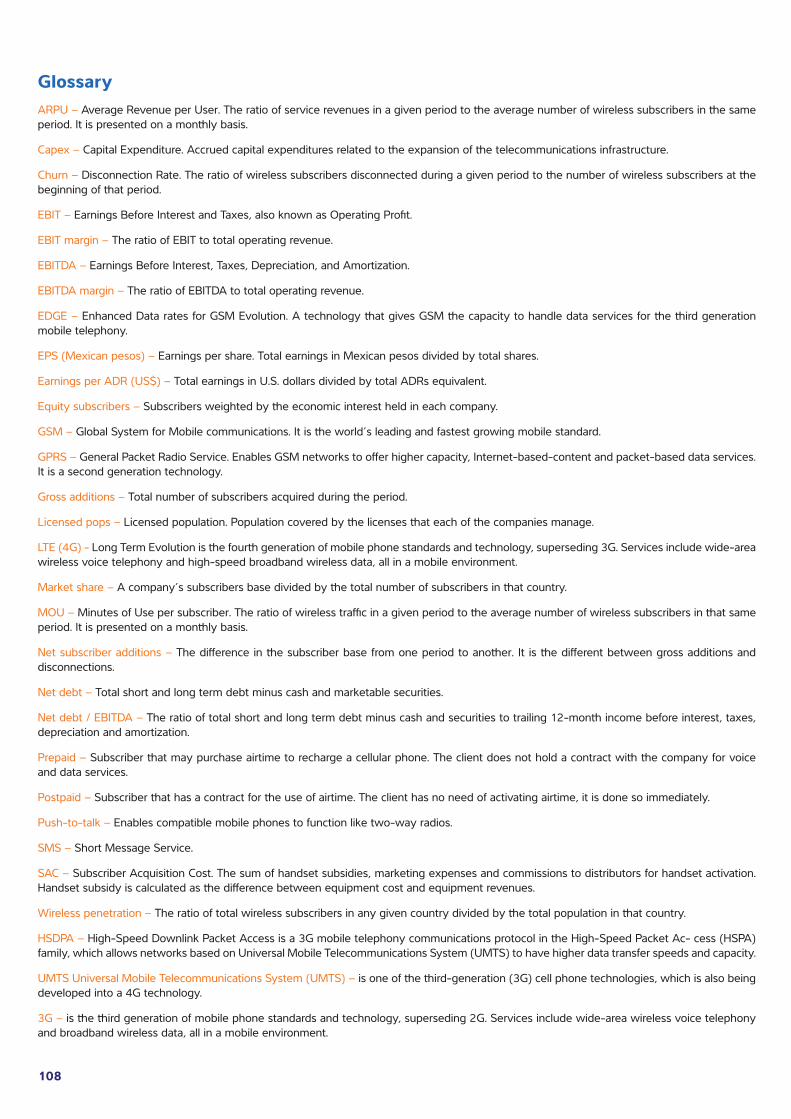
108
GlossaryARPU – Average Revenue per User. The ratio of service revenues in a given period to the average number of wireless subscribers in the same period. It is presented on a monthly basis.
Capex – Capital Expenditure. Accrued capital expenditures related to the expansion of the telecommunications infrastructure.
Churn – Disconnection Rate. The ratio of wireless subscribers disconnected during a given period to the number of wireless subscribers at the beginning of that period.
EBIT – Earnings Before Interest and Taxes, also known as Operating Profit.
EBIT margin – The ratio of EBIT to total operating revenue.
EBITDA – Earnings Before Interest, Taxes, Depreciation, and Amortization.
EBITDA margin – The ratio of EBITDA to total operating revenue.
EDGE – Enhanced Data rates for GSM Evolution. A technology that gives GSM the capacity to handle data services for the third generation mobile telephony.
EPS (Mexican pesos) – Earnings per share. Total earnings in Mexican pesos divided by total shares.
Earnings per ADR (US$) – Total earnings in U.S. dollars divided by total ADRs equivalent.
Equity subscribers – Subscribers weighted by the economic interest held in each company.
GSM – Global System for Mobile communications. It is the world’s leading and fastest growing mobile standard.
GPRS – General Packet Radio Service. Enables GSM networks to offer higher capacity, Internet-based-content and packet-based data services. It is a second generation technology.
Gross additions – Total number of subscribers acquired during the period.
Licensed pops – Licensed population. Population covered by the licenses that each of the companies manage.
LTE (4G) - Long Term Evolution is the fourth generation of mobile phone standards and technology, superseding 3G. Services include wide-area wireless voice telephony and high-speed broadband wireless data, all in a mobile environment.
Market share – A company’s subscribers base divided by the total number of subscribers in that country.
MOU – Minutes of Use per subscriber. The ratio of wireless traffic in a given period to the average number of wireless subscribers in that same period. It is presented on a monthly basis.
Net subscriber additions – The difference in the subscriber base from one period to another. It is the different between gross additions and disconnections.
Net debt – Total short and long term debt minus cash and marketable securities.
Net debt / EBITDA – The ratio of total short and long term debt minus cash and securities to trailing 12-month income before interest, taxes, depreciation and amortization.
Prepaid – Subscriber that may purchase airtime to recharge a cellular phone. The client does not hold a contract with the company for voice and data services.
Postpaid – Subscriber that has a contract for the use of airtime. The client has no need of activating airtime, it is done so immediately.
Push-to-talk – Enables compatible mobile phones to function like two-way radios.
SMS – Short Message Service.
SAC – Subscriber Acquisition Cost. The sum of handset subsidies, marketing expenses and commissions to distributors for handset activation. Handset subsidy is calculated as the difference between equipment cost and equipment revenues.
Wireless penetration – The ratio of total wireless subscribers in any given country divided by the total population in that country.
HSDPA – High-Speed Downlink Packet Access is a 3G mobile telephony communications protocol in the High-Speed Packet Ac- cess (HSPA) family, which allows networks based on Universal Mobile Telecommunications System (UMTS) to have higher data transfer speeds and capacity.
UMTS Universal Mobile Telecommunications System (UMTS) – is one of the third-generation (3G) cell phone technologies, which is also being developed into a 4G technology.
3G – is the third generation of mobile phone standards and technology, superseding 2G. Services include wide-area wireless voice telephony and broadband wireless data, all in a mobile environment.

Corporate OfficesLago Zurich 245, Colonia Ampliación Granada, México, D F , C P 11529
Investor RelationsContact: Daniela Lecuonadaniela lecuona@americamovil comLago Zurich 245, edif Telcel,Piso 16, Colonia Ampliación Granada, México, D F ,C P 11529Tel: 52 (55) 25 81 44 49Fax: 52 (55) 25 81 44 22www.americamovil.com
Shares traded in México“A”: Bolsa Mexicana de Valores, Symbol: AMX A“L”: Bolsa Mexicana de Valores, Symbol: AMX L
Shares traded in the USADS: New York Stock ExchangeSymbol: AMXOne ADS represents 20 “L” sharesADS: NASDAQSymbol: AMOV One ADS represents 20 “A” shares
Shares traded in Spain“L”: LATIBEX Mercado de Valores Latinoamericanos en EurosSymbol: XAMXL
Depositary agent in the USThe Bank of New York Mellon Corporation (BNY Mellon)Investor ServicesP O Box 43006, Providence, RI 02940-3006,Toll Free Tel # for domestic callers: 1 888 BNY ADRsInternational callers: 201 680 6825www stockbny com/shareownershrrelations@bnymellon com
LATIBEX liaisonSantander Investment Services, S A Ave De Cantabria s/n, 28660,Boadilla del Monte, Madrid, EspañaTel: 34 (91) 289 39 43Fax: 34 (91) 257 10 26
Independent AuditorsMancera, S C , A Member Practice ofErnst & Young Global
This annual report may contain forward-looking statements that reflect the current views and/or expectations of América Móvil and its management with respect to its performance, business and future events Forward looking statements include, without limitation, any statement that may predict, forecast, indicate or imply future results, performance, or achievements, and may contain words like “believe”, “anticipate”, “expect”, “envisages”, “will likely result”, or any other words or phrases of similar meaning Such statements are subject to a number of risks, uncertainties and assumptions We caution you that a number of important factors could cause actual results to differ materially from the plans, objectives, expectations, estimates and intentions expressed in this annual report In no event, neither América Móvil nor any of its subsidiaries, affiliates, directors, officers, agents or employees shall be liable before any third party (including investors) for any investment or business decision made or action taken in reliance on the information and statements contained in this annual report or for any consequential, special or similar damages
design: www signi com mx

AMÉRICAMÓVIL