Ameren Missouri Impact Evaluation: Year
163
Ameren Missouri LightSavers Impact and Process Evaluation: Program Year 2013 May 15, 2014 Ameren Missouri 1901 Chouteau Avenue St. Louis, MO 63103
Transcript of Ameren Missouri Impact Evaluation: Year
Ameren Missouri
LightSavers Impact and
Process Evaluation:
Program Year 2013 May 15, 2014
Ameren Missouri 1901 Chouteau Avenue St. Louis, MO 63103

This page left blank.

Prepared by:
Jane Colby
Laura James
Josh Keeling
Jason Christensen
Doug Bruchs
M. Sami Khawaja, Ph.D.
Cadmus: Energy Services Division

This page left blank.

Table of Contents EXECUTIVE SUMMARY .................................................................................................................................. 1
Program Description ............................................................................................................................... 1
Key Impact Evaluation Findings .............................................................................................................. 1
Gross Impacts ................................................................................................................................... 2
Net Impacts ...................................................................................................................................... 3
Key Process Evaluation Findings ............................................................................................................. 5
Communication and Data Management ......................................................................................... 5
Promotional Events and Product Placement ................................................................................... 6
CFLs and LEDs per Household .......................................................................................................... 6
Key Conclusions and Recommendations ................................................................................................ 6
INTRODUCTION ............................................................................................................................................. 9
Program Description ............................................................................................................................... 9
About the Target Market ........................................................................................................................ 9
About the Program Implementers ......................................................................................................... 9
Program Activity ................................................................................................................................... 10
EVALUATION METHODOLOGY .................................................................................................................... 12
Impact Evaluation Priorities ................................................................................................................. 12
Process Evaluation Priorities ................................................................................................................ 12
TRM Review .......................................................................................................................................... 14
Data Tracking Review ........................................................................................................................... 14
Program Staff Interviews ...................................................................................................................... 14
Marketing and Documents Review ...................................................................................................... 15
Retailer and Manufacturer Interviews ................................................................................................. 15
Store Intercepts Study .......................................................................................................................... 16
SMD Surveys ......................................................................................................................................... 16
HIS ......................................................................................................................................................... 16
HOU Metering Study ............................................................................................................................ 16
Engineering Analysis ............................................................................................................................. 17
Interactive Effects or WHF ................................................................................................................... 17
Demand Elasticity Modeling ................................................................................................................. 18

NTG for SMD .................................................................................................................................. 20
Cost‐Effectiveness Analysis .................................................................................................................. 20
PROCESS EVALUATION FINDINGS ............................................................................................................... 21
Program Design .................................................................................................................................... 21
Changes for PY13 ........................................................................................................................... 21
Upstream Delivery Channels .......................................................................................................... 21
Upstream Coupon Delivery Channel .............................................................................................. 23
SMD ................................................................................................................................................ 23
Program Delivery .................................................................................................................................. 23
Progress Toward Goals .................................................................................................................. 23
Communication, Quality Assurance and Data Management ........................................................ 24
Program Implementation Challenges ............................................................................................ 25
Delivery Successes and Program Achievements ............................................................................ 27
Marketing and Outreach ...................................................................................................................... 27
Program Marketing Goals and Primary Channels .......................................................................... 27
Marketing Materials and Placement ............................................................................................. 28
HIS: Lighting Usage ............................................................................................................................... 31
Program Satisfaction ............................................................................................................................ 35
SMD Customer Satisfaction ........................................................................................................... 35
Corporate Retailer Satisfaction ...................................................................................................... 36
Store‐Level Retailer Satisfaction .................................................................................................... 36
CSR Summary ....................................................................................................................................... 38
GROSS IMPACT EVALUATION RESULTS ....................................................................................................... 39
CFL and LED Gross Savings ............................................................................................................. 40
WattsEE and WattsBase ..................................................................................................................... 41
Leakage (LKG) ................................................................................................................................. 42
Residential/Nonresidential Split (%RES) ........................................................................................ 43
ISR .................................................................................................................................................. 43
HOU (HoursRES and HoursNRes) ........................................................................................................ 45
WHFRES and WHFNRes ....................................................................................................................... 45
Occupancy Sensor Gross Savings ................................................................................................... 46
NET IMPACT EVALUATION RESULTS ........................................................................................................... 48
Free Ridership ....................................................................................................................................... 48
Nonparticipant Lighting Spillover and Market Effects ......................................................................... 51
Market Effects Preponderance of Evidence .................................................................................. 54
Nonparticipant Spillover ....................................................................................................................... 55
Methodology .................................................................................................................................. 55
Results ............................................................................................................................................ 56
BENCHMARKING ......................................................................................................................................... 61
COST‐EFFECTIVENESS RESULTS ................................................................................................................... 65
APPENDIX A. EX POST DEMAND REDUCTIONS ........................................................................................... 67
APPENDIX B. STAKEHOLDER INTERVIEW GUIDE ......................................................................................... 68
APPENDIX C. PARTICIPANT SURVEY INSTRUMENTS ................................................................................... 71
APPENDIX D. RETAILER INTERVIEW GUIDE ................................................................................................. 78
APPENDIX E. STORE INTERCEPTS ANALYSIS ................................................................................................ 91
APPENDIX F. SMD SURVEY ANALYSIS .......................................................................................................... 98
APPENDIX G. HIS ANALYSIS ....................................................................................................................... 108
APPENDIX H. INTERACTIVE EFFECTS ANALYSIS ......................................................................................... 118
APPENDIX I. DEMAND ELASTICITY MODELING ......................................................................................... 135
APPENDIX J. SPILLOVER AND MARKET EFFECTS ANALYSIS ....................................................................... 141
APPENDIX K. MARKETING FINDINGS ........................................................................................................ 151

This page left blank.
1
EXECUTIVE SUMMARY
Ameren Missouri (Ameren) engaged the Cadmus team (composed of Cadmus and Nexant) to perform
annual process and impact evaluations of the LightSavers program for a three‐year period from 2013
through 2015. This annual report covers the impact and process evaluation findings for Program Year
2013 (PY13), the period from January 1, 2013, through December 31, 2013.
Program Description LightSavers is primarily an upstream markdown lighting program, designed to increase sales of energy‐
efficient lighting products through a variety of retail channels. Ameren works with Applied Proactive
Technologies (APT), the LightSavers implementer, to provide a per‐unit discount for eligible compact
fluorescent lamp (CFL) and light‐emitting diode (LED) bulbs and lighting occupancy sensors. In addition
to reducing prices, APT leverages its relationships with participating retailers to relocate discounted
lighting to prominent locations within the store, with Ameren signage and marketing materials nearby.
Energy Federation Incorporated (EFI) also assists in program implementation by maintaining the tracking
system and selling discounted lighting products through an online store.
For retailers without a point‐of‐sale system (that tracks all purchases through computer software),
Ameren provides coupons that customers complete at the register to receive a discount.
In addition to the upstream markdown and coupon elements of the program, LightSavers includes a
social marketing distribution (SMD) element, which provides an avenue to distribute free CFLs to
income‐eligible customers through partnerships with community organizations.
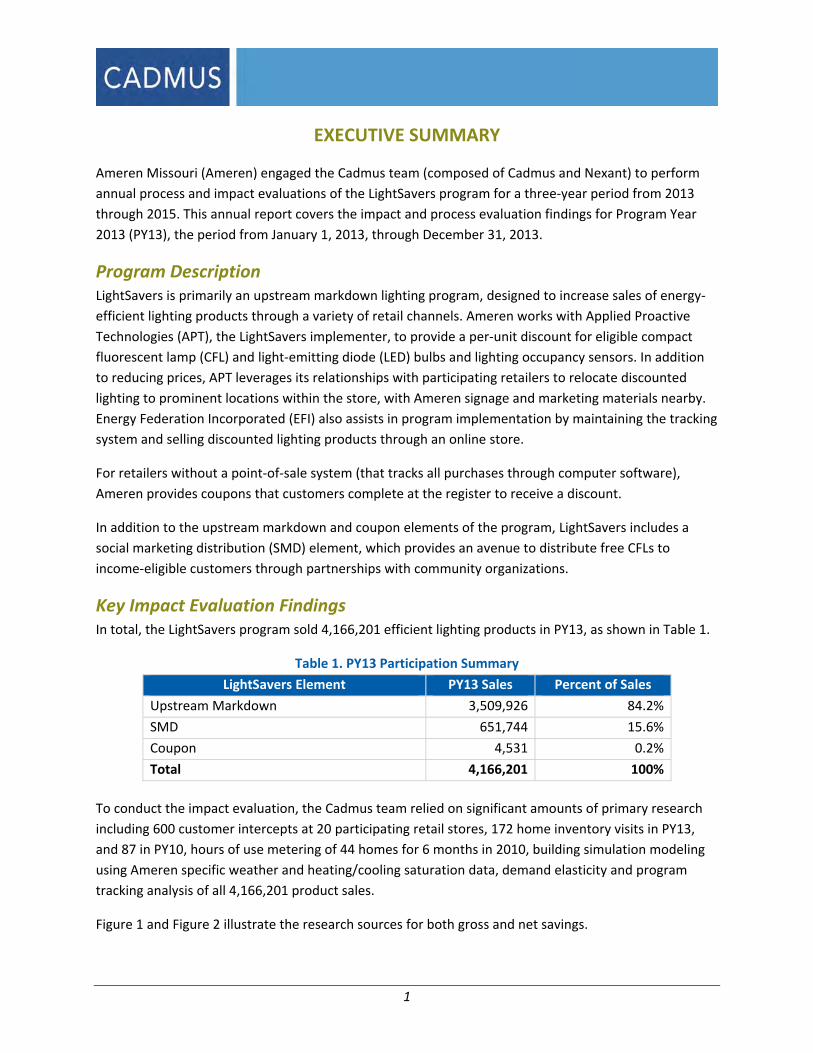
Key Impact Evaluation Findings In total, the LightSavers program sold 4,166,201 efficient lighting products in PY13, as shown in Table 1.
Table 1. PY13 Participation Summary
LightSavers Element PY13 Sales Percent of Sales
Upstream Markdown 3,509,926 84.2%
SMD 651,744 15.6%
Coupon 4,531 0.2%
Total 4,166,201 100%
To conduct the impact evaluation, the Cadmus team relied on significant amounts of primary research
including 600 customer intercepts at 20 participating retail stores, 172 home inventory visits in PY13,
and 87 in PY10, hours of use metering of 44 homes for 6 months in 2010, building simulation modeling
using Ameren specific weather and heating/cooling saturation data, demand elasticity and program
tracking analysis of all 4,166,201 product sales.
Figure 1 and Figure 2 illustrate the research sources for both gross and net savings.

2
Figure 1. Gross Savings Inputs
Figure 2. Net Savings Inputs and Results (Upstream Program)
The Cadmus team’s key impact findings for PY13 follow.
Gross Impacts
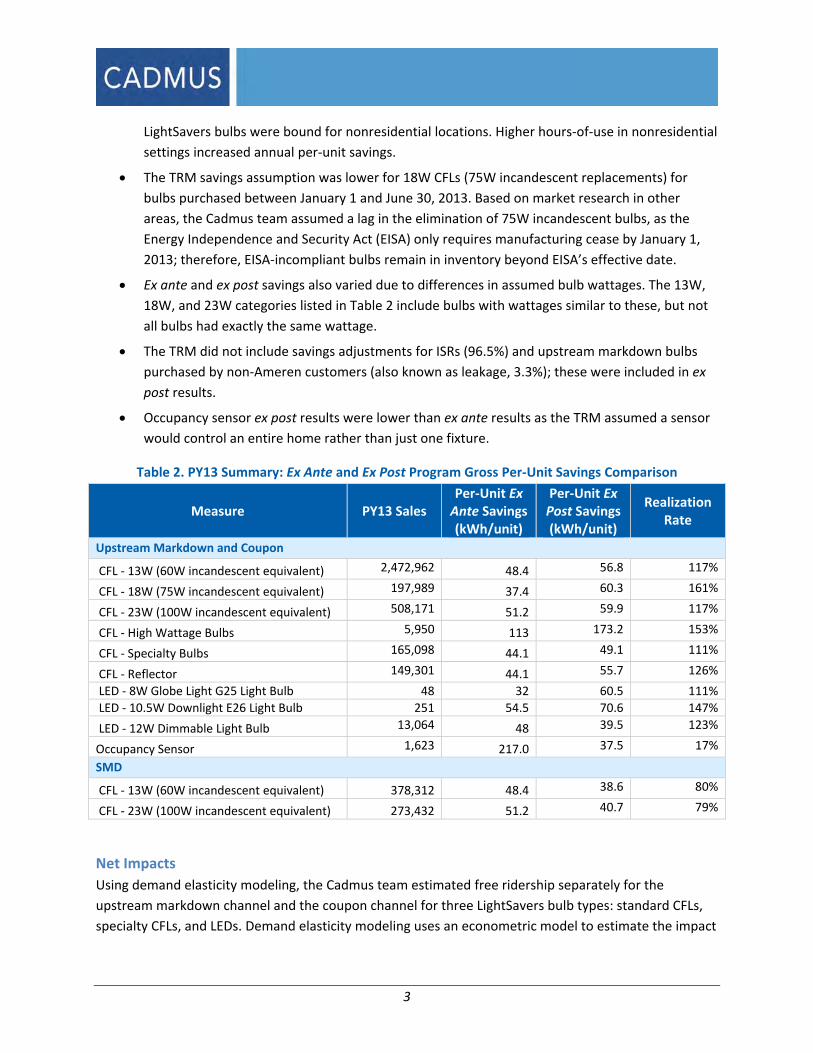
As shown in Table 2, the realization rates of per‐unit ex ante savings—based on Ameren’s Technical
Resource Manual (TRM) and the Cadmus team’s ex post savings—varied by bulb type; however, most
were greater than 100%. The following key factors contributed to the realization rates:
The TRM assumed all program bulbs were installed in residential locations. The Cadmus team,
however, used store intercept surveys with lighting purchasers to determine that 11% of
3
LightSavers bulbs were bound for nonresidential locations. Higher hours‐of‐use in nonresidential
settings increased annual per‐unit savings.
The TRM savings assumption was lower for 18W CFLs (75W incandescent replacements) for
bulbs purchased between January 1 and June 30, 2013. Based on market research in other
areas, the Cadmus team assumed a lag in the elimination of 75W incandescent bulbs, as the
Energy Independence and Security Act (EISA) only requires manufacturing cease by January 1,
2013; therefore, EISA‐incompliant bulbs remain in inventory beyond EISA’s effective date.
Ex ante and ex post savings also varied due to differences in assumed bulb wattages. The 13W,
18W, and 23W categories listed in Table 2 include bulbs with wattages similar to these, but not
all bulbs had exactly the same wattage.
The TRM did not include savings adjustments for ISRs (96.5%) and upstream markdown bulbs
purchased by non‐Ameren customers (also known as leakage, 3.3%); these were included in ex
post results.
Occupancy sensor ex post results were lower than ex ante results as the TRM assumed a sensor
would control an entire home rather than just one fixture.
Table 2. PY13 Summary: Ex Ante and Ex Post Program Gross Per‐Unit Savings Comparison
Measure PY13 Sales Per‐Unit Ex Ante Savings (kWh/unit)
Per‐Unit Ex Post Savings (kWh/unit)
Realization Rate
Upstream Markdown and Coupon
CFL ‐ 13W (60W incandescent equivalent) 2,472,962 48.4 56.8 117%
CFL ‐ 18W (75W incandescent equivalent) 197,989 37.4 60.3 161%
CFL ‐ 23W (100W incandescent equivalent) 508,171 51.2 59.9 117%
CFL ‐ High Wattage Bulbs 5,950 113 173.2 153%
CFL ‐ Specialty Bulbs 165,098 44.1 49.1 111%
CFL ‐ Reflector 149,301 44.1 55.7 126%
LED ‐ 8W Globe Light G25 Light Bulb 48 32 60.5 111%
LED ‐ 10.5W Downlight E26 Light Bulb 251 54.5 70.6 147%
LED ‐ 12W Dimmable Light Bulb 13,064 48 39.5 123%
Occupancy Sensor 1,623 217.0 37.5 17%
SMD
CFL ‐ 13W (60W incandescent equivalent) 378,312 48.4 38.6 80%
CFL ‐ 23W (100W incandescent equivalent) 273,432 51.2 40.7 79%
Net Impacts
Using demand elasticity modeling, the Cadmus team estimated free ridership separately for the
upstream markdown channel and the coupon channel for three LightSavers bulb types: standard CFLs,
specialty CFLs, and LEDs. Demand elasticity modeling uses an econometric model to estimate the impact

4
of program incentives, promotional events, and product placements on observed lighting sales, based
on actual program sales data.
As shown in Table 3, LEDs experienced extremely limited free ridership (1%), while higher free ridership
rates occurred for standard CFLs (24%) and specialty CFLs (23%). Overall, the program exhibited a
savings‐weighted free ridership rate of 24%, as standard CFLs constituted 91.5% of total savings.
Table 3. Upstream Free Ridership by Bulb Type
Bulb Type Free Ridership Percentage of Savings
Standard CFLs 24% 91.5%
Specialty CFLs 23% 7.2%
LEDs 1% 0.4%
Total 24% 100%
To estimate LightSavers’ PY13 net‐to‐gross (NTG) ratio, the Cadmus team used the following formula:
NTG = 1.0 – Free Ridership + Nonparticipant Lighting Spillover + Nonparticipant Non‐lighting Spillover +
Market Effects
For the LightSavers upstream markdown and coupon distribution channels, the Cadmus team estimated
an overall savings‐weighted NTG of 125%, based on the following:
Free ridership (24%): the percentage of products that would have been purchased without the
retailer discounts or coupons.
Nonparticipant Lighting Spillover or “like” Spillover (28%): the additional non‐discounted light
bulbs purchased as a result of the program.
Nonparticipant Non‐lighting Spillover or “unlike Spillover” (1%): the non‐lighting energy‐
efficiency actions induced by the program.
Market Effects (20%): structural market or behavior changes caused by program activity that
result in additional purchases of non‐discounted bulbs.
The Cadmus team applied a NTG ratio of 1.0 to the SMD program element as it offered free CFLs to low‐
income customers that could not purchase them independently.
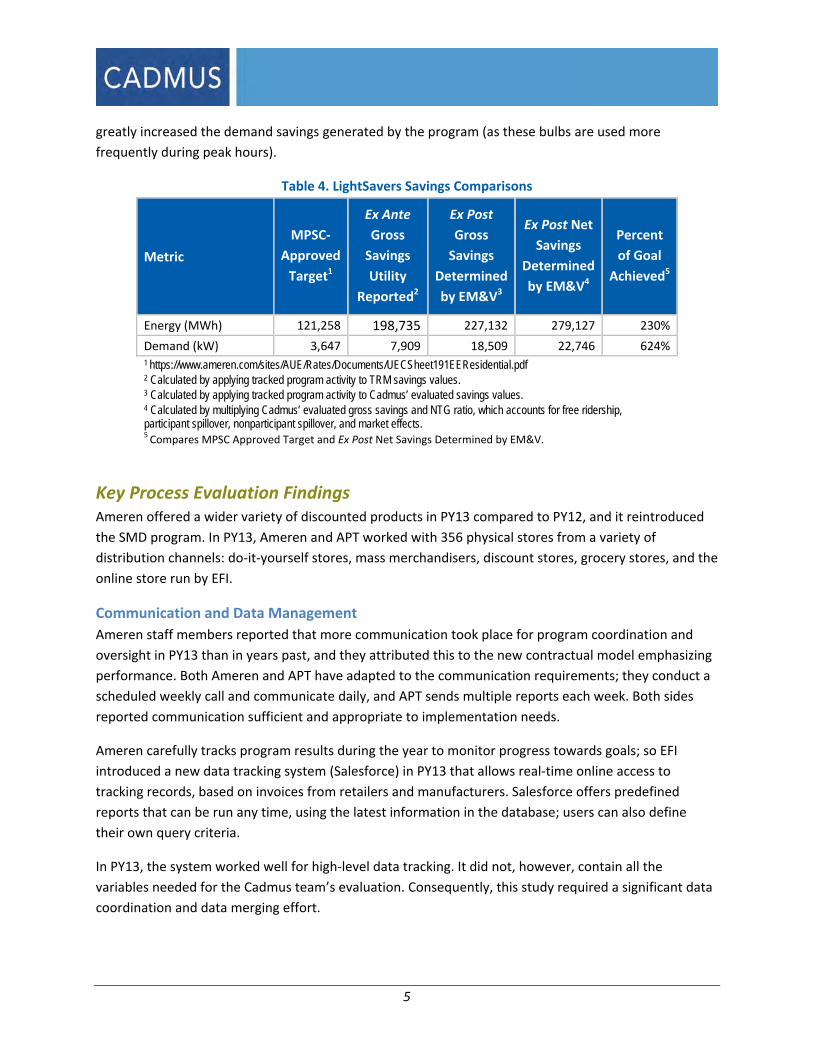
As shown in Table 4 the PY13 LightSavers program realized 230% of its targeted energy savings as
approved by the Public Service Commission (PSC), and 624% of its targeted demand savings based on
actual PY13 participation. As reported in this table ex ante gross savings are annualized savings by
calculated by applying tracked program activity to TRM savings values. Ex post gross savings are those
calculated and presented by the evaluators (and already include installation rate adjustments). Ex post
net savings is the ex post gross savings multiplied by the NTG ratio, accounting for free ridership,
spillover, and market effects. The high number of upstream CFLs installed in non‐residential locations
5
greatly increased the demand savings generated by the program (as these bulbs are used more
frequently during peak hours).
Table 4. LightSavers Savings Comparisons
Metric
MPSC‐
Approved
Target1
Ex Ante
Gross
Savings
Utility
Reported2
Ex Post
Gross
Savings
Determined
by EM&V3
Ex Post Net
Savings
Determined
by EM&V4
Percent
of Goal
Achieved5
Energy (MWh) 121,258 198,735 227,132 279,127 230%
Demand (kW) 3,647 7,909 18,509 22,746 624%1 https://www.ameren.com/sites/AUE/Rates/Documents/UECSheet191EEResidential.pdf 2 Calculated by applying tracked program activity to TRM savings values. 3 Calculated by applying tracked program activity to Cadmus’ evaluated savings values. 4 Calculated by multiplying Cadmus’ evaluated gross savings and NTG ratio, which accounts for free ridership, participant spillover, nonparticipant spillover, and market effects. 5 Compares MPSC Approved Target and Ex Post Net Savings Determined by EM&V.
Key Process Evaluation Findings Ameren offered a wider variety of discounted products in PY13 compared to PY12, and it reintroduced
the SMD program. In PY13, Ameren and APT worked with 356 physical stores from a variety of
distribution channels: do‐it‐yourself stores, mass merchandisers, discount stores, grocery stores, and the
online store run by EFI.
Communication and Data Management
Ameren staff members reported that more communication took place for program coordination and
oversight in PY13 than in years past, and they attributed this to the new contractual model emphasizing
performance. Both Ameren and APT have adapted to the communication requirements; they conduct a
scheduled weekly call and communicate daily, and APT sends multiple reports each week. Both sides
reported communication sufficient and appropriate to implementation needs.
Ameren carefully tracks program results during the year to monitor progress towards goals; so EFI
introduced a new data tracking system (Salesforce) in PY13 that allows real‐time online access to
tracking records, based on invoices from retailers and manufacturers. Salesforce offers predefined
reports that can be run any time, using the latest information in the database; users can also define
their own query criteria.
In PY13, the system worked well for high‐level data tracking. It did not, however, contain all the
variables needed for the Cadmus team’s evaluation. Consequently, this study required a significant data
coordination and data merging effort.

6
Promotional Events and Product Placement
In addition to providing in‐store promotional materials, APT facilitates promotions, events, and premium
product placements. APT’s goals included conducting at least six in‐store demos, per quarter, per field
rep (approximately 180 promotional events over the course of the program year). In PY13, APT
exceeded this goal and conducted 222 promotional events in at least 84 locations, with no location
receiving more than six events. APT also worked with retailers to gain premium product placement, such
as end caps for visibility. As the Cadmus team’s demand elasticity modeling indicated, these efforts
added to the sales lift achieved through price discounts.
Although retailers serve as the primary means for generating awareness about the LightSavers program,
Ameren conducts portfolio‐wide marketing activities that promote Ameren’s Act On Energy brand and
various individual programs. Ameren staff focused on developing innovative and integrated platforms to
drive program participation across the portfolio. The Act On Energy campaign used a range of media
types and varied timing of messaging.
CFLs and LEDs per Household
As part of the PY13 evaluation, the Cadmus team completed lighting inventories at 172 randomly
selected Ameren customer homes. Upon comparing the results of these site visits to similar visits
completed in PY10, the team found the number of CFL bulbs per home and the number of CFLs in MSB
sockets per home increased by nearly 50% over PY10 levels. Currently, CFLs and LEDs account for
approximately 22% of all bulbs and about 31% of all MSB sockets per home.
Key Conclusions and Recommendations Based on impact and process evaluation findings for the LightSavers program, the Cadmus team offers
the conclusions and recommendations that follow.
Conclusion 1. The TRM did not account for leakage, nonresidential purchases, less than 100%
installation rates, or continued availability of EISA‐impacted incandescent bulbs past the
manufacturing deadline; all of these impact per‐unit gross energy savings.
Recommendation 1. Update the TRM to account for these factors, more closely aligning ex ante
and ex post estimation methodologies.
Conclusion 2. Leakage rates decreased (from 8.7% to 3.3%) and nonresidential purchase rates
increased from (3% to 11%) since the PY10 study.
Recommendation 2. Continue to utilize the current mix of urban and rural stores, as current
leakage rates are modest and the program benefits from nonresidential purchases.
Conclusion 3. Storage rates increased from an average of 2.2 per home in PY10 to 3.7 in PY13. This
resulted in a lower overall installation rate in PY13 (96.5%) than in PY10 (97%). Both installation rates
accounted for first‐year installations and predicted future installations up to three years. First‐year

7
installation rates were similar to (although slightly higher than) other utilities reviewed. SMD customers
exhibited a lower first‐year installation rates (60%), with predicted future installations of 81.5%.
Recommendation 3. Encourage customers to replace incandescent bulbs immediately with
CFLs or LEDs through a call to action, presented through marketing materials, to replace
incandescent bulbs without waiting for them to burn out.
Conclusion 4. Free ridership (estimated using a demand elasticity model) was: 1% for LEDs, 24% for
standard CFLs, and 23% for specialty CFLs. Using the same model, the Cadmus team found that
premium product placement and in‐store promotion events provided a significant uplift in non‐free
rider sales of standard and specialty CFLs.
Recommendation 4. Perform additional analysis using the demand elasticity model and work
with APT to conduct natural experiments to optimize program offerings, promotions, product
placements, and incentive levels (balancing free ridership and incentive costs). Variations by
store type should also be examined to identify those with the least free ridership, thus
maximizing product offerings at those locations. Any changes in the retailer mix would have to
be carefully balanced against the need to achieve gross savings targets and to offer program
benefits across a wide cross‐section of Ameren Missouri customers.
Conclusion 5. Variation in program activity is critical for the demand elasticity analysis, particularly
variation in price and merchandising.
Recommendation 5. Continue to work with retailers to vary prices and promotions. Sales data
should include at least one variation in pricing lasting a minimum of six weeks for multiple bulb
types and retailers.
Conclusion 6. While data tracking improved through the use of an online tracking system (Salesforce)
and additional data granularity, improvement opportunities remain.
Recommendation 6. APT should streamline and combine its current reporting into one overall
online tracking system. Combining these reports into a single system would reduce evaluation costs
(due to time spent cleaning data, merging multiple files, and completing quality control efforts that
ensure accurate matching). Most critically, APT should conduct the following:
Incorporate price data by date into the markdown report available on Salesforce.
Develop a system that provides each product with a consistent SKU number in Salesforce
(especially when APT and retailers update Memoranda of Understanding (MOUs) or a
manufacturer changes reported sales).
Maintain the promotions and product placement tracking on Salesforce.
Conclusion 7. Home CFL and LED saturations increased significantly, from 20.9% of MSB sockets in
2010 to 30.5% in PY13. Among all sockets, CFLs and LEDs made up 17.7%. Long‐running programs
exhibited saturation rates of 30% or more of all sockets.

8
Recommendation 7. Continue to offer a wide mix of efficient lighting types that will fit most
applications.
Conclusion 8. Overall, retailer inventory shares of energy‐efficient lighting significantly increased. In
big box stores, 42% of lighting inventory was energy efficient, with significant variations between
participating stores (44%) and nonparticipant stores (31%) (derived from Internet inventory analysis).
These rates were higher than retailer self‐reported inventory shares in 2008, which were 35% in
participant stores and 25% in nonparticipant stores.
Recommendation 8. Continue to work with retailers to maintain a wide variety of available
energy‐efficient products, especially as EISA‐compliant halogens replace standard
incandescents. Halogens tend to be marketed as energy efficient, which confuses consumers
(and possibly retailers) about best available options.
9
INTRODUCTION
Ameren Missouri (Ameren) engaged the Cadmus team (composed of Cadmus and Nexant) to perform a
process and impact evaluation of the LightSavers program for a three‐year period. This annual report
covers the impact and process evaluation findings for Program Year 2013 (PY13), the period from
January 1, 2013, through December 31, 2013.
Program Description The LightSavers Program is designed to increase the sales and customer awareness of ENERGY STAR®‐
qualified residential lighting products. The program provides incentives to retail partners to discount
prices and increase the availability of qualifying lighting products. Specifically, LightSavers encourages
the purchase of new technologies such as light‐emitting diode (LED) bulbs and specialty compact
fluorescent lamps (CFLs), in addition to standard CFLs. Through these incentives, the end user (the
customer) receives a discount on the price of these products.
LightSavers relies on various promotional techniques—improved product placements, off‐shelf
merchandising opportunities, and in‐store demonstrations. The program also uses a social marketing
distribution (SMD) channel, in which Ameren provides CFLs at no charge to income‐eligible customers
through partnerships with community organizations.
About the Target Market Working through local and national lighting retailers, LightSavers targets Ameren residential customers.
While the program generates the most sales through its large, national retailer partners, program and
implementer staff seek to include more local retailers, regional chains, and small hardware stores that
are both Ameren customers and often serve Ameren customers in more rural locations.
Through its SMD channel, the program targets hard‐to‐reach segments of the residential customer
market, such as low‐income and elderly customers.
Ameren also offers an online store to ensure availability to customers unable to access a retail partner.
About the Program Implementers Ameren contracted with Applied Proactive Technologies (APT) and Energy Federation Incorporated (EFI)
to implement LightSavers for the 2013, 2014, and 2015 program years.
APT has managed upstream lighting programs, having administered Ameren’s LightSavers
Program (formerly the Lighting and Appliance Program) for the past three years and has
administered similar programs for other utilities across the country.
EFI processes the program’s incentive payments and manages the online store that sells
discounted CFLs and LEDs.

10
Program Activity In PY13, the program sold 4,166,201 lighting products. Retailers participated through one of the
following channels:
An upstream markdown delivery channel, which relied on a point‐of‐sale (POS) system that
allowed retailers to automate the discount through their registers.
A coupon channel, in which customers completed coupons for bulbs while in the store, with the
store then submitting the bundled coupons to EFI for processing.
Although fewer coupon retailers participated than upstream markdown retailers and coupon retailers
sold only a fraction of the program’s total bulbs, they helped ensure program discounts reached all
customers (such as those in rural areas of the service territory). Table 5, Table 6, and Table 7 summarize
overall PY13 sales by the upstream markdown retailer and the coupon retailer.
Table 5. LightSavers PY13 Program Activity
Measure PY13 Participants
CFL ‐ 13W 2,469,915
CFL ‐ 18W 197,417
CFL ‐ 23W 507,367
CFL ‐ High Wattage Bulbs 5,842
CFL ‐ Specialty Bulbs 165,098
CFL ‐ Reflector 149,301
LED ‐ 8W Globe Light G25 Bulb 48
LED ‐ 10.5W Downlight E26 Light Bulb 251
LED ‐ 12W Dimmable Light Bulb 13,064
Occupancy Sensor 1,623
Subtotal 3,509,926
Coupons
CFL ‐ 13W 3,047
CFL ‐ 18W 572
CFL ‐ 23W 804
CFL ‐ High Wattage Bulbs 108
Subtotal 4,531
SMD
CFL ‐ 13W 378,312
CFL ‐ 23W 273,432
Subtotal 651,744
Program Total 4,166,201

11
Table 6. Upstream Markdown Participating Retailers Stores
POS RetailersStore Bulb Sales No. of Locations
CLUB 999,867 11
DIY 1,165,112 52
Discount Retail 80,862 93
Grocery/Drug Stores 116,269 150
Mass Merchandise 1,147,816 50
Total 3,509,926 356
Table 7. Coupon Retailers with PY13 Sales
Coupon Stores (Small Hardware)
Store Bulb Sales No. of
Locations Total 4,531 74*
*Data not available to verify bulbs sold at all 74 participating locations because some stores submit coupons to central stores for processing.

12
EVALUATION METHODOLOGY
The Cadmus team identified the following PY13 impact and process evaluation objectives for
LightSavers.
Impact Evaluation Priorities Determine measure‐specific savings, total gross savings, net energy savings, and demand
reductions generated.
Review Ameren’s Technical Resource Manual (TRM).
Estimate the measure installation and storage rates.
Determine Ameren‐specific hours‐of‐use (HOUs) for average households and for specific
room types.
Estimate Ameren‐specific waste heat factors (WHFs) associated with reduced lighting heat for
average households.
Estimate net‐to‐gross (NTG), including an assessment of free ridership and retailer spillover at
participating and nonparticipating branch locations.
Assess leakage rates into and out of Ameren’s service territory and the portion of lamps,
incentivized through the residential program, that become installed in commercial facilities.
Incorporate results from the cross‐cutting evaluation plan.
Process Evaluation Priorities Assess the impacts of design changes, marketing activities, and processes on program delivery.
Assess the program’s achievements against goals.
Examine the participants’ experiences, satisfaction levels, and decision‐making motivations
through surveys and store intercepts.
Identify primary market barriers and provide recommendations for effectively overcoming
barriers through program design and delivery improvements.
For stocking lighting, identify standard practices and program‐influenced practices of
participating and nonparticipating retailers.
Assess purchase rates, market saturations, and installation locations of various bulbs
(incandescent, CFL, Halogen, and LEDs).
Track changes in key progress indicators, such as customer awareness and the penetration of
energy‐efficient lighting products.
Characterize local market responses to the 2007 Energy Independence and Security Act (EISA)
lighting requirements.
Identify areas where the program’s design and delivery can be improved.

13
Define the target market, market segment imperfections, and market demands, per
requirements of 4 CSR 240‐22.070(8).1
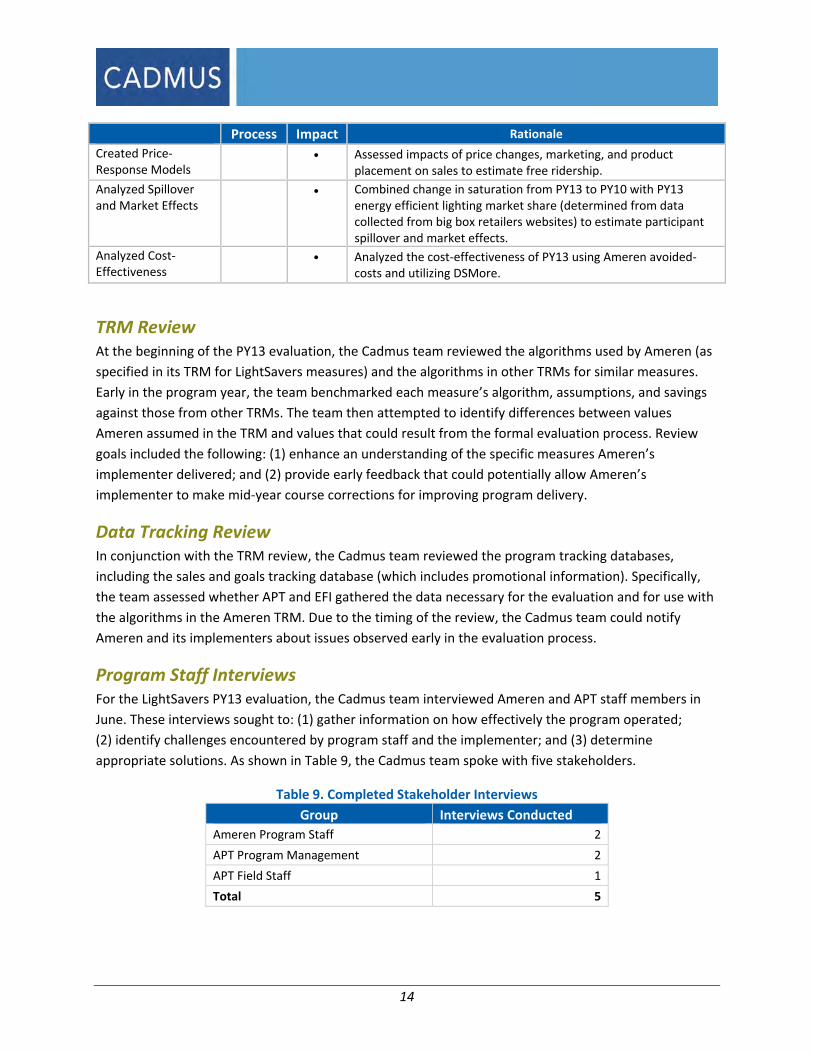
Table 8 lists the evaluation activities conducted in PY13 to achieve the preceding objectives. A brief
summary of each activity follows.
Table 8. PY13 Process and Impact Evaluation Activities and Rationale
Process Impact Rationale
Reviewed TRM
•
Identified and reported potential issues/inconsistencies that couldresult from the evaluation. Reviewed TRM values and assumptions and provided updated information through engineering analysis for future program years.
Reviewed Program Data
• • Ensured information was collected to inform the impact analysis.Provide ongoing support to ensure all necessary program data were tracked accurately; identified gaps for EM&V purposes.
Interviewed Stakeholders
•
Interviewed utility staff and implementer staff to provide insights regarding: program design, effectiveness of marketing, delivery, satisfaction, free ridership, and spillover.
Reviewed Marketing Materials and Website
•
Identified gaps and opportunities in the updated marketing materials and the website to understand the marketing strategy and to offer suggestions for improvements.
Interviewed Retailer and Manufacturer
•
Surveyed 18 local‐level and five corporate‐level retailers and manufacturers, gathering information on: program barriers, partner satisfaction, opportunities for improvements, spillover information, and trends in market transformation.
Conducted Store Intercepts
• Conducted intercept surveys at 20 store locations to update leakage estimates.
Conducted SMD Surveys •
Surveyed 75 participants in the SMD program to assess CFL installation rates (ISRs) and to investigate program barriers, satisfaction, and typical purchasing and usage patterns.
Conducted a Home Inventory Study (HIS)
•
Conducted on‐site inventories of 172 households. Inventories collected information on saturation levels and changes in saturation levels since 2010 as well as customers’: awareness of lighting and other efficiency products, and shopping habits.
Conducted an HOU Metering Study
• Installed lighting loggers in up to 10 light sockets in 172 homes. Loggers will remain in place until Spring 2014 to capture the range of light usage over the year.
Conducted an Engineering Analysis
• Estimated gross energy and demand savings by applying engineering calculations, using inputs gathered through the research activities during PY13 and other sources, as needed. Applied the NTG ratio to evaluate net savings.
1 http://sos.mo.gov/adrules/csr/current/4csr/4c240‐22.pdf
14
Process Impact Rationale
Created Price‐Response Models
• Assessed impacts of price changes, marketing, and product
placement on sales to estimate free ridership.
Analyzed Spillover and Market Effects
• Combined change in saturation from PY13 to PY10 with PY13 energy efficient lighting market share (determined from data collected from big box retailers websites) to estimate participant spillover and market effects.
Analyzed Cost‐Effectiveness
• Analyzed the cost‐effectiveness of PY13 using Ameren avoided‐costs and utilizing DSMore.
TRM Review At the beginning of the PY13 evaluation, the Cadmus team reviewed the algorithms used by Ameren (as
specified in its TRM for LightSavers measures) and the algorithms in other TRMs for similar measures.
Early in the program year, the team benchmarked each measure’s algorithm, assumptions, and savings
against those from other TRMs. The team then attempted to identify differences between values
Ameren assumed in the TRM and values that could result from the formal evaluation process. Review
goals included the following: (1) enhance an understanding of the specific measures Ameren’s
implementer delivered; and (2) provide early feedback that could potentially allow Ameren’s
implementer to make mid‐year course corrections for improving program delivery.
Data Tracking Review In conjunction with the TRM review, the Cadmus team reviewed the program tracking databases,
including the sales and goals tracking database (which includes promotional information). Specifically,
the team assessed whether APT and EFI gathered the data necessary for the evaluation and for use with
the algorithms in the Ameren TRM. Due to the timing of the review, the Cadmus team could notify
Ameren and its implementers about issues observed early in the evaluation process.
Program Staff Interviews For the LightSavers PY13 evaluation, the Cadmus team interviewed Ameren and APT staff members in
June. These interviews sought to: (1) gather information on how effectively the program operated;
(2) identify challenges encountered by program staff and the implementer; and (3) determine
appropriate solutions. As shown in Table 9, the Cadmus team spoke with five stakeholders.
Table 9. Completed Stakeholder Interviews
Group Interviews Conducted
Ameren Program Staff 2
APT Program Management 2
APT Field Staff 1
Total 5

15
Prior to conducting the interviews, the Cadmus team prepared an interview guide, consisting of
questions designed to elicit comprehensive information about the program design, its current
performance, and ideas for mid‐stream course corrections to improve the program.
Appendix B provides a copy of the stakeholder interview guide.
Marketing and Documents Review In mid‐2013, the Cadmus team reviewed the LightSavers updated marketing materials. To enhance the
team’s understanding of the marketing planning, coordination, and outreach efforts, interviews included
key marketing staff. The assessment considered all program marketing aspects, such as: strategy
development, processes and planning, goals and objectives, target audiences, messaging, marketing
tactics, and metrics. The Cadmus team then synthesized the findings to assess the program’s ability to:
(1) reach the identified customer segments; and (2) generate program participation efficiently.
This report includes information from the team’s findings memo (submitted to Ameren and APT in
November 2013) and recommendations for improving PY13 marketing.
Retailer and Manufacturer Interviews The Cadmus team interviewed 18 store managers and department managers from participating
locations. In addition to these interviews with participants from each distribution channel (coupon and
upstream markdown), interviews included five corporate‐level contacts who managed the program
activities for participating retailers: four manufacturer representatives; and one retailer representative.
The interviews examined the following topics:
Stocking practices for standard and ENERGY STAR‐qualified lighting products in participating and
nonparticipating locations;
Sales of ENERGY STAR‐qualified lighting products in participating and nonparticipating locations;
Change in sales of non‐program bulbs due to the program’s education and marketing of energy‐
efficient lighting (spillover);
Perceptions of and reactions to EISA lighting regulations;
Any additional discounts offered on program or non‐program bulbs;
Participating retailer/manufacturer experiences with the program;
Their views on program effectiveness;
Satisfaction with different program aspects and with the program overall; and
Suggestions for improving the program
Appendix D provides the retailer interview guide.

16
Store Intercepts Study Beginning in September 2013, the Cadmus team conducted intercept surveys with 495 customers at 20
big box retail stores selling Ameren LightSavers program bulbs.
These intercept surveys occurred in conjunction with planned promotional events by the program
implementers.2 The team asked customers questions regarding: (1) where they lived; (2) where they
expected to install the bulbs; and (3) whether they knew about the program discounts before entering
the store.
Appendix C provides the intercept survey guide, and Appendix E provides a detailed explanation of the
methodology used and results.
SMD Surveys The Cadmus team surveyed 75 SMD participants who voluntarily provided contact information via a
returned postcard. Appendix C provides the survey guide, and Appendix F presents detailed
explanations of methodology and analysis used.
HIS Beginning in May 2013, the Cadmus team conducted 172 inventories of single‐family households in
Ameren’s service territory. This sample group included customers from Ameren’s general population
who had: participated in a potential study conducted by Enernoc; and, during that survey, indicated they
would participate in additional studies.
The Cadmus team used tablet‐based electronic forms to collect data for each home, including a detailed
inventory of all lighting equipment (both exterior lights and stored bulbs) and information on HVAC
equipment. During visits, representatives asked residents to complete a written, four‐page survey
composed of 35 questions that addressed lighting and program awareness as well as purchasing habits.
Team representatives, who answered respondents’ questions as needed, collected these survey forms
at the end of the site visit and stored them as PDF files. The Cadmus team then input the responses into
an Excel spreadsheet for analysis.
Appendix C provides the survey guide, and Appendix G provides detailed explanations of the
methodology and analysis used.
HOU Metering Study The Cadmus team installed approximately eight lighting loggers per each of 172 homes in the home
inventory participant sample. As the loggers had to remain in place for six or more months, metering
effort results will become available in PY14.
2 Store managers required this approach to allow in‐store to be performed.

17
Engineering Analysis Starting with PY12, the Cadmus team updated the gross savings approach to account for federal
legislation stemming from EISA and to reflect HVAC interactive effects.3 To calculate lighting savings
from CFLs and LEDs, the Cadmus team utilized the following algorithms:
Equation 1
∆ ∗ % ∗ ∗ 1 ∗ ∗1,000
Equation 2
∆ ∗ 1 % ∗ ∗ 1 ∗ ∗1,000
Where:
WattsEE is the average program bulb wattage
WattsBase is the lumen‐equivalent wattage of replaced bulbs
HoursRES/NRES are average daily HOUs for residential or nonresidential applications
%Res is the percentage of program bulbs installed
ISR is the installation rate (NRES is assumed to be the same as RES)
LKG is the leakage rate (bulbs sold to customers outside Ameren’s service area)
WHFRES/NRES are HVAC interaction factors (adjustments for HVAC interactive effects)
The Gross Impacts Section provides an explanation of the methodology used and results.
Interactive Effects or WHF The Cadmus team used a simulation model, populated with a customer’s typical home characteristics
(identified from Ameren’s recent potential study), to estimate how heating and cooling needs change
when incandescent lights are converted to efficient CFLs or LEDs. Specifically, the team used BEopt™
Version 2.04 to model energy simulations required for estimating the WHFe (energy) and WHFd
(demand) in residential homes.
3 HVAC interactive effects occur as CFLs radiate less heat than the incandescents they replace; therefore, they
result in slightly increased heating loads, offset by slightly decreased cooling loads.
4 Developed by National Renewable Energy Laboratory (NREL), BeOpt uses the Energy Plus V8.0 simulation engine to generate hourly projected energy consumption, based on typical TMY3 weather data.

18
Though the WHF depends on many influences, major considerations include the following:
The length of the respective heating and cooling seasons. (Areas with long cooling seasons and
low saturations of electric heating tend to have higher WHFe values.)
Electric heating saturation.
Cooling saturation.
Electric resistance versus heat‐pump electric heating.
The Cadmus team used Equation 3 to determine the WHFe.
(Equation 3. WHF for Energy)
∆ ∆ ∆ ∆
The WHFd value depends on cooling saturation and cooling efficiency. The Cadmus team used Equation 4
to determine the WHFd.
(Equation 4. WHF for Demand)
∆ @ ∆ @ ∆ @
Where:
A value of 1.0 would mean no net interaction occurs between heating, cooling, and lighting.
A value of less than 1.0 would mean a net reduction in total energy savings occurs due to the
higher heating load offsetting the lower cooling load.
A value of more than 1.0 would mean there a net increase in energy savings occurs due to the
lower cooling load offsetting the higher heating load.
Appendix H presents the full methodology and details used.
Demand Elasticity Modeling Lighting products that incur price changes and promotion over the program period provide valuable
information regarding the correlation between sales and prices. Thus, as in the bridge program year
(PY12), the Cadmus team developed a demand elasticity model to estimate free ridership for the
upstream markdown channel.
Demand elasticity modeling is based on same economic principle driving program design: that a change
in price and promotion generates a change in quantities sold (i.e., the upstream buy‐down approach).
Demand elasticity modeling uses sales and promotion information to achieve the following:

19
Quantify the relationship of price and promotion to sales;
Determine the likely sales level without the program’s intervention (baseline sales); and
Estimate free ridership by comparing modeled baseline sales with actual sales.
After estimating variable coefficients, the Cadmus team used the resulting model to predict: sales that
would occur without the program’s price impact and promotional activity; and sales that would occur
with the program (and should be close to actual sales with a representative model). The team then
calculated free ridership using this formula:
Appendix I provides the full methodology used and results.
Spillover and Market Effects Analysis The Cadmus team’s LightSavers spillover and market effects study relied on information from two
research efforts:
The HIS (Discussed Previously In This Methodology Section And Provided In Full Detail In
Appendix G.
Documented lighting inventories (rather than sales data) at one to three big box stores for each
chain in Ameren’s service territory (both participating and nonparticipating stores). During these
inventories (conducted to estimate lighting stocking practices),5 the team collected data from
five participating and two nonparticipating retail chains, representing the available big box store
chains in Ameren’s territory.
After comparing saturation rates from the PY13 HIS study to the baseline values from the PY10 HIS, the
Cadmus team attributed the total change in saturation to the following factors:
Direct program bulbs (from tracking system);
Free ridership (from the price response model);
Naturally occurring (unrelated to program efforts);
Participant spillover; and
Market effects.
The team used the proportion of energy‐efficient inventory to attribute the increase in energy efficient
bulbs that are in excess of program sales to spillover and market effects after removing estimated
5 All participating and nonparticipating retailers analyzed for this study listed individual store inventories online
via an “in store” search option.

20
naturally occurring sales. The Net Impact Section provides the full analysis and Appendix J provides
additional background on the theory and methodology.
NTG for SMD
As in previous years, the Cadmus team applied a NTG of 1.0 for the programs’ SMD portions, as these
programs targeted low‐income customers that receive CFLs free of charge.
Cost‐Effectiveness Analysis Using the final PY13 ex post gross and net savings estimates for LightSavers presented in this report,
Morgan Marketing Partners (MMP) determined the program’s cost‐effectiveness using DSMore.6 MMP
also calculated measure‐specific cost‐effectiveness. As shown in the Cost‐Effectiveness Results section,
the Cadmus team assessed cost‐effectiveness using the five standard perspectives produced by DSMore:
Total Resource Cost
Utility Cost
Societal Cost Test
Participant Cost Test
Ratepayer Impact Test
6 A financial analysis tool designed to evaluate the costs, benefits, and risks of demand‐side management (DSM)
programs and services.

21
PROCESS EVALUATION FINDINGS
This section provides the Cadmus team’s process evaluation findings for Ameren’s LightSavers program.
Findings have been organized into four sections: Program Design, Program Delivery, Marketing, and
Satisfaction of Stakeholder partners.
Program Design The LightSavers program’s design seeks to achieve energy savings by: (1) increasing the use of high‐
efficiency light bulbs over lower‐efficiency baseline options; and (2) educating consumers about energy‐
efficient lighting options. To do so, the program provides the following:
POS discounts for high‐efficiency light bulbs through major retail chains;
Coupon discounts for smaller retailers in less urban parts of the service territory;
Free CFLs distributions to low‐income populations; and
Promotional events to demonstrate different lighting technologies and to educate consumers.
Changes for PY13
PY13 saw the first year of a new, three‐year program cycle and the first full program year following the
“bridge” year in 2012, which had a reduced budget and lower offerings.
For 2013, Ameren and its implementer, APT, updated the program’s design as follows:
Fully incorporated standard CFLs in the offerings (after a limited offering during the
previous year);
Addition of occupancy sensors;
Reintroduction of the SMD program (not offered in 2012);
A greater emphasis placed on LEDs through inclusion of a key performance indicator for the
number of LEDs sold; and
An increase in the number of “brought‐in”7 bulbs sold.
Upstream Delivery Channels
The program’s principle delivery stream uses the POS markdown system, which incorporates discounts
into a store’s register system and applies when a customer completes a transaction. Stores then submit
the required documentation for bulk reimbursement of these discounts. To participate in the upstream
markdown distribution channel, stores must meet the RFP terms and offer store locations within ZIP
codes where at least 70% of the residents have Ameren‐owned meters.
7 “Brought‐in” bulbs are high‐efficiency bulbs the program brings into stores that did not previously market
high‐efficiency bulbs.
22
To accelerate the launch at the beginning of the year, APT provided a MOU to stores that had previously
participated. In the spring of PY13, APT issued an RFP, noting bulb types and sales levels it expected; so
stores could bid to participate. This second round of MOUs took place for the period from July through
December.
For small stores lacking the infrastructure to accommodate a POS system, Ameren offers a coupon
discount system, with booklets of coupons left on the shelf near the product or at the register. After a
customer fills out the coupon at the store, the store applies the discount and, when the store collects a
bundle of coupons, it submits them to EFI for reimbursement. (EFI also maintains an online store
offering program bulbs.)
In PY13, 15 participating chains provided 356 upstream markdown store locations (see Table 6), along
with EFI’s online store. Each participating retailer signed an MOU that specified details such as the
participation period, discounted products, and discount levels. APT negotiated six‐month MOUs, rather
than MOUs covering the entire program year (as it had done in the past). These shorter agreement
periods offered the program the flexibility to make mid‐year adjustments to incentive levels and
acceptable models and to change partners.
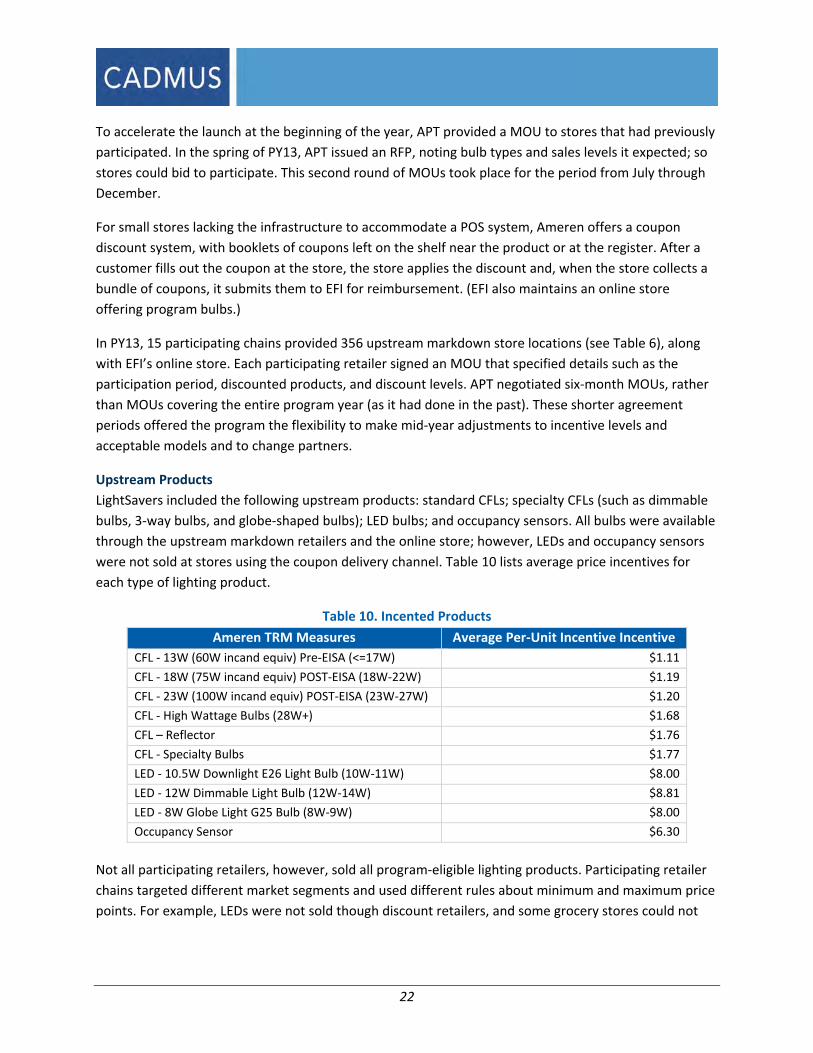
Upstream Products
LightSavers included the following upstream products: standard CFLs; specialty CFLs (such as dimmable
bulbs, 3‐way bulbs, and globe‐shaped bulbs); LED bulbs; and occupancy sensors. All bulbs were available
through the upstream markdown retailers and the online store; however, LEDs and occupancy sensors
were not sold at stores using the coupon delivery channel. Table 10 lists average price incentives for
each type of lighting product.
Table 10. Incented Products
Ameren TRM Measures Average Per‐Unit Incentive Incentive
CFL ‐ 13W (60W incand equiv) Pre‐EISA (<=17W) $1.11
CFL ‐ 18W (75W incand equiv) POST‐EISA (18W‐22W) $1.19
CFL ‐ 23W (100W incand equiv) POST‐EISA (23W‐27W) $1.20
CFL ‐ High Wattage Bulbs (28W+) $1.68
CFL – Reflector $1.76
CFL ‐ Specialty Bulbs $1.77
LED ‐ 10.5W Downlight E26 Light Bulb (10W‐11W) $8.00
LED ‐ 12W Dimmable Light Bulb (12W‐14W) $8.81
LED ‐ 8W Globe Light G25 Bulb (8W‐9W) $8.00
Occupancy Sensor $6.30
Not all participating retailers, however, sold all program‐eligible lighting products. Participating retailer
chains targeted different market segments and used different rules about minimum and maximum price
points. For example, LEDs were not sold though discount retailers, and some grocery stores could not

23
accept the lower‐priced standard CFLs because the discounts resulted in price point being too low. APT
worked with each retailer to stock appropriate products.
Upstream Coupon Delivery Channel
The 74 coupon stores in the program had to meet the following eligibility requirements: (1) be an
Ameren customer; and (2) be located in a ZIP code with at least 60% Ameren meters. These
requirements were less stringent as leakage out of Ameren territory historically has been negligible from
coupon stores; their customer base typically travels only short distances to stores. In PY13, the coupon
stores, accounting for 4,531 bulbs sold, offered standard CFLs and specialty CFLs.
SMD
Through the SMD channel, Ameren provides not‐for‐profit organizations with energy‐efficient CFLs,
which the organizations distribute to income‐qualified Ameren customers within the communities they
serve. Although APT has worked with several types of organization, its primarily works with food bank
systems. In PY13, all SMD bulbs were distributed through food banks that, in accordance with APT’s
requirement, operated in areas where at least 80% of the meters belonged to Ameren.
Between April and October of PY13, Ameren distributed 651,744 bulbs through the SMD channel
program to seven food banks. About 60% of the bulbs were 13W; the remainder were 23W bulbs. Each
customer could receive either one or two four‐packs of bulbs.
Program Delivery This section, describing the Cadmus team’s assessment of various program management and delivery
aspects of LightSavers, contains feedback from program stakeholder and retailer interviews.
Progress Toward Goals
Ameren must meet portfolio‐wide, 2015 regulatory targets for energy savings. Although it need not
meet interim targets on an annual basis or at the program level, examining program achievements
against stated goals proves important for planning purposes.
Program staff reported that annual goal‐setting follows a bottom‐up process, in which APT provides
participation goals for each measure. These goals are then multiplied by each measure’s estimated
savings—determined in the TRM—to generate an aggregate kWh/year target. During stakeholder
interviews that the Cadmus team conducted mid‐year, APT and Ameren staff felt the LightSavers
program remained on target to meet its savings goals by 2015.
While the program’s contractually binding goals are savings related, the LightSavers program includes
additional key performance indicators (KPIs) for promotional events, quality assurance, data
management, and reporting. Ameren staff reported that APT did doing well regarding all KPIs.
APT, which used internal goals for the proportion of each measure in the program, expected that
standard CFLs would compose 90% of sales, specialty CFLs would compose about 10%, and LED sales
24
would number around 15,000 (less than 0.5%). APT did not have a sales goal for occupancy sensors as
this is the first year the program has offered them.
The Cadmus team’s review of end‐of‐year data shows that specialty bulbs and reflectors contributed
approximately 8% of program sales and LEDs numbered 13,363 (or 0.3%).
Communication, Quality Assurance and Data Management
The Cadmus team asked Ameren staff and APT staff about certain program implementation aspects,
addressing topics such as communication between APT and Ameren, implementation and
administration, and data tracking and reporting.
Communication
Ameren staff reported more communication was required for program coordination and oversight in
PY13 than in years past, attributing this to a new contractual model emphasizing performance. Both
organizations adapted to the communication requirements—Ameren and APT staff scheduled weekly
call and communicated daily. APT also noted that it sends 20 reports a week to Ameren, although some
of these are for programs other than LightSavers. Both sides reported that communication was sufficient
and appropriate to implementation needs.
Program Processes
Once retailers sign the MOU, they take responsibility for working with manufacturers of program‐
eligible bulbs to maintain their supplies. APT staff members remain in close contact with manufacturers
or retailers to monitor stocking and ensure supply gaps do not occur.
Most store‐level managers reported that an APT representative visited every two to four months,
although four large chains from the upstream markdown distribution channel reported that
representatives visited every few weeks. (APT visits some locations as often as once a week, but most
locations far less often.) Both Ameren staff and retailers reported that APT representatives primarily
focused their time on retailers with the highest sell‐through. This includes time spent on store employee
training and promotional events. As these stores also see the most traffic, the promotional events likely
reach more customers than would occur if the events were more evenly distributed across
participating stores.
In addition to conducting promotional events, APT performs quality assurance checks through its field
representative visits to participating stores. While at a store, representatives verify all discounted bulbs
are stocked and displayed as prominently as possible. They also confirm that pricing listed on the shelf is
correct. APT did not report any major concerns from these field checks.
In PY13, Ameren staff performed one ride‐along with an APT field representative to obtain a clearer
understanding of how the program works and what kind of feedback the representatives receive.
Manufacturers receive a portion of the price of each bulb from the stores, and they receive the
remainder (the discounted portion) from EFI, which processes their invoices on behalf of Ameren. To

25
ensure accuracy in reporting and payments, Ameren crosschecks invoices from manufacturers with sales
records. While Ameren reported that most records were accurate, minor errors occasionally were
discovered. In such cases, Ameren notified APT, which worked with the retailer to correct the error.
Data Management and Reporting
Salesforce, introduced in PY13 by LightSavers implementer EFI, allows real‐time online access to tracking
records, based on invoices from retailers and manufacturers. The database contains multiple variables in
the following information categories:
Store details (including chain and location);
SKUs available, with a description of product;
The number of bulbs sold;
The date of sale (on a weekly or monthly basis, depending on the store); and
Accounting details, including invoice date and amount, and payment date.
Salesforce does not contain retail bulb prices by date or promotional activities, both of which are
tracked separately. Data about bulb wattages were not available to the Cadmus team.
Ameren staff reported that the new Salesforce‐based reporting system proves sufficient for oversight.
Staff members experienced only a few glitches at the beginning of PY13, when system reports were
introduced, and they continued to work with APT and EFI to resolve these.
According to Ameren staff, Salesforce offered a benefit through providing immediate access to data
entered by EFI. Ameren also considered the data tracking more robust than in the past, noting it now
includes tracking bulb placement in stores.
The Cadmus team used Salesforce data for tracking participating stores, bulb sales, and developing the
price‐response model. As the team could not find all necessary information in Salesforce, APT provided
the missing data in separate reports. For example, as storefront data in the Salesforce reports did not
include bulb prices at the SKU level, APT tracked this information separately and provided it in a
separate report at an aggregated level. However, this required the Cadmus team to match storefront‐
level data—derived from sales invoices submitted by retailers or manufacturers—with aggregated
retailer data. For many SKUs in the storefront data, matching prices to aggregated retailer sales data
proved difficult.
Ameren currently is developing its own data warehouse, which will store information from all programs
in a central location and will enable cross‐tab analysis. The Cadmus team and APT provided feedback on
early plans for this database. Ameren expects the system to launch sometime in 2014.
Program Implementation Challenges
Both Ameren and APT reported that LightSavers ran relatively smoothly, largely as the program model
has been in use for several years. Nevertheless, some implementation challenges emerged in PY13.
26
Launch Delays
Ameren reported the program launch was delayed by about one week due to difficulties in signing APT’s
contract around the winter holiday season.
APT reported that some SKUs of specialty bulbs were delayed an additional two months while incentive
levels were negotiated. To make up this lost time, APT found program partners for the first half of PY13
by reaching out to retailers that previously partnered with the program. APT negotiated MOUs with
these retailers in the same manner it would have had they used an RFP. (The RFP process enables APT to
pick the best partners by comparing the number of program SKUs and the sales levels across retailers.
However, the retailers APT approached likely would have been selected to participate through the RFP
process; so overall impacts on program sales were likely minor.)
Specialty sales fell slightly below APT’s internal goal of 10%, which could have resulted from the delay.
Discounts That Resulted in Price Points below Retailer Minimums
According to Ameren, the program experienced some difficulty recruiting at least one retailer with the
price points set in the filing. When retailers set a price lower than the program anticipated, the discount
could bring the product price level below the retailer’s minimum acceptable price point. This took place
with Dierbergs—one of the largest St. Louis‐based companies (as opposed to national‐scale companies)
participating in the program in previous years, but not participating in PY13. A lower incentive for
Dierbergs might result in future participation.
According to Ameren staff, PY13 has been valuable for providing data on sell‐through rates, price‐
responses, and necessary incentive levels. Schnucks (the other major St Louis ‐based retailer) continued
to participate in the program. In addition, the program brought back Walgreens and added Family
Dollar.
Predicting the NTG Ratio
Ameren staff members cited the NTG as the most significant unknown element in the program design;
so they wanted to see preliminary estimates early enough in the year to enable them to make course
corrections, if necessary. The Cadmus team reported that, due to way that price changes were
implemented and the configuration of the data reporting and tracking system, early NTG estimates
could not be provided.
The demand elasticity model the Cadmus team used to estimate free ridership relied on the relationship
between the changing prices of light bulbs and the associated sales changes. The first round of price
changes did not occur until July, and accumulating a meaningful number of sales transactions to reflect
the impact of the price change required several weeks.
Some retailers lagged in sales reporting. Several were still missing data as far back as June, when data
were analyzed in November.

27
The Cadmus team had to obtain data from different reports, with resulting data not easily combined.
Consequently, the team compiled a dataset manually, which added to the time required to prepare and
run the model, perform diagnostics, and update the model with the final data.
Delivery Successes and Program Achievements
Stakeholders felt the program succeeded overall, specifying the following highlights:
The program benefitted from using a well‐established model, in place for four years. APT
increased its field representatives from five to nine for PY13, and Ameren staff reported that
APT’s ability to rehire former field representatives also benefitted program performance.
Retailers received product placement and marketing assistance well. APT continued to improve
its relationship with Lowe’s stores (one of the major sellers in the program) and made signage
more visible in their stores. Although the program name and overall appearance were updated,
basic marketing materials remained the same and continued to receive broad approval from
retailer partners. Local managers considered signage the best way to attract customer attention,
and they reported that program staff provided well‐executed, effective signage.
Some retailers, however, could not take advantage of the product placement assistance APT
offered, as not all retailers operated on a model allowing for storefront‐level marketing
assistance. Some retailers reported that all of their product placement and signage was dictated
at the corporate level. Some smaller coupon stores noted their available space was so restricted
that end cap displays, pallet displays, and even some signage could not be used.
Marketing and Outreach This section contains the Cadmus team’s findings regarding LightSavers marketing strategies and
outcomes. Appendix K provides further detail.
Program Marketing Goals and Primary Channels
Partner retailers offer the primary outreach channel for the LightSavers program. The marketing and
outreach efforts, overseen by the program implementer, serve two purposes: (1) educating customers
about the availability and benefits of the products; and (2) engaging with market actors to deliver the
message.
Program staff reported that in PY13, a large number and variety of stores participated in LightSavers,
including big box (such as Lowes and Home Depot) and nontraditional stores (Dollar Tree and local
retailers). Given this increase in store volumes, APT increased the number of field representatives
servicing the contract to nine (from five in PY12).
In support of the program, APT conducts the following in‐store activities:
In‐store promotions: Approximately two per year for each participating big‐box location.
In‐store meetings: Periodic meetings to discuss LightSavers program details with sales
associates and to provide a manual with the certified product list and rebate information.
28
Site visits: Field representatives visit all participating markdown stores and many coupon stores
at least every few months. Stores with higher sell‐through rates receive more frequent visits,
some as often as weekly. During visits, field representatives check in with store or department
managers, check stocking levels and signage, and answer questions from employees and
customers. Though separate, the visits sometimes combine with on‐site promotions
Through field representatives, APT ensures prominent placement of in‐store materials. in line with
industry best practices (regarding messaging, specifications, and placement). APT also ensures all
in‐store signage conforms to the specific brand guidelines of retailers and Ameren.
Marketing Materials and Placement
The Cadmus team reviewed the original PY13 LightSavers proposed marketing plan and several creative
samples for review and reference.
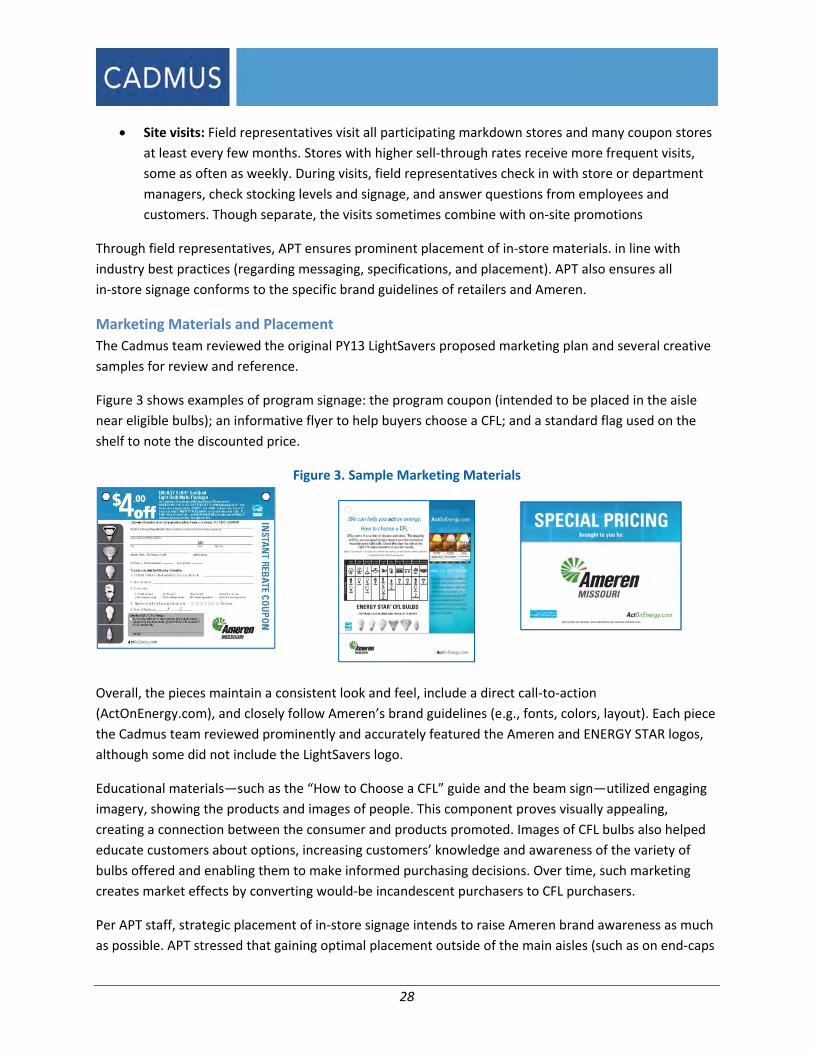
Figure 3 shows examples of program signage: the program coupon (intended to be placed in the aisle
near eligible bulbs); an informative flyer to help buyers choose a CFL; and a standard flag used on the
shelf to note the discounted price.
Figure 3. Sample Marketing Materials
Overall, the pieces maintain a consistent look and feel, include a direct call‐to‐action
(ActOnEnergy.com), and closely follow Ameren’s brand guidelines (e.g., fonts, colors, layout). Each piece
the Cadmus team reviewed prominently and accurately featured the Ameren and ENERGY STAR logos,
although some did not include the LightSavers logo.
Educational materials—such as the “How to Choose a CFL” guide and the beam sign—utilized engaging
imagery, showing the products and images of people. This component proves visually appealing,
creating a connection between the consumer and products promoted. Images of CFL bulbs also helped
educate customers about options, increasing customers’ knowledge and awareness of the variety of
bulbs offered and enabling them to make informed purchasing decisions. Over time, such marketing
creates market effects by converting would‐be incandescent purchasers to CFL purchasers.
Per APT staff, strategic placement of in‐store signage intends to raise Ameren brand awareness as much
as possible. APT stressed that gaining optimal placement outside of the main aisles (such as on end‐caps

29
and wing stacks) proves critical to this effort. Thus, APT focused on attaining such high‐value placements
through relationships with retailers. During APT visits, field representatives found premium
merchandising displays, as shown in Table 11. A majority of the time, Club stores and Mass Market
stores contained program bulbs in end‐caps.
Table 11. Percentage of APT Visits Noting Displays
Display Type Club
Stores
DIY
Stores
Mass
Market
Stores
Other
Clip Strips. A narrow, vertical band of plastic with hooks that
displays one row of product units in front of regular shelves. 0% 16% 1% 0%
End‐Cap Majority. The shelves at the end of the aisles that face
outward to a main aisle or traffic path.* 72% 41% 63% 17%
End‐Cap Minority. Same end‐cap placement; however, APT notes
this when program bulbs occupy less than 50% of the space. 0% 12% 8% 2%
Fence line Display. Typically located at the entrance of a
membership club store. This is the most coveted location because
products tend to be sold fastest from this display. 18% 8% 2% 0%
Pallet Display. A stack of products—often displayed on a shipping
pallet—in an open area in the store.** 3% 0% 2% 0%
Side Cap. A small display next to an end‐cap, differentiated from the
regular aisle, but parallel to it, and perpendicular to the end‐cap
(typically, a peg hook display on the side of an end‐cap). 0% 39% 13% 18%
Register Tips. Any display or placement of the product and POP next
or adjacent to the cash registers. 0% 19% 0% 4%
Wing Stack. A display of products that sticks out from the regular
aisle shelves, usually in an area of related products. 8% 46% 44% 62%
*APT notes an end‐cap majority when program bulbs occupy the majority of space on an end‐cap. **Any bulk display that is merchandised in the main aisles and typically in Home Depot, Sam’s Club, Costco, Lowe’s and Menards. This does not, however, refer to the Walmart four‐ways, bulk packs, and pallet drops.
***This can also describe a four‐way display in a Walmart aisle.
Promotional Events
In addition to in‐store materials, the program implementer facilitates promotions and events, designed
to foster conversations with customers, educating them about benefits from energy‐efficient products
and driving sales. For LightSavers, APT’s goals included conducting at least six in‐store demos per
quarter, per field rep, or roughly 180 promotional events over the year. These promotions typically
included the following:
A table (with a tablecloth and a runner), placed close to the store’s lighting section;
A light bar showing the colors of CFL lighting;

30
A light meter; and
Program literature and rebate forms.
APT held 222 promotional events in at least 84 locations during PY13, with no location having any more
than six events. APT did not provide locations for 32 of the promotional events.
Cross‐Program Promotion
Given that the same implementer markets and executes the LightSavers program and the RebateSavers
program (which, formerly, were one program), cross‐program promotional opportunities exist at the
retail level. These opportunities include: synergies between in‐store materials, relationships with
retailers, and coordination of in‐store promotions and events.
Outside of the two APT programs, Ameren has identified opportunities for implementers to collaborate
in cross‐promotion of one another’s programs. For example, Ameren suggested that APT place in‐store
educational materials for the ApplianceSavers program (implemented by Appliance Recycling Centers of
America, Inc.). By the end of the PY13, Ameren had enrolled 48 LightSavers partner retailers in the cross‐
promotion program.
Act On Energy Campaign and Research
Although retailers serve as the primary means for generating awareness about the LightSavers program,
Ameren conducts portfolio‐wide marketing activities that promote both the Act On Energy brand and
individual programs. In PY13, Ameren staff focused the campaign on the development of innovative and
integrated platforms to drive program participation across the portfolio; this effort used a variety of
media and varied the timing of messages.
From June through August, Ameren’s corporate marketing team dedicated its Act On Energy marketing
and media to ApplianceSavers, CoolSavers, and LightSavers. Ameren’s team sought to increase: general
awareness of the programs throughout the service territory; and participation specifically for the
featured programs during the summer months. (Though this effort included the LightSavers program,
the campaign primarily focused on the ApplianceSavers and CoolSavers programs.) The campaign
included: radio spots, digital billboards, outdoor billboards, transit windscreens, animated and static
banner advertisements, social media, direct mailers, gas toppers, and e‐mail marketing.
For this marketing effort, Ameren hired the Shelton Group to conduct segmentation, potential, and
usability studies to inform program design and outreach efforts. Consistent with the Cadmus team’s
survey findings, Shelton’s study indicated low awareness of program offerings, likely indicating an
opportunity for increased promotion and visibility at retail levels. Specifically, the Shelton segmentation
study results show that only 44% of customers knew of Ameren’s energy‐efficiency rebates or
incentives. Furthermore, when asked if Ameren offered a rebate or incentive for products sold through
the LightSavers program, only 15% of respondents knew about the LED bulb discount and only 13%
knew about the CFL bulb discount.

31
Shelton’s profile of those likely to purchase CFLs indicated the following characteristics: a young target
audience (18–34) that prefers online communications channels. This may offer a means to communicate
with this audience outside of retail‐based efforts.
HIS: Lighting Usage To accurately determine savings achieved from the program as well as spillover and market effects, the
Cadmus team surveyed of 172 Ameren households to establish an inventory of their lighting equipment.
The effort also obtained information on lighting behaviors of those in the households, offering insights
into customer trends. The study weighted results according to home ownership status and familiarity
with CFLs (similarly to the weights used in 2010), and used the weighted survey results to update the
lighting inventory estimates, for use in key metrics that impact savings calculations.
CFLs per Household
As shown in Table 12Error! Reference source not found., the Cadmus team’s PY13 inventory indicates
the number of CFL bulbs per home increased by nearly 50% from PY10 levels. Survey results indicated
that CFLs currently account for approximately 22% of all sockets in the homes. Overall socket numbers
increased from just under 70 to just under 74. Differences in socket counts are likely due to sampling
error.
Table 12. Average Number of Bulbs Installed for All Sockets (Weighted, Based on 164 sites)
PY13 PY10
Bulb Type Number of Bulbs Avg. Bulbs / Home
Incandescent 6,664 40.6
Compact Fluorescent (CFL) 2,734 16.7 11.4
Linear Fluorescent 1,246 7.6
Halogen 1,115 6.8
Light‐emitting Diode (LED) 157 0.96
Empty Socket 143 0.9
Other/Type not Assigned 20 0.1
Total Sockets 12,080 73.7 69.5
As shown in Table 13, numbers of CFLs in medium screw‐base sockets (MSBs) per home increased by
just under 50% from PY10. CFLs and LEDs currently account for approximately 31% of all MSBs per
home.

32
Table 13. Average Number of Bulbs per Home in Medium Screw‐Base Sockets (weighted, based on 164 sites)
PY13 PY10 Bulb Type Number of Bulbs Avg. Bulbs / Home
Incandescent 5,404 33.0
CFL 2,685 16.4 11.0
Halogen 705 4.3
Empty Socket 124 0.8
LED 61 0.4
Other/Type not Assigned 4 0.0
Total 8,983 54.8 53.0
Sockets per Home
The number of sockets per home represents the total residential market size for lighting. Seventy‐five of
172 home (44%) fell within the 41–80 socket range. Only 35 homes (21%) had fewer than 40 sockets
total in the home, while 54 (31%) had more than 80 total sockets. Many homes (41%) had between 41‐
80 MSB (the socket holding a standard CFL bulb) sockets, with the remainder ending to have 40 or fewer
MSB sockets, rather than more than 80. (Table 14).
Table 14. Number of Sockets per Home
Number of Homes (out of 172)
No. of Sockets All Socket Types MSB Sockets
0‐40 35 64
41‐80 75 71
>80 54 27
Bulb Saturation
Between PY10 and PY13, saturations of incandescent bulbs fell slightly, with CFLs primarily replacing
more traditional bulbs. This shift, shown in Figure 4, was not surprising, given the intensive Ameren
lighting campaign, EISA regulations, and consumers’ adjustments to the new technology.

33
Figure 4. Installed Saturation (All Sockets)
For MSBs, the CFL saturations were even higher, with the vast majority of CFLs sold were standard bulbs
fitting that socket type (see Table 15).
Table 15. Installed Saturation (MSB only, weighted)
Percentage of Sockets
Bulb Type PY13 PY10
Incandescent 60.0%
CFL 30.2% 20.8%
Halogen 7.7%
Empty Socket 1.4%
LED 0.7%
Bulb Storage
Despite the onset of EISA regulations, which limit the wholesale distribution of traditional incandescent
light bulbs, most households participating in the inventory retained a large number of these bulbs in
storage, as shown in Table 16.

34
Table 16. Stored Bulbs by Type (Weighted)
Average Number of Storage Bulbs per Home
Bulb Type Number of BulbsAvg. Bulbs / Home in PY13
Avg. Bulbs / Home in PY10
Incandescent 1,712 10.4
CFL 580 3.5 2.5
Halogen 129 0.8
Linear Fluorescent 76 0.5
LED 9 0.1
Total 2,510 15.3
Lighting Purchasing Behaviors
The Cadmus team’s resident survey asked respondents about their lighting purchasing habits, both in
general and in regard to Ameren‐discounted products. The vast majority (94%) of 130 respondents said
they previously purchased CFLs, and 36% (n=146) confirmed they bought LEDs at some point.8
Survey results showed that 16 people (25%; n=64) knowingly purchased Ameren‐discounted CFLs, and
four people (7%; n=55) reported they purchased a discounted LED. Nevertheless, the CFLs made up
most of the bulbs that respondents purchased after January 2013, as shown in Figure 5. Given these
households fell within Ameren’s territory, residents likely purchased a significant number of CFLS
through the program, though without knowing aware of Ameren’s involvement.
Figure 5. Number of Bulbs Purchased After January 1, 2013, by Type
8 The survey did not distinguish between incandescent‐replacement LEDs or other types of LEDs, such as
flashlights or Christmas lights.

35
Program Satisfaction The Cadmus team surveyed 75 SMD participants (with four dropped due to inconsistent responses and
one dropped as the respondent was not an Ameren customer). Interviews included 17 retailer store
participants and five corporate‐level retailer participants. The designs of the surveys and interviews
sought to obtain information about the respondents’ satisfaction with different program components
and with the program overall; interviews also solicited ideas for program improvements.
SMD Customer Satisfaction
As shown in Figure 6, the majority of SMD participants (90%) rated themselves as very satisfied with the
program bulbs, while 6% said they were somewhat satisfied. Only 4% were not very satisfied.
Figure 6. How satisfied are you overall with the energy saving bulbs you received from Ameren? (n=70)
The study asked participants to explain their negative and positive responses, and then ranked them
according to how often they were mentioned:
Positive satisfaction rating:
Energy savings
Low replacement rate or longevity of bulb life
The quality of light given off by the new bulbs
The bulbs were free
Negative satisfaction rating:
Bulbs failing
CFLs are dimmer than incandescents
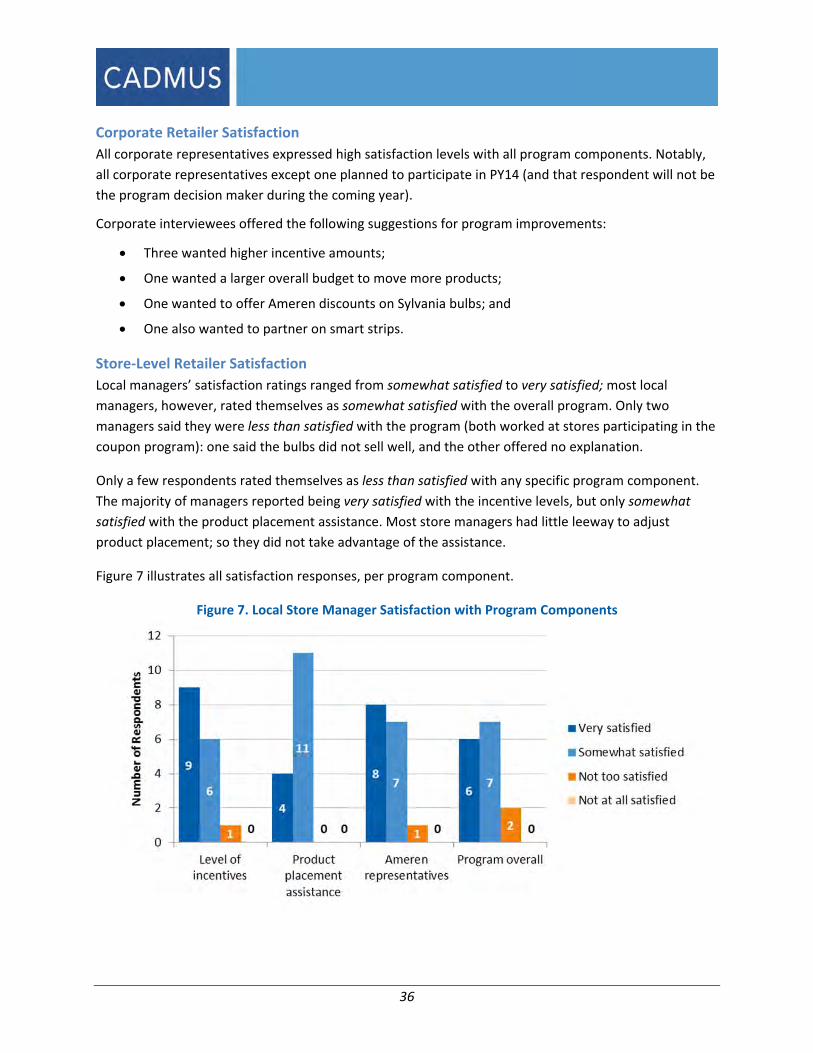
36
Corporate Retailer Satisfaction
All corporate representatives expressed high satisfaction levels with all program components. Notably,
all corporate representatives except one planned to participate in PY14 (and that respondent will not be
the program decision maker during the coming year).
Corporate interviewees offered the following suggestions for program improvements:
Three wanted higher incentive amounts;
One wanted a larger overall budget to move more products;
One wanted to offer Ameren discounts on Sylvania bulbs; and
One also wanted to partner on smart strips.
Store‐Level Retailer Satisfaction
Local managers’ satisfaction ratings ranged from somewhat satisfied to very satisfied; most local
managers, however, rated themselves as somewhat satisfied with the overall program. Only two
managers said they were less than satisfied with the program (both worked at stores participating in the
coupon program): one said the bulbs did not sell well, and the other offered no explanation.
Only a few respondents rated themselves as less than satisfied with any specific program component.
The majority of managers reported being very satisfied with the incentive levels, but only somewhat
satisfied with the product placement assistance. Most store managers had little leeway to adjust
product placement; so they did not take advantage of the assistance.
Figure 7 illustrates all satisfaction responses, per program component.
Figure 7. Local Store Manager Satisfaction with Program Components
37
Other than the suggestions offered by corporate level retailers, neither local retailers nor SMD
customers provided suggestions for improving the program.
Coupon store managers, some of whom reported that the program proved less effective in their stores,
received less marketing assistance and requested better marketing assistance to help them take
advantage of the program.

38
CSR Summary According to the Missouri Code of State Regulations (CSR),9 demand‐side programs operating as part of a utility’s preferred resource plan are
subject to ongoing process evaluations that address, at a minimum, the five questions listed in Table 17. While the process evaluation findings
discussed touch on each of these topics, Table 17 summarizes responses for each specified CSR requirement.
Table 17. Summary Responses to CSR Process Evaluation Requirements
CSR Requirement
Number CSR Requirement Description Summary Response
1 What are the primary market imperfections common to the target market segment?
Customers lack information about energy‐efficient lighting options (e.g., difference in hours of use, energy use, lighting quality), and prices for some energy‐efficient bulbs remain much higher than the incandescent baseline.
2 Is the target market segment appropriately defined, or should it be further subdivided or merged with other market segments?
The LightSavers market is broadly defined, though the program moves in the direction of targeting bulbs to new audiences (such as discount retail shoppers). New market research indicates younger customers could be a more interested audience.
3 Does the mix of end‐use measures included in the program appropriately reflect the diversity of end‐use energy service needs and existing end‐use technologies within the target market segment?
Yes. The program offers a diversity of products, representing the majority of common consumer lighting needs, including a range of wattages, specialty bulbs such as dimmables, globes, and reflectors, and LED bulbs. This year the program added occupancy sensors.
4 Are the communication channels and delivery mechanisms appropriate for the target market segment?
Retailers report Ameren’s signage is effective. New market research indicates greater online activity could be effective in targeting younger customers.
5 What can be done to more effectively overcome the identified market imperfections and to increase the rate of customer acceptance and implementation of each end‐use measure included in the program?
Ameren continues to reach out to more retailers and audiences, and to expand the list of eligible measures, but program awareness remains low. Ameren has commissioned market research to identify market segments and should use this information to experiment with new messaging and market channels.
9 http://sos.mo.gov/adrules/csr/current/4csr/4c240‐22.pdf

39
GROSS IMPACT EVALUATION RESULTS
Table 18 lists ex ante and ex post gross program savings by measure. Subsequent tables and discussions
address savings calculations and ISRs.
Table 18. PY13 Gross Impact Results Summary
Measure Participation*
Ex Ante
Savings
(MWh/yr)**
Ex Post
Gross Savings
(MWh/yr)**
Precision at
90%
Confidence
Upstream Markdown
CFL ‐ 13W (60W incand equiv) PRE‐EISA 2,469,915 119,544 140,391
15%
CFL ‐ 18W (75W incand equiv) Pre‐ and POST‐
EISA 197,417 7,393 11,913
CFL ‐ 23W (100W incand equiv) POST‐EISA 507,367 26,001 30,414
CFL ‐ High Wattage Bulbs 5,842 660 1,011
CFL ‐ Specialty Bulbs 165,098 7,281 8,100
CFL ‐ Reflector 149,301 6,584 8,320
LED ‐ 8W Globe Light G25 Bulb 48 2 2
LED ‐ 10.5W Downlight E26 Light Bulb 251 14 15
LED ‐ 12W Dimmable Light Bulb 13,064 627 922
Occupancy Sensor 1,623 352 61
Upstream Markdown Subtotal 3,509,926 168,457 201,149
Coupon
CFL ‐ 13W (60W incand equiv) PRE‐EISA 3,047 147 179
4%
CFL ‐ 18W (75W incand equiv) POST‐EISA 572 21 29
CFL ‐ 23W (100W incand equiv) POST‐EISA 804 41 50
CFL ‐ High Wattage Bulbs 108 12 19
Coupon Subtotal 4,531 222 277
SMD
CFL ‐ 13W (60W incand equiv) PRE‐EISA 378,312 18,310 14,587
20%
CFL ‐ 23W (100W incand equiv) POST‐EISA 273,432 14,012 11,119
SMD Subtotal 651,744 32,323 25,706
Program Total 4,166,201 201,002 227,132 15%
*Participation is defined by the number of products sold.
**May not sum exactly to subtotal and total values because of rounding.

40
CFL and LED Gross Savings
To calculate lighting savings from CFLs and LEDs, the Cadmus team summed the savings calculations
resulting from the following two equations:
Equation 5
∆ ∗ % ∗ ∗ 1 ∗ ∗ ∗
1,000
Equation 6
∆ ∗ 1 % ∗ ∗ 1 ∗ ∗ ∗
1,000
Where:
WattBASE = Wattage of the original incandescent bulb replaced by a program bulb
WattEE = Wattage of a new bulb installed
LKG = Leakage rate (bulbs sold to customers outside Ameren’s service area)
%Res = The percentage of program bulbs installed in residential applications
(as opposed to nonresidential applications)
ISR = Installation rate (NRES is assumed to be the same as RES)
HoursRES = Average hours of use per day for bulbs installed in residential applications
HoursNRES = Average hours of use per day for bulbs installed in non‐residential
applications
Days = Days used per year
WHFRES = HVAC interaction factor (adjustments for HVAC interactive effects) for bulbs
installed in residential applications
WHFNRES = HVAC interaction factor (adjustments for HVAC interactive effects) for bulbs
installed in nonresidential applications
1,000 = Conversion factor between Wh and kWh (Wh/kWh)
Table 19 summarizes the savings assumptions and their sources. The following sections provide details
for each assumption the Cadmus team used to calculate gross savings.
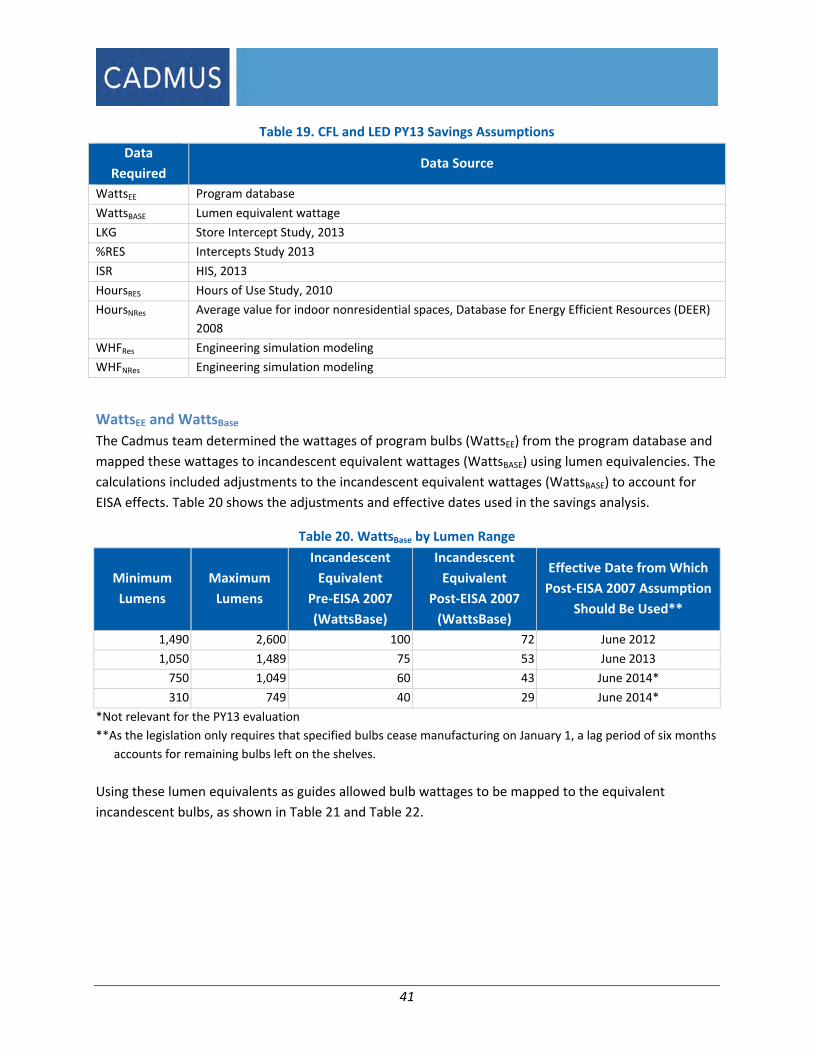
41
Table 19. CFL and LED PY13 Savings Assumptions
Data
Required Data Source
WattsEE Program database
WattsBASE Lumen equivalent wattage
LKG Store Intercept Study, 2013
%RES Intercepts Study 2013
ISR HIS, 2013
HoursRES Hours of Use Study, 2010
HoursNRes Average value for indoor nonresidential spaces, Database for Energy Efficient Resources (DEER)
2008
WHFRes Engineering simulation modeling
WHFNRes Engineering simulation modeling
WattsEE and WattsBase
The Cadmus team determined the wattages of program bulbs (WattsEE) from the program database and
mapped these wattages to incandescent equivalent wattages (WattsBASE) using lumen equivalencies. The
calculations included adjustments to the incandescent equivalent wattages (WattsBASE) to account for
EISA effects. Table 20 shows the adjustments and effective dates used in the savings analysis.
Table 20. WattsBase by Lumen Range
Minimum
Lumens
Maximum
Lumens
Incandescent
Equivalent
Pre‐EISA 2007
(WattsBase)
Incandescent
Equivalent
Post‐EISA 2007
(WattsBase)
Effective Date from Which
Post‐EISA 2007 Assumption
Should Be Used**
1,490 2,600 100 72 June 2012
1,050 1,489 75 53 June 2013
750 1,049 60 43 June 2014*
310 749 40 29 June 2014*
*Not relevant for the PY13 evaluation
**As the legislation only requires that specified bulbs cease manufacturing on January 1, a lag period of six months
accounts for remaining bulbs left on the shelves.
Using these lumen equivalents as guides allowed bulb wattages to be mapped to the equivalent
incandescent bulbs, as shown in Table 21 and Table 22.

42
Table 21. CFL Wattage Mapping
CFL Wattage Lumen‐Equivalent
Incandescent WattageCFL Wattage
Lumen‐Equivalent Incandescent Wattage
3 15 20 53*5 20 22 53*7 25 23 729 40 24 72
10 40 24 7211 40 25 7212 40 26 7212 40 27 7213 60 28 15014 60 29 15015 60 32 15016 60 33 15017 60 40 15018 53* 42 15019 53* 55 250
*For 75W standard incandescent equivalent bulbs sold prior to June 30, 2013, the study applied an incandescent
wattage of 75 to account for delayed effects of EISA rules at the retail level.
Table 22. LED Wattage Mapping
LED Wattage Lumen‐Equivalent Wattage (Specialty)
8 40
10 40
11 60
12 60
13 60 14 75
Leakage (LKG)
Through intercept surveys, the analysis described in Appendix E. m counted program‐discounted bulbs
purchased by Ameren customers and by other utility customers at a sample of big box stores carrying
LightSavers upstream CFLs and LEDs. Analysis segmented the stores by their expected vulnerability to
leakage and then weighted the results by program bulbs sold in each store by segment. The team then
averaged in an assumption of zero leakage for non‐big box stores to estimate the total upstream
markdown leakage, as shown in Table 23.
Table 23. Leakage Rate
Delivery Channel Leakage Rate Precision at 90% Confidence
Upstream Markdown 3.3% 1%
Coupon 0.0% ‐
SMD 1.3% 2%

43
The study did not find coupon and online store leakage as participants had to provide their Ameren
utility account number to receive a coupon. In a separate effort, the Cadmus team estimated SMD
leakage through a survey of 75 randomly selected SMD participants. One customer (1.3% out of 75)
reported they were not an Ameren customer. Appendix E provides further details on leakage analysis for
the Upstream Markdown delivery channel.
Residential/Nonresidential Split (%RES)
Through the same intercepts, the Cadmus team counted program‐discounted bulbs purchased by
Ameren and other utility customers to install in their homes or businesses. If bulbs were purchased for a
business, surveys asked if the business was located within Ameren’s territory or another utility area. All
businesses were located in Ameren territory. Weighting the results in the same manner as the leakage
results discussed above resulted in 11% (1.5% precision at 90% confidence) of the bulbs purchased for
nonresidential use in Ameren’s territory. Appendix E provides further details on this analysis.
ISR
To account for Ameren customers installing some currently uninstalled bulbs at a later date, the Cadmus
team determined the overall ISR as the present value of savings over the nine‐year lifetime of the CFLs.
These calculations derived on the protocol recommended in Residential Lighting chapter of The Uniform
Methods Project (UMP): methods for Determining Energy Efficiency Savings for Specific Measures.10
These data allowed determination of the probable rate of future installation applicable to Ameren’s
results.
Per the UMP, 11% of total CFLs are typically installed in year two, another 6.7% of remaining CFLs in
storage are installed in year three, and a final, small portion is installed in year 4. As UMP data could not
provide an exact number for the percentage of remaining bulbs installed in year 4, they recommended
averaging the cumulative installation rate by year 3 with 99%, which is the final installation rate found in
an earlier study in California (which the Cadmus team has used in previous evaluations as the basis for
this calculation).
For Ameren’s territory, the Cadmus team used the home inventory visits to determine a year‐one ISR of
82% in PY13. Thus, 632,310 of 3,512,834 Upstream Markdown and coupon bulbs sold in PY13 went into
storage in year one. Of those, an estimated 316,858 will be installed in year two, 214,225 will be
installed in year three, and a final 33,050 will be installed in year four, for a total of 3,444,656, or 98.1%
installed over time (see Table 24)
Table 24. Expected CFL Installations from PY13 Markdown and Coupon Bulbs
Installation Rate Total Bulbs
Total Bulbs Sold 3,512,834
PY13 Installation Rate (YR1) 0.82
10 While the UMP has not yet been finalized, the Residential Lighting Evaluation Protocol chapter has been
through substantial review and no major changes are expected prior to publication.

44
PY13 Installed 2,880,524
Year Projected
UMP Cumulative Installed
Percentage Cumulative Install Rate
Cumulative Bulbs
Installed Installed in Year
2014 (YR2) ISRYR1 * (1.11) 91.0% 3,197,382 316,858
2015 (YR3) ISRYR2 * (1.067) 97.1% 3,411,606 214,225
2016 (YR4)
(99% + ISRYR3) / 2 98.1% 3,444,656 33,050
98.1%
In calculating the overall ISR, the Cadmus team determined the difference in the net present value (NPV)
of CFL savings, accrued over a 12‐year period, between those phased in as described above (Scenario 1,
all CFLs are installed within four years) and those phased in per a scenario where 100% would be
installed in the first year. (In this case, analysis simplified the savings value to assume savings equaled
the number of CFLs. This value is applied to the actual savings of the CFLs in the impact results
calculations.)
As shown in Table 25, the NPV of savings from the actual delayed‐install scenario (Scenario 1) equaled
96.5% of the NPV value of savings if all bulbs were installed in the first year (Scenario 2). Therefore, the
Cadmus team applied a 96.5% ISR adjustment to gross savings.
Table 25. Comparison of Actual Installation Impacts to Assumed First‐Year Installation
Scenario 1, Installation Over Four Years Scenario 2, Installation Assumed in Year One
Installation Rate
Year 1 Year 2 Year 3 Year 4 Total
NPV 22,140,837 22,935,689 96.5%
1 2,880,524 2,880,524 3,512,834
2 2,880,524 316,858 3,197,382 3,512,834
3 2,880,524 316,858 214,225 3,411,606 3,512,834
4 2,880,524 316,858 214,225 33,050 3,444,656 3,512,834
5 2,880,524 316,858 214,225 33,050 3,444,656 3,512,834
6 2,880,524 316,858 214,225 33,050 3,444,656 3,512,834
7 2,880,524 316,858 214,225 33,050 3,444,656 3,512,834
8 2,880,524 316,858 214,225 33,050 3,444,656 3,512,834
9 2,880,524 316,858 214,225 33,050 3,444,656 3,512,834
10 316,858 214,225 33,050 564,132 0
11 214,225 33,050 247,274 0
12 33,050 33,050 0

45
While 98.1% of the bulbs were predicted to be installed over time, on a NPV basis, an ISR of 96.5%
results, as shown in Table 26. This value applies to markdown and coupon sales.
For SMD bulbs, addressing a different population but distributed in a different manner, the Cadmus
team conducted a separate survey of participants. The survey‐reported ISR of 60% served as the starting
point and repeated the calculation process described above. This resulted in an ISR of 81.5% for SMD
bulbs. Table 26 shows all ISRs.
Table 26. Measure Installation
Delivery Channel Percentage Installed and Operating
Upstream Markdown 96.5%
Coupon 96.5%
SMD 81.5%*
*The first‐year installation rate was lower for SMD than for the upstream program.
HOU (HoursRES and HoursNRes)
We applied average HOU (2.91 hours per day, with 12.4% precision at 90% confidence), determined
from the metering study performed during the PY10 evaluation for residentially installed bulbs. For
nonresidential installations, the Cadmus team applied an assumption of 8.74 hours per day, drawn from
DEER 2008 for CFLs installed in the miscellaneous category for nonresidential buildings.11
WHFRES and WHFNRes
The Cadmus team used the LightSavers program data—average home information from Ameren’s
recent potential study and from an engineering simulation model—to estimate the WHF for residential
customers. The team also worked with Ameren’s nonresidential evaluation contractor to develop the
WHF for nonresidential customers. Appendix H details the entire methodology. The analysis resulted in
the residential and nonresidential WHFs listed in Table 27.
Table 27. WHF
Sector Delivery Stream Waste Heat Factor
Residential
Upstream Markdown 0.99
Coupon 0.99
SMD* 0.98
Nonresidential Upstream Markdown and Coupon 1.10
*SMD varies slightly due to a different mix of heating and cooling types.
Using the engineering algorithms described above, Cadmus determined ex post energy savings for each
measure category, as shown in Table 28. Realization rates for upstream and coupon bulbs ranged from
111%% to 161% due to differences between the Ameren TRM estimates and the observed bulb
11 DEER 2008 values for CFLs in the Miscellaneous category, using an average of interior space values.

46
wattages. The impact evaluation accounted for ISR, leakage, WHF, and nonresidential installations,
which the TRM did not factor in. Lower SMD realization rates resulted (79%–80%), due to the lower‐
than‐expected ISR.
Table 28. Ex Ante and Ex Post Gross Unit Savings Comparison for CFLs and LEDs
Bulb Type and Wattage Ex Ante
Savings/Unit
Ex Post
Savings/Unit
Precision at
90%
Confidence
Realization
Rate
Upstream and Coupon Bulbs
CFL ‐ 13W (60W incandescent equiv) pre‐EISA 48.4 56.8
3%
117%
CFL ‐ 18W (75W incandescent equiv) post‐EISA 37.4 60.3 161%
CFL ‐ 23W (100W incandescent equiv) post‐EISA 51.2 59.9 117%
CFL ‐ High Wattage Bulbs 113.0 173.2 153%
CFL ‐ Specialty Bulbs 44.1 49.1 111%
CFL – Reflector 44.1 55.7 126%
LED ‐ 8W Globe Light G25 Bulb 32.0 39.5 123%
LED ‐ 10.5W Downlight E26 Light Bulb 54.5 60.5 111%
LED ‐ 12W Dimmable Light Bulb 48.0 70.6 147%
SMD Bulbs
CFL ‐ 13W (60W incandescent equiv) pre‐EISA 48.4 38.62%
80%
CFL ‐ 23W (100W incandescent equiv) post‐EISA 51.2 40.7 79%
Occupancy Sensor Gross Savings
The Cadmus team used the following equation to calculate ex post energy savings for
occupancy sensors:
∆ ∗ ∗ ∗
Where:
Wattest = Average interior fixture wattage from the PY13 HIS.
HOU = Daily hours of use from PY10 metering study
Days/Year = Days per year
SF = Savings factor from Ameren TRM
Using this engineering algorithm, the Cadmus team determined an ex post energy savings value of 37.5
kWh/year for each installed occupancy sensor. This value equals approximately 17% of the program’s
ex ante value (217 kWh/year), based on the Ameren TRM (as shown in Table 29). The Ameren value
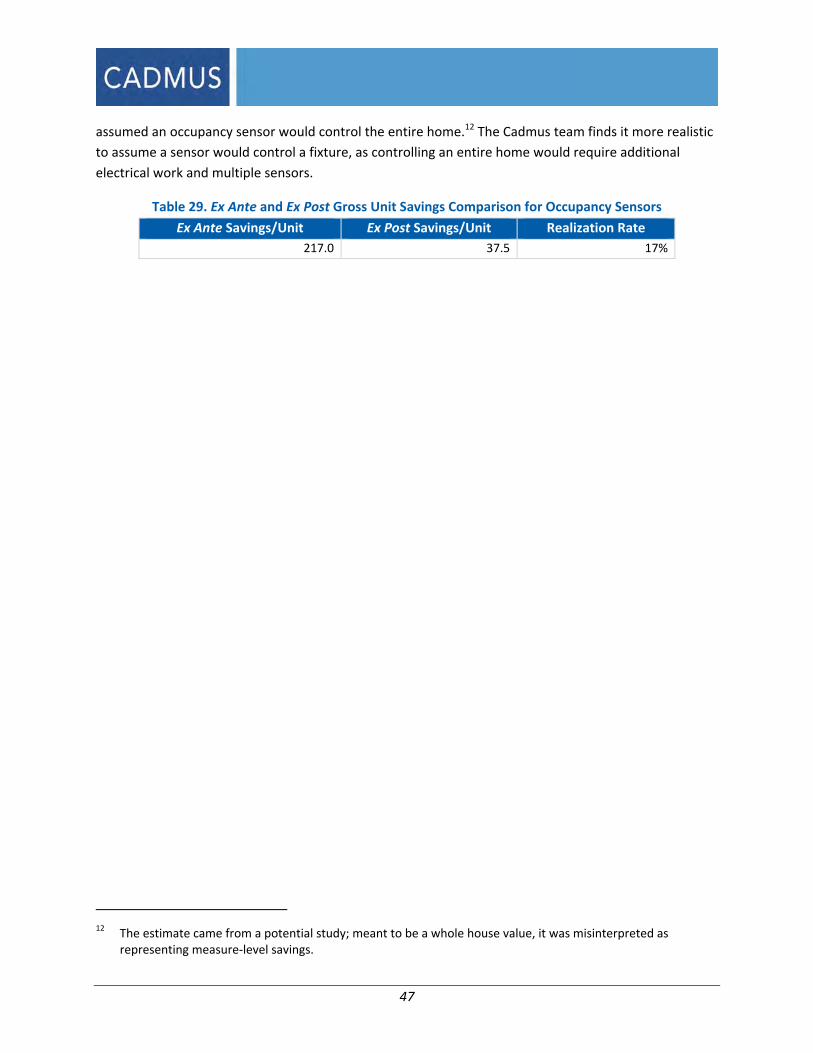
47
assumed an occupancy sensor would control the entire home.12 The Cadmus team finds it more realistic
to assume a sensor would control a fixture, as controlling an entire home would require additional
electrical work and multiple sensors.
Table 29. Ex Ante and Ex Post Gross Unit Savings Comparison for Occupancy Sensors
Ex Ante Savings/Unit Ex Post Savings/Unit Realization Rate
217.0 37.5 17%
12 The estimate came from a potential study; meant to be a whole house value, it was misinterpreted as
representing measure‐level savings.
48
NET IMPACT EVALUATION RESULTS
The Cadmus team calculated the program’s NTG ratio using the following formula:
1
Free riders are customers who would have purchased the marked‐down lighting independently of the
program. They account for some program costs but none of its benefits, thus decreasing program net
savings. The Cadmus team estimated free ridership through the price‐response model (which Appendix I
describes in detail).
Nonparticipant lighting spillover results from additional savings generated when program participants
undertake additional energy‐efficient measures or activities without financial assistance and due to their
experience participating in a given program. In the case of LightSavers, the Cadmus team defined
nonparticipant lighting spillover as “like” spillover: increased purchases of efficient lighting products that
were not discounted, but occurring due to the program’s increasing availability and presenting
education about the benefits from energy‐efficient lighting. Unlike free ridership, no program costs are
associated with spillover savings, but energy‐saving benefits can result, which increase net savings.
Market effects are systemic changes to standard business practices, caused by program activities and
tending to persist long after program interventions have ended. Demand‐side management (DSM)
programs’ potential to result in structural changes when intervening in a given market have become
increasingly apparent as:
Program delivery models have evolved (e.g., more upstream‐focused programs);
Energy‐efficiency investment has grown dramatically; and
Programs have established long‐term relationships with key market actors and trade allies.
Nonparticipant non‐lighting spillover result from additional savings generated when those exposed to
education and advertising about energy efficiency make additional (non‐lighting) energy savings
improvements on their own.
As the SMD program targets at low‐income customers and CFLs are provided free of charge, the Cadmus
team assumed a NTG of 1.0
Free Ridership The Cadmus team modeled bulb, pricing, and promotional data using an econometric model. The study
modeled these data as a panel, with a cross‐section of program package quantities modeled over time
as a function of prices, promotional events, and retail channels. This involved testing a variety of
specifications to ascertain price impacts—the main instrument affected by the program—on the
demand for bulbs. The team estimated the basic equation for the model as follows (for bulb model i, in
period t):

49
Equation 7
ln , , ∗ , ∗ ,
, PromotionalEvents ∗ , ∗ ,
Where:
ln = Natural log
Q = Quantity of bulb packs sold during the month
P = Retail price in that month
Retail Channel = Retail category (DIY or non‐DIY)
Bulb Type = Product category (standard CFL, specialty CFL, or LED)
Promotional Events = Number of in‐store promotions
ID = Dummy variable equaling 1 for each unique retail channel and SKU; 0 otherwise
Time Trend = Quantitative trend representing the impact of secular trends not related to the
program13
= Cross‐sectional random‐error term
= Time‐series random‐error term
The model specification assumed a negative binomial distribution. This distribution serves as the best fit
of the plausible distributions (lognormal, poisson, negative binomial, or gamma).
The Cadmus team adjusted the model for four factors (which discussed in more detail in Appendix I.
Seasonality: To account for baseline lighting sales tending to follow a seasonal pattern,
unrelated to price or promotion.
Brought‐in bulbs: In a limited number of stores, the study set free ridership at zero because,
without the program, the store would not offer CFLs prior to PY13.
Adjustment for missing data on promotional displays: Display data were based on random visits
to stores by field representatives rather than continuous information.
Stocking issues: The model assumed supply would always meet demand; after verifying
situations where this did not occur, the Cadmus team dropped a small number of observations
from the analysis.
13 The time trend for this analysis represents shifts in sales due to non‐program related seasonality. It was
calculated using normalized sales of program bulbs in the previous year, without in‐store promotions or price changes.
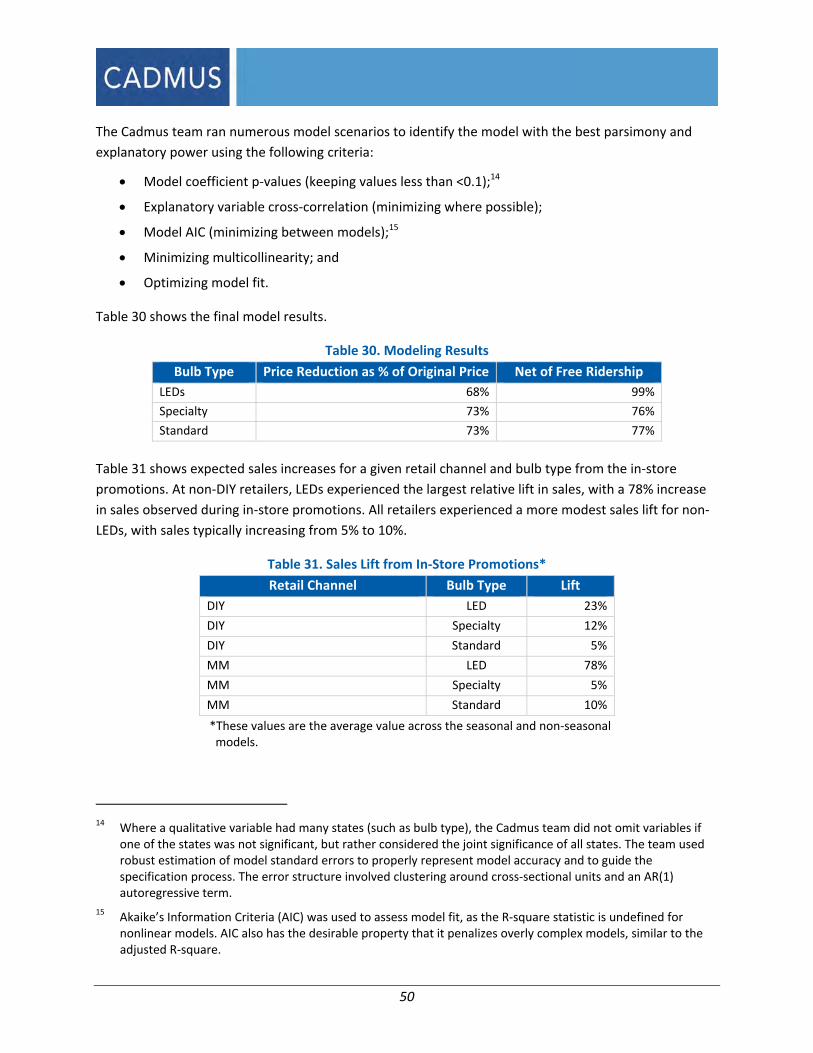
50
The Cadmus team ran numerous model scenarios to identify the model with the best parsimony and
explanatory power using the following criteria:
Model coefficient p‐values (keeping values less than <0.1);14
Explanatory variable cross‐correlation (minimizing where possible);
Model AIC (minimizing between models);15
Minimizing multicollinearity; and
Optimizing model fit.
Table 30 shows the final model results.
Table 30. Modeling Results
Bulb Type Price Reduction as % of Original Price Net of Free Ridership
LEDs 68% 99%
Specialty 73% 76%
Standard 73% 77%
Table 31 shows expected sales increases for a given retail channel and bulb type from the in‐store
promotions. At non‐DIY retailers, LEDs experienced the largest relative lift in sales, with a 78% increase
in sales observed during in‐store promotions. All retailers experienced a more modest sales lift for non‐
LEDs, with sales typically increasing from 5% to 10%.
Table 31. Sales Lift from In‐Store Promotions*
Retail Channel Bulb Type Lift
DIY LED 23%
DIY Specialty 12%
DIY Standard 5%
MM LED 78%
MM Specialty 5%
MM Standard 10%
*These values are the average value across the seasonal and non‐seasonal models.
14 Where a qualitative variable had many states (such as bulb type), the Cadmus team did not omit variables if
one of the states was not significant, but rather considered the joint significance of all states. The team used robust estimation of model standard errors to properly represent model accuracy and to guide the specification process. The error structure involved clustering around cross‐sectional units and an AR(1) autoregressive term.
15 Akaike’s Information Criteria (AIC) was used to assess model fit, as the R‐square statistic is undefined for nonlinear models. AIC also has the desirable property that it penalizes overly complex models, similar to the adjusted R‐square.
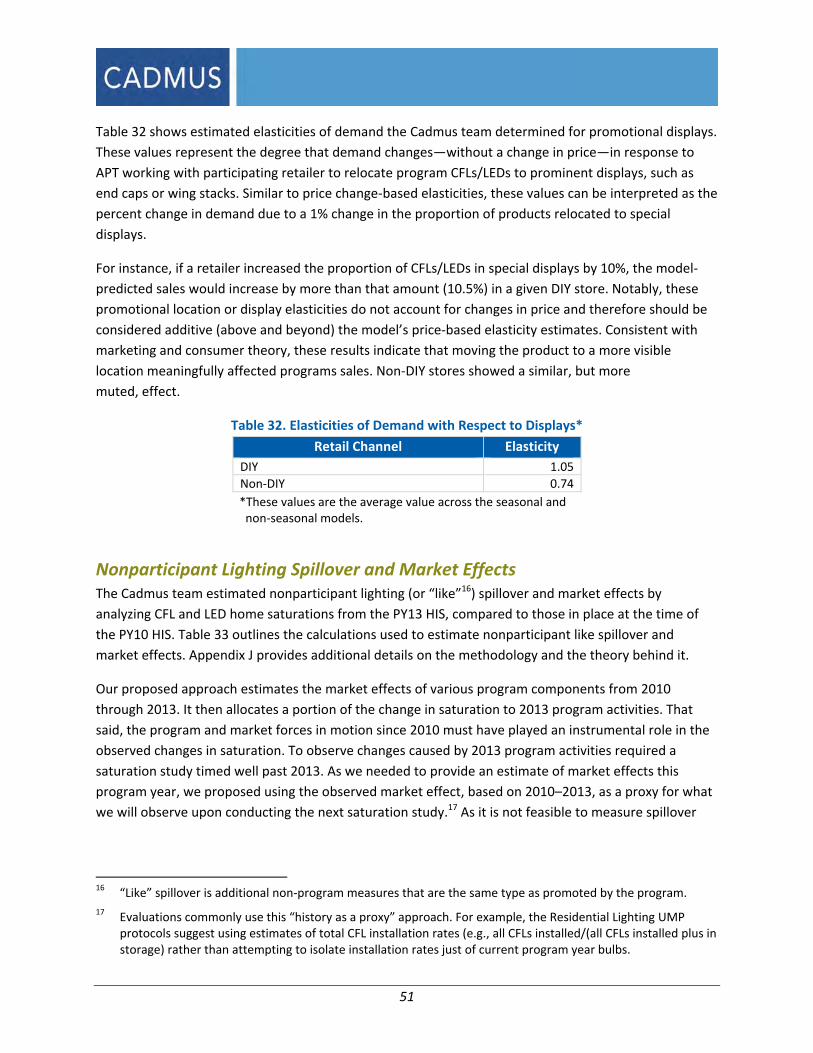
51
Table 32 shows estimated elasticities of demand the Cadmus team determined for promotional displays.
These values represent the degree that demand changes—without a change in price—in response to
APT working with participating retailer to relocate program CFLs/LEDs to prominent displays, such as
end caps or wing stacks. Similar to price change‐based elasticities, these values can be interpreted as the
percent change in demand due to a 1% change in the proportion of products relocated to special
displays.
For instance, if a retailer increased the proportion of CFLs/LEDs in special displays by 10%, the model‐
predicted sales would increase by more than that amount (10.5%) in a given DIY store. Notably, these
promotional location or display elasticities do not account for changes in price and therefore should be
considered additive (above and beyond) the model’s price‐based elasticity estimates. Consistent with
marketing and consumer theory, these results indicate that moving the product to a more visible
location meaningfully affected programs sales. Non‐DIY stores showed a similar, but more
muted, effect.
Table 32. Elasticities of Demand with Respect to Displays*
Retail Channel Elasticity
DIY 1.05
Non‐DIY 0.74
*These values are the average value across the seasonal and non‐seasonal models.
Nonparticipant Lighting Spillover and Market Effects The Cadmus team estimated nonparticipant lighting (or “like”16) spillover and market effects by
analyzing CFL and LED home saturations from the PY13 HIS, compared to those in place at the time of
the PY10 HIS. Table 33 outlines the calculations used to estimate nonparticipant like spillover and
market effects. Appendix J provides additional details on the methodology and the theory behind it.
Our proposed approach estimates the market effects of various program components from 2010
through 2013. It then allocates a portion of the change in saturation to 2013 program activities. That
said, the program and market forces in motion since 2010 must have played an instrumental role in the
observed changes in saturation. To observe changes caused by 2013 program activities required a
saturation study timed well past 2013. As we needed to provide an estimate of market effects this
program year, we proposed using the observed market effect, based on 2010–2013, as a proxy for what
we will observe upon conducting the next saturation study.17 As it is not feasible to measure spillover
16 “Like” spillover is additional non‐program measures that are the same type as promoted by the program.
17 Evaluations commonly use this “history as a proxy” approach. For example, the Residential Lighting UMP protocols suggest using estimates of total CFL installation rates (e.g., all CFLs installed/(all CFLs installed plus in storage) rather than attempting to isolate installation rates just of current program year bulbs.

52
and market effects from the beginning to the end of PY13,18 we use average historical spillover and
market effects rates as a proxy for PY13. Embedded in this approach is an assumption that PY13
spillover and market effects occur at the same rate as that exhibited between mid‐PY10 and mid‐PY13.
Table 33. Spillover and Market Effects Calculations
Line Inputs Value Inputs and Calculations
1 No. MSB Sockets Per Household
54.8 The weighted average found from combined site visits in 2010 and 2013 (53.0 in 2010 and 54.8 in 2013).
Baseline Saturation
2 No. of Households 1,032,949 Obtained from utility customer accounting at the time of the 2010 home inventory visits in July 2010.
3 Baseline Saturation CFLs and LEDs
21% Baseline saturations of MSB sockets from 2010 site visits (20.8% in 2010).
4 Storage CFLs and LEDs 2.2 Estimated through baseline site visits (2.2 in 2010).
5 No. of CFLs and LEDs (Baseline) 14,051,205
Straight computation as the product of the number of sockets, the number of households, and saturation levels, plus bulbs in storage, multiplied by the number of households.
Current Saturation
6 No. of Households 1,040,928 Collected from Ameren to determine the timing of site visits (June 2013).
7 Post Saturation 31% Estimated through 2013 site visits.
8 Storage CFLs and LEDs 3.7 Counted at site visits in 2013.
9 Other CFLs and LEDs purchased plus disposed
0.07 CFLs otherwise disposed of since June 2010, as gathered from customer surveys conducted during 2013 site visits.
10 Subtract SMD bulbs 614,350 The count of SMD bulbs distributed between June 2010 and July 2013 (as SMD bulbs are accounted for separately).
11 Post CFL and LEDs without SMD
20,831,890
Similar to the number of CFLs in the baseline, this derives from straight computations, as the product of the number of sockets, the number of households, and saturation levels plus the average CFLs in storage and the CFLs disposed of since the last study, multiplied by the number of households, and subtracting bulbs distributed through the SMD program.
12 Increase in CFLs and LEDs 6,780,684 Computed by subtracting program bulbs from post CFLs.
13 Program CFLs and LEDs 3,999,774 Obtained from the implementer data tracking system for the period between June 2010 and July 2013.
14 Non Program CFLs and LEDs 2,780,910 The difference between the increase in total CFLs.
Free Ridership
15 Rate 24% The current free ridership rate, estimated through self‐reporting or a pricing model.
16 Free rider CFLs and LEDs 959,946 The product of the free ridership rate and program CFLs.
17 Non Free rider CFLs and LEDs 3,039,828 The difference between program bulbs and free rider bulbs.
18 This would require implementing home inventory studies twice in one year to coincide precisely with the
program’s beginning and end, and would double the evaluation budget for this task.
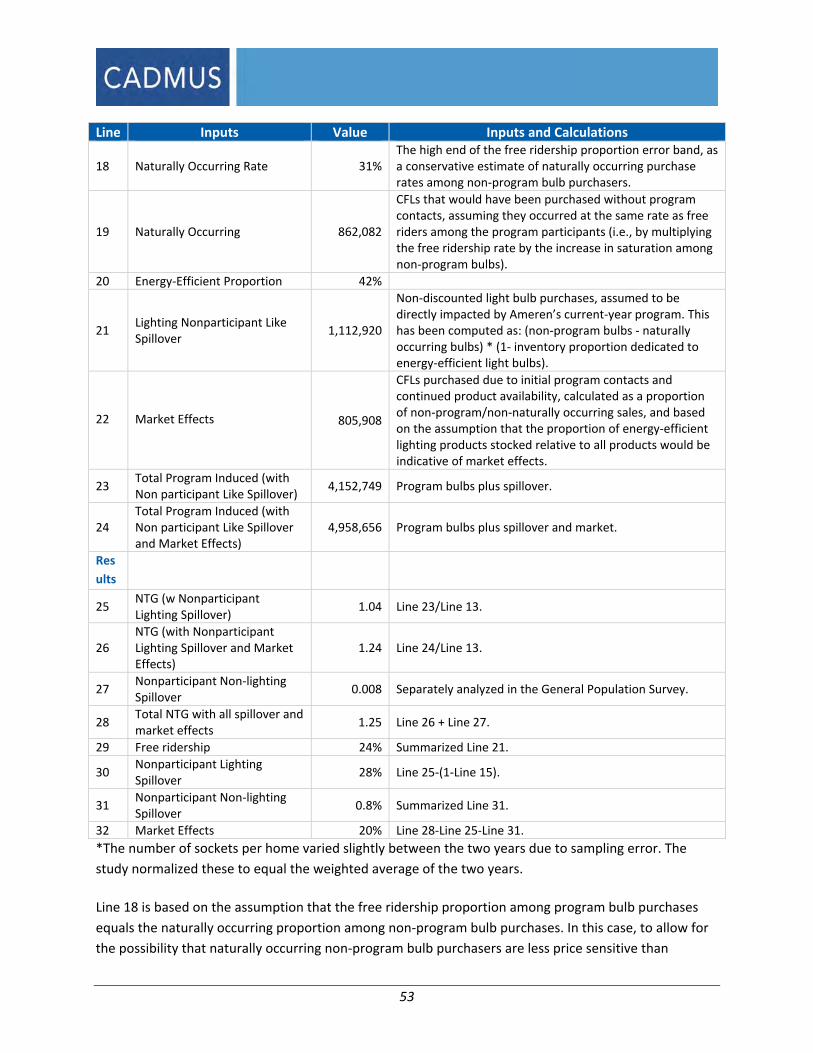
53
Line Inputs Value Inputs and Calculations
18 Naturally Occurring Rate 31% The high end of the free ridership proportion error band, as a conservative estimate of naturally occurring purchase rates among non‐program bulb purchasers.
19 Naturally Occurring 862,082
CFLs that would have been purchased without program contacts, assuming they occurred at the same rate as free riders among the program participants (i.e., by multiplying the free ridership rate by the increase in saturation among non‐program bulbs).
20 Energy‐Efficient Proportion 42%
21 Lighting Nonparticipant Like Spillover
1,112,920
Non‐discounted light bulb purchases, assumed to be directly impacted by Ameren’s current‐year program. This has been computed as: (non‐program bulbs ‐ naturally occurring bulbs) * (1‐ inventory proportion dedicated to energy‐efficient light bulbs).
22 Market Effects 805,908
CFLs purchased due to initial program contacts and continued product availability, calculated as a proportion of non‐program/non‐naturally occurring sales, and based on the assumption that the proportion of energy‐efficient lighting products stocked relative to all products would be indicative of market effects.
23 Total Program Induced (with Non participant Like Spillover)
4,152,749 Program bulbs plus spillover.
24 Total Program Induced (with Non participant Like Spillover and Market Effects)
4,958,656 Program bulbs plus spillover and market.
Res
ults
25 NTG (w Nonparticipant Lighting Spillover)
1.04 Line 23/Line 13.
26 NTG (with Nonparticipant Lighting Spillover and Market Effects)
1.24 Line 24/Line 13.
27 Nonparticipant Non‐lighting Spillover
0.008 Separately analyzed in the General Population Survey.
28 Total NTG with all spillover and market effects
1.25 Line 26 + Line 27.
29 Free ridership 24% Summarized Line 21.
30 Nonparticipant Lighting Spillover
28% Line 25‐(1‐Line 15).
31 Nonparticipant Non‐lighting Spillover
0.8% Summarized Line 31.
32 Market Effects 20% Line 28‐Line 25‐Line 31.
*The number of sockets per home varied slightly between the two years due to sampling error. The
study normalized these to equal the weighted average of the two years.
Line 18 is based on the assumption that the free ridership proportion among program bulb purchases
equals the naturally occurring proportion among non‐program bulb purchases. In this case, to allow for
the possibility that naturally occurring non‐program bulb purchasers are less price sensitive than

54
program free riders, we assumed the naturally occurring portion occurred at a slightly higher rate: equal
to the high end of the error bound for free ridership. The Cadmus team also conducted sensitivity
analysis to assess how the NTG would vary if the free ridership rate applied to non‐program bulbs. As
shown in Figure 8, the NTG fell between 0.9 and 1.3.
Figure 8. NTG Sensitivity from Varying Naturally Occurring Purchases
Market Effects Preponderance of Evidence
To support the market effects estimate, the Cadmus team researched other metrics, tracked since 2010,
indicative of market effects. Specifically, we looked for increased CFL awareness, increased retail store
program participation, and increased stocking of non‐program bulbs among retailers. While some of
these effects may result from other, non‐program‐related factors, it is reasonable to assume that some
of the changes resulted from the program:
Customer familiarity with CFLs is increasing. In PY10, we asked inventory customers whether
they were not at all, not very, somewhat, or very familiar with CFLs. The proportion somewhat
or very familiar increased from 80% in PY10 to 95% in PY13. Some customers attributed this
directly to the program, as, of those surveyed in PY13, 37% and 50% of CFL and LED purchasers,
respectively, stated they learned about the bulbs in a store or from Ameren directly.
Customer purchase rates are increasing. Through the PY13 home inventory study, residents
reported that 70% of all bulbs purchased since January 2013 were CFLs or LEDs. This compares
to the average historical rate of 31% of MSB sockets that contain CFLs or LEDs.
Retail store program participation has increased. Ameren has expanded the store participation
from 270 locations in PY10 to 350 locations in PY13.
Retail stocking of non‐discounted CFLs and LEDs has increased. In PY10, approximately 50% of
participating retail stores stocked only Ameren‐discounted standard CFLs and did not stock
55
specialty CFLs or LEDs. In PY13, 15 of 18 retailers surveyed stocked Ameren discounted and non‐
discounted standard and specialty CFLs. Of the specialty CFLs stocked, 11 of 15 retailers said
fewer than 50% were discounted by Ameren. Twelve of 18 retailers offered Ameren and non‐
Ameren discounted LEDs; fewer than 25% of the LEDs were discounted.
Nonparticipant Spillover Effective program marketing and outreach generates program participation and increases general
energy‐efficiency awareness among customers. The cumulative effect of sustained utility program
marketing (which often occurs concurrently for multiple programs) can affect customers’ perceptions of
their energy usage and, in some cases, motivates customers to take efficiency actions outside of the
utility’s program. This phenomenon—called nonparticipant spillover (NPSO)—results in energy savings
caused by but not rebated through a utility’s demand‐side management activity.
During PY13, Ameren Missouri spent over $1.6 million dollars to market individual residential efficiency
programs and the portfolio‐wide Act on Energy campaign. To understand whether Ameren’s program‐
specific and general Act On Energy marketing efforts generated energy‐efficiency improvements outside
of Ameren’s incentive programs, the Cadmus team implemented a general population survey of
residential customers. We will repeat the survey for both PY14 and PY15 as we continue monitoring
nonparticipant activity and tracking potential long‐term changes in energy‐efficiency awareness among
Ameren’s residential customers.
Methodology
Using Ameren’s entire residential customer information system as the sample frame, the Cadmus team
randomly selected and surveyed 401 customers. We determined that our sample contained a small
number of customers (n=36) who self‐reported that they participated in an Ameren residential program
in 2013. When estimating NPSO, we excluded these customers from our analysis, focusing on the
365 identified nonparticipants to avoid the potential double‐counting of program‐specific spillover.
We limited our NPSO analysis to the same efficiency measures rebated through Ameren programs
(known as “like” spillover), with the notable exception of lighting products. Even though lighting is a
“like” spillover measure, the analysis excluded it to avoid double‐counting NPSO lighting savings already
captured through the upstream LightSavers program market affects analysis.
To confirm a relationship between Ameren’s energy‐efficiency programs and the Act On Energy
awareness campaign and actions taken by nonparticipants, the Cadmus team’s survey asked about
nonparticipants’ familiarity with Ameren’s energy‐efficiency programs and Act On Energy. To be
included in the NPSO analysis, nonparticipating respondents had to indicate: a) they were familiar with
Ameren’s campaign; and b) Ameren’s efficiency messaging motivated their purchasing decisions.

56
Results
Of 365 nonparticipants surveyed, 11 cited Ameren’s marketing as either “very important” or “somewhat
important” in their decisions to purchase non‐rebated, high‐efficiency measures during 2013:19
Among nonparticipants citing their knowledge of Ameren’s energy‐efficiency programs or the
Act On Energy campaign as “very important,” we counted ex post, gross, per‐unit savings,
determined through the PY13 evaluation towards the NPSO analysis.
If nonparticipants said Ameren was “somewhat important” in their decisions, we applied a 50%
decrement and applied one‐half of the ex post energy savings for the specified measure.
The analysis excluded the responses of nonparticipants who said that Ameren’s programs or Act On
Energy were “not very important” or “not at all important” to their efficiency actions.
Table 34 shows measures and gross evaluated kWh savings attributed to Ameren, with average savings
per spillover measure of 242 kWh.
Table 34. NPSO Response Summary
Individual Reported Spillover
Measures
Influence of
Ameren
Information on
Purchase
Measure
Savings
(kWh)*
Allocated
Savings
Total
kWh
Savings
Avg kWh Per
Spillover
Measure
Water Heater Very 245.7† 100% 245.7
A
Central Air Conditioner (CAC) Somewhat 288* 50% 144.0
Installed Programmable Thermostat Somewhat 105† 50% 52.7
Installed Programmable Thermostat Somewhat 105† 50% 52.7
Installed Programmable Thermostat Somewhat 105† 50% 52.7
Installed Programmable Thermostat Somewhat 105† 50% 52.7
Installed Programmable Thermostat Somewhat 105† 50% 52.7
Removed Refrigerator Very 1,013ˆ 100% 1,013
Scheduled CAC Tune‐Up Somewhat 993** 50% 496.5
Water Heat Pipe Wrap Very 363.8† 100 363.8
Windows Somewhat 271*** 50% 136
Total (n=11) 2,662 242
†Based on savings calculated for the RebateSavers program.*Assumption used for the CoolSavers program’s gross evaluated savings, based on a 2.5‐ton unit rated at 15 SEER, with a baseline of 13 SEER.
ˆBased on savings calculated for the ApplianceSavers program. **Assumption used for the CoolSavers program’s gross evaluated savings, based on a 3‐ton unit and a 7.7% efficiency
improvement in heating and cooling for condenser cleaning. ***Based on savings calculated for the PerformanceSavers program.
19 This translates to approximately 3% of the general population, with a range of 90% confidence of 1.54% to
4.49%. Despite the range, the middle point of 3% remains the most likely value. With 3% of the population undertaking actions on their own, the sample size needed to detect such a level with ±10% would be nearly 10,000 surveys, a clearly prohibitive undertaking.
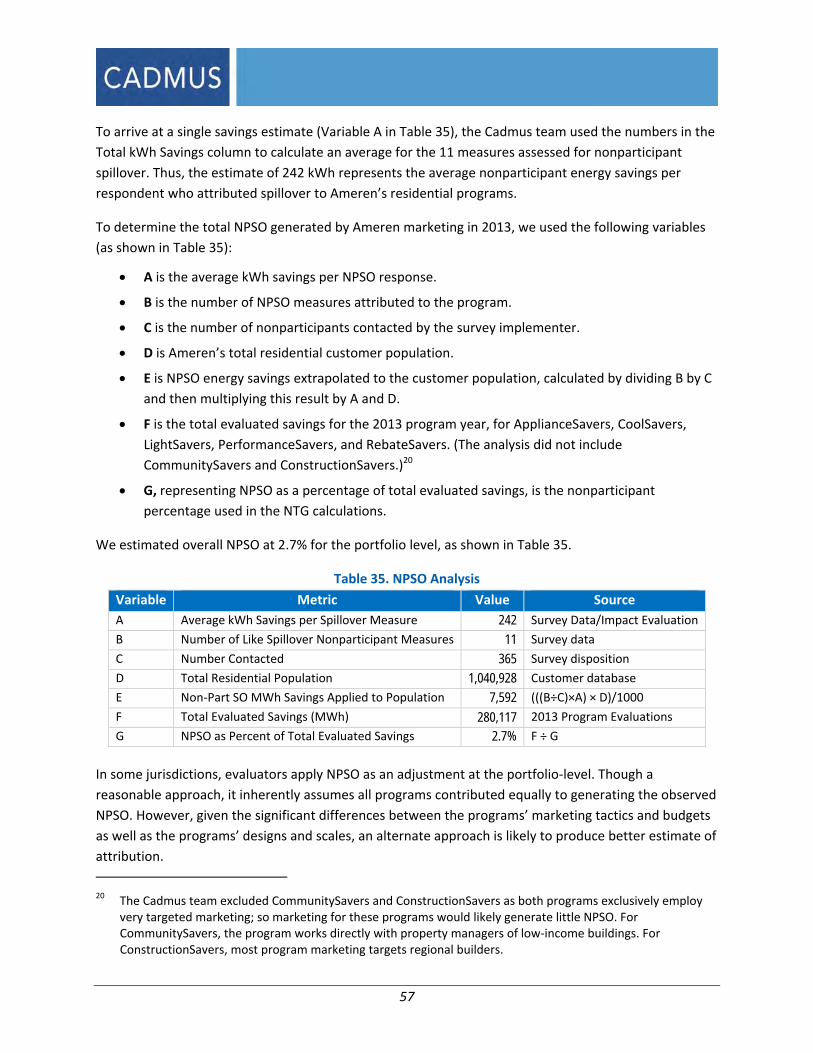
57
To arrive at a single savings estimate (Variable A in Table 35), the Cadmus team used the numbers in the
Total kWh Savings column to calculate an average for the 11 measures assessed for nonparticipant
spillover. Thus, the estimate of 242 kWh represents the average nonparticipant energy savings per
respondent who attributed spillover to Ameren’s residential programs.
To determine the total NPSO generated by Ameren marketing in 2013, we used the following variables
(as shown in Table 35):
A is the average kWh savings per NPSO response.
B is the number of NPSO measures attributed to the program.
C is the number of nonparticipants contacted by the survey implementer.
D is Ameren’s total residential customer population.
E is NPSO energy savings extrapolated to the customer population, calculated by dividing B by C
and then multiplying this result by A and D.
F is the total evaluated savings for the 2013 program year, for ApplianceSavers, CoolSavers,
LightSavers, PerformanceSavers, and RebateSavers. (The analysis did not include
CommunitySavers and ConstructionSavers.)20
G, representing NPSO as a percentage of total evaluated savings, is the nonparticipant
percentage used in the NTG calculations.
We estimated overall NPSO at 2.7% for the portfolio level, as shown in Table 35.
Table 35. NPSO Analysis
Variable Metric Value Source
A Average kWh Savings per Spillover Measure 242 Survey Data/Impact Evaluation
B Number of Like Spillover Nonparticipant Measures 11 Survey data
C Number Contacted 365 Survey disposition
D Total Residential Population 1,040,928 Customer database
E Non‐Part SO MWh Savings Applied to Population 7,592 (((B÷C)×A) × D)/1000
F Total Evaluated Savings (MWh) 280,117 2013 Program Evaluations
G NPSO as Percent of Total Evaluated Savings 2.7% F ÷ G
In some jurisdictions, evaluators apply NPSO as an adjustment at the portfolio‐level. Though a
reasonable approach, it inherently assumes all programs contributed equally to generating the observed
NPSO. However, given the significant differences between the programs’ marketing tactics and budgets
as well as the programs’ designs and scales, an alternate approach is likely to produce better estimate of
attribution.
20 The Cadmus team excluded CommunitySavers and ConstructionSavers as both programs exclusively employ
very targeted marketing; so marketing for these programs would likely generate little NPSO. For CommunitySavers, the program works directly with property managers of low‐income buildings. For ConstructionSavers, most program marketing targets regional builders.

58
The Cadmus team considered the following three approaches for allocating total observed NPSO to
individual programs:
1. Even Allocation: The most straightforward approach allocates NPSO evenly across the
residential programs (i.e., makes a 2.7% adjustment to each program’s NTG). Doing so, however,
is equivalent to applying NPSO at the portfolio‐level, and therefore, as noted, assumes all
programs contribute equally to generating NPSO.
2. “Like” Programs: Another approach allocates NSPO savings to specific programs, based on the
measure installed by the nonparticipant or by the action they took. For example, one
nonparticipant reported tuning up their CAC, based on energy‐efficiency messaging from
Ameren. Using this approach, we would assign NPSO savings associated with the tune‐up to
CoolSavers. While this approach establishes a clear connection between a reported NPSO
measure and Ameren’s program that promotes that measure, our research found this direct
measure‐program relationship did not prove as straightforward as it appeared. Specifically,
while our study found all 11 respondents reporting NPSO were familiar with Act on Energy or
Ameren’s energy‐efficiency messaging, only nine could cite specific program names. Further,
just over one‐half of the customers (6 of 11) who reported NPSO measures were unfamiliar with
the program or the programs corresponding to the measure they installed. These findings
indicated that Ameren generated NPSO through the cumulative effects of various program‐
specific and portfolio‐level marketing efforts, and mapping NPSO measures solely to the
program offering that measure could undervalue the overall impact of cumulative and sustained
energy‐efficiency messaging.
3. Marketing Budget and Program Size. The final allocation approach we considered—and
eventually chose to use—assigns overall NSPO as a function of each program’s marketing and
program budget. This approach remains consistent with the theory that NPSO results from the
cumulative effect of program‐specific and ActOnEnergy marketing and program activity over a
period of time, not necessarily by a single, program‐specific marketing effort. In addition, while
NPSO is most commonly associated with mass media marketing campaigns, the scale of program
activity also proves to be a factor. For example, even without a significant marketing campaign,
a program’s size can drive NPSO through word‐of‐mouth and in‐store program messaging. We
believe this approach accurately reflects and attributes NSPO to programs, ensuring those total
costs (including marketing) and total benefits (net savings including NPSO) are properly
accounted for when assessing overall program cost‐effectiveness.
The Cadmus team then distributed the portfolio‐level result of 7,592 MWh NPSO to Ameren’s residential
programs (excluding CommunitySavers and ConstructionSavers). As noted, we considered both the PY13
program size (in terms of total gross ex post MWh savings) and each program’s marketing budget
(shown in Table 36) when allocating NPSO across programs.

59
Table 36. Program‐Specific Savings and Marketing
Program Program Ex Post Gross
Savings (MWh)
Percentage of
Portfolio Savings
Total
Marketing
Percentage of
Total Marketing
ApplianceSavers 6,965 2.5% $542,242 35.1%
CoolSavers 25,105 9.0% $824,949 53.4%
LightSavers 232,842 83.1% $33,146 2.1%
PerformanceSavers 189 0.1% $73,145 4.7%
RebateSavers 15,017 5.4% $71,788 4.6%
Total 280,117 100% $1,545,270 100%
The results of this approach (shown in Table 37 and Table 38) reflect the impact of each program on the
nonparticipant population, based on marketing expenditures and program magnitudes in the
marketplace.
Table 37. Combined Savings and Marketing Allocation Approach
Program Ex Post Gross
Energy Savings (A)
Marketing
Spending (B)
Combined
Savings/Marketing
(AxB)
Percentage of
Combined
Savings/Marketing
ApplianceSavers 2.5% 35.1% 0.9% 11.3%
CoolSavers 9.0% 53.4% 4.8% 62.2%
LightSavers 83.1% 2.1% 1.8% 23.2%
PerformanceSavers 0.1% 4.7% 0.003% 0.04%
RebateSavers 5.4% 4.6% 0.2% 3.2%
Total 100% 100% 7.7% 100%
Two programs are credited with the greatest NPSO: CoolSavers (accounting for one‐half of all marketing
dollars) at 4,722 MWh; and LightSavers (accounting for more than 80% of total energy savings) at 1,760
MWh. As NPSO impacts program‐specific NTG results,21 all NPSO estimates have been reported as a
percentage of each program’s total gross energy savings.
As shown in Table 38, we allocated 1,760 MWh of NPSO to LightSavers, representing 23.2% of the
combined residential portfolio savings and marketing expenditure. This resulted in a 0.8% adjustment to
the program’s PY13 NTG.
21 NTG = 1 – Free Ridership + Participant Spillover + NPSO + Market Effects

60
Table 38. NPSO by Program
Program
Program
Gross Savings
(MWh)
Total
NPSO
(MWh)
Percentage of
Combined
Savings/Marketing
Program‐
Specific NPSO
(MWh)
NPSO as a
Percentage of
Gross Savings
ApplianceSavers 6,965
7,592
11.3% 861 12.4%
CoolSavers 25,105 62.2% 4,722 18.8%
LightSavers 232,842 23.2% 1,760 0.8%
PerformanceSavers 189 0.04% 3 1.7%
RebateSavers 15,017 3.2% 246 1.6%
Total 280,117 100% 7,592 2.7%
Summary
Table 39 summarizes the program’s net impacts.
Table 39. PY13 Net Impacts Results Summary
Measure
Ex Post Gross
Savings
(MWh/yr)
Free
Ridership
Lighting
NPSO
Non‐
Lighting
NPSO
Market
Effects
NTG
Ratio
Net Savings
(MWh/yr)
Upstream
Markdown/
Coupon
201,426 24% 28% 0.8% 20% 1.25 253,421
SMD 25,706 N/A N/A N/A N/A 1.0 25,706
Total 227,132 1.19 279,127

61
BENCHMARKING
The Cadmus team researched other utilities offering programs similar to Ameren Missouri’s Residential
LightSavers program. Table 40 compares: incentives levels and incentives as a share of price and gross;
and net savings of those utilities with Ameren Missouri by measure type. Ameren’s offers an average
incentive close to that offered by other upstream programs. However, the incentive as a percentage of
retail price varies widely. Generally, the higher the incentive as a percentage of the retail price, the
lower the free ridership rate.
Table 40. LightSavers Benchmarking Results: Incentives and Free Ridership
State or Utility Bulb Type Retail ChannelIncentive as a Share
of Retail Price
Net of Free
Ridership
Ameren Missouri All All 58% 76%
Entergy Arkansas 2012 All All 55%
Midwest Utility 2012 Standard All 31% 49%
Specialty All 47% 24%
Efficiency Maine ‐ 2012 Standard All 28% 68%
Specialty All 20% 8%
Focus on Energy – 2012 Standard All 54% 61%
Specialty All 27% 41%
Rocky Mountain Power UT ‐ 2014
Standard DIY
58% 80%
Specialty 39% 53%
Standard Mass Market
62% 89%
Specialty 35% 54%
Standard Other
55% 63%
Specialty 60% 40%
Rocky Mountain Power WY ‐ 2014
Standard DIY
72% 75%
Specialty 33% 68%
Standard Non‐DIY
66% 63%
Specialty 37% 42%
Pacific Power ID ‐ 2014
Standard DIY
66% 78%
Specialty 16% 38%
Standard Non‐DIY
61% 62%
Specialty 32% 44%
Northeastern Utility ‐ 2013
LEDs All 28% 22%
Reflector All 39% 39%
Specialty All 33% 33%
Standard All 61% 59%
Table 41 compares Ameren Missouri’s average incentives by bulb type with other similar programs.
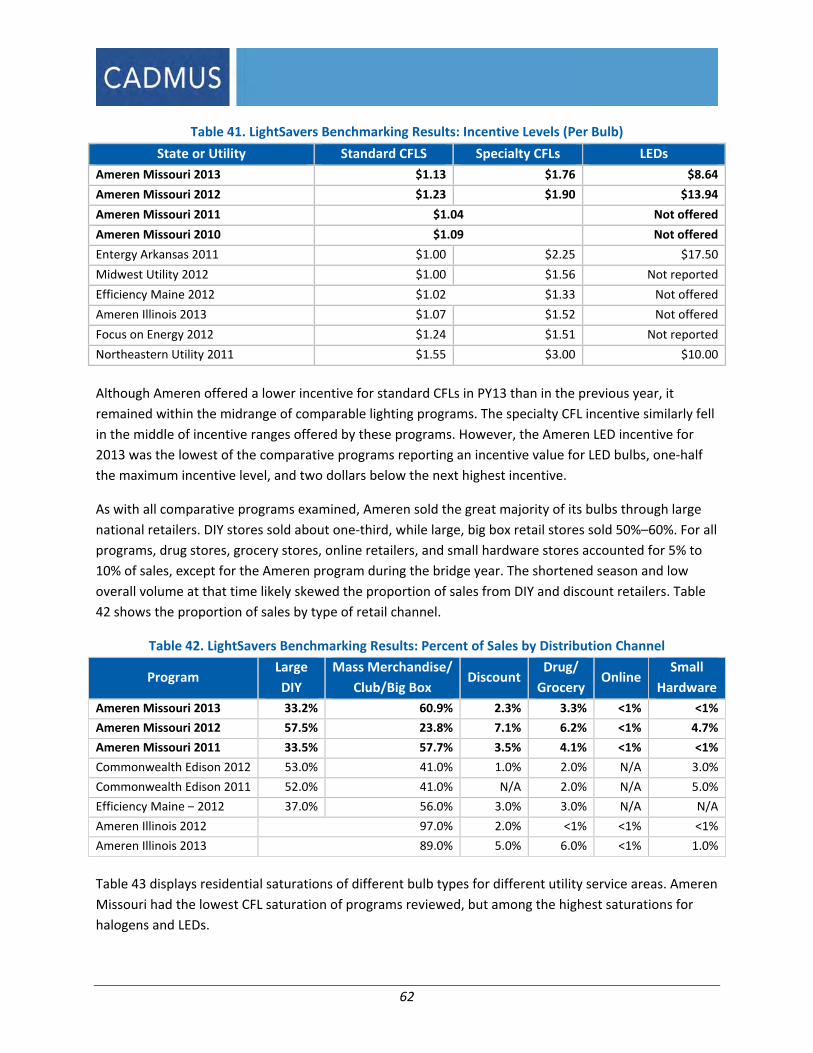
62
Table 41. LightSavers Benchmarking Results: Incentive Levels (Per Bulb)
State or Utility Standard CFLS Specialty CFLs LEDs
Ameren Missouri 2013 $1.13 $1.76 $8.64
Ameren Missouri 2012 $1.23 $1.90 $13.94
Ameren Missouri 2011 $1.04 Not offered
Ameren Missouri 2010 $1.09 Not offered
Entergy Arkansas 2011 $1.00 $2.25 $17.50
Midwest Utility 2012 $1.00 $1.56 Not reported
Efficiency Maine 2012 $1.02 $1.33 Not offered
Ameren Illinois 2013 $1.07 $1.52 Not offered
Focus on Energy 2012 $1.24 $1.51 Not reported
Northeastern Utility 2011 $1.55 $3.00 $10.00
Although Ameren offered a lower incentive for standard CFLs in PY13 than in the previous year, it
remained within the midrange of comparable lighting programs. The specialty CFL incentive similarly fell
in the middle of incentive ranges offered by these programs. However, the Ameren LED incentive for
2013 was the lowest of the comparative programs reporting an incentive value for LED bulbs, one‐half
the maximum incentive level, and two dollars below the next highest incentive.
As with all comparative programs examined, Ameren sold the great majority of its bulbs through large
national retailers. DIY stores sold about one‐third, while large, big box retail stores sold 50%–60%. For all
programs, drug stores, grocery stores, online retailers, and small hardware stores accounted for 5% to
10% of sales, except for the Ameren program during the bridge year. The shortened season and low
overall volume at that time likely skewed the proportion of sales from DIY and discount retailers. Table
42 shows the proportion of sales by type of retail channel.
Table 42. LightSavers Benchmarking Results: Percent of Sales by Distribution Channel
Program Large
DIY
Mass Merchandise/
Club/Big Box Discount
Drug/
Grocery Online
Small
Hardware
Ameren Missouri 2013 33.2% 60.9% 2.3% 3.3% <1% <1%
Ameren Missouri 2012 57.5% 23.8% 7.1% 6.2% <1% 4.7%
Ameren Missouri 2011 33.5% 57.7% 3.5% 4.1% <1% <1%
Commonwealth Edison 2012 53.0% 41.0% 1.0% 2.0% N/A 3.0%
Commonwealth Edison 2011 52.0% 41.0% N/A 2.0% N/A 5.0%
Efficiency Maine – 2012 37.0% 56.0% 3.0% 3.0% N/A N/A
Ameren Illinois 2012 97.0% 2.0% <1% <1% <1%
Ameren Illinois 2013 89.0% 5.0% 6.0% <1% 1.0%
Table 43 displays residential saturations of different bulb types for different utility service areas. Ameren
Missouri had the lowest CFL saturation of programs reviewed, but among the highest saturations for
halogens and LEDs.
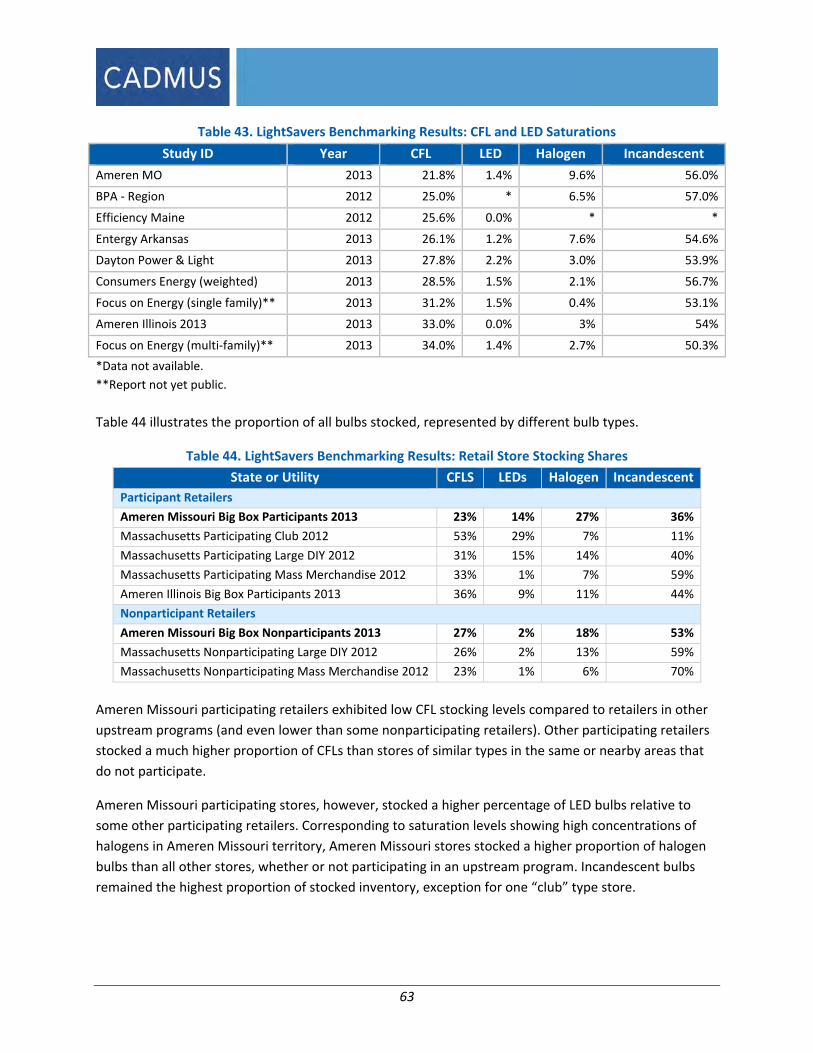
63
Table 43. LightSavers Benchmarking Results: CFL and LED Saturations
Study ID Year CFL LED Halogen Incandescent
Ameren MO 2013 21.8% 1.4% 9.6% 56.0%
BPA ‐ Region 2012 25.0% * 6.5% 57.0%
Efficiency Maine 2012 25.6% 0.0% * *
Entergy Arkansas 2013 26.1% 1.2% 7.6% 54.6%
Dayton Power & Light 2013 27.8% 2.2% 3.0% 53.9%
Consumers Energy (weighted) 2013 28.5% 1.5% 2.1% 56.7%
Focus on Energy (single family)** 2013 31.2% 1.5% 0.4% 53.1%
Ameren Illinois 2013 2013 33.0% 0.0% 3% 54%
Focus on Energy (multi‐family)** 2013 34.0% 1.4% 2.7% 50.3%
*Data not available.
**Report not yet public.
Table 44 illustrates the proportion of all bulbs stocked, represented by different bulb types.
Table 44. LightSavers Benchmarking Results: Retail Store Stocking Shares
State or Utility CFLS LEDs Halogen Incandescent
Participant Retailers
Ameren Missouri Big Box Participants 2013 23% 14% 27% 36%
Massachusetts Participating Club 2012 53% 29% 7% 11%
Massachusetts Participating Large DIY 2012 31% 15% 14% 40%
Massachusetts Participating Mass Merchandise 2012 33% 1% 7% 59%
Ameren Illinois Big Box Participants 2013 36% 9% 11% 44%
Nonparticipant Retailers
Ameren Missouri Big Box Nonparticipants 2013 27% 2% 18% 53%
Massachusetts Nonparticipating Large DIY 2012 26% 2% 13% 59%
Massachusetts Nonparticipating Mass Merchandise 2012 23% 1% 6% 70%
Ameren Missouri participating retailers exhibited low CFL stocking levels compared to retailers in other
upstream programs (and even lower than some nonparticipating retailers). Other participating retailers
stocked a much higher proportion of CFLs than stores of similar types in the same or nearby areas that
do not participate.
Ameren Missouri participating stores, however, stocked a higher percentage of LED bulbs relative to
some other participating retailers. Corresponding to saturation levels showing high concentrations of
halogens in Ameren Missouri territory, Ameren Missouri stores stocked a higher proportion of halogen
bulbs than all other stores, whether or not participating in an upstream program. Incandescent bulbs
remained the highest proportion of stocked inventory, exception for one “club” type store.

64
Ameren saw a slightly higher rate of CFL installations, compared to other recent utility estimates, as
shown in Table 45. Comparisons were not available for LED installation rates, but the Ameren Missouri
rate nonetheless remained high.
Table 45. LightSavers Benchmarking Results: First‐Year ISRs
State or Utility Year CFLs LEDs
Ameren Missouri 2013 81% 94%
Efficiency Maine 2012 73% Not offered
Dayton Power & Light 2012 77% Not offered
Ameren Illinois 2013 77% Not offered
Commonwealth Edison 2013 78%
As shown in Table 46, awareness of utility upstream lighting programs varied across the comparative
programs identified. Ameren had one of the highest awareness rates.
Table 46. LightSavers Benchmarking Results: Program Awareness
State or Utility Percentage Aware of Utility‐Sponsored Discounts
Ameren Missouri ‐ 2013 25%*
Entergy Arkansas ‐ 2013 5.7%
Midwestern Utility– 2012 26%
Northeastern Utility 2011 15%
* An additional 6% were aware of discounts, but not the sponsor.
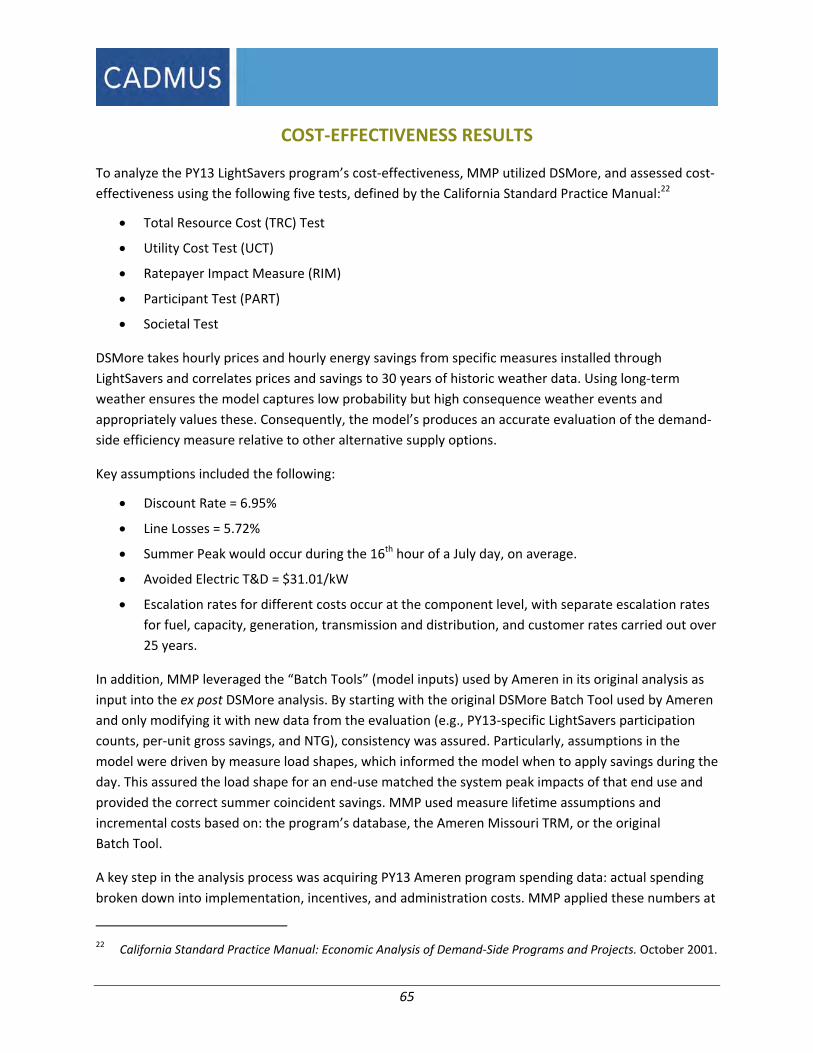
65
COST‐EFFECTIVENESS RESULTS
To analyze the PY13 LightSavers program’s cost‐effectiveness, MMP utilized DSMore, and assessed cost‐
effectiveness using the following five tests, defined by the California Standard Practice Manual:22
Total Resource Cost (TRC) Test
Utility Cost Test (UCT)
Ratepayer Impact Measure (RIM)
Participant Test (PART)
Societal Test
DSMore takes hourly prices and hourly energy savings from specific measures installed through
LightSavers and correlates prices and savings to 30 years of historic weather data. Using long‐term
weather ensures the model captures low probability but high consequence weather events and
appropriately values these. Consequently, the model’s produces an accurate evaluation of the demand‐
side efficiency measure relative to other alternative supply options.
Key assumptions included the following:
Discount Rate = 6.95%
Line Losses = 5.72%
Summer Peak would occur during the 16th hour of a July day, on average.
Avoided Electric T&D = $31.01/kW
Escalation rates for different costs occur at the component level, with separate escalation rates
for fuel, capacity, generation, transmission and distribution, and customer rates carried out over
25 years.
In addition, MMP leveraged the “Batch Tools” (model inputs) used by Ameren in its original analysis as
input into the ex post DSMore analysis. By starting with the original DSMore Batch Tool used by Ameren
and only modifying it with new data from the evaluation (e.g., PY13‐specific LightSavers participation
counts, per‐unit gross savings, and NTG), consistency was assured. Particularly, assumptions in the
model were driven by measure load shapes, which informed the model when to apply savings during the
day. This assured the load shape for an end‐use matched the system peak impacts of that end use and
provided the correct summer coincident savings. MMP used measure lifetime assumptions and
incremental costs based on: the program’s database, the Ameren Missouri TRM, or the original
Batch Tool.
A key step in the analysis process was acquiring PY13 Ameren program spending data: actual spending
broken down into implementation, incentives, and administration costs. MMP applied these numbers at
22 California Standard Practice Manual: Economic Analysis of Demand‐Side Programs and Projects. October 2001.
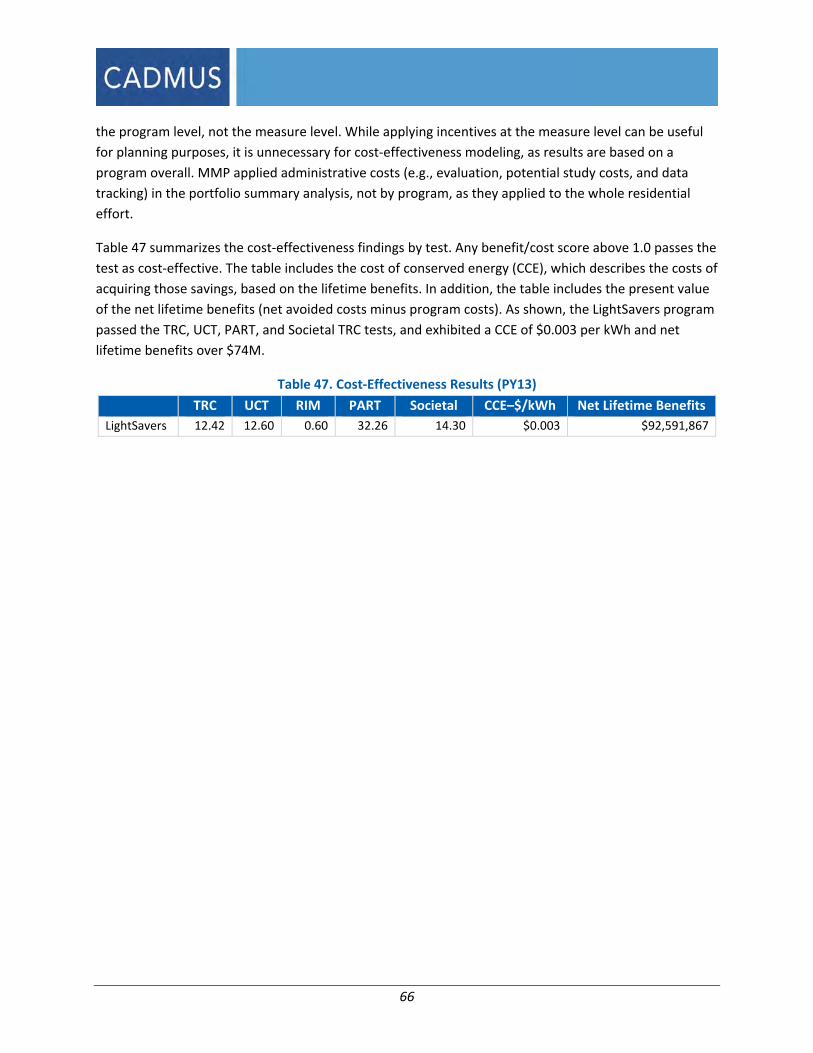
66
the program level, not the measure level. While applying incentives at the measure level can be useful
for planning purposes, it is unnecessary for cost‐effectiveness modeling, as results are based on a
program overall. MMP applied administrative costs (e.g., evaluation, potential study costs, and data
tracking) in the portfolio summary analysis, not by program, as they applied to the whole residential
effort.
Table 47 summarizes the cost‐effectiveness findings by test. Any benefit/cost score above 1.0 passes the
test as cost‐effective. The table includes the cost of conserved energy (CCE), which describes the costs of
acquiring those savings, based on the lifetime benefits. In addition, the table includes the present value
of the net lifetime benefits (net avoided costs minus program costs). As shown, the LightSavers program
passed the TRC, UCT, PART, and Societal TRC tests, and exhibited a CCE of $0.003 per kWh and net
lifetime benefits over $74M.
Table 47. Cost‐Effectiveness Results (PY13)
TRC UCT RIM PART Societal CCE–$/kWh Net Lifetime Benefits
LightSavers 12.42 12.60 0.60 32.26 14.30 $0.003 $92,591,867
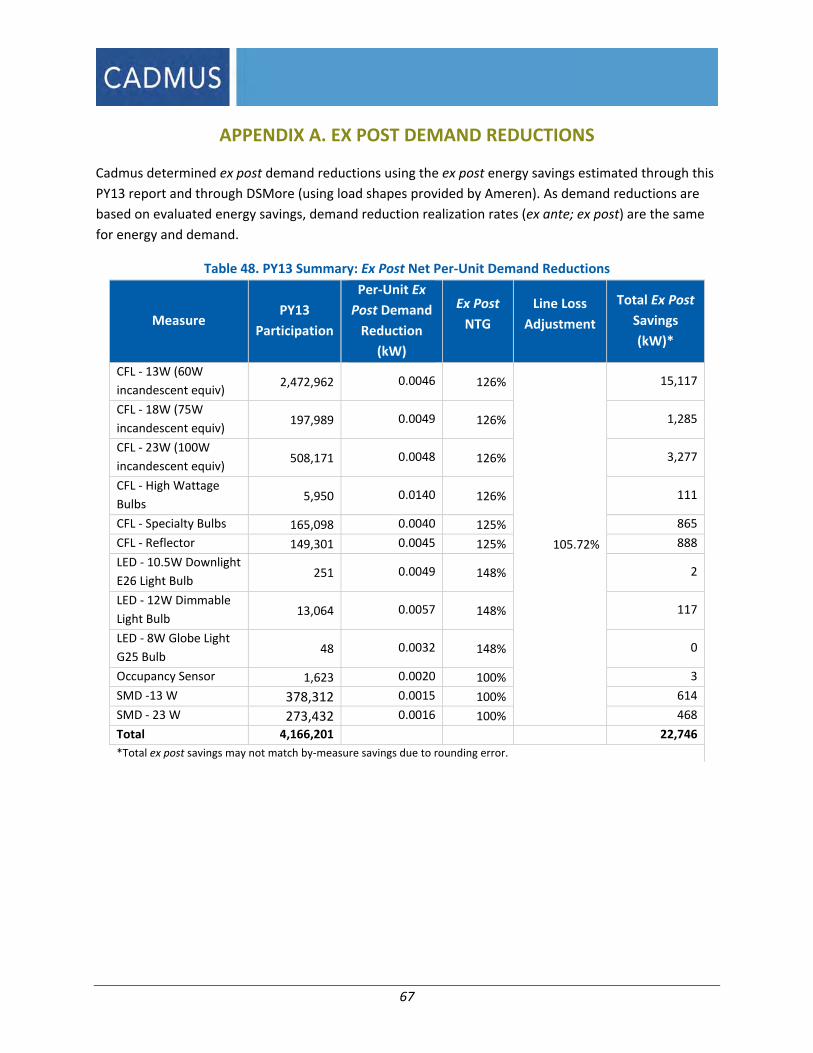
67
APPENDIX A. EX POST DEMAND REDUCTIONS
Cadmus determined ex post demand reductions using the ex post energy savings estimated through this
PY13 report and through DSMore (using load shapes provided by Ameren). As demand reductions are
based on evaluated energy savings, demand reduction realization rates (ex ante; ex post) are the same
for energy and demand.
Table 48. PY13 Summary: Ex Post Net Per‐Unit Demand Reductions
Measure PY13
Participation
Per‐Unit Ex
Post Demand
Reduction
(kW)
Ex Post
NTG
Line Loss
Adjustment
Total Ex Post
Savings
(kW)*
CFL ‐ 13W (60W
incandescent equiv) 2,472,962 0.0046 126%
105.72%
15,117
CFL ‐ 18W (75W
incandescent equiv) 197,989 0.0049 126% 1,285
CFL ‐ 23W (100W
incandescent equiv) 508,171 0.0048 126% 3,277
CFL ‐ High Wattage
Bulbs 5,950 0.0140 126% 111
CFL ‐ Specialty Bulbs 165,098 0.0040 125% 865
CFL ‐ Reflector 149,301 0.0045 125% 888
LED ‐ 10.5W Downlight
E26 Light Bulb 251 0.0049 148% 2
LED ‐ 12W Dimmable
Light Bulb 13,064 0.0057 148% 117
LED ‐ 8W Globe Light
G25 Bulb 48 0.0032 148% 0
Occupancy Sensor 1,623 0.0020 100% 3
SMD ‐13 W 378,312 0.0015 100% 614
SMD ‐ 23 W 273,432 0.0016 100% 468
Total 4,166,201 22,746
*Total ex post savings may not match by‐measure savings due to rounding error.

68
APPENDIX B. STAKEHOLDER INTERVIEW GUIDE
A. Introduction
1) What are your main responsibilities for Ameren Missouri’s LightSavers Program?
2) What percent of your time is dedicated to LightSavers?
3) What tasks do you regularly spend the majority of your time on?
B. Program Design and Implementation
4) How is communication, both formal and informal, between APT and Ameren conducted?
5) How does APT communicate with retailers and manufacturers?
6) How does APT communicate with EFI?
7) Can you provide a summary of how the program is intended to perform?
8) Outside of the change in program scale (i.e. from the bridge year), where there any other
changes to the program design between PY4 and PY5? If yes, what were they and what was the
impetus for the change?
9) How did Ameren determine which measures to rebate?
10) Do you expect any new measures to be added this year, or later in the cycle?
11) What would you say is working particularly well so far in PY5? Why is that?
12) Conversely, what is not working as well as anticipated? Why is that?
13) Have there been any lessons learned from the PY5 launch? Have there been any lessons learned
from the PY5 launch?
14) What do you think have been the most influential program or market factors to attract program
participation this year?
15) What program or market factors have you seen serve as a barrier to participation this year?
C. Program Goals
16) What are the program’s participation and savings goals for PY5?
17) How are these determined?
18) Does the program have any process or non‐impact goals for PY5? (Probe: overall sales, sales of
specialty bulbs, increased awareness, inclusion of rural areas/smaller retailers)?
19) How are these determined?
20) In your opinion, how has the program performed so far in PY5 relative to the program goals (in
terms of both process and savings/participation goals)?
21) Why do you think this is?
22) Are there benchmarks in place to monitor progress throughout the year?
23) Have you identified the triggers for contingency plans in case goals are not being met?

69
D. Measures
24) In your opinion, should any additional measures be considered for inclusion in future programs?
If so, what measures?
25) Conversely, should any current measures be excluded?
26) How were incentive amounts determined?
E. Marketing Efforts
27) What kind of marketing have you or partner retailers or manufacturers done so far in PY5, both
inside and outside the stores? How does this differ from previous program years? (Using quality
response codes, social media, in‐store media, online ads?)
28) Have you received any new input on marketing from manufacturer partners?
29) Do you anticipate any different types of marketing later in the year from what you are doing
now?
30) Have any marketing techniques you have tried this year significantly underperformed, relative
to your expectations?
31) Have you noticed that any marketing methods work well for one type of lighting product, but
not others (i.e., dimmables, but not standard bulbs).
32) Have you done any research around the messaging for marketing these products?
33) Have you differentiated your marketing for different product types?
34) How many field representatives are employed this year, relative to last year? How are their
territories defined? What are their specific responsibilities?
F. Retailers and Manufacturers
35) How are relationships with retailers and manufacturers going? Have all anticipated partners
been able to sign an MOU and join the program (Family Dollar, Walgreens)?
36) What subjects are covered in a typical MOU?
37) Have any retailers been unwilling to work with the program? Why do you think that is?
38) Have you done any additional analysis on a leakage strategy?
39) Do you have retailers using the coupon system this year? What is your vision for the future of
the coupon system?
G. Quality Control
40) In your own words, please explain how the program’s quality control process works.
41) Does Ameren perform any ride‐alongs or independent quality control checks? Please explain.
H. Program Delivery
42) Are the new data tracking systems satisfactory? Are they performing as you expected? (i.e.,
sharing data with Ameren)
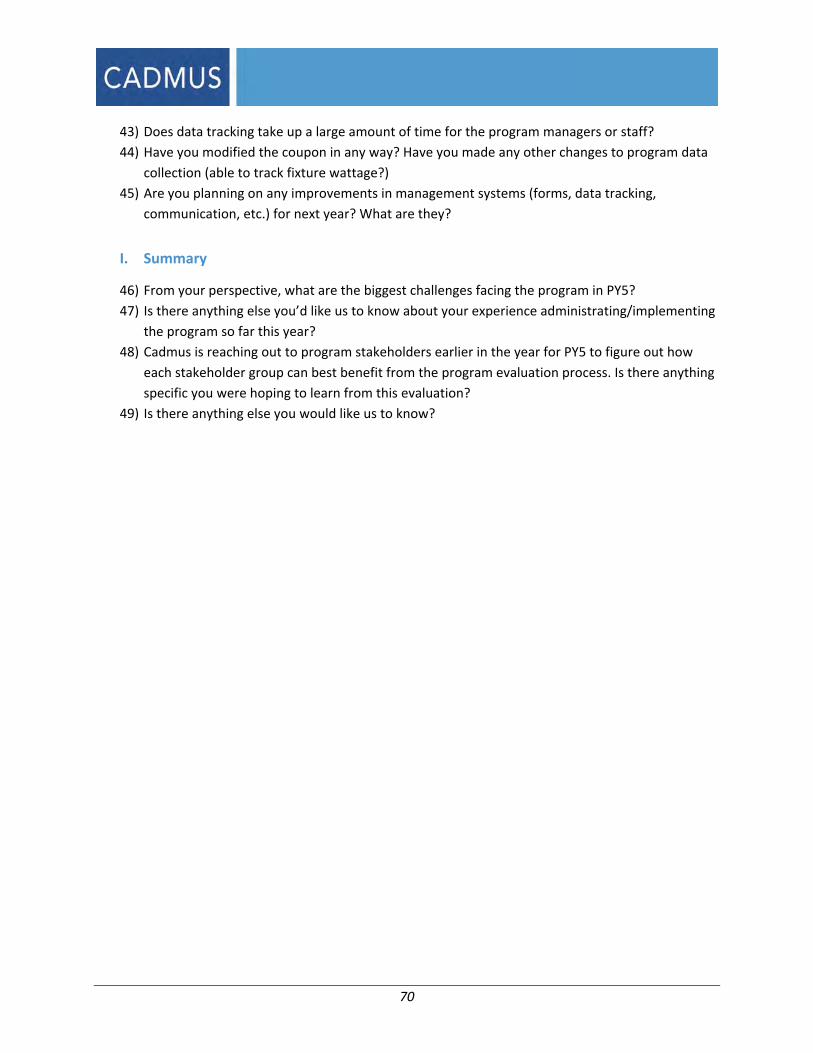
70
43) Does data tracking take up a large amount of time for the program managers or staff?
44) Have you modified the coupon in any way? Have you made any other changes to program data
collection (able to track fixture wattage?)
45) Are you planning on any improvements in management systems (forms, data tracking,
communication, etc.) for next year? What are they?
I. Summary
46) From your perspective, what are the biggest challenges facing the program in PY5?
47) Is there anything else you’d like us to know about your experience administrating/implementing
the program so far this year?
48) Cadmus is reaching out to program stakeholders earlier in the year for PY5 to figure out how
each stakeholder group can best benefit from the program evaluation process. Is there anything
specific you were hoping to learn from this evaluation?
49) Is there anything else you would like us to know?

71
APPENDIX C. PARTICIPANT SURVEY INSTRUMENTS
SMD Phone Survey: Introduction
Hello, I am [name] calling on behalf of Ameren Missouri. I am calling about the energy saving light bulb
give‐away recently sponsored by Ameren Missouri at [name] food pantry. I have a few questions about
your experience with the light bulbs. Your feedback will help Ameren Missouri assist customers like you
save money on their energy bill. My questions will only take about 5 minutes. All of your responses will
be kept entirely confidential.
A. Screening
A1. Do you recall receiving energy saving light bulbs through the [name] Food Pantry? These bulbs have a distinctive twisty shape. 1. Yes 2. No [ASK “IS THERE SOMEONE ELSE IN YOUR HOME I COULD SPEAK TO NOW WHO
MAY KNOW ABOUT THE CFLS?” IF NO ONE ELSE IS AVAILIBLE, THANK AND TERMINATE]
88. Refused [THANK AND TERMINATE] 99. Don’t know [THANK AND TERMINATE]
A2. Our records show you received ___ light bulbs. Is this correct?
1. Yes, I received that number of light bulbs 2. No, I received a different number [SPECIFY: _________] 3. No, I did not receive any light bulbs [VERIFY, THEN THANK AND TERMINATE] 88. Refused [THANK AND TERMINATE] 99. Don’t know
B. Installation and Satisfaction
B1. How many of the new bulbs have you used so far?
1. SPECIFY NUMBER: _________ 88. Refused 99. Don’t know
B2. [ASK IF A2‐B1>0] What did you do with the new bulbs that are not being used?
1. Stored for later use:_______________[number of bulbs] 2. Gave away to someone else:_______________[number of bulbs] 3. Threw away:_______________[number of bulbs] 4. Other [SPECIFY: _________]:_______________[number of bulbs] ( 88. Refused 99. Don’t know:_______________[number of bulbs]
B3. [IF B1=0] Why did you not install the new bulbs?
1. No empty sockets/burned out bulbs [SKIP TO B8]

72
2. I don’t like the light from this type of bulb 3. I don’t like the shape/appearance of this type of bulb 4. I needed a different type of bulb (dimmable, different wattage, etc.) 5. Other [SPECIFY: __________________]
88. Refused 99. Don’t know
B4. [IF B1>0] Did you remove any of the energy‐saving bulbs after you installed them?
1. Yes 2. No[SKIP TO B7] 88. Refused [SKIP TO B7] 99. Don’t know [SKIP TO B7]
B5. How many did you remove?
[RECORD NUMBER]____________________ 88. Refused 99. Don’t know
B6. Why did you remove the light bulbs?
1. Bulb burned or out stopped working 2. I don’t like the light from this type of bulb 3. I don’t like the shape/appearance of this type of bulb 4. I needed a different type of bulb (dimmable, different wattage, etc.) 5. Other [SPECIFY: _________] 88. Refused 99. Don’t know
B7. When you removed the energy saving bulbs(s), did you replace it/them with another energy
saving bulb, with a regular light bulb, or something else?
1. Energy saving bulb (CFL or LED) 2. Regular light bulbs 3. Something else [SPECIFY: _________] 4. Did not replace 88. Refused 99. Don’t know
B8. Did you receive a pamphlet on energy efficiency or any other information on energy efficiency
with the light bulbs?
1. Yes 2. No [SKIP TO B10]
88. Refused [SKIP TO B10] 99. DON’T KNOW [SKIP TO B10]
B9. How helpful was this information? Would you say,
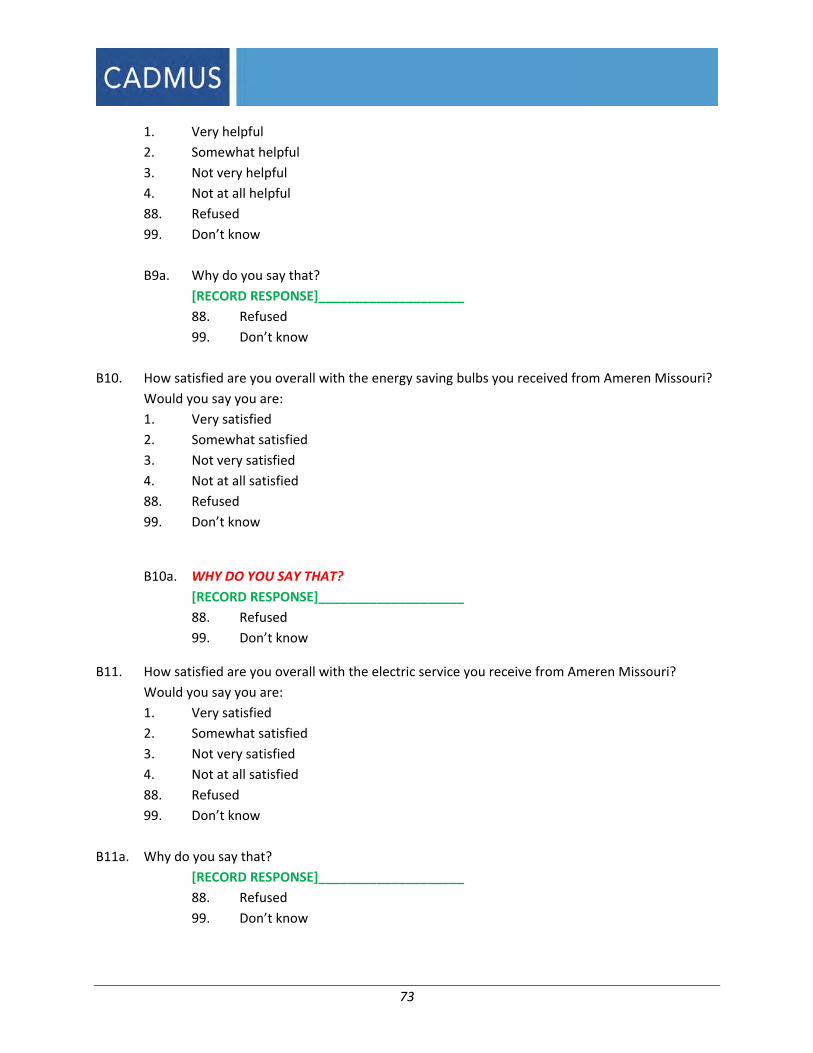
73
1. Very helpful
2. Somewhat helpful
3. Not very helpful
4. Not at all helpful
88. Refused
99. Don’t know
B9a. Why do you say that?
[RECORD RESPONSE]____________________
88. Refused
99. Don’t know
B10. How satisfied are you overall with the energy saving bulbs you received from Ameren Missouri?
Would you say you are:
1. Very satisfied
2. Somewhat satisfied
3. Not very satisfied
4. Not at all satisfied
88. Refused
99. Don’t know
B10a. WHY DO YOU SAY THAT?
[RECORD RESPONSE]____________________
88. Refused
99. Don’t know
B11. How satisfied are you overall with the electric service you receive from Ameren Missouri?
Would you say you are:
1. Very satisfied
2. Somewhat satisfied
3. Not very satisfied
4. Not at all satisfied
88. Refused
99. Don’t know
B11a. Why do you say that?
[RECORD RESPONSE]____________________
88. Refused
99. Don’t know

74
C. Home Heating
C1. Is your home primarily heated with an electric heat pump or electric baseboard heating system?
[SELECT ONLY ONE OPTION.]
1. Electric heat pump
2. Electric baseboard
3. Other
88. Refused
99. Don’t know
C2. [IF C1=1] Was your heat pump installed after 2006?
1. Yes
2. No
88. Refused
99. Don’t know
C3. Do you have a central air conditioning system?
1. Yes
2. No
88. Refused
99. Don’t know
D. Purchasing Habits
D1. Before receiving these bulbs, had you ever used an energy saving bulb in your home?
1. Yes
2. No
88. Refused
99. Don’t know
D2. Since receiving these energy saving bulbs, have you purchased any additional ones?
1. Yes
2. No [SKIP TO D5]
88. Refused [SKIP TO D5]
99. Don’t know [SKIP TO D5]
D3. How many?
[RECORD NUMBER]____________________
88. Refused
99. Don’t know

75
D4. Do you remember where you bought your energy‐saving bulbs? [Select up to three options.]
1. Big Box store (i.e., Home Depot or CostCo) 2. Small hardware store 3. Discount Retailer 4. Grocery Store 5. Online 6. Other [SPECIFY: _________]
88. Refused
99. Don’t know
D5. How many energy saving bulbs are currently installed in your home, including the ones received
from our giveaway?
[RECORD NUMBER]____________________
88. Refused
99. Don’t know
D6. What type of store do you normally buy light bulbs from?
1. Big Box Hardware store (i.e., Home Depot or CostCo) 2. Small hardware store 3. Discount Retailer 4. Grocery store 5. Online 6. Other [SPECIFY: _________]
88. Refused
99. Don’t know
D7. Do you plan to purchase energy saving bulbs in the future?
1. Yes
2. No
88. Refused
99. Don’t know
D8. [IF D7=2] Why not? [Select up to 3]
1. Too expensive
2. Don't know where to buy them
3. Bulb is too bright
4. Bulb is too dim
5. Delay in turning on
6. Doesn't fit properly/sticks out of fixture
7. Doesn't work with dimmer or 3‐way switch
8. No savings/savings not obvious
9. Safety concern

76
10. Flicker
11. Light color
12. Other [SPECIFY: _________]
88. Refused
99. Don’t know
E. Demographics
Now I’d like to ask you a few questions about your home and lifestyle. These questions help us group
your answers with those of similar households. We use this information when we are determining how
to set up our programs, and what benefits to offer our customers.
E1. In what type of building do you live? [List options]
1. A one‐family home detached from any other house
2. A one‐family home attached to one or more houses
3. A building with 2 apartments
4. A building with 3 or 4 apartments
5. A building with 5 or more apartments
6. A mobile home
7. Other [SPECIFY: _________]
88. Refused
99. Don’t know
E2. What year were you born?
[RECORD NUMBER]____________________
88. Refused
99. Don’t know
E3. Do you own or rent your home?
1. Own
2. Rent
3. Other [SPECIFY: _________]
88. Refused
99. Don’t know
CLOSING SCRIPT: Those are all the questions I have. Ameren Missouri appreciates your input. Thank you
for your time.
F1. [INTERVIEWER RECORD: DO NOT READ.]
Gender?
4. Male
5. Female

77
Store Intercepts Survey:

78
APPENDIX D. RETAILER INTERVIEW GUIDE
Corporate Retailer/Manufacturer: Date of Interview
Interviewer
Interviewee
Interviewee Job Title
Section 1. Respondent Information
Intro. Hi. My name is [INSERT NAME], and I’m calling from Cadmus on behalf of Ameren Missouri regarding your company’s participation in Ameren’s efficient lighting discount program, known as LightSavers. I received your contact information from Ameren Missouri.
I understand you are the contact for the LightSavers program and are therefore the best person to talk with about your store’s energy efficient lighting products, is that correct?
1. Yes 2. No
My firm, Cadmus, has been hired by Ameren Missouri to evaluate the effectiveness of LightSavers.
Would you have a few minutes now to talk to me about the program?
[IF ASKED ABOUT TIME, SAY, this interview will take about 10 minutes. Is now a good time?
Section 2. Program Participation
First I’d like to ask some questions your company’s involvement in the program.
PP1. Were you involved in the decision to participate in the program?
PP2. [IF YES] What was your company’s primary reason for getting involved with the Ameren Missouri Lighting program? [RECORD RESPONSE:_________________]
PP3. What % of your company’s stores in Ameren Missouri service area participated in this year’s program? [Service area = eastern part of Missouri including St. Louis. Also includes area around Jefferson City]
PP4. How did you determine which stores participated? [Will likely say all that were allowed by APT – “high leakage” stores not allowed.]
Section 3. Lighting Stocking
For the next few questions, we’re going to review your lighting stocking patterns. Please consider only the time period from January 2013 to the present, and focus on your actions in stores in the Ameren Missouri service territory.

79
How often do you make changes to or evaluate stocking practices? ST1.1. Daily or weekly 2. Monthly 3. Quarterly 4. Annually 5. Other: ____________________
What geographic area do you consider when you make stocking decisions about lighting ST2.products? (Local, zip code, state, does it vary by product? Are there exceptions?)
Will you consider stocking practices at an individual store level? ST3.
Do the types of bulbs that are stocked in your stores in Ameren Missouri service territory vary ST4.from what is stocked in other areas? [If yes, probe: In what way, how many models are different (how does the proportion of energy efficient models change)? If no, probe: how big is the region for which stocking determinations are made?]
Do the number of models of each bulb type that are stocked in your stores in Ameren ST5.Missouri territory differ from what is stocked in other stores? (Packaging counts as different product; i.e., 2‐pack, 4‐pack)
I’m going to read a list of types of lighting products. Please tell me if your store stocks this ST6.product, and if you stock any models that are NOT discounted by Ameren.
Products Stock? (Y/N) % models discounted?
Specialty CFLs, such as covered bulbs, dimmable, 3‐way, spotlights or reflector CFLs?
LED bulbs
Standard ENERGY STAR compact fluorescent bulbs that are 42 watts or less?
ENERGY STAR CFL light fixtures which require pin‐based light bulbs?
N/A
Incandescent bulbs N/A
Efficient halogens, which are the newer lower wattage bulbs that look like incandescent and comply with the new lighting standards
N/A
Light Fixtures (non‐ENERGY STAR) N/A
Other [SPECIFY] ________________ N/A
Since January 2013, have you changed the number of models of energy efficient lighting ST7.products that you stock?
[IF ST5 = YES] Are you carrying: ST8.1. Significantly more 2. Somewhat more
80
3. Same 4. Somewhat less 5. Significantly less
[IF ST5 = YES] Has this change been only in Ameren Missouri stores, or in all stores? Has the ST9.change affected only models discounted by Ameren, or additional models?
To what degree do you feel this change is due to your participation in the program? ST10.1. All 2. More than 50% but not entirely due 3. Less than 50% but somewhat due 4. Not at all [If store has participated in the past] Now I’d like to ask the same questions, but thinking back to when you first joined the program.
Since your company first joined the Ameren Lighting Program, have you changed the number ST11.of models of energy efficient lighting products that you stock?
[IF ST5 = YES] Are you carrying: ST12.1. Significantly more 2. Somewhat more 3. Same 4. Somewhat less 5. Significantly less
[IF ST5 = YES] Has this change been only in Ameren Missouri stores, or in all stores? Has the ST13.change affected only models discounted by Ameren, or additional models?
To what degree do you feel this change is due to your participation in the program? ST14.1. All 2. More than 50% but not entirely due 3. Less than 50% but somewhat due 4. Not at all
Have there been any changes in stocking patterns as a result of the federal legislation that is ST15.gradually eliminating the distribution of incandescent bulbs, sometimes referred to as EISA legislation? How have stocking practices changed as a result of this legislation?
Section 3. Sales Trends
SA1. In your opinion, would sales of the discounted standard CFL bulbs be different were the Ameren
Missouri discounts not available?
SA2. [IF YES] How would sales be different? Would they be…
1. Significantly more

81
2. Somewhat more 3. Same 4. Somewhat less 5. Significantly less
SA3. In your opinion, would sales of the discounted specialty CFL bulbs be different were the Ameren
Missouri discounts not available?
SA4. [IF YES] How would sales be different? Would they be…
1. Significantly more 2. Somewhat more 3. Same 4. Somewhat less 5. Significantly less
SA5. In your opinion, would sales of non‐discounted CFL bulbs be different were the Ameren discount
not available?
SA6. [IF YES] How would sales be different? Would they be…
1. Significantly more 2. Somewhat more 3. Same 4. Somewhat less 5. Significantly less
SA7. Using the same scale, how would you characterize the sales of discounted LED bulbs were the
discounts not available?
1. Significantly more 2. Somewhat more 3. Same 4. Somewhat less 5. Significantly less
SA8. And how would you characterize the sales of non‐discounted LED bulbs?
1. Significantly more 2. Somewhat more 3. Same 4. Somewhat less 5. Significantly less

82
SA9. Does the program benefit you as a retailer in any way other than affecting sales on lighting?
Section 5: Point‐Of‐Purchase (POP) Promotions
PO1. In addition to the incentive you received from Ameren, did you offer any of your own additional discounts on these same CFLs or LEDs in the Ameren MO program area?
1. Yes, Please describe. [PROBE FOR $ AMOUNT, BULB TYPE:_________________]
2. No
PO2. Since January 2013, did you or the other manufacturers offer any discounts on non‐program incented specialty CFLs or LEDs in the Ameren MO program area?
1. Yes, Please describe. [PROBE FOR $ AMOUNT, BULB TYPE:_________________]
2. No
Section 8. Program Satisfaction
Finally I would like to find out your level of satisfaction with the Ameren Missouri Lighting program.
PS1. How satisfied have you been with the level of incentives provided by the program? Would you
say you have been very satisfied, somewhat satisfied, not very satisfied, or not at all satisfied?
1. Very satisfied 2. Somewhat satisfied 3. Not too satisfied 4. Not at all satisfied
PS2. Using the same satisfaction scale, how satisfied have you been with the coordination with you
on product placement and promotions? If you are not familiar with how this coordination takes
place, you can just say you are not familiar.
1. Very satisfied 2. Somewhat satisfied 3. Not too satisfied 4. Not at all satisfied N. Not familiar with this activity
PS3. [ASK IF PS2=3,4] Why do you say that? [RECORD RESPONSE:___________]
PS4. Using the same satisfaction scale, how satisfied have you been with Ameren’s program
managers and other staff involved in this program during the past year?
1. Very satisfied 2. Somewhat satisfied

83
3. Not too satisfied 4. Not at all satisfied N. Not familiar
PS5. Who do you interact with most frequently? [Name]
PS6. [ASK IF PS4=3,4] Why do you say that? [RECORD RESPONSE:___________]
PS7. Using the same scale, how would you rate your level of satisfaction with the program overall?
1. Very satisfied 2. Somewhat satisfied 3. Not too satisfied 4. Not at all satisfied
PS8. [ASK IF PS7=4,5] Why do you say that? [RECORD RESPONSE:___________]
PS9. In what way could the program be improved? [RECORD RESPONSE:___________]
PS10. Are you planning to participate in the program going forward?
1. Yes 2. No
PS11. [IF NO] Why do you say that? [RECORD RESPONSE:___________]
PS12. Do you have any other comments or questions about Ameren Missouri’s LightSavers Program?
[RECORD RESPONSE:___________]
Section 9. Firmagraphics
Now I have a few questions about your company’s past history with energy efficient products. Please
consider only your company’s activity in the Ameren Missouri program area.
F1. [ASK if ST1 = 1 or ST2 = 1] How many years have your stores been selling specialty CFLs?
1. 1 or less
2. 2
3. 3
4. 4
5. 5
6. More than five
84
F2. [ASK if ST1 = 2 or ST2 = 2] How many years have your stores been selling LED bulbs?
1. 1 or less
2. 2
3. 3
4. 4
5. 5
6. More than five
D. Don’t Know
R. Refused
F3. [ASK if ST1 = 3 or ST2 = 3] How many years have your stores been selling standard CFLs?
1. 1 or less
2. 2
3. 3
4. 4
5. 5
6. More than five
D. Don’t Know
R. Refused

85
Store Manager/Independent Retailer: ID Number: Store: Contact: Number: Notes: Hi. My name is [INSERT NAME] from Cadmus. I'm calling on behalf of Ameren Missouri to follow up on your company’s participation in Ameren’s efficient lighting discount program LightSavers. (I received your contact information from the company implementing the program, APT.)
A. Introduction
1. Are you the best person to talk with about your store’s energy efficient lighting products and participation in LightSavers?
1. Yes 2. No
[IF YES] My firm, Cadmus, has been hired by Ameren Missouri to evaluate the effectiveness of LightSavers. Would you have a few minutes now to talk to me about the program? [IF ASKED ABOUT TIME, SAY, this interview will take about 15 minutes.]
B. PROGRAM PARTICIPATION
To begin, I’d like to talk a little bit about your participation in the program and your experiences with Ameren’s representative who may have visited your store. 1. Did your store participate in the Ameren Missouri lighting program last year? 2. Were you involved in the decision to participate in the program this year? 3. What was your company’s primary reason for getting involved with the Ameren Missouri Lighting
program this year? [RECORD RESPONSE:_________________] 4. Did all of your company’s stores in Ameren Missouri service area participate in this year’s program?
[If no] How did you determine which stores participated?
C. STOCKING PATTERNS
1. Have there been any changes to how lighting products are stocked in your store since the beginning of the year?
Probe: Why have there been changes? 2. [IF YES] To what degree do you feel this change is due to your participation in the program?
Most or all due Majority due Somewhat due Not at all due
3. Have you seen changes in stocking patterns resulting from the federal legislation phasing out incandescent bulbs? [Prompt with EISA if needed].
4. [If yes] How have stocking practices changed as a result of this legislation?

86
5. Do you stock [Product Type]? For [Product Type], what percentage in stock are discounted by Ameren?
Products: Specialty CFLs, such as covered bulbs, dimmable, 3‐way, spotlights or reflector CFLs?
Stock?
% models discounted? LED bulbs
Stock?
% models discounted? Standard ENERGY STAR compact fluorescent bulbs that are 42 watts or less?
Stock?
% models discounted? ENERGY STAR CFL light fixtures which require pin‐based light bulbs?
Stock? Incandescent bulbs
Stock? Efficient halogens, (which are the newer lower wattage bulbs that look like incandescent and comply with the new lighting standards)
Stock? Other [SPECIFY] ________________
Stock? 6. Hypothetically, if Ameren were to end its LightSavers program tomorrow, what stocking changes, if
any, do you think would be made at this store? 1. Increase energy efficiency products 2. Decrease energy efficiency products 3. No changes to stocking patterns for energy efficiency products
7. Would you discontinue selling any of the discounted models?
1. Yes [Which?] 2. No
8. [If no] Would you stock fewer models of that bulb type?
1. Yes [Which?] 2. No
D. SALES PATTERNS
1. Since January 2013, has your store offered any discounts on ENERGY‐STAR lighting products other than the Ameren discounts? [If so, probe for product and amount.]
1. Yes 2. No
2. Since January 2013, have you seen a change in the sales of products discounted by Ameren Missouri?
1. Yes

87
2. No 3. How did they change? Why do you think sales levels changed? 4. Since the beginning of the year, have you seen a change in the sales any products that are NOT
discounted by Ameren? 1. Yes 2. No
5. How did they change? Why do you think they changed? 6. Hypothetically, if Ameren were to end its LightSavers program tomorrow, by what percentage would
sales of [standard CFLs/specialty CFLs/LEDs] change? Standard CFLs: Specialty CFLs: LEDs:
E. OUTREACH AND TRAINING
I’d like to understand a little more about how your store interacts with the program.
1. How often does an Ameren/APT representative visit your store? 1. Once a week 2. Once a month 3. Once every few months 4. Once a year 5. Never
2. Tell me about what happens when an APT representative visits the store.
3. Have you had a meeting with the Ameren/APT representative to discuss the details of the program and the eligible products? 1. Yes 2. No
4. How useful would you say that meeting was? Would you say… 1. Very useful, 2. Somewhat useful 3. Not too useful, or 4. Not at all useful?
5. Why do you say that?
6. How many staff at your store have discussed the program with Ameren field representatives?
7. How useful were staff meetings with Ameren representatives are. Would you say…
1. Very useful, 2. Somewhat useful 3. Not too useful, or 4. Not at all useful?
88
F. MARKETING
1. How do you decide where to place lighting products, and how much shelf space to assign to the products and signs?
Probe: What criteria do you use? Who has input into the decision? How do you decide which products to display on end‐caps?
2. Do you allow pallet displays or other in‐aisle displays in your store? If not, why not? 1. Yes 2. No
3. How do you decide which products are displayed in this manner? 4. How involved is the APT representative (the person that is your contact for the LightSavers program)
involved in making decisions about where to place signs and products? 5. What are the most effective ways to inform customers about discounts on lighting products? [If in‐
store advertisement, ask if it would be allowed in their store.] 6. Do you feel the Ameren signage is effective? Why or why not?
1. Yes 2. No
7. [IF INVOLVED IN 2012]Was Ameren’s marketing different this year compared to the previous year? If yes, what was different? Do you think it was effective?
8. Did an Ameren/APT representative conduct an in‐store promotion of lighting technology in your
store this year? 1. Yes 2. No
9. If not, why not? 10. Were these promotions effective at increasing sales of Ameren‐discounted products? Why or why
not? 1. Yes 2. No
11. Were these promotions effective at increasing sales of Ameren‐discounted products? Why or why not?
1. Yes 2. No
12. Were these promotions effective at educating customers about available efficient lighting technologies? Why or why not?
1. Yes 2. No
13. Would you recommend any changes to Ameren’s marketing methods and approach? Is so, what do you suggest?
1. Yes 2. No
H. PROGRAM SATISFACTION
1. How satisfied have you been with the level of incentives provided by the program? Would you say you have been very satisfied, somewhat satisfied, not very satisfied, or not at all satisfied?
1. Very satisfied

89
2. Somewhat satisfied 3. Not too satisfied 4. Not at all satisfied
2. Using the same satisfaction scale, how satisfied have you been with the coordination with you on
product placement and promotions? If you are not familiar with how this coordination takes place, you can just say you are not familiar.
1. Very satisfied 2. Somewhat satisfied 3. Not too satisfied 4. Not at all satisfied N. Not familiar
3. [ASK IF H2=3,4] Why do you say that? [RECORD RESPONSE:___________]
4. Using the same satisfaction scale, how satisfied have you been with Ameren’s program managers
and other staff involved in this program during the past year? 1. Very satisfied 2. Somewhat satisfied 3. Not too satisfied 4. Not at all satisfied N. Not familiar
5. How satisfied are you with your overall program experience? Would you say you are…
1. Very satisfied 2. Somewhat satisfied 3. Not too satisfied 4. Not at all satisfied
G. CUSTOMER AWARENESS AND RESPONSE
6. How would you rate the interest level of a typical customer when your sales staff tells them about
the energy‐saving potential of the efficient lighting products? Would you say they are: 1. Not at all interested 2. Not very interested 3. Somewhat interested 4. Very interested
7. What tends to be the best selling point for the higher efficiency lighting products? [DO NOT READ]
1. Cost saving on bill 2. Energy savings 3. Incentive Amount 4. Environmental benefits 5. Other [SPECIFY:____________]
90
8. Are customers influenced by the Ameren discounts? How so?
I. WRAP‐UP
1. Do you think your store will participate in the program going forward? 1. Yes 2. No
Do you have any other comments or questions about Ameren Missouri’s LightSavers Program? [RECORD RESPONSE:___________]

91
APPENDIX E. STORE INTERCEPTS ANALYSIS
In September and October 2013, the Cadmus team and its subcontractor, ICC Decision Services,
completed intercept surveys with 495 customers at 20 big box retail stores selling Ameren LightSavers
program bulbs. The intercepts provided information regarding the following:
The portion of Ameren‐incentivized upstream lighting products purchased by non‐Ameren
customers (known as leakage).
The portion of bulbs incentivized through Ameren’s residential program that customers
purchased and installed in commercial applications.
Based on this research, the Cadmus team estimated leakage at 3.3% for upstream markdown sales to
residential customers. The analysis also assessed the percentages of discounted bulb sales installed in
nonresidential versus residential locations (11% and 89%, respectively). The study found zero leakage
for those purchasing bulbs for nonresidential locations.
This section summarizes the analysis and findings from this research, discussing the leakage rates,
residential/nonresidential purchase shares, and types of bulbs purchased, and other questions around
program awareness and purchasing motivation.
Methodology
The Cadmus team segmented the population of LightSavers retail stores into four groups, according to
whether they were perceived by Ameren to be “vulnerable” to leakage or not and whether they were
located in an urban or rural area. APT only allows smaller, local chain, or franchised retailers to
participate if the store location is in a ZIP code where 60% of the meters or more belong to Ameren. APT
did not feel it had retained any local stores in the program that might be a leakage concern.
APT allows large, national chain retailers (such as Home Depot or Wal‐Mart) to participate if the store
location is located in a ZIP code in which 70% or more of the meters belong to Ameren. APT regarded as
vulnerable those large retailer locations eligible to participate, but located near the border of Ameren’s
service territory. The Cadmus team weighted all results by program bulb sales for stores in each of these
four segments. Table 49 shows the sample group and total population of stores and bulb sales within
each segment.

92
Table 49. Intercepts Survey Population, Sample, and Bulb Counts*
Segment No. of Stores in
Population
No. of Stores in
Sample
Bulb Sales in
Population
Bulb Sales in
Sample
Not Vulnerable, Urban 45 4 1,473,496 154,816
Not Vulnerable, Rural 14 3 305,732 107,438
Vulnerable, Urban 1 1 36,002 36,002
Vulnerable, Rural 18 13 332,105 242,648
Total 78 20 2,147,335 540,904
* Results weighted using PY13 Markdown sales through September 30.
Based on the previous intercept survey completed as part of the PY10 Lighting and Appliances
evaluation, the Cadmus team knows most leakage occurs, unsurprisingly, in vulnerable stores. As a
result, the study oversampled this program segment to improve the overall precision of the findings. The
subsequent weighting, described below, ensures oversampling did not bias the overall population
estimate.
The Cadmus team conducted intercept surveys in conjunction with planned promotional events by the
program implementers,23 asking intercepted customers the following survey questions:
What is your ZIP code?
What utility provides your electricity service?
What type(s) of bulbs were you planning to buy?
Are you planning to install the light bulbs you're purchasing today in your home, a business,
or both?
Before entering the store today, did you know Ameren was offering discounts on CFLs?
Did you come into the store today specifically to buy CFLs discounted by Ameren?
What prompted you to purchase Ameren’s discounted energy bulbs today?
The team also noted the types of bulbs a customer purchased and how many, if any, were discounted by
the program.
Findings
This section organizes the survey findings as follows:
Leakage
Home versus Business Installation
Awareness of Ameren Discounts
Customer Intentions Upon Entering the Store
23 This approach was required by store managers to allow intercepts to be performed in their stores.

93
Motivation for Purchasing
Types of Bulb Purchased
The Cadmus team offers conclusions and recommendations at the end of this section.
Leakage
The Cadmus team counted the number of program discounted bulbs purchased by Ameren customers
and those purchased by other utility customers at each store. The study weighted the results according
to the contribution to the retailer segment as described in Table 50, and then by the segment’s
contribution to overall program sales.
Table 50. Surveyed Store, Sales Contribution to Segment, Segment Contribution to Total Bulb Sales
City Segment
% of Segment
Sales
Segment %
of Population
Sales
Weight
(A) (B) (A X B)
DIY
Store 1 Not Vulnerable, Urban 37.30% 68.60% 25.60%
Store 2 Vulnerable, Rural 4.50% 15.50% 0.70%
Store 3 Not Vulnerable, Urban 28.90% 68.60% 19.90%
DIY
Store 4 Vulnerable, Rural 6.50% 15.50% 1.00%
Store 5 Not Vulnerable, Rural 15.60% 14.20% 2.20%
Store 6 Vulnerable, Rural 1.70% 15.50% 0.30%
Store 7 Vulnerable, Rural 5.00% 15.50% 0.80%
CLUB
Store 8 Vulnerable, Urban 100% 1.70% 1.70%
BIG Box
Store 9 Not Vulnerable, Urban 23.40% 68.60% 16.00%
Store 10 Vulnerable, Rural 5.00% 15.50% 0.80%
Store 11 Vulnerable, Rural 10.00% 15.50% 1.50%
Store 12 Vulnerable, Rural 1.60% 15.50% 0.30%
Store 13 Vulnerable, Rural 6.20% 15.50% 1.00%
Store 14 Not Vulnerable, Rural 17.50% 14.20% 2.50%
Store 15 Not Vulnerable, Rural 66.90% 14.20% 9.50%
Store 16 Vulnerable, Rural 15.40% 15.50% 2.40%
Store 17 Vulnerable, Rural 5.70% 15.50% 0.90%
Store 18 Vulnerable, Rural 7.00% 15.50% 1.10%
Store 19 Vulnerable, Rural 31.30% 15.50% 4.80%
Store 20 Not Vulnerable, Urban 10.40% 68.60% 7.10%
Table 51 illustrates the calculations of each store’s weight.
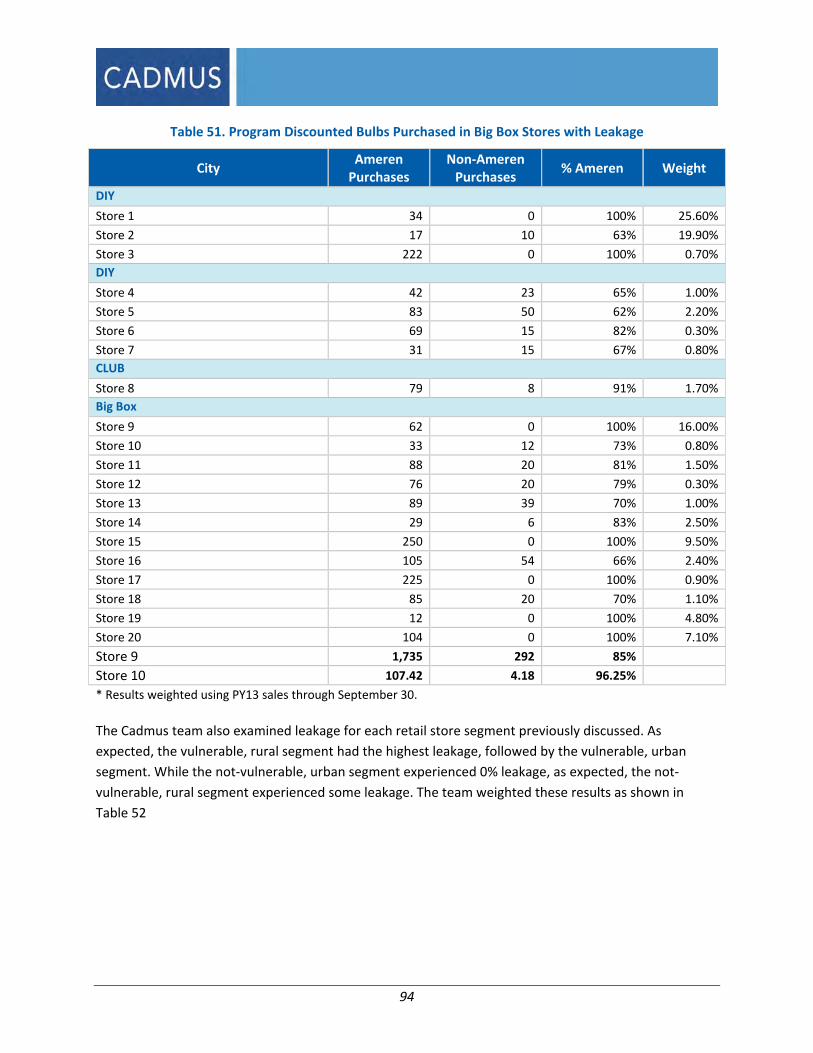
94
Table 51. Program Discounted Bulbs Purchased in Big Box Stores with Leakage
The Cadmus team also examined leakage for each retail store segment previously discussed. As
expected, the vulnerable, rural segment had the highest leakage, followed by the vulnerable, urban
segment. While the not‐vulnerable, urban segment experienced 0% leakage, as expected, the not‐
vulnerable, rural segment experienced some leakage. The team weighted these results as shown in
Table 52
City Ameren Purchases
Non‐Ameren Purchases
% Ameren Weight
DIY
Store 1 34 0 100% 25.60%
Store 2 17 10 63% 19.90%
Store 3 222 0 100% 0.70%
DIY
Store 4 42 23 65% 1.00%
Store 5 83 50 62% 2.20%
Store 6 69 15 82% 0.30%
Store 7 31 15 67% 0.80%
CLUB
Store 8 79 8 91% 1.70%
Big Box
Store 9 62 0 100% 16.00%
Store 10 33 12 73% 0.80%
Store 11 88 20 81% 1.50%
Store 12 76 20 79% 0.30%
Store 13 89 39 70% 1.00%
Store 14 29 6 83% 2.50%
Store 15 250 0 100% 9.50%
Store 16 105 54 66% 2.40%
Store 17 225 0 100% 0.90%
Store 18 85 20 70% 1.10%
Store 19 12 0 100% 4.80%
Store 20 104 0 100% 7.10%
Store 9 1,735 292 85%
Store 10 107.42 4.18 96.25%
* Results weighted using PY13 sales through September 30.

95
Table 52. Big Box Leakage by Retail Store Segment
Segment Leakage Weight
Not Vulnerable, Urban
3.75%
68.6%
Not Vulnerable, Rural 14.2%
Vulnerable, Urban 1.7%
Vulnerable, Rural 15.5%
Total 100%
The Cadmus team counted the number of program discounted bulbs Ameren and other utility
customers purchased to install in their homes versus businesses. If they purchased bulbs for a business,
the study asked if that business was located within Ameren territory or another utility area. All bulbs
purchased for a business were for businesses located in Ameren territory. Analysis weighted the results
similarly to the leakage results discussed earlier. As Table 53 shows, 89% of the bulbs purchased for
installation in Ameren territory were for residential use. All bulbs purchased by non‐Ameren customers
were for use in homes.
Table 53. Home Versus Business Split
Segment Share of Upstream Bulbs Leakage
Ameren Residential Homes 89% 3.75%
Ameren Businesses 11% 0%
Total Big Box 100% 3.75%
The Cadmus team then weighted the residential big box store leakage of 3.75%, with the 0% assumed
leakage24 for small stores based on the proportion of bulbs sold in big box versus smaller stores. This did
not include coupon sales or SMD bulbs as leakage would not be applied to such sales. The team also
assumed the same residential/business split would occur in small retail stores as in big box stores.
Table 54. Total Weighted Leakage Results
Store Type Leakage Bulb Sales Population
Big Box Stores 3.75% 2,147,335
Small Stores 0% 268,748
Weighted 3.3% 2,416,083
The Cadmus team also considered whether “leakage out” of Ameren service territory would be
countered by “leakage in” from other regional utilities that offer upstream programs. (The research
team finds Ameren Illinois as the only identified utility offering CFL discounts in stores. A recent
intercepts survey, conducted as part of the Ameren Illinois evaluation, found only one bulb purchase out
24 In PY10, Cadmus performed intercept surveys at small stores and found 0% leakage. We did not revisit these
stores in PY13, focusing evaluation resources on the areas of greatest uncertainty. We believe it appropriate to rely on the PY2 results as: 1) the bulb volume was lower in small stores; and 2) individuals were more likely to travel further distances to shop in big box stores than for smaller stores.

96
of 898 bulbs went to an Ameren Missouri customer.) The team did not net “leakage in” from “leakage
out” estimates as any non‐discounted bulbs purchased by Ameren customers (whether inside or outside
the service territory)25 would be accounted for through lighting spillover estimates. Reducing “leakage
out” by “leakage in” as part of this analysis therefore would constitute double‐counting.
Customer Awareness of Ameren Discounts
The Cadmus team asked customers the following question: “Before entering the store today, did you
know Ameren was offering discounts on CFLs?” The great majority, 89%, responded they did not know
this, not an uncommon resulted due to program’s upstream nature.
Of all 2,695 bulbs purchased during store intercepts, 64.1% (weighted) were discounted bulbs. By
contrast, Ameren Illinois’ recent leakage study found only 47% of bulb purchases to be CFLs and LEDs. As
shown in Figure 9, the majority of Ameren’s purchased bulbs were discounted CFLs (64%), followed by
incandescents (23.1%). Of 495 customers intercepted, 375 (or 76%) purchased at least one program‐
discounted bulb. Non‐discounted purchased CFLs and LEDs may indicate spillover or market effects,
estimated through information gathered from the Home Inventory Surveys.
Figure 9. Proportions of Bulb Types Purchased During Intercepts
Motivations for Purchasing Discounted Bulbs
Of all customers purchasing a discounted bulb, the Cadmus team asked the following, open‐ended
question: “What prompted you to purchase Ameren‐discounted energy‐efficient bulbs today?”
Categorized responses following in Figure 10, with the most common indicating some program influence
25 To estimate spillover, the Cadmus team conducted home inventories of a sample of customers and will use
the information to estimate a count of all CFLs purchased in the territory. Program bulb sales will be subtracted from that estimate to serves as a basis for spillover calculations.

97
(e.g., Discount, Ameren representative, Demonstration Table) at 36%. While a significant proportion
(24%) indicated: they just “needed bulbs”; a general desire for energy efficiency and a belief that the
purchased bulbs provided higher quality also ranked high, with 17% for each indicating one of these as
primary motivations for the purchases.
Figure 10. Reasons for Purchasing Discounted Bulbs (n=329)
CONCLUSIONS AND RECOMMENDATIONS
While a certain level of leakage exists at most rural locations, the overall residential leakage rate (3.3%)
appears to be manageable. By comparison, a recent leakage study for Ameren Illinois found a leakage
rate of 10% from randomly chosen stores. The 3.3% also compares favorably to the PY10 result of 8.7%.
The Cadmus team does not recommend eliminating stores with acceptable levels of leakage, as this
would reduce program access to rural customers.26
A significant portion of upstream sales go to business customers (11%). This will increase savings as
business customers have longer HOU than residential customers.27
Comments provided by those purchasing energy‐efficient bulbs indicate the program influenced them,
either through the demonstration table, the Ameren representative, or the discounts offered. The
majority of bulbs purchased during the intercepts were CFLs, and a significant share of customers
indicated that the Ameren program (e.g., signs, discount, demonstration table, or representative) serves
as the reason for their purchase.
26 While rural customers can access the online store, not all customers know of it or are comfortable
shopping online.
27 HOU for nonresidential screw‐based bulbs are estimated at 8.76 hours per day, as derived from DEER 2008 (by building type) for CFLs in the Miscellaneous category, using an average of interior space values, www.deeresources.com. Alternatively residential metering in PY2 resulted in residential HOU of 2.91 hours per day.
98
APPENDIX F. SMD SURVEY ANALYSIS
As part of the Program Year 2013 evaluation, the Cadmus team conducted a survey of Ameren
customers receiving free CFLs through the SMD program within LightSavers. Through the SMD channel,
Ameren provides not‐for‐profit organizations with energy‐efficient CFLs, which the organizations
distribute to Ameren customers within the communities they serve. Although implementers have
worked with a several different organization types in the past, they primarily work with food bank
systems. In PY13, all SMD bulbs were distributed through food banks. Ameren’s implementer, APT,
requires that participating food banks operate in areas with at least 80% of the meters belonging to
Ameren.
Food banks distribute critical household items and food through partner agencies, known as food
pantries. The Ameren bulbs and educational materials are delivered to the food banks, which pass the
items out to food pantries, where it reaches low‐income residents on a neighborhood level. The
educational materials cover: how to recycle the CFLs and general tips on saving energy. No application
process exists, and customers need not provide personal information. The distribution process removes
participation barriers for low‐income residents and helps ensure people will take an interest in the
product and get it home. where they can use it and save energy and reduce their electric bills
In PY13, between April and October, Ameren distributed 651,744 bulbs through the SMD program to
seven food banks. About 40% of the bulbs were 23W, and the remainder were 13 W. All bulbs were
given in 4‐packs, with either one or two packs per customer.
This section presents the preliminary results from and details of the participant survey, and contains a
description of methods used. In general, the study found the following:
The program seemed to be well received by the intended target population; and
The responses tended to be positive regarding program equipment satisfaction, current
installations, and future estimations of CFL installations.
Methodology The program does not require customers apply or provide any personal information. Therefore, to
collect contact information for the sample pool, the Cadmus team sent pre‐stamped, fillable postcards
to the implementer to be distributed with bulbs. The implementer included postcards in an April and
two July distributions, totaling 45,480 bulbs (enough for approximately 5,600 to 11,400 customers).
Participants were offered a chance to win a $200 Walmart gift card if they submitted their name,
address, and the name of their utility via the postcard. Participants were advised they might be
contacted to participate in a phone survey.
Initially, participants returned their postcards via direct mail; however, to minimize cost, Cadmus and
program staff arranged for the food pantries to collect and return the completed postcards to Cadmus in
bulk. In total, more than 7,500 completed cards were received.

99
Cadmus randomly selected 700 postcards from the 7,500 received and manually entered the customer
information into a database to serve as a sample.28
The evaluation phone survey contained 28 questions on the following topics:
The number of bulbs received and installed;
Purchasing habits regarding efficient bulbs;
Satisfaction with the bulbs received;
Barriers (if any) to installing the bulbs; and
Home heating and cooling equipment and household demographics.
Cadmus completed 75 surveys, though removing the responses of a participant who self‐identified as a
non‐Ameren customer. (Although there was only one such response, it indicates that some light bulbs
ended up in non‐Ameren households.) The study also removed the responses of four participants who
reported installing more light bulbs than they received. Thus, a final completed survey population of
70 resulted.
Survey Analysis The following sections detail the results of the survey data analysis.
Program Metrics
Cadmus reviewed survey results to determine critical inputs for calculating energy savings from the SMD
program. Where appropriate, these values were used in end‐of‐year savings analysis.
Bulbs Distributed
The survey asked customers to verify, using the postcard, the number of bulbs they reported receiving.
The 70 participants completing the program survey received a total of 465 CFLs; of these participants,
76% said they received from four to eight CFL bulbs, as shown in Figure 11.
28 From this pool, Cadmus selected 10 names at random to receive the gift cards, with Cadmus staff calling the
winners to verify their addresses, and then mailed the gift cards in November 2013.

100
Figure 11. Number of CFLs Received by Respondent (n=70)
Bulbs Installed
When asked how many of the received bulbs they installed: all but three customers (96%) had installed
at least one bulb; 66% had installed from one to four bulbs; and 30% had installed more than four bulbs.
Figure 12 Shows bulb install rates.
Figure 12. How many of the new bulbs have you used so far? (n=70)
Among participants who reported installing only some bulbs they received, the majority said they were
saving the uninstalled bulbs for future use or were waiting until their currently installed bulbs had
burned out. Only one participant said they gave away some of the CFLs to someone else. The study also
found a statistically significant but weak negative correlation between the number of bulbs received and
the initial ISR. Specifically, customers receiving a larger number of CFLs tended to immediately install a
lower proportion, compared to customers receiving fewer bulbs.

101
Figure 13. ISRs by the Number of Bulbs Received
Bulbs Removed
Two customers said they removed one bulb, one customer removed three bulbs, and one customer
removed bulbs but did not know how many. Three customers said the bulbs burned out, and one did
not like the light from the CFL. Those who said the bulbs burned out replaced them with CFLs, and only
the customer that did not like the light from the CFL replaced the bulb with an incandescent. Cadmus
considered one bulb removed. Accounting for removals, respondents installed 279 (60%) of the 465
bulbs they received in the first year.
Overall Installation Rate
To account for Ameren customers installing some currently uninstalled bulbs at a later date, the Cadmus
team used the same methodology that we applied to the markdown and coupon bulbs to determine the
separate installation rate for the SMD bulbs. We calculated a separate installation rate, because the
population and distribution method were significantly different, and expected t result in different end‐
user behavior. Our method determined the overall ISR as the present value of savings over the nine‐year
lifetime of the CFLs. We derived this approach from the protocol recommended in Residential Lighting
chapter of The Uniform Methods Project (UMP): Methods for Determining Energy Efficiency Savings for
Specific Measures.29 These data allowed determination of the probable rate of future installation
applicable to Ameren’s results.
Per the UMP, 11% of total CFLs are typically installed in year two, another 6.7% of remaining CFLs in
storage are installed in year three, and a final, small portion is installed in year 4. As UMP data could not
provide an exact number for the percentage of remaining bulbs installed in year 4, they recommended
averaging the cumulative installation rate by year 3 with 99%, which is the final installation rate found in 29 While the UMP has not yet been finalized, the Residential Lighting Evaluation Protocol chapter has been
through substantial review, and no major changes are expected prior to publication.
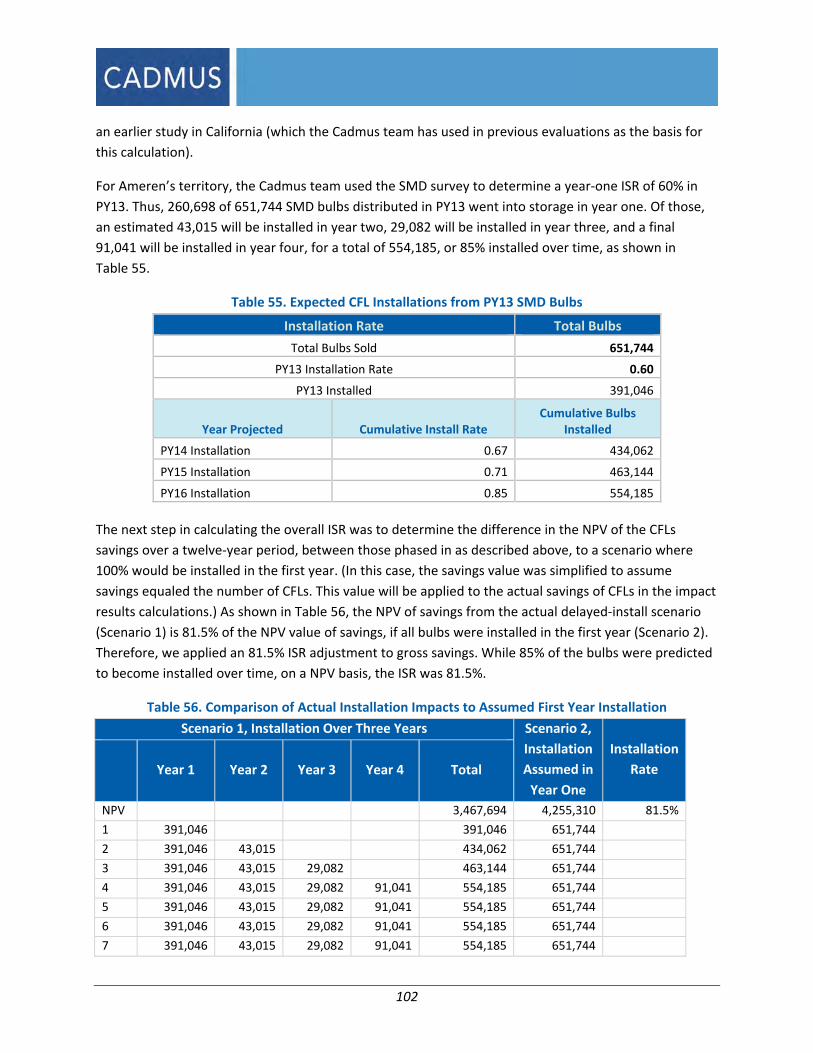
102
an earlier study in California (which the Cadmus team has used in previous evaluations as the basis for
this calculation).
For Ameren’s territory, the Cadmus team used the SMD survey to determine a year‐one ISR of 60% in
PY13. Thus, 260,698 of 651,744 SMD bulbs distributed in PY13 went into storage in year one. Of those,
an estimated 43,015 will be installed in year two, 29,082 will be installed in year three, and a final
91,041 will be installed in year four, for a total of 554,185, or 85% installed over time, as shown in
Table 55.
Table 55. Expected CFL Installations from PY13 SMD Bulbs
Installation Rate Total Bulbs
Total Bulbs Sold 651,744
PY13 Installation Rate 0.60
PY13 Installed 391,046
Year Projected Cumulative Install Rate Cumulative Bulbs
Installed
PY14 Installation 0.67 434,062
PY15 Installation 0.71 463,144
PY16 Installation 0.85 554,185
The next step in calculating the overall ISR was to determine the difference in the NPV of the CFLs
savings over a twelve‐year period, between those phased in as described above, to a scenario where
100% would be installed in the first year. (In this case, the savings value was simplified to assume
savings equaled the number of CFLs. This value will be applied to the actual savings of CFLs in the impact
results calculations.) As shown in Table 56, the NPV of savings from the actual delayed‐install scenario
(Scenario 1) is 81.5% of the NPV value of savings, if all bulbs were installed in the first year (Scenario 2).
Therefore, we applied an 81.5% ISR adjustment to gross savings. While 85% of the bulbs were predicted
to become installed over time, on a NPV basis, the ISR was 81.5%.
Table 56. Comparison of Actual Installation Impacts to Assumed First Year Installation
Scenario 1, Installation Over Three Years Scenario 2,
Installation
Assumed in
Year One
Installation
Rate
Year 1 Year 2 Year 3 Year 4 Total
NPV 3,467,694 4,255,310 81.5%
1 391,046 391,046 651,744
2 391,046 43,015 434,062 651,744
3 391,046 43,015 29,082 463,144 651,744
4 391,046 43,015 29,082 91,041 554,185 651,744
5 391,046 43,015 29,082 91,041 554,185 651,744
6 391,046 43,015 29,082 91,041 554,185 651,744
7 391,046 43,015 29,082 91,041 554,185 651,744

103
Scenario 1, Installation Over Three Years Scenario 2,
Installation
Assumed in
Year One
Installation
Rate
Year 1 Year 2 Year 3 Year 4 Total
8 391,046 43,015 29,082 91,041 554,185 651,744
9 391,046 43,015 29,082 91,041 554,185 651,744
10 43,015 29,082 91,041 163,139 0
11 29,082 91,041 120,124 0
12 91,041 91,041 0
*Calculated at 6.95% discount rate.
Customer Use of CFLs
Nearly one‐half (47%) of respondents had not used a CFL before receiving bulbs from the program.
When respondents were asked whether they had purchased additional CFLs after receiving the program
bulbs, 73% (n=70) said they had not—not a surprising response, given that respondents are in low‐
income brackets and just received several free bulbs. All but two participants said they planned to
purchase CFLs in the future. The two saying they would not specified bulb price as their reason.
The Cadmus team asked all respondents where they normally purchased light bulbs. As shown in Figure
14, more than one‐half (57%) said they made purchases from a discount retail store, while 40% specified
big box hardware stores. As Ameren is already in these spaces, they present a potential additional
market for low‐cost, energy‐efficient bulbs.
Figure 14. What type of store do you normally buy light bulbs from? (n=70)*
*Percentages do not sum to zero because respondents were allow to offer more than one response.
Customer Response to Educational Materials
In addition to the CFLs, participants received information about general, energy‐efficient practices and
how to recycle CFLs. The surveys found 47% of participants remembered receiving this information,
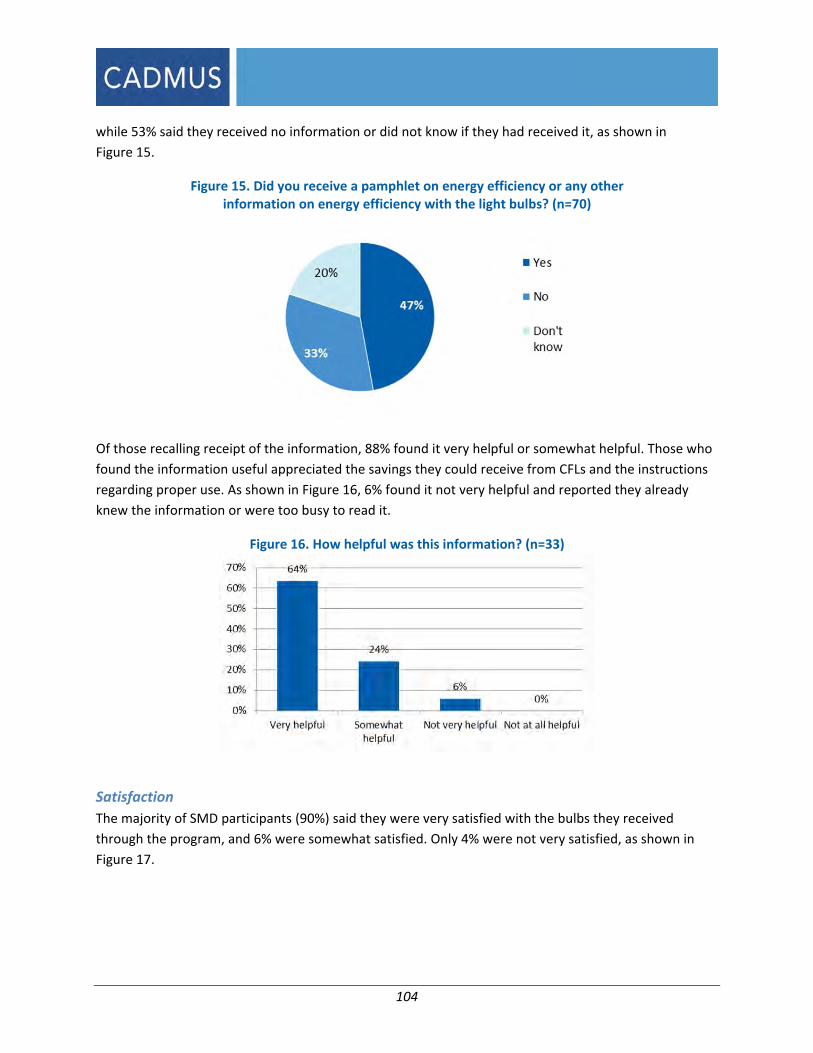
104
while 53% said they received no information or did not know if they had received it, as shown in
Figure 15.
Figure 15. Did you receive a pamphlet on energy efficiency or any other information on energy efficiency with the light bulbs? (n=70)
Of those recalling receipt of the information, 88% found it very helpful or somewhat helpful. Those who
found the information useful appreciated the savings they could receive from CFLs and the instructions
regarding proper use. As shown in Figure 16, 6% found it not very helpful and reported they already
knew the information or were too busy to read it.
Figure 16. How helpful was this information? (n=33)
Satisfaction
The majority of SMD participants (90%) said they were very satisfied with the bulbs they received
through the program, and 6% were somewhat satisfied. Only 4% were not very satisfied, as shown in
Figure 17.

105
Figure 17. How satisfied are you overall with the energy‐saving bulbs you received from Ameren? (n=70)
Cadmus asked participants to explain why they were or were not satisfied. Their responses fell into the
following categories, ranked by frequency of mention:
Positive satisfaction rating;
Energy savings;
Low replacement rate or longevity of bulb life;
The quality of light given off by the new bulbs; and
The bulbs were free.
Negative satisfaction ratings included the following:
Bulbs failing; and
CFLs were dimmer than incandescents.
Respondent Characteristics Cadmus also asked respondents a series of questions to better understand their lifestyle and energy use.
Heating and Cooling Sources
When respondents were asked about the primary source of heat for their house, they most commonly
(56%) cited a source other than an electric heat pump or an electric baseboard unit, as shown in
Figure 18. When asked about cooling systems, 75% (n=69) of respondents said they had a central air
conditioning system.
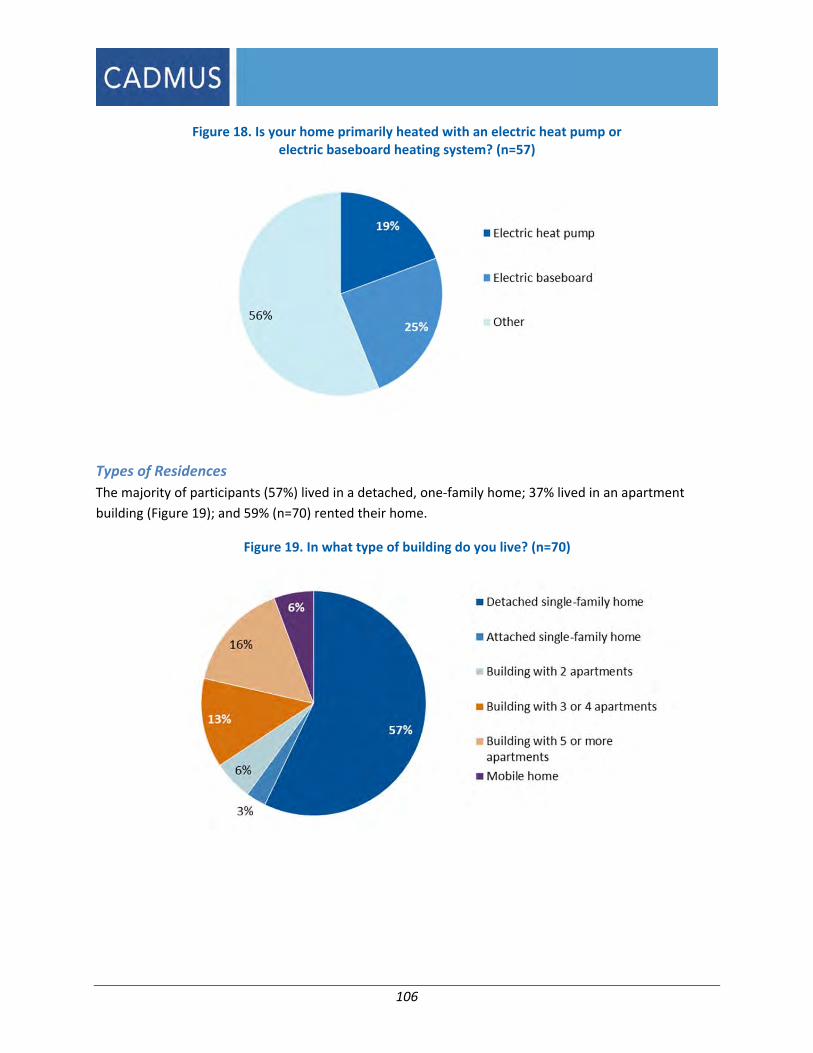
106
Figure 18. Is your home primarily heated with an electric heat pump or electric baseboard heating system? (n=57)
Types of Residences
The majority of participants (57%) lived in a detached, one‐family home; 37% lived in an apartment
building (Figure 19); and 59% (n=70) rented their home.
Figure 19. In what type of building do you live? (n=70)
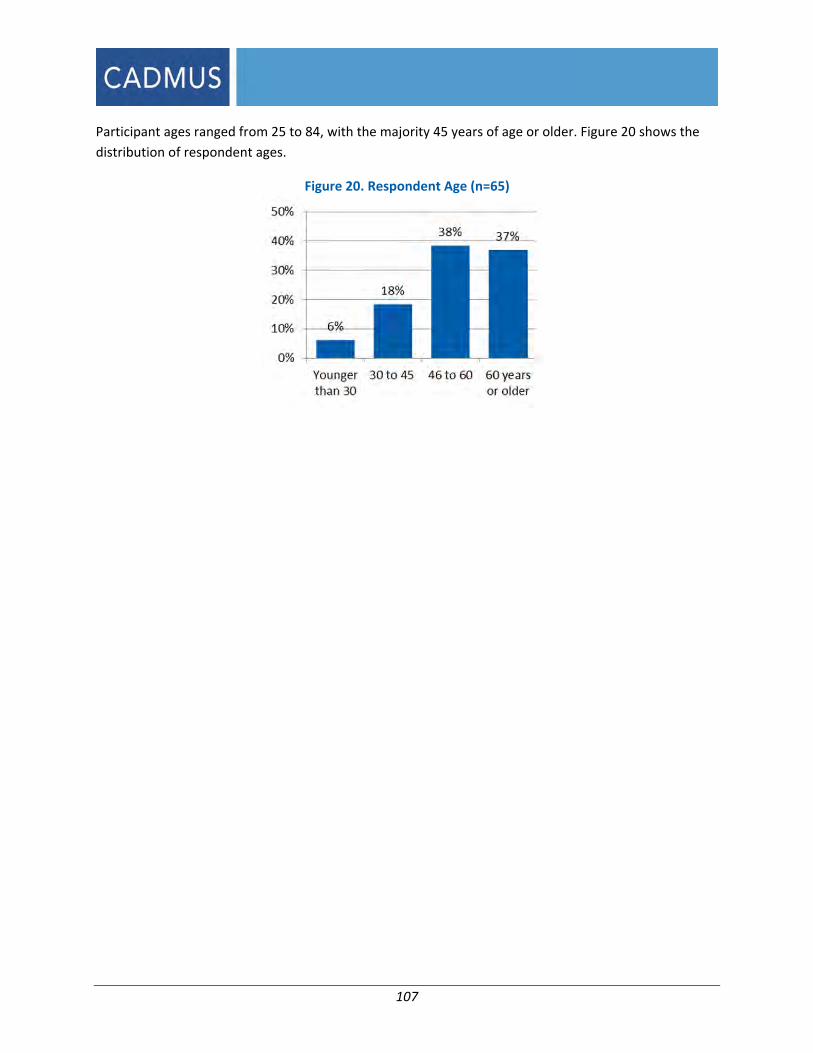
107
Participant ages ranged from 25 to 84, with the majority 45 years of age or older. Figure 20 shows the
distribution of respondent ages.
Figure 20. Respondent Age (n=65)

108
APPENDIX G. HIS ANALYSIS
As part of this PY13 evaluation, the Cadmus team updated key metrics for the LightSavers and
RebateSavers Programs’ impact evaluations through a HIS and metering to assess HOU for lighting and
HVAC equipment. On‐site visits gathered information on the number, type, and location of lights in
customers’ homes (including lights in storage), and allowed meter installations on a randomly selected
sample of lights (to update assumptions on HOU). The team also installed meters on thermostats and air
conditioners.
During each visit, a Cadmus team representative conducted a short interview with the resident, which
included questions about the resident’s general awareness of energy‐efficient lighting, the program, and
rebates as well as typical lighting purchase behaviors. The representatives also asked customers about
their preferences for lighting products, including types of bulbs they expected to purchase in the future.
Methodology
During May and June 2013, Cadmus sent representatives to 172 single‐family households in the Ameren
service territory. This sample group included customers from Ameren’s general population who
previously volunteered for a potential study conducted by EnerNOC and indicated during that survey
they would participate in additional studies. This sample size resulted in an expected sampling error of
±6.3% at the 90% confidence level.
Cadmus representatives used tablet‐based electronic forms to collect data and complete a detailed
inventory of all lighting equipment in the house, including exterior lights and stored lights, along with
data on HVAC equipment. During the visit, representatives asked residents to complete a written four‐
page survey, which included 35 questions addressing lighting and program awareness as well as
purchasing habits; respondents asked questions as needed. Representatives collected survey forms at
the end of the site visit and stored these as PDF files. The Cadmus team then input the responses into an
Excel spreadsheet for analysis.
LightSavers Participant Survey Analysis
The evaluation results indicated an expected increase in bulb saturation and penetration for CFLs and
LEDs as well as increased awareness of the technology. Where appropriate, PY13 results were compared
to PY10 results from a survey of the Ameren general population that Cadmus also conducted.
Energy‐Efficient Lighting: General Awareness and Attitudes
The PY13 survey asked respondents about their familiarity with CFLs and LED light bulbs and included
pictures and brief descriptions of the bulbs alongside a question. Respondents generally were more
familiar with CFLs, but had some familiarity with LEDs. Of all respondents, 95% were very familiar or
somewhat familiar with CFLs—an 15% increase from PY10, when 80% of customers reported familiarity
with CFLs. The increase is notable as the group that is very familiar has become larger, proportionally,
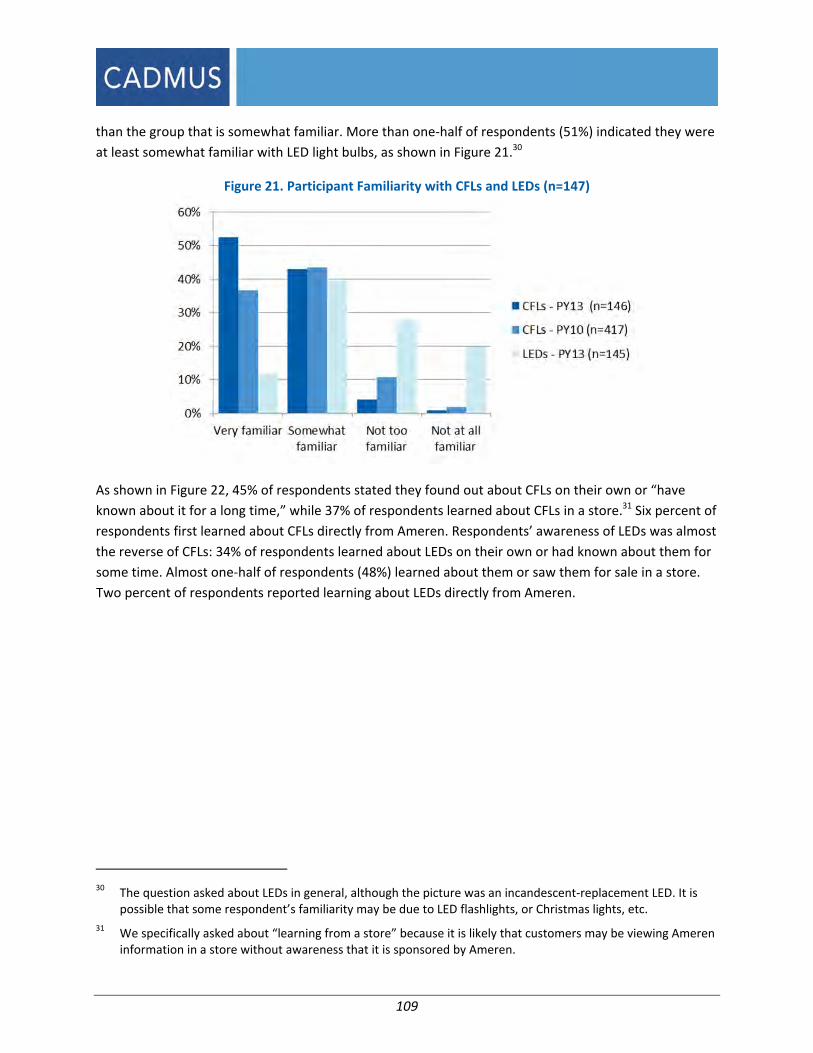
109
than the group that is somewhat familiar. More than one‐half of respondents (51%) indicated they were
at least somewhat familiar with LED light bulbs, as shown in Figure 21.30
Figure 21. Participant Familiarity with CFLs and LEDs (n=147)
As shown in Figure 22, 45% of respondents stated they found out about CFLs on their own or “have
known about it for a long time,” while 37% of respondents learned about CFLs in a store.31 Six percent of
respondents first learned about CFLs directly from Ameren. Respondents’ awareness of LEDs was almost
the reverse of CFLs: 34% of respondents learned about LEDs on their own or had known about them for
some time. Almost one‐half of respondents (48%) learned about them or saw them for sale in a store.
Two percent of respondents reported learning about LEDs directly from Ameren.
30 The question asked about LEDs in general, although the picture was an incandescent‐replacement LED. It is
possible that some respondent’s familiarity may be due to LED flashlights, or Christmas lights, etc.
31 We specifically asked about “learning from a store” because it is likely that customers may be viewing Ameren information in a store without awareness that it is sponsored by Ameren.

110
Figure 22. How Did You First Become Aware of CFLs and LEDS?
As shown in Figure 23, 82% of respondents in PY13 stated they were very satisfied or somewhat
satisfied with their CFL bulbs. Although respondents appeared to be more familiar and have more
experience with CFLs in PY13 than in PY10, satisfaction remained generally flat. In fact, while roughly the
same percentage of respondents were very satisfied or somewhat satisfied with the bulbs, a greater
proportion were only somewhat satisfied in PY13.
Figure 23. If You Have Installed CFL Bulbs Now or in the Past, How Satisfied Have You Been With Them?

111
Note that the PY10 language used for questions and options differed slightly:
“How satisfied are you with the compact fluorescent light bulbs currently in your home or, if you have no
CFLs installed right now, the ones you have used in the past? Would you say:
1. Very satisfied
2. Somewhat satisfied
3. Neither satisfied nor dissatisfied
4. Somewhat dissatisfied
5. Very dissatisfied
98. Don’t know
99. Refused”
The inclusion of the neutral option in PY10 may have slightly decreased the number of respondents that
selected the “somewhat satisfied” option in PY10.
Ameren Program Awareness and Attitudes
To gauge awareness of Ameren lighting programs, the survey asked respondents if they knew of the
lighting discounts and whether or not they had taken advantage of them. As shown in Figure 24, the
majority of respondents did not know that Ameren offers lighting discounts. This result was not
surprising as Ameren designed the discount to be transparent to customers.32 Respondents that did
know about the discounts primarily learned of them through signs at retail stores (35%), or Ameren
communications or their energy bills (33%). Of 19 people who purchased discounted CFLs, 15 were
satisfied or somewhat satisfied with the price. Of four people who purchased a discounted LED, one was
very satisfied, one somewhat satisfied, one not very satisfied, and one not at all satisfied.
32 This is also consistent, if not somewhat higher, than lighting program awareness in other areas promoting CFLs
through upstream programs. For example, Cadmus performed similar surveys in Pennsylvania and Maine recently and 13% and 15%, respectively, were aware the utility offered discounts. In both Arkansas and Michigan, we asked an open‐ended question: “What utility programs are you aware of?” In those cases only 1‐2% volunteered they knew about lighting discounts (which we expect would be less than a prompted question such as this one).

112
Figure 24. Are You Aware That Ameren Offers Discounts on Energy‐saving Light Bulbs Sold at Local Stores? (n=133)
The survey also asked respondents whether they had heard of the Act On Energy Program. Seventy‐
three percent (n=147) of respondents indicated that they had not heard of the program, as shown in
Figure 25. Of the 24 responding “yes”: seven said they had purchased energy‐efficient equipment since
hearing about the program, including air conditioning units, windows, and electronics. This information
will be used to calculate a non‐like spillover percentage when determining final program savings
numbers.
Figure 25. Have You Heard About Act On Energy, a Set of Programs From Ameren to Help Customers Save Energy? (n=147)

113
Lighting Purchasing Behaviors
The resident survey asked respondents questions about their lighting purchasing habits, both in general
and in regard to Ameren‐discounted products. Ninety‐four percent of respondents (n=130) said they
previously purchased CFLs, while 36% (n=146) confirmed they bought LEDs at some point.33
Survey results showed that 16 people (25%; n=64) knowingly purchased Ameren‐discounted CFLs, and
four people (7%; n=55) reported purchasing a discounted LED. Nevertheless, the vast majority of bulbs
that respondents purchased, as of January 2013, were CFLs. Given these households fell within
Ameren’s territory, it is likely that residents purchased a significant number of the CFLs through the
program without knowing of Ameren’s involvement.
Figure 26. Number of Bulbs Purchased After January 1, 2013, by Type
For respondents purchasing LEDs, Cadmus asked what they might have purchased had LEDs not been
available. Many respondents (43%; n=54) said they would have purchased a regular incandescent light
bulb, indicating the LED purchase replaced a regular incandescent purchase. Thirty‐seven percent would
have purchased a CFL, 11% an energy‐efficient halogen, and 6% some other bulb. Four percent would
not have purchased any other bulb.34
33 The survey did not distinguish between incandescent‐replacement LEDs or other types of LEDs, such as
flashlights or Christmas lights.
34 Numbers do not total to 100% due to rounding error.

114
Figure 27. Had the LED Bulb You Purchased Not Been Available, What Type of Bulb Would You Have Purchased Instead? (n=54)
LightSavers Lighting Inventory Analysis
The lighting inventory provides updated estimates for several key metrics that impact savings
calculations and lighting program design.
CFLs per Household
Cadmus’ PY13 inventory shows the number of CFL bulbs per home and the number of CFLs in MSBs per
home increased by nearly 50% from PY10 levels. The overall number of sockets increased as well. CFLs
at the time of the survey accounted for approximately 22% of all bulbs in the home and about 29% of all
MSB bulbs per home.
Table 57. Average Number of Bulbs Installed for all Sockets (Weighted)
PY13 PY10
Bulb Type Number of Bulbs Avg. Bulbs / Home
Incandescent 6,664 40.6
Compact Fluorescent (CFL) 2,734 16.7 11.4
Linear Fluorescent 1,246 7.6
Halogen 1,115 6.8
Light‐emitting Diode (LED) 157 0.96
Empty Socket 143 0.9
Other/Type not Assigned 20 0.1
Total Sockets 12,080 73.7 69.5
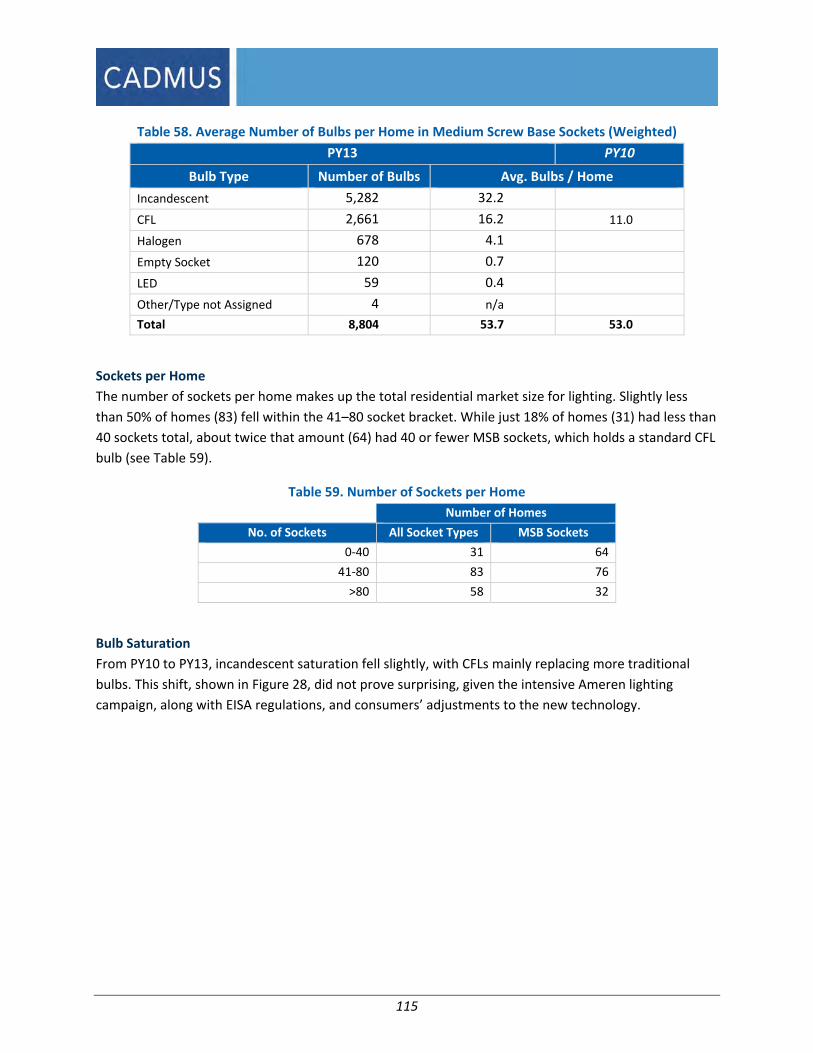
115
Table 58. Average Number of Bulbs per Home in Medium Screw Base Sockets (Weighted)
PY13 PY10
Bulb Type Number of Bulbs Avg. Bulbs / Home
Incandescent 5,282 32.2
CFL 2,661 16.2 11.0
Halogen 678 4.1
Empty Socket 120 0.7
LED 59 0.4
Other/Type not Assigned 4 n/a
Total 8,804 53.7 53.0
Sockets per Home
The number of sockets per home makes up the total residential market size for lighting. Slightly less
than 50% of homes (83) fell within the 41–80 socket bracket. While just 18% of homes (31) had less than
40 sockets total, about twice that amount (64) had 40 or fewer MSB sockets, which holds a standard CFL
bulb (see Table 59).
Table 59. Number of Sockets per Home
Number of Homes
No. of Sockets All Socket Types MSB Sockets
0‐40 31 64
41‐80 83 76
>80 58 32
Bulb Saturation
From PY10 to PY13, incandescent saturation fell slightly, with CFLs mainly replacing more traditional
bulbs. This shift, shown in Figure 28, did not prove surprising, given the intensive Ameren lighting
campaign, along with EISA regulations, and consumers’ adjustments to the new technology.

116
Figure 28. Installed Saturation (All Sockets)
Among MSB sockets, CFL saturations were even higher, with the vast majority of CFLs sold are standard
bulbs fitting that socket type (see Table 60).
Table 60. Installed Saturation (MSB only)
Percentage of Sockets
Bulb Type PY13 PY10
Incandescent 60.0%
CFL 30.2% 20.8%
Halogen 7.7%
Empty Socket 1.4%
LED 0.7%
Bulb Storage
Despite the onset of EISA regulations, which limit the wholesale distribution of traditional incandescent
light bulbs, most households participating in the inventory still had a large number of these bulbs
in storage.
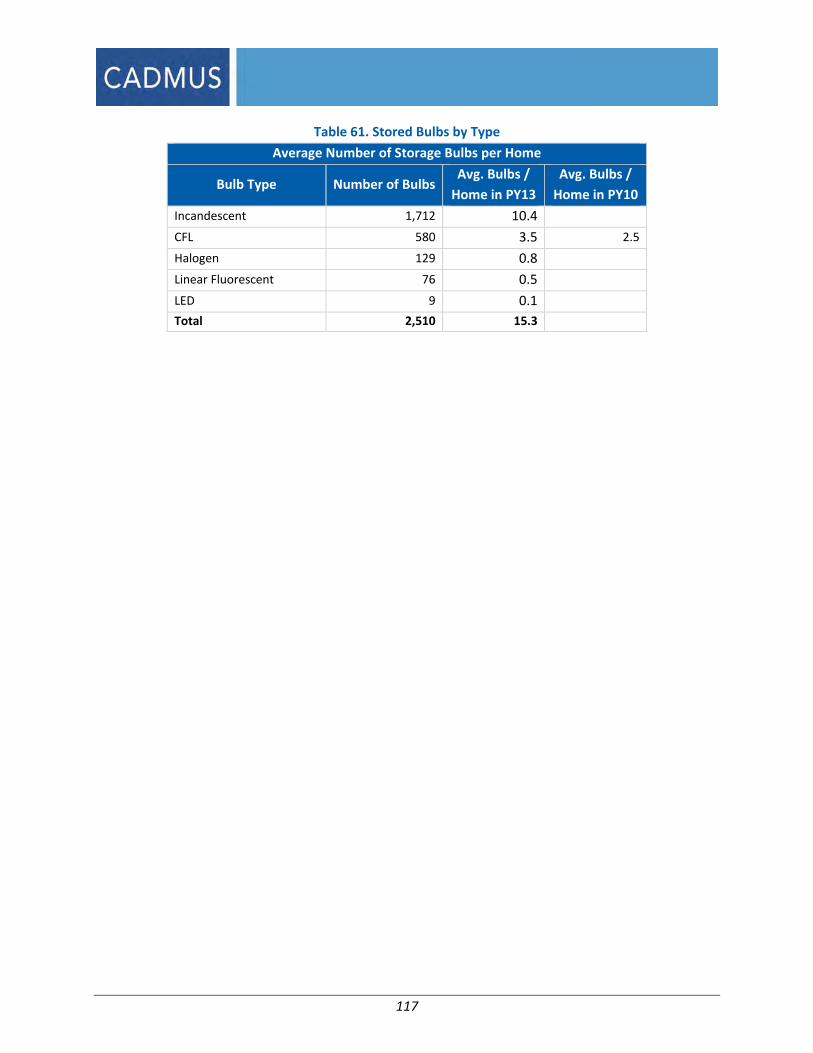
117
Table 61. Stored Bulbs by Type
Average Number of Storage Bulbs per Home
Bulb Type Number of BulbsAvg. Bulbs /
Home in PY13
Avg. Bulbs /
Home in PY10
Incandescent 1,712 10.4
CFL 580 3.5 2.5
Halogen 129 0.8
Linear Fluorescent 76 0.5
LED 9 0.1
Total 2,510 15.3

118
APPENDIX H. INTERACTIVE EFFECTS ANALYSIS
This section summarizes the analyses that the Cadmus team performed to provides Ameren with an
estimate of interactive effects related to the installation of efficient lighting.
Generally, lighting systems convert only a fraction of their electrical input into useful light output, with
much remaining electricity released directly as heat into the space around fixtures. As such, light energy
is converted to heat over time. Therefore, any lighting upgrade that reduces input wattage reduces the
heat an air conditioning system must remove in the summer, and, conversely, that a home’s heating
system must compensate for during in the winter.
In Missouri, interactions between lighting and HVAC systems are termed lighting interactive effects. The
industry commonly refers to this interaction as a WHF, with WHFe is related to energy savings and
WHFd is associated with demand savings.
A WHF helps to answer two basic questions: How much less of the lighting system's heat must be
removed by the cooling system after installation of efficient lighting, and how much heat must the
system add during the winter to make up for the lower heat production of efficient lights?
A WHFe of 1.1 means that annually for every kilowatt hour (kWh) saved by an efficient lighting system,
an additional 0.1 kWh is saved in heating and cooling systems. Similarly, a WHFd of 1.15 means that—
for a particular peak period—each reduction of 1 kW in lighting saves an additional 150 watts in peak
cooling energy. A WHFe of 0.9 means that annually for every 1 kWh saved though efficient lighting, a
typical home expends a net of 0.1 kWh of energy to compensate for the reduction in heat.
The Cadmus team will use the results of this analysis to evaluate lighting savings for the LightSavers®,
PerformanceSavers®, CommunitySavers®, SMD, and RebateSavers® (efficiency kits) Programs.
Approach To estimate interactive effects for each applicable Ameren program, the Cadmus team used program
data from tracking databases and primary research. As lighting interaction highly depend on the time of
day and time of year, the team used a simulation model: specifically, a BEopt™ Version 2.035 to model
energy simulations needed for estimating the WHFe and WFHd in residential homes.
Using the model, the Cadmus team simulated lighting usage using load‐shape information from Cadmus’
2010 Lighting Metering Study in Ameren’s service territory—specifically using load shapes for lighting,
heating, and cooling. (A load shape represents the average hourly load for each hour of the day and
each month of the year.) Load shapes, reflecting real occupant behaviors for lighting and cooling usage,
also are important for calculating lighting interactions during peak periods. From the 2012 Ameren
35 Developed by NREL, BeOpt uses the Energy Plus V8.0 simulation engine to generate hourly projected energy
consumption, based on typical TMY3 weather data.

119
potential study, the Cadmus team obtained the general characteristics of the simulated homes (such as
insulation levels, home size, and construction type).
The WHF depends on many influences, but the major considerations include the following:
The length of the respective heating and cooling seasons. (Areas with long cooling seasons and
low saturations of electric heating will tend to have higher WHFe values.)
Electric heating saturation.
Cooling saturation.
Electric resistance versus heat‐pump electric heating.
Cadmus used Equation 1 to determine the WHFe.
(Equation 1. Waste Heat Factor for Energy)
∆ ∆ ∆ ∆
The WHFd value depends on cooling saturation and cooling efficiency. Cadmus used Equation 2 to
determine the WHFd.
(Equation 2. Waste Heat Factor for Demand)
∆ @ ∆ @ ∆ @
Where:
A value of 1.0 would mean no net interaction between heating, cooling, and lighting.
A value of less than 1.0 would mean a net reduction in total energy savings due to the higher
heating load offsetting the lower cooling load.
A value of more than 1.0 would mean a net increase in energy savings due to the lower cooling
load offsetting the higher heating load.
Figure 29 shows BEopt model output for the typical heating, cooling, and lighting consumption over a
one‐year period in St. Louis, Missouri. In Ameren’s territory as a whole, approximately 26%36 of the
homes use electrical resistance heat, while the majority have central cooling. For a typical heat pump
heated home (shown here), the likely interaction would result in a WHFe less than 1.0 for this home.
36 2009 Ameren Potential Study. The 2009 study was used in place of the 2013 potential study due to
unexplained differences between the studies. The 2013 study showed an unlikely increase in electric resistance heating.

120
This resulted from a longer heating season in Ameren’s service territory (six months versus four months)
and generally higher efficiencies for cooling versus heating.
Figure 29. Heating and Cooling Loads for a Typical Home with Heat Pump
Development of the WHF
The Cadmus team developed a series of energy models to simulate the effects of high‐efficiency lamps
on the heating and cooling systems. The parameters in Table 62 defined a prototypical home.
Table 62. Modeled Home Parameters
Parameter Value Source
Size 1,900 square feet Ameren Potential Study
Attic Insulation R‐19 Assumed base on vintage from Ameren Potential Study
Wall Insulation R‐7 Assumed base on vintage from Ameren Potential Study
Window Type Double Pane Metal Assumed base on vintage from Ameren Potential Study
Building Leakage 11 ACH50 Assumed base on vintage from Ameren Potential Study
Heating Thermostat 69.4˚F daytime 67.9˚F nighttime 8:00 am‐8:00 PM
Weighted mean temperatures Ameren Potential Study
Cooling Thermostat 73.5˚F daytime 72.9˚F nighttime 8:00 am‐8:00 PM
Weighted mean temperatures Ameren Potential Study
This section’s introduction defined lighting interaction as the proportion of heating, cooling, and lighting
energy to the lighting energy. As the WHF is a proportion, it is valid for a single CFL or for an entire home
retrofit, as illustrated by the following equation.

121
Equation 3. WHF Proportion Calculation
∆ ∆ ∆ ∆
Cadmus modeled five heating and cooling scenarios to capture these common types of HVAC systems:
Air source heat pump
Gas furnace with cooling
Gas furnace without cooling
Electric resistance with cooling
Electric resistance without cooling
For most central cooling systems, the study assumed a 10 SEER (seasonal energy efficiency ratio) cooling
efficiency and a 6.2 HSPF (heating seasonal performance factor) heat‐pump heating efficiency. For the
PerformanceSavers Program, simulations assumed a 10.9 SEER cooling efficiency and an 8.7 HSPF heat‐
pump heating efficiency (based on program tracking data).
For each home, Cadmus modeled two lighting scenarios: one with the baseline scenario of 34%
fluorescent lighting (which consumed approximately 1,700kWh/year) and one with 80% florescent
lighting (which consumed 1,330kWh/year). While the latter model did not necessarily represent the
typical retrofit scenario, it allowed calculation of the proportion of heating and cooling energy changes
associated with reduced lighting loads, which applies to any level of incandescent‐to‐CFL conversion.
Using Ameren’s hourly lighting load shape, Cadmus ran the simulations.37 (Appendix H‐B provides the
load shape for each month.)
The simulation model, BEopt, assumes all lighting energy from interior fixtures dissipates into a home’s
conditioned space. While likely true for most interior fixtures, certain fixtures (such as recessed can
lighting) extend beyond the thermal boundary of the home. Cadmus tested can lighting in our laboratory
to determine how much lighting energy dissipated through an attic and how much enters a home. The
tests showed, on average, 60% of the lighting energy enters the home. Thus, the study used this value,
with the fixture‐specific data from the Ameren residential lighting inventory, to correct for recessed can
fixtures.
Cadmus weighted the resulting WHFs to saturations of heating and cooling systems for each program, as
shown in Table 63.
37 Cadmus determined the lighting load shape from the Cadmus’ 2010 lighting metering study.

122
Table 63. Heating and Cooling Saturation by Program
Program
Central
Cooling
Saturation
Electric Heating Saturation
Source Heat Pump
Electric
Resistance/Furnace
LightSavers 95% 4% 25% Ameren Potential Study2
SMD 75% 16% 20% SMD Survey Responses
RebateSavers –
Efficiency Kits3 81% 26% 15% RebateSavers Survey Responses
CommunitySavers 87%1 11% 70% CommunitySavers Tracking Data
PerformanceSavers 87% 3% 20%PerformanceSavers Tracking
Data 1Included Package Terminal Air Conditions (PTAC) since PTAC’s are designed to heat and cool an entire unit. 2 Weighted for single‐family and multifamily homes, with 85% of homes single‐family and 15% multifamily applied to 22% electric resistance/furnace and 4% heat pumps for single‐family and 44% electric resistance/furnace and 2% heat pumps for multifamily.
3This program targets homes likely to have electric water heating; therefore, this group is also likely to have higher proportions of electric heating.
Result
The equipment heating and cooling scenarios, shown in Table 64, are not weighted and do not account
for gas interactions. Based on the model output of BEopt, Cadmus calculated the WHFe and WHFd using
Equation 1 and Equation 2.
As gas furnaces use relatively small amounts of electricity,38 little heating penalty occurs, and the WHFe
is relatively high. As for the WHFd, it is only above 1.0 for homes with a cooling system; otherwise, no
interaction occurs. Homes with electric‐resistance heating systems have a relatively low WHFe, primarily
due to a longer heating season than cooling season. For gas‐heated homes, Cadmus assumed the
heating system was a gas furnace.
Table 64. WHFs by Cooling and Heating Equipment
Equipment WHFe WHFd
Gas Furnace with central air conditioning 1.09 1.27
Gas Furnace without central air conditioning 0.99 1.00
Heat Pump 0.93 1.28
Electric Resistance with central air conditioning 0.76 1.27
Electric Resistance without central air conditioning 0.67 1.00
To illustrate how Cadmus calculated the WHFe, Table 65 shows the equipment proportions and
weighted average results for the LightSavers Program.
38 Gas furnace fan power is slightly affected by lighting interactions.

123
Table 65. LightSavers: WHF Weighting Calculations
LightSavers WHFe WHFd Saturation
Gas Furnace with central air conditioning 1.09 1.27 67%
Gas Furnace without central air conditioning 0.99 1.00 4%
Heat Pump 0.93 1.28 4%
Electric Resistance with central air conditioning 0.76 1.27 24%
Electric Resistance without central air conditioning 0.67 1.00 1%
Average 0.99 1.26
High saturations of electric heating significantly lowers the WHFe. As shown in Table 66, the
CommunitySavers Program has a considerably lower WHF than the SMD Program, although both
programs have similar cooling saturations. Approximately 81%39 of the CommunitySavers population
uses electric heating, whereas only 36% of the SMD population uses electric heating.
Table 66. WHF by Program
Program WHFe WHFd
LightSavers 0.99 1.26
SMD 0.97 1.20
RebateSavers 0.98 1.22
CommunitySavers 0.83 1.24
PerformanceSavers 0.99 1.23
Table 67 lists WHFe across several information sources. The only values showing a net positive
interaction ignore any heating penalty. The average of sources that include a heating penalty have an
average WHFe of 0.90. Though less than the average of 0.99 for Ameren, this is expected as Ameren’s
climate is warmer that the first three locations in the table.
39 Combined heat pump and electric resistance.

124
Table 67. Comparisons to Other Sources
Sources of WHF Heating
Adjustment
Cooling
Adjustment WHFe
Includes Heating
Equipment
Interaction
Regional Technical Forum (RTF)
(OR, WA, ID, MT) ‐22% 7% 0.86 Yes
New York TRM (TecMarket Works 2010) ‐12% 3% 0.91 Yes
Wisconsin ‐10% 8% 0.94 Yes
Mean including heating penalty ‐15% 6% 0.90
Vermont TRM (VEIC 2012) n/a 6% 1.06 No
Ohio TRM (DPS 2010) n/a 7% 1.07 No
Mid‐Atlantic TRM 2012 (VEIC 2011) n/a 14% 1.14 No
State of Illinois Energy Efficiency TRM 2012
(Illinois 2012) n/a 6% 1.06 No
Multifamily section of Illinois TRM
(Illinois 2012) n/a 4% 1.04 No
Mean excluding heating adjustment 7% 1.07
Appendix H‐A. Recessed Can Lighting The following content derives from an excerpt from IEPEC conference paper, delivered by David Korn of
Cadmus in August 2013.
Understanding Heat Flow in Lighting Fixtures
It is important to understand the heat flow in light fixtures, because heat can enter a space and interact
with the building’s HVAC system, or it can leave the space and not contribute to the WHF. In a
residential environment, a ceiling‐mounted fixture, such as a recessed can, may allow heat to rise into
an attic space and be lost from conditioned space. In a commercial building, heat can rise above a
dropped ceiling and be lost from the space, or it can rise above the ceiling and enter a return‐air
plenum, where all of the heat enters the HVAC system. However, data are limited regarding how much
heat enters living spaces served by a fixture and how much rises into unoccupied space. Thus, Cadmus
devised a simple but effective study to gather this information.
Through a limited experimental study of recessed lighting in our laboratory, Cadmus observed the
amount of heat released by a recessed fixture through a drywall ceiling cross‐section. This measurement
is important, because residential calculations and commercial modeling approaches all require an
estimate of the amount of heat leaving a space.
Experimental Set Up
Cadmus engineers built a calorimeter using closed cell foam residential insulation. The calorimeter
consisted of a box with known heat transfer parameters (Figure HA‐1).

125
Figure HA‐1. Calorimeter Test Setup
We created three setups with these insulation values: a box with ½‐inch walls and an R‐value of 3.3; a
box with 2‐inch walls and an R‐value of 10; and a box with double‐thick (2‐inch) walls and a total R‐value
of 20.
Into ¾” drywall, we mounted a standard 45‐watt incandescent indoor floodlight, using these fixture
setups: non IC‐rated and IC‐rated. The bottom of the drywall‐mounted fixture was left open, as it would
be in an actual installation. Figure HA‐2 shows the bottom of the calorimeter where the recessed fixture
is open. This allows the heat to descend and be dispersed into the testing area, which is similar to how
heat distribution in a home works: descending heat enters the living space.
Figure HA‐2. View From Below Showing Recessed Fixture

126
After mounting four Onset TMCx‐HD ambient temperature sensors inside the box—to measure the air
temperature as the light heated the interior—we tested the IC‐rated fixture two ways: bare and with
R‐19 batt insulation covering the fixture. We also recorded the steady‐state temperature once a heat
balance had been achieved. Additionally, we placed a temperature sensor on the outside of the box to
measure the ambient temperature of the testing room. Using a Watt’s Up Pro plug‐through power
meter, we monitored the fixture’s power draw so that we could account for any variation occurring from
the bulb’s rating.
Calibrating the Test Procedure
Cadmus conducted preliminary tests to determine how much of a bulb’s power could be accounted for
in the calorimeter. We made a second box from the insulation and covered the lower half of the test set
to enclose the bulb completely. We then mounted four additional temperature sensors in the lower box
to gather data.
After monitoring the test until it reached steady state, we averaged the temperature readings in the
upper and lower chambers and then calculated the energy drawn by the bulb. Because the mass of the
air inside the box was insignificant at steady state, we assumed that the heat released by the bulb would
match the calculated amount of heat escaping through the insulation walls. At steady state, the bottom
box had an inside temperature of 112.3°F, and the outside temperature was 69.62°F. With this
information, we used the following equation to calculate the heat lost from the bottom box.
(Equation HA‐1. Steady State Raw Energy for Calibration Test)
112.3 69.6224.75
10.85
3.412 240.0
0.1188
Cadmus’ averaging of the heat lost during the calibration test yielded an average heat‐loss rate of 27.68
watts. We repeated this process with the top box and the edge of the drywall housing the fixture, which
yielded a total 46.96 watts. We also determined that the average power used by the light bulb during
the test was 48 watts. The calibration test accounted for 97.84% of the power drawn by the bulb, so we
used 97.84% as a calibration factor for the remaining tests.
Heat Distribution Testing
We ran each of three fixture arrangements with a different level of insulation (a total of nine tests). In
each, we ran the test until the box reached a steady‐state temperature. The varying thicknesses of
insulation resulted in different steady‐state temperatures, which allowed us to see whether different
temperatures above the bulb impacted the heat transfer from the bulb. (Note that in an actual home,
the temperature of the space above the bulb will vary not only by fixture type but also by insulation,
shape of the space above, and the season.)
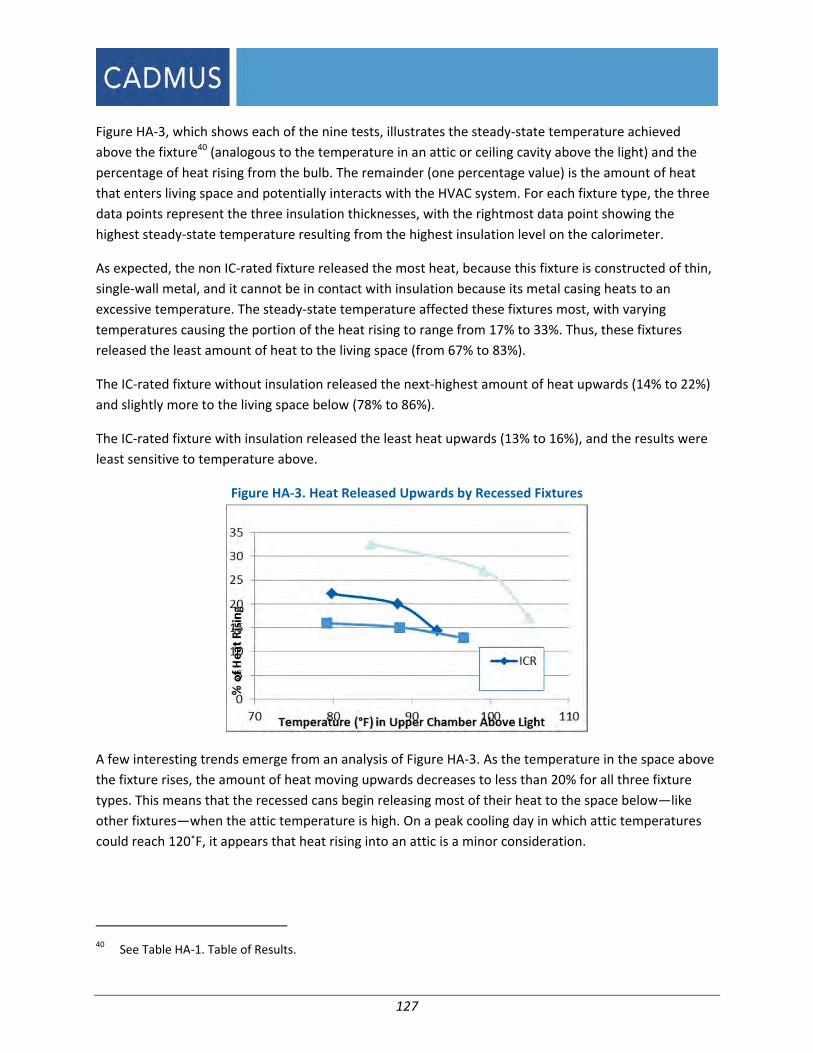
127
Figure HA‐3, which shows each of the nine tests, illustrates the steady‐state temperature achieved
above the fixture40 (analogous to the temperature in an attic or ceiling cavity above the light) and the
percentage of heat rising from the bulb. The remainder (one percentage value) is the amount of heat
that enters living space and potentially interacts with the HVAC system. For each fixture type, the three
data points represent the three insulation thicknesses, with the rightmost data point showing the
highest steady‐state temperature resulting from the highest insulation level on the calorimeter.
As expected, the non IC‐rated fixture released the most heat, because this fixture is constructed of thin,
single‐wall metal, and it cannot be in contact with insulation because its metal casing heats to an
excessive temperature. The steady‐state temperature affected these fixtures most, with varying
temperatures causing the portion of the heat rising to range from 17% to 33%. Thus, these fixtures
released the least amount of heat to the living space (from 67% to 83%).
The IC‐rated fixture without insulation released the next‐highest amount of heat upwards (14% to 22%)
and slightly more to the living space below (78% to 86%).
The IC‐rated fixture with insulation released the least heat upwards (13% to 16%), and the results were
least sensitive to temperature above.
Figure HA‐3. Heat Released Upwards by Recessed Fixtures
A few interesting trends emerge from an analysis of Figure HA‐3. As the temperature in the space above
the fixture rises, the amount of heat moving upwards decreases to less than 20% for all three fixture
types. This means that the recessed cans begin releasing most of their heat to the space below—like
other fixtures—when the attic temperature is high. On a peak cooling day in which attic temperatures
could reach 120˚F, it appears that heat rising into an attic is a minor consideration.
40 See Table HA‐1. Table of Results.
128
With better sealed insulated fixtures, there is a decrease in the amount of heat that rises (insulated ICR
versus non‐ICR). This means that increased insulation of the cans could increase the cooling load from
the lights, no matter their efficiency.
In the future, Cadmus will conduct tests with different kinds of light bulbs (specifically, high‐efficiency
CFLs and LEDs) to determine whether the noted trends continue. This testing will also include linear
fluorescents mounted into dropped ceilings, so we can simulate lighting systems used in commercial
buildings.
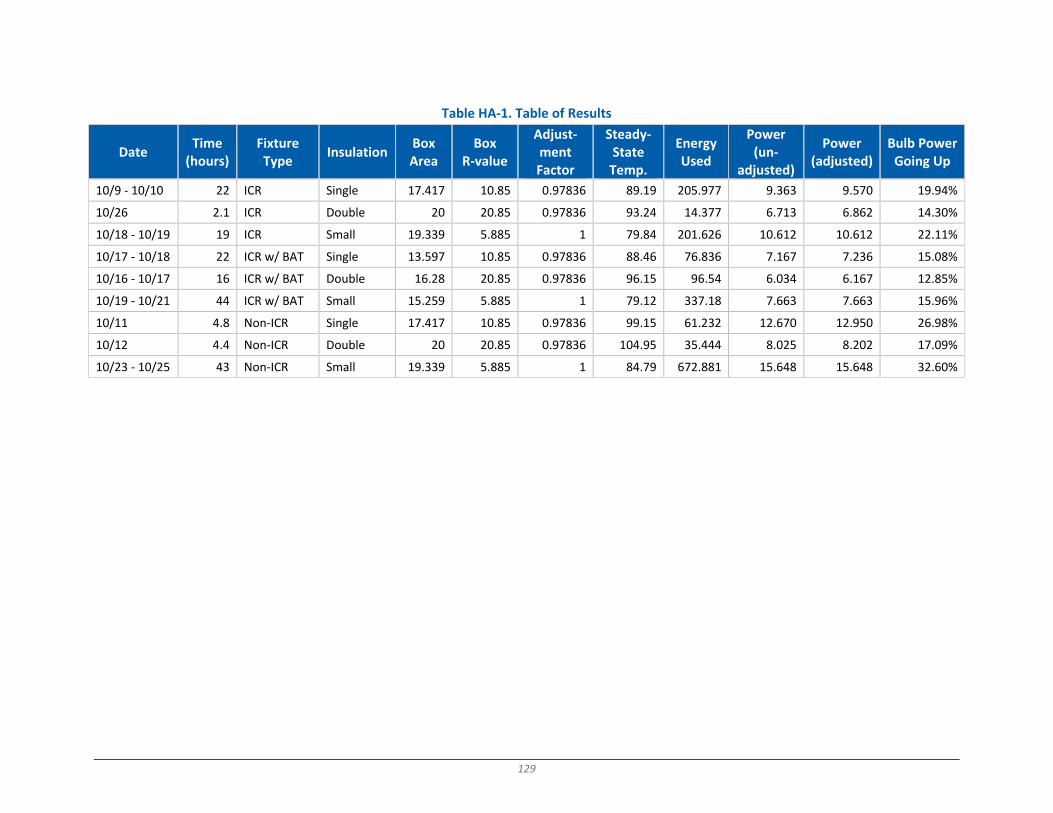
129
Table HA‐1. Table of Results
Date Time (hours)
Fixture Type
Insulation Box Area
Box R‐value
Adjust‐ment Factor
Steady‐State Temp.
Energy Used
Power (un‐
adjusted)
Power (adjusted)
Bulb Power Going Up
10/9 ‐ 10/10 22 ICR Single 17.417 10.85 0.97836 89.19 205.977 9.363 9.570 19.94%
10/26 2.1 ICR Double 20 20.85 0.97836 93.24 14.377 6.713 6.862 14.30%
10/18 ‐ 10/19 19 ICR Small 19.339 5.885 1 79.84 201.626 10.612 10.612 22.11%
10/17 ‐ 10/18 22 ICR w/ BAT Single 13.597 10.85 0.97836 88.46 76.836 7.167 7.236 15.08%
10/16 ‐ 10/17 16 ICR w/ BAT Double 16.28 20.85 0.97836 96.15 96.54 6.034 6.167 12.85%
10/19 ‐ 10/21 44 ICR w/ BAT Small 15.259 5.885 1 79.12 337.18 7.663 7.663 15.96%
10/11 4.8 Non‐ICR Single 17.417 10.85 0.97836 99.15 61.232 12.670 12.950 26.98%
10/12 4.4 Non‐ICR Double 20 20.85 0.97836 104.95 35.444 8.025 8.202 17.09%
10/23 ‐ 10/25 43 Non‐ICR Small 19.339 5.885 1 84.79 672.881 15.648 15.648 32.60%

130
Appendix H‐B. Lighting Load Shapes
January
February
March
0.00%
5.00%
10.00%
15.00%
20.00%
25.00%
30.00%
35.00%
1 3 5 7 9 11 13 15 17 19 21 23
0.00%
5.00%
10.00%
15.00%
20.00%
25.00%
30.00%
1 3 5 7 9 11 13 15 17 19 21 23

131
April
May
0.00%
5.00%
10.00%
15.00%
20.00%
25.00%
30.00%
1 3 5 7 9 11 13 15 17 19 21 23
0.00%
5.00%
10.00%
15.00%
20.00%
25.00%
1 3 5 7 9 11 13 15 17 19 21 23

132
June
July
0.00%
5.00%
10.00%
15.00%
20.00%
25.00%
1 3 5 7 9 11 13 15 17 19 21 23
0.00%
5.00%
10.00%
15.00%
20.00%
25.00%
1 3 5 7 9 11 13 15 17 19 21 23
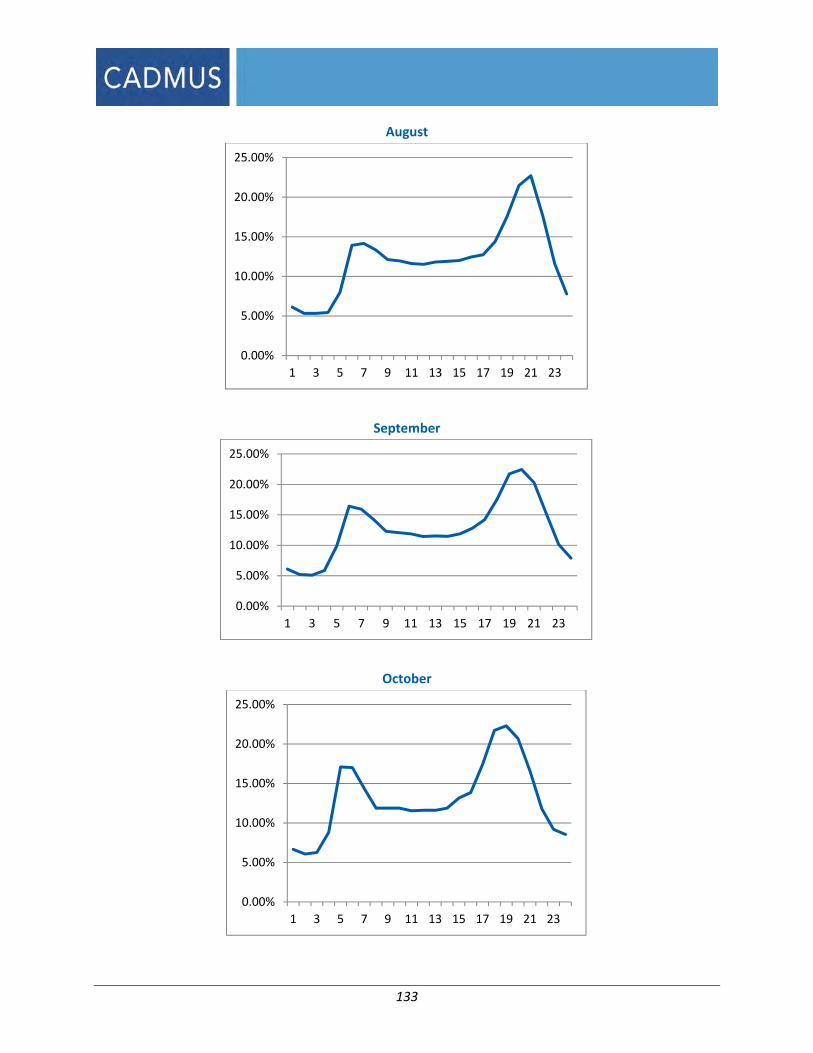
133
August
September
October
0.00%
5.00%
10.00%
15.00%
20.00%
25.00%
1 3 5 7 9 11 13 15 17 19 21 23
0.00%
5.00%
10.00%
15.00%
20.00%
25.00%
1 3 5 7 9 11 13 15 17 19 21 23
0.00%
5.00%
10.00%
15.00%
20.00%
25.00%
1 3 5 7 9 11 13 15 17 19 21 23

134
November
December
0.00%
5.00%
10.00%
15.00%
20.00%
25.00%
30.00%
1 3 5 7 9 11 13 15 17 19 21 23
0.00%
5.00%
10.00%
15.00%
20.00%
25.00%
30.00%
1 3 5 7 9 11 13 15 17 19 21 23

135
APPENDIX I. DEMAND ELASTICITY MODELING
This section provides additional detail on specific aspects of the demand elasticity modeling developed
by Cadmus for estimating program free ridership.
Improvements in Data Collection
Improving upon the modeling completed in PY12, Cadmus and Ameren worked with the program
implementer, APT, to provide greater granularity in the data used in the PY13 price response model.
Specific improvements included:
More price variations in more products for most participating retailers;
Sales by retail store outlet, rather than retail chain; and
Lists of promotional activities by retail store outlet.
More Price Variation
In PY13, Cadmus used a more robust dataset (models with price variability were 83% for LEDs, 75% for
specialty bulb sales, and 56% for standard bulb sales) compared to PY12 (30% of LED and 20% of
specialty CFL sales had varying prices). Cadmus worked with APT and Ameren early in 2013 to increase
the amount of price variation over PY12. APT successfully renegotiated markdown levels f41or the vast
majority of products with most participating retailer’s midway through the program year.
This model does assume a constant elasticity since the sales at the original retail price are
unavailable. Any potential bias in the estimated elasticities could be mitigated in the future is price
variation both increases and decreases the price the consumer faces. Sales by Retail Outlet
In PY12, Cadmus performed the modeling using sales by retail chain, which captured average lift for
price changes across the retail chain. In PY13, however, Cadmus could capture the impacts of in‐store
promotions and promotional displays which occurs at the individual store level. As such, the model
could better estimate sales impacts directly associated with promotion and product placement.
Promotional Displays
APT also provided records of product displays collected by its field staff when they visited stores to
ensure compliance with contractual agreements negotiated with retailers. The field staff verifies prices,
product placements, and shelf signs indicating products included as part of Ameren’s Act On Energy
program. They also collect data that track whether or not program bulbs have been displayed in
prominent, promotional displays (e.g., clip strips, end caps, pallet displays).
Data provided at the storefront level included:
Retailer name
Store address
41 The elasticities estimated in the model are not linear but are a proportional change.

136
Date of store visit
Display type
Model Adjustments
Promotional Displays
Display data tracking does not include every participating storefront in every week of the program, but
rather includes a sample of stores within a given week. Given this timing, some weeks did not include
any indication whether products were displayed or not and included missing observations. Cadmus
verified with APT that the sample within a given week reflected stores visited at random.
Therefore, Cadmus imputed values for the missing weeks by assuming that, until another observation
indicated a change in displays within a given storefront, the previous observation would hold. That is, if
a given storefront used an end cap display in week five and did not display the product in week eight,
the display remained in place between week five and week seven, until the observed change in week
eight. Similarly, if weeks nine and ten were missing, analysis assumed display did not occur (an
assumption continued until data observed for another week again indicated a display in place).
Given only a subset of stores produced display data, the model could not include a variable controlling
for display. To correct for potential omitted variable bias, Cadmus estimated two models for the sample
of stores with display data: one with a variable controlling for the proportion of products in a
promotional display; and one with the display variable omitted. Analysis then calculated free ridership
ratios from each model and compared the results. The degree that they differed represented the
marginal impact of omitting the display variable. Therefore, the following bias‐adjustment factor
corrected final free ridership ratios (calculated with the full data set):
∗
∗
Stocking Issues
In preparing to model the sales data, Cadmus observed inexplicable, dramatic sales drops that did not
correspond to programmatic activity:
With a wholesale club, one model appeared to be phased out halfway through the year, and a
bulb sold in a four‐pack was replaced with a six‐pack. Costco sold both concurrently for a short
time, but phased out the four‐pack after a few weeks. Cadmus followed up with APT, asking if
notable program changes occurred at that retailer. APT confirmed that Feit experienced issues
in maintaining stock during the early fall at these stores, but was gearing up to meet demand
later in the fall.
A dollar store sold a single‐pack bulb at $0.50 per bulb, but sales declined sharply upon adding a
four‐pack to the program, selling for $0.25 per bulb.

137
Cadmus’ model implicitly assumed supply would always meet demand at the given price. This proved
true for virtually all products in the analysis. However, where stocking issues arose for bulbs, the
available data precluded separating these effects from the influence of program factors. Therefore, the
analysis excluded these bulbs as including these data would bias any elasticity estimates downward.
Brought‐In Products
Ameren works with some retailers to specially bring in discounted bulbs that otherwise would not be
stocked in a particular store. As with the PY12 analysis, bulbs sold at a dollar store received a zero free
ridership score, given that, without the program markdown, the store would not stock CFLs at all. In
addition, given target customer demographics, its shoppers would be less likely to shop elsewhere for
CFLs if discounted bulbs were unavailable.
The demand elasticity analysis included other brought‐in bulbs sold through the program (rather than
assigning zero free ridership). This resulted from the bulbs’ similarity to other program or non‐program
bulbs sold at those retailers or that would be sold at retailers where the same customers would likely
shop. Thus the decision to purchase one of these products depended on: whether the brought‐in bulb
proved less expensive than the alternatives; and whether the alternative would be another bulb on the
shelf next to the program bulb or at another retailer. If price differences presented the main factor
driving purchasing decisions, the study included the products in the demand elasticity model, as it
offered the most appropriate tool to measure program impacts.
For example, for customers purchasing a bulb through the Act On Energy web store, the online store
would not be available if the program did not exist. One can reasonably assume, however, that
customers probably would not limit their shopping to one website. Similarly, if customers could not
purchase a particular model from a participating wholesale club without the program, and the wholesale
club offered limited products as substitutes, customers reasonably could find a substitute product
through another retailer.
Notably, with EISA’s continued impacts and its banning the production of 60 watt incandescent bulbs in
2014, the above logic regarding zero free ridership eventually will fail to hold true even at dollar stores.
Once 60 watt incandescent bulbs no longer remain available, customers will have fewer choices for
inexpensive, inefficient, substitute products. Without an inexpensive substitute and in the program’s
absence, even dollar store shoppers would have to choose between a halogen bulb or a CFL. Given the
much smaller price differences between CFLs and halogen bulbs than between traditional incandescent
bulbs and CFLs (with program CFLs being less expensive than halogens in most cases), bringing bulbs to a
dollar store that would not otherwise stock them would very likely displace sales of other program bulbs
for another retailer.
Seasonality Adjustment
In any economic analysis, it is critical to separate data variations resulting from seasonality from those
resulting from relevant external factors. For example, suppose prices had been reduced on umbrellas at

138
the beginning of the rainy season. Any estimate of the impact of this price shift would be skewed if the
analysis did not account for the natural seasonality of umbrella sales.
Ideally, adjustment for seasonal variations in sales would derive from historical data on aggregate sales
of lighting products (e.g., inefficient and efficient, program and non‐program). These data would then
represent overall trends in lighting product sales and would not suffer from potential confounding with
programmatic activity.42
Unfortunately, such data currently remain unavailable. Consequently, the Cadmus team estimated the
seasonal trend using program product sales from the last year in which:
They were sold for the entire year; and
They experienced no price variations or promotional activities for the duration of the year.
Some marketing activity still could affect these sales, leading to underestimated program impacts.
Nevertheless, not controlling for seasonal variations could lead to program impact overestimates by
falsely attributing seasonal trends to price impacts (to the degree that they co‐vary). Absent a better
alternative, the team estimated model and subsequent FR ratios, including and excluding this seasonal
trend, assuming that biases in each approach would offset one other. In the future, the Cadmus team
will explore purchasing third‐party data on aggregate lighting sales (provided these become available).
Findings
Elasticities
Price elasticity of demand measures the percent change in the quantity demanded, given a percent
change in price. Due to the model’s logarithmic functional form, these simply represented the
coefficients for each price variable. In previous, similar analyses, the Cadmus team has seen elasticities
range from ‐1 to ‐3 for CFLs, meaning a 10% drop in price leads to a 10% to 30% increase in the quantity
sold. LED demand often proves much more sensitive to price, with elasticities ranging from ‐4 to ‐6. As
shown in Table 68, elasticity estimates largely fell within expected ranges. The relatively high elasticities
for specialty CFLs at DIY stores presented a notable deviation from this trend and could result from the
bridge year evaluation’s focus on specialties, which may have played a part in increasing customer
awareness regarding the products’ benefits.
42 This assumes aggregate lighting sales do not change due to promotions; that is, customers simply substitute
an efficient product for an inefficient one. While bulb stockpiling may occur during programmatic periods, this should be smoothed out over time, as the program does not affect the number of sockets in the home.

139
Table 68. Elasticity Estimates by Retail Channel and Bulb Type*
Store Type Bulb Type Pack Category Elasticity
DIY LED One ‐7.71
DIY Specialty Four to Eight ‐3.08
DIY Specialty Two to Three ‐2.69
DIY Specialty One ‐3.00
DIY Standard Four to Eight ‐0.84
DIY Standard Ten to Twelve ‐1.50
DIY Standard Two to Three ‐0.44
DIY Standard One ‐0.75
Non‐DIY LED One ‐5.81
Non‐DIY Specialty Four to Eight ‐1.59
Non‐DIY Specialty Two to Four ‐1.20
Non‐DIY Specialty One ‐1.51
Non‐DIY Standard Four to Eight ‐0.67
Non‐DIY Standard Ten to Twelve ‐1.33
Non‐DIY Standard Two to Four ‐0.28
Non‐DIY Standard One ‐0.59
*These elasticities are the average value across the seasonal and non‐seasonal models.
Program Price Impacts
Table 69 shows the sales‐weighted, average sale price, the original price, and the markdown within the
program, broken out by retail channel and bulb type. The table also shows the markdown as a share of
the original price.
Table 69. Mean Prices and Markdown by Retail Channel and Bulb Type
Store
Type
Bulb
Type
Mean Target
Price/Bulbhjuyyyjjj
Mean Regular
Price/Bulb
Mean Markdown/
Bulb
%
Markdown
DIY LED $ 12.06 $ 21.15 $ 9.08 43%
DIY Specialty $ 3.34 $ 4.98 $ 1.64 33%
DIY Standard $ 0.99 $ 2.08 $ 1.08 52%
Non‐DIY LED $ 6.90 $ 15.33 $ 8.42 55%
Non‐DIY Specialty $ 1.84 $ 3.71 $ 1.87 50%
Non‐DIY Standard $ 0.54 $ 1.70 $ 1.16 68%
The mass market retail channel, which includes some big box stores and club stores, exhibited
markdowns of 50% or greater per bulb for each type. LED products also featured prominently in the
program, with incentives of nearly 50% at both DIY stores and mass market stores.
As free ridership emerges as a function of the markdown (measured by price elasticity), aggressive
markdowns contribute to lower‐than‐average free ridership levels. The Cadmus team benchmarked
Ameren’s PY13 free ridership and incentives against other programs in the Benchmarking section.
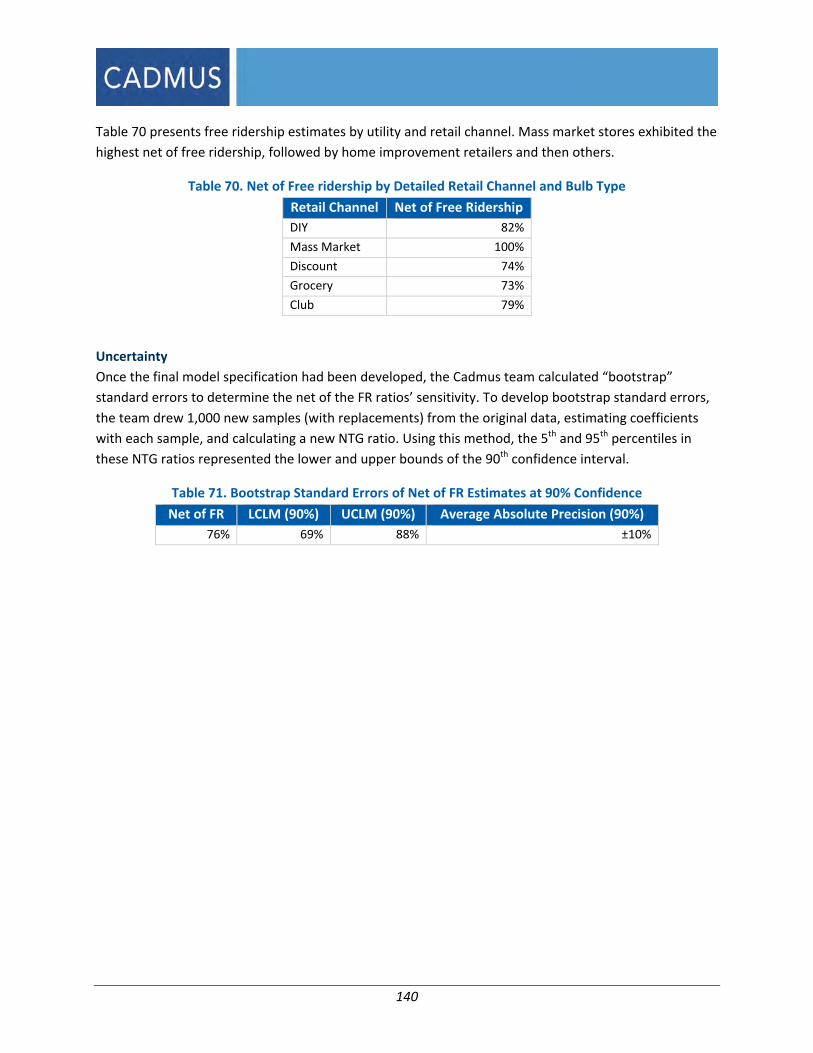
140
Table 70 presents free ridership estimates by utility and retail channel. Mass market stores exhibited the
highest net of free ridership, followed by home improvement retailers and then others.
Table 70. Net of Free ridership by Detailed Retail Channel and Bulb Type
Retail Channel Net of Free Ridership
DIY 82%
Mass Market 100%
Discount 74%
Grocery 73%
Club 79%
Uncertainty
Once the final model specification had been developed, the Cadmus team calculated “bootstrap”
standard errors to determine the net of the FR ratios’ sensitivity. To develop bootstrap standard errors,
the team drew 1,000 new samples (with replacements) from the original data, estimating coefficients
with each sample, and calculating a new NTG ratio. Using this method, the 5th and 95th percentiles in
these NTG ratios represented the lower and upper bounds of the 90th confidence interval.
Table 71. Bootstrap Standard Errors of Net of FR Estimates at 90% Confidence
Net of FR LCLM (90%) UCLM (90%) Average Absolute Precision (90%)
76% 69% 88% ±10%

141
APPENDIX J. SPILLOVER AND MARKET EFFECTS ANALYSIS
Ameren’s LightSavers program creates spillover and market effects by increasing the availability and
stocking of energy‐efficient light bulbs among retailers and by educating customers about the benefits
of using efficient lighting. The Cadmus team developed an approach to estimate these impacts, using
the methodology and resulting estimates detailed in this section. Analysis resulted in an overall NTG of
1.25, including nonparticipant lighting and non‐lighting spillover and market effects.
Overview
Spillover can be defined as: energy savings caused by (but not incented by) program activity during a
program’s implementation cycle. Spillover may occur due to the following:
Nonparticipants purchasing lighting products (for example, a customer indicating they
purchased a non‐incented specialty CFL after experiencing satisfaction with the performance of
a three‐pack of incented, standard CFLs); or
Nonparticipants purchasing non‐lighting products(those purchasing additional energy‐efficient
measures, with their actions influenced by knowledge they received from the program).
Per industry standard practice, evaluators quantify and apply spillover, when possible, to program
NTG ratios.
Market effects are systemic changes to standard business practices, resulting from program activities
and tending to persist long after the close of program interventions. The potential for DSM programs to
cause structural changes when intervening in a given market has become increasingly apparent as the
following has occurred:
Program delivery models have evolved (e.g., become more upstream‐focused programs);
Energy‐efficiency investments have grown dramatically; and
Programs have established long‐term relationships with key market actors and trade allies.
The LightSavers program works closely with retailers and manufacturers to:
Increase the availability and dedicated shelf space for efficient lighting products; and
Offer education to help retail staff communicate the value of efficient purchasing decisions to
local consumers.
LightSavers’ potential to generate market effects also has become readily evident, given its significant
role within Ameren’s 2013–2015 residential portfolio.
In addition, Act On Energy, Ameren’s umbrella marketing campaign, seeks to raise general awareness
about and adoption of energy efficiency, and, in doing so, create a more energy‐conscious customer
base, more likely to buy energy‐efficient lighting, whether or not it has been discounted through

142
Ameren’s program. Though this may result in higher free ridership over time, it should also result in
market effects.
Methodology The LightSavers spillover and market effects study relied on information drawn from two
research efforts:
The Cadmus team documented lighting inventories (not sales data) of one to three big box
stores from each chain in Ameren’s service territory (both participating and nonparticipating
stores) to estimate lighting stocking practices.43 This included collecting Inventory data from five
participating and two nonparticipating retail chains, representing the available “big box” store
chains in Ameren’s territory.
To assess energy‐efficiency lighting saturations, Cadmus conducted home inventories for a
sample of 172 Ameren customers, selected from a sample of customers noted as “willing to
participate” from Ameren’s 2012 Potential Study.
Retailer Inventory Methodology
The study’s initial plan was to request “snapshots” of lighting inventories from a sample of retail stores
to estimate lighting stocking practices, particularly to explore differences: in current stocking practices
for energy‐efficient products across Ameren’s service territory; and between retailers participating in
Ameren’s programs and those not participating. However, participating and nonparticipating retailers
were unwilling to directly provide inventory data. Alternatively, the Cadmus team collected inventory
data using an “in store” search option via the retailers’ websites.
The Cadmus team collected the following data, which will be tracked over following program years to
better understand market effects:
Lighting categories:
CFLs (specialty and standard)
LEDs (specialty and standard)
Fluorescents
Halogens (specialty and standard)
Incandescent (specialty and standard)
Manufacturers
Model numbers
Number of bulbs in packs
Prices (both retail and sales)
43 All participating and nonparticipating retailers analyzed for this study list individual store inventories online via
an “in store” search option.

143
Initially, the Cadmus team planned to inventory of three randomly selected store locations; however,
little variation emerged between individual stores. As such, the study randomly selected one store
location for each retailer, with the inventory of that store assumed to represent all store locations.
Saturation Study Methodology
Through site visits to 172 homes, the Cadmus team conducted a saturation study of efficient lighting
technologies. Data from this research effort were compared to 2010 results, which included a sample of
87 customers. The study gathered information on the number, type, and location of all lights within a
home (including those in storage). During each visit, the Cadmus team conducted short interviews with
residents. Results for 2010 and 2013 were weighted to the population, based on the proportion of
residents who own their homes.
Spillover and Market Effects Methodology
Figure 30 illustrates the theory behind DSM intervention in the market. Upfront prices most often limit
or slow adoption of energy‐efficient technologies. Through use of rebates or buydowns, DSM programs
lower prices from those charged before intervention (Ppre) to levels presumed acceptable to consumers
(Ppgm). At the same time, DSM programs work directly with manufacturers and retailers to increase the
supply of energy‐efficient technologies.
In theory, lowering the price should, in the short run, increase the quantity demanded from Qpre to
QPgm1.44 If a program does not affect the market, its price returns to Ppre and the quantity demanded
returns to Qpre upon the intervention’s close.
The more successfully a program raises consumer awareness of energy‐efficiency benefits (as shown
through increasing shelf space dedicated to energy‐efficient products, engaging trade allies, or similar
activities), the more the program will likely shift the demand curve from D1 to D2. Concurrently, the
more successfully a program increases shelf space dedicated to energy‐efficient products, engages trade
allies, or accomplishes similar activities, the more likely the supply curve will shift from S1 to S2. If
permanent, these shifts in supply and demand curves indicate market transformation and indicate
market effects. At the new demand curve, customers will purchase more CFLs at all price levels, and
more CFLs will become available for purchase. If market effects are ignored, this would show up as
increased free ridership over time.
In other words, the program’s direct impact can be measured as Qpgm1 ‐ QPre, but its long‐term market
effects can be measured as Qpgm2 ‐ Qpgm1 (as shown in Figure 30).
44 Economists call this “movement along the demand curve.”
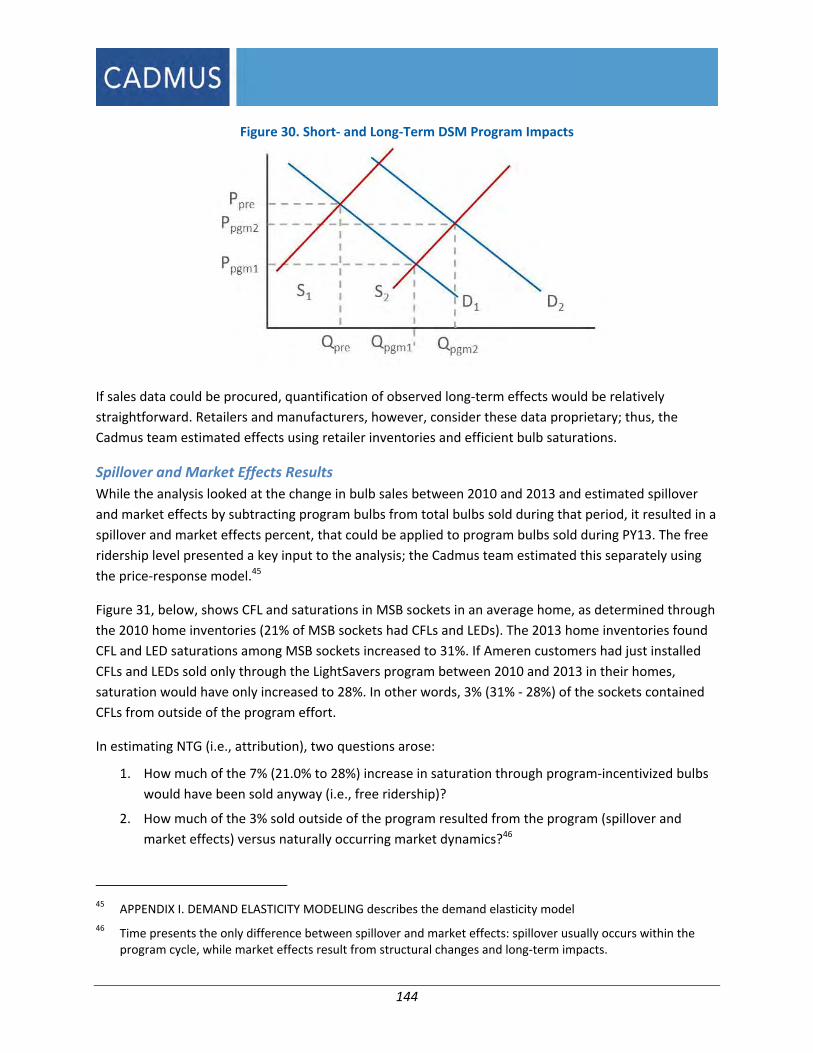
144
Figure 30. Short‐ and Long‐Term DSM Program Impacts
If sales data could be procured, quantification of observed long‐term effects would be relatively
straightforward. Retailers and manufacturers, however, consider these data proprietary; thus, the
Cadmus team estimated effects using retailer inventories and efficient bulb saturations.
Spillover and Market Effects Results
While the analysis looked at the change in bulb sales between 2010 and 2013 and estimated spillover
and market effects by subtracting program bulbs from total bulbs sold during that period, it resulted in a
spillover and market effects percent, that could be applied to program bulbs sold during PY13. The free
ridership level presented a key input to the analysis; the Cadmus team estimated this separately using
the price‐response model.45
Figure 31, below, shows CFL and saturations in MSB sockets in an average home, as determined through
the 2010 home inventories (21% of MSB sockets had CFLs and LEDs). The 2013 home inventories found
CFL and LED saturations among MSB sockets increased to 31%. If Ameren customers had just installed
CFLs and LEDs sold only through the LightSavers program between 2010 and 2013 in their homes,
saturation would have only increased to 28%. In other words, 3% (31% ‐ 28%) of the sockets contained
CFLs from outside of the program effort.
In estimating NTG (i.e., attribution), two questions arose:
1. How much of the 7% (21.0% to 28%) increase in saturation through program‐incentivized bulbs
would have been sold anyway (i.e., free ridership)?
2. How much of the 3% sold outside of the program resulted from the program (spillover and
market effects) versus naturally occurring market dynamics?46
45 APPENDIX I. DEMAND ELASTICITY MODELING describes the demand elasticity model
46 Time presents the only difference between spillover and market effects: spillover usually occurs within the program cycle, while market effects result from structural changes and long‐term impacts.

145
Figure 31. CFL Market Saturations
One method for solving this problem would use sales data for program and non‐program bulbs,
provided by Ameren and other non‐program areas. In the absence of ideal data, however, a procedure
had to be developed to allocate the 10% saturation increases to various drivers.
In doing so, the Cadmus team stipulated five kinds of CFL and LED buyers collectively causing
saturation increases:
1. Participant non‐free riders: they would not have purchased a CFL or LED without the program.
2. Participant free riders: they would have purchased a CFL or LED anyway.
3. Naturally occurring: those purchasing a CFL or LED outside of the program. These customers
very much resemble free riders. They did purchase CFLs or LEDs without the program (non‐
discounted). Free riders would have purchased CFLs or LEDs without the program (they just
happened to find them discounted).
4. Spillover: those making purchases driven by increased awareness arising from the program
within the current year. They bought CFLs or LEDs from nonparticipating stores or purchased a
particular CFL or LED not discounted by the program from a participating store.
5. Market effects: those “converted” to purchasing CFLs or LEDs by learning of them through the
program and through increased availability on the store shelf. They bought the CFLs or LEDs, but
they purchased them from nonparticipating stores or selected a non‐program CFL or LED at a
participating retailer.
The study’s attribution analysis approach divided the 10% rise in saturation into the five groups above.
For items 1 and 2, analysis used the 24% free ridership estimate, determined through the demand
elasticity model, to attribute how many program bulb purchases would be considered free riders (e.g.,
would have occurred without the program) and how many were influenced by the program.
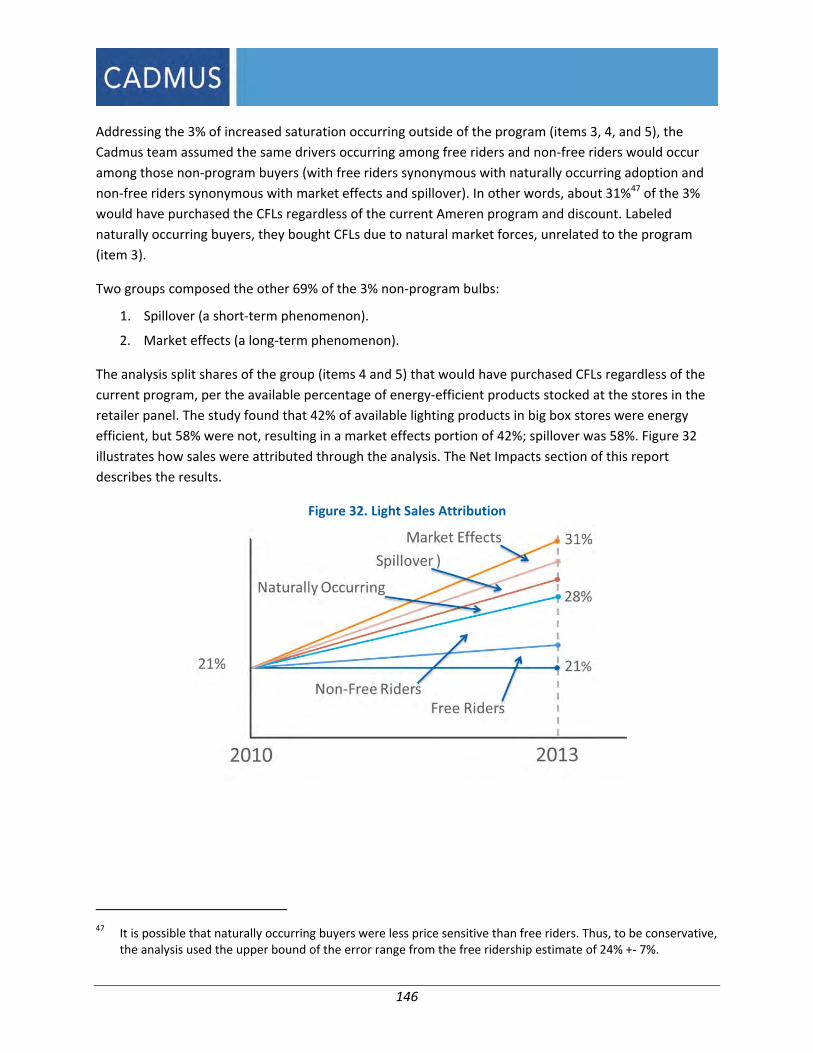
146
Addressing the 3% of increased saturation occurring outside of the program (items 3, 4, and 5), the
Cadmus team assumed the same drivers occurring among free riders and non‐free riders would occur
among those non‐program buyers (with free riders synonymous with naturally occurring adoption and
non‐free riders synonymous with market effects and spillover). In other words, about 31%47 of the 3%
would have purchased the CFLs regardless of the current Ameren program and discount. Labeled
naturally occurring buyers, they bought CFLs due to natural market forces, unrelated to the program
(item 3).
Two groups composed the other 69% of the 3% non‐program bulbs:
1. Spillover (a short‐term phenomenon).
2. Market effects (a long‐term phenomenon).
The analysis split shares of the group (items 4 and 5) that would have purchased CFLs regardless of the
current program, per the available percentage of energy‐efficient products stocked at the stores in the
retailer panel. The study found that 42% of available lighting products in big box stores were energy
efficient, but 58% were not, resulting in a market effects portion of 42%; spillover was 58%. Figure 32
illustrates how sales were attributed through the analysis. The Net Impacts section of this report
describes the results.
Figure 32. Light Sales Attribution
47 It is possible that naturally occurring buyers were less price sensitive than free riders. Thus, to be conservative,
the analysis used the upper bound of the error range from the free ridership estimate of 24% +‐ 7%.

147
Lighting Inventory Results To establish a foundation for understanding market effects over time, the Cadmus team analyzed
several themes using the inventory stocking data described above. This study concerned two general
themes: proportions of energy‐efficient bulb types and average prices of bulb types.
First, lighting category data were used to determine the proportions of: energy‐efficient bulbs (e.g.,
CFLs, LEDs, and fluorescents) overall, for participant and nonparticipant stores; and bulb types by
participant and nonparticipant stores. The data were weighed by how many stores each the retailer
operated within Ameren’s territories, presenting a clearer representation of the entire lighting market.
Figure 33 and Figure 34 present the percentage of energy‐efficient light bulbs by participant and
nonparticipant stores. For participant retailers, energy‐efficiency bulbs made up 44% of their lighting
inventories, compared to 31% with nonparticipant retailers. Combining participant and nonparticipant
stores (weighted by the number of stores in Ameren’s territory) resulted in an overall average of 42%.
Figure 33. Proportion of Energy‐Efficient Bulbs Among Participant Stores

148
Figure 34. Proportion of Energy‐Efficiency Bulbs Among Nonparticipant Stores
Figure 35 compares the proportion of bulbs by type between participant and nonparticipant retailers.
Specialty incandescent bulbs made up the largest portion of participant and nonparticipant inventories,
at 39% and 27%, respectively. For energy‐efficient bulb types (e.g., CFLs, LEDs, and fluorescents), the
two store types’ inventories varied significantly, except for specialty CFLs (which remained even at 13%
for both store types). Clearly, participant retailers stocked more energy‐efficient light bulbs than
nonparticipants.
Figure 35. Proportion of Bulbs by Type Between Participant and Nonparticipant Retailers
The second part of the analysis concerned light bulb pricing for both store types, designed to determine
whether the program effectively reduced the cost of energy‐efficient bulbs among participant retailers
in Ameren’s territories.

149
The Cadmus team also reviewed past evaluations that asked retailers to estimate the proportion of their
store’s inventory was made up of: CFLs, incandescent bulbs, fluorescents, LEDs, or other. While the
sample make‐up and data collection methods varied between the earlier and current evaluations,
participant and nonparticipant retailers in the PY1 study from 2009 reported an average of 35% and 25%
CFLs in their inventories, respectively—both amounts lower than current values determined through
Internet analysis.
Figure 36 presents a comparative analysis of average bulb prices by type between participant and
nonparticipant retailers.
Figure 36. Average Bulb Price by Bulb Type Between Participant and Nonparticipant Stores
For energy‐efficient bulbs, participant retailers’ standard CFL bulbs cost $1.91 less, on average, than
nonparticipant retailers’, and $2.49 less for specialty CFL bulbs. EISA‐compliant halogens (replacing
incandescents) also were lower priced in participating stores: $1.96 versus $2.72 in the nonparticipant
stores. Traditional standard incandescent bulbs were less expensive in nonparticipating stores,
averaging $1.32 compared to $1.56 in participating stores. Nonparticipating stores did not carry
standard LEDs.
Participating retailers offered several standard CFL bulbs at $.50 per bulb or less, but also offered some
as expensive as many sold at nonparticipating retailers, with the most expensive standard CFL priced at
$9.97. The lowest‐price standard CFL at nonparticipating stores was $1.60 and the highest‐priced was
$11.49. Figure 37 and Figure 38 show how price distribution compares between participant and
nonparticipant stores for standard and specialty CFLs.

150
Figure 37. Frequency Distribution of Standard CFL Prices
Figure 38. Frequency Distribution of Specialty CFLs

151
APPENDIX K. MARKETING FINDINGS
This appendix presents preliminary findings and high‐level recommendations for Ameren’s LightSavers
marketing efforts. In conducting these activities, the Cadmus team sought to achieve the following:
Assess current (PY13) LightSavers program marketing;
Compare outreach efforts to industry best practices; and
Identify gaps and/or opportunities for Ameren’s consideration in marketing the program during
PY14 and beyond.
As part of this effort, the Cadmus team conducted the following:
A marketing materials review;
A program marketing interview with key Ameren staff; and
A follow‐up interview with implementation contractor marketing staff in support of the PY13
LightSavers process evaluation.
The interim findings and recommendations included in this section will be synthesized with any
additional marketing‐related findings gained from year‐end activities (Wave 2 PY13 interviews and
surveys) and will be formalized for inclusion in the final PY13 LightSavers evaluation report.
METHODOLOGY The Cadmus team developed its preliminary program marketing findings, conclusions, and
recommendations through the following process evaluation activities.
Stakeholder Interviews In addition to a review of findings, drawn from previously completed Wave 1 interviews, the Cadmus
team conducted the following, marketing‐specific interviews to achieve a broader understanding of the
marketing planning, coordination, and outreach efforts for the LightSavers Program:
Key Ameren Staff:
Interviews included key Ameren marketing, energy‐efficiency, and corporate
communications staff, in conjunction with the cross‐cutting evaluation efforts.
Program Implementer:
Ameren works with third‐party contractors—APT and EFI—in implementing the LightSavers
Program. Interviews included APT staff responsible for program marketing management.
Prior to conducting the interviews, the Cadmus team prepared an interview guide, consisting of
questions designed to elicit comprehensive information about planning, design, execution, results, and
opportunities resulting from implementation of PY13 LightSavers marketing efforts. Ultimately, these
questions sought to gather insights that would potentially inform planning efforts for the coming
program year (PY14).

152
Materials Review The Cadmus team worked with Ameren to collect copies of the existing PY13 LightSavers’ marketing
materials as well as any available planning or strategy documents, such as marketing plans and recaps,
and marketing metrics tracking reports. In doing so, the team collected and reviewed the following
LightSavers marketing materials to assess the program’s marketing efforts and to identify potential
opportunities for optimizing marketing, outreach, and communications.
LightSavers Program Specific Marketing References The review included the following program marketing resources, developed by APT and provided
by Ameren:
2013 Ameren LightSavers Overall Marketing Plan
2013 Marketing Materials:
Ameren Special Pricing Labels
Ameren Coupons and Holder ($1.50 and $4.00)
POP Materials PDF, including: Special Pricing Signage, Beam Sign, CFL “How to Choose”
informational sheet, and promotional templates.
Figure 39. PY13 Marketing Materials
Act On Energy Campaign and Program Marketing References As the portfolio‐wide Act On Energy campaign promoted various programs throughout the year, the
Cadmus team reviewed the following resources, provided by Ameren:
Ameren Energy Efficiency Segmentation Study–Shelton Group (7/2013)
Ameren DSM Potential Study Preliminary Results (9/2013)
Act On Energy Summer Awareness Campaign Results (9/2013)
Q2 2013 EM&V Update to Stakeholders (9/2013)

153
HIS Residential Survey
As LightSavers operates as an upstream program, the Cadmus team did not conduct a customer survey.
Rather, the team is conducting a residential survey of the Ameren general population, which included
general program awareness information. The findings presented in this section specifically relate to
program marketing and outreach for meeting program marketing evaluation objectives. The full, general
population survey results are included in the final report.
FINDINGS Upon completing the above‐cited preliminary research activities, the Cadmus team identified the
following high‐level findings for Ameren’s LightSavers program marketing efforts.
Strategy Overview and Planning Since 2009, APT has implemented Ameren’s Lighting and Appliance programs. As of PY12, the two
programs began individual execution. In late 2012, an Ameren rebrand effort renamed the programs
LightSavers and RebateSavers, respectively.
Notably, relative to program marketing efforts, the program came off a program bridge year (PY12 to
PY13), which caused a delayed launch earlier in the year. While stakeholders reported the program
performed well, they also noted several challenges relating to customer education and awareness. The
two main concerns expressed in Wave 1 interviews included EISA legislation implications and the price
of LEDs. In part, stakeholders emphasized the importance of program marketing efforts to educate
customers on the benefits of energy‐efficiency lighting and to help them understand the technology; so
they could make informed purchasing decisions.
As with many programs, interviews with stakeholders revealed that, while the implementer developed
and executed the program‐specific marketing tactics, the Ameren program manager and staff remained
involved and supportive throughout the planning process. Stakeholders reported weekly conference
calls to coordinate efforts between Ameren and the implementer, along with daily e‐mail exchanges and
phone calls to facilitate management of ongoing program implementation efforts.
Regarding program marketing efforts for LightSavers and RebateSavers programs, APT primarily advised
the client on in‐store marketing, including: management of relationships with retailers, oversight of
materials, and negotiation of store placements. The LightSavers program sought to offer incentives that
encouraged customers to purchase technologies that could save money, improve comfort, and save
energy. The proposed marketing plan discussed the delivery of visually stimulating educational materials
that would: build upon and reinforce the ENERGY STAR and Ameren brands, engage and influence the
buying process, and incorporate a call to action.
Program‐Specific Marketing Design and Execution
Ameren provided program implementers with Act On Energy brand guidelines and marketing templates
to ensure program and campaign materials delivered a consistent brand and message across all
programs and advertisements. The program implementer found the guidelines comprehensive, concise,

154
and easy‐to‐follow. Upon development of creative materials, the program implementer worked closely
with the Ameren program manager to manage the workflow of the Ameren review process, ensuring all
parties had an opportunity to provide feedback.
Act On Energy Campaign and Research
Although retailers served as the primary means for generating awareness about the LightSavers
program, Ameren conducted portfolio‐wide marketing activities to promote the Act On Energy brand
and individual programs.
Ameren staff focused the campaign on the development of innovative and integrated platforms to drive
program participation across the portfolio. The effort promoted the Act On Energy brand (generally) and
specific programs, using a variety of media and varying the timing of messaging.
In June through August, the corporate marketing team dedicated its Act On Energy marketing and media
to ApplianceSavers, CoolSavers, and LightSavers. They sought to increase mass awareness of the
programs throughout the Ameren service territory, and to increase program participation specifically for
the featured programs during the summer months. (While this effort included the LightSavers program,
the campaign primarily focused on the ApplianceSavers and CoolSavers programs.) The campaign
included: radio spots, digital billboards, out‐of‐home billboards, transit windscreens, animated and static
banner advertisements, social media, direct mailers, gas toppers, e‐mail marketing, and more.
As part of this effort, Ameren conducted segmentation, potential, and usability studies to inform
program design and outreach efforts. The segmentation study, conducted by the Shelton Group,
revealed the following high‐level findings relating to LightSavers marketing and Ameren
customers overall:
Only 44% of customers knew of Ameren’s energy‐efficiency rebates/incentives.
Over one‐half of Ameren customers likely needed to install more CFLs in their homes.
Energy efficiency and saving money served as the top drivers for installing CFLs.
Hardware and retail stores were the top two places that Ameren customers shopped for CFLs
(as opposed to club stores, discount stores, drug stores, and grocery stores).
Those more likely to purchase CFLs instead of incandescent bulbs with rebates conformed to the
following profile (compared to overall customers surveyed):
Demographic profile:
Equally likely to be male or female.
Ages 18–34 (34% vs. 30% overall).
Education closely mirrors the overall population.
Slightly more likely to have a household income of $35,000–$50,000 (20% vs.
17%, overall).

155
Shelton segmented the target audience as follows: predominantly Concerned Parents (30%),
but more likely than the overall population to be Working Class Realists (29% vs. 25%
overall). Collective characteristics, values, and attitudes for these segments included
the following:
Marketing channel preferences for Shelton’s target segments included: a personal
energy report, social media, direct mail, Internet searches, word‐of‐mouth, and
Ameren’s website.
Potential participants were more likely than the overall population to choose the
Performance/Waste (25%) and Environment (21%) messages, developed by the
Shelton Group:
Shelton’s Performance/Waste Message: “You take your responsibilities seriously and
take pride in your home. Making energy‐efficient home improvements is the best
way to make sure that your home is operating at peak efficiency and that you’re not
wasting your hard‐earned resources.”
Shelton’s Environmental Message: “Reducing your energy consumption is one of the
most important things you can do to help protect the environment. When you use
less energy, you’re helping to slow the impact of the climate crisis and conserve
natural resources”
Survey Findings
The Cadmus team reviewed the following results from the residential survey:
When asked if they were aware that Ameren offered discounts on energy‐saving light bulbs sold
at local stores, 69% of customers responded they were not aware. In comparison to the store
intercept survey, conducted in PY10, awareness of the CFL program increased (92% of
customers surveyed were not aware of Ameren’s CFL program, although a different data
collection approach produced these result).
As expected, 35% of respondents indicated they learned of the program through signs at retail
outlets, followed by “in my energy bill” (22%).