AMER SPORTS 2013 Continued growth and …s3-eu-west-1.amazonaws.com/amersports/uploads/...driving...
28
AMER SPORTS 2013 Continued growth and improving profitability January 28, 2014, Heikki Takala, President and CEO
Transcript of AMER SPORTS 2013 Continued growth and …s3-eu-west-1.amazonaws.com/amersports/uploads/...driving...

AMER SPORTS 2013
Continued growth and improving
profitability
January 28, 2014, Heikki Takala, President and CEO
Amer Sports Financial Statements
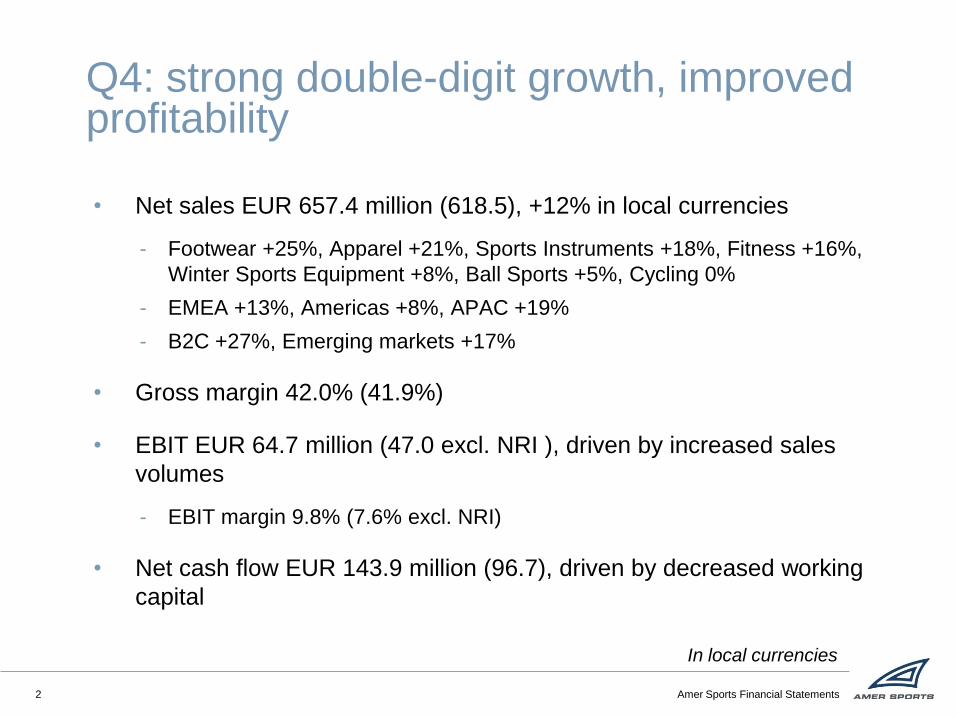
• Net sales EUR 657.4 million (618.5), +12% in local currencies
- Footwear +25%, Apparel +21%, Sports Instruments +18%, Fitness +16%,
Winter Sports Equipment +8%, Ball Sports +5%, Cycling 0%
- EMEA +13%, Americas +8%, APAC +19%
- B2C +27%, Emerging markets +17%
• Gross margin 42.0% (41.9%)
• EBIT EUR 64.7 million (47.0 excl. NRI ), driven by increased sales
volumes
- EBIT margin 9.8% (7.6% excl. NRI)
• Net cash flow EUR 143.9 million (96.7), driven by decreased working
capital
Q4: strong double-digit growth, improved profitability
In local currencies
2

Amer Sports Financial Statements
• Record net sales EUR 2,136.5 million (2,064.0), +8% in local currencies
- Apparel +21%, Sports Instruments +17%, Fitness +13%, Footwear +11%
- Winter Sports Equipment 3%, Ball Sports +1%, Cycling +1%
- EMEA +8%, Americas +5%, APAC +15%
- B2C +32%, Emerging markets growth +21%
• Gross margin 43.6% (43.6%): last year level safeguarded despite
increased air freight and currency headwinds
• EBIT EUR 154.9 million (138.7 excl. NRI), EBIT margin 7.3% (6.7% excl.
NRI)
- Driven by increased sales volumes
- OPEX 37.0% (37.7%). Strategic OPEX investments continued
• Dividend proposal EUR 0.40 per share (0.35)
2013: broad-based and profitable growth
3
In local currencies

Amer Sports Financial Statements
Record sales improved profitability
EUR million 2013 2012 Ch % Ch %*
Net sales 2,136.5 2,064.0 4 8
Gross profit 932.2 900.6 4 7
Gross profit, % of net sales 43.6 43.6
EBIT excluding non-recurring items 154.9 138.7 12
EBIT % excluding non-recurring items 7.3 6.7
Non-recurring items 0.0 -24.8
EBIT total 154.9 113.9 36
Net cash flow after investing activities 42.5 71.8
*) In local currencies
4

Amer Sports Financial Statements
• Operating expenses increased by EUR 41 million in local currencies
• Continuous investments into future growth with focus on softgoods, sales
coverage, emerging markets and business to consumers
• Restructuring continued, impacts maintenance OPEX
Continuous investments into future growth
EUR million 2013 2012 2011
Topline driven OPEX increase 22.5 10.3 19.1
Investment OPEX increase 20.9 31.9 26.1
Maintenance OPEX increase -2.3 10.9 3.7
Total increase in OPEX 41.1 53.1 48.9
In local currencies
5
Amer Sports Financial Statements
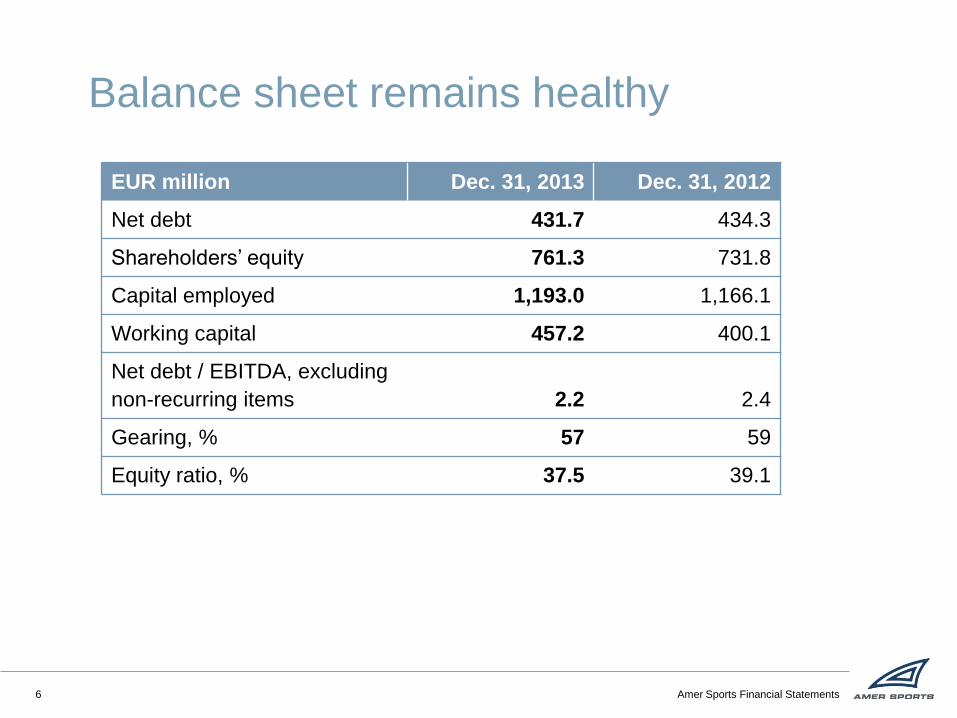
Balance sheet remains healthy
EUR million Dec. 31, 2013 Dec. 31, 2012
Net debt 431.7 434.3
Shareholders’ equity 761.3 731.8
Capital employed 1,193.0 1,166.1
Working capital 457.2 400.1
Net debt / EBITDA, excluding
non-recurring items 2.2 2.4
Gearing, % 57 59
Equity ratio, % 37.5 39.1
6

Amer Sports Financial Statements
Strong cash flow in Q4
-150
-100
-50
0
50
100
150
Q1-11 Q2-11 Q3-11 Q4-11 Q1-12 Q2-12 Q3-12 Q4-12 Q1-13 Q2-13 Q3-13 Q4-13
MEUR
7
H2: EUR -41m H2: EUR +19m H2: EUR +25m

Amer Sports Financial Statements
No significant mid-term refinancing needs
8
• Cash EUR 270.0 million and
unused committed facilities
EUR 240 million (December
31, 2013)
• Commercial paper program
EUR 500 million, of which
EUR 119.6 million issued
• Scheduled long-term
payments in 2014 EUR 62.5
million and in 2015 EUR
157.4 million
• Average interest rate of the
loan portfolio is 3.5% (3.6)
0m
25m
50m
75m
100m
125m
150m
175m
200m
225m
2014 2015 2016 2017 2018=>
Pension Loan Bonds Bank loans Commercial Papers Other

Amer Sports Financial Statements
Summary: progress vs. financial targets
9
TARGET 2009 2010 2011 2012 2013
Growth Organic FX-neutral
5% annual growth -6% 8% 9% 5% 8%
Profitability EBIT of at least 10%
of net sales 3.2% 6.2% 7.2% 6.7% 7.3%
Cash Flow Annual free cash flow
equal to net profit 4.5X 0.7X -0.2X 0.9X 0.5X
Balance
Sheet
Net Debt/EBITDA ratio
at or below 3X 3.6X 2.2X 2.3X 2.4X 2.2X
OUTLOOK

Amer Sports Financial Statements
• Amer Sports expects global trading conditions to remain
challenging, with some regional improvements.
• In 2014, Amer Sports’ net sales growth in local currencies is
expected to meet at minimum the company’s long-term annual
5% growth target and EBIT excluding non-recurring items is
expected to improve from 2013.
• The company will continue to focus on softgoods growth,
consumer-driven product and marketing innovation, commercial
expansion and operational excellence.
Outlook for 2014
11

WE CONTINUE MOVING

Amer Sports Financial Statements
• Majority of businesses improving according to their portfolio role,
driving scale and synergies
- Strong growth in softgoods (EUR 715 million), emerging markets, B2C, etc.
- Winter Sports Equipment: increasingly sustainable model
- Sports Instruments and Fitness turnaround continued
- Now major focus on improving Ball Sports and realizing further portfolio
synergies
• Our consumer marketing and product innovation pipeline increasingly
focused on “surrounding the consumer” with head-to-toe solutions
• Continuous improvement in Go to Market: distribution quantity and
quality, good progress on B2C
• All operations improving their KPIs
We continue to make solid progress in our strategic priorities
13

Amer Sports Financial Statements
Clarify future direction &
deliver the year
Repeatable business
model
Build critical capabilities,
allocate resources and
reignite growth
• Clarify priorities, set
direction
• Continue to drive profit
recovery, deliver the year
• Continue the work on
operational efficiency &
margins improvement
• Build capabilities:
• Softgoods
• Category based development
• Go to market
• Drive organic growth:
softgoods, Russia, China, BtoC,
etc.
• Operational excellence, WSE
efficiency & profitability
• Grow the core
• Hardgoods
• Big countries
• Add more
• Softgoods
• Emerging markets
• Own retail
• Learn for future
• Next growth categories
(accessories, action
sports, Digital)
~2010
~2011...2012
~2013-
Prioritized, sequenced program
14


APPENDIX

Amer Sports Financial Statements
Net sales and EBIT breakdown (MEUR)
17
NET SALES 2013
Q4/
2013
Q3/
2013
Q2/
2013
Q1/
2013 2012
Q4/
2012
Q3/
2012
Q2/
2012
Q1/
2012
Winter and
Outdoor 1,289.5 433.7 420.6 168.7 266.5 1,221.2 402.8 411.0 150.9 256.5
Ball Sports 551.0 126.1 116.7 144.2 164.0 569.7 127.7 121.9 146.5 173.6
Fitness 296.0 97.6 71.6 64.3 62.5 273.1 88.0 69.0 56.4 59.7
Total 2,136.5 657.4 608.9 377.2 493.0 2,064.0 618.5 601.9 353.8 489.8
EBIT 2013
Q4/
2013
Q3/
2013
Q2/
2013
Q1/
2013 2012*
Q4/
2012*
Q3/
2012
Q2/
2012
Q1/
2012
Winter and
Outdoor 127.0 52.5 87.4 -27.1 14.2 113.8 41.7 86.8 -25.4 10.7
Ball Sports 27.0 3.9 -2.1 7.8 17.4 28.0 1.0 -2.6 9.7 19.9
Fitness 24.4 14.3 6.2 4.3 -0.4 17.0 7.9 4.2 1.0 3.9
Headquarters -23.5 -6.0 -9.0 -3.7 -4.8 -20,1 -3.6 -7.1 -4.5 -4.9
Total 154.9 64.7 82.5 -18.7 26.4 138.7 47.0 81.3 -19.2 29.6
* Excluding non-recurring items

Amer Sports Financial Statements
Business area net sales in Q4 and 2013
MEUR
Q4/
2013
Q4/
2012
Ch
%
Ch
%* 2013 2012
Ch
%
Ch
%*
Winter Sports Equipment 208.6 203.2 3 8 416.7 425.0 -2 3
Footwear 73.4 60.7 21 25 341.2 314.4 9 11
Apparel 86.9 77.0 13 21 285.4 248.6 15 21
Cycling 30.8 31.8 -3 0 128.2 129.0 -1 1
Sports Instruments 34.0 30.1 13 18 118.0 104.2 13 17
Individual Ball Sports 59.7 61.8 -3 3 306.0 318.8 -4 0
Team Sports 66.4 65.9 1 7 245.0 250.9 -2 1
Fitness 97.6 88.0 11 16 296.0 273.1 8 13
Total 657.4 618.5 6 12 2,136.5 2,064.0 4 8
18
* In local currencies

Amer Sports Financial Statements
Net sales +10+%
• Apparel +21%. Both Salomon and Arc’teryx grew
• Sports Instruments +17% driven by the Suunto Ambit product family and market expansion
• Footwear +11%. All product segment and regions grew, strong growth in US
• Winter Sports Equipment +3%. Strong growth in alpine boots and cross country
• Cycling +1%, softgoods +14%
EBIT was EUR 127.0 million (113.8, excl. NRI)
• Increased sales volumes
• Increased operating expenses due to sales and distribution costs
Winter and Outdoor in 2013 (2012)
19
0
50
100
150
200
250
300
350
400
450
500
Net sales
-40
-20
0
20
40
60
80
100
EBIT excluding
non-recurring itemsMEUR MEUR
416.5
45.0 61.2
Q4/10 Q4/11 Q4/10 Q4/11
Q4/12
375.0
Q4/12
402.8
41.7
Q4/13
433.7
Q4/13
52.5

Amer Sports Financial Statements
Net sales remained at previous year’s level
• Americas and EMEA flat, 6% growth in APAC
• Individual Ball Sports 0%. Tennis rackets flat, growth in tennis balls
• Team Sports +1%. Baseball trade conditions normalized
EBIT was EUR 27.0 million (28.0 excl. NRI)
Ball Sports 2013 (2012)
20
0
20
40
60
80
100
120
140
160
180
Net sales
-5
0
5
10
15
20
25
EBIT exludingnon-recurring items
MEUR MEUR
107.3
-2.7
Q4/10 Q4/10
Q4/11
109.0
Q4/11
-0.7
Q4/12 Q4/12
127.7
1.0
Q4/13
126.1
Q4/13
3.9

Amer Sports Financial Statements
Net sales +13%
• EMEA +14%, the Americas +8%, APAC +39%
EBIT was EUR 24.4 million (17.0 excl. NRI)
• Increased sales volumes and improved gross margins were partly offset by higher operating expenses due to sales and distribution costs
Fitness 2013 (2012)
21
0
20
40
60
80
100
120
Net sales
-6
-4
-2
0
2
4
6
8
10
12
14
16
EBIT excluding
non-recurring itemsMEUR
MEUR
59.6 4.3 4.5
Q4/10
Q4/10 Q4/11
72.9
Q4/11
Q4/12
Q4/12
88.0 7.9
Q4/13
97.6
14.3
Q4/13

Amer Sports Financial Statements
Foreign currency translation difference
22
EUR million 2013 2012
Business Area Reported Reported Local
Currency
Translation
Difference
Winter Sports Equipment 416.7 425.0 404.9 -20.1
Footwear 341.2 314.4 308.2 -6.2
Apparel 285.4 248.5 235.3 -13.2
Cycling 128.3 129.0 126.8 -2.1
Sports Instruments 118.1 104.2 100.7 -3.6
Winter & Outdoor 1,289.5 1,221.2 1,176.0 -45.2
Individual Ball Sports 306.0 318.8 306.0 -12.8
Team Sports 245.0 250.9 241.7 -9.2
Ball Sports 551.0 569.7 547.7 -22.0
Fitness 296.0 273.1 262.7 -10.5
Total 2,136.5 2,064.0 1,986.3 -77.7

Amer Sports Financial Statements
Net sales by region (MEUR)
MEUR 2013
Q4/
2013
Q3/
2013
Q2/
2013
Q1/
2013 2012
Q4/
2012
Q3/
2012
Q2/
2012
Q1/
2012
EMEA 1,025.2 338.6 301.6 144.5 240.5 962.7 305.3 297.6 133.1 226.7
Americas 839.4 229.3 237.2 177.6 195.3 834.1 224.8 236.2 167.4 205.7
Asia Pacific 271.9 89.5 70.1 55.1 57.2 267.2 88.4 68.1 53.3 57.4
Total 2,136.5 657.4 608.9 377.2 493.0 2,064.0 618.5 601.9 353.8 489.8
23

Amer Sports Financial Statements
Sales development by region
24
39 %
48 %
13 %
Sales development by region in 2013
Winter and Outdoor Ball Sports Fitness Total
1,289.5
65 %
21 %
14 %
551.0 296.0 2,136.5
Americas EMEA Asia Pacific
23 %
65 %
12 %
EMEA Americas Asia Pacific Total
MEUR Ch, %* MEUR Ch, %* MEUR Ch, %* MEUR Ch, %*
Winter and Outdoor 830.3 9 300.0 9 159.2 15 1,289.5 10
Ball Sports 116.8 0 356.8 0 77.4 6 551.0 1
Fitness 78.2 14 182.6 8 35.2 39 296.0 13
Total 1,025.2 8 839.4 5 271.9 15 2,136.5 8
62 %
26 %
12 %

Amer Sports Financial Statements
Balance sheet
MEUR Dec. 31, 2013 Dec. 31, 2012
Goodwill and other intangible non-current assets 486.2 500.5
Tangible non-current assets and other non-current assets 269.5 282.8
Inventories and work in progress 355.1 336.7
Receivables 649.1 607.8
Cash and cash equivalents 270.0 142.5
Shareholders’ equity 761.3 731.8
Interest bearing liabilities 701.7 576.8
- Long-term 517.9 378.2
- Current 183.8 198.6
Other liabilities 566.9 561.7
Total 2,029.9 1,870.3
25

Amer Sports Financial Statements
• Heikki Takala, President and CEO, tel. +358 9 7257 8210
• Jussi Siitonen, CFO, tel. +358 9 7257 8212
• Samppa Seppälä, Corporate Communications and IR,
tel. +358 9 7257 8233
www.amersports.com
Contact information
26

www.amersports.com Disclaimer Statements in this presentation, which are not historical facts, such as expectations, anticipations, beliefs and estimates, are forward-looking statements within the meaning of the United States Private Securities Litigation Reform Act of 1995. Such statements involve risks and uncertainties which may cause actual results to materially differ from those expressed in such forward-looking statements. Amer Sports assumes no responsibility to update any of the forward-looking statements contained herein. No representation or warranty, express or implied, is made or given by or on behalf of Amer Sports or its employees or any other person as to the accuracy, completeness or fairness of the information or opinions contained in this presentation.