
AmCham Romania Competitiveness Report, 2016 Edition
60
-
Upload
amchamromania -
Category
Business
-
view
138 -
download
0
Transcript of AmCham Romania Competitiveness Report, 2016 Edition

coperta EN:report 3/22/2016 8:53 AM Page 1

Special acknowledgments to the Competitiveness Report Team:
Ileana Gutu, Senior Manager, PwC Romania
(Project Leader, Data Collection, Executive Summary, Research & Policy Analysis)
Sinziana Pardhan (Frangeti), Associate Director, Investment Services, Colliers International
(Executive Summary & Policy Analysis)
Andreea Manole, Global Commercial Operations Lead, Pfizer Romania
(Statistical Analysis for the Executive Survey & Policy Analysis)
Ciprian Gorita, Senior Manager, Public Sector Advisory, KPMG Romania (Legal & Regulatory Framework)
Florin Deaconescu, Partner, PwC Romania (Executive Summary & Policy Analysis)
Anca Harasim, Executive Director, AmCham Romania (Report Aggregation)
Ana-Maria Dorobat, Advocacy & External Relations Manager, AmCham Romania (Report Coordination & Aggregation)
Remus Ghiuzeli, Managing Director, Veritas Romania (Design & Layout)
Mark Percival, Business Writer, KPMG Romania (Proofreading & Translation)
Carmen Sbarna, Senior Translator, KPMG Romania (Proofreading & Translation)
Supervising Members of the Board:
Daniela Nemoianu, AmCham President, Executive Partner, KPMG Romania
Nolan Townsend, Country Manager, Pfizer Romania
Special Reviewers:
Vasile Puscas, Professor, Director of the Institute of European Research, Babes-Bolyai University
Adrian Curaj, Minister of National Education
Laurentiu Dinu, Managing Partner, European Advisory Services and Research, Romania
Radu Tatucu, Financial Sector Specialist, The World Bank, Washington D.C.
AmCham Board of Directors:
Daniela Nemoianu, KPMG Romania, President
Jacopo Murzi, Janssen, Vice-President
Ionut Simion, PwC Romania, Vice-President
Catalin Velescu, 3M Romania, Board member
Ion-Toni Teau, CNTEE Transelectrica, Board member
Juraj Barus, IBM Romania, Board member
Cristian Colteanu, General Electric International, Board member
Kostas Loukas, Microsoft Romania, Board member
Nolan Townsend, Pfizer Romania, Board member
Jim Kearney, UPS, Board member
With the support of:
coperta EN:report 3/22/2016 8:53 AM Page 2
Romania benefits from remarkable potential for development
and the current circumstances point to investment opportunities
in various sectors that are being revamped. Under the pressure
of complex and accelerated global changes, Romania’s efforts
to gain a competitive edge must be scaled up and strategically
upheld to be aligned more efficiently to international geo-political,
economic and technological developments.
Impact of global mega-trends on Romania
Global reality and macroeconomic studies highlight the existence of extremely strong forces for change, such as massiveurbanization with a focus on smart cities, the impact of demographics (with reference to countries such as China, Indiaetc., but a reverse trend as well, insofar as some of the EUcountries are concerned), the tsunami wave in technologydevelopment with an impact on extended interconnectivity, aswell as critical challenges such as climate change (the recentCOP21 Agreement being a momentous turning point towardsglobally concerted, responsible actions), the severe scarcity ofresources and the shift in the centers of economic power, allthese generating structural systemic effects.
Romania is part of this dynamic matrix and cannot afford toignore the overall effects or the prospects taking shape. Prioritiesare manifold, while the budget remains highly strapped forRomania in 2016–2020. Whether it is about transport corridors,the development of energy or cyber security projects, nuclearreactors, rehabilitation of irrigation systems or about floodprevention, modernization of ports, airports and railways, healthresorts or the ELI nuclear physics mega-research project, healthand education, to which we can add regional and local projects,all require an extended exercise of systemically sustainablestrategic projections, enhanced administration and managementcapabilities from the public authorities and institutions,specialized and dedicated resources, the capacity to comeforward with viable and bankable projects, as well as efficiencyand transparency at all levels and during all stages.
Romania’s transformation
The world is changing and so are we. Romania should be morealert to the pulse of the economic, political and financialenvironment at a regional and worldwide level, as competitionbetween states to attract investors and funding has been increasing.The impact of the post 2008 economic downturn, and theuncertainties in the economy over the last few years have
exposed the local business environment, which still has someweaknesses, to pressures that require real time actions, adjustedforecasts and forward looking contingency measures.
We believe that a predictable, level playing field and a stablebusiness, political and legislative environment is the key toprogress for Romania. The country’s economy is developing, asproven by the latest positive macroeconomic indicators, whichunderline diversity, complexity, European and internationalstandards and global connectivity in many sectors. Problemspersist in certain poorer regions, in the transport infrastructuresector, as well as in health and education. There are also delaysin the absorption of European funds.
Deep-rooted challenges, such as the culture of instantgratification, massive corruption, the lack of an integratedsystemic vision, the widening gaps in society and the shrinkingadministrative capacity can be substantively cured only throughthe crafting and calibration of a multigenerational countryproject, of a competitive course and strategic priorities thatshould embrace national values and interests and promote thecountry’s role in the European and transatlantic community.
AmCham is committed to a long-term strategic country projectfocused on competitiveness and value differentiators, which aimto enhance democracy, security and prosperity. We promote anddirectly support Project Romania and invite all stakeholders toalign and contribute substantially to this powerful exercise for abetter future.
Daniela Nemoianu March 2016
President
AmCham Romania
1
Investment - a competitivenessdriver for Romania
interior EN final:report 3/22/2016 9:08 AM Page 1

Methodology
This is the second edition of the CompetitivenessReport for Romania issued by AmCham Romania.The first edition was published in December 2011based on a methodology prepared by AmChamCzech Republic.
The current report highlights Romania’s performancecompared to the average EU28 and benchmark itagainst 6 other countries in our region. Furthermore,this analysis captures the dynamics of the selectedindicators since the 2011 report.
In addition to analyzing the five policy areas basedon objective data, an executive survey was conductedand included in this report with the objective ofcapturing the opinions and perceptions of CEOsrunning businesses in Romania in relation to theprogress of our country in terms of the legislativeframework, public administration, physical infrastructure,human resources as well as fiscal and monetary policy.This survey provides qualitative insights on howthese areas actually have an impact on doingbusiness in Romania.
This instrument aims to provide a useful tool to help uswork more effectively with the Romanian authorities.
How the report was prepared
Other excellent competitiveness reports - the WorldEconomic Forum’s Global Competitiveness Reportand IMD’s World Competitiveness Yearbook - assessa country’s competitiveness in full. This report attemptsonly to assign a value as to how Government policyhas an impact on competitiveness.
To do so, economic policy was split into six areas:general, legislative framework, public administration,physical infrastructure, human resources as well asfiscal and monetary policy.
1.General covers macro outcomes of the otherfive policy areas combined: the indicatorslisted represent the desired outcome of economicpolicy.
2.Legislative framework provides a snapshotof the current legislation.
3.Public administration assesses how effectivelyand efficiently regulation is enforced.
4.Physical Infrastructure describes how farGovernment policy has built up the necessarysupporting landscape for business.
5.Human Resources addresses how policy hasinfluenced the labor force, education, researchand healthcare.
6.Fiscal and Monetary highlights how policyhas affected access to capital and price stability.
For each area of policy, a statistical model was created.The statistical model gives numbers for judging the effectiveness of policy. For the statistical model - exceptfor the legislative framework - both actual numbersand a comparative index with the average result withinthe EU are presented. The final score was indexedbased on how the country performed against the EUaverage, because EU is the benchmark for Romania.
2
Doing Business 2016, World Bank
(www.worldbank.org)
IMD World Competitiveness Scoreboard
(www.imd.ch/wcc)
World Economic Forum's The Global Competitiveness
Report 2015-2016(www.weforum.org)
Legatum Prosperity Index(2016)
(www.prosperity.com))
Where Romania Ranks in Competitiveness
interior EN final:report 3/22/2016 9:08 AM Page 2

For each of the policy areas, the EU index scores weretotaled up and the sum was divided by the number ofstatistical indicators in that area. That gave the overallscore for each area. The six areas were then addedtogether - without any weighting - and the resultmultiplied by 100 to give visual dimension to thedifferences. Thus, each of the seven countries comparedreceived an overall economic policy score.
Determining a numerical benchmark for the legislativeframework was more difficult. Categories of law weredefined and a series of principles required for competitivelegislation in each category were developed. Theseprinciples must be subjective: after all, law itself is aseries of rules to define a philosophic system ofgovernance and we do not all share the same philosophy(and often have a different understanding of it even ifwe believe we agree).
Comparative Countries. Six countries were chosenfor comparison: Austria, Bulgaria, the Czech Republic,Hungary, Poland and Slovakia.
Sources. The primary statistical sources have beenEurostat and national statistical offices. Data publishedby OECD, the Legatum Prosperity Index, the EuropeanCentral Bank, the IMF and the World Bank were alsoused. The Global Competitiveness Report and theWorld Competitiveness Yearbook were sources ofinspiration; every business interested in crossing bordersshould have a copy of each.
How were the indicators selected
The aim was to assess outcomes and efficiency inall areas of Government policy. That meant findingstatistics that would measure the economic impactof policies and also the cost in money and otherresources of implementing them.
Our efforts were restricted by the availability of data.To calculate competitiveness, we needed comparabledata not only from our seven comparative countries,but also from all EU countries. For that reason, it wasnot possible to include such comparative data as averagelength of legislative process, the legislative cost ofparliament per law, the cost of highway developmentand other relevant measures. In large, the report isbased on 2014 data.
Some entire areas of economic policy - real estate,for instance - were not included because of the lackof data covering the whole of the European Union.We would have liked to provide a view on real estate
by providing occupancy numbers for industrial sitesor the amount of square meters of office space perperson. Unfortunately, these numbers, as far as ourresearch has carried us, are not available in a comparativeway for all countries of the EU.
How do we assess the indicators and areas
We constructed a simple model for determiningcountry performance in every indicator and each area.
• Exceeding +.15 of the European averagemeant that the indicator or area was a competitiveadvantage for the country. These areas areshaded in green.
• Performing at +/- .15 of the European averagemeant the country was competitive. Theseindicators or areas are shaded in blue.
• Falling below -.15 of the European averageindicated a competitive disadvantage. Theseareas of indicators are marked in red.
3
interior EN final:report 3/22/2016 9:08 AM Page 3

Executive Summary
interior EN final:report 3/22/2016 9:09 AM Page 4

Since the publishing of AmCham’s previous RomaniaCompetitiveness Report in 2011, Romania has seenthree years of strong economic growth as well aspositive developments in a number of economicand public policy areas such as labor legislation,anti-corruption measures and inflation, to nameonly a few. There is no doubt that Romania is makingsteps towards becoming a more competitive countryon the global scene. The sobering aspect, however,is the length of the road ahead. GDP/capita is agreat illustration in this respect. The indicator has
grown by 4.5% per year, on average, during the pastthree years, much faster than the rest of Europe(1.9% yearly growth). Still, Romania’s GDP/capitain 2014 stood at a mere 30% of the EU average.This is the story that we see replicated in many crucial aspects of the Romanian economy, Governmentand society. In a nutshell – things are going in theright direction, but there is still a long way to go.The chart below depicts Romania's performanceagainst EU average as per different competitivenessreports.
In acknowledgement of the positive changes thathave happened in recent years, the main globalcompetitiveness rankings have unanimously movedRomania up in their classifications. The most strikingimprovement comes from the World Bank’s
Doing Business Report, in which Romaniaclimbed from the 72nd position in 2011 to the 37th
in 2016, while the World Economic Forum‘s
Global Competitiveness Report placed Romaniain 53rd place in 2015, up from 77th place in 2011.
5
Global Competitiveness
Rankings
EU Austria BulgariaCzech
RepublicHungary Poland Romania Slovakia
average result result result result result result result
World Bank Doing Business (2016) 31 21 38 36 42 25 37 29
IMD World 31 26 55 29 48 33 47 46
WEF Global Competitiveness Index(2015 - 2016)
36 23 54 31 63 41 53 67
Legatum Prosperity Index (2016) 27 16 51 26 45 29 50 35
interior EN final:report 3/22/2016 9:09 AM Page 5

Volatility Scores assesses the 83 indicators that wereanalysed from the perspective of clustering them intocompetitive advantages, disadvantages or neutral.Overall the balance of advantages and disadvantages
remains similar to 2011, with only one indicatorchanging cluster from being a competitive advantageto a competitive disadvantage.
6
General Indicators
Public Administration
PhysicalInfrastructure
Human Resources
Fiscal/Financial
Score Development 2011-2014
This report also shows a slight overall improvementof Romania’s performance. With the exception ofthe general indicators where we see a small decrease (mainly due to the impact of the current
account deficit as compared to the EU), and humanresources, all other categories show either similaror slightly improved scores.
General indicators
Public Administration
PhysicalInfrastructure
Human Resources
Fiscal/Financial
Romania Volatility Scores
interior EN final:report 3/22/2016 9:09 AM Page 6

Trend Assessment captures the evolution of the
analysed indicators between 2011 and 2016 reports.
Consequently, out of the 40 indicators that cluster as
either neutral or competitive advantage in 2016, 37 lied
within the same category in 2011 whereas 3 indicators
changed clusters and become competitive advantages
(while being competitive disadvantages in 2011).
The 43 competitive disadvantages recorded consist
of 39 indicators that were also disadvantages in
2011 (over this interval, approximately half of
them displayed better performance than the EU
average) and 4 indicators that became competitive
disadvantages while in 2011 they display a competitive
advantage.
7
Trend�Assesment
General�
Indicators
Public�
Administration
Physical
Infrastructure
Human�
Resources
Fiscal/
Financial
interior EN final:report 3/24/2016 12:33 PM Page 7
8
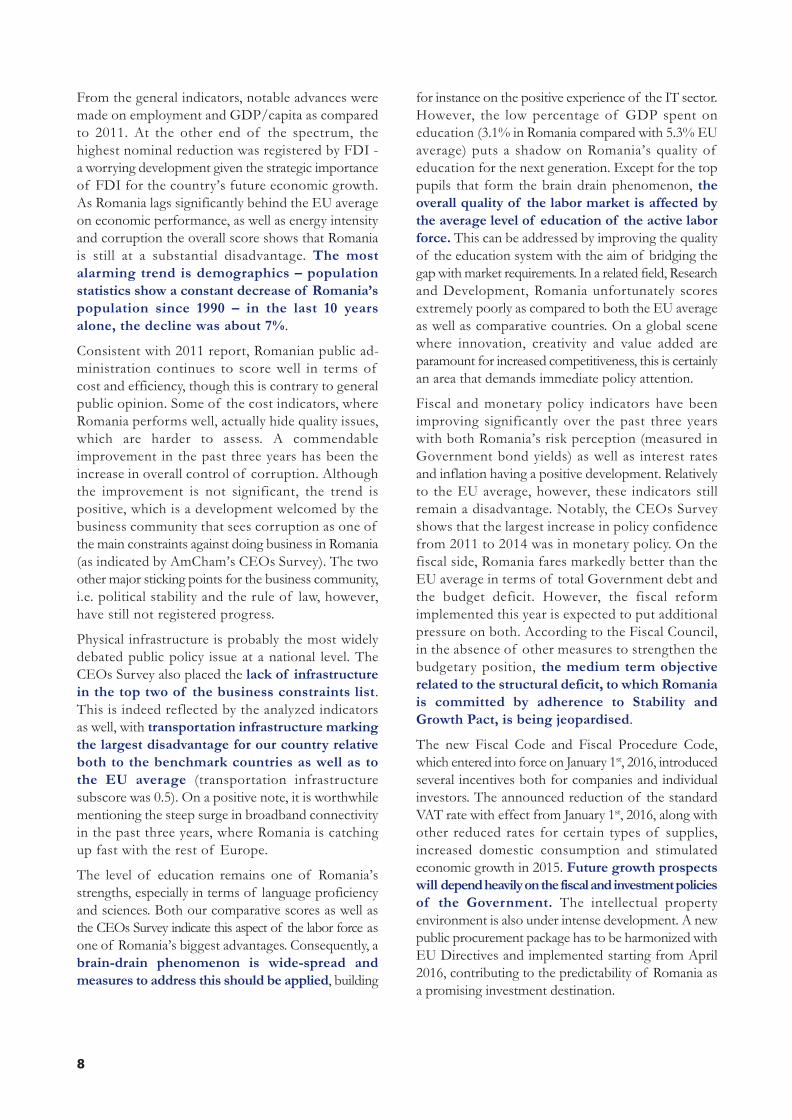
From the general indicators, notable advances weremade on employment and GDP/capita as comparedto 2011. At the other end of the spectrum, thehighest nominal reduction was registered by FDI -a worrying development given the strategic importanceof FDI for the country’s future economic growth.As Romania lags significantly behind the EU averageon economic performance, as well as energy intensityand corruption the overall score shows that Romaniais still at a substantial disadvantage. The most
alarming trend is demographics – population
statistics show a constant decrease of Romania’s
population since 1990 – in the last 10 years
alone, the decline was about 7%.
Consistent with 2011 report, Romanian public ad-ministration continues to score well in terms ofcost and efficiency, though this is contrary to generalpublic opinion. Some of the cost indicators, whereRomania performs well, actually hide quality issues,which are harder to assess. A commendable improvement in the past three years has been theincrease in overall control of corruption. Althoughthe improvement is not significant, the trend ispositive, which is a development welcomed by thebusiness community that sees corruption as one ofthe main constraints against doing business in Romania(as indicated by AmCham’s CEOs Survey). The twoother major sticking points for the business community,i.e. political stability and the rule of law, however,have still not registered progress.
Physical infrastructure is probably the most widelydebated public policy issue at a national level. TheCEOs Survey also placed the lack of infrastructure
in the top two of the business constraints list.This is indeed reflected by the analyzed indicatorsas well, with transportation infrastructure marking
the largest disadvantage for our country relative
both to the benchmark countries as well as to
the EU average (transportation infrastructure subscore was 0.5). On a positive note, it is worthwhilementioning the steep surge in broadband connectivityin the past three years, where Romania is catchingup fast with the rest of Europe.
The level of education remains one of Romania’sstrengths, especially in terms of language proficiencyand sciences. Both our comparative scores as well asthe CEOs Survey indicate this aspect of the labor force asone of Romania’s biggest advantages. Consequently, abrain-drain phenomenon is wide-spread and
measures to address this should be applied, building
for instance on the positive experience of the IT sector.However, the low percentage of GDP spent oneducation (3.1% in Romania compared with 5.3% EUaverage) puts a shadow on Romania’s quality ofeducation for the next generation. Except for the toppupils that form the brain drain phenomenon, the
overall quality of the labor market is affected by
the average level of education of the active labor
force. This can be addressed by improving the qualityof the education system with the aim of bridging thegap with market requirements. In a related field, Researchand Development, Romania unfortunately scoresextremely poorly as compared to both the EU averageas well as comparative countries. On a global scenewhere innovation, creativity and value added areparamount for increased competitiveness, this is certainlyan area that demands immediate policy attention.
Fiscal and monetary policy indicators have beenimproving significantly over the past three yearswith both Romania’s risk perception (measured inGovernment bond yields) as well as interest ratesand inflation having a positive development. Relativelyto the EU average, however, these indicators stillremain a disadvantage. Notably, the CEOs Surveyshows that the largest increase in policy confidencefrom 2011 to 2014 was in monetary policy. On thefiscal side, Romania fares markedly better than theEU average in terms of total Government debt andthe budget deficit. However, the fiscal reform implemented this year is expected to put additionalpressure on both. According to the Fiscal Council,in the absence of other measures to strengthen thebudgetary position, the medium term objective
related to the structural deficit, to which Romania
is committed by adherence to Stability and
Growth Pact, is being jeopardised.
The new Fiscal Code and Fiscal Procedure Code,which entered into force on January 1st, 2016, introducedseveral incentives both for companies and individualinvestors. The announced reduction of the standardVAT rate with effect from January 1st, 2016, along withother reduced rates for certain types of supplies,increased domestic consumption and stimulatedeconomic growth in 2015. Future growth prospects
will depend heavily on the fiscal and investment policies
of the Government. The intellectual property environment is also under intense development. A newpublic procurement package has to be harmonized withEU Directives and implemented starting from April2016, contributing to the predictability of Romania asa promising investment destination.
interior EN final:report 3/22/2016 9:09 AM Page 8

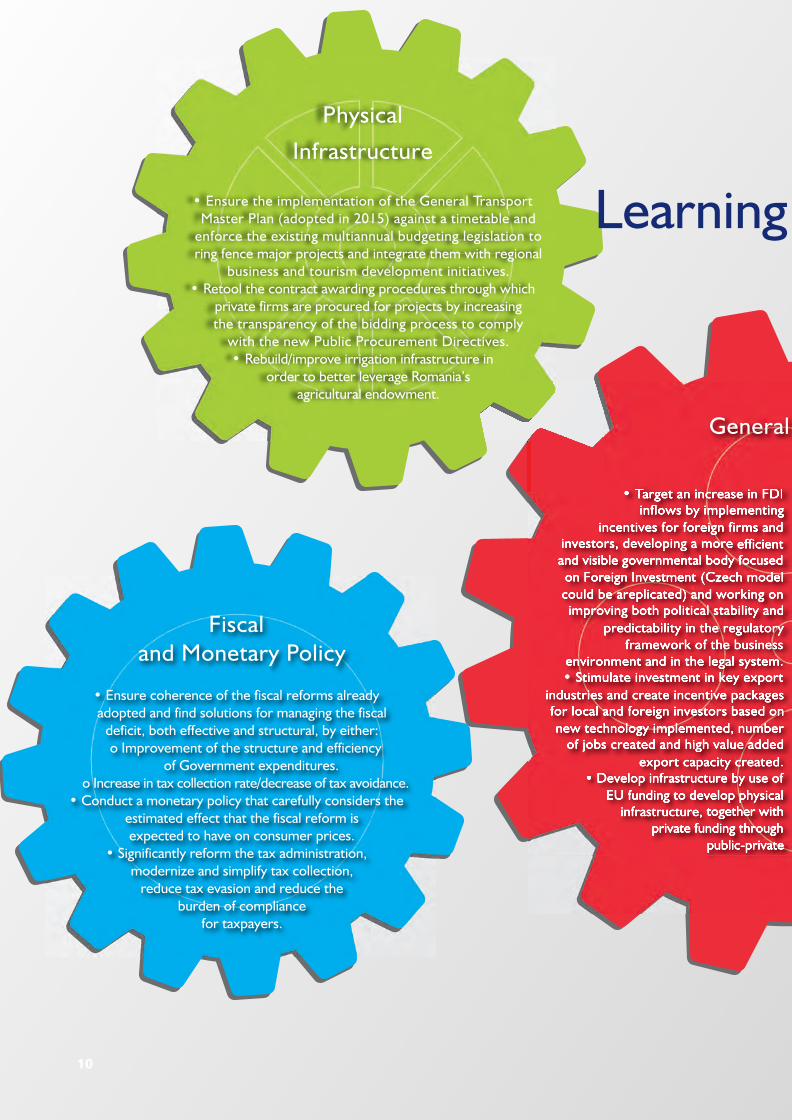
Following the analyses carried out in each of the 6 policyareas, a number of learning points have emerged,that could be used as a starting point by policy makers.They will need to be further analyzed, developed,
prioritized and, most importantly, implemented, inorder to increase the speed with which Romania willclose the competitiveness gap. A snapshot of the mostimportant learning points by area is presented as follows.
Based on the methodology of the present report, ratingshave been derived for each country and category of
indicators. A summary of these results as well as acomparison to 2011 results are depicted in the table below:
9
Country comparative scoresAustria Bulgaria
Czech Republic
Hungary Poland Romania Slovakia 2011
General Indicators 1.22 0.95 1.05 1.00 0.90 0.80 0.88 0.83Public Administration 1.10 0.90 1.03 1.04 1.03 1.05 1.06 1.01Physical Infrastructure 1.29 0.78 0.78 0.89 1.00 0.86 0.76 0.85
Human Resources 1.41 0.70 0.98 0.78 0.70 0.70 0.79 0.74Fiscal/Financial 1.17 1.02 1.47 0.72 0.84 1.23 0.98 1.17
Overall 6.19 4.34 5.30 4.43 4.48 4.64 4.48 4.51
interior EN final:report 3/22/2016 9:09 AM Page 9
10
Physical
Infrastructure
• Ensure the implementation of the General TransportMaster Plan (adopted in 2015) against a timetable and
enforce the existing multiannual budgeting legislation toring fence major projects and integrate them with regional
business and tourism development initiatives.• Retool the contract awarding procedures through which
private firms are procured for projects by increasingthe transparency of the bidding process to comply
with the new Public Procurement Directives.• Rebuild/improve irrigation infrastructure in
order to better leverage Romania’sagricultural endowment.
Fiscal and Monetary Policy
• Ensure coherence of the fiscal reforms alreadyadopted and find solutions for managing the fiscal
deficit, both effective and structural, by either:o Improvement of the structure and efficiency
of Government expenditures.o Increase in tax collection rate/decrease of tax avoidance.
• Conduct a monetary policy that carefully considers theestimated effect that the fiscal reform is expected to have on consumer prices.
• Significantly reform the tax administration, modernize and simplify tax collection,
reduce tax evasion and reduce theburden of compliance
for taxpayers.
• Target an increase in FDI inflows by implementing
incentives for foreign firms and investors, developing a more efficientand visible governmental body focusedon Foreign Investment (Czech model
could be areplicated) and working onimproving both political stability and
predictability in the regulatory framework of the business
environment and in the legal system.• Stimulate investment in key export
industries and create incentive packagesfor local and foreign investors based onnew technology implemented, number
of jobs created and high value addedexport capacity created.
• Develop infrastructure by use ofEU funding to develop physical
infrastructure, together withprivate funding through
public-private
p a o f o a a t r e• d i • v T d i a m i c
Learning
General In
interior EN final:report 3/22/2016 9:09 AM Page 10

11
Human Resources
• Elaborate and enforce a coherent policy framework tosupport Romania's standard of living and population growth
in the context of the country's aging population and its impact on real economy and financial sustainability.
• Offer incentives to keep highly skilled specialists in the country and reverse the brain drain, building on the positive experience of the IT sector.
• Enact urgent reform of the healthcare system - both in terms of retention of medical specialists as well as increasing the level and efficiency
of public investments and creating the framework for private investments.
• Increase Government and private sector R&D spending and adoption of efficient, targeted policies that aim to improve Romania’s innovation output.
• Improve the quality of the labor market by, for example, increasing the level of education of the active labor force,
increasing the quality of the education system to bridge the gapwith market needs and strengthening connections between
universities, research centres and companies by aligning curricula and research objectives
to the needs of the private sector.
I g
d t
d l
n d
y s
. t
s n
r d
. f
l h
he
partnerships and/or concessionsand strengthen the competitivenessof Romanian companies on local andforeign markets. The improvement of EU funds absorption should remaina top priority of the Government whichat the same time should take care of the quality of the projects and their relevance for the overall economic environment.• Adopt policies to stop the demographicdecline with focus on stimulating an increase in the birth rate.• Take steps towards increasing thevalue added of agricultural products.This objective can be achieved by decreasing exports of raw materials,increasing local production usingas input agricultural raw materials, increasing investment aimed at capital formation, etc.
Public Administration
• Increase transparency and accountability in public administration and in the use of national public funds.
Publish the costs of public investments (including the bid pricesand final costs), the cost/benefit analysis of each investment and implement the OECD corporate governance principles for state
owned enterprises, either as a code of conduct, or as a law.• Increase implementation of Internet based "e-services" by the
administration to enhance efficiency and reduce costs. In addition, ensure that the population is aware of Internet
based "e-services" and implement policies to enhance their capability to access them.
• Enhance the competency of public officers to improvequality of public interaction with Government
services by improving the skills of current employees and attracting talent
by improving incentives.
Policy g Points
al Indicators
interior EN final:report 3/22/2016 9:09 AM Page 11

General Indicators
interior EN final:report 3/22/2016 9:09 AM Page 12

13
General indicators rate a country’sprogress: the main aim of economic policy.The indicators are split into five areas:economic performance, demographics,direct Government contribution toperformance, energy consumption and
Government accountability.
Economic PerformanceSeveral general indicators could be used to measurethe overall performance of the Romanian economy:GDP per capita, household consumption, compensationof employees, percentage of total population employed, gross national savings, current accountbalance, investment and gross fixed capital formation.Since overall economic success depends on manyfactors, such as natural resources endowment or geographical position, these indicators cannot describefully the impact of policies on economic performanceand should not be used as the sole determinants ofpolicy success or failure.
Romania has a GDP per capita (in current prices) ofEUR 7,500, placing it well below the EU average(EUR 27,300) and below all other benchmark countrieswith the exception of Bulgaria. However, there hasbeen an improvement of this indicator for Romaniain recent years, as the country’s GDP per capita hasgrown at an average annual rate of 4.5% from EUR 6,300in 2010. During the same period the average EU GDPper capita showed an annual growth rate of only 1.9%.It is important to note that the recent financial crisiscurbed GDP growth in most European countries andthat although Romania was not impacted as forcefullyas some European countries, the stagnation certainlyaffected its growth momentum. Barring any negativeeconomic events with widespread consequences,Romania’s GDP is expected to continue to grow inthe next few years. World Bank estimations placeRomania’s real GDP growth for the period 2016 – 2018at a yearly average of 4%.
Romania’s return on employment scores well abovethe EU average, exceeding virtually all other selectedcountries. This indicates that the country has a betterreturn than average on every euro spent on employment,which offers Romania a competitive advantage over
3 8 10
Romania
Economic performance
Co
untr
y R
esul
t20
14
EU
(28
) av
erag
e20
14
Co
untr
y R
esul
t20
10
EU
(28
) av
erag
e20
10
GDP per capita Euro (current prices)
7,500 27,300 6,300 25,300
Return on employment(GDP/Employment
compensation)3.19 2.09 2.81 2.08
FDI per capita, Euro
156 358 110 956
interior EN final:report 3/22/2016 9:09 AM Page 13

14
other EU countries. Romania’s strong performance inthis indicator can be partially attributed to the fact thatthe cost of labor in Romania, both skilled and unskilled,is significantly lower than in more developed parts ofthe EU. Other factors that influence this metric arelabor productivity per hour and hours worked per year(these factors will be analyzed in detail in the HumanResources section of this report). As Romania
continues to develop, wages should slowly rise
towards the EU average and eventually catch-up,
so this return on employment advantage may
deteriorate over time unless value added by the
workforce or productivity increase as well.
While observing gross fixed capital formation and FDIlevels for the countries analyzed, a positive correlationcan be identified (countries that display low FDI alsodisplay low levels of gross fixed capital). In 2012, FDIper capita in Romania was roughly 87% lower than theEU average (based on data from that year). FDI is asignificant channel for financing gross fixed capitalformation, balancing the current account and providingknow-how and best practices to the economy. Designingeffective policies to foster FDI, especially in post-transitioneconomies, has always been a fine balancing act due tocumbersome regulation and underdeveloped productionstructures. The most successful FDI policies haveensured a significant inflow of foreign funds andexpertise, without Government relinquishing controlof the most strategically important elements of theeconomy through overzealous privatization. To increaselevels of FDI inflows in the coming years Romania
must implement carefully targeted incentives for
foreign firms and investors (while observing EU
legislation), set-up an efficient and visible Foreign
Investment Agency and work on improving
political stability, while displaying predictability
in both the business environment and the legal
regulatory environment. Along with increasedrevenues, higher FDI inflows will also generate highercompetition of foreign firms in the domestic market,thus increasing both the rate of knowledge transfer inthe country and the competitiveness of domesticfirms. In the context of FDI increases, it is expectedthat fixed capital and R&D are amongst the areas thatcould benefit from improvements.
Total investment in Romania amounted to 24.2% ofGDP in 2014, which places Romania above the EUaverage of 19.8% in this category. However, whenconsidering the nominal value of investments, theGDP trend for the peer countries as well as the factthat EU average incorporates many mature markets
where significant investments are not required with thesame urgency, we may conclude that Romania needsto be more ambitious in attracting FDI to finance theformation of its fixed capital. Increased investment inRomania will serve as evidence of a higher level oftrust in the markets and in the profits they can generateand is paramount for stimulating R&D and innovationthat could lead to further economic growth.
There has been a deterioration in the current accountbalance per capita, as compared to EU average; thisindicator has changed clusters over the analyzed period, turning from a competitive advantage to acompetitive disadvantage. Additional measures for furtherstimulating local production and exports should
be envisaged, in correlation with measures to
increase FDI and improving the skills of the
labor force.
A general indicator for tourism (tourist trips per bed)shows a slight deterioration of this sector. While thisindicator was clustered as neutral based on 2010 data(0.9 of the EU average), it has turned into a competitivedisadvantage when considering statistics published for2013 (0.8 of the EU average). This will be furtheranalyzed later in this report.
Direct GovernmentContribution
A Government should invest and spend its revenuesin ways that generate more economic prosperity.Therefore, the weight of Government direct contributionto economic performance is a strong indicator ofeffectiveness of public policy making and resourceallocation. In this report, we have included severalindicators that reveal how much of the economydepends on Government spending and how effectivelyGovernment spending stimulates growth and privateconsumption (i.e. household consumption to Governmentconsumption, Government subsidies, business investmentas a percentage of total investment).
Romania seems well-positioned within the analyzedgroup in terms of household consumption toGovernment consumption. The ratio of householdto Government consumption increased from 1.45in 2010 to 1.62 in 2014, equivalent to an annualcompound growth rate of 3.8% as compared to a1% average displayed by the EU. This trend can beexplained by the fact that household consumptionwas considerably lower in 2010 which probably occurred
interior EN final:report 3/22/2016 9:09 AM Page 14

15
due to the austerity measures and general fall inconsumer confidence that followed the global financialcrisis. So, although Romania has been improvingthis metric and it has been doing so at a faster ratethan the rest of Europe, further measures aimed atimproving this indicator either by raising the purchasingpower of households or reducing Governmentconsumption should be considered.
EnergyEnergy consumption is relevant to an economy’sproductivity and competitiveness. Energy is relevantto virtually all sectors of the economy and this isdemonstrated whenever there are supply constraints.Furthermore, the structure of the energy sector, includingsupply and distribution, has an important effect onthe competitiveness of the economy, as well as environmental costs and benefits.
Romania scores well in terms of CO2 emissions percapita. However, this indicator also reflects thesharp decrease of industrial output in Romania since1989 in the context of the structural transformationof the economy. When looking at this processthrough the perspective of competitiveness, thismay not necessarily reflect an advantage (furtherdetails are provided within Physical Infrastructure– Energy section).
Energy intensity is a measure of the energy equivalentof oil required to produce 1.000 EUR of GDP. Romaniastill shows a competitive disadvantage in this area,(i.e. still it is more energy intensive than the benchmarkcountries/EU28 average). However when comparedto 2009 data presented in the previous report, thetrend is positive and it displays a more acceleratedpace than the EU average.
Focusing investment and policy on energy efficiency,including savings, is an effective mechanism forspurring productivity and competitiveness via efficiencygains. At the same time, such a strategic thrustwould continue Romania’s alignment with EU environmental regulations. Policy decisions that
encourage private action and funding, as well
as public resources such as EU funding, would
contribute to achieving such targets and more
sustainable economic growth.
Government AccountabilityA Government’s effectiveness in formulating andimplementing effective economic policy reliesheavily on its ability to put the public interest beforepersonal profits and partisan goals. In countrieswith a history of corruption, seeking out corruptpublic officials and holding them accountable is amandatory process for meaningful progress. However,fighting against corruption should be a natural outcomeof increasing the quality of public policies in generaland the overall capacity of public institutions toformulate qualitative regulation. Romania’s scoreof 4.3 in the 2014 TI Corruption Index has improvedfrom the 3.7 it has scored in 2010. However it remainsa poor overall result (the above-mentioned indexranges from 0-10, where 0 represents high levels ofcorruption). There is no doubt that an objective
and independent judicial system is paramount
to a successful overhaul of a country’s political
landscape. To conclude on a slightly positive note,the average annual rate displayed by the indicatorover the analyzed period shows a more acceleratedperformance as compared to EU average.
DemographicsA worrying feature for Romania’s future economicdevelopment that needs to be addressed by Governmentpolicy is the development of the country’s demographics.Population statistics show a constant decrease of
Romania’s population since 1990 - in the last 10
years alone, the decline was about 7%. Futureprojections also indicate a bleak prospect. While theEU population is expected to increase by 3% by 2050,for Romania, Eurostat foresees a 10% decrease inpopulation for the same period. Projections made bythe Center for Demographic Research of the RomanianAcademy take a more drastic view placing the 2050population in Romania at 16 million, a 20% decreaseas compared to the 2014 level.
This level of depopulation, if not properly addressed,will have a major impact on the country’s competitivenessaffecting a wide range of areas from availability ofworkforce to the size of the consumer market, ultimatelyundermining Romania’s potential for sustained economicgrowth.
While until 2009 migration had the largest influenceon Romania’s depopulation, natural decrease (births-deaths) has led the trend since. Net migration saw a
interior EN final:report 3/22/2016 9:09 AM Page 15

16
significant decline, with the number of emigrants andthat of immigrants in 2012 and 2013 almost eveningout. The natural change in Romania’s populationturned negative in 1991 and has remained there eversince. If no change occurs in fertility rate, which inRomania is 1.41 (meaning the number of children thatare born alive to a woman in her lifetime), below theEU average of 1.55, natural decrease is expected toaccelerate in the medium term.
Population decrease brings with it even more dramaticstructural changes in terms of age distribution. Europeis already confronted with an aging population, withthe percentage of people over 65 at 18.5% of the totalpopulation, which is the second highest in the world,after Japan. (For comparison purposes, the percentagein India, according to World Bank Indicators is 5%).With 16.5% in 2014, Romania is not far behind. Thesituation is only getting worse. The old age dependencyratio (population of over 65 for every 100 active peoplewith ages between 15 and 64) in Romania is projected toincrease from 24.3 in 2014 to 48.5 by 2050. The expectedworsening of the ageing phenomenon sparks seriousconcerns about the capacity of the social security,healthcare systems and the economy as a whole to cope.
SummaryRomania’s overall ranking in general policy indicatorsis based on its good performance in three mainareas: total investment as a % of GDP, householdconsumption to Government consumption ratio andCO2 emissions per capita. The main areas whereRomania’s performance needs urgent improvementare: household consumption per capita, compensationof employees per capita, GDP per capita, grossfixed capital, foreign direct investment, current accountbalance, energy intensity, crude death rate, touristtrips and the TI Corruption Index. For 7 out ofthese 10 indicators listed as competitive disadvantagesfor Romania, the trend analysis reveals that theirperformance improved compared to 2011 and theyscored better relative to the EU average.
Policy Learning Points The authorities should aim to do the following:
• Target an increase in the FDI inflows by implementingincentives for foreign firms and investors, developinga more efficient and visible governmental body focusedon Foreign Investment (Czech model could be replicated)and working on improving both political stability andpredictability in the regulatory framework of the businessenvironment and in the legal system.
• Stimulate R&D and innovation throughout thecountry by:
o Stimulating the establishment of industrial clustersand technology transfer infrastructure to encouragedevelopment and commercialization of newpatents (targeting less developed areas).
o Defining breakthrough projects to enable knowledgetransfer to Romania by bringing in global expertise(e.g. Laser Valley project). Increasing accountabilityby strengthening transparency of public administration.
• Stimulate investments in key export industries andcreate incentive packages for local and foreign investorsbased on new technology introduced, number of jobscreated and high value added export capacity created.
• Define a strategic framework for large infrastructureinvestment projects such as energy investment andenforce a predictable and stable regulatory environmentaimed at supporting economic competitiveness.
• Use EU funding to develop physical infrastructure,together with private funding through public-privatepartnerships and/or concessions and strengthen thecompetitiveness of Romanian companies on local andforeign markets. The improvement of EU fundsabsorption should remain a top priority of theGovernment, which at the same time should ensurethat projects are of high quality and are relevant forthe overall economic environment.
• Adopt policies to stop the demographic decline witha focus on stimulating an increase in the birth rate.
interior EN final:report 3/22/2016 9:09 AM Page 16

17
General Indicators
People
EU Austria BulgariaCzech
RepublicHungary Poland Romania Slovakia
aver
age
resu
lt
sco
re
(EU
rat
io)
resu
lt
sco
re
(EU
rat
io)
resu
lt
sco
re
(EU
rat
io)
resu
lt
sco
re
(EU
rat
io)
resu
lt
sco
re
(EU
rat
io)
resu
lt
sco
re
(EU
rat
io)
resu
lt
sco
re
(EU
rat
io)
Employment (%) of total population2014
64.9 71.1 1.1 61.0 0.9 69.0 1.1 61.8 1.0 61.7 1.0 61.0 0.9 61.0 0.9
Household consumption per capita (including non-profit institutions serving households), EUR 2014
15,569 20,742 1.3 3,606 0.2 7,135 0.5 5,287 0.3 6,447 0.4 4,717 0.3 7,865 0.5
Compensation of employees per capita 2014
13,098 18,595 1.4 2,325 0.2 5,903 0.5 4,575 0.3 3,815 0.3 2,357 0.2 5,345 0.4
General Indicators
Economic Performance
EU Austria BulgariaCzech
RepublicHungary Poland Romania Slovakia
aver
age
resu
lt
sco
re
(EU
rat
io)
resu
lt
sco
re
(EU
rat
io)
resu
lt
sco
re
(EU
rat
io)
resu
lt
sco
re
(EU
rat
io)
resu
lt
sco
re
(EU
rat
io)
resu
lt
sco
re
(EU
rat
io)
resu
lt
sco
re
(EU
rat
io)
GDP per capita, EUR 2014 27,300 38,500 1.4 5,800 0.2 14,700 0.5 10,500 0.4 10,700 0.4 7,500 0.3 13,900 0.5
Gross Domestic Savings % of GDP2013
21.7 26.4 1.2 20.9 1.0 30.8 1.4 27.4 1.3 21.0 1.0 22.3 1.0 25.2 1.2
Gross fixed capital formation, EUR per capita
5,267 8,523 1.6 1,222 0.2 3,731 0.7 n.a. n.a. 2,093 0.4 1,653 0.3 2,933 0.6
FDI per capita, 2012 821 532 0.6 n.a. n.a. 785 1.0 1080 1.3 122 0.1 107 0.1 407 0.5
Total Investment as % of GDP, 2014
19.8 22.4 1.1 n.a. n.a. 25.0 1.3 21.7 1.1 20 1.0 24.2 1.2 20.9 1.1
Business investment to Total investment ratio, 2012
0.6 0.6 1.1 n.a. n.a. 0.7 1.2 0.7 1.1 0.5 0.9 0.6 1.1 0.6 1.1
Current account balance per capita, 4Q average, 2014Q1-2014Q4
248 299 1.2 50 0.2 91 0.4 426 1.7 -155 -0.6 -32 -0.1 7 0.0
Household consumption to Government consumption ratio, 2014
2.7 2.7 1.0 3.6 1.3 2.5 0.9 2.5 0.9 3.3 1.2 4.4 1.6 n.a. n.a.
People subsum 3.8 1.3 2.0 1.6 1.7 1.4 1.9
People subscore 1.3 0.4 0.7 0.5 0.6 0.5 0.6
Economic Performance subsum 9.3 2.9 7.3 7.8 4.4 5.5 4.9
Economic Performance subscore 1.2 0.6 0.9 1.1 0.5 0.7 0.7
General Indicators
Energy
EU Austria BulgariaCzech
RepublicHungary Poland Romania Slovakia
aver
age
resu
lt
sco
re
(EU
rat
io)
resu
lt
sco
re
(EU
rat
io)
resu
lt
sco
re
(EU
rat
io)
resu
lt
sco
re
(EU
rat
io)
resu
lt
sco
re
(EU
rat
io)
resu
lt
sco
re
(EU
rat
io)
resu
lt
sco
re
(EU
rat
io)
Energy intensity, KG of oil per 1000 EUR GDP, 2013
141,6 123.9 0.9 610.6 4.3 353.8 2.5 256.6 1.8 294.7 2.1 334.7 0.4 337.2 2.4
CO2 emissions per capita,metric ton per capita, 2010
7.4 8.0 1.1 6.0 0.8 10.7 1.5 5.1 0.7 8.3 1.1 3.9 1.9 6.7 0.9
Energy subsum 2.0 5.1 3.9 2.5 3.2 2.3 3.3
Energy subscore 1.0 2.6 2.0 1.3 1.6 1.2 1.6
interior EN final:report 3/22/2016 9:10 AM Page 17

18
General Indicators
Demographics
EU Austria BulgariaCzech
RepublicHungary Poland Romania Slovakia
aver
age
resu
lt
sco
re
(EU
rat
io)
resu
lt
sco
re
(EU
rat
io)
resu
lt
sco
re
(EU
rat
io)
resu
lt
sco
re
(EU
rat
io)
resu
lt
sco
re
(EU
rat
io)
resu
lt
sco
re
(EU
rat
io)
resu
lt
sco
re
(EU
rat
io)
Population (million) 18.1 8.5 0.5 7.2 0.4 10.5 0.6 9.9 0.5 38.0 2.1 19.9 1.1 5.4 0.3
Fertility Rate (2013) 1.6 1.4 0.9 1.5 1.0 1.5 0.9 1.4 0.9 1.3 0.8 1.4 0.9 1.3 n.a
Crude Birth Rate (birth per 1000 inhabitants)
10.0 9.4 0.9 9.2 0.9 10.2 1.0 9.0 0.9 9.7 1.0 9.1 0.9 10.1 1.0
Crude Death Rate (death per 1000 inhabitants)
9.9 9.4 1.1 14.3 0.7 10.4 1.0 12.8 0.8 10.2 1.0 12.3 0.8 9.6 1.0
Old Age Dependancy Rate 28.1 27.2 1.0 29.3 1.0 25.7 0.9 25.8 0.9 21.2 0.8 24.3 0.9 19.0 0.7
Life expectancy 81 81 1.0 75 0.9 78 1.0 76 0.9 77 1.0 75 0.9 77 1.0
Demographics subsum 8.0 5.9 7.3 6.5 7.6 6.1 5.3
Demographics subscore 1.0 0.7 0.9 0.8 1.0 0.8 0.8
General Indicators
Tourism
EU Austria BulgariaCzech
RepublicHungary Poland Romania Slovakia
aver
age
resu
lt
sco
re
(EU
rat
io)
resu
lt
sco
re
(EU
rat
io)
resu
lt
sco
re
(EU
rat
io)
resu
lt
sco
re
(EU
rat
io)
resu
lt
sco
re
(EU
rat
io)
resu
lt
sco
re
(EU
rat
io)
resu
lt
sco
re
(EU
rat
io)
Tourist trips (for personal purposes,in nights spent) per bed, 2013
86.3 112.8 1.3 71.5 0.8 58.5 0.7 57.9 0.7 92.7 1.1 66.3 0.8 59.6 0.7
General Indicators
Corruption
EU Austria BulgariaCzech
RepublicHungary Poland Romania Slovakia
aver
age
resu
lt
sco
re
(EU
rat
io)
resu
lt
sco
re
(EU
rat
io)
resu
lt
sco
re
(EU
rat
io)
resu
lt
sco
re
(EU
rat
io)
resu
lt
sco
re
(EU
rat
io)
resu
lt
sco
re
(EU
rat
io)
resu
lt
sco
re
(EU
rat
io)
TI corruption index, 2014 (10 clean - 0 high corruption)
6.4 7.2 1.1 5.8 0.9 5.1 0.8 5.4 0.8 6.1 1.0 4.3 0.7 5.0 0.8
General Indicators Austria BulgariaCzech
RepublicHungary Poland Romania Slovakia
Overall score 1.22 0.95 1.05 1.00 0.90 0.80 0.88
interior EN final:report 3/22/2016 9:10 AM Page 18

19
Trend assessment Number Details
Indicators that clustered as competitive disadvantage in 2011, but have turned into competitive advantage
or neutral meanwhile0 No indicator in this cluster
Indicators that clustered as competitive disadvantage in 2011, still are, but have shown better performance
than EU average meanwhile7
Household consumption per capita, GDP per capita, Gross fixed capital, FDI per capita, Energy intensity,
Crude death rate, TI Corruption Index
Indicators that clustered as competitive disadvantage in 2011, still are, but have shown worse performance than
EU average meanwhile1 Compensation of employees per capita 2014
Indicators that clustered as competitive advantage or neutral in2011, but have turned into competitive disadvantage meanwhile
2 Current account balance per capita, Tourist trips per bed
Indicators that clustered as competitive advantage or neutral in 2011 and have not changed cluster meanwhile
11
Employment (%) of total population, Gross Domestic Savings,Total Investment as % of GDP, Business investment to Total
investment, Household consumption to Government consumptionratio, CO2 emissions per capita, Population, Fertility rate, Crude birth rate, Old Age Dependancy, Life expectancy
interior EN final:report 3/22/2016 9:10 AM Page 19

Public Administration
interior EN final:report 3/22/2016 9:10 AM Page 20
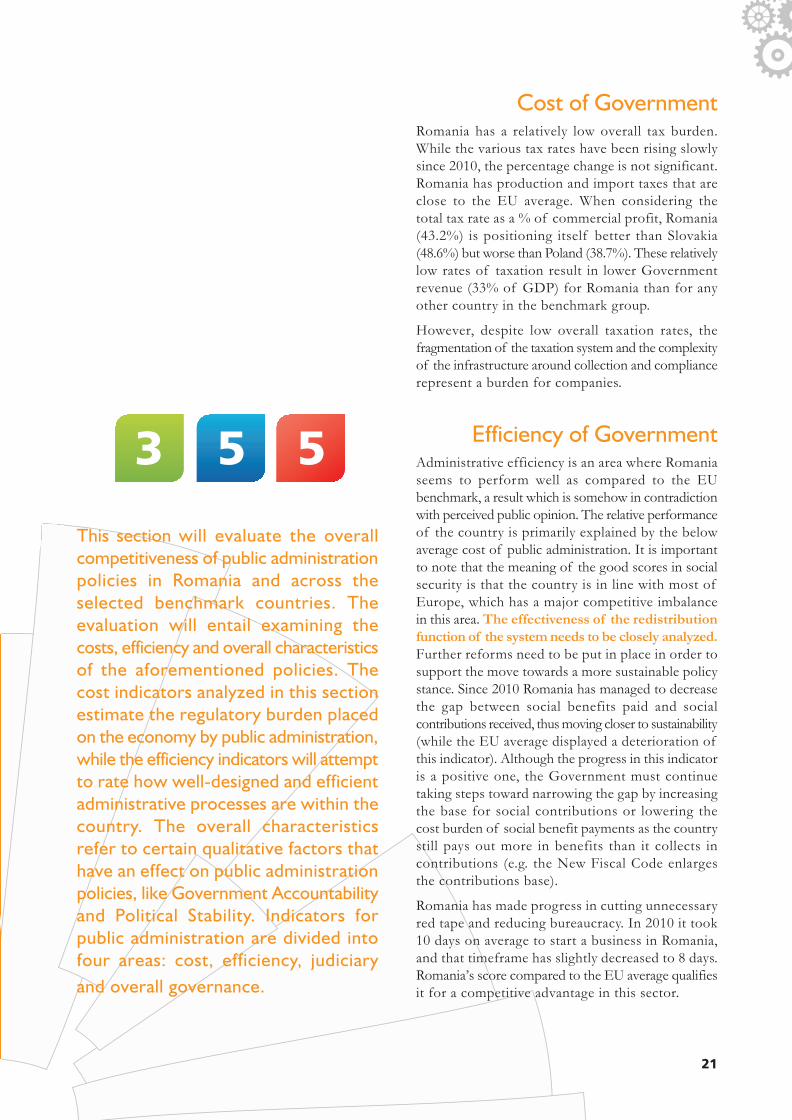
This section will evaluate the overallcompetitiveness of public administrationpolicies in Romania and across the selected benchmark countries. Theevaluation will entail examining thecosts, efficiency and overall characteristicsof the aforementioned policies. Thecost indicators analyzed in this sectionestimate the regulatory burden placedon the economy by public administration,while the efficiency indicators will attemptto rate how well-designed and efficientadministrative processes are within thecountry. The overall characteristicsrefer to certain qualitative factors thathave an effect on public administrationpolicies, like Government Accountabilityand Political Stability. Indicators forpublic administration are divided intofour areas: cost, efficiency, judiciary
and overall governance.
Cost of GovernmentRomania has a relatively low overall tax burden.While the various tax rates have been rising slowlysince 2010, the percentage change is not significant.Romania has production and import taxes that areclose to the EU average. When considering thetotal tax rate as a % of commercial profit, Romania(43.2%) is positioning itself better than Slovakia(48.6%) but worse than Poland (38.7%). These relativelylow rates of taxation result in lower Governmentrevenue (33% of GDP) for Romania than for anyother country in the benchmark group.
However, despite low overall taxation rates, thefragmentation of the taxation system and the complexityof the infrastructure around collection and compliancerepresent a burden for companies.
Efficiency of GovernmentAdministrative efficiency is an area where Romaniaseems to perform well as compared to the EUbenchmark, a result which is somehow in contradictionwith perceived public opinion. The relative performanceof the country is primarily explained by the belowaverage cost of public administration. It is importantto note that the meaning of the good scores in socialsecurity is that the country is in line with most ofEurope, which has a major competitive imbalancein this area. The effectiveness of the redistribution
function of the system needs to be closely analyzed.
Further reforms need to be put in place in order tosupport the move towards a more sustainable policystance. Since 2010 Romania has managed to decreasethe gap between social benefits paid and social contributions received, thus moving closer to sustainability(while the EU average displayed a deterioration ofthis indicator). Although the progress in this indicatoris a positive one, the Government must continuetaking steps toward narrowing the gap by increasingthe base for social contributions or lowering thecost burden of social benefit payments as the countrystill pays out more in benefits than it collects incontributions (e.g. the New Fiscal Code enlargesthe contributions base).
Romania has made progress in cutting unnecessaryred tape and reducing bureaucracy. In 2010 it took10 days on average to start a business in Romania,and that timeframe has slightly decreased to 8 days.Romania’s score compared to the EU average qualifiesi t for a competitive advantage in this sector.
21
3 5 5
interior EN final:report 3/22/2016 9:10 AM Page 21

In the Public Administration efficiency table there is onlyone indicator where Romania scores as non-competitive:e-Government online activity. Increasing the quality
of public services across the board, at both
local and central Government level, is considered
a significant factor to enhance competitiveness
and encouraging investment. The performanceof Romania’s public administration is severely constrainedby inefficiency (even though this is not necessarilyreflected in the indicators selected due to quantificationissues). One reason for this inefficiency is the lowlevel of automation or e-Government in administrativeprocesses. The Romanian Government offers onlineservices that are quite similar to those offered bypeer countries, so the issue lies either with the promotionof these services within the country, with theirtechnical quality or with the technical abilities ofthe population. Given that internet penetration inhouseholds has been increasing significantly in recentyears (however still showing a consistent gap comparedto average EU level), the Government must focuson ensuring that the population is aware of theseservices and has the capability to access them.
In terms of time to prepare and pay taxes annually,Romania displays a competitive advantage as it isplaced 16% below the EU average. Since 2010 Romaniahas managed to reduce the lead time of thisprocess from 228 hours per year to 159 hours peryear on average. Further progress could be made
by simplifying the tax forms citizens must
complete, offering comprehensive online tax
submission, simplifying the tax code, or offering
citizens more help with completing tax forms,
either in the form of online tutorials or tax advisory
and support services.
JudiciaryThe time it takes to enforce contracts is an importantmeasure of the efficiency of the judicial system andthe overall competitiveness of a country. This isone of the indicators that features prominently inthe most widely read GCRs, and foreign investorswill certainly look to this metric when evaluating apotential market, as it expresses how efficiently thejudicial system is able to handle contractual disputesor issues. It currently takes 512 days on average toenforce a contract in Romania, which is competitivein the EU context (amounts to only 89% of averagedays spent on enforcement in the EU).
Overall Governance This segment attempts to measure areas of Governmentperformance that are often difficult to quantify: publictrust in the Government, Government's compliance withthe law, the effectiveness of anti-corruption efforts,Government accountability to citizens and the stabilityof the political system.
In contrast to other Public Administration sectors,Romania performs poorly compared with the benchmarkgroup here. It only achieved 70% of the EU averagein the 2014 results for Voice and Accountability,Political Stability and Rule of Law and 60% forGovernance Efficiency. An important aspect relatedto these metrics is their trend – Romania’s performancehas worsened slightly since 2010. Although worrying,this is not necessarily surprising given the politicalturmoil of recent years. Today the situation is not
much improved, as political scandals and corruption
accusations levelled at high-ranking officials
still dominate the news cycle. Nevertheless, generalcorruption (the type that permeates institutions atall levels, measured by the Control of Corruptionmetric) has been reduced and Romania’s scores(71,8) is above its benchmark countries (with theexception of Austria – 88,5), but it is still behindthe EU average in this metric (77,7).
SummaryRomania has an advantage in the cost of Governmentservice, average performance in administration andlow scores in integrity and quality of institutions andpublic policies. However, the trend observed for thecontrol of corruption is encouraging. Maintainingthis trend in control of corruption, which could beenhanced by successfully addressing integrity, woulddistinguish Romania from other countries in the regionwith similar problems. The trend analysis carried outfor public administration reveals that the only noticeablechanges occurred in relation to control of corruption,while most of the other indicators remained withinthe same cluster (either competitive advantages ordisadvantages) as per the data displayed in 2010.
22
interior EN final:report 3/22/2016 9:10 AM Page 22

23
Policy Learning Points The authorities should aim to do the following:
• Take steps toward narrowing the gap between socialcontributions and social benefits by increasing thebase for social contributions (for example by increasingthe employed population) and consequently loweringthe cost burden of social benefit payments.
• Increase transparency and accountability in publicadministration and in the use of national publicfunds. Publish the costs of public investments (includingthe bid prices and final costs), the cost/benefitanalysis of each investment and implement theOECD corporate governance principles for stateowned enterprises, either as a code of conduct, oras a law.
• Increase implementation of Internet based "e-services"by the administration to enhance efficiency, reducecosts and improve the quality of public interactionwith Government services.
• Ensure that the population is aware of Internetbased "e-services" and implement policies to enhancetheir capability to access them.
• Increase the quality of public service and buildadministrative capacity at both central and locallevel, by increasing remuneration, introducing careerpath development, defining seniority levels, performanceobjectives and annual evaluations against the objectiveslinked to remuneration.
• Improve the sophistication of public procurementto differentiate between commodities and value-addedproducts and services. Perform lifecycle cost analysisand cost-quality analysis where appropriate, as partof the public procurement process.
• Simplify the tax forms the citizens must fill in,offer comprehensive online tax submission, simplifythe tax code or offer citizens more help with completingtax forms, either in the form of online tutorials ortax advisory and support services.
interior EN final:report 3/22/2016 9:10 AM Page 23

* EU28 computation excludes data for Croatia, Cyprus and Greece, due to unavailability
24
Public Administration
Efficiency
EU Austria BulgariaCzech
RepublicHungary Poland Romania Slovakia
aver
age
resu
lt
sco
re
(EU
rat
io)
resu
lt
sco
re
(EU
rat
io)
resu
lt
sco
re
(EU
rat
io)
resu
lt
sco
re
(EU
rat
io)
resu
lt
sco
re
(EU
rat
io)
resu
lt
sco
re
(EU
rat
io)
resu
lt
sco
re
(EU
rat
io)
Efficiency - Social contributions to Social benefits ratio, 2014
0.8 0.8 1.0 0.6 0.8 1.1 1.4 0.9 1.2 0.9 1.1 0.8 1.0 1.0 1.2
Efficiency - E-Government on-line-availability, 2010
84.3 100.0 1.2 70.0 0.8 73.8 0.9 65.8 0.8 78.8 0.9 60.0 0.7 62.5 0.7
Efficiency - Time to prepare and pay taxes annually,
(expressed in hours per year) 2014189.2 166.0 1.1 454.0 0.4 413.0 0.5 277.0 0.7 286.0 0.7 159.0 1.2 207.0 0.9
Efficiency, days to start a business, 2014
11.6 22.0 0.5 18.0 0.6 19.0 0.6 5.0 2.3 30.0 0.4 8.0 1.4 11.5 1.0
Public Administration Efficiency subsum 3.8 2.7 3.3 4.9 3.1 4.3 3.9
Public Administration Efficiency subscore 1.0 0.7 0.8 1.2 0.8 1.1 1.0
Public Administration
Judiciary
EU Austria BulgariaCzech
RepublicHungary Poland Romania Slovakia
aver
age
resu
lt
sco
re
(EU
rat
io)
resu
lt
sco
re
(EU
rat
io)
resu
lt
sco
re
(EU
rat
io)
resu
lt
sco
re
(EU
rat
io)
resu
lt
sco
re
(EU
rat
io)
resu
lt
sco
re
(EU
rat
io)
resu
lt
sco
re
(EU
rat
io)
Judiciary - Time to enforce contracts,2014
576.0 397.0 0.7 564.0 1.0 611.0 1.1 395.0 0.7 685.0 1.2 512.0 1.1 545.0 0.9
Public Administration
Costs
EU Austria BulgariaCzech
RepublicHungary Poland Romania Slovakia
aver
age
resu
lt
sco
re
(EU
rat
io)
resu
lt
sco
re
(EU
rat
io)
resu
lt
sco
re
(EU
rat
io)
resu
lt
sco
re
(EU
rat
io)
resu
lt
sco
re
(EU
rat
io)
resu
lt
sco
re
(EU
rat
io)
resu
lt
sco
re
(EU
rat
io)
Total General Government Revenue as % of GDP, 2014
45.7 49.7 0.9 37.2 1.2 40.9 1.1 47.7 1.0 37.5 1.2 32.7 1.4 38.7 1.2
Cost - Taxes on production and import % GDP, 2014
13.5 14.4 0.9 14.8 0.9 12.1 1.1 18.6 0.7 12.7 1.1 12.8 1.1 10.6 1.3
Cost - Total tax rate as % of Commercial Profit, 2014
41.9 52.0 0.8 27.0 1.6 48.5 0.9 48.0 0.9 38.7 1.1 43.2 1.0 48.6 0.9
Public Administration Costs subsum 2.7 3.7 3.1 2.6 3.4 3.5 3.3
Public Administration Costs subscore 0.9 1.2 1.0 0.9 1.1 1.2 1.1
interior EN final:report 3/22/2016 9:10 AM Page 24

25
Public Administration
Overall Governance
EU Austria BulgariaCzech
RepublicHungary Poland Romania Slovakia
aver
age
resu
lt
sco
re
(EU
rat
io)
resu
lt
sco
re
(EU
rat
io)
resu
lt
sco
re
(EU
rat
io)
resu
lt
sco
re
(EU
rat
io)
resu
lt
sco
re
(EU
rat
io)
resu
lt
sco
re
(EU
rat
io)
resu
lt
sco
re
(EU
rat
io)
Overall Governance - Voice and Accountability (Rank 0-100), 2013
82.1 96.2 1.2 58.3 0.7 76.8 0.9 69.7 0.8 78.2 1.0 57.3 0.7 76.3 0.9
Overall Governance - Political Stability, 2014 (Rank 0-100)
73.1 96.7 1.3 54.5 0.7 84.4 1.2 69.7 1.0 78.7 1.1 52.6 0.7 88.6 1.2
Overall Governance - Rule of Law,2014 (Rank 0-100)
81.1 97.6 1.2 51.2 0.6 82.5 1.0 67.3 0.8 73.5 0.9 56.4 0.7 64.0 0.8
Overall Governance - Control of Corruption, 2014 (Rank 0-100)
77.7 88.5 1.1 52.2 0.7 63.6 0.8 64.6 0.8 71.8 0.9 71.8 0.9 60.3 0.8
Overall Governance - Governance Effectivness Ranking,2014 (Rank 0-100)
81.9 92.8 1.1 59.3 0.7 75.1 0.9 70.3 0.9 71.3 0.9 52.6 0.6 73.2 0.9
Public Administration Overall Governance subsum 6.0 3.5 4.8 4.3 4.7 3.7 4.6
Public Administration Overall Governance subscore 1.2 0.7 1.0 0.9 0.9 0.7 0.9
Public Administration Austria BulgariaCzech
RepublicHungary Poland Romania Slovakia
Overall score 1.1 0.9 1.0 1.0 1.0 1.1 1.1
Trend assessment Number Details
Indicators that clustered as competitive disadvantage in 2011, but have turned into competitive advantage
or neutral meanwhile1 Overall Governance - Control of Corruption
Indicators that clustered as competitive disadvantage in 2011, still are, but have shown better performance
than EU average meanwhile1 Overall Governance - Rule of Law
Indicators that clustered as competitive disadvantage in 2011, still are, but have shown worse performance than
EU average meanwhile4
Overall Governance - Voice and Accountability,Overall Governance - Political Stability,
Overall Governance - Governance Effectivness Ranking
Indicators that clustered as competitive advantage or neutral in2011, but have turned into competitive disadvantage meanwhile
0 No indicator in this cluster
Indicators that clustered as competitive advantage or neutral in 2011 and have not changed cluster meanwhile
7 The remainder
interior EN final:report 3/22/2016 9:10 AM Page 25

PhysicalInfrastructure
interior EN final:report 3/22/2016 9:10 AM Page 26

Physical infrastructure indicators measure acountry's level of development in bothquantitative and qualitative terms. Thesemeasures are considered a significant pre-requisite for economic growth and compet-itiveness. Our analysis focuses on: Internetinfrastructure, agriculture, energy, tourism
and transport networks.
Internet InfrastructureRomania's Internet infrastructure is still quite lopsided,although coverage has become more homogenousin recent years. Where Internet connections exist,Romania boasts connection speeds that are highlycompetitive at the EU level. In fact, based on severalinternational rankings, Romania is known to be inthe top 10 countries in the world for Internet speed.While in 2010 42% of households were connectedto the Internet, as of 2014, that figure has risen toaround 61%, which means penetration is increasingsteadily. In the same period, average EU householdInternet penetration rose from 70% to 81%, which,given demographic similarities across Europe, indicatesthat the main barrier to further growth in Romania isinfrastructure development. Given that the Internetand telecom market in Romania is highly competitiveand features a number of large international playerswhich are investing in infrastructure and battlingover market share, a continuation of this positivetrend is expected in the coming years. In terms ofenterprises connected to the Internet, Romania’s2014 score positions it around the EU average,whereas in 2010 this indicator clustered Romaniaas showing a competitive disadvantage.
AgricultureRomania has a vast amount of arable land, almosttwice the average per capita area found in other EUcountries. This has always been perceived as a competitiveadvantage. In fact, the value added from agriculturalactivities represented around 6% of Romania’sGDP in 2013, while the EU average in the samemeasure was only 1.7% of GDP. This indicates,however, that Romania remains highly dependent onagricultural revenue in the context of an increasinglyindustrialized, highly-skilled and specialized EuropeanUnion. Agricultural revenue is highly dependent onweather conditions and lacks predictability. In thecontext of the relatively low level of developmentof financial services for this sector, this brings significantvulnerabilities in terms of consolidated budgetaryrevenues.
When assessing the efficiency of agricultural exploitation,Romania remains far behind other EU countries,with agricultural production per hectare 50% lowerthan the EU average. Moreover, the agriculturaloutput is obtained in the context of a high percentageof labor “employed” in agriculture (about 27%)
27
4 2 11
interior EN final:report 3/22/2016 9:10 AM Page 27

28
which may suggest that resources allocation in theeconomy are not optimal.
Given its natural endowment in this sector, Romaniawould be well-advised to keep developing its agriculturaladvantage. Steps should be taken towards increasing
the value added of agricultural products – for
example by moving from export of raw materials
to exports of agricultural based goods processed
in Romania. Other measures to be considered areincreased investments, including investment in irrigation systems, encouraging more efficient landownership structures as well as developing sourcesof revenue from medium and high – skilled industriesin the agricultural sector. This would contribute toincreasing productivity and the value added by thesector as well as its contribution to GDP formation.
EnergyRomania consumes about half the amount of fossilfuels that the average EU country consumes. In lightof the recent EU push to reduce CO2 emissions aswell as reliance on traditional forms of energy generation,this level of emissions is quite competitive. It is importantto note, however, that the reduced emissions are
not the result of successful policies aimed at
significantly lowering carbon dioxide production
within the country, but are in fact the result ofthe abrupt restructuring process of the nationaleconomy in the context of the transition process.This process has been accompanied by structuraltransformation of the economy as well.
Romania also has a competitive advantage in renewablesenergy production, which represents about 23.9%of total energy generation in the country, comparedto an average of 15% at EU28 level. Romania’s advantagecomes mostly from the large hydro plants builtprior to 1990 in Romania’s water rich mountainousareas. However, other forms of renewable energy,mainly wind and solar have seen a considerablesurge in the past few years and have led to an increaseof 2.5 percentage points in renewables’ share oftotal energy production in only 3 years (from 2010to 2013).
The largest energy provider in Romania only controlsaround 27% of the domestic market, while thelargest players in other EU countries represent, onaverage, 54% of their respective markets. While inmany industries such a high level of market controlcould be considered monopolistic and could result
in higher prices and lower quality service for consumers,in the energy sector a high level of market dominancedoes offer certain advantages. Centralization ofelectricity distribution decisions lends higher efficiencyto the system, while economies of scale allow forlower prices. That being said, energy prices in Romaniaare about 20% lower than the EU average, but purchasingpower parity has to be accounted for, as wage levelsare also considerably lower in Romania. Also, pricesin the industry are regulated by the Government toa certain extent.
TransportIn terms of road infrastructure, Romania has traditionallyperformed very poorly compared to its EU peers.Unfortunately no significant progress has beenmade, as less than 200 km of highway have beenbuilt in the last five years, totaling about 700 km.In 2014 the length of highways per million inhabitantsin Romania amounted to less than 10% of thelength of motorways per million in Austria andAustria has a considerably smaller surface area thanRomania. Although countries like Poland and Slovakiahave considerably lower values than Austria in thismetric, Romania still ranks lowest in the benchmarkgroup by a considerable margin. Given Romania’sstrategic geographical position at the border ofEast and West, improving the road and railway
system is paramount for economic development,
attracting FDI and cultivating Romania’s potential
as a logistic hub for the region. Apart from a lowlevel of motorway coverage, Romania also scorespoorly in terms of road interconnectivity with otherEU countries and this has numerous consequences,including increased lead time for road trade betweencountries and a lower export capacity. Romania hashad difficulty improving its road infrastructure becausemost ambitious expansion projects fall apart duringthe planning or negotiation stages, generally becausecosts are deemed to be too high. This issue shouldbe addressed by completely transforming theprocess through which private firms are procuredfor projects and by increasing the transparency ofthe bidding process.
Romania also performs poorly in the air transportsector. Romania has only one major internationalairport, which handles a fraction of the traffic ofmajor airports in more developed EU countries.This has been partly compensated by the investmentsconducted in order to improve Henry Coanda Airport
interior EN final:report 3/22/2016 9:10 AM Page 28

29
and increase its capacity in recent years and by recentenhancement of the number of internationalflights at regional airports, but far more investmentis required for Romania to be able to meet its potentialas a layover hub for flights from the Far and MiddleEast to the West. Romania also has a significantlylower number of airplane passengers per capitathan most other EU countries (15% of the EU average)and while this is certainly partly related to the lackof airport infrastructure throughout the country, itis also a result of the overall low purchasing powerof Romanian consumers, especially since airplaneticket prices are quite uniform across the continent.However, the purchasing power element has beenpartly addressed by the higher availability of lowcost flights that have significantly contributed toeconomic development by introducing a degree ofopenness into the markets and facilitating labormobility.
The rail infrastructure and transportation system inRomania is lagging behind considerably and needssignificant improvements, since efficient rail transportis likely to be an EU priority. According to a 2015analysis commissioned by the European Parliament,Romania has a fairly large network of rail linesopen to commercial traffic (the eighth largest in theEU with a network of 11 000 km, more than 1000stations, almost 200 tunnels and around 6 800bridges) which is in an advanced state of disrepairdue to a chronic lack of maintenance, investmentand poor management. As a consequence, the rail
system is very inefficient and it continues to
deteriorate.
In 2015 Romania adopted the General TransportMaster Plan (GTMP) drawn up by the Ministry ofTransport as a prerequisite for EU funding and approvedby the European Commission in July 2015.
According to the Master Plan, bringing the whole existingrail network to EU standards would be unaffordable -and unnecessary on portions with very low volumesof traffic. The Master Plan therefore suggests
channelling the available resources towards the
main lines serving the majority of demand.
Consequently, the priority for the coming years ofany Government should be to access most of thefunds available, use them in an efficient manner inthe modernisation and development of the systemand not allow this strategic pillar of the economyto deteriorate further.
TourismTourist nights per bed was selected as the primaryindicator for this section because it can be studiedas a measure of tourism's economic activity. However,it does not distinguish business travelers fromtourists and it is a poor method of measuring theattractiveness of the country's cultural sites
and activities, the development of its natural
attractions, the effectiveness of tourism promotion
and the regulation of commercial tourism
infrastructure development. In 2010 touristnights per bed in Romania was 26 % lower than theEuropean average and in 2013 Romania’s performancein this sector still lagged behind the EU average by23%. Since it is hard to isolate tourism activity inthis metric, it is difficult to estimate the proportionthat is attributable to an increase in tourism activity.
It is important to note the great potential that Romaniahas in this area, although this is difficult to quantify.Romania has a highly diverse geography, boastingboth extensive mountain ranges and access to theBlack Sea. Its major cities are modern and offer avibrant nightlife. Most importantly, it is home tonumerous important historical sites and multipleUNESCO World Heritage sites, like the DanubeDelta. With the appropriate levels of investmentand promotion Romania could become, in time,one of the most sought – after European tourismdestinations.
SummaryRomania’s physical infrastructure requires furtherinvestment to reach EU levels of development.Improvements would benefit the overall economy byconnecting rural areas to larger markets, improvingproductivity, reducing transport costs and generallyencouraging development and more economic activity.EU funds are available and could significantly defraythe cost of the necessary development. A comprehensiveand coordinated plan to bring Romanian infrastructureto EU levels should be high on the Government’s listof priorities. The low level of development presentsa significant opportunity to implement integratedintermodal transportation that would reduce costs,increase efficiency and reduce the environmentalimpact of this sector.
interior EN final:report 3/22/2016 9:10 AM Page 29

Policy Learning Points The authorities should aim to do the following:
• Ensure the implementation of the General TransportMaster Plan (adopted in 2015) against a timetableand enforce the existing multiannual budgeting legislationto ring fence major projects and integrate themwith regional business and tourism developmentinitiatives.
• Invest in intelligent utility network infrastructurecoordinated with a focus on increased renewableenergy generation.
• Continue development of the nationwide broadbandcommunications infrastructure.
• Ensure coherent development of e-Government,based on common standards accessible by all localand central Government structures.
• Focus on absorbing the available EU funds fortransport infrastructure by ensuring co-financingsources from the state budget, as well as on developingwell-structured public private partnerships (e.g. forthe construction and operation of highways, as wellas the development of air transport).
• Redesign the contract awarding proceduresthrough which private firms are procured for projectsby increasing the transparency of the biddingprocess in compliance with the new Public ProcurementDirectives.
• Take steps towards increasing the value added ofagricultural products. This objective can be achievedby decreasing exports of raw materials, increasing localproduction using as input agricultural raw materials,increasing investment aimed at capital formation, etc.
30
interior EN final:report 3/22/2016 9:10 AM Page 30

31
Physical Infrastructure
Communication
EU Austria BulgariaCzech
RepublicHungary Poland Romania Slovakia
aver
age
resu
lt
sco
re
(EU
rat
io)
resu
lt
sco
re
(EU
rat
io)
resu
lt
sco
re
(EU
rat
io)
resu
lt
sco
re
(EU
rat
io)
resu
lt
sco
re
(EU
rat
io)
resu
lt
sco
re
(EU
rat
io)
resu
lt
sco
re
(EU
rat
io)
% Enterprises having a broadband connection (fixed conn), 2014 (%)
94.0 96.0 1.0 78.0 0.8 97.0 1.0 88.0 0.9 90.0 1.0 82.0 0.9 93.0 1.0
Households having a broadband connection, 2014 (%)
81.0 81.0 1.0 57.0 0.7 78.0 1.0 75.0 0.9 75.0 0.9 61.0 0.8 78.0 1.0
Broadband penetration rate - numberof broadband access at home (%)
26.5 23.8 0.9 15.0 0.6 21.5 0.8 20.6 0.8 16.0 0.6 14.0 0.5 16.4 0.6
Level of internet access - Households - Households who have internet access at home, 2014 (%)
78.0 79.0 1.0 56.0 0.7 76.0 1.0 74.0 0.9 71.0 0.9 58.0 0.7 76.0 1.0
Physical Infrastructure Communication subsum 3.9 2.8 3.8 3.6 3.4 2.9 3.5
Physical Infrastructure Communication subscore 1.0 0.7 0.9 0.9 0.8 0.7 0.9
Physical Infrastructure Agriculture subsum 2.4 2.4 2.1 2.6 2.0 2.5 2.4
Physical Infrastructure Agriculture subscore 1.2 1.2 1.0 1.3 1.0 1.3 1.2
Physical Infrastructure
Agriculture
EU Austria BulgariaCzech
RepublicHungary Poland Romania Slovakia
aver
age
resu
lt
sco
re
(EU
rat
io)
resu
lt
sco
re
(EU
rat
io)
resu
lt
sco
re
(EU
rat
io)
resu
lt
sco
re
(EU
rat
io)
resu
lt
sco
re
(EU
rat
io)
resu
lt
sco
re
(EU
rat
io)
resu
lt
sco
re
(EU
rat
io)
Arable land (hectars per person),2012
0.2 0.2 0.7 0.5 2.1 0.3 1.4 0.4 2.1 0.3 1.3 0.4 2.0 0.3 1.2
Agricultural Value at current prices, per hectare, 2014
20.2 34.0 1.7 6.7 0.3 13.3 0.7 10.5 0.5 12.8 0.6 9.2 0.5 23.8 1.2
Physical Infrastructure
Energy
EU Austria BulgariaCzech
RepublicHungary Poland Romania Slovakia
aver
age
resu
lt
sco
re
(EU
rat
io)
resu
lt
sco
re
(EU
rat
io)
resu
lt
sco
re
(EU
rat
io)
resu
lt
sco
re
(EU
rat
io)
resu
lt
sco
re
(EU
rat
io)
resu
lt
sco
re
(EU
rat
io)
resu
lt
sco
re
(EU
rat
io)
GDP per unit of energy in use (using constant PPP $ 2011
per kg of oil equivalent), 201210.5 11.2 1.1 5.8 0.6 7.0 0.7 9.0 0.9 8.4 0.8 9.8 0.9 7.8 0.7
Primary Energy use, tonnes of oil equivalent (toe), 2011
3.3 3.9 1.2 2.6 0.8 4.1 1.3 2.5 0.8 2.6 0.8 1.8 0.5 3.2 1.0
Share of renewable energy in grossfinal energy consumption, 2013
15.0 32.6 2.2 19.0 1.3 12.4 0.8 9.8 0.7 11.3 0.8 23.9 1.6 9.8 0.7
Market share of the largest generator inthe electricity market, 2013 (excluding
the Netherlands and Bulgaria)54.4 55.5 1.0 n.a n.a 58.2 0.9 51.9 1.0 17.3 3.1 26.8 2.0 83.8 0.6
Electricity prices for industrial consumers, (in EUR per Kwh),
Mwh <consumption<2000 MWh,2014, S2
0.089 0.079 1.1 0.083 1.1 0.081 1.1 0.082 1.1 0.079 1.1 0.0710 1.3 0.113 0.8
Physical Infrastructure Energy subsum 6.6 3.7 4.8 4.4 6.6 6.4 3.8
Physical Infrastructure Energy subscore 1.3 0.9 1.0 0.9 1.3 1.3 0.8
interior EN final:report 3/22/2016 9:10 AM Page 31
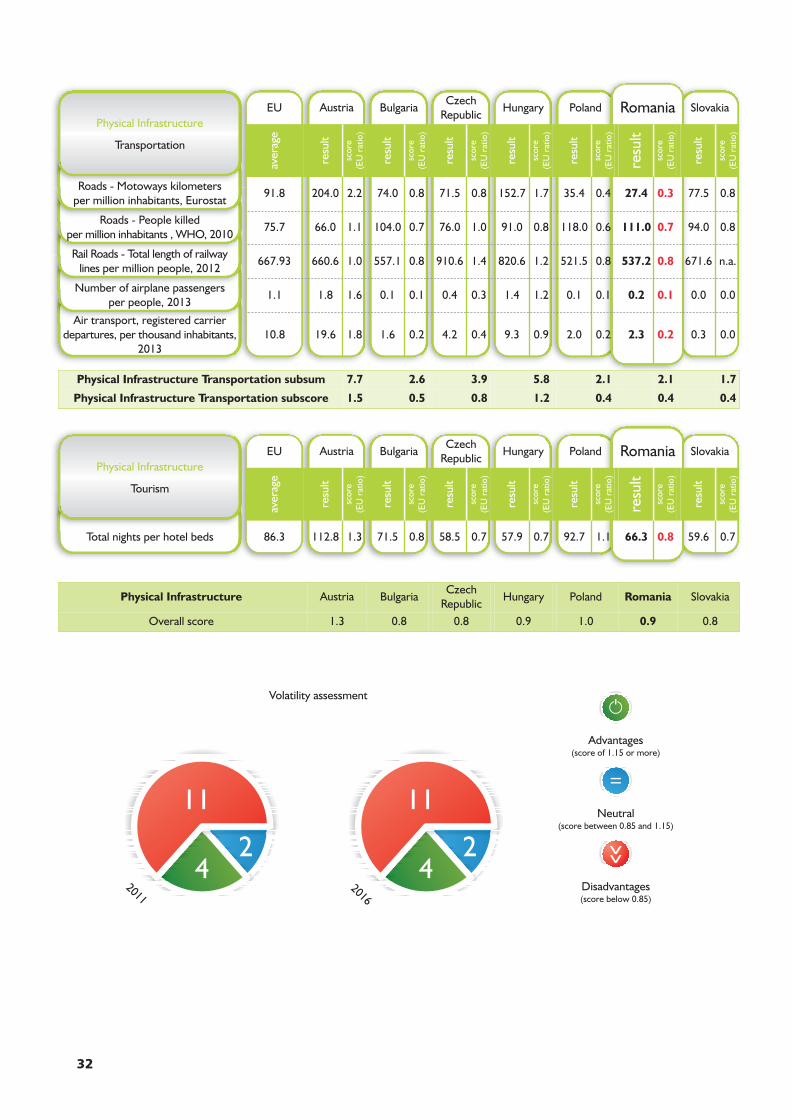
Physical Infrastructure
Transportation
EU Austria BulgariaCzech
RepublicHungary Poland Romania Slovakia
aver
age
resu
lt
sco
re
(EU
rat
io)
resu
lt
sco
re
(EU
rat
io)
resu
lt
sco
re
(EU
rat
io)
resu
lt
sco
re
(EU
rat
io)
resu
lt
sco
re
(EU
rat
io)
resu
lt
sco
re
(EU
rat
io)
resu
lt
sco
re
(EU
rat
io)
Roads - Motoways kilometers per million inhabitants, Eurostat
91.8 204.0 2.2 74.0 0.8 71.5 0.8 152.7 1.7 35.4 0.4 27.4 0.3 77.5 0.8
Roads - People killed per million inhabitants , WHO, 2010
75.7 66.0 1.1 104.0 0.7 76.0 1.0 91.0 0.8 118.0 0.6 111.0 0.7 94.0 0.8
Rail Roads - Total length of railway lines per million people, 2012
667.93 660.6 1.0 557.1 0.8 910.6 1.4 820.6 1.2 521.5 0.8 537.2 0.8 671.6 n.a.
Number of airplane passengers per people, 2013
1.1 1.8 1.6 0.1 0.1 0.4 0.3 1.4 1.2 0.1 0.1 0.2 0.1 0.0 0.0
Air transport, registered carrier departures, per thousand inhabitants,
2013 10.8 19.6 1.8 1.6 0.2 4.2 0.4 9.3 0.9 2.0 0.2 2.3 0.2 0.3 0.0
Physical Infrastructure Transportation subsum 7.7 2.6 3.9 5.8 2.1 2.1 1.7
Physical Infrastructure Transportation subscore 1.5 0.5 0.8 1.2 0.4 0.4 0.4
Physical Infrastructure
Tourism
EU Austria BulgariaCzech
RepublicHungary Poland Romania Slovakia
aver
age
resu
lt
sco
re
(EU
rat
io)
resu
lt
sco
re
(EU
rat
io)
resu
lt
sco
re
(EU
rat
io)
resu
lt
sco
re
(EU
rat
io)
resu
lt
sco
re
(EU
rat
io)
resu
lt
sco
re
(EU
rat
io)
resu
lt
sco
re
(EU
rat
io)
Total nights per hotel beds 86.3 112.8 1.3 71.5 0.8 58.5 0.7 57.9 0.7 92.7 1.1 66.3 0.8 59.6 0.7
Physical Infrastructure Austria BulgariaCzech
RepublicHungary Poland Romania Slovakia
Overall score 1.3 0.8 0.8 0.9 1.0 0.9 0.8
32
interior EN final:report 3/22/2016 9:10 AM Page 32

Trend assessment Number Details
Indicators that clustered as competitive disadvantage in 2011, but have turned into competitive advantage
or neutral meanwhile1 % Enterprises having a broadband connection (fixed conn)
Indicators that clustered as competitive disadvantage in 2011, still are, but have shown better performance
than EU average meanwhile4
Households having a broadband connection, Percentage of Households who have internet access at home, Total nights per hotel
beds, Roads - Motorways kilometers per million inhabitants
Indicators that clustered as competitive disadvantage in 2011, still are, but have shown worse performance than
EU average meanwhile6
Broadband penetration rate-number of broadband access athome, Primary Energy use, tonnes of oil equivalent (toe),
Roads - People killed per million inhabitants, Number of airplanepassengers per people, Air transport, registered carrier
departures, Agricultural value at current prices
Indicators that clustered as competitive advantage or neutral in2011, but have turned into competitive disadvantage meanwhile
1 Rail Roads - Total length of railways lines per million people
Indicators that clustered as competitive advantage or neutral in 2011 and have not changed cluster meanwhile
5
Arable land (hectars per person), GDP per unit of energy in use,Share of renewable energy in gross final energy consumption,Market share of the largest generator in the electricity market,
Electricity prices for industrial consumers
33
interior EN final:report 3/22/2016 9:10 AM Page 33

HumanResources
interior EN final:report 3/22/2016 9:11 AM Page 34
The Government makes an important andbasic contribution to the development ofthe country's human capital through itspolicies on education and research. It cantake steps to encourage further thecontinuous development of human capitalto a coherent range of policies related toeducation, research and continuous training,to increase the level of participation in theworkforce and to encourage the creationof jobs in high value added sectors of theeconomy, which bring greater income andstandard of living. This chapter is dividedinto four areas: labor force, education,
research and development and healthcare.
Labor ForceRomania still lags well behind its EU peers in termsof productivity per hour worked, but it is slowly makingup ground in this regard. This is not unexpected – theRomanian economy is still in the process of shakingoff the lingering constraints of the former commandsystem it used to follow, based on large, unwieldyenterprises and a legacy of inefficient economic policies.But Romania shows advantages in other departments.It achieves competitive scores in both working hours peryear and high tech and medium-high tech employment.Romania’s success in the latter measure should comeas no surprise, especially when one considers the largenumber of high-tech firms that are present on theRomanian market. Large multinational corporationslike Microsoft, Oracle and Ubisoft have been increasingtheir commitment to Romania by increasing the numberof their Romanian employees in recent years, as thereis a constant stream of qualified and cheap (comparedto Western Europe) labor entering the market. Therehas also been a strong emergence of competitive domesticIT and software firms that are fighting for marketshare both domestically and on the world stage (thebest example is probably BitDefender).
While there is still much progress to be made in terms ofoverall workforce skills, the amount of quality educationalresources has been increasing in Romania. In 2014nearly 70% of the eligible workforce held a tertiaryeducation degree, which places Romania at the EUaverage in this respect. Further efforts should, however,be directed towards increasing the quality of education
and alignment with the demands of the labor
market. This measure, together with better employmentopportunities, would help trigger a reversal of the“brain drain” that has plagued the country since theearly 90’s. It would also lead to a direct improvementin the labor productivity of employees.
EducationEducation in Romania is still underdeveloped relativeto the benchmark country group. Romania scoresbelow any other country in the peer group in threevery important indicators: % GDP spent on education,Student/Teacher Ratio and Education – LifelongLearning. These indicators reveal the structuralproblems of the educational system in Romania.This poor showing can be attributed to a turbulentand ever – changing environment in the Romanianpublic school system in the past few years. With the
35
3 10 14
interior EN final:report 3/22/2016 9:11 AM Page 35

36
private school industry still in its infancy in Romania,the public system bears almost the entire burdenof educating millions of pupils and students. Romaniahas had more than 8 Education Ministers in the last10 years and nearly every one of them has radicallychanged the national curriculum and examinationstructure, for reasons which many observers haveclaimed to be mainly partisan or electoral. Romaniahas one of the lowest degrees of spending on education,at only 3% of its GDP (decreasing from 4.25% in2010). Low teacher compensation is also an importantissue that truly contributes to the atmosphere ofuncertainty that permeates the public school systems.Large-scale teacher strikes and school shutdownshave been all too common in post – 2000 Romania.Romania needs a multilaterally agreed upon
cohesive national education strategy that will
not be subject to constant tinkering and would
also benefit from increased GDP spending on
education and higher teacher compensation or
incentive programs. Teacher compensation hasbeen improved by recent increases in salaries. Lifelonglearning must also be improved by increasing thenumber and quality of vocational training programsthroughout the country. Apart from raising theoverall skill of the labor force, increased vocationaltraining will also help combat structural unemployment.It is important to mention that education is one ofthe most difficult sectors to reform, as it is hard togauge the results of specific policies until manyyears have passed. Best practice systems fromhighly competitive countries like Finland or theUnited Kingdom can be analyzed in order to identifyappropriate policies to be implemented.
It is important to note, however, that the resultsdisplayed by Romania in English Proficiency, Science/Math/Tech graduates, Reading, Mathematics andScience Scores cluster Romania as either neutral orshowing a competitive advantage in these areas.This is an additional argument for sustainablemeasures to be taken in this field – there is a lot
of potential in the Romanian workforce that
can be translated into value added for the economy
by building a competitive advantage on the
skills of employees, not on the wage level. This
is what builds sustainable growth.
Research and Development
CEEC nations perform quite poorly in this area, althoughthe Czech Republic and Hungary have started to aligntheir spending on R&D to the EU average. Romania’sperformance is consistently disappointing across allindicators in this section. A very relevant indicator,R&D expenditure as % of GDP, decreased from 0.47%in 2009 to 0.39% in 2013, only increasing the gap with theEU average. However, there has been some improvementin several of the categories, like total spending per researcher(which increased at an average annual rate of 11% during2009 – 2013). While Romania is far from being competitivein this regard, the trend is favorable and likely to continuein the coming years. This increase in spending per
researcher should be doubled by an increase in
Government and private sector R&D spending and
combined with efficient, targeted policies that aim
to improve the innovation output of the country.
For instance, the Government should support thedevelopment of an education cluster, where theGovernment would provide the legal framework thatwould entice major university centers to partner up withprivate sector companies to further advance R&D,innovation, etc. Some examples exist in Timisoara,Sibiu, and Iasi, but a much more coherent policy isneeded to scale this up. Primarily, the Government mustaim to push the university system into a more central rolein the country’s research endeavors, perhaps by creatingfinancial incentives for innovation or encouraging private-public partnerships. Looking closely at the U.K. or U.S.
university systems will reveal valuable lessons and
best practices that should be applied in Romania.
In 2009 non-resident patent applications in Romaniarepresented less than 4% of the EU average, while themeasure currently places Romania at about 5% of theEU average. It is important to note here that patentapplications have been growing across the EU as welland that the average is slightly skewed due to countries likeGermany, which have a truly vast number of non-residentpatent applications annually. This increase can be partiallyattributed to the growing number of foreign firmsand entities that have entered the Romanian market inrecent years.
Domestic high-tech patent applications have alsodecreased significantly and only represent 3% of theEU average. In 2007 Romania recorded 0.7 high-techpatents per million inhabitants and that value decreasedto 0.20 per million in 2012.
interior EN final:report 3/22/2016 9:11 AM Page 36

37
HealthcareWhen looking generally at EU demographics, Romaniafaces similar challenges to other EU member statesfrom the perspective of an aging population as well aswhen it comes to the future financial viability of pensionsplans, which need to be adjusted to reality. However,additional challenges for Romania are visible at firstinstance and they intervene with the need for finalizingreform of the healthcare system. These challenges relateto the level of financing in the sector, allocation offinancial resources, decentralization of the hospitalsystem, as well as structural deficiencies of the NationalHealth Insurance Fund (FNUASS), all of which standin the way of Romanian patients getting care at Europeanstandards.
Romania performs poorly both in terms of quality andefficiency of the healthcare system. Shortfalls in qualityare underlined by unmet needs for medical examinations(too expensive or too far for patients to travel to a doctor)and for treatment (waiting lists for approval of paperworkand delayed access to innovative treatments). The lag
behind Europe in terms of efficiency is highlighted
by gaps in healthcare expenditure per capita, doctors
per 1000 inhabitants and hospital beds per doctor.
In addition to the insufficient level of funding (withthe public sector as the major provider of funding andwith a lower level of consolidated budget revenues inRomania compared with the EU average), one shouldalso take into account the decentralized system, thediversity of actors, insurance contributions and contractualrelations between service providers and the HealthInsurance Authority (CNAS). All of these indicators
show a stringent requirement for structural reform
of the healthcare system in Romania.
Increased competition between the public and privatehealth systems should be also encouraged, as competitionis mainly focused on the funding provided by theHealth Insurance House (CNAS). In addition, whenit comes to the private health sector, with a generalstrategy of attracting patients with above averageincomes and a focus on providing medical serviceswhich involve lower consumption of medicines andsanitary materials, the result is seen in an increase inthe number of inpatients in private hospitals (byapproximately five times between 2006 and 2013).We have to take notice of a private healthcare sectorwhich is much more developed in Bucharest than therest of Romania (the rural areas being disadvantagedfrom the perspective of the levels of service) as wellas a shortage at country level of specialized clinics or
hospitals in high priority specialties such as general surgery,cardiology, oncology and oncology surgery, emergencyservices (nevertheless, since 2013 a small number ofspecialized hospitals have focused on one or more ofthese priority services, especially in Bucharest).
In 2015 the Ministry of Health and the Health InsuranceAuthority (CNAS) made some small steps on the wayto reform in healthcare by taking the following measures:an update of the reimbursement list of medicines(about 35 medicines for rare and chronic diseases wereadded), a 25% increase in salaries for employees in thepublic healthcare system (from November 2015) andthe introduction of mandatory healthcare card forevery insured citizen (from May 2015). These areexamples that complement a high level overview ofthe healthcare system in Romania, where the statebudget finances investments in hospitals, the HealthInsurance House (CNAS) debits the medical servicesand medicines, and local authorities cover the maintenanceand repair expenditures for hospitals that they havetaken over responsibility for following the decentralizationreform.
In line with general medical innovation and technologicaladvances that have led to the increased use of outpatienttreatment - minor surgery, procedures and treatmentachieved within a shorter time span than major, orinpatient care – the trend, with beneficial public
budgetary effects, should be to move an increasing
portion of patient care from an inpatient setting
to an outpatient one. Moreover, a reduction in thelength of stay in an inpatient setting, which shallrepresent a key performance indicator for acute-carehospitals, will result in reduced cost for medical care.Moreover, in addition to shifting to outpatient care,Romania should also consider a coherent preventionprogram that encourages early diagnosis and a healthylifestyle among citizens, lowering the burden oftreatment in the long term.
These are elements that should be related to the arrearsanalysis in the Romanian public healthcare system asthe competition between public and private hospitalsfor Health Authority funding will become more evident,the private healthcare insurance market (which is rather weak at his moment) will see a further advance and the public healthcare sector will remainunder-financed.
Overall, Romania still needs to make importantchanges in healthcare in order to make sure it offersthe basis for good productivity for Romanian citizens.All the reform components highlighted above should
interior EN final:report 3/22/2016 9:11 AM Page 37

be seen through the lenses of productivity and the costof poor healthcare for businesses both in terms ofproductivity and absenteeism. It is crucial that the
Romanian healthcare sector is not perceived only
as a “black hole” for public funding, but becomes
an acknowledged contributor to economic growth.
Health is a value in itself and also a precondition foreconomic prosperity. In order to create wealth a societyneeds health. We cannot speak about a healthy businesswithout a healthy community. Indeed, healthy peopleare more active, more productive and contribute moreto the development of the economy and society.Moreover, the health sector has great potential to createnew jobs to reduce unemployment.
SummaryWhile analyzing Romania’s human resources, 4 areasof strength are revealed: Efficiency - Hospital beds perdoctor, percentage of students learning 2 or morelanguages, accidents at work and people with longstanding illness or health problems. A worrying trendcan be observed in the healthcare when comparingindicators from 2013 and 2011 in terms of efficiency.Healthcare expenditure per capita and number ofdoctors per 1000 inhabitants are all indicators thatcluster Romania as having a competitive disadvantagewhereas they showed good performance in 2011.
Policy Learning Points The authorities should aim to do the following:
• Elaborate and enforce a coherent policy frameworkto support Romania's standard of living and populationgrowth in the context of the country's aging populationand its impact on real economy and financial sustainability.
• Offer incentives to keep highly skilled specialists inRomania and reverse the brain drain, building on thepositive experience of the IT sector.
• Urgently implement healthcare reform – both interms of retention of medical specialists as well asincreasing the level and efficiency of public investmentsand creating the framework for private investments.
• Increase Government and private sector R&Dspending and adopt efficient, targeted policies that aimto improve the innovation output of the country.
• Improve the quality of the labor market by:
1. Increasing the level of education of the activelabor force (e.g. e-Learning, Life-Long Learning).
2.Increasing the quality of the education system,including high school, vocational schools andhigher education (Master and PhD degrees) tobridge the gap with market needs.
3.Strengthening connections between universities,research centres and companies by aligning curriculaand research objectives to the needs of the privatesector.
4.Enhancing young people's entry into the labormarket through integrated action including guidance,counselling, internships and apprenticeships.
5.Promoting greater involvement of experiencedspecialists, including retirees.
38
interior EN final:report 3/22/2016 9:11 AM Page 38

39
Human Resources
Labor Force
EU Austria BulgariaCzech
RepublicHungary Poland Romania Slovakia
aver
age
resu
lt
sco
re
(EU
rat
io)
resu
lt
sco
re
(EU
rat
io)
resu
lt
sco
re
(EU
rat
io)
resu
lt
sco
re
(EU
rat
io)
resu
lt
sco
re
(EU
rat
io)
resu
lt
sco
re
(EU
rat
io)
resu
lt
sco
re
(EU
rat
io)
Productivity per hour worked as % of GDP, 2013
32.1 39.9 1.2 4.9 0.2 13.1 0.4 11.5 0.4 10.6 0.3 5.6 0.2 13.20 0.41
Labor force - High tech and mediumtech (% of total employment), 2013
5.6 5.8 1.0 3.8 0.7 10.8 1.9 8.5 1.5 5.0 0.9 4.8 0.9 9.80 1.75
Labor force - Working hours per employee, per year, 2012
1,736 1,751 1.0 1,723 1.0 1,749 1.0 1,780 1.0 1,685 1.0 1,850 1.1 1,705 0.98
Labor force - % 15-64 with tertiary education, 2014
72.6 79.7 1.1 77.4 1.1 87.6 1.2 78.0 1.1 84.5 1.2 68.8 0.9 84.80 1.17
Human Resources Labor Force subsum 4.4 2.9 4.6 4.0 3.4 3.0 4.3
Human Resources Labor Force subscore 1.1 0.7 1.1 1.0 0.8 0.8 1.1
Human Resources
Education
EU Austria BulgariaCzech
RepublicHungary Poland Romania Slovakia
aver
age
resu
lt
sco
re
(EU
rat
io)
resu
lt
sco
re
(EU
rat
io)
resu
lt
sco
re
(EU
rat
io)
resu
lt
sco
re
(EU
rat
io)
resu
lt
sco
re
(EU
rat
io)
resu
lt
sco
re
(EU
rat
io)
resu
lt
sco
re
(EU
rat
io)
Education, English Proficiency,TOEFL Scores, 2014
85.5 100.0 1.2 88.0 1.0 91.0 1.1 91.0 1.1 90.0 1.1 90.0 1.1 N/A N/A
Education - % Students learning 2 or more languages, 2012
50.6 74.2 1.5 74.3 1.5 98.8 2.0 45.3 0.9 70.1 1.4 98.4 1.9 99.0 2.0
Education - % GDP spent on education, 2011
5.3 5.8 1.1 3.8 0.7 4.5 0.9 4.7 0.9 4.9 0.9 3.1 0.6 4.1 0.8
Education - Science/ Math/Tech graduates, 2012
22.8 25.6 1.1 20.1 0.9 22.3 1.0 N/A N/A 16.9 0.7 24.8 1.1 20.6 0.9
Education - Student/Teacher Ratio(ISCED 1-3) 2012
11.9 10.1 1.2 13.9 0.9 13.2 0.9 11.3 1.1 10.7 1.1 15.4 0.8 14.1 0.8
Education - Lifelong Learning, 2014
10.7 14.2 1.3 1.8 0.2 9.3 0.9 3.2 0.3 4.0 0.4 1.5 0.1 3.0 0.3
Education - Reading Scores, 2012
510.7 490.0 1.0 436.0 0.9 493.0 1.0 488.0 1.0 518.0 1.0 438.0 0.9 471.0 0.9
Education - Math Scores, 2012
513.4 506.0 1.0 439.0 0.9 499.0 1.0 477.0 0.9 518.0 1.0 445.0 0.9 482.0 0.9
Education - Science Scores, 2012
516.1 506.0 1.0 446.0 0.9 508.0 1.0 494.0 1.0 526.0 1.0 439.0 0.9 471.0 0.9
Human Resources Education subsum 10.3 7.7 9.5 7.1 8.6 8.2 7.5
Human Resources Education subscore 1.1 0.9 1.1 0.9 1.0 0.9 0.9
interior EN final:report 3/22/2016 9:11 AM Page 39

Human Resources
R&D
EU Austria BulgariaCzech
RepublicHungary Poland Romania Slovakia
aver
age
resu
lt
sco
re
(EU
rat
io)
resu
lt
sco
re
(EU
rat
io)
resu
lt
sco
re
(EU
rat
io)
resu
lt
sco
re
(EU
rat
io)
resu
lt
sco
re
(EU
rat
io)
resu
lt
sco
re
(EU
rat
io)
resu
lt
sco
re
(EU
rat
io)
Patent applications by non-residents
per million inhabitants, 201357.9 28.8 0.5 2.1 0.0 9.2 0.2 6.7 0.1 4.5 0.1 2.7 0.05 2.6 0.0
Commercialzation High Tech patents per million, 2012
7.8 10.2 1.3 0.2 0.0 0.6 0.1 1.6 0.2 1.1 0.1 0.2 0.03 0.6 0.1
Patent applications to the Europeanpatent office, 2012
1,963.7 1,804.3 0.9 22.2 0.0 188.0 0.1 198.4 0.1 469.4 0.2 55.9 0.03 53.2 0.0
Gross R&D expenditure as % GDP,2013
2.0 2.8 1.4 0.7 0.3 1.9 1.0 1.4 0.7 0.9 0.4 0.39 0.19 0.8 0.4
R&D spending per researcher euro thousands, 2013
119.6 227.3 1.9 21.7 0.2 83.0 0.7 56.4 0.5 48.6 0.4 29.8 0.25 41.5 0.3
Share of Government budget appropriations on R&D
as % of total general Government expenditure, 2013
1.4 1.6 1.1 0.7 0.5 1.6 1.1 1.3 1.0 0.9 0.6 0.6 0.42 1.0 0.7
Human Resources R&D subsum 7.1 1.0 3.1 2.6 1.9 1.0 1.6
Human Resources R&D subscore 1.2 0.2 0.5 0.4 0.3 0.2 0.3
Human Resources Healthcare subsum 16 7 9 7 5 7 6
Human Resources Healthcare subscore 2.0 0.9 1.1 0.8 0.6 0.8 0.9
Human Resources
Healthcare
EU Austria BulgariaCzech
RepublicHungary Poland Romania Slovakia
aver
age
resu
lt
sco
re
(EU
rat
io)
resu
lt
sco
re
(EU
rat
io)
resu
lt
sco
re
(EU
rat
io)
resu
lt
sco
re
(EU
rat
io)
resu
lt
sco
re
(EU
rat
io)
resu
lt
sco
re
(EU
rat
io)
resu
lt
sco
re
(EU
rat
io)
Healthcare - Quality - Healthy years as % of life expectancy,
avg male and female, 20130.9 0.9 1.0 0.9 1.0 0.9 1.0 0.9 1.0 0.9 1.0 0.9 1.03 0.9 1.0
Healthcare - Quality - unmet needs for medical examination (too
expensive or far, or waiting list), 20133.6 0.4 9.0 8.9 0.4 1.0 3.6 2.4 1.5 8.8 0.4 10.4 0.35 1.9 1.9
Healthcare Quality - accidents atwork per 100,000 inhabitants, 2012
17.5 668.1 0.0 24.2 0.7 342.7 0.1 168.5 0.1 175.1 0.1 14.4 1.21 138.2 0.1
Healthcare - Quality - people with long standing illness or health
problem % population, 201332.5 34.5 0.9 19.1 1.7 31.5 1.0 37.0 0.9 34.1 1.0 19.7 1.65 30.7 1.1
Healthcare - Efficiency - healthcare expenditure per capita, euro, 2013
2,659.7 4,174.8 1.6 426.9 0.2 1,051.6 0.4 812.1 0.3 688.4 0.3 387.5 0.15 1,118.5 0.4
Healthcare - Efficiency - Doctors, per 1000 inhabitants, 2011
3.5 4.8 1.4 3.9 1.1 3.6 1.0 3.0 0.8 2.2 0.6 2.4 0.67 n.a n.a
Healthcare - Efficiency - Hospital beds per 1000 inhabitants, 2011
5.4 7.6 1.4 6.4 1.2 6.8 1.3 7.2 1.3 6.5 1.2 6.1 1.14 6.0 1.1
Healthcare - Efficiency - Hospitalbeds per doctor, 2011
1.5 1.6 1.0 1.7 0.9 1.9 0.8 2.4 0.6 3.0 0.5 2.6 0.59 n.a n.a
40
Human Resources Austria BulgariaCzech
RepublicHungary Poland Romania Slovakia
Overall score 1.4 0.7 1.0 0.8 0.7 0.7 0.8
interior EN final:report 3/22/2016 9:11 AM Page 40

Trend assessment Number Details
Indicators�that�clustered�as�competitive�disadvantage�
in�2011,�but�have�turned�into�competitive�advantage�
or�neutral�meanwhile
1Labor�force�-�High�tech�and�medium�tech�
(%�of�total�employment)
Indicators�that�clustered�as�competitive�disadvantage�in�2011,�
still�are,�but�have�shown�better�performance�
than�EU�average�meanwhile
5
Productivity�per�hour�worked�as�%�of�GDP;�Patent�applications�
by�non-residents�per�million�inhabitants;��High�Tech�patents�
per�million;�Patent�applications�to�the�European�patent�office;�
R&D�spending�per�researcher
Indicators�that�clustered�as�competitive�disadvantage�in�2011,�
still�are,�but�have�shown�worse�performance�than�
EU�average�meanwhile
8
%�GDP�spent�on�education;�Quality�-�unmet�needs�for�medical�
examination;�Share�of�Government�budget�appropriations�on�
R&D�as�%�of�total�general�Government�expenditure;�
Education�-�Student/Teacher�Ratio;�
Education�-�Life�-�Long�learning;�
2014,�Efficiency�-�healthcare�expenditure�per�capita
Indicators�that�clustered�as�competitive�advantage�or�neutral�in
2011,�but�have�turned�into�competitive�disadvantage�meanwhile1 Healthcare�Quality�-�accidents�at�work�per�100,000�inhabitants
Indicators�that�clustered�as�competitive�advantage�or�
neutral�in�2011�and�have�not�changed�cluster�meanwhile12
Labor�force�-�Working�hours�per�employee;�%�of�students
learning�2�or�more�languages;�Education,�English�Proficiency,
TOEFL�Scores;�Science/�Math/Tech�graduates;�Reading�Scores;
Math�Scores;�Science�Scores;�Quality�-�Healthy�years�as�%�of�life�
expectancy;�Quality�-�people�with�long�standing�illness�or�health
problem�%�population;�Labor�force�-�%�15-64�with�tertiary�
education;�Efficiency�-�hospital�beds�per�1000�inhabitants
41
interior EN final:report 3/24/2016 12:33 PM Page 41

Fiscal & MonetaryPolicy
interior EN final:report 3/22/2016 9:11 AM Page 42

43
While recognising virtues of agreementswith international institutions for the stabilityof public finances, budgetary policy shouldincrease the quality of public spending,especially by prioritising public investmentexpenditure based on cost-benefit analysis.This chapter analyses selected indicators inthe areas of Government / finance andfiscal / monetary.
Given the favourable macroeconomic context over thepast few years, the Government deficit as a percentageof GDP decreased from 5.4% in 2011 to 1.4% in2014, while the public debt increased from 34% in2011 to 40% in 2014. Together with an estimatedbudget deficit for 2015 of around 1.2% of GDP (theestimated target was 1.86%), both of these indicatorsposition Romania comfortably from the perspectiveof the EU average. However, these indicators do notreflect the newly adopted Fiscal Code (approved onJune 24, 2015) nor the commitments already assumedby Romania in relation to the EU or other internationalbodies. They also need to be considered in the contextof the significant failure of the authorities to implementmajor capital expenditure projects especially in timesof crisis. The quality of public expenditure needsto be considered when analysing the levels of thebudget deficits. Continuation of this trend of low
investment in physical infrastructure would mean
that sustainable economic growth would be
rather difficult to achieve since strong private
consumption cannot be a sustainable source of
economic expansion.
In addition, with respect to the newly adopted FiscalCode, the reduction of taxes is likely to have a significantimpact on the Government deficit in the next fewyears. According to the Fiscal Council, the estimatedimpact of the fiscal reform amounts to approximately2% of GDP in 2016. The fiscal reform includedsignificant measures which will boost consumption (suchas the decrease in indirect taxes like VAT and excises).
With respect to commitments already assumed byRomania in relation to EU bodies, the most restrictiveis the MTO that sets the target for the structural deficitat 1% of GDP. Another criterion, referred to as theMaastricht criterion, sets the maximum level of fiscaldeficit at 3% of GDP. In this context, many investorsexpect a widening of the fiscal deficit, which maytranslate into higher financing costs (which are alreadyhigher than the EU average).
Consequently, monetary policy should carefully
weigh the estimated effect that the expected increase
in demand (arising from fiscal reform that stimulates
consumption) will have on consumer prices. In theshort term, it is expected that consumer prices willshow a decreasing trend as a result of the decrease inthe VAT rate and in excises.
2 0 5
interior EN final:report 3/22/2016 9:11 AM Page 43

Policy Learning PointsThe authorities should aim to do the following:
• Ensure coherence of the already adopted fiscalreform and find solutions for managing the fiscaldeficit, both effective and structural, by either:
o Improvement of the structure and efficiencyof Government expenditure.
o Increase in the tax collection rate/decrease oftax avoidance.
• Conduct a monetary policy that carefully takesinto account the estimated effect that the fiscal reformwill have on consumer prices.
• Carry out significant reform of the tax administration,modernize and simplify tax collection, reduce taxevasion and reduce the taxpayer’s complianceburden. Finalize the reform of fiscal administrationand establish an economically efficient public revenue collection system that facilitates privatesector development.
• Further stimulate lending in local currency and thedevelopment of a local currency debt market.Prompt long-term saving behaviour of the populationby encouraging participation in private pensionfunds, private healthcare insurance plans, as well asstimulating the activity of saving – lending banks.
• Recognize and develop the capital markets as animportant alternative source of capital, for bothprivate and public borrowers. The development ofstrong and liquid local capital markets will providemuch needed funding for private and public investmentand will reduce the dependence of the economy onbanking financing.
44
interior EN final:report 3/22/2016 9:11 AM Page 44

45
Trend assessment Number Details
Indicators that clustered as competitive disadvantage in 2011, but have turned into competitive advantage
or neutral meanwhile0 No indicator in this cluster
Indicators that clustered as competitive disadvantage in 2011, still are, but have shown better performance
than EU average meanwhile1 Long Term Government Bond Yields
Indicators that clustered as competitive disadvantage in 2011, still are, but have shown worse performance than
EU average meanwhile2
Hamortized indices of Consumer Prices, Credit Depth of information index
Indicators that clustered as competitive advantage or neutral in2011, but have turned into competitive disadvantage meanwhile
0 No indicator in this cluster
Indicators that clustered as competitive advantage or neutral in 2011 and have not changed cluster meanwhile
2Government gross debt as % GDP 2014,
Government deficit/surplus as % GDP 2014
Fiscal Monetary
Policy
EU Austria BulgariaCzech
RepublicHungary Poland Romania Slovakia
aver
age
resu
lt
sco
re
(EU
rat
io)
resu
lt
sco
re
(EU
rat
io)
resu
lt
sco
re
(EU
rat
io)
resu
lt
sco
re
(EU
rat
io)
resu
lt
sco
re
(EU
rat
io)
resu
lt
sco
re
(EU
rat
io)
resu
lt
sco
re
(EU
rat
io)
Long Term Government Bond Yields,September 2014
1.5 0.8 1.9 3.0 0.5 0.7 2.2 3.6 0.4 2.6 0.6 3.7 0.4 1.2 1.2
Credit Depth of information index,2014
8.0 7.0 0.9 0.0 0.0 4.0 0.5 0.0 0.0 0.0 0.0 5.0 0.6 0.0 0.0
HICP/Hamortized indices of ConsumerPrices, 12/2014, (2005=100)
120.8 121.4 1.0 142.0 0.9 122.2 1.0 143.1 0.8 124.8 1.0 154.4 0.8 122.4 1.0
Government Finance
Statistics
EU Austria BulgariaCzech
RepublicHungary Poland Romania Slovakia
aver
age
resu
lt
sco
re
(EU
rat
io)
resu
lt
sco
re
(EU
rat
io)
resu
lt
sco
re
(EU
rat
io)
resu
lt
sco
re
(EU
rat
io)
resu
lt
sco
re
(EU
rat
io)
resu
lt
sco
re
(EU
rat
io)
resu
lt
sco
re
(EU
rat
io)
Government gross debt as % GDP 2014
86.8 84.2 1.0 27.0 3.2 42.7 2.0 76.2 1.1 50.4 1.7 39.9 2.2 53.5 1.6
Government deficit/surplus as % GDP 2014
-3.0 -2.7 1.1 -5.8 0.5 -1.9 1.6 -2.5 1.2 -3.3 0.9 -1.4 2.1 -3 1.1
Fiscal & Monetary Policy Austria BulgariaCzech
RepublicHungary Poland Romania Slovakia
Overall score 1.2 1.0 1.5 0.7 0.8 1.2 1.0
interior EN final:report 3/22/2016 9:11 AM Page 45

Legal & RegulatoryFramework
interior EN final:report 3/22/2016 9:11 AM Page 46

Labor LawThe labor environment is governed by a comprehensiveLabor Code that provides an all-embracing legalframework and generally regulates labor law relationships,while certain labor issues are governed by special laws(such as Law no. 62/2011 on Social Dialogue).
Traditionally, labor legislation has been viewed
as excessively favoring employees and, in 2011,
in an attempt to support the labor market and
provide more flexibility to employers, substantial
amendments were enacted. Among other changes,the 2011 amendments to the Labor Code placed anincreased emphasis on performance, providing anextension of probation periods and of dismissal andresignation notices and sought to facilitate the use offixed-term employment, temporary work and othermore flexible forms of work.
Nonetheless, dismissals remain difficult as they may bemade only on the basis of certain statutory reasons fordismissal, which are viewed as narrow, as well as subjectto fulfilment of complex formalities. For example, themandatory notice period for termination of employmentcontracts cannot be shorter than 20 working days.
However, the Romanian law does not provide forminimum severance payments to dismissed employees,as such severance payments are usually subject to eitherindividual or collective negotiations between the parties.
Employees may be held liable for damages caused totheir employer, but the amount of damages is cappedat a maximum threshold set out under the Labor Code(5 times the minimum monthly gross salary applicable atnational level and approved under Government Decision,currently RON 1,050, approximately EUR 230).Additional amounts exceeding the legal threshold arepayable only as a result of a court ruling.
Romanian law regulates part-time work and work fromhome, but not specifically on-call employment andjob sharing, which are not common and need to beimplemented indirectly, through the use of other concepts(implementation of uneven work schedules, or part-timecontracts, generally with the employee’s cooperation).
If, further to a court dispute regarding the validity ofemployment termination, the court decides thattermination was void, the employee is reinstated andhis/her contract is retroactively considered valid, withthe employee being entitled to his/her salary for theperiod between the unlawful contract termination andhis/her reinstatement.
Law no. 62/2011 on Social Dialogue was enacted inMay 2011, unifying the legal framework governingtrade unions and employers’ organizations. Collectivebargaining agreements may be concluded only atindustry, group of companies and company level andare applicable only to the parties that have negotiatedand signed such agreements.
While employment of EU nationals has become easiersince Romania‘s accession to the EU, the procedureto be followed for the assignment/employment ofnon-EU nationals who need work and residencepermits is currently complex and time consuming.For short-term projects it is usually unrealistic to useworkers from outside the EU, as obtaining a workpermit can take several months.
TaxesThe length of court proceedings has always been aproblem in Romania. Certain steps have been made inthis respect: a New Civil Procedure Code entered intoforce in 2013. Nevertheless, in Romania the averagelength of proceedings to challenge a tax decision is2-3 years. One of the essential rights of a taxpayerbefore the tax authorities is the right to obtain a statementof reasons for each material decision imposed by thetax authorities, which is already applicable in Romania.
Another cornerstone of fair tax administration is thesuspensive effect of an appeal against tax authorities’decisions. In Romania, an appeal does not have asuspensive effect, irrespective of whether it is anadministrative appeal against the relevant departmentof the tax authorities or an appeal in court. This favorsthe tax authorities, which can collect taxes from taxpayersand return excess payments only following a relevantcourt decision. In Romania, the principle in dubio contrafiscum (=when legislation is unclear, it should beinterpreted in favor of the taxpayer) has only recentlybeen introduced into fiscal legislation, through the reformof the Fiscal Code and Fiscal Procedure Code. Thisprinciple is regulated under article 13 (6) of the FiscalProcedure Code, which entered into force fromJanuary 1st, 2016. Hopefully, this amendment will reduceabuse against taxpayers and improve the behaviour oftax inspectors.
Tax authorities can issue binding rules in connectionwith certain tax related issues, which all tax offices arethen required to take into consideration. One suchexample is the „advance individual tax ruling” andrefers to a taxpayer’s future operations. It is valid and
47
interior EN final:report 3/22/2016 9:11 AM Page 47

48
binding on tax authorities only if the taxpayer complieswith its terms and conditions.
Taxpayers must express their standpoint with respectto regulations applicable to a certain issue and can haveprior meetings with the tax authorities. If taxpayersdisagree with the content of a regulation, they may notifythe tax authorities, in which case the solution will nolonger be considered binding. However, the procedureis rather complicated and time consuming. To increasetransparency, the tax authorities should publish, as inother EU member states, a report showing the numberof requested vs. issued binding rules, as well as advanceprice arrangements.
The Fiscal Code regulates the main direct and indirecttaxes applicable to individual and corporate taxpayers.
Romania has had a flat rate system since 2005 and thecurrent applicable rate is 16%. The country’s tax systemfavours employees with higher salaries, although therate of social security contributions is rather high.With gross pay of EUR 1,000; EUR 2,000; EUR3,000, the take-home net pay/employer’s costs is EUR701/EUR 1,229; EUR 1,403/EUR 2,454; and EUR2,106/EUR 3,682 respectively. The calculation basefor social security contributions is capped at 5 timesthe monthly gross salary at national level (the cap isapproximately EUR 2,980/month).
There is no integrated ‘one-stop-shop’ dealing with alltaxes, social security, pension and health insurancepayments for employees.
From a corporate income tax perspective, there arecertain incentives, although not tax-based, available to allinvestors in Romania such as: (i) accelerated depreciation,(ii) special allowances for expenses related to R&D activitiesand (iii) reinvested profit. In addition, certain tax incentivesmay be granted to individual investors ("business angels")starting 2015, i.e. dividend tax exemption in the first 3years of investment and capital gains tax exemption ifshares are sold after at least 3 years. From a personalincome tax perspective, income earned by employeesworking in software creation is free of personal incometax, subject to certain conditions to be met by bothemployer and employee. There also are specific incentivesbut with their applicability limited to only certain socialsecurity contributions such as the unemploymentcontributions (e.g. for employers hiring new graduates/individuals with disabilities/unemployed individualsover the age of 45 /sole family supporters).
Insofar as indirect taxation is concerned, from January 1st,2016 (the date when the new Fiscal Code entered
force), the standard VAT rate in Romania is 20%.Certain types of goods benefit from reduced rates,e.g. 9% for food products, hotel accommodation,etc. and 5% for magazines, newspapers, tickets tothe cinema, family/individual housing under certainconditions, residential estates designed for retirementhomes, etc.
With respect to taxpayers required to register for VATpurposes and account for VAT in Romania, there is athreshold of EUR 65,000 (or RON 220.000) for theexemption of small enterprises. Consequently, taxpayersthat do not supply goods/services during a calendaryear in excess of this threshold are not required toregister for VAT purposes in Romania or to pay RomanianVAT. It is also important to note that, generally, forthe import of goods in Romania, taxpayers are requiredto pay the related VAT to the customs authorities andsubsequently deduct the VAT. Nevertheless, wheretaxpayers hold an import VAT payment defermentcertificate, they are not required to pay VAT uponimport of goods and apply the VAT reverse chargemechanism. The import VAT deferment certificateis granted to the following business operators:1) Authorized Economic Operators (AEOs), 2) operatorsholding an on-site customs clearance authorization or3) operators which have imported goods over theprevious last 12 months with an aggregate value of atleast RON 100 million.
Starting a Business in Romania
According to recent data collected by the World
Bank’s Doing Business, globally, Romania ranks
37th out of 189 economies analysed when it comes
to the ease of starting a business. Several types ofcompanies may be established in Romania, i.e.: (i) Limitedliability company (SRL), (ii) Joint stock company (SA),(iii) General partnership (SNC), (iv) Limited partnership(SCS), (v) Limited partnership by shares (SCA).
Among other several key indicators on businessregulations proving that Romania is a good place tostart a business, we have identified the following:
(i) In principle, shareholders may limit their liability to thirdparties (e.g. the company’s creditors) up to the value ofthe share capital contribution, by choosing to incorporatea limited liability company or a joint stock company.
(ii) A limited liability company may be incorporatedwith a minimum share capital of approx. EUR 47.
interior EN final:report 3/22/2016 9:11 AM Page 48

49
(iii) The standard timeframe for incorporating a companywith the relevant Romanian registry (i.e. the TradeRegistry) or for registering various corporate changes(e.g. new directors, share capital increases/decreases,etc.) is 3-5 business days from the date when the TradeRegistry establishes that the incorporation/ registrationfile is complete.
(iv) The costs (e.g. Trade Registry fees) for incorporatinga company are low.
(v) If all conditions have been met, the general authorization procedure needed to start a business inRomania is carried out with the relevant Trade RegistryOffice (e.g., health and safety requirements, environmentalcompliance, work protection as well as sanitary-veterinaryconditions) and it is only for certain activities that aspecial authorization/licensing procedure must beobserved (e.g. for environmentally hazardous activities,insurance or banking activities, pharmaceuticals, certainindustrial activities, etc.). In these cases, the applicantneeds to ensure that it fulfils the conditions imposedunder Romanian law to obtain each authorizationor license from the relevant authorities, after thecompany’s incorporation.
In addition, Directive 2012/17/EU on the interconnectionof central, commercial and company registers has veryrecently been transposed into domestic legislation. Thus,the National Trade Register Office (ONRC) will be furtherincluded into the European Registers InterconnectionSystems, ensuring free access to information harmonizedat European Union level with regard to the companiesregistered in EU member states.
CompetitionAccording to the existing case law of the CompetitionCouncil, the majority of mergers notified to the Councilwere granted unconditional clearance.
The legal framework applicable to merger
clearance was significantly amended in August
2010, in order to harmonize it with EU legislation,
following Romania’s accession to the EU in 2007.
Simplified procedures are in place; the review periodafter the submission of the notification is 45 days,provided that the notification is deemed complete bythe Council and no further clarifications/informationis required.
The standard procedure, including a potential investigationlaunched by the Council, may take from severalmonths to several years (3-4 months is the average).
If the authority does not make a decision with respectto the notified merger within the required timeframe,clearance is deemed to have been given. Divestmentorders are very rare.
Fines for implementation of a merger in the absence ofclearance from the Council can be up to 10% of the totalannual turnover for the year preceding the sanction.
Competition advocacy is allowed in Romania. Notificationof a merger is mandatory if (1) the worldwide aggregatedturnover generated by the undertakings involved is atleast EUR 10 million, and (2) a turnover of EUR 4million is generated in Romania by each of at least twoof the undertakings involved in the operation. Themethodology for calculating turnover is differentfor financial institutions and leasing companies. InRomania, the fee for filing a notification is RON4,775, approximately EUR 1,080 at an exchange rateof EUR 1 = RON 4.43.
Under Romanian law, the criminal penalty for theorganization of or participation in a cartel is imprisonmentof between 6 months and 3 years or a fine and limitationof certain rights. Investigations for hard-core infringements of competition rules may include dawnraids by the Competition Council in order to takedocuments and interview employees, without priornotice.
InsolvencyThe Romanian Insolvency Law (Law no. 85/2014)allows for the adoption of the non-liquidationmethod. Consequently, a debtor has the option of eitherreorganizing its activities or filing for bankruptcy.
Although in theory reorganization represents a possibilityfor debtors to recover from insolvency, in practicemost insolvency files become bankruptcy files (90%).The main cause of the low success rate of reorganizationsis creditors’ lack of confidence in the debtor’s capacityto recover.
Under the law, neither secured nor unsecured creditorshave a guaranteed percentage of satisfaction from thevalue of the collateral, mostly due to the fact that differentvaluations may show different results. Generally, creditorsreceive the money established under the reorganizationplan or the amounts obtained from disposal of thedebtor’s assets, such amounts depending on, amongother things, the market value of the assets.
Secured creditors have a privileged position in thedistribution order of liquidation amounts resulting
interior EN final:report 3/22/2016 9:11 AM Page 49

50
from the sale of the assets mortgaged in their favour.The law does not provide for a limitation of a collateral’seconomic value. However, such limitation may occurin the valuation of a debtor’s assets subject to insolvency,made according to international valuation standards,by a valuator appointed by the judicial administrator/liquidator. This limitation may also be triggered by adeterioration of the market conditions with respect tothe encumbered asset. Creditors may not independentlyenforce their rights against a debtor after the datewhen the debtor was declared insolvent by the court.Also, following the initiation of the insolvency procedure,as a rule, the debtor’s rights of self-management areseverely limited, including the right to dispose ofits assets.
Although the limitation of a debtor’s right to disposeof its assets is intended to ensure creditors’ protectionagainst other creditors willing to independently enforcetheir rights and against an insolvent debtor fraudulentlydecreasing the value of its estate, such rules are sometimesexcessively applied by the judicial administrators/liquidators and disposals of assets, which may beprofitable for the debtor’s estate and its creditors, arevery hard to carry out. According to Law no. 85/2014,the liquidation of a debtor’s estate is performed by thejudicial administrator/liquidator under the control ofthe judge and not directly by creditors. However, creditorsare informed and may decide upon certain aspects,including the sale method (direct sale, tender bid).In certain cases, due to the rather excessive formalismof the insolvency procedure, the restrictions on assetdisposals may also limit the possibility to obtain thehighest value. Publication of all important aspects ofthe insolvency procedure (e.g. decisions, summonses,subpoenas, etc.) is made via the Insolvency ProceduresBulletin (www.buletinulinsolventei.ro).
Intellectual Property RightsWith a history that begins in 1879, the Romanianintellectual property environment is under constantchange and intense development. Romania is amember of the Bern Convention on Copyrightsand a signatory party to the WIPO CopyrightTreaty. Moreover, Romania’s Patent Office is partof the integrated OHIM and PATLIB system. Romaniais a founding member of the World IntellectualProperty Organization (WIPO) and several softwareantipiracy campaigns have been initiated in recentyears with the help of the police force. The EU Accession Treaty lays down specific provisions that
reaffirm Romania's commitment to internationallyagreed rules in this field.
Romanian law contains specific rules applicable tocopyright, trademarks, patents (including job inventions),utility models, geographical indications, industrial designand models etc.
As regards IPR cases, in appellate jurisdictions, thereare specialized senates of judges that deal with disputesarising from the infringement of certain IP rights -patents, trademarks, geographic designations, industrialdesigns, topography of semiconductor products, utilitymodels - („industrial rights“), and sole judges at thefirst instance courts. The Bucharest Tribunal hasexclusive jurisdiction in first instance rulings fortrademarks and patents, in the light of Romanian legalprovisions in this respect. Romanian IP legislation isgenerally harmonized with EU law. Moreover, thetrademark database organized by the Romanian PatentOffice is completely merged with OHIM’s TMviewdata base as well as WIPO’s ROMARIN data base.Improvements can be made by increasing the numberof judges, prosecutors and investigators specialized inthe IP field. A seizure of goods is possible for a periodset by a court decision. Within this period, no irreversiblemeasure may be taken without a court’s approval.Release of seized goods against deposit is possible.These provisions are also included in the Civil ProceduralCode and Civil Code.
SMEs are not treated differently from largecorporations. However, the size of an enterprise maybe considered by the authority/court at its discretionwhen imposing a fine.
Regarding patents protection, account should be takenof the fact that from 2014 specific rules governingjob inventions were issued. Its main objectives are to(a) offer additional guarantees to large investors carryingout research and production activities in Romania,(b) stimulate nationwide inventive activities throughincentives awarded to employees, (c) expand the applicability of inventions developed by using theemployer’s resources, etc.
Moreover, in 2015, Romania became a signatoryparty to the Geneva Act of the Lisbon Agreementon Appellations of Origin and Geographical Indications.This new international act will enable, upon itsentry into force, the registration and protection ofany local appellation of origin and geographical indication in all countries which are part of the“Lisbon System”.
interior EN final:report 3/22/2016 9:11 AM Page 50

51
In Romania, Internet Service Providers are generallynot liable for publishing, copying or disseminatinginfringing content by Internet users. However, certainrestrictive measures may be imposed by a court of law(e.g. blocking the content of certain sites).
Romanian law sets out sanctions for the violation ofIP rights, such as administrative sanctions (fines,confiscation, destruction of the counterfeitedproducts and of the materials and equipment used forcounterfeiting and closedown of a company), as wellas civil and possibly criminal liability. Interim injunctionsare regulated and used.
The jurisprudence of the courts hearing intellectual
property rights infringement cases is generally
consistent. Cross border cooperation in terms of
IPR enforcement is in place.
Public ProcurementPublic procurement is currently highly regulated
in Romania and benefits from almost a decade of
practice in line with EU legislation. Romania is oneof the largest public procurement markets in theEuropean Union. The general legal framework forpublic procurement and concessions is provided byGovernment Emergency Ordinance no. 34/2006 on theaward of public procurement contracts, works concessioncontracts and services concession contracts, withsubsequent amendments („Public Sector Regulation”).While the ordinance provides the main rules for theperformance of these procedures, there also areimportant pieces of secondary legislation whichsupport public authorities and private entities either inorganizing or in taking part in public tenders. Insofaras concession contracts (services or public works) areconcerned, the Public Sector Regulation sets forth theapplicable rules under a distinct section thereof, withother legal as well as technical provisions beingprovided under separate Government decisions.
All such internal legislation is based on the Europeanfundamental principles of non-discrimination,equal treatment, transparency, mutual recognition,proportionality, efficient use of public funds andaccountability and is focused on finding the most suitablepublic tendering processes for identifying and selectinginvestments and partners.
Furthermore, the Romanian Government has takenthe necessary measures for making public tenders
smoother, protecting the contracting authorities butalso the bidders against potential non-competitivepractices or non-transparent tendering. The relevantlegal environment allows investors to easily participate inaward procedures by way of consortiums, joint venturesor as subcontractors.
The relevant legal framework is currently undergoingsignificant reforms, with a new consolidated publicprocurement legislative package to be implemented inthe near future (starting April 2016), which will transposethe new EU public procurement directives. TheRomanian Government is also working towards a lessbureaucratic system with more streamlined proceduresaimed at ensuring better commercial coordinates aswell as a competitive environment. In particular,the reform is focused on simplification of awardprocedures, strategic use of public procurement policies,introduction of new environmental protection and socialresponsibility issues, facilitation of small companies’participation in the award procedures, elimination ofcorruption, as well as removal of bureaucratic obstacles.In addition, the focus is for the new legislation to beoriented towards obtaining commercial performance andcompetition in the public procurement market, insteadof being focused on over-regulating the system.
As regards the institutional framework, Romania hasseveral institutions with responsibilities in the field ofpublic procurement, such as (i) the National Councilfor Solving Complaints, an independent body withadministrative and judicial activity whose main role isthe settlement of complaints filed during the awardof public procurement contracts, (ii) the NationalAgency for Public Procurement whose main role is thedevelopment, promotion and implementation of publicprocurement policy.
The relevant supervisory bodies responsible for thecontrol of public funds are the Court of Accounts,whose specific activity in this case is performance ofthe external public audit and the Audit Authority whois responsible for the management and implementationof European funds.
interior EN final:report 3/22/2016 9:11 AM Page 51

Executive Survey
interior EN final:report 3/22/2016 9:11 AM Page 52

While the chapters above present a statistical analysisgrounded in hard data, giving a strong sense of Romania’scompetitive profile, which are the competitive advantagesand disadvantages of the country and how these haveevolved over the past 3 years, this chapter focuses onthe perception of CEOs running business in Romaniawhich is equally important as it represents the way thehard data is translated into practice and is perceived inthe opinion of 200 business leaders.
Similarly to 2011, the Government’s economic policy
in terms of contribution to economic growth is
rated poorly; with 67% believing that the Government’seconomic policy has not contributed to or has actuallyimpeded the economic growth of the country. 95% ofleaders believe that the current economic policy needsto be changed in order to sustain high levels of growth.The CEOs Survey indicates that CEOs perceive thatthe poor performance in economic policy is driven bythe misalignment between political parties (79%) andthe use of taxation as a political tool, rather than aneconomic one (87%). The trust in Government amongleaders is low, as 97% believe corruption is an issue thatinfluences Government policymaking with 61% declaringthat corruption has shifted the focus of economicpolicy-making from creating a fair and level playingfield to protecting a narrow group of special interests.
The Government continues to receive low marks forthe various areas of economic policy. However withthe exception of physical infrastructure developmentthese ratings are above the ratings given by CEOs in asimilar survey run in 2011. On a scale of 1 (insufficient)to 5 (superior), the Government received an averagescore of 2.33 on the legal framework, 1.61 for publicadministration, 1.39 for physical infrastructure, 2.71for human resources and 3.12 for monetary policy.These ratings are by and large in line with the statisticalindicators analyzed previously, which indicate thatRomania needs considerable improvements in virtuallyall of these areas, only monetary policy being ratedslightly above average.
The low ratings in the legal framework are largelyexplained by the perception that Romanian laws arenot cohesive and clear (83%) and that they are morerestrictive to competition compared to EU laws (37%).56% of CEOs find that Romanian laws and regulationsare less attractive for entrepreneurial activity than inother EU countries, 38% believing they are aboutaverage for an EU country, and only 6% declaringthem attractive to entrepreneurial activity and betterthan most EU countries.
Public administration has been rated poorly or belowaverage compared with other EU countries by 94% ofCEOs, 54% of whom believe that 30% or more of thepublic budget is wasted through inefficient, ineffectiveor corrupt management of Government officesand programs, while more that 75% believe that theperformance of public officials is not properly monitoredand managed.
Availability of human resources skills on the Romanianlabor market is very well rated by the CEOs participatingin the survey. On a scale of 1 (worst) to 5 (best), theCEOs rate skilled labor at a 3.45 average. The laborforce received an average score of 4.08 on linguisticability, 3.14 for professional service and admin, 3.47for degrees in finance, 3.33 for marketing and sales,3.72 for advance degree in math and science and2.78 for internationally experienced management.The workforce is described as being above averagein education and creativity and slightly below averagein self-motivation, discipline, accountability and decision-making. Human resources were perceived byleaders as one of Romania’s strengths in the 2011survey and the position has clearly not changed.
Despite the poor perception in key areas of policy,
88% of CEOs have declared that their investment
in Romania is meeting or surpassing expectations,
with 100% of CEOs of companies with local
turnover of 200 million EURO or more declaring
this is the case. According to the CEOs Survey theoutlook from an investment perspective in Romaniais positive, 46% of CEOs saying that their company’sinvestment in Romania will increase, while 49% declareit will remain the same. These plans translate intosimilar expectations in relation to the number ofemployees. The outlook for Romania in the opinionof the CEOs surveyed remains positive, 75% ofthem saying that Romania offers some or numerousopportunities for business.
53
interior EN final:report 3/22/2016 9:11 AM Page 53

54
Over the next five years, will your capital investment in Romania
2014 2011
Remain essentially the same? 49.3% 38.4%
Increase by 50% or more? 20.5% 22.2%
Increase by up to 50%? 25.3% 35.8%
Decrease by up to 50%? 0.7% 3.2%
Decrease by 50% or more? 2.1% 0.5%
Decrease to zero? 3.4% 1.1%
Over the next five years, will your average number of employees in Romania
2014 2011
Remain essentially the same? 39.7% 30.6%
Increase by 50% or more? 19.2% 21.5%
Increase by up to 50%? 34.2% 42.5%
Decrease by up to 50%? 4.8% 5.9%
Decrease by 50% or more? 0.0% 0.0%
Decrease to zero? 2.1% 0.0%
Is your company’s investment in Romania viewed internally as
2014 2011
An unqualified success? 7.5% 1.6%
Surpassing expectations? 17.8% 19.9%
Meeting expectations? 62.3% 61.8%
Falling below expectations? 11.0% 17.2%
A mistake? 1.4% 0.0%
Please rank the factors in your decisions to increase or decrease investment and employment in Romania over the next five years
2014 2011
Global or Regional (external) demand for your product or services 43.4% 27%
Local demand for your product or services 63.2% 63.8%
Competitive changes within your industry 44.2% 35.7%
Local business environment 49.4% 48.1%
If you were personally going to pursue another opportunity, do you believe that the local market
2014 2011
Provides numerous possibilities for similar managerial and entrepreneurial opportunities? 17.1% 19.9%
Provides some possibilities for similar managerial and entrepreneurial opportunities? 58.2% 65.1%
Lacks realistic possibilities for similar managerial and entrepreneurial opportunities? 24.7% 15.1%
Summary of responsesKey Questions
Business Confidence
interior EN final:report 3/22/2016 9:11 AM Page 54

55
On a scale of 1 (worst) to 10 (best), how would you rate the following qualities of the workforce?
2014 2011
Education 6.7 6.21
Creativity 7.08 6.44
Self-Motivation 5.98 5.50
Discipline 5.3 5.08
Accountability 5.46 5.36
Decision-making 5.58 5.28
In comparison with other EU countries, on a scale of 1(worst) to 10 (best), how would you ratethe public administration of Romania (ministries, agencies, courts, counties, municipalities)?
2014 2011
Average rating 3.42 3.19
In comparison with other European countries, on a scale of 1 (worst) to 10 (best) how would yourate the Government’s performance in the following areas of economic policy?
2014 2011
Company Formation 6.65 5.38
Competition 6.26 5.19
Intellectual Property 6.10 5.23
Consumer Rights 6.22 5.46
Contractual Relations 6.05 5.30
Labor Relations 6.22 5.50
Product Liability 5.95 5.34
Environmental Protection 5.14 4.53
On a scale of 1 (worst) to 10 (best), how would you rate the availability of the following categories of people?
2014 2011
Skilled Labor Force 6.9 6.09
Linguistic Ability 8.16 7.33
Professional Services and Admin 6.28 5.99
Degrees in Finance 6.94 6.70
Marketing & Sales 6.66 6.76
Advanced Degrees in Math and Science 7.44 6.95
Internationally Experienced Management 5.56 5.37
In comparison with other European countries, on a scale of 1 (worst) to 10 (best) how would yourate the Government’s performance in the following areas of economic policy?
2014 2011
Legal Framework 4.66 3.83
Public Administration 3.22 3.08
Physical Infrastructure 2.78 2.95
Human Resources 5.42 4.09
Monetary Policy 6.24 4.54
interior EN final:report 3/22/2016 9:11 AM Page 55
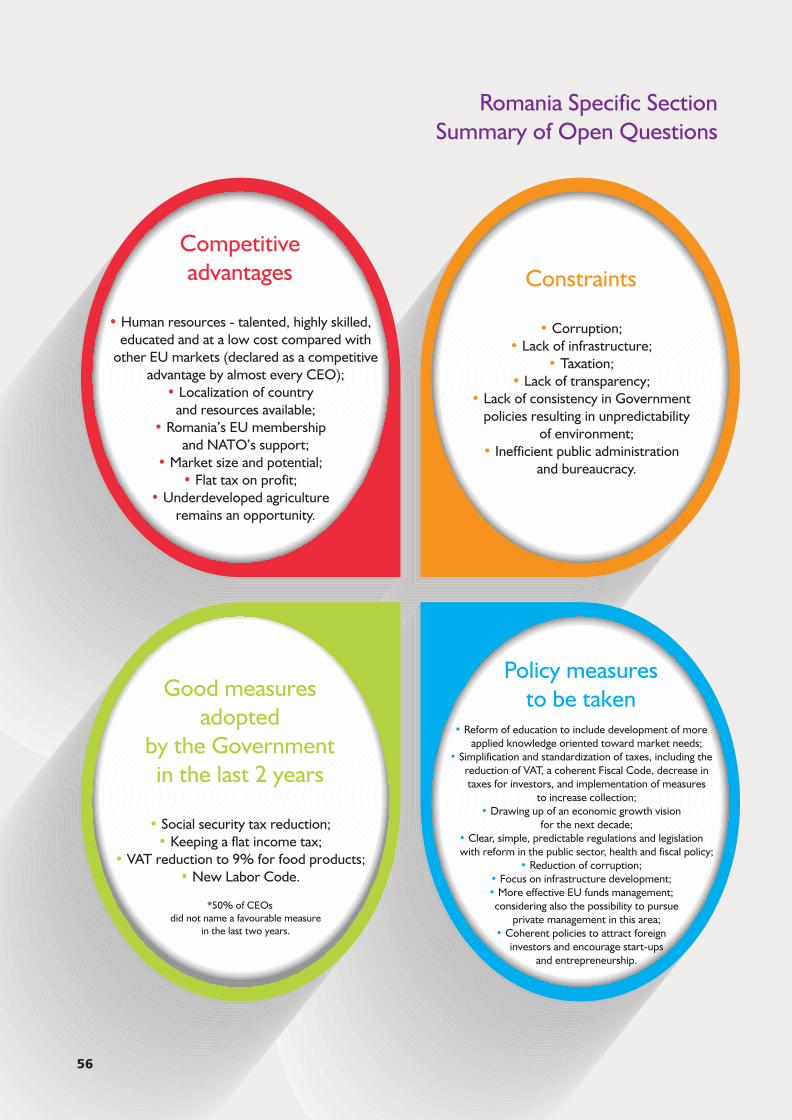
Romania Specific SectionSummary of Open Questions
56
Competitive advantages
• Human resources - talented, highly skilled,educated and at a low cost compared with
other EU markets (declared as a competitiveadvantage by almost every CEO);
• Localization of country and resources available;
• Romania’s EU membership and NATO’s support;
• Market size and potential;• Flat tax on profit;
• Underdeveloped agriculture remains an opportunity.
Constraints
• Corruption;• Lack of infrastructure;
• Taxation;• Lack of transparency;
• Lack of consistency in Government policies resulting in unpredictability
of environment;• Inefficient public administration
and bureaucracy.
Good measuresadopted
by the Government in the last 2 years
• Social security tax reduction;• Keeping a flat income tax;
• VAT reduction to 9% for food products;• New Labor Code.
*50% of CEOs did not name a favourable measure
in the last two years.
Policy measures to be taken
• Reform of education to include development of moreapplied knowledge oriented toward market needs;
• Simplification and standardization of taxes, including thereduction of VAT, a coherent Fiscal Code, decrease intaxes for investors, and implementation of measures
to increase collection; • Drawing up of an economic growth vision
for the next decade;• Clear, simple, predictable regulations and legislation with reform in the public sector, health and fiscal policy;
• Reduction of corruption;• Focus on infrastructure development;• More effective EU funds management;
considering also the possibility to pursue private management in this area;
• Coherent policies to attract foreign investors and encourage start-ups
and entrepreneurship.
interior EN final:report 3/22/2016 9:11 AM Page 56

coperta EN:report 3/22/2016 8:53 AM Page 3

w w w . a m c h a m . r o
coperta EN:report 3/22/2016 8:53 AM Page 4


![[Sxsw] Amcham](https://static.fdocuments.in/doc/165x107/547f55f3b4af9fbe788b46ba/sxsw-amcham.jpg)