Amberyn Thomas - University of Queensland
56
Amberyn Thomas
Transcript of Amberyn Thomas - University of Queensland

Amberyn Thomas

Things that can be counted ◦ number of publications◦ citation counts Also:◦ Journal rankings◦ Journal impact factor◦ H-index
Metrics: must always be considered in context – significant disciplinary differences, and differences over time

•How do you find relevant metrics?
•What metrics are available to support some common claims?
•What tools are available and how useful are they?

Thomson Reuters Web of Knowledge◦ Web of Science
Citation reports, H-index, graphs and tables of publications per year and cpp per year, refine and analyse feature
◦ Journal Citation Reports◦ Essential Science Indicators◦ ResearcherID
Allows authors to claim publications as theirs (assert authorship), citation analysis feature, collaboration metrics
Scopus◦ Citation counts from 1996, citation overview, H-index (post
1996), SCImago journal rank (SJR), SNIP etc.Google Scholar
Poor quality control but comprehensive in humanities, etcPublish or Perish (PoP) – GS interface

HERDC, ERA data etc Value added using◦ APIs for retrieving Scopus and WoS citation counts◦ WoS Web services – weekly download of pubs with
UQ in address field◦ ResearcherID uploads and downloads
still being implemented

• Track record of individuals, groups of researchers • Contribution to the discipline and/or significance
of the contribution• Evidence of international profile• Evidence of capacity to collaborate effectively
Increasing requests and complexity of requests:• Current environment – research evaluation, ERA –
grant application reviewers, potential employers etc may expect to see metrics
Why use publication metrics?
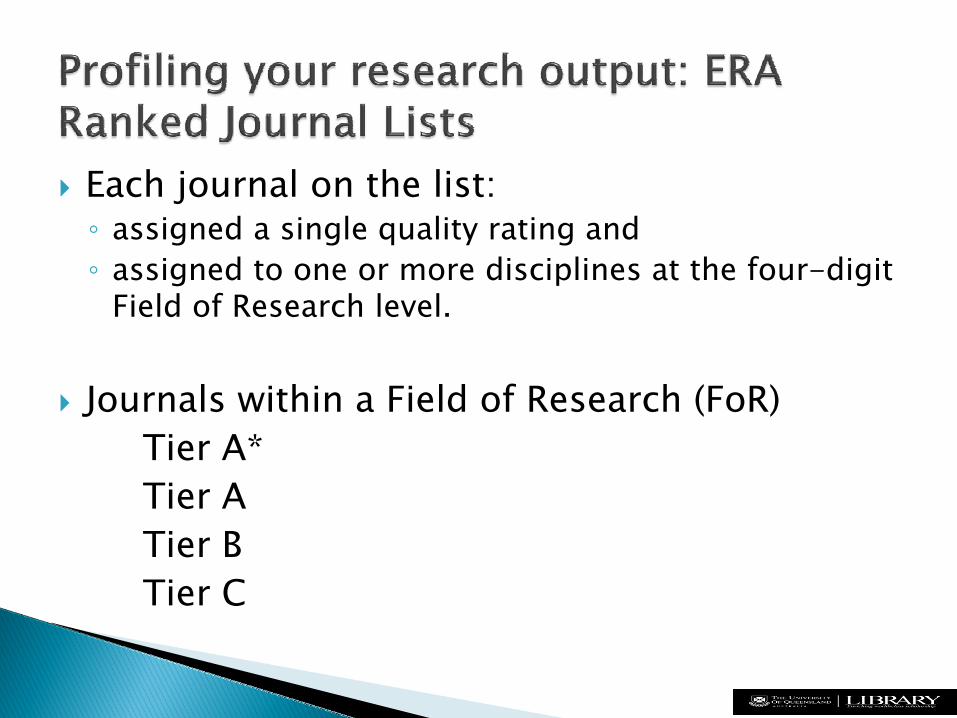
Each journal on the list: ◦ assigned a single quality rating and ◦ assigned to one or more disciplines at the four-digit
Field of Research level.
Journals within a Field of Research (FoR)Tier A*Tier ATier BTier C

“Typically an A* journal would be one of the best in its field or subfield in which to publish and would typically cover the entire field/subfield. Virtually all papers they publish will be of a very high quality. These are journals where most of the work is important (it will really shape the field) and where researchers boast about getting accepted. Acceptance rates would typically be low and the editorial board would be dominated by field leaders, including many from top institutions.”

Ranked conference listsFor some disciplines, ranked conferences was used as an indicator.


X % of my refereed journal articles since <year> are in ERA 2010 A/A* journals◦ This is evidence of the quality of the outlets that
your work as a whole is published in (not necessarily the quality of the work itself)
Y% of my refereed journal articles since <year> are in ERA 2010 A/A* journals in the <field of research, FoR code> area◦ this is evidence of quality of the outlets you publish
in, in a particular FoR

eSpace◦ http://espace.library.uq.edu.au/◦ Login to eSpace and go to My Research
To see the journals with FoR code information:◦ http://lamp.infosys.deakin.edu.au/era/


Look at the quality of the citations your work is receiving◦ What % of citations to your publications are from
A/A* outlets?

“Friends, researchers, grant review panels, lend me your ears;
I come to not quite bury the impact factor, and not to praise it.
Many scholarly articles and blogs have told you that the JIF is fundamentally flawed…..”
A new take on what was in James Pringle, What impact, Whose value? Citation metrics in a work-flow perspective. Serials 20(3) Nov 2007 (with due acknowledgement of Shakespeare)
But it may be a useful tool to profile your output……

• JIF – “measures” how often articles in journals are cited.
• In a given year, the impact factor of a journal is the average number of citations received per paper published in that journal during the two preceding years
• A = no. of times articles published in 2006 and 2007 were cited during 2008
• B = no. of "citable items" published by that journal in 2006 and 2007.
• 2008 impact factor = A/B

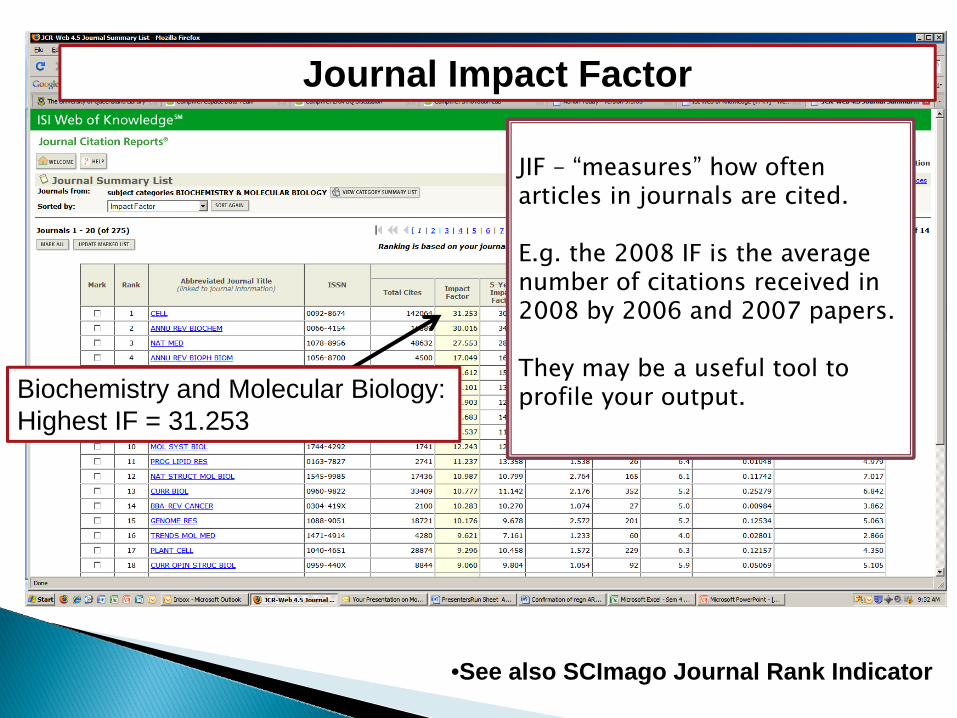
JIF – “measures” how often articles in journals are cited.
E.g. the 2008 IF is the average number of citations received in 2008 by 2006 and 2007 papers.
They may be a useful tool to profile your output.
Journal Impact Factor
•See also SCImago Journal Rank Indicator
Biochemistry and Molecular Biology:Highest IF = 31.253

•Not an article-level metric.•Highly discipline specific.
Mathematics:Highest IF = 3.806

Look at the JIFs for the Subject Category (or Categories) that you publish inWork out what IF is required for a journal to be in the top, say, 10% (or 5%, or 15% etc) by IF for this listWork out what % of your refereed journal articles (indexed by TR WoS) are in the top 10% by IF for the Subject Categories◦ 75% of my refereed journal articles indexed by Web of
Science are in journals with impact factors in the top 10% for the Subject Category of X (or Categories of X, Y etc) (source: JCR 05/02/11)
Could look at different Subject Categories separately if that serves your purpose – you may look better on this measure in one Category than in another – must support the claims you make however.


5 year Journal Impact FactorImmediacy index, cited half-lifeEigenfactor metrics (eigenfactor score, article influence score)
Scopus have SNIP and SJR
BUT: suggest the KIS principle – use widely recognised and understood metrics

Reviews in scholarly journals: the best (?) guide to the quality of a book publication, but often long delays

Number of publicationsNumber of citations (career citation count)Citations per paper
◦ I have 35 refereed journal articles, of which 33 are indexed by Web of Science. These articles have received 230 citations, giving an average citation per (indexed) paper of 7 (source: WoS, 05/02/11).
Percentage not cited◦ Of my 33 indexed journal articles, only 3 articles have
not been cited by others (9% not cited), and these were all published in 2010 (WoS, 05/02/11)

Citations for an individual paper or sub-set of publications: supporting evidence for outstanding contribution in a particular area
Citations per paper by year of publication◦ use TR Essential Science Indicators for
benchmarking◦ benchmark using refine feature within WoS
◦ http://www.youtube.com/watch?v=EbVKWCpNFhY


For papers published in journals within the ESI field of Mathematics in 2002 the average citation rate in WoS is 4.91
In Molecular Biology and Genetics it is 37.24!

To be in the top 1 % of papers in the ESI field of Biology and Biochemistry, a 2002 paper must have received more than 171 citations

Evidence of outstanding contribution in a given Field if you have a number of papers in that Field in the top 1% by citations◦ The outstanding nature of my contribution to the Field
of X is evidenced by 3 papers (A, B and C) achieving citation rates which place them in the top 1% of papers in the ESI Field of <field> for their publication year (source: Essential Science Indicators, 05/02/11)
Profile your output◦ How many (or %) of your refereed journal articles since
<year> are in top 5, 10, 25% etc for a given ESI Field?◦ How many (or percentage of) your refereed journal
articles exceed the expected citation rate for papers in the ESI Field in their published year?

◦ I have 35 refereed journal articles, of which 33 are indexed by Web of Science. These articles have received 230 citations, giving an average citation per (indexed) paper of 7 (source: WoS, 05/02/11).
◦ I have 15 articles which exceed the expected citation rate for the ESI Field of <ESI field> for their respective publication years, and 5 articles in the top 10 % by citations for this Field (source: Essential Science Indicators, 05/02/11)

Search WoS for the topic which best describes your research e.g. “water catchments”, “renal cancer”, “shoulder rehabilitation” etcRefine by document type (articles and reviews usually)Choose the year you wish to benchmarkClick on “citation report”The average cpp is the average number of citations a paper identified with that topic published in that year has been cited in WoS- You can use this to compare your publications in that
topic published in that year

◦ From search results:Analyze
most prolific author in the topicrefine by country – see Aust benchmark etc, sort by total citations etc
◦ Can export results (e.g. tab-delimited file for Windows) and open in excel and play with them
◦ Can do this with any set of search results ……(max. 500 at a time)

The H-index (JE Hirsh) proposed in 2005 as a measure of research influence of a scientist
"The index H, defined as the number of papers with citation number greater than or equal to H, is a useful index to characterize the scientific output of a researcher."
E.g. If your H-index is 15, you have 15 papers cited 15 times or more.
Productivity + Impact = Influence

Citation reports in Web of Science and Citation Tracker in Scopus calculate the H-index of a search result. ◦ You can search for the publications of an author,
research group, or institution and calculate the H-index. ◦ You must be aware of the difficulties of
comprehensively searching for the publications of an individual or group. ◦ No database lists all articles.

Use the H-index measure with care. Citation patterns vary across disciplines. ◦ E.g. H-indices in Medicine are much higher than in
Mathematics for example. ◦ Researchers in different disciplines can not be
compared using the H-index.Even within the same discipline the H-index should not be used alone as a measure of research quality.
Researchers in the same discipline at different stages of their careers can not be compared using the H-index.

Researcher 2 cites per paper
Researcher 2 cites per paper
Researcher 3 cites per paper
Paper 1 100 50 15Paper 2 90 50 15Paper 3 70 45 14Paper 4 50 45 14Paper 5 35 5 12Paper 6 4 4 4Paper 7 0 2 4Paper 8 0 0 4Paper 9 0 0 4Paper 10 0 0 4
Average cites per paper
35.3 20.1 9.0

My H-index based on these indexed papers is 10. I have 4 papers (A, B, C, D) with more than 20 citations and 1 paper (E) with 29 citations (source: WoS, 05/02/11). I also have an additional 3 papers not indexed by WoS, with 29 citations based on Scopus data (05/02/11).

“My work is multi-disciplinary, spanning biochemistry, biophysics and oncology…..”
◦ Analyse your WoS articles by WoS subject category to see if this is evidenced in your research output
◦ “34 % of my journal articles are in the WoS Subject Area of Biochemistry and Molecular Biology, with 29% in Biophysics and 16 % in Oncology (WoSSubject Areas, 05/02/11).”

Look at the articles which cite your work in WoSand analyse them by WoS Subject Area
available by clicking on the citing articles link from a citation report, and then analysing that list of citing articles
“Whilst 65% of my articles are published in Physiology (WoS Subject Area), 55% of my citations are from journals with a Subject Area of Cell Biology (source: WoS, 02/11).”

Are you an “ISI highly cited” scientist? ◦ ISIHighlyCited.com - top 250 individual researchers in each
of 21 subject categories who have demonstrated great influence in their field as measured by citations to their work
Are you listed as a “highly cited” or “ranked” scientist in ESI (top 1% by Field)?Do you have any papers “highly cited” in ESI (top 1% of papers in the Field)?Do you have any ESI “highly cited” papers identified as being “core papers” in an area of relevance to the application?How many of your papers rank highly in your “topic” for any of the years of interest to the application (say last 5)?

highly cited papers - the top 1% of articles by total citations in each annual cohort from each of the 22 disciplines. ◦ Highly cited papers ~ 90,000 "hot papers," – papers from the last two years and which have received an unusually high number of citations during the most recent two-month period. ◦ ~ 1,800 hot papers are selected, representing the
top 0.1% in the two-year period.

Do you have any papers with very high citations e.g. 100+? Who has cited your work?Longevity in importance of work – are papers from 10+ years ago still being cited?Cumulative citations – how many times are you being cited in each year for the last (say) 3 years?

If you refine your topic search by country, do any of your papers turn up in the top 5% when sorted by citation count?How many publications have you contributed to your topic? Are you one of the most prolific authors who publish papers in that topic with an Australian address?
E.g. “For the years 2002 – 2010, I have the 3rd and 5th
highest cited papers in the topic “Shoulder Rehabilitation” published with an Australian institution in the address (source; WoS Topic search = “shoulder rehabilitation”, 05/02/11)”.

Particular publications achieving citations very quickly (are any ESI “hot papers”?)
Particular publications achieving citations over a long time period

Analyse your WoS articles by country and/or institutionWhat % of your WoS indexed articles have a non-UQ author, or an overseas co-author?
“70% of my journal articles have non-UQ Australian based co-authors, with 15% of my papers involving international co-authors, including 3 papers with Harvard…”

What % of your journal articles are in ERA 2010 A/A* outlets?What % of your journal articles are in the top 10% by IF for the JCR categories you publish in?

How many of your publications are co-authored by your post-grads?And post-docs?

Look in detail at the quality of the citations your work is receiving◦ What % of citations to your publications are from
A/A* outlets?◦ What are the impact factors of the journals in which
your work is cited?◦ Who is citing your work?
Who are they? Where are they from?◦ Why are they citing your work?◦ How quickly is your work being cited?


Take care how you present the results of a Scopus or WoS search/analysis ◦ be specific and descriptive about what data you
present – check what it is you are presenting◦ provide dates and data source(s)◦ keep screen dumps for referenceContext is all important ◦ Use a range of metrics as appropriate to your
discipline and your publication history◦ Define your discipline and use appropriate
benchmarks.

Where to find more information:http://www.library.uq.edu.au/research/roi.html
My contact details:[email protected]
Or your librarian, contact details available from:
http://www.library.uq.edu.au/about/liaison.phtml