Amazon com Inc. Equity Research
16
DISCLOSURE APPENDIX AT THE BACK OF THIS REPORT CONTAINS IMPORTANT DISCLOSURES, ANALYST CERTIFICATIONS, LEGAL ENTITY DISCLOSURE AND THE STATUS OF NON-US ANALYSTS. US Disclosure: Credit Suisse does and seeks to do business with companies covered in its research reports. As a result, investors should be aware that the Firm may have a conflict of interest that could affect the objectivity of this report. Investors should consider this report as only a single factor in making their investment decision. 17 April 2017 Americas/United States Equity Research Consumer Internet Amazon com Inc. (AMZN) INCREASE TARGET PRICE Rating OUTPERFORM Price (13-Apr-17, US$) 884.67 Target price (US$) (from 900.00) 1050.00 52-week price range (US$) 909.28 - 602.00 Market cap (US$ m) 422,826.64 Target price is for 12 months. Research Analysts Stephen Ju 212 325 8662 [email protected] Christopher Ford 212 538 8446 [email protected] Recalibration of Model Following Annual Report Yields Higher FCF Estimates ■ Event: We preview Amazon's 1Q17 results – we have increased our price target objective for AMZN shares to $1,050 versus prior $900 as we recalibrate our model following the annual disclosure of balance sheet and cash flow items for AWS as well as the e-commerce operations. Our FY17 EPS estimate is now $11.30 vs. prior $12.08. ■ Investment Case: Although our operating profit estimates for 2Q17 & 3Q17 decrease as we take into account Amazon's ongoing investments into content, fulfillment centers, and data centers, the strategic and product- driven rationale behind these should already be well-familiar to investors. As far as we are concerned, this push to invest serves as positive demand indicators across its consumer and enterprise-facing businesses. As we have previously called out, we believe that Amazon will report a second derivative change in its operating margin, i.e. the amount of margin compression as implied in the 2Q17 guidance will start to abate as it has established a pattern of investing (in either fulfillment centers or data centers) and growing into the larger infrastructure. We maintain our Outperform rating and our updated investment thesis for AMZN shares is predicated on the following longer-term factors 1) re-establishment of e-commerce segment operating margin expansion as Amazon grows into its larger infrastructure, 2) ongoing margin benefit due to shipping loss moderation, and 3) upward bias to AWS revenue forecasts and likely more moderate deceleration path as suggested by ongoing capital intensity in the business. ■ Valuation: We maintain our Outperform rating and our DCF-based target price which is based on a 10.5% WACC and 3% terminal growth is now $1,050 vs. prior $900. Higher-than-expected capital intensity for either the e- commerce platform or AWS is a risk to our estimates. Share price performance AMZN.OQ S&P 500 INDEX Ju l- 1 6 Oct-16 Jan - 1 7 Apr-17 600 700 800 900 On 13-Apr-2017 the S&P 500 INDEX closed at 2328.95 Daily Apr15, 2016 - Apr13, 2017, 04/15/16 = US$625.89 Quarterly EPS Q1 Q2 Q3 Q4 2016A 2.39 3.51 2.21 3.44 2017E 2.35 2.84 2.44 3.66 2018E 3.21 3.90 3.57 5.28 Financial and valuation metrics Year 12/16A 12/17E 12/18E 12/19E EPS (Excl. ESO) (US$) 11.54 11.30 15.97 22.47 EPS (CS adj., ) 11.54 11.30 15.97 22.47 Prev. EPS (CS adj., US$) - 12.08 16.39 22.58 P/E (CS adj.) (x) 76.7 78.3 55.4 39.4 P/E rel. (CS adj., %) 376.1 421.9 335.0 262.6 Revenue (US$ m) 135,987.0 160,438.3 190,817.6 224,968.7 EBITDA (US$ m) 12,303.0 14,713.4 20,868.0 28,654.6 Net Debt (US$ m) -11,640 -20,133 -33,482 -53,175 OCFPS (US$) 33.83 42.96 54.67 68.71 P/OCF (x) 22.2 20.6 16.2 12.9 Number of shares (m) 477.95 Price/Sales (x) 3.01 BV/share (Next Qtr., US$) 44.2 P/BVPS (x) 19.7 Net debt (Next Qtr., US$ m) 3,846.1 Dividend (current, US$) - Dividend yield (%) - Source: Company data, Thomson Reuters, Credit Suisse estimates
Transcript of Amazon com Inc. Equity Research
DISCLOSURE APPENDIX AT THE BACK OF THIS REPORT CONTAINS IMPORTANT DISCLOSURES, ANALYST CERTIFICATIONS, LEGAL ENTITY DISCLOSURE AND THE STATUS OF NON-US ANALYSTS. US Disclosure: Credit Suisse does and seeks to do business with companies covered in its research reports. As a result, investors should be aware that the Firm may have a conflict of interest that could affect the objectivity of this report. Investors should consider this report as only a single factor in making their investment decision.
17 April 2017Americas/United States
Equity ResearchConsumer Internet
Amazon com Inc. (AMZN)
INCREASE TARGET PRICE Rating OUTPERFORMPrice (13-Apr-17, US$) 884.67Target price (US$) (from 900.00) 1050.0052-week price range (US$) 909.28 - 602.00Market cap (US$ m) 422,826.64Target price is for 12 months.
Research AnalystsStephen Ju
212 325 [email protected]
Christopher Ford212 538 8446
Recalibration of Model Following Annual Report Yields Higher FCF Estimates■ Event: We preview Amazon's 1Q17 results – we have increased our price
target objective for AMZN shares to $1,050 versus prior $900 as we recalibrate our model following the annual disclosure of balance sheet and cash flow items for AWS as well as the e-commerce operations. Our FY17 EPS estimate is now $11.30 vs. prior $12.08.
■ Investment Case: Although our operating profit estimates for 2Q17 & 3Q17 decrease as we take into account Amazon's ongoing investments into content, fulfillment centers, and data centers, the strategic and product-driven rationale behind these should already be well-familiar to investors. As far as we are concerned, this push to invest serves as positive demand indicators across its consumer and enterprise-facing businesses. As we have previously called out, we believe that Amazon will report a second derivative change in its operating margin, i.e. the amount of margin compression as implied in the 2Q17 guidance will start to abate as it has established a pattern of investing (in either fulfillment centers or data centers) and growing into the larger infrastructure. We maintain our Outperform rating and our updated investment thesis for AMZN shares is predicated on the following longer-term factors 1) re-establishment of e-commerce segment operating margin expansion as Amazon grows into its larger infrastructure, 2) ongoing margin benefit due to shipping loss moderation, and 3) upward bias to AWS revenue forecasts and likely more moderate deceleration path as suggested by ongoing capital intensity in the business.
■ Valuation: We maintain our Outperform rating and our DCF-based target price which is based on a 10.5% WACC and 3% terminal growth is now $1,050 vs. prior $900. Higher-than-expected capital intensity for either the e-commerce platform or AWS is a risk to our estimates.
Share price performance
A M ZN .O Q S& P 5 0 0 IN D EX
Ju l - 1 6 O ct - 1 6 Jan - 1 7 A p r - 1 7
6 0 0
7 0 0
8 0 0
9 0 0
On 13-Apr-2017 the S&P 500 INDEX closed at 2328.95Daily Apr15, 2016 - Apr13, 2017, 04/15/16 = US$625.89
Quarterly EPS Q1 Q2 Q3 Q42016A 2.39 3.51 2.21 3.442017E 2.35 2.84 2.44 3.662018E 3.21 3.90 3.57 5.28
Financial and valuation metricsYear 12/16A 12/17E 12/18E 12/19EEPS (Excl. ESO) (US$) 11.54 11.30 15.97 22.47EPS (CS adj., ) 11.54 11.30 15.97 22.47Prev. EPS (CS adj., US$) - 12.08 16.39 22.58P/E (CS adj.) (x) 76.7 78.3 55.4 39.4P/E rel. (CS adj., %) 376.1 421.9 335.0 262.6Revenue (US$ m) 135,987.0 160,438.3 190,817.6 224,968.7EBITDA (US$ m) 12,303.0 14,713.4 20,868.0 28,654.6Net Debt (US$ m) -11,640 -20,133 -33,482 -53,175OCFPS (US$) 33.83 42.96 54.67 68.71P/OCF (x) 22.2 20.6 16.2 12.9
Number of shares (m) 477.95 Price/Sales (x) 3.01BV/share (Next Qtr., US$) 44.2 P/BVPS (x) 19.7Net debt (Next Qtr., US$ m) 3,846.1 Dividend (current, US$) -Dividend yield (%) -Source: Company data, Thomson Reuters, Credit Suisse estimates

17 April 2017
Amazon com Inc. (AMZN) 2
Amazon com Inc. (AMZN)Price (13 Apr 2017): US$884.67; Rating: OUTPERFORM; Target Price: (from US$900.00) US$1,050.00; Analyst: Stephen JuIncome Statement 12/16A 12/17E 12/18E 12/19ERevenue (US$ m) 135,987.0 160,438.3 190,817.6 224,968.7Sales 135,987.0 160,438.3 190,817.6 224,968.7EBITDA 12,303.0 14,713.4 20,868.0 28,654.6Operating profit 4,186.0 3,440.1 6,277.6 10,564.0Recurring profit 3,892.0 2,991.5 5,816.6 10,099.9Cash Flow 12/16A 12/17E 12/18E 12/19ECash flow from operations 16,442 21,099 27,306 34,904CAPEX (6,736) (7,445) (7,817) (8,130)Free cashflow to the firm 9,706 13,654 19,489 26,774Cash flow from investments (9,876) (7,445) (7,817) (8,130)Net share issue(/repurchase) 0 0 0 0Dividends paid 0 0 0 0Issuance (retirement) of debt - - - -Other (2,370) (5,161) (6,140) (7,081)Cashflow from financing activities (2,370) (5,161) (6,140) (7,081)Effect of exchange rates (211) 0 0 0Changes in Net Cash/Debt 3,985 8,493 13,349 19,693Net debt at end (11,640) (20,133) (33,482) (53,175)Balance Sheet ($US) 12/16A 12/17E 12/18E 12/19EAssetsOther current assets 6,647 6,647 6,647 6,647Total current assets 45,781 57,110 73,878 97,269Total assets 83,402 97,526 117,749 142,359LiabilitiesShort-term debt 0 0 0 0Total current liabilities 43,816 52,503 62,470 73,637Long-term debt 7,694 7,694 7,694 7,694Total liabilities 64,117 70,903 82,903 96,069Shareholder equity 19,285 26,623 34,846 46,290Total liabilities and equity 83,402 97,526 117,749 142,359Net debt (11,640) (20,133) (33,482) (53,175)Per share 12/16A 12/17E 12/18E 12/19ENo. of shares (wtd avg) 486 491 499 508CS adj. EPS 11.54 11.30 15.97 22.47Prev. EPS (US$) - 12.08 16.39 22.58Dividend (US$) 0.00 0.00 0.00 0.00Free cash flow per share 19.97 27.80 39.02 52.71Earnings 12/16A 12/17E 12/18E 12/19ESales growth (%) 27.1 18.0 18.9 17.9EBIT growth (%) 87.5 (17.8) 82.5 68.3Net profit growth (%) 82.8 (1.0) 43.8 43.0EPS growth (%) 83.4 (2.1) 41.4 40.6EBIT margin (%) 3.1 2.1 3.3 4.7Valuation 12/16A 12/17E 12/18E 12/19EEV/Sales (x) 3.02 2.51 2.04 1.64EV/EBIT (x) 98.2 117.1 62.0 35.0P/E (x) 76.7 78.3 55.4 39.4Quarterly EPS Q1 Q2 Q3 Q42016A 2.39 3.51 2.21 3.442017E 2.35 2.84 2.44 3.662018E 3.21 3.90 3.57 5.28
Company BackgroundAmazon.com is a customer-centric company for 3 primary customer sets: consumers, sellers & enterprises. In addition, it generates revenue through other marketing and promotional services, such as online advertising, and co-branded credit card agreements.
Blue/Grey Sky Scenario
Our Blue Sky Scenario (US$) (from 1230.00) 1400.00
We have also elected to run a blue sky/grey sky scenario for AMZN shares using historic Free Cash Flow Yield on next twelve month estimates – AMZN shares have traded in a range of ~1.7%-4.0% with an average of ~2.6% and a standard deviation of ~0.6%. In terms of upside potential, we think of where we are going to be at the end of 2017, we apply a 2.0% to our 2018 FCF of $13.6 billion and derive a blue sky scenario of $1400.
Our Grey Sky Scenario (US$) (from 615.00) 700.00In terms of downside potential, we apply a peak FCF Yield of 4.0% to our 2018 FCF estimate of $13.6 billion, and we derive a grey sky scenario of $700.
Share price performance
A M ZN .O Q S& P 5 0 0 IN D EX
Ju l - 1 6 O ct - 1 6 Jan - 1 7 A p r - 1 7
6 0 0
7 0 0
8 0 0
9 0 0
On 13-Apr-2017 the S&P 500 INDEX closed at 2328.95Daily Apr15, 2016 - Apr13, 2017, 04/15/16 = US$625.89
Source: Company data, Thomson Reuters, Credit Suisse estimates
17 April 2017
Amazon com Inc. (AMZN) 3
Amazon.com Inc. (AMZN) – Recalibration of Model Following Annual Report Yields Higher FCF EstimatesWe have increased our price target objective for AMZN shares from $900 to $1,050 as we once again recalibrate our model following the annual disclosure of balance sheet and cash flow items for AWS as well as the e-commerce operations.
Setting aside the impact from foreign exchange rates, the fundamental changes to our model include the following items:
Moderated long-term deceleration path for AWS growth – AWS rolled through price cuts in specific products during 4Q16 which should see full impact to revenue growth for 1Q17-3Q17; 4Q17 should directionally accelerate sequentially from 3Q17 all things being equal
Decreased the trajectory of increase in our Technology and Content expense projections – while our T&C expense projection for AWS remain at ~$11b for 2017, our forecast for the balance of the businesses has decreased modestly to $7.6b vs. prior $8.0b (versus $5.9b in 2016)
Updated asset base for both AWS and e-commerce operations as disclosed in the 10-k, as well as the mix of CapEx (in-cash-flow-statement versus acquired via capital lease and acquired via other other leases)
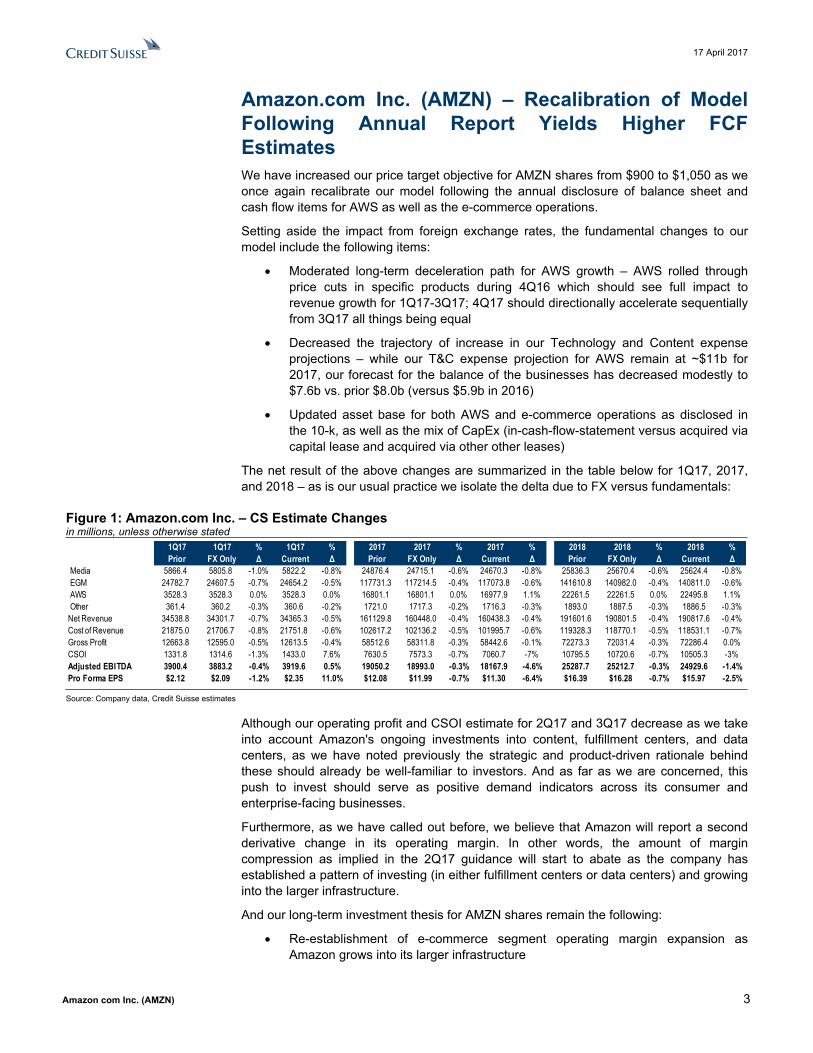
The net result of the above changes are summarized in the table below for 1Q17, 2017, and 2018 – as is our usual practice we isolate the delta due to FX versus fundamentals:
Figure 1: Amazon.com Inc. – CS Estimate Changesin millions, unless otherwise stated
1Q17 1Q17 % 1Q17 % 2017 2017 % 2017 % 2018 2018 % 2018 %Prior FX Only Δ Current Δ Prior FX Only Δ Current Δ Prior FX Only Δ Current Δ
Media 5866.4 5805.8 -1.0% 5822.2 -0.8% 24876.4 24715.1 -0.6% 24670.3 -0.8% 25836.3 25670.4 -0.6% 25624.4 -0.8% EGM 24782.7 24607.5 -0.7% 24654.2 -0.5% 117731.3 117214.5 -0.4% 117073.8 -0.6% 141610.8 140982.0 -0.4% 140811.0 -0.6% AWS 3528.3 3528.3 0.0% 3528.3 0.0% 16801.1 16801.1 0.0% 16977.9 1.1% 22261.5 22261.5 0.0% 22495.8 1.1% Other 361.4 360.2 -0.3% 360.6 -0.2% 1721.0 1717.3 -0.2% 1716.3 -0.3% 1893.0 1887.5 -0.3% 1886.5 -0.3%Net Revenue 34538.8 34301.7 -0.7% 34365.3 -0.5% 161129.8 160448.0 -0.4% 160438.3 -0.4% 191601.6 190801.5 -0.4% 190817.6 -0.4%Cost of Revenue 21875.0 21706.7 -0.8% 21751.8 -0.6% 102617.2 102136.2 -0.5% 101995.7 -0.6% 119328.3 118770.1 -0.5% 118531.1 -0.7%Gross Profit 12663.8 12595.0 -0.5% 12613.5 -0.4% 58512.6 58311.8 -0.3% 58442.6 -0.1% 72273.3 72031.4 -0.3% 72286.4 0.0%CSOI 1331.8 1314.6 -1.3% 1433.0 7.6% 7630.5 7573.3 -0.7% 7060.7 -7% 10795.5 10720.6 -0.7% 10505.3 -3%Adjusted EBITDA 3900.4 3883.2 -0.4% 3919.6 0.5% 19050.2 18993.0 -0.3% 18167.9 -4.6% 25287.7 25212.7 -0.3% 24929.6 -1.4%Pro Forma EPS $2.12 $2.09 -1.2% $2.35 11.0% $12.08 $11.99 -0.7% $11.30 -6.4% $16.39 $16.28 -0.7% $15.97 -2.5%
Source: Company data, Credit Suisse estimates
Although our operating profit and CSOI estimate for 2Q17 and 3Q17 decrease as we take into account Amazon's ongoing investments into content, fulfillment centers, and data centers, as we have noted previously the strategic and product-driven rationale behind these should already be well-familiar to investors. And as far as we are concerned, this push to invest should serve as positive demand indicators across its consumer and enterprise-facing businesses.
Furthermore, as we have called out before, we believe that Amazon will report a second derivative change in its operating margin. In other words, the amount of margin compression as implied in the 2Q17 guidance will start to abate as the company has established a pattern of investing (in either fulfillment centers or data centers) and growing into the larger infrastructure.
And our long-term investment thesis for AMZN shares remain the following:
Re-establishment of e-commerce segment operating margin expansion as Amazon grows into its larger infrastructure
17 April 2017
Amazon com Inc. (AMZN) 4
Ongoing margin benefit due to shipping loss moderation
Upward bias to AWS revenue forecasts and likely more moderate deceleration path as suggested by ongoing capital intensity in the business
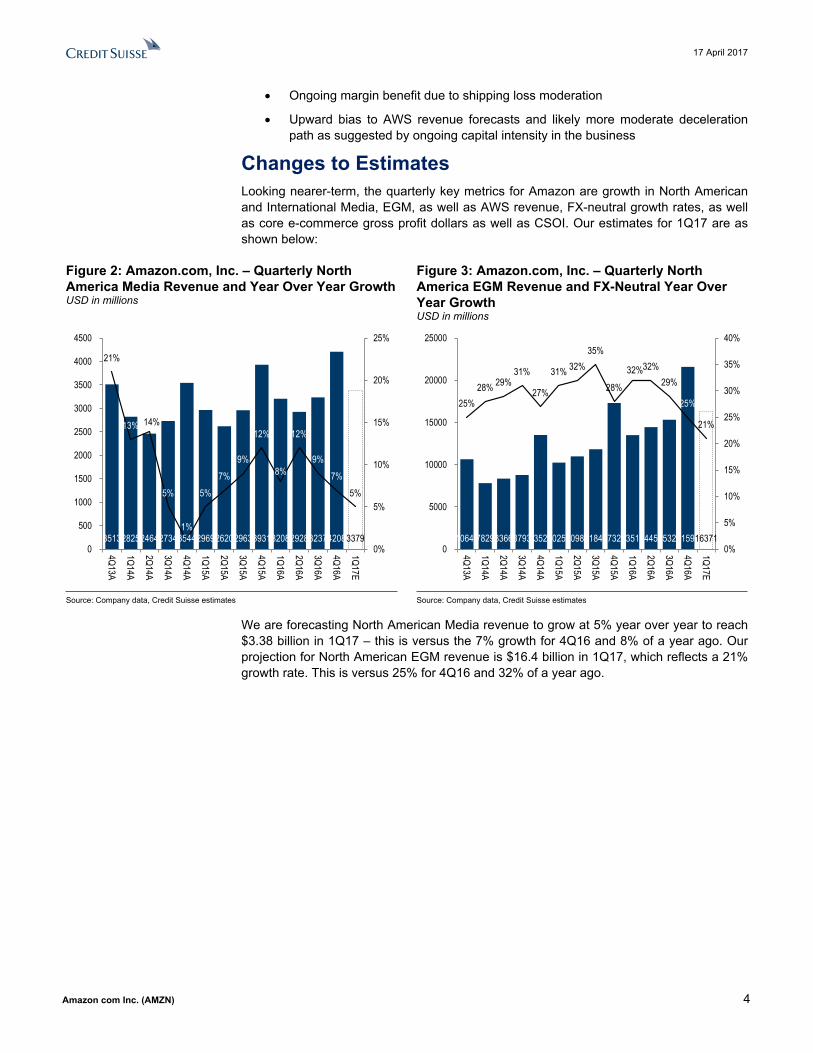
Changes to EstimatesLooking nearer-term, the quarterly key metrics for Amazon are growth in North American and International Media, EGM, as well as AWS revenue, FX-neutral growth rates, as well as core e-commerce gross profit dollars as well as CSOI. Our estimates for 1Q17 are as shown below:
Figure 2: Amazon.com, Inc. – Quarterly North America Media Revenue and Year Over Year GrowthUSD in millions
Figure 3: Amazon.com, Inc. – Quarterly North America EGM Revenue and FX-Neutral Year Over Year Growth USD in millions
35132825246427343544296926202963393132082928323742083379
21%
13% 14%
5%
1%
5%7%
9%
12%
8%
12%
9%7%
5%
0%
5%
10%
15%
20%
25%
0
500
1000
1500
2000
2500
3000
3500
4000
4500
4Q13A
1Q14A
2Q14A
3Q14A
4Q14A
1Q15A
2Q15A
3Q15A
4Q15A
1Q16A
2Q16A
3Q16A
4Q16A
1Q17E
1064878298366879313529102501098711840173251351114459153272159016371
25%28% 29%
31%
27%
31% 32%35%
28%
32%32%29%
25%
21%
0%
5%
10%
15%
20%
25%
30%
35%
40%
0
5000
10000
15000
20000
250004Q13A
1Q14A
2Q14A
3Q14A
4Q14A
1Q15A
2Q15A
3Q15A
4Q15A
1Q16A
2Q16A
3Q16A
4Q16A
1Q17E
Source: Company data, Credit Suisse estimates Source: Company data, Credit Suisse estimates
We are forecasting North American Media revenue to grow at 5% year over year to reach $3.38 billion in 1Q17 – this is versus the 7% growth for 4Q16 and 8% of a year ago. Our projection for North American EGM revenue is $16.4 billion in 1Q17, which reflects a 21% growth rate. This is versus 25% for 4Q16 and 32% of a year ago.
17 April 2017
Amazon com Inc. (AMZN) 5
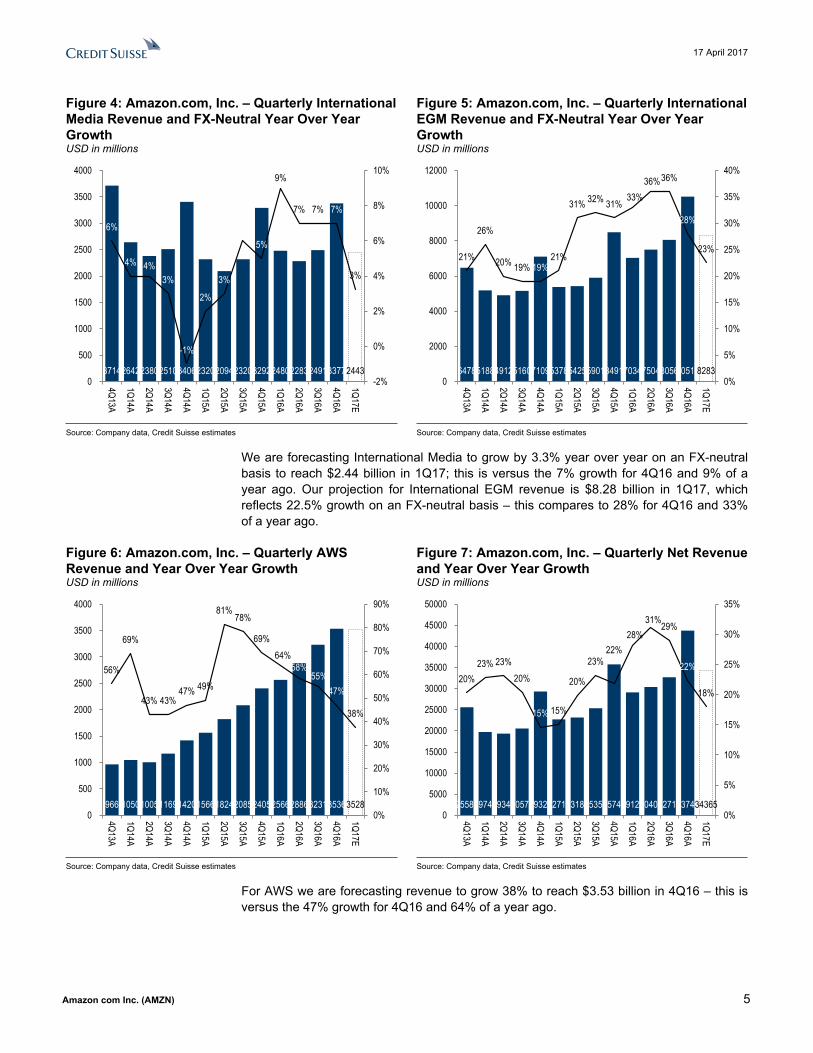
Figure 4: Amazon.com, Inc. – Quarterly International Media Revenue and FX-Neutral Year Over Year GrowthUSD in millions
Figure 5: Amazon.com, Inc. – Quarterly International EGM Revenue and FX-Neutral Year Over Year Growth USD in millions
37142642238025103406232020942320329224802283249133772443
6%
4% 4%3%
-1%
2%
3%
6%
5%
9%
7% 7% 7%
3%
-2%
0%
2%
4%
6%
8%
10%
0
500
1000
1500
2000
2500
3000
3500
4000
4Q13A
1Q14A
2Q14A
3Q14A
4Q14A
1Q15A
2Q15A
3Q15A
4Q15A
1Q16A
2Q16A
3Q16A
4Q16A
1Q17E
647851884912516071095378542559018491703475048056105148283
21%
26%
20% 19% 19%21%
31% 32% 31%33%
36%36%
28%
23%
0%
5%
10%
15%
20%
25%
30%
35%
40%
0
2000
4000
6000
8000
10000
12000
4Q13A
1Q14A
2Q14A
3Q14A
4Q14A
1Q15A
2Q15A
3Q15A
4Q15A
1Q16A
2Q16A
3Q16A
4Q16A
1Q17E
Source: Company data, Credit Suisse estimates Source: Company data, Credit Suisse estimates
We are forecasting International Media to grow by 3.3% year over year on an FX-neutral basis to reach $2.44 billion in 1Q17; this is versus the 7% growth for 4Q16 and 9% of a year ago. Our projection for International EGM revenue is $8.28 billion in 1Q17, which reflects 22.5% growth on an FX-neutral basis – this compares to 28% for 4Q16 and 33% of a year ago.
Figure 6: Amazon.com, Inc. – Quarterly AWS Revenue and Year Over Year GrowthUSD in millions
Figure 7: Amazon.com, Inc. – Quarterly Net Revenue and Year Over Year GrowthUSD in millions
966 1050100511691420156618242085240525662886323135363528
56%
69%
43% 43%47% 49%
81%78%
69%64%
58%55%
47%
38%
0%
10%
20%
30%
40%
50%
60%
70%
80%
90%
0
500
1000
1500
2000
2500
3000
3500
4000
4Q13A
1Q14A
2Q14A
3Q14A
4Q14A
1Q15A
2Q15A
3Q15A
4Q15A
1Q16A
2Q16A
3Q16A
4Q16A
1Q17E
2558719741193402057929328227172318525358357472912830404327144374134365
20%23% 23%
20%
15% 15%
20%
23%22%
28%31%29%
22%
18%
0%
5%
10%
15%
20%
25%
30%
35%
0
5000
10000
15000
20000
25000
30000
35000
40000
45000
50000
4Q13A
1Q14A
2Q14A
3Q14A
4Q14A
1Q15A
2Q15A
3Q15A
4Q15A
1Q16A
2Q16A
3Q16A
4Q16A
1Q17E
Source: Company data, Credit Suisse estimates Source: Company data, Credit Suisse estimates
For AWS we are forecasting revenue to grow 38% to reach $3.53 billion in 4Q16 – this is versus the 47% growth for 4Q16 and 64% of a year ago.

17 April 2017
Amazon com Inc. (AMZN) 6
Figure 8: Amazon.com, Inc. – Quarterly Core E-Commerce Gross Profit and MarginUSD in millions
Figure 9: Amazon.com, Inc. – Quarterly Consolidated Segment Operating Income and MarginUSD in millions
581546364936478372375756620165189001769683388223112479085
27%25%
27%25%
26%27%
29% 28% 27%29%
30%28% 28%
29%
0%
5%
10%
15%
20%
25%
30%
35%
0
2000
4000
6000
8000
10000
12000
4Q13A
1Q14A
2Q14A
3Q14A
4Q14A
1Q15A
2Q15A
3Q15A
4Q15A
1Q16A
2Q16A
3Q16A
4Q16A
1Q17E
581546364936478372375756620165189001769683388223112479085
27%25%
27%25%
26%27%
29% 28% 27%29%
30%28% 28%
29%
0%
5%
10%
15%
20%
25%
30%
35%
0
2000
4000
6000
8000
10000
12000
4Q13A
1Q14A
2Q14A
3Q14A
4Q14A
1Q15A
2Q15A
3Q15A
4Q15A
1Q16A
2Q16A
3Q16A
4Q16A
1Q17E
Source: Company data, Credit Suisse estimates Source: Company data, Credit Suisse estimates
Adding it all up, our net revenue forecast for 1Q17 stands at $34.4 billion, which reflects 18% growth. Once again we have conservatively modeled only modest year over year gross margin expansion for the core e-commerce franchise and our CSOI estimate stands at 1.43 billion.
Our estimates versus consensus for revenue and adjusted EBITDA are as shown below for 1Q17, FY17, FY18.
Figure 10: Amazon.com, Inc. – Credit Suisse vs. Consensus Estimates1Q17 FY17 FY18
CS Consensus % Diff CS Consensus % Diff CS Consensus % DiffRevenue 34365.3 35303.0 -2.7% 160438.3 165246.0 -2.9% 190817.6 199551.0 -4.4%Adjusted EBITDA 3919.6 4085.0 -4.0% 18167.9 19392.0 -6.3% 24929.6 24850.0 0.3%Adjusted EPS $2.35 $2.28 2.9% $11.30 $12.62 -10.5% $15.97 $18.12 -11.9%
Source: Company data, Credit Suisse estimates, the BLOOMBERG PROFESSIONALTM service
ValuationIn-line with the valuation methodology we have used with the rest of our coverage universe, we have based our target price on DCF, which now suggests $1,050 vs. prior $900 as we modify our estimates. We have used a weighted average cost of capital of 10.5% and a terminal growth rate expectation of 3%.

17 April 2017
Amazon com Inc. (AMZN) 7
Figure 11: Amazon.com, Inc. – Discounted Cash Flow AnalysisUS$ in millions, unless otherwise stated
CAGR 2017E 2018E 2019E 2020E 2021E 2022E '17-'22
EBITDA 14713.4 20868.0 28654.6 38945.2 51607.6 66903.3 35.4%Net Income 1828.6 3645.5 6402.7 10657.1 16339.9 23551.2 66.7%Depreciation & Amortization 11273.3 14590.4 18090.6 21823.6 25718.2 29947.4 21.6%Other Non-Cash Charges (Benefits) 2146.0 2523.1 2940.2 3356.2 3794.2 4247.5 14.6%Interest Expense (Income) 448.5 461.1 464.1 416.4 363.8 239.6Changes in Operating Assets & Liabilities 5851.2 6547.2 7470.7 8258.7 9045.3 9769.5 10.8%Unlevered Cash Flows 21547.6 27767.2 35368.3 44512.0 55261.5 67755.2 25.8%Capital Expenditures 15506.6 16747.0 17953.1 19104.2 20179.5 21158.8 6.4%Unlevered Free Cash Flows 6041.0 11020.2 17415.2 25407.9 35081.9 46596.4 50.5%Y/Y % Change 90.2% 82.4% 58.0% 45.9% 38.1% 32.8%
Weighted Average Cost of Capital 10.5%Perpetual UFCF Growth Rate ("G") 3.0%
2017ENPV of Unlevered Free Cash Flows 100923Present Value of Terminal Value 388434Enterprise Value 489357Off-Balance Sheet Assets 0Adjusted Enterprise Value 489357Year End Net Debt (Cash) (26780)Equity Value 516137Diluted Shares Outstanding 491.1Equity Value Per Share $1051
Source: Company data, Credit Suisse estimates
As previously noted, we have elected to add as capital expenditure Amazon's spend financed by capital and financing leases and the corresponding amounts outstanding on the long-term liabilities disclosed on the balance sheet as part of net debt.
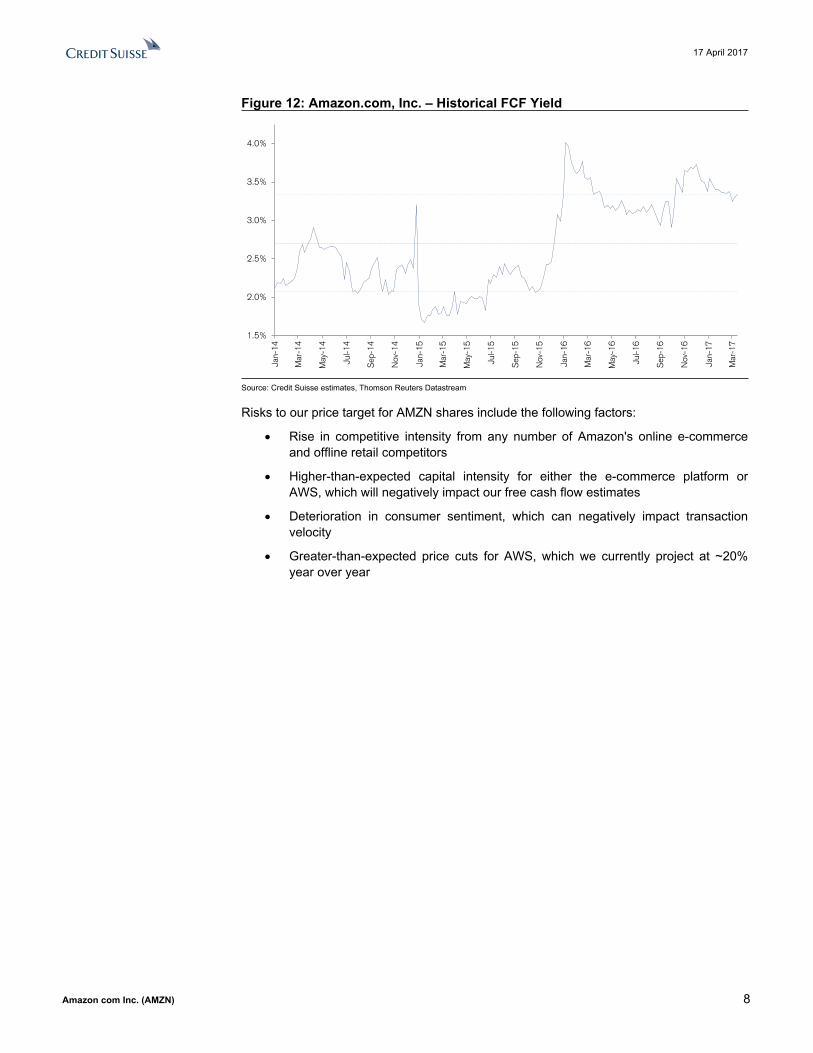
We have also elected to run a blue sky/grey sky scenario for AMZN shares using historic Free Cash Flow Yield on next twelve month estimates – AMZN shares have traded in a range of ~1.7%-4.0% with an average of ~2.6% and a standard deviation of ~0.6%. As we think about where we will be at the end of 2017, we apply a high end FCF Yield of 4% to our 2018 FCF estimate of $13.6 billion, and we derive a grey sky scenario of $700. In terms of upside potential, we apply a 2.0% FCF Yield (average less one standard deviation) to the same and derive a blue sky scenario of $1,400.
17 April 2017
Amazon com Inc. (AMZN) 8
Figure 12: Amazon.com, Inc. – Historical FCF Yield
1.5%
2.0%
2.5%
3.0%
3.5%
4.0%
Jan-
14
Mar
-14
May
-14
Jul-1
4
Sep
-14
Nov
-14
Jan-
15
Mar
-15
May
-15
Jul-1
5
Sep
-15
Nov
-15
Jan-
16
Mar
-16
May
-16
Jul-1
6
Sep
-16
Nov
-16
Jan-
17
Mar
-17
Source: Credit Suisse estimates, Thomson Reuters Datastream
Risks to our price target for AMZN shares include the following factors:
Rise in competitive intensity from any number of Amazon's online e-commerce and offline retail competitors
Higher-than-expected capital intensity for either the e-commerce platform or AWS, which will negatively impact our free cash flow estimates
Deterioration in consumer sentiment, which can negatively impact transaction velocity
Greater-than-expected price cuts for AWS, which we currently project at ~20% year over year
17 April 2017
Amazon com Inc. (AMZN) 9
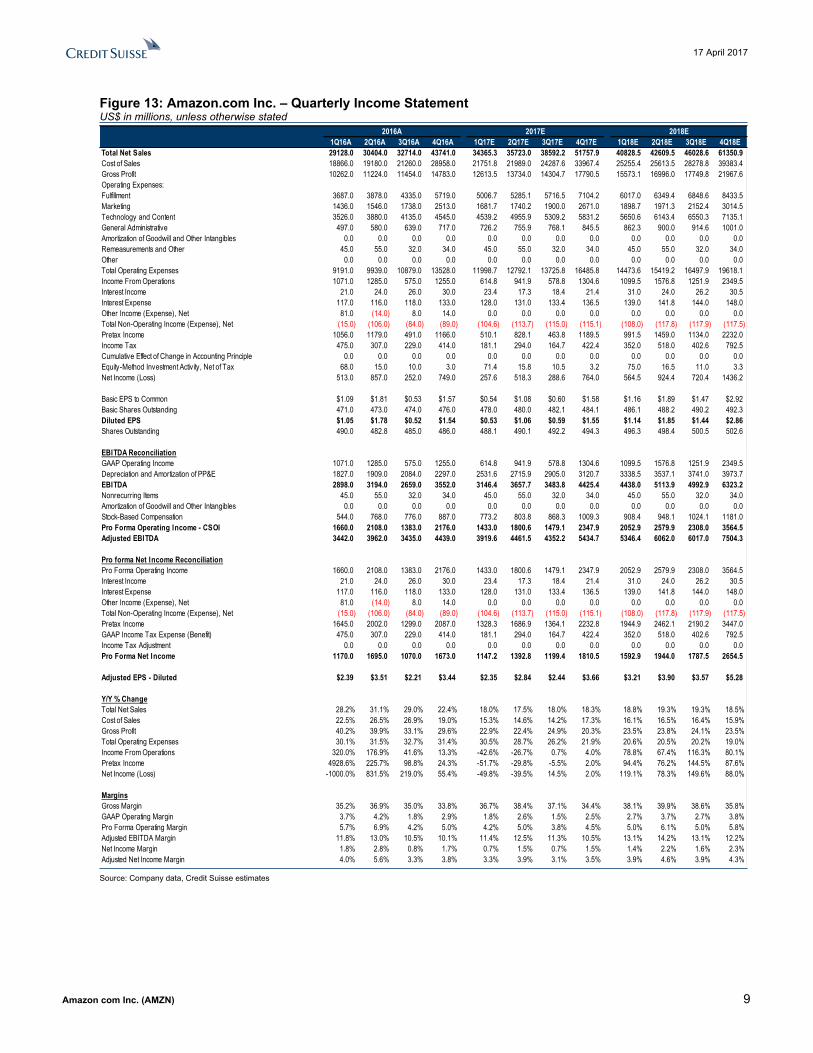
Figure 13: Amazon.com Inc. – Quarterly Income StatementUS$ in millions, unless otherwise stated
1Q16A 2Q16A 3Q16A 4Q16A 1Q17E 2Q17E 3Q17E 4Q17E 1Q18E 2Q18E 3Q18E 4Q18ETotal Net Sales 29128.0 30404.0 32714.0 43741.0 34365.3 35723.0 38592.2 51757.9 40828.5 42609.5 46028.6 61350.9Cost of Sales 18866.0 19180.0 21260.0 28958.0 21751.8 21989.0 24287.6 33967.4 25255.4 25613.5 28278.8 39383.4Gross Profit 10262.0 11224.0 11454.0 14783.0 12613.5 13734.0 14304.7 17790.5 15573.1 16996.0 17749.8 21967.6Operating Expenses:Fulfillment 3687.0 3878.0 4335.0 5719.0 5006.7 5285.1 5716.5 7104.2 6017.0 6349.4 6848.6 8433.5Marketing 1436.0 1546.0 1738.0 2513.0 1681.7 1740.2 1900.0 2671.0 1898.7 1971.3 2152.4 3014.5Technology and Content 3526.0 3880.0 4135.0 4545.0 4539.2 4955.9 5309.2 5831.2 5650.6 6143.4 6550.3 7135.1General Administrative 497.0 580.0 639.0 717.0 726.2 755.9 768.1 845.5 862.3 900.0 914.6 1001.0Amortization of Goodwill and Other Intangibles 0.0 0.0 0.0 0.0 0.0 0.0 0.0 0.0 0.0 0.0 0.0 0.0Remeasurements and Other 45.0 55.0 32.0 34.0 45.0 55.0 32.0 34.0 45.0 55.0 32.0 34.0Other 0.0 0.0 0.0 0.0 0.0 0.0 0.0 0.0 0.0 0.0 0.0 0.0Total Operating Expenses 9191.0 9939.0 10879.0 13528.0 11998.7 12792.1 13725.8 16485.8 14473.6 15419.2 16497.9 19618.1Income From Operations 1071.0 1285.0 575.0 1255.0 614.8 941.9 578.8 1304.6 1099.5 1576.8 1251.9 2349.5Interest Income 21.0 24.0 26.0 30.0 23.4 17.3 18.4 21.4 31.0 24.0 26.2 30.5Interest Expense 117.0 116.0 118.0 133.0 128.0 131.0 133.4 136.5 139.0 141.8 144.0 148.0Other Income (Expense), Net 81.0 (14.0) 8.0 14.0 0.0 0.0 0.0 0.0 0.0 0.0 0.0 0.0Total Non-Operating Income (Expense), Net (15.0) (106.0) (84.0) (89.0) (104.6) (113.7) (115.0) (115.1) (108.0) (117.8) (117.9) (117.5)Pretax Income 1056.0 1179.0 491.0 1166.0 510.1 828.1 463.8 1189.5 991.5 1459.0 1134.0 2232.0Income Tax 475.0 307.0 229.0 414.0 181.1 294.0 164.7 422.4 352.0 518.0 402.6 792.5Cumulative Effect of Change in Accounting Principle 0.0 0.0 0.0 0.0 0.0 0.0 0.0 0.0 0.0 0.0 0.0 0.0Equity-Method Investment Activity, Net of Tax 68.0 15.0 10.0 3.0 71.4 15.8 10.5 3.2 75.0 16.5 11.0 3.3Net Income (Loss) 513.0 857.0 252.0 749.0 257.6 518.3 288.6 764.0 564.5 924.4 720.4 1436.2
Basic EPS to Common $1.09 $1.81 $0.53 $1.57 $0.54 $1.08 $0.60 $1.58 $1.16 $1.89 $1.47 $2.92Basic Shares Outstanding 471.0 473.0 474.0 476.0 478.0 480.0 482.1 484.1 486.1 488.2 490.2 492.3Diluted EPS $1.05 $1.78 $0.52 $1.54 $0.53 $1.06 $0.59 $1.55 $1.14 $1.85 $1.44 $2.86Shares Outstanding 490.0 482.8 485.0 486.0 488.1 490.1 492.2 494.3 496.3 498.4 500.5 502.6
EBITDA ReconciliationGAAP Operating Income 1071.0 1285.0 575.0 1255.0 614.8 941.9 578.8 1304.6 1099.5 1576.8 1251.9 2349.5Depreciation and Amortization of PP&E 1827.0 1909.0 2084.0 2297.0 2531.6 2715.9 2905.0 3120.7 3338.5 3537.1 3741.0 3973.7EBITDA 2898.0 3194.0 2659.0 3552.0 3146.4 3657.7 3483.8 4425.4 4438.0 5113.9 4992.9 6323.2Nonrecurring Items 45.0 55.0 32.0 34.0 45.0 55.0 32.0 34.0 45.0 55.0 32.0 34.0Amortization of Goodwill and Other Intangibles 0.0 0.0 0.0 0.0 0.0 0.0 0.0 0.0 0.0 0.0 0.0 0.0Stock-Based Compensation 544.0 768.0 776.0 887.0 773.2 803.8 868.3 1009.3 908.4 948.1 1024.1 1181.0Pro Forma Operating Income - CSOI 1660.0 2108.0 1383.0 2176.0 1433.0 1800.6 1479.1 2347.9 2052.9 2579.9 2308.0 3564.5Adjusted EBITDA 3442.0 3962.0 3435.0 4439.0 3919.6 4461.5 4352.2 5434.7 5346.4 6062.0 6017.0 7504.3
Pro forma Net Income ReconciliationPro Forma Operating Income 1660.0 2108.0 1383.0 2176.0 1433.0 1800.6 1479.1 2347.9 2052.9 2579.9 2308.0 3564.5Interest Income 21.0 24.0 26.0 30.0 23.4 17.3 18.4 21.4 31.0 24.0 26.2 30.5Interest Expense 117.0 116.0 118.0 133.0 128.0 131.0 133.4 136.5 139.0 141.8 144.0 148.0Other Income (Expense), Net 81.0 (14.0) 8.0 14.0 0.0 0.0 0.0 0.0 0.0 0.0 0.0 0.0Total Non-Operating Income (Expense), Net (15.0) (106.0) (84.0) (89.0) (104.6) (113.7) (115.0) (115.1) (108.0) (117.8) (117.9) (117.5)Pretax Income 1645.0 2002.0 1299.0 2087.0 1328.3 1686.9 1364.1 2232.8 1944.9 2462.1 2190.2 3447.0GAAP Income Tax Expense (Benefit) 475.0 307.0 229.0 414.0 181.1 294.0 164.7 422.4 352.0 518.0 402.6 792.5Income Tax Adjustment 0.0 0.0 0.0 0.0 0.0 0.0 0.0 0.0 0.0 0.0 0.0 0.0Pro Forma Net Income 1170.0 1695.0 1070.0 1673.0 1147.2 1392.8 1199.4 1810.5 1592.9 1944.0 1787.5 2654.5
Adjusted EPS - Diluted $2.39 $3.51 $2.21 $3.44 $2.35 $2.84 $2.44 $3.66 $3.21 $3.90 $3.57 $5.28
Y/Y % ChangeTotal Net Sales 28.2% 31.1% 29.0% 22.4% 18.0% 17.5% 18.0% 18.3% 18.8% 19.3% 19.3% 18.5%Cost of Sales 22.5% 26.5% 26.9% 19.0% 15.3% 14.6% 14.2% 17.3% 16.1% 16.5% 16.4% 15.9%Gross Profit 40.2% 39.9% 33.1% 29.6% 22.9% 22.4% 24.9% 20.3% 23.5% 23.8% 24.1% 23.5%Total Operating Expenses 30.1% 31.5% 32.7% 31.4% 30.5% 28.7% 26.2% 21.9% 20.6% 20.5% 20.2% 19.0%Income From Operations 320.0% 176.9% 41.6% 13.3% -42.6% -26.7% 0.7% 4.0% 78.8% 67.4% 116.3% 80.1%Pretax Income 4928.6% 225.7% 98.8% 24.3% -51.7% -29.8% -5.5% 2.0% 94.4% 76.2% 144.5% 87.6%Net Income (Loss) -1000.0% 831.5% 219.0% 55.4% -49.8% -39.5% 14.5% 2.0% 119.1% 78.3% 149.6% 88.0%
MarginsGross Margin 35.2% 36.9% 35.0% 33.8% 36.7% 38.4% 37.1% 34.4% 38.1% 39.9% 38.6% 35.8%GAAP Operating Margin 3.7% 4.2% 1.8% 2.9% 1.8% 2.6% 1.5% 2.5% 2.7% 3.7% 2.7% 3.8%Pro Forma Operating Margin 5.7% 6.9% 4.2% 5.0% 4.2% 5.0% 3.8% 4.5% 5.0% 6.1% 5.0% 5.8%Adjusted EBITDA Margin 11.8% 13.0% 10.5% 10.1% 11.4% 12.5% 11.3% 10.5% 13.1% 14.2% 13.1% 12.2%Net Income Margin 1.8% 2.8% 0.8% 1.7% 0.7% 1.5% 0.7% 1.5% 1.4% 2.2% 1.6% 2.3%Adjusted Net Income Margin 4.0% 5.6% 3.3% 3.8% 3.3% 3.9% 3.1% 3.5% 3.9% 4.6% 3.9% 4.3%
2018E2017E2016A
Source: Company data, Credit Suisse estimates

17 April 2017
Amazon com Inc. (AMZN) 10
Figure 14: Amazon.com Inc. – Annual Income StatementUS$ in millions, unless otherwise stated
CAGR 2015A 2016A 2017E 2018E 2019E 2020E 2021E 2022E '17-'22
Total Net Sales 107007.0 135987.0 160438.3 190817.6 224968.7 263008.7 304701.6 349765.5 16.9%Cost of Sales 71651.0 88264.0 101995.7 118531.1 136736.1 156069.8 176390.0 197430.7Gross Profit 35356.0 47723.0 58442.6 72286.4 88232.6 106938.9 128311.7 152334.9 21.1%Operating Expenses:Fulfillment 13411.0 17619.0 23112.5 27648.6 32595.8 37952.2 43641.0 49699.9Marketing 5252.0 7233.0 7992.9 9036.9 10043.5 11019.1 12001.2 12895.5Technology and Content 12542.0 16086.0 20635.4 25479.4 30592.4 35831.1 41163.6 46552.9General Administrative 1747.0 2433.0 3095.8 3677.9 4271.0 4848.9 5450.4 6064.6Amortization of Goodwill and Other Intangibles 0.0 0.0 0.0 0.0 0.0 0.0 0.0 0.0Remeasurements and Other 171.0 166.0 166.0 166.0 166.0 166.0 166.0 166.0Other 0.0 0.0 0.0 0.0 0.0 0.0 0.0 0.0Total Operating Expenses 33123.0 43537.0 55002.5 66008.8 77668.6 89817.4 102422.2 115378.9 16.0%Income From Operations 2233.0 4186.0 3440.1 6277.6 10564.0 17121.5 25889.4 36956.0 60.8%Interest Income 49.0 101.0 80.5 111.7 161.9 236.1 340.6 481.9Interest Expense 460.0 484.0 529.0 572.8 626.0 652.5 704.5 721.5Other Income (Expense), Net 0.0 0.0 0.0 0.0 0.0 0.0 0.0 0.0Total Non-Operating Income (Expense), Net (665.0) (294.0) (448.5) (461.1) (464.1) (416.4) (363.8) (239.6)Pretax Income 1568.0 3892.0 2991.5 5816.6 10099.9 16705.1 25525.6 36716.3Income Tax 951.0 1425.0 1062.2 2065.2 3586.1 5931.3 9063.1 13036.5Cumulative Effect of Change in Accounting Principle 0.0 0.0 0.0 0.0 0.0 0.0 0.0 0.0Equity-Method Investment Activity, Net of Tax 21.0 96.0 100.8 105.8 111.1 116.7 122.5 128.6Net Income (Loss) 596.0 2371.0 1828.6 3645.5 6402.7 10657.1 16339.9 23551.2 66.7%
Basic EPS to Common $1.27 $5.01 $3.80 $7.45 $12.87 $21.06 $31.75 $45.00 63.9%Basic Shares Outstanding 467.5 473.5 481.0 489.2 497.5 506.0 514.6 523.3Diluted EPS $1.22 $4.88 $3.72 $7.30 $12.60 $20.63 $31.10 $44.08 63.9%Shares Outstanding 487.5 486.0 491.1 499.5 508.0 516.6 525.4 534.3
EBITDA ReconciliationGAAP Operating Income 2233.0 4186.0 3440.1 6277.6 10564.0 17121.5 25889.4 36956.0Depreciation and Amortization of PP&E 6281.0 8117.0 11273.3 14590.4 18090.6 21823.6 25718.2 29947.4EBITDA 8514.0 12303.0 14713.4 20868.0 28654.6 38945.2 51607.6 66903.3 35.4%Nonrecurring Items 171.0 166.0 166.0 166.0 166.0 166.0 166.0 166.0Amortization of Goodwill and Other Intangibles 0.0 0.0 0.0 0.0 0.0 0.0 0.0 0.0Stock-Based Compensation 2120.0 2975.0 3454.6 4061.6 4733.1 5402.8 6107.9 6837.6Pro Forma Operating Income - CSOI 4524.0 7327.0 7060.7 10505.3 15463.0 22690.3 32163.4 43959.5 44.2%Adjusted EBITDA 10634.0 15278.0 18167.9 24929.6 33387.7 44347.9 57715.5 73740.9 32.3%
Pro forma Net Income ReconciliationPro Forma Operating Income 4524.0 7327.0 7060.7 10505.3 15463.0 22690.3 32163.4 43959.5Interest Income 49.0 101.0 80.5 111.7 161.9 236.1 340.6 481.9Interest Expense 460.0 484.0 529.0 572.8 626.0 652.5 704.5 721.5Other Income (Expense), Net (254.0) 89.0 0.0 0.0 0.0 0.0 0.0 0.0Total Non-Operating Income (Expense), Net (665.0) (294.0) (448.5) (461.1) (464.1) (416.4) (363.8) (239.6)Pretax Income 3859.0 7033.0 6612.1 10044.2 14998.9 22273.9 31799.5 43719.9GAAP Income Tax Expense (Benefit) 951.0 1425.0 1062.2 2065.2 3586.1 5931.3 9063.1 13036.5Income Tax Adjustment 0.0 0.0 0.0 0.0 0.0 0.0 0.0 0.0Pro Forma Net Income 3067.0 5608.0 5550.0 7979.0 11412.9 16342.6 22736.4 30683.4
Adjusted EPS - Diluted $6.29 $11.54 $11.30 $15.97 $22.47 $31.63 $43.28 $57.43
Y/Y % ChangeTotal Net Sales 20.2% 27.1% 18.0% 18.9% 17.9% 16.9% 15.9% 14.8%Cost of Sales 14.2% 23.2% 15.6% 16.2% 15.4% 14.1% 13.0% 11.9%Gross Profit 34.8% 35.0% 22.5% 23.7% 22.1% 21.2% 20.0% 18.7%Total Operating Expenses 27.1% 31.4% 26.3% 20.0% 17.7% 15.6% 14.0% 12.7%Income From Operations 1154.5% 87.5% -17.8% 82.5% 68.3% 62.1% 51.2% 42.7%Pretax Income -1500.0% 148.2% -23.1% 94.4% 73.6% 65.4% 52.8% 43.8%Net Income (Loss) -347.3% 297.8% -22.9% 99.4% 75.6% 66.4% 53.3% 44.1%
MarginsGross Margin 33.0% 35.1% 36.4% 37.9% 39.2% 40.7% 42.1% 43.6%GAAP Operating Margin 2.1% 3.1% 2.1% 3.3% 4.7% 6.5% 8.5% 10.6%Pro Forma Operating Margin 4.2% 5.4% 4.4% 5.5% 6.9% 8.6% 10.6% 12.6%Adjusted EBITDA Margin 9.9% 11.2% 11.3% 13.1% 14.8% 16.9% 18.9% 21.1%Net Income Margin 0.6% 1.7% 1.1% 1.9% 2.8% 4.1% 5.4% 6.7%Adjusted Net Income Margin 2.9% 4.1% 3.5% 4.2% 5.1% 6.2% 7.5% 8.8%
Source: Company data, Credit Suisse estimates

17 April 2017
Amazon com Inc. (AMZN) 11
Figure 15: Amazon.com Inc. – Cash Flow StatementUS$ in millions, unless otherwise stated
2015A 2016A 2017E 2018E 2019E 2020E 2021E 2022EOperating ActivitiesNet Income (Loss) 596.0 2371.0 1828.6 3645.5 6402.7 10657.1 16339.9 23551.2Depreciation of Property and Equipment, Including Internal-Use Software 6281.0 8117.0 11273.3 14590.4 18090.6 21823.6 25718.2 29947.4Amortization of Goodwill and Other Intangibles 0.0 0.0 0.0 0.0 0.0 0.0 0.0 0.0Stock-Based Compensation 2120.0 2975.0 3454.6 4061.6 4733.1 5402.8 6107.9 6837.6Other Operating Expense (Income), Net 155.0 158.0 0.0 0.0 0.0 0.0 0.0 0.0Losses (Gains) on Sales of Marketable Securities, Net 5.0 3.0 0.0 0.0 0.0 0.0 0.0 0.0Other Expense (Income), Net 244.0 (23.0) 0.0 0.0 0.0 0.0 0.0 0.0Deferred Income Taxes 82.0 (246.0) 0.0 0.0 0.0 0.0 0.0 0.0Excess Tax Benefits from Stock-Based Compensation (119.0) (829.0) (1308.6) (1538.6) (1792.9) (2046.6) (2313.7) (2590.1)Other 0.0 0.0 0.0 0.0 0.0 0.0 0.0 0.0
Inventories (2186.0) (1426.0) (1790.0) (1680.0) (1751.6) (1741.3) (1701.9) (1623.3)Accounts Receivable, Net and Other (1755.0) (3367.0) (1045.7) (1739.4) (1945.6) (2156.1) (2350.5) (2527.2)Accounts Payable 4294.0 5030.0 5498.0 6210.4 7071.2 7800.6 8509.3 9150.8Accrued Expenses and Other 910.0 1724.0 2910.6 2820.9 3050.5 3196.1 3324.4 3410.2Addition to Unearned Revenue 7401.0 11931.0 278.4 935.3 1046.2 1159.4 1263.9 1358.9Amortization of Previously Unearned Revenue (6108.0) (9976.0) 0.0 0.0 0.0 0.0 0.0 0.0Other 0.0 0.0 0.0 0.0 0.0 0.0 0.0 0.0Net Cash from Operating Activities 11920.0 16442.0 21099.0 27306.1 34904.1 44095.6 54897.6 67515.5
Investing Activities:Purchases of Property and Equipment (4588.0) (6736.0) (7444.9) (7817.1) (8129.8) (8373.7) (8541.2) (8626.6)Acquisitions, Net of cash Acquired and Other (795.0) (117.0) 0.0 0.0 0.0 0.0 0.0 0.0Sales and Maturities of Marketable Securities 3025.0 4733.0 0.0 0.0 0.0 0.0 0.0 0.0Purchases of Marketable Securities and Other (4092.0) (7756.0) 0.0 0.0 0.0 0.0 0.0 0.0Other 0.0 0.0 0.0 0.0 0.0 0.0 0.0 0.0Net Cash from Investing Activities (6450.0) (9876.0) (7444.9) (7817.1) (8129.8) (8373.7) (8541.2) (8626.6)
Financing Activities:Excess Tax Benefits from Stock-Based Compensation 119.0 829.0 0.0 0.0 0.0 0.0 0.0 0.0Proceeds from Long-Term Debt and Other 353.0 620.0 0.0 0.0 0.0 0.0 0.0 0.0Repayments of Long-Term Debt (1652.0) (355.0) 0.0 0.0 0.0 0.0 0.0 0.0Proceeds from Issuance of Common Stock 0.0 0.0 0.0 0.0 0.0 0.0 0.0 0.0Other 0.0 0.0 0.0 0.0 0.0 0.0 0.0 0.0Net Cash from Financing Activities (3763.0) (2911.0) (5161.1) (6139.8) (7081.3) (8013.7) (8947.5) (9883.5)
Foreign-Currency Effect on Cash and Cash Equivalents (374.0) (211.0) 0.0 0.0 0.0 0.0 0.0 0.0Net Increase (Decrease) in Cash and Cash Equivalents 1333.0 3444.0 8493.0 13349.2 19693.0 27708.2 37408.9 49005.4Cash and Cash Equivalents, Beginning of Period 14557.0 15890.0 19334.0 27827.0 41176.2 60869.2 88577.3 125986.2Cash and Cash Equivalents, End of Period 15890.0 19334.0 27827.0 41176.2 60869.2 88577.3 125986.2 174991.6
Property and Equipment Acquired Under Capital Leases 4717.0 5704.0 6790.9 7599.5 8442.9 9311.1 10192.2 11072.4Property and Equipment Acquired Under Build-to-Suit Leases 544.0 1209.0 1270.7 1330.3 1380.3 1419.3 1446.1 1459.7
Source: Company data, Credit Suisse estimates
17 April 2017
Amazon com Inc. (AMZN) 12
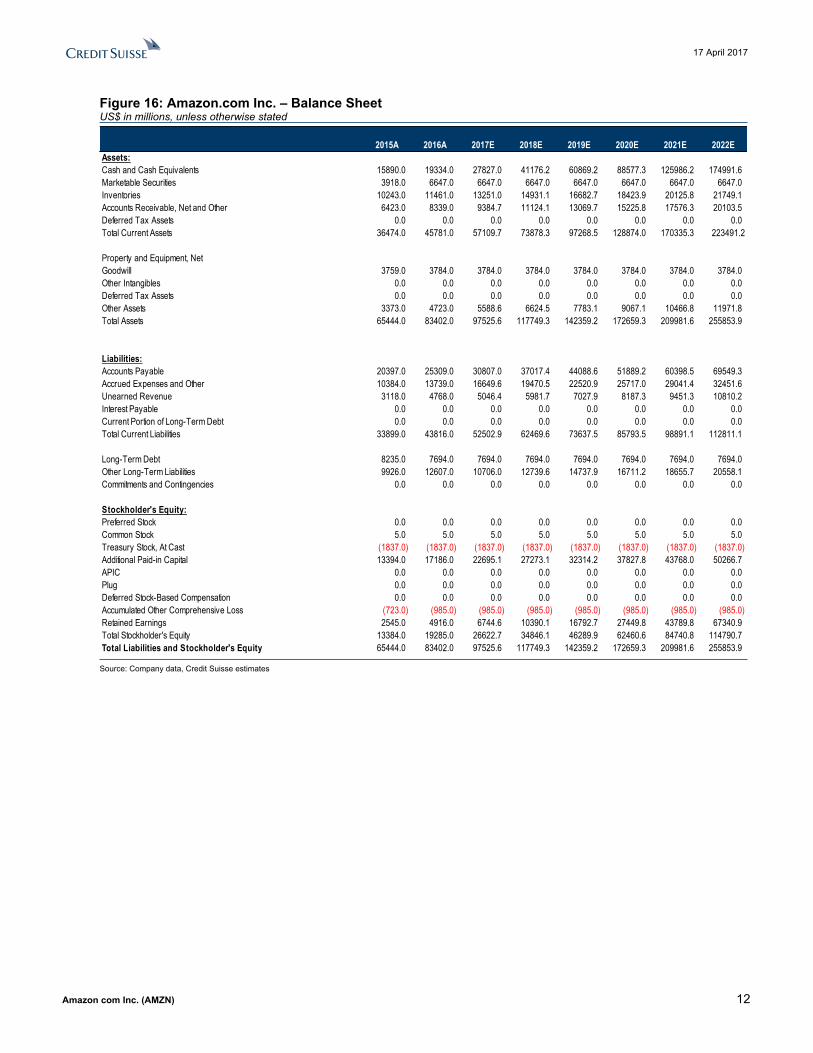
Figure 16: Amazon.com Inc. – Balance Sheet US$ in millions, unless otherwise stated
2015A 2016A 2017E 2018E 2019E 2020E 2021E 2022EAssets:Cash and Cash Equivalents 15890.0 19334.0 27827.0 41176.2 60869.2 88577.3 125986.2 174991.6Marketable Securities 3918.0 6647.0 6647.0 6647.0 6647.0 6647.0 6647.0 6647.0Inventories 10243.0 11461.0 13251.0 14931.1 16682.7 18423.9 20125.8 21749.1Accounts Receivable, Net and Other 6423.0 8339.0 9384.7 11124.1 13069.7 15225.8 17576.3 20103.5Deferred Tax Assets 0.0 0.0 0.0 0.0 0.0 0.0 0.0 0.0Total Current Assets 36474.0 45781.0 57109.7 73878.3 97268.5 128874.0 170335.3 223491.2
Property and Equipment, NetGoodwill 3759.0 3784.0 3784.0 3784.0 3784.0 3784.0 3784.0 3784.0Other Intangibles 0.0 0.0 0.0 0.0 0.0 0.0 0.0 0.0Deferred Tax Assets 0.0 0.0 0.0 0.0 0.0 0.0 0.0 0.0Other Assets 3373.0 4723.0 5588.6 6624.5 7783.1 9067.1 10466.8 11971.8Total Assets 65444.0 83402.0 97525.6 117749.3 142359.2 172659.3 209981.6 255853.9
Liabilities:Accounts Payable 20397.0 25309.0 30807.0 37017.4 44088.6 51889.2 60398.5 69549.3Accrued Expenses and Other 10384.0 13739.0 16649.6 19470.5 22520.9 25717.0 29041.4 32451.6Unearned Revenue 3118.0 4768.0 5046.4 5981.7 7027.9 8187.3 9451.3 10810.2Interest Payable 0.0 0.0 0.0 0.0 0.0 0.0 0.0 0.0Current Portion of Long-Term Debt 0.0 0.0 0.0 0.0 0.0 0.0 0.0 0.0Total Current Liabilities 33899.0 43816.0 52502.9 62469.6 73637.5 85793.5 98891.1 112811.1
Long-Term Debt 8235.0 7694.0 7694.0 7694.0 7694.0 7694.0 7694.0 7694.0Other Long-Term Liabilities 9926.0 12607.0 10706.0 12739.6 14737.9 16711.2 18655.7 20558.1Commitments and Contingencies 0.0 0.0 0.0 0.0 0.0 0.0 0.0 0.0
Stockholder's Equity:Preferred Stock 0.0 0.0 0.0 0.0 0.0 0.0 0.0 0.0Common Stock 5.0 5.0 5.0 5.0 5.0 5.0 5.0 5.0Treasury Stock, At Cast (1837.0) (1837.0) (1837.0) (1837.0) (1837.0) (1837.0) (1837.0) (1837.0)Additional Paid-in Capital 13394.0 17186.0 22695.1 27273.1 32314.2 37827.8 43768.0 50266.7APIC 0.0 0.0 0.0 0.0 0.0 0.0 0.0 0.0Plug 0.0 0.0 0.0 0.0 0.0 0.0 0.0 0.0Deferred Stock-Based Compensation 0.0 0.0 0.0 0.0 0.0 0.0 0.0 0.0Accumulated Other Comprehensive Loss (723.0) (985.0) (985.0) (985.0) (985.0) (985.0) (985.0) (985.0)Retained Earnings 2545.0 4916.0 6744.6 10390.1 16792.7 27449.8 43789.8 67340.9Total Stockholder's Equity 13384.0 19285.0 26622.7 34846.1 46289.9 62460.6 84740.8 114790.7Total Liabilities and Stockholder's Equity 65444.0 83402.0 97525.6 117749.3 142359.2 172659.3 209981.6 255853.9
Source: Company data, Credit Suisse estimates

17 April 2017
Amazon com Inc. (AMZN) 13
Companies Mentioned (Price as of 16-Apr-2017)Amazon com Inc. (AMZN.OQ, $884.67, OUTPERFORM, TP $1050.0)
Disclosure AppendixAnalyst Certification I, Stephen Ju, certify that (1) the views expressed in this report accurately reflect my personal views about all of the subject companies and securities and (2) no part of my compensation was, is or will be directly or indirectly related to the specific recommendations or views expressed in this report.
3-Year Price and Rating History for Amazon com Inc. (AMZN.OQ)
AMZN.OQ Closing Price Target Price Date (US$) (US$) Rating 25-Apr-14 303.83 439.00 O 25-Jul-14 324.01 431.00 14-Oct-14 308.31 422.00 24-Oct-14 287.06 395.00 14-Jan-15 293.27 389.00 30-Jan-15 354.53 410.00 14-Apr-15 385.11 412.00 24-Apr-15 445.10 480.00 24-Jul-15 529.42 700.00 09-Oct-15 539.80 720.00 23-Oct-15 599.03 777.00 12-Jan-16 617.89 800.00 29-Apr-16 659.59 880.00 29-Jul-16 758.81 920.00 17-Oct-16 812.95 1050.00 28-Oct-16 776.32 1000.00 11-Jan-17 799.02 950.00 03-Feb-17 810.20 900.00 * Asterisk signifies initiation or assumption of coverage.
Target Price Closing Price AMZN.OQ
01- Jan- 2015 01- Jan- 2016 01- Jan- 2017200
400
600
800
1,000
1,200
O U T PERFO RM
The analyst(s) responsible for preparing this research report received Compensation that is based upon various factors including Credit Suisse's total revenues, a portion of which are generated by Credit Suisse's investment banking activitiesAs of December 10, 2012 Analysts’ stock rating are defined as follows:Outperform (O) : The stock’s total return is expected to outperform the relevant benchmark* over the next 12 months.Neutral (N) : The stock’s total return is expected to be in line with the relevant benchmark* over the next 12 months.Underperform (U) : The stock’s total return is expected to underperform the relevant benchmark* over the next 12 months. *Relevant benchmark by region: As of 10th December 2012, Japanese ratings are based on a stock’s total return relative to the analyst's coverage universe which consists of all companies covered by the analyst within the relevant sector, with Outperforms representing the most attractive, Neutrals the less attractive, and Underperforms the least attractive investment opportunities. As of 2nd October 2012, U.S. and Canadian as well as European ratings are based on a stock’s total return relative to the analyst's coverage universe which consists of all companies covered by the analyst within the relevant sector, with Outperforms representing the most attractive, Neutrals the less attractive, and Underperforms the least attractive investment opportunities. For Latin American and non-Japan Asia stocks, ratings are based on a stock’s total return relative to the average total return of the relevant country or regional benchmark; prior to 2nd October 2012 U.S. and Canadian ratings were based on (1) a stock’s absolute total return potential to its current share price and (2) the relative attractiveness of a stock’s total return potential within an analyst’s coverage universe. For Australian and New Zealand stocks, the expected total return (ETR) calculation includes 12-month rolling dividend yield. An Outperform rating is assigned where an ETR is greater than or equal to 7.5%; Underperform where an ETR less than or equal to 5%. A Neutral may be assigned where the ETR is between -5% and 15%. The overlapping rating range allows analysts to assign a rating that puts ETR in the context of associated risks. Prior to 18 May 2015, ETR ranges for Outperform and Underperform ratings did not overlap with Neutral thresholds between 15% and 7.5%, which was in operation from 7 July 2011.Restricted (R) : In certain circumstances, Credit Suisse policy and/or applicable law and regulations preclude certain types of communications, including an investment recommendation, during the course of Credit Suisse's engagement in an investment banking transaction and in certain other circumstances.Not Rated (NR) : Credit Suisse Equity Research does not have an investment rating or view on the stock or any other securities related to the company at this time.Not Covered (NC) : Credit Suisse Equity Research does not provide ongoing coverage of the company or offer an investment rating or investment view on the equity security of the company or related products.Volatility Indicator [V] : A stock is defined as volatile if the stock price has moved up or down by 20% or more in a month in at least 8 of the past 24 months or the analyst expects significant volatility going forward.Analysts’ sector weightings are distinct from analysts’ stock ratings and are based on the analyst’s expectations for the fundamentals and/or valuation of the sector* relative to the group’s historic fundamentals and/or valuation:Overweight : The analyst’s expectation for the sector’s fundamentals and/or valuation is favorable over the next 12 months.

17 April 2017
Amazon com Inc. (AMZN) 14
Market Weight : The analyst’s expectation for the sector’s fundamentals and/or valuation is neutral over the next 12 months.Underweight : The analyst’s expectation for the sector’s fundamentals and/or valuation is cautious over the next 12 months. *An analyst’s coverage sector consists of all companies covered by the analyst within the relevant sector. An analyst may cover multiple sectors.
Credit Suisse's distribution of stock ratings (and banking clients) is:
Global Ratings DistributionRating Versus universe (%) Of which banking clients (%)Outperform/Buy* 45% (64% banking clients)Neutral/Hold* 39% (61% banking clients)Underperform/Sell* 14% (54% banking clients)Restricted 2%*For purposes of the NYSE and FINRA ratings distribution disclosure requirements, our stock ratings of Outperform, Neutral, and Underperform most closely correspond to Buy, Hold, and Sell, respectively; however, the meanings are not the same, as our stock ratings are determined on a relative basis. (Please refer to definitions above.) An investor's decision to buy or sell a security should be based on investment objectives, current holdings, and other individual factors.
Important Global Disclosures Credit Suisse’s research reports are made available to clients through our proprietary research portal on CS PLUS. Credit Suisse research products may also be made available through third-party vendors or alternate electronic means as a convenience. Certain research products are only made available through CS PLUS. The services provided by Credit Suisse’s analysts to clients may depend on a specific client’s preferences regarding the frequency and manner of receiving communications, the client’s risk profile and investment, the size and scope of the overall client relationship with the Firm, as well as legal and regulatory constraints. To access all of Credit Suisse’s research that you are entitled to receive in the most timely manner, please contact your sales representative or go to https://plus.credit-suisse.com . Credit Suisse’s policy is to update research reports as it deems appropriate, based on developments with the subject company, the sector or the market that may have a material impact on the research views or opinions stated herein.Credit Suisse's policy is only to publish investment research that is impartial, independent, clear, fair and not misleading. For more detail please refer to Credit Suisse's Policies for Managing Conflicts of Interest in connection with Investment Research: https://www.credit-suisse.com/sites/disclaimers-ib/en/managing-conflicts.html . Credit Suisse does not provide any tax advice. Any statement herein regarding any US federal tax is not intended or written to be used, and cannot be used, by any taxpayer for the purposes of avoiding any penalties.
Target Price and RatingValuation Methodology and Risks: (12 months) for Amazon com Inc. (AMZN.OQ)
Method: We use the discounted cash flow (DCF) method to calculate our $1050 target price for AMZN. Our 5-year DCF uses a 3% terminal growth rate and a market-implied discount rate derived by discounting our unlevered FCF (free cash flow) estimates from 2017 through 2022 to arrive at the stock's current trading price. We then applied this discount rate to our 2017-2022 unlevered free cash flow estimates for AMZN. We maintain our Outperform rating for AMZN shares, and factors that can provide potential upside to our estimates include: ) re-establishment of e-commerce segment operating margin expansion as Amazon grows into its larger infrastructure, 2) ongoing margin benefit due to shipping loss moderation, and 3) upward bias to AWS revenue forecasts and likely more moderate deceleration path as suggested by ongoing capital intensity in the busines
Risk: Risks to our $1050 target price and Outperform rating for AMZN include a deteriorating global economy, competition from major offline retailers, volatility in operating margins, and unpredictable investment spending.
Please refer to the firm's disclosure website at https://rave.credit-suisse.com/disclosures/view/selectArchive for the definitions of abbreviations typically used in the target price method and risk sections. See the Companies Mentioned section for full company names The subject company (AMZN.OQ) currently is, or was during the 12-month period preceding the date of distribution of this report, a client of Credit Suisse.Credit Suisse expects to receive or intends to seek investment banking related compensation from the subject company (AMZN.OQ) within the next 3 months.A member of the Credit Suisse Group is party to an agreement with, or may have provided services set out in sections A and B of Annex I of Directive 2014/65/EU of the European Parliament and Council ("MiFID Services") to, the subject issuer (AMZN.OQ) within the past 12 months.For date and time of production, dissemination and history of recommendation for the subject company(ies) featured in this report, disseminated within the past 12 months, please refer to the link: https://rave.credit-suisse.com/disclosures/view/report?i=294525&v=-1vdvne3rp44nb5z2iynrqpa33 . Important Regional Disclosures Singapore recipients should contact Credit Suisse AG, Singapore Branch for any matters arising from this research report.The analyst(s) involved in the preparation of this report may participate in events hosted by the subject company, including site visits. Credit Suisse does not accept or permit analysts to accept payment or reimbursement for travel expenses associated with these events.Restrictions on certain Canadian securities are indicated by the following abbreviations: NVS--Non-Voting shares; RVS--Restricted Voting Shares; SVS--Subordinate Voting Shares.Individuals receiving this report from a Canadian investment dealer that is not affiliated with Credit Suisse should be advised that this report may not contain regulatory disclosures the non-affiliated Canadian investment dealer would be required to make if this were its own report.

17 April 2017
Amazon com Inc. (AMZN) 15
For Credit Suisse Securities (Canada), Inc.'s policies and procedures regarding the dissemination of equity research, please visit https://www.credit-suisse.com/sites/disclaimers-ib/en/canada-research-policy.html.Principal is not guaranteed in the case of equities because equity prices are variable.Commission is the commission rate or the amount agreed with a customer when setting up an account or at any time after that.This research report is authored by:Credit Suisse Securities (USA) LLC ...................................................................................................................Stephen Ju ; Vikram KesavabhotlaImportant disclosures regarding companies or other issuers that are the subject of this report are available on Credit Suisse’s disclosure website at https://rave.credit-suisse.com/disclosures or by calling +1 (877) 291-2683.

17 April 2017
Amazon com Inc. (AMZN) 16
This report is produced by subsidiaries and affiliates of Credit Suisse operating under its Global Markets Division. For more information on our structure, please use the following link: https://www.credit-suisse.com/who-we-are This report may contain material that is not directed to, or intended for distribution to or use by, any person or entity who is a citizen or resident of or located in any locality, state, country or other jurisdiction where such distribution, publication, availability or use would be contrary to law or regulation or which would subject Credit Suisse or its affiliates ("CS") to any registration or licensing requirement within such jurisdiction. All material presented in this report, unless specifically indicated otherwise, is under copyright to CS. None of the material, nor its content, nor any copy of it, may be altered in any way, transmitted to, copied or distributed to any other party, without the prior express written permission of CS. All trademarks, service marks and logos used in this report are trademarks or service marks or registered trademarks or service marks of CS or its affiliates.The information, tools and material presented in this report are provided to you for information purposes only and are not to be used or considered as an offer or the solicitation of an offer to sell or to buy or subscribe for securities or other financial instruments. CS may not have taken any steps to ensure that the securities referred to in this report are suitable for any particular investor. CS will not treat recipients of this report as its customers by virtue of their receiving this report. The investments and services contained or referred to in this report may not be suitable for you and it is recommended that you consult an independent investment advisor if you are in doubt about such investments or investment services. Nothing in this report constitutes investment, legal, accounting or tax advice, or a representation that any investment or strategy is suitable or appropriate to your individual circumstances, or otherwise constitutes a personal recommendation to you. CS does not advise on the tax consequences of investments and you are advised to contact an independent tax adviser. Please note in particular that the bases and levels of taxation may change. Information and opinions presented in this report have been obtained or derived from sources believed by CS to be reliable, but CS makes no representation as to their accuracy or completeness. CS accepts no liability for loss arising from the use of the material presented in this report, except that this exclusion of liability does not apply to the extent that such liability arises under specific statutes or regulations applicable to CS. This report is not to be relied upon in substitution for the exercise of independent judgment. CS may have issued, and may in the future issue, other communications that are inconsistent with, and reach different conclusions from, the information presented in this report. Those communications reflect the different assumptions, views and analytical methods of the analysts who prepared them and CS is under no obligation to ensure that such other communications are brought to the attention of any recipient of this report. Some investments referred to in this report will be offered solely by a single entity and in the case of some investments solely by CS, or an associate of CS or CS may be the only market maker in such investments. Past performance should not be taken as an indication or guarantee of future performance, and no representation or warranty, express or implied, is made regarding future performance. Information, opinions and estimates contained in this report reflect a judgment at its original date of publication by CS and are subject to change without notice. The price, value of and income from any of the securities or financial instruments mentioned in this report can fall as well as rise. The value of securities and financial instruments is subject to exchange rate fluctuation that may have a positive or adverse effect on the price or income of such securities or financial instruments. Investors in securities such as ADR's, the values of which are influenced by currency volatility, effectively assume this risk. Structured securities are complex instruments, typically involve a high degree of risk and are intended for sale only to sophisticated investors who are capable of understanding and assuming the risks involved. The market value of any structured security may be affected by changes in economic, financial and political factors (including, but not limited to, spot and forward interest and exchange rates), time to maturity, market conditions and volatility, and the credit quality of any issuer or reference issuer. Any investor interested in purchasing a structured product should conduct their own investigation and analysis of the product and consult with their own professional advisers as to the risks involved in making such a purchase. Some investments discussed in this report may have a high level of volatility. High volatility investments may experience sudden and large falls in their value causing losses when that investment is realised. Those losses may equal your original investment. Indeed, in the case of some investments the potential losses may exceed the amount of initial investment and, in such circumstances, you may be required to pay more money to support those losses. Income yields from investments may fluctuate and, in consequence, initial capital paid to make the investment may be used as part of that income yield. Some investments may not be readily realisable and it may be difficult to sell or realise those investments, similarly it may prove difficult for you to obtain reliable information about the value, or risks, to which such an investment is exposed. This report may provide the addresses of, or contain hyperlinks to, websites. Except to the extent to which the report refers to website material of CS, CS has not reviewed any such site and takes no responsibility for the content contained therein. Such address or hyperlink (including addresses or hyperlinks to CS's own website material) is provided solely for your convenience and information and the content of any such website does not in any way form part of this document. Accessing such website or following such link through this report or CS's website shall be at your own risk.
This report is issued and distributed in European Union (except Switzerland): by Credit Suisse Securities (Europe) Limited, One Cabot Square, London E14 4QJ, England, which is authorised by the Prudential Regulation Authority and regulated by the Financial Conduct Authority and the Prudential Regulation Authority. Germany: Credit Suisse Securities (Europe) Limited Niederlassung Frankfurt am Main regulated by the Bundesanstalt fuer Finanzdienstleistungsaufsicht ("BaFin"). United States and Canada: Credit Suisse Securities (USA) LLC; Switzerland: Credit Suisse AG; Brazil: Banco de Investimentos Credit Suisse (Brasil) S.A or its affiliates; Mexico: Banco Credit Suisse (México), S.A. (transactions related to the securities mentioned in this report will only be effected in compliance with applicable regulation); Japan: by Credit Suisse Securities (Japan) Limited, Financial Instruments Firm, Director-General of Kanto Local Finance Bureau ( Kinsho) No. 66, a member of Japan Securities Dealers Association, The Financial Futures Association of Japan, Japan Investment Advisers Association, Type II Financial Instruments Firms Association; Hong Kong: Credit Suisse (Hong Kong) Limited; Australia: Credit Suisse Equities (Australia) Limited; Thailand: Credit Suisse Securities (Thailand) Limited, regulated by the Office of the Securities and Exchange Commission, Thailand, having registered address at 990 Abdulrahim Place, 27th Floor, Unit 2701, Rama IV Road, Silom, Bangrak, Bangkok10500, Thailand, Tel. +66 2614 6000; Malaysia: Credit Suisse Securities (Malaysia) Sdn Bhd; Singapore: Credit Suisse AG, Singapore Branch; India: Credit Suisse Securities (India) Private Limited (CIN no.U67120MH1996PTC104392) regulated by the Securities and Exchange Board of India as Research Analyst (registration no. INH 000001030) and as Stock Broker (registration no. INB230970637; INF230970637; INB010970631; INF010970631), having registered address at 9th Floor, Ceejay House, Dr.A.B. Road, Worli, Mumbai - 18, India, T- +91-22 6777 3777; South Korea: Credit Suisse Securities (Europe) Limited, Seoul Branch; Taiwan: Credit Suisse AG Taipei Securities Branch; Indonesia: PT Credit Suisse Securities Indonesia; Philippines:Credit Suisse Securities (Philippines ) Inc., and elsewhere in the world by the relevant authorised affiliate of the above.Additional Regional DisclaimersHong Kong: Credit Suisse (Hong Kong) Limited ("CSHK") is licensed and regulated by the Securities and Futures Commission of Hong Kong under the laws of Hong Kong, which differ from Australian laws. CSHKL does not hold an Australian financial services licence (AFSL) and is exempt from the requirement to hold an AFSL under the Corporations Act 2001 (the Act) under Class Order 03/1103 published by the ASIC in respect of financial services provided to Australian wholesale clients (within the meaning of section 761G of the Act). Research on Taiwanese securities produced by Credit Suisse AG, Taipei Securities Branch has been prepared by a registered Senior Business Person. Australia (to the extent services are offered in Australia): Credit Suisse Securities (Europe) Limited (“CSSEL”) and Credit Suisse International (“CSI”) are authorised by the Prudential Regulation Authority and regulated by the Financial Conduct Authority (“FCA”) and the Prudential Regulation Authority under UK laws, which differ from Australian Laws. CSSEL and CSI do not hold an Australian Financial Services Licence (“AFSL”) and are exempt from the requirement to hold an AFSL under the Corporations Act (Cth) 2001 (“Corporations Act”) under Class Order 03/1099 published by the Australian Securities and Investments Commission (“ASIC”), in respect of the financial services provided to Australian wholesale clients (within the meaning of section 761G of the Corporations Act). This material is not for distribution to retail clients and is directed exclusively at Credit Suisse's professional clients and eligible counterparties as defined by the FCA, and wholesale clients as defined under section 761G of the Corporations Act. Credit Suisse (Hong Kong) Limited (“CSHK”) is licensed and regulated by the Securities and Futures Commission of Hong Kong under the laws of Hong Kong, which differ from Australian laws. CSHKL does not hold an AFSL and is exempt from the requirement to hold an AFSL under the Corporations Act under Class Order 03/1103 published by the ASIC in respect of financial services provided to Australian wholesale clients (within the meaning of section 761G of the Corporations Act). Credit Suisse Securities (USA) LLC (CSSU) and Credit Suisse Asset Management LLC (CSAM LLC) are licensed and regulated by the Securities Exchange Commission of the United States under the laws of the United States, which differ from Australian laws. CSSU and CSAM LLC do not hold an AFSL and is exempt from the requirement to hold an AFSL under the Corporations Act under Class Order 03/1100 published by the ASIC in respect of financial services provided to Australian wholesale clients (within the meaning of section 761G of the Corporations Act). Malaysia: Research provided to residents of Malaysia is authorised by the Head of Research for Credit Suisse Securities (Malaysia) Sdn Bhd, to whom they should direct any queries on +603 2723 2020. Singapore: This report has been prepared and issued for distribution in Singapore to institutional investors, accredited investors and expert investors (each as defined under the Financial Advisers Regulations) only, and is also distributed by Credit Suisse AG, Singapore Branch to overseas investors (as defined under the Financial Advisers Regulations). Credit Suisse AG, Singapore Branch may distribute reports produced by its foreign entities or affiliates pursuant to an arrangement under Regulation 32C of the Financial Advisers Regulations. Singapore recipients should contact Credit Suisse AG, Singapore Branch at +65-6212-2000 for matters arising from, or in connection with, this report. By virtue of your status as an institutional investor, accredited investor, expert investor or overseas investor, Credit Suisse AG, Singapore Branch is exempted from complying with certain compliance requirements under the Financial Advisers Act, Chapter 110 of Singapore (the “FAA”), the Financial Advisers Regulations and the relevant Notices and Guidelines issued thereunder, in respect of any financial advisory service which Credit Suisse AG, Singapore Branch may provide to you. UAE: This information is being distributed by Credit Suisse AG (DIFC Branch), duly licensed and regulated by the Dubai Financial Services Authority (“DFSA”). Related financial services or products are only made available to Professional Clients or Market Counterparties, as defined by the DFSA, and are not intended for any other persons. Credit Suisse AG (DIFC Branch) is located on Level 9 East, The Gate Building, DIFC, Dubai, United Arab Emirates. EU: This report has been produced by subsidiaries and affiliates of Credit Suisse operating under its Global Markets Division In jurisdictions where CS is not already registered or licensed to trade in securities, transactions will only be effected in accordance with applicable securities legislation, which will vary from jurisdiction to jurisdiction and may require that the trade be made in accordance with applicable exemptions from registration or licensing requirements. Non-US customers wishing to effect a transaction should contact a CS entity in their local jurisdiction unless governing law permits otherwise. US customers wishing to effect a transaction should do so only by contacting a representative at Credit Suisse Securities (USA) LLC in the US. Please note that this research was originally prepared and issued by CS for distribution to their market professional and institutional investor customers. Recipients who are not market professional or institutional investor customers of CS should seek the advice of their independent financial advisor prior to taking any investment decision based on this report or for any necessary explanation of its contents. This research may relate to investments or services of a person outside of the UK or to other matters which are not authorised by the Prudential Regulation Authority and regulated by the Financial Conduct Authority and the Prudential Regulation Authority or in respect of which the protections of the Prudential Regulation Authority and Financial Conduct Authority for private customers and/or the UK compensation scheme may not be available, and further details as to where this may be the case are available upon request in respect of this report. CS may provide various services to US municipal entities or obligated persons ("municipalities"), including suggesting individual transactions or trades and entering into such transactions. Any services CS provides to municipalities are not viewed as "advice" within the meaning of Section 975 of the Dodd-Frank Wall Street Reform and Consumer Protection Act. CS is providing any such services and related information solely on an arm's length basis and not as an advisor or fiduciary to the municipality. In connection with the provision of the any such services, there is no agreement, direct or indirect, between any municipality (including the officials,management, employees or agents thereof) and CS for CS to provide advice to the municipality. Municipalities should consult with their financial, accounting and legal advisors regarding any such services provided by CS. In addition, CS is not acting for direct or indirect compensation to solicit the municipality on behalf of an unaffiliated broker, dealer, municipal securities dealer, municipal advisor, or investment adviser for the purpose of obtaining or retaining an engagement by the municipality for or in connection with Municipal Financial Products, the issuance of municipal securities, or of an investment adviser to provide investment advisory services to or on behalf of the municipality. If this report is being distributed by a financial institution other than Credit Suisse AG, or its affiliates, that financial institution is solely responsible for distribution. Clients of that institution should contact that institution to effect a transaction in the securities mentioned in this report or require further information. This report does not constitute investment advice by Credit Suisse to the clients of the distributing financial institution, and neither Credit Suisse AG, its affiliates, and their respective officers, directors and employees accept any liability whatsoever for any direct or consequential loss arising from their use of this report or its content. Principal is not guaranteed. Commission is the commission rate or the amount agreed with a customer when setting up an account or at any time after that. Copyright © 2017 CREDIT SUISSE AG and/or its affiliates. All rights reserved. Investment principal on bonds can be eroded depending on sale price or market price. In addition, there are bonds on which investment principal can be eroded due to changes in redemption amounts. Care is required when investing in such instruments. When you purchase non-listed Japanese fixed income securities (Japanese government bonds, Japanese municipal bonds, Japanese government guaranteed bonds, Japanese corporate bonds) from CS as a seller, you will be requested to pay the purchase price only.