AmalBabuPuthumana - Griffith University
155
Effect of feed ratio and pre-treatment on methane yields during anaerobic co-digestion of sugarcane bagasse and trash with chicken manure Author Puthumana, Amal Babu Published 2020-05-15 Thesis Type Thesis (Masters) School School of Eng & Built Env DOI https://doi.org/10.25904/1912/3687 Copyright Statement The author owns the copyright in this thesis, unless stated otherwise. Downloaded from http://hdl.handle.net/10072/393971 Griffith Research Online https://research-repository.griffith.edu.au
Transcript of AmalBabuPuthumana - Griffith University

Effect of feed ratio and pre-treatment on methane yieldsduring anaerobic co-digestion of sugarcane bagasse andtrash with chicken manure
Author
Puthumana Amal Babu
Published
2020-05-15
Thesis Type
Thesis (Masters)
School
School of Eng amp Built Env
DOI
httpsdoiorg102590419123687
Copyright Statement
The author owns the copyright in this thesis unless stated otherwise
Downloaded from
httphdlhandlenet10072393971
Griffith Research Online
httpsresearch-repositorygriffitheduau
1
Effect of feed ratio and pre-treatment onmethane yields during anaerobic co-digestionof sugarcane bagasse and trash with chicken
manure
Amal Babu PuthumanaBachelor of Technology (BTech) Mahatma Gandhi
University India
Master of Technology (MTech) Cochin University of Scienceand Technology India
Griffith School of Engineering and Built
Environment Griffith Sciences
Griffith University Nathan QLD 4111 Australia
Submitted in the fulfillment of the requirements of thedegree of Master of Philosophy
November 2019
2ii
iii
ABSTRACT
Australia is one of the major producers and exporter of agricultural products Annually
Australian agriculture produces approximately 151 Tg CO2 equivalent emissions The
use of fossil fuels in crop cultivation harvesting and transportation are considered as the
primary source of these greenhouse gas (GHG) emissions Moreover agronomic
management and crop residues left in the field also contribute to these GHG emissions
Alternative waste management practices include the use of crop residues and
agro-wastes as feedstocks for bioenergy production Anaerobic digestion is considered
as sustainable environmental technology to convert industrial sugarcane residues to
carbon dioxide (CO2) - neutral biogas The biogas thus produced can be used to produce
heat electricity and upgrade to biomethane for vehicle use The produced biomethane
can replace the diesel consumption associated with GHG emission in cane transport
Sugarcane is one among the most cultivated crop in the world Australia alone produced
nearly 335 million tonnes of cane in 2018 (FAO 2018) These large production of
sugarcane lead to an increase in crop residues and agro-wastes from the sugarcane
industry In this study an investigation regarding the anaerobic co-digestion of crop
residues and agro-wastes from sugarcane industry viz sugarcane trash (SCT) or
sugarcane bagasse (SCB) with chicken manure (CM) was investigated in a batch
experiment at 37 degC In spite of various researches conducted till date about
co-digestion of lignocellulosic waste with manure no research data was available
regarding the effect of feed ratio on co-digestion of SCTSCB with CM This research
gap was investigated in this study In addition to this steam explosion pre-treatment of
SCTSCB was included to investigate how the pre-treatment influence methane yield
among different feed ratios of SCTSCB with CM
iv
At first SCT and SCB were subjected to steam explosion pre-treatment (steam
impregnation at 130 degC for 5 minutes followed by steam explosion) Later two sets of
biochemical methane potential (BMP) tests were conducted at an Inoculum to Substrate
Ratio (ISR) of 2 Co-digestion of untreated and steam exploded SCT or SCB with CM
was investigated at feed ratios of 7525 5050 and 2575 on volatile solids (VS) basis
Assays with 100 untreated and steam exploded SCT or SCB were also included
Chemical analysis revealed that the steam explosion improved the VS content in
pre-treated biomass compared with untreated biomass The increase in VS was 16
and 57 in SCT and SCB respectively
On the other hand a slight reduction in total solids (TS) of nearly 4 and 1 were
observed in the case of SCT and SCB respectively BMP results showed that the steam
explosion had a profound effect on the methane production rates and yields especially
for SCB than SCT Methane (CH4) yields of 2018 and 199 ml CH4gVSadded were
obtained during the mono-digestion of untreated SCT and SCB respectively The
corresponding values for 100 steam-exploded SCT and SCB were 2075 and 2256
mlgVSadded respectively In comparison to mono-digestion the co-digestion of SCB or
SCT with CM did not improve the methane yields
Nevertheless pre-treatment improved the methane production rates and yields of
pre-treated biomass than untreated biomass Among the studied feed ratios best
methane yields of 2065 mlgVSadded were obtained when steam-exploded SCT was
co-digested with CM at 7525 ratio However methane yields decreased with an
increase in the amount of CM added SCB also showed a similar trend The best
methane yield of 1995 mlgVSadded was obtained when steam-exploded SCB was
co-digested with CM at 7525 ratio Among the tested feed ratios all co-digestion
mixtures except for 7525 and 5050 ratios of untreated SCT to CM showed synergistic
v
effects The best synergistic effect of 1857 was observed when untreated SCB was
co-digested with CM at 2575 ratio Kinetic modelling results confirmed that the steam
explosion pre-treatment improved the methane production rates and yields by increasing
the hydrolysis rate constant values However a higher hydrolysis rate constant was
noticed for SCT than SCB The highest hydrolysis rate constant of 016 d-1 was
achieved at feed ratios of 5050 and 2575 of pre-treated SCTCM
Interestingly more than 75 of methane in pre-treated assays was produced by Day 11
The study thus suggests that the steam explosion can improve the methane production
rates yields and productivity of SCT and SCB However the use of CM as co-substrate
did not improve the methane yields when compared to the mono-digestion of SCT or
SCB but a positive synergism was evident in most of the co-digestion feed ratios
Keywords lignocellulosic biomass co-digestion anaerobic digestion (AD)
chicken manure steam explosion pre-treatment feed ratio synergistic effect
vi
STATEMENT OF ORIGINALITY
This work has not previously been submitted for a degree or diploma in any
university To the best of my knowledge and belief the thesis contains no
material previously published or written by another person except where due
reference is made in the thesis itself
Amal Babu Puthumana (-sd)
vii
TABLE OF CONTENTS
Abstract iii
Statement of originality vi
Table of contents vii
List of figures xi
List of tables xiii
List of symbols and abbreviations xiv
Acknowledgments xvi
Chapter 1 Introduction 1
11 Background 3
12 Aim and Objectives 5
13 Thesis outline 5
Chapter 2 Literature Review 7
21 Agro-waste generation and their management 9
22 Sugarcane cultivation in Australia 10
23 Impact of sugarcane agricultural residue on the environment 15
24 Energy potential of sugarcane agricultural residue 16
25 Lignocellulosic biomass structure 16
26 Anaerobic digestion process 18
27 AD process parameters 21
271 Process temperature 21
272 pH 24
273 CN ratio and trace nutrients 25
28 Pre-treatment of lignocellulosic substrates 26
viii
281 Physical pre-treatment 27
282 Chemical pre-treatment 33
283 Biological pre-treatment 34
29 Anaerobic co-digestion 35
291 Chicken manure as a co-digestion substrate 39
210 Overview of literature review 42
Chapter 3 Materials and Methods 43
31 Substrates 45
311 Lignocellulosic substrates 45
312 Manure 45
32 Inoculum 45
33 Pre-treatment of lignocellulosic substrates 46
34 Experimental design 46
35 Analytical methods 49
351 Determination of TS and VS 49
352 Determination of Chemical Oxygen Demand (COD) 49
353 Determination of Total Kjeldahl Nitrogen (TKN) Total
Kjeldahl Phosphorous (TKP) soluble and total metal ions 49
354 Determination of CN ratio 50
355 Determination of cellulose hemicellulose and lignin 50
356 Determination of VFA 50
357 Determination of ammoniacal nitrogen (NH4-N) and
phosphate (PO43-) 51
36 Biochemical Methane Potential (BMP) test 51
37 Data Processing 54
371 Theoretical BMP 54
372 Experimental BMP 54
ix
373 Synergistic effects analysis 56
374 Anaerobic biodegradability 56
375 BMP mathematical models 57
3751 First-order kinetic model 58
3752 Modified Gompertz model 58
376 Statistical analysis 59
Chapter 4 Results and Discussions 61
41 Physical properties and chemical composition of substrates
and Inoculum 63
42 Anaerobic co-digestion of untreated and steam exploded SCT
with CM 67
421 Effect of different feed ratio on methane yields
during anaerobic co-digestion of SCT with CM 67
422 Effect of steam explosion pre-treatment on anaerobic
co-digestion of SCT with CM at different feed ratios 69
423 Synergistic effects on anaerobic digestibility and methane yields
during anaerobic co-digestion of SCT with CM 71
43 Anaerobic co-digestion of untreated and steam exploded SCB
with CM 72
431 Effect of different feed ratio on methane yields
during anaerobic co-digestion of SCB with CM 73
432 Effect of steam explosion pre-treatment on anaerobic
co-digestion of SCB with CM at different feed ratios 75
433 Synergistic effects on anaerobic digestibility and methane yields
during anaerobic co-digestion of SCB with CM 76
44 Post BMP analysis of SCTSCB when co-digested with CM 77
441 Cumulative methane yield and statistical analysis 77
442 Anaerobic biodegradability 79
443 VFA analysis of digestates 81
x
444 FIA analysis of digestates 84
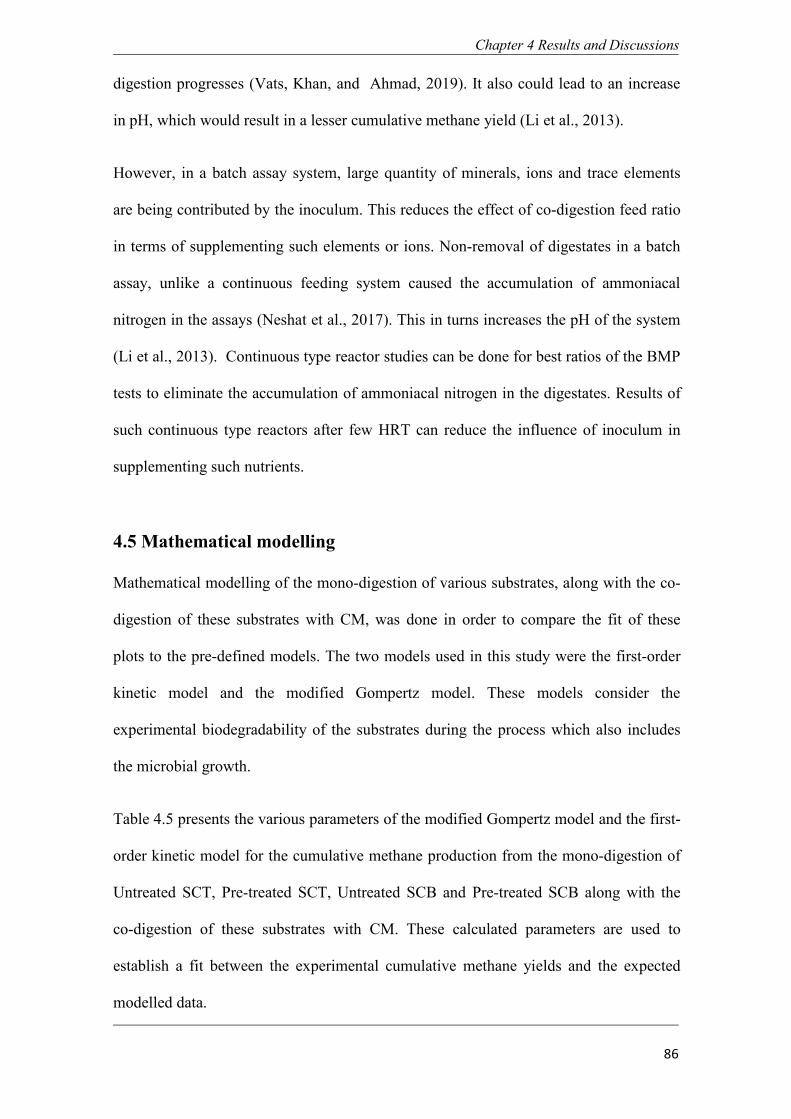
45 Mathematical modelling 86
Chapter 5 Conclusions 95
51 Conclusion to this research work 97
52 Related future research works 99
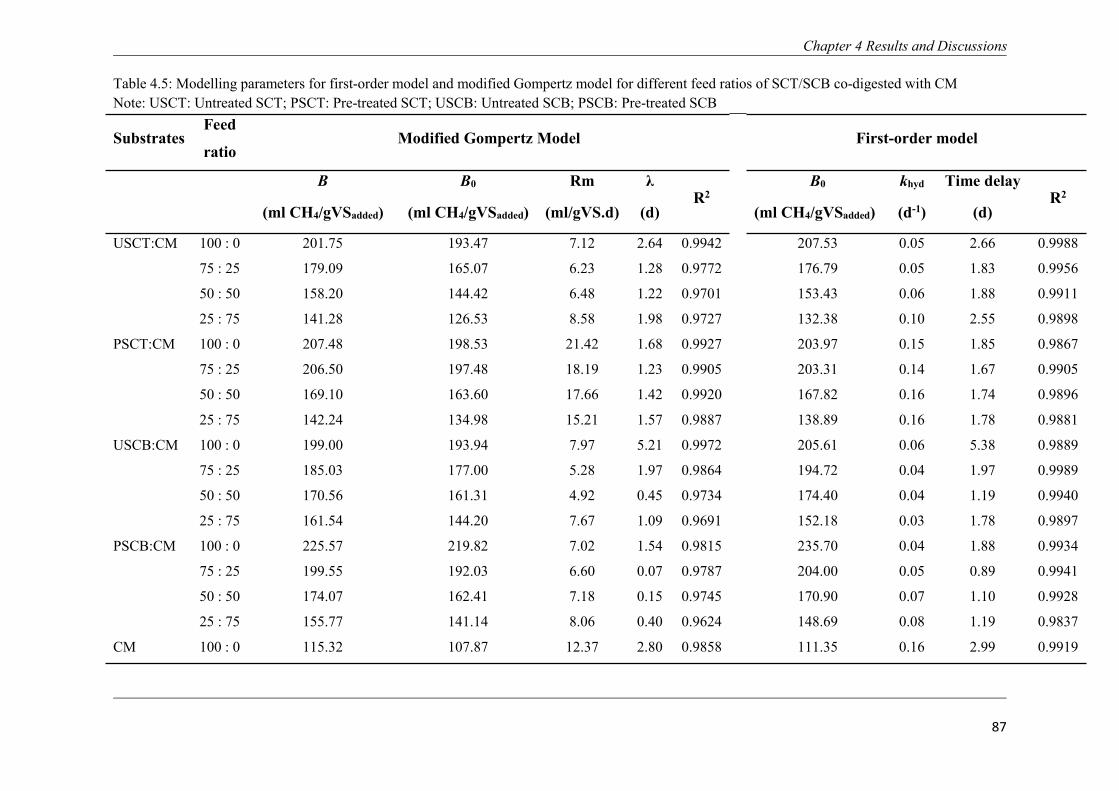
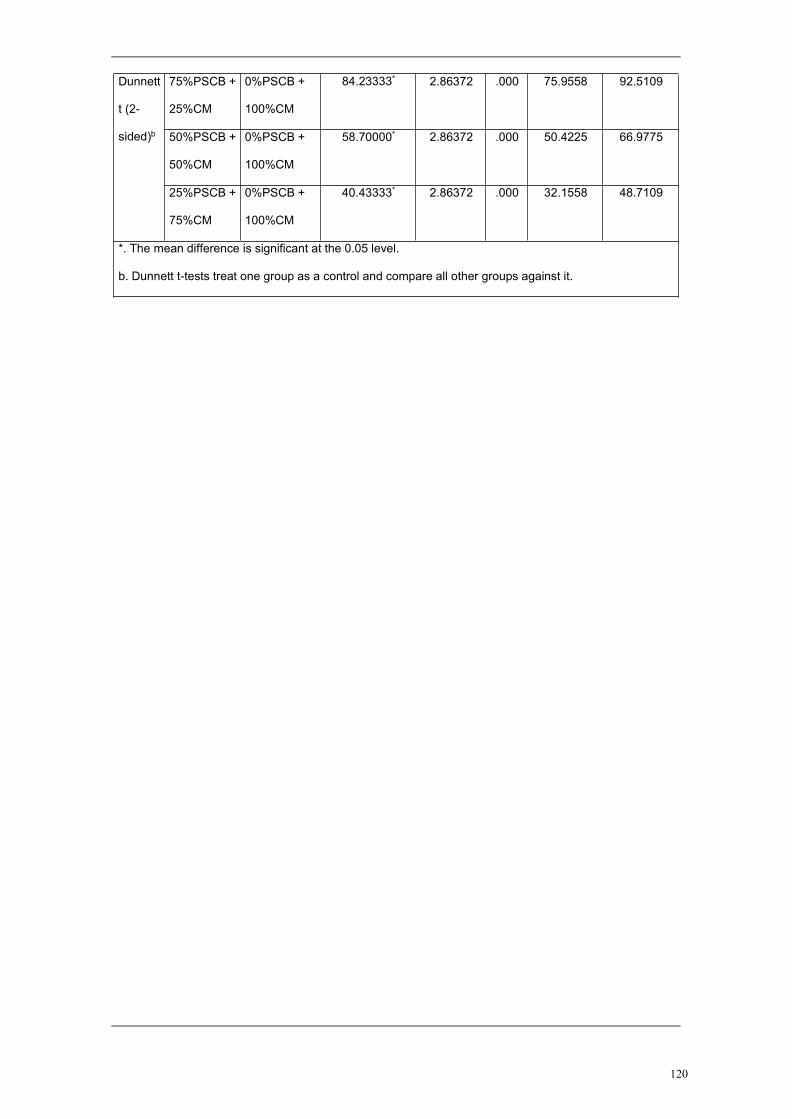
Appendix 1 Statistical Analysis of Untreated SCT with CM 101
Appendix 2 Statistical Analysis of Pre-treated SCT with CM 106
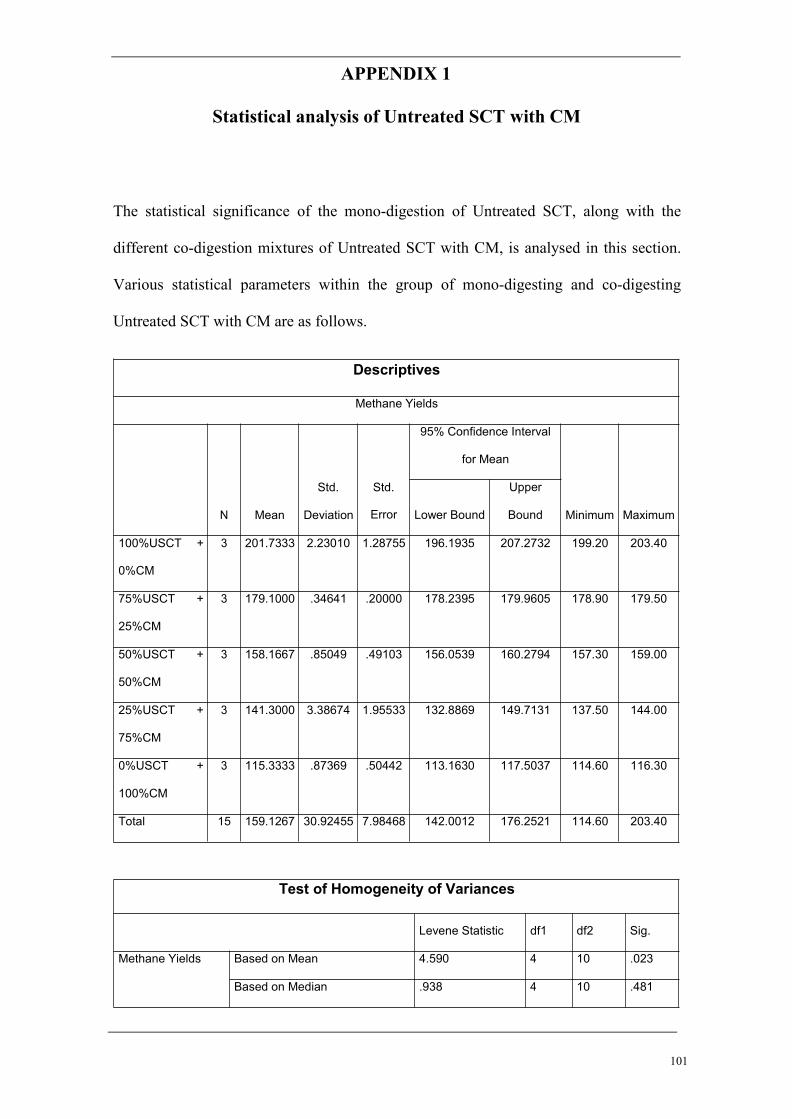
Appendix 3 Statistical Analysis of Untreated SCB with CM 111
Appendix 4 Statistical Analysis of Pre-treated SCB with CM 116
References 121
xi
LIST OF FIGURES
Figure 21 Sugarcane mills and crop areas in Australia 11
Figure 22 Flowchart of production of SCB and SCT during sugar cultivation 13
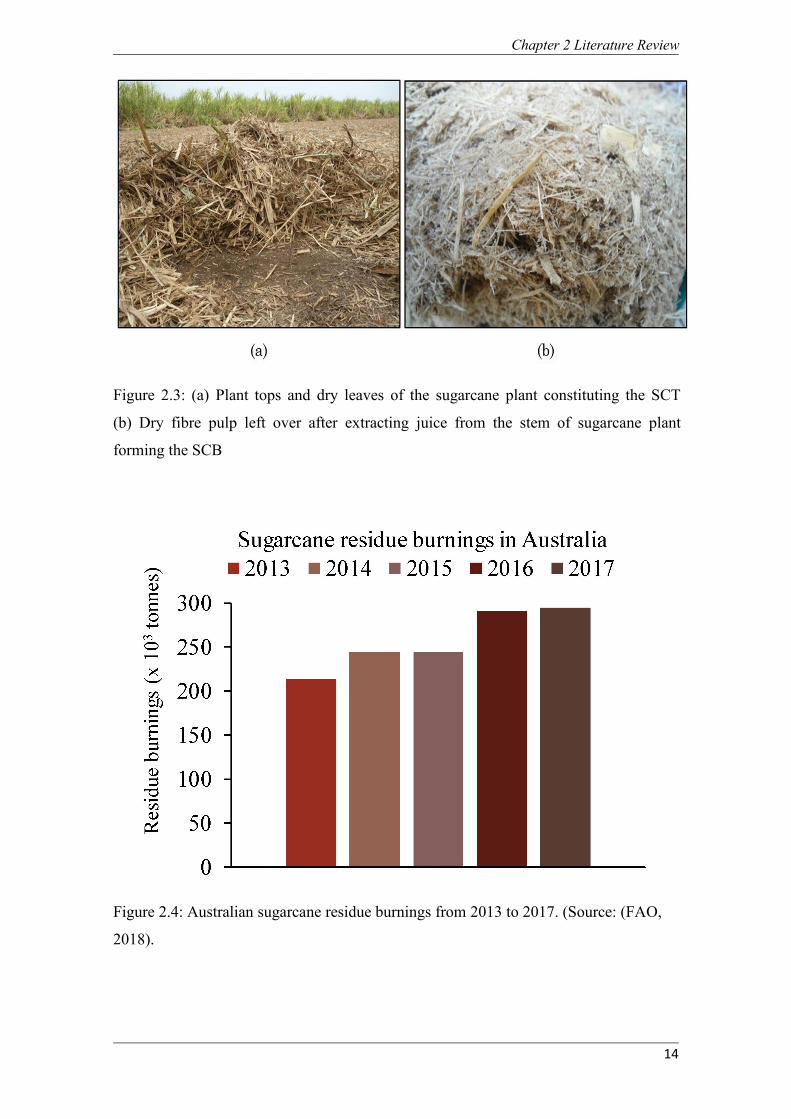
Figure 23 (a) Plant tops and dry leaves of the sugarcane plant constituting
the SCT 14
Figure 23 (b) Dry fibre pulp left over after extracting juice from the stem
of sugarcane plant forming the SCB 14
Figure 24 Australian sugarcane residue burnings from 2013-2017 14
Figure 25 Structure of lignocellulosic biomass 17
Figure 26 Anaerobic digestion pathway 20
Figure 27 Rate of AD process based on different process temperatures 23
Figure 28 Pre-treatment of lignocellulosic biomass 27
Figure 31 (a) Untreated SCT 47
Figure 31 (b) Pre-treated SCT 47
Figure 31 (c) Untreated SCB 47
Figure 31 (d) Pre-treated SCB 47
Figure 31 (e) CM 47
Figure 32 Flowchart of methodology adopted in research study 48
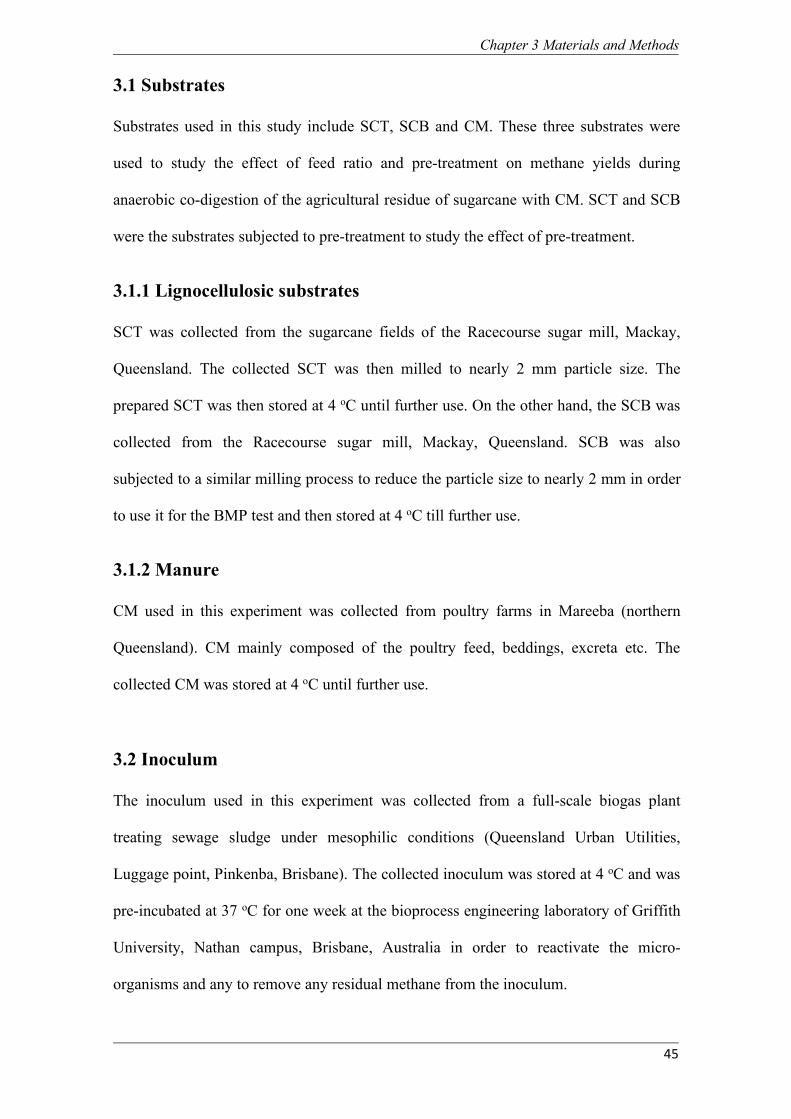
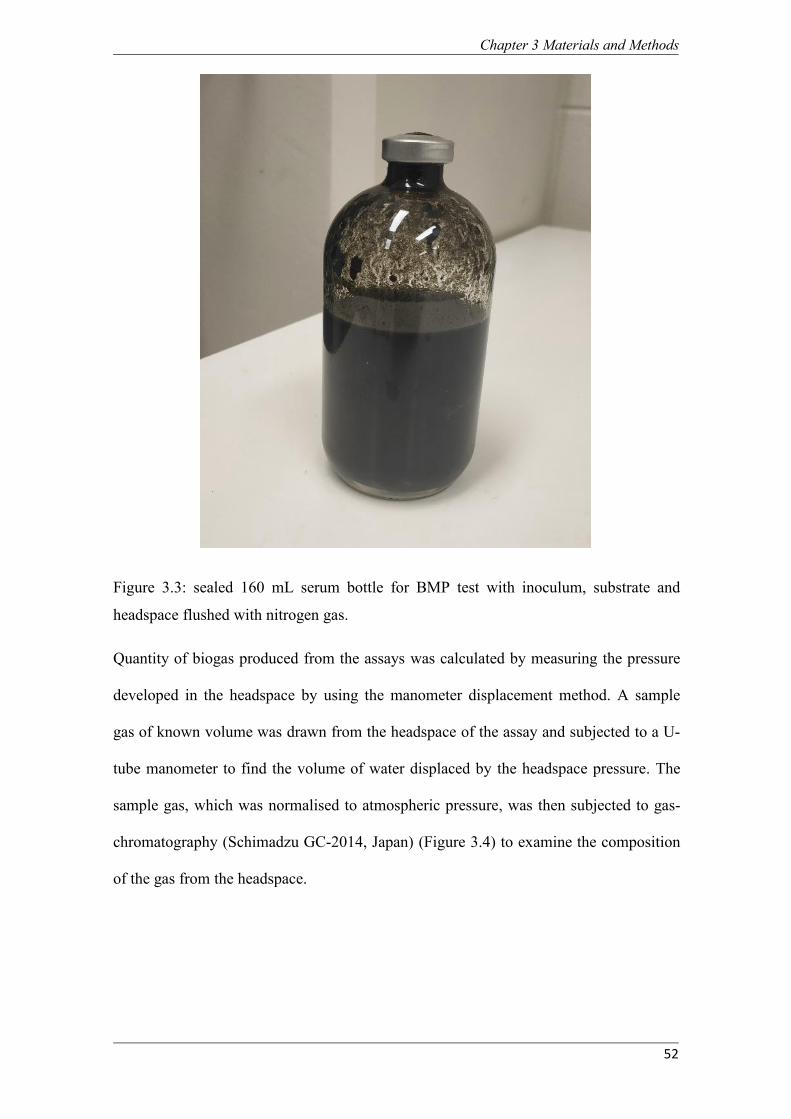
Figure 33 Sealed 160mL serum bottle for BMP test with inoculum
substrate and headspace flushed with nitrogen gas 52
Figure 34 Gas chromatography machine (GC-2014) 53
Figure 41 Cumulative methane production during the anaerobic
co-digestion of untreated SCT (USCT) and pre-treated SCT (PSCT) with
CM at different feed ratios incubated in batch experiment at 37 oC
for 83 days 68
Figure 42 Cumulative methane yield among different feed ratios of
xii
Untreated SCTCM and Pre-treated SCTCM on day 11 (T11) 70
Figure 43 Synergistic and antagonistic effects of various co-digestion feed ratios
during anaerobic co-digestion of SCT with CM in batch assays at 37 oC 72
Figure 44 Cumulative methane production during the anaerobic
co-digestion of untreated SCB (USCB) and pre-treated SCB (PSCB) with
CM at different feed ratios incubated in batch experiment at 37 oC
for 83 days 74
Figure 45 Cumulative methane yield among different feed ratios of
Untreated SCBCM and Pre-treated SCBCM on day 11 (T11) 76
Figure 46 Synergistic and antagonistic effects of various co-digestion feed ratios
during anaerobic co-digestion of SCB with CM in batch assays at 37 oC 77
Figure 47 VFAs of post BMP digestates in various feed ratio assays 83
Figure 48 Comparison of first-order and modified Gompertz kinetic model
predictions with experimental cumulative methane yield for different
co-digestion ratios of SCT with CM 89
Figure 49 Comparison of first-order and modified Gompertz kinetic model
predictions with experimental cumulative methane yield for different
co-digestion ratios of SCB with CM 91
xiii
LIST OF TABLES
Table 21 Major agricultural crops and their area of cultivation in Australia
(2012-2017) 10
Table 22 Composition of various lignocellulosic biomasses 18
Table 23 Comparison of mesophilic and thermophilic operation 23
Table 24 Optimal pH requirement for each stage of the AD process 24
Table 25 CN ratio of different lignocellulosic material and manure from
previous studies 26
Table 26 Previous studies and their results on mechanical pre-treatments 31
Table 27 Results of previous studies on the effect of feed ratio during the
anaerobic co-digestion of manure and lignocellulosic agro-wastes 37
Table 28 Previous studies reporting improvement in methane yields as a
result of co-digesting with manure 41
Table 31 Different feed ratios in anaerobic co-digestion of SCT and SCB
with CM tested in this study 47
Table 41 Physio-chemical properties of substrates and inoculum 65
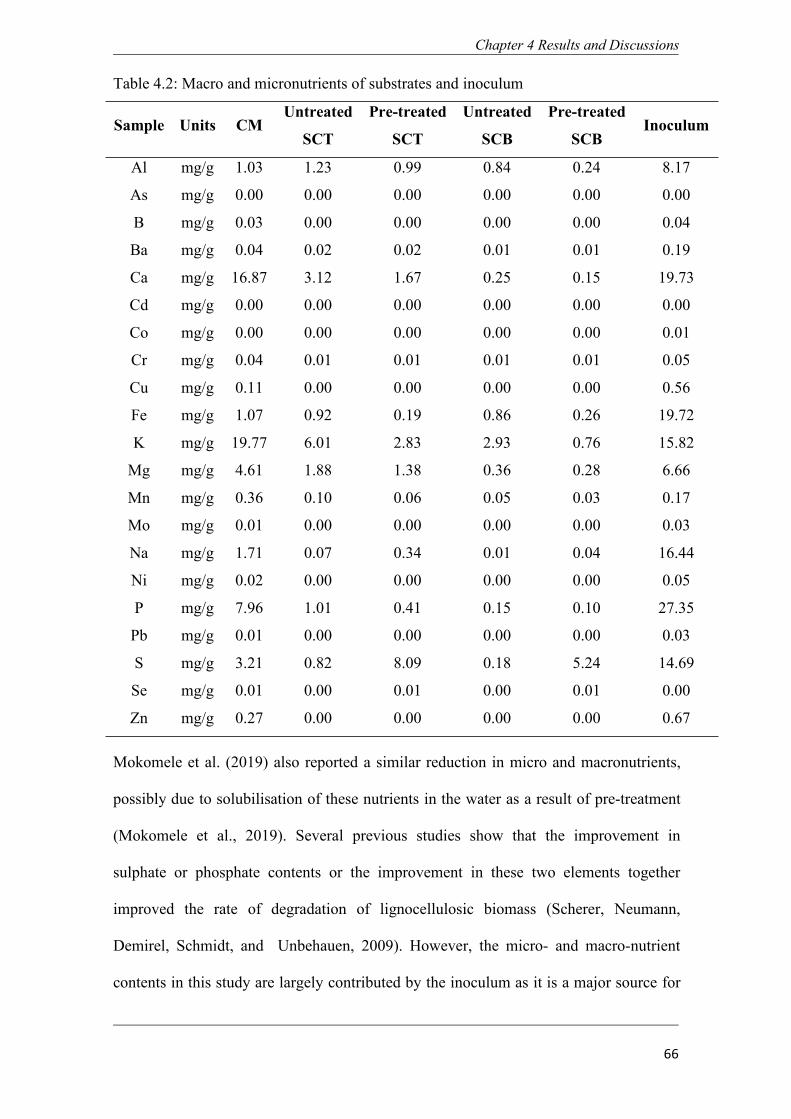
Table 42 Macro and micro nutrients of substrates and inoculum 66
Table 43 Theoretical and experimental results of anaerobic biodegradability
during anaerobic co-digestion of SCTSCB with CM 80
Table 44 Results of flow injection analysis for various feed ratios of SCTSCB
with CM 85
Table 45 Modelling parameters for first-order and modified Gompertz model
for different feed ratios of SCTSCB co-digested with CM 87
xiv
LIST OF ABBREVIATIONS
AD Anaerobic Digestion
ANOVA Analysis of Variances
APHA American Public Health Association
ASMC Australian Sugar Milling Council
BD Biodegradability
BMP Bio-chemical Methane Potential
CN Carbon to Nitrogen
CEC Clean Energy Council
CM Chicken Manure
COD Chemical Oxygen Demand
CSTR Continuous Stirred Tank Reactor
DAWR Department of Agriculture and Water Resources
FAO Food and Agricultural Organisation
FIA Flow Injection Analyser
GC Gas Chromatography
GHG Green House Gases
HPLC High Performance Liquid Chromatography
HRT Hydraulic Retention Time
ICP Inductivity Coupled Plasma
ISR Inoculum to Substrate Ratio
NREL National Renewable Energy Laboratory
OES Optical Emission Spectroscopy
PSCB Pre-treated Sugarcane Bagasse
xv
PSCT Pre-treated Sugarcane Trash
SCB Sugarcane Bagasse
SCT Sugarcane Trash
STP Standard Temperature and Pressure
TCD Thermal Conductivity Detector
TKN Total Kjeldahl Nitrogen
TKP Total Kjeldahl Phosphorous
TS Total Solids
USCB Untreated Sugarcane Bagasse
USCT Untreated Sugarcane Trash
UV Ultra-Violet
VFA Volatile Fatty Acids
VOC Volatile Organic Compounds
VS Volatile Solids
xvi
ACKNOWLEDGMENTS
All glory and honours to God the Almighty for providing me an opportunity to conduct
this research work His blessings and mercy have given me strength throughout my
MPhil program at Griffith University Australia
I want to express my sincere gratitude to my principal supervisor Dr Prasad Kaparaju
Senior Lecturer School of Engineering and Built Environment for his patience
guidance technical assistance and productive discussions His motivation and
dedication towards work inspired me to work harder and overcome the hurdles in my
research pathway He also gave insightful comments through discussions and reviews
for the successful completion of my research and thesis writing process I am
acknowledging his efforts in sharpening my skills and moulding me to be a successful
researcher
I would also like to use this opportunity to thank my Associate supervisor Dr Sunil
Herat and HDR convenor of the Griffith School of Engineering and Built Environment
Nathan Campus Dr Jimmy Yu for their innovative ideas and suggestions that helped me
to improve my skills during my tenure as an MPhil researcher at Griffith University I
would also extend my gratitude to Dr Asif Latif and Dr Thiago Edwiges for their
support in my research work
I am also thankful to my colleagues Mr Paulose Paulose Mrs Thi Kim Chi Do and Ms
Erika Maria Conde Espitia for their sincere supports and laboratory assistance that
helped me to complete my research work efficiently much before the expected
completion date I would also like to acknowledge the technical supports provided by
Mr Scott Byrnes and Mr Rad Bak in my analysis I would also thank Mrs Lynda
xvii
Ashworth Administrative Support Officer Griffith School of Engineering and Built
Environment for providing me all non-technical supports during my tenure
I am also thankful for all the support and guidelines provided by the Griffith Higher
Degree by Research Office Even though I had to undergo some complex process
associated with the candidature change HDR staff supported me and showed patience
to hear understand and clear my quires I also take this opportunity to thank all
academic and non-academic staff of Griffith University Nathan Campus for providing
me all support to complete my research successfully
Last but not least I am thanking all my friends especially Mr Pranav Sajeevu Mr Alan
Jacob Antony Ms Megha Roy Mr Nikhil Aravindakshan Mrs Priya Philip and Ms
Jagriti Tiwari for their incredible support along with my family members including my
father - Mr Babu P John mother - Mrs Surya Kala Babu brother - Mr Adharsh B
Puthumana and my wife - Mrs Jisna Johnson who supported and motivated me during
my hard times It is because of their kind words and endless support I was able to
achieve this milestone
AMAL BABU PUTHUMANA
18
Chapter 1 General Introduction
1
Chapter 1 General introduction
Chapter 1 General Introduction
2
Chapter 1 General Introduction
3
11 Background
Australia is one of the major producers and exporter of agricultural crops producing
about 838 million tonnes of crops annually (FAO 2018) The agro-based industries in
Australia which process these crops emit nearly 151 Tg of CO2 equivalent (FAO 2018)
The GHG emissions from them are mainly associated with the use of fossil fuels during
cultivation harvesting and transportation of associated raw materials or products
Further surplus crop residues are either left on the field or burnt to reduce the
transportation cost (Nachiappan Fu and Holtzapple 2011) Accumulation of
agricultural residues on the field may also lead to environmental and health issues (Sud
Mahajan and Kaur 2008) Thus the need to develop an efficient waste management
technology to utilise these agro-wastes is increasing The utilisation of these biomass
resources for biofuel generation may reduce the GHG emissions associated with waste
management and replaces fossil fuel use in agriculture (Paudel et al 2017)
Among the different technologies used for conversion of agricultural feedstocks into
useful bioenergy anaerobic digestion (AD) is considered as the most economical and
environmentally sustainable technology (Chandra Takeuchi and Hasegawa 2012)
The produced biogas can be utilised for heat or electricity generation or even upgraded
to bio-methane for vehicle fuel use (Kaparaju and Rintala 2013)
The dry fibre pulp obtained after extracting the cane juice known as the sugarcane
bagasse (SCB) is estimated to be 30 of the weight of the cane (CEC 2019) Large
quantities of SCB are generally used as a biomass resource to produce process steam to
use onsite (Rabelo Carrere Maciel Filho and Costa 2011) It can also be used to
produce paper and paperboard products (Rainey and Covey 2016) On the other hand
the dry and green leaves and tops of the cane known as the sugarcane trash (SCT) is
estimated to be about 33 of the total plant weight (CEC 2019) Although the heat
Chapter 1 General Introduction
4
content of SCT is much more than SCB (Eggleston Grisham and Antoine 2009) SCT
is generally left on the field to decay due to its bulkiness and high cost associated with
the collection storing and transportation (Janke et al 2015)
Both SCT and SCB are lignocellulosic materials that consist of cellulose hemicellulose
and lignin (Sawatdeenarunat Surendra Takara Oechsner and Khanal 2015) Different
pre-treatment methods can be used to break the complex structure of lignocellulosic
biomass (Neshat Mohammadi Najafpour and Lahijani 2017) Pre-treatment of
lignocellulosic substrates can be mainly classified as physical chemical and biological
pre-treatment Steam-explosion is a physical pre-treatment method which is more
economical and efficient for disrupting the lignocellulosic structure to improve the
anaerobic biodegradability and rate of methane production among these substrates
(Neshat et al 2017) Thus steam-explosion was adopted as the pre-treatment
methodology in this study to pre-treat SCT and SCB
Lignocellulosic materials have a high potential in producing biogas using AD
technology However the high carbon content in these substrates can cause inhibition to
the process resulting in a lower rate of production According to the studies conducted
by Neshat et al (2017) carbon to nitrogen (CN) ratio of 20-301 is to be maintained for
optimal microbial growth (Neshat et al 2017) Co-digesting these lignocellulosic
materials with animal manure can be done to reduce the CN ratio Many researchers
had worked to find out the best feed ratio in co-digesting animal manure with
lignocellulosic material For instance Cheng and Zhong (2014) conducted a research
study to investigate the best feed ratio among 1000 7525 5050 and 2575 ratios while
co-digesting cotton stalk with swine manure 5050 ratio was reported to produce more
yield in this study (Cheng and Zhong 2014) However not many previous studies have
been reported which investigated the amount of chicken manure to be added to enhance
Chapter 1 General Introduction
5
biogas production while co-digesting with SCT and SCB In other words there is a need
to examine which feed ratio of SCTSCB to CM has the best biogas production
12 Aim and Objectives
The overall aim of this project is to investigate the effect of feed ratio on methane
production from sugarcane industry wastes through anaerobic co-digestion with
nitrogen-rich livestock manures Different feed ratios were tested with both untreated
and pre-treated lignocellulosic waste materials Moreover the utilisation of these two
waste streams will help in sustainable waste management and energy renewable energy
production Specific objectives included in this project to attain the aim are as follows
Objective 1 To study the effect of different feed ratios on methane production during
anaerobic co-digestion of untreated and pre-treated sugarcane bagassetrash with
chicken manure
Objective 2 To evaluate the anaerobic digestibility and kinetics of methane production
during anaerobic co-digestion of sugarcane bagassetrash with chicken manure
13 Thesis outline
This thesis is organised into five different chapters
Chapter 1 presents the background of the study the need for such research
identification of research gap the formation of aim and specific objectives of this
project
Chapter 2 reviews literature on the importance of sugarcane agro-wastes and as a
potential source for bioenergy production in Australia It also describes the anaerobic
Chapter 1 General Introduction
6
digestion process and the various stages and process parameters affecting the anaerobic
digestion process Pre-treatment of the lignocellulosic substrates and co-digestion of
lignocellulosic waste with animal manure is discussed with some previous studies
Chapter 3 explains the various materials used describes the experimental design and
methodologies used in this study
Chapter 4 presents the main results of this research work and discusses the reasons for
obtaining those results along with supportive literature studies BMP results along with
the synergistic effects of co-digestion for both untreated and pre-treated SCT and SCB
were discussed Finally mathematical modelling anaerobic biodegradability and post
BMP analysis were also presented to understand the kinetics of biogas production and
the influence of pre-treatment on the biomass
Chapter 5 summarises the results of this study and arrives at the main conclusions This
chapter also provides some direction for future work that can be incorporated to have a
broader discussion on commercialising such a plant
Chapter 2 Literature Review
7
Chapter 2 Literature Review
Chapter 2 Literature Review
8
Chapter 2 Literature Review
9
This chapter aims to describe different aspects associated with the anaerobic digestion
of lignocellulosic biomass factors affecting AD and methods to enhance methane yield
from lignocellulosic biomass It also provides the importance of sugarcane wastes and
their generation in Australia current management practices and their impact on the
environment Practical usage of these organic wastes to improve bioenergy production
from the sugarcane industry wastes are also discussed here This section also presents
previous studies dealing with the anaerobic co-digestion of lignocellulosic waste with
nitrogen-rich animal manure
21 Agro-waste generation and their management
Agro-wastes and organic wastes produced from the agricultural crops after crop harvest
are considered as a valuable renewable resource with excellent potential for generating
bio-energy (Anwar Gulfraz and Irshad 2014) Plant stalks straw hulls leaves and
vegetable matter are the significant agricultural residues generated from crop cultivation
(Lim and Matu 2015) In 2017 Australia alone produced 3835 gigagrams of CO2
equivalent crop residues (FAO 2018) The quantity of these wastes produced and their
physical and chemical properties are primarily depended on the crop species soil type
cultivation practices harvest time harvesting methods and processing technology
Burning of agro-wastes can lead to greenhouse gas (GHG) emissions and eventually
lead to global warming (Paul and Dutta 2018) On the other hand the disposal of these
organic wastes in landfills or dumpsites can also lead to severe health and
environmental issues (Sud et al 2008) Thus utilisation of this agro-waste for energy
recovery nutrients and chemicals is considered as sustainable management of these
organic wastes (Caramiello et al 2013 Lancellotti Righi Tatagraveno Taurino and
Barbieri 2013)
Chapter 2 Literature Review
10
22 Sugarcane cultivation in Australia
The major agricultural crops cultivated in Australia are wheat sugarcane cotton maize
and rice Among these crops sugarcane is the second-largest cultivated crop Table 21
shows the major crops cultivated across Australia and their area of cultivation since
2012 It can be noted from Table 21 that there is a significant increase in the area of
cultivation of sugarcane in recent years
Table 21 Major agricultural crops and their area of cultivation in Australia (2012-17)
Source (FAO 2018)
Crop
Cultivate area (x 103ha)
2012 2013 2014 2015 2016 2017
Maize 696 786 524 596 533 678
Rice 1031 1136 767 697 266 822
Cotton 5965 444 3901 197 2804 NA
Soybean 381 411 37 301 292 300
Sugarcane 3386 3293 3752 3765 4472 4534
Sunflower 402 303 27 295 23 27
Wheat 139021 129793 126132 123837 112822 1219115
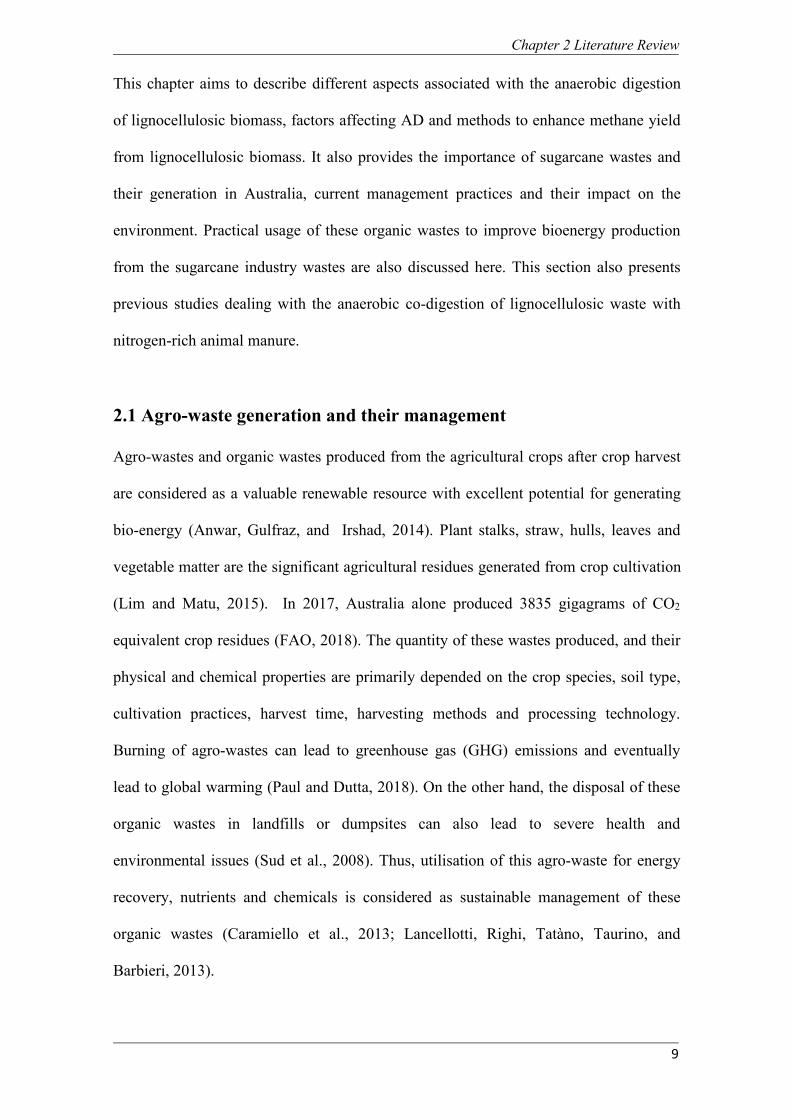
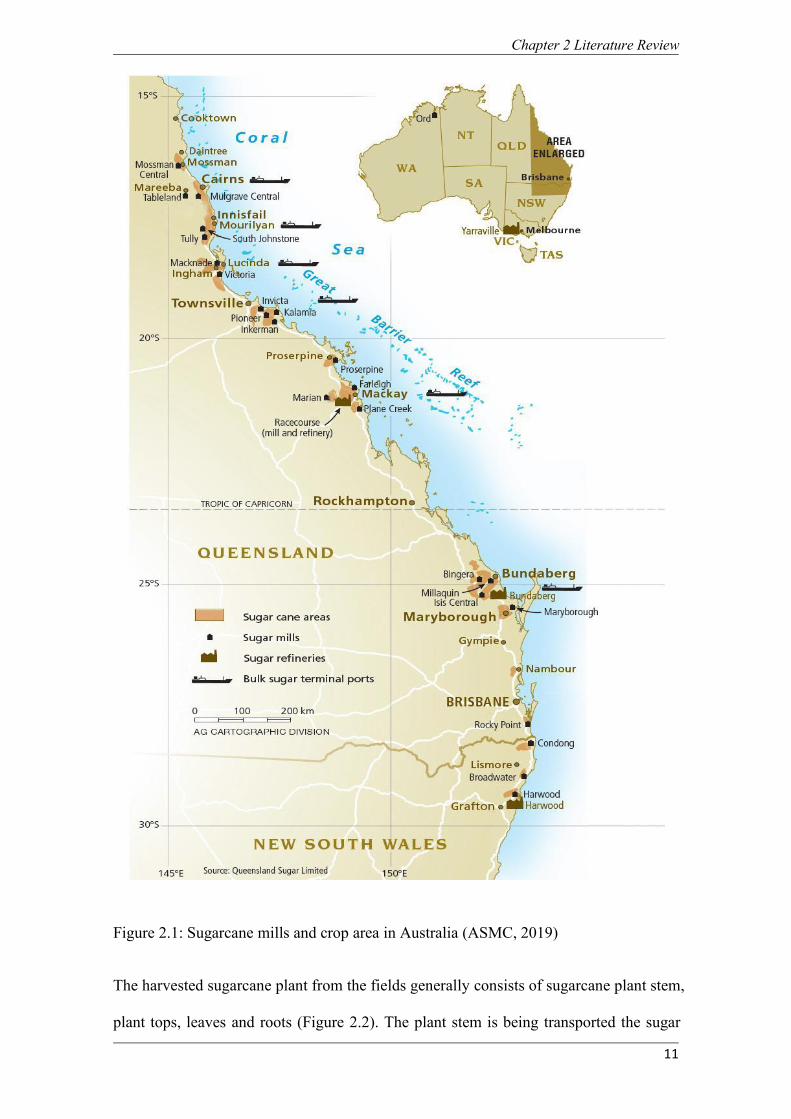
Despite being the second-largest cultivated crop in Australia sugar cultivation is mainly
limited to Queensland (Linnenluecke Zhou Smith Thompson and Nucifora 2019)
Australian sugar production is concentrated primarily in Queensland which constitutes
about 95 of the total output and the remaining is being produced in New South Wales
(Magarey et al 2019) It is spread along the eastern coastline for about 2100 km
between Mossman in northern Queensland and Grafton in north NSW (DAWR 2017)
The main sugarcane growing areas in Australia are located near Townsville and
Bundaberg as shown in Figure 21 In 2017 Australia produced about 365 million
tonnes of sugarcane (FAO 2018)
Chapter 2 Literature Review
11
Figure 21 Sugarcane mills and crop area in Australia (ASMC 2019)
The harvested sugarcane plant from the fields generally consists of sugarcane plant stem
plant tops leaves and roots (Figure 22) The plant stem is being transported the sugar
Chapter 2 Literature Review
12
mill for further processing The main products produced after processing the sugarcane
stem are sugar bagasse molasses and filter cake (George Cabello Eras Sagastume
Hens and Vandecasteele 2010) In the sugar mill the cane is crushed to extract juice
leaving behind a dry fibre pulp known as bagasse or SCB (Figure 23b) It is estimated
that bagasse constitutes about 25-30 of the total weight of cane (CEC 2019) Gabov
et al (2017) reported that around 260-280 kg of wet bagasse per ton of sugarcane is
produced from the sugar mills (Gabov Hemming and Fardim 2017) Bagasse
produced from the sugar industry is generally used for paper and paperboard production
(Sahu 2018) It is also used as fuel for the industrial boilers used for process steam
generation (George et al 2010) In Australia out of the total bagasse generated 107
million tonnes of bagasse was burnt producing 102 PJ of heat and power during 2015-
16 (Ramirez and Rainey 2019)
Green leaves of the sugarcane plant along with the plant top and plant roots are dried
together on field These trash substances are generally known as SCT (Figure 22
Figure 23a) It is estimated that almost one-third of the sugarcane plant weight is
contributed by the trash (Sahu 2018) After harvesting trash is left on the field to decay
or burnt mainly due to the high cost associated with the collection and transportation of
these trash from the fields (Janke et al 2015)
Chapter 2 Literature Review
13
Figure 22 Flowchart of production of SCB and SCT during sugar cultivation
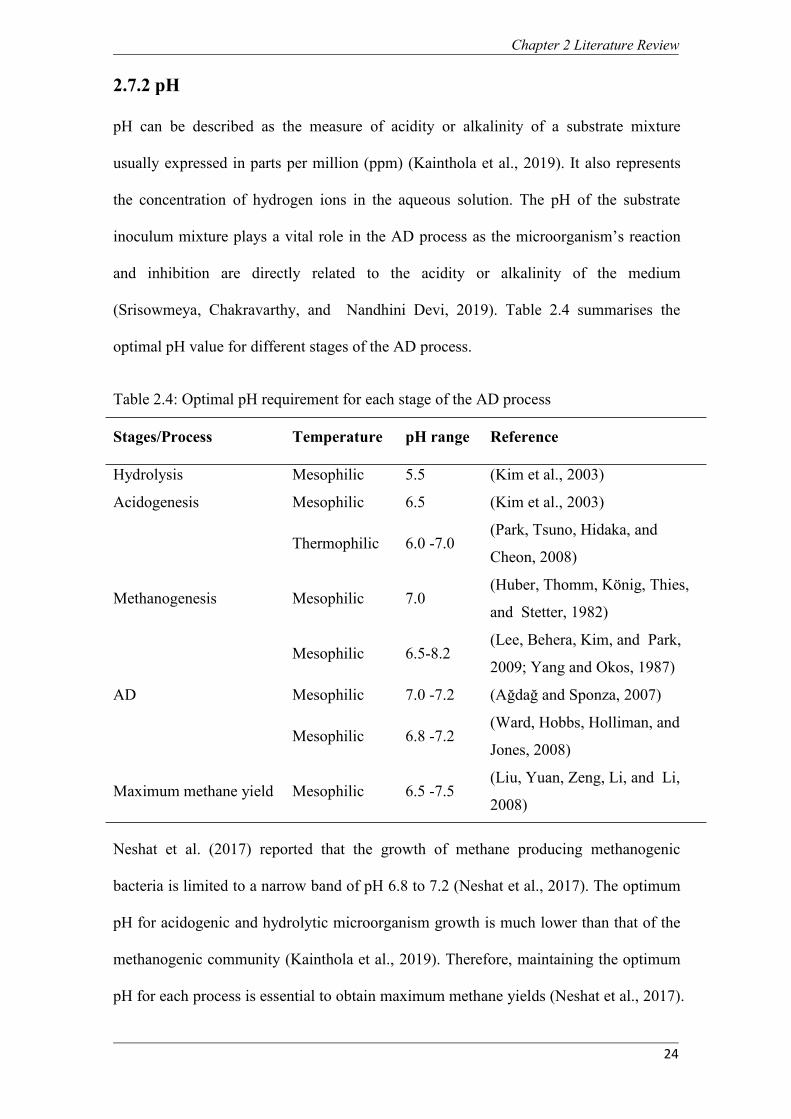
Sugarcane residue burnings in Australia from 2013 to 2017 are shown in Figure 24
Data shows that trash burnings associated with sugarcane cultivation had increased by
38 in Australia This trash management practice can contribute to air pollution
respiratory diseases and GHG emissions (Cerri et al 2011) Thus the need for efficient
and sustainable technology to utilise these organic wastes for generating energy and
other high-value products is required
Chapter 2 Literature Review
14
Figure 23 (a) Plant tops and dry leaves of the sugarcane plant constituting the SCT
(b) Dry fibre pulp left over after extracting juice from the stem of sugarcane plant
forming the SCB
Figure 24 Australian sugarcane residue burnings from 2013 to 2017 (Source (FAO
2018)
Chapter 2 Literature Review
15
23 Impacts of sugarcane agricultural residue on the environment
During the early 1980s green cane harvesting was one of the innovative techniques
adopted to utilise the vast quantities of trash produced in sugarcane cultivation
(Thorburn Horan and Biggs 2004) Even though trash has been used as soil much and
proved to improve the nutrient availability and soil moisture content its spread on land
had increased the chances of spreading diseases due to humidity and lower soil
temperatures (Goacutemez Torres De Souza and Jackson 2014) It also increased the risk
of spreading diseases such as the Weilrsquos disease caused due to the contact of wet soil or
water contaminated by an infected animal such as rat (Thorburn et al 2004) The most
cost-effective solution to this issue was to burn the trash in the fields after harvesting the
crop (Jain Bhatia and Pathak 2014) Burning of sugarcane trash had become a
standard policy throughout the industry as it turned out to be the most natural solution to
prevent the spread of diseases (Cerri et al 2011) Soon the negative impacts of the
burning sugarcane residues became evident It paved the way for many respiratory
disorders (Cerri et al 2011) Environmental implications of trash burnings include air
pollution in terms of volatile organic compounds (VOC) nitrogen oxide (NOx) nitrous
oxide (N2O) carbon monoxide (CO) carbon dioxide (CO2) and sulphur oxides (SOx)
(Jain et al 2014)
With the increase in demand for sugar and related products the sugar cultivation area
increased throughout the world including Australia (George et al 2010) The current
global sugarcane cultivation area is 26 million hectares with a total sugarcane
production of 18 billion tonnes (FAO 2018) Thus the need for developing alternative
technologies to utilise the wastes generated from sugarcane industries is necessary The
use of SCT and SCB to produce biogas is considered as one of the best sustainable
solutions to solve waste management without causing many environmental issues or
Chapter 2 Literature Review
16
health hazards The ability of SCT and SCB to be used as a source for biogas can be
justified only by determining the energy potential of these agro wastes
24 Energy potential of sugarcane agricultural residue
Both SCT and SCB are considered as lignocellulosic biomass and are made of
carbohydrate polymers such as cellulose and hemicellulose and an aromatic polymer
known as lignin and a small number of acetyl groups minerals and phenolic compounds
(Sahu 2018) The arrangement of lignin cellulose and hemicellulose vary according to
the type of lignocellulosic biomass (Isikgor and Becer 2015) The distribution of these
compounds also depends on the maturity of the plant and species (Murphy Braun
Weiland and Wellinger 2011) On average the composition of cellulose
hemicellulose and lignin are approximately 35-50 20-35 and 10-25 respectively
(Cherubini 2010) The cross-linked structure of lignin binds the cellulose and
hemicellulose in the lignocellulosic biomass to form a complex cross-linked structure
(Eskicioglu et al 2017) The lignin bond thus hinders the accessibility of cellulose and
hemicellulose for the microbes in an anaerobic digestion process (Sawatdeenarunat et
al 2015)
25 Lignocellulosic biomass structure
Despite having high biomass yield lignocellulosic biomass does not contribute much to
the food and feed production It was inferred that lignocellulosic materials could
produce a better yield even in low energy input conditions which makes it a better
option for biogas production (Sawatdeenarunat et al 2015) High resistants and
recalcitrance of lignocellulosic biomasses are due to the interaction of cellulose
hemicellulose and lignin present in the lignocellulosic structure (Figure 25) Thus
hydrolysis is considered as the rate limiter for the AD process (Khanal 2011) These
Chapter 2 Literature Review
17
major components of the lignocellulosic materials form a non-uniform complex
structure with a relatively different composition according to the type of biomass These
complex structures resist the cellulose crystallinity lignin phobicity and cellulose
encapsulation by the lignin-hemicellulose matrix inside the lignocellulose stem (Barakat
de Vries and Rouau 2013 Moraiumls et al 2012)
Figure 25 Structure of lignocellulosic biomass (Jensen Rodriguez Guerrero Karatzos
Olofsson and Iversen 2017)
Lignin is responsible for providing compressive strength to the plant tissues and to resist
the plant stem from pathogen or insect attack (War et al 2012) These long-chain
compound needs to be broken in order to attain access to the cellulose and
hemicellulose during the AD process (Paul and Dutta 2018) Composition of cellulose
hemicellulose and lignin for various lignocellulosic materials available are as shown in
Table 22
Chapter 2 Literature Review
18
Table 22 Composition of various lignocellulosic biomasses Source (Cherubini 2010
Isikgor and Becer 2015 Menon and Rao 2012)
Biomass Cellulose () Hemicellulose () Lignin ()
Wheat Straw 350ndash390 230ndash300 120ndash160
Barley Hull 34 36 138ndash190
Barley Straw 360ndash430 240ndash330 63ndash98
Rice Straw 292ndash347 230ndash259 170ndash190
Rice Husks 287ndash356 120ndash293 154ndash200
Oat Straw 310ndash350 200ndash260 100ndash150
Ray Straw 362ndash470 190ndash245 99ndash240
Corn Cobs 337ndash412 319ndash360 61ndash159
Corn Stalks 350ndash396 168ndash350 70ndash184
Sugarcane Bagasse 250ndash450 280ndash320 150ndash250
Sorghum Straw 320ndash350 240ndash270 150ndash210
26 Anaerobic digestion process
Bio-chemical conversion of the agro-wastes into energy is one of the most efficient and
eco-friendly process compared to the direct combustion or thermochemical process
(Renouf Pagan and Wegener 2013) Anaerobic digestion is a biochemical process
where organic matter is decomposed by microbial community in the absence of oxygen
to produce CH4 and CO2 (Gumisiriza Hawumba Okure and Hensel 2017 Gumisiriza
Mshandete Rubindamayugi Kansiime and Kivaisi 2009) In addition to the major
components such as CH4 and CO2 traces of nitrogen (N2) oxygen (O2) and hydrogen
sulphide (H2S) together is known as the biogas
AD process can be broadly classified into four sub-processes namely hydrolysis
acidogenesis acetogenesis and methanogenesis (Figure 26) Acidogenic acetogenic
and methanogenic bacteria act on the available organic matter in the anaerobic condition
to produce biogas (Kothari Pandey Kumar Tyagi and Tyagi 2014) Organic matter
available in the anaerobic digesters generally consists of complex compounds such as
Chapter 2 Literature Review
19
carbohydrates (cellulose hemicellulose starch) proteins and lipids The concentration
of these organic compounds varies according to the type of feedstock used The
complexity of these compounds hinders the action of microbes (Gumisiriza et al 2017)
Hydrolysis of these compounds to smaller units and solubilising them to make them
available for the microbial uptake (Sawatdeenarunat et al 2015) and further
degradation is necessary for proceeding the AD process The biochemical equation for
the hydrolysis of complex organic matter is presented as below (Gunes Stokes Davis
Connolly and Lawler 2019)
C6H10O4 + 2H2O C6H12O6 + H2 Eq21
In the subsequent phase the acid formic acidogenic bacteria use the monomeric sugars
amino acids and fatty acids obtained in the hydrolysis step to produce intermediate
volatile fatty acids (VFArsquos) (Neshat et al 2017) VFAs consist of short-chain organic
acids such as acetic acid propionic acid butyric acid valeric acid and caproic acid
Acidogenic bacteria use CO2 H2O and H2 to produce VFArsquos and have a doubling time
of approximately 30 minutes The acidogenic reactions can be written as follows (Gunes
et al 2019)
C6H12O6 2CH3CH2OH + 2CO2 Eq22
C6H12O6 + 2H2 2CH3CH2COOH + 2H2O Eq23
CH3CH2COOH + 2H2O CH3COOH + CO2 + 3H2 Eq24
Chapter 2 Literature Review
20
Figure 26 Anaerobic digestion pathway Source (Si 2016)
Acetogenesis is the process in which the acetogenic bacteria converts the VFAs such as
propionic acid butyric acid and valeric acid to acetic acid and H2 (Si 2016) It is a
comparatively slow process and takes place usually in 15 to 4 days (Gunes et al 2019)
In the final stage the acetic acid H2 and CO2 are utilised by the methanogens to
produce CH4 and CO2 (Neshat et al 2017) This process of formation of methane from
the products of acetogenesis is known as methanogenesis It is the slowest growing
process and its doubling rate is 2 to 4 days (Kainthola Kalamdhad and Goud 2019)
Methanogens which produce methane by consuming H2 and CO2 are known as the
hydrogenotrophic methanogens (Xu et al 2019) On the other hand methanogens that
produce CH4 and CO2 from acetic acid are called acetoclastic methanogens (Kainthola
Chapter 2 Literature Review
21
et al 2019) Methanogenesis can be represented by using the following equations
(Gumisiriza et al 2017 Kothari et al 2014)
2CH3CH2OH + CO2 2CH3COOH + CH4 Eq25
CH3COOH + CO2 CH4 + 2CO2 Eq26
CH3OH + H2 CH4 + H2O Eq27
CO2 + 4H2 CH4 + 2H2O Eq28
HCO-3 + 4H2 + H+ CH4 + 3H2O Eq29
27 AD process parameters
The microbial activity on the degradation of organic matter to produce CH4 is
dependent on various process parameters such as type of organic matter the
temperature of operation pH of the medium Carbon to Nitrogen (CN) ratio and trace
elements (Neshat et al 2017) In order to attain maximum yield from the organic
substance using AD these process parameters should be optimum (Kainthola et al
2019) The techno-economic feasibility of the experimental set-up in maintaining these
process parameters should also be considered while designing a commercial AD plant
271 Process temperature
The temperature of the process is one of the most influential parameters in an anaerobic
digestion process Effect of temperature can affect the metabolic activity of the
microorganisms resulting in variation of biogas produced Acidogenic bacteria are
active in a particular temperature range and a variation from that optimum temperature
Chapter 2 Literature Review
22
range can result in acidification due to VFA accumulation (Neshat et al 2017) Based
on the experimental results of various researchers and by thermodynamic and kinetic
factors it can be concluded that the temperature of operation of an AD process
dramatically influences the methane production from an AD process (Gumisiriza et al
2017)
Based on the microbial growth rate process temperature range of an AD process can be
broadly classified as follows (Neshat et al 2017)
Psychrophilic Cryophilic 10 ndash 15 oC
Mesophilic 30 ndash 40 oC
Thermophilic 45 ndash 65 oC
AD process generally takes place between 10 oC (psychrophilic) to 65 oC (thermophilic)
(Figure 27) Based on experimental researches the AD process generally takes place at
an optimal range of 37 oC for mesophilic operation and 55 oC for thermophilic operation
(Mata-Aacutelvarez 2002 van Lier et al 2001) Advantages and disadvantages of both
mesophilic and thermophilic range of operation in anaerobic digestion are listed in
Table 23
Higher rate of microbial growth and lesser retention time along with the lesser reactor
volume makes the thermophilic operation the most favourable among the various
operating temperature (Gumisiriza et al 2017 Neshat et al 2017)According to the
literature higher temperature of operation is more sensitive to toxicity due to the
imbalance created due to high amount of VFA production and its low conversion at
high temperatures (Kainthola et al 2019)
Chapter 2 Literature Review
23
Table 23 Comparison of mesophilic and thermophilic operation Source (Gumisiriza
et al 2017 Kainthola et al 2019 Neshat et al 2017)
Advantages Disadvantages
Mesophilic Wide range of operation More digester volume
Common anaerobic bacteria More retention time
More stable
Less energy input
Thermophilic higher organic loading rate increases inhibitory effect
a faster rate of biogas production Less range of feedstock
smaller reactor volume More sensitive to toxicity
Figure 27 Rate of AD process based on different process temperatures (Mojiri Aziz
Zaman Aziz and Hamidi 2012)
Fluctuations in the operating temperature by a fewer degree also results in a
considerable variation of the AD operation (Chae Jang Yim and Kim 2008) So
maintaining a constant temperature of operation throughout the AD process is very
important
Chapter 2 Literature Review
24
272 pH
pH can be described as the measure of acidity or alkalinity of a substrate mixture
usually expressed in parts per million (ppm) (Kainthola et al 2019) It also represents
the concentration of hydrogen ions in the aqueous solution The pH of the substrate
inoculum mixture plays a vital role in the AD process as the microorganismrsquos reaction
and inhibition are directly related to the acidity or alkalinity of the medium
(Srisowmeya Chakravarthy and Nandhini Devi 2019) Table 24 summarises the
optimal pH value for different stages of the AD process
Table 24 Optimal pH requirement for each stage of the AD process
StagesProcess Temperature pH range Reference
Hydrolysis Mesophilic 55 (Kim et al 2003)
Acidogenesis Mesophilic 65 (Kim et al 2003)
Thermophilic 60 -70(Park Tsuno Hidaka and
Cheon 2008)
Methanogenesis Mesophilic 70(Huber Thomm Koumlnig Thies
and Stetter 1982)
Mesophilic 65-82(Lee Behera Kim and Park
2009 Yang and Okos 1987)
AD Mesophilic 70 -72 (Ağdağ and Sponza 2007)
Mesophilic 68 -72(Ward Hobbs Holliman and
Jones 2008)
Maximum methane yield Mesophilic 65 -75(Liu Yuan Zeng Li and Li
2008)
Neshat et al (2017) reported that the growth of methane producing methanogenic
bacteria is limited to a narrow band of pH 68 to 72 (Neshat et al 2017) The optimum
pH for acidogenic and hydrolytic microorganism growth is much lower than that of the
methanogenic community (Kainthola et al 2019) Therefore maintaining the optimum
pH for each process is essential to obtain maximum methane yields (Neshat et al 2017)
Chapter 2 Literature Review
25
273 CN ratio and trace nutrients
CN ratio is also an essential parameter in determining the overall methane production
Low gas production is experienced in case of high CN ratio as the methanogenic
bacterial community consumes the available nitrogen to meet their requirements of
proteins and hence leaving behind the carbon content of the substrate resulting in less
biogas production (Wu Hickey Bhatnagar and Zeikus 2018) Low CN ratio of the
inoculum substrate mixture can result in the liberation of ammonium ions (NH4+) which
will lead to the gradual pH increase of the assay and finally results in toxicity and
inhibition of methane production (Fernandez Srinivas Schmidt Swita and Ahring
2018) Thus an optimal CN ratio of 20-301 is required to efficiently convert the
organic matter into biogas without any inhibition (Neshat et al 2017) Table 25
tabulates the CN ratio of various substrates that are subjected to anaerobic digestion
Agricultural residues and agro-wastes have a high CN ratio which makes them less
favourable for anaerobic digestion as the optimum CN ratio is not obtained (Risberg
Sun Leveacuten Horn and Schnuumlrer 2013) Whereas the low CN of manure and its lesser
carbon content retards the process and thus does not make it favourable for anaerobic
digestion as a sole substrate (Li et al 2014) However when these two substrates are
being co-digested a more preferred CN ratio can be obtained and thus an improvement
in the biogas production can be expected For instance Cheng and Zhong (2014)
reported CN of the cotton stalk as 501 which was higher than the considered optimum
CN ratio for an AD process The addition of swine manure resulted in attaining an
optimum CN ratio of 251 which resulted in an enhanced biogas production (Cheng and
Zhong 2014) Similar results were also achieved by Zhang et al (2016) when sorghum
stem and cow manure were co-digested An improvement of 26 from the control was
reported in this study (Zhang Zhang Li Li and Xu 2016)
Chapter 2 Literature Review
26
Table 25 CN ratio of different lignocellulosic materials and manure from previous
studies
Biomass CN ratio Reference
Corn Stover 63 (Li et al 2014)
Switch grass 90 (Brown Shi and Li 2012)
Wheat straw 60 (Brown et al 2012)
Oat straw 46 (Wu Yao Zhu and Miller 2010)
Rice straw 47 (Ye et al 2013)
Cotton stalk 50 (Cheng and Zhong 2014)
Sugarcane bagasse 118 (Karthikeyan and Visvanathan 2013)
Chicken manure 10 (Li et al 2013)
Cattle manure 24 (Chandra et al 2012)
Swine manure 17 (Ye et al 2013)
Various micronutrients such as iron nickel zinc selenium molybdenum manganese
and tungsten along with macronutrients such as carbon nitrogen phosphorous
potassium calcium magnesium and sulphur are essential for the survival and growth of
the microorganisms that convert the organic matter to biogas (Paul and Dutta 2018)
However these micro macronutrients are being supplemented by the activated sludge
inoculum which constitutes nearly 95 of the volume in all the batch assays
28 Pre-treatment of lignocellulosic substrates
Pre-treatment of a substrate is the process of conditioning the substrate before
subjecting it to an AD process in order to enhance the methane yield of the substrate
with a comparatively lesser retention time (Maniet et al 2017) Pre-treatment helps to
break the structural bonding in the substrates and thus makes the organic matter readily
available for the microorganisms (Saidu Yuzir Salim Azman and Abdullah 2014) In
addition to these primary functions pre-treatment also helps to make the feedstock
available in a moderate size to the AD process and thereby reduces the energy
consumption for the process (Bauer et al 2014a) Pre-treatment of lignocellulosic
Chapter 2 Literature Review
27
biomass is mainly done to reduce the cellulose crystallinity and to reduce lignin (Maniet
et al 2017) The lignocellulosic structure of the agricultural residues and the breakage
of complex lignin structure as a result of pre-treatment is as shown in Figure 28
Figure 28 Pre-treatment of lignocellulosic biomass (Kumar Barrett Delwiche and
Stroeve 2009)
The main types of lignocellulosic pre-treatments include physical chemical and
biological pre-treatments (Lizasoain et al 2016) Physical pre-treatment includes
mechanical grinding irradiation steam explosion and hydro-thermolysis (Wang et al
2018) Chemical pre-treatments are those pre-treatment methods using acid base
catalyst organic solvents and oxidising agents (Kumar et al 2009) On the other hand
biological pre-treatment is the type of pre-treatment in which the substrates are
subjected to microbial and enzymatic hydrolysis (Yang and Wyman 2008)
281 Physical pre-treatment
Physical pre-treatment methods include the treatment of lignocellulosic materials by
using mechanical operations such as grinding milling and chipping along with
Chapter 2 Literature Review
28
ultrasound microwaves liquid hot water and steam explosion (Neshat et al 2017)
Methane yield and hydrolysis kinetics largely depend on the pre-treatment methodology
final particle size and physical structure of the lignocellulosic substrates (Eskicioglu et
al 2017) Reduction in particle size in order to increase the surface area and pore size is
one of the main characteristics of such mechanical pre-treatments (Galbe and Zacchi
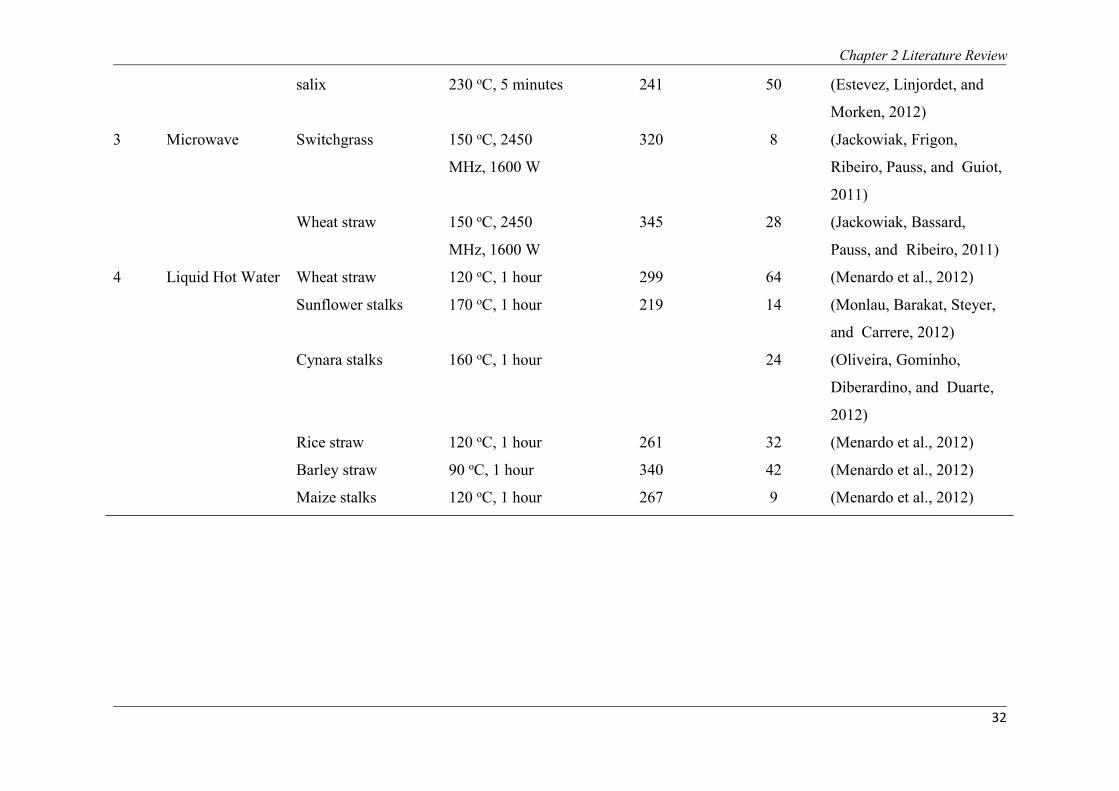
2007 Palmowski and Muumlller 2000 Taherzadeh and Karimi 2008) Table 26 tabulates
the improvement in the methane yield of lignocellulosic substrates due to different
physical pre-treatment methodologies However significant energy consumption for
mechanical pre-treatment is one of its major disadvantages (Paudel et al 2017)
Ultrasound and microwave technologies have also proved to be efficient in increasing
the methane yields by cleavage of β-14 glucan bonds which increases the accessibility
for microbes(Chandra et al 2012) However the high cost associated with mechanical
pre-treatments made it less popular on commercial-scale operations (Chandra et al
2012) Production of inhibiting by-products high cost and higher energy consumption
prevents the commercial use of these technologies (Neshat et al 2017)
Liquid hot water pre-treatment is a methodology in which pressure is generated so as to
maintain water at an elevated temperature in the liquid state for a few minutes (Kumar
et al 2009) This process doesnrsquot require rapid decomposition Catalyst is also not used
in liquid hot water pre-treatment technique Pressurised water enters into the biomass
increasing the surface area and thereby removing hemicellulose and lignin (Mosier et al
2005) Liquid hot water pre-treatment methodology is attractive as it is a low-cost
process and doesnrsquot involve the use of any catalyst for the pre-treatment However
water and energy requirements are higher
The steam explosion was introduced tested and patented by Mason et al (1926) In the
steam explosion the substrates were subjected to hot steam (180 oC to 240 oC) and
Chapter 2 Literature Review
29
pressure (1 to 35 MPa) followed by explosive decompression of the biomass resulting
in the rupture of the rigid structure of biomass fibres (Stelte 2013) The sudden pressure
release will cause the cellulose bundles to defibrillate and thus increases the
accessibility of the cellulose for enzymatic hydrolysis and fermentation (Stelte 2013)
Steam explosion is a cost-effective pre-treatment methodology as it avoids the usage of
any chemicals Equipment corrosion is minimum in steam explosion pre-treatment due
to the absence of chemicals A good yield of hemicellulose with low degraded by-
products could be obtained from steam explosion pre-treatment (Stelte 2013)
During the steam explosion process lignin is softened causing it to be released from
the cell wall and leads to a uniform distribution of lignin into the raw material (Kumar
et al 2009) Steam explosion reduces the time required by the microorganisms to
access the cellulose and hemicellulose (Hendriks and Zeeman 2009) resulting in an
increase in the rate of hydrolysis and more methane can be produced from the substrate
in comparatively lesser time compared to the untreated substrates (Paudel et al 2017)
The hydraulic retention time of the digester is also reduced as a result of steam
explosion (Bauer et al 2014a) The absence of acid or base will reduce the risk of high
or low pH of the inoculum substrate mixture (Lizasoain et al 2016) Even though the
steam explosion process is one among the easiest and cheapest process of pre-treatment
of lignocellulosic substrates the main challenges faced in this pre-treatment method is
the formation of toxic compounds and destruction of xylan fraction (Hendriks and
Zeeman 2009)
Previous studies on the steam explosion showed an improvement in methane yield For
instance the steam explosion of potato pulp reported by Kryvoruchko et al (2009)
produced 373 mlCH4gVSadded which was 12 more than the untreated substrate
(Kryvoruchko Machmuumlller Bodiroza Amon and Amon 2009) Similarly Bauer et al
(2009) reported a higher methane yield of 331 mLCH4gVSadded (an increase of 20
Chapter 2 Literature Review
30
CH4) when wheat straw was subjected to steam explosion pre-treatment (Bauer Boumlsch
Friedl and Amon 2009) Table 26 summarises similar studies that include various
mechanical pre-treatment
Chapter 2 Literature Review
31
Table 26 Previous studies and their results on mechanical pre-treatments
Sl
No
Pre-treatment
method
Lignocellulosic
substrates
Pre-treatment
condition
CH4 production
after pre-
treatment
(mLCH4gVSadded)
Increase in
CH4 ()
References
1 Milling Maize silage 2 mm 410 11 (Bruni Jensen Pedersen
and Angelidaki 2010)
Maize stalks 2 mm 272 0 (Menardo Airoldi and
Balsari 2012)
Barley straw 5 mm 370 54 (Menardo et al 2012)
2 Steam explosion Potato pulp 107 oC 15 minutes 373 12 (Kryvoruchko et al 2009)
Cane leaf matter 200 oC 10 minutes 237 3 (Mokomele et al 2019)
Harvested hay 175 oC 10 minutes 281 16 (Bauer et al 2014b)
Rice straw 200 oC 2 minutes 329 51 (Zhou et al 2016)
Wheat straw 180 oC 15 minutes 361 20 (Bauer et al 2009)
Kitchen waste 120 oC 15 minutes 930 43 (Li Jin Li Li and Yu
2016)
Reed biomass 200 oC 15 minutes 350 89 (Lizasoain et al 2016)
Olive mill solid
waste
200 oC 5 minutes 589 61 (Rincoacuten Rodriacuteguez-
Gutieacuterrez Bujalance
Fernaacutendez-Bolantildeos and
Borja 2016)
Chapter 2 Literature Review
32
salix 230 oC 5 minutes 241 50 (Estevez Linjordet and
Morken 2012)
3 Microwave Switchgrass 150 oC 2450
MHz 1600 W
320 8 (Jackowiak Frigon
Ribeiro Pauss and Guiot
2011)
Wheat straw 150 oC 2450
MHz 1600 W
345 28 (Jackowiak Bassard
Pauss and Ribeiro 2011)
4 Liquid Hot Water Wheat straw 120 oC 1 hour 299 64 (Menardo et al 2012)
Sunflower stalks 170 oC 1 hour 219 14 (Monlau Barakat Steyer
and Carrere 2012)
Cynara stalks 160 oC 1 hour 24 (Oliveira Gominho
Diberardino and Duarte
2012)
Rice straw 120 oC 1 hour 261 32 (Menardo et al 2012)
Barley straw 90 oC 1 hour 340 42 (Menardo et al 2012)
Maize stalks 120 oC 1 hour 267 9 (Menardo et al 2012)
Chapter 2 Literature Review
33
282 Chemical Pre-treatment
Disruption in the structure of lignocellulosic biomass as a result of chemical treatment is
known as chemical pre-treatment The main types of chemical pre-treatment can be
broadly classified as oxidative acidic alkaline ionic and inorganic salts pre-treatments
(Chen et al 2017) Oxidative pre-treatment is done to enhance methane yield of a
lignocellulosic substrate by subjecting the substrate to an oxidising alkaline medium at a
high temperature (~ 190 oC) for a short period (~ 30 minutes) (Teghammar Yngvesson
Lundin Taherzadeh and Horvaacuteth 2010) This chemical action is solubilising soluble
lignin and hemicellulose in the lignocellulosic materials and thereby the surface area of
cellulose is being increased (Monlau et al 2012)
Bases such as calcium potassium and sodium hydroxides are used to perform alkaline
chemical pre-treatment on lignocellulosic substrates (Chen et al 2017) Alkaline pre-
treatment is reported to be an efficient technique in the removal of lignin and preserving
carbohydrates and cellulose to enhance microbial activity which leads to a faster and
increased methane yield from the substrates (Zhu Wan and Li 2010) Alkaline pre-
treatment can also be used to increase pore size and accessible surface area (Datta 1981
Gharpuray Lee and Fan 1983) However these alkaline chemical pre-treatment
methodologies were restricted to minimal usage due to its chemical requirements and
formation of inhibitory compounds
Dilute acids are generally used for acidic chemical pre-treatment of lignocellulosic
substrates Acidic pre-treatments are generally carried out for short retention times (~ 1-
5 minutes) and high temperature (~120 ndash 170 oC) or long retention time (~15 minutes-1
day) and low temperature (~25 oC) Sulfuric acid hydrochloric acid and nitric acid are
the primary reagents used in acidic chemical pre-treatments (Gunes et al 2019) Acidic
pre-treatment breaks the bonds between ligninphenolics and carbohydrates complexes
Chapter 2 Literature Review
34
so that cellulose and hemicellulose are readily available for the microbes (Knappert
Grethlein and Converse 1980) Similar to alkaline pre-treatment acidic pre-treatment
also has a significant drawback as the requirement of chemicals and the formation of
inhibitory compounds from the hemicellulose degradation (Larsson et al 1999)
Ionic liquids are also used for pre-treating the lignocellulosic biomass These liquids are
capable of dissolving lignocellulosic materials producing cellulose with a little residual
crystallinity (Samayam and Schall 2010) Despite having limited environmental issues
as these ionic liquids are capable of reusing even after pre-treatment they are less
popular due to the high cost of these compounds (Nguyen et al 2010)
Some of the inorganic salts also have been tested as a catalyst in chemical pre-treatment
of lignocellulosic substrates Generally such pre-treatments are being conducted at a
higher temperature (~160 oC) for few minutes (~45 minutes) (Liu et al 2009a Liu et
al 2009b Monlau et al 2012) Chemical pre-treatment is efficient in breaking the
ester linkage and the bonds between carbohydrates and lignin However the effect on
delignification is limited in chemical pre-treatment (Liu et al 2009a Liu et al 2009b)
The main drawback of inorganic salts pre-treatment is the presence of an excessive
amount of trace elements which will lead to inhibition of the process (Liu et al 2009a)
283 Biological pre-treatment
Destruction of the lignocellulosic structure of the biomass using any living organisms is
known as biological pre-treatment (Neshat et al 2017) Unlike physical and chemical
pre-treatment biological pre-treatments are more sustainable for the environment (Lee
1997 Taherzadeh and Karimi 2008) Commercial enzymes or fungi are being used to
break the complex bonding structure of lignocellulosic materials Different types of
commercial enzymes such as the endoglucanase exoglucanase and xylanase are being
synthesised and used for biological pre-treatment techniques (Lopez et al 2007) The
Chapter 2 Literature Review
35
high enzymatic activity leads to the breakdown of complex lignocellulosic structure
(Lopez et al 2007) The main drawback of biological pre-treatment is the dependency
of enzymatic activity on temperature and pH (Kainthola et al 2019) Ensiling of
biomass is also considered as a biological pre-treatment (Janke et al 2019) Ensiling
induces an anaerobic condition that will convert many insoluble sugars into organic
acids and helps in preserving structural proteins and carbohydrates (Vervaeren Hostyn
Ghekiere and Willems 2010)
29 Anaerobic co-digestion
Anaerobic co-digestion is the process of combining two or more substrates to
supplement the deficiency of a substrate if subjected to the AD process as mono-
digestion (Song and Zhang 2015) Moreover anaerobic co-digestion of lignocellulosic
substrates with manure helps to maintain a stable pH within the methanogenesis range
(Kaparaju and Rintala 2005) Improved biogas yield and economic advantages
associated with the sharing of equipment resulted in an increased interest among co-
digestion of lignocellulosic substrates with manure (Li Li Zheng Fu and Lar 2009)
Mata-Alvarez et al (2002) reported that anaerobic co-digestion of substrates established
a positive synergism in the digester (Mata-Aacutelvarez 2002)
SCT and SCB are substrates with a high CN ratio that can be co-digested with
substrates with a lower CN ratio such as the cow manure chicken manure pig manure
etc In addition to improving the CN ratio of the substrate inoculum mixture co-
digestion also improves the trace nutrients content requirement for the AD process
(Sawatdeenarunat et al 2015) It also helps in the effective utilisation of the digester
volumes and more methane yield can be attained from the digester of the same volume
by incorporating co-digestion techniques (Li et al 2009)Co-digestion of energy crops
and animal manure resulted in increased plant output without changing the reactor
Chapter 2 Literature Review
36
volume (Lindorfer Loacutepez Resch Braun and Kirchmayr 2007) For instance
Mokomele et al (2019) reported an increase of 7 in cumulative methane in co-
digesting sugarcane leaves and cow manure in 7525 ratio than the mono-digestion of
dairy cow manure (Mokomele et al 2019) Similarly an 18 increase in methane yield
was reported by Zheng et al (2015) when switchgrass and diary manure was co-
digested (Zheng et al 2015)
Co-digestion reduces the waste disposal issues related to the animal excreta and thereby
reduces GHG emissions (Shen et al 2018) On the other hand the co-digested digestate
has a greater fertilizer value compared to the digestate of mono-digestion (Li et al
2014) Thus co-digesting the lignocellulosic waste from the agricultural residue of
sugarcane along with the cattle manure can improve the overall production yield of the
AD process
Many studies have been conducted regarding the co-digestion of nitrogen-rich
substrates with carbon-rich lignocellulosic materials to supplement the deficiencies of
these batch assays Table 27 summarises some of the significant studies in this field
along with their results
Chapter 2 Literature Review
37
Table 27 Results of previous studies on the effect of feed ratios during the anaerobic co-digestion of manure and lignocellulosic agro
wastes
Sl
No
Substrates Operating
conditions
Feed Ratios
tested
Pre-treatment Results Reference
1 Sugarcane leaves
+ Diary cow
manure
100 mL Mesophilic
temperature ISR =
04 55 days
1000 7525
5050 2575
0100 (VS basis)
Steam explosion 0100 (274
LCH4kgVSadded)
(Mokomele et al
2019)
2 Sugarcane
Bagasse + Diary
cow manure
100 mL Mesophilic
temperature ISR =
04 55 days
1000 5050
0100 (VS basis)
Steam explosion 0100 (274
LCH4kgVSadded)
(Mokomele et al
2019)
3 Sugarcane leaves
+ Diary cow
manure
100 mL Mesophilic
temperature ISR =
04 55 days
1000 7525
5050 2575
0100 (VS basis)
NA 7525 (292
LCH4kgVSadded)
(Mokomele et al
2019)
4 Switchgrass +
Diary manure
500 mL Mesophilic
temperature ISR =
067 30 days
1000 7525
5050 2575
0100 (TS basis)
NA 5050 18 increment
in methane yield than
mono-digestion of
switchgrass
(Zheng et al 2015)
5 Salix viminalis +
Cow manure
1125 mL
mesophilic
temperature ISR =
067 57 days
1000 8020
7030 6040
5050 4060
3070 2080
0100 (VS basis)
Steam explosion 0100 (239
mLCH4gVS)
pre-treated salix (1976
mLgVS) has 23
(Estevez et al 2012)
Chapter 2 Literature Review
38
improvement over
untreated salix
6 Corn Stover + Pig
Manure
250 mL Mesophilic
temperature ISR =
026 70 days
1000 8020
6733 5050
3367 2080
0100 (VS basis)
NA 0100 (889
mLCH4gVS)
(Li et al 2018b)
7 Cotton stalk +
swine manure
500 mL Mesophilic
temperature ISR =
025 45 days
1000 7525
5050 2575 (TS
basis)
NA 5050 19-fold increase
in yield when
compared to control
(102 mLCH4gVS)
(Cheng and Zhong
2014)
8 Apple waste +
Chicken manure
250 mL Mesophilic
temperature ISR =
026 70 days
1000 8020
6733 5050
3367 2080
0100 (VS basis)
NA 3367 (827
mLCH4gVS)
(Li et al 2018b)
9 Whey + cow
manure
400 mL Mesophilic
temperature 55 days
1000 8515
7525 5050
2575 1585
0100 (VS basis)
NA 8515 (266
mLCH4gVS)
(Vivekanand Mulat
Eijsink and Horn
2018)
Chapter 2 Literature Review
39
291 Chicken manure as a co-digestion substrate
Chicken manure also known as poultry litter can be described as a mixture of excreted
manure water spilled feed feathers and bedding materials from a poultry farm
Traditionally the chicken manure was spread on land as a fertilizer or disposed of to
landfill (Abouelenien Namba Kosseva Nishio and Nakashimada 2014) With
increasing environmental concerns related to spreading litter on land and the rising cost
of energy more attention was given for developing more value from these kinds of
wastes in the form of energy (Li et al 2014)
The potential of manure being used to produce biogas using AD technology was
identified and various experiments were conducted by different researchers
(Abouelenien et al 2014 Kalamaras and Kotsopoulos 2014 Masih-Das and Tao 2018
Mokomele et al 2019 Shen et al 2018) However one of the main drawbacks of the
manure as a mono-digestion substrate was the low CN ratio which caused the system
to inhibit the process and result in low gas production (Abouelenien Kitamura Nishio
and Nakashimada 2009) Later with the advancement of co-digestion technology the
potential of manure to be used as co-substrate in the AD process started to get its
priority (Mokomele et al 2019) Using poultry manure for the AD process not only
improved the biogas potential of substrates with a high CN ratio but also helped in
solving various issues related to the waste management from poultry farms (Neshat et
al 2017)
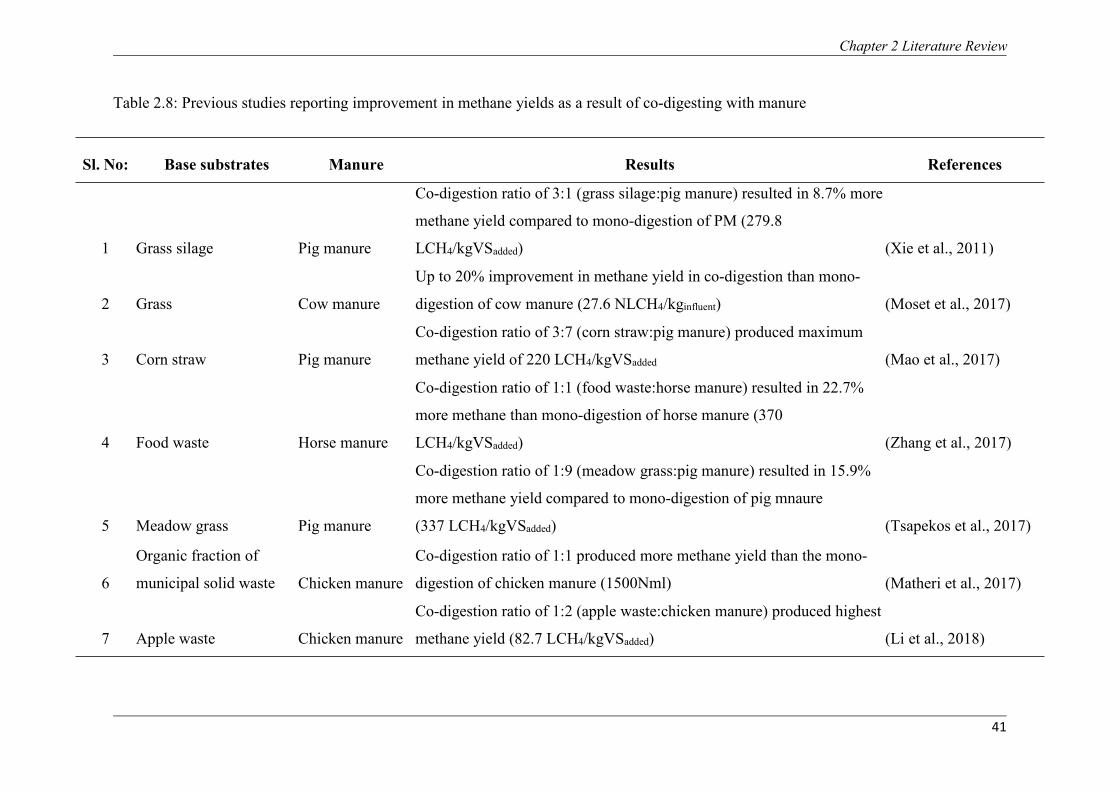
Table 28 tabulates a list of studies that were conducted by various researchers which
used different kind of manures to enhance biodegradability and to improve methane
yield using AD technology Cow manure pig manure horse manure chicken manure
etc were used by various researchers such as Mao et al (2017) Zhang et al (2017) and
Moset et al (2017) in their studies All these studies reported an improvement in
Chapter 2 Literature Review
40
methane yield as a result of co-digestion with manures Studies conducted by Awasthi
et al (2019) reported chicken manure to produce highest biogas production rate of 04
m3kg of dry matter while comparing it with pig sheep cattle horse and duck manure
Similar results were also reported by Neshat et al (2017) Thus use of chicken manure
as a co-substrate in co-digestion with lignocellulosic substrates can result in a better
degradation of organic matter and thus better methane yield can be expected (Neshat et
al 2017)
Chapter 2 Literature Review
41
Table 28 Previous studies reporting improvement in methane yields as a result of co-digesting with manure
Sl No Base substrates Manure Results References
1 Grass silage Pig manure
Co-digestion ratio of 31 (grass silagepig manure) resulted in 87 more
methane yield compared to mono-digestion of PM (2798
LCH4kgVSadded) (Xie et al 2011)
2 Grass Cow manure
Up to 20 improvement in methane yield in co-digestion than mono-
digestion of cow manure (276 NLCH4kginfluent) (Moset et al 2017)
3 Corn straw Pig manure
Co-digestion ratio of 37 (corn strawpig manure) produced maximum
methane yield of 220 LCH4kgVSadded (Mao et al 2017)
4 Food waste Horse manure
Co-digestion ratio of 11 (food wastehorse manure) resulted in 227
more methane than mono-digestion of horse manure (370
LCH4kgVSadded) (Zhang et al 2017)
5 Meadow grass Pig manure
Co-digestion ratio of 19 (meadow grasspig manure) resulted in 159
more methane yield compared to mono-digestion of pig mnaure
(337 LCH4kgVSadded) (Tsapekos et al 2017)
6
Organic fraction of
municipal solid waste Chicken manure
Co-digestion ratio of 11 produced more methane yield than the mono-
digestion of chicken manure (1500Nml) (Matheri et al 2017)
7 Apple waste Chicken manure
Co-digestion ratio of 12 (apple wastechicken manure) produced highest
methane yield (827 LCH4kgVSadded) (Li et al 2018)
Chapter 2 Literature Review
42
210 Overview of Literature review
The increasing agro-wastes in Australia facilitates the use of anaerobic digestion
techniques to produce energy from wastes Sugarcane agricultural wastes viz the SCT
and SCB contribute a large quantity in the total agro wastes produced in Australia (FAO
2018) Various factors contribute to maximising energy production using this technique
The use of nitrogen-rich manure with sugarcane agricultural wastes could be favouring
more methane yield from these wastes The usage of manure for increasing nitrogen
content is more environmentally sustainable than using chemicals to improve the CN
ratio of the digester Moreover it helps in the efficient usage of poultry wastes Based
on the literature study conducted it was found that not much research has been done on
co-digesting the carbon-rich lignocellulosic sugarcane wastes with nitrogen-rich chicken
manure There exists a research gap in this field regarding the effect of different feed
ratios on methane yields during anaerobic co-digestion of sugarcane waste with chicken
manure which is investigated in this study This study is also extended to investigate
the behaviour of pre-treated SCT and SCB with different feed ratios while co-digesting
with CM This study aims to reveal which feed ratio produces more yield and the
synergistic or antagonistic effects of co-digestion of pre-treateduntreated SCT and SCB
with CM
Chapter 3 Materials and Methods
43
Chapter 3 Materials and methods
Chapter 3 Materials and Methods
44
Chapter 3 Materials and Methods
45
31 Substrates
Substrates used in this study include SCT SCB and CM These three substrates were
used to study the effect of feed ratio and pre-treatment on methane yields during
anaerobic co-digestion of the agricultural residue of sugarcane with CM SCT and SCB
were the substrates subjected to pre-treatment to study the effect of pre-treatment
311 Lignocellulosic substrates
SCT was collected from the sugarcane fields of the Racecourse sugar mill Mackay
Queensland The collected SCT was then milled to nearly 2 mm particle size The
prepared SCT was then stored at 4 oC until further use On the other hand the SCB was
collected from the Racecourse sugar mill Mackay Queensland SCB was also
subjected to a similar milling process to reduce the particle size to nearly 2 mm in order
to use it for the BMP test and then stored at 4 oC till further use
312 Manure
CM used in this experiment was collected from poultry farms in Mareeba (northern
Queensland) CM mainly composed of the poultry feed beddings excreta etc The
collected CM was stored at 4 oC until further use
32 Inoculum
The inoculum used in this experiment was collected from a full-scale biogas plant
treating sewage sludge under mesophilic conditions (Queensland Urban Utilities
Luggage point Pinkenba Brisbane) The collected inoculum was stored at 4 oC and was
pre-incubated at 37 oC for one week at the bioprocess engineering laboratory of Griffith
University Nathan campus Brisbane Australia in order to reactivate the micro-
organisms and any to remove any residual methane from the inoculum
Chapter 3 Materials and Methods
46
33 Pre-treatment of lignocellulosic substrates
Based on the various pre-treatment studied in section 28 steam explosion pre-treatment
had a clear advantage over the other types of pre-treatment mainly due to its low cost in
pre-treating lignocellulosic substrates Thus steam explosion pre-treatment was adopted
as the pre-treatment method for this study Steam explosion pre-treatment was
conducted in a two-step pilot-scale reactor at the Renewable bio-commodities pilot
plant Racecourse sugar mill Mackay Queensland designed and built by Andrtiz Inc
(USA) 20 kg of the substrate (SCTSCB) was mixed with 20 kg of water (50
moisture by weight) in a first stage stainless steel horizontal reactor with a capacity of
150L and incubated at room temperature for one hour The substrates were then loaded
to a second stage vertical reactor with 22 m lengthy and diameter 02 m in which the
steam impregnation was done at 130 oC for 5 minutes followed by a steam explosion
(explosion pressure = 2 MPa) (Harrison et al 2013 Zhang Wong Albertson Doherty
and OrsquoHara 2013b)
34 Experimental Design
SCT and SCB were co-digested with CM in different feed ratios in order to investigate
the effect of feed ratios on methane yields during anaerobic digestion The sugarcane
residue used were further divided into pre-treated (steam explosion) and untreated
substrates The same feed ratios were designed for pre-treated sugarcane trash (Pre-
treated SCT) untreated sugarcane trash (Untreated SCT) pre-treated sugarcane bagasse
(Pre-treated SCB) and untreated sugarcane bagasse (Untreated SCB) with chicken
manure (CM) Table 31 shows the various feed ratios tested in this work such as 1000
7525 5050 2575 0100 for Pre-treated SCTUntreated SCTPre-treated
SCBUntreated SCBCM Various substrates used in this study are shown in Figure 31
and the flowchart of methodology of this research work is shown in figure 32
Chapter 3 Materials and Methods
47
Figure 31 Substrates used in this study (A) Untreated SCT (B) Pre-treated SCT (C)
Untreated SCB (D) Pre-treated SCB (E) CM
Table 31 Different feed ratios in anaerobic co-digestion of SCT and SCB with CM
tested in this study
Sample Untreated
SCT ()
Pre-treated
SCT ()
Untreated
SCB ()
Pre-treated
SCB ()
CM
()
Untreated SCT 100 0 0 0 0
Co-digestion 1 75 0 0 0 25
Co-digestion 2 50 0 0 0 50
Co-digestion 3 25 0 0 0 75
Pre-treated SCT 0 100 0 0 0
Co-digestion 4 0 75 0 0 25
Co-digestion 5 0 50 0 0 50
Co-digestion 6 0 25 0 0 75
Untreated SCB 0 0 100 0 0
Co-digestion 7 0 0 75 0 25
Co-digestion 8 0 0 50 0 50
Co-digestion 9 0 0 25 0 75
Pre-treated SCB 0 0 0 100 0
Co-digestion 10 0 0 0 75 25
Co-digestion 11 0 0 0 50 50
Co-digestion 12 0 0 0 25 75
CM 0 0 0 0 100
Chapter 3 Materials and Methods
48
Figure 32 Flowchart of methodology adopted in this research study
Initially the substrates and inoculum is subjected to a set of pre-BMP analysis Based
on the results obtained from these analysis BMP preparation calculations are done to
estimate the quantity of substrate and inoculum required for the designed parameters
BMP assays are prepared based on these design parameters and incubated at the
designed temperature GC analysis is performed in calculated intervals to obtain the
quantity and composition of biogas produced in the assays This process is continued
Chapter 3 Materials and Methods
49
until the BMP termination where there is no significant gas production from any of the
assays in successive GC test intervals After the BMP termination digestates are
collected for post-BMP analysis Data obtained from the pre-BMP analysis GC analysis
and post-BMP analysis are integrated and results are formed based on various data
processing techniques
35 Analytical methods
351 Determination of TS and VS
TS and VS of the substrates and inoculum were determined before the start of the
experiment using the Standard Methods (APHA 1995)
352 Determination of Chemical Oxygen Demand (COD)
The COD of the substrates and inoculum was determined according to the standard
methods described elsewhere (Latif Mehta and Batstone 2017) Briefly high range
COD vials (500 ndash 10000 mg L-1) were used to make dilutions using suitable dilution
factors Deionised water was used to make these dilutions The prepared dilutions were
then thermally digested using Spectroquant TR 620 COD digester at 148 oC for 2 hours
After the vials being cooled down to the room temperature COD values were examined
using a spectrophotometer Move 100 (Merck)
353 Determination of Total Kjeldahl Nitrogen (TKN) Total Kjeldahl
Phosphorous (TKP) soluble and total metal ions
The soluble and total metal ions of the sample were measured along with TKP and TKN
using Perkin Elmer (USA) Optima 7300DV inductivity coupled plasma ndash optical
emission spectroscopy (ICP-OES) equipped with WinLab32 software (Latif Mehta and
Batstone 2015)
Chapter 3 Materials and Methods
50
354 Determination of CN ratio
The CN ratio of the sample was determined using Sercon Europa EA-GSL elemental
analyser by combusting the sample at 1050 oC The sample was then inter-phased to a
Sercon Hydra 20-22 (IRMS) as per the standard methods described elsewhere (Beckett
Cresswell Grice and Carter 2015)
355 Determination of cellulose hemicellulose and lignin
The chemical composition of the samples was analysed using the standard procedures
described in Pasangulapati et at (2012) (Pasangulapati et al 2012) Briefly dried
samples were sieved through 250 μm sieve plates according to the procedures
demonstrated in Hames et al (2008) of the National Renewable Energy Laboratory
(NREL) Biomass retained on the sieve plate was subjected to the accelerated solvent
extractor to remove any non-structural material (Sluiter et al 2008) A two-step acid
hydrolysis methodology was used to analyse structural carbohydrates lignin acetyl and
ash content from the residual material To determine the acid-insoluble lignin a muffle
furnace was used HPLC with a refractive index detector (Bio-Rad Aminex HPX-87P
column) was used to analyse structural carbohydrates During a total run time of 30
minutes column temperature of 85 oC an eluent flow rate of 06 mLmin (deionized
water) was maintained A UV-vis spectrophotometer was used to analyse the acid
soluble lignin at a wavelength of 205 nm and an extinction coefficient of 1101g-cm
356 Determination of VFA
VFAs of the samples were determined using a gas chromatograph (Agilent model
78090A USA) with flame ionization detection according to the standard methods and
protocols described elsewhere (Latif et al 2015)
Chapter 3 Materials and Methods
51
357 Determination of ammoniacal nitrogen (NH4-N) and phosphate
(PO43-)
NH4-N and PO43- contents in the sample were determined using flow injection analyser
(FIA) Lachat Instruments USA Quick Chem 8000 according to the methods described
elsewhere (Latif et al 2015)
36 Biochemical Methane Potential (BMP) tests
BMP tests were conducted for all the feed ratios mentioned above as in Table 31 An
inoculum to substrate ratio of 2 was maintained in all the assays BMP test was
conducted in 160 mL serum bottles with 100 mL working volume as per the standard
BMP protocols described elsewhere (Angelidaki et al 2009) A feeding load of 08gVS
was maintained in all assays Distilled water was used to make the working volume of
100mL pH in all assays was monitored before sealing the cap and was made neutral
(69 ndash 72) by the addition of an adequate amount of 1M HCl or NaOH solution The
anaerobic condition was maintained in the headspace by flushing the headspace with
99 pure nitrogen gas for 3 minutes The prepared assays (Figure 33) were then closed
with a butyl rubber stopper and sealed with aluminium crimps Sealed assays were then
incubated at mesophilic conditions (37 plusmn 01 oC)
Chapter 3 Materials and Methods
52
Figure 33 sealed 160 mL serum bottle for BMP test with inoculum substrate and
headspace flushed with nitrogen gas
Quantity of biogas produced from the assays was calculated by measuring the pressure
developed in the headspace by using the manometer displacement method A sample
gas of known volume was drawn from the headspace of the assay and subjected to a U-
tube manometer to find the volume of water displaced by the headspace pressure The
sample gas which was normalised to atmospheric pressure was then subjected to gas-
chromatography (Schimadzu GC-2014 Japan) (Figure 34) to examine the composition
of the gas from the headspace
Chapter 3 Materials and Methods
53
Figure 34 Gas chromatography machine (GC-2014)
The gas chromatograph used for this research was equipped with a Thermal
Conductivity Detector (TCD) and chin carbon ST 100120 packed column It had a
length of 2 m an outer diameter of 116rsquorsquo and an inner diameter of 1 mm A sample
loop of 1 mL (Valco GC valve) was used for injection A temperature of 75 oC and
110 oC was set for the injector and oven of the gas chromatograph However the
detector temperature of the gas chromatograph was set to 120 oC Argon gas of ultra-
high purity at a flow rate of 275 mL min-1 and 7238 kPa was used as the carrier gas
Chapter 3 Materials and Methods
54
37 Data Processing
371 Theoretical BMP
The maximum biochemical methane potential of a substrate or a combination of
substrates estimated based on the amount of COD that is fed to the assays through these
substrates or combination of these substrates is known as the theoretical BMP
(BMPthCOD) The theoretical BMP of each feed ratio was calculated based on the
chemical analysis done before the start of the BMP test Theoretical BMP can be
calculated based on equation 31 and is expressed as mlCH4gVSadded (Nielfa Cano and
Fdz-Polanco 2015)
ᆒ㢐ᆒ썈υ =ᆒt
tttEq31
R represents the universal gas constant (0082 atm Lmol K) Temperature of operation
is denoted by T (31015K) the pressure is given by p (1 atm) VSadded is the amount of
VS added in the assay through the substrate The number of moles of CH4 can be
calculated using equation 32 (Nielfa et al 2015) and is denoted by ηCH4
ᆒt =ᆒ썈υ
Eq32
COD denotes the total COD in the assay from the substrate or combination of substrates
372 Experimental BMP
The amount of methane produced experimentally per gram of VS (gVS) added to the
assay through the substrates is termed as the experimental BMP and is expressed as mL-
CH4gVSadded To estimate the methane potential of the substrate assay with the same
quantity of inoculum alone is operated as blank and the methane production from the
blank is subtracted from the methane produced from the assays with substrates and
Chapter 3 Materials and Methods
55
inoculum (Zhang et al 2014) Thus the experimental BMP values can be calculated
using equation 33
ᆒ = 䇅ᆒ㢐戴 戴ᆒ㢐戴 Eq33
The volume of methane produced per gVS of the substrate from the assay containing
substrates and inoculum at STP is denoted by VsubSTPmethane and volume of methane
produced per gVS of inoculum from the assay containing inoculum alone at STP is
expressed as VinoSTPmethane To reduce the error in experimental data analysis all batch
assays were prepared in triplicates and the average production from these three assays
are used for calculations
The volume of methane produced per gram VS of substrate added at STP during a
sample event can be calculated using equation 34 and equation 35 (Kafle Kim and
Sung 2012)
䇅ᆒ㢐戴 =s ᆒ㢐戴 Σ gVS䇅ݏ
Eq34
戴ᆒ㢐戴 =s ᆒ㢐戴 gVS戴䇅䇅
Eq35
Where Vbiogas is the volume of biogas produced in the sample event Cmethane is the
concentration of methane in the headspace of assays Rvol is the Ratio used to normalise
the temperature during volume measurement (Rvol = 111 for mesophilic condition and
volume measurement is done at 30 oC ndash room temperature calculated based on the ideal
gas equation) ƩgVSsubstrate is the sum of VS added to the assays through substrate or the
mixture of substrates and gVSinoculum is the grams of volatile solids in the blank assays
through the inoculum
Chapter 3 Materials and Methods
56
373 Synergistic effects analysis
The synergistic effects analysis of the co-digestion mixture is done in order to evaluate
the influence of each substrate in different feed ratio mixtures It also helps to estimate
the synergetic effects that could be produced during the biodegradation process The
synergetic effect (α) was calculated using equation 36 (Nielfa et al 2015)
= 戴ݏ t䇅戴ݏ㢐ݏ t䇅戴ݏ
Eq36
Experimental production is the experimental cumulative methane yield from the co-
digestion assay at the end of the BMP test and theoretical production is the methane
yield calculated from the sole substrates considering the contribution of VS from them
to form the co-digestion mixture
374 Anaerobic biodegradability
Anaerobic biodegradability of a batch assay is the measure of the amount of degradation
in VS or COD of an assay as a result of the anaerobic digestion process happening
during the BMP test Anaerobic biodegradability is calculated in this experiment
according to the standard methods and protocols outlined in Nielfa et al 2015 COD
and VS in each bottle is measured before the start of BMP and also after terminating the
BMP CODi and CODf represent the initial and final COD of the assays and VSi and VSf
indicate the initial and final VS in the assays respectively Biodegradability (BD)
calculated based on the COD values are done according to equation 6 BD calculated
based on COD is expressed as BDexpCOD as in equation 37 (Nielfa et al 2015)
υᆒ썈υ = ᆒ썈υ ᆒ썈υᆒ썈υ
tt Eq37
Chapter 3 Materials and Methods
57
BD calculated based on the VS of assays can be done according to equation 7 BD
calculated based on VS is expressed as BDexpVS as in equation 38 (Nielfa et al 2015)
υ =
tt Eq38
Theoretical maximum methane production estimated in equation one was corrected with
biodegradability to obtain the BD corrected BMP which was then compared with the
experimental BMP results to validate the experimental methane production from batch
assays BD corrected BMP values can be written as in equation 39 (Nielfa et al 2015)
ᆒ㢐υ = ᆒ㢐ᆒ썈υ υᆒ썈υ Eq39
The relative error between the experimental BMP and BD corrected BMP can be
calculated using equation 310 (Nielfa et al 2015) A smaller value of error indicates a
minor deviation of experimental results with the predicted results
ݏݏݏ = ᆒ ᆒ㢐υᆒ
Eq310
375 BMP mathematical Models
The experimental biochemical methane potential of different feed ratios was modelled
based on the first-order kinetic model and modified Gompertz model Different model
variables of these two models were estimated using Microsoft excels solver function
These model parameters were used to determine the rate and performance of the AD
process The experimental data were compared with both the first-order model and the
modified Gompertz model to test the curve fitting following these models
Chapter 3 Materials and Methods
58
3751 First-order kinetic model
The anaerobic digestion process in batch assays was assumed to follow the first-order
kinetic model as the substrates used in this AD process are lignocellulosic materials
and hydrolysis is considered as the rate-limiting step for such substrates (Angelidaki et
al 2009) The first-order kinetic model equation is as given in equation 311 (Zhang et
al 2014)
= t 㢐t) Eq311
The cumulative methane yield of the substrate is denoted by B and is measured in ml-
CH4gVSadded The ultimate methane potential of the assay is denoted by Bo and has the
same unit as that of the biochemical methane potential of the assay The hydrolysis rate
constant of the AD process is denoted by khyd It represents the rate of hydrolysis of the
AD process and has a unit of d-1 The time of the process is denoted by t and is
calculated as the difference between cumulative time from the start of the experiment
and the time delay of the assay
3752 Modified Gompertz model
The cumulative methane production from the batch assays was also modelled using the
modified Gompertz model according to equation 312 (Shen et al 2018) The modified
Gompertz model assumes that biogas production in the assays was directly proportional
to the microbial activity in the assay
= t
t
Eq312
The ultimate methane production from the assays in an infinite period was given by Go
(ml-CH4gVSadded) G gives the modelled biochemical methane potential of the assay at
time t and has the same unit as that of the ultimate biochemical methane potential Rm
Chapter 3 Materials and Methods
59
denotes the rate of reaction in the AD process (ml-CH4gVSaddedd and λ denote the lag
phase time constant for the assay (d)
376 Statistical Analysis
In order to evaluate the data-set for any significant difference within the groups and
between the groups statistical analysis of cumulative methane produced from triplicates
assays were performed using one-way ANOVA using SPSS software (Kalamaras and
Kotsopoulos 2014) The test was conducted at a 5 level of significance Multiple
comparison statistical test was also conducted among different feed ratios of the same
treatment using the post hoc (Tukey) test to check the mean difference of the assays at a
5 level of significance
Chapter 3 Materials and Methods
60
1
Chapter 4 Results and Discussions
61
Chapter 4 Results and discussions
Chapter 4 Results and Discussions
62
Chapter 4 Results and Discussions
63
41 Physical properties and chemical composition of substrates and
inoculum
Various physio-chemical properties of the substrates and inoculum used in this study
are presented in Table 41 The chemical composition of the substrates indicates that the
pre-treatment of SCT and SCB had a significant influence on their properties Untreated
SCT had a TS content of 913 The steam explosion of SCT resulted in a slight
reduction in TS content (Table 41) Similarly Untreated SCB contained 828 of
solids which was also reduced by nearly 1 as a result of the steam explosion pre-
treatment A similar reduction of TS content as a result of pre-treatment was reported by
Lizasoain et al (2016) Direct injection of steam during steam explosion pre-treatment
leading to solubilisation caused this reduction in dry matter content of pre-treated SCT
and SCB (Lizasoain et al 2016)
The organic matter content of Untreated SCT was 909 of dry matter (Table 41)
Steam explosion pre-treatment increased the VS content of SCT by 18 Similarly
VS content in Untreated SCB was 894 of TS and the steam explosion increased its
VS by 64 (Table 41) Estevez et al (2012) also reported a similar improvement in
VS content during the steam explosion of salix (Estevez et al 2012) Solubilisation of
organic matter as a result of steam explosion pre-treatment resulted in a higher VS
content in pre-treated SCT and SCB (Neshat et al 2017) The present study results are
in accord with those reported by Mokomele et al (2019) where the steam explosion
pre-treatment improved the VS of sugarcane bagasse by 4 (Mokomele et al 2019)
The CN ratio of SCT increased from 831 in untreated SCT to 953 in steam-exploded
SCT The corresponding values for SCB were 1465 and 1919 respectively (Table 41)
Mokomele et al (2019) also reported an increase from 152 to 171 in the CN ratio of
sugarcane bagasse as a result of the steam explosion pre-treatment (Mokomele et al
Chapter 4 Results and Discussions
64
2019) Enrichment of cellulose and lignin contents in steam-exploded SCT and SCB
biomass resulted in a higher CN ratio However the use of substrates with a high CN
ratio for biogas production can lead to VFA inhibition (Neshat et al 2017) Previously
several studies have shown the optimal CN ratio for biogas production is 20-301
(Abouelenien et al 2014 Li Liu Cui Yu and Ma 2018a Matheri et al 2018
Mokomele et al 2019 Neshat et al 2017 Sawatdeenarunat et al 2015) Thus to
improve the anaerobic biodegradability and biogas production SCT and SCB can be co-
digested with co-substrates rich in nitrogen CN ratio of nitrogen-rich manure is much
lower than that of the lignocellulosic agro-wastes (Song and Zhang 2015) For instance
Li et al (2014) reported the CN ratio of chicken manure as 101 (Li et al 2014) which
is similar to the results obtained in this study Similarly Mokomele et al (2019)
reported high CN values for SCB and cane leaf matter in his studies A CN ratio of
153 and 107 was reported for SCB and cane leaf matter respectively in the studies of
Mokomele et al (2019) which is in accord with the results attained in this study
(Mokomele et al 2019) Thus to optimise the CN ratio co-digestion of these two co-
substrates was done and the preferred feed ratio of co-digestion was investigated in this
study
Glucan concentration of both SCT and SCB was improved due to pre-treatment The
increase in glucan content after the steam explosion was 156 and 77 in SCT and
SCB respectively (Table 41) Similar results were also reported during the steam
explosion of bulrush (Wang et al 2010)In this study the glucan content of the
lignocellulosic bulrush increased from 361 to 398 due to pre-treatment Similarly
a slight reduction in total lignin content (about 1) was evident in the studies by Wang
et al (2010) The increase in glucan content with a corresponding decrease in
hemicellulose (xylan and arabinan) and lignin contents in steam-exploded
Chapter 4 Results and Discussions
65
lignocellulosic substrates was obviously due to disruption of cellulose structure as a
result of steam explosion pre-treatment (Wang et al 2010) During steam explosion
pre-treatment hemicellulose and a part of cellulose are hydrolysed into simple sugars
resulting in an increase in glucan content with a corresponding decrease in xylan
arabinan and lignin contents (Rodriacuteguez Rodriacuteguez Jimeacutenez Guilleacuten and Fernaacutendez-
Bolantildeos 2007)
Table 41 Physio-chemical properties of substrates and inoculum
Parameter Unit CMUntreated
SCT
Pre-treated
SCT
Untreated
SCB
Pre-treated
SCBInoculum
TS 721 913 872 828 819 19
VS TS 807 909 925 894 951 722
COD gl 7487 11598 12099 7939 9156 211
TSVS - 12 11 11 11 11 14
CN ratio - 124 831 953 1465 1919 49
Glucan ND 307 463 351 428 ND
Xylan ND 168 117 20 146 ND
Arabinan ND 28 14 21 16 ND
Lignin ND 298 283 315 282 ND
TKP gPkg 82 11 07 05 06 312
TKN gNkg 836 97 108 512 71 1113
Note ND Not determined
The macro- (P S Ca Na K and Mg) and micro- (Co Cu Fe Mn Mo Ni Se and Zn)
nutrient contents in the studied substrates are presented in Table 42 Results showed
that macro-micro nutrient contents in the pre-treated biomass were lower than the
corresponding untreated substrates except for Na and S
Chapter 4 Results and Discussions
66
Table 42 Macro and micronutrients of substrates and inoculum
Sample Units CMUntreated
SCT
Pre-treated
SCT
Untreated
SCB
Pre-treated
SCBInoculum
Al mgg 103 123 099 084 024 817
As mgg 000 000 000 000 000 000
B mgg 003 000 000 000 000 004
Ba mgg 004 002 002 001 001 019
Ca mgg 1687 312 167 025 015 1973
Cd mgg 000 000 000 000 000 000
Co mgg 000 000 000 000 000 001
Cr mgg 004 001 001 001 001 005
Cu mgg 011 000 000 000 000 056
Fe mgg 107 092 019 086 026 1972
K mgg 1977 601 283 293 076 1582
Mg mgg 461 188 138 036 028 666
Mn mgg 036 010 006 005 003 017
Mo mgg 001 000 000 000 000 003
Na mgg 171 007 034 001 004 1644
Ni mgg 002 000 000 000 000 005
P mgg 796 101 041 015 010 2735
Pb mgg 001 000 000 000 000 003
S mgg 321 082 809 018 524 1469
Se mgg 001 000 001 000 001 000
Zn mgg 027 000 000 000 000 067
Mokomele et al (2019) also reported a similar reduction in micro and macronutrients
possibly due to solubilisation of these nutrients in the water as a result of pre-treatment
(Mokomele et al 2019) Several previous studies show that the improvement in
sulphate or phosphate contents or the improvement in these two elements together
improved the rate of degradation of lignocellulosic biomass (Scherer Neumann
Demirel Schmidt and Unbehauen 2009) However the micro- and macro-nutrient
contents in this study are largely contributed by the inoculum as it is a major source for
Chapter 4 Results and Discussions
67
micro- and macro-nutrient Chicken manure a co-substrate in this study also contained
a higher amount of micro-and macro-nutrients which are required for the optimum AD
process (Hagos Zong Li Liu and Lu 2017)
42 Anaerobic co-digestion of untreated and steam exploded SCT with
CM
The effect of different feed ratios such as 7525 5050 and 2575 on methane yields
during the anaerobic co-digestion of SCT with CM was tested in this section Methane
yields of all the tested co-digestion ratios were compared with the mono-digestion of
both SCT and CM Different feed ratios of both untreated and pre-treated SCT were
compared and the results are presented in Table 43
421 Effect of different feed ratios on methane yields during anaerobic
co-digestion of SCT with CM
Results showed that feed ratio had a profound effect on methane production rates and
yields for both untreated and pre-treated SCT (Figure 41) For untreated SCT methane
production started after a lag phase of 3-4 days which could be possibly due to the lack
of readily available cellulose and hemicellulose in the assays as the untreated SCT
contained highly resistant and recalcitrant lignocellulosic structure (Sawatdeenarunat et
al 2015)
Thereafter methane production in all assays increased steadily and exhibited a similar
methane production rate during the initial seven days of incubation From day 7 to 14
methane production increased and higher methane production rates were noticed in
assays with a higher amount of CM than SCT Higher nitrogen contents in the assays
with more CM would have reduced the CN ratio to an optimum range which caused
Chapter 4 Results and Discussions
68
the methane yield to increase sharply (Li et al 2014) However the lesser amount of
carbon in assays with lesser Untreated SCT caused it to cease methane production at a
very early stage indicating a lower HRT cycle for the co-digestion feed ratio with lesser
Untreated SCT
Figure 41 Cumulative methane production during the anaerobic co-digestion of
untreated SCT (USCT) and Pre-treated SCT (PSCT) with CM at different feed ratios
incubated in a batch experiment at 37 oC for 83 days
On the other hand for steam-exploded SCT methane production started immediately
without any lag phase A similar trend in methane production without any lag phase was
reported during anaerobic digestion steam-exploded olive mill solid waste (Rincoacuten et al
2016) However methane production rates with pre-treated SCT were higher than those
of untreated SCT The ease in availability of the cellulose and hemicellulose in a pre-
treated substrate resulted in more accessibility of these elements to the microbes
Similar results were observed in the studies conducted elsewhere (Paudel et al 2017)
Thus a faster production of biogas in the pre-treated substrates assays than that of the
untreated substrates assays was observed Among the feed ratios methane production
Chapter 4 Results and Discussions
69
increased with an increase in the amount of pre-treated SCT This trend was noticed
throughout the experimental run Lower carbon contents in the assays with lesser SCT
would be the possible reason for such a lower production rate among them (Vivekanand
et al 2018) To compare the assays with the same amount of carbon mono-digestion
assays were used Synergistic and antagonistic effects of co-digestion ratios were
discussed in Section 423
422 Effect of steam explosion pre-treatment on anaerobic co-digestion
of SCT with CM at different feed ratios
In Pre-treated SCTCM assays more than 75 of methane production was obtained
within the initial 11 days of incubation when the rate of production of methane dropped
below 10 in all assays (Figure 42) However on an average only less than 45 of
methane production was observed among the Untreated SCTCM assays in the same 11
days of incubation This could be possibly due to the destruction of the lignocellulosic
structure as a result of the steam explosion pre-treatment leading to the availability of
cellulose and hemicellulose (Hendriks and Zeeman 2009) Thus the rate of hydrolysis
in pre-treated SCT was improved leading to more methane being produced rapidly in a
short period than with untreated SCT Similar results were achieved in the studies
conducted elsewhere (Mokomele et al 2019)
Figure 42 illustrates the cumulative methane produced among various feed ratios until
day 11 It is evident that among all the co-digestion ratios and mono-digestion of SCT
all Pre-treated SCTCM ratios produced much more methane than the corresponding
feed ratios of Untreated SCTCM till day 11 A similar positive effect of pre-treatment
was reported during the sodium hydroxide pre-treatment of sorghum by Sambusiti et al
(2013) (Sambusiti Ficara Malpei Steyer and Carregravere 2013) Steam explosion and
AFEX pre-treatment on sugarcane agricultural residues producing a higher methane
Chapter 4 Results and Discussions
70
yield during the initial days of incubation were reported by Mokomele et al (2109)
(Mokomele et al 2019)
Figure 42 Cumulative methane yield among different feed ratios of Untreated
SCTCM and Pre-treated SCTCM on day 11 (T11)
It can also be seen that from Figure 42 the cumulative methane yield of Pre-treated
SCTCM assays show a decreasing trend as the SCT contents decreased possibly due to
the significant reduction in carbon content within feed ratios with lesser amount of SCT
contents A similar trend was also observed during the anaerobic co-digestion of whey
and manure when they were co-digested in different feed ratios such as 1000 8515
7525 5050 2575 1585 and 0100 (Vivekanand et al 2018) In this study
Vivekanand et al (2018) reported a decrease in methane yield from 264
mLCH4gVSadded to 147 mLCH4gVSadded as the percentage of manure in the co-
digestion mixture increased from 0 to 100 This might be due to the lesser carbon
content in the assays at lower amounts of SCT (Li et al 2009) The slightly better
methane yields obtained for untreated SCT with an increase in the amount of CM was
probably due to the availability of easily accessible cellulose and hemicellulose and due
Chapter 4 Results and Discussions
71
to a better CN ratio contributed by CM (Vivekanand Olsen Eijsink and Horn 2013)
Both these results were in agreement with previous studies reported in the literature
(Ferreira Donoso-Bravo Nilsen Fdz-Polanco and Peacuterez-Elvira 2013)
423 Synergistic effects on anaerobic digestibility and methane yields
during anaerobic co-digestion of SCT with CM
The amount of methane produced in different co-digestion feed ratios can be compared
with an equivalent amount of SCT and CM contributed from their mono-digestion
assays Additional methane yield obtained in the co-digestion mixtures compared to the
expected output from mono-digestion assays is known as synergism (Nielfa et al 2015)
On the contrary the reduction in methane yield in the co-digestion assays compared
with the expected methane production from the sole substrates (SCT and CM) alone is
known as antagonism (Nielfa et al 2015) Synergism observed in the co-digestion
assays might be due to the improvement in any of the factors affecting anaerobic
digestion (Mata-Aacutelvarez 2002) Nitrogen-rich manure used in this co-digestion study
improved the methane yield by lowering the CN ratio of high CN sugarcane
agricultural residue In this experiment the highest synergistic effect of 1196 was
observed in the 7525 ratio of Pre-treated SCTCM (Figure 43)
However in the case of Untreated SCTCM both 7525 and 5050 ratio exhibited
antagonistic effects A Similar antagonistic effect was observed during the anaerobic co-
digestion of whey and fish ensilage (Vivekanand et al 2018) In this study Vivekanand
et al (2018) reported an antagonistic effect in the co-digestion ratios 5050 2575 and
1585 A decrease in the extent of bio-degradation was reported for co-digestion ratios
with more than 50 of fish ensilage among the tested co-digestion ratios of 8515
7525 5050 2575 and 1585 (Vivekanand et al 2018) Among the tested feed ratios
in the current study 2575 ratio of Untreated SCTCM was the only co-digestion ratio
Chapter 4 Results and Discussions
72
that produced a synergistic effect Thus the results of this study indicate that anaerobic
co-digestion is best suited for steam-exploded SCT than for the untreated SCT when co-
digested with CM
Figure 43 Synergistic and antagonistic effects of various co-digestion feed ratios
during anaerobic co-digestion of SCT with CM in batch assays at 37 oC
43 Anaerobic co-digestion of untreated and steam exploded SCB with
CM
The second set of experiments was conducted under the same conditions to study the
effect of different feed ratios such as 7525 5050 and 2575 on methane yields during
the anaerobic co-digestion of SCB with CM Methane yields of all the tested co-
digestion ratios were compared with the mono-digestion of both SCB and CM
Different feed ratios of both untreated and pre-treated SCB were compared and the
results are presented in Table 43
Chapter 4 Results and Discussions
73
431 Effect of different feed ratios on methane yields during anaerobic
co-digestion of SCB with CM
Results showed that feed ratio had a profound effect on methane production rates and
yields for both untreated and pre-treated SCB Methane production in all untreated SCB
assays was low and delayed by four days (Figure 44) A similar lag phase of nearly
four days was reported by Estevez et al (2012) in his studies on untreated salix (Estevez
et al 2012) However an increase in the methane production rate was observed around
day 4 From day 4 to day 15 higher methane production rates and yields were noticed
(Figure 44) A similar observation in the initial lag phase and an increase in methane
production rates after a lag-phase of 4 ndash 5 days was reported during the anaerobic co-
digestion of goat manure with wheat straw (Zhang et al 2013a) The lower methane
production rates noticed in assays with high CM content was probably due to the lack of
readily available carbon contents in these assays A reverse trend of increased methane
production with an increase in SCT amount was evident from day 15 onwards
However higher methane production rates and relatively small lag-phase were noticed
in assays with steam-exploded SCB compared with untreated SCB A similar trend was
observed during the anaerobic digestion of steam-exploded salix (Estevez et al 2012)
Estevez et al (2012) reported the highest methane yield of 166 mLCH4gVSadded for
steam-exploded salix at 210oC for 10 minutes against the untreated salix which
produced 97 mLCH4gVSadded after 22 days of incubation (Estevez et al 2012)
Chapter 4 Results and Discussions
74
Figure 44 Cumulative methane production during the anaerobic co-digestion of
untreated SCB (USCB) and Pre-treated SCB (PSCB) with CM at different feed ratios
incubated in a batch experiment at 37 oC for 83 days
A steep increase in methane production was observed from day 4 through day 10 and
thereafter methane production rates were lower indicating that the hydrolysis was the
rate-limiting step (Zhang et al 2013a) Towards the end of the experiment a clear trend
of increased methane production was noticed in all assays with a higher amount of SCT
The availability of more carbon contents to be converted into methane could be the
possible reason for this higher production in these assays (Vivekanand et al 2018)
However the biodegradability check on both untreated and pre-treated substrates shows
that only about 25 of the substrates were degraded during this BMP analysis (Table
43) This might be due to process inhibition in all assays as a result of high ammoniacal
nitrogen accumulation in them as it is a batch test (Table 44) A synergistic study
among the different co-digestion ratios tested was conducted and presented in Section
433 to estimate the performance of co-digestion
Chapter 4 Results and Discussions
75
432 Effect of steam explosion pre-treatment on anaerobic co-digestion
of SCB with CM at different feed ratios
The cumulative methane yield among different feed ratios until day 11 when the rate of
methane production drops below 10 among all assays is shown in Figure 45 Among
untreated SCB cumulative methane yield increases as the amount of chicken manure
increases in the assays The chemical analysis of untreated SCB showed that only a
lesser amount of cellulose and hemicellulose is available compared to the pre-treated
SCB for the microorganisms to feed A similar trend was observed when SCB was co-
digested with dairy cow manure by Mokomele et al (2019) Methane yield of SCB
increased from nearly 75 to 120 mLCH4gVSadded on the 11th day of incubation when
the co-digestion ratio was increased from 0 to 50 (Mokomele et al 2019) This is due
to the fact that the assays with more CM reduce the CN ratio of high CN SCB to an
optimum range which favours more methane production (Neshat et al 2017) This
causes the assays with high CM content to produce more yield on day 11 in the case of
untreated SCB
However in the case of pre-treated substrates the variation in feed ratios did not affect
the cumulative methane production in them All the Pre-treated SCBCM assays
produced nearly 85 mlCH4gVSadded till day 11 Similar results were reported by
Mokomele et al (2019) when cane leaf matter was co-digested with dairy manure
When cane leaf matter was subjected to AFEX pre-treatment the increase in manure
content during co-digestion does not show much difference in the methane yields
between the mono-digestion and the co-digestion mixtures after 10days of incubation
(Mokomele et al 2019) The availability of biodegradable fibres among the pre-treated
SCB in all co-digestion ratios must have reduced the effect of co-digestion with chicken
manure in this study Pre-treated SCB among all feed ratios tested here must be having
Chapter 4 Results and Discussions
76
nutrient balance and buffer capacity to negate the benefits of co-digestion (Mokomele et
al 2019) Thus all feed ratios of pre-treated SCB produced almost the same methane
yield after 11 days of incubation
Figure 45 Cumulative methane yield among different feed ratios of Untreated
SCBCM and Pre-treated SCBCM on day 11 (T11)
433 Synergistic effect on anaerobic digestibility and methane yields
during anaerobic co-digestion of SCB with CM
Unlike the SCT all assays of untreated and pre-treated substrates of SCB has a
synergistic effect while co-digesting with CM Untreated SCBCM assays show a
higher synergistic effect when compared to the Pre-treated SCBCM for the same feed
ratio Both untreated and pre-treated substrates co-digestion show an increasing trend in
the synergistic effect as the amount of CM increases among the co-digestion assays
Supplementing the deficient components by the co-digestion caused an improvement in
overall cumulative methane yield (Aichinger et al 2015) Figure 46 shows the
improvement in co-digestion when compared to the expected methane production from
mono-digestion
Chapter 4 Results and Discussions
77
Figure 46 Synergistic and antagonistic effects of various co-digestion feed ratios
during anaerobic co-digestion of SCB with CM in batch assays at 37 oC
The highest synergistic effect of 1857 was observed in the 2575 ratio of Untreated
SCBCM Lesser synergistic effect among the pre-treated substrates of SCBCM shows
that the co-digestion SCB with CM is more suitable for untreated SCB than pre-treated
SCB However the better synergistic effect alone does not mean that the co-digestion
ratio is the best choice for anaerobic digestion The synergistic effect shows how good
the co-digestion performed than the expected methane production from the same VS
contents from sole substrates alone (Kim Chowdhury Nakhla and Keleman 2017)
44 Post-BMP analysis of SCTSCB when co-digested with CM
441 Cumulative methane yield and statistical analysis
Cumulative methane yield obtained from all BMP assays including co-digestion
mixtures and mono-digestion of sole substrates is detailed in Table 43 Towards the
end of experiment all sets of co-digestion ratios showed a decrease in cumulative
Chapter 4 Results and Discussions
78
methane yield with the increase in chicken manure The lesser amount of carbon
molecules in assays with lesser SCTSCB resulted in the low methane yield during
longer degradation time (Vivekanand et al 2018) Among Untreated SCTCM the
mono-digestion of Untreated SCT achieved the highest cumulative methane yield of
202 mlCH4gVSadded As the VS from chicken manure was increased by 25 of total VS
a decrease of 11 22 30 and 43 was observed among the cumulative methane
yield at the end of 83 days of incubation On the other hand for Pre-treated SCTCM
ratios a slightly higher cumulative methane yield of 2075 mlCH4gVSadded was
achieved by the mono-digestion of Pre-treated SCT All feed ratios of Pre-treated
SCTCM produced more cumulative methane yield than the corresponding feed ratios
of Untreated SCTCM assays
A similar trend was noticed in the case of SCB Highest cumulative methane yield of
199 mlCH4gVSadded among the Untreated SCBCM assays was attained when Untreated
SCB was mono-digested (Table 43) The decline in cumulative methane yield as the
amount of chicken manure increases is evident in the case of both Untreated SCB and
Pre-treated SCB co-digestion assays 185171162115 mlCH4gVSadded were the
cumulative methane yield obtained from 7525 5050 2575 and 0100 feed ratios of
Untreated SCBCM Similarly the highest methane yield of 225 mlCH4gVSadded was
produced by anaerobic digestion of Pre-treated SCB alone While increasing the
percentage of chicken manure in the feed a decrease of 12 23 31 and 49 was
observed among the tested feed ratios of 7525 5050 2575 and 0100 respectively
Cumulative methane yields of all batch assays were tested for statistical significance
using one-way ANOVA It was observed that all cumulative methane yield was distinct
and hence statistically significant at 95 confidence level except 1000 and 7525 ratio
of Pre-treated SCTCM assay All assays within the groups and between the groups
Chapter 4 Results and Discussions
79
were tested Test of homogeneity of variances ANOVA and multiple comparisons
including the Tukey HSD LSD and Dunnett 2-sided t-test was done and tabulated in
the appendix for Untreated SCTCM Pre-treated SCTCM Untreated SCBCM and
Pre-treated SCBCM
442 Anaerobic biodegradability
Anaerobic biodegradability describes the amount of organic matter degraded as a result
of anaerobic digestion (Panigrahi Sharma and Dubey 2020) The theoretical methane
potential of the BMP assays can be corrected using the biodegradability factor and can
be used to compare for error with the experimentally achieved values (Nielfa et al
2015)
Table 43 also shows the theoretical methane yield expected from the assays per gram
VS of substrate added along with the experimental methane yield per gram of VS added
It also shows the biodegradability factor based on VS reduction and COD reduction
The percentage of VS destruction occurring in the assays as a result of the anaerobic
digestion process is known as the VS destruction (Wei et al 2018) Whereas the
reduction in COD as a result of the anaerobic digestion is termed as the COD
destruction Theoretical methane corrected with the biodegradability factor is the
product of biodegradability factor from COD destruction and the theoretical expected
methane yield from the assays calculated based on the moles of methane that can be
produced from initial COD (Nielfa et al 2015)
Chapter 4 Results and Discussions
80
Table 43 Theoretical and experimental results of anaerobic biodegradability during anaerobic co-digestion of SCTSCB with CMNote denotes statistically significant values at 95 confidence level a denotes these values are not statistically significant at 95 confidence level
Substrates Feed ratio Theoretical BMP Experimental resultsBMPth BMPexpCOD BMPexpVS BDexpVS BDexpCOD BMPthBD Error
(mlCH4gVSadded) (mlCH4gCODadded) (mlCH4gVSadded) () () (mlCH4gVSadded) ()
Untreated
SCTCM
1000 5552 1444 2018 215 353 1960 28
7525 5444 1307 1791 247 307 1671 67
5050 5336 1178 1582 248 308 1642 -38
2575 5228 1074 1413 244 270 1413 00
Pre-treated
SCTCM
1000 5073 1625 2075a 265 410 2082 -03
7525 5085 1614 2065a 252 391 1988 37
5050 5097 1318 1691 235 319 1628 37
2575 5109 1106 1422 190 255 1302 85
Untreated
SCBCM
1000 4364 1812 1990 262 421 1839 76
7525 4553 1615 1850 237 391 1780 38
5050 4742 1429 1706 232 350 1660 27
2575 4931 1302 1615 179 301 1486 80
Pre-treated
SCBCM
1000 2882 3110 2256 251 715 2061 86
7525 3442 2304 1995 220 538 1852 72
5050 4000 1729 1741 235 414 1656 49
2575 4561 1357 1558 194 348 1586 -18
CM 1000 5121 895 1153 216 206 1056 84
Chapter 4 Results and Discussions
81
It can be observed in general that the pre-treated substrates (Pre-treated SCTPre-treated
SCBCM) have a higher value of biodegradability compared to the untreated substrates
(Untreated SCTUntreated SCBCM) Readily available cellulose and hemicellulose
content among the pre-treated substrates causes the assays with these substrates to have
more degradation due to anaerobic digestion (Panigrahi et al 2020) It can also be
noted that the nitrogen-rich CM has the lowest value of biodegradability The lack of
degrading compounds in these kinds of animal manures is the reason for such a low
biodegradability among them (Gonzaacutelez-Fernaacutendez Leoacuten-Cofreces and Garciacutea-Encina
2008) The antibiotic feed given to the animals results in a higher quantity of antibiotic
contents in their manure which resulted in an inhibitory effect as the antibiotics kill or
deactivate living micro-organisms (Neshat et al 2017) Since the animal manures have
a lower biodegradability the same trend can be seen in the co-digestion assays Assays
with a higher amount of CM has a lower biodegradability This means that the
anaerobic biodegradability decreases with the increase in CM content among the co-
digestion assays Table 43 shows the theoretical BMP experimental BMP VS and
COD destruction biodegradability biodegradability corrected BMP and the relative
error for different feed ratios tested in this study A smaller value of error validates that
the experimentally achieved value matches with the theoretically expected value
443 VFA analysis of digestates
Digestates of the BMP assays were subjected to Volatile Fatty Acids (VFA) tests in
order to check the presence of any inhibitory long-chain volatile fatty acids All the co-
digestion mixtures and the individual mono-digestion of all the substrates used in this
study were tested All the assays had a considerable amount of acetic acids which
could have been converted into methane if all other parameters for anaerobic digestion
were optimum (Li et al 2018b) Figure 47 shows the percentage of VFAs in each
Chapter 4 Results and Discussions
82
assay after 83 days of incubation All the assays consisted of about 40-50 of acetic
acid in them They degrade to acetic acid and then to methane by acetogenic microbes
A similar result was also observed by Bolado et al (2016) (Bolado-Rodriacuteguez Toquero
Martiacuten-Juaacuterez Travaini and Garciacutea-Encina 2016) However the presence of about
20-30 of valeric acids in these digestates could have caused an inhibitory effect on the
anaerobic digestion process Butyric acid also contributed to about 15-20 of the total
VFA concentration in these digestates High concentrations of butyric acid can inhibit
the activity of methanogens (Mamimin Prasertsan Kongjan and O-Thong 2017
Wagner Malin Lins and Illmer 2011) Small quantities of hexanoic acid heptanoic
acid and propionic acid were also present in the digestates of these assays
Chapter 4 Results and Discussions
83
Figure 47 VFAs of post BMP digestates in various feed ratio assays
Note USCT Untreated SCT PSCT Pre-treated SCT USCB Untreated SCB PSCB Pre-treated SCB
Chapter 4 Results and Discussions
84
444 FIA analysis of digestates
Flow Injection analysis was performed on the digestates from the BMP assays in this
study It tests the presence and amount of NO2-N NOx-N NH4-N and PO4-P ions in the
digestates These tests are usually done to check for the existence of any of the above
mentioned ions in the assays that resulted in the ceasing of biogas production For
instance higher quantity of NH4-N ions in the digestates indicates the presence of
ammoniacal nitrogen which hinders the microbial action and thereby reduces the net
biogas production from the substrates (Neshat et al 2017)
Table 44 shows the results of flow injection analysis on various co-digestion assays and
mon-digestion substrates used in this experiment Results show that ~1600 mgL of
ammoniacal nitrogen were present in all assay digestates However we can see a slight
increasing trend in ammoniacal nitrogen as the amount of chicken manure is being
increased among the feed ratios This trend is evident in all four type of co-digestion
mixtures Among untreated SCTCM assays NH4-N increased from 1616 mgL to
1727 mgL as the ratio of CM increased from 0 to 75 Similarly an increase of 1566
to 1687 1636 to 1727 and 1576 to 1727 mgL of NH4-N was observed in pre-treated
SCTCM untreated SCBCM and pre-treated SCBCM assays respectively Highest
value of NH4-N was observed in the digestates of mono-digestion of chicken manure
and was about 1747 mgL
On contrary the PO4P values shows a decreasing trend as the percentage of CM
increased in all four types of co-digestion mixtures Highest value of PO4P (165 mgL)
was observed in the digestates of mono-digesting untreated bagasse As the amount of
chicken manure increased a reduction in PO4P value was observed Among untreated
SCBCM assays the least value of PO4P was obtained in 2575 ratio and was 144 mgL
Chapter 4 Results and Discussions
85
Similarly a decrease from 154 to 140 164 to 141 and 157 to 144 mgL was observed
among untreated SCTCM pre-treated SCTCM and pre-treated SCBCM respectively
The lowest value of PO4P was obtained from the digestates of 100 CM and was
136 mgL
Table 44 Results of flow injection analysis for various feed ratios of SCTSCB with
CM
Sample Feed ratioNO2-N NOx-N NH4-N PO4-P
mgL mgL mgL mgL
Untreated
SCTCM
1000 0 548 16160 1535
7525 0 554 16160 1465
5050 0 550 16867 1444
2575 0 553 17271 1404
Pre-treated
SCTCM
1000 0 556 15655 1636
7525 0 547 16059 1596
5050 0 551 16362 1505
2575 0 550 16867 1414
Untreated
SCBCM
1000 0 548 16362 1646
7525 0 561 16564 1586
5050 0 535 17069 1515
2575 0 551 17271 1444
Pre-treated
SCBCM
1000 0 364 15756 1566
7525 0 549 16665 1576
5050 0 543 16968 1505
2575 0 552 17271 1444
CM 1000 0 553 17473 1364
It can be also noted from table 43 and table 44 that the higher the amount of
ammoniacal nitrogen in the digestates lesser is the amount of PO4P and lesser is the
amount of cumulative methane yield obtained from those assays Higher concentrations
of ammoniacal nitrogen reduced the CN ratio of the digestates as the anaerobic
Chapter 4 Results and Discussions
86
digestion progresses (Vats Khan and Ahmad 2019) It also could lead to an increase
in pH which would result in a lesser cumulative methane yield (Li et al 2013)
However in a batch assay system large quantity of minerals ions and trace elements
are being contributed by the inoculum This reduces the effect of co-digestion feed ratio
in terms of supplementing such elements or ions Non-removal of digestates in a batch
assay unlike a continuous feeding system caused the accumulation of ammoniacal
nitrogen in the assays (Neshat et al 2017) This in turns increases the pH of the system
(Li et al 2013) Continuous type reactor studies can be done for best ratios of the BMP
tests to eliminate the accumulation of ammoniacal nitrogen in the digestates Results of
such continuous type reactors after few HRT can reduce the influence of inoculum in
supplementing such nutrients
45 Mathematical modelling
Mathematical modelling of the mono-digestion of various substrates along with the co-
digestion of these substrates with CM was done in order to compare the fit of these
plots to the pre-defined models The two models used in this study were the first-order
kinetic model and the modified Gompertz model These models consider the
experimental biodegradability of the substrates during the process which also includes
the microbial growth
Table 45 presents the various parameters of the modified Gompertz model and the first-
order kinetic model for the cumulative methane production from the mono-digestion of
Untreated SCT Pre-treated SCT Untreated SCB and Pre-treated SCB along with the
co-digestion of these substrates with CM These calculated parameters are used to
establish a fit between the experimental cumulative methane yields and the expected
modelled data
Chapter 4 Results and Discussions
87
Table 45 Modelling parameters for first-order model and modified Gompertz model for different feed ratios of SCTSCB co-digested with CMNote USCT Untreated SCT PSCT Pre-treated SCT USCB Untreated SCB PSCB Pre-treated SCB
SubstratesFeed
ratioModified Gompertz Model First-order model
B B0 Rm λR2
B0 khyd Time delayR2
(ml CH4gVSadded) (ml CH4gVSadded) (mlgVSd) (d) (ml CH4gVSadded) (d-1) (d)
USCTCM 100 0 20175 19347 712 264 09942 20753 005 266 09988
75 25 17909 16507 623 128 09772 17679 005 183 09956
50 50 15820 14442 648 122 09701 15343 006 188 09911
25 75 14128 12653 858 198 09727 13238 010 255 09898
PSCTCM 100 0 20748 19853 2142 168 09927 20397 015 185 09867
75 25 20650 19748 1819 123 09905 20331 014 167 09905
50 50 16910 16360 1766 142 09920 16782 016 174 09896
25 75 14224 13498 1521 157 09887 13889 016 178 09881
USCBCM 100 0 19900 19394 797 521 09972 20561 006 538 09889
75 25 18503 17700 528 197 09864 19472 004 197 09989
50 50 17056 16131 492 045 09734 17440 004 119 09940
25 75 16154 14420 767 109 09691 15218 003 178 09897
PSCBCM 100 0 22557 21982 702 154 09815 23570 004 188 09934
75 25 19955 19203 660 007 09787 20400 005 089 09941
50 50 17407 16241 718 015 09745 17090 007 110 09928
25 75 15577 14114 806 040 09624 14869 008 119 09837
CM 100 0 11532 10787 1237 280 09858 11135 016 299 09919
Chapter 4 Results and Discussions
88
Hydrolysis process is considered as the rate-limiting step in the first-order kinetic model
whereas the bacterial growth and inhibition process is considered as the rate-limiting
step of the modified Gompertz model (Kafle et al 2012 Patil Raj Muralidhara Desai
and Raju 2012 Vats et al 2019) The term khyd of the first-order kinetic model
describes the rate of hydrolysis of the substrate and is known as the hydrolysis
coefficient Larger values of khyd imply the hydrolysis of that batch is at a faster rate
Untreated SCT had the lowest khyd value of 005 (Table 45) indicating that the rate of
hydrolysis was the slowest among the assays This was similar to the result of khyd value
of 006 d-1 reported elsewhere (Kafle et al 2012) for Untreated SCB This would be
possible due to the complex lignocellulosic structure consisting of a lesser amount of
soluble organic compounds Even though the mon-digestion of Untreated SCT had the
lowest khyd value its ultimate methane potential (B0) was highest when compared with
different co-digestion ratios for Untreated SCT with CM The B0 value for mono-
digested Untreated SCT was 20753 ml CH4gVSadded (Table 45) This value was
similar to the methane yield obtained by Pre-treated SCT towards the end of the
experimental run (Figure 48) It can be noticed that the khyd value increased with an
increase in the amount of CM On the other hand the B0 value decreased with an
increase in the amount of CM Both these results indicate that the rate of hydrolysis
improved with an increase in the amount of CM
Chapter 4 Results and Discussions
89
Figure 48 Comparison of first-order (∆ - Untreated SCT and ndash Pre-treated SCT) and
modified Gompertz kinetic model ( ndash Untreated SCT and ndash Pre-treated SCT)
predictions with experimental cumulative methane yield (ndash) for different co-digestion
ratios of SCT with CM
Chapter 4 Results and Discussions
90
At the same feed ratio the hydrolysis rate constant for Pre-treated SCT mono-digestion
and co-digestion samples was higher than that of Untreated SCT samples (Table 45)
This implies that the steam explosion pretreatment improved the hydrolysis of the
substrate and resulted in smaller khyd values This is due to the fact that steam explosion
pretreatment improved the solubilization of cellulose and hemicellulose and increased
the accessibility of substrate for the microorganisms (Sawatdeenarunat et al 2015)
Similarly B0 values obtained for Pre-treated SCB substrates were higher than that of the
Untreated SCB substrates for the same feed ratios This resulted in higher cumulative
methane yields produced at the end of the experimental run The high khyd for Pre-
treated SCT substrates resulted in a faster methane production rate among the same feed
Among the different co-digestion ratios for Untreated SCB the highest khyd value was
noticed for mono-digestion of Untreated SCB followed by the co-digestion ratios of
7525 and 5050 (Table 45) This could be possibly due to the weak hydrolysis of
Untreated SCB and inhibition caused due low pH as a result of VFA formation (Chen
Cheng and Creamer 2008 Risberg et al 2013 Weil et al 2002) A similar trend was
also observed for the B0 values (Table 45) Nevertheless the time delay of 538 days
was noticed for the mono-digestion of Untreated SCB Both these results indicate that
although the hydrolysis rate was slightly better the effect of time delay caused methane
production to follow the same trend as in the case of Untreated SCT assays (Figure 49)
The Pre-treated SCB also followed the same trend as that of the Pre-treated SCT It was
noticed that the khyd values increased with the increase in CM amount (Table 45)
Similarly a higher rate of hydrolysis was observed with an increase in CM content
Ultimate methane production for Pre-treated SCB also followed the same trend as that
of Pre-treated SCT B0 value decreased with the increase in CM content resulting in
faster hydrolysis but lower methane production towards the end of the experimental run
Chapter 4 Results and Discussions
91
Figure 49 Comparison of first-order (∆ - Untreated SCB and ndash Pre-treated SCB)
and modified Gompertz kinetic model ( ndash Untreated SCB and ndash Pre-treated SCB)
predictions with experimental cumulative methane yield (ndash) for different co-digestion
ratios of SCB with CM
Chapter 4 Results and Discussions
92
Modified Gompertz model uses three parameters for the prediction of methane
production from the assays Maximum methane potential of the assay (B0) specific rate
constant (Rm) and the lag phase (λ) (Nielfa et al 2015) The maximum methane
potential of Untreated SCT assays decreased with an increase in CM content (Table 45)
The specific rate constant and lag phase for the different feed ratios of Untreated SCT
were 712 623 648 858 and 264 128 122 198 respectively for the feed ratio of
1000 7525 5050 2575
A similar trend was also noticed with Pre-treated SCT (Table 45) B0 value decreased
with an increase in CM amount This resulted in lower methane production towards the
end of the experimental run (Figure 47) Rm also showed a decreasing trend with an
increase in CM amount The higher value of Rm will result in a faster rate of methane
production (Xie et al 2016) This in turn can be observed in terms of faster hydrolysis
for the Pre-treated SCT assays than the Untreated SCT assays at the same feed ratio
From Table 45 it can be noticed that Untreated SCB assays also followed the same
trend for B0 when the modified Gompertz model was applied B0 decreased with an
increase in the amount of CM Thus a high amount of SCB will lead to increased
methane production Rm values showed a decreasing trend until the feed ratio of 5050
for Untreated SCBCM Thereafter an increase in Rm values was noticed
Similar to that of the first-order model a significant lag phase was evident for the
mono-digestion of Untreated SCB The lag phase also followed the same trend as that of
the methane production rate (Table 45) For Pre-treated SCB assays a decrease in B0
values was noticed with an increase in CM amount On the other hand Rm and λ
showed a decreasing trend till 7525 feed ratio and thereafter it increased steadily as the
amount of CM increased The low B0 noticed at higher CM amount resulted in low
methane production at the end of the experimental run Thus we can conclude that
Chapter 4 Results and Discussions
93
different co-digestion ratios for both SCT and SCB with and without steam explosion
pre-treatment had a profound influence on both methane production and its rate of
production
Chapter 4 Results and Discussions
94
1
Chapter 5 Conclusions and Future works
95
Chapter 5 Conclusions and Future Works
Chapter 5 Conclusions and Future works
96
Chapter 5 Conclusions and Future works
97
51 Conclusion to this research work
The effect of feed ratio and pre-treatment on methane yields during anaerobic co-digestion of
sugarcane trash and bagasse was investigated in this study Chemical analysis shows that pre-
treatment of lignocellulosic substrates viz SCT and SCB had a profound effect Steam explosion
pre-treatment helped to break the complex lignocellulosic substrates and thus resulted in faster
and higher methane yields among the pre-treated substrates
BMP analysis of both SCT and SCB proved that a faster rate of production of biogas was
evident in all feed ratios for both substrates Even though the final methane yields are within the
comparable range the initial faster rate of methane production provides an opportunity to
implement a lower HRT among pre-treated substrates when compared to the untreated
substrates Results showed that about 75 of the total yield was obtained within the first 11
days in the case of pre-treated substrates whereas it took almost 45 days for the untreated
substrates to produce similar yields This implies that using pre-treated substrates can improve
net productivity by at least four times Thus the methane yield can be increased by about four
times if pre-treated substrates instead of untreated substrates
Considering the HRT of the reactor as 11 days pre-treated substrates had a clear advantage over
the untreated substrates (both SCT and SCB) in all the tested feed ratios and mono-digestion of
SCT and SCB An improvement of 156 122 83 and 37 was observed as a result of pre-
treatment among 1000 7525 5050 and 2575 ratios of SCT on day 11 The corresponding
improvement observed in SCB assays were 120 54 39 and 9 respectively
Among the different feed ratios tested for both untreated and pre-treated SCT and SCB an
overall improvement in methane yields with the addition of chicken manure was not observed
The cumulative methane yields were reduced with the addition of chicken manure which
implies that the addition of chicken manure had a negative impact on cumulative methane yields
However with the addition of chicken manure the amount of carbon molecules is considerably
reduced as the same VS was maintained among all co-digestion assays This caused a reduction
in methane yield from the co-digestion mixture Synergistic studies were done in this research
Chapter 5 Conclusions and Future works
98
work to investigate whether co-digestion improved the synergism of the mixture The effect of
co-digestion was analysed by comparing the expected methane yields from the same amount of
VS content of the sole substrates digested separately and the methane yields produced from the
co-digestion mixture with the same VS content Synergism was observed among most of the co-
digestion mixtures which show co-digestion has a positive effect However the reduction of
carbon contents due to lesser carbon molecules being fed to the reactors resulted in a lesser yield
with the addition of chicken manure
Among the tested feed ratios addition of chicken manure helped to achieve a positive
synergism in all assays except 7525 and 5050 ratio of untreated SCTCM The only feed ratio
that had a synergistic effect in untreated SCTCM was 2575 ratio and was observed to be
318 Among pre-treated SCT assays the percentage improvement in cumulative methane
based on synergistic studies was 1196 477 and 281 among the 7525 5050 and 2575
ratios respectively Similar improvement observed in untreated SCB and pre-treated SCB were
390 853 1857 and 078 213 902 respectively for 7525 5050 and 2575 ratios An
improvement based on synergistic studies implies that the co-digestion helped in increasing the
methane yield from the same amount of VS from substrates digested separately
Mathematical modelling was done for all the batch assays using the first-order kinetic model
and the modified Gompertz model and different associated parameters were analysed It was
observed that time delay could be considerably reduced in the case of pre-treated substrates
when compared to the untreated substrates Both models produced a higher rate of methane
yield while using pre-treated substrates Anaerobic biodegradability post BMP analysis and
statistical analysis were also done in this research work to substantiate the results obtained in
this research The BMP analysis done to study the effect of co-digestion ratios of sugarcane
wastes with chicken manure opens up an opportunity to facilitate an efficient utilisation
technique for both SCTSCB and CM Further research works with different ISR ratios and
continuous type reactors need to be done to study how the feed ratios behave in such a reactor
before commercialising this technique
Chapter 5 Conclusions and Future works
99
52 Related future research works
Testing of different ISR ratios to study the effect of feed ratio and co-digestion of
SCTSCB with CM
Testing different feed ratios of co-digesting SCTSCB with CM on a continuous type
CSTR reactor to conduct a scale down lab-scale study of the commercial plant
Testing the effect of feed ratio and co-digestion of SCTSCB with CM within different
incubation temperatures
100
101
APPENDIX 1
Statistical analysis of Untreated SCT with CM
The statistical significance of the mono-digestion of Untreated SCT along with the
different co-digestion mixtures of Untreated SCT with CM is analysed in this section
Various statistical parameters within the group of mono-digesting and co-digesting
Untreated SCT with CM are as follows
Descriptives
Methane Yields
N Mean
Std
Deviation
Std
Error
95 Confidence Interval
for Mean
Minimum MaximumLower Bound
Upper
Bound
100USCT +
0CM
3 2017333 223010 128755 1961935 2072732 19920 20340
75USCT +
25CM
3 1791000 34641 20000 1782395 1799605 17890 17950
50USCT +
50CM
3 1581667 85049 49103 1560539 1602794 15730 15900
25USCT +
75CM
3 1413000 338674 195533 1328869 1497131 13750 14400
0USCT +
100CM
3 1153333 87369 50442 1131630 1175037 11460 11630
Total 15 1591267 3092455 798468 1420012 1762521 11460 20340
Test of Homogeneity of Variances
Levene Statistic df1 df2 Sig
Methane Yields Based on Mean 4590 4 10 023
Based on Median 938 4 10 481
102
Based on Median and with
adjusted df
938 4 4174 521
Based on trimmed mean 4144 4 10 031
ANOVA
Methane Yields
Sum of Squares df Mean Square F Sig
Between Groups 13352489 4 3338122 924688 000
Within Groups 36100 10 3610
Total 13388589 14
Multiple Comparisons
Dependent Variable Methane Yields
(I) treatment (J) treatment
Mean
Difference (I-
J) Std Error Sig
95 Confidence Interval
Lower
Bound
Upper
Bound
Tukey
HSD
100USCT
+ 0CM
75USCT +
25CM
2263333 155134 000 175277 277389
50USCT +
50CM
4356667 155134 000 384611 486723
25USCT +
75CM
6043333 155134 000 553277 655389
0USCT +
100CM
8640000 155134 000 812944 915056
75USCT +
25CM
100USCT +
0CM
-2263333 155134 000 -277389 -175277
50USCT +
50CM
2093333 155134 000 158277 260389
25USCT +
75CM
3780000 155134 000 326944 429056
0USCT +
100CM
6376667 155134 000 586611 688723
103
50USCT +
50CM
100USCT +
0CM
-4356667 155134 000 -486723 -384611
75USCT +
25CM
-2093333 155134 000 -260389 -158277
25USCT +
75CM
1686667 155134 000 117611 219723
0USCT +
100CM
4283333 155134 000 377277 479389
25USCT +
75CM
100USCT +
0CM
-6043333 155134 000 -655389 -553277
75USCT +
25CM
-3780000 155134 000 -429056 -326944
50USCT +
50CM
-1686667 155134 000 -219723 -117611
0USCT +
100CM
2596667 155134 000 208611 310723
0USCT +
100CM
100USCT +
0CM
-8640000 155134 000 -915056 -812944
75USCT +
25CM
-6376667 155134 000 -688723 -586611
50USCT +
50CM
-4283333 155134 000 -479389 -377277
25USCT +
75CM
-2596667 155134 000 -310723 -208611
LSD 100USCT
+ 0CM
75USCT +
25CM
2263333 155134 000 191767 260899
50USCT +
50CM
4356667 155134 000 401101 470233
25USCT +
75CM
6043333 155134 000 569767 638899
0USCT +
100CM
8640000 155134 000 829434 898566
75USCT +
25CM
100USCT +
0CM
-2263333 155134 000 -260899 -191767
104
50USCT +
50CM
2093333 155134 000 174767 243899
25USCT +
75CM
3780000 155134 000 343434 412566
0USCT +
100CM
6376667 155134 000 603101 672233
50USCT +
50CM
100USCT +
0CM
-4356667 155134 000 -470233 -401101
75USCT +
25CM
-2093333 155134 000 -243899 -174767
25USCT +
75CM
1686667 155134 000 134101 203233
0USCT +
100CM
4283333 155134 000 393767 462899
25USCT +
75CM
100USCT +
0CM
-6043333 155134 000 -638899 -569767
75USCT +
25CM
-3780000 155134 000 -412566 -343434
50USCT +
50CM
-1686667 155134 000 -203233 -134101
0USCT +
100CM
2596667 155134 000 225101 294233
0USCT +
100CM
100USCT +
0CM
-8640000 155134 000 -898566 -829434
75USCT +
25CM
-6376667 155134 000 -672233 -603101
50USCT +
50CM
-4283333 155134 000 -462899 -393767
25USCT +
75CM
-2596667 155134 000 -294233 -225101
Dunnett
t (2-sided)b
100USCT
+ 0CM
0USCT +
100CM
8640000 155134 000 819159 908841
75USCT +
25CM
0USCT +
100CM
6376667 155134 000 592825 682508
105
50USCT +
50CM
0USCT +
100CM
4283333 155134 000 383492 473175
25USCT +
75CM
0USCT +
100CM
2596667 155134 000 214825 304508
The mean difference is significant at the 005 level
b Dunnett t-tests treat one group as a control and compare all other groups against it
106
APPENDIX2
Statistical analysis of Pre-treated SCT with CM
The statistical significance of the mono-digestion of Pre-treated SCT along with the
different co-digestion mixtures of Pre-treated SCT with CM is analysed in this section
Various statistical parameters within the group of mono-digesting and co-digesting Pre-
treated SCT with CM are as follows
Descriptives
Methane Yields
N Mean
Std
Deviation
Std
Error
95 Confidence Interval
for Mean
Minimum Maximum
Lower
Bound
Upper
Bound
100PSCT +
0CM
3 2075000 629603 363501 1918598 2231402 20050 21270
75PSCT +
25CM
3 2065000 580259 335012 1920856 2209144 20310 21320
50PSCT +
50CM
3 1691000 272213 157162 1623379 1758621 16600 17110
25PSCT +
75CM
3 1422667 250067 144376 1360547 1484787 13980 14480
0PSCT +
100CM
3 1153333 87369 50442 1131630 1175037 11460 11630
Total 15 1681400 3743018 966443 1474119 1888681 11460 21320
Test of Homogeneity of Variances
Levene Statistic df1 df2 Sig
Methane Yields Based on Mean 3425 4 10 052
Based on Median 501 4 10 736
107
Based on Median and with
adjusted df
501 4 4789 739
Based on trimmed mean 3020 4 10 071
ANOVA
Methane Yields
Sum of Squares df Mean Square F Sig
Between Groups 19438783 4 4859696 276948 000
Within Groups 175473 10 17547
Total 19614256 14
Multiple Comparisons
Dependent Variable Methane Yields
(I) treatment (J) treatment
Mean
Difference (I-
J) Std Error Sig
95 Confidence Interval
Lower
Bound
Upper
Bound
Tukey
HSD
100PSCT
+ 0CM
75PSCT +
25CM
100000 342027 998 -102564 122564
50PSCT +
50CM
3840000 342027 000 271436 496564
25PSCT +
75CM
6523333 342027 000 539770 764897
0PSCT +
100CM
9216667 342027 000 809103 1034230
75PSCT +
25CM
100PSCT +
0CM
-100000 342027 998 -122564 102564
50PSCT +
50CM
3740000 342027 000 261436 486564
25PSCT +
75CM
6423333 342027 000 529770 754897
108
0PSCT +
100CM
9116667 342027 000 799103 1024230
50PSCT +
50CM
100PSCT +
0CM
-3840000 342027 000 -496564 -271436
75PSCT +
25CM
-3740000 342027 000 -486564 -261436
25PSCT +
75CM
2683333 342027 000 155770 380897
0PSCT +
100CM
5376667 342027 000 425103 650230
25PSCT +
75CM
100PSCT +
0CM
-6523333 342027 000 -764897 -539770
75PSCT +
25CM
-6423333 342027 000 -754897 -529770
50PSCT +
50CM
-2683333 342027 000 -380897 -155770
0PSCT +
100CM
2693333 342027 000 156770 381897
0PSCT +
100CM
100PSCT +
0CM
-9216667 342027 000 -1034230 -809103
75PSCT +
25CM
-9116667 342027 000 -1024230 -799103
50PSCT +
50CM
-5376667 342027 000 -650230 -425103
25PSCT +
75CM
-2693333 342027 000 -381897 -156770
LSD 100PSCT
+ 0CM
75PSCT +
25CM
100000 342027 776 -66208 86208
50PSCT +
50CM
3840000 342027 000 307792 460208
25PSCT +
75CM
6523333 342027 000 576125 728542
0PSCT +
100CM
9216667 342027 000 845458 997875
109
75PSCT +
25CM
100PSCT +
0CM
-100000 342027 776 -86208 66208
50PSCT +
50CM
3740000 342027 000 297792 450208
25PSCT +
75CM
6423333 342027 000 566125 718542
0PSCT +
100CM
9116667 342027 000 835458 987875
50PSCT +
50CM
100PSCT +
0CM
-3840000 342027 000 -460208 -307792
75PSCT +
25CM
-3740000 342027 000 -450208 -297792
25PSCT +
75CM
2683333 342027 000 192125 344542
0PSCT +
100CM
5376667 342027 000 461458 613875
25PSCT +
75CM
100PSCT +
0CM
-6523333 342027 000 -728542 -576125
75PSCT +
25CM
-6423333 342027 000 -718542 -566125
50PSCT +
50CM
-2683333 342027 000 -344542 -192125
0PSCT +
100CM
2693333 342027 000 193125 345542
0PSCT +
100CM
100PSCT +
0CM
-9216667 342027 000 -997875 -845458
75PSCT +
25CM
-9116667 342027 000 -987875 -835458
50PSCT +
50CM
-5376667 342027 000 -613875 -461458
25PSCT +
75CM
-2693333 342027 000 -345542 -193125
100PSCT
+ 0CM
0PSCT +
100CM
9216667 342027 000 822805 1020529
110
Dunnett
t (2-
sided)b
75PSCT +
25CM
0PSCT +
100CM
9116667 342027 000 812805 1010529
50PSCT +
50CM
0PSCT +
100CM
5376667 342027 000 438805 636529
25PSCT +
75CM
0PSCT +
100CM
2693333 342027 000 170471 368195
The mean difference is significant at the 005 level
b Dunnett t-tests treat one group as a control and compare all other groups against it
111
APPENDIX 3
Statistical analysis of Untreated SCB with CM
The statistical significance of the mono-digestion of Untreated SCB along with the
different co-digestion mixtures of Untreated SCB with CM is analysed in this section
Various statistical parameters within the group of mono-digesting and co-digesting
Untreated SCB with CM are as follows
Descriptives
Methane Yields
N Mean
Std
Deviation
Std
Error
95 Confidence Interval
for Mean
Minimum Maximum
Lower
Bound
Upper
Bound
100USCB +
0CM
3 1990000 481248 277849 1870451 2109549 19400 20360
75USCB +
25CM
3 1850333 221209 127715 1795382 1905285 18270 18710
50USCB +
50CM
3 1705667 51316 29627 1692919 1718414 17000 17100
25USCB +
75CM
3 1615333 187172 108064 1568837 1661829 15940 16290
0USCB +
100CM
3 1153333 87369 50442 1131630 1175037 11460 11630
Total 15 1662933 2957005 763495 1499180 1826687 11460 20360
Test of Homogeneity of Variances
Levene Statistic df1 df2 Sig
Methane Yields Based on Mean 2387 4 10 121
Based on Median 1518 4 10 269
112
Based on Median and
with adjusted df
1518 4 4354 339
Based on trimmed mean 2332 4 10 127
ANOVA
Methane Yields
Sum of Squares df Mean Square F Sig
Between Groups 12176263 4 3044066 467120 000
Within Groups 65167 10 6517
Total 12241429 14
Multiple Comparisons
Dependent Variable Methane Yields
(I) treatment (J) treatment
Mean
Difference (I-J) Std Error Sig
95 Confidence Interval
Lower
Bound
Upper
Bound
Tukey
HSD
100USCB
+ 0CM
75USCB +
25CM
1396667 208433 000 71070 208264
50USCB +
50CM
2843333 208433 000 215736 352930
25USCB +
75CM
3746667 208433 000 306070 443264
0USCB +
100CM
8366667 208433 000 768070 905264
75USCB +
25CM
100USCB +
0CM
-1396667 208433 000 -208264 -71070
50USCB +
50CM
1446667 208433 000 76070 213264
25USCB +
75CM
2350000 208433 000 166403 303597
113
0USCB +
100CM
6970000 208433 000 628403 765597
50USCB +
50CM
100USCB +
0CM
-2843333 208433 000 -352930 -215736
75USCB +
25CM
-1446667 208433 000 -213264 -76070
25USCB +
75CM
903333 208433 000 21736 158930
0USCB +
100CM
5523333 208433 000 483736 620930
25USCB +
75CM
100USCB +
0CM
-3746667 208433 000 -443264 -306070
75USCB +
25CM
-2350000 208433 000 -303597 -166403
50USCB +
50CM
-903333 208433 000 -158930 -21736
0USCB +
100CM
4620000 208433 000 393403 530597
0USCB +
100CM
100USCB +
0CM
-8366667 208433 000 -905264 -768070
75USCB +
25CM
-6970000 208433 000 -765597 -628403
50USCB +
50CM
-5523333 208433 000 -620930 -483736
25USCB +
75CM
-4620000 208433 000 -530597 -393403
LSD 100USCB
+ 0CM
75USCB +
25CM
1396667 208433 000 93225 186109
50USCB +
50CM
2843333 208433 000 237891 330775
25USCB +
75CM
3746667 208433 000 328225 421109
0USCB +
100CM
8366667 208433 000 790225 883109
114
75USCB +
25CM
100USCB +
0CM
-1396667 208433 000 -186109 -93225
50USCB +
50CM
1446667 208433 000 98225 191109
25USCB +
75CM
2350000 208433 000 188558 281442
0USCB +
100CM
6970000 208433 000 650558 743442
50USCB +
50CM
100USCB +
0CM
-2843333 208433 000 -330775 -237891
75USCB +
25CM
-1446667 208433 000 -191109 -98225
25USCB +
75CM
903333 208433 000 43891 136775
0USCB +
100CM
5523333 208433 000 505891 598775
25USCB +
75CM
100USCB +
0CM
-3746667 208433 000 -421109 -328225
75USCB +
25CM
-2350000 208433 000 -281442 -188558
50USCB +
50CM
-903333 208433 000 -136775 -43891
0USCB +
100CM
4620000 208433 000 415558 508442
0USCB +
100CM
100USCB +
0CM
-8366667 208433 000 -883109 -790225
75USCB +
25CM
-6970000 208433 000 -743442 -650558
50USCB +
50CM
-5523333 208433 000 -598775 -505891
25USCB +
75CM
-4620000 208433 000 -508442 -415558
100USCB
+ 0CM
0USCB +
100CM
8366667 208433 000 776419 896914
115
Dunnett
t (2-
sided)b
75USCB +
25CM
0USCB +
100CM
6970000 208433 000 636753 757247
50USCB +
50CM
0USCB +
100CM
5523333 208433 000 492086 612581
25USCB +
75CM
0USCB +
100CM
4620000 208433 000 401753 522247
The mean difference is significant at the 005 level
b Dunnett t-tests treat one group as a control and compare all other groups against it
116
APPENDIX 4
Statistical analysis of Pre-treated SCB with CM
The statistical significance of the mono-digestion of Pre-treated SCB along with the
different co-digestion mixtures of Pre-treated SCB with CM is analysed in this section
Various statistical parameters within the group of mono-digesting and co-digesting Pre-
treated SCB with CM are as follows
Descriptives
Methane Yields
N Mean
Std
Deviation
Std
Error
95 Confidence Interval
for Mean
Minimum Maximum
Lower
Bound
Upper
Bound
100PSCB +
0CM
3 2255667 539290 311359 2121700 2389634 21940 22940
75PSCB +
25CM
3 1995667 427239 246667 1889535 2101799 19470 20270
50PSCB +
50CM
3 1740333 234592 135442 1682057 1798609 17140 17590
25PSCB +
75CM
3 1557667 281129 162310 1487830 1627503 15390 15900
0PSCB +
100CM
3 1153333 87369 50442 1131630 1175037 11460 11630
Total 15 1740533 3908233 1009101 1524103 1956964 11460 22940
Test of Homogeneity of Variances
Levene Statistic df1 df2 Sig
Methane Yields Based on Mean 3311 4 10 057
Based on Median 407 4 10 800
117
Based on Median and with
adjusted df
407 4 5808 798
Based on trimmed mean 2841 4 10 082
ANOVA
Methane Yields
Sum of Squares df Mean Square F Sig
Between Groups 21260984 4 5315246 432087 000
Within Groups 123013 10 12301
Total 21383997 14
Multiple Comparisons
Dependent Variable Methane Yields
(I) treatment (J) treatment
Mean
Difference (I-J) Std Error Sig
95 Confidence Interval
Lower
Bound
Upper
Bound
Tukey
HSD
100PSCB
+ 0CM
75PSCB +
25CM
2600000 286372 000 165753 354247
50PSCB +
50CM
5153333 286372 000 421086 609581
25PSCB +
75CM
6980000 286372 000 603753 792247
0PSCB +
100CM
11023333 286372 000 1008086 1196581
75PSCB +
25CM
100PSCB
+ 0CM
-2600000 286372 000 -354247 -165753
50PSCB +
50CM
2553333 286372 000 161086 349581
25PSCB +
75CM
4380000 286372 000 343753 532247
118
0PSCB +
100CM
8423333 286372 000 748086 936581
50PSCB +
50CM
100PSCB
+ 0CM
-5153333 286372 000 -609581 -421086
75PSCB +
25CM
-2553333 286372 000 -349581 -161086
25PSCB +
75CM
1826667 286372 000 88419 276914
0PSCB +
100CM
5870000 286372 000 492753 681247
25PSCB +
75CM
100PSCB
+ 0CM
-6980000 286372 000 -792247 -603753
75PSCB +
25CM
-4380000 286372 000 -532247 -343753
50PSCB +
50CM
-1826667 286372 000 -276914 -88419
0PSCB +
100CM
4043333 286372 000 310086 498581
0PSCB +
100CM
100PSCB
+ 0CM
-11023333 286372 000 -1196581 -1008086
75PSCB +
25CM
-8423333 286372 000 -936581 -748086
50PSCB +
50CM
-5870000 286372 000 -681247 -492753
25PSCB +
75CM
-4043333 286372 000 -498581 -310086
LSD 100PSCB
+ 0CM
75PSCB +
25CM
2600000 286372 000 196192 323808
50PSCB +
50CM
5153333 286372 000 451526 579141
25PSCB +
75CM
6980000 286372 000 634192 761808
0PSCB +
100CM
11023333 286372 000 1038526 1166141
119
75PSCB +
25CM
100PSCB
+ 0CM
-2600000 286372 000 -323808 -196192
50PSCB +
50CM
2553333 286372 000 191526 319141
25PSCB +
75CM
4380000 286372 000 374192 501808
0PSCB +
100CM
8423333 286372 000 778526 906141
50PSCB +
50CM
100PSCB
+ 0CM
-5153333 286372 000 -579141 -451526
75PSCB +
25CM
-2553333 286372 000 -319141 -191526
25PSCB +
75CM
1826667 286372 000 118859 246474
0PSCB +
100CM
5870000 286372 000 523192 650808
25PSCB +
75CM
100PSCB
+ 0CM
-6980000 286372 000 -761808 -634192
75PSCB +
25CM
-4380000 286372 000 -501808 -374192
50PSCB +
50CM
-1826667 286372 000 -246474 -118859
0PSCB +
100CM
4043333 286372 000 340526 468141
0PSCB +
100CM
100PSCB
+ 0CM
-11023333 286372 000 -1166141 -1038526
75PSCB +
25CM
-8423333 286372 000 -906141 -778526
50PSCB +
50CM
-5870000 286372 000 -650808 -523192
25PSCB +
75CM
-4043333 286372 000 -468141 -340526
100PSCB
+ 0CM
0PSCB +
100CM
11023333 286372 000 1019558 1185109
120
Dunnett
t (2-
sided)b
75PSCB +
25CM
0PSCB +
100CM
8423333 286372 000 759558 925109
50PSCB +
50CM
0PSCB +
100CM
5870000 286372 000 504225 669775
25PSCB +
75CM
0PSCB +
100CM
4043333 286372 000 321558 487109
The mean difference is significant at the 005 level
b Dunnett t-tests treat one group as a control and compare all other groups against it
121
REFERENCES
Abouelenien F Kitamura Y Nishio N amp Nakashimada Y (2009) Dry anaerobic ammoniandashmethane production from chicken manure Applied microbiology and biotechnology82(4) 757-764
Abouelenien F Namba Y Kosseva M R Nishio N amp Nakashimada Y (2014) Enhancementof methane production from co-digestion of chicken manure with agricultural wastesBioresource technology 159 80-87doihttpsdoiorg101016jbiortech201402050
Ağdağ O N amp Sponza D T (2007) Co-digestion of mixed industrial sludge with municipal solidwastes in anaerobic simulated landfilling bioreactors Journal of Hazardous Materials140(1-2) 75-85
Aichinger P Wadhawan T Kuprian M Higgins M Ebner C Fimml C Wett B (2015)Synergistic co-digestion of solid-organic-waste and municipal-sewage-sludge 1 plus 1equals more than 2 in terms of biogas production and solids reductionWater Research87 416-423 doihttpsdoiorg101016jwatres201507033
Angelidaki I Alves M Bolzonella D Borzacconi L Campos J Guwy A Van Lier J(2009) Defining the biomethane potential (BMP) of solid organic wastes and energycrops a proposed protocol for batch assaysWater Science and Technology 59(5) 927-934
Anwar Z Gulfraz M amp Irshad M (2014) Agro-industrial lignocellulosic biomass a key tounlock the future bio-energy A brief review Journal of Radiation Research and AppliedSciences 7(2) 163-173 doihttpsdoiorg101016jjrras201402003
APHA A (1995) WPCF Standard methods for the examination of water and wastewaterAmerican Public Health Association Washington DC
ASMC (2019) Australian sugar milling council Retrieved from httpsasmccomau
Barakat A de Vries H amp Rouau X (2013) Dry fractionation process as an important step incurrent and future lignocellulose biorefineries A review Bioresource technology 134362-373 doihttpsdoiorg101016jbiortech201301169
Bauer A Boumlsch P Friedl A amp Amon T (2009) Analysis of methane potentials of steam-exploded wheat straw and estimation of energy yields of combined ethanol andmethane production Journal of Biotechnology 142(1) 50-55doihttpsdoiorg101016jjbiotec200901017
122
Bauer A Lizasoain J Theuretzbacher F Agger J W Rincoacuten M Menardo S PotthastA (2014a) Steam explosion pretreatment for enhancing biogas production of lateharvested hay Bioresource technology 166 403-410
Bauer A Lizasoain J Theuretzbacher F Agger J W Rincoacuten M Menardo S Horn S J(2014b) Steam explosion pretreatment for enhancing biogas production of lateharvested hay Bioresource technology 166 403-410doihttpsdoiorg101016jbiortech201405025
Beckett N M Cresswell S L Grice D I amp Carter J F (2015) Isotopic profiling of seizedbenzylpiperazine and trifluoromethylphenylpiperazine tablets using δ13C and δ15Nstable isotopes Science amp Justice 55(1) 51-56doihttpsdoiorg101016jscijus201408003
Bolado-Rodriacuteguez S Toquero C Martiacuten-Juaacuterez J Travaini R amp Garciacutea-Encina P A (2016)Effect of thermal acid alkaline and alkaline-peroxide pretreatments on the biochemicalmethane potential and kinetics of the anaerobic digestion of wheat straw and sugarcanebagasse Bioresource technology 201 182-190doihttpsdoiorg101016jbiortech201511047
Brown D Shi J amp Li Y (2012) Comparison of solid-state to liquid anaerobic digestion oflignocellulosic feedstocks for biogas production Bioresource technology 124 379-386doihttpsdoiorg101016jbiortech201208051
Bruni E Jensen A P Pedersen E S amp Angelidaki I (2010) Anaerobic digestion of maizefocusing on variety harvest time and pretreatment Applied Energy 87(7) 2212-2217doihttpsdoiorg101016japenergy201001004
Caramiello C Lancellotti I Righi F Tatagraveno F Taurino R amp Barbieri L (2013) Anaerobicdigestion of selected Italian agricultural and industrial residues (grape seeds and leatherdust) Combined methane production and digestate characterization EnvironmentalTechnology 34 1225-1237 doi101080095933302012743597
CEC (2019) Clean Energy Council Retrieved from httpswwwcleanenergycouncilorgau
Cerri C C Galdos M V Maia S M F Bernoux M Feigl B J Powlson D amp Cerri C E P(2011) Effect of sugarcane harvesting systems on soil carbon stocks in Brazil anexamination of existing data European Journal of Soil Science 62(1) 23-28doi101111j1365-2389201001315x
Chae K J Jang A Yim S K amp Kim I S (2008) The effects of digestion temperature andtemperature shock on the biogas yields from the mesophilic anaerobic digestion ofswine manure Bioresource technology 99(1) 1-6doihttpsdoiorg101016jbiortech200611063
Chandra R Takeuchi H amp Hasegawa T (2012) Methane production from lignocellulosicagricultural cropwastes A review in context to second generationof biofuel production
123
Renewable and Sustainable Energy Reviews 16(3) 1462-1476doihttpsdoiorg101016jrser201111035
Chen H Liu J Chang X Chen D Xue Y Liu P Han S (2017) A review on thepretreatment of lignocellulose for high-value chemicals Fuel Processing Technology160 196-206 doihttpsdoiorg101016jfuproc201612007
Chen Y Cheng J J amp Creamer K S (2008) Inhibition of anaerobic digestion process A reviewBioresource technology 99(10) 4044-4064doihttpsdoiorg101016jbiortech200701057
Cheng X-Y amp Zhong C (2014) Effects of Feed to Inoculum Ratio Co-digestion andPretreatment on Biogas Production from Anaerobic Digestion of Cotton Stalk Energy ampFuels 28(5) 3157-3166 doi101021ef402562z
Cherubini F (2010) The biorefinery concept using biomass instead of oil for producing energyand chemicals Energy Conversion and Management 51(7) 1412-1421
Datta R (1981) Acidogenic fermentation of corn stover Biotechnology and bioengineering23(1) 61-77 doi101002bit260230106
DAWR (2017 15092017) Department of Agriculture andWater Resources Senate inquiry intosugar marketing arrangements Retrieved from httpwwwagriculturegovauag-farm-foodcropssugar
Eggleston G Grisham M amp Antoine A (2009) Clarification Properties of Trash and StalkTissues from Sugar Cane (Vol 58)
Eskicioglu C Monlau F Barakat A Ferrer I Kaparaju P Trably E amp Carregravere H (2017)Assessment of hydrothermal pretreatment of various lignocellulosic biomass with CO2catalyst for enhanced methane and hydrogen production Water Research 120 32-42doihttpsdoiorg101016jwatres201704068
Estevez M M Linjordet R amp Morken J (2012) Effects of steam explosion and co-digestion inthe methane production from Salix by mesophilic batch assays Bioresource technology104 749-756 doihttpsdoiorg101016jbiortech201111017
FAO (2018) Food and Agriculture Organization of the United Nations Retrieved fromhttpwwwfaoorgfaostatendataQC
Fernandez S Srinivas K Schmidt A J Swita M S amp Ahring B K (2018) Anaerobic digestionof organic fraction from hydrothermal liquefied algae wastewater byproductBioresource technology 247 250-258doihttpsdoiorg101016jbiortech201709030
124
Ferreira L C Donoso-Bravo A Nilsen P J Fdz-Polanco F amp Peacuterez-Elvira S I (2013)Influence of thermal pretreatment on the biochemical methane potential of wheatstraw Bioresource technology 143 251-257doihttpsdoiorg101016jbiortech201305065
Gabov K Hemming J amp Fardim P (2017) Sugarcane bagasse valorization by fractionationusing a water-based hydrotropic process Industrial crops and products 108 495-504doihttpsdoiorg101016jindcrop201706038
Galbe M amp Zacchi G (2007) Pretreatment of Lignocellulosic Materials for Efficient BioethanolProduction In L Olsson (Ed) Biofuels (pp 41-65) Berlin Heidelberg Springer BerlinHeidelberg
George P Cabello Eras J Sagastume A Hens L amp Vandecasteele C (2010) Residue fromSugarcane Juice Filtration (Filter Cake) Energy Use at the Sugar Factory Waste andBiomass Valorization 1 407-413 doi101007s12649-010-9046-2
Gharpuray M M Lee Y-H amp Fan L T (1983) Structural modification of lignocellulosics bypretreatments to enhance enzymatic hydrolysis Biotechnology and bioengineering25(1) 157-172 doi101002bit260250113
Goacutemez E O Torres R De Souza G amp Jackson G (2014) Sugarcane trash a feedstock forsecond generation processes In Sugarcane Bioethanol-RampD for Productivity andSustainability
Gonzaacutelez-Fernaacutendez C Leoacuten-Cofreces C amp Garciacutea-Encina P A (2008) Differentpretreatments for increasing the anaerobic biodegradability in swine manureBioresource technology 99(18) 8710-8714doihttpsdoiorg101016jbiortech200804020
Gumisiriza R Hawumba J F Okure M amp Hensel O (2017) Biomass waste-to-energyvalorisation technologies a review case for banana processing in Uganda Biotechnologyfor Biofuels 10(1) 11 doi101186s13068-016-0689-5
Gumisiriza R Mshandete A M Rubindamayugi M S T Kansiime F amp Kivaisi A K (2009)Enhancement of anaerobic digestion of Nile perch fish processing wastewater AfricanJournal of Biotechnology 8(2)
Gunes B Stokes J Davis P Connolly C amp Lawler J (2019) Pre-treatments to enhancebiogas yield and quality from anaerobic digestion of whiskey distillery and brewerywastes A review Renewable and Sustainable Energy Reviews 113 109281doihttpsdoiorg101016jrser2019109281
Hagos K Zong J Li D Liu C amp Lu X (2017) Anaerobic co-digestion process for biogasproduction Progress challenges and perspectives Renewable and Sustainable EnergyReviews 76 1485-1496 doihttpsdoiorg101016jrser201611184
125
Harrison M D Zhang Z Shand K OrsquoHara I M Doherty W O S amp Dale J L (2013) Effectof pretreatment on saccharification of sugarcane bagasse by complex and simpleenzyme mixtures Bioresource technology 148 105-113doihttpsdoiorg101016jbiortech201308099
Hendriks A T W M amp Zeeman G (2009) Pretreatments to enhance the digestibility oflignocellulosic biomass Bioresource technology 100(1) 10-18doihttpsdoiorg101016jbiortech200805027
Huber H Thomm M Koumlnig H Thies G amp Stetter K O (1982) Methanococcusthermolithotrophicus a novel thermophilic lithotrophic methanogen Archives ofMicrobiology 132(1) 47-50
Isikgor F H amp Becer C R (2015) Lignocellulosic biomass a sustainable platform for theproduction of bio-based chemicals and polymers Polymer Chemistry 6(25) 4497-4559
Jackowiak D Bassard D Pauss A amp Ribeiro T (2011) Optimisation of a microwavepretreatment of wheat straw for methane production Bioresource technology 102(12)6750-6756 doihttpsdoiorg101016jbiortech201103107
Jackowiak D Frigon J C Ribeiro T Pauss A amp Guiot S (2011) Enhancing solubilisation andmethane production kinetic of switchgrass by microwave pretreatment Bioresourcetechnology 102(3) 3535-3540 doihttpsdoiorg101016jbiortech201011069
Jain N Bhatia A amp Pathak H (2014) Emission of air pollutants from crop residue burning inIndia Aerosol and Air Quality Research 14(1) 422-430
Janke L Leite A Nikolausz M Schmidt T Liebetrau J Nelles M amp Stinner W (2015)Biogas Production from Sugarcane Waste Assessment on Kinetic Challenges for ProcessDesigning (Vol 16)
Janke L McCabe B K Harris P Hill A Lee S Weinrich S Baillie C (2019) Ensilingfermentation reveals pre-treatment effects for anaerobic digestion of sugarcanebiomass An assessment of ensiling additives on methane potential Bioresourcetechnology 279 398-403 doihttpsdoiorg101016jbiortech201901143
Jensen C Rodriguez Guerrero J Karatzos S Olofsson G amp Iversen S (2017) Fundamentalsof Hydrofactiontrade Renewable crude oil from woodybiomass
Kafle G K Kim S H amp Sung K I (2012) Batch anaerobic co-digestion of Kimchi factory wastesilage and swine manure under mesophilic conditions Bioresource technology 124489-494 doihttpsdoiorg101016jbiortech201208066
Kainthola J Kalamdhad A S amp Goud V V (2019) A review on enhanced biogas productionfrom anaerobic digestion of lignocellulosic biomass by different enhancement
126
techniques Process Biochemistry 84 81-90doihttpsdoiorg101016jprocbio201905023
Kalamaras S D amp Kotsopoulos T A (2014) Anaerobic co-digestion of cattle manure andalternative crops for the substitution of maize in South Europe Bioresource technology172 68-75 doihttpsdoiorg101016jbiortech201409005
Kaparaju P amp Rintala J (2005) Anaerobic co-digestion of potato tuber and its industrial by-products with pig manure Resources Conservation and Recycling 43(2) 175-188doihttpsdoiorg101016jresconrec200406001
Kaparaju P amp Rintala J (2013) 17 - Generation of heat and power from biogas for stationaryapplications boilers gas engines and turbines combined heat and power (CHP) plantsand fuel cells In A Wellinger J Murphy amp D Baxter (Eds) The Biogas Handbook (pp404-427) Woodhead Publishing
Karthikeyan O P amp Visvanathan C (2013) Bio-energy recovery from high-solid organicsubstrates by dry anaerobic bio-conversion processes a review Reviews inEnvironmental Science and BioTechnology 12(3) 257-284 doi101007s11157-012-9304-9
Khanal S K (2011) Anaerobic biotechnology for bioenergy production principles andapplications John Wiley amp Sons
Kim J Park C Kim T-H Lee M Kim S Kim S-W amp Lee J (2003) Effects of variouspretreatments for enhanced anaerobic digestion with waste activated sludge Journalof bioscience and bioengineering 95(3) 271-275
Kim M Chowdhury M M I Nakhla G amp Keleman M (2017) Synergism of co-digestion offood wastes with municipal wastewater treatment biosolids Waste Management 61473-483 doihttpsdoiorg101016jwasman201610010
Knappert D Grethlein H amp Converse A (1980) Partial acid hydrolysis of cellulosic materialsas a pretreatment for enzymatic hydrolysis Biotechnology and bioengineering 22(7)1449-1463 doi101002bit260220711
Kothari R Pandey A Kumar S Tyagi V amp Tyagi S (2014) Different aspects of dry anaerobicdigestion for bio-energy An overview Renewable and Sustainable Energy Reviews 39174-195
Kryvoruchko V Machmuumlller A Bodiroza V Amon B amp Amon T (2009) Anaerobic digestionof by-products of sugar beet and starch potato processing Biomass and Bioenergy33(4) 620-627 doihttpsdoiorg101016jbiombioe200810003
127
Kumar P Barrett D M Delwiche M J amp Stroeve P (2009) Methods for Pretreatment ofLignocellulosic Biomass for Efficient Hydrolysis and Biofuel Production Industrial ampengineering chemistry research 48(8) 3713-3729 doi101021ie801542g
Lancellotti I Righi F Tatagraveno F Taurino R amp Barbieri L (2013) Anaerobic digestion ofselected Italian agricultural and industrial residues (grape seeds and leather dust)combined methane production and digestate characterization AU - Caramiello CEnvironmental Technology 34(10) 1225-1237 doi101080095933302012743597
Larsson S Palmqvist E Hahn-Haumlgerdal B Tengborg C Stenberg K Zacchi G amp NilvebrantN-O (1999) The generation of fermentation inhibitors during dilute acid hydrolysis ofsoftwood Enzyme and Microbial Technology 24(3) 151-159doihttpsdoiorg101016S0141-0229(98)00101-X
Latif M AMehta CM amp Batstone D J (2015) Low pH anaerobic digestion ofwaste activatedsludge for enhanced phosphorous release Water Research 81 288-293doihttpsdoiorg101016jwatres201505062
Latif M A Mehta C M amp Batstone D J (2017) Influence of low pH on continuous anaerobicdigestion of waste activated sludge Water Research 113 42-49doihttpsdoiorg101016jwatres201702002
Lee D H Behera S K Kim J W amp Park H-S (2009) Methane production potential ofleachate generated from Korean food waste recycling facilities a lab-scale studyWasteManagement 29(2) 876-882
Lee J (1997) Biological conversion of lignocellulosic biomass to ethanol Journal ofBiotechnology 56(1) 1-24 doihttpsdoiorg101016S0168-1656(97)00073-4
Li K Liu R Cui S Yu Q amp Ma R (2018a) Anaerobic co-digestion of animal manures withcorn stover or apple pulp for enhanced biogas production Renewable Energy 118 335-342 doihttpsdoiorg101016jrenene201711023
Li X Li L Zheng M Fu G amp Lar J S (2009) Anaerobic Co-Digestion of Cattle Manure withCorn Stover Pretreated by Sodium Hydroxide for Efficient Biogas Production Energy ampFuels 23(9) 4635-4639 doi101021ef900384p
Li Y Jin Y Li J Li H amp Yu Z (2016) Effects of thermal pretreatment on the biomethane yieldand hydrolysis rate of kitchen waste Applied Energy 172 47-58doihttpsdoiorg101016japenergy201603080
Li Y Zhang R Chen C Liu G He Y amp Liu X (2013) Biogas production from co-digestion ofcorn stover and chicken manure under anaerobic wet hemi-solid and solid stateconditions Bioresource technology 149 406-412doihttpsdoiorg101016jbiortech201309091
128
Li Y Zhang R He Y Zhang C Liu X Chen C amp Liu G (2014) Anaerobic co-digestion ofchicken manure and corn stover in batch and continuously stirred tank reactor (CSTR)Bioresource technology 156 342-347doihttpsdoiorg101016jbiortech201401054
Li Z Chen Z Ye H Wang Y Luo W Chang J-S He N (2018b) Anaerobic co-digestionof sewage sludge and food waste for hydrogen and VFA production with microbialcommunity analysis Waste Management 78 789-799doihttpsdoiorg101016jwasman201806046
Lim S-F amp Matu S U (2015) Utilization of agro-wastes to produce biofertilizer InternationalJournal of Energy and Environmental Engineering 6(1) 31-35 doi101007s40095-014-0147-8
Lindorfer H Loacutepez C P Resch C Braun R amp Kirchmayr R (2007) The impact of increasingenergy crop addition on process performance and residual methane potential inanaerobic digestion Water Science and Technology 56(10) 55-63doihttpdxdoiorg102166wst2007728
Linnenluecke M K Zhou C Smith T Thompson N amp Nucifora N (2019) The impact ofclimate change on the Australian sugarcane industry Journal of Cleaner Production118974 doihttpsdoiorg101016jjclepro2019118974
Liu C-f Yuan X-z Zeng G-m Li W-w amp Li J (2008) Prediction of methane yield atoptimum pH for anaerobic digestion of organic fraction of municipal solid wasteBioresource technology 99(4) 882-888
Liu L Sun J Cai C Wang S Pei H amp Zhang J (2009a) Corn stover pretreatment byinorganic salts and its effects on hemicellulose and cellulose degradation Bioresourcetechnology 100(23) 5865-5871 doihttpsdoiorg101016jbiortech200906048
Liu L Sun J Li M Wang S Pei H amp Zhang J (2009b) Enhanced enzymatic hydrolysis andstructural features of corn stover by FeCl3 pretreatment Bioresource technology100(23) 5853-5858 doihttpsdoiorg101016jbiortech200906040
Lizasoain J RincoacutenM Theuretzbacher F Enguiacutedanos R Nielsen P J Potthast A BauerA (2016) Biogas production from reed biomass Effect of pretreatment using differentsteam explosion conditions Biomass and Bioenergy 95 84-91
Lopez M J Vargas-Garciacutea M d C Suaacuterez-Estrella F Nichols N N Dien B S amp Moreno J(2007) Lignocellulose-degrading enzymes produced by the ascomycete Coniochaetaligniaria and related species Application for a lignocellulosic substrate treatmentEnzyme and Microbial Technology 40(4) 794-800doihttpsdoiorg101016jenzmictec200606012
Magarey R C Reynolds M Dominiak B C Sergeant E Agnew J Ward A amp Thompson N(2019) Review of sugarcane Fiji leaf gall disease in Australia and the declaration of pest
129
freedom in Central Queensland Crop Protection 121 113-120doihttpsdoiorg101016jcropro201903022
Mamimin C Prasertsan P Kongjan P amp O-Thong S (2017) Effects of volatile fatty acids inbiohydrogen effluent on biohythane production from palm oil mill effluent underthermophilic condition Electronic Journal of Biotechnology 29 78-85doihttpsdoiorg101016jejbt201707006
Maniet G Schmetz Q Jacquet N Temmerman M Gofflot S amp Richel A (2017) Effect ofsteam explosion treatment on chemical composition and characteristic of organosolvfescue lignin Industrial crops and products 99 79-85
Mao C Zhang T Wang X Feng Y Ren G amp Yang G (2017) Process performance andmethane production optimizing of anaerobic co-digestion of swine manure and cornstraw Scientific Reports 7(1) 9379 doi101038s41598-017-09977-6
Masih-Das J amp Tao W (2018) Anaerobic co-digestion of foodwaste with liquid dairy manureor manure digestate Co-substrate limitation and inhibition Journal of EnvironmentalManagement 223 917-924 doihttpsdoiorg101016jjenvman201807016
Mata-Aacutelvarez J (2002)Biomethanization of theOrganic Fraction ofMunicipal SolidWastes (Vol4)
Matheri A N Ndiweni S N Belaid M Muzenda E amp Hubert R (2017) Optimising biogasproduction from anaerobic co-digestion of chicken manure and organic fraction ofmunicipal solid waste Renewable and Sustainable Energy Reviews 80 756-764doihttpsdoiorg101016jrser201705068
Matheri A N Ntuli F Ngila J C Seodigeng T Zvinowanda C amp Njenga C K (2018)Quantitative characterization of carbonaceous and lignocellulosic biomass for anaerobicdigestion Renewable and Sustainable Energy Reviews 92 9-16doihttpsdoiorg101016jrser201804070
Menardo S Airoldi G amp Balsari P (2012) The effect of particle size and thermal pre-treatment on the methane yield of four agricultural by-products Bioresourcetechnology 104 708-714 doihttpsdoiorg101016jbiortech201110061
Menon V amp Rao M (2012) Trends in bioconversion of lignocellulose biofuels platformchemicals amp biorefinery concept Progress in energy and combustion science 38(4) 522-550
Mojiri A Aziz H A Zaman N Aziz S Q amp Hamidi A (2012) A Review on AnaerobicDigestion Bio-reactor and Nitrogen Removal fromWastewater and Landfill Leachate byBio-reactor Advances in Environmental Biology 6 2143-2150
Mokomele T da Costa Sousa L Balan V van Rensburg E Dale B E amp Goumlrgens J F (2019)
130
Incorporating anaerobic co-digestion of steam exploded or ammonia fiber expansionpretreated sugarcane residues with manure into a sugarcane-based bioenergy-livestocknexus Bioresource technology 272 326-336doihttpsdoiorg101016jbiortech201810049
Monlau F Barakat A Steyer J P amp Carrere H (2012) Comparison of seven types of thermo-chemical pretreatments on the structural features and anaerobic digestion of sunflowerstalks Bioresource technology 120 241-247doihttpsdoiorg101016jbiortech201206040
Moraiumls S Morag E Barak Y Goldman D Hadar Y Lamed R Bayer E A (2012)Deconstruction of lignocellulose into soluble sugars by native and designercellulosomesMBio 3(6) e00508-00512
Moset V Fontaine D amp Moslashller H B (2017) Co-digestion of cattle manure and grassharvested with different technologies Effect on methane yield digestate compositionand energy balance Energy 141 451-460doihttpsdoiorg101016jenergy201708068
Mosier N Wyman C Dale B Elander R Lee Y Y Holtzapple M amp Ladisch M (2005)Features of promising technologies for pretreatment of lignocellulosic biomassBioresource technology 96(6) 673-686doihttpsdoiorg101016jbiortech200406025
Murphy J Braun R Weiland P amp Wellinger A (2011) Biogas from crop digestion Paperpresented at the IEA bioenergy task
Nachiappan B Fu Z amp Holtzapple M T (2011) Ammonium carboxylate production fromsugarcane trash using long-term air-lime pretreatment followed by mixed-culturefermentation Bioresource technology 102(5) 4210-4217doihttpsdoiorg101016jbiortech201012059
Neshat S A Mohammadi M Najafpour G D amp Lahijani P (2017) Anaerobic co-digestion ofanimal manures and lignocellulosic residues as a potent approach for sustainable biogasproduction Renewable and Sustainable Energy Reviews 79 308-322doihttpsdoiorg101016jrser201705137
Nguyen T-A D Kim K-R Han S J Cho H Y Kim J W Park S M Sim S J (2010)Pretreatment of rice straw with ammonia and ionic liquid for lignocellulose conversionto fermentable sugars Bioresource technology 101(19) 7432-7438doihttpsdoiorg101016jbiortech201004053
Nielfa A Cano R amp Fdz-Polanco M (2015) Theoretical methane production generated by theco-digestion of organic fraction municipal solid waste and biological sludgeBiotechnology Reports 5 14-21 doihttpsdoiorg101016jbtre201410005
Oliveira I Gominho J Diberardino S amp Duarte E (2012) Characterization of Cynaracardunculus L stalks and their suitability for biogas production Industrial crops and
131
products 40 318-323 doihttpsdoiorg101016jindcrop201203029
Palmowski L M amp Muumlller J A (2000) Influence of the size reduction of organic waste on theiranaerobic digestion Water Science and Technology 41(3) 155-162doi102166wst20000067
Panigrahi S Sharma H B amp Dubey B K (2020) Anaerobic co-digestion of food waste withpretreated yard waste A comparative study of methane production kinetic modelingand energy balance Journal of Cleaner Production 243 118480doihttpsdoiorg101016jjclepro2019118480
Park Y-J Tsuno H Hidaka T amp Cheon J-H (2008) Evaluation of operational parameters inthermophilic acid fermentation of kitchen waste Journal of Material Cycles and WasteManagement 10(1) 46-52
Pasangulapati V Ramachandriya K Ajay K Wilkins M Jones C amp Huhnke R (2012) Effectsof cellulose hemicellulose and lignin on thermochemical conversion characteristics ofthe selected biomass Bioresource technology 114 663-669doi101016jbiortech201203036
Patil J H Raj M A Muralidhara P Desai S amp Raju G M (2012) Kinetics of anaerobicdigestion of water hyacinth using poultry litter as inoculum International Journal ofEnvironmental Science and Development 3(2) 94
Paudel S R Banjara S P Choi O K Park K Y Kim Y M amp Lee J W (2017) Pretreatmentof agricultural biomass for anaerobic digestion Current state and challengesBioresource technology 245 1194-1205doihttpsdoiorg101016jbiortech201708182
Paul S amp Dutta A (2018) Challenges and opportunities of lignocellulosic biomass for anaerobicdigestion Resources Conservation and Recycling 130 164-174
Rabelo S C Carrere H Maciel Filho R amp Costa A C (2011) Production of bioethanolmethane and heat from sugarcane bagasse in a biorefinery concept Bioresourcetechnology 102(17) 7887-7895 doihttpsdoiorg101016jbiortech201105081
Rainey T J amp Covey G (2016) Pulp and paper production from sugarcane bagasse InSugarcane-based Biofuels and Bioproducts (pp 259-280)
Ramirez J A amp Rainey T J (2019) Comparative techno-economic analysis of biofuelproduction through gasification thermal liquefaction and pyrolysis of sugarcanebagasse Journal of Cleaner Production 229 513-527doihttpsdoiorg101016jjclepro201905017
Renouf M A Pagan R J amp Wegener M K (2013) Bio-production from Australian sugarcanean environmental investigation of product diversification in an agro-industry Journal ofCleaner Production 39 87-96 doihttpsdoiorg101016jjclepro201208036
132
Rincoacuten B Rodriacuteguez-Gutieacuterrez G Bujalance L Fernaacutendez-Bolantildeos J amp Borja R (2016)Influence of a steam-explosion pre-treatment on the methane yield and kinetics ofanaerobic digestion of two-phase olive mil solid waste or alperujo Process Safety andEnvironmental Protection 102 361-369
Risberg K Sun L Leveacuten L Horn S J amp Schnuumlrer A (2013) Biogas production from wheatstraw and manure ndash Impact of pretreatment and process operating parametersBioresource technology 149 232-237doihttpsdoiorg101016jbiortech201309054
Rodriacuteguez G Rodriacuteguez R Jimeacutenez A Guilleacuten R amp Fernaacutendez-Bolantildeos J (2007) Effect ofSteam Treatment of Alperujo on the Composition Enzymatic Saccharification and inVitro Digestibility of Alperujo Journal of Agricultural and Food Chemistry 55(1) 136-142 doi101021jf0616513
Sahu O (2018) Assessment of sugarcane industry Suitability for production consumption andutilization Annals of Agrarian Science 16(4) 389-395doihttpsdoiorg101016jaasci201808001
Saidu M Yuzir A Salim M R Azman S amp Abdullah N (2014) Biological pre-treated oil palmmesocarp fibre with cattle manure for biogas production by anaerobic digestion duringacclimatization phase International Biodeterioration amp Biodegradation 95 189-194
Samayam I P amp Schall C A (2010) Saccharification of ionic liquid pretreated biomass withcommercial enzyme mixtures Bioresource technology 101(10) 3561-3566doihttpsdoiorg101016jbiortech200912066
Sambusiti C Ficara E Malpei F Steyer J P amp Carregravere H (2013) Effect of sodium hydroxidepretreatment on physical chemical characteristics and methane production of fivevarieties of sorghum Energy 55 449-456doihttpsdoiorg101016jenergy201304025
Sawatdeenarunat C Surendra K C Takara D Oechsner H amp Khanal S K (2015) Anaerobicdigestion of lignocellulosic biomass Challenges and opportunities Bioresourcetechnology 178 178-186 doihttpsdoiorg101016jbiortech201409103
Scherer P Neumann L Demirel B Schmidt O amp Unbehauen M (2009) Long termfermentation studies about the nutritional requirements for biogasification of fodderbeet silage as mono-substrate Biomass and Bioenergy 33 873-881doi101016jbiombioe200901011
Shen J Zhao C Liu Y Zhang R Liu G amp Chen C (2018) Biogas production from anaerobicco-digestion of durian shell with chicken dairy and pig manures Energy Conversion andManagement doihttpsdoiorg101016jenconman201806099
Si K (2016) Review Anaerobic Co-Digestion of Slaughterhouse Waste and Food and VegetableWaste Inhibition Factors and its Reverting Methods
133
Sluiter A Hames B Ruiz R Scarlata C Sluiter J Templeton D amp Crocker D (2008)Determination of Structural Carbohydrates and Lignin in BiomassmdashNRELTP-510-42618Laboratory Analytical Procedure (LAP)
Song Z amp Zhang C (2015) Anaerobic codigestion of pretreated wheat straw with cattlemanure and analysis of the microbial community Bioresource technology 186 128-135doihttpsdoiorg101016jbiortech201503028
Srisowmeya G Chakravarthy M amp Nandhini Devi G (2019) Critical considerations in two-stage anaerobic digestion of food waste ndash A review Renewable and Sustainable EnergyReviews 109587 doihttpsdoiorg101016jrser2019109587
Stelte W (2013) Steam explosion for biomass pre-treatment Danish Technological Institute
Sud D Mahajan G amp Kaur M P (2008) Agricultural waste material as potential adsorbentfor sequestering heavy metal ions from aqueous solutions ndash A review Bioresourcetechnology 99(14) 6017-6027 doihttpsdoiorg101016jbiortech200711064
Taherzadeh M J amp Karimi K (2008) Pretreatment of lignocellulosic wastes to improve ethanoland biogas production a review International journal of molecular sciences 9(9) 1621-1651 doi103390ijms9091621
Teghammar A Yngvesson J Lundin M Taherzadeh M J amp Horvaacuteth I S (2010)Pretreatment of paper tube residuals for improved biogas production Bioresourcetechnology 101(4) 1206-1212 doihttpsdoiorg101016jbiortech200909029
Thorburn P Horan H amp Biggs J (2004) The impact of trash management on sugarcaneproduction and nitrogen management a simulation study
Tsapekos P Kougias P G Treu L Campanaro S amp Angelidaki I (2017) Processperformance and comparative metagenomic analysis during co-digestion of manureand lignocellulosic biomass for biogas production Applied Energy 185 126-135doihttpsdoiorg101016japenergy201610081
van Lier J B Tilche A Ahring B K Macarie H Moletta R Dohanyos M Verstraete W(2001) New perspectives in anaerobic digestion Water Science and Technology 43(1)1-18 doi102166wst20010001
Vats N Khan A A amp Ahmad K (2019) Anaerobic co-digestion of thermal pre-treatedsugarcane bagasse using poultry waste Journal of Environmental Chemical Engineering7(5) 103323 doihttpsdoiorg101016jjece2019103323
Vervaeren H Hostyn K Ghekiere G amp Willems B (2010) Biological ensilage additives aspretreatment for maize to increase the biogas production Renewable Energy 35(9)2089-2093 doihttpsdoiorg101016jrenene201002010
Vivekanand V Mulat D G Eijsink V G H amp Horn S J (2018) Synergistic effects of anaerobic
134
co-digestion of whey manure and fish ensilage Bioresource technology 249 35-41doihttpsdoiorg101016jbiortech201709169
Vivekanand V Olsen E F Eijsink V G H amp Horn S J (2013) Effect of different steamexplosion conditions on methane potential and enzymatic saccharification of birchBioresource technology 127 343-349doihttpsdoiorg101016jbiortech201209118
Wagner A O Malin C Lins P amp Illmer P (2011) Effects of various fatty acid amendmentson a microbial digester community in batch culture Waste Management 31(3) 431-437 doihttpsdoiorg101016jwasman201010020
Wang D Shen F Yang G Zhang Y Deng S Zhang J Mei Z (2018) Can hydrothermalpretreatment improve anaerobic digestion for biogas from lignocellulosic biomassBioresource technology 249 117-124doihttpsdoiorg101016jbiortech201709197
Wang J Yue Z-B Chen T-H Peng S-C Yu H-Q amp Chen H-Z (2010) Anaerobicdigestibility and fiber composition of bulrush in response to steam explosionBioresource technology 101(17) 6610-6614doihttpsdoiorg101016jbiortech201003086
War A R Paulraj M G Ahmad T Buhroo A A Hussain B Ignacimuthu S amp Sharma H C(2012) Mechanisms of plant defense against insect herbivores Plant signaling ampbehavior 7(10) 1306-1320 doi104161psb21663
Ward A J Hobbs P J Holliman P J amp Jones D L (2008) Optimisation of the anaerobicdigestion of agricultural resources Bioresource technology 99(17) 7928-7940
Wei W Wang Q Zhang L Laloo A Duan H Batstone D J amp Yuan Z (2018) Free nitrousacid pre-treatment of waste activated sludge enhances volatile solids destruction andimproves sludge dewaterability in continuous anaerobic digestionWater Research 13013-19 doihttpsdoiorg101016jwatres201711050
Weil J R Dien B Bothast R Hendrickson R Mosier N S amp Ladisch M R (2002) Removalof Fermentation Inhibitors Formed during Pretreatment of Biomass by PolymericAdsorbents Industrial amp engineering chemistry research 41(24) 6132-6138doi101021ie0201056
Wu W-M Hickey R F Bhatnagar L amp Zeikus J G (2018) 24 FATTY ACID DEGRADATION ASA TOOL TO MONITOR ANAEROBIC SLUDGE ACTIVITY AND TOXICITY Paper presented atthe Proceedings of the 44th Industrial Waste Conference May 1989 PurdueUniversity
Wu X Yao W Zhu J amp Miller C (2010) Biogas and CH4 productivity by co-digesting swinemanure with three crop residues as an external carbon source Bioresource technology101(11) 4042-4047 doihttpsdoiorg101016jbiortech201001052
Xie S Hai F I Zhan X Guo W Ngo H H Price W E amp Nghiem L D (2016) Anaerobic co-
135
digestion A critical review of mathematical modelling for performance optimizationBioresource technology 222 498-512doihttpsdoiorg101016jbiortech201610015
Xie S Lawlor P G Frost J P Hu Z amp Zhan X (2011) Effect of pig manure to grass silageratio on methane production in batch anaerobic co-digestion of concentrated pigmanure and grass silage Bioresource technology 102(10) 5728-5733doihttpsdoiorg101016jbiortech201103009
Xu R Xu S Florentino A P Zhang L Yang Z amp Liu Y (2019) Enhancing blackwatermethane production by enriching hydrogenotrophic methanogens through hydrogensupplementation Bioresource technology 278 481-485doihttpsdoiorg101016jbiortech201901014
Yang B amp Wyman C E (2008) Pretreatment the key to unlocking low-cost cellulosic ethanolBiofuels Bioproducts and Biorefining 2(1) 26-40 doi101002bbb49
Yang S-T amp Okos M (1987) Kinetic study and mathematical modeling of methanogenesis ofacetate using pure cultures of methanogens Biotechnology and bioengineering 30(5)661-667
Ye J Li D Sun Y Wang G Yuan Z Zhen F amp Wang Y (2013) Improved biogas productionfrom rice straw by co-digestion with kitchen waste and pig manure WasteManagement 33(12) 2653-2658doihttpsdoiorg101016jwasman201305014
Zhang J Loh K-C Lee J Wang C-H Dai Y amp Wah Tong Y (2017) Three-stage anaerobicco-digestion of food waste and horse manure Scientific Reports 7(1) 1269doi101038s41598-017-01408-w
Zhang T Liu L Song Z Ren G Feng Y Han X amp Yang G (2013a) Biogas Production by Co-Digestion of Goat Manure with Three Crop Residues Plos One 8(6) e66845doi101371journalpone0066845
Zhang W Wei Q Wu S Qi D Li W Zuo Z amp Dong R (2014) Batch anaerobic co-digestionof pig manure with dewatered sewage sludge under mesophilic conditions AppliedEnergy 128 175-183 doihttpsdoiorg101016japenergy201404071
Zhang Z Wong H H Albertson P L Doherty W O S amp OrsquoHara I M (2013b) Laboratoryand pilot scale pretreatment of sugarcane bagasse by acidified aqueous glycerolsolutions Bioresource technology 138 14-21doihttpsdoiorg101016jbiortech201303065
Zhang Z Zhang G Li W Li C amp Xu G (2016) Enhanced biogas production from sorghumstem by co-digestion with cow manure International Journal of Hydrogen Energy41(21) 9153-9158 doihttpsdoiorg101016jijhydene201602042
Zheng Z Liu J Yuan X Wang X Zhu W Yang F amp Cui Z (2015) Effect of dairy manure toswitchgrass co-digestion ratio on methane production and the bacterial community in
136
batch anaerobic digestion Applied Energy 151 249-257doihttpsdoiorg101016japenergy201504078
Zhou J Yan B H Wang Y Yong X Y Yang Z H Jia H H Wei P (2016) Effect of steamexplosion pretreatment on the anaerobic digestion of rice straw RSC Advances 6(91)88417-88425 doi101039C6RA15330E
Zhu J Wan C amp Li Y (2010) Enhanced solid-state anaerobic digestion of corn stover byalkaline pretreatment Bioresource technology 101(19) 7523-7528doihttpsdoiorg101016jbiortech201004060
- ABSTRACT
- STATEMENT OF ORIGINALITY
- LIST OF FIGURES
- LIST OF TABLES
- LIST OF ABBREVIATIONS
- ACKNOWLEDGMENTS
- APPENDIX 1
- APPENDIX 3
- APPENDIX 4
- REFERENCES
-

1
Effect of feed ratio and pre-treatment onmethane yields during anaerobic co-digestionof sugarcane bagasse and trash with chicken
manure
Amal Babu PuthumanaBachelor of Technology (BTech) Mahatma Gandhi
University India
Master of Technology (MTech) Cochin University of Scienceand Technology India
Griffith School of Engineering and Built
Environment Griffith Sciences
Griffith University Nathan QLD 4111 Australia
Submitted in the fulfillment of the requirements of thedegree of Master of Philosophy
November 2019
2ii
iii
ABSTRACT
Australia is one of the major producers and exporter of agricultural products Annually
Australian agriculture produces approximately 151 Tg CO2 equivalent emissions The
use of fossil fuels in crop cultivation harvesting and transportation are considered as the
primary source of these greenhouse gas (GHG) emissions Moreover agronomic
management and crop residues left in the field also contribute to these GHG emissions
Alternative waste management practices include the use of crop residues and
agro-wastes as feedstocks for bioenergy production Anaerobic digestion is considered
as sustainable environmental technology to convert industrial sugarcane residues to
carbon dioxide (CO2) - neutral biogas The biogas thus produced can be used to produce
heat electricity and upgrade to biomethane for vehicle use The produced biomethane
can replace the diesel consumption associated with GHG emission in cane transport
Sugarcane is one among the most cultivated crop in the world Australia alone produced
nearly 335 million tonnes of cane in 2018 (FAO 2018) These large production of
sugarcane lead to an increase in crop residues and agro-wastes from the sugarcane
industry In this study an investigation regarding the anaerobic co-digestion of crop
residues and agro-wastes from sugarcane industry viz sugarcane trash (SCT) or
sugarcane bagasse (SCB) with chicken manure (CM) was investigated in a batch
experiment at 37 degC In spite of various researches conducted till date about
co-digestion of lignocellulosic waste with manure no research data was available
regarding the effect of feed ratio on co-digestion of SCTSCB with CM This research
gap was investigated in this study In addition to this steam explosion pre-treatment of
SCTSCB was included to investigate how the pre-treatment influence methane yield
among different feed ratios of SCTSCB with CM
iv
At first SCT and SCB were subjected to steam explosion pre-treatment (steam
impregnation at 130 degC for 5 minutes followed by steam explosion) Later two sets of
biochemical methane potential (BMP) tests were conducted at an Inoculum to Substrate
Ratio (ISR) of 2 Co-digestion of untreated and steam exploded SCT or SCB with CM
was investigated at feed ratios of 7525 5050 and 2575 on volatile solids (VS) basis
Assays with 100 untreated and steam exploded SCT or SCB were also included
Chemical analysis revealed that the steam explosion improved the VS content in
pre-treated biomass compared with untreated biomass The increase in VS was 16
and 57 in SCT and SCB respectively
On the other hand a slight reduction in total solids (TS) of nearly 4 and 1 were
observed in the case of SCT and SCB respectively BMP results showed that the steam
explosion had a profound effect on the methane production rates and yields especially
for SCB than SCT Methane (CH4) yields of 2018 and 199 ml CH4gVSadded were
obtained during the mono-digestion of untreated SCT and SCB respectively The
corresponding values for 100 steam-exploded SCT and SCB were 2075 and 2256
mlgVSadded respectively In comparison to mono-digestion the co-digestion of SCB or
SCT with CM did not improve the methane yields
Nevertheless pre-treatment improved the methane production rates and yields of
pre-treated biomass than untreated biomass Among the studied feed ratios best
methane yields of 2065 mlgVSadded were obtained when steam-exploded SCT was
co-digested with CM at 7525 ratio However methane yields decreased with an
increase in the amount of CM added SCB also showed a similar trend The best
methane yield of 1995 mlgVSadded was obtained when steam-exploded SCB was
co-digested with CM at 7525 ratio Among the tested feed ratios all co-digestion
mixtures except for 7525 and 5050 ratios of untreated SCT to CM showed synergistic
v
effects The best synergistic effect of 1857 was observed when untreated SCB was
co-digested with CM at 2575 ratio Kinetic modelling results confirmed that the steam
explosion pre-treatment improved the methane production rates and yields by increasing
the hydrolysis rate constant values However a higher hydrolysis rate constant was
noticed for SCT than SCB The highest hydrolysis rate constant of 016 d-1 was
achieved at feed ratios of 5050 and 2575 of pre-treated SCTCM
Interestingly more than 75 of methane in pre-treated assays was produced by Day 11
The study thus suggests that the steam explosion can improve the methane production
rates yields and productivity of SCT and SCB However the use of CM as co-substrate
did not improve the methane yields when compared to the mono-digestion of SCT or
SCB but a positive synergism was evident in most of the co-digestion feed ratios
Keywords lignocellulosic biomass co-digestion anaerobic digestion (AD)
chicken manure steam explosion pre-treatment feed ratio synergistic effect
vi
STATEMENT OF ORIGINALITY
This work has not previously been submitted for a degree or diploma in any
university To the best of my knowledge and belief the thesis contains no
material previously published or written by another person except where due
reference is made in the thesis itself
Amal Babu Puthumana (-sd)
vii
TABLE OF CONTENTS
Abstract iii
Statement of originality vi
Table of contents vii
List of figures xi
List of tables xiii
List of symbols and abbreviations xiv
Acknowledgments xvi
Chapter 1 Introduction 1
11 Background 3
12 Aim and Objectives 5
13 Thesis outline 5
Chapter 2 Literature Review 7
21 Agro-waste generation and their management 9
22 Sugarcane cultivation in Australia 10
23 Impact of sugarcane agricultural residue on the environment 15
24 Energy potential of sugarcane agricultural residue 16
25 Lignocellulosic biomass structure 16
26 Anaerobic digestion process 18
27 AD process parameters 21
271 Process temperature 21
272 pH 24
273 CN ratio and trace nutrients 25
28 Pre-treatment of lignocellulosic substrates 26
viii
281 Physical pre-treatment 27
282 Chemical pre-treatment 33
283 Biological pre-treatment 34
29 Anaerobic co-digestion 35
291 Chicken manure as a co-digestion substrate 39
210 Overview of literature review 42
Chapter 3 Materials and Methods 43
31 Substrates 45
311 Lignocellulosic substrates 45
312 Manure 45
32 Inoculum 45
33 Pre-treatment of lignocellulosic substrates 46
34 Experimental design 46
35 Analytical methods 49
351 Determination of TS and VS 49
352 Determination of Chemical Oxygen Demand (COD) 49
353 Determination of Total Kjeldahl Nitrogen (TKN) Total
Kjeldahl Phosphorous (TKP) soluble and total metal ions 49
354 Determination of CN ratio 50
355 Determination of cellulose hemicellulose and lignin 50
356 Determination of VFA 50
357 Determination of ammoniacal nitrogen (NH4-N) and
phosphate (PO43-) 51
36 Biochemical Methane Potential (BMP) test 51
37 Data Processing 54
371 Theoretical BMP 54
372 Experimental BMP 54
ix
373 Synergistic effects analysis 56
374 Anaerobic biodegradability 56
375 BMP mathematical models 57
3751 First-order kinetic model 58
3752 Modified Gompertz model 58
376 Statistical analysis 59
Chapter 4 Results and Discussions 61
41 Physical properties and chemical composition of substrates
and Inoculum 63
42 Anaerobic co-digestion of untreated and steam exploded SCT
with CM 67
421 Effect of different feed ratio on methane yields
during anaerobic co-digestion of SCT with CM 67
422 Effect of steam explosion pre-treatment on anaerobic
co-digestion of SCT with CM at different feed ratios 69
423 Synergistic effects on anaerobic digestibility and methane yields
during anaerobic co-digestion of SCT with CM 71
43 Anaerobic co-digestion of untreated and steam exploded SCB
with CM 72
431 Effect of different feed ratio on methane yields
during anaerobic co-digestion of SCB with CM 73
432 Effect of steam explosion pre-treatment on anaerobic
co-digestion of SCB with CM at different feed ratios 75
433 Synergistic effects on anaerobic digestibility and methane yields
during anaerobic co-digestion of SCB with CM 76
44 Post BMP analysis of SCTSCB when co-digested with CM 77
441 Cumulative methane yield and statistical analysis 77
442 Anaerobic biodegradability 79
443 VFA analysis of digestates 81
x
444 FIA analysis of digestates 84
45 Mathematical modelling 86
Chapter 5 Conclusions 95
51 Conclusion to this research work 97
52 Related future research works 99
Appendix 1 Statistical Analysis of Untreated SCT with CM 101
Appendix 2 Statistical Analysis of Pre-treated SCT with CM 106
Appendix 3 Statistical Analysis of Untreated SCB with CM 111
Appendix 4 Statistical Analysis of Pre-treated SCB with CM 116
References 121
xi
LIST OF FIGURES
Figure 21 Sugarcane mills and crop areas in Australia 11
Figure 22 Flowchart of production of SCB and SCT during sugar cultivation 13
Figure 23 (a) Plant tops and dry leaves of the sugarcane plant constituting
the SCT 14
Figure 23 (b) Dry fibre pulp left over after extracting juice from the stem
of sugarcane plant forming the SCB 14
Figure 24 Australian sugarcane residue burnings from 2013-2017 14
Figure 25 Structure of lignocellulosic biomass 17
Figure 26 Anaerobic digestion pathway 20
Figure 27 Rate of AD process based on different process temperatures 23
Figure 28 Pre-treatment of lignocellulosic biomass 27
Figure 31 (a) Untreated SCT 47
Figure 31 (b) Pre-treated SCT 47
Figure 31 (c) Untreated SCB 47
Figure 31 (d) Pre-treated SCB 47
Figure 31 (e) CM 47
Figure 32 Flowchart of methodology adopted in research study 48
Figure 33 Sealed 160mL serum bottle for BMP test with inoculum
substrate and headspace flushed with nitrogen gas 52
Figure 34 Gas chromatography machine (GC-2014) 53
Figure 41 Cumulative methane production during the anaerobic
co-digestion of untreated SCT (USCT) and pre-treated SCT (PSCT) with
CM at different feed ratios incubated in batch experiment at 37 oC
for 83 days 68
Figure 42 Cumulative methane yield among different feed ratios of
xii
Untreated SCTCM and Pre-treated SCTCM on day 11 (T11) 70
Figure 43 Synergistic and antagonistic effects of various co-digestion feed ratios
during anaerobic co-digestion of SCT with CM in batch assays at 37 oC 72
Figure 44 Cumulative methane production during the anaerobic
co-digestion of untreated SCB (USCB) and pre-treated SCB (PSCB) with
CM at different feed ratios incubated in batch experiment at 37 oC
for 83 days 74
Figure 45 Cumulative methane yield among different feed ratios of
Untreated SCBCM and Pre-treated SCBCM on day 11 (T11) 76
Figure 46 Synergistic and antagonistic effects of various co-digestion feed ratios
during anaerobic co-digestion of SCB with CM in batch assays at 37 oC 77
Figure 47 VFAs of post BMP digestates in various feed ratio assays 83
Figure 48 Comparison of first-order and modified Gompertz kinetic model
predictions with experimental cumulative methane yield for different
co-digestion ratios of SCT with CM 89
Figure 49 Comparison of first-order and modified Gompertz kinetic model
predictions with experimental cumulative methane yield for different
co-digestion ratios of SCB with CM 91
xiii
LIST OF TABLES
Table 21 Major agricultural crops and their area of cultivation in Australia
(2012-2017) 10
Table 22 Composition of various lignocellulosic biomasses 18
Table 23 Comparison of mesophilic and thermophilic operation 23
Table 24 Optimal pH requirement for each stage of the AD process 24
Table 25 CN ratio of different lignocellulosic material and manure from
previous studies 26
Table 26 Previous studies and their results on mechanical pre-treatments 31
Table 27 Results of previous studies on the effect of feed ratio during the
anaerobic co-digestion of manure and lignocellulosic agro-wastes 37
Table 28 Previous studies reporting improvement in methane yields as a
result of co-digesting with manure 41
Table 31 Different feed ratios in anaerobic co-digestion of SCT and SCB
with CM tested in this study 47
Table 41 Physio-chemical properties of substrates and inoculum 65
Table 42 Macro and micro nutrients of substrates and inoculum 66
Table 43 Theoretical and experimental results of anaerobic biodegradability
during anaerobic co-digestion of SCTSCB with CM 80
Table 44 Results of flow injection analysis for various feed ratios of SCTSCB
with CM 85
Table 45 Modelling parameters for first-order and modified Gompertz model
for different feed ratios of SCTSCB co-digested with CM 87
xiv
LIST OF ABBREVIATIONS
AD Anaerobic Digestion
ANOVA Analysis of Variances
APHA American Public Health Association
ASMC Australian Sugar Milling Council
BD Biodegradability
BMP Bio-chemical Methane Potential
CN Carbon to Nitrogen
CEC Clean Energy Council
CM Chicken Manure
COD Chemical Oxygen Demand
CSTR Continuous Stirred Tank Reactor
DAWR Department of Agriculture and Water Resources
FAO Food and Agricultural Organisation
FIA Flow Injection Analyser
GC Gas Chromatography
GHG Green House Gases
HPLC High Performance Liquid Chromatography
HRT Hydraulic Retention Time
ICP Inductivity Coupled Plasma
ISR Inoculum to Substrate Ratio
NREL National Renewable Energy Laboratory
OES Optical Emission Spectroscopy
PSCB Pre-treated Sugarcane Bagasse
xv
PSCT Pre-treated Sugarcane Trash
SCB Sugarcane Bagasse
SCT Sugarcane Trash
STP Standard Temperature and Pressure
TCD Thermal Conductivity Detector
TKN Total Kjeldahl Nitrogen
TKP Total Kjeldahl Phosphorous
TS Total Solids
USCB Untreated Sugarcane Bagasse
USCT Untreated Sugarcane Trash
UV Ultra-Violet
VFA Volatile Fatty Acids
VOC Volatile Organic Compounds
VS Volatile Solids
xvi
ACKNOWLEDGMENTS
All glory and honours to God the Almighty for providing me an opportunity to conduct
this research work His blessings and mercy have given me strength throughout my
MPhil program at Griffith University Australia
I want to express my sincere gratitude to my principal supervisor Dr Prasad Kaparaju
Senior Lecturer School of Engineering and Built Environment for his patience
guidance technical assistance and productive discussions His motivation and
dedication towards work inspired me to work harder and overcome the hurdles in my
research pathway He also gave insightful comments through discussions and reviews
for the successful completion of my research and thesis writing process I am
acknowledging his efforts in sharpening my skills and moulding me to be a successful
researcher
I would also like to use this opportunity to thank my Associate supervisor Dr Sunil
Herat and HDR convenor of the Griffith School of Engineering and Built Environment
Nathan Campus Dr Jimmy Yu for their innovative ideas and suggestions that helped me
to improve my skills during my tenure as an MPhil researcher at Griffith University I
would also extend my gratitude to Dr Asif Latif and Dr Thiago Edwiges for their
support in my research work
I am also thankful to my colleagues Mr Paulose Paulose Mrs Thi Kim Chi Do and Ms
Erika Maria Conde Espitia for their sincere supports and laboratory assistance that
helped me to complete my research work efficiently much before the expected
completion date I would also like to acknowledge the technical supports provided by
Mr Scott Byrnes and Mr Rad Bak in my analysis I would also thank Mrs Lynda
xvii
Ashworth Administrative Support Officer Griffith School of Engineering and Built
Environment for providing me all non-technical supports during my tenure
I am also thankful for all the support and guidelines provided by the Griffith Higher
Degree by Research Office Even though I had to undergo some complex process
associated with the candidature change HDR staff supported me and showed patience
to hear understand and clear my quires I also take this opportunity to thank all
academic and non-academic staff of Griffith University Nathan Campus for providing
me all support to complete my research successfully
Last but not least I am thanking all my friends especially Mr Pranav Sajeevu Mr Alan
Jacob Antony Ms Megha Roy Mr Nikhil Aravindakshan Mrs Priya Philip and Ms
Jagriti Tiwari for their incredible support along with my family members including my
father - Mr Babu P John mother - Mrs Surya Kala Babu brother - Mr Adharsh B
Puthumana and my wife - Mrs Jisna Johnson who supported and motivated me during
my hard times It is because of their kind words and endless support I was able to
achieve this milestone
AMAL BABU PUTHUMANA
18
Chapter 1 General Introduction
1
Chapter 1 General introduction
Chapter 1 General Introduction
2
Chapter 1 General Introduction
3
11 Background
Australia is one of the major producers and exporter of agricultural crops producing
about 838 million tonnes of crops annually (FAO 2018) The agro-based industries in
Australia which process these crops emit nearly 151 Tg of CO2 equivalent (FAO 2018)
The GHG emissions from them are mainly associated with the use of fossil fuels during
cultivation harvesting and transportation of associated raw materials or products
Further surplus crop residues are either left on the field or burnt to reduce the
transportation cost (Nachiappan Fu and Holtzapple 2011) Accumulation of
agricultural residues on the field may also lead to environmental and health issues (Sud
Mahajan and Kaur 2008) Thus the need to develop an efficient waste management
technology to utilise these agro-wastes is increasing The utilisation of these biomass
resources for biofuel generation may reduce the GHG emissions associated with waste
management and replaces fossil fuel use in agriculture (Paudel et al 2017)
Among the different technologies used for conversion of agricultural feedstocks into
useful bioenergy anaerobic digestion (AD) is considered as the most economical and
environmentally sustainable technology (Chandra Takeuchi and Hasegawa 2012)
The produced biogas can be utilised for heat or electricity generation or even upgraded
to bio-methane for vehicle fuel use (Kaparaju and Rintala 2013)
The dry fibre pulp obtained after extracting the cane juice known as the sugarcane
bagasse (SCB) is estimated to be 30 of the weight of the cane (CEC 2019) Large
quantities of SCB are generally used as a biomass resource to produce process steam to
use onsite (Rabelo Carrere Maciel Filho and Costa 2011) It can also be used to
produce paper and paperboard products (Rainey and Covey 2016) On the other hand
the dry and green leaves and tops of the cane known as the sugarcane trash (SCT) is
estimated to be about 33 of the total plant weight (CEC 2019) Although the heat
Chapter 1 General Introduction
4
content of SCT is much more than SCB (Eggleston Grisham and Antoine 2009) SCT
is generally left on the field to decay due to its bulkiness and high cost associated with
the collection storing and transportation (Janke et al 2015)
Both SCT and SCB are lignocellulosic materials that consist of cellulose hemicellulose
and lignin (Sawatdeenarunat Surendra Takara Oechsner and Khanal 2015) Different
pre-treatment methods can be used to break the complex structure of lignocellulosic
biomass (Neshat Mohammadi Najafpour and Lahijani 2017) Pre-treatment of
lignocellulosic substrates can be mainly classified as physical chemical and biological
pre-treatment Steam-explosion is a physical pre-treatment method which is more
economical and efficient for disrupting the lignocellulosic structure to improve the
anaerobic biodegradability and rate of methane production among these substrates
(Neshat et al 2017) Thus steam-explosion was adopted as the pre-treatment
methodology in this study to pre-treat SCT and SCB
Lignocellulosic materials have a high potential in producing biogas using AD
technology However the high carbon content in these substrates can cause inhibition to
the process resulting in a lower rate of production According to the studies conducted
by Neshat et al (2017) carbon to nitrogen (CN) ratio of 20-301 is to be maintained for
optimal microbial growth (Neshat et al 2017) Co-digesting these lignocellulosic
materials with animal manure can be done to reduce the CN ratio Many researchers
had worked to find out the best feed ratio in co-digesting animal manure with
lignocellulosic material For instance Cheng and Zhong (2014) conducted a research
study to investigate the best feed ratio among 1000 7525 5050 and 2575 ratios while
co-digesting cotton stalk with swine manure 5050 ratio was reported to produce more
yield in this study (Cheng and Zhong 2014) However not many previous studies have
been reported which investigated the amount of chicken manure to be added to enhance
Chapter 1 General Introduction
5
biogas production while co-digesting with SCT and SCB In other words there is a need
to examine which feed ratio of SCTSCB to CM has the best biogas production
12 Aim and Objectives
The overall aim of this project is to investigate the effect of feed ratio on methane
production from sugarcane industry wastes through anaerobic co-digestion with
nitrogen-rich livestock manures Different feed ratios were tested with both untreated
and pre-treated lignocellulosic waste materials Moreover the utilisation of these two
waste streams will help in sustainable waste management and energy renewable energy
production Specific objectives included in this project to attain the aim are as follows
Objective 1 To study the effect of different feed ratios on methane production during
anaerobic co-digestion of untreated and pre-treated sugarcane bagassetrash with
chicken manure
Objective 2 To evaluate the anaerobic digestibility and kinetics of methane production
during anaerobic co-digestion of sugarcane bagassetrash with chicken manure
13 Thesis outline
This thesis is organised into five different chapters
Chapter 1 presents the background of the study the need for such research
identification of research gap the formation of aim and specific objectives of this
project
Chapter 2 reviews literature on the importance of sugarcane agro-wastes and as a
potential source for bioenergy production in Australia It also describes the anaerobic
Chapter 1 General Introduction
6
digestion process and the various stages and process parameters affecting the anaerobic
digestion process Pre-treatment of the lignocellulosic substrates and co-digestion of
lignocellulosic waste with animal manure is discussed with some previous studies
Chapter 3 explains the various materials used describes the experimental design and
methodologies used in this study
Chapter 4 presents the main results of this research work and discusses the reasons for
obtaining those results along with supportive literature studies BMP results along with
the synergistic effects of co-digestion for both untreated and pre-treated SCT and SCB
were discussed Finally mathematical modelling anaerobic biodegradability and post
BMP analysis were also presented to understand the kinetics of biogas production and
the influence of pre-treatment on the biomass
Chapter 5 summarises the results of this study and arrives at the main conclusions This
chapter also provides some direction for future work that can be incorporated to have a
broader discussion on commercialising such a plant
Chapter 2 Literature Review
7
Chapter 2 Literature Review
Chapter 2 Literature Review
8
Chapter 2 Literature Review
9
This chapter aims to describe different aspects associated with the anaerobic digestion
of lignocellulosic biomass factors affecting AD and methods to enhance methane yield
from lignocellulosic biomass It also provides the importance of sugarcane wastes and
their generation in Australia current management practices and their impact on the
environment Practical usage of these organic wastes to improve bioenergy production
from the sugarcane industry wastes are also discussed here This section also presents
previous studies dealing with the anaerobic co-digestion of lignocellulosic waste with
nitrogen-rich animal manure
21 Agro-waste generation and their management
Agro-wastes and organic wastes produced from the agricultural crops after crop harvest
are considered as a valuable renewable resource with excellent potential for generating
bio-energy (Anwar Gulfraz and Irshad 2014) Plant stalks straw hulls leaves and
vegetable matter are the significant agricultural residues generated from crop cultivation
(Lim and Matu 2015) In 2017 Australia alone produced 3835 gigagrams of CO2
equivalent crop residues (FAO 2018) The quantity of these wastes produced and their
physical and chemical properties are primarily depended on the crop species soil type
cultivation practices harvest time harvesting methods and processing technology
Burning of agro-wastes can lead to greenhouse gas (GHG) emissions and eventually
lead to global warming (Paul and Dutta 2018) On the other hand the disposal of these
organic wastes in landfills or dumpsites can also lead to severe health and
environmental issues (Sud et al 2008) Thus utilisation of this agro-waste for energy
recovery nutrients and chemicals is considered as sustainable management of these
organic wastes (Caramiello et al 2013 Lancellotti Righi Tatagraveno Taurino and
Barbieri 2013)
Chapter 2 Literature Review
10
22 Sugarcane cultivation in Australia
The major agricultural crops cultivated in Australia are wheat sugarcane cotton maize
and rice Among these crops sugarcane is the second-largest cultivated crop Table 21
shows the major crops cultivated across Australia and their area of cultivation since
2012 It can be noted from Table 21 that there is a significant increase in the area of
cultivation of sugarcane in recent years
Table 21 Major agricultural crops and their area of cultivation in Australia (2012-17)
Source (FAO 2018)
Crop
Cultivate area (x 103ha)
2012 2013 2014 2015 2016 2017
Maize 696 786 524 596 533 678
Rice 1031 1136 767 697 266 822
Cotton 5965 444 3901 197 2804 NA
Soybean 381 411 37 301 292 300
Sugarcane 3386 3293 3752 3765 4472 4534
Sunflower 402 303 27 295 23 27
Wheat 139021 129793 126132 123837 112822 1219115
Despite being the second-largest cultivated crop in Australia sugar cultivation is mainly
limited to Queensland (Linnenluecke Zhou Smith Thompson and Nucifora 2019)
Australian sugar production is concentrated primarily in Queensland which constitutes
about 95 of the total output and the remaining is being produced in New South Wales
(Magarey et al 2019) It is spread along the eastern coastline for about 2100 km
between Mossman in northern Queensland and Grafton in north NSW (DAWR 2017)
The main sugarcane growing areas in Australia are located near Townsville and
Bundaberg as shown in Figure 21 In 2017 Australia produced about 365 million
tonnes of sugarcane (FAO 2018)
Chapter 2 Literature Review
11
Figure 21 Sugarcane mills and crop area in Australia (ASMC 2019)
The harvested sugarcane plant from the fields generally consists of sugarcane plant stem
plant tops leaves and roots (Figure 22) The plant stem is being transported the sugar
Chapter 2 Literature Review
12
mill for further processing The main products produced after processing the sugarcane
stem are sugar bagasse molasses and filter cake (George Cabello Eras Sagastume
Hens and Vandecasteele 2010) In the sugar mill the cane is crushed to extract juice
leaving behind a dry fibre pulp known as bagasse or SCB (Figure 23b) It is estimated
that bagasse constitutes about 25-30 of the total weight of cane (CEC 2019) Gabov
et al (2017) reported that around 260-280 kg of wet bagasse per ton of sugarcane is
produced from the sugar mills (Gabov Hemming and Fardim 2017) Bagasse
produced from the sugar industry is generally used for paper and paperboard production
(Sahu 2018) It is also used as fuel for the industrial boilers used for process steam
generation (George et al 2010) In Australia out of the total bagasse generated 107
million tonnes of bagasse was burnt producing 102 PJ of heat and power during 2015-
16 (Ramirez and Rainey 2019)
Green leaves of the sugarcane plant along with the plant top and plant roots are dried
together on field These trash substances are generally known as SCT (Figure 22
Figure 23a) It is estimated that almost one-third of the sugarcane plant weight is
contributed by the trash (Sahu 2018) After harvesting trash is left on the field to decay
or burnt mainly due to the high cost associated with the collection and transportation of
these trash from the fields (Janke et al 2015)
Chapter 2 Literature Review
13
Figure 22 Flowchart of production of SCB and SCT during sugar cultivation
Sugarcane residue burnings in Australia from 2013 to 2017 are shown in Figure 24
Data shows that trash burnings associated with sugarcane cultivation had increased by
38 in Australia This trash management practice can contribute to air pollution
respiratory diseases and GHG emissions (Cerri et al 2011) Thus the need for efficient
and sustainable technology to utilise these organic wastes for generating energy and
other high-value products is required
Chapter 2 Literature Review
14
Figure 23 (a) Plant tops and dry leaves of the sugarcane plant constituting the SCT
(b) Dry fibre pulp left over after extracting juice from the stem of sugarcane plant
forming the SCB
Figure 24 Australian sugarcane residue burnings from 2013 to 2017 (Source (FAO
2018)
Chapter 2 Literature Review
15
23 Impacts of sugarcane agricultural residue on the environment
During the early 1980s green cane harvesting was one of the innovative techniques
adopted to utilise the vast quantities of trash produced in sugarcane cultivation
(Thorburn Horan and Biggs 2004) Even though trash has been used as soil much and
proved to improve the nutrient availability and soil moisture content its spread on land
had increased the chances of spreading diseases due to humidity and lower soil
temperatures (Goacutemez Torres De Souza and Jackson 2014) It also increased the risk
of spreading diseases such as the Weilrsquos disease caused due to the contact of wet soil or
water contaminated by an infected animal such as rat (Thorburn et al 2004) The most
cost-effective solution to this issue was to burn the trash in the fields after harvesting the
crop (Jain Bhatia and Pathak 2014) Burning of sugarcane trash had become a
standard policy throughout the industry as it turned out to be the most natural solution to
prevent the spread of diseases (Cerri et al 2011) Soon the negative impacts of the
burning sugarcane residues became evident It paved the way for many respiratory
disorders (Cerri et al 2011) Environmental implications of trash burnings include air
pollution in terms of volatile organic compounds (VOC) nitrogen oxide (NOx) nitrous
oxide (N2O) carbon monoxide (CO) carbon dioxide (CO2) and sulphur oxides (SOx)
(Jain et al 2014)
With the increase in demand for sugar and related products the sugar cultivation area
increased throughout the world including Australia (George et al 2010) The current
global sugarcane cultivation area is 26 million hectares with a total sugarcane
production of 18 billion tonnes (FAO 2018) Thus the need for developing alternative
technologies to utilise the wastes generated from sugarcane industries is necessary The
use of SCT and SCB to produce biogas is considered as one of the best sustainable
solutions to solve waste management without causing many environmental issues or
Chapter 2 Literature Review
16
health hazards The ability of SCT and SCB to be used as a source for biogas can be
justified only by determining the energy potential of these agro wastes
24 Energy potential of sugarcane agricultural residue
Both SCT and SCB are considered as lignocellulosic biomass and are made of
carbohydrate polymers such as cellulose and hemicellulose and an aromatic polymer
known as lignin and a small number of acetyl groups minerals and phenolic compounds
(Sahu 2018) The arrangement of lignin cellulose and hemicellulose vary according to
the type of lignocellulosic biomass (Isikgor and Becer 2015) The distribution of these
compounds also depends on the maturity of the plant and species (Murphy Braun
Weiland and Wellinger 2011) On average the composition of cellulose
hemicellulose and lignin are approximately 35-50 20-35 and 10-25 respectively
(Cherubini 2010) The cross-linked structure of lignin binds the cellulose and
hemicellulose in the lignocellulosic biomass to form a complex cross-linked structure
(Eskicioglu et al 2017) The lignin bond thus hinders the accessibility of cellulose and
hemicellulose for the microbes in an anaerobic digestion process (Sawatdeenarunat et
al 2015)
25 Lignocellulosic biomass structure
Despite having high biomass yield lignocellulosic biomass does not contribute much to
the food and feed production It was inferred that lignocellulosic materials could
produce a better yield even in low energy input conditions which makes it a better
option for biogas production (Sawatdeenarunat et al 2015) High resistants and
recalcitrance of lignocellulosic biomasses are due to the interaction of cellulose
hemicellulose and lignin present in the lignocellulosic structure (Figure 25) Thus
hydrolysis is considered as the rate limiter for the AD process (Khanal 2011) These
Chapter 2 Literature Review
17
major components of the lignocellulosic materials form a non-uniform complex
structure with a relatively different composition according to the type of biomass These
complex structures resist the cellulose crystallinity lignin phobicity and cellulose
encapsulation by the lignin-hemicellulose matrix inside the lignocellulose stem (Barakat
de Vries and Rouau 2013 Moraiumls et al 2012)
Figure 25 Structure of lignocellulosic biomass (Jensen Rodriguez Guerrero Karatzos
Olofsson and Iversen 2017)
Lignin is responsible for providing compressive strength to the plant tissues and to resist
the plant stem from pathogen or insect attack (War et al 2012) These long-chain
compound needs to be broken in order to attain access to the cellulose and
hemicellulose during the AD process (Paul and Dutta 2018) Composition of cellulose
hemicellulose and lignin for various lignocellulosic materials available are as shown in
Table 22
Chapter 2 Literature Review
18
Table 22 Composition of various lignocellulosic biomasses Source (Cherubini 2010
Isikgor and Becer 2015 Menon and Rao 2012)
Biomass Cellulose () Hemicellulose () Lignin ()
Wheat Straw 350ndash390 230ndash300 120ndash160
Barley Hull 34 36 138ndash190
Barley Straw 360ndash430 240ndash330 63ndash98
Rice Straw 292ndash347 230ndash259 170ndash190
Rice Husks 287ndash356 120ndash293 154ndash200
Oat Straw 310ndash350 200ndash260 100ndash150
Ray Straw 362ndash470 190ndash245 99ndash240
Corn Cobs 337ndash412 319ndash360 61ndash159
Corn Stalks 350ndash396 168ndash350 70ndash184
Sugarcane Bagasse 250ndash450 280ndash320 150ndash250
Sorghum Straw 320ndash350 240ndash270 150ndash210
26 Anaerobic digestion process
Bio-chemical conversion of the agro-wastes into energy is one of the most efficient and
eco-friendly process compared to the direct combustion or thermochemical process
(Renouf Pagan and Wegener 2013) Anaerobic digestion is a biochemical process
where organic matter is decomposed by microbial community in the absence of oxygen
to produce CH4 and CO2 (Gumisiriza Hawumba Okure and Hensel 2017 Gumisiriza
Mshandete Rubindamayugi Kansiime and Kivaisi 2009) In addition to the major
components such as CH4 and CO2 traces of nitrogen (N2) oxygen (O2) and hydrogen
sulphide (H2S) together is known as the biogas
AD process can be broadly classified into four sub-processes namely hydrolysis
acidogenesis acetogenesis and methanogenesis (Figure 26) Acidogenic acetogenic
and methanogenic bacteria act on the available organic matter in the anaerobic condition
to produce biogas (Kothari Pandey Kumar Tyagi and Tyagi 2014) Organic matter
available in the anaerobic digesters generally consists of complex compounds such as
Chapter 2 Literature Review
19
carbohydrates (cellulose hemicellulose starch) proteins and lipids The concentration
of these organic compounds varies according to the type of feedstock used The
complexity of these compounds hinders the action of microbes (Gumisiriza et al 2017)
Hydrolysis of these compounds to smaller units and solubilising them to make them
available for the microbial uptake (Sawatdeenarunat et al 2015) and further
degradation is necessary for proceeding the AD process The biochemical equation for
the hydrolysis of complex organic matter is presented as below (Gunes Stokes Davis
Connolly and Lawler 2019)
C6H10O4 + 2H2O C6H12O6 + H2 Eq21
In the subsequent phase the acid formic acidogenic bacteria use the monomeric sugars
amino acids and fatty acids obtained in the hydrolysis step to produce intermediate
volatile fatty acids (VFArsquos) (Neshat et al 2017) VFAs consist of short-chain organic
acids such as acetic acid propionic acid butyric acid valeric acid and caproic acid
Acidogenic bacteria use CO2 H2O and H2 to produce VFArsquos and have a doubling time
of approximately 30 minutes The acidogenic reactions can be written as follows (Gunes
et al 2019)
C6H12O6 2CH3CH2OH + 2CO2 Eq22
C6H12O6 + 2H2 2CH3CH2COOH + 2H2O Eq23
CH3CH2COOH + 2H2O CH3COOH + CO2 + 3H2 Eq24
Chapter 2 Literature Review
20
Figure 26 Anaerobic digestion pathway Source (Si 2016)
Acetogenesis is the process in which the acetogenic bacteria converts the VFAs such as
propionic acid butyric acid and valeric acid to acetic acid and H2 (Si 2016) It is a
comparatively slow process and takes place usually in 15 to 4 days (Gunes et al 2019)
In the final stage the acetic acid H2 and CO2 are utilised by the methanogens to
produce CH4 and CO2 (Neshat et al 2017) This process of formation of methane from
the products of acetogenesis is known as methanogenesis It is the slowest growing
process and its doubling rate is 2 to 4 days (Kainthola Kalamdhad and Goud 2019)
Methanogens which produce methane by consuming H2 and CO2 are known as the
hydrogenotrophic methanogens (Xu et al 2019) On the other hand methanogens that
produce CH4 and CO2 from acetic acid are called acetoclastic methanogens (Kainthola
Chapter 2 Literature Review
21
et al 2019) Methanogenesis can be represented by using the following equations
(Gumisiriza et al 2017 Kothari et al 2014)
2CH3CH2OH + CO2 2CH3COOH + CH4 Eq25
CH3COOH + CO2 CH4 + 2CO2 Eq26
CH3OH + H2 CH4 + H2O Eq27
CO2 + 4H2 CH4 + 2H2O Eq28
HCO-3 + 4H2 + H+ CH4 + 3H2O Eq29
27 AD process parameters
The microbial activity on the degradation of organic matter to produce CH4 is
dependent on various process parameters such as type of organic matter the
temperature of operation pH of the medium Carbon to Nitrogen (CN) ratio and trace
elements (Neshat et al 2017) In order to attain maximum yield from the organic
substance using AD these process parameters should be optimum (Kainthola et al
2019) The techno-economic feasibility of the experimental set-up in maintaining these
process parameters should also be considered while designing a commercial AD plant
271 Process temperature
The temperature of the process is one of the most influential parameters in an anaerobic
digestion process Effect of temperature can affect the metabolic activity of the
microorganisms resulting in variation of biogas produced Acidogenic bacteria are
active in a particular temperature range and a variation from that optimum temperature
Chapter 2 Literature Review
22
range can result in acidification due to VFA accumulation (Neshat et al 2017) Based
on the experimental results of various researchers and by thermodynamic and kinetic
factors it can be concluded that the temperature of operation of an AD process
dramatically influences the methane production from an AD process (Gumisiriza et al
2017)
Based on the microbial growth rate process temperature range of an AD process can be
broadly classified as follows (Neshat et al 2017)
Psychrophilic Cryophilic 10 ndash 15 oC
Mesophilic 30 ndash 40 oC
Thermophilic 45 ndash 65 oC
AD process generally takes place between 10 oC (psychrophilic) to 65 oC (thermophilic)
(Figure 27) Based on experimental researches the AD process generally takes place at
an optimal range of 37 oC for mesophilic operation and 55 oC for thermophilic operation
(Mata-Aacutelvarez 2002 van Lier et al 2001) Advantages and disadvantages of both
mesophilic and thermophilic range of operation in anaerobic digestion are listed in
Table 23
Higher rate of microbial growth and lesser retention time along with the lesser reactor
volume makes the thermophilic operation the most favourable among the various
operating temperature (Gumisiriza et al 2017 Neshat et al 2017)According to the
literature higher temperature of operation is more sensitive to toxicity due to the
imbalance created due to high amount of VFA production and its low conversion at
high temperatures (Kainthola et al 2019)
Chapter 2 Literature Review
23
Table 23 Comparison of mesophilic and thermophilic operation Source (Gumisiriza
et al 2017 Kainthola et al 2019 Neshat et al 2017)
Advantages Disadvantages
Mesophilic Wide range of operation More digester volume
Common anaerobic bacteria More retention time
More stable
Less energy input
Thermophilic higher organic loading rate increases inhibitory effect
a faster rate of biogas production Less range of feedstock
smaller reactor volume More sensitive to toxicity
Figure 27 Rate of AD process based on different process temperatures (Mojiri Aziz
Zaman Aziz and Hamidi 2012)
Fluctuations in the operating temperature by a fewer degree also results in a
considerable variation of the AD operation (Chae Jang Yim and Kim 2008) So
maintaining a constant temperature of operation throughout the AD process is very
important
Chapter 2 Literature Review
24
272 pH
pH can be described as the measure of acidity or alkalinity of a substrate mixture
usually expressed in parts per million (ppm) (Kainthola et al 2019) It also represents
the concentration of hydrogen ions in the aqueous solution The pH of the substrate
inoculum mixture plays a vital role in the AD process as the microorganismrsquos reaction
and inhibition are directly related to the acidity or alkalinity of the medium
(Srisowmeya Chakravarthy and Nandhini Devi 2019) Table 24 summarises the
optimal pH value for different stages of the AD process
Table 24 Optimal pH requirement for each stage of the AD process
StagesProcess Temperature pH range Reference
Hydrolysis Mesophilic 55 (Kim et al 2003)
Acidogenesis Mesophilic 65 (Kim et al 2003)
Thermophilic 60 -70(Park Tsuno Hidaka and
Cheon 2008)
Methanogenesis Mesophilic 70(Huber Thomm Koumlnig Thies
and Stetter 1982)
Mesophilic 65-82(Lee Behera Kim and Park
2009 Yang and Okos 1987)
AD Mesophilic 70 -72 (Ağdağ and Sponza 2007)
Mesophilic 68 -72(Ward Hobbs Holliman and
Jones 2008)
Maximum methane yield Mesophilic 65 -75(Liu Yuan Zeng Li and Li
2008)
Neshat et al (2017) reported that the growth of methane producing methanogenic
bacteria is limited to a narrow band of pH 68 to 72 (Neshat et al 2017) The optimum
pH for acidogenic and hydrolytic microorganism growth is much lower than that of the
methanogenic community (Kainthola et al 2019) Therefore maintaining the optimum
pH for each process is essential to obtain maximum methane yields (Neshat et al 2017)
Chapter 2 Literature Review
25
273 CN ratio and trace nutrients
CN ratio is also an essential parameter in determining the overall methane production
Low gas production is experienced in case of high CN ratio as the methanogenic
bacterial community consumes the available nitrogen to meet their requirements of
proteins and hence leaving behind the carbon content of the substrate resulting in less
biogas production (Wu Hickey Bhatnagar and Zeikus 2018) Low CN ratio of the
inoculum substrate mixture can result in the liberation of ammonium ions (NH4+) which
will lead to the gradual pH increase of the assay and finally results in toxicity and
inhibition of methane production (Fernandez Srinivas Schmidt Swita and Ahring
2018) Thus an optimal CN ratio of 20-301 is required to efficiently convert the
organic matter into biogas without any inhibition (Neshat et al 2017) Table 25
tabulates the CN ratio of various substrates that are subjected to anaerobic digestion
Agricultural residues and agro-wastes have a high CN ratio which makes them less
favourable for anaerobic digestion as the optimum CN ratio is not obtained (Risberg
Sun Leveacuten Horn and Schnuumlrer 2013) Whereas the low CN of manure and its lesser
carbon content retards the process and thus does not make it favourable for anaerobic
digestion as a sole substrate (Li et al 2014) However when these two substrates are
being co-digested a more preferred CN ratio can be obtained and thus an improvement
in the biogas production can be expected For instance Cheng and Zhong (2014)
reported CN of the cotton stalk as 501 which was higher than the considered optimum
CN ratio for an AD process The addition of swine manure resulted in attaining an
optimum CN ratio of 251 which resulted in an enhanced biogas production (Cheng and
Zhong 2014) Similar results were also achieved by Zhang et al (2016) when sorghum
stem and cow manure were co-digested An improvement of 26 from the control was
reported in this study (Zhang Zhang Li Li and Xu 2016)
Chapter 2 Literature Review
26
Table 25 CN ratio of different lignocellulosic materials and manure from previous
studies
Biomass CN ratio Reference
Corn Stover 63 (Li et al 2014)
Switch grass 90 (Brown Shi and Li 2012)
Wheat straw 60 (Brown et al 2012)
Oat straw 46 (Wu Yao Zhu and Miller 2010)
Rice straw 47 (Ye et al 2013)
Cotton stalk 50 (Cheng and Zhong 2014)
Sugarcane bagasse 118 (Karthikeyan and Visvanathan 2013)
Chicken manure 10 (Li et al 2013)
Cattle manure 24 (Chandra et al 2012)
Swine manure 17 (Ye et al 2013)
Various micronutrients such as iron nickel zinc selenium molybdenum manganese
and tungsten along with macronutrients such as carbon nitrogen phosphorous
potassium calcium magnesium and sulphur are essential for the survival and growth of
the microorganisms that convert the organic matter to biogas (Paul and Dutta 2018)
However these micro macronutrients are being supplemented by the activated sludge
inoculum which constitutes nearly 95 of the volume in all the batch assays
28 Pre-treatment of lignocellulosic substrates
Pre-treatment of a substrate is the process of conditioning the substrate before
subjecting it to an AD process in order to enhance the methane yield of the substrate
with a comparatively lesser retention time (Maniet et al 2017) Pre-treatment helps to
break the structural bonding in the substrates and thus makes the organic matter readily
available for the microorganisms (Saidu Yuzir Salim Azman and Abdullah 2014) In
addition to these primary functions pre-treatment also helps to make the feedstock
available in a moderate size to the AD process and thereby reduces the energy
consumption for the process (Bauer et al 2014a) Pre-treatment of lignocellulosic
Chapter 2 Literature Review
27
biomass is mainly done to reduce the cellulose crystallinity and to reduce lignin (Maniet
et al 2017) The lignocellulosic structure of the agricultural residues and the breakage
of complex lignin structure as a result of pre-treatment is as shown in Figure 28
Figure 28 Pre-treatment of lignocellulosic biomass (Kumar Barrett Delwiche and
Stroeve 2009)
The main types of lignocellulosic pre-treatments include physical chemical and
biological pre-treatments (Lizasoain et al 2016) Physical pre-treatment includes
mechanical grinding irradiation steam explosion and hydro-thermolysis (Wang et al
2018) Chemical pre-treatments are those pre-treatment methods using acid base
catalyst organic solvents and oxidising agents (Kumar et al 2009) On the other hand
biological pre-treatment is the type of pre-treatment in which the substrates are
subjected to microbial and enzymatic hydrolysis (Yang and Wyman 2008)
281 Physical pre-treatment
Physical pre-treatment methods include the treatment of lignocellulosic materials by
using mechanical operations such as grinding milling and chipping along with
Chapter 2 Literature Review
28
ultrasound microwaves liquid hot water and steam explosion (Neshat et al 2017)
Methane yield and hydrolysis kinetics largely depend on the pre-treatment methodology
final particle size and physical structure of the lignocellulosic substrates (Eskicioglu et
al 2017) Reduction in particle size in order to increase the surface area and pore size is
one of the main characteristics of such mechanical pre-treatments (Galbe and Zacchi
2007 Palmowski and Muumlller 2000 Taherzadeh and Karimi 2008) Table 26 tabulates
the improvement in the methane yield of lignocellulosic substrates due to different
physical pre-treatment methodologies However significant energy consumption for
mechanical pre-treatment is one of its major disadvantages (Paudel et al 2017)
Ultrasound and microwave technologies have also proved to be efficient in increasing
the methane yields by cleavage of β-14 glucan bonds which increases the accessibility
for microbes(Chandra et al 2012) However the high cost associated with mechanical
pre-treatments made it less popular on commercial-scale operations (Chandra et al
2012) Production of inhibiting by-products high cost and higher energy consumption
prevents the commercial use of these technologies (Neshat et al 2017)
Liquid hot water pre-treatment is a methodology in which pressure is generated so as to
maintain water at an elevated temperature in the liquid state for a few minutes (Kumar
et al 2009) This process doesnrsquot require rapid decomposition Catalyst is also not used
in liquid hot water pre-treatment technique Pressurised water enters into the biomass
increasing the surface area and thereby removing hemicellulose and lignin (Mosier et al
2005) Liquid hot water pre-treatment methodology is attractive as it is a low-cost
process and doesnrsquot involve the use of any catalyst for the pre-treatment However
water and energy requirements are higher
The steam explosion was introduced tested and patented by Mason et al (1926) In the
steam explosion the substrates were subjected to hot steam (180 oC to 240 oC) and
Chapter 2 Literature Review
29
pressure (1 to 35 MPa) followed by explosive decompression of the biomass resulting
in the rupture of the rigid structure of biomass fibres (Stelte 2013) The sudden pressure
release will cause the cellulose bundles to defibrillate and thus increases the
accessibility of the cellulose for enzymatic hydrolysis and fermentation (Stelte 2013)
Steam explosion is a cost-effective pre-treatment methodology as it avoids the usage of
any chemicals Equipment corrosion is minimum in steam explosion pre-treatment due
to the absence of chemicals A good yield of hemicellulose with low degraded by-
products could be obtained from steam explosion pre-treatment (Stelte 2013)
During the steam explosion process lignin is softened causing it to be released from
the cell wall and leads to a uniform distribution of lignin into the raw material (Kumar
et al 2009) Steam explosion reduces the time required by the microorganisms to
access the cellulose and hemicellulose (Hendriks and Zeeman 2009) resulting in an
increase in the rate of hydrolysis and more methane can be produced from the substrate
in comparatively lesser time compared to the untreated substrates (Paudel et al 2017)
The hydraulic retention time of the digester is also reduced as a result of steam
explosion (Bauer et al 2014a) The absence of acid or base will reduce the risk of high
or low pH of the inoculum substrate mixture (Lizasoain et al 2016) Even though the
steam explosion process is one among the easiest and cheapest process of pre-treatment
of lignocellulosic substrates the main challenges faced in this pre-treatment method is
the formation of toxic compounds and destruction of xylan fraction (Hendriks and
Zeeman 2009)
Previous studies on the steam explosion showed an improvement in methane yield For
instance the steam explosion of potato pulp reported by Kryvoruchko et al (2009)
produced 373 mlCH4gVSadded which was 12 more than the untreated substrate
(Kryvoruchko Machmuumlller Bodiroza Amon and Amon 2009) Similarly Bauer et al
(2009) reported a higher methane yield of 331 mLCH4gVSadded (an increase of 20
Chapter 2 Literature Review
30
CH4) when wheat straw was subjected to steam explosion pre-treatment (Bauer Boumlsch
Friedl and Amon 2009) Table 26 summarises similar studies that include various
mechanical pre-treatment
Chapter 2 Literature Review
31
Table 26 Previous studies and their results on mechanical pre-treatments
Sl
No
Pre-treatment
method
Lignocellulosic
substrates
Pre-treatment
condition
CH4 production
after pre-
treatment
(mLCH4gVSadded)
Increase in
CH4 ()
References
1 Milling Maize silage 2 mm 410 11 (Bruni Jensen Pedersen
and Angelidaki 2010)
Maize stalks 2 mm 272 0 (Menardo Airoldi and
Balsari 2012)
Barley straw 5 mm 370 54 (Menardo et al 2012)
2 Steam explosion Potato pulp 107 oC 15 minutes 373 12 (Kryvoruchko et al 2009)
Cane leaf matter 200 oC 10 minutes 237 3 (Mokomele et al 2019)
Harvested hay 175 oC 10 minutes 281 16 (Bauer et al 2014b)
Rice straw 200 oC 2 minutes 329 51 (Zhou et al 2016)
Wheat straw 180 oC 15 minutes 361 20 (Bauer et al 2009)
Kitchen waste 120 oC 15 minutes 930 43 (Li Jin Li Li and Yu
2016)
Reed biomass 200 oC 15 minutes 350 89 (Lizasoain et al 2016)
Olive mill solid
waste
200 oC 5 minutes 589 61 (Rincoacuten Rodriacuteguez-
Gutieacuterrez Bujalance
Fernaacutendez-Bolantildeos and
Borja 2016)
Chapter 2 Literature Review
32
salix 230 oC 5 minutes 241 50 (Estevez Linjordet and
Morken 2012)
3 Microwave Switchgrass 150 oC 2450
MHz 1600 W
320 8 (Jackowiak Frigon
Ribeiro Pauss and Guiot
2011)
Wheat straw 150 oC 2450
MHz 1600 W
345 28 (Jackowiak Bassard
Pauss and Ribeiro 2011)
4 Liquid Hot Water Wheat straw 120 oC 1 hour 299 64 (Menardo et al 2012)
Sunflower stalks 170 oC 1 hour 219 14 (Monlau Barakat Steyer
and Carrere 2012)
Cynara stalks 160 oC 1 hour 24 (Oliveira Gominho
Diberardino and Duarte
2012)
Rice straw 120 oC 1 hour 261 32 (Menardo et al 2012)
Barley straw 90 oC 1 hour 340 42 (Menardo et al 2012)
Maize stalks 120 oC 1 hour 267 9 (Menardo et al 2012)
Chapter 2 Literature Review
33
282 Chemical Pre-treatment
Disruption in the structure of lignocellulosic biomass as a result of chemical treatment is
known as chemical pre-treatment The main types of chemical pre-treatment can be
broadly classified as oxidative acidic alkaline ionic and inorganic salts pre-treatments
(Chen et al 2017) Oxidative pre-treatment is done to enhance methane yield of a
lignocellulosic substrate by subjecting the substrate to an oxidising alkaline medium at a
high temperature (~ 190 oC) for a short period (~ 30 minutes) (Teghammar Yngvesson
Lundin Taherzadeh and Horvaacuteth 2010) This chemical action is solubilising soluble
lignin and hemicellulose in the lignocellulosic materials and thereby the surface area of
cellulose is being increased (Monlau et al 2012)
Bases such as calcium potassium and sodium hydroxides are used to perform alkaline
chemical pre-treatment on lignocellulosic substrates (Chen et al 2017) Alkaline pre-
treatment is reported to be an efficient technique in the removal of lignin and preserving
carbohydrates and cellulose to enhance microbial activity which leads to a faster and
increased methane yield from the substrates (Zhu Wan and Li 2010) Alkaline pre-
treatment can also be used to increase pore size and accessible surface area (Datta 1981
Gharpuray Lee and Fan 1983) However these alkaline chemical pre-treatment
methodologies were restricted to minimal usage due to its chemical requirements and
formation of inhibitory compounds
Dilute acids are generally used for acidic chemical pre-treatment of lignocellulosic
substrates Acidic pre-treatments are generally carried out for short retention times (~ 1-
5 minutes) and high temperature (~120 ndash 170 oC) or long retention time (~15 minutes-1
day) and low temperature (~25 oC) Sulfuric acid hydrochloric acid and nitric acid are
the primary reagents used in acidic chemical pre-treatments (Gunes et al 2019) Acidic
pre-treatment breaks the bonds between ligninphenolics and carbohydrates complexes
Chapter 2 Literature Review
34
so that cellulose and hemicellulose are readily available for the microbes (Knappert
Grethlein and Converse 1980) Similar to alkaline pre-treatment acidic pre-treatment
also has a significant drawback as the requirement of chemicals and the formation of
inhibitory compounds from the hemicellulose degradation (Larsson et al 1999)
Ionic liquids are also used for pre-treating the lignocellulosic biomass These liquids are
capable of dissolving lignocellulosic materials producing cellulose with a little residual
crystallinity (Samayam and Schall 2010) Despite having limited environmental issues
as these ionic liquids are capable of reusing even after pre-treatment they are less
popular due to the high cost of these compounds (Nguyen et al 2010)
Some of the inorganic salts also have been tested as a catalyst in chemical pre-treatment
of lignocellulosic substrates Generally such pre-treatments are being conducted at a
higher temperature (~160 oC) for few minutes (~45 minutes) (Liu et al 2009a Liu et
al 2009b Monlau et al 2012) Chemical pre-treatment is efficient in breaking the
ester linkage and the bonds between carbohydrates and lignin However the effect on
delignification is limited in chemical pre-treatment (Liu et al 2009a Liu et al 2009b)
The main drawback of inorganic salts pre-treatment is the presence of an excessive
amount of trace elements which will lead to inhibition of the process (Liu et al 2009a)
283 Biological pre-treatment
Destruction of the lignocellulosic structure of the biomass using any living organisms is
known as biological pre-treatment (Neshat et al 2017) Unlike physical and chemical
pre-treatment biological pre-treatments are more sustainable for the environment (Lee
1997 Taherzadeh and Karimi 2008) Commercial enzymes or fungi are being used to
break the complex bonding structure of lignocellulosic materials Different types of
commercial enzymes such as the endoglucanase exoglucanase and xylanase are being
synthesised and used for biological pre-treatment techniques (Lopez et al 2007) The
Chapter 2 Literature Review
35
high enzymatic activity leads to the breakdown of complex lignocellulosic structure
(Lopez et al 2007) The main drawback of biological pre-treatment is the dependency
of enzymatic activity on temperature and pH (Kainthola et al 2019) Ensiling of
biomass is also considered as a biological pre-treatment (Janke et al 2019) Ensiling
induces an anaerobic condition that will convert many insoluble sugars into organic
acids and helps in preserving structural proteins and carbohydrates (Vervaeren Hostyn
Ghekiere and Willems 2010)
29 Anaerobic co-digestion
Anaerobic co-digestion is the process of combining two or more substrates to
supplement the deficiency of a substrate if subjected to the AD process as mono-
digestion (Song and Zhang 2015) Moreover anaerobic co-digestion of lignocellulosic
substrates with manure helps to maintain a stable pH within the methanogenesis range
(Kaparaju and Rintala 2005) Improved biogas yield and economic advantages
associated with the sharing of equipment resulted in an increased interest among co-
digestion of lignocellulosic substrates with manure (Li Li Zheng Fu and Lar 2009)
Mata-Alvarez et al (2002) reported that anaerobic co-digestion of substrates established
a positive synergism in the digester (Mata-Aacutelvarez 2002)
SCT and SCB are substrates with a high CN ratio that can be co-digested with
substrates with a lower CN ratio such as the cow manure chicken manure pig manure
etc In addition to improving the CN ratio of the substrate inoculum mixture co-
digestion also improves the trace nutrients content requirement for the AD process
(Sawatdeenarunat et al 2015) It also helps in the effective utilisation of the digester
volumes and more methane yield can be attained from the digester of the same volume
by incorporating co-digestion techniques (Li et al 2009)Co-digestion of energy crops
and animal manure resulted in increased plant output without changing the reactor
Chapter 2 Literature Review
36
volume (Lindorfer Loacutepez Resch Braun and Kirchmayr 2007) For instance
Mokomele et al (2019) reported an increase of 7 in cumulative methane in co-
digesting sugarcane leaves and cow manure in 7525 ratio than the mono-digestion of
dairy cow manure (Mokomele et al 2019) Similarly an 18 increase in methane yield
was reported by Zheng et al (2015) when switchgrass and diary manure was co-
digested (Zheng et al 2015)
Co-digestion reduces the waste disposal issues related to the animal excreta and thereby
reduces GHG emissions (Shen et al 2018) On the other hand the co-digested digestate
has a greater fertilizer value compared to the digestate of mono-digestion (Li et al
2014) Thus co-digesting the lignocellulosic waste from the agricultural residue of
sugarcane along with the cattle manure can improve the overall production yield of the
AD process
Many studies have been conducted regarding the co-digestion of nitrogen-rich
substrates with carbon-rich lignocellulosic materials to supplement the deficiencies of
these batch assays Table 27 summarises some of the significant studies in this field
along with their results
Chapter 2 Literature Review
37
Table 27 Results of previous studies on the effect of feed ratios during the anaerobic co-digestion of manure and lignocellulosic agro
wastes
Sl
No
Substrates Operating
conditions
Feed Ratios
tested
Pre-treatment Results Reference
1 Sugarcane leaves
+ Diary cow
manure
100 mL Mesophilic
temperature ISR =
04 55 days
1000 7525
5050 2575
0100 (VS basis)
Steam explosion 0100 (274
LCH4kgVSadded)
(Mokomele et al
2019)
2 Sugarcane
Bagasse + Diary
cow manure
100 mL Mesophilic
temperature ISR =
04 55 days
1000 5050
0100 (VS basis)
Steam explosion 0100 (274
LCH4kgVSadded)
(Mokomele et al
2019)
3 Sugarcane leaves
+ Diary cow
manure
100 mL Mesophilic
temperature ISR =
04 55 days
1000 7525
5050 2575
0100 (VS basis)
NA 7525 (292
LCH4kgVSadded)
(Mokomele et al
2019)
4 Switchgrass +
Diary manure
500 mL Mesophilic
temperature ISR =
067 30 days
1000 7525
5050 2575
0100 (TS basis)
NA 5050 18 increment
in methane yield than
mono-digestion of
switchgrass
(Zheng et al 2015)
5 Salix viminalis +
Cow manure
1125 mL
mesophilic
temperature ISR =
067 57 days
1000 8020
7030 6040
5050 4060
3070 2080
0100 (VS basis)
Steam explosion 0100 (239
mLCH4gVS)
pre-treated salix (1976
mLgVS) has 23
(Estevez et al 2012)
Chapter 2 Literature Review
38
improvement over
untreated salix
6 Corn Stover + Pig
Manure
250 mL Mesophilic
temperature ISR =
026 70 days
1000 8020
6733 5050
3367 2080
0100 (VS basis)
NA 0100 (889
mLCH4gVS)
(Li et al 2018b)
7 Cotton stalk +
swine manure
500 mL Mesophilic
temperature ISR =
025 45 days
1000 7525
5050 2575 (TS
basis)
NA 5050 19-fold increase
in yield when
compared to control
(102 mLCH4gVS)
(Cheng and Zhong
2014)
8 Apple waste +
Chicken manure
250 mL Mesophilic
temperature ISR =
026 70 days
1000 8020
6733 5050
3367 2080
0100 (VS basis)
NA 3367 (827
mLCH4gVS)
(Li et al 2018b)
9 Whey + cow
manure
400 mL Mesophilic
temperature 55 days
1000 8515
7525 5050
2575 1585
0100 (VS basis)
NA 8515 (266
mLCH4gVS)
(Vivekanand Mulat
Eijsink and Horn
2018)
Chapter 2 Literature Review
39
291 Chicken manure as a co-digestion substrate
Chicken manure also known as poultry litter can be described as a mixture of excreted
manure water spilled feed feathers and bedding materials from a poultry farm
Traditionally the chicken manure was spread on land as a fertilizer or disposed of to
landfill (Abouelenien Namba Kosseva Nishio and Nakashimada 2014) With
increasing environmental concerns related to spreading litter on land and the rising cost
of energy more attention was given for developing more value from these kinds of
wastes in the form of energy (Li et al 2014)
The potential of manure being used to produce biogas using AD technology was
identified and various experiments were conducted by different researchers
(Abouelenien et al 2014 Kalamaras and Kotsopoulos 2014 Masih-Das and Tao 2018
Mokomele et al 2019 Shen et al 2018) However one of the main drawbacks of the
manure as a mono-digestion substrate was the low CN ratio which caused the system
to inhibit the process and result in low gas production (Abouelenien Kitamura Nishio
and Nakashimada 2009) Later with the advancement of co-digestion technology the
potential of manure to be used as co-substrate in the AD process started to get its
priority (Mokomele et al 2019) Using poultry manure for the AD process not only
improved the biogas potential of substrates with a high CN ratio but also helped in
solving various issues related to the waste management from poultry farms (Neshat et
al 2017)
Table 28 tabulates a list of studies that were conducted by various researchers which
used different kind of manures to enhance biodegradability and to improve methane
yield using AD technology Cow manure pig manure horse manure chicken manure
etc were used by various researchers such as Mao et al (2017) Zhang et al (2017) and
Moset et al (2017) in their studies All these studies reported an improvement in
Chapter 2 Literature Review
40
methane yield as a result of co-digestion with manures Studies conducted by Awasthi
et al (2019) reported chicken manure to produce highest biogas production rate of 04
m3kg of dry matter while comparing it with pig sheep cattle horse and duck manure
Similar results were also reported by Neshat et al (2017) Thus use of chicken manure
as a co-substrate in co-digestion with lignocellulosic substrates can result in a better
degradation of organic matter and thus better methane yield can be expected (Neshat et
al 2017)
Chapter 2 Literature Review
41
Table 28 Previous studies reporting improvement in methane yields as a result of co-digesting with manure
Sl No Base substrates Manure Results References
1 Grass silage Pig manure
Co-digestion ratio of 31 (grass silagepig manure) resulted in 87 more
methane yield compared to mono-digestion of PM (2798
LCH4kgVSadded) (Xie et al 2011)
2 Grass Cow manure
Up to 20 improvement in methane yield in co-digestion than mono-
digestion of cow manure (276 NLCH4kginfluent) (Moset et al 2017)
3 Corn straw Pig manure
Co-digestion ratio of 37 (corn strawpig manure) produced maximum
methane yield of 220 LCH4kgVSadded (Mao et al 2017)
4 Food waste Horse manure
Co-digestion ratio of 11 (food wastehorse manure) resulted in 227
more methane than mono-digestion of horse manure (370
LCH4kgVSadded) (Zhang et al 2017)
5 Meadow grass Pig manure
Co-digestion ratio of 19 (meadow grasspig manure) resulted in 159
more methane yield compared to mono-digestion of pig mnaure
(337 LCH4kgVSadded) (Tsapekos et al 2017)
6
Organic fraction of
municipal solid waste Chicken manure
Co-digestion ratio of 11 produced more methane yield than the mono-
digestion of chicken manure (1500Nml) (Matheri et al 2017)
7 Apple waste Chicken manure
Co-digestion ratio of 12 (apple wastechicken manure) produced highest
methane yield (827 LCH4kgVSadded) (Li et al 2018)
Chapter 2 Literature Review
42
210 Overview of Literature review
The increasing agro-wastes in Australia facilitates the use of anaerobic digestion
techniques to produce energy from wastes Sugarcane agricultural wastes viz the SCT
and SCB contribute a large quantity in the total agro wastes produced in Australia (FAO
2018) Various factors contribute to maximising energy production using this technique
The use of nitrogen-rich manure with sugarcane agricultural wastes could be favouring
more methane yield from these wastes The usage of manure for increasing nitrogen
content is more environmentally sustainable than using chemicals to improve the CN
ratio of the digester Moreover it helps in the efficient usage of poultry wastes Based
on the literature study conducted it was found that not much research has been done on
co-digesting the carbon-rich lignocellulosic sugarcane wastes with nitrogen-rich chicken
manure There exists a research gap in this field regarding the effect of different feed
ratios on methane yields during anaerobic co-digestion of sugarcane waste with chicken
manure which is investigated in this study This study is also extended to investigate
the behaviour of pre-treated SCT and SCB with different feed ratios while co-digesting
with CM This study aims to reveal which feed ratio produces more yield and the
synergistic or antagonistic effects of co-digestion of pre-treateduntreated SCT and SCB
with CM
Chapter 3 Materials and Methods
43
Chapter 3 Materials and methods
Chapter 3 Materials and Methods
44
Chapter 3 Materials and Methods
45
31 Substrates
Substrates used in this study include SCT SCB and CM These three substrates were
used to study the effect of feed ratio and pre-treatment on methane yields during
anaerobic co-digestion of the agricultural residue of sugarcane with CM SCT and SCB
were the substrates subjected to pre-treatment to study the effect of pre-treatment
311 Lignocellulosic substrates
SCT was collected from the sugarcane fields of the Racecourse sugar mill Mackay
Queensland The collected SCT was then milled to nearly 2 mm particle size The
prepared SCT was then stored at 4 oC until further use On the other hand the SCB was
collected from the Racecourse sugar mill Mackay Queensland SCB was also
subjected to a similar milling process to reduce the particle size to nearly 2 mm in order
to use it for the BMP test and then stored at 4 oC till further use
312 Manure
CM used in this experiment was collected from poultry farms in Mareeba (northern
Queensland) CM mainly composed of the poultry feed beddings excreta etc The
collected CM was stored at 4 oC until further use
32 Inoculum
The inoculum used in this experiment was collected from a full-scale biogas plant
treating sewage sludge under mesophilic conditions (Queensland Urban Utilities
Luggage point Pinkenba Brisbane) The collected inoculum was stored at 4 oC and was
pre-incubated at 37 oC for one week at the bioprocess engineering laboratory of Griffith
University Nathan campus Brisbane Australia in order to reactivate the micro-
organisms and any to remove any residual methane from the inoculum
Chapter 3 Materials and Methods
46
33 Pre-treatment of lignocellulosic substrates
Based on the various pre-treatment studied in section 28 steam explosion pre-treatment
had a clear advantage over the other types of pre-treatment mainly due to its low cost in
pre-treating lignocellulosic substrates Thus steam explosion pre-treatment was adopted
as the pre-treatment method for this study Steam explosion pre-treatment was
conducted in a two-step pilot-scale reactor at the Renewable bio-commodities pilot
plant Racecourse sugar mill Mackay Queensland designed and built by Andrtiz Inc
(USA) 20 kg of the substrate (SCTSCB) was mixed with 20 kg of water (50
moisture by weight) in a first stage stainless steel horizontal reactor with a capacity of
150L and incubated at room temperature for one hour The substrates were then loaded
to a second stage vertical reactor with 22 m lengthy and diameter 02 m in which the
steam impregnation was done at 130 oC for 5 minutes followed by a steam explosion
(explosion pressure = 2 MPa) (Harrison et al 2013 Zhang Wong Albertson Doherty
and OrsquoHara 2013b)
34 Experimental Design
SCT and SCB were co-digested with CM in different feed ratios in order to investigate
the effect of feed ratios on methane yields during anaerobic digestion The sugarcane
residue used were further divided into pre-treated (steam explosion) and untreated
substrates The same feed ratios were designed for pre-treated sugarcane trash (Pre-
treated SCT) untreated sugarcane trash (Untreated SCT) pre-treated sugarcane bagasse
(Pre-treated SCB) and untreated sugarcane bagasse (Untreated SCB) with chicken
manure (CM) Table 31 shows the various feed ratios tested in this work such as 1000
7525 5050 2575 0100 for Pre-treated SCTUntreated SCTPre-treated
SCBUntreated SCBCM Various substrates used in this study are shown in Figure 31
and the flowchart of methodology of this research work is shown in figure 32
Chapter 3 Materials and Methods
47
Figure 31 Substrates used in this study (A) Untreated SCT (B) Pre-treated SCT (C)
Untreated SCB (D) Pre-treated SCB (E) CM
Table 31 Different feed ratios in anaerobic co-digestion of SCT and SCB with CM
tested in this study
Sample Untreated
SCT ()
Pre-treated
SCT ()
Untreated
SCB ()
Pre-treated
SCB ()
CM
()
Untreated SCT 100 0 0 0 0
Co-digestion 1 75 0 0 0 25
Co-digestion 2 50 0 0 0 50
Co-digestion 3 25 0 0 0 75
Pre-treated SCT 0 100 0 0 0
Co-digestion 4 0 75 0 0 25
Co-digestion 5 0 50 0 0 50
Co-digestion 6 0 25 0 0 75
Untreated SCB 0 0 100 0 0
Co-digestion 7 0 0 75 0 25
Co-digestion 8 0 0 50 0 50
Co-digestion 9 0 0 25 0 75
Pre-treated SCB 0 0 0 100 0
Co-digestion 10 0 0 0 75 25
Co-digestion 11 0 0 0 50 50
Co-digestion 12 0 0 0 25 75
CM 0 0 0 0 100
Chapter 3 Materials and Methods
48
Figure 32 Flowchart of methodology adopted in this research study
Initially the substrates and inoculum is subjected to a set of pre-BMP analysis Based
on the results obtained from these analysis BMP preparation calculations are done to
estimate the quantity of substrate and inoculum required for the designed parameters
BMP assays are prepared based on these design parameters and incubated at the
designed temperature GC analysis is performed in calculated intervals to obtain the
quantity and composition of biogas produced in the assays This process is continued
Chapter 3 Materials and Methods
49
until the BMP termination where there is no significant gas production from any of the
assays in successive GC test intervals After the BMP termination digestates are
collected for post-BMP analysis Data obtained from the pre-BMP analysis GC analysis
and post-BMP analysis are integrated and results are formed based on various data
processing techniques
35 Analytical methods
351 Determination of TS and VS
TS and VS of the substrates and inoculum were determined before the start of the
experiment using the Standard Methods (APHA 1995)
352 Determination of Chemical Oxygen Demand (COD)
The COD of the substrates and inoculum was determined according to the standard
methods described elsewhere (Latif Mehta and Batstone 2017) Briefly high range
COD vials (500 ndash 10000 mg L-1) were used to make dilutions using suitable dilution
factors Deionised water was used to make these dilutions The prepared dilutions were
then thermally digested using Spectroquant TR 620 COD digester at 148 oC for 2 hours
After the vials being cooled down to the room temperature COD values were examined
using a spectrophotometer Move 100 (Merck)
353 Determination of Total Kjeldahl Nitrogen (TKN) Total Kjeldahl
Phosphorous (TKP) soluble and total metal ions
The soluble and total metal ions of the sample were measured along with TKP and TKN
using Perkin Elmer (USA) Optima 7300DV inductivity coupled plasma ndash optical
emission spectroscopy (ICP-OES) equipped with WinLab32 software (Latif Mehta and
Batstone 2015)
Chapter 3 Materials and Methods
50
354 Determination of CN ratio
The CN ratio of the sample was determined using Sercon Europa EA-GSL elemental
analyser by combusting the sample at 1050 oC The sample was then inter-phased to a
Sercon Hydra 20-22 (IRMS) as per the standard methods described elsewhere (Beckett
Cresswell Grice and Carter 2015)
355 Determination of cellulose hemicellulose and lignin
The chemical composition of the samples was analysed using the standard procedures
described in Pasangulapati et at (2012) (Pasangulapati et al 2012) Briefly dried
samples were sieved through 250 μm sieve plates according to the procedures
demonstrated in Hames et al (2008) of the National Renewable Energy Laboratory
(NREL) Biomass retained on the sieve plate was subjected to the accelerated solvent
extractor to remove any non-structural material (Sluiter et al 2008) A two-step acid
hydrolysis methodology was used to analyse structural carbohydrates lignin acetyl and
ash content from the residual material To determine the acid-insoluble lignin a muffle
furnace was used HPLC with a refractive index detector (Bio-Rad Aminex HPX-87P
column) was used to analyse structural carbohydrates During a total run time of 30
minutes column temperature of 85 oC an eluent flow rate of 06 mLmin (deionized
water) was maintained A UV-vis spectrophotometer was used to analyse the acid
soluble lignin at a wavelength of 205 nm and an extinction coefficient of 1101g-cm
356 Determination of VFA
VFAs of the samples were determined using a gas chromatograph (Agilent model
78090A USA) with flame ionization detection according to the standard methods and
protocols described elsewhere (Latif et al 2015)
Chapter 3 Materials and Methods
51
357 Determination of ammoniacal nitrogen (NH4-N) and phosphate
(PO43-)
NH4-N and PO43- contents in the sample were determined using flow injection analyser
(FIA) Lachat Instruments USA Quick Chem 8000 according to the methods described
elsewhere (Latif et al 2015)
36 Biochemical Methane Potential (BMP) tests
BMP tests were conducted for all the feed ratios mentioned above as in Table 31 An
inoculum to substrate ratio of 2 was maintained in all the assays BMP test was
conducted in 160 mL serum bottles with 100 mL working volume as per the standard
BMP protocols described elsewhere (Angelidaki et al 2009) A feeding load of 08gVS
was maintained in all assays Distilled water was used to make the working volume of
100mL pH in all assays was monitored before sealing the cap and was made neutral
(69 ndash 72) by the addition of an adequate amount of 1M HCl or NaOH solution The
anaerobic condition was maintained in the headspace by flushing the headspace with
99 pure nitrogen gas for 3 minutes The prepared assays (Figure 33) were then closed
with a butyl rubber stopper and sealed with aluminium crimps Sealed assays were then
incubated at mesophilic conditions (37 plusmn 01 oC)
Chapter 3 Materials and Methods
52
Figure 33 sealed 160 mL serum bottle for BMP test with inoculum substrate and
headspace flushed with nitrogen gas
Quantity of biogas produced from the assays was calculated by measuring the pressure
developed in the headspace by using the manometer displacement method A sample
gas of known volume was drawn from the headspace of the assay and subjected to a U-
tube manometer to find the volume of water displaced by the headspace pressure The
sample gas which was normalised to atmospheric pressure was then subjected to gas-
chromatography (Schimadzu GC-2014 Japan) (Figure 34) to examine the composition
of the gas from the headspace
Chapter 3 Materials and Methods
53
Figure 34 Gas chromatography machine (GC-2014)
The gas chromatograph used for this research was equipped with a Thermal
Conductivity Detector (TCD) and chin carbon ST 100120 packed column It had a
length of 2 m an outer diameter of 116rsquorsquo and an inner diameter of 1 mm A sample
loop of 1 mL (Valco GC valve) was used for injection A temperature of 75 oC and
110 oC was set for the injector and oven of the gas chromatograph However the
detector temperature of the gas chromatograph was set to 120 oC Argon gas of ultra-
high purity at a flow rate of 275 mL min-1 and 7238 kPa was used as the carrier gas
Chapter 3 Materials and Methods
54
37 Data Processing
371 Theoretical BMP
The maximum biochemical methane potential of a substrate or a combination of
substrates estimated based on the amount of COD that is fed to the assays through these
substrates or combination of these substrates is known as the theoretical BMP
(BMPthCOD) The theoretical BMP of each feed ratio was calculated based on the
chemical analysis done before the start of the BMP test Theoretical BMP can be
calculated based on equation 31 and is expressed as mlCH4gVSadded (Nielfa Cano and
Fdz-Polanco 2015)
ᆒ㢐ᆒ썈υ =ᆒt
tttEq31
R represents the universal gas constant (0082 atm Lmol K) Temperature of operation
is denoted by T (31015K) the pressure is given by p (1 atm) VSadded is the amount of
VS added in the assay through the substrate The number of moles of CH4 can be
calculated using equation 32 (Nielfa et al 2015) and is denoted by ηCH4
ᆒt =ᆒ썈υ
Eq32
COD denotes the total COD in the assay from the substrate or combination of substrates
372 Experimental BMP
The amount of methane produced experimentally per gram of VS (gVS) added to the
assay through the substrates is termed as the experimental BMP and is expressed as mL-
CH4gVSadded To estimate the methane potential of the substrate assay with the same
quantity of inoculum alone is operated as blank and the methane production from the
blank is subtracted from the methane produced from the assays with substrates and
Chapter 3 Materials and Methods
55
inoculum (Zhang et al 2014) Thus the experimental BMP values can be calculated
using equation 33
ᆒ = 䇅ᆒ㢐戴 戴ᆒ㢐戴 Eq33
The volume of methane produced per gVS of the substrate from the assay containing
substrates and inoculum at STP is denoted by VsubSTPmethane and volume of methane
produced per gVS of inoculum from the assay containing inoculum alone at STP is
expressed as VinoSTPmethane To reduce the error in experimental data analysis all batch
assays were prepared in triplicates and the average production from these three assays
are used for calculations
The volume of methane produced per gram VS of substrate added at STP during a
sample event can be calculated using equation 34 and equation 35 (Kafle Kim and
Sung 2012)
䇅ᆒ㢐戴 =s ᆒ㢐戴 Σ gVS䇅ݏ
Eq34
戴ᆒ㢐戴 =s ᆒ㢐戴 gVS戴䇅䇅
Eq35
Where Vbiogas is the volume of biogas produced in the sample event Cmethane is the
concentration of methane in the headspace of assays Rvol is the Ratio used to normalise
the temperature during volume measurement (Rvol = 111 for mesophilic condition and
volume measurement is done at 30 oC ndash room temperature calculated based on the ideal
gas equation) ƩgVSsubstrate is the sum of VS added to the assays through substrate or the
mixture of substrates and gVSinoculum is the grams of volatile solids in the blank assays
through the inoculum
Chapter 3 Materials and Methods
56
373 Synergistic effects analysis
The synergistic effects analysis of the co-digestion mixture is done in order to evaluate
the influence of each substrate in different feed ratio mixtures It also helps to estimate
the synergetic effects that could be produced during the biodegradation process The
synergetic effect (α) was calculated using equation 36 (Nielfa et al 2015)
= 戴ݏ t䇅戴ݏ㢐ݏ t䇅戴ݏ
Eq36
Experimental production is the experimental cumulative methane yield from the co-
digestion assay at the end of the BMP test and theoretical production is the methane
yield calculated from the sole substrates considering the contribution of VS from them
to form the co-digestion mixture
374 Anaerobic biodegradability
Anaerobic biodegradability of a batch assay is the measure of the amount of degradation
in VS or COD of an assay as a result of the anaerobic digestion process happening
during the BMP test Anaerobic biodegradability is calculated in this experiment
according to the standard methods and protocols outlined in Nielfa et al 2015 COD
and VS in each bottle is measured before the start of BMP and also after terminating the
BMP CODi and CODf represent the initial and final COD of the assays and VSi and VSf
indicate the initial and final VS in the assays respectively Biodegradability (BD)
calculated based on the COD values are done according to equation 6 BD calculated
based on COD is expressed as BDexpCOD as in equation 37 (Nielfa et al 2015)
υᆒ썈υ = ᆒ썈υ ᆒ썈υᆒ썈υ
tt Eq37
Chapter 3 Materials and Methods
57
BD calculated based on the VS of assays can be done according to equation 7 BD
calculated based on VS is expressed as BDexpVS as in equation 38 (Nielfa et al 2015)
υ =
tt Eq38
Theoretical maximum methane production estimated in equation one was corrected with
biodegradability to obtain the BD corrected BMP which was then compared with the
experimental BMP results to validate the experimental methane production from batch
assays BD corrected BMP values can be written as in equation 39 (Nielfa et al 2015)
ᆒ㢐υ = ᆒ㢐ᆒ썈υ υᆒ썈υ Eq39
The relative error between the experimental BMP and BD corrected BMP can be
calculated using equation 310 (Nielfa et al 2015) A smaller value of error indicates a
minor deviation of experimental results with the predicted results
ݏݏݏ = ᆒ ᆒ㢐υᆒ
Eq310
375 BMP mathematical Models
The experimental biochemical methane potential of different feed ratios was modelled
based on the first-order kinetic model and modified Gompertz model Different model
variables of these two models were estimated using Microsoft excels solver function
These model parameters were used to determine the rate and performance of the AD
process The experimental data were compared with both the first-order model and the
modified Gompertz model to test the curve fitting following these models
Chapter 3 Materials and Methods
58
3751 First-order kinetic model
The anaerobic digestion process in batch assays was assumed to follow the first-order
kinetic model as the substrates used in this AD process are lignocellulosic materials
and hydrolysis is considered as the rate-limiting step for such substrates (Angelidaki et
al 2009) The first-order kinetic model equation is as given in equation 311 (Zhang et
al 2014)
= t 㢐t) Eq311
The cumulative methane yield of the substrate is denoted by B and is measured in ml-
CH4gVSadded The ultimate methane potential of the assay is denoted by Bo and has the
same unit as that of the biochemical methane potential of the assay The hydrolysis rate
constant of the AD process is denoted by khyd It represents the rate of hydrolysis of the
AD process and has a unit of d-1 The time of the process is denoted by t and is
calculated as the difference between cumulative time from the start of the experiment
and the time delay of the assay
3752 Modified Gompertz model
The cumulative methane production from the batch assays was also modelled using the
modified Gompertz model according to equation 312 (Shen et al 2018) The modified
Gompertz model assumes that biogas production in the assays was directly proportional
to the microbial activity in the assay
= t
t
Eq312
The ultimate methane production from the assays in an infinite period was given by Go
(ml-CH4gVSadded) G gives the modelled biochemical methane potential of the assay at
time t and has the same unit as that of the ultimate biochemical methane potential Rm
Chapter 3 Materials and Methods
59
denotes the rate of reaction in the AD process (ml-CH4gVSaddedd and λ denote the lag
phase time constant for the assay (d)
376 Statistical Analysis
In order to evaluate the data-set for any significant difference within the groups and
between the groups statistical analysis of cumulative methane produced from triplicates
assays were performed using one-way ANOVA using SPSS software (Kalamaras and
Kotsopoulos 2014) The test was conducted at a 5 level of significance Multiple
comparison statistical test was also conducted among different feed ratios of the same
treatment using the post hoc (Tukey) test to check the mean difference of the assays at a
5 level of significance
Chapter 3 Materials and Methods
60
1
Chapter 4 Results and Discussions
61
Chapter 4 Results and discussions
Chapter 4 Results and Discussions
62
Chapter 4 Results and Discussions
63
41 Physical properties and chemical composition of substrates and
inoculum
Various physio-chemical properties of the substrates and inoculum used in this study
are presented in Table 41 The chemical composition of the substrates indicates that the
pre-treatment of SCT and SCB had a significant influence on their properties Untreated
SCT had a TS content of 913 The steam explosion of SCT resulted in a slight
reduction in TS content (Table 41) Similarly Untreated SCB contained 828 of
solids which was also reduced by nearly 1 as a result of the steam explosion pre-
treatment A similar reduction of TS content as a result of pre-treatment was reported by
Lizasoain et al (2016) Direct injection of steam during steam explosion pre-treatment
leading to solubilisation caused this reduction in dry matter content of pre-treated SCT
and SCB (Lizasoain et al 2016)
The organic matter content of Untreated SCT was 909 of dry matter (Table 41)
Steam explosion pre-treatment increased the VS content of SCT by 18 Similarly
VS content in Untreated SCB was 894 of TS and the steam explosion increased its
VS by 64 (Table 41) Estevez et al (2012) also reported a similar improvement in
VS content during the steam explosion of salix (Estevez et al 2012) Solubilisation of
organic matter as a result of steam explosion pre-treatment resulted in a higher VS
content in pre-treated SCT and SCB (Neshat et al 2017) The present study results are
in accord with those reported by Mokomele et al (2019) where the steam explosion
pre-treatment improved the VS of sugarcane bagasse by 4 (Mokomele et al 2019)
The CN ratio of SCT increased from 831 in untreated SCT to 953 in steam-exploded
SCT The corresponding values for SCB were 1465 and 1919 respectively (Table 41)
Mokomele et al (2019) also reported an increase from 152 to 171 in the CN ratio of
sugarcane bagasse as a result of the steam explosion pre-treatment (Mokomele et al
Chapter 4 Results and Discussions
64
2019) Enrichment of cellulose and lignin contents in steam-exploded SCT and SCB
biomass resulted in a higher CN ratio However the use of substrates with a high CN
ratio for biogas production can lead to VFA inhibition (Neshat et al 2017) Previously
several studies have shown the optimal CN ratio for biogas production is 20-301
(Abouelenien et al 2014 Li Liu Cui Yu and Ma 2018a Matheri et al 2018
Mokomele et al 2019 Neshat et al 2017 Sawatdeenarunat et al 2015) Thus to
improve the anaerobic biodegradability and biogas production SCT and SCB can be co-
digested with co-substrates rich in nitrogen CN ratio of nitrogen-rich manure is much
lower than that of the lignocellulosic agro-wastes (Song and Zhang 2015) For instance
Li et al (2014) reported the CN ratio of chicken manure as 101 (Li et al 2014) which
is similar to the results obtained in this study Similarly Mokomele et al (2019)
reported high CN values for SCB and cane leaf matter in his studies A CN ratio of
153 and 107 was reported for SCB and cane leaf matter respectively in the studies of
Mokomele et al (2019) which is in accord with the results attained in this study
(Mokomele et al 2019) Thus to optimise the CN ratio co-digestion of these two co-
substrates was done and the preferred feed ratio of co-digestion was investigated in this
study
Glucan concentration of both SCT and SCB was improved due to pre-treatment The
increase in glucan content after the steam explosion was 156 and 77 in SCT and
SCB respectively (Table 41) Similar results were also reported during the steam
explosion of bulrush (Wang et al 2010)In this study the glucan content of the
lignocellulosic bulrush increased from 361 to 398 due to pre-treatment Similarly
a slight reduction in total lignin content (about 1) was evident in the studies by Wang
et al (2010) The increase in glucan content with a corresponding decrease in
hemicellulose (xylan and arabinan) and lignin contents in steam-exploded
Chapter 4 Results and Discussions
65
lignocellulosic substrates was obviously due to disruption of cellulose structure as a
result of steam explosion pre-treatment (Wang et al 2010) During steam explosion
pre-treatment hemicellulose and a part of cellulose are hydrolysed into simple sugars
resulting in an increase in glucan content with a corresponding decrease in xylan
arabinan and lignin contents (Rodriacuteguez Rodriacuteguez Jimeacutenez Guilleacuten and Fernaacutendez-
Bolantildeos 2007)
Table 41 Physio-chemical properties of substrates and inoculum
Parameter Unit CMUntreated
SCT
Pre-treated
SCT
Untreated
SCB
Pre-treated
SCBInoculum
TS 721 913 872 828 819 19
VS TS 807 909 925 894 951 722
COD gl 7487 11598 12099 7939 9156 211
TSVS - 12 11 11 11 11 14
CN ratio - 124 831 953 1465 1919 49
Glucan ND 307 463 351 428 ND
Xylan ND 168 117 20 146 ND
Arabinan ND 28 14 21 16 ND
Lignin ND 298 283 315 282 ND
TKP gPkg 82 11 07 05 06 312
TKN gNkg 836 97 108 512 71 1113
Note ND Not determined
The macro- (P S Ca Na K and Mg) and micro- (Co Cu Fe Mn Mo Ni Se and Zn)
nutrient contents in the studied substrates are presented in Table 42 Results showed
that macro-micro nutrient contents in the pre-treated biomass were lower than the
corresponding untreated substrates except for Na and S
Chapter 4 Results and Discussions
66
Table 42 Macro and micronutrients of substrates and inoculum
Sample Units CMUntreated
SCT
Pre-treated
SCT
Untreated
SCB
Pre-treated
SCBInoculum
Al mgg 103 123 099 084 024 817
As mgg 000 000 000 000 000 000
B mgg 003 000 000 000 000 004
Ba mgg 004 002 002 001 001 019
Ca mgg 1687 312 167 025 015 1973
Cd mgg 000 000 000 000 000 000
Co mgg 000 000 000 000 000 001
Cr mgg 004 001 001 001 001 005
Cu mgg 011 000 000 000 000 056
Fe mgg 107 092 019 086 026 1972
K mgg 1977 601 283 293 076 1582
Mg mgg 461 188 138 036 028 666
Mn mgg 036 010 006 005 003 017
Mo mgg 001 000 000 000 000 003
Na mgg 171 007 034 001 004 1644
Ni mgg 002 000 000 000 000 005
P mgg 796 101 041 015 010 2735
Pb mgg 001 000 000 000 000 003
S mgg 321 082 809 018 524 1469
Se mgg 001 000 001 000 001 000
Zn mgg 027 000 000 000 000 067
Mokomele et al (2019) also reported a similar reduction in micro and macronutrients
possibly due to solubilisation of these nutrients in the water as a result of pre-treatment
(Mokomele et al 2019) Several previous studies show that the improvement in
sulphate or phosphate contents or the improvement in these two elements together
improved the rate of degradation of lignocellulosic biomass (Scherer Neumann
Demirel Schmidt and Unbehauen 2009) However the micro- and macro-nutrient
contents in this study are largely contributed by the inoculum as it is a major source for
Chapter 4 Results and Discussions
67
micro- and macro-nutrient Chicken manure a co-substrate in this study also contained
a higher amount of micro-and macro-nutrients which are required for the optimum AD
process (Hagos Zong Li Liu and Lu 2017)
42 Anaerobic co-digestion of untreated and steam exploded SCT with
CM
The effect of different feed ratios such as 7525 5050 and 2575 on methane yields
during the anaerobic co-digestion of SCT with CM was tested in this section Methane
yields of all the tested co-digestion ratios were compared with the mono-digestion of
both SCT and CM Different feed ratios of both untreated and pre-treated SCT were
compared and the results are presented in Table 43
421 Effect of different feed ratios on methane yields during anaerobic
co-digestion of SCT with CM
Results showed that feed ratio had a profound effect on methane production rates and
yields for both untreated and pre-treated SCT (Figure 41) For untreated SCT methane
production started after a lag phase of 3-4 days which could be possibly due to the lack
of readily available cellulose and hemicellulose in the assays as the untreated SCT
contained highly resistant and recalcitrant lignocellulosic structure (Sawatdeenarunat et
al 2015)
Thereafter methane production in all assays increased steadily and exhibited a similar
methane production rate during the initial seven days of incubation From day 7 to 14
methane production increased and higher methane production rates were noticed in
assays with a higher amount of CM than SCT Higher nitrogen contents in the assays
with more CM would have reduced the CN ratio to an optimum range which caused
Chapter 4 Results and Discussions
68
the methane yield to increase sharply (Li et al 2014) However the lesser amount of
carbon in assays with lesser Untreated SCT caused it to cease methane production at a
very early stage indicating a lower HRT cycle for the co-digestion feed ratio with lesser
Untreated SCT
Figure 41 Cumulative methane production during the anaerobic co-digestion of
untreated SCT (USCT) and Pre-treated SCT (PSCT) with CM at different feed ratios
incubated in a batch experiment at 37 oC for 83 days
On the other hand for steam-exploded SCT methane production started immediately
without any lag phase A similar trend in methane production without any lag phase was
reported during anaerobic digestion steam-exploded olive mill solid waste (Rincoacuten et al
2016) However methane production rates with pre-treated SCT were higher than those
of untreated SCT The ease in availability of the cellulose and hemicellulose in a pre-
treated substrate resulted in more accessibility of these elements to the microbes
Similar results were observed in the studies conducted elsewhere (Paudel et al 2017)
Thus a faster production of biogas in the pre-treated substrates assays than that of the
untreated substrates assays was observed Among the feed ratios methane production
Chapter 4 Results and Discussions
69
increased with an increase in the amount of pre-treated SCT This trend was noticed
throughout the experimental run Lower carbon contents in the assays with lesser SCT
would be the possible reason for such a lower production rate among them (Vivekanand
et al 2018) To compare the assays with the same amount of carbon mono-digestion
assays were used Synergistic and antagonistic effects of co-digestion ratios were
discussed in Section 423
422 Effect of steam explosion pre-treatment on anaerobic co-digestion
of SCT with CM at different feed ratios
In Pre-treated SCTCM assays more than 75 of methane production was obtained
within the initial 11 days of incubation when the rate of production of methane dropped
below 10 in all assays (Figure 42) However on an average only less than 45 of
methane production was observed among the Untreated SCTCM assays in the same 11
days of incubation This could be possibly due to the destruction of the lignocellulosic
structure as a result of the steam explosion pre-treatment leading to the availability of
cellulose and hemicellulose (Hendriks and Zeeman 2009) Thus the rate of hydrolysis
in pre-treated SCT was improved leading to more methane being produced rapidly in a
short period than with untreated SCT Similar results were achieved in the studies
conducted elsewhere (Mokomele et al 2019)
Figure 42 illustrates the cumulative methane produced among various feed ratios until
day 11 It is evident that among all the co-digestion ratios and mono-digestion of SCT
all Pre-treated SCTCM ratios produced much more methane than the corresponding
feed ratios of Untreated SCTCM till day 11 A similar positive effect of pre-treatment
was reported during the sodium hydroxide pre-treatment of sorghum by Sambusiti et al
(2013) (Sambusiti Ficara Malpei Steyer and Carregravere 2013) Steam explosion and
AFEX pre-treatment on sugarcane agricultural residues producing a higher methane
Chapter 4 Results and Discussions
70
yield during the initial days of incubation were reported by Mokomele et al (2109)
(Mokomele et al 2019)
Figure 42 Cumulative methane yield among different feed ratios of Untreated
SCTCM and Pre-treated SCTCM on day 11 (T11)
It can also be seen that from Figure 42 the cumulative methane yield of Pre-treated
SCTCM assays show a decreasing trend as the SCT contents decreased possibly due to
the significant reduction in carbon content within feed ratios with lesser amount of SCT
contents A similar trend was also observed during the anaerobic co-digestion of whey
and manure when they were co-digested in different feed ratios such as 1000 8515
7525 5050 2575 1585 and 0100 (Vivekanand et al 2018) In this study
Vivekanand et al (2018) reported a decrease in methane yield from 264
mLCH4gVSadded to 147 mLCH4gVSadded as the percentage of manure in the co-
digestion mixture increased from 0 to 100 This might be due to the lesser carbon
content in the assays at lower amounts of SCT (Li et al 2009) The slightly better
methane yields obtained for untreated SCT with an increase in the amount of CM was
probably due to the availability of easily accessible cellulose and hemicellulose and due
Chapter 4 Results and Discussions
71
to a better CN ratio contributed by CM (Vivekanand Olsen Eijsink and Horn 2013)
Both these results were in agreement with previous studies reported in the literature
(Ferreira Donoso-Bravo Nilsen Fdz-Polanco and Peacuterez-Elvira 2013)
423 Synergistic effects on anaerobic digestibility and methane yields
during anaerobic co-digestion of SCT with CM
The amount of methane produced in different co-digestion feed ratios can be compared
with an equivalent amount of SCT and CM contributed from their mono-digestion
assays Additional methane yield obtained in the co-digestion mixtures compared to the
expected output from mono-digestion assays is known as synergism (Nielfa et al 2015)
On the contrary the reduction in methane yield in the co-digestion assays compared
with the expected methane production from the sole substrates (SCT and CM) alone is
known as antagonism (Nielfa et al 2015) Synergism observed in the co-digestion
assays might be due to the improvement in any of the factors affecting anaerobic
digestion (Mata-Aacutelvarez 2002) Nitrogen-rich manure used in this co-digestion study
improved the methane yield by lowering the CN ratio of high CN sugarcane
agricultural residue In this experiment the highest synergistic effect of 1196 was
observed in the 7525 ratio of Pre-treated SCTCM (Figure 43)
However in the case of Untreated SCTCM both 7525 and 5050 ratio exhibited
antagonistic effects A Similar antagonistic effect was observed during the anaerobic co-
digestion of whey and fish ensilage (Vivekanand et al 2018) In this study Vivekanand
et al (2018) reported an antagonistic effect in the co-digestion ratios 5050 2575 and
1585 A decrease in the extent of bio-degradation was reported for co-digestion ratios
with more than 50 of fish ensilage among the tested co-digestion ratios of 8515
7525 5050 2575 and 1585 (Vivekanand et al 2018) Among the tested feed ratios
in the current study 2575 ratio of Untreated SCTCM was the only co-digestion ratio
Chapter 4 Results and Discussions
72
that produced a synergistic effect Thus the results of this study indicate that anaerobic
co-digestion is best suited for steam-exploded SCT than for the untreated SCT when co-
digested with CM
Figure 43 Synergistic and antagonistic effects of various co-digestion feed ratios
during anaerobic co-digestion of SCT with CM in batch assays at 37 oC
43 Anaerobic co-digestion of untreated and steam exploded SCB with
CM
The second set of experiments was conducted under the same conditions to study the
effect of different feed ratios such as 7525 5050 and 2575 on methane yields during
the anaerobic co-digestion of SCB with CM Methane yields of all the tested co-
digestion ratios were compared with the mono-digestion of both SCB and CM
Different feed ratios of both untreated and pre-treated SCB were compared and the
results are presented in Table 43
Chapter 4 Results and Discussions
73
431 Effect of different feed ratios on methane yields during anaerobic
co-digestion of SCB with CM
Results showed that feed ratio had a profound effect on methane production rates and
yields for both untreated and pre-treated SCB Methane production in all untreated SCB
assays was low and delayed by four days (Figure 44) A similar lag phase of nearly
four days was reported by Estevez et al (2012) in his studies on untreated salix (Estevez
et al 2012) However an increase in the methane production rate was observed around
day 4 From day 4 to day 15 higher methane production rates and yields were noticed
(Figure 44) A similar observation in the initial lag phase and an increase in methane
production rates after a lag-phase of 4 ndash 5 days was reported during the anaerobic co-
digestion of goat manure with wheat straw (Zhang et al 2013a) The lower methane
production rates noticed in assays with high CM content was probably due to the lack of
readily available carbon contents in these assays A reverse trend of increased methane
production with an increase in SCT amount was evident from day 15 onwards
However higher methane production rates and relatively small lag-phase were noticed
in assays with steam-exploded SCB compared with untreated SCB A similar trend was
observed during the anaerobic digestion of steam-exploded salix (Estevez et al 2012)
Estevez et al (2012) reported the highest methane yield of 166 mLCH4gVSadded for
steam-exploded salix at 210oC for 10 minutes against the untreated salix which
produced 97 mLCH4gVSadded after 22 days of incubation (Estevez et al 2012)
Chapter 4 Results and Discussions
74
Figure 44 Cumulative methane production during the anaerobic co-digestion of
untreated SCB (USCB) and Pre-treated SCB (PSCB) with CM at different feed ratios
incubated in a batch experiment at 37 oC for 83 days
A steep increase in methane production was observed from day 4 through day 10 and
thereafter methane production rates were lower indicating that the hydrolysis was the
rate-limiting step (Zhang et al 2013a) Towards the end of the experiment a clear trend
of increased methane production was noticed in all assays with a higher amount of SCT
The availability of more carbon contents to be converted into methane could be the
possible reason for this higher production in these assays (Vivekanand et al 2018)
However the biodegradability check on both untreated and pre-treated substrates shows
that only about 25 of the substrates were degraded during this BMP analysis (Table
43) This might be due to process inhibition in all assays as a result of high ammoniacal
nitrogen accumulation in them as it is a batch test (Table 44) A synergistic study
among the different co-digestion ratios tested was conducted and presented in Section
433 to estimate the performance of co-digestion
Chapter 4 Results and Discussions
75
432 Effect of steam explosion pre-treatment on anaerobic co-digestion
of SCB with CM at different feed ratios
The cumulative methane yield among different feed ratios until day 11 when the rate of
methane production drops below 10 among all assays is shown in Figure 45 Among
untreated SCB cumulative methane yield increases as the amount of chicken manure
increases in the assays The chemical analysis of untreated SCB showed that only a
lesser amount of cellulose and hemicellulose is available compared to the pre-treated
SCB for the microorganisms to feed A similar trend was observed when SCB was co-
digested with dairy cow manure by Mokomele et al (2019) Methane yield of SCB
increased from nearly 75 to 120 mLCH4gVSadded on the 11th day of incubation when
the co-digestion ratio was increased from 0 to 50 (Mokomele et al 2019) This is due
to the fact that the assays with more CM reduce the CN ratio of high CN SCB to an
optimum range which favours more methane production (Neshat et al 2017) This
causes the assays with high CM content to produce more yield on day 11 in the case of
untreated SCB
However in the case of pre-treated substrates the variation in feed ratios did not affect
the cumulative methane production in them All the Pre-treated SCBCM assays
produced nearly 85 mlCH4gVSadded till day 11 Similar results were reported by
Mokomele et al (2019) when cane leaf matter was co-digested with dairy manure
When cane leaf matter was subjected to AFEX pre-treatment the increase in manure
content during co-digestion does not show much difference in the methane yields
between the mono-digestion and the co-digestion mixtures after 10days of incubation
(Mokomele et al 2019) The availability of biodegradable fibres among the pre-treated
SCB in all co-digestion ratios must have reduced the effect of co-digestion with chicken
manure in this study Pre-treated SCB among all feed ratios tested here must be having
Chapter 4 Results and Discussions
76
nutrient balance and buffer capacity to negate the benefits of co-digestion (Mokomele et
al 2019) Thus all feed ratios of pre-treated SCB produced almost the same methane
yield after 11 days of incubation
Figure 45 Cumulative methane yield among different feed ratios of Untreated
SCBCM and Pre-treated SCBCM on day 11 (T11)
433 Synergistic effect on anaerobic digestibility and methane yields
during anaerobic co-digestion of SCB with CM
Unlike the SCT all assays of untreated and pre-treated substrates of SCB has a
synergistic effect while co-digesting with CM Untreated SCBCM assays show a
higher synergistic effect when compared to the Pre-treated SCBCM for the same feed
ratio Both untreated and pre-treated substrates co-digestion show an increasing trend in
the synergistic effect as the amount of CM increases among the co-digestion assays
Supplementing the deficient components by the co-digestion caused an improvement in
overall cumulative methane yield (Aichinger et al 2015) Figure 46 shows the
improvement in co-digestion when compared to the expected methane production from
mono-digestion
Chapter 4 Results and Discussions
77
Figure 46 Synergistic and antagonistic effects of various co-digestion feed ratios
during anaerobic co-digestion of SCB with CM in batch assays at 37 oC
The highest synergistic effect of 1857 was observed in the 2575 ratio of Untreated
SCBCM Lesser synergistic effect among the pre-treated substrates of SCBCM shows
that the co-digestion SCB with CM is more suitable for untreated SCB than pre-treated
SCB However the better synergistic effect alone does not mean that the co-digestion
ratio is the best choice for anaerobic digestion The synergistic effect shows how good
the co-digestion performed than the expected methane production from the same VS
contents from sole substrates alone (Kim Chowdhury Nakhla and Keleman 2017)
44 Post-BMP analysis of SCTSCB when co-digested with CM
441 Cumulative methane yield and statistical analysis
Cumulative methane yield obtained from all BMP assays including co-digestion
mixtures and mono-digestion of sole substrates is detailed in Table 43 Towards the
end of experiment all sets of co-digestion ratios showed a decrease in cumulative
Chapter 4 Results and Discussions
78
methane yield with the increase in chicken manure The lesser amount of carbon
molecules in assays with lesser SCTSCB resulted in the low methane yield during
longer degradation time (Vivekanand et al 2018) Among Untreated SCTCM the
mono-digestion of Untreated SCT achieved the highest cumulative methane yield of
202 mlCH4gVSadded As the VS from chicken manure was increased by 25 of total VS
a decrease of 11 22 30 and 43 was observed among the cumulative methane
yield at the end of 83 days of incubation On the other hand for Pre-treated SCTCM
ratios a slightly higher cumulative methane yield of 2075 mlCH4gVSadded was
achieved by the mono-digestion of Pre-treated SCT All feed ratios of Pre-treated
SCTCM produced more cumulative methane yield than the corresponding feed ratios
of Untreated SCTCM assays
A similar trend was noticed in the case of SCB Highest cumulative methane yield of
199 mlCH4gVSadded among the Untreated SCBCM assays was attained when Untreated
SCB was mono-digested (Table 43) The decline in cumulative methane yield as the
amount of chicken manure increases is evident in the case of both Untreated SCB and
Pre-treated SCB co-digestion assays 185171162115 mlCH4gVSadded were the
cumulative methane yield obtained from 7525 5050 2575 and 0100 feed ratios of
Untreated SCBCM Similarly the highest methane yield of 225 mlCH4gVSadded was
produced by anaerobic digestion of Pre-treated SCB alone While increasing the
percentage of chicken manure in the feed a decrease of 12 23 31 and 49 was
observed among the tested feed ratios of 7525 5050 2575 and 0100 respectively
Cumulative methane yields of all batch assays were tested for statistical significance
using one-way ANOVA It was observed that all cumulative methane yield was distinct
and hence statistically significant at 95 confidence level except 1000 and 7525 ratio
of Pre-treated SCTCM assay All assays within the groups and between the groups
Chapter 4 Results and Discussions
79
were tested Test of homogeneity of variances ANOVA and multiple comparisons
including the Tukey HSD LSD and Dunnett 2-sided t-test was done and tabulated in
the appendix for Untreated SCTCM Pre-treated SCTCM Untreated SCBCM and
Pre-treated SCBCM
442 Anaerobic biodegradability
Anaerobic biodegradability describes the amount of organic matter degraded as a result
of anaerobic digestion (Panigrahi Sharma and Dubey 2020) The theoretical methane
potential of the BMP assays can be corrected using the biodegradability factor and can
be used to compare for error with the experimentally achieved values (Nielfa et al
2015)
Table 43 also shows the theoretical methane yield expected from the assays per gram
VS of substrate added along with the experimental methane yield per gram of VS added
It also shows the biodegradability factor based on VS reduction and COD reduction
The percentage of VS destruction occurring in the assays as a result of the anaerobic
digestion process is known as the VS destruction (Wei et al 2018) Whereas the
reduction in COD as a result of the anaerobic digestion is termed as the COD
destruction Theoretical methane corrected with the biodegradability factor is the
product of biodegradability factor from COD destruction and the theoretical expected
methane yield from the assays calculated based on the moles of methane that can be
produced from initial COD (Nielfa et al 2015)
Chapter 4 Results and Discussions
80
Table 43 Theoretical and experimental results of anaerobic biodegradability during anaerobic co-digestion of SCTSCB with CMNote denotes statistically significant values at 95 confidence level a denotes these values are not statistically significant at 95 confidence level
Substrates Feed ratio Theoretical BMP Experimental resultsBMPth BMPexpCOD BMPexpVS BDexpVS BDexpCOD BMPthBD Error
(mlCH4gVSadded) (mlCH4gCODadded) (mlCH4gVSadded) () () (mlCH4gVSadded) ()
Untreated
SCTCM
1000 5552 1444 2018 215 353 1960 28
7525 5444 1307 1791 247 307 1671 67
5050 5336 1178 1582 248 308 1642 -38
2575 5228 1074 1413 244 270 1413 00
Pre-treated
SCTCM
1000 5073 1625 2075a 265 410 2082 -03
7525 5085 1614 2065a 252 391 1988 37
5050 5097 1318 1691 235 319 1628 37
2575 5109 1106 1422 190 255 1302 85
Untreated
SCBCM
1000 4364 1812 1990 262 421 1839 76
7525 4553 1615 1850 237 391 1780 38
5050 4742 1429 1706 232 350 1660 27
2575 4931 1302 1615 179 301 1486 80
Pre-treated
SCBCM
1000 2882 3110 2256 251 715 2061 86
7525 3442 2304 1995 220 538 1852 72
5050 4000 1729 1741 235 414 1656 49
2575 4561 1357 1558 194 348 1586 -18
CM 1000 5121 895 1153 216 206 1056 84
Chapter 4 Results and Discussions
81
It can be observed in general that the pre-treated substrates (Pre-treated SCTPre-treated
SCBCM) have a higher value of biodegradability compared to the untreated substrates
(Untreated SCTUntreated SCBCM) Readily available cellulose and hemicellulose
content among the pre-treated substrates causes the assays with these substrates to have
more degradation due to anaerobic digestion (Panigrahi et al 2020) It can also be
noted that the nitrogen-rich CM has the lowest value of biodegradability The lack of
degrading compounds in these kinds of animal manures is the reason for such a low
biodegradability among them (Gonzaacutelez-Fernaacutendez Leoacuten-Cofreces and Garciacutea-Encina
2008) The antibiotic feed given to the animals results in a higher quantity of antibiotic
contents in their manure which resulted in an inhibitory effect as the antibiotics kill or
deactivate living micro-organisms (Neshat et al 2017) Since the animal manures have
a lower biodegradability the same trend can be seen in the co-digestion assays Assays
with a higher amount of CM has a lower biodegradability This means that the
anaerobic biodegradability decreases with the increase in CM content among the co-
digestion assays Table 43 shows the theoretical BMP experimental BMP VS and
COD destruction biodegradability biodegradability corrected BMP and the relative
error for different feed ratios tested in this study A smaller value of error validates that
the experimentally achieved value matches with the theoretically expected value
443 VFA analysis of digestates
Digestates of the BMP assays were subjected to Volatile Fatty Acids (VFA) tests in
order to check the presence of any inhibitory long-chain volatile fatty acids All the co-
digestion mixtures and the individual mono-digestion of all the substrates used in this
study were tested All the assays had a considerable amount of acetic acids which
could have been converted into methane if all other parameters for anaerobic digestion
were optimum (Li et al 2018b) Figure 47 shows the percentage of VFAs in each
Chapter 4 Results and Discussions
82
assay after 83 days of incubation All the assays consisted of about 40-50 of acetic
acid in them They degrade to acetic acid and then to methane by acetogenic microbes
A similar result was also observed by Bolado et al (2016) (Bolado-Rodriacuteguez Toquero
Martiacuten-Juaacuterez Travaini and Garciacutea-Encina 2016) However the presence of about
20-30 of valeric acids in these digestates could have caused an inhibitory effect on the
anaerobic digestion process Butyric acid also contributed to about 15-20 of the total
VFA concentration in these digestates High concentrations of butyric acid can inhibit
the activity of methanogens (Mamimin Prasertsan Kongjan and O-Thong 2017
Wagner Malin Lins and Illmer 2011) Small quantities of hexanoic acid heptanoic
acid and propionic acid were also present in the digestates of these assays
Chapter 4 Results and Discussions
83
Figure 47 VFAs of post BMP digestates in various feed ratio assays
Note USCT Untreated SCT PSCT Pre-treated SCT USCB Untreated SCB PSCB Pre-treated SCB
Chapter 4 Results and Discussions
84
444 FIA analysis of digestates
Flow Injection analysis was performed on the digestates from the BMP assays in this
study It tests the presence and amount of NO2-N NOx-N NH4-N and PO4-P ions in the
digestates These tests are usually done to check for the existence of any of the above
mentioned ions in the assays that resulted in the ceasing of biogas production For
instance higher quantity of NH4-N ions in the digestates indicates the presence of
ammoniacal nitrogen which hinders the microbial action and thereby reduces the net
biogas production from the substrates (Neshat et al 2017)
Table 44 shows the results of flow injection analysis on various co-digestion assays and
mon-digestion substrates used in this experiment Results show that ~1600 mgL of
ammoniacal nitrogen were present in all assay digestates However we can see a slight
increasing trend in ammoniacal nitrogen as the amount of chicken manure is being
increased among the feed ratios This trend is evident in all four type of co-digestion
mixtures Among untreated SCTCM assays NH4-N increased from 1616 mgL to
1727 mgL as the ratio of CM increased from 0 to 75 Similarly an increase of 1566
to 1687 1636 to 1727 and 1576 to 1727 mgL of NH4-N was observed in pre-treated
SCTCM untreated SCBCM and pre-treated SCBCM assays respectively Highest
value of NH4-N was observed in the digestates of mono-digestion of chicken manure
and was about 1747 mgL
On contrary the PO4P values shows a decreasing trend as the percentage of CM
increased in all four types of co-digestion mixtures Highest value of PO4P (165 mgL)
was observed in the digestates of mono-digesting untreated bagasse As the amount of
chicken manure increased a reduction in PO4P value was observed Among untreated
SCBCM assays the least value of PO4P was obtained in 2575 ratio and was 144 mgL
Chapter 4 Results and Discussions
85
Similarly a decrease from 154 to 140 164 to 141 and 157 to 144 mgL was observed
among untreated SCTCM pre-treated SCTCM and pre-treated SCBCM respectively
The lowest value of PO4P was obtained from the digestates of 100 CM and was
136 mgL
Table 44 Results of flow injection analysis for various feed ratios of SCTSCB with
CM
Sample Feed ratioNO2-N NOx-N NH4-N PO4-P
mgL mgL mgL mgL
Untreated
SCTCM
1000 0 548 16160 1535
7525 0 554 16160 1465
5050 0 550 16867 1444
2575 0 553 17271 1404
Pre-treated
SCTCM
1000 0 556 15655 1636
7525 0 547 16059 1596
5050 0 551 16362 1505
2575 0 550 16867 1414
Untreated
SCBCM
1000 0 548 16362 1646
7525 0 561 16564 1586
5050 0 535 17069 1515
2575 0 551 17271 1444
Pre-treated
SCBCM
1000 0 364 15756 1566
7525 0 549 16665 1576
5050 0 543 16968 1505
2575 0 552 17271 1444
CM 1000 0 553 17473 1364
It can be also noted from table 43 and table 44 that the higher the amount of
ammoniacal nitrogen in the digestates lesser is the amount of PO4P and lesser is the
amount of cumulative methane yield obtained from those assays Higher concentrations
of ammoniacal nitrogen reduced the CN ratio of the digestates as the anaerobic
Chapter 4 Results and Discussions
86
digestion progresses (Vats Khan and Ahmad 2019) It also could lead to an increase
in pH which would result in a lesser cumulative methane yield (Li et al 2013)
However in a batch assay system large quantity of minerals ions and trace elements
are being contributed by the inoculum This reduces the effect of co-digestion feed ratio
in terms of supplementing such elements or ions Non-removal of digestates in a batch
assay unlike a continuous feeding system caused the accumulation of ammoniacal
nitrogen in the assays (Neshat et al 2017) This in turns increases the pH of the system
(Li et al 2013) Continuous type reactor studies can be done for best ratios of the BMP
tests to eliminate the accumulation of ammoniacal nitrogen in the digestates Results of
such continuous type reactors after few HRT can reduce the influence of inoculum in
supplementing such nutrients
45 Mathematical modelling
Mathematical modelling of the mono-digestion of various substrates along with the co-
digestion of these substrates with CM was done in order to compare the fit of these
plots to the pre-defined models The two models used in this study were the first-order
kinetic model and the modified Gompertz model These models consider the
experimental biodegradability of the substrates during the process which also includes
the microbial growth
Table 45 presents the various parameters of the modified Gompertz model and the first-
order kinetic model for the cumulative methane production from the mono-digestion of
Untreated SCT Pre-treated SCT Untreated SCB and Pre-treated SCB along with the
co-digestion of these substrates with CM These calculated parameters are used to
establish a fit between the experimental cumulative methane yields and the expected
modelled data
Chapter 4 Results and Discussions
87
Table 45 Modelling parameters for first-order model and modified Gompertz model for different feed ratios of SCTSCB co-digested with CMNote USCT Untreated SCT PSCT Pre-treated SCT USCB Untreated SCB PSCB Pre-treated SCB
SubstratesFeed
ratioModified Gompertz Model First-order model
B B0 Rm λR2
B0 khyd Time delayR2
(ml CH4gVSadded) (ml CH4gVSadded) (mlgVSd) (d) (ml CH4gVSadded) (d-1) (d)
USCTCM 100 0 20175 19347 712 264 09942 20753 005 266 09988
75 25 17909 16507 623 128 09772 17679 005 183 09956
50 50 15820 14442 648 122 09701 15343 006 188 09911
25 75 14128 12653 858 198 09727 13238 010 255 09898
PSCTCM 100 0 20748 19853 2142 168 09927 20397 015 185 09867
75 25 20650 19748 1819 123 09905 20331 014 167 09905
50 50 16910 16360 1766 142 09920 16782 016 174 09896
25 75 14224 13498 1521 157 09887 13889 016 178 09881
USCBCM 100 0 19900 19394 797 521 09972 20561 006 538 09889
75 25 18503 17700 528 197 09864 19472 004 197 09989
50 50 17056 16131 492 045 09734 17440 004 119 09940
25 75 16154 14420 767 109 09691 15218 003 178 09897
PSCBCM 100 0 22557 21982 702 154 09815 23570 004 188 09934
75 25 19955 19203 660 007 09787 20400 005 089 09941
50 50 17407 16241 718 015 09745 17090 007 110 09928
25 75 15577 14114 806 040 09624 14869 008 119 09837
CM 100 0 11532 10787 1237 280 09858 11135 016 299 09919
Chapter 4 Results and Discussions
88
Hydrolysis process is considered as the rate-limiting step in the first-order kinetic model
whereas the bacterial growth and inhibition process is considered as the rate-limiting
step of the modified Gompertz model (Kafle et al 2012 Patil Raj Muralidhara Desai
and Raju 2012 Vats et al 2019) The term khyd of the first-order kinetic model
describes the rate of hydrolysis of the substrate and is known as the hydrolysis
coefficient Larger values of khyd imply the hydrolysis of that batch is at a faster rate
Untreated SCT had the lowest khyd value of 005 (Table 45) indicating that the rate of
hydrolysis was the slowest among the assays This was similar to the result of khyd value
of 006 d-1 reported elsewhere (Kafle et al 2012) for Untreated SCB This would be
possible due to the complex lignocellulosic structure consisting of a lesser amount of
soluble organic compounds Even though the mon-digestion of Untreated SCT had the
lowest khyd value its ultimate methane potential (B0) was highest when compared with
different co-digestion ratios for Untreated SCT with CM The B0 value for mono-
digested Untreated SCT was 20753 ml CH4gVSadded (Table 45) This value was
similar to the methane yield obtained by Pre-treated SCT towards the end of the
experimental run (Figure 48) It can be noticed that the khyd value increased with an
increase in the amount of CM On the other hand the B0 value decreased with an
increase in the amount of CM Both these results indicate that the rate of hydrolysis
improved with an increase in the amount of CM
Chapter 4 Results and Discussions
89
Figure 48 Comparison of first-order (∆ - Untreated SCT and ndash Pre-treated SCT) and
modified Gompertz kinetic model ( ndash Untreated SCT and ndash Pre-treated SCT)
predictions with experimental cumulative methane yield (ndash) for different co-digestion
ratios of SCT with CM
Chapter 4 Results and Discussions
90
At the same feed ratio the hydrolysis rate constant for Pre-treated SCT mono-digestion
and co-digestion samples was higher than that of Untreated SCT samples (Table 45)
This implies that the steam explosion pretreatment improved the hydrolysis of the
substrate and resulted in smaller khyd values This is due to the fact that steam explosion
pretreatment improved the solubilization of cellulose and hemicellulose and increased
the accessibility of substrate for the microorganisms (Sawatdeenarunat et al 2015)
Similarly B0 values obtained for Pre-treated SCB substrates were higher than that of the
Untreated SCB substrates for the same feed ratios This resulted in higher cumulative
methane yields produced at the end of the experimental run The high khyd for Pre-
treated SCT substrates resulted in a faster methane production rate among the same feed
Among the different co-digestion ratios for Untreated SCB the highest khyd value was
noticed for mono-digestion of Untreated SCB followed by the co-digestion ratios of
7525 and 5050 (Table 45) This could be possibly due to the weak hydrolysis of
Untreated SCB and inhibition caused due low pH as a result of VFA formation (Chen
Cheng and Creamer 2008 Risberg et al 2013 Weil et al 2002) A similar trend was
also observed for the B0 values (Table 45) Nevertheless the time delay of 538 days
was noticed for the mono-digestion of Untreated SCB Both these results indicate that
although the hydrolysis rate was slightly better the effect of time delay caused methane
production to follow the same trend as in the case of Untreated SCT assays (Figure 49)
The Pre-treated SCB also followed the same trend as that of the Pre-treated SCT It was
noticed that the khyd values increased with the increase in CM amount (Table 45)
Similarly a higher rate of hydrolysis was observed with an increase in CM content
Ultimate methane production for Pre-treated SCB also followed the same trend as that
of Pre-treated SCT B0 value decreased with the increase in CM content resulting in
faster hydrolysis but lower methane production towards the end of the experimental run
Chapter 4 Results and Discussions
91
Figure 49 Comparison of first-order (∆ - Untreated SCB and ndash Pre-treated SCB)
and modified Gompertz kinetic model ( ndash Untreated SCB and ndash Pre-treated SCB)
predictions with experimental cumulative methane yield (ndash) for different co-digestion
ratios of SCB with CM
Chapter 4 Results and Discussions
92
Modified Gompertz model uses three parameters for the prediction of methane
production from the assays Maximum methane potential of the assay (B0) specific rate
constant (Rm) and the lag phase (λ) (Nielfa et al 2015) The maximum methane
potential of Untreated SCT assays decreased with an increase in CM content (Table 45)
The specific rate constant and lag phase for the different feed ratios of Untreated SCT
were 712 623 648 858 and 264 128 122 198 respectively for the feed ratio of
1000 7525 5050 2575
A similar trend was also noticed with Pre-treated SCT (Table 45) B0 value decreased
with an increase in CM amount This resulted in lower methane production towards the
end of the experimental run (Figure 47) Rm also showed a decreasing trend with an
increase in CM amount The higher value of Rm will result in a faster rate of methane
production (Xie et al 2016) This in turn can be observed in terms of faster hydrolysis
for the Pre-treated SCT assays than the Untreated SCT assays at the same feed ratio
From Table 45 it can be noticed that Untreated SCB assays also followed the same
trend for B0 when the modified Gompertz model was applied B0 decreased with an
increase in the amount of CM Thus a high amount of SCB will lead to increased
methane production Rm values showed a decreasing trend until the feed ratio of 5050
for Untreated SCBCM Thereafter an increase in Rm values was noticed
Similar to that of the first-order model a significant lag phase was evident for the
mono-digestion of Untreated SCB The lag phase also followed the same trend as that of
the methane production rate (Table 45) For Pre-treated SCB assays a decrease in B0
values was noticed with an increase in CM amount On the other hand Rm and λ
showed a decreasing trend till 7525 feed ratio and thereafter it increased steadily as the
amount of CM increased The low B0 noticed at higher CM amount resulted in low
methane production at the end of the experimental run Thus we can conclude that
Chapter 4 Results and Discussions
93
different co-digestion ratios for both SCT and SCB with and without steam explosion
pre-treatment had a profound influence on both methane production and its rate of
production
Chapter 4 Results and Discussions
94
1
Chapter 5 Conclusions and Future works
95
Chapter 5 Conclusions and Future Works
Chapter 5 Conclusions and Future works
96
Chapter 5 Conclusions and Future works
97
51 Conclusion to this research work
The effect of feed ratio and pre-treatment on methane yields during anaerobic co-digestion of
sugarcane trash and bagasse was investigated in this study Chemical analysis shows that pre-
treatment of lignocellulosic substrates viz SCT and SCB had a profound effect Steam explosion
pre-treatment helped to break the complex lignocellulosic substrates and thus resulted in faster
and higher methane yields among the pre-treated substrates
BMP analysis of both SCT and SCB proved that a faster rate of production of biogas was
evident in all feed ratios for both substrates Even though the final methane yields are within the
comparable range the initial faster rate of methane production provides an opportunity to
implement a lower HRT among pre-treated substrates when compared to the untreated
substrates Results showed that about 75 of the total yield was obtained within the first 11
days in the case of pre-treated substrates whereas it took almost 45 days for the untreated
substrates to produce similar yields This implies that using pre-treated substrates can improve
net productivity by at least four times Thus the methane yield can be increased by about four
times if pre-treated substrates instead of untreated substrates
Considering the HRT of the reactor as 11 days pre-treated substrates had a clear advantage over
the untreated substrates (both SCT and SCB) in all the tested feed ratios and mono-digestion of
SCT and SCB An improvement of 156 122 83 and 37 was observed as a result of pre-
treatment among 1000 7525 5050 and 2575 ratios of SCT on day 11 The corresponding
improvement observed in SCB assays were 120 54 39 and 9 respectively
Among the different feed ratios tested for both untreated and pre-treated SCT and SCB an
overall improvement in methane yields with the addition of chicken manure was not observed
The cumulative methane yields were reduced with the addition of chicken manure which
implies that the addition of chicken manure had a negative impact on cumulative methane yields
However with the addition of chicken manure the amount of carbon molecules is considerably
reduced as the same VS was maintained among all co-digestion assays This caused a reduction
in methane yield from the co-digestion mixture Synergistic studies were done in this research
Chapter 5 Conclusions and Future works
98
work to investigate whether co-digestion improved the synergism of the mixture The effect of
co-digestion was analysed by comparing the expected methane yields from the same amount of
VS content of the sole substrates digested separately and the methane yields produced from the
co-digestion mixture with the same VS content Synergism was observed among most of the co-
digestion mixtures which show co-digestion has a positive effect However the reduction of
carbon contents due to lesser carbon molecules being fed to the reactors resulted in a lesser yield
with the addition of chicken manure
Among the tested feed ratios addition of chicken manure helped to achieve a positive
synergism in all assays except 7525 and 5050 ratio of untreated SCTCM The only feed ratio
that had a synergistic effect in untreated SCTCM was 2575 ratio and was observed to be
318 Among pre-treated SCT assays the percentage improvement in cumulative methane
based on synergistic studies was 1196 477 and 281 among the 7525 5050 and 2575
ratios respectively Similar improvement observed in untreated SCB and pre-treated SCB were
390 853 1857 and 078 213 902 respectively for 7525 5050 and 2575 ratios An
improvement based on synergistic studies implies that the co-digestion helped in increasing the
methane yield from the same amount of VS from substrates digested separately
Mathematical modelling was done for all the batch assays using the first-order kinetic model
and the modified Gompertz model and different associated parameters were analysed It was
observed that time delay could be considerably reduced in the case of pre-treated substrates
when compared to the untreated substrates Both models produced a higher rate of methane
yield while using pre-treated substrates Anaerobic biodegradability post BMP analysis and
statistical analysis were also done in this research work to substantiate the results obtained in
this research The BMP analysis done to study the effect of co-digestion ratios of sugarcane
wastes with chicken manure opens up an opportunity to facilitate an efficient utilisation
technique for both SCTSCB and CM Further research works with different ISR ratios and
continuous type reactors need to be done to study how the feed ratios behave in such a reactor
before commercialising this technique
Chapter 5 Conclusions and Future works
99
52 Related future research works
Testing of different ISR ratios to study the effect of feed ratio and co-digestion of
SCTSCB with CM
Testing different feed ratios of co-digesting SCTSCB with CM on a continuous type
CSTR reactor to conduct a scale down lab-scale study of the commercial plant
Testing the effect of feed ratio and co-digestion of SCTSCB with CM within different
incubation temperatures
100
101
APPENDIX 1
Statistical analysis of Untreated SCT with CM
The statistical significance of the mono-digestion of Untreated SCT along with the
different co-digestion mixtures of Untreated SCT with CM is analysed in this section
Various statistical parameters within the group of mono-digesting and co-digesting
Untreated SCT with CM are as follows
Descriptives
Methane Yields
N Mean
Std
Deviation
Std
Error
95 Confidence Interval
for Mean
Minimum MaximumLower Bound
Upper
Bound
100USCT +
0CM
3 2017333 223010 128755 1961935 2072732 19920 20340
75USCT +
25CM
3 1791000 34641 20000 1782395 1799605 17890 17950
50USCT +
50CM
3 1581667 85049 49103 1560539 1602794 15730 15900
25USCT +
75CM
3 1413000 338674 195533 1328869 1497131 13750 14400
0USCT +
100CM
3 1153333 87369 50442 1131630 1175037 11460 11630
Total 15 1591267 3092455 798468 1420012 1762521 11460 20340
Test of Homogeneity of Variances
Levene Statistic df1 df2 Sig
Methane Yields Based on Mean 4590 4 10 023
Based on Median 938 4 10 481
102
Based on Median and with
adjusted df
938 4 4174 521
Based on trimmed mean 4144 4 10 031
ANOVA
Methane Yields
Sum of Squares df Mean Square F Sig
Between Groups 13352489 4 3338122 924688 000
Within Groups 36100 10 3610
Total 13388589 14
Multiple Comparisons
Dependent Variable Methane Yields
(I) treatment (J) treatment
Mean
Difference (I-
J) Std Error Sig
95 Confidence Interval
Lower
Bound
Upper
Bound
Tukey
HSD
100USCT
+ 0CM
75USCT +
25CM
2263333 155134 000 175277 277389
50USCT +
50CM
4356667 155134 000 384611 486723
25USCT +
75CM
6043333 155134 000 553277 655389
0USCT +
100CM
8640000 155134 000 812944 915056
75USCT +
25CM
100USCT +
0CM
-2263333 155134 000 -277389 -175277
50USCT +
50CM
2093333 155134 000 158277 260389
25USCT +
75CM
3780000 155134 000 326944 429056
0USCT +
100CM
6376667 155134 000 586611 688723
103
50USCT +
50CM
100USCT +
0CM
-4356667 155134 000 -486723 -384611
75USCT +
25CM
-2093333 155134 000 -260389 -158277
25USCT +
75CM
1686667 155134 000 117611 219723
0USCT +
100CM
4283333 155134 000 377277 479389
25USCT +
75CM
100USCT +
0CM
-6043333 155134 000 -655389 -553277
75USCT +
25CM
-3780000 155134 000 -429056 -326944
50USCT +
50CM
-1686667 155134 000 -219723 -117611
0USCT +
100CM
2596667 155134 000 208611 310723
0USCT +
100CM
100USCT +
0CM
-8640000 155134 000 -915056 -812944
75USCT +
25CM
-6376667 155134 000 -688723 -586611
50USCT +
50CM
-4283333 155134 000 -479389 -377277
25USCT +
75CM
-2596667 155134 000 -310723 -208611
LSD 100USCT
+ 0CM
75USCT +
25CM
2263333 155134 000 191767 260899
50USCT +
50CM
4356667 155134 000 401101 470233
25USCT +
75CM
6043333 155134 000 569767 638899
0USCT +
100CM
8640000 155134 000 829434 898566
75USCT +
25CM
100USCT +
0CM
-2263333 155134 000 -260899 -191767
104
50USCT +
50CM
2093333 155134 000 174767 243899
25USCT +
75CM
3780000 155134 000 343434 412566
0USCT +
100CM
6376667 155134 000 603101 672233
50USCT +
50CM
100USCT +
0CM
-4356667 155134 000 -470233 -401101
75USCT +
25CM
-2093333 155134 000 -243899 -174767
25USCT +
75CM
1686667 155134 000 134101 203233
0USCT +
100CM
4283333 155134 000 393767 462899
25USCT +
75CM
100USCT +
0CM
-6043333 155134 000 -638899 -569767
75USCT +
25CM
-3780000 155134 000 -412566 -343434
50USCT +
50CM
-1686667 155134 000 -203233 -134101
0USCT +
100CM
2596667 155134 000 225101 294233
0USCT +
100CM
100USCT +
0CM
-8640000 155134 000 -898566 -829434
75USCT +
25CM
-6376667 155134 000 -672233 -603101
50USCT +
50CM
-4283333 155134 000 -462899 -393767
25USCT +
75CM
-2596667 155134 000 -294233 -225101
Dunnett
t (2-sided)b
100USCT
+ 0CM
0USCT +
100CM
8640000 155134 000 819159 908841
75USCT +
25CM
0USCT +
100CM
6376667 155134 000 592825 682508
105
50USCT +
50CM
0USCT +
100CM
4283333 155134 000 383492 473175
25USCT +
75CM
0USCT +
100CM
2596667 155134 000 214825 304508
The mean difference is significant at the 005 level
b Dunnett t-tests treat one group as a control and compare all other groups against it
106
APPENDIX2
Statistical analysis of Pre-treated SCT with CM
The statistical significance of the mono-digestion of Pre-treated SCT along with the
different co-digestion mixtures of Pre-treated SCT with CM is analysed in this section
Various statistical parameters within the group of mono-digesting and co-digesting Pre-
treated SCT with CM are as follows
Descriptives
Methane Yields
N Mean
Std
Deviation
Std
Error
95 Confidence Interval
for Mean
Minimum Maximum
Lower
Bound
Upper
Bound
100PSCT +
0CM
3 2075000 629603 363501 1918598 2231402 20050 21270
75PSCT +
25CM
3 2065000 580259 335012 1920856 2209144 20310 21320
50PSCT +
50CM
3 1691000 272213 157162 1623379 1758621 16600 17110
25PSCT +
75CM
3 1422667 250067 144376 1360547 1484787 13980 14480
0PSCT +
100CM
3 1153333 87369 50442 1131630 1175037 11460 11630
Total 15 1681400 3743018 966443 1474119 1888681 11460 21320
Test of Homogeneity of Variances
Levene Statistic df1 df2 Sig
Methane Yields Based on Mean 3425 4 10 052
Based on Median 501 4 10 736
107
Based on Median and with
adjusted df
501 4 4789 739
Based on trimmed mean 3020 4 10 071
ANOVA
Methane Yields
Sum of Squares df Mean Square F Sig
Between Groups 19438783 4 4859696 276948 000
Within Groups 175473 10 17547
Total 19614256 14
Multiple Comparisons
Dependent Variable Methane Yields
(I) treatment (J) treatment
Mean
Difference (I-
J) Std Error Sig
95 Confidence Interval
Lower
Bound
Upper
Bound
Tukey
HSD
100PSCT
+ 0CM
75PSCT +
25CM
100000 342027 998 -102564 122564
50PSCT +
50CM
3840000 342027 000 271436 496564
25PSCT +
75CM
6523333 342027 000 539770 764897
0PSCT +
100CM
9216667 342027 000 809103 1034230
75PSCT +
25CM
100PSCT +
0CM
-100000 342027 998 -122564 102564
50PSCT +
50CM
3740000 342027 000 261436 486564
25PSCT +
75CM
6423333 342027 000 529770 754897
108
0PSCT +
100CM
9116667 342027 000 799103 1024230
50PSCT +
50CM
100PSCT +
0CM
-3840000 342027 000 -496564 -271436
75PSCT +
25CM
-3740000 342027 000 -486564 -261436
25PSCT +
75CM
2683333 342027 000 155770 380897
0PSCT +
100CM
5376667 342027 000 425103 650230
25PSCT +
75CM
100PSCT +
0CM
-6523333 342027 000 -764897 -539770
75PSCT +
25CM
-6423333 342027 000 -754897 -529770
50PSCT +
50CM
-2683333 342027 000 -380897 -155770
0PSCT +
100CM
2693333 342027 000 156770 381897
0PSCT +
100CM
100PSCT +
0CM
-9216667 342027 000 -1034230 -809103
75PSCT +
25CM
-9116667 342027 000 -1024230 -799103
50PSCT +
50CM
-5376667 342027 000 -650230 -425103
25PSCT +
75CM
-2693333 342027 000 -381897 -156770
LSD 100PSCT
+ 0CM
75PSCT +
25CM
100000 342027 776 -66208 86208
50PSCT +
50CM
3840000 342027 000 307792 460208
25PSCT +
75CM
6523333 342027 000 576125 728542
0PSCT +
100CM
9216667 342027 000 845458 997875
109
75PSCT +
25CM
100PSCT +
0CM
-100000 342027 776 -86208 66208
50PSCT +
50CM
3740000 342027 000 297792 450208
25PSCT +
75CM
6423333 342027 000 566125 718542
0PSCT +
100CM
9116667 342027 000 835458 987875
50PSCT +
50CM
100PSCT +
0CM
-3840000 342027 000 -460208 -307792
75PSCT +
25CM
-3740000 342027 000 -450208 -297792
25PSCT +
75CM
2683333 342027 000 192125 344542
0PSCT +
100CM
5376667 342027 000 461458 613875
25PSCT +
75CM
100PSCT +
0CM
-6523333 342027 000 -728542 -576125
75PSCT +
25CM
-6423333 342027 000 -718542 -566125
50PSCT +
50CM
-2683333 342027 000 -344542 -192125
0PSCT +
100CM
2693333 342027 000 193125 345542
0PSCT +
100CM
100PSCT +
0CM
-9216667 342027 000 -997875 -845458
75PSCT +
25CM
-9116667 342027 000 -987875 -835458
50PSCT +
50CM
-5376667 342027 000 -613875 -461458
25PSCT +
75CM
-2693333 342027 000 -345542 -193125
100PSCT
+ 0CM
0PSCT +
100CM
9216667 342027 000 822805 1020529
110
Dunnett
t (2-
sided)b
75PSCT +
25CM
0PSCT +
100CM
9116667 342027 000 812805 1010529
50PSCT +
50CM
0PSCT +
100CM
5376667 342027 000 438805 636529
25PSCT +
75CM
0PSCT +
100CM
2693333 342027 000 170471 368195
The mean difference is significant at the 005 level
b Dunnett t-tests treat one group as a control and compare all other groups against it
111
APPENDIX 3
Statistical analysis of Untreated SCB with CM
The statistical significance of the mono-digestion of Untreated SCB along with the
different co-digestion mixtures of Untreated SCB with CM is analysed in this section
Various statistical parameters within the group of mono-digesting and co-digesting
Untreated SCB with CM are as follows
Descriptives
Methane Yields
N Mean
Std
Deviation
Std
Error
95 Confidence Interval
for Mean
Minimum Maximum
Lower
Bound
Upper
Bound
100USCB +
0CM
3 1990000 481248 277849 1870451 2109549 19400 20360
75USCB +
25CM
3 1850333 221209 127715 1795382 1905285 18270 18710
50USCB +
50CM
3 1705667 51316 29627 1692919 1718414 17000 17100
25USCB +
75CM
3 1615333 187172 108064 1568837 1661829 15940 16290
0USCB +
100CM
3 1153333 87369 50442 1131630 1175037 11460 11630
Total 15 1662933 2957005 763495 1499180 1826687 11460 20360
Test of Homogeneity of Variances
Levene Statistic df1 df2 Sig
Methane Yields Based on Mean 2387 4 10 121
Based on Median 1518 4 10 269
112
Based on Median and
with adjusted df
1518 4 4354 339
Based on trimmed mean 2332 4 10 127
ANOVA
Methane Yields
Sum of Squares df Mean Square F Sig
Between Groups 12176263 4 3044066 467120 000
Within Groups 65167 10 6517
Total 12241429 14
Multiple Comparisons
Dependent Variable Methane Yields
(I) treatment (J) treatment
Mean
Difference (I-J) Std Error Sig
95 Confidence Interval
Lower
Bound
Upper
Bound
Tukey
HSD
100USCB
+ 0CM
75USCB +
25CM
1396667 208433 000 71070 208264
50USCB +
50CM
2843333 208433 000 215736 352930
25USCB +
75CM
3746667 208433 000 306070 443264
0USCB +
100CM
8366667 208433 000 768070 905264
75USCB +
25CM
100USCB +
0CM
-1396667 208433 000 -208264 -71070
50USCB +
50CM
1446667 208433 000 76070 213264
25USCB +
75CM
2350000 208433 000 166403 303597
113
0USCB +
100CM
6970000 208433 000 628403 765597
50USCB +
50CM
100USCB +
0CM
-2843333 208433 000 -352930 -215736
75USCB +
25CM
-1446667 208433 000 -213264 -76070
25USCB +
75CM
903333 208433 000 21736 158930
0USCB +
100CM
5523333 208433 000 483736 620930
25USCB +
75CM
100USCB +
0CM
-3746667 208433 000 -443264 -306070
75USCB +
25CM
-2350000 208433 000 -303597 -166403
50USCB +
50CM
-903333 208433 000 -158930 -21736
0USCB +
100CM
4620000 208433 000 393403 530597
0USCB +
100CM
100USCB +
0CM
-8366667 208433 000 -905264 -768070
75USCB +
25CM
-6970000 208433 000 -765597 -628403
50USCB +
50CM
-5523333 208433 000 -620930 -483736
25USCB +
75CM
-4620000 208433 000 -530597 -393403
LSD 100USCB
+ 0CM
75USCB +
25CM
1396667 208433 000 93225 186109
50USCB +
50CM
2843333 208433 000 237891 330775
25USCB +
75CM
3746667 208433 000 328225 421109
0USCB +
100CM
8366667 208433 000 790225 883109
114
75USCB +
25CM
100USCB +
0CM
-1396667 208433 000 -186109 -93225
50USCB +
50CM
1446667 208433 000 98225 191109
25USCB +
75CM
2350000 208433 000 188558 281442
0USCB +
100CM
6970000 208433 000 650558 743442
50USCB +
50CM
100USCB +
0CM
-2843333 208433 000 -330775 -237891
75USCB +
25CM
-1446667 208433 000 -191109 -98225
25USCB +
75CM
903333 208433 000 43891 136775
0USCB +
100CM
5523333 208433 000 505891 598775
25USCB +
75CM
100USCB +
0CM
-3746667 208433 000 -421109 -328225
75USCB +
25CM
-2350000 208433 000 -281442 -188558
50USCB +
50CM
-903333 208433 000 -136775 -43891
0USCB +
100CM
4620000 208433 000 415558 508442
0USCB +
100CM
100USCB +
0CM
-8366667 208433 000 -883109 -790225
75USCB +
25CM
-6970000 208433 000 -743442 -650558
50USCB +
50CM
-5523333 208433 000 -598775 -505891
25USCB +
75CM
-4620000 208433 000 -508442 -415558
100USCB
+ 0CM
0USCB +
100CM
8366667 208433 000 776419 896914
115
Dunnett
t (2-
sided)b
75USCB +
25CM
0USCB +
100CM
6970000 208433 000 636753 757247
50USCB +
50CM
0USCB +
100CM
5523333 208433 000 492086 612581
25USCB +
75CM
0USCB +
100CM
4620000 208433 000 401753 522247
The mean difference is significant at the 005 level
b Dunnett t-tests treat one group as a control and compare all other groups against it
116
APPENDIX 4
Statistical analysis of Pre-treated SCB with CM
The statistical significance of the mono-digestion of Pre-treated SCB along with the
different co-digestion mixtures of Pre-treated SCB with CM is analysed in this section
Various statistical parameters within the group of mono-digesting and co-digesting Pre-
treated SCB with CM are as follows
Descriptives
Methane Yields
N Mean
Std
Deviation
Std
Error
95 Confidence Interval
for Mean
Minimum Maximum
Lower
Bound
Upper
Bound
100PSCB +
0CM
3 2255667 539290 311359 2121700 2389634 21940 22940
75PSCB +
25CM
3 1995667 427239 246667 1889535 2101799 19470 20270
50PSCB +
50CM
3 1740333 234592 135442 1682057 1798609 17140 17590
25PSCB +
75CM
3 1557667 281129 162310 1487830 1627503 15390 15900
0PSCB +
100CM
3 1153333 87369 50442 1131630 1175037 11460 11630
Total 15 1740533 3908233 1009101 1524103 1956964 11460 22940
Test of Homogeneity of Variances
Levene Statistic df1 df2 Sig
Methane Yields Based on Mean 3311 4 10 057
Based on Median 407 4 10 800
117
Based on Median and with
adjusted df
407 4 5808 798
Based on trimmed mean 2841 4 10 082
ANOVA
Methane Yields
Sum of Squares df Mean Square F Sig
Between Groups 21260984 4 5315246 432087 000
Within Groups 123013 10 12301
Total 21383997 14
Multiple Comparisons
Dependent Variable Methane Yields
(I) treatment (J) treatment
Mean
Difference (I-J) Std Error Sig
95 Confidence Interval
Lower
Bound
Upper
Bound
Tukey
HSD
100PSCB
+ 0CM
75PSCB +
25CM
2600000 286372 000 165753 354247
50PSCB +
50CM
5153333 286372 000 421086 609581
25PSCB +
75CM
6980000 286372 000 603753 792247
0PSCB +
100CM
11023333 286372 000 1008086 1196581
75PSCB +
25CM
100PSCB
+ 0CM
-2600000 286372 000 -354247 -165753
50PSCB +
50CM
2553333 286372 000 161086 349581
25PSCB +
75CM
4380000 286372 000 343753 532247
118
0PSCB +
100CM
8423333 286372 000 748086 936581
50PSCB +
50CM
100PSCB
+ 0CM
-5153333 286372 000 -609581 -421086
75PSCB +
25CM
-2553333 286372 000 -349581 -161086
25PSCB +
75CM
1826667 286372 000 88419 276914
0PSCB +
100CM
5870000 286372 000 492753 681247
25PSCB +
75CM
100PSCB
+ 0CM
-6980000 286372 000 -792247 -603753
75PSCB +
25CM
-4380000 286372 000 -532247 -343753
50PSCB +
50CM
-1826667 286372 000 -276914 -88419
0PSCB +
100CM
4043333 286372 000 310086 498581
0PSCB +
100CM
100PSCB
+ 0CM
-11023333 286372 000 -1196581 -1008086
75PSCB +
25CM
-8423333 286372 000 -936581 -748086
50PSCB +
50CM
-5870000 286372 000 -681247 -492753
25PSCB +
75CM
-4043333 286372 000 -498581 -310086
LSD 100PSCB
+ 0CM
75PSCB +
25CM
2600000 286372 000 196192 323808
50PSCB +
50CM
5153333 286372 000 451526 579141
25PSCB +
75CM
6980000 286372 000 634192 761808
0PSCB +
100CM
11023333 286372 000 1038526 1166141
119
75PSCB +
25CM
100PSCB
+ 0CM
-2600000 286372 000 -323808 -196192
50PSCB +
50CM
2553333 286372 000 191526 319141
25PSCB +
75CM
4380000 286372 000 374192 501808
0PSCB +
100CM
8423333 286372 000 778526 906141
50PSCB +
50CM
100PSCB
+ 0CM
-5153333 286372 000 -579141 -451526
75PSCB +
25CM
-2553333 286372 000 -319141 -191526
25PSCB +
75CM
1826667 286372 000 118859 246474
0PSCB +
100CM
5870000 286372 000 523192 650808
25PSCB +
75CM
100PSCB
+ 0CM
-6980000 286372 000 -761808 -634192
75PSCB +
25CM
-4380000 286372 000 -501808 -374192
50PSCB +
50CM
-1826667 286372 000 -246474 -118859
0PSCB +
100CM
4043333 286372 000 340526 468141
0PSCB +
100CM
100PSCB
+ 0CM
-11023333 286372 000 -1166141 -1038526
75PSCB +
25CM
-8423333 286372 000 -906141 -778526
50PSCB +
50CM
-5870000 286372 000 -650808 -523192
25PSCB +
75CM
-4043333 286372 000 -468141 -340526
100PSCB
+ 0CM
0PSCB +
100CM
11023333 286372 000 1019558 1185109
120
Dunnett
t (2-
sided)b
75PSCB +
25CM
0PSCB +
100CM
8423333 286372 000 759558 925109
50PSCB +
50CM
0PSCB +
100CM
5870000 286372 000 504225 669775
25PSCB +
75CM
0PSCB +
100CM
4043333 286372 000 321558 487109
The mean difference is significant at the 005 level
b Dunnett t-tests treat one group as a control and compare all other groups against it
121
REFERENCES
Abouelenien F Kitamura Y Nishio N amp Nakashimada Y (2009) Dry anaerobic ammoniandashmethane production from chicken manure Applied microbiology and biotechnology82(4) 757-764
Abouelenien F Namba Y Kosseva M R Nishio N amp Nakashimada Y (2014) Enhancementof methane production from co-digestion of chicken manure with agricultural wastesBioresource technology 159 80-87doihttpsdoiorg101016jbiortech201402050
Ağdağ O N amp Sponza D T (2007) Co-digestion of mixed industrial sludge with municipal solidwastes in anaerobic simulated landfilling bioreactors Journal of Hazardous Materials140(1-2) 75-85
Aichinger P Wadhawan T Kuprian M Higgins M Ebner C Fimml C Wett B (2015)Synergistic co-digestion of solid-organic-waste and municipal-sewage-sludge 1 plus 1equals more than 2 in terms of biogas production and solids reductionWater Research87 416-423 doihttpsdoiorg101016jwatres201507033
Angelidaki I Alves M Bolzonella D Borzacconi L Campos J Guwy A Van Lier J(2009) Defining the biomethane potential (BMP) of solid organic wastes and energycrops a proposed protocol for batch assaysWater Science and Technology 59(5) 927-934
Anwar Z Gulfraz M amp Irshad M (2014) Agro-industrial lignocellulosic biomass a key tounlock the future bio-energy A brief review Journal of Radiation Research and AppliedSciences 7(2) 163-173 doihttpsdoiorg101016jjrras201402003
APHA A (1995) WPCF Standard methods for the examination of water and wastewaterAmerican Public Health Association Washington DC
ASMC (2019) Australian sugar milling council Retrieved from httpsasmccomau
Barakat A de Vries H amp Rouau X (2013) Dry fractionation process as an important step incurrent and future lignocellulose biorefineries A review Bioresource technology 134362-373 doihttpsdoiorg101016jbiortech201301169
Bauer A Boumlsch P Friedl A amp Amon T (2009) Analysis of methane potentials of steam-exploded wheat straw and estimation of energy yields of combined ethanol andmethane production Journal of Biotechnology 142(1) 50-55doihttpsdoiorg101016jjbiotec200901017
122
Bauer A Lizasoain J Theuretzbacher F Agger J W Rincoacuten M Menardo S PotthastA (2014a) Steam explosion pretreatment for enhancing biogas production of lateharvested hay Bioresource technology 166 403-410
Bauer A Lizasoain J Theuretzbacher F Agger J W Rincoacuten M Menardo S Horn S J(2014b) Steam explosion pretreatment for enhancing biogas production of lateharvested hay Bioresource technology 166 403-410doihttpsdoiorg101016jbiortech201405025
Beckett N M Cresswell S L Grice D I amp Carter J F (2015) Isotopic profiling of seizedbenzylpiperazine and trifluoromethylphenylpiperazine tablets using δ13C and δ15Nstable isotopes Science amp Justice 55(1) 51-56doihttpsdoiorg101016jscijus201408003
Bolado-Rodriacuteguez S Toquero C Martiacuten-Juaacuterez J Travaini R amp Garciacutea-Encina P A (2016)Effect of thermal acid alkaline and alkaline-peroxide pretreatments on the biochemicalmethane potential and kinetics of the anaerobic digestion of wheat straw and sugarcanebagasse Bioresource technology 201 182-190doihttpsdoiorg101016jbiortech201511047
Brown D Shi J amp Li Y (2012) Comparison of solid-state to liquid anaerobic digestion oflignocellulosic feedstocks for biogas production Bioresource technology 124 379-386doihttpsdoiorg101016jbiortech201208051
Bruni E Jensen A P Pedersen E S amp Angelidaki I (2010) Anaerobic digestion of maizefocusing on variety harvest time and pretreatment Applied Energy 87(7) 2212-2217doihttpsdoiorg101016japenergy201001004
Caramiello C Lancellotti I Righi F Tatagraveno F Taurino R amp Barbieri L (2013) Anaerobicdigestion of selected Italian agricultural and industrial residues (grape seeds and leatherdust) Combined methane production and digestate characterization EnvironmentalTechnology 34 1225-1237 doi101080095933302012743597
CEC (2019) Clean Energy Council Retrieved from httpswwwcleanenergycouncilorgau
Cerri C C Galdos M V Maia S M F Bernoux M Feigl B J Powlson D amp Cerri C E P(2011) Effect of sugarcane harvesting systems on soil carbon stocks in Brazil anexamination of existing data European Journal of Soil Science 62(1) 23-28doi101111j1365-2389201001315x
Chae K J Jang A Yim S K amp Kim I S (2008) The effects of digestion temperature andtemperature shock on the biogas yields from the mesophilic anaerobic digestion ofswine manure Bioresource technology 99(1) 1-6doihttpsdoiorg101016jbiortech200611063
Chandra R Takeuchi H amp Hasegawa T (2012) Methane production from lignocellulosicagricultural cropwastes A review in context to second generationof biofuel production
123
Renewable and Sustainable Energy Reviews 16(3) 1462-1476doihttpsdoiorg101016jrser201111035
Chen H Liu J Chang X Chen D Xue Y Liu P Han S (2017) A review on thepretreatment of lignocellulose for high-value chemicals Fuel Processing Technology160 196-206 doihttpsdoiorg101016jfuproc201612007
Chen Y Cheng J J amp Creamer K S (2008) Inhibition of anaerobic digestion process A reviewBioresource technology 99(10) 4044-4064doihttpsdoiorg101016jbiortech200701057
Cheng X-Y amp Zhong C (2014) Effects of Feed to Inoculum Ratio Co-digestion andPretreatment on Biogas Production from Anaerobic Digestion of Cotton Stalk Energy ampFuels 28(5) 3157-3166 doi101021ef402562z
Cherubini F (2010) The biorefinery concept using biomass instead of oil for producing energyand chemicals Energy Conversion and Management 51(7) 1412-1421
Datta R (1981) Acidogenic fermentation of corn stover Biotechnology and bioengineering23(1) 61-77 doi101002bit260230106
DAWR (2017 15092017) Department of Agriculture andWater Resources Senate inquiry intosugar marketing arrangements Retrieved from httpwwwagriculturegovauag-farm-foodcropssugar
Eggleston G Grisham M amp Antoine A (2009) Clarification Properties of Trash and StalkTissues from Sugar Cane (Vol 58)
Eskicioglu C Monlau F Barakat A Ferrer I Kaparaju P Trably E amp Carregravere H (2017)Assessment of hydrothermal pretreatment of various lignocellulosic biomass with CO2catalyst for enhanced methane and hydrogen production Water Research 120 32-42doihttpsdoiorg101016jwatres201704068
Estevez M M Linjordet R amp Morken J (2012) Effects of steam explosion and co-digestion inthe methane production from Salix by mesophilic batch assays Bioresource technology104 749-756 doihttpsdoiorg101016jbiortech201111017
FAO (2018) Food and Agriculture Organization of the United Nations Retrieved fromhttpwwwfaoorgfaostatendataQC
Fernandez S Srinivas K Schmidt A J Swita M S amp Ahring B K (2018) Anaerobic digestionof organic fraction from hydrothermal liquefied algae wastewater byproductBioresource technology 247 250-258doihttpsdoiorg101016jbiortech201709030
124
Ferreira L C Donoso-Bravo A Nilsen P J Fdz-Polanco F amp Peacuterez-Elvira S I (2013)Influence of thermal pretreatment on the biochemical methane potential of wheatstraw Bioresource technology 143 251-257doihttpsdoiorg101016jbiortech201305065
Gabov K Hemming J amp Fardim P (2017) Sugarcane bagasse valorization by fractionationusing a water-based hydrotropic process Industrial crops and products 108 495-504doihttpsdoiorg101016jindcrop201706038
Galbe M amp Zacchi G (2007) Pretreatment of Lignocellulosic Materials for Efficient BioethanolProduction In L Olsson (Ed) Biofuels (pp 41-65) Berlin Heidelberg Springer BerlinHeidelberg
George P Cabello Eras J Sagastume A Hens L amp Vandecasteele C (2010) Residue fromSugarcane Juice Filtration (Filter Cake) Energy Use at the Sugar Factory Waste andBiomass Valorization 1 407-413 doi101007s12649-010-9046-2
Gharpuray M M Lee Y-H amp Fan L T (1983) Structural modification of lignocellulosics bypretreatments to enhance enzymatic hydrolysis Biotechnology and bioengineering25(1) 157-172 doi101002bit260250113
Goacutemez E O Torres R De Souza G amp Jackson G (2014) Sugarcane trash a feedstock forsecond generation processes In Sugarcane Bioethanol-RampD for Productivity andSustainability
Gonzaacutelez-Fernaacutendez C Leoacuten-Cofreces C amp Garciacutea-Encina P A (2008) Differentpretreatments for increasing the anaerobic biodegradability in swine manureBioresource technology 99(18) 8710-8714doihttpsdoiorg101016jbiortech200804020
Gumisiriza R Hawumba J F Okure M amp Hensel O (2017) Biomass waste-to-energyvalorisation technologies a review case for banana processing in Uganda Biotechnologyfor Biofuels 10(1) 11 doi101186s13068-016-0689-5
Gumisiriza R Mshandete A M Rubindamayugi M S T Kansiime F amp Kivaisi A K (2009)Enhancement of anaerobic digestion of Nile perch fish processing wastewater AfricanJournal of Biotechnology 8(2)
Gunes B Stokes J Davis P Connolly C amp Lawler J (2019) Pre-treatments to enhancebiogas yield and quality from anaerobic digestion of whiskey distillery and brewerywastes A review Renewable and Sustainable Energy Reviews 113 109281doihttpsdoiorg101016jrser2019109281
Hagos K Zong J Li D Liu C amp Lu X (2017) Anaerobic co-digestion process for biogasproduction Progress challenges and perspectives Renewable and Sustainable EnergyReviews 76 1485-1496 doihttpsdoiorg101016jrser201611184
125
Harrison M D Zhang Z Shand K OrsquoHara I M Doherty W O S amp Dale J L (2013) Effectof pretreatment on saccharification of sugarcane bagasse by complex and simpleenzyme mixtures Bioresource technology 148 105-113doihttpsdoiorg101016jbiortech201308099
Hendriks A T W M amp Zeeman G (2009) Pretreatments to enhance the digestibility oflignocellulosic biomass Bioresource technology 100(1) 10-18doihttpsdoiorg101016jbiortech200805027
Huber H Thomm M Koumlnig H Thies G amp Stetter K O (1982) Methanococcusthermolithotrophicus a novel thermophilic lithotrophic methanogen Archives ofMicrobiology 132(1) 47-50
Isikgor F H amp Becer C R (2015) Lignocellulosic biomass a sustainable platform for theproduction of bio-based chemicals and polymers Polymer Chemistry 6(25) 4497-4559
Jackowiak D Bassard D Pauss A amp Ribeiro T (2011) Optimisation of a microwavepretreatment of wheat straw for methane production Bioresource technology 102(12)6750-6756 doihttpsdoiorg101016jbiortech201103107
Jackowiak D Frigon J C Ribeiro T Pauss A amp Guiot S (2011) Enhancing solubilisation andmethane production kinetic of switchgrass by microwave pretreatment Bioresourcetechnology 102(3) 3535-3540 doihttpsdoiorg101016jbiortech201011069
Jain N Bhatia A amp Pathak H (2014) Emission of air pollutants from crop residue burning inIndia Aerosol and Air Quality Research 14(1) 422-430
Janke L Leite A Nikolausz M Schmidt T Liebetrau J Nelles M amp Stinner W (2015)Biogas Production from Sugarcane Waste Assessment on Kinetic Challenges for ProcessDesigning (Vol 16)
Janke L McCabe B K Harris P Hill A Lee S Weinrich S Baillie C (2019) Ensilingfermentation reveals pre-treatment effects for anaerobic digestion of sugarcanebiomass An assessment of ensiling additives on methane potential Bioresourcetechnology 279 398-403 doihttpsdoiorg101016jbiortech201901143
Jensen C Rodriguez Guerrero J Karatzos S Olofsson G amp Iversen S (2017) Fundamentalsof Hydrofactiontrade Renewable crude oil from woodybiomass
Kafle G K Kim S H amp Sung K I (2012) Batch anaerobic co-digestion of Kimchi factory wastesilage and swine manure under mesophilic conditions Bioresource technology 124489-494 doihttpsdoiorg101016jbiortech201208066
Kainthola J Kalamdhad A S amp Goud V V (2019) A review on enhanced biogas productionfrom anaerobic digestion of lignocellulosic biomass by different enhancement
126
techniques Process Biochemistry 84 81-90doihttpsdoiorg101016jprocbio201905023
Kalamaras S D amp Kotsopoulos T A (2014) Anaerobic co-digestion of cattle manure andalternative crops for the substitution of maize in South Europe Bioresource technology172 68-75 doihttpsdoiorg101016jbiortech201409005
Kaparaju P amp Rintala J (2005) Anaerobic co-digestion of potato tuber and its industrial by-products with pig manure Resources Conservation and Recycling 43(2) 175-188doihttpsdoiorg101016jresconrec200406001
Kaparaju P amp Rintala J (2013) 17 - Generation of heat and power from biogas for stationaryapplications boilers gas engines and turbines combined heat and power (CHP) plantsand fuel cells In A Wellinger J Murphy amp D Baxter (Eds) The Biogas Handbook (pp404-427) Woodhead Publishing
Karthikeyan O P amp Visvanathan C (2013) Bio-energy recovery from high-solid organicsubstrates by dry anaerobic bio-conversion processes a review Reviews inEnvironmental Science and BioTechnology 12(3) 257-284 doi101007s11157-012-9304-9
Khanal S K (2011) Anaerobic biotechnology for bioenergy production principles andapplications John Wiley amp Sons
Kim J Park C Kim T-H Lee M Kim S Kim S-W amp Lee J (2003) Effects of variouspretreatments for enhanced anaerobic digestion with waste activated sludge Journalof bioscience and bioengineering 95(3) 271-275
Kim M Chowdhury M M I Nakhla G amp Keleman M (2017) Synergism of co-digestion offood wastes with municipal wastewater treatment biosolids Waste Management 61473-483 doihttpsdoiorg101016jwasman201610010
Knappert D Grethlein H amp Converse A (1980) Partial acid hydrolysis of cellulosic materialsas a pretreatment for enzymatic hydrolysis Biotechnology and bioengineering 22(7)1449-1463 doi101002bit260220711
Kothari R Pandey A Kumar S Tyagi V amp Tyagi S (2014) Different aspects of dry anaerobicdigestion for bio-energy An overview Renewable and Sustainable Energy Reviews 39174-195
Kryvoruchko V Machmuumlller A Bodiroza V Amon B amp Amon T (2009) Anaerobic digestionof by-products of sugar beet and starch potato processing Biomass and Bioenergy33(4) 620-627 doihttpsdoiorg101016jbiombioe200810003
127
Kumar P Barrett D M Delwiche M J amp Stroeve P (2009) Methods for Pretreatment ofLignocellulosic Biomass for Efficient Hydrolysis and Biofuel Production Industrial ampengineering chemistry research 48(8) 3713-3729 doi101021ie801542g
Lancellotti I Righi F Tatagraveno F Taurino R amp Barbieri L (2013) Anaerobic digestion ofselected Italian agricultural and industrial residues (grape seeds and leather dust)combined methane production and digestate characterization AU - Caramiello CEnvironmental Technology 34(10) 1225-1237 doi101080095933302012743597
Larsson S Palmqvist E Hahn-Haumlgerdal B Tengborg C Stenberg K Zacchi G amp NilvebrantN-O (1999) The generation of fermentation inhibitors during dilute acid hydrolysis ofsoftwood Enzyme and Microbial Technology 24(3) 151-159doihttpsdoiorg101016S0141-0229(98)00101-X
Latif M AMehta CM amp Batstone D J (2015) Low pH anaerobic digestion ofwaste activatedsludge for enhanced phosphorous release Water Research 81 288-293doihttpsdoiorg101016jwatres201505062
Latif M A Mehta C M amp Batstone D J (2017) Influence of low pH on continuous anaerobicdigestion of waste activated sludge Water Research 113 42-49doihttpsdoiorg101016jwatres201702002
Lee D H Behera S K Kim J W amp Park H-S (2009) Methane production potential ofleachate generated from Korean food waste recycling facilities a lab-scale studyWasteManagement 29(2) 876-882
Lee J (1997) Biological conversion of lignocellulosic biomass to ethanol Journal ofBiotechnology 56(1) 1-24 doihttpsdoiorg101016S0168-1656(97)00073-4
Li K Liu R Cui S Yu Q amp Ma R (2018a) Anaerobic co-digestion of animal manures withcorn stover or apple pulp for enhanced biogas production Renewable Energy 118 335-342 doihttpsdoiorg101016jrenene201711023
Li X Li L Zheng M Fu G amp Lar J S (2009) Anaerobic Co-Digestion of Cattle Manure withCorn Stover Pretreated by Sodium Hydroxide for Efficient Biogas Production Energy ampFuels 23(9) 4635-4639 doi101021ef900384p
Li Y Jin Y Li J Li H amp Yu Z (2016) Effects of thermal pretreatment on the biomethane yieldand hydrolysis rate of kitchen waste Applied Energy 172 47-58doihttpsdoiorg101016japenergy201603080
Li Y Zhang R Chen C Liu G He Y amp Liu X (2013) Biogas production from co-digestion ofcorn stover and chicken manure under anaerobic wet hemi-solid and solid stateconditions Bioresource technology 149 406-412doihttpsdoiorg101016jbiortech201309091
128
Li Y Zhang R He Y Zhang C Liu X Chen C amp Liu G (2014) Anaerobic co-digestion ofchicken manure and corn stover in batch and continuously stirred tank reactor (CSTR)Bioresource technology 156 342-347doihttpsdoiorg101016jbiortech201401054
Li Z Chen Z Ye H Wang Y Luo W Chang J-S He N (2018b) Anaerobic co-digestionof sewage sludge and food waste for hydrogen and VFA production with microbialcommunity analysis Waste Management 78 789-799doihttpsdoiorg101016jwasman201806046
Lim S-F amp Matu S U (2015) Utilization of agro-wastes to produce biofertilizer InternationalJournal of Energy and Environmental Engineering 6(1) 31-35 doi101007s40095-014-0147-8
Lindorfer H Loacutepez C P Resch C Braun R amp Kirchmayr R (2007) The impact of increasingenergy crop addition on process performance and residual methane potential inanaerobic digestion Water Science and Technology 56(10) 55-63doihttpdxdoiorg102166wst2007728
Linnenluecke M K Zhou C Smith T Thompson N amp Nucifora N (2019) The impact ofclimate change on the Australian sugarcane industry Journal of Cleaner Production118974 doihttpsdoiorg101016jjclepro2019118974
Liu C-f Yuan X-z Zeng G-m Li W-w amp Li J (2008) Prediction of methane yield atoptimum pH for anaerobic digestion of organic fraction of municipal solid wasteBioresource technology 99(4) 882-888
Liu L Sun J Cai C Wang S Pei H amp Zhang J (2009a) Corn stover pretreatment byinorganic salts and its effects on hemicellulose and cellulose degradation Bioresourcetechnology 100(23) 5865-5871 doihttpsdoiorg101016jbiortech200906048
Liu L Sun J Li M Wang S Pei H amp Zhang J (2009b) Enhanced enzymatic hydrolysis andstructural features of corn stover by FeCl3 pretreatment Bioresource technology100(23) 5853-5858 doihttpsdoiorg101016jbiortech200906040
Lizasoain J RincoacutenM Theuretzbacher F Enguiacutedanos R Nielsen P J Potthast A BauerA (2016) Biogas production from reed biomass Effect of pretreatment using differentsteam explosion conditions Biomass and Bioenergy 95 84-91
Lopez M J Vargas-Garciacutea M d C Suaacuterez-Estrella F Nichols N N Dien B S amp Moreno J(2007) Lignocellulose-degrading enzymes produced by the ascomycete Coniochaetaligniaria and related species Application for a lignocellulosic substrate treatmentEnzyme and Microbial Technology 40(4) 794-800doihttpsdoiorg101016jenzmictec200606012
Magarey R C Reynolds M Dominiak B C Sergeant E Agnew J Ward A amp Thompson N(2019) Review of sugarcane Fiji leaf gall disease in Australia and the declaration of pest
129
freedom in Central Queensland Crop Protection 121 113-120doihttpsdoiorg101016jcropro201903022
Mamimin C Prasertsan P Kongjan P amp O-Thong S (2017) Effects of volatile fatty acids inbiohydrogen effluent on biohythane production from palm oil mill effluent underthermophilic condition Electronic Journal of Biotechnology 29 78-85doihttpsdoiorg101016jejbt201707006
Maniet G Schmetz Q Jacquet N Temmerman M Gofflot S amp Richel A (2017) Effect ofsteam explosion treatment on chemical composition and characteristic of organosolvfescue lignin Industrial crops and products 99 79-85
Mao C Zhang T Wang X Feng Y Ren G amp Yang G (2017) Process performance andmethane production optimizing of anaerobic co-digestion of swine manure and cornstraw Scientific Reports 7(1) 9379 doi101038s41598-017-09977-6
Masih-Das J amp Tao W (2018) Anaerobic co-digestion of foodwaste with liquid dairy manureor manure digestate Co-substrate limitation and inhibition Journal of EnvironmentalManagement 223 917-924 doihttpsdoiorg101016jjenvman201807016
Mata-Aacutelvarez J (2002)Biomethanization of theOrganic Fraction ofMunicipal SolidWastes (Vol4)
Matheri A N Ndiweni S N Belaid M Muzenda E amp Hubert R (2017) Optimising biogasproduction from anaerobic co-digestion of chicken manure and organic fraction ofmunicipal solid waste Renewable and Sustainable Energy Reviews 80 756-764doihttpsdoiorg101016jrser201705068
Matheri A N Ntuli F Ngila J C Seodigeng T Zvinowanda C amp Njenga C K (2018)Quantitative characterization of carbonaceous and lignocellulosic biomass for anaerobicdigestion Renewable and Sustainable Energy Reviews 92 9-16doihttpsdoiorg101016jrser201804070
Menardo S Airoldi G amp Balsari P (2012) The effect of particle size and thermal pre-treatment on the methane yield of four agricultural by-products Bioresourcetechnology 104 708-714 doihttpsdoiorg101016jbiortech201110061
Menon V amp Rao M (2012) Trends in bioconversion of lignocellulose biofuels platformchemicals amp biorefinery concept Progress in energy and combustion science 38(4) 522-550
Mojiri A Aziz H A Zaman N Aziz S Q amp Hamidi A (2012) A Review on AnaerobicDigestion Bio-reactor and Nitrogen Removal fromWastewater and Landfill Leachate byBio-reactor Advances in Environmental Biology 6 2143-2150
Mokomele T da Costa Sousa L Balan V van Rensburg E Dale B E amp Goumlrgens J F (2019)
130
Incorporating anaerobic co-digestion of steam exploded or ammonia fiber expansionpretreated sugarcane residues with manure into a sugarcane-based bioenergy-livestocknexus Bioresource technology 272 326-336doihttpsdoiorg101016jbiortech201810049
Monlau F Barakat A Steyer J P amp Carrere H (2012) Comparison of seven types of thermo-chemical pretreatments on the structural features and anaerobic digestion of sunflowerstalks Bioresource technology 120 241-247doihttpsdoiorg101016jbiortech201206040
Moraiumls S Morag E Barak Y Goldman D Hadar Y Lamed R Bayer E A (2012)Deconstruction of lignocellulose into soluble sugars by native and designercellulosomesMBio 3(6) e00508-00512
Moset V Fontaine D amp Moslashller H B (2017) Co-digestion of cattle manure and grassharvested with different technologies Effect on methane yield digestate compositionand energy balance Energy 141 451-460doihttpsdoiorg101016jenergy201708068
Mosier N Wyman C Dale B Elander R Lee Y Y Holtzapple M amp Ladisch M (2005)Features of promising technologies for pretreatment of lignocellulosic biomassBioresource technology 96(6) 673-686doihttpsdoiorg101016jbiortech200406025
Murphy J Braun R Weiland P amp Wellinger A (2011) Biogas from crop digestion Paperpresented at the IEA bioenergy task
Nachiappan B Fu Z amp Holtzapple M T (2011) Ammonium carboxylate production fromsugarcane trash using long-term air-lime pretreatment followed by mixed-culturefermentation Bioresource technology 102(5) 4210-4217doihttpsdoiorg101016jbiortech201012059
Neshat S A Mohammadi M Najafpour G D amp Lahijani P (2017) Anaerobic co-digestion ofanimal manures and lignocellulosic residues as a potent approach for sustainable biogasproduction Renewable and Sustainable Energy Reviews 79 308-322doihttpsdoiorg101016jrser201705137
Nguyen T-A D Kim K-R Han S J Cho H Y Kim J W Park S M Sim S J (2010)Pretreatment of rice straw with ammonia and ionic liquid for lignocellulose conversionto fermentable sugars Bioresource technology 101(19) 7432-7438doihttpsdoiorg101016jbiortech201004053
Nielfa A Cano R amp Fdz-Polanco M (2015) Theoretical methane production generated by theco-digestion of organic fraction municipal solid waste and biological sludgeBiotechnology Reports 5 14-21 doihttpsdoiorg101016jbtre201410005
Oliveira I Gominho J Diberardino S amp Duarte E (2012) Characterization of Cynaracardunculus L stalks and their suitability for biogas production Industrial crops and
131
products 40 318-323 doihttpsdoiorg101016jindcrop201203029
Palmowski L M amp Muumlller J A (2000) Influence of the size reduction of organic waste on theiranaerobic digestion Water Science and Technology 41(3) 155-162doi102166wst20000067
Panigrahi S Sharma H B amp Dubey B K (2020) Anaerobic co-digestion of food waste withpretreated yard waste A comparative study of methane production kinetic modelingand energy balance Journal of Cleaner Production 243 118480doihttpsdoiorg101016jjclepro2019118480
Park Y-J Tsuno H Hidaka T amp Cheon J-H (2008) Evaluation of operational parameters inthermophilic acid fermentation of kitchen waste Journal of Material Cycles and WasteManagement 10(1) 46-52
Pasangulapati V Ramachandriya K Ajay K Wilkins M Jones C amp Huhnke R (2012) Effectsof cellulose hemicellulose and lignin on thermochemical conversion characteristics ofthe selected biomass Bioresource technology 114 663-669doi101016jbiortech201203036
Patil J H Raj M A Muralidhara P Desai S amp Raju G M (2012) Kinetics of anaerobicdigestion of water hyacinth using poultry litter as inoculum International Journal ofEnvironmental Science and Development 3(2) 94
Paudel S R Banjara S P Choi O K Park K Y Kim Y M amp Lee J W (2017) Pretreatmentof agricultural biomass for anaerobic digestion Current state and challengesBioresource technology 245 1194-1205doihttpsdoiorg101016jbiortech201708182
Paul S amp Dutta A (2018) Challenges and opportunities of lignocellulosic biomass for anaerobicdigestion Resources Conservation and Recycling 130 164-174
Rabelo S C Carrere H Maciel Filho R amp Costa A C (2011) Production of bioethanolmethane and heat from sugarcane bagasse in a biorefinery concept Bioresourcetechnology 102(17) 7887-7895 doihttpsdoiorg101016jbiortech201105081
Rainey T J amp Covey G (2016) Pulp and paper production from sugarcane bagasse InSugarcane-based Biofuels and Bioproducts (pp 259-280)
Ramirez J A amp Rainey T J (2019) Comparative techno-economic analysis of biofuelproduction through gasification thermal liquefaction and pyrolysis of sugarcanebagasse Journal of Cleaner Production 229 513-527doihttpsdoiorg101016jjclepro201905017
Renouf M A Pagan R J amp Wegener M K (2013) Bio-production from Australian sugarcanean environmental investigation of product diversification in an agro-industry Journal ofCleaner Production 39 87-96 doihttpsdoiorg101016jjclepro201208036
132
Rincoacuten B Rodriacuteguez-Gutieacuterrez G Bujalance L Fernaacutendez-Bolantildeos J amp Borja R (2016)Influence of a steam-explosion pre-treatment on the methane yield and kinetics ofanaerobic digestion of two-phase olive mil solid waste or alperujo Process Safety andEnvironmental Protection 102 361-369
Risberg K Sun L Leveacuten L Horn S J amp Schnuumlrer A (2013) Biogas production from wheatstraw and manure ndash Impact of pretreatment and process operating parametersBioresource technology 149 232-237doihttpsdoiorg101016jbiortech201309054
Rodriacuteguez G Rodriacuteguez R Jimeacutenez A Guilleacuten R amp Fernaacutendez-Bolantildeos J (2007) Effect ofSteam Treatment of Alperujo on the Composition Enzymatic Saccharification and inVitro Digestibility of Alperujo Journal of Agricultural and Food Chemistry 55(1) 136-142 doi101021jf0616513
Sahu O (2018) Assessment of sugarcane industry Suitability for production consumption andutilization Annals of Agrarian Science 16(4) 389-395doihttpsdoiorg101016jaasci201808001
Saidu M Yuzir A Salim M R Azman S amp Abdullah N (2014) Biological pre-treated oil palmmesocarp fibre with cattle manure for biogas production by anaerobic digestion duringacclimatization phase International Biodeterioration amp Biodegradation 95 189-194
Samayam I P amp Schall C A (2010) Saccharification of ionic liquid pretreated biomass withcommercial enzyme mixtures Bioresource technology 101(10) 3561-3566doihttpsdoiorg101016jbiortech200912066
Sambusiti C Ficara E Malpei F Steyer J P amp Carregravere H (2013) Effect of sodium hydroxidepretreatment on physical chemical characteristics and methane production of fivevarieties of sorghum Energy 55 449-456doihttpsdoiorg101016jenergy201304025
Sawatdeenarunat C Surendra K C Takara D Oechsner H amp Khanal S K (2015) Anaerobicdigestion of lignocellulosic biomass Challenges and opportunities Bioresourcetechnology 178 178-186 doihttpsdoiorg101016jbiortech201409103
Scherer P Neumann L Demirel B Schmidt O amp Unbehauen M (2009) Long termfermentation studies about the nutritional requirements for biogasification of fodderbeet silage as mono-substrate Biomass and Bioenergy 33 873-881doi101016jbiombioe200901011
Shen J Zhao C Liu Y Zhang R Liu G amp Chen C (2018) Biogas production from anaerobicco-digestion of durian shell with chicken dairy and pig manures Energy Conversion andManagement doihttpsdoiorg101016jenconman201806099
Si K (2016) Review Anaerobic Co-Digestion of Slaughterhouse Waste and Food and VegetableWaste Inhibition Factors and its Reverting Methods
133
Sluiter A Hames B Ruiz R Scarlata C Sluiter J Templeton D amp Crocker D (2008)Determination of Structural Carbohydrates and Lignin in BiomassmdashNRELTP-510-42618Laboratory Analytical Procedure (LAP)
Song Z amp Zhang C (2015) Anaerobic codigestion of pretreated wheat straw with cattlemanure and analysis of the microbial community Bioresource technology 186 128-135doihttpsdoiorg101016jbiortech201503028
Srisowmeya G Chakravarthy M amp Nandhini Devi G (2019) Critical considerations in two-stage anaerobic digestion of food waste ndash A review Renewable and Sustainable EnergyReviews 109587 doihttpsdoiorg101016jrser2019109587
Stelte W (2013) Steam explosion for biomass pre-treatment Danish Technological Institute
Sud D Mahajan G amp Kaur M P (2008) Agricultural waste material as potential adsorbentfor sequestering heavy metal ions from aqueous solutions ndash A review Bioresourcetechnology 99(14) 6017-6027 doihttpsdoiorg101016jbiortech200711064
Taherzadeh M J amp Karimi K (2008) Pretreatment of lignocellulosic wastes to improve ethanoland biogas production a review International journal of molecular sciences 9(9) 1621-1651 doi103390ijms9091621
Teghammar A Yngvesson J Lundin M Taherzadeh M J amp Horvaacuteth I S (2010)Pretreatment of paper tube residuals for improved biogas production Bioresourcetechnology 101(4) 1206-1212 doihttpsdoiorg101016jbiortech200909029
Thorburn P Horan H amp Biggs J (2004) The impact of trash management on sugarcaneproduction and nitrogen management a simulation study
Tsapekos P Kougias P G Treu L Campanaro S amp Angelidaki I (2017) Processperformance and comparative metagenomic analysis during co-digestion of manureand lignocellulosic biomass for biogas production Applied Energy 185 126-135doihttpsdoiorg101016japenergy201610081
van Lier J B Tilche A Ahring B K Macarie H Moletta R Dohanyos M Verstraete W(2001) New perspectives in anaerobic digestion Water Science and Technology 43(1)1-18 doi102166wst20010001
Vats N Khan A A amp Ahmad K (2019) Anaerobic co-digestion of thermal pre-treatedsugarcane bagasse using poultry waste Journal of Environmental Chemical Engineering7(5) 103323 doihttpsdoiorg101016jjece2019103323
Vervaeren H Hostyn K Ghekiere G amp Willems B (2010) Biological ensilage additives aspretreatment for maize to increase the biogas production Renewable Energy 35(9)2089-2093 doihttpsdoiorg101016jrenene201002010
Vivekanand V Mulat D G Eijsink V G H amp Horn S J (2018) Synergistic effects of anaerobic
134
co-digestion of whey manure and fish ensilage Bioresource technology 249 35-41doihttpsdoiorg101016jbiortech201709169
Vivekanand V Olsen E F Eijsink V G H amp Horn S J (2013) Effect of different steamexplosion conditions on methane potential and enzymatic saccharification of birchBioresource technology 127 343-349doihttpsdoiorg101016jbiortech201209118
Wagner A O Malin C Lins P amp Illmer P (2011) Effects of various fatty acid amendmentson a microbial digester community in batch culture Waste Management 31(3) 431-437 doihttpsdoiorg101016jwasman201010020
Wang D Shen F Yang G Zhang Y Deng S Zhang J Mei Z (2018) Can hydrothermalpretreatment improve anaerobic digestion for biogas from lignocellulosic biomassBioresource technology 249 117-124doihttpsdoiorg101016jbiortech201709197
Wang J Yue Z-B Chen T-H Peng S-C Yu H-Q amp Chen H-Z (2010) Anaerobicdigestibility and fiber composition of bulrush in response to steam explosionBioresource technology 101(17) 6610-6614doihttpsdoiorg101016jbiortech201003086
War A R Paulraj M G Ahmad T Buhroo A A Hussain B Ignacimuthu S amp Sharma H C(2012) Mechanisms of plant defense against insect herbivores Plant signaling ampbehavior 7(10) 1306-1320 doi104161psb21663
Ward A J Hobbs P J Holliman P J amp Jones D L (2008) Optimisation of the anaerobicdigestion of agricultural resources Bioresource technology 99(17) 7928-7940
Wei W Wang Q Zhang L Laloo A Duan H Batstone D J amp Yuan Z (2018) Free nitrousacid pre-treatment of waste activated sludge enhances volatile solids destruction andimproves sludge dewaterability in continuous anaerobic digestionWater Research 13013-19 doihttpsdoiorg101016jwatres201711050
Weil J R Dien B Bothast R Hendrickson R Mosier N S amp Ladisch M R (2002) Removalof Fermentation Inhibitors Formed during Pretreatment of Biomass by PolymericAdsorbents Industrial amp engineering chemistry research 41(24) 6132-6138doi101021ie0201056
Wu W-M Hickey R F Bhatnagar L amp Zeikus J G (2018) 24 FATTY ACID DEGRADATION ASA TOOL TO MONITOR ANAEROBIC SLUDGE ACTIVITY AND TOXICITY Paper presented atthe Proceedings of the 44th Industrial Waste Conference May 1989 PurdueUniversity
Wu X Yao W Zhu J amp Miller C (2010) Biogas and CH4 productivity by co-digesting swinemanure with three crop residues as an external carbon source Bioresource technology101(11) 4042-4047 doihttpsdoiorg101016jbiortech201001052
Xie S Hai F I Zhan X Guo W Ngo H H Price W E amp Nghiem L D (2016) Anaerobic co-
135
digestion A critical review of mathematical modelling for performance optimizationBioresource technology 222 498-512doihttpsdoiorg101016jbiortech201610015
Xie S Lawlor P G Frost J P Hu Z amp Zhan X (2011) Effect of pig manure to grass silageratio on methane production in batch anaerobic co-digestion of concentrated pigmanure and grass silage Bioresource technology 102(10) 5728-5733doihttpsdoiorg101016jbiortech201103009
Xu R Xu S Florentino A P Zhang L Yang Z amp Liu Y (2019) Enhancing blackwatermethane production by enriching hydrogenotrophic methanogens through hydrogensupplementation Bioresource technology 278 481-485doihttpsdoiorg101016jbiortech201901014
Yang B amp Wyman C E (2008) Pretreatment the key to unlocking low-cost cellulosic ethanolBiofuels Bioproducts and Biorefining 2(1) 26-40 doi101002bbb49
Yang S-T amp Okos M (1987) Kinetic study and mathematical modeling of methanogenesis ofacetate using pure cultures of methanogens Biotechnology and bioengineering 30(5)661-667
Ye J Li D Sun Y Wang G Yuan Z Zhen F amp Wang Y (2013) Improved biogas productionfrom rice straw by co-digestion with kitchen waste and pig manure WasteManagement 33(12) 2653-2658doihttpsdoiorg101016jwasman201305014
Zhang J Loh K-C Lee J Wang C-H Dai Y amp Wah Tong Y (2017) Three-stage anaerobicco-digestion of food waste and horse manure Scientific Reports 7(1) 1269doi101038s41598-017-01408-w
Zhang T Liu L Song Z Ren G Feng Y Han X amp Yang G (2013a) Biogas Production by Co-Digestion of Goat Manure with Three Crop Residues Plos One 8(6) e66845doi101371journalpone0066845
Zhang W Wei Q Wu S Qi D Li W Zuo Z amp Dong R (2014) Batch anaerobic co-digestionof pig manure with dewatered sewage sludge under mesophilic conditions AppliedEnergy 128 175-183 doihttpsdoiorg101016japenergy201404071
Zhang Z Wong H H Albertson P L Doherty W O S amp OrsquoHara I M (2013b) Laboratoryand pilot scale pretreatment of sugarcane bagasse by acidified aqueous glycerolsolutions Bioresource technology 138 14-21doihttpsdoiorg101016jbiortech201303065
Zhang Z Zhang G Li W Li C amp Xu G (2016) Enhanced biogas production from sorghumstem by co-digestion with cow manure International Journal of Hydrogen Energy41(21) 9153-9158 doihttpsdoiorg101016jijhydene201602042
Zheng Z Liu J Yuan X Wang X Zhu W Yang F amp Cui Z (2015) Effect of dairy manure toswitchgrass co-digestion ratio on methane production and the bacterial community in
136
batch anaerobic digestion Applied Energy 151 249-257doihttpsdoiorg101016japenergy201504078
Zhou J Yan B H Wang Y Yong X Y Yang Z H Jia H H Wei P (2016) Effect of steamexplosion pretreatment on the anaerobic digestion of rice straw RSC Advances 6(91)88417-88425 doi101039C6RA15330E
Zhu J Wan C amp Li Y (2010) Enhanced solid-state anaerobic digestion of corn stover byalkaline pretreatment Bioresource technology 101(19) 7523-7528doihttpsdoiorg101016jbiortech201004060
- ABSTRACT
- STATEMENT OF ORIGINALITY
- LIST OF FIGURES
- LIST OF TABLES
- LIST OF ABBREVIATIONS
- ACKNOWLEDGMENTS
- APPENDIX 1
- APPENDIX 3
- APPENDIX 4
- REFERENCES
-
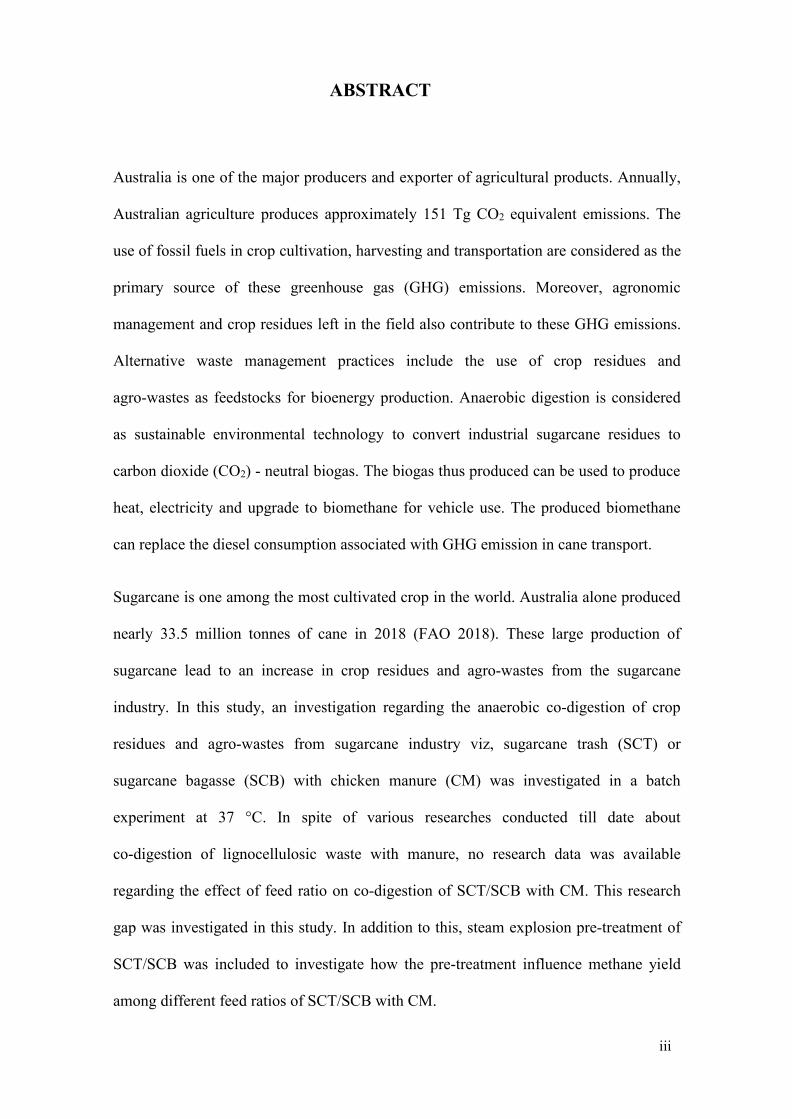