
AMA2007_1
95
VOL.38, NO.1, Winter 2007 VOL.38, No.1, WINTER 2007 ISSN 0084-5841
-
Upload
associate-professor-dr-said-elshahat-abdallah -
Category
Documents
-
view
157 -
download
9
Transcript of AMA2007_1

VO
L.38, NO
.1, Win
ter 2007
VOL.38, No.1, WINTER 2007
ISSN 0084-5841

Yoshisuke Kishida, Publisher & Chief EditorContributing Editors and Cooperators
- AFRICA -Kayombo, Benedict (Botswana)Fonteh, Fru Mathias (Cameroon)
El Behery, A.A.K. (Egypt)El Hossary, A.M. (Egypt)
Pathak, B.S. (Ethiopia)Bani, Richard Jinks (Ghana)Djokoto, Israel Kofi (Ghana)
Some, D. Kimutaiarap (Kenya)Houmy, Karim (Morocco)Igbeka, Joseph C. (Nigeria)
Odigboh, E.U. (Nigeria)Oni, Kayode C. (Nigeria)
Kuyembeh, N.G. (Sierra Leone)Abdoun, Abdien Hassan (Sudan)
Saeed, Amir Bakheit (Sudan)Khatibu, Abdisalam I. (Tanzania)Baryeh, Edward A. (Zimbabwe)Tembo, Solomon (Zimbabwe)
- AMERICAS -Cetrangolo, Hugo Alfredo (Argentina)
Naas, Irenilza de Alencar (Brazil)Ghaly, Abdelkader E. (Canada)
Hetz, Edmundo J. (Chile)Valenzuela, A.A. (Chile)
Aguirre, Robert (Colombia)Ulloa-Torres, Omar (Costa Rica)Magana, S.G. Campos (Mexico)
Ortiz-Laurel, H. (Mexico)Chancellor, William J. (U.S.A.)
Goyal, Megh Raj (U.S.A.)Mahapatra, Ajit K. (U.S.A.)Philips, Allan L. (U.S.A.)
- ASIA and OCEANIA -Quick, G.R. (Australia)
Farouk, Shah M. (Bangladesh)Hussain, Daulat (Bangladesh)
Mazed, M.A. (Bangladesh)Wangchen, Chetem (Bhutan)
Wang, Wanjun (China)Illangantileke, S. (India)
Ilyas, S. M. (India)Michael, A.M. (India)
Ojha, T.P. (India)
Verma, S.R. (India)Soedjatmiko (Indonesia)
Behroozi-Lar, Mansoor (Iran)Minaei, Saeid (Iran)Sakai, Jun (Japan)
Snobar, Bassam A. (Jordan)Chung, Chang Joo (Korea)
Lee, Chul Choo (Korea)Bardaie, Muhamad Zohadie (Malaysia)
Pariyar, Madan (Nepal)Ampratwum, David Boakye (Oman)
Eldin, Eltag Seif (Oman)Chaudhry, Allah Ditta (Pakistan)
Mughal, A.Q. (Pakistan)Rehman, Rafiq ur (Pakistan)
Devrajani, Bherular T. (Pakistan)Abu-Khalaf, Nawaf A. (Palestine)Nath, Surya (Papua New Guinea)Lantin, Reynaldo M. (Philippines)Venturina, Ricardo P. (Philippines)
Al-suhaibani, Saleh Abdulrahman (Saudi Arabia)Al-Amri, Ali Mufarreh Saleh (Saudi Arabia)
Chang, Sen-Fuh (Taiwan)Peng, Tieng-song (Taiwan)
Krishnasreni, Suraweth (Thailand)Phongsupasamit, Surin (Thailand)
Rojanasaroj. C. (Thailand)Salokhe, Vilas M. (Thailand)Singh, Gajendra (Thailand)
Pinar, Yunus (Turkey)Haffar, Imad (United Arab Emirates)
Lang, Pham Van (Viet Nam)Nguyen Hay (Viet Nam)
Hazza’a, Abdulsamad Abdulmalik (Yemen)
- EUROPE -Kaloyanov, Anastas P. (Bulgaria)
Kic, Pavel (Czech)Have, Henrik (Denmark)Pellizzi, Giuseppe (Italy)
Wanders, A. Anne (Netherlands)Pawlak, Jan (Poland)
Marchenko, Oleg S. (Russia)Kilgour, John (U.K.)
Martinov, Milan (Yugoslavia)
EDITORIAL STAFF(Tel.+81-(0)3-3291-5718)
Yoshisuke Kishida, Chief EditorShinjiro Tetsuka, Managing Editor
Noriyuki Muramatsu, Assistant EditorZachary A. Henry, Editorial Consultant
ADVERTISING(Tel.+81-(0)3-3291-3672)
Yoshito Nakajima, Manager (Head Office)Hiroshi Yamamoto, Manager (Branch Office)Advertising Rate: 300 thousand yen per page
CIRCULATION(Tel.+81-(0)3-3291-5718)(Fax.+81-(0)3-3291-5717)
Editorial, Advertising and Circulation Headquarters7, 2-chome, Kanda Nishikicho, Chiyoda-ku, Tokyo 101-0054, Japan
URL: http://www.shin-norin.co.jpE-Mail: [email protected]
Copylight © 2007 byFARM MACHINERY INDUSTRIAL RESEACH CORP.
SHIN-NORIN Building7, 2-chome, Kanda Nishikicho, Chiyoda-ku, Tokyo 101-0054, Japan
Printed in Japan
This is the 130th issue since its maiden isue in the Spring of 1971

EDITORIAL
It is a record-making warm winter season all over the world this year. They had rainfall instead of snowfall in Oslo, Norway; the temperature went up to over 20 degrees in New York. Snow has never lain this year, even in the areas of high snowfall in Japan. Some scientists say that global warming has been accelerated recently. Greenhouse effect gas emissions are continually increasing, forests are diminishing, and the eco-system is losing its balance. This is caused by growing population and economic activities that might have led to global warming.
Most national governments signed and ratified the Kyoto Protocol aimed at combating global warming. However, the reduction target of greenhouse gases emissions proved to be hardly achieved in Japan. As greenhouse gases are released largely by the burning of fossil fuels, many countries and organizations promote renewable energies. While solar energy and wind power are used as common renewable energy sources, more recently, the use of biomass energy especially attracts attention. With the background of the September 11 attack, the United States has adopted a new energy plan aimed at 75 percent reduction of oil dependency on Middle East Asia by 2025. Also in the National Re-newable Energy Standard issued in 2005, it is required that the production of ethanol be increased to 7.5 billion gallons per year by 2012. In the 2007 State of the Union Address, U.S. President G.W. Bush asked Congress to work to reduce gasoline usage in the U.S. by 20 percent over the next ten years and to increase ethanol production capacity up to 35 billion gallons.
Ethanol manufacturing consumes so much corn that the demand for corn used for ethanol production is rapidly growing, not only in U.S. but also in China. This leads to long term rise in corn price. Corn and sugar cane are the best agricultural products for energy production. The present concern is whether increasing corn demand can be supplied by increasing corn yield. On the other hand, a large number of people are still starving and enough food supply for the increasing population remains our critical concern, while a part of farm production is used for energy and not for food.
In this event, the most effective solution to what is going on earth is raising productivity on the limited farmland; in other words, increasing land productivity through timely farm work by intensified mechanization. The role of farm mechanization has proven to be the most important in this century. With this in mind, AMA readers and contributors are expected to join the efforts for further development of agricultural mechanization.
Yoshisuke KishidaChief Editor
Tokyo, JapanFebruary 2007

Yoshisuke Kishida
Sedat Çalisir
V. B. Shambhu, R. B. Ram
B. K. Behera, B. P. VarshneyS. Swain
B. K. Behera, B. P. VarshneyS. Swain
A. F. Alonge, A. A. Opeloyeru
M. W. Ullah, S. Anad
Ghanshyam TiwariAjay Kumar Sharma, K. P. Pandey
Hamid Al-Jalil, Jumah AmayrehMohamad Al-Widyan
Binisam, K. Kathirvel, R. ManianT. Senthikumar
K. Kathirvel, Binisam, R. ManianT. Senthikumar
Ahmed Al-Marshudi
Sukhbir SinghDinesh Kumar Vatsa
M. Din, P. S. DeshmukhN. Ravisankar, S. G. Choudhuri
H. Ortiz-Laurel, D. Rössel
Abstracts
News
New Publications from ASABE
7
9
18
23
29
33
39
46
51
55
61
68
74
78
83
89
91
92
Editorial
The Evaluation of Performance and Energy Usage in Submersible Deep Well Irrigation Pumping Plants
Status of Farm Mechanization in Nalanda District of Bihar
Effect of Puddling on Physical Prosperities of Soil and Rice Yield
Ground Contact Pressure and Soil Sedimentation Period Affecting Transplanter Sinkage and its Performance
Development of a Reinforced Mud Silo
Current Status, Constraints and Potentiality of Agricultural Mecha-nization in Fiji
Performance of some Pneumatic Tires Used in Camel Carts on Sandy Terrain
Feasibility of Collecting Ambient Air Moisture by Forced Conden-sation
Energy Cost of Riding and Walking Type Power Tillers
Vibration Mapping of Walking and Riding Type Power Tillers
Oman Traditional Farms: Changes and Improvement of Farms in Oman
Prospects of Maize Cultivation Mechanization in Hills of Himachal Pradesh
Farm Mechanization in Andaman and Nicobar Island
Current Status of Animal Traction in Mexico
CONTENTS
AGRICULTURAL MECHANIZATION IN ASIA, AFRICA AND LATIN AMERICAVol.38, No.1, February 2007
Co-operating Editor ............................................93Back Issues ..........................................................96
Instructions to AMA Contributors .....................98★ ★ ★

VOL.38 NO.1 2007 AGRICULTURAL MECHANIZATION IN ASIA, AFRICA, AND LATIN AMERICA 9
The Evaluation of Performance and Energy Usage in Submersible Deep Well Irrigation Pumping Plants
bySedat ÇalisirProfessorDepartment of Agricultural Machinery,Faculty of Agriculture,University of Selçuk, 42031 [email protected]
AbstractMaterial performance and en-
ergy usage of submersible irrigation pumping plants were evaluated in this study. This research was car-ried out in Konya vicinity of Turkey. In general submersible irrigation pumping plants were tested. Total mass per pumping plant, flow rate, total dynamic head, specific draw-down of well, diving depth, actual performance (system efficiency), performance rating and specific to-tal energy consumption were found to be 1,283.8 ± 27.6 kg/unit, 41.1 ± 1.0 L/s, 56.1 ± 2.1 m, 0.25 ± 0.02 m per L/s, 12.1 ± 0.6 m, 52 ± 1 %, 78 ± 1 % and 2.93 ± 0.10 MJ m-3, respec-tively. According to Nebraska Per-formance Criteria (NPC), potential of energy saving rating was deter-mined as 22 % in all of the plants. In addition, the simple and useful regression equations for specific to-tal energy consumption depending on motor power, flow rate and total dynamic head were obtained.
IntroductionIn arid and semiarid climate re-
gions, irrigation is one of the tech-niques used for increasing agricul-tural production. Subterranean wa-ter sources are used in agricultural irrigation either due to insufficiency of surface water sources or due to its uneconomical transportation. To benefit from subterranean water, opening and installation of drilling well and buying of deep well pumps are expensive investment.
There are approximately 80,000 deep well pumps in Turkey (SIS, 2001). The submersible deep well irrigation pumps were at the 90 % level for agricultural irrigation in the past decade because of increas-ing dynamic water level, wide spread electrical energy and the technological developments of drill-ing machines, pumps and submers-ible motors. However, vertical line shaft deep well pumps lubricated with oil were preferred in condi-tions which included silt-sand (>50 kgm-3) of well water and in regions without electrical energy (Schulz, 1977 and Kosyna, 1984).
Turkey has useable subterranean water source of 12 billion m3/year. According to 1997 data, consump-tion rate was 50 %. Approximately 504,965 ha were irrigated with 75 %
of this consumption (SHW, 1997).Energy efficiency determined by
the energy balance of the plant is an important indicator in agricultural production (Heyland & Solonsky, 1979; Smil, 1983; Dipenbrock et al., 1995; Moerschner et al., 1997; Hüls-bergen et al., 2001). The supply en-ergy of irrigation water is an impor-tant input of plant energy balance in arid and semiarid regions (Sloggett, 1992; Mrini et al., 2001). Instead of calculating equivalent irrigation wa-ter assurance energy, water source, type of pump and driven source, the reference value of 0.63 MJ m-3 in Turkey was used (Yaldiz et al., 1993).
The aim of this study was to evaluate the used material, system efficiency and usage energy for the supply of unit irrigation water in submersible deep well irrigation pumping plants.
Acknowledgment: The author wishes to acknowledge the 4th Re-gional Directorate of State Hydrau-lic Works (SHW) and the subter-ranean water irrigation cooperative for helpful on this work.

AGRICULTURAL MECHANIZATION IN ASIA, AFRICA, AND LATIN AMERICA 2007 VOL.38 NO.110
Material and MethodsWorking Region
The study was carried out in July and August of 2001-2002 in the Konya region. Konya is the largest agricultural region of Turkey with area of 41.94 km2 at middle Anato-lia. The annual average rainfall is 300 mm and the altitude is 1,016 m (Anonymous, 2002).
Material SelectionThere are 23 subterranean water
irrigation cooperatives in the study area (Anonymous, 2000). The selec-tion of submersible deep well pumps in these cooperatives was based on motor power, numerical density, and suitability for measuring criteria. A sample volume was selected at 90 % confidence range and 5 % degree of importance with respect to the stage sampling method in order to represent the population (McClave and Benson, 1988). Motor power of pumping plants that depend on f low rate and total dynamic head, were 22, 30, 37, 45 and 55 kW, and the distribution according to motor power of 110 plants were 12, 31, 32, 26 and 9, respectively.
Generally Properties of Pumping Plants
Each pumping plant has an am-meter, a voltmeter and an electric counter. There is no control valve in the discharge pipe and the discharge pipe is commonly connected to a sprinkler irrigation line or it trans-mitted water directly to the field. In addition, there is a hole in the equip-
ping pipe to measure the dynamic water level of the well. Technical properties of the pumping plants such as well depth, pump diving depth, column pipe diameter, motor characteristics, stage number and pump set total mass were provided from records of 4th Regional Direc-torate of State Hydraulic Works and manufacturer catalogues (Anony-mous, 2000). Instruments used in performance tests of pumping plants are shown in Table 1.
Audit of TestingPower consumption from the net-
work in present working conditions of tested plants were determined by measuring from discharge of the electrical dashboard. The system was then stopped. Measurement instruments, which were a pressure gauge, orifice meter and control valve, were connected to the system at a suitable discharge pipe diameter of the plants. About 15-20 minutes after system start, the discharge pressure, flow rate, power consumed and dynamic level were measured. Again, system was stopped and af-ter 30 minutes and static level was measured (Hansen, 1974; Saqip & Khan, 1993). Static and dynamic levels were measured by putting an electrical well sounder between the pump column pipe and well equip-ping pipe. Calibrated orifice meters of about 3/4", 4/6", 5/6" and 6/8" with respect to discharge pipe diam-eter of plants, were used at 4-1/2", 5-1/2", 6-5/8" and 8-5/8" discharge pipe respectively (Karassik et al., 1986).
Evaluating of Performance Test Results
Actual performance of pumping irrigation plants was calculated by using the equations below (Han-son, 1994; Conlon et al., 1999; Hla & Scherer, 2001; Loftis & Miles, 2001).
AP=((Q*TDH*γ)/(102*NI))*100 ............................(1)TDH=PWL+10.2*P+VH+FL ...(2)VH=v2/2g .....................................(3)FL= L*J ........................................(4)Water velocity at the pump dis-
charge pipe was calculated by us-ing the measured f low rate and discharge pipe diameter from the continuity equation. Friction loses of the column pipe, were calcu-lated from the hydraulic gradient (j) which was given by the manufac-turer as a function of flow rate and pipe diameter. Specific mass of wa-ter was assumed as (γ) 1 kg L-1 since the pumping water was clear and its temperature (t) varied between 0-30 ºC (Karassik et al., 1986).
Specif ic drawdown of pump-ing wells were determined by the ratio of the difference between the dynamic level and the static level to the consumed f low rate (Eqn. 5) (Saqip and Khan, 1993). Diving depth was calculated from the dif-ference between the column line length and the pumping water level (Eqn. 6) (Schulz, 1977).
∆=(PWL-SL)/Q ..........................(5)DD=L-PWL ................................(6)A plant’s performance rating (PR)
was determined by the ratio of sys-tem efficiency to 0.66 value known as a Nebraska Performance Criteria (NPC) (Eqn. 9). NPC value is the optimum accessible system efficien-cy (pump efficiency 75 % and motor efficiency 88 %), (USDA1997, Con-lon et al., 1999).
PR=[AP/NPC]*100 ....................(7)
Evaluating of Direct and Indirect Energy Usage
Pumping plants not only con-sumed system energy but also the most efficient system conversion
Parameter/date Units Instruments used
Flow rate (Q) L/s Calibrated orifice meters (3/4"), (4/6"), (5/6"), (6/8")
Power consumed (NI) kW Power master (Electric power analyser)
Static (SL) and pumping water levels (PWL) m Electric well sounder
Discarge pressure (P) before control valve bar Test grade dial pressure gauge
Water temperature (t) ºC Thermometer
Table 1 Instruments used in tests

VOL.38 NO.1 2007 AGRICULTURAL MECHANIZATION IN ASIA, AFRICA, AND LATIN AMERICA 11
Prop
ertie
s of p
umpi
ng p
lant
sPe
rfor
man
ce o
f pum
ping
pla
nts
Ener
gy u
sage
of p
umpi
ng p
lant
sN
M kWN
r.W
ell
Nr.
D (")
L mM kg
DD m
Q L/s
NI
kWSL m
PWL
mP ba
rTD
Hm
∆m
per
L/s
AP %
PR %D
EM
J m-3
IE M
J m-3
TEM
J m-3
SR %W
ell
Pum
p-se
t
22
132
,300
4-1/
251
.995
5.8
7.9
21.6
25.7
32.6
44.0
1.3
66.0
0.53
5482
3.10
0.15
0.08
3.33
182
32,3
015-
1/2
51.9
1,10
5.4
5.9
31.2
25.6
31.2
46.0
0.2
54.0
0.47
6498
2.14
0.12
0.06
2.32
23
45,2
135-
1/2
48.8
1,05
2.0
9.6
30.2
26.1
27.6
39.2
0.4
49.0
0.38
5684
2.25
0.11
0.06
2.42
164
53,2
626-
5/8
36.6
956.
88.
440
.626
.616
.428
.20.
233
.00.
2949
751.
710.
060.
041.
8125
549
,627
6-5/
836
.695
6.8
9.1
38.6
25.2
17.3
27.5
0.8
38.5
0.26
5888
1.70
0.06
0.04
1.81
126
42,0
106-
5/8
33.6
895.
46.
841
.624
.515
.526
.80.
332
.50.
2754
821.
530.
060.
041.
6318
742
,014
6-5/
833
.689
5.4
7.1
40.2
25.3
15.9
26.5
0.4
33.0
0.26
5178
1.64
0.06
0.04
1.74
228
42,0
206-
5/8
24.4
711.
28.
458
.324
.68.
216
.00.
121
.00.
1349
741.
100.
040.
021.
1626
942
,008
6-5/
830
.583
4.0
6.0
47.9
24.6
12.6
24.5
0.5
32.6
0.25
6294
1.34
0.05
0.03
1.42
610
42,0
156-
5/8
24.4
711.
25.
549
.625
.38.
418
.91.
133
.10.
2164
961.
330.
050.
031.
404
1151
,858
6-5/
818
.358
8.4
3.1
60.5
25.8
8.9
15.2
0.5
24.0
0.10
5584
1.11
0.04
0.02
1.17
1612
46,2
835-
1/2
45.8
998.
68.
928
.925
.424
.636
.90.
749
.00.
4355
832.
290.
110.
062.
4617
Aver
age
36.3
888.
47.
240
.825
.418
.329
.10.
538
.80.
3056
851.
770.
080.
041.
8915
Stan
dard
err
or3.
244
.00.
53.
40.
22.
53.
00.
13.
80.
042.
02.
00.
170.
010.
010.
182.
0
30
1346
,244
6-5/
827
.585
2.6
13.5
39.5
32.6
13.0
14.0
3.3
51.0
0.03
6182
2.16
0.07
0.04
2.25
1814
41,5
264-
1/2
61.0
1,15
7.4
6.0
22.0
35.1
25.0
55.0
0.6
76.0
1.36
4771
4.16
0.15
0.09
4.40
2915
35,3
845-
1/2
61.0
1,33
7.5
12.5
28.0
34.7
42.0
48.5
0.5
62.0
0.23
4974
3.23
0.11
0.08
3.42
2616
13,1
146-
5/8
39.7
1,09
8.2
4.7
51.0
32.0
29.0
35.0
0.0
42.0
0.12
6610
01.
630.
060.
041.
730
1721
,822
6-5/
833
.697
5.4
17.6
48.0
35.9
8.0
16.0
1.1
33.0
0.17
4366
1.95
0.06
0.04
2.04
3418
83,3
736-
5/8
21.4
729.
83.
447
.536
.39.
018
.01.
032
.00.
1941
621.
990.
060.
032.
0738
1983
,289
5-1/
251
.91,
177.
48.
430
.133
.319
.043
.51.
364
.50.
8157
972.
880.
090.
073.
043
2018
,940
6-5/
830
.591
4.0
13.5
48.5
34.3
12.0
17.0
1.2
34.5
0.10
4873
1.84
0.06
0.03
1.93
2721
14,4
556-
5/8
24.4
791.
26.
658
.037
.613
.517
.80.
124
.90.
0738
571.
690.
050.
021.
7643
2230
,266
6-5/
842
.71,
159.
614
.738
.036
.521
.028
.01.
144
.00.
1845
682.
500.
090.
052.
6432
2321
,974
6-5/
839
.71,
098.
216
.740
.033
.021
.023
.02.
250
.50.
0560
912.
150.
090.
052.
289
2419
,157
6-5/
848
.81,
282.
317
.841
.032
.325
.031
.01.
450
.60.
1563
952.
050.
070.
052.
185
2546
,380
6-5/
836
.61,
036.
814
.640
.536
.716
.022
.01.
037
.00.
1540
612.
360.
070.
042.
4839
2642
,282
5-1/
261
.01,
337.
525
.530
.034
.81 1
.035
.51.
560
.50.
8251
773.
020.
130.
083.
2323
2742
,283
5-1/
245
.81,
070.
69.
331
.036
.711
.036
.50.
347
.30.
8239
593.
080.
120.
063.
2641
2851
,632
5-1/
258
.01,
284.
19.
528
.035
.135
.048
.50.
258
.20.
4846
693.
260.
140.
083.
4831
2930
,468
6-5/
833
.697
5.4
8.6
42.0
34.0
17.0
25.0
1.5
44.5
0.19
5482
2.11
0.07
0.04
2.23
1830
10,0
276-
5/8
24.4
791.
29.
452
.034
.012
.015
.01.
535
.00.
0652
801.
700.
060.
031.
7920
3147
,836
6-5/
851
.91,
343.
713
.936
.932
.629
.038
.01.
255
.00.
2461
922.
300.
100.
062.
478
3253
,972
6-5/
851
.91,
343.
726
.939
.233
.215
.025
.01.
545
.50.
2653
802.
200.
090.
062.
3620
3331
,771
6-5/
851
.91,
343.
714
.940
.133
.732
.037
.00.
648
.90.
1257
862.
190.
090.
062.
3414
3426
,938
6-5/
842
.71,
159.
68.
740
.034
.730
.034
.00.
443
.20.
1049
742.
260.
090.
052.
4026
3530
,044
6-5/
848
.81,
282.
316
.840
.632
.828
.032
.01.
250
.00.
1061
922.
090.
100.
062.
258
3647
,884
5-1/
264
.11,
390.
913
.129
.234
.045
.051
.00.
262
.50.
2153
803.
030.
160.
083.
2720
3755
,755
6-5/
839
.71,
098.
22.
740
.632
.328
.037
.00.
850
.30.
2262
942.
070.
100.
052.
226
Tabl
e 2
Ave
rage
val
ues a
nd st
anda
rd e
rror
s of t
est r
esul
ts in
pum
ping
pla
nts (
cont
inue
d on
pag
e 12
)

AGRICULTURAL MECHANIZATION IN ASIA, AFRICA, AND LATIN AMERICA 2007 VOL.38 NO.112
Prop
ertie
s of p
umpi
ng p
lant
sPe
rfor
man
ce o
f pum
ping
pla
nts
Ener
gy u
sage
of p
umpi
ng p
lant
sN
M kWN
r.W
ell
Nr.
D (")
L mM kg
DD m
Q L/s
NI
kWSL m
PWL
mP ba
rTD
Hm
∆m
per
L/s
AP %
PR %D
EM
J m-3
IE M
J m-3
TEM
J m-3
SR %W
ell
Pum
p-se
t
30
3821
,018
6-5/
839
.71,
098.
210
.739
.235
.814
.029
.00.
438
.00.
3841
622.
380.
080.
052.
5138
3924
,938
5-1/
258
.01,
284.
115
.028
.934
.331
.043
.00.
960
.00.
4250
753.
090.
160.
083.
3325
4046
,399
4-1/
279
.31,
432.
723
.319
.636
.236
.056
.00.
475
.01.
0240
604.
810.
230.
135.
1740
4147
,704
6-5/
833
.697
5.4
13.6
59.6
34.7
13.0
20.0
0.0
28.0
0.12
4771
1.52
0.04
0.03
1.59
2942
51,2
595-
1/2
48.8
1,12
4.0
2.8
28.9
34.3
38.0
46.0
0.7
60.0
0.28
5075
3.09
0.12
0.07
3.28
2543
18,6
686-
5/8
48.8
1,28
2.3
8.8
40.0
33.3
33.0
40.0
0.1
47.0
0.18
5584
2.17
0.08
0.06
2.31
16Av
erag
e45
.21,
136.
412
.338
.634
.423
.032
.80.
948
.70.
3151
772.
480.
100.
062.
6423
Stan
dard
err
or2.
434
.51.
11.
70.
31.
92.
20.
12.
30.
061.
02.
00.
130.
010.
000.
142
37
4441
,531
6-5/
854
.91,
475.
118
.939
.539
.022
.036
.02.
061
.00.
3561
922.
570.
080.
072.
718
4541
,533
6-5/
836
.61,
106.
811
.649
.543
.322
.025
.00.
939
.00.
0644
662.
280.
050.
042.
3734
4613
,097
8-5/
836
.61,
450.
19.
649
.247
.723
.027
.00.
938
.60.
0844
662.
260.
050.
052.
3634
4747
,879
6-5/
836
.61,
106.
86.
650
.343
.727
.030
.00.
338
.50.
0643
662.
260.
050.
042.
3634
4853
,262
6-5/
845
.81,
290.
910
.841
.140
.321
.035
.01.
757
.00.
3457
862.
550.
070.
052.
6814
4953
,260
5-1/
251
.91,
610.
45.
931
.039
.415
.046
.02.
578
.51.
0061
923.
310.
120.
093.
528
5032
,298
6-5/
839
.71,
168.
228
.760
.539
.56.
011
.02.
241
.00.
0862
931.
700.
040.
031.
777
5146
,585
5-1/
273
.21,
984.
026
.229
.639
.828
.047
.02.
379
.00.
6458
873.
500.
130.
123.
7513
5239
,272
6-5/
854
.91,
475.
112
.939
.841
.841
.042
.01.
461
.00.
0357
862.
730.
090.
062.
8914
5319
,155
6-5/
845
.81,
290.
97.
838
.540
.428
.038
.02.
366
.00.
2662
932.
730.
080.
062.
887
5436
,240
6-5/
836
.61,
106.
810
.649
.843
.213
.026
.00.
637
.00.
2642
632.
260.
050.
042.
3537
5525
,135
6-5/
854
.91,
475.
110
.938
.940
.440
.044
.01.
766
.00.
1062
942.
710.
090.
072.
876
5652
,681
6-5/
836
.61,
106.
88.
637
.842
.314
.028
.02.
153
.00.
3746
702.
920.
070.
053.
0430
5752
,680
6-5/
836
.61,
106.
87.
639
.644
.215
.029
.00.
845
.00.
3540
602.
900.
070.
053.
0240
5853
,142
8-5/
851
.91,
884.
719
.940
.240
.420
.032
.02.
863
.00.
3061
932.
620.
070.
082.
777
5930
,191
6-5/
845
.81,
290.
97.
850
.039
.833
.038
.01.
458
.00.
1072
108
2.07
0.07
0.05
2.18
-860
10,0
246-
5/8
30.5
984.
08.
550
.145
.716
.022
.00.
633
.00.
1235
542.
370.
050.
032.
4646
6143
,400
4-1/
297
.61,
763.
921
.621
.544
.159
.076
.00.
398
.20.
7947
715.
340.
220.
145.
7029
6226
,933
6-5/
858
.01,
536.
524
.040
.239
.633
.034
.02.
665
.50.
0265
992.
560.
070.
072.
711
6351
,656
6-5/
842
.71,
229.
60.
740
.340
.032
.042
.01.
763
.20.
2562
952.
580.
090.
052.
725
6454
,287
6-5/
851
.91,
413.
72.
940
.040
.545
.049
.01.
165
.40.
1063
962.
640.
100.
062.
804
6538
,313
5-1/
270
.21,
930.
615
.230
.241
.538
.055
.00.
770
.50.
5650
763.
580.
140.
1 13.
8324
6621
,027
6-5/
842
.71,
229.
613
.740
.040
.919
.029
.01.
851
.20.
2549
742.
660.
070.
052.
7826
6752
,538
6-5/
845
.81,
290.
95.
839
.840
.823
.040
.01.
862
.30.
4360
902.
670.
080.
062.
8110
6854
,213
6-5/
854
.91,
475.
12.
930
.639
.942
.052
.02.
480
.20.
3360
913.
400.
130.
083.
619
6911
,277
6-5/
845
.81,
290.
913
.850
.443
.025
.032
.00.
442
.30.
1449
742.
220.
060.
042.
3226
7046
,777
6-5/
864
.11,
659.
318
.140
.541
.033
.046
.01.
365
.00.
3263
952.
630.
090.
072.
805
7146
,770
6-5/
864
.11,
659.
320
.139
.640
.534
.044
.01.
565
.20.
2563
952.
660.
090.
072.
835
7230
,479
6-5/
848
.81,
352.
311
.839
.243
.422
.037
.01.
051
.30.
3845
692.
880.
080.
063.
0231
7349
,956
6-5/
873
.21,
843.
521
.230
.942
.141
.052
.01.
773
.50.
3653
803.
550.
130.
103.
7920
7430
,110
6-5/
839
.71,
168.
214
.741
.143
.417
.025
.01.
141
.50.
1646
702.
300.
050.
042.
4030
7547
,930
4-1/
297
.61,
741.
328
.620
.642
.643
.049
.01.
511
4.5
0.29
5482
5.39
0.16
0.12
5.67
18
Tabl
e 2
Ave
rage
val
ues a
nd st
anda
rd e
rror
s of t
est r
esul
ts in
pum
ping
pla
nts (
cont
inue
d fr
om p
age
11)

VOL.38 NO.1 2007 AGRICULTURAL MECHANIZATION IN ASIA, AFRICA, AND LATIN AMERICA 13
37Av
erag
e52
.01,
421.
813
.940
.341
.527
.838
.11.
560
.10.
2954
822.
840.
090.
072.
9918
Stan
dard
err
or2.
948
.61.
61.
50.
32.
12.
20.
13.
20.
042.
02.
00.
140.
010.
000.
152
45
7616
,063
6-5/
830
.51,
064.
02.
557
.547
.118
.028
.01.
346
.00.
1755
832.
130.
050.
032.
2217
7713
,104
6-5/
836
.61,
186.
817
.660
.552
.717
.019
.01.
339
.00.
0344
672.
270.
040.
032.
3433
7845
,555
6-5/
827
.51,
002.
611
.550
.250
.88.
016
.01.
434
.50.
1633
512.
640.
050.
032.
7249
7941
,146
5-1/
273
.21,
686.
018
.226
.154
.046
.055
.06.
512
7.0
0.34
6091
5.39
0.11
0.11
5.61
980
25,4
056-
5/8
48.8
1,43
2.3
22.8
49.6
48.5
22.0
26.0
1.7
49.0
0.08
4974
2.55
0.06
0.05
2.66
2681
46,5
876-
5/8
48.8
1,43
2.3
17.8
60.1
41.8
28.0
31.0
0.8
47.0
0.05
5888
2.07
0.06
0.04
2.18
1282
33,1
996-
5/8
51.9
1,49
3.7
7.9
51.2
47.7
32.0
44.0
0.3
53.0
0.23
5684
2.43
0.05
0.05
2.53
1683
43,0
456-
5/8
70.2
1,86
2.1
9.2
39.6
48.4
54.0
61.0
0.5
71.0
0.18
5786
3.18
0.10
0.08
3.36
1484
52,6
796-
5/8
36.6
1,18
6.8
7.6
50.0
49.6
24.0
29.0
0.6
40.0
0.10
4060
2.58
0.07
0.04
2.69
4085
52,6
786-
5/8
36.6
1,18
6.8
11.6
50.6
47.9
19.0
25.0
1.0
40.0
0.12
4163
2.47
0.06
0.04
2.57
3786
51,6
346-
5/8
45.8
1,37
0.9
9.8
48.2
52.9
29.0
36.0
1.2
53.0
0.15
4772
2.86
0.05
0.05
2.96
2887
30,1
888-
5/8
42.7
1,71
2.0
11.7
47.9
47.6
24.0
31.0
0.5
38.5
0.15
3858
2.59
0.08
0.06
2.72
4288
47,8
296-
5/8
51.9
1,49
3.7
15.9
49.9
51.5
34.0
36.0
0.7
49.0
0.04
4771
2.69
0.05
0.05
2.79
2989
53,5
976-
5/8
39.7
1,24
8.2
4.7
40.5
53.1
17.0
35.0
0.7
46.0
0.44
3452
3.42
0.07
0.05
3.54
4890
31,7
736-
5/8
51.9
1,49
3.7
15.9
50.6
48.8
27.0
36.0
1.1
53.0
0.18
5482
2.51
0.06
0.05
2.62
1891
42,6
376-
5/8
45.8
1,37
0.9
11.8
48.9
47.3
27.0
34.0
0.8
48.0
0.14
4974
2.52
0.07
0.05
2.64
2692
32,5
926-
5/8
48.8
1,43
2.3
16.8
48.8
56.2
29.0
32.0
1.1
49.0
0.06
4263
3.00
0.05
0.05
3.10
3793
8,30
66-
5/8
33.6
1,12
5.4
13.8
58.9
53.2
19.0
20.0
1.3
39.0
0.02
4264
2.35
0.02
0.03
2.41
3694
20,5
256-
5/8
45.6
1,37
0.9
13.8
50.3
47.3
31.0
32.0
0.8
46.0
0.02
4873
2.45
0.06
0.05
2.56
2795
30,4
856-
5/8
39.7
1,24
8.2
16.7
50.6
48.0
22.0
23.0
2.0
49.0
0.02
5177
2.47
0.07
0.04
2.58
2396
14,4
786-
5/8
39.7
1,24
8.2
14.7
50.4
48.0
12.0
25.0
1.1
41.0
0.26
4264
2.48
0.08
0.04
2.60
3697
43,5
046-
5/8
67.1
1,80
0.7
18.1
40.9
50.8
37.0
49.0
1.6
71.0
0.29
5685
3.23
0.1 1
0.08
3.41
1598
47,7
056-
5/8
39.7
1,24
8.2
16.7
49.8
49.1
12.0
23.0
1.3
41.0
0.22
4162
2.57
0.05
0.04
2.66
3899
50,3
915-
1/2
58.0
1,41
9.1
3.5
28.6
49.3
47.0
54.5
3.1
92.0
0.26
5279
4.49
0.12
0.09
4.70
2110
025
,687
6-5/
839
.71,
248.
215
.739
.648
.612
.024
.05.
079
.00.
3063
963.
200.
100.
063.
364
101
41,8
604-
1/2
73.2
1,46
0.9
2.2
22.2
52.7
49.0
71.0
5.0
135.
00.
9956
846.
190.
130.
126.
4316
Aver
age
47.0
1,37
7.9
12.6
47.0
50.0
26.8
34.4
1.6
56.0
80.
1949
732.
950.
070.
063.
0827
Stan
dard
err
or2.
542
.51.
11.
90.
52.
42.
70.
35.
00.
042.
02.
00.
190.
010.
000.
202
55
102
51,3
435-
1/2
54.9
1,45
5.8
8.9
28.9
60.1
32.0
46.0
5.2
105.
00.
4850
755.
410.
130.
095.
6325
103
51,3
445-
1/2
51.9
1,40
2.4
8.9
29.5
59.7
29.0
43.0
6.3
113.
00.
4755
835.
270.
120.
085.
4717
104
51,3
455-
1/2
61.0
1,56
2.5
9.0
30.0
58.1
37.5
52.0
4.4
104.
00.
4853
805.
050.
140.
095.
2720
105
51,3
515-
1/2
51.9
1,40
2.4
10.4
30.5
59.7
30.5
41.5
6.1
110.
00.
3655
835.
100.
110.
085.
2917
106
51,3
535-
1/2
48.8
1,34
9.0
9.8
24.6
57.1
24.5
39.0
6.9
114.
00.
5948
736.
050.
130.
106.
2827
107
43,0
126-
5/8
61.0
1,56
2.5
11.2
41.0
59.4
30.6
49.8
0.8
62.0
0.47
4264
3.77
0.10
0.07
3.94
3610
843
,011
6-5/
881
.01,
777.
912
.538
.957
.931
.548
.51.
183
.00.
4442
833.
870.
100.
084.
0517
109
46,9
006-
5/8
58.0
1,71
6.5
7.0
48.0
56.7
36.8
51.0
0.6
62.0
0.30
5178
3.08
0.08
0.06
3.22
2211
046
,591
6-5/
861
.01,
777.
913
.749
.058
.030
.647
.30.
861
.00.
2851
773.
080.
090.
063.
2423
Aver
age
56.6
1,55
6.3
10.1
35.6
58.5
31.8
46.5
3.6
88.2
0.43
5075
4.52
0.11
0.08
4.71
25St
anda
rd e
rror
1.6
55.8
0.7
3.0
0.4
1.3
1.5
0.9
8.4
0.03
2.0
2.0
0.36
0.01
0.00
0.37
2O
vera
ll av
erag
e47
.61,
283.
812
.141
.141
.125
.535
.41.
456
.10.
2852
782.
790.
090.
062.
9322
Ove
rall
stan
dard
err
or1.
427
.60.
61.
00.
91.
11.
20.
12.
10.
021.
01.
00.
100.
000.
000.
101
T ota
l5,
232
141,
219
1,33
44,
517
4,52
82,
803
3,89
915
66,
171
31-
-30
610
732
3-

AGRICULTURAL MECHANIZATION IN ASIA, AFRICA, AND LATIN AMERICA 2007 VOL.38 NO.114
energy was assumed. Therefore, if the provided irrigation water unit energy comsumption was low, plant production was high to the same degree. This has more importance for Turkey, which is an agriculture country in arid and semiarid re-gion. Total energy consumed for supplying water for the irrigation pumps consists of two components; direct and indirect energy (Eqn. 10) (Kaltschmit & Moersnhner, 1995). The specific direct energy compo-nent for supplying water was calcu-lated by dividing electrical power consumed from network to system f low rate (Eqn. 8). The indirect energy component was calculated by addition of the specific energy consumption of drilling a deep well and energy for manufacturing the pump-set. In this study, labour energy was negligible. Below equa-tions were used for determining the energy component.
DE=(NI/(3.6*Q))*E1 ..................(8)IE=(WD*E2)/n1+(M*E3)/n2 ......(9)TE=DE+IE ................................(10)In Turkey, the efficiency of pro-
duction and transportation of electri-cal energy is 38.4 % (WEC, 1990). Equivalent unit of electrical energy was taken as E1 9.375 MJ kW h-1. E2 is the specific energy consump-tion of well drilling and is assumed to be 1,764.7 MJ m-1 (Çalisir et al., 2001). E3 is the energy equivalent,
which is consumed to produce the machine and was used as 100.7 MJ kg-1 (Bridges & Smith, 1979), and n1 and n2 are average design life of the drilling well and pump-set. Both of them were assumed as 16,000 h life-1 (USDA, 1959 and Karassik et al., 1986).
The energy saving rat ing of pumping plants (SR) was deter-mined by Equation 11 below (Hay et al., 1984; New, 1986; USDA, 1997).
SR=100-PR ................................(11)
Results and DiscussionOne hundred submersible deep
well irrigation pumping plants were tested and the results of plant prop-erties, performance and energy us-age are given in Table 2.
Generally Properties of Pumping Plants
About 72.7 %, 19.1 %, 5.5 % and 2.7 % relative distribution was examined for column pipe with diameter 6-5/8" 5-1/2", 4-1/2" and 8-5/8", respectively. Total mass for pumping plants, column pipe length, static level, pumping div-ing depth and specific draw down ranged between 711.2-1,930.6 kg, 18.3-97.6 m, 8.0-59.0 m, 0.7-29.0 m and 0.03-1.02 m per L/s, respec-tively. Overall averages were de-
termined as 1,283.8 ± 27.6 kg, 47.6 ± 1.4 m, 25.5 ± 1.1 m, 12.1 ± 0.6 m and 0.28 ± 0.02, respectively. The total mass for per pumping plants increased when the pumping plant motor power increased. Specific drawdown and pump diving depth with respect to motor power groups distributions are given in Fig. 1 and Fig. 2. The specific draw down range was 0.21-0.40 m per L/s for well number 39. It is expressed that the feeding situation of the well for which specific draw down is small is good for agricultural irrigation.
In the region, 49 % were 11 to 20 m and 38 percent were 5 to 10 m of the total pumping plants that were set up. According to optimum diving depth of 5 m, pumps were placed at a greater depth at 89 % of the plants. This situation caused much more material to be used and more energy loss. As a result, an accurate determination of well characteristics could not be made and decreasing concern depending on the time the water level could be shown.
Performance Evaluation of Pump-ing Plants
The flow rate of pumping plants was varied from 20.4 to 60.5 L/s depending on discharge pipe diam-eter while the actual performance of plants varied from 30 to 65 %.
Number of pumping plants
0
5
10
15 55 kW
45 kW
37 kW
30 kW
22 kW
>1.000.81-1.00
0.61-0.800.41-0.60
0.21-0.400.11-0.20
<0.10
Specific drawdown, m per L/s
22 kW30 kW37 kW45 kW55 kW
Number of pumping plants
0
6
12
18 55 kW
45 kW
37 kW
30 kW
22 kW
>20 m10.1-20 m5.1-10.0 m<=5 m
Diving depth (DD), m
22 kW30 kW37 kW45 kW55 kW
Fig. 1 Distribution of specific drawdown in pumping plants Fig. 2 Distribution of driving depth in pumping plants

VOL.38 NO.1 2007 AGRICULTURAL MECHANIZATION IN ASIA, AFRICA, AND LATIN AMERICA 15
Actual performance at 46 plants ranged from 46 to 55 % (Fig. 3). Actual performance of all plants was about 50 ± 2. The number of plants with actual performances below 40 % and above 65 % were 6 and 2, respectively. Similar results were reported by Saqib &Khan, (1993); Conlon et al., (1999); Hla & Scherer, (2001) ve Loftis & Miles, (2001).
According to NPC, a histogram of performance rating is presented in Fig. 4. The performance ratings varied between 51 to 108 %. For these conditions, NPC criteria were obtained at two plants. The per-formance rating of all plants were found to be 78 ± 2 %. On the other hand, there was a saving potential of 22 % in research plants.
This result, if total motor power of the plants and an annual operating time of 1,278.5 ± 27 h are consid-ered, appears to be a problem that could be fixed immediately (Çalisir et al., 2002). For this, better system design, correct pump and motor selection, usage of current pumps more efficiently and a correct check-ing program should be made.
Evaluation of Energy Usage in Pumping Plants
At plants under the test, the en-ergy consumption varied between the values of 1.10 to 6.05 MJ m-3,
and overall average direct energy consumption was calculated as 2.79 ± 0.10 MJ m-3. Direct energy con-sumption increased as the motor power increased (Table 2). Direct energy is 95.22 % of total energy consumption. For the entire plant, the overall average indirect energy (consisting of installation of drilling well of 0.11 ± 0.01 MJ m-3 and pump-set set up energy of 0.08 ± 0.01 MJ m-3) was calculated as 0.19 ( 0.01 MJ m-3. Additionally, overall aver-age specific total energy consump-tion was found to be 2.93 ± 0.10 MJ m-3. Sloggett (1992); Hülsbergen et al. (2001); and ve Mrini et al. (2001), reported similar results for the plant that uses electrical energy for sprinkler irrigation. Distribution of specific total energy consumption over motor power is shown in Fig. 5. According to this, while specific energy consumption changed be-tween 2.1 and 3.0 MJ m-3 at 58 % of all the plants, specific total energy consumption increased with in-creasing motor power. The relation-ships between specific energy con-sumption to motor power, flow rate and total dynamic head were shown in Figs. 6, 7 and 8, respectively. The relationships between these factors were found statistical significantly (p < 0.05).
ConclusionsThe following conclusions can be
drawn with respect to tested sub-mersible deep well irrigation pump-ing plants.
a. The pump diving depth was the upper of optimum level at 89 % of the plants.
b. Specific draw down was less than 0.4 m per L/s at 79 % of all wells. Therefore, it is sufficient for agricultural irrigation.
c. Actual performance or system efficiency of plants was deter-mined as 50 % in all plants. Per-formance rating was 78 % when compared with NPC. In these conditions, there are improving possibilities for saving rating potential of 22 % at plants.
d. Energy equivalent of specific irrigation water of submersible deep well pumping plants were found to have an average 2.93 ± 0.10 MJ m-3. As motor power increased, specific total energy consumption increased. An important energy loss occurred when absolute values of power consumed and annual operation time of plants were considered.
NotationsΔ: Specific draw down of wells, m
Number of pumping plants
0
3
6
9
12 55 kW
45 kW
37 kW
30 kW
22 kW
>6560.1-65.0
55.1-60.050.1-55.0
45.1-50.040.1-45.0
<40.0
Actual performance (system efficiency), %
22 kW30 kW37 kW45 kW55 kW
Number of pumping plants
0
3
6
9
12 55 kW
45 kW
37 kW
30 kW
22 kW
>10091-10081-9071-8061-70<60
Performance rating, %
22 kW30 kW37 kW45 kW55 kW
Fig. 3 Distribution of system efficiency in pumping plants Fig. 4 Distribution of performance rating in pumping plants

AGRICULTURAL MECHANIZATION IN ASIA, AFRICA, AND LATIN AMERICA 2007 VOL.38 NO.116
per L s-1
γ: Water density, kg L-1
AP: Actual performance or sys-tem efficiency, %
D: Diameter of pump discharge pipe, "
DD: Diving (submersible) depth of pump, m
DE, Specific direct energy con-sumption, MJ m-3
E1: Electrical energy equivalent, MJ kWh-1
E2: Specific Deep well drilling energy, MJ m-1
E3: Machine manufactured energy equivalent, MJ kg-1
FL: Column pipe friction loss, mg: Gravity acceleration, m s-2
IE: Specific indirect energy con-sumption, MJ m-3
J: Pipe hydraulic gradient, m per m
L: Column line length, mM: Total mass of pump-set, kgn1: Design life of well, hn2: Design life of pump-set, hNI: Actual electrical power con-
sumed, kWNM: Submersible motor nominal
power, kWNPC: Nebraska Performance Cri-
teria, %P: Discharge pressure, barPR: Performance rating, %PWL: Pumping water level, mQ: Flow rate, L s-1
SL: Static level, mSR: Energy saving potential rat-
ing, %t: Water temperature, ºCTDH: Total dynamic head, mTE: Specific total energy con-
sumption, MJ m-3
v: Water velocity of pump dis-charge pipe, m s-1
VH: Velocity head, m WD: Well depth, m
REFERENCES
Anonymous 2002. Registered of Konya Regional Directorate of State Meteorology Works (SMW) Konya/Turkey.
Anonymous 2000. Registered of 4th Regional Directorate of State Hydraulic Works (SHW), Konya Turkey.
Bridges, T. C. and E. M. Smith 1979. A method for determining the total energy input for agricul-tural practices. Transaction of the ASAE. 0001-2351/79/2204. pp. 781-784.
Conlon, T., G. Weisbrod, and S. Samiullah. 1999. We’ve Been Testing Water Pumps For Years-Has their Efficiency Changed? Proceedings of the April ACEEE Summer Study of Energy Ef-ficiency in Industry, California.
Cooperative Extension Service - EC 84-725, USA.
Çalisir, S., T. Eryilmaz, and A. Erkol. 2001. Determination of specific energy consumption on drilling of water wells, Journal of Agricultural of Faculty Univer-sity of Selçuk, ISSN: 1300-5774, 15(27): 145-152.
Çalisir, S., T. Marakoglu, and M. U. Yildiz. 2002. Annual usage of deep well ir rigation pump-ing plants in Çumra / Konya , Journal of Agricultural of Fac-ulty, University of Selçuk, ISSN: 1300-5774, 16(30): 84-87.
Diepenbrock, W., B. Pelzer, and J. Radtke. 1995. Energieblanz im Ackerbaubetrieb, Kuratorium für Technik und Bauwesen in der Landwir tschaf t (KTLB). Darmstadt, Arbeitspaper 211, Landwirtschaftsverlag Münster-Hiltrup, 1995.
Hansen, D. J. 1974. Laboratory test-ing of centrifugal and vertical turbine pumps, ASHRAE Trans-actions, (80)2: 448-455.
Hanson, B. 1994. Irrigation pump-ing plants. On-Farm Irrigation, Water Management Handbook Series. Publication number 93-94, University of California. Davis.
Hay, D., R. M. Schroeder, and T. Dorn. 1984. Pumping Plant Re-pair Feasibility. Nebraska
Number of pumping plants
0
5
10
15 55 kW
45 kW
37 kW
30 kW
22 kW
>4.003.51-4.00
3.01-3.502.51-3.00
2.01-2.501.51-2.00
<1.5
Total specific energy consumption MJ/m3
22 kW30 kW37 kW45 kW55 kW
Total specific energy consumption, MJ m-3
20 30 40 50 600
1
2
3
4
5
Motor power (NM), kW
TE=0.0013*NM2-0.0271*NM+1.9904R2=0.928
Fig. 5 Distribution of specific total energyconsumption in pumping plants
Fig. 6 Effect on specific total energyconsumption of motor power

VOL.38 NO.1 2007 AGRICULTURAL MECHANIZATION IN ASIA, AFRICA, AND LATIN AMERICA 17
Total specific energy consumption, MJ m-3
30 35 40 45 500
1
2
3
4
5
Flow rate (Q), L/s
TE=0.0519*Q2-4.425*Q+96.405R2=0.8558
Total specific energy consumption, MJ m-3
30 40 50 60 70 80 90 1000
1
2
3
4
5
Flow rate (Q), L/s
TE=0.0555*TDH-0.1871R2=0.9867
Fig. 7 Effect on specific total energy sonsumption of flow late Fig. 8 Effect on specific total energyconsumption of total dynamic head
Heyland, K. U. and S. Solansky. 1979. Energieeinsatz und Ener-gieumsetzung im Bereich der Pflanzenproduktion, Ber. Landw., (195): 15-30.
Hla, A. K. and T. F. Scherer. 2001. Operating efficiencies of irriga-tion pumping plants, paper num-ber 01-2090, Extension Service North Dakota State University USA.
Hülsbergen, K., J. B. Feil, S. Bier-mann, G. W. Rathke, W. D. Kalk, and W. Diepenbrock. 2001. A method of energy balancing in crop production and its applica-tion in a long-term fertilizer trial, Agriculture, Ecosystems and En-vironment, (86): 303-321.
Kaltschmitt, M. and A. Reinhardt. 1995. Nachwachsende Energieträger. Grundlagen, Verfahren,
Karassik, I. J., W. C. Krutzsch, W. H. Fraser, and J. P. Messina. 1986. Pump Handbook, Second edition, New York.
Kosyna, G. 1984. Taucmotoren und moderne Pumpentechnik. World Pumps, p. 153-157.
Loftis, J. C. and D. L. Miles. 2001. Irrigation Pumping Plant Effi-ciency, Colorado State University Crop Series, No: 4.712.
McClave, J. T. and P. G. Benson. 1988. Statistics for business and economics (4th Edn.). Dellon Pub.
Co., San Francisco. CA.Moerschner, J., B. Gerowitt, and
W. Lücke. 1997. Abbildung ener-getischer Effekte beim Vergleich von Ackerbausystemen mit ger-ingen Intensitaetsunterschieden, VDLUFA-Schrief tenreihe 46, VDLUFA-Verlag, Darmstdt, p. 471-474.
Mrini, M., F. Senhaji, and D. Pi-mentel. 2001. Energy Analysis of Sugarcane Production in Mo-rocco. Environment, Development and Sustainability, (3): 109-126.
New, L. 1986. Pumping plant Energy use and potential savings, Water Resources Engineering (2).
Ökologische Bilanzierung. Vieweg Verlag, Braunschweig/Wiesbaden.
Saqib, G. S. and S. Khan. 1993. Performance evaluation of deep well turbine pumps, Journal Ag-riculture Engineering Research (JAER), p.165-175.
Schulz, H. 1977. Die Pumpen (Ar-beitweise, Berechnung, Konstruc-tion). Springer Verlag. Berlin.
Sloggett, G. 1992. Estimating energy use in world irrigation. (Edited by RC Fluck, Energy in Farm Pro-duction), Chapter 14, pp. 203-218. New York.
Smil, V. 1983. Energy analysis and agriculture, An Application to US, Corn Production, Westview Press Boulder, Colorado.
State Hydraulic Works (SHW). 1997. Statistics Publication, Gen-eral Directorate of State Hydrau-lic Works, Ankara, Turkey.
State Institute of Statistics (SIS). 2001. For 1999 year Agricultural structure (production, price, val-ue), Prime Ministry Republic of Turkey, Ankara, Turkey.
USDA (United States Department of Agriculture), Natural Resourc-es Conservation Service (NRCS). 1959. Irrigation pumping plants. National Engineering Handbook. 210 -v i-N EH-15, Sec t ion 15, Chapter 8.
USDA (United States Department of Agriculture), Natural Resourc-es Conservation Service (NRCS). 1997. Energy use and conserva-tion. National Engineering Hand-book. 210-vi-NEH, Par t. 652. Irrigation Guide, Chapter 12.
World Energy Council (WEC), Turk ish Nat ional Commit tee (TNC). 1990. Energy statistics. Turkey 5. Energy Congress. s. 219. Ankara, Turkey.
Yaldiz, O., H. H. Öztürk, Y. Zeren, and A. Basçetinçelik. 1990. Usage energy in crop production of Tur-key, Akdeniz University, Journal of Agricultural Faculty, 3(1-2): 51-62, Antalya, Turkey.
■■

AGRICULTURAL MECHANIZATION IN ASIA, AFRICA, AND LATIN AMERICA 2007 VOL.38 NO.118
Status of Farm Mechanization in Nalanda Districtof Bihar
byV. B. ShambhuScientistCentral Research Institute for Juteand Allied Fibres,Barrackpore - 700 120, West [email protected]
R. B. RamProfessor and Dean (P. G.)Rajendra Agricultural University,Pusa - 848 125, BiharINDIA
AbstractThe pace of farm mechaniza-
tion is very slow in Bihar state as compared to many advanced states of the country. A study was under-taken to identify the status of farm mechanization in Nalanda District of Bihar. A survey was conducted in three blocks of the district having different geographical areas. The only manually operated improved equipment were sprayers, dusters and chaff cutters numbering 27, 9 and 470 per thousand hectare, re-spectively. In the case of bullock drawn equipment, cultivator, bull-ock carts and cane crushers were 103, 22 and 9 units per thousand hectare, respectively. The average number of tractors per thousand hectare area was 17 which was high-er than other districts of the state. Only cultivators and trailers were used with the tractor. The number of tractor operated threshers were eight whereas other power operated threshers were 203 per thousand hectare area. The bottleneck in mechanization was due to lack of extension programmes, availability of equipment, farm roads and con-solidation of land holdings.
Introduction It has been well realized all over
the world that in order to meet the food requirements of the rapid growing population and rapid in-dustrialization, the mechanization of agriculture is inescapable. The package of modern technology in-cludes the use of more efficient and economical farm implements and machineries and suitable forms of farm power. Modernization requires appropriate machinery for ensuring timely field operations and effective application of various crop produc-tion inputs utilizing human, animal and mechanical power sources. Equipment for tillage sowing, irri-gation, plant protection, harvesting and post harvest operations have widely been accepted by farmers. This study was conducted to assess farm mechanization in Nalanda dis-trict of Bihar.
Ray (1993) studied the status of farm mechanization and constraints in 1987. He reported that the use of traditional implements were more popular than the improved imple-ment and machinery. He also report-ed that the majority of farmers were small and could rarely afford to pur-
chase huge and costly agricultural implements and machinery. Patel (1981) studied farm mechanization in India. He observed that per unit cost of operation declined sharply under mechanization and there was time saving in tillage operation. He also reported that mechanized farms had more labour hour use than the non-mechanized farms. Dash et al. (1988) studied constraints in the use of agricultural implements and machinery in the state of Orissa. They observed that mechanization in agriculture was not up to mark because of problems which were mostly social, economical and tech-nical in nature. Kumar et al. (1991) investigated constraints on the use of agricultural implements and machinery in the state of Rajathan, India. They reported that problems were mainly social, economical, and technical. They also recommend how these problems might be over-come. Mittal et al. (1989) reported that the production and availability of food crops can be increased by about 40 per cent in the Punjab state through the farm mechanization of sowing, intensive cropping, plant protection, post harvest practices and reclamation of cultural wastes.

VOL.38 NO.1 2007 AGRICULTURAL MECHANIZATION IN ASIA, AFRICA, AND LATIN AMERICA 19
Materials and MethodsStratified multi-stage random sam-
pling design was adopted for collec-tion of data with regard to known status of farm implements and ma-chinery use in Nalanda district of Bihar. Three blocks from the district were selected randomly for this sur-vey. Selection of blocks was done by an implement and machinery index, which was prepared by giving speci-fied priority values to different farm implement and machinery.
On the basis of the implement and machinery index the blocks of the district were enlisted in ascending order. One block was selected ran-domly from above the average index value, one from below the average index value and one from aver-age value. Thus, the three blocks selected were Sarmera, Rajgir and Ekangar Sarai. Three villages were taken from each block.
Thirty six farm families from dif-ferent farm categories (marginal, small, medium size and large farm-ers) owning improved implements and machinery of nine selected vil-lages were contacted for collecting data (through comprehensive profor-ma). The proforma was developed
to provide necessary information regarding village and cultivators. Information about a village included demographic details of house hold, inventory of implement and machin-ery, distribution and availability of power source, land utilization pat-tern, irrigation structure and crop-ping pattern (rotation). Information regarding cultivator included family description, land utilization pattern, mode of irrigation, farm machinery and implement owned, cropping pattern, and operation wise power utilization. This included availabil-ity, demand and deficit of various power sources for crop production for different farm categories in the study area. The important crop rota-tions were Paddy-Wheat or Paddy-Onion and Moong.
Results and DiscussionStatus of Improved Implements and Machinery in Use
For the purpose of this study, in-formation regarding availability of improved implements and machin-eries operated by various power sources in the selected villages were collected and presented below:
Status of Manually Operated Implement and Machinery in Use
Table 1 indicates that the use of plant protection equipment was very low, i.e. less than 60 per thousand hectare including sprayers (manually and power operated) and dusters as compared to the national standard of 200 units per 1000 hectares. It was observed that Ekanagar Sarai block had 42 sprayers per 1000 ha whereas Sarmera and Rajgir blocks had only 22 and 17 sprayers, respec-tively. This difference was due to the fact that the area of serial crops in Ekangar Sarai block was more as compared to other blocks. On the contrary, Ekanagar Sarai block had only 5 dusters per 1000 ha as compared to Sarmera, Rajgir blocks. This was because the onion growing area was observed to be greater with respect to Ekangar Sarai block. The average number of chaff cutters in use in the district was 470 and in dif-ferent blocks varied from 296 to 593 per 1000 ha cultivated area. It was observed that the blocks with a lower number of chaff cutters had low cat-tle population on one hand and had high grazing area on the other hand due to the presence of hillocks in the block. Surprisingly, no pedal paddy threshers and hand maize shellers were observed in all three blocks. Paddy threshing was observed to be still in the primitive stage.
Status of Animal Operated Imple-ments and Machinery in Use
It is clear from Table 2 that the position of implement and machin-ery use was very poor except in case of the desi plough. The availabil-ity of M.B. plough, disc plough, disc harrow, olpad thresher, seed-drill, ridger and puddler was almost nil in the entire district. It was observed that the cultivator in all three blocks were being used as the primary till-age implement instead of secondary tillage. It was observed that Ekangar Sarai block had 454 desi ploughs and 319 plan kers per 1000 ha whereas Sarmera and Rajgir blocks
No. of farm implements and machineries per 1000 ha cultivated areaSl.No.
Name of farm implement/machinery
Ekangar Sarai block
Sarmera block Rajgir block District
average1 Sprayer 41.72 22.07 17.39 27.062 Duster 4.91 11.03 10.43 8.793 Chaff cutter 520.25 593.10 295.65 469.674 Pedal paddy thresher Nil Nil Nil Nil5 Hand maize sheller Nil Nil Nil Nil
Table 1 Status of manually operated implements and machineries used inselected blocks of Nalanda district (based on sample survey)
No. of farm implements and machineries per 1000 ha cultivated areaSl.No.
Name of farm implement/machinery
Ekangar Sarai block
Sarmera block Rajgir block District
average1 Desi plough 453.90 310.34 321.74 361.992 Cultivator 73.62 131.03 104.35 103.003 Planker 319.02 208.69 263.10 263.64 Bullock cart 39.26 13.79 17.39 22.155 Cane crusher 12.27 8.28 5.22 8.59
Table 2 Status of bullock drawn implements and machineries uses inselected blocks of Nalanda district (based on sample survey)
AGRICULTURAL MECHANIZATION IN ASIA, AFRICA, AND LATIN AMERICA 2007 VOL.38 NO.120
had 310 desi ploughs, 209 plankers and 322 desi ploughs and 263 plank-ers, respectively. This variation was due to the fact that the paddy grow-ing area in Ekangar Sarai block was highest among the three. Then comes Rajgir block followed by Sarmera block. The number of cul-tivators in Ekangar Sarai block was 74 per 1000 ha where, as in Sarmera and Rajgir blocks, there were 131 and 104 per 1000 ha, respectively due to higher pulse growing area.
The number of bullock carts in Ekangar Sarai, Sarmera and Raj-gir blocks were found to be 39, 14 and 17 per 1000 ha, respectively. Ekangar Sarai block had more carts because it had more roads as com-pared to Sarmera and Rajgir blocks. The number of cane crushers was more in Ekangar Sarai block with respect to Sarmera and Rajgir due to higher sugarcane area in Ekangar Sarai block.
Status of Tractor and Tractor Drawn Implement in Use
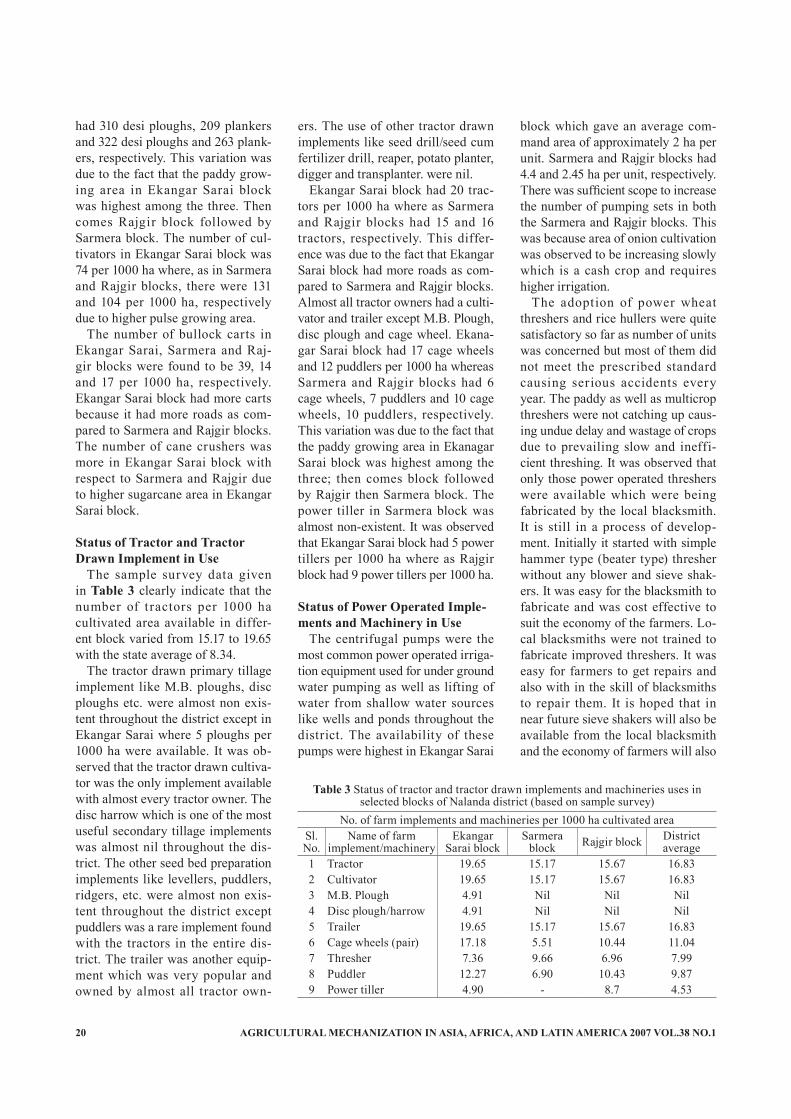
The sample survey data given in Table 3 clearly indicate that the number of t ractors per 1000 ha cultivated area available in differ-ent block varied from 15.17 to 19.65 with the state average of 8.34.
The tractor drawn primary tillage implement like M.B. ploughs, disc ploughs etc. were almost non exis-tent throughout the district except in Ekangar Sarai where 5 ploughs per 1000 ha were available. It was ob-served that the tractor drawn cultiva-tor was the only implement available with almost every tractor owner. The disc harrow which is one of the most useful secondary tillage implements was almost nil throughout the dis-trict. The other seed bed preparation implements like levellers, puddlers, ridgers, etc. were almost non exis-tent throughout the district except puddlers was a rare implement found with the tractors in the entire dis-trict. The trailer was another equip-ment which was very popular and owned by almost all tractor own-
ers. The use of other tractor drawn implements like seed drill/seed cum fertilizer drill, reaper, potato planter, digger and transplanter. were nil.
Ekangar Sarai block had 20 trac-tors per 1000 ha where as Sarmera and Rajgir blocks had 15 and 16 tractors, respectively. This differ-ence was due to the fact that Ekangar Sarai block had more roads as com-pared to Sarmera and Rajgir blocks. Almost all tractor owners had a culti-vator and trailer except M.B. Plough, disc plough and cage wheel. Ekana-gar Sarai block had 17 cage wheels and 12 puddlers per 1000 ha whereas Sarmera and Rajgir blocks had 6 cage wheels, 7 puddlers and 10 cage wheels, 10 puddlers, respectively. This variation was due to the fact that the paddy growing area in Ekanagar Sarai block was highest among the three; then comes block followed by Rajgir then Sarmera block. The power tiller in Sarmera block was almost non-existent. It was observed that Ekangar Sarai block had 5 power tillers per 1000 ha where as Rajgir block had 9 power tillers per 1000 ha.
Status of Power Operated Imple-ments and Machinery in Use
The centrifugal pumps were the most common power operated irriga-tion equipment used for under ground water pumping as well as lifting of water from shallow water sources like wells and ponds throughout the district. The availability of these pumps were highest in Ekangar Sarai
block which gave an average com-mand area of approximately 2 ha per unit. Sarmera and Rajgir blocks had 4.4 and 2.45 ha per unit, respectively. There was sufficient scope to increase the number of pumping sets in both the Sarmera and Rajgir blocks. This was because area of onion cultivation was observed to be increasing slowly which is a cash crop and requires higher irrigation.
The adoption of power wheat threshers and rice hullers were quite satisfactory so far as number of units was concerned but most of them did not meet the prescribed standard causing serious accidents every year. The paddy as well as multicrop threshers were not catching up caus-ing undue delay and wastage of crops due to prevailing slow and ineffi-cient threshing. It was observed that only those power operated threshers were available which were being fabricated by the local blacksmith. It is still in a process of develop-ment. Initially it started with simple hammer type (beater type) thresher without any blower and sieve shak-ers. It was easy for the blacksmith to fabricate and was cost effective to suit the economy of the farmers. Lo-cal blacksmiths were not trained to fabricate improved threshers. It was easy for farmers to get repairs and also with in the skill of blacksmiths to repair them. It is hoped that in near future sieve shakers will also be available from the local blacksmith and the economy of farmers will also
No. of farm implements and machineries per 1000 ha cultivated areaSl.No.
Name of farm implement/machinery
Ekangar Sarai block
Sarmera block Rajgir block District
average1 Tractor 19.65 15.17 15.67 16.832 Cultivator 19.65 15.17 15.67 16.833 M.B. Plough 4.91 Nil Nil Nil4 Disc plough/harrow 4.91 Nil Nil Nil5 Trailer 19.65 15.17 15.67 16.836 Cage wheels (pair) 17.18 5.51 10.44 11.047 Thresher 7.36 9.66 6.96 7.998 Puddler 12.27 6.90 10.43 9.879 Power tiller 4.90 - 8.7 4.53
Table 3 Status of tractor and tractor drawn implements and machineries uses inselected blocks of Nalanda district (based on sample survey)
VOL.38 NO.1 2007 AGRICULTURAL MECHANIZATION IN ASIA, AFRICA, AND LATIN AMERICA 21
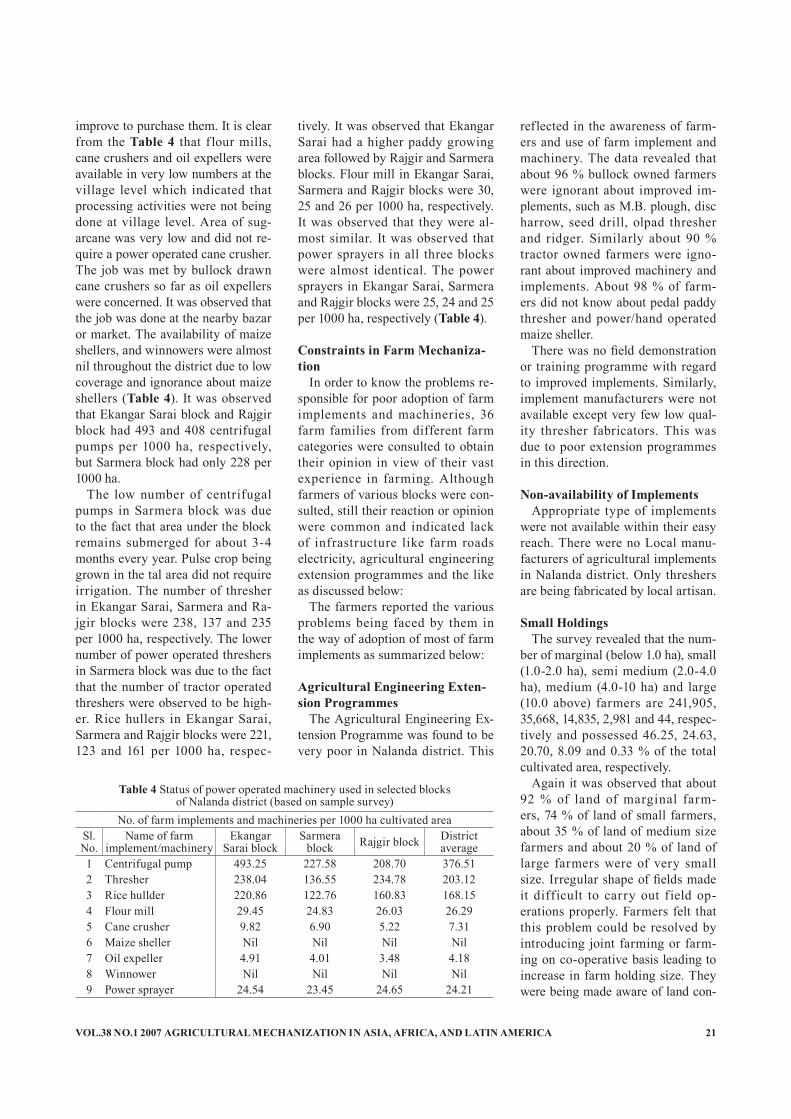
improve to purchase them. It is clear from the Table 4 that f lour mills, cane crushers and oil expellers were available in very low numbers at the village level which indicated that processing activities were not being done at village level. Area of sug-arcane was very low and did not re-quire a power operated cane crusher. The job was met by bullock drawn cane crushers so far as oil expellers were concerned. It was observed that the job was done at the nearby bazar or market. The availability of maize shellers, and winnowers were almost nil throughout the district due to low coverage and ignorance about maize shellers (Table 4). It was observed that Ekangar Sarai block and Rajgir block had 493 and 408 centrifugal pumps per 1000 ha, respectively, but Sarmera block had only 228 per 1000 ha.
The low number of centrifugal pumps in Sarmera block was due to the fact that area under the block remains submerged for about 3-4 months every year. Pulse crop being grown in the tal area did not require irrigation. The number of thresher in Ekangar Sarai, Sarmera and Ra-jgir blocks were 238, 137 and 235 per 1000 ha, respectively. The lower number of power operated threshers in Sarmera block was due to the fact that the number of tractor operated threshers were observed to be high-er. Rice hullers in Ekangar Sarai, Sarmera and Rajgir blocks were 221, 123 and 161 per 1000 ha, respec-
tively. It was observed that Ekangar Sarai had a higher paddy growing area followed by Rajgir and Sarmera blocks. Flour mill in Ekangar Sarai, Sarmera and Rajgir blocks were 30, 25 and 26 per 1000 ha, respectively. It was observed that they were al-most similar. It was observed that power sprayers in all three blocks were almost identical. The power sprayers in Ekangar Sarai, Sarmera and Rajgir blocks were 25, 24 and 25 per 1000 ha, respectively (Table 4).
Constraints in Farm Mechaniza-tion
In order to know the problems re-sponsible for poor adoption of farm implements and machineries, 36 farm families from different farm categories were consulted to obtain their opinion in view of their vast experience in farming. Although farmers of various blocks were con-sulted, still their reaction or opinion were common and indicated lack of infrastructure like farm roads electricity, agricultural engineering extension programmes and the like as discussed below:
The farmers reported the various problems being faced by them in the way of adoption of most of farm implements as summarized below:
Agricultural Engineering Exten-sion Programmes
The Agricultural Engineering Ex-tension Programme was found to be very poor in Nalanda district. This
reflected in the awareness of farm-ers and use of farm implement and machinery. The data revealed that about 96 % bullock owned farmers were ignorant about improved im-plements, such as M.B. plough, disc harrow, seed drill, olpad thresher and ridger. Similarly about 90 % tractor owned farmers were igno-rant about improved machinery and implements. About 98 % of farm-ers did not know about pedal paddy thresher and power/hand operated maize sheller.
There was no field demonstration or training programme with regard to improved implements. Similarly, implement manufacturers were not available except very few low qual-ity thresher fabricators. This was due to poor extension programmes in this direction.
Non-availability of ImplementsAppropriate type of implements
were not available within their easy reach. There were no Local manu-facturers of agricultural implements in Nalanda district. Only threshers are being fabricated by local artisan.
Small HoldingsThe survey revealed that the num-
ber of marginal (below 1.0 ha), small (1.0-2.0 ha), semi medium (2.0-4.0 ha), medium (4.0-10 ha) and large (10.0 above) farmers are 241,905, 35,668, 14,835, 2,981 and 44, respec-tively and possessed 46.25, 24.63, 20.70, 8.09 and 0.33 % of the total cultivated area, respectively.
Again it was observed that about 92 % of land of marginal farm-ers, 74 % of land of small farmers, about 35 % of land of medium size farmers and about 20 % of land of large farmers were of very small size. Irregular shape of fields made it difficult to carry out field op-erations properly. Farmers felt that this problem could be resolved by introducing joint farming or farm-ing on co-operative basis leading to increase in farm holding size. They were being made aware of land con-
No. of farm implements and machineries per 1000 ha cultivated areaSl.No.
Name of farm implement/machinery
Ekangar Sarai block
Sarmera block Rajgir block District
average1 Centrifugal pump 493.25 227.58 208.70 376.512 Thresher 238.04 136.55 234.78 203.123 Rice hullder 220.86 122.76 160.83 168.154 Flour mill 29.45 24.83 26.03 26.295 Cane crusher 9.82 6.90 5.22 7.316 Maize sheller Nil Nil Nil Nil7 Oil expeller 4.91 4.01 3.48 4.188 Winnower Nil Nil Nil Nil9 Power sprayer 24.54 23.45 24.65 24.21
Table 4 Status of power operated machinery used in selected blocksof Nalanda district (based on sample survey)

AGRICULTURAL MECHANIZATION IN ASIA, AFRICA, AND LATIN AMERICA 2007 VOL.38 NO.122
solidation by government agencies. Such consolidation could attract co-operative farming or mechanized farming. Land consolidation be done by Revenue Department in collabora-tion with Department of Agricultural Engineers with latest knowledge of farm roads, irrigation systems, ir-rigation channel, drainage channels and the like.
Scattered FieldIn Nalanda district, generally, fields
were small and scattered. About 88 % of farms of marginal farmers, 75 % of farms of small farmers, 49 % of farms of medium size farmers and 37 % of farms of large farmers were observed to be scattered over the entire area of village. In some cases, it was beyond the area of the village. Therefore, farmers were unable to use the machinery gainfully. It took much time and labour to transport them from one f ield to another. Hence, farmers were unable to adopt intensive cultivation.
Lack of Farm RoadFarm roads are the backbone of
farm mechanization. It may be ap-propriate to discuss transportability of other parameters of farming like high yielding seeds, fertilizer, insec-ticides, pesticides, micronutrients and even farming practices. It may be observed that these parameters can travel to the farm on shoulders of farmers or labourers. All these reached Nalanda district and con-tributed to increase production. But the major parameter called energy input to farm was found to be still missing. The basic source of energy input to the farm is still a tractor which moves on roads and all of it attachments need farm roads to go to the field. This was one of the most important parameter, which prohib-ited farm mechanization in Nalanda district. Farmers reported 100 % absence of farm roads. There existed no farm road, no approach road to village. Even a cyclist could not go to his village on a cycle. Some farm-
ers had not heard of farm roads or had no concept of farm roads.
Non-availability of ElectricityElectricity, being a cheaper source
of power, is capable of reducing unit cost of operation, which in turn intensifies mechanization. But, due to non-availability of electric-ity, mechanization was adversely affected. Several farm operations like irrigation, threshing and post production processes could be done at lower cost as compared to diesel power. For intensive cropping pat-terns, timely irrigation and quick threshing becomes important. It was observed in Nalanda district that the water table was low enough to lower the pumping sets to a depth of 4 to 7 m. Under the circumstances, pumping irrigation water by die-sel was uneconomical. This was a bottleneck to farm mechanization.
Poor Economic ConditionAbout 90 % of marginal farm-
ers, 75 % of small farmers and 20 % of medium size farmers were economically poor. Due to this poor economic condition, in spite of their willingness to own farm imple-ments, they were unable to purchase as these did not come in their order of priority of day to day require-ments.
Lack of Genuine Spare Parts and After Sales Service
Farmers faced difficulty in getting genuine spare parts on reasonable price at convenient distance. It badly affected the working of machines. Thus, lack of spare parts for agri-cultural machinery and equipment was a major problem which greatly affected all mechanization schemes in the district. There was no local service facility.
Credit AvailabilityThe farmers of the district ex-
pressed great difficulty in availing credit facilities for the purchase of implements. They reported that
formalities and number of visits required for availing credit were too many. They were also concerned as to how many times they would be required to repay the credit obtained. This was because of sus-pected foul play in societies. They wanted interest free credit for pur-chase of implements and machinery.
ConclusionsOn the basis of this survey it was
found that the number of tractors were about 17 per thousand hectare of cultivated land which was more than double the state average. But use of implements was limited to cultivators and trailers. Similarly, the use of animal drawn and manu-ally operated tools were very few. However, threshers and water lift-ing pumps were found to be 203 and 376 per thousand hectare area basis.
The main const raint in farm mechanization was lack of extension programmes, farm roads, availabil-ity of implements and consolidation of land holdings.
REFERENCES
Das, S. K. and S. C. Pradhan. 1988. Agricultural mechanization in orissa, India. AMA 19(1): 69-72.
Kumar, A. and A. Sharma. 1991. Agricultural mechanization in Rajasthan. AMA 22(1): 69-72.
Mittal, V. K., B. S. Bhatia, and A. M. Chauhan. 1989. Food security through farm mechanization. The Punjab science. Farm Power and Machinery, ASAE, Jan. 5-7: 88- 95.
Patel, A. R. 1981. Farm mechaniza-tion in India. Agricultural Engi-neering Today. December, 12.
Ray, A. K. 1993. The present status of Agricultural mechinization and its constrints. Agricultural situa-tion in India. 148(4): 245-250.
■■

VOL.38 NO.1 2007 AGRICULTURAL MECHANIZATION IN ASIA, AFRICA, AND LATIN AMERICA 23
Effect of Puddling on Physical Prosperities of Soiland Rice Yield
byB. K. BeheraAssistant Agricultural EngineerCollege of Agricultural Engineeringand Technology, OUATBhubaneswar - 751 003, [email protected]
S. SwainDeanCollege of Agricultural Engineeringand Technology, OUATBhubaneswar - 751 003, OrissaINDIA
B. P. VarshneyProfessorG. B. Pant University of Agriculturaland Technology,Pantnagar - 263 145, UttaranchalINDIA
AbstractRice crop requires a good puddled
soil condition to create a favour-able physico-chemical and micro-biological environment for normal growth. The effect of puddling by three puddlers with varying levels of puddling on soil physical proper-ties and yield was studied in a silty clay loam soil of Tarai region. The puddling treatments in the first year of the experiment were rotary pud-dler with two passes (R2) and with three passes (R3), peg type puddler with two passes (P2) and with three passes (P3) and cultivator with two passes (C2) and with three passes (C3). In the second year experiment, the treatments were peg type pud-dler with two passes (P2), peg type puddler with one pass (P1) and ro-tary puddler with one pass (R1). The study revealed that the rotary pud-
dler gave a better puddling index over other treatments at a particular level of puddling. Increased level of puddling reduced the hydraulic conductivity and increased the bulk density (d. b) of soil. Higher bulk density probably reduced the root growth and yield. Highest yield of 3.63 t/ha was observed in case of P3 in the first experiment. The yield in case of P2, R2 and C3 are statistically at par. During the second experi-ment, there was much higher yield (4.82 to 4.99 t/ha) in all the treat-ments. There was no significant dif-ference in the yield among the treat-ments. The study revealed that for silty clay loam soil, reduced level of puddling (one pass) by either rotary puddler or peg type puddler is good enough to get a better yield than higher levels of puddling by either of the above equipments.
IntroductionRice is a major crop grown in
more than 110 countr ies in the world with a total production of 527 million tonnes, out of which 78 percent is contributed by major rice growing countries of Asia. India is the largest grower of rice in terms of area (42 million ha) in the world with an annual production of 82 million tonnes. However, it ranks second to China in terms of produc-tion (187 million tonnes) with an area of 31 million ha (World Rice Statistics, 1994 and Survey of In-dian Agriculture, 1999). About 50 percent of the total irrigated area is under rice cultivation in India and hence, 50 percent of irrigation water is used for rice crop whose water requirement is 107 L/ha (Manian and Jivaraj, 1989). Since, rice is the lowest productive crop per unit of

AGRICULTURAL MECHANIZATION IN ASIA, AFRICA, AND LATIN AMERICA 2007 VOL.38 NO.124
water consumption amongst cere-als, optimum water management and cultural practices need to be followed to ensure minimum losses of water. Approximately 75 percent of water applied to rice crop is lost through deep percolation during submergence of field (Swaminathan, 1972). Hence, it is cultivated under puddled condition so as to minimize the percolation losses and to enhance the water and nutrient use efficiency of plant. Rice is also grown through direct seeding which is less costly in comparison to transplanting but weed infestation is a severe problem associated with this method. In con-trast transplanting using healthy and vigorous seedling gives a more uni-form crop stand with higher yield (Khan and Gunkel, 1989). Rice crop requires a good puddled field condi-tion to create favourable physico-chemical and microbiolog ical environment for normal growth of rice plant (Gupta and Jaggi, 1980). However, it has also been reported that excessive puddling is detrimen-tal to subsequent crop in a wetland and dryland crop rotation (Bajpai, 1994). Keeping this in mind, the present study was undertaken in a silty clay loam soil of Tarai region to study the physical properties of soil after puddling by different pud-dling equipment and their effect on rice yield.
Review of Literature Puddling and subsequent f lood-
ing of rice field increase the growth and productivity of rice (Bhan and Padwal, 1976). Transplanted rice on puddled soil produced more yield than direct seeding rice because of reduction in leaching losses of nitrogen and efficient use of water (Sharma and De Datta, 1985). Lal (1985) reported that for soils with relatively high clay content, there is no obvious advantage in rice yield by puddling over no till method of seed bed preparation. But in medi-
um textured soil, puddling increases grain yield over no till method. (Mambani et al., 1990). Varade and Ghildyal (1967) found that dry matter and grain yield of rice were greater under moderate compac-tion (1.5 to 1.6 Mg m-3) in lateritic sandy clay loam soil, but subsequent increase in bulk density decreased yield. Ghidyal and Satyanarayan (1969) showed that higher bulk den-sity beyond 1.63 Mg m-3 not only affected yield adversely but also delayed the plant growth. Sharma and De Datta (1985) observed that puddling significantly increased grains per panicle and plant height and subsequently yield for both clay and clay loam soil by lowering the soil strength at root zone. Sharma et al. (1988), in an experiment of dif-ferent tillage methods (no tillage, minimum tillage, shallow puddling and deep puddling) on clay and clay loam soil, reported that minimum tillage produced about 26 and 36 percent higher grain yield than that with zero tillage in clay and clay loam soils respectively. The in-crease of yield in shallow and deep puddling over zero tillage was 33 and 28 percent and 66 and 56 per-cent for the above soils respectively. They attributed the increase in grain yield due to increase in plant height, panicle length and root length den-sity and decrease in soil penetration resistance.
Sood and Acharya (1991) conduct-ed an experiment on silty clay loam soil with deep ploughing and deep puddling (DP), shallow conven-tional cultivation and puddling (CP), conventional cultivation and non puddling (CN), compaction after conventional cultivation (CC) and zero tillage without any prepara-tory tillage (ZT) as the tillage treat-ments and observed that CC showed significantly higher plant height and number of tillers per hill at all growth stages and higher dry matter accumulation at 30 DAT whereas DP produced higher panicle length and dry matter accumulation at
panicles initiation stage. Treatments CN and ZT were at par but signifi-cantly lower than the treatment CP. There was no significant difference of yield between treatment CC and DP. However, yield in case of CP was significantly lower than that of CC and DP and higher than that of CN and ZT.
Sharma et al. (1991) evaluated four bullock drawn puddling equip-ment (rotary puddler, disc harrow, ha r row-cum-puddler and desi plough) with a varying number of passes and reported that rotary blade puddler with two puddlings produced highest yield followed by disc harrow with three puddlings, disc harrow with two puddling and rotary blade puddler with one pud-dling. Higher yield was attributed to lower percolation losses.
Rath (1999) observed that yield at t r ibuting characters and sub-sequently yield was significantly higher in case of the peg type pud-dler and compaction after flooding compared to rotary puddler, spade puddling and no tillage in a silty-clay loam soil in the year 1997. But there was no significant difference of yield between peg type and ro-tary puddler in the year 1998. Low yield in case of rotary blade puddler was attributed to higher hill mortal-ity and greater bulk density of soil leading to lesser root growth. From the above review of literature, it is observed that in a silty clay loam soil, the effect of puddling by dif-ferent equipment on soil physical properties and rice yield needs to be studied.
Materials and MethodsThe study was conducted in Uni-
versity farm of G. B. Pant Univer-sity of Agriculture and Technology in a silty clay loam soil (Sand: 32.82 %, Silt: 42.00 % and Clay: 25.18 %). After harvest of wheat, one summer ploughing was done by a vertical disc plough and subsequently the

VOL.38 NO.1 2007 AGRICULTURAL MECHANIZATION IN ASIA, AFRICA, AND LATIN AMERICA 25
experimental plots were harrowed twice and were leveled by a scraper. In the first year experiment, three puddling equipment, namely, rotary puddler, peg type puddler and culti-vator were used with two and three passes. Based upon the results of the first year's experiment, cultivator was dropped as a treatment and puddling was done by rotary puddler and peg type puddler. The details of the pud-dling treatments are given below:First year experiment
(Puddling equipment): (Treatment) Rotary puddler two passes: R2
Rotary puddler three passes: R3
Peg type puddler two passes: P2
Peg type puddler three passes: P3
Cultivator two passes: C2
Cultivator three passes: C3
Second year experimentPeg type puddler two passes: P2
Peg type puddler one pass: P1
Rotary puddler one pass: R1
The puddling index was measured by standard technique of collecting the puddled soil samples at different places in the experimental plot just after puddling. The bulk density (d.
b) was measured by core sampler method before tillage and 30 and 60 days after puddling (DAP). The hy-draulic conductivity of the soil was measured before puddling and 30 and 60 days after puddling by a fall-ing head permeameter as suggested by Rane and Varade (1972). The transplanting was carried out by an eight-row self-propelled rice trans-planter. Nitrogen, phosphorous and potassium were applied at the rate of 120, 60 and 40 kg per hectare. Half the dose of nitrogen, and full dose of phosphorous and potassium were applied as basal dose after puddling. Zinc sulphate at 20 kg/ha was also applied after puddling. Remaining half dose of nitrogen was applied in two splits: first at tillering and sec-ond at panicle initiation stage. The harvesting was carried out by sickle and threshing was done by a power thresher. The statistical design of the experiment was randomized block design (RBD). The data were analyzed statistically by using anal-ysis of variance (ANOVA) and the means were compared at 5 % level
of significance.
Results and discussionEffect of Puddling on Physical Properties of SoilPuddling Index
The puddling index data under different treatments are given in Table 1. It is evident from the table that puddling index increased sig-nificantly with level of puddling, irrespective of puddling equipment. Increase of puddling index from 36.27 to 43.15, 27.93 to 38.33 and 15.20 to 26.33 percent was observed for rotary puddler, peg type pud-dler and cultivator, respectively, when level of puddling increased from two to three passes in the first year. It was also clear from the data that puddling index was more for the rotary puddler compared to that of others at each level of puddling. Maximum puddling index of 43.15 percent was recorded for treatment R3, which was significantly higher than that of other treatments. There
Treatments(Puddling equipment)
Puddling index, %
Bulk density, Mg m-3 Hydraulic conductivity, mm hr-1
30 DAP 60 DAP 30 DAP 60 DAPFirst ExperimentsRotary puddler two passes (R2) 36.27 1.542 (8.59*) 1.561 (9.93) 0.234 (71.80) 0.229 (72.41)Rotary puddler three passes (R3) 43.15 1.606 (13.10) 1.636 (15.21) 0.191 (76.99) 0.206 (75.18)Peg type puddler two passes (P2) 27.93 1.499 (5.56) 1.520 (7.04) 0.312 (62.41) 0.303 (63.19)Peg type puddler three passes (P3) 38.33 1.530 (7.75) 1.548 (9.01) 0.239 (71.20) 0.238 (71.33)Cultivator two passes (C2) 15.20 1.446 (1.83) 1.458 (2.68) 0.547 (34.10) 0.551 (33.61)Cultivator three passes (C3) 26.33 1.474 (3.73) 1.498 (5.49) 0.370 (55.42) 0.364 (56.14)SE m± 0.686 0.013 0.010 0.021 0.014CD(0.05) 2.150 0.040 0.032 0.067 0.043
Initial bulk density, Mg m-3: 1.42; Initial hydraulic conductivity, mm hr-1: 0.830; Average moisture content of soil, %: 28.30 (30 DAP), 21.50 (60 DAP)
Treatments(Puddling equipment)
Puddling index, %
Bulk density, Mg m-3 Hydraulic conductivity, mm hr-1
30 DAP 60 DAP 30 DAP 60 DAPSecond ExperimentsPeg type puddler one passes (P1) 19.40 1.472 (2.22) 1.487 (3.26) 0.315 (51.39) 0.325 (49.85)Peg type puddler two passes (P2) 30.13 1.507 (4.65) 1.519 (5.49) 0.257 (60.34) 0.258 (60.19)Rotary puddler three passes (R1) 24.60 1.492 (3.61) 1.504 (4.44) 0.270 (58.33) 0.263 (59.41)SE m± 0.513 0.008 0.010 0.010 0.003CD(0.05) 2.00 NS NS 0.040 0.013
Initial bulk density, Mg m-3: 1.44; Initial hydraulic conductivity, mm hr-1: 0.648; Average moisture content of soil, %: 28.70 (30 DAP); 23.35 (60 DAP)
Table 1 Effect of puddling by using different equipment on physical properties of soil
* Values in the parenthesis are percentage change
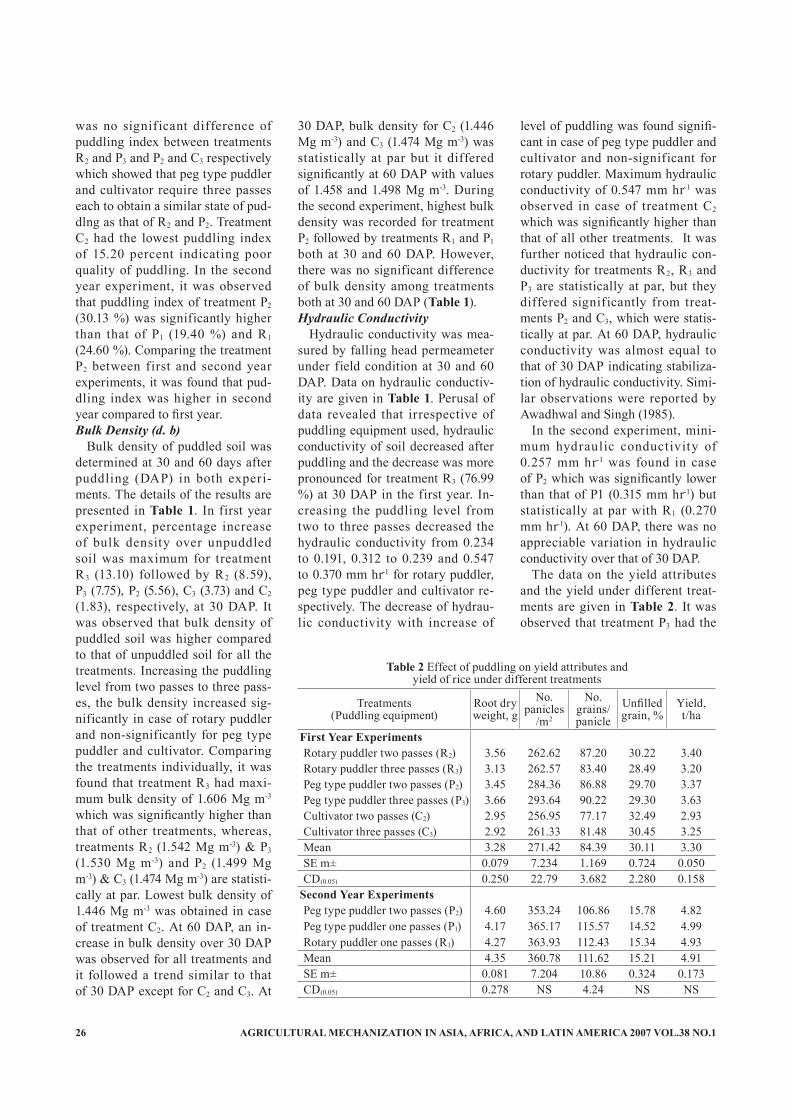
AGRICULTURAL MECHANIZATION IN ASIA, AFRICA, AND LATIN AMERICA 2007 VOL.38 NO.126
was no significant difference of puddling index between treatments R2 and P3 and P2 and C3 respectively which showed that peg type puddler and cultivator require three passes each to obtain a similar state of pud-dlng as that of R2 and P2. Treatment C2 had the lowest puddling index of 15.20 percent indicating poor quality of puddling. In the second year experiment, it was observed that puddling index of treatment P2 (30.13 %) was significantly higher than that of P1 (19.40 %) and R1 (24.60 %). Comparing the treatment P2 between first and second year experiments, it was found that pud-dling index was higher in second year compared to first year.Bulk Density (d. b)
Bulk density of puddled soil was determined at 30 and 60 days after puddling (DAP) in both experi-ments. The details of the results are presented in Table 1. In first year experiment, percentage increase of bulk density over unpuddled soil was maximum for treatment R3 (13.10) followed by R2 (8.59), P3 (7.75), P2 (5.56), C3 (3.73) and C2 (1.83), respectively, at 30 DAP. It was observed that bulk density of puddled soil was higher compared to that of unpuddled soil for all the treatments. Increasing the puddling level from two passes to three pass-es, the bulk density increased sig-nificantly in case of rotary puddler and non-significantly for peg type puddler and cultivator. Comparing the treatments individually, it was found that treatment R3 had maxi-mum bulk density of 1.606 Mg m-3 which was significantly higher than that of other treatments, whereas, treatments R2 (1.542 Mg m-3) & P3 (1.530 Mg m-3) and P2 (1.499 Mg m-3) & C3 (1.474 Mg m-3) are statisti-cally at par. Lowest bulk density of 1.446 Mg m-3 was obtained in case of treatment C2. At 60 DAP, an in-crease in bulk density over 30 DAP was observed for all treatments and it followed a trend similar to that of 30 DAP except for C2 and C3. At
30 DAP, bulk density for C2 (1.446 Mg m-3) and C3 (1.474 Mg m-3) was statistically at par but it differed significantly at 60 DAP with values of 1.458 and 1.498 Mg m-3. During the second experiment, highest bulk density was recorded for treatment P2 followed by treatments R1 and P1 both at 30 and 60 DAP. However, there was no significant difference of bulk density among treatments both at 30 and 60 DAP (Table 1).Hydraulic Conductivity
Hydraulic conductivity was mea-sured by falling head permeameter under field condition at 30 and 60 DAP. Data on hydraulic conductiv-ity are given in Table 1. Perusal of data revealed that irrespective of puddling equipment used, hydraulic conductivity of soil decreased after puddling and the decrease was more pronounced for treatment R3 (76.99 %) at 30 DAP in the first year. In-creasing the puddling level from two to three passes decreased the hydraulic conductivity from 0.234 to 0.191, 0.312 to 0.239 and 0.547 to 0.370 mm hr-1 for rotary puddler, peg type puddler and cultivator re-spectively. The decrease of hydrau-lic conductivity with increase of
level of puddling was found signifi-cant in case of peg type puddler and cultivator and non-significant for rotary puddler. Maximum hydraulic conductivity of 0.547 mm hr-1 was observed in case of treatment C2 which was significantly higher than that of all other treatments. It was further noticed that hydraulic con-ductivity for treatments R2, R3 and P3 are statistically at par, but they differed significantly from treat-ments P2 and C3, which were statis-tically at par. At 60 DAP, hydraulic conductivity was almost equal to that of 30 DAP indicating stabiliza-tion of hydraulic conductivity. Simi-lar observations were reported by Awadhwal and Singh (1985).
In the second experiment, mini-mum hydraulic conductivity of 0.257 mm hr-1 was found in case of P2 which was significantly lower than that of P1 (0.315 mm hr-1) but statistically at par with R1 (0.270 mm hr-1). At 60 DAP, there was no appreciable variation in hydraulic conductivity over that of 30 DAP.
The data on the yield attributes and the yield under different treat-ments are given in Table 2. It was observed that treatment P3 had the
Treatments(Puddling equipment)
Root dry weight, g
No. panicles
/m2
No. grains/panicle
Unfilled grain, %
Yield, t/ha
First Year ExperimentsRotary puddler two passes (R2) 3.56 262.62 87.20 30.22 3.40Rotary puddler three passes (R3) 3.13 262.57 83.40 28.49 3.20Peg type puddler two passes (P2) 3.45 284.36 86.88 29.70 3.37Peg type puddler three passes (P3) 3.66 293.64 90.22 29.30 3.63Cultivator two passes (C2) 2.95 256.95 77.17 32.49 2.93Cultivator three passes (C3) 2.92 261.33 81.48 30.45 3.25Mean 3.28 271.42 84.39 30.11 3.30SE m± 0.079 7.234 1.169 0.724 0.050CD(0.05) 0.250 22.79 3.682 2.280 0.158
Second Year ExperimentsPeg type puddler two passes (P2) 4.60 353.24 106.86 15.78 4.82Peg type puddler one passes (P1) 4.17 365.17 115.57 14.52 4.99Rotary puddler one passes (R1) 4.27 363.93 112.43 15.34 4.93Mean 4.35 360.78 111.62 15.21 4.91SE m± 0.081 7.204 10.86 0.324 0.173CD(0.05) 0.278 NS 4.24 NS NS
Table 2 Effect of puddling on yield attributes andyield of rice under different treatments

VOL.38 NO.1 2007 AGRICULTURAL MECHANIZATION IN ASIA, AFRICA, AND LATIN AMERICA 27
highest yield of 3.63 t/ha followed by R2 (3.40 t/ha), P2 (3.37 t/ha), C3 (3.25 t/ha), R3 (3.20 t/ha) and C2 (2.931 t/ha). Treatment P3 was sta-tistically superior to all other treat-ments whereas treatment P2, R2 and C3 are statistically at par. During second year experiment, maximum grain yield of 4.99 t/ha was ob-tained in case of P2 followed by R1 (4.93 t/ha) and P1 (4.82 t/ha). It was observed that even with low level of puddling the grain yield was re-markably higher than that obtained in the first experiment.
DiscussionsDuring puddling, soil undergoes
two types of deformations: first, due to normal stress which is associ-ated with compression and second, because of tangential stress causing shear. Compression is most effective below upper plastic limit whereas shear effect dominates above it. Since, puddling is done under satu-rated condition of soil, it is shear stress, which causes dispersion of soil particles in water. Rotary puddler due to rotary motion of its blades matches the weakest fracture plane of soil mass disintegrating it into fine particles (Sharma and De Datta, 1985). This is the reason for higher puddling index in case of rotary puddler. Besides that, the angular orientation of blade (30º) in rotary puddler creates a cycloid ac-tion of the blade on the soil thereby increases the churning of soil and water mixture, which enhances the puddling index (Tewari, 1984). Low puddling index in case of peg type puddler and cultivator may be due to combing action of the soil working elements of the puddling equipment. Higher puddling index in case of peg type puddler compared to culti-vator at a same puddling level may be because of close spacing of pegs. Puddling index for P2 in the second year was higher compared to that of 1998. It may be because of weed
free and well-prepared initial field condition.
After dispersion of soil particles by puddling, flocculation takes place and there is a stratified settlement of soil particles leading to destruc-tion of macro pores, which creates a dense soil. Higher the dispersion of soil particles in water (puddling index), higher is the bulk density. It has also been noticed that, though there is significant increase of pud-dling index with level of puddling (2 to 3), the bulk density increased significantly only in case of rotary puddler. This might be due to higher puddling index in case of rotary puddler and lower in case of peg type puddler and cultivator, which may not be contributing towards the destruction of macro pores as in case of rotary puddler. Bulk density increased with respect to time. This might be due to shrinkage of soil at lower moisture content. Aver-age moisture content of soil at 30 DAP was 28.30 and 28.70 percent in First and second year of experiment respectively whereas it was 21.50 and 23.35 percent at 60 DAP for the above years. The findings cor-roborate with the results reported by Scheltema (1974); Bajpai (1994) and Rath (1999).
The hydraulic conductivity de-pends upon the amount and size of coarse pores (transmission pores) in the soil. Considerable reduction of hydraulic conductivity of puddled soil over unpuddled was observed in case of all treatments under the study. This might be due to clog-ging of pore space channels on set-tling of soil particles after puddling. Clogging of these channels reduce the water transmission pores which results in decreasing hydraulic con-ductivity. Similar results were re-ported by Bhole and Pandya (1962); Naphade and Ghildyal (1971); Rane and Varade (1972); Tyagi et al. (1974); Sharma and DeDatta (1985) and Sharma et al. (1991). At higher level of puddling, viscosity of puddled soil increases. Hence, water
moves at a very slow rate, which in turn enhances lodgment of finer particles. Lodgment favours a more closely packed soil medium, which reduces hydraulic conductivity con-siderably (Alva and Petersen, 1979). This might be the reason for lower hydraulic conductivity in case of treatment R3 where there was maxi-mum dispersion of soil particles in water.
Grain yield is affected by physi-co-chemical status of soil and op-timum plant population taking into account others parameters constant for all treatments. Poor performance of treatment C2 may be due to less nutrient availability because of higher leaching losses resulting due to greater hydraulic conductivity. Similar observations were made by Tyagi et al. (1975); Sharma and De Datta (1986); Sharma et al. (1988) and Rath (1999). Although the pud-dling quality was good in case of R3, its performance in term of yield was found poor. This may be due to low plant population resulting from higher mortality because of more buried and floating hills after trans-planting by the self-propelled trans-planter. Another reason for poor yield may be higher bulk density leading to poor root growth (Table 2). Reduction in yield as a result of higher bulk density was also report-ed by Ghildyal and Satyanarayan (1969); Gupta and Jaggi (1979). The soil physical properties obtained af-ter puddling were almost similar for treatments P3 and R2 but P3 contrib-uted more grain yield than R2 which might be due to more of panicles per sq.-m (P3: 323.97, R2: 287.45) (Table 2). In comparison to C2 grain yield, C3 was significantly higher. This may be due to less leaching losses because of comparatively lower hy-draulic conductivity (Table 1). Low grain yield in the first experiment compared to the second might be due to late transplanting, stem borer infestation and higher percentage of unfilled grains. The hill population was higher in the second experi-

AGRICULTURAL MECHANIZATION IN ASIA, AFRICA, AND LATIN AMERICA 2007 VOL.38 NO.128
ment because of less mortality and hill spacing. In the second experi-ment the hill spacing was set at 10 cm whereas it was 12 cm during the first experiment. The transplant-ing during the first experiment was carried out in the last week of July whereas it was performed in the first week of the same month in the sec-ond experiment. Although themet at 20 kg per hectare was applied to control the stem borer, they migrat-ed from the nearby field. There was a heavy rainfall of 283.5 mm in the third week of October which was before harvesting which might have facilitated the attack of gandhibug resulting in an increase of unfilled grain of 28-34 percent in the first experiment while it was only 12-16 percent in the second experiment.
The yield was found higher, even if the puddling level was reduced in the second experiment. Well prepared and weed free initial field condition might have improved the quality of puddling in terms of bulk density and hydraulic conductiv-ity (Table 1) giving a better root and crop growth and ultimately higher yield.
ConclusionThe results of the study indicate
that cultivator is not ideal equipment for puddling. Treatment R3 reduced the bulk density and hydraulic con-ductivity of the soil considerably in comparison to other treatments but the root growth and subsequently the yield was less. Treatment P3 produced higher rice yield in the first year experiment whereas, in the second year experiment with re-duced puddling level, the yield was much higher. This indicates that for silty clay loam soil reduced pud-dling gives more yield. There was no significant difference in the soil physical properties with reduced puddling level among the treatments in the second year experiment. Hence, to reduce the cost of tillage
and time, treatment R1 and P1 should be preferred to other treatments.
REFERENCES
Anonymous. 1994. World Rice sta-tistics. IRRI, Manila-1099, Philip-pines.
Anonymous. 1999. Survey of Indian agriculture.
Alva, A. K. and L. Paterson. 1979. Soil physical properties in relation to rice yields and water consump-tion under flooded and unflooded condition. Plant Soil. 52: 353-363.
Awadhwal, N. K. and C. P. Singh. 1985. Characterization of puddled soil. J. Agric. Engg. ISAE. 22(1): 9-14.
Bajpai. R. K. 1994. Effect of till-age methods and fertility levels on soil physical properties, crop growth and productivity in rice-wheat cropping system. Thesis, Ph. D. GBPUAT, Pantnagar.
Bhan, S. and V. D. Padwal. 1976. Effect of soil and water manage-ment practices on yield and water use of direct seeded rice under light textured alluvium soil of Ut-tar Pradesh. Indian J. Agric. Sci. 46: 503-506.
Bhole, N. G. and A. C. Pandya. 1964. Puddling of soil. The har-vester. (J. Agri. Engg. Soc.), IIT, Kharagpur. 7: 11-17.
Ghildyal, B. P. and T. Satyanaraya-na. 1969. Effect of compaction on physical properties and manage-ment of paddy soils. Pp. 42-58. In: Proceedings Symposium. Paddy soil. Nanjing, China. 19-24 Oct. 1980. Science Press. Beijing, China.
Gupta, R. K. and I. K. Jaggi. 1979. Soil physical conditions and pad-dy yield as influenced by depth of puddling. J. Agron. Crop Sci. 148: 329-336.
Khan, A. S. and W. W. Gunkel. 1988. Mechanical transplanting of rice in Pakistan. AMA. 19(1): 21-34.
Lal, R. 1985. Tillage in low land
rice based cropping systems. In: Soil Physics and Rice, IRRI, Phil-ippines. Pp. 283-307.
Manian, R. and P. Jivaraj. 1989. Puddled characteristics of soil with selected implements. AMA. 20 (1): 21-24 & 26.
Mambani, B., S. K. De Datta, and A. C. Redula. 1989. Soil physi-cal behaviour and crop response to tillage in lowland rice soil of varying clay content. Plant Soil. 126 (2): 227-235.
Naphade, J. D. and B. P. Ghildyal. 1971. effect of puddling on physi-cal properties of rice soil. Indian J. Agric. Sci. 41 (12): 1065-1067.
Rane, D. B. and S. B. Varade. 1972. Hydraulic conductivity as an index for evaluating the perfor-mance of different puddlers. J. Agric. Engg. 9 (1): 11-16.
Rath, B. S. 1999. Studies of wheat sowing at various levels of pud-dling in rice under rice-wheat cropping system. Thesis, Ph.D. GBPUAT, Pantnagar.
Scheltema, W. 1974. Puddl ing against dry ploughing for low land rice culture in Surinam Agril. Res. Rep. 823. Centre for Agril. Publishing and Documentation, Wageningan, Netherlands. 241P
Sharma, P. K. and S. K. De Datta. 1985. Puddling influence on soil, rice development and yield. Soil Sci. Soc. Am. J. 49: 1451-1457.
Sharma, P. K. and S. K. De Datta. 1985. Physical properties and pro-cesses of puddled rice soils. Adv. Soil sci. 5: 139-178.
Sharma, P. K., S. K. De Datta, and A. C. Redula. 1988. Tillage ef-fects on soil physical properties and wetland rice yield. Agron. J. 80 (1); 34-39.
Sood, M. C. and C. L. Acharya. 1991. Effect of tillage on root plant growth and nutrient uptake by wetland rice on acidic alfisol. Ann. Agric. Res. 12 (4): 344-351.
Swaminathan, M. S. 1972. Scientific management and user of water. Indian farming. 22 (2): 5-7.
■■

VOL.38 NO.1 2007 AGRICULTURAL MECHANIZATION IN ASIA, AFRICA, AND LATIN AMERICA 29
Ground Contact Pressure and Soil SedimentationPeriod Affecting Transplanter Sinkage and itsPerformance
byB. K. BeheraAssistant Agricultural EngineerCollege of Agricultural Engineeringand Technology, OUATBhubaneswar - 751 003, [email protected]
S. SwainDeanCollege of Agricultural Engineeringand Technology, OUATBhubaneswar - 751 003, OrissaINDIA
B. P. VarshneyProfessorG. B. Pant University of Agriculturaland Technology,Pantnagar - 263 145, UttaranchalINDIA
AbstractSelf-propelled transplanter has
problems of poor traction and sink-age and requires ideal soil condition for proper working. Too soft soil increases the sinkage of the float of the transplanter and leads to a high-er percentage of buried and floating hills and subsequently increases the hill mortality. A study was con-ducted to determine the sinkage of the transplanter through a sinkage device under simulated conditions and later on verified on the field by the transplanter itself. Good agree-ment between the simulated sinkage and actual sinkage was observed. Further study on the performance of the transplanter showed that ideal transplanting time should be 48 hours after puddling for a silty clay
loam soil. Sinkage of the float had good correlation with buried and floating hill as well as with the hill mortality.
IntroductionManual transplanting, still preva-
lent in most parts of the country, is labour intensive and requires 250-350 man-hours per hectare, which is 25 percent of the total la-bour requirement of the crop (G. Singh and U. K. Hussain, 1983). In addition to being labour intensive, manual transplanting involves a lot of human drudgery, reducing the ef-ficiency appreciably. Manual trans-planter, the first substitute of manual transplanting, requires 70-80 man-hours per hectare, reduces the la-
bour requirement by 55 percent (G. Singh and U. K. Hussain, 1983). But it has been observed that the use of manual transplanter is still associ-ated with human drudgery and low work capacity ranging from 0.01 to 0.015 ha h-1. Therefore, gradu-ally, the attention has been shifted to self-propelled rice transplanter whose work capacity varies from 0.12 to 0.15 ha per hour (B. K Be-hera, 2000).
Like all other wetland agricul-tural machinery, aself-propelled rice transplanter has problems of poor traction, sinkage and steer-ability. Since a self-propelled rice transplanter works on puddled soil, it encounters a hard surface at the plow pan and a soft puddled soil at the top where it must have sufficient bearing capacity to prevent sinkage

AGRICULTURAL MECHANIZATION IN ASIA, AFRICA, AND LATIN AMERICA 2007 VOL.38 NO.130
of the f loat. At the same time, the plow pan must not be too deep to provide necessary traction to pro-pel the transplanter. Both traction and bearing capacity are depen-dent upon shear strength of the soil (Knight and Freitag, 1962). Usually a transplanter would be immobi-lized by failure in either bearing of the machine on the soil or traction. Efficient working of a self-propelled rice transplanter requires suitable puddled soil conditions vis-à-vis optimum depth of puddling, degree of puddling and strength of puddled soil. High degree of puddling se-verely affects the mobility of the transplanter and its performance due to sinkage and poor traction and requires a longer sedimentation period.
Sinkage of the transplanter de-pends on the ground contact pres-sure and the softness of top layer of the puddled soil, which is directly affected by degree of puddling, type of puddling equipment and sedimen-tation period. Sinkage with respect to contact pressure and sedimenta-tion period will be of immense help in designing the machine. Keeping this in mind, the present study was undertaken to simulate the sinkage of a transplanter with respect to different contact pressures through a sinkage device. The transplanter was also operated in the field to asses the sinkage of the float and its performance.
Materials and MethodsThe study was conducted in a
silty clay loam soil (sand: 32.82 %; silt: 42 %; clay: 25.18 %) at G. B. Pant University of Agriculture and Technology, Pantnagar, Uttaranchal in the year 1999. Puddling of the field was carried out by two pud-dling units namely: peg type pud-dler and rotary puddler. One pass of peg type puddler (P1), two passes of peg type puddler (P2) and one pass of rotary puddler (R1) were the three
main treatments of the experiment. Three sedimentation periods of 24, 36 and 48 hours were considered as the sub-treatment. The transplanter was self-propelled as shown in Fig. 1. In operating condition, the trans-planter rests on the traction wheel at the front and on the float at the back.
The sinkage of the transplanter was simulated by a sinkage device (Fig. 2). The sinkage device had a base plate fixed to the center that was a rectangular bar 25 x 25 mm. Over the rectangular bar, a m. s. plate was welded onto which weights could be placed to get the desired contact pressure at the base plate.
The dimension of the base plate was determined by dimensional
analysis as described below:The general prediction equation
of sinkage will be:X = f (W, L, B, C) .......................(1)Where,X = Sinkage, W = Weight on the floatL = Length of the floatB = Breadth of the floatC = Resistance of the puddled soilThe effect of standing water on
sinkage was not considered because, under both actual and simulated condition, the same water level was maintained.
By dimensional analysis, the di-mensionless π terms are:
π1 = X / B; π2 = L / B; π3 = W / (C x L x B)
Sl. no Items Specifications1 Model 2ZT-238-82 External dimensions; L x W x H, mm 2410 x 2131 x 13003 Weight, kg Air cooled 2.4 kW diesel engine4 Engine 3205 Number of rows 86 Row spacing, mm 2387 Hill to hill spacing, mm (i) 100, (ii) 1208 Frequency of transplanting 2639 Depth of transplanting Infinitesimal adjustment with screw rod10 Operating speed, km/h (i) 1.57, (ii) 1.9411 Width of transplanting finger, mm 12.512 Width of seedling gate, mm 16
Fig. 1 Eight row self-propelled rice transplanter

VOL.38 NO.1 2007 AGRICULTURAL MECHANIZATION IN ASIA, AFRICA, AND LATIN AMERICA 31
Where, L x B = Area of the floatApplying the theory of model, the
design conditions for the model of the float (base plate of the sinkage device) is as follows:
X / B = Xm / Bm ...........................(2)L / B = Lm / Bm ............................(3)W / (C x B x L) = Wm / (Cm x Bm x
Lm) .....................................................(4)Where, ‘m’ represents the modelThe length scale of the model will
be Lm / Bm = L / B = 182 cm / 77 cm = 2.36
Assuming the breadth of the model to be 12 cm, the length of the model will be:
12 x 2.36 = 28.32 cm.The thickness of the base plate
was 5 cm. The detail of the sinkage device has been given in Fig. 2.
Simulation of Load on the FloatThe load on the model (sinkage
device) to simulate contact pressure was done by using the design condi-tion of the model as derived from equation (4):
Wm = W x (Cm x Bm x Lm / C x B x L) .......................................................(5)
Since, Cm = C, as the soil condi-tion was same for both the trans-planter and the sinkage device, the above equation will be:
Wm = W x (Bm x Lm / B x L) .....(6)Wm = W x (12 x 28.32 /77 x 182 =
W x 0.024 ........................................(7)
The load on the f loat was deter-mined by weighing the machine in a weighbridge.
Weight of the transplanter without operator and seedling mat = 320 kg.
Load on the float = 150 kg.Load on the traction wheel = 170
kg.The load distribution on the float
when additional loads are added was found to be:
a. With operator seated and seed-ling mat on the transplanter tray = 206 kg.
b. With additional two loaders along with operator and seed-ling mat on the tray = 266 kg.
c. With 8 additional seedling mats on the float along with operator, two loaders and seedling mat on the tray = 298 kg.
Putting the above loads in equa-tion (6), the simulated loads on the sinkage device will be 4.94, 6.38 and 7.152 kg, respectively. However, the experiment was conducted with loads of 3, 4, 5, 6 and 7 kg, which includes the weight of the sinkage device. The corresponding contact pressures on the device were 8.83, 11.77, 14.71, 17.66 and 20.60 g cm-2. The contact pressure of the sinkage device with the puddled soil was de-termined by dividing the load by the area of the base plate of the device. The contact pressure of the float of the transplanter with the puddled
soil was determined by dividing the load on the float by the area of the float.
Measurement of SinkageThe sinkage device was placed
on the undisturbed marked area of the puddled soil for each treatment and weights were put on it to simu-late required contact pressure. The sinkage of the base plate into the puddled soil was noted from four scales attached at four sides of the central rectangular bar to measure the sinkage and the average was taken as the representative sinkage. Five observations were taken for each treatment. Constant water level of one cm was maintained through out the experiment to simulate the ideal transplanting condition. Ob-servations on sinkage were taken at 24, 36 and 48 hours of sedimenta-tion periods.
Actual sinkage of the float of the transplanter during transplanting was determined by subtracting the pre-set depth (3 cm) of transplant-ing from the actual depth of trans-planting. The transplanter had a provision for setting the depth of transplanting and it was presumed that actual depth of transplanting was the sinkage of the float plus the pre-set depth of transplanting. The buried and floating hills along with hill mortality were determined as suggested by (Singh et al., 1985).
Results and DiscussionsThe sinkage of the device under
different soil conditions as obtained by the puddling equipment, degree of puddling and the sedimentation period has been presented in Table 1.
It was observed that the sinkage of the device simulating the sinkage of the transplanter increased with increase of contact pressure for each puddling equipment and degree of puddling. A decrease of sinkage was also noticed when the sedimen-
Fig. 2 Sinkage device for measurement of sinkage

AGRICULTURAL MECHANIZATION IN ASIA, AFRICA, AND LATIN AMERICA 2007 VOL.38 NO.132
tation period increased irrespective of puddling equipment and degree of puddling. Maximum sinkage of 3.85 cm was found in the case of the peg type puddler with two passes followed by rotary puddler with one pass (3.33 cm) and peg type pud-dler with one pass (3.11 cm) after 24 hours of sedimentation period at a contact pressure of 20.60 g cm-2 that represents an operating condition of the self-propelled rice transplanter with operator, two loaders and seed-ling mat both on the tray and on the f loat. When the sedimentation pe-riod increased from 24 to 36 hours, the sinkage reduced to 1.40, 2.20 and 2.15 cm for the peg type puddler with one pass (P1), peg type puddler with two passes (P2) and rotary pud-dler with one pass (R1), respectively. The corresponding sinkages were 0.85, 1.61 and 1.38 cm after 48 hours of sedimentation period (Table 1). However, it was observed that there was appreciable decrease in sinkage between 24 to 36 hours of sedimen-tation period than as compared to 36 to 48 hours. A similar trend was observed for other contact pres-sures under different sedimentation periods. Maximum sinkage in case of peg type puddler with two passes may be due to softer soil because of good puddling (Puddling index: 30.13 %).
The transplanter was operated under a contact pressure of 14.71 g cm-2 in the puddled field as cre-ated by different puddling equip-ment af ter 24, 36 and 48 hours of sedimentation periods. It was observed that the peg type puddler with two passes caused maximum sinkage of 2.69 cm at 24 hours of sedimentation period followed by rotary puddler with one pass (2.58 cm) and peg type puddler with one pass (2.38 cm). Quite similar to the trend observed in case of the sink-age device, the sinkage of the float of the transplanter decreased with increase in sedimentation period. It was noticed that the observed sinkage was slightly less compared
to the simulated sinkage at 14.71 g cm-2 contact pressure. However, the test of goodness of fit (χc
2 = 0.053) showed that the observed sinkage of the transplanter and simulated sink-age were at par at 1 percent level of significance.
The buried and floating hill per-centage demonstrated a decrease as the sedimentation period increased as did the hill mortality (Table 2). A good correlation (R2 = 0.839*) be-tween sinkage and buried and float-ing hill was observed (Fig. 3). Sink-age depends on the softness of the soil. With soft soil leading to more sinkage, there is a flow of soil along with the float resulting in more per-centage of buried and floating hills which ultimately increased the hill mortality. There also exists a good correlation (R2 = 0.796*) between sinkage and hill mortality (Fig. 4).
From the study, it was observed that buried and floating hill percent-
age was appreciably high after 24 hours of puddling which showed that transplanting should not be done after 24 hours of puddling for a silty clay loam soil. For the peg type puddler with two passes, the ideal condition is after 48 hours of puddling. For the other treatments, transplanting could be done after 26 hours of sedimentation period as observed from the field experiment. It has been reported that sinkage above 2 cm in a soil is considered to represent too soft a soil for trans-planting and sinkage less than 1 cm is too hard for transplanting (Garg, 1999). Taking that as a reference, it can be said that for a contact pres-sure of 20.66 g cm-2 which was obtained by the load condition at which the transplanter should be operated to increase the efficiency by reducing the seedling mat feed-ing time, the ideal transplanting time should be 48 hours after the
Puddling equipment
Sedimen-tation period
Sinkage, cmContact pressure, g cm-2
8.83 11.77 14.71 17.66 20.66
P1
24 1.85 2.01 2.50 2.92 3.1136 1.01 1.21 1.40 1.22 1.4048 0.29 0.35 0.50 0.73 0.85
P2
24 2.09 2.40 2.90 3.12 3.8536 1.20 1.35 1.70 1.95 2.2048 0.80 0.95 1.32 1.46 1.61
R1
24 1.90 2.40 2.85 2.95 3.3336 1.00 1.31 1.62 1.75 2.1548 0.42 0.80 1.21 1.06 1.38
Table 1 Effect of contact pressure on sinkage of the sinkagedevice under different puddled soil conditions
Puddling equipment
Sedimen-tation period
Observed sinkage at 14.71 g cm-2
contact pressureBuried hill,
%Floating hill,
%Hill
mortality, %
P1
24 2.38 3.33 2.93 4.8836 1.20 1.97 0.75 1.9748 0.92 0.53 0.00 0.00
P2
24 2.69 5.78 4.05 8.2836 1.56 2.50 1.55 4.2348 1.19 1.32 1.30 2.59
R1
24 2.58 3.27 3.30 5.3736 1.33 1.55 0.78 1.7748 1.10 0.00 0.00 2.78
Table 2 Observed sinkage, buried and floating hill andhill mortality under different puddled soil condition

VOL.38 NO.1 2007 AGRICULTURAL MECHANIZATION IN ASIA, AFRICA, AND LATIN AMERICA 33
Buried and floating hill, %
0
2
4
6
8
10
12
2.692.582.381.561.331.21.191.10.92
Sinkage, cm
y = 1.0638x - 1.4358R2 = 0.839*
Hill mortality, %
0
2
4
6
8
10
2.692.582.381.561.331.21.191.10.92
Sinkage, cm
y = 0.7955x - 0.4364R2 = 0.796*
puddling for all treatments under the study. However, this study was limited to silty clay loam soil and further investigation could be made with different soils and level of pud-dling with other puddlers.
Conclusions Peg type puddler with two passes
caused maximum float sinkage of 2.69 cm at 24 hours of sedimenta-tion period followed by rotary pud-dler with one pass (2.58 cm) and peg type puddler with one pass (2.38 cm). It was noticed that the observed sinkage was slightly less compared to the simulated sinkage at 14.71 g cm-2 contact pressure. However, the test of goodness of fit (χc
2 = 0.053) showed that the observed sinkage of the transplanter and simulated sink-age were at par at 1 percent level of significance. The simulated sink-age obtained by the sinkage device could be used as representative of the sinkage of the float and can be used to determine the ideal trans-planting time after puddling. With increase in sedimentation period the sinkage, buried and floating hill and the hill mortality decrease and there was a good correlation between sinkage and buried and floating hill (R2 = 0.839*). For silty clay loam soil, the ideal transplanting time by
a self-propelled rice transplanter should be 48 hours after puddling for peg type puddler with two pass-es.
REFERENCES
Behera, B. K. 2000. “Investigation on puddled soil characteristics in relation to performance of self-propelled rice transplanter”. Un-published Ph. D Thesis. G. B. P. U. A & T, Pantnagar.
Garg, I. K. 1999. Effect of ground contact pressure and soil settle-ment period on paddy transplanter sinkage. Personal communication, PAU, Ludhiana.
Knight, S. J. and D. R. Freitag. 1962. Measurement of soil trafficability characteristics. Trans. ASAE. vol. 5: 121-124.
Singh, G. and U. K. Hussain. 1983. Modif ication and testing of a manual rice transplanter’. Agri-cultural Mechanization in Asia, Africa and Latin America, vol. 14 (2): 25-30.
Singh, G., T. R. Sharma, and C. W. Bockhop. 1985. Field performance evaluation of a manual rice trans-planter. J. Agric. Engg. Res. 32: 259-268.
■■
Fig. 3 Relationship between sinkage and buried & floating hill Fig. 4 Relationship between sinkage and hill mortality
AGRICULTURAL MECHANIZATION IN ASIA, AFRICA, AND LATIN AMERICA 2007 VOL.38 NO.134
Development of a Reinforced Mud SilobyA. F. AlongeLecturerDepartment of Agricultural Engineering,University of Ilorin,[email protected]
A. A. OpeloyeruGraduate StudentDepartment of Civil Engineering,Rivers State University of Technology,PortharcourtNIGERIA
AbstractAn experimental mud silo was
designed, constructed with mud. The mud from Oyun River (along University Road, Ilorin, Nigeria) was subjected to tests using the Cob, Wattle and Daub method be-fore construction was carried out on the two soil types from two differ-ent locations. The soil samples from the river has a plastic index of 38.50 % and bulk density of 1.65 g/cm3, while the sample collected from Okelele in Ilorin had a plastic index of 22.2 % and bulk density of 2.85 g/cm3. The silo was constructed with local available materials such as clay, wood and plywood. Tests showed that the relative humid-ity and moisture content of four-grain types stored increased until a temperature of 29 ºC was reached. It then decreased until the hygro-scopic equilibrium was reached at a temperature of 21 ºC. The outside temperatures, due to low thermal conductivity of the mud used, influ-enced the temperature in the silo at a very low or negligible rate. There was no development of mould or
insect activity observed. For storage of bean, yellow maize, white maize and sorghum in mud silos, a relative humidity of below 75 % and a tem-perature of 29 ºC or less is recom-mended.
IntroductionStorage of grains dates back to
Bible days with the building of pyramid stores in Egypt by the Is-raelites, in the cities of Pithom and Ramses (The Holy Bible, Exodus 1:11, 5:16). They made bricks from straw and well-mixed mud; fired the mud and used it in building. The building of these storage structures, though tedious, served as a timely saving gesture against starvation for Egypt and its environs.
Ditcher (1981) in Ghana noted that ordinary mud is moulded into mud bricks and they are used for circular walls from a locally made mould. Ghana German Agricultural Development Project (GGADP) has adopted the improved form of this type of silo. Igbeka (1983) pointed out that Nigeria exists in
three climatic zones; the lowland humid zone of the south, the Guinea Savannah of the middle belt and the Arid and Semi-Arid region of the North. It is observed that storage structures made from mud, ranging from mud Rhumbus in the North to mud silo and earthenware roots in the south and middle belts are com-mon and universally accepted.
Thatched rhumbus a re com-monly found in the Northern States of Nigeria especially Adamawa and Borno states. Grains are usu-ally stored in shelled or unshelled from. The structure, which is made from thatches and palm fronts, is supported on wooden structures or stones. The walls are provided with tension rings in about three places. These tension rings are made from local rope materials. This kind of structure has been disqualified be-cause of fire hazards, and it is not moisture proof.
Mud Rhumbus or bins range from small to large size. It is a very com-mon for storage and modifications are made in the shape and size in accordance to the environment in which it is to be used. It is found

VOL.38 NO.1 2007 AGRICULTURAL MECHANIZATION IN ASIA, AFRICA, AND LATIN AMERICA 35
mainly in cylindrical shape. The cover is conical and can be made up of either mud or thatches. The open-ing is sealed after it is filled with grains. It usually has four compart-ments for storing different grains and a provision made for a chicken to live underneath it. This is to con-trol infestation by pest.
Many of the traditional structures mentioned have limitations particu-lar in durability, protection against moisture and ambient air. Losses are incurred from plant pest causing deterioration, discoloration and loss of nutrients, mould development on crops due to inadequate drying, pilfering by people, and shattering of grains due to premature harvest. Hence, the need for a modified mud silo arises for this chosen design. This work is a prototype that falls between the mud Rhumbus (used in the North) and the mud silo in the South. The ability of mud being able to maintain relatively constant temperature in structures and its ef-fects on the storability of grains was exploited.
This paper presents the design, construction and testing of a mud silo with materials that are cheap, readily and locally available. Addi-tional desirable characteristics that
it should have are stable and capable of bearing design loads, portable and can easily be maintained, rea-sonably insect-proof, and have ease of loading and unloading and with reduced temperature fluctuation in the bin.
Materials and MethodDesign Considerations
The following points were taken into considerations for the mud silo:
i. A stable structure, capable of bearing the desired load.
ii. Cheap and easily maintained structures
iii. Ease of cleaningiv. Fire proof structurev. Ease of loading and unloadingvi. Reasonably insect proof, thus
reducing insect infestation.vii. Prevention of violent tempera-
ture fluctuations thus improving storage quality.
viii. Permit effective pest control practices such as fumigation.
The considerations made before designing can be explained as those factors that dictates the materials and design chosen for construction.
Material SelectionThe selection of materials for
constructions are based on their availability, cost durability and ease of maintenance. Some phase related properties or qualities were tested
before choosing materials for con-struction. The following tests were carried out on clay obtained from the two best clayey area of the town.
1. Sieve analysis2. Determination of specific grav-
ity, bulk density and dry density3. Testing for Atterberg limits.4. Determination of moisture con-
tent (wet basis)Lambe and Whitman (1976) and
Bengtsson and Whitaker (1987) gave the detailed procedure for carrying out these tests. For this work two soil samples were tested. The first one was from Oyun River along the University Road while the second sample was from Okelele, Ilorin, Kwara State. The result of the various test carried out showed that both clay samples fell under the illite group. Plasticity Index (PI), which is the arithmetic difference between the liquid limit and plastic limit, ranged from 33 % to 67 %. The plasticity index of sample 1 from Oyun River was 38.5 %, and sample 2 from Okelele was 22.2 %. The soil from Oyun River was used in construction because it was more plastic. The first soil sample was more unfairly distributed and grad-ed than that of the second sample.
Design Analysis The major calculations and analy-
sis carried out on the design of the mud silo were:
1. Pressure Analysis on the Silo.
Fig. 1 Pictorial view of the reinforced mud silo
Fig. 2 Sectional view of thereinforced mud silo
Fig. 3 Plan view of the reinforcedmud silo (Section A-A)
1: Inlet cover, 2: Roof, 3: Reinforced mud wall, 4: Base, 5: Partition, 6: Slot, 7: Wall reinforcement, 8: Outlet cover, 9: Stand, 10: Roof support
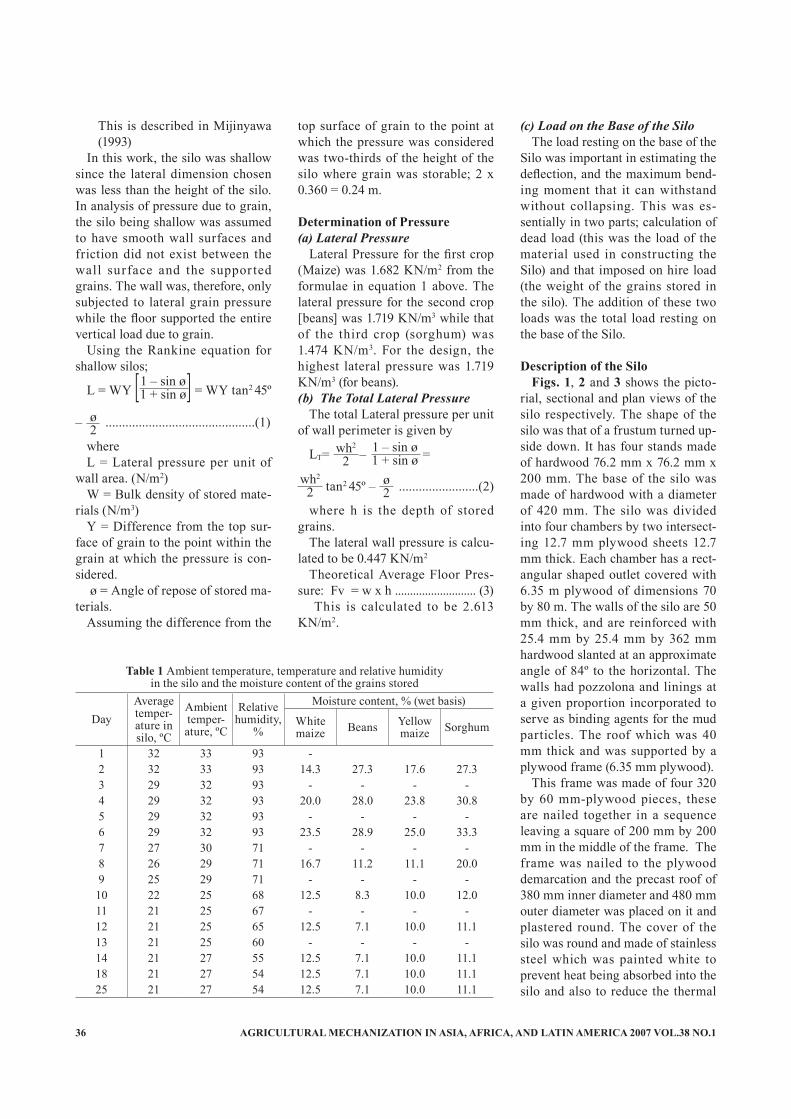
AGRICULTURAL MECHANIZATION IN ASIA, AFRICA, AND LATIN AMERICA 2007 VOL.38 NO.136
This is described in Mijinyawa (1993)
In this work, the silo was shallow since the lateral dimension chosen was less than the height of the silo. In analysis of pressure due to grain, the silo being shallow was assumed to have smooth wall surfaces and friction did not exist between the wall surface and the suppor ted grains. The wall was, therefore, only subjected to lateral grain pressure while the floor supported the entire vertical load due to grain.
Using the Rankine equation for shallow silos;
L = WY = WY tan2 45º
– .............................................(1)
whereL = Lateral pressure per unit of
wall area. (N/m2)W = Bulk density of stored mate-
rials (N/m3)Y = Difference from the top sur-
face of grain to the point within the grain at which the pressure is con-sidered.
ø = Angle of repose of stored ma-terials.
Assuming the difference from the
top surface of grain to the point at which the pressure was considered was two-thirds of the height of the silo where grain was storable; 2 x 0.360 = 0.24 m.
Determination of Pressure(a) Lateral Pressure
Lateral Pressure for the first crop (Maize) was 1.682 KN/m2 from the formulae in equation 1 above. The lateral pressure for the second crop [beans] was 1.719 KN/m3 while that of the third crop (sorghum) was 1.474 KN/m3. For the design, the highest lateral pressure was 1.719 KN/m3 (for beans). (b) The Total Lateral Pressure
The total Lateral pressure per unit of wall perimeter is given by
LT= – =
tan2 45º – ........................(2)
where h is the depth of stored grains.
The lateral wall pressure is calcu-lated to be 0.447 KN/m2
Theoretical Average Floor Pres-sure: Fv = w x h ........................... (3)
This is calculated to be 2.613 KN/m2.
(c) Load on the Base of the SiloThe load resting on the base of the
Silo was important in estimating the deflection, and the maximum bend-ing moment that it can withstand without collapsing. This was es-sentially in two parts; calculation of dead load (this was the load of the material used in constructing the Silo) and that imposed on hire load (the weight of the grains stored in the silo). The addition of these two loads was the total load resting on the base of the Silo.
Description of the SiloFigs. 1, 2 and 3 shows the picto-
rial, sectional and plan views of the silo respectively. The shape of the silo was that of a frustum turned up-side down. It has four stands made of hardwood 76.2 mm x 76.2 mm x 200 mm. The base of the silo was made of hardwood with a diameter of 420 mm. The silo was divided into four chambers by two intersect-ing 12.7 mm plywood sheets 12.7 mm thick. Each chamber has a rect-angular shaped outlet covered with 6.35 m plywood of dimensions 70 by 80 m. The walls of the silo are 50 mm thick, and are reinforced with 25.4 mm by 25.4 mm by 362 mm hardwood slanted at an approximate angle of 84º to the horizontal. The walls had pozzolona and linings at a given proportion incorporated to serve as binding agents for the mud particles. The roof which was 40 mm thick and was supported by a plywood frame (6.35 mm plywood).
This frame was made of four 320 by 60 mm-plywood pieces, these are nailed together in a sequence leaving a square of 200 mm by 200 mm in the middle of the frame. The frame was nailed to the plywood demarcation and the precast roof of 380 mm inner diameter and 480 mm outer diameter was placed on it and plastered round. The cover of the silo was round and made of stainless steel which was painted white to prevent heat being absorbed into the silo and also to reduce the thermal
DayAverage temper-ature in silo, ºC
Ambient temper-ature, ºC
Relative humidity,
%
Moisture content, % (wet basis)
White maize Beans Yellow
maize Sorghum
1 32 33 93 -2 32 33 93 14.3 27.3 17.6 27.33 29 32 93 - - - -4 29 32 93 20.0 28.0 23.8 30.85 29 32 93 - - - -6 29 32 93 23.5 28.9 25.0 33.37 27 30 71 - - - -8 26 29 71 16.7 11.2 11.1 20.09 25 29 71 - - - -10 22 25 68 12.5 8.3 10.0 12.011 21 25 67 - - - -12 21 25 65 12.5 7.1 10.0 11.113 21 25 60 - - - -14 21 27 55 12.5 7.1 10.0 11.118 21 27 54 12.5 7.1 10.0 11.125 21 27 54 12.5 7.1 10.0 11.1
Table 1 Ambient temperature, temperature and relative humidityin the silo and the moisture content of the grains stored
ø2
1 – sin ø1 + sin ø[ ]
ø2
wh2
2
wh2
21 – sin ø1 + sin ø

VOL.38 NO.1 2007 AGRICULTURAL MECHANIZATION IN ASIA, AFRICA, AND LATIN AMERICA 37
conductivity of material.
Results and DiscussionAbout 23 g of white maize, 23
g of sorghum, 7 g of yellow maize and 9.30 g of beans were stored in various compartments of the 30 kg capacity silo. Before the grains were stored, their moisture content were determined to know if the products are at or near the safe moisture con-tent before storage. The moisture content (wet basis) of Sorghum, yel-low maize, white maize and beans were 9.09 %, 14.29 %, 12.12 % and 18.80 %, respectively. Table 1 gives the summary of the ambient tem-perature, temperature and relative humidity in the silo, and the mois-ture content (wet basis) of the grains during storage.
It is seen from Fig. 4, that the moisture content of each grain in-creased from the first day until the sixth day, then there was a sharp decrease until the twelfth day when the moisture content became stable. The sharp increase in moisture content until the sixth day was as a result of increased temperature from about 29 ºC to 32 ºC. Tempera-ture increase resulted in a high rate of respiration of the grains during which more oxygen was consumed and carbon dioxide and water were
liberated. The water liberated caused the grains to become wet hence the increase in moisture content. As the temperature decreased from 32 ºC, the moisture content decreased each day until the twelfth day when it reached a temperature of 21 ºC. This was due to the fact that as tem-perature was reduced the respirato-ry activities of grains were reduced to a minimal level. The moisture given off escaped to the atmosphere through diffusion. The moisture content remained constant after the twelfth day at a temperature of 21 ºC because the grains attained a state of hygroscopic equilibrium.
The sharp decrease of silo tem-perature with ambient temperature of the surrounding air indicated little or relatively negligible change due to the fact that mud posses a low thermal conductivity (K) of 0.00120 cal sec cm. This meant that mud conducted heat from the outside to the inside (or vice versa at a very low rate). This attribute enhanced the maintenance of a con-stant or near constant temperature in the mud for some time. The ther-mal conductivity, which is density multiplied by specific heat, was also low. The maintenance of a constant temperature in the silo was due to the fact that there was diffusion or moisture migration (even though the rate was small) from the inside to
the outer environment. Fig. 5 shows that relative hu-
midity was constant from the first day to the sixth day (93 %) then it decreased at a varying rate (73 % to 68 %) until the fourteenth day. From the fourteenth day the relative humidity maintained constant or near constant values (68 % to 65 %). This phenomenon was due to the change in weather. As the experi-ment was being performed, harmat-tan sets in, which accounts for the constant temperature.
Inspection of the grains during the four weeks of storage showed that there was no mouldiness ob-served. Also, no damage on the grain occurred due to insect infec-tion. From the results obtained, the decrease in silo temperature indi-cated the absence of insect activi-ties. This was because stocks with insect activity have unusual heat created within the silo. Mouldiness and insect activities do not thrive in relative humidity values below 75 % (Griffith, 1964). The silo did not re-tain a relative humidity of above 75 % for a long time, hence there was no mould or insect activity observed in the stock.
ConclusionsAn experimental mud silo was
Moisture content, % (w.b.)
0 5 10 15 20 250
5
10
15
20
25
30
35
No. of days
MC (White maize)MC (Beans)MC (Yellow maize)MC (Sorghum)
Fig. 4 Variation of moisture content with days Fig. 5 Variation of relative humidity with a daysRelative humidity, %
0 5 10 15 20 250
10
20
30
40
50
60
70
80
90
100
No. of days

AGRICULTURAL MECHANIZATION IN ASIA, AFRICA, AND LATIN AMERICA 2007 VOL.38 NO.138
designed, constructed and tested for a period of about four weeks. The results obtained revealed the follow-ing:
i. Relative humidity and moisture content of four grain type stored in the silo increased until a tem-perature of 29 ºC was reached then decreased and reached hygroscopic equilibrium at a temperature of 21 ºC.
ii. The temperature outside the mud silo inf luenced the tem-perature inside the silo at a little or relatively negligible rate because of the low thermal con-ductivity.
iii. No development of mould or insect activities was seen in the silo, hence the mud silo stored the grain properly.
iv. The 30 kg capacity silo was in-expensive, the cost of construc-tion being N700 (about $6). An average farmer produces about 200 kg to 350 kg annually. A 500 kg capacity silo was esti-mated to cost only about N6000 ($50).
v. The materials were locally available and could easily be constructed by local farmers. No expertise was required in construction.
REFERENCES
Abdulkarim, L. O. 1988. Investiga-tion of strength and durability of walls built of traditional earth ma-terial. Unpublished B. Eng. Proj-ect Report, University of Ilorin, Nigeria.
Babarinsa, F. A. and S. O. Nwanga. 1989. Modification of Rhumbus to enhance fumigation and increase strength. Unpublished NSPRI pa-per.
Bengtsson, L. P. and J. H. Whitaker. 1987. Farm structures in tropical climate. Food and Agricultural Organization Publications, (FAO) 40: 264-279.
Birewar, B. R. 1989. Existing On-
farm Grain Storage Facilities in Nigeria. Agricultural Mechani-sation in Asia, Africa and Latin America (AMA), Tokyo, 21(2): 58-60.
Ditcher, D. 1981. Improved Mud Brick Silo for storing grains. Jour-nal of Technology for the People. 3 (1):18.
Griffiths, H. J. 1964. Bulk Storage of grains. Commonwealth Scien-tific and Industrial Research Or-ganization Journal. 8 : 10-14.
Igbeka, J. C. 1983. Evaluation of grain storage techniques in Ni-geria, African Journal of Science and Technology, 2(7) : 22-33.
Lambe, T. and R. Whitman. 1976. Soil Mechanics. Oxford Chamber Press, New York.
Lasisi, F. 1995. A tropical small farm storage structure for grains. The Nigerian Agricultural Jour-nal, 12(1): 19-22.
Mijinyawa, Y. 1993. Lecture notes on Design Methodology for grain silo. Depar tment of Agr icul-tural Engineering, University of Ibadan, Nigeria.
The Holy Bible. 1995. Exodus 1:11, 5:16. King James Version. Thom-as Nelson Publishers.
■■

VOL.38 NO.1 2007 AGRICULTURAL MECHANIZATION IN ASIA, AFRICA, AND LATIN AMERICA 39
Current Status, Constraints and Potentiality ofAgricultural Mechanization in Fiji
byM. W. UllahProfessorDepartment of Soil Science andAgricultural Engineering,The University of the South Pacific,Alafua Campus, [email protected]
S. AnadPostgraduate StudentDepartment of Soil Science andAgricultural Engineering,The University of the South Pacific,Alafua Campus, ApiaSAMOA
AbstractThis paper discusses the location,
topography, soil type, climate, pop-ulation, literacy rate and percentage of people engaged in agriculture in Fiji. The paper also briefly touches the farming systems adopted by farmers and crops cultivated in-cluding the main diet of different ethnicities. The current status of agricultural mechanization has been discussed. The constraints and po-tentialities of mechanization have been pointed out. Some of the con-straints of agricultural mechaniza-tion have been identified as current land tenure system, poor economic condition of farmers, small holding size, fragmented holdings, cost of fossil fuel and higher cost of hir-ing tractors. The topography, soil type and sometimes continued bad weather also play a negative role to apply mechanization. To encourage agricultural mechanization the cur-rent land tenure system needs to be addressed as a burning issue. Some suggestions have been put forward to encourage mechanized cultiva-tion in order to increase agricultural production at both subsistence and commercial levels. On the whole, Fiji has a huge potentiality to adopt
agricultural mechanization in farm-ing activities.
IntroductionThe Fiji island group is located
in the South Pacific Ocean between East longitude 174º and 178º and South latitude 15º and 22º lying about 1,800 km to the North of New Zealand. Fiji comprises of 332 islands and islets, scattered over a million square kilometers of ocean of which approximately 110 are in-habited. Fiji has a total land area of 18,272 sq km, 85 percent of which is accounted for by two large islands, Viti Levu and Vanua Levu (Mi-crosoft Corp., 2002). Other major islands include Taveuni, Kadavu, Koro and Ovalau. The maritime claims, measured from archipelago baselines include a continental shelf of 200 m depth or to the depth of exploitation with rectilinear self claim added, an exclusive economic zone of 200 nautical miles and a ter-ritorial sea of 12 nautical miles. The Fiji group does not have any land boundaries and has a total coastline of 1,129 km (Europa, 2000). Fiji has a population of approximately 844,330. The overall population den-
sity is about 46 persons per square kilometer. The ethnic breakup of the population includes 51 percent Fijians, 44 percent Indians and 5 percent others, which comprises Chinese, other Pacific islanders and Europeans having a literacy rate of 93.8 percent for male and 89.3 per-cent for female (CIA, 2000) of the country.
Agriculture is the backbone of the country’s economy, accounting for 17.8 percent of the gross domestic product. For agricultural use it is the flat land and to a lesser extent the undulating and gently hilly ar-eas are of importance. This makes the effective area for agricultural use to about 2,861 sq km of flat land and 2,842 sq km of undulating and gently hilly land. Agriculture is indeed a tough job for the farmers who have not yet practiced agri-cultural mechanization input. The general level of mechanization in Fiji is low. Most of the farmers use draught animals for the production of almost all crops. Animal drawn implements such as mould board plough and spike tooth harrows are employed for land preparation ac-tivities. Some small farms still use the manual system of using hand tools such as forks, spades, bush-

AGRICULTURAL MECHANIZATION IN ASIA, AFRICA, AND LATIN AMERICA 2007 VOL.38 NO.140
knives while some sugarcane grow-ers use tractors and implements for tillage purpose (Lal, 2003). Farm work is generally labour intensive and demands a considerable amount of energy. It is laborious if carried out manually. There is a tendency for people to avoid such physical works thus affecting farming as an enterprise. That is why, from 1879 until 1916 there has been a major migration of workers from India to operate the sugar estates in Fiji. Viti Levu and Vanua Levu are the two main islands of Fiji, which may be termed as agricultural zones. Ag-ricultural mechanization is mainly carried out in the Eastern side of Viti Levu where there is an annual rainfall of over 100 inches during the months of October to March. Also these months are regarded as the hurricane prone months. It ex-periences rainfall below 100 inches from April to September which is dry and cooler months in Fiji. The agricultural areas falling in the Cen-tral Division consists of the three main rivers (Rewa, Navua and Si-gatoka). Majority of root crops and vegetables are grown in this area.
ObjectivesThe specific objectives of this
study may be stated as follows:• To study the current status of
agricultural mechanization of Fiji.
• To identify the constraints of ag-ricultural mechanization.
• To suggest some strategies for adoption to improve the pace of mechanization activities.
TopographyThe larger islands in the Fiji group
are of volcanic origin and are moun-tainous. The elevation extremes in-clude a lowest point of zero m at sea level and the highest peak is mount Tomanivi (1,324 m). These moun-
tainous terrains are incised by many rivers. Rich alluvial soil is found in the river deltas. The smaller islands and islets are characterised by coral reef and limestone. The topogra-phy can be divided into three main classes namely flat, undulating and gentle hilly, and steep mountainous. However, the distribution of land area in different island is shown in Table 1. Apart from the coral atolls which usually have a larger propor-tion of flat land accompanied with many natural constraints like cli-mate and soil condition most other islands have similar proportions of the three land classes. Arable agri-culture is confined to flat to gently rolling areas whereas tree crops, agriculture and animal grazing are extended to relatively steep slopes. Forestry is usually confined to mar-ginal lands of steep topography.
ClimateRainfall
There are five broad geographi-cal regions in Fiji that can be used to describe the climate. These can be classed as wet zone, intermediate zone, dry zone, highland and small outer islands. The main difference among wet, intermediate and dry zones is total annual rainfall. The wet zone receives over 3,000 mm of rainfall annually and have a weak seasonality of distribution. Interme-diate zone receives an annual aver-age of 2,000 to 3,000 mm rainfall with moderate seasonality. The dry zone receives an annual average of less than 2,000 mm of rainfall with a strong seasonal distribution. The highest rainfall occurs in the central
highlands of Viti Levu, Vanua Levu and Taveuni. The highland zones receive an average annual rainfall of over 3,600 mm. The small islands generally receive an average an-nual rainfall of less than 2,000 mm. Both Viti Levu and Vanua Levu display strong characteristics of wet and dry zones. Taveuni and Kadavu also show marked zonal differences in above factors. The intermediate zone can only be distinguished in Viti Levu and extends over a narrow band across the mid-section of the is-land from North East to South West.
The common rainfall pattern for all islands of the Fiji group is a uni-form distribution of rainfall. The rainy season is from November to April and the dry season from May to October. In the wet zone 61 per-cent and in the dry zone 77 percent of the annual rainfall is received in the wet season. The wet zone has an average of 237 rainy days per annum compared to 128 rainy days per an-num in the dry zone. Drought condi-tions are common in the dry zone and usually a prolonged drought of four to six months is common in the dry season.
TemperatureThe country has a relatively mild
temperature a reflection of the oce-anic influence of the climate. The monthly mean maximum tempera-ture never rises above 32 ºC and the monthly mean minimum tempera-ture never drops below 18 ºC at sea level, anywhere in Fiji. There is only a small variation in monthly mean temperatures, usually about 3 to 4 ºC. This variability is slightly higher in the wet zones and the small islands than in the dry zone.
Land classesViti levu Vanua levu Other islands
Area,sq. km % Area,
sq. km % Area,sq. km %
Flat land 1,664 16 831 15 366 15.5Undulating and gentle hilly land 1,768 17 720 13 354 15Steep, mountainous contry 6,968 67 3,989 72 1,640 69.5Total 10,400 100 5,540 100 2,360 100
Table 1 Land terrain distribution (Chandra, 1983)

VOL.38 NO.1 2007 AGRICULTURAL MECHANIZATION IN ASIA, AFRICA, AND LATIN AMERICA 41
The smaller islands, especially the atolls, have more equitable tempera-tures between summer and winter months. The highland temperature is nearly 1 ºC lower for every 100 m rise in altitude.
Humidity and Bright SunshineThe relative humidity is directly
related to rainfall. Ordinarily the highest relative humidity occurs in the wet highlands where it var-ies between 82 to 90 percent. The coastal wet zone areas and the small outer islands follow this closely. The dry zone has lowest levels of relative humidity and also a greater monthly variation between wet and dry seasons, approximately between 66 to 80 percent. Annual bright sunshine ranges from 2,507 hours in the dry zone to 1,883 hours in the wet zone. In the wet zone 46 percent of the sunshine is received in the dry season as against 52 percent in the dry zone.
Type of SoilThe parent material and climate
are the two important factors that determine the nature of soils in Fiji. Other secondary criteria such as
steepness of slope and stoniness of soils have been used to differentiate soil phases within soil types. A clas-sification of the great soil groups based on their parent materials, climate and topographic location is shown in Table 2.
Soil FertilityIn Fiji, some of the fertile alluvial
soils are those of the floodplains of Sigatoka, Rewa, Nadi, Ba, Navua and Labasa r ivers. Most of the agricultural activities are concen-trated on these floodplains. Within these floodplains some of the most productive soils for arable agricul-ture are Sigatoka and Rewa series. Fer t ile hill-soils are those that originate from basic volcanic rocks. Nigrescent soils are a good example and these are found in large areas throughout Viti Levu and Vanua Levu, especially, in the dry zones. Another example is the latosolic soils of Taveuni island which is almost entirely composed of basic volcanic rocks, ash and scoria. Soils in Taveuni are extremely fertile. Humic latosols and ferruginous latosols are hill soils of low fertil-ity and cover vast areas of the wet and dry zones of the main islands respectively. These soils have low
levels of NPK, trace elements such as sulphur and other micronutrients. Ferruginous latosols are particularly deficient in phosphorus and are most difficult hill-soils to manage. Other problem hill-soils are the red-yellow podozolics, which after leaching in the high rainfall regimes of the wet zone over a long period of geologic time, are now in a steady state of low fertility. These soils also require large inputs of fertilizer to obtain even moderate levels of production.
DrainageSwampy conditions exist if the
water table is at or near the surface. Gley soils occur in outermost areas of the floodplains next to the hills and in restricted river valleys. Gley soils are extremely important for some aspects of agriculture such as wetland rice cultivation and grazing of dairy cattle in the wet zone. Some of the agriculturally important gley soils are those of Nausori, Navua and Tokotoko series of the wet zone and Matavelo and Narewa series of the dry zone. Poorly drained soils include the red-yellow podzolic soils where the soil texture is either ex-tremely clayey or there is existence of hardpans and organic soils. Gener-ally, the sandy textured alluvial soils and other hill soils have good drain-age. Saline soils which have sea water drainage problems and are not used for agriculture in unimproved state are sometimes reclaimed for fisheries development activities.
Slopes and ErodibilityGeneral ly, a rable farming is
Soil groups Parent material Climate Topography1. Alluvial River alluvium All regions Floodplains and deltas2. Nigrescent Basic sedimentary and volcanic ash All regions Hills and steep country3. Latosolic Young volcanic ash, scoria and coral limestone All regions Plateaus on atolls and small islands4. Humic latosols Acidic and intermediate volcanic rocks Wet and intermediate zones Hills at steep topography5. Ferruginous latosols Basic and intermediate volcanic ash Dry zone Low hills and old eroded plateaus6. Red-yellow podozoic Acidic volcanic ash Wet zone Hills and eroded terraces7. Grey River alluvium All regions Valley bottoms with impeded drainage8. Organic Peat All regions Swampry, water-logged areas9. Saline Coastal sand All regions Brackish seawater areas
Table 2 Soil type classification of Fiji (Chandra, 1983)
Divisions Total farm area, ha
Total farm population No. of farms Average farm
size, haPopulation per farm
Western 85,528 164,622 30,475 2.81 5.40Central 47,611 85,516 18,699 2.54 4.57Northern 125,032 35,291 11,072 11.072 3.19Eastern 18,962 72,928 6,130 3.09 11.90Total 277,133 358,357 66,376 4.18 5.40
Table 3 Division-wise farm area and farm population (Agricultural Census, 2001)

AGRICULTURAL MECHANIZATION IN ASIA, AFRICA, AND LATIN AMERICA 2007 VOL.38 NO.142
confined to f lat or gently sloping topography and livestock grazing is on steeper hillsides. However, steep slopes with a very thin layer of soil are often cultivated for both com-mercial and subsistence agriculture at a high cost of soil erosion. Under intensive rainfall conditions severe soil loss of cultivated land even on very gentle slope may be caused by sheet and gully erosion. Ferruginous latosols which have weak soil struc-ture are particularly susceptible in this regard. Landslides and slips on steep land are common occurrence in intense rainstorms both in the wet and dry zones.
Farm SizeFarm Area and Farm Population
The total farmed area in the coun-try is just over 277,000 ha which represents a large portion of agri-culturally usable land. The number of people engaged in agriculture is also large which is about 30 percent of the total population. Altogether there are some 66,376 farms con-sisting of 37,975 indigenous Fijians, 25, 280 Indians and 2,581 farms of other races. The form of land tenure mostly dictates the average farm size (Gerard, 1965). Table 3 shows the total farm area and the people in-volved in agriculture division wise.
There are significant numbers of very small-sized farms in Fiji. The distribution of farm sizes by divi-sion is shown in Table 4 (Agricul-tural Census, 2001).
Nearly, 59 percent of all farms are below 0.50 ha and only 3.3 percent are over 20 ha. The Central Divi-
sion has an unusually large number of small farms; nearly 74 percent of all the farms are below 0.50 ha. The Northern Division and the Eastern Divisions have much smaller pro-portions (30 percent and 49 percent respectively) of farms less than 0.50 ha. This may be mainly due to most of the large coconut plantations are located in these divisions.
The land ownership is markedly skewed in Fiji. Although, as much as 40 percent of the farms fall in the 0-0.19 ha category, they account for less than 1 percent of the total farm area. At the other end of the distribution, only 1 percent of all farms are over 50 ha, but they rep-resent nearly 42 percent of the total farm area. Most of the large farms consist of coconut plantations, beef and dairy cattle farms. Sugarcane, entirely commercial, farms repre-sent nearly 26 percent of all farms and are largely operated by Indians. Village farms are those operated entirely by Fijians and are strongly subsistence oriented. Other cat-egories include commercial, semi-subsistence and subsistence farms growing crops like pineapple, taro, cassava, ginger etc. The area oc-cupied by the above three categories of farms are shown in Table 5.
Crops GrownSince many of the areas around
the central division are good for ag-ricultural mechanization, many of the root crops and vegetable crops are commercially grown around this area. History states that this area was first brought under planta-tion during the early years of the development of Fiji. Even the sugar mills were first built around this area (Nausori/Suva). At present, apart from sugarcane, which is also grown in the dry land area of Viti Levu, crops such as banana, taro, pineapple, rice, yams, cocoa, gin-ger and vegetables are commonly grown. Root crops like taro, yams, cassava, alocasia are the main crops grown well throughout Fiji. Rice grows well in the Central Division where agricultural mechanization is mainly carried out. As such there is no single staple food but a variety of staple food in Fiji (Michael and Baxter, 1977, 1980). The experience shows that rice is the staple food for most Indian, Chinese and other races whereas staple food for the Fijians is the native root crops and vegetables. The crops grown under different farming systems are listed below. Seasonal harvest includes yams, ivi, lemons, kavika, guava, wi, jackfruit and turmeric. Regular
Divisions Farm size, ha≤0.19 0.2-0.49 0.5-0.99 1.0-1.99 2-2.99 3.0-4.99 5.0-9.99 10-14.99 15-19.99 20-49.99 ≥50.0
Western 12,770 4,164 2,073 2,152 1,766 4,110 2,265 474 81 452 166Central 10,565 3,232 1,885 1,185 388 477 422 151 22 127 245Northern 2,270 1,094 471 546 750 1,408 2,213 818 598 531 374Eastern 1,221 1,753 1,164 544 186 198 482 127 156 299 -Total 28,826 10,243 5,593 4,427 3,090 6,193 5,382 1,570 875 1,409 785
Table 4 Distribution of farm size by division
Divisions Sugar cane Village OthersNumber Area, ha Number Area, ha Number Area, ha
Western 21,853 63,661 8,187 5,819 8,435 16,048Central - - 8,345 6,592 10,349 41,019Northern 3,133 22,492 5,775 27,952 2,164 74,589Eastern - - 6,048 17,833 82 1,126Total 24,986 86,153 28,355 58,196 21,030 132,782
Table 5 Area occupied by different category of farms (Agricultural Census, 2001)

VOL.38 NO.1 2007 AGRICULTURAL MECHANIZATION IN ASIA, AFRICA, AND LATIN AMERICA 43
harvest of crops is only coconut.
Cropping Systemsi. Mono-cropping ii. Annual cropping: Sugar cane, ir-
rigated riceiii. Perennial: Coconut, cocoa, citrus,
coffee, breadfruit and passion fruitiv. Rotational systems:
• Annual rotation with other crops include wetland rice, dry land rice, pulses, vegetables, maize, sorghum and broomcorn, to-bacco and watermelon etc.
• Long-term rotation with fallows is used for crops like ginger, cassava, taro, yam, sweet po-tato, kava, masi, banana and plantains, and pineapple etc.
Agricultural Machinery Used
The type and the extent of ag-ricultural machinery usage in Fiji is dictated by a number of factors, such as, the scale of operation (sub-sistence, semi-subsistence, small holder or commercial), crops grown,
farm size, topography, weather condition, available finance, access to finance and cost of machines to name a few. In addition, land tenure and the nature of distribution and location of individual farms also inf luence the level of mechaniza-tion. However, there are a number of mechanized operations carried out for commercial, annual as well as perennial crops. However, the num-ber of farms using and owning dif-ferent types of machinery, number of transports used for agricultural purpose and the number of animal drawn implements which portray the current status of agricultural mechanization situation may be sighted from the Tables 6-11 shown below (Agricultural Census, 1991).
Land PreparationLand preparation for most of the
annual crops such as sugar cane, vegetables, cereals and pulses em-ploys mechanized operations de-pending upon the farm size and the scale of operation. Mostly, tractors and tractor drawn mounted imple-ments such as disc ploughs, disc harrows, spike tooth harrows, mould board ploughs, spring tine cultiva-
tors, chisel plough, ripper and drill machines are used for this purpose. For vegetable production, where a much finer soil tilth is required, ro-tovators and rototillers are used. For root crop cultivation such as taro and ginger, on a commercial scale, the above-mentioned machines are used. However, for village level, subsistence and smallholder farms, the land preparation is mainly done by hand tools. In places where new areas have to be cleared, heavy ma-chines such as excavators are used to loosen up the soil and to remove large trees as these machines can be used on fairly sloping land.
Mechan i za t ion se r v ices a re backed by the Ministry of Agricul-ture, Sugar and Land Resettlement through its machinery pool services where farmers can hire tractors and implements for land preparation. In Sigatoka valley, which is the main place for vegetable production, there is a provision for the farmers to hire tractors and implements from the Extension Division of the Ministry’s office based within the valley. This service is also provided in the Rewa Delta. In addition to Governmental services there are about 6,952 pri-vately owned tractors operating in Fiji (Agricultural Census, 1991).
PlantingPlanting for the subsistence sec-
tor is mainly done by hand. This includes vegetables and all other crops. For root crops like taro, the use of spear headed steel pipe or a pitch stick is used to assist in mak-ing holes (Ullah, 1999). The use of machinery is limited due to small ar-
Machinery and equipment type Numberof farms
Number of machinery or equipment owened
Harrows 161 190Milking machines (bale) 30 55Milking machines (herring bone) 400 852Plough 4,444 4,498Rotary tillers 3,676 3,780Tractors 6,419 6,952Other 6,866 7,250
Machinery and equipment type Number of farmsHarrows 3Milking machines (bale) 3Milking machines (herring bone) 88Plough 200Rotary tillers 191Tractors 404Other 624
Machinery and equipment type Number of farms
Number of machinery or
equipment ownedCars and vans 1,579 1,885Farm lorries 2,341 2,484Trailers 41 51Other 8,995 10,587
Table 6 Number of farms and number of poweroperated machinery and equipment owned
Table 7 Number of farm transportsowened by types and farms
Table 8 Number of farms that hired or borrowedpower operated machinery and equipment

AGRICULTURAL MECHANIZATION IN ASIA, AFRICA, AND LATIN AMERICA 2007 VOL.38 NO.144
eas of arable land, and fragmentation due to small individual holdings, especially for land under communal tenure. Planting in the commercial sector differs widely from that of the subsistence sector. Optimum plant density and spacing are closely monitored in the commercial sector. Planting is not restricted to a partic-ular season or time. Mechanization in the commercial sector is limited to certain activities only such as land preparation (clearing and ploughing) while the actual planting is mostly done manually. On commercial farms, involved in cereals and pulses production, the primary sowing of seeds is carried out manually, as most commercial farmers believe that it is more economical to use hu-man labour for such activities. Even for commercial scale rice planting and transplanting, as well as for sugarcane planting, human labour is the main source of power except that the furrows for sugar cane planting are made using oxen or horse with a mould board plough.
Crop ProtectionThe principal methods of control-
ling diseases and insect pests are through proper cultural practices. By tilling the soil properly, either by the use of a plough or with hoes, insect pests, larva and eggs are all made exposed to solar radiation. Working the soil also controls weed growth. Field sanitation, rouging and crop rotation techniques are also practiced for disease control as they reduce the spread of plant diseases. In high rainfall areas, good and ad-equate drainage provisions are made on the fields to avoid the incidence of nematodes and rot diseases. The
time of planting crops, early or late in the season also helps to escape in-cidence of seasonal diseases. For ex-ample, planting after rainy seasons, helps prevent the incidence of fungal diseases such as rots and wilts.
In addition to the above mentioned cultural practices, based on the tra-ditional knowledge of the farmers, the use of chemicals for crop protec-tion is widely adopted to compliment these practices. The agro-chemicals mostly used are selective herbicides, fungicides and insecticides for com-mercial farming which are also gaining popularity at smallholder’s level. The equipment used to apply these chemicals is mainly the lever operated knapsack sprayers or hand sprayers for small scale farming. On commercial farms spraying with selective herbicides using motorized mist blowers is commonly practiced.
Potentiality of Agricul-tural Mechanization
During the 1970’s most farmers in Fiji did not need to learn agricul-ture. This is because the old type of farming system was practiced from generation to generation by watch-ing and helping the parents. In 1980’s agricultural mechanization was introduced in the country and signs, posters and other forms of demon-strations were extended to help the farmers. The country possesses a huge potentiality to adopt selective mechanization rather than sweeping mechanization. The application of mechanization technology would in-crease agricultural productivity since some marginal land might be opened up for farming. Moreover, better per-
formance of the existing farms would result through timeliness of opera-tions and minimization of avoidable losses. Consequently, labour tied up with manual farm operations would be released to higher value activities.
Constraints of Agricul-tural Mechanization
The choice, extent and adoption of mechanization for Fiji’s agriculture have some severe limitations. Some of the constraints are mentioned be-low:
• The most crucial and deciding factor being the economic con-ditions of the farmers. A large number of farms fall under the subsistence and smallholders’ sector with a very low economic turnover. As a result limited cash is reinvested back into farming. For reinvestment mechanization is mostly at the bottom of the priority list.
• The cost of fuel and machinery hiring rate has increased con-siderably over the last few de-cades making it unattractive for the farmers to hire machines.
• Holding size as dictated by the communal form of land ownership, whereby there is a lot of fragmented land owned by small individual holdings, makes mechanization almost impossible. Farming on such land is only restricted to hand-tool technology.
• Topography has also been a limiting factor for the adoption of mechanization. The use of machines for farm operations has largely been confined to flat
Machinery and equipment type Number of farms
Cars and vans 176Farm lorries 116Trailers 3Other 490
Implement Number of farms
Harrow 246Plough 484Scarrifiers 33Other 790
Implement Number of farms
Number of Implements
Harrow 15,649 16,215Plough 27,160 29,713Scarrifiers 996 1,439Other 30,167 35,771
Table 9 Number of farm that hired or borrowed transport equipment
Table 10 Number of farms with numberof animal drawn implements owned
Table 11 Number of farms that hired or borrowed animal drawn implement
VOL.38 NO.1 2007 AGRICULTURAL MECHANIZATION IN ASIA, AFRICA, AND LATIN AMERICA 45
and gently sloping land which account for a small proportion of cropping area as f lat lands have other competing demands. Heavy machines cannot be used on hilly land.
• Soil type also is an impediment to the use of machinery in many areas. For instance, some low ly-ing areas in the Central Division are always waterlogged making mechanization impossible.
• Somet i mes t he preva i l i ng weather condition also restricts the use of machines. Vegetable production requires timely oper-ations. Prolonged rainy weather may pose a serious problem to machinery usage thus affecting timeliness of other activities later in the season.
• The availability and access to farm machines is also a major problem where the Ministry of Agriculture’s tractors are in use. Usually there is a very large farmer to tractor ratio and the commercial farmers are the ones to get priority while small-er farmers have either to wait or are deprived of this service. Sometimes the delay may go up to the middle of the season be-cause of early bookings.
• The shift in cropping systems has also played an important role in the declining machinery use. Moving to agro-forestry and zero tillage, though not very common at present, has reduced the level of mechanization to some extent.
• Expiring agricultural land lease has also caused a decline in machinery use in recent years. Currently, there are a huge num-ber of evicted farmers who are trying to sell their tractors and implements causing a significant drop in machinery use.
ConclusionsOn the whole Fiji has a huge
potentiality to adopt agricultural mechanization for increasing ag-ricultural production. Taking the fragile nature of the island state and the conservation issues in sustain-able farming into consideration adoption of mechanization input to agriculture needs to be selected wisely. The following points are suggested as accelerate the pace of mechanization:
• Hand tool technology can be improved in subsistence sector through procurement of more appropriate hand tools and de-veloping research for such tools.
• Draught animal technology can be applied to cultivate crops which at present are entirely de-pendent on hand tool technolo-gy. Land preparation by digging with forks, spades and sticks can be replaced by draught animals using a mould board plough or a harrow (Smith, 1994).
• Mechanical power technology can be further improved by pro-curement of more appropriate machines by the government and renting out to farmers. This would open new areas for agri-culture and maintain timeliness of field operations.
• Marginal land currently under no form of use may be reclaimed by using right type of machin-ery.
• Making appropriate and reason-ably priced machines avail-able, preferably of local origin, with adequate arrangements for maintenance facilities and spares.
• Improved land tenure system will make mechanization more attractive to farmers.
• Government may provide incen-tive to the interested farmers, such as, exemption of import duty on equipments, power units etc, so that they feel en-couraged to import appropri-ate agricultural machinery for mechanization purpose.
• Adoption of machinery opera-
tions into agriculture will help reduce total reliance on labour during peak time when the de-mand is the highest.
REFERENCES
Chandra, S. 1983. Agricultural Development in Fiji Australian Universities International De-velopment Program, Australian Vice-Chancellors Committee, Canberra.
CIA. 2002. World Fact Book Files-Fiji. http://www.cia.org/country
Eu ropa Publ icat ions Limited , (2000). The Europa. World Year Book (vol. 1). The Gresham Press, Old Working, Surrey, p 1407-1414.
F.A.O. 2000. Food and Agricultural Organisation Year Book (54), F.A.O publication.
Gerard, R. W. 1965. Land use and population in Fiji, University Col-lege London.
Lal, B. 2003. Making it easier with mechanization. IRETA’s South Pacific Agricultural News. July.
MASLR. 2001. Fiji Agricultural Census Report. Ministry of Ag-riculture, Sugar, and Land Reset-tlemnt.
Microsoft Corporation. 2002. Mi-crosoft Encarta Encyclopedia-Fiji.
Michael, W. and P. Baxter. 1977. Food in Fiji, University of the South Pacific, Suva, Fiji.
Michael, W. and P. Baxter. 1980. Food in Fiji, (The produce and processed foods distribution sys-tems, University of the South Pa-cific, Suva, Fiji.
Smith, D. W. 1994. Testing and evaluation of agricultural ma-chinery and equipment, Food and agriculture organization of the United Nations, Rome.
Ullah, M. W. 1999. Present Status and Future prospects of Agricul-tural Mechanization in the South Pacific. Journal of South Pacific Agriculture, 6(2), p 62-70.
■■

AGRICULTURAL MECHANIZATION IN ASIA, AFRICA, AND LATIN AMERICA 2007 VOL.38 NO.146
Performance of some Pneumatic Tires Used inCamel Carts on Sandy Terrain
byGhanshyam TiwariProfessorDepartment of Farm Machinery andPower Engineering,College of Technology and Engineering,Udaipur - 313 001, [email protected]
K. P. PandeyDepartment of Food andAgricultural Engineering,Insian Institute of Technology,Kharagpur - 721 302, West BengalINDIA
Ajay Kumar SharmaProfessorDepartment of Farm Machinery andPower Engineering,College of Technology and Engineering,Udaipur - 313 001, RajasthanINDIA
AbstractFour ADV tires (5.00-19, 6.00-19,
7.00-19 and 8.00-19) and one trailer tire (7.50-19), commonly used in camel carts in Rajasthan, India were evaluated under controlled soil bin conditions in sand at different levels of inf lation pressure, normal load and soil compaction. Among the tested tires 7.00-19 tire performed better, however its use in camel car ts may not be recommended beyond the payload of 600 daN on single wheel within the inf lation pressure and soil compaction range of 172.5 to 379.5 kPa and 3.4 to 4.5 MPa/m respectively. The developed second order regression model pre-dicts the rolling resistance fairly well within the tested range of vari-ous parameters.
IntroductionAnimal energy is the principle
source of motive power in Indian farming. Animal drawn ploughs and vehicles are an important part of Indian scene and are several gen-erations older than its oldest tree. Animal power is used for various farming operations such as plough-ing, sowing, interculture, threshing, water lifting etc. During the last two decades the growth of mechaniza-tion in Indian agriculture has been has comparatively rapid. Still the draught animals continue to be the predominant source of renewable energy for traction and rural trans-port.
The western part of India is fa-mous for “Thar Desert” with Ra-jasthan comprising its major portion (259,000 km2). The camel is a high-ly suitable animal for desert or arid
zones because of its unique qualities of withstanding drought conditions and living for days together without water. There are 1.3 million camels out of total population of 84 million work animals in the country, which is about 7 percent of the global camel population. Rajasthan has the maximum number of camels and accounts for about 60 percent of the total population of India.
The camels are used not only as draught animal for various farm operations but also as a source of power for haulage of goods, water and passengers in desert areas of the state. Goods are transported on the back of camels as well as the carts pulled by them. The camel cart is a main source of transport in villages in the desert area of Rajasthan. The carts are extensively used for passenger transport as well as for hauling all sorts of cargoes, i.e. such

VOL.38 NO.1 2007 AGRICULTURAL MECHANIZATION IN ASIA, AFRICA, AND LATIN AMERICA 47
as farm produce, water tank and building material. A single camel is used to provide draught power to desert carts fitted with two or four pneumatic wheels (Fig. 1). Animal drawn vehicle (ADV) tires, which are commonly used in these carts were considered in the study. A similar size tire used on trailers was also studied along with ADV tires.
The performance characteristics of a towed wheel are usually de-scribed by towing force, i.e. rolling resistance, sinkage and skid. The rolling resistance is the most im-portant performance parameter of the towed pneumatic wheel, which is influenced by tire design, system parameters and terrain character-istics. The present study deals with the behavior of the towed pneumatic wheels on sandy terrain.
Material and MethodsDifferent sizes of pneumatic
wheels (Table 1) which are used in camel carts were selected for evaluating their performance (Fig. 2). The tire design parameters such as diameter, section width, section height, inf lation pressure, carcass construction and load def lection relationship and system parameters such as normal load, speed and ter-rain characteristics play a vital role on performance of pneumatic towed wheels. Considering the findings of various researchers (Singh and Verma, 1987; Jain, 1987; Shrimali, 1990, ILO, 1986; Verma, 1991) a study was conducted for perfor-mance evaluation of different ADV and a trailer tire in sandy terrain (Table 2). The range of various pa-
rameters were selected taking into consideration the normal values observed in the field except the in-flation pressure which reflects the maximum and minimum range as recommended by the manufacturer.
Experimental TechniquesA single tire test carriage with a
four parallel bar linkage system was developed to test the tires. Experi-ments were conducted in the indoor soil bin in sand to evaluate the per-formance of tires at different normal loads, inf lation pressures and soil compaction levels (Figs. 3 and 4).
Test ProcedureBefore each test, the soil bed was
processed using the soil processing trolley. A hand operated standard soil cone penetrometer was used to measure the cone index of the soil at five different places in the depth range of 0-150 mm. The soil processing was repeated if large variation in compaction level was observed. From the recorded obser-vations, the cone index gradient was calculated by using the expression:
G = ........(1)
whereG = cone index gradient, MPa/m;CIav = average cone index, MPa
andCIsurf = cone index at surface, Mpa.The towing trolley attached with
tire test carriage was coupled with the soil processing trolley through a ring transducer (Fig. 3) to record the towing force, i.e. rolling resistance. Replicated tests were conducted at a forward speed of 3.1 km/h to
Fig. 1 Two wheeled camel cart
Fig. 2 Test tires
CIav – CIsurf1/2 x depth of interest

AGRICULTURAL MECHANIZATION IN ASIA, AFRICA, AND LATIN AMERICA 2007 VOL.38 NO.148
cover a length of 5.5 m in the soil bin using factorial RBD and rolling resistance was recorded using a 2 channel dynograph recorder.
Results and DiscussionThe performance of four ADV
tires and one trailer tire was evalu-ated in sand based on their deflec-tion characteristics the tires TA1 and TA2 were tested at 200, 400 and 600 daN normal loads while the tires TA3, TA4 and TT5 were tested at five normal loads (200, 400, 600, 800 and 1000 daN). Figure 5 shows the typical curves of variation in rolling resistance of ADV and trailer tires at different normal loads, inflation pressures at a given soil compaction level.
Effect of Normal Load on Rolling Resistance
The trends of the curves (Fig. 5) indicate that the rolling resistance increased with the increase in nor-mal load at all inf lation pressures and soil compaction levels for all tires. The results confirm the find-ings of McAllister et al. (1981). Less rolling resistance at low normal loads can be attributed to sufficient soil strength to support the wheel with insignif icant sinkage. The wheels have neither to overcome the
resistance offered by the surface in compacting it nor shearing it. The force due to adhesion is the only factor, and hence the rolling resis-tance is reduced to a large extent.
Effect of Inflation Pressure on Rolling Resistance
In general the rolling resistance of all the tires increased with infla-tion pressure at all the normal loads and soil compaction levels studied (Fig. 5). The rolling resistance was minimum at an inflation pressure of 172.5 kPa and it increased rapidly with increase in inflation pressure up to 310.5 kPa. Further increase in inflation pressure did not show ed little difference in the rolling resis-tance. Similar trends were also ob-served by Mckibben (1940), Janosi (1961), McAllister (1979), Wong et al. (1984) and Verma and Singh (1994). The increase in rolling resis-tance may be explained as follows:
1. The tire stiffness increases with inf lation pressure due to which tire does not deform sig-nificantly and it works as a rigid wheel beyond a certain inflation pressure. The resistance in such case depends only on load.
2. At lower inflation pressure the tire deforms rather than sinks, thus yielding less resistance and more ground contact area than a tire with higher inflation pres-
sure.
Effect of Terrain Condition on Rolling Resistance
It was observed that with increase in compaction level of sand, the variation in rolling resistance of the tire was much less. The data also indicated that the increase in compaction level of soil from 3.4 to 4.0 MPa/m did not affect the rolling resistance of tires significantly at all normal loads and inflation pres-sures. This may be due to insignifi-cant variation in supporting strength of soil with change in compaction level within this range.
Effect of Tire Size on Rolling Re-sistance
It is interesting to note that in general rolling resistance decreased with increase in the size of tire. This is in conformity with the findings of Mckibben et al. (1940) which states that the contact area of the tire effects the rolling resistance significantly. Out of five tires tested the tire TA1 indicated the maximum rolling resistance at all loads, infla-tion pressures and soil compaction levels. This may be attributed to its narrow area of supporting con-tact surface due to which the tire failed to hold enough volume of soil under compression resulting in in-creased sinkage and thereby rolling resistance. At lower normal loads (200-400 daN), the minimum roll-ing resistance was indicated by the tire TA4 (15-70 daN) while at higher loads of 600-1000 daN, it was indi-cated by tire TA3 (45-130 daN) in the range of inflation pressures and
Fig. 3 Schematic diagram of experimental set-up
Fig. 4 Experimental set-up

VOL.38 NO.1 2007 AGRICULTURAL MECHANIZATION IN ASIA, AFRICA, AND LATIN AMERICA 49
soil compaction studied.It can be seen from Table 1 that
the tires TA2 and TT5 have almost the same diameter but their width differs significantly. Comparing the perfor-mance of these tires, it was observed that the rolling resistance of tire TT5 was lower than that of tire TA2 under different loads and inflation pres-sures. This may be due to greater width of tire TT5, which helped in decreasing the wheel sinkage and thereby the rolling resistance. This behaviour is in close agreement with the findings of Bekker (1956) and McAllister et al. (1981).
Comparing the performance of tires TA3, TA4, and TT5, it is noticed that, though the width of the tires is almost the same, but their diameters differ significantly. The large di-ameters of TA3 and TA4 resulted in decreasing the rolling resistance of these tires as compared to TT5. Sim-ilar trends were also observed by Mckibben (1940), Turnage (1972), McAllister et al. (1981) and McAl-lister (1983). The decrease in rolling resistance with wheel diameter may
be explained on the basis of the fact that at large wheel diameters the ground pressure is relatively low which helps in reducing the roll-ing resistance due to failure of soil mainly in compression.
Comparative study of tires indi-cated that the overall performance of TA3 was better than that of the other four tires. The minimum and maximum values of rolling resis-tance were in the range of 16-69 daN and 21-130 daN respectively for the test parameters used in the study. The results indicated that the upper range of the minimum rolling resistance of the tire TA3 is 68 daN, which is beyond the draft capac-ity of a single camel (80-100 daN) is generally employed to pull a two wheeled cart. The maximum load-ing capacity for TA3 is therefore, recommended to be less than 600 daN in sandy terrain.
Modeling the ResultsAn empirical model was devel-
oped for prediction of rolling resis-tance of various tires tested in the study. Utilizing the experimental data, a multiple regression analysis was carried out to investigate the combined effect of inf lation pres-sure (Pi), normal laod (W), soil compaction (G) and tire b/D ratio on rolling resistance (R). The fol-lowing second-degree polynomial equation was found to estimate the rolling resistance.
R = 403.64 + 0.265Pi + 0.171W – 4026.9(b/D) – 0.00057Pi
2 – 0.0001W2 + 8532.2(b/D)2 + 0.00024PiW + 0.347Pi(b/D) ....................................(2)
(R2 = 0.95, F = 641.20** )The high value of coeff icient
of determination indicate that the observed data could be accurately predicted by the proposed model.
Optimization of Tire Design and Soil Parameters
Using the multiple regression equation the tire design and soil parameters were optimized for mini-mum rolling resistance. A computer programme based on search tech-nique was used for optimization of independent parameters and results are presented in Table 3.
It is noticed from the Table 3 that the optimum b/D ratio for ADV tire is 0.232, which corresponds to a tire size 7.00-19.
Conclusions1. The overall performance of the
tire 5.00-19 and 6.00-19 was in-ferior to that of the tires 7.00-19, 8.00-19 and 7.00-16. The poor performance of 5.00-19 and 6.00-19 tires indicated their un-suitability in sandy terrain.
2. The minimum rolling resis-tance was indicated by the tire 7.00-19. However, its use in camel carts may not be recom-mended beyond the payload capacity of 600 daN on a single wheel.
Optimum values of independent parameters Rolling resistance, daNb/D Pi, kPa G, MPa/m
0.232 172.5 3.4 82.35
Table 3 Optimum values of tire design and soil parameters
Variables Levels ValuesIndependant variablesTire size 5 5.00-19, 6.00-19, 7.00-19, 8.00-19, 7.50-16Inflation pressure, kPa 4 172.5, 241.5, 310.5, 379.5Normal load, daN 5 200, 400, 600, 800, 1000Soil compaction, MPa/m 3 3.4, 4.0, 4.5Forward speed, km/h 1 3.1 km/h
Dependent variableRolling resistance, daN -
Sl. No.
Type of tire Tire code Tire size Diameter
(D), mmSection
width (b), mm
Section height
(h), mmb/D
1 ADV TA1 5.00-19, 4PR 745 130 115 0.1742 ADV TA2 6.00-19, 8PR 790 160 125 0.2023 ADV TA3 7.00-19, 10PR 850 200 160 0.2354 ADV TA4 8.00-19, 10PR 890 220 190 0.2475 Trailer TT5 7.50-16, 10PR 795 210 175 0.264
Table 2 Various parameters considered in the study
Table 1 Specifications of tires used in the study

AGRICULTURAL MECHANIZATION IN ASIA, AFRICA, AND LATIN AMERICA 2007 VOL.38 NO.150
REFERENCES
Bekker, M. G. 1956. Theory of land locomotion. Ann.Arbor, M.I.: University of Michigan press.
International Labour Organisation. 1986. The design and manufac-ture of animal drawn carts. Inter-mediate Technology Publication, London.
Jain, A. K. 1987. Testing of camel carts of Rajathan. Unpublished M.E. thesis, Rajasthan Agricul-tural University, Bikaner, Rajast-han, India.
Janosi, Z. 1961. An analysis of pneumatic tire performance on deformable soils. Proc. of the 1st Int. Conf. On mechanics of soil vehicle systems. Edizioniminerva
Tecnica, Tormo: 737-771.McAllister, M. 1983. Reduction in
the rolling resistance of tires for trailed agricultural machinery. J. Agric. Engng. Res. 28:127-137.
McAllister, M., D. Gee-Clough, and D. W. Evernden. 1981. An inves-tigation into the rolling resistance of undriven wheels. Dept.note DN/1075, NIAE, Silsoe.
McAllister, M., D. Gee-Clough, and D. W. Evernden. 1979. Prelimi-nary results obtained from an in-vestigation into rolling resistance of towed wheels. Dept. note DN/ T/917/01002, NIAE, Silsoe.
Mckibben, E. G. and J. B. Davidson. 1940. Effect of inflation pressure on the rolling resistance of pneu-matic implement tires. Agricul-
tural Engineering 21(1): 25-26.Mckibben, E. G. and J. B. Davidson.
1940. Effect of outside and cross-sectional diameter on the rolling resistance of pneumatic imple-ment tires. Agricultural Engineer-ing, 21(1): 57-58.
Shrimali, H. 1990. Testing of two wheeled camel car ts used in desert tracts of Rajasthan. Un-published M. E. thesis, Rajasthan Agricultural University, Bikaner, Rajasthan, India.
Singh, P. and R. N. Verma. 1987. Survey of carts used in desert tract of Rajasthan. Paper pre-sented in 23rd annual convention of ISAE, Jabalpur, India.
Turnage, G. W. 1972. Tire selection and performance prediction for off-road wheeled vehicle opera-tions. Proc. of the 4th Int. Conf. of the ISTVS, Stockholm, Vol. 1: 61-82.
Verma, A. 1991. Comparative per-formance study of different types of pneumatic wheels for two wheel camel carts. Unpublished M.E. thesis, Rajasthan Agricul-tural University, Bikaner, Rajast-han, India.
Verma, A. K. and P. Singh. 1994. Effect of inf lation pressure and payload and draught requirement of two wheeled camel carts on sandy terrain. J. of the Institution of Engineers (India), 75: 34-37.
Wong, Z. and A. R. Reece. 1984. The performance of free rolling rigid and flexible wheels on sand. J. Terramechanics 21(4): 347-360.
■■
Fig. 5 Performance of test tires at different nomal loads andinflation pressures in sand at compaction level 3.4 MPa/m

VOL.38 NO.1 2007 AGRICULTURAL MECHANIZATION IN ASIA, AFRICA, AND LATIN AMERICA 51
Feasibility of Collecting Ambient Air Moisture byForced Condensation
byHamid Al-JalilAssociate ProfessorDepartment of Biosystems Engineeringand College Engineering,Jordan University of Science and Technology,P.O. Box 3030, Irbid [email protected]
Mohamad Al-WidyanAssociate ProfessorDepartment of Biosystems Engineeringand College Engineering,Jordan University of Science and Technology,P.O. Box 3030, Irbid [email protected]
Jumah AmayrehDepartment of Biosystems Engineeringand College Engineering,Jordan University of Science and Technology,P.O. Box 3030, Irbid [email protected]
AbstractThis work investigated the feasi-
bility of collecting ambient air mois-ture. A dehumidifying unit of 215 watts was used to condense and col-lect moisture. A rain gage recorded the collected moisture. Dry bulb temperature and relative humidity (RH) were recorded plus the instan-taneous voltage and current. A data logger recorded data on an hourly basis. There was positive correlation between ambient RH and moisture collection rate. Up to 137.2 ml of water/hr were collected with effi-ciency of 0.822 liters/kW hr at 14.0 ºC and RH of 87.4 % resulting in a
Acknowledgements: Apprecia-tion is due to Jordan University of Science and Technology, Irbid-Jordan for their financial support through project No. 74/2000.
cost that compares favorably with the local rate of bottled water.
IntroductionJordan lacks credible readily
available water resources. In addi-tion, most of the country lies in a semi-arid to arid region where the annual average rainfall is below 200 to 250 mm. In the last few decades, substantial increase in the country’s population, rising living standards, and expanding industry and irrigat-ed-agriculture resulted in drastic increases on water demand. Further, it is established that water resources available in the region will witness serious competition among differ-ent nations. Based on the discussion above, making any additional water resources available is of extreme importance.
Water may be made available by different means including rational use, reuse of treated wastewater, or creating new resources. The signifi-cance of this research is to create a potentially new water resource by collecting ambient air moisture. The quality and quantity (availability) of this source are, respectively, good
Fig. 1 Moisture recovery system

AGRICULTURAL MECHANIZATION IN ASIA, AFRICA, AND LATIN AMERICA 2007 VOL.38 NO.152
and at least theoretically unlimited. This approach may be particularly invaluable for water collection in remote areas where providing water utilities is too expensive.
Various forms of water harvesting have been practiced for thousands of years in areas where rainfall is the only source of water supply. Today, water harvesting is still practiced in many developing countries as a way of supplementing the normal water supply. Some methods of wa-ter interception in common practice include the use of roofs, courtyards and ground catchments (Abu-Zreig, 1999). In arid and semi-arid areas where rivers and lakes are few and scarce, much experimentation has been done on the collection of fog
and dew to supplement water sup-ply. Plastic meshes were used for collecting water from fog and mist. For example, in the village of Chun-gongo in Chili, which lies in an arid area, the earliest fog and mist collection systems provided 11,000 liters of good-quality water from its numerous collectors. Similar sys-tems have been successful in other regions in Ecuador, Peru, Oman, and the Canary Islands (Cutlip, 1997). Dew collectors may be as simple as wooden planks or a pile of stones supported above the ground or they may be made of newly-developed materials with enhanced properties such as polymer foils. Even the simplest dew collector can gather up to 0.4 liters per square
meter per night (Nikolayev et al., 1996; Nilson, 1996; UNEP, 1979).
The literature searched indicated that all collection techniques have relied on the natural condensation of fog or mist from the ambient air. However, forced condensation of dew or mist for the purpose of water collection was not tested by existing systems. Consequently, this research effort was initiated with the goal of examining the feasibility of collect-ing ambient air moisture by forced means. In specific terms, this work involved investigating the moisture collection process in terms of quan-tity, the influence of major psychro-metric parameters on the process, and comparing the costs with the local average rates of water supply.
0
20
40
60
80
100
120
140 Relative humidity
Temperature
Moisture
24222018161412108642
Time, hr
Moisture, ml/hrTemperature, ºCRelative humidity, %
0
20
40
60
80
100
120
140 Relative humidity
Temperature
Moisture
24222018161412108642
Time, hr
Moisture, ml/hrTemperature, ºCRelative humidity, %
Fig. 4 Temporal variation of moisture collectedwith humidity and temperature (day 3)
Fig. 5 Temporal variation of moisture collectedwith humidity and temperature (day 4)
0
10
20
30
40
50
60
70
80
90
100 Relative humidity
Temperature
Moisture
24222018161412108642
Time, hr
Moisture, ml/hrTemperature, ºCRelative humidity, %
0
20
40
60
80
100
120
140 Relative humidity
Temperature
Moisture
24222018161412108642
Time, hr
Moisture, ml/hrTemperature, ºCRelative humidity, %
Fig. 2 Temporal variation of moisture collectedwith humidity and temperature (day 1)
Fig. 3 Temporal variation of moisture collectedwith humidity and temperature (day 2)

VOL.38 NO.1 2007 AGRICULTURAL MECHANIZATION IN ASIA, AFRICA, AND LATIN AMERICA 53
Experimental ProcedureAmbient air moisture was col-
lected by forced condensation. The system was installed in an open area on J.U.S.T campus, which is among the driest regions in Northern Jor-dan. Thus, if the system works in this location, it is expected to be much more promising in many other regions in the country where air is more humid. A small dehumidifying unit of 215 watts was used to provide a cold surface below the dew point under prevailing ambient conditions.
The unit was equipped with a humidstat and a two-speed air fan. The humidistat controled the opera-tion and shutting down of the unit at prescribed levels of air moisture content (relative humidity). The air fan passed the ambient air over the cold surface and the moisture in contact with this surface would condense and then be collected. Specially designed wooden housing was used to protect the unit from the environment. The housing and the unit were mounted on a 1-meter high steel frame as shown in Fig. 1.
A small tank located under the cold surface was used to collect the condensed water. The amount of collected water was detected using a rain gage (Model TR-525M) at-tached to the steel frame underneath the unit. A rubber hose was used to conduct the collected water from the tank to the rain gage by gravity.
The ambient relative humidity and dry bulb temperature were also re-corded using Vaisala probe (Model HMP35C) mounted at 1.5 m height. The instantaneous voltage and cur-rent were detected using a specially designed electrical circuit. The total energy consumption was measured by a power meter. The system was run for a total of 96 hours in such a way that they represented the typi-cal range of seasonal variations in the local weather conditions. The dry bulb temperature ranged from 7.7 ºC up to 25.7 ºC while the rela-tive humidity ranged from 24.5 % to 94.9 %.
A d a t a logge r ( Model 21X, Cambell Scientific,Inc.) was pro-grammed to record the sensed signals on an hourly basis. The recorded data were processed and analyzed by the computer using Ex-cell software to determine the effect of relative humidity, temperature and other relevant variables on the rate of water collection.
As the moisture collection in this work was by forced means, it was elected to express the feasibility of the collection process by a collec-tion efficiency term defined as the amount of water collected in liters per unit energy consumed in kW hr.
Results and DiscussionThe results of this study are re-
ported in Figs. 2 through 9. In all figures, the horizontal axis repre-sents a 24-hour time span starting midnight to midnight next day. The general trends of temperature and relative humidity in the figures are attributed to day and night varia-tions. Figs. 2, 3, 4 and 5 show the effect of dry bulb temperature and relative humidity of ambient air on moisture collection. In general, there was a close correlation be-tween the relative humidity and the rate of moisture collection. As expected, the higher the ambient relative humidity the higher the rate of moisture collection. It was found that an amount of up to 137.2 ml of water could be collected in one hour at average ambient temperature of 14.0 ºC and relative humidity of 84.4 %. The efficiency of collection expressed in liters of water per kW per hour was calculated to be 0.822 under these conditions.
The temperature at a given rela-tive humidity was observed to have a positive influence on the rate of moisture collection, specifically, the higher the temperature the higher the rate of moisture collection. This is attributed to the fact that for the same relative humidity, the absolute amount of moisture in air is higher at a higher temperature than at a lower one.
Figures 6 through 9 show the corresponding accumulated mois-ture collection. The slope of these
0
10
20
30
40
50
60
70
80
90
100 Moisture
24222018161412108642
Time, hr
R.H.A.M.
0
100
200
300
400
500
600
700
800
900
1000 AM
Rel
ativ
e hu
mid
ity, %
Acc
umul
ated
moi
stur
e, m
l
Fig. 6 Temporal variation of accumulatedmoisture with humidity (day 1)
0
10
20
30
40
50
60
70
80
90
100 Moisture
24222018161412108642
Time, hr
R.H.A.M.
0
100
200
300
400
500
600
700
800
900
1000
1100 AM
Rel
ativ
e hu
mid
ity, %
Acc
umul
ated
moi
stur
e, m
l
Fig. 7 Temporal variation of accumulatedmoisture with humidity (day 2)

AGRICULTURAL MECHANIZATION IN ASIA, AFRICA, AND LATIN AMERICA 2007 VOL.38 NO.154
curves represent the rate of moisture collection in ml/hr. These curves confirm that the rate of moisture collection increased as the relative humidity increased. The trends reported in all cases except for the humid day (day 3) indicated that, in general, the rate of moisture collec-tion in daytime especially at noon was almost leveled indicating a very poor collection rate. Specifically, during all test runs, the unit failed to condense air moisture below 24 % relative humidity. This may be due to the fact that under low humidity ratio conditions, the dew point gets significantly lower beyond the cool-ing capacity of the unit.
The data indicated that the current and voltage signals showed very little variation during the test, which implies that the power consumption was steady during the test and was independent of ambient conditions and collection rates. The total en-ergy consumed during the test was about 16.0 kW hr.
The feasibility of moisture col-lection process in this work was evaluated by estimating the cost per unit water volume collected. The data indicated that based on power consumption, the cost under aver-age weather conditions was about $0.123 per liter while under favor-able conditions the cost was about $0.06 per liter. These figures com-pare favorably with local common rates of good quality bottled drink-
ing water, which range from $0.35 to $0.49 per liter.
ConclusionsThe following conclusions may be
drawn from the results of this study.1. The collection process was very
efficient under higher levels of relative humidity and the mois-ture collected over time fol-lowed the same trend as that of the relative humidity.
2. The system collected up to 137.2 ml of water in one hour at an average ambient temperature of 14.0 ºC and relative humid-ity of 84.4 %. The efficiency of collection was found to be 0.822 liters/kW.hr under these condi-tions.
3. For the same relative humid-ity, the system collected more moisture at higher tempera-tures compared to lower ones ref lecting a positive influence of higher temperatures at any given relative humidity.
4. The unit failed to condense moisture below 24 % relative humidity during the test period.
5. Under the prevailing local con-ditions, the system was much more efficient at night compared to daytime.
6. Power consumption was steady throughout the test and was independent of ambient condi-
tions and the cost of a unit water volume collected by the system compares very favorably with local cost of bottled drinking water.
REFERENCES
Abu-Zreig, M. 1999. Water har-vesting techniques to increase agricultural sustainability on arid regions. SDR International Conference, Nov. 20-22, Al-Ain, UAE.
Cutlip, K. L. 1997. Fog on tap. Weatherwise Vol. 50, Issue 2 p 8. Heldref Publications.
Nikolayev, V. S., D. Beysens, A. Giodo, and K. Milimouk. 1996. Water recovery from dew. Journal of Hydrology Vol. 182: 19-35.
Nilson, T. 1996. Initial experiments on dew collection in Sweden and Tanzania. Solar Energy Materials and Solar Cells Vol. 40(1): 23-32, March, 1996.
United Nations Environment Pro-grams. 1979. Rain and Storm Water Harvesting for Additional Water Supply in Rural Areas. Ex-pert Group Meeting, Nairobi.
■■
0
10
20
30
40
50
60
70
80
90
100 Moisture
24222018161412108642
Time, hr
R.H.A.M.
0
500
1000
1500
2000
2500
3000 AM
Rel
ativ
e hu
mid
ity, %
Acc
umul
ated
moi
stur
e, m
l
Fig. 8 Temporal variation of accumulatedmoisture with humidity (day 3)
0
10
20
30
40
50
60
70
80
90
100 Moisture
24222018161412108642
Time, hr
R.H.A.M.
0
250
500
750
1000
1250
1500
1750
2000 AM
Rel
ativ
e hu
mid
ity, %
Acc
umul
ated
moi
stur
e, m
l
Fig. 9 Temporal variation of accumulatedmoisture with humidity (day 4)

VOL.38 NO.1 2007 AGRICULTURAL MECHANIZATION IN ASIA, AFRICA, AND LATIN AMERICA 55
Energy Cost of Riding and Walking Type PowerTillers
byBinisamPh. D. ScholarAgricultural Engineering Collegeand Research Institute,Tamil Nadu Agricultural University,Coimbatore - 641 003INDIA
R. ManianDeanAgricultural Engineering Collegeand Research Institute,Tamil Nadu Agricultural University,Coimbatore - 641 003INDIA
K. KathirvelProfessor and HeadAgricultural Engineering Collegeand Research Institute,Tamil Nadu Agricultural University,Coimbatore - 641 003INDIA
T. SenthikumarPh. D. ScholarAgricultural Engineering Collegeand Research Institute,Tamil Nadu Agricultural University,Coimbatore - 641 003INDIA
AbstractThe ergonomic aspects of the
power tiller are of great importance as working with thepower tiller in-volves considerable physiological strain to the operator. The physio-logical response of the subject while operating two power tillers with one as walking type (7.46 kW) and the other as riding type (8.95 kW) was investigated. The selected opera-tions included rotary tilling in un-tilled and tilled fields and transport on farm and bitumen roads. The se-lected levels of forward speed of op-eration were 1.5, 1.8, 2.1, 2.4 km h-1 and 3.5, 4.0, 4.5, 5.0 km h-1 for field and transport operations respec-tively. Three subjects were selected based on the age and weight and screened for normal health through medical investigations. The physio-
logical cost of power tiller operation was computed and the energy cost of work was graded. The oxygen uptake in terms of VO2 max was compared with acceptable workload and the work pulse was compared with limit of continuous perfor-mance. For rototilling in an untilled field the energy cost of work varied from 17.13 to 20.09 kJ min-1 for the walking type (7.46 kW) power tiller and 13.95 to 15.43 kJ min-1 for rid-ing type (8.95 kW) power tiller. In thetilled field the values varied from 15.70 to 18.23 kJ min-1 and 13.28 to 14.59 kJ min-1, respectively. The operations were generally graded as “moderate work”. The rototill-ing operation in an untilled field was strenuous as it demanded 9.1 to 10.20 percent and 1 to 6 percent more energy for walking type (7.46 kW) and riding type power tillers
(8.95 kW), respectively than in a tilled field. Power tiller with seating attachment resulted in saving of 23 to 30 percent and 18 to 25 percent human energy requirement in un-tilled and tilled fields, respectively. In transport mode the energy cost of work varied from 10.17 to 11.12 kJ min-1 and 11.32 to 12.82 kJ min-1 with 7.46 kW and 8.95 kW power tillers, respectively. The opera-tion was generally graded as “light work” to “moderate work”. When compared to the 8.95 kW power til-ler, the 7.46 kW power tiller resulted in savings of human energy require-ment of 15.33 to 16.23 percent on farm roads and 4.9 to 11.3 percent on bitumen road. For field operation with the walking type power tiller, the oxygen uptake interms of the olxgen consumption rate (VO2) max varied from 35.30 to 43.93 percent

AGRICULTURAL MECHANIZATION IN ASIA, AFRICA, AND LATIN AMERICA 2007 VOL.38 NO.156
which was above the acceptable work load whereas the values varied from 29.04 to 33.74 percent for the riding type (8.95 kW) power til-ler and was within the acceptable workload. During transport mode, oxygen uptake in terms of VO2 max varied from 22.24 to 28.03 percent and the values were within the ac-ceptable limit for both power tillers. The work pulse (∆ HR) varied from 21.08 to 37.79 percent for field op-erations and 11.42 to 19.88 for trans-porting operations and were within the limit of continuous performance.
IntroductionThe ergonomic aspects of power
tillers are of great importance as working with the power tiller in-volves considerable physical strain to the operator. Controlling the power tiller while turning causes considerable fatigue to the operator. An operator has to walk behind the machine for adistance of about 15 to 20 km, merely to rototill a hectare of land once. The problem is ag-gravated when walking behind the machine in puddled soil during the rotopuddling operation in rice fields (Mehta et al., 1997). The working performance of a power tiller de-pends not only on the machine but also on the operator. If ergonomic aspects are not given due consid-eration, the performance of the man-machine system will be poor and effective working time will be
reduced. On the other hand, due to heavy demand on the worker's biological systems, the power til-ler operation results in clinical and anatomical disorders and in the long run, will affect the workers health (Tiwari and Gite, 1998). In the pres-ent study the energy cost of operat-ing walking and riding type power tiller was compared and reported.
Review of LiteratureThe heart rate for power tiller till-
age operation was observed in the range of 105 beats min-1 to 114 beats min-1. The corresponding human energy requirement was in the range of 13.22 to 20.52 kJ min-1 (Pawar, 1978). Kathirvel et al. (1991) ob-served that energy expenditure of power tiller operation varied from 13.48 to 25.83 kJ min-1 during ro-totilling operation under different operating conditions. The heart rate was used as the index of physi-ological cost. Mc Ardle et al. (1994) reported that energy expenditure during walking was inf luenced by the walking speed and terrain conditions. Tiwari and Gite (1998) measured heart rate and oxygen consumption of the power tiller op-erators during rototilling operations under actual field condition. The mean values for human energy ex-penditure during rototilling opera-tions were 10.02, 12.11 and 13.15 kJ min-1 at the forward speeds of 1.09, 1.69 and 2.26 km h-1 respectively.
Mamansari and Salokhe (1999) as-sessed the physiological cost of the most commonly used power tiller in Thailand in terms of heart rate of the operator and reported that the surface condition of the agricultural field was another factor contributing to operator workload. Tiwari and Gite (2000) evaluated the physio-logical cost of a 10.5 kW rotary type power tiller with and without seat-ing attachment. Mean heart rate and oxygen consumption rates varied from 85.1 to 90.2 beats min-1 and 6.68 to 8.98 kJ min-1, respectively, with the increase in forward speed from 1.04 to 4.14 km h-1 with seat-ing attachment. Without seating at-tachment the heart rate and oxygen consumption rate varied from 90.3 to 134 beats min-1 and 8.77 to 16.07 kJ min-1, respectively.
Methods and MaterialsAmong different makes of power
tillers popular among the farmers of the study region, two power til-lers with one as walking type (7.46 kW) and the other as riding type (8.95 kW) were selected. The se-lected operations included rotary tilling in untilled and tilled fields and transport on farm and bitumen roads. The selected levels of for-ward speed of operation were 1.5, 1.8, 2.1, 2.4 km h-1 and 3.5, 4.0, 4.5, 5.0 km h-1 for field and transport operations, respectively. Three sub-jects were selected based on the age and weight and screened for normal health through medical investiga-tions. The selected subjects were well acquainted with the controls of power tiller and had experience of operating power tillers under dif-ferent terrain conditions. All the three subjects were calibrated in the laboratory condition by assess-ment of oxygen uptake in response to heart rate and their maximum aerobic capacity was computed. The physiological response was assessed through the measurement of heart
Fig. 1 View of the measurement of heartrate during the operation of power tiller B in untilled field
Fig. 2 View of the measurement of heartrate during the operation of power tiller A with trailer attachment on farm road

VOL.38 NO.1 2007 AGRICULTURAL MECHANIZATION IN ASIA, AFRICA, AND LATIN AMERICA 57
rate for field and transporting opera-tions.
The power tiller was put in prop-er test condition before conducting the trails. It was in full working or-der with full fuel tank and radiator, without optional front weights and any specialized components. Tires used for the tests were of standard size and depth of treads was not less than 70 percent of depth of a new tread. The mean dry bulb tempera-ture, wet bulb temperature and rela-
tive humidity varied between 25 to 32 ºC, 18 to 25 ºC and 25 to 76 per-cent respectively during the period of evaluation.
The experiment was conducted at different time intervals of the day between 8:30 AM and 5:00 PM as the effect of environmental condi-tion causes changes in heart rate values of the subjects. To minimize the effects of variation in environ-mental and soil factors, the treat-ments were given in randomized
order. All the three subjects were equally trained in the operation of power tiller with rotavator. The sub-jects were given information about the experimental requirements so as to enlist their full cooperation. They were asked to report at the work site at 8:00 AM in post-absorptive stage and have a rest for 30 minutes be-fore starting the trial. A rest period of 90 minutes was given between the three trials on the same day, with the same subject.
After 30 minutes of resting, the subject was asked to operate the power tiller (already star ted by another person and engine throttle position set at required engine speed and gearshift lever in the required position corresponding to the se-lected forward speed) for a duration of 15 minutes. The duration of mea-surement was fixed as 15 minutes in accordance with the physiological studies conducted by Tiwari and Gite, 1998 and Vidhu, 2001. The speedometer was monitored to be achieve a constant speed through out the period of investigation.
a. RototillingThe experiment was carried out
in the field using a rotavator in both untilled and tilled conditions. The soil was sandy clay with 48.47 per-cent clay, 40.47 percent sand and 9.1 percent silt. The soil moisture and bulk density were 11 percent (d.w.) and 1.31 g cm-3 for untilled and 7 percent (d.w.) and 1.2 g cm-3 for tilled conditions. The surface con-dition of untilled field was dry and undulating with a weed intensity of 370 g m-2. The surface condition of tilled field was dry with small undulations and without weeds. The recommended tire pressure (1.5 kg cm-2) was maintained for the wheels. Depth of operation was maintained at about 15 cm throughout the pe-riod of investigation. The trials were conducted at the selected four lev-els of forward speed with both the power tillers in untilled and tilled field. The heart rate was measured
Forward speed, km h-1
Power tiller Operation Energy cost, kJ min-1
Grading of work
1.5
Walking type (A)
Rototilling in intilled field 17.13Monderate
workRototilling in tilled field 15.70
Riding type (B)
Rototilling in intilled field 13.95Rototilling in tilled field 13.28
1.8
Walking type (A)
Rototilling in intilled field 17.98Monderate
workRototilling in tilled field 16.06
Riding type (B)
Rototilling in intilled field 14.49Rototilling in tilled field 13.72
2.1
Walking type (A)
Rototilling in intilled field 19.01Monderate
workRototilling in tilled field 16.91
Riding type (B)
Rototilling in intilled field 14.99Rototilling in tilled field 14.01
2.4
Walking type (A)
Rototilling in intilled field 20.09Monderate
workRototilling in tilled field 18.23
Riding type (B)
Rototilling in intilled field 15.43Rototilling in tilled field 14.59
Table 1 Energy cost of power tiller A and B during rototilling
Forward speed, km h-1
Power tiller Operation Energy cost, kJ min-1
Grading of work
3.5
Walking type (A)
Transport in farm road 10.50
Light workTransport in bitumen road 10.17Riding type
(B)Transport in farm road 12.11Transport in bitumen road 11.32
4.0
Walking type (A)
Transport in farm road 10.89
Light workTransport in bitumen road 10.69Riding type
(B)Transport in farm road 12.36Transport in bitumen road 11.15
4.5
Walking type (A)
Transport in farm road 10.83
Light workTransport in bitumen road 10.78Riding type
(B)Transport in farm road 12.69Transport in bitumen road 11.42
5.0
Walking type (A)
Transport in farm road 11.05
Light workTransport in bitumen road 11.12Riding type
(B)Transport in farm road 12.82Transport in bitumen road 11.67
Table 2 Energy cost of power tiller A and B during transport

AGRICULTURAL MECHANIZATION IN ASIA, AFRICA, AND LATIN AMERICA 2007 VOL.38 NO.158
and recorded using a computerized heart rate monitor for the entire work period. The same procedure was repeated three times for all the selected subjects. The view of the measurement of heart rate during the operation of power tiller B in untilled field is shown in Fig. 1.
b. TransportingThe tests were carried out on farm
roads and bitumen roads on trans-port mode of power tiller attached with an empty trailer for both power tiller A and B at four levels of for-ward speed. The recommended tire pressure (2.5 kg cm-2) was main-tained for the wheels. The heart rate of the subject was measured and recorded using computerized heart rate monitor for the entire work pe-riod. Measurements were taken for 15 minutes duration and repeated three times for each subject. A view of the measurement of heart rate during the operation of power tiller A with trailer attachment on a farm road is shown in Fig. 2.
The recorded heart rate values from the computerized heart rate monitor were downloaded to the computer through the interface pro-vided for all the operations. From the down loaded data, the values of heart rate at the resting level and at the 6th to 15th minute of operation were taken for calculating the physi-
ological responses of the subjects. From the mean value of heart rate (HR) observed during the trials, the corresponding values of oxy-gen consumption rate (VO2) of the subjects for the selected operations were predicted from the calibration chart of the subjects. The energy cost of operation was computed by multiplying the oxygen consumed by the subject with the calorific value of oxygen (20.88 kJ lit-1) (Nag et al., 1980) for all the subjects. To ascertain whether the operation of the power tillers was within the ac-ceptable workload (AWL), it was necessary to compute the VO2 max for each subject.
Results and Discussioni. Energy Cost of Operation
The physiological response of the subjects during rototilling with a walking type power tiller (A) and riding type power tiller (B) in un-tilled and tilled fields and grading of the work are furnished in Table 1.
Based on the mean energy expen-diture, the operation was graded as “moderate work” for all the selected levels of forward speed (Rodahl, 1989). Comparison between untilled and tilled field operation showed a marked difference in the energy ex-penditure between the terrain condi-
tions (Fig. 3). The subjects expend-ed more energy during rototilling in untilled field than tilled field opera-tion. The increase in forward speed resulted in the increase of energy expenditure of 9.1 to 10.20 percent when compared to the tilled field. The higher energy cost involved in untilled terrain might be due to the additional effort required by the subjects in walking and guiding the power tiller in soil with stubbles of previous crops. In addition, the bite of tynes of the rotary tiller on the relatively compacted terrain of un-tilled soil induces vibration, which might have increased the energy cost of the subjects. Therefore, the surface condition of the agricultural field was another factor contributing to operator’s workload (Maman-sari and Salokhe, 1999). The results clearly indicated that the energy ex-penditure of the subjects was influ-enced by the terrain conditions (Mc Ardle, 1994). Comparison between power tiller A and power tiller B clearly showed a marked difference in energy expenditure between the two power tillers as shown in Fig. 3. The mean energy expenditure of the subjects was higher for power tiller A than those for power tiller B in both untilled and tilled fields.
As power tiller B was provided with a seating attachment, the op-erator could comfortably sit and ride
Energy cost, kJ min-1
10
15
20
25 "Power tiller B (tilled)
"Power tiller A (tilled)
"Power tiller B (untilled)
"Power tiller A (untilled)
2.42.11.81.5
Forward speed, km h-1
Power tiller A (Untilled)Power tiller B (Untilled)Power tiller A (Tilled)Power tiller B (Tilled)
RototillingEnergy cost, kJ min-1
5
10
15
20 "Power tiller B (tilled)
"Power tiller A (tilled)
"Power tiller B (untilled)
"Power tiller A (untilled)
5.04.54.03.5
Forward speed, km h-1
Power tiller A (Farm road)Power tiller B (Farm road)Power tiller A (Bitumen road)Power tiller B (Bitumen road)
Transporting
Fig. 3 Energy cost of power tiller operations

VOL.38 NO.1 2007 AGRICULTURAL MECHANIZATION IN ASIA, AFRICA, AND LATIN AMERICA 59
the power tiller with little drudgery. But, in the walking type power tiller (Power tiller A), the subjects must walk during the entire period of operation. It is observed that operat-ing the power tiller with aseating attachment saved human energy requirement to the tune of 23 to 30 percent with increase in forward speed from 1.5 to 2.4 km h-1 in un-tilled field and 18 to 25 percent in tilled field, respectively. The results clearly indicated that operation of power tiller without a seating at-tachment involved higher physiolog-ical cost in comparison to that with seating attachment. This confirmed the earlier results reported by Ti-wari and Gite, 2000). The effect of terrain condition on energy cost of the subject was more pronounced in untilled field when compared to tilled field for both the power tillers.
The physiological response of the subjects during transport with walk-ing type power tiller (A) and riding type power tiller (B) on farm roads and bitumen roads and grading of the work are furnished in Table 2.
Based on the mean energy expen-diture, the operation was graded as “Light work” for all the selected levels of forward speed (Rodahl, 1989). The increase in energy cost was 17.27 percent as the forward speed increased from 1.5 to 2.4 km h-1. Comparison of energy cost of work between farm road and bitu-men road is shown in Fig. 3. The in-crease in energy expenditure was by
6.97 to 10.85 percent on farm road than bitumen road for the speed level from 3.5 to 5.0 km h-1. This might be due to the more discomfort experienced by the subject while operating the power tiller on farm roads with undulations and surface roughness.
Comparison between power til-lers A and B during transport with trailer showed that human energy requirement was higher for power tiller B when compared to power tiller A as depicted in Fig. 3. This might be due to the fact that maneu-vering and handling of power tiller B was more difficult than power tiller A since the positioning of the handle and trailer seat with respect to engine was at a longer distance for power tiller B (1,850 and 2,270 mm) when compared to power tiller A (1,170 and 2,150 mm). Moreover the weight of power tiller B (517 kg) was more than power tiller A (442 kg). The subjects might have exerted more energy in handling the heavy weight power tiller B. It is observed that when compared to power tiller B, operating power tiller A with an empty trailer resulted in saving of human energy requirement to the tune of 15.33 to 16.23 percent on a farm road and 11.3 to 4.9 percent on a bitumen road with increase in for-ward speed from 3.5 to 5.0 km h-1, respectively.
ii. Acceptable Workload (AWL)The mean oxygen uptake of all
operating conditions in terms of maximum aerobic capacity was calculated for all the subjects an d the values are furnished in Table 3. For field operation with the walk-ing type power tiller the oxygen uptake in terms of VO2 max varied from 35.30 to 43.93 percent which was above the acceptable work load whereas the values varied from 29.04 to 33.74 percent for riding type (8.95 kW) power tiller and was within the acceptable workload. During t ranspor t mode oxygen uptake in terms of VO2 max varied from 22.24 to 28.03 percent and the values were within the acceptable limit of 35 percent of VO2 max for both power tillers.
iii. Limit of Continuous Perfor-mance (LCP)
The increase in physiological re-sponses over resting values of heart rate (∆ HR) for all the subjects at selected levels of forward speed for all selected operations were calcu-lated and the values are furnished in Table 4.
It is observed that the work pulse (∆ HR) for all the operations at selected levels of forward speed varied from 21.08 to 37.79 percent during rototilling in untilled and tilled field respectively. It varied from 13.23 to 19.88 and 11.42 to 17.50 during transport operation on farm and bitumen road respectively. The work pulse values for power til-ler B were lower than power tiller A both in untilled and tilled field. This confirmed the result that the seat-ing arrangement provided in power tiller B enhanced the comfort of the subjects. It was observed that in all the selected operations, the work pulse values were well within the limit of continuous performance of 40 beats min-1 for both power tillers on a farm and a bitumen road.
ConclusionsBased of the analysis of results the
Operation Power tiller
Maximam aerobic capacity of subjects, %AWL, 35 % of VO2 maxForward speed, km h-1
1. Rototilling 1.5 1.8 2.1 2.4
Untilled field A 37.45 39.32 41.57 43.93 > AWLB 30.50 31.68 32.78 33.74 < AWL
Tilled field A 35.30 35.60 36.98 39.86 > AWLB 29.04 30.00 30.64 31.91 < AWL
2. Transport mode 3.5 4.0 4.5 5.0
Farm road A 22.96 23.81 25.43 26.44 < AWLB 26.48 27.03 27.75 28.03 < AWL
Bitumen road A 22.24 24.09 24.16 25.65 < AWLB 24.75 24.38 24.97 25.52 < AWL
Table 3 Oxygen uptake interms of VO2 max for power tiller operation

AGRICULTURAL MECHANIZATION IN ASIA, AFRICA, AND LATIN AMERICA 2007 VOL.38 NO.160
following conclusions were drawn.• The basal metabolic rate of the
selected three subjects varied form 1,402 to 2,005 kcal day-1.
• The relationship between the heart rate and oxygen consump-tion of the subjects was found to be linear for all the subjects.
• The maximum aerobic capacity of the selected subjects varied from 1.98 to 2.48 L min-1.
• For rototilling in untilled field the energy cost of work varied from 17.13 to 20.09 kJ min-1 for walking type (7.46 kW) power tiller and 13.95 to 15.43 kJ min-1 for riding type (8.95 kW) power tiller. In tilled field the values varied from 15.70 to 18.23 kJ min-1 and 13.28 to 14.59 kJ min-1, respectively. The opera-tions were generally graded as “moderate work”.
• The rototilling operation in un-tilled field was strenuous as it demanded 9.1 to 10.20 percent and 1 to 6 percent more energy for walking type (7.46 kW) and riding type power tillers (8.95 kW), respectively, than in tilled field.
• Power tiller with seating attach-ment resulted in saving of 23 to 30 percent and 18 to 25 percent human energy requirement in untilled and tilled field, respec-tively.
• In transport mode the energy cost of work varied from 10.17 to 11.12 kJ min-1 and 11.32 to 12.82 kJ min-1 with the 7.46 kW and 8.95 kW power tillers, respectively. The operat ion was generally graded as “light work” to “moderate work”.
• When compared to 8.95 kW power tiller, the 7.46 kW power tiller resulted in a saving of human energy requirement of 15.33 to 16.23 percent on a farm road and 4.9 to 11.3 percent on a bitumen road. The energy cost increased with increase in for-ward speed of operation.
• For field operation with walking
type power tiller the oxygen up-take in terms of VO2 max var-ied from 35.30 to 43.93 percent which was above the acceptable work load whereas the values varied from 29.04 to 33.74 per-cent for riding type (8.95 kW) power tiller and was within the acceptable workload.
• During transport mode oxygen uptake in terms of VO2 max varied from 22.24 to 28.03 per-cent and the values were within the acceptable limit for both power tillers.
• The work pulse (∆ HR) varied from 21.08 to 37.79 percent for field operations and 11.42 to 19.88 for transporting opera-tions and were within the limit of continuous performance.
REFERENCES
Mamansari, D. U. and V. M. Sa-lokhe. 1999. The need for ergo-nomics considerations for the design and development of agri-cultural machinery in Thailand. Journal of human Ergology, 24(1): 61-72.
McArdle, D. E., F. I. Katch, and V. L. Katch. 1994. Essentials of exer-cise physiology. Lea & Febiger, A Waverly Company, Philadelphia. pp. 508.
Mehta, C. R., P. S. Tiwari, and A. C. Varshney. 1997. Ride vibrations on a 7.5 kW power tiller. J. agric.
Operation Power tiller
Work pulse, beats min-1
LCP, 40 beats min-1Forward speed, km h-1
1. Rototilling 1.5 1.8 2.1 2.4
Untilled field A 32.25 34.79 37.24 37.79 < LCPB 21.08 24.92 24.86 25.21 < LCP
Tilled field A 27.47 28.24 31.23 33.16 < LCPB 22.02 22.28 23.09 24.88 < LCP
2. Transport mode 3.5 4.0 4.5 5.0
Farm road A 13.29 13.23 17.46 18.71 < LCPB 18.81 19.35 19.52 19.88 < LCP
Bitumen road A 11.42 15.13 13.67 17.50 < LCPB 16.14 16.06 16.96 16.78 < LCP
Table 4 Work pulse (∆ HR) for power tiller operation
Engng Res., 66: 169-176.Pawar, J. G. 1978. Investigation of
human energy requirements for power tiller opertation. Unpub-lished M. Tech Thesis, Punjab Agricultural University, Ludhi-ana.
Tiwari, P. S. and L. P. Gite. 2000. Physiological cost evaluation of a 10.5 kW rotary type power tiller with and without seating attach-ment. Agricultural Engineering Today, 24(6): 49-59.
Tiwari, P. S. and L. P. Gite. 1998. Human energy expenditure dur-ing power tiller operations. Paper presented during XXXIII annual convention of ISAE, CIAE, Bho-pal, Sept. pp. 21-23.
Vidhu, K. P. 2001. An investiga-tion on ergonomic evaluation of selected rice farming equipment. Unpublished M.E. (Ag.) Thesis, Department of Farm Machinery, Tamil Nadu Agricultural Univer-sity, Coimbatore, India.
■■

VOL.38 NO.1 2007 AGRICULTURAL MECHANIZATION IN ASIA, AFRICA, AND LATIN AMERICA 61
Vibration Mapping of Walking and Riding TypePower Tillers
byK. KathirvelProfessor and HeadAgricultural Engineering Collegeand Research Institute,Tamil Nadu Agricultural University,Coimbatore - 641 003INDIA
R. ManianDeanAgricultural Engineering Collegeand Research Institute,Tamil Nadu Agricultural University,Coimbatore - 641 003INDIA
BinisamPh. D. ScholarAgricultural Engineering Collegeand Research Institute,Tamil Nadu Agricultural University,Coimbatore - 641 003INDIA
T. SenthikumarDeanAgricultural Engineering Collegeand Research Institute,Tamil Nadu Agricultural University,Coimbatore - 641 003INDIA
AbstractThe major excitation of the vibra-
tion of the power tiller is the unbal-anced inertia force of the engine. Further vibration exciting forces are the transmission system. The me-chanical vibration is transmitted to the human body through the handle and seat. The magnitude of me-chanical vibration at different com-ponents of the power tiller system is essential for identifying the source of vibration and providing vibration isolators to increase the safe expo-sure limit of operators. The mechan-ical vibration of walking and riding type power tillers was measured at different locations in stationery con-dition, during rototilling in untilled and tilled soil and in transport mode on bitumen and farm roads. Com-paring the acceleration at the differ-
ent locations, the vibration at the top of the engine was highest followed by chassis, handle, root of handle bar and gear box for both walking and riding type power tillers. In sta-tionary mode the increase in engine speed resulted in two fold increase in machine vibration at handle for both power tillers. Among the pow-er tillers the vibration at handle was higher by 72.94 to 170 percent for the riding type power tiller. In field operation and transport mode the increase in forward speed of opera-tion resulted in increased values of acceleration. The magnitude of vi-bration was higher at handle (40.50 percent) and seat (28.08 percent) in untilled field than tilled field. In transport mode farm road induced higher vibration than bitumen road. Among the power tillers the vibra-tion induced in walking type power
tiller was higher during field op-eration whereas in transport mode power tiller (8.95 kW) exhibited higher values.
IntroductionThe operator of a power tiller has
to endure various environments and stresses. The environment includes all the factors in the surroundings which have an effect on man-ma-chine system. Among these factors, mechanical vibration is more impor-tant because it significantly acceler-ates fatigue and affects sensitivity and reaction rates of the operator. Excessive noise level, vibrations and uncomfortable posture are the im-portant shortcomings in power tiller design (Pawar, 1978). Mechanical vibrations have instantaneous and

AGRICULTURAL MECHANIZATION IN ASIA, AFRICA, AND LATIN AMERICA 2007 VOL.38 NO.162
long term effects upon the human body. Walking control and riding control type power tillers are in use at present. In walking control type, a random vibration is transmitted to the operator’s chest through his hands (hand transmitted vibration). In case of a riding control type, two possible types of vibration are trans-mitted to the operator’s body, one is through seat as whole body vibra-tion (WBV) and other is through his hands as hand transmitted vibration (HTV). In this paper the mapping of mechanical vibration transmitted from the engine to the handle is re-ported.
Review of LiteratureVibration affects human perfor-
mance. It is usually characterized by its frequency, acceleration and direction. It affects the whole body (Whole body vibration) and it af-fects parts of it, such as the hands (Hand transmitted vibration). Both whole body and local vibration can cause vibration throughout the body (Rodahl, 1989). Vibration is defined as oscillatory motion about a fixed point. A vibration is called periodic when the oscillation repeats itself. Vibrations primarily are of two types (Sanders and McCormick, 1993). In the first type of vibration, the body continues to vibrate at the same frequency over a consider-able period of time. The simplest
way of describing this motion is by a sinusoidal equation. The other type of vibration is that of one-time shocks and impacts, called non periodic vibrations. Majumder (1994) reported that analysis of power tiller vibration in stationary condition was complex. Acceleration and frequency of vibration changed depending on engine speed and ex-perimental conditions. These were increased with an increase in engine speed. The human body reacts to the different kinds of vibration in various ways. The human body is not rigid, and different body parts vibrate differently even if they are under the influence of the same lin-ear vibration (Kroemer et al., 2000). Vibration seems to generate muscle ref lexes, which have a protective function, causing the extended mus-cle to shorten. The reflex activity of the muscles also explains the often observed increase in energy con-sumption, heart rate and respiratory rate when a person is exposed to strong vibrations. These vibrational effects on metabolism, circulation and respiration are small and have little significance (Kroemer and Grandjean, 2000).
Methods and MaterialsMachine vibration of different
components in stationary mode as well as handle and seat vibrations under operating conditions in field
and on road were measured to know the magnitude of vibration transmit-ted to the subject.
Vibration Characteristics at Sta-tionary Mode
The idea of measuring the vibra-tions of a power tiller in a stationary mode was to determine the vibra-tion of the machine in free moving mode without any influence of the human operator. The major source of induced vibration is the engine and the vibrations are transmitted to the operator through the handle in the walking type power tiller (A) and through handle and seat in rid-ing type power tiller (B), therefore the accelerometer was mounted on the engine top, chassis, transmission gear box, root of handle bar and handle for power tiller A and engine top, chassis, transmission gear box, root of handle bar, handle and seat for power tiller B as shown in Fig. 1. The machine vibration was mea-sured using the ENDEVCO Istron model 751-10 accelerometer of the B & K instrument. Vibration signals in the vertical mode were recorded by employing Fast Fourier Trans-form (FFT) technique using the FFT analyzer built in the PULSE multi-analyzer system. FFT is a powerful analytical tool which transforms the random time domain data into high-ly descriptive frequency data. The trial was conducted for different engine speeds for both power tillers. Each trial was repeated for three
Fig. 1 Components showing measurement of machine vibration
Fig. 2 Accelerometer onhandle of power tiller A
Fig. 3 Accelerometer placed onmetallic seat of power tiller B
1. Seat, 2. Handle, 3. Root of the handle bar, 4. Transmission gear box, 5. Engine top, 6. Chassis

VOL.38 NO.1 2007 AGRICULTURAL MECHANIZATION IN ASIA, AFRICA, AND LATIN AMERICA 63
times with an acquisition period of 30 sec and the peak value obtained from the spectrum was averaged for each engine speed. The views of the accelerometer placed on the handle of power tiller A and on the seat of power tiller B are shown in Fig. 2 and 3, respectively.
Vibration Characteristics in Ro-totilling Operation
The measurement of machine vibration during tillage was aimed to determine the vibration level of the power tiller with the influence of implement during field operations, as well as the effect of terrain in order to understand the amount of vibration transmitted to the body by comparing with the hand transmit-ted and whole body vibration. The measurements were taken in un-tilled and tilled fields using rotova-tor. The accelerometer was mounted on the root of handle bar and handle for the power tiller A and on the root of handle bar, handle and un-derneath the seat for power tiller B.
Vibration Characteristics in Transporting Operation
The vibration characteristics of the power tiller handle and seat are
different while riding a power tiller with an empty trailer. Therefore, vi-bration levels were measured on the root of handle bar, handle and un-derneath the seat for power tiller A and power tiller B during transport on farm roads and bitumen roads.
Results and DiscussionVibration Characteristics at Sta-tionary Modea. Power Tiller A
The peak acceleration values ob-tained from the vibration spectrum for power tiller A at different engine speeds are presented in Table 1.
As the engine speed increased, the peak acceleration also increased at different locations. Since the ma-jor vibration contribution was the power stroke of the engine, as the engine speed increased more power strokes are completed per second and the different components of power tiller vibrate frequently and resulted in higher values of acceler-ation. The increase in engine speed of power tiller A from 900 to 2,300 rpm resulted in two fold increase in vibration at engine top, nearly six fold increase at the chassis, four fold
increase at the gear box, three fold increase at the root of handle bar and two fold at the handle.
Comparing the acceleration at the different locations of power tiller A, it was found that the vibration at the top of the engine was highest followed by chassis, handle, root of handle bar and gear box. The vibra-tion at the top of the engine was the highest since the major excitation of the vibration of the power tiller was the unbalanced inertia force of the engine (Jiao Qunying et al., 1989; Dong, 1996 and Ying et al., 1998). The vibration magnitude at the gear box was the lowest among other locations, since the free move-ment of the gear box was restricted by the pneumatic wheels supported on the ground which act as vibra-tion damping medium. The handle of the power tiller showed higher acceleration than at root of handle bar because the handle of the power tiller was like a cantilever beam. It was subjected to forced as well as free vibrations. The longitudinal movement of the root of handle bar was restricted because the end of the handle was attached rigidly to the frame of the power tiller and hence showed lower magnitude of vibration compared to the handle.
b. Power Tiller BThe peak acceleration values ob-
tained from the vibration spectrum for power tiller B at different engine speeds are shown in Table 2.
As in power tiller A, the accel-eration values increased with engine speed at all locations (Majumder, 1994 and Mamansari, 1998). The increase in engine speed from 900 to 2,000 rpm resulted in three fold increase in vibration at the engine top, nearly four fold increase in the chassis, four fold increase at the gear box, four fold increase at the root of handle bar, two fold at the handle and one and half fold in-crease at the seat of the power tiller B. The highest value of acceleration was obtained at the top of the engine
Engine speed, rpm
Peak acceleration, ms-2
Engine top Chassis Gear box Root of handle bar Handle
900 12.1 3.35 0.52 2.44 4.251200 14.0 4.74 0.62 2.65 5.251500 16.0 6.10 0.72 2.98 5.701800 18.2 11.60 1.12 3.07 6.132000 24.3 11.90 1.59 4.31 6.252300 25.8 20.90 2.03 7.42 9.14
Engine speed, rpm
Peak acceleration, ms-2
Engine top Chassis Gear box Root of handle bar Handle Seat
900 18.05 6.61 0.77 2.66 7.35 12.751200 19.20 14.45 0.85 5.24 10.95 15.551500 40.75 15.40 1.69 4.83 11.27 17.251800 53.25 25.65 2.24 8.45 13.20 18.352000 54.20 27.05 2.90 9.49 16.90 19.30
Table 1 Machine vibration of power tiller A in stationary mode
Table 2 Machine vibration of power tiller B in stationary mode

AGRICULTURAL MECHANIZATION IN ASIA, AFRICA, AND LATIN AMERICA 2007 VOL.38 NO.164
followed by chassis, seat, handle, root of handle bar and gear box as observed in power tiller A. The seat showed the highest value of acceler-ation, after the engine top, followed by chassis. This was due to the free vibrations in addition of forced vi-brations since the seat was attached to the power tiller as a separate unit and whose vibrations change as per the mass. The increase in the engine speed from 900 to 2,000 rpm re-sulted in an increased peak value of acceleration by 130 percent for the handle and 51.37 percent for seat.
Comparing power tillers A and B, power tiller B showed highest val-ues of acceleration at all locations measured at the same engine rpm as depicted in Fig. 4. The increase in peak value of acceleration for the power tiller B was 49.17 percent to 123 percent at the engine top, 97.3
to 127 percent at the chassis, 47.78 to 82.70 percent at the gear box, 9.01 to 120 percent at the root of the han-dle bar, 72.94 to 170 percent at the handle with the increase in engine speed from 900 to 2,000 rpm when compared to the power tiller A. This might have been due to the higher rated horsepower produced by the engine of the power tiller B (8.95 kW) compared to power tiller A (7.46 kW). In addition, the position-ing of the handle and seat with re-spect to the engine was at a greater distance (1,850 and 2,270 mm) for power tiller B as compared to the power tiller A (1,170 and 2,150 mm). Since the handle and seat of power tiller B was positioned further from the engine compared to power til-ler A, these parts were subjected to more free vibrations.
Vibration Characteristics in Ro-totilling Operationa. Power Tiller A
The highest value of acceleration obtained from the vibration spec-trum for power tiller A at selected forward speeds in untilled and tilled fields are shown in Table 3. It was observed that the magnitude of acceleration on the root of the handle bar and handle increased with increase in selected levels of forward speed in both untilled and tilled field. A two fold increase in peak acceleration on the handle was recorded with increase in forward speed from 1.5 to 2.4 km h-1 in un-tilled fields. Similarly, in tilled fields the increase in acceleration was 53.96 percent as the forward speed increased from 1.5 to 2.4 km h-1.
The peak acceleration on the handle was higher in untilled filed
Acceleration (r.m.s.), ms-2
Engine speed, rpm
Engine top (A)Chassis (A)Gear box (A)Root of handle bar (A)Handle (A)
0
10
20
30
40
50
60
Seat (B)
Handle (B)
"Root of handle bar (B)
Gear box (B)
Chassis (B)
Engine top (B)
Handle (A)
"Root of handle bar (A)
Gear box (A)
Chassis (A)
Engine top (A)
23002000180015001200900
Engine top (B)Chassis (B)Gear box (B)Root of handle bar (B)Handle (B)Seat (B)
Acceleration (r.m.s.), ms-2
0
5
10
15
20 Seat (B)
Handle (B)
Root of handle bar (B)
Handle (A)
Root of handle bar (A)
2.42.11.81.5
Forward speed, km h-1
Root of handle bar (A)Handle (A)Root of handle bar (B)Handle (B)Seat (B)
Untilled field
0
5
10
15
20 Seat (B)
Handle (B)
Root of handle bar (B)
Handle (A)
Root of handle bar (A)
2.42.11.81.5
Root of handle bar (A)Handle (A)Root of handle bar (B)Handle (B)Seat (B)
Tilled field
Fig. 4 Machine vibration of power tillerA and B in stationary mode
Fig. 5 Machine vibration of power tillerA and B during rototilling operation
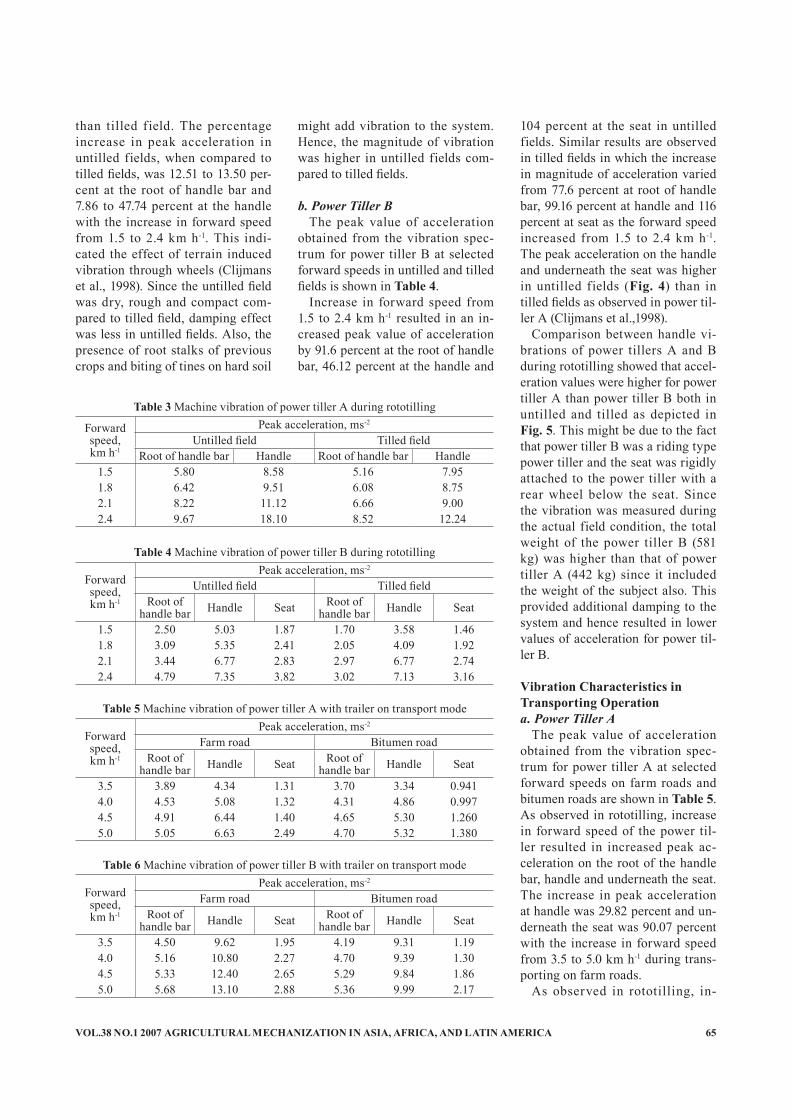
VOL.38 NO.1 2007 AGRICULTURAL MECHANIZATION IN ASIA, AFRICA, AND LATIN AMERICA 65
than tilled field. The percentage increase in peak acceleration in untilled fields, when compared to tilled fields, was 12.51 to 13.50 per-cent at the root of handle bar and 7.86 to 47.74 percent at the handle with the increase in forward speed from 1.5 to 2.4 km h-1. This indi-cated the effect of terrain induced vibration through wheels (Clijmans et al., 1998). Since the untilled field was dry, rough and compact com-pared to tilled field, damping effect was less in untilled fields. Also, the presence of root stalks of previous crops and biting of tines on hard soil
might add vibration to the system. Hence, the magnitude of vibration was higher in untilled fields com-pared to tilled fields.
b. Power Tiller BThe peak value of acceleration
obtained from the vibration spec-trum for power tiller B at selected forward speeds in untilled and tilled fields is shown in Table 4.
Increase in forward speed from 1.5 to 2.4 km h-1 resulted in an in-creased peak value of acceleration by 91.6 percent at the root of handle bar, 46.12 percent at the handle and
104 percent at the seat in untilled fields. Similar results are observed in tilled fields in which the increase in magnitude of acceleration varied from 77.6 percent at root of handle bar, 99.16 percent at handle and 116 percent at seat as the forward speed increased from 1.5 to 2.4 km h-1. The peak acceleration on the handle and underneath the seat was higher in untilled fields (Fig. 4) than in tilled fields as observed in power til-ler A (Clijmans et al.,1998).
Comparison between handle vi-brations of power tillers A and B during rototilling showed that accel-eration values were higher for power tiller A than power tiller B both in untilled and tilled as depicted in Fig. 5. This might be due to the fact that power tiller B was a riding type power tiller and the seat was rigidly attached to the power tiller with a rear wheel below the seat. Since the vibration was measured during the actual field condition, the total weight of the power tiller B (581 kg) was higher than that of power tiller A (442 kg) since it included the weight of the subject also. This provided additional damping to the system and hence resulted in lower values of acceleration for power til-ler B.
Vibration Characteristics in Transporting Operationa. Power Tiller A
The peak value of acceleration obtained from the vibration spec-trum for power tiller A at selected forward speeds on farm roads and bitumen roads are shown in Table 5. As observed in rototilling, increase in forward speed of the power til-ler resulted in increased peak ac-celeration on the root of the handle bar, handle and underneath the seat. The increase in peak acceleration at handle was 29.82 percent and un-derneath the seat was 90.07 percent with the increase in forward speed from 3.5 to 5.0 km h-1 during trans-porting on farm roads.
As observed in rototilling, in-
Forward speed,km h-1
Peak acceleration, ms-2
Untilled field Tilled fieldRoot of handle bar Handle Root of handle bar Handle
1.5 5.80 8.58 5.16 7.951.8 6.42 9.51 6.08 8.752.1 8.22 11.12 6.66 9.002.4 9.67 18.10 8.52 12.24
Forward speed,km h-1
Peak acceleration, ms-2
Untilled field Tilled fieldRoot of
handle bar Handle Seat Root of handle bar Handle Seat
1.5 2.50 5.03 1.87 1.70 3.58 1.461.8 3.09 5.35 2.41 2.05 4.09 1.922.1 3.44 6.77 2.83 2.97 6.77 2.742.4 4.79 7.35 3.82 3.02 7.13 3.16
Table 3 Machine vibration of power tiller A during rototilling
Table 4 Machine vibration of power tiller B during rototilling
Forward speed,km h-1
Peak acceleration, ms-2
Farm road Bitumen roadRoot of
handle bar Handle Seat Root of handle bar Handle Seat
3.5 4.50 9.62 1.95 4.19 9.31 1.194.0 5.16 10.80 2.27 4.70 9.39 1.304.5 5.33 12.40 2.65 5.29 9.84 1.865.0 5.68 13.10 2.88 5.36 9.99 2.17
Table 6 Machine vibration of power tiller B with trailer on transport mode
Forward speed,km h-1
Peak acceleration, ms-2
Farm road Bitumen roadRoot of
handle bar Handle Seat Root of handle bar Handle Seat
3.5 3.89 4.34 1.31 3.70 3.34 0.9414.0 4.53 5.08 1.32 4.31 4.86 0.9974.5 4.91 6.44 1.40 4.65 5.30 1.2605.0 5.05 6.63 2.49 4.70 5.32 1.380
Table 5 Machine vibration of power tiller A with trailer on transport mode

AGRICULTURAL MECHANIZATION IN ASIA, AFRICA, AND LATIN AMERICA 2007 VOL.38 NO.166
crease in forward speed of the power tiller resulted in increased peak acceleration on the root of the handle bar, handle and underneath the seat. The increase in peak ac-celeration at the handle was 29.82 percent and underneath the seat was 90.07 percent with the increase in forward speed from 3.5 to 5.0 km h-1 during transporting on farm road. Similar results were observed on bitumen roads in which the in-crease in forward speed from 3.5 to 5.0 km h-1 resulted in an increased peak value of r.m.s acceleration by 59.28 percent at the handle and 46.65 percent underneath the seat. The peak acceleration on the handle and underneath the seat was higher on farm roads than in bitumen roads (tar road). This clearly revealed the effect of terrain in inducing vibra-tion. The reason for higher magni-tude of vibration on farm roads was the unevenness and small undula-tions of farm road compared to rela-tively medium surface finish level on bitumen roads.
b. Power Tiller BThe peak value of acceleration
obtained from the vibration spec-trum for power tiller B at selected forward speeds on farm roads and bitumen roads are shown in Table 6.
The results were similar to the earlier findings that the magnitude
of vibration increased with forward speed. The values of acceleration on the handle and underneath the seat were increased by 36.17 and 47.69 percent, respectively with the increase in forward speed from 3.5 to 5.0 km h-1 on farm roads. On bi-tumen roads, the peak acceleration on the handle and underneath the seat was increased by 7.3 and 82.35 percent with the increase in for-ward speed from 3.5 to 5.0 km h-1, respectively. Comparison between power tillers A and B showed that magnitude of vibration was higher for power tiller B than power tiller A during transport with anempty trailer as depicted in Fig. 6. The percentage increase in power tiller B was 15.68 to 12.47 percent at root of the handle bar, 121.65 to 97.58 percent at the handle, 48.85 to 15.66 percent at seat on farm roads and 13.24 to 14.04 percent at root of the handle bar, 178.74 to 87.78 percent at the handle, 26.46 to 57.25 percent at seat on bitumen roads with the in-crease in forward speed from 3.5 to 5.0 km h-1. This might be due to the fact that same trailer was attached to both power tillers and hence the weight of the trailer added same vertical load to the both power til-lers unlike in field operations where the total weight of the power tiller B was increased due to the seated person when compared to power tiller A. In addition, the damping
effect of the terrain during transport was relatively less when compared to the field operations in which the soil mass acted as a cushion. So the same condition as that of stationary was obtained where the machine vibration of each location of power tiller B was higher than power tiller A, which was mainly due to higher rated horsepower of the engine.
ConclusionsBased on the analysis of the re-
sults the following conclusions are drawn
• In thestationary mode the in-crease in engine speed from 900 to 2,300 rpm resulted in two fold increase in vibration at engine top, nearly six fold increase at the chassis, four fold increase at thegear box, three fold increase at the root of handle bar and two fold at the handle of the walking type power tiller (A).
• The increase in engine speed from 900 to 2000 rpm resulted in three fold increase in vibra-tion at engine top, nearly four fold increase in the chassis, four fold increase at the gear box, four fold increase at the root of handle bar, two fold at the handle and one and half fold in-crease at the seat of riding type
Acceleration (r.m.s.), ms-2
0
5
10
15
20 Seat (B)
Handle (B)
Root of handle bar (B)
Seat (A)
Handle (A)
Root of handle bar (A)
5.04.54.03.5Forward speed, km h-1
Root of handle bar (A)Handle (A)Seat (A)
Farm roadRoot of handle bar (B)Handle (B)Seat (B)
Acceleration (r.m.s.), ms-2
0
5
10
15
20 Seat (B)
Handle (B)
Root of handle bar (B)
Seat (A)
Handle (A)
Root of handle bar (A)
5.04.54.03.5Forward speed, km h-1
Root of handle bar (A)Handle (A)Seat (A)
Bitumen roadRoot of handle bar (B)Handle (B)Seat (B)
Fig. 6 Machine vibration of power tillers A and B transport mode

VOL.38 NO.1 2007 AGRICULTURAL MECHANIZATION IN ASIA, AFRICA, AND LATIN AMERICA 67
power tiller (B).• Among the power tillers the vi-
bration at the handle was higher by 72.94 to 170 percent for rid-ing type power tillers.
• In field operation and transport mode the increase in forward speed of operation resulted in increased values of accelera-tion.
• The magnitude of vibration was higher at the handle (40.50 per-cent) and seat (28.08 percent) in untilled fields than tilled fields.
• In transport mode farm road induced higher vibration than bitumen road.
• Among the power tillers the vi-bration induced in walking type power tiller was higher during field operation whereas in trans-port mode power tiller (8.95 kW) exhibited higher values.
REFERENCES
Dong, M. D. 1996. Testing analysis and evaluation of vibration trans-mitted by handles of GN-5 walk-ing tractor. Journal of Zhejiang Agricultural University, 22(1): 68-72.
Jiao Qunying., Dai Shiliang, and Ji Chunliang. 1989. The dynamic characteristics of a walking trac-tor. Transactions of the Chinese Society of Agricultural-Machin-ery, 20(4): 3-8.
Guignard, J. C. 1985. A text book of Industrial Hygiene and Toxicol-ogy, Biological Responses, 2nd Edn, Wiley, New York, Chapter 15, Vibration: 653-724.
Hornick, R. J. 1961. Effects of trac-tor vibration on operators. Ag-ricultural Engineering, 42(12): 674-675 & 696-697.
Kroemer, K. H. E., H. J. Kroemer, and K. E. E. Kroemer. 1997. Engi-neering physiology 3rd Edn., Van Nostrand Reinhold, A division of International Thomson Publishing Inc. New York: 209-215.
Kroemer, K. H. E. and E. Grand-
jean. 2000. Fitting the task to the human. A textbook of occupa-tional ergonomics. 5th Edn., Taylor & Francis Ltd., UK. pp. 118.
Kroemer, K. H. E., H. B. Kroemer, and K. E. E. Kroemer. 2000. Er-gonomics-How to design for ease and efficiency. Prentice-Hall Inc. Upper saddle River, New Jersey. pp. 112.
Majumder, B. 1994. Vibration and noise characteristics of a Thai-made power tiller Unpublished M.E. Thesis. Asian Institute of Technology, Bangkok.
Mamansari, D. U. 1998. Ergonomic evaluation of a commonly used power tiller in Thailand. Unpub-lished Ph.D. Thesis. Asian Insti-tute of Technology, Bangkok.
Pawar, J. G. 1978. Investigation of human energy requirements for power tiller opertation. Unpub-lished M.Tech Thesis, Punjab Ag-ricultural University, Ludhiana.
Rodahl, K. 1989. The physiology of work. Taylor & Fransis Ltd., Lon-don: 51-79.
Seidel, H., R. Bastek., D. Brauer., C. H. Buchholz., A. Meister., A. M. Metz, and R. Rothe. 1980. On human response to prolonged repeated whole body vibration. Ergonomics, 23(30): 191-211.
Ying, Y., L. Zhang., F. Xu, and M. Dong. 1998. Vibratory character-istics and hand-transmitted vibra-tion reduction of walking tractor. Transactions of the ASAE, 41(4): 917-922.
■■

AGRICULTURAL MECHANIZATION IN ASIA, AFRICA, AND LATIN AMERICA 2007 VOL.38 NO.168
Oman Traditional Farms: Changes and Improvement of Farms in Oman
byAhmed Al-MarshudiProfessorDepartment of Agricultural Economicsand Rural Studies, College of Agriculture,Sultan Qaboos UniversityP.O. Box 34 Al-Khod 123Sultanate of [email protected]
AbstractTraditional methods were de-
veloped to allow farmers to live in harmony with a harsh environment. The farming techniques employed required only limited inputs of capi-tal and caused minimal disturbance to the environment. The patterns of production were truly sustainable and skills were passed from genera-tion to generation. However, human development and population growth have led into significant change in the traditional farming. Thus, it is very often stated that success in any society could be measured by the balance required to manage and ad-just traditional methods and cultural belief and modernization.
This paper examines the two types of farming systems in Oman, with more emphasis on water re-sources. In fact, most of the discus-sion is based on the two main clas-sifications of farms. The analysis of the observed data found some of the economic and social problems which confront farmers at present in the northern part of the country. A number of recommendations have been suggested to tackle some of these problems. However, attempts
to undertake these actions require careful consideration of prevailing social rules and habits. It is well rec-ognized that any suggested changes of an existing system may bring problems of greater complexity.
IntroductionAgriculture has existed in the
Sultanate of Oman for thousands of years, as shown by the existence of the surface irrigation system referred as Aflaj (singular called fa-laj). Sutton (1984) stated “the ganat of falaj systems of Oman have pro-vided communities with water for irrigation and domestic purposes for 1500-2000 years”. In fact, the origi-nal establishment of the system goes back to about 7000 BC (Wilkinson, 1977).
In the early 1970’s, the social and economic situation in the country changed. The major reason for the change was that oil was discovered creating movement toward mod-ernization. The first two five-year development plans that were ad-opted in the country relied on the oil revenues. These two plans created tremendous progress, especially in
social infrastructure development (education, health, etc.) However, for the third five-year development plan (1986-1990) following the de-cline in oil prices, the government realized the importance of diversi-fying its national income. Therefore, the agricultural sector became a tar-geted sector to play a major role in diversifying the country’s economy.
However, since ancient times, Omanis have relied on agriculture for their livelihood. In spite of the fact that oil discovery reduced the importance of agriculture as the main source of income, nearly half of the population is engaged in agri-culture activities.
This paper examines some of the present economic and social prob-lems that confront farmers at pres-ent in the northern part of the coun-try. The nature of farming around the northern region of the country and some of the socio-economic relationships, which link the urban and rural populations, are discussed based upon data from fieldwork conducted between 1993 to 1999. The discussion is divided into three main sections: the nature environ-ment within which agriculture in the region is practiced, the social

VOL.38 NO.1 2007 AGRICULTURAL MECHANIZATION IN ASIA, AFRICA, AND LATIN AMERICA 69
organization of this population and a preliminarily analysis of recent socio-economic changes in these village communities.
With increasing evidence of change from the communal water management of falaj villages to in-dividual agricultural holdings based upon wells, attention is drawn to the danger for farming of the misuse of nature resources. Change rates are being accelerated by factors both external and internal to village set-tlements. These include alterations to local power structures, economic diversification and cash circulation, and increasingly widespread labor migrations.
Three objectives are proposed here: to record the physical and natural environment within which farming is practiced in the area, to describe the social organization of the settlements involved in this activity, and to offer a preliminary analysis of recent patterns of socio-economic change in these com-munities. The objectives cover the issues of what is thought of as farm-ing activities, where, how and when are they undertaken, and by whom. Some consideration is given also to agricultural support available local-ly, as well as major problems facing farmers.
MethodologyThe study used primary as well
as secondary sources of informa-tion. Secondary data were mainly from statistical reporting services of Minist ry of Agriculture and fisheries and Ministry of National Economy. Primary sources on the organization and current structure used the author’s own observations that were collected through random field observation throughout Oman. The visits were conducted through Sultan Qaboos University, College of Agriculture, student course visits. The preliminary stage was initiated in 1993 when in each semester the
author has to arrange a student visits to one of the agricultural extension centers nearby. Thus, both the stu-dents and the supervisors during the explanation in the filed have asked questions. Sometime a group of farmers come together in order that students will see in practice how ex-tension agents convey information to the farmers.
Information gathering for the agricultural extension program in Oman is essential for several rea-sons. First, to update the decision-maker, farmers and others con-cerned about problems that exists and the required solution. Second, to document information about farming and farmers’ perceptions of agriculture in Oman. Third, to learn how the communication of vari-ous positions takes place among all those concerned in the agriculture system in Oman.
Therefore, this study used three main techniques in order to gather such information. First is the visit to the extension centers at different regions of the country to find out their activities with farmer. Second, is to meet with farmers so that com-munication of extension agents with farmers can be observed. Third, to visit the Ministry headquarters to understand how senior staff con-cerned with the extension service assist extension centers in the region and farmers.
Agricultural Development and Practice
The northern part of Oman, par-
ticularly the Batinal coastal strip, has been cultivated for at least as far back as the Sassanid period (Wilkinson, 1977). Stanger (1984) stated that “during the Persian in-fluence between the mid-third and mid-seventh centuries AD. Remains are still seen of ancient cement lined falajis that transported water across the Batinah coastal settlements. Agriculture has existed in the Sul-tanate of Oman for thousands of years, as shown by the existence of the “Aflaj” irrigation system. Thus, Sutton (1984) stated that the ganate of falaj systems of Oman have pro-vided communities with water for irrigation and domestic purposes for 1500-2000 years.
Oman over the last two decades have experienced a continuous de-velopment almost in all aspects of life. The revenues from the exploi-tation of oil have been reinvested in the development of the country and its people. The changes this has brought have affected every aspect of national life. Many parts of the traditional systems of agriculture and fisheries have benefited.
Traditional methods or systems can be defined as ways or tech-niques developed in the past to al-low farmers and fishermen to live in harmony with harsh environment. (COA, 1995). In the recent past, the
Fig. 1 Traditional farm in Oman
Fig. 2 Traditional Palm-tree garden irrigated by aflaj system

AGRICULTURAL MECHANIZATION IN ASIA, AFRICA, AND LATIN AMERICA 2007 VOL.38 NO.170
nutrition of Omani’s people rested almost completely upon what was produced by the land and the sea. Much has changed but the impor-tance of those two elements has remained and will continue. Agri-culture, the growing of crops, in-cluding tree crops, and the raising of livestock to provide food and fiber, has been practiced for over 1000 years (Fig. 1).
Agriculture in Oman is, and will continue to be a very important part of the economy. In the past, agri-culture was traditional in nature; most people lived in small farming villages. The farmer and his family provided all the labor required for the production of crops, including tree crops and raising livestock. The farm unit functioned primarily to provide for the basic food needs of the family. Any surplus was sold or bartered to obtain necessities that the farm unit could not produce. Whenever possible a member of the farm family would seek some type of employment elsewhere to gener-ate additional income for the family. As outside opportunities expanded, the general welfare of the family improved.
Farming activities then may be classified as belonging to one of two possible types: falaj irrigated farms, or well irrigated new farms. Gener-ally speaking, the former primarilly produces dates, and the latter live-stock fodder in the form of alfalfa and new grown Rhod grass and veg-etables like tomato, onion, cucumber and potatoes. However, as water provides the key to agriculture in Oman than elsewhere in the world, it is important to examine the implica-tion of each system in more detail (Fig. 2).
Aflaj Irrigated FarmsOman is almost exclusively de-
pendent on rainfall for its supply of fresh water. Sub-surface and deep wells are the main sources of
water. Traditional surface irrigation systems of aflaj provide 38 percent of the fresh water supply in the Sul-tanate of Oman and irrigate around 55 percent of the cropped area (MRMEW, 2002). Over the years, these systems have set traditions for inter-temporal water resources al-location and a process of users rights established on ownership and/or rent basis. A management structure has been generated to organize, maintain and distribute aflaj water resources.
Several studies on hydrology and water resources of Oman have been carried out over the last decade. A number of studies for example, Wilknson (1977); Norman (1997); Omezzine (1996); Marshudi (2000), focused on the Aflaj system. Oth-ers like Hayder (1993) search ways to conserve water in Oman. Zaibet (1996) and Omezzine (1997) at-tempted to find more efficient crops or high valued crops which consume water efficiently.
To sum up, falaj irrigation sys-tems support relatively large num-bers of people, on a fixed area of land, based upon a complex system of water supply and allocation from a source or sources, often, some distance from the settlement. To un-derstand the structural organization and management of falaj system, the following aspects can be briefly summarized as follows:
1. Physical Structure: A falaj con-sists of a tunnel to tap ground-water and bring it to the surface
for distribution to crops and housing. It is designed to trans-port groundwater to the surface without any mechanical device or costly expenditure of fuel. This is achieved by excavating a tunnel (typically several kilo-meters long), which taps con-centrated lines of groundwater flow and leads water to the sur-face along a channel at a lesser gradient than either the ground surface or the water table. Falaj systems have been running for centuries with high efficiency of water delivery. Water f low depends on hydraulic gradient along the tunnel starting from the mother well for tens of ki-lometers long. At the end of the tunnel, water is divided into lat-eral tunnels and then into small channels that supply individual garden (Fig. 3). The distribution channels and hydraulic struc-tures need constant attention to control leakage and to distribute water to each lot. Points for the collection of drinking water and those set aside for washing also require maintenance.
2. Administrative Organization: Water ownership and distribu-tion are governed through well-accepted social rules. These rules have generated an adapted management system that in-volves various responsibilities and functions undertaken by what is called the “the falaj
Fig. 3 Cross-section of quanat (falaj) in the piedmont zone
Souce: Hayder and Omezzine, 1996

VOL.38 NO.1 2007 AGRICULTURAL MECHANIZATION IN ASIA, AFRICA, AND LATIN AMERICA 71
management committee”. The administrative structure can be divided into two groups accord-ing to the work done. The first group can be considered as the administered superstructure. The second group consists of labors responsible for the physi-cal implementation of the tasks.
3. Type of Falaj: Al-Rawas et al. (1999) have divided af laj in Oman into two types, while Al-Ghafri (2000) and Hatmi (2000) divided aflaj into three types. The later stated that “Aflaj in Oman can be classi-fied into three types depending on its source of water; ghainy, dawoodi and aniy”. However, Al-Rawas regarded the aniy falj as part of the dawoodi . He stated that “when the source of a dawoodi falaj is a spring (single source), the falaj is known as an ayni falaj”. The source of Da-woodi falaj is from underground acquifer, while the source of ghayli falaj is normally a surface aquifer in a wadi (Al-Rawas, 1999). Eighty percent of the aflaj in Oman are of Dawoodi type.
4. Crop Cultivation: Falaj crop cul-tivation is based upon a three-crop system with the date palm as the main crop. It has been indicated by the last agriculture census (MAF, 1993) that date palm provide approximately 80 percent of the cultivation with a scattering of citrus (mainly lime). However, in recent years, areas under lime cultivation and lime yield have drastically de-creased to less than 40 percent of 1991 data. Indeed, majority of dense orchards in Batinah re-gion have been either killed or removed as a direct result of a prokaryotic plant disease. The disease is named as witches’ broom disease of lime. In ad-dition, banana and mango are grown as inter-cropped among the palms. Apart from tree crops bull and swon with beans, sor-
ghum or Rhodes or other grass as livestock fodder are often grown under the palms.
Well Irrigated FarmsStanger (1985) described that
water well supply was learned by trail and error, eventually result-ing in a narrow strip of cultivation, normally up to 3 km but occasion-ally up to 5 km from the sea. Costra (1987) showed the location of wells in Oman. He stated, “Wells provide water for settlements and fields in both the mountain zone and the Ba-tinah, but it is only in the latter area they form the primary water source, and therefore partly determine the basic pattern of the irrigation and field system”.
Originally, nearly all wells were of the animal powered driven type. In this old method animals such as bullocks or donkeys, yoked by rope to rubber or leather buckets, bailed water by walking up and down an excavated ramp. Obviously, this method is slow and inefficient and thus requires a constant supervi-sion. Stanger (1985) showed the rate of irrigation that can be provided using old well animal driven power. He stated, “From observation of the few remaining animal-bailed wells of interior Oman it is estimated that a single zagira can irrigate about 0.8 ha of date or citrus trees or 1.5 ha of annual crops”.
Change began well before Omans’ oil boom. Stanger (1985) pointed out that the first diesel pumps were
installed before the 1950’s but re-sistance to technical innovation, import restriction, and the lack of capital and commercial infrastruc-ture, inhibited a widespread adop-tion of pumped irrigation. On the other hand, Costra (1987) stated that many traditional systems of water supply remain in use today, but others, such as the animal powered well, have witnessed a rapid decline since the 1950’s.
According to the recent well inventory carried out in 1992 by the Ministry of Water Resources, there were 176,000 wells owned by citizens, of which 50 percent were concentrated in the Batinah region. In addition, the FAO Review report (1997) pointed out that 47 percent of the total number of 62,411 house-holds, the well system is their main source of water.
A number of characteristics of well irrigated farms in Oman disti-gush them from flaj irrigated farms. These can be summerized as fol-lows:
1. This system uses modern meth-ods of extracting underground sources of water. Diesel and electrical pumps have replaced animal power as a means of raising water from wells since 1960. Water is discharged into a reservoir or cistern of lined ce-ment block construction.
2. Well irrigated farms are operat-ed mainly for the production of the livestock fodder, invariably alfalfa. Vegetables and some fruit t rees also grown in an open area using new irrigation
Region Percentage of farms from total holding Number of Aflaj Number of Wells
Muscut 3.85 1,266 1,733Batinah 33.59 6,572 16,409Musandam 2.51 130 1,314Dhahira 9.30 3,101 3,236Interior 12.37 4,166 2,224Sharqiya 19.68 8,652 1,746Al-Wusta 2.07 0 5Dhifar 16.63 27 946
Table 1 Distribution of aflaj and wells irrigated farm all over the country

AGRICULTURAL MECHANIZATION IN ASIA, AFRICA, AND LATIN AMERICA 2007 VOL.38 NO.172
methods in some farms such as droplet and spinkler irrigation method.
According to Agriculture census of 1993/94, wells in Oman provide the source of irrigation water for 46.8 percent of holdings with land compared to 38 percent for af laj. For the balance of holdings, irriga-tion water was derived from other sources. The data in Table 1 are reproduced from the Agriculture Cencus to illustrate the number of farms using the f laj system (date production on one hand) and wells (new farms used to cultivate animal folder and vegetables).
As mentioned earlier, Batinah region is characterized as having well irrigated farms, while Sharqiya followed by the Interior have the majority of farms that are irrigated from the old system (Falaj).
Traditional Omani society was farming on the subsistence pattern. The popular crops have been dates, lime, onion, garlic, wheat, alfalfa, watermelon and cucumber. The pro-duction of these crops was sustain-able but low in productivity. Modern farming emerged after the discovery of oil in Oman. Heavy machines, new seeds, fertilizer, pesticides, more water resources, better man-agement and marketing system re-sulted in a huge surge in agriculture production. There was a sharp in-crease in fruits, vegetables and field crops from 1978 to 1994. The area under fruit cultivation has increased from 35,885 ha in 1988/89 to 42,978 ha in 1993/94 at an increase of 16 percent. Nevertheless, present pro-duction of agricultural commodities in Oman is not sufficient to meet the local market demand. While Oman has considerable export of agricul-tural produce, the imports are nearly 10 times higher than exports.
Problems and Recom-mendation
A number of problems have been
identified in the falaj system. They fall into two categories. Problems due to physical structures of the falaj system and problems that have resulted from the administrative management of the system.
The physical structure problems can be summarized as follows:
1. Water conveyance of some aflaj over a wide gravel or earth bed has resulted in losses due to seepage and evaporation.
2. Water losses could be also at-tributed to breakage, poor grad-ing of channels, and disorderly patterns of distribution.
3. The present structure of water r ight f ragmentation has in-creased in channel losses.
4. The nature of the cycle (water-ing), which can go as long as 16 days, does not allow cultivation of high vegetable value crops and could lead to water stress during the dry hot days.
Problems, which result f rom social management focus on the socially accepted competitive con-ditions, are not solved when water rights are in the hands of a few large owners selling to many small wa-terless landlords. In addition, there is evidence of some market power leading to speculation and, there-fore, to unacceptable higher water costs for small landowners.
To sum up, low demand, lack of free inter-community mobility and absence of new water collection and distribution system too often result in over-irrigation and waste of water during wet years and in regions with surplus water supply.
Agrarian reform of the aflaj sys-tem in Oman is, therefore, of great importance. A number of recom-mendations have been forwarded by Hayder and Omezzine (1996). A summery of these is as follows:
1. Improvement of the operation of the water tradable system through some form of public regulation.
2. Sustainable use of falaj water can be made more f lexible by
the introduction of new engi-neering and ir rigation tech-niques such as consolidated farming and the construction of artificial pools to collect and use water more efficiently to meet the needs of more diversi-fied cropping systems.
3. Specific actions for aflaj water sustainability which may in-clude:i. Increasing efficiency of the
present af laj i r r igation to combine the best features of the aflaj systems with the benefits of modern irrigation systems.Cultivation of high value crops to give an incen-tive to farmers to maintain their aflaj.
ii. Aflaj maintenance through channel lining and provision of improved dams and cis-terns.
iii. More rational water distribu-tion and modification of water rotation to suit crop require-ment.
Installing water measuring de-vices and basing shares on time and discharge.
In recent years, the introduc-tion of modern techniques, electric or diesel pumps, extracting water from these wells, have led to higher extraction rate compared with tradi-tional methods. Another cause is the increase in agricultural productiv-ity. As a result of this the following problems occur: At present ground-water depletion already takes place, especially in the coastal areas, leading to seawater intrusion and deterioration in water quality. The assessment of seawater interaction on the Batinah coast has been ex-amined through several studies. The most important of these so far is the production of the series of maps comparing the extent of saline water interaction and falls in groundwa-ter levels during the period 1983 to 1991 (Ministry of Water Resources, 1997).
VOL.38 NO.1 2007 AGRICULTURAL MECHANIZATION IN ASIA, AFRICA, AND LATIN AMERICA 73
ConclusionThis review of farming in the
area of the northern part of Oman has focused upon the old irrigated flaj farms and the small new farms. Discussion has included the physi-cal and natural environment within which farming operates; and the so-cial organization of those activities. Below we try to summarize this ac-count and examine in more details major areas of change.
Agriculture in the region pres-ently includes two types: falaj, and new (well-irrigated) farms. The date gardens of the falaj are old-estab-lished agricultural systems designed to adapt crop husbandry to the arid environment. More recently new farms have been established outside old system where land area is fixed according to the irrigation abili-ties of the falaj. These individual holdings are irrigated by water and based upon a very much less labor-intensive system than that on which the falaj depends in its present form. Generally speaking a number of negative side effects of the newly established farm have been ob-served. These can be summarized as follows:
1. Establishment of many new wells has disrupted the quality of the groundwater.
2. Essential reciprocal behavior in economic and social relations between individuals in the falaj community, or between them and the nomadic population are altering.
3. Under present conditions man-aging a farm in the old aflaj ir-rigated farm and that in a new well irrigated farm may favor the later.
Factors both external and internal to the falaj community settlement appear to be accelerating the rates of change. The external factors includ-ed first, the removal of power from the interior to the coast, effectively from the local to the national center of Oman. Second, economic diver-
sification resulting locally in access to wider markets and the wider cir-culation of cash. Third, widespread labor migrations seeking high salary . Internally, the village demographic structure, upon which the upkeep of the falaj, the local division of labor and the successful flow of farming year depend, has been disrupted by rapid out-migration.
The overall picture drawn from reviewing of farming systems in Oman reveals the important of wa-ter resources. Thus, the recommen-dations of this paper may help to find solutions to some high priority problems. However, attempts to un-dertake these actions require careful consideration of prevailing social rules and habits. It is well recognized that any suggested changes of an existing system may bring problems of greater complexity.
REFERENCES
Costra, M and T. J. Wilkinson. 1987. Traditional Methods of Water Supply. The Journal of Oman Stu-diies, vol. 9. Ministry of National Heritage and Culture, Oman.
Dutton, R. W. 1984. Modernizing Falj irrigation system: A proposal for a Dhahira action research cen-ter. Center for overseas research and development, University of Durham.
Hayder, A. and I. M. Adel-Magid. 1993. Water conser vat ion in Oman. Water international 18: 95-102.
Hayder, A. and A. Omezzine. 1996. Aflaj Water Resources Manage-ment: Tradable water Rights to Improve Irrigation Productivity. Water International, 21, 70-75.
Japan International Cooperation Agency (JICA). 1990. The Study on a master plan for agricultural development. Sultanate of Oman. Final Report, Vol. 5.
MAF. 1995. The Progression of Ag-ricultural and Fisheries Develop-ment from 1970 to 1995. Ministry
of Agriculture and Fisheries, Sul-tanate of Oman.
Marshudi A. 2000. Aflaj Water Re-sources Mangement: Operation and Improvement of the Aflaj Sys-tem in Oman. First International Symposium on Qanat. Yazd, Iran
Ministry of Water Resources. 1997. Wells Inventory. Sultanate of Oman.
MRMEW, Ministry of Regional Municipality, Environment and Water. 2002. Aflaj Inventory Re-port. Sultanate of Oman.
Norman, W. R. and W. H. Shayya. 1997. Aflaj irrigation water man-agement and efficiencies: a case study from northern Oman. The third Gulf water Conference. “Toward efficient utilization wa-ter resources in the Gulf”. Vol II Muscat, Sultanate of Oman.
Rosegrant, Mark W. 1993. Commen-tary. Markets in tradable water rights could improve irrigation production in developing coun-tries, IFRI Report, Vol. 15, No. 2, 1993.
Statistical yearbook, various issues. Ministry of national economy, Sultanate of Oman.
Stanger, G. 1985. Coastal Saliniza-tion: A case study from Oman. Agriculture Water Management Journal, vol. 9, pp. 269-86.
Suttan, Sally. 1984. The Falaj- A Traditional cooperative system of water management, Waterline, Vol 2, No.3.
University of Durham. 1982. Agri-culture, Research and Develop-ment Surveys, Northern Oman, Final Report, Vol. IV, A.
Wilkinson, J. C. 1977. Water and Tribal Settlment in Southeast Ara-bia. Oxford Research Studies in Geography, Clarendon Press.
Zaibet, L. and A. Omezzine. 1997. A comparison of economics and Engineering Efficiency in Modern Irrigation in Oman. 37, 99-107.
College of Agriculture. 1995. Tra-ditional agriculture and Fishing in the Sultanate of Oman. Sultan
(continued on page88)

AGRICULTURAL MECHANIZATION IN ASIA, AFRICA, AND LATIN AMERICA 2007 VOL.38 NO.174
Prospects of Maize Cultivation Mechanization in Hills of Himachal Pradesh
bySukhbir SinghAssistant Agricultural EngineerDepartment of Agricultural Engineering,Ch. Sarwan Kumar H.P. Krishi Vishvavidyalaya,Palampur - 176 [email protected]
Dinesh Kumar VatsaAssistant Agricultural EngineerDepartment of Agricultural Engineering,Ch. Sarwan Kumar H.P. Krishi Vishvavidyalaya,Palampur - 176 [email protected]
AbstractMaize is one of the major crops
of Himachal Pradesh as it is grown in 80 % of the net cultivated area with average yield of 2 t/ha. Re-search work in the development and dissemination of engineering technologies carried out to mecha-nize the maize cultivation for the state can play dominant role in aug-menting and sustaining the maize production. Seed-bed preparation with power tiller rotary has en-hanced the crop yields by 25-30 % in comparison to bullock plough-ing and the practice of rota-tilling for maize cultivation is becoming popular among the farmers of this region. Mechanical maize sowing by multicrop planter/manual planter ensured proper crop stand and gave 10-15 % increased yield compared to kera and broadcasting. Similarly, weeding, earthing up and shelling operations by wheel hand hoe, hand ridger/power ridger and different type of shellers produced better results as well as saved labour and
time, respectively. This means that the various operations needed for increasing maize yield have to be mechanized, not necessarily with the costly automatic equipment, but with suitable improved implements suited to local conditions.
IntroductionMaize (Zea Mays) is one of the
important kharif crops of the Him-achal Pradesh, which is grown in 80 % of the net cultivated area with an average yield of 2 t/ha (Anon, 1998) under rainfed conditions. In the maize crop, conventional prac-tices are followed for most of the farm operations, which consume maximum time, energy and cost as well as increase drudgery to the farmers and farm labourers. Also raising of draft animal power is becoming very costly, resulting in enhanced cost of farm operation and ultimately decreasing net returns to the farmers (Varshney and Bohra, 1989; Gupta and Verma, 1990). In
neighbouring plain areas bullock power on the farms of small and marginal farmers is decreasing and the custom-hire system of tractor power is increasing. This system is not feasible, as such, to the hill re-gion because of unique topography and small plots. For this reason, the young farmer generations in many cases are more and more unwilling to stay on farms. A few countries like China, Japan, Thailand, Philip-pines and Taiwan started the agri-cultural mechanization programme with the introduction of the power tiller and they have replaced the draft animal power significantly
Fig. 1 Seedbed preparationwith power tiller

VOL.38 NO.1 2007 AGRICULTURAL MECHANIZATION IN ASIA, AFRICA, AND LATIN AMERICA 75
(Chancellor, 1971; Depeng et al., 1983; Peng, 1983; Singh, 1983). Such a power source may lead to farm mechanization and reducing human physical strain for all the farm operations in the hilly region also. Better cultivation practices, plant protection measures and bal-anced fertilizer application play a significant role in augmenting the yields. Nevertheless, the adoption of improved processes and modified implements is equally important for better germination, proper plant stand and interculturing, which are the pre-requisites for good crop yields. It is the need of the hour and a challenge to change the agricultur-al strategy for increasing crop yields through appropriate mechanization to meet the food grain requirement of increasing population.
Research conducted by the sci-entists on different aspects reveals that decisively higher yield can be obtained by the vigorous introduc-tion of improved tools and tech-niques. However, it is confronted by technological, economical, physical and social constraints, which must be overcome in order to achieve and maintain production at par with the other leading countries producing maize. This means that the various
operations needed for raising the maize crop yield have to be mecha-nized not necessarily with the costly automatic equipment, but with im-proved implements suited to local conditions. To explore the possibil-ity of mechanizing maize cultiva-tion, different farm operations have been reviewed so that hill farmers may benefit.
Mechanization Prospects in Maize CultivationSeed Bed Preparation
Land preparation in maize plays a significant role in crop establish-ment (Maurya, 1988). The seedbed preparation including ploughing, planking, FYM application and clod breaking take up nearly 31 % of the total power required for cultivating maize (Singh, 2002) and hence the choice of the type of implement for seedbed preparation will strongly the cost affect of maize production. The requirements of a good seedbed are:
i. Fairly deep cultivated, fine and well pulverized;
ii. Clear of trash, straw, roots,
grasses and stubbles of previous crop, which may hamper
mechanical sowing;iii. Ample moisture at the time of
sowing;iv. Levelled for efficient and judi-
cious use of irrigation water and effective working of sowing machines; and
v. Properly packed and planked to achieve fine tilth and to con-serve moisture in the soil.
In hills, farmers mostly use a bullock drawn indigenous/soil stir-ring plough for seedbed prepara-tion. In most of the region, there is a problem of clod formation after ploughing in clay loam soil and then farmers have to apply extra labour and time for clod breaking which ultimately increases cost of opera-tion with higher drudgery. Field ex-periments conducted by Vatsa and Singh (1997) to study the effect of seed bed preparation on the tradi-tional bullock drawn system and improved power tiller systems for maize (Table 1) reveals that there is a significant saving in cost, time and energy with the power tiller system. Table 1 also indicates that the field capacity of the power tiller rotavator
ParametersPower tiller system Bullock system
Rotavatorx 2
Plankerx 1
SS ploughx 2
Plankerx 1
Effective field capacity, ha/h 0.085 0.21 0.026 0.20Field efficiency, % 75.10 75.26 53.4 71.68Labour requirement, man-h/ha 11.75 4.76 38.46 5.00Cost of operation, Rs/ha 816.0 145.9 1,507.70 198.10Yield, q/ha 27.50 21.22
Table 1 Comparison of power tiller and bullock farming systems
Source: Vasta and Varma (1997)
ParameterSowing techniques
PT MCP Manual planter Kera Broad-
castingDepth of seeding, mm 49 47 53 22Actual seed rate, kg/ha 22 23 27.9 28Effective field capacity, ha/h 0.175 0.078 0.033 0.027Labour requirement, man-h/ha 12 38.46 90.9 111.11Cost of seeding, Rs/ha 417.50 350 850 1,100Yield, q/ha 28.4 27.1 26.5 24.6
Table 2 Performance of different sowing techniques
Source: Vasta and Varma (1997)
Fig. 2 Power tiller operated multicrop planter and manual planter in operation

AGRICULTURAL MECHANIZATION IN ASIA, AFRICA, AND LATIN AMERICA 2007 VOL.38 NO.176
(Fig. 1) was 3.27 times more than the field capacity of bullock plough-ing with a soil stirring plough. How-ever, the field capacity and cost of operation of planker is almost same for both the power tiller and bullock systems.
Statistical analysis showed that yield under rotatilling twice was significantly higher than the yield under ploughing twice with bull-ocks. Seedbed preparation with power tiller rotavator should be done to achieve fine tilth. By use of rotavator the problem of clod forma-tion solved and crop yields can be enhanced by 25-30 %.
Sowing and PlantingSowing and establishing proper
plant stand is the most crucial re-quirement in maize cultivation. On the other hand, farmers using the Kera and broadcasting method of sowing results in poor germination, higher labour involvement and cost. For successful planting of maize, field experiments conducted under AICRP on FIM (Power tillers) on use of the power tiller multi-crop planter (Fig. 2) and manual planter (Fig. 2) indicate that planter can
save 6-7 times labour and 50-60 % cost of operation over traditional sowing (Table 2). There was an increase in yield also due to better plant germination and stand.
Weeding and Earthing upWeeds compete with the crop
plants for soil nutrients, moisture, light and space. Unless weeds are controlled in time, the crop yields reduce drastically. Generally, weed-ing is done by using khurpi, spade and kudal. The output of these tools is very low and involves great drudgery. By the use of improved weeding tools and implements, weeds can be controlled effectively and timely resulting in higher pro-duction and productivity. The hoe-ing should be done with the wheel hand hoe sweep and tyne type (Fig. 3). Field studies at the Himachal Agricultural University show that the wheel hand hoe double tyne type gives better performance compared to sweep type and local khuntti (Table 3).
The maize crop requires earthing up at least two times. At present this operation is done by manual labour. Therefore, there is a need to mecha-nize this operation by introducing a suitable hand ridger/power ridger.
SprayingPlant protection measures are
imperative in saving the maize crop from insects and pests. Many dif-ferent kinds of spraying and dust-ing machines are available to meet the requirements of agriculturists in controlling insects, disease and weeds. The common type of sprayer is the knapsack sprayer, which can be used in hilly areas. It is provided with a pump and large air chamber permanently mounted in a 9 to 22.5 liter tank. One man can spray about 0.4 hectare in a day thus spraying about 90 liters of liquid. Engine operated, shoulder mounted spray-ers are available which are ideal for spraying operations. Since they are very precise in their operation, good care is required in their operation. Where dusting is to be done for the control of pests, manually operated crop dusters are quite effective.
HarvestingTimely harvest ing of cereals
crops reduces the risk of weather hazards and clear the fields for the next operations. The most com-mon harvesting tool in Himachal Pradesh is the plain sickle used by the farmers, which has lower capac-ity and higher drudgery. The plain sickle with impact action is used for harvesting maize, which gives
Name of the weederField
capacity, ha/h
Weeding efficiency,
%Man-h/ha
Cost of weeding,
Rs/haWheel type hoe (sweep type) 0.020 82.5 50 375Wheel hand hoe (single tyne type) 0.018 83.4 56 420Wheel hand hoe (double tyne type) 0.030 90.5 34 255Local Khuntti 0.004 80.5 250 1,875
Type of maize sheller Moisture content, % Grain, kg/h Shelling
efficiency, %Conventional mathod 20.8-22.0 8.33 100.00Octagonal tubular maize sheller 20.8-22.0 14.36 93.00Rotary disc type maize sheller 20.8-22.0 19.70 86.60Horizonal maize sheller 20.8-22.0 15.32 96.43Vertical maize sheller 20.8-22.0 16.80 98.24
Table 4 Comparative performance of hand operated maize sheller
Table 3 Performance of different type of weeders in maize crop
Fig. 3 Wheel hand hoe
Source: Annual Report

VOL.38 NO.1 2007 AGRICULTURAL MECHANIZATION IN ASIA, AFRICA, AND LATIN AMERICA 77
better performance as compared to serrated sickle with shear action. However, a power-operated harvest-er is the need of the hour to easily harvest the maize crop with reduced drudgery. A brush cutter has been used (Vatsa & Singh, 1998) to har-vest the maize and higher efficiency was recorded. An additional attach-ment is required with brush cutter to form windrow for easy collection of stalk.
Threshing/Shelling Shelling is the removal of grain
from the cobs by striking, treading or rubbing and shearing. By the use of various maize shellers, shelling of maize can be done easily and quickly. Beating and hand shelling are the most commonly used prac-tices by the farmers. Hand oper-ated horizontal and vertical maize shellers have been developed (Fig. 4) and evaluated with other meth-ods of shelling under NATP at the University (Table 4). Table 4 shows
that 72.38, 136.49, 83.91 and 101.68 % higher output can be achieved by using tubular maize sheller, rotary disc type, horizontal and vertical maize sheller than the conventional method, respectively.
Power operated maize sheller evaluated under AICRP on FIM scheme may be used for higher ef-ficiency. This machine consists of hopper, shelling rotors, sieves and blower. The grains are removed by impact and rubbing action between roller and concave grate. The blower helps in cleaning the grain. This maize sheller can be operated by a power source like the power tiller or an electric motor and engine (Fig. 5) and has a capacity of 18-20 q/h.
ConclusionThere is a good scope for mecha-
nizing the maize crop in the hills of Himachal Pradesh by adopting the improved implements for different operations suitable for hills which reduces the time, cost of operation, drudgery over traditional methods.
REFERENCES
Anonymous. 2002. Annual Report. NATP project- Development of small tools and equipments for mechanized hill farming. Depart-ment of Agricultural Engineering, CSKHPKV-Palampur (H.P.), In-dia. April 2001 to March 2002.
Chancellor, W. J. 1971. Mechaniza-tion of small farms in Thailand
and Malaysia by tractor hire ser-vices. Transaction ASAE. 14(5): 847-945.
Depeng, Kong, Ling Tongsen, and Zii Gaunggin. 1983. Small trac-tors in china. Agril. Mechaniza-tion in Asia, Africa and Latin America. 14(1): 44-48.
Gupta, M. L. and M. K. Verma. 1990. Comparative performance of power tiller and bullock farm-ing systems in hilly areas. Pro-ceedings of XXVI Annual Con-ventional of ISAE held at Haryana Agricultural University, Hissar, India.
Maurya, P. R. 1988. Comparison of tillage and conventional tillage under different soils and climatic condit ions in Niger ia. AMA. 19(2): 30-32.
Peng, Tien-Song. 1983. The devel-opment of agricultural mechaniza-tion and its strategies in Taiwan. Agricultural Mechanization in Asia, Africa and Latin America. 14(3): 71-74.
Varshney, A. C. and C. P. Bohra. 1989. Comparative field evaluation of power tiller and animal drawn equipment in wheat production. J. Agril. Engg. 26(1): 19-23.
Vatsa, D. K. and S. P. Singh. 1996. Effect of Various Sowing Tech-niques under Hilly Conditions. Journal of Hill Research. 9 (2): 255-261.
Vatsa, D. K. and M. K. Verma. 1997. Response of power tiller and bullock based tillage treatment on maize yield in hills of H.P. Journal of Hill Research 10(2): 136-141.
■■
Fig. 4 Horizontal and verticalmaize sheller
Fig. 5 Maize sheller operatedwith power tiller

AGRICULTURAL MECHANIZATION IN ASIA, AFRICA, AND LATIN AMERICA 2007 VOL.38 NO.178
Farm Mechanization in Andaman and Nicobar IslandbyM. DinSr. ScientistCentral Agricultural Research Institute,P.O. Box # 181, Port Blair - 744 101, [email protected]
N. RavisankarScientistCentral Agricultural Research Institute,P.O. Box # 181, Port Blair - 744 101, AndamanINDIA
P. S. DeshmukhScientistCentral Agricultural Research Institute,P.O. Box # 181, Port Blair - 744 101, AndamanINDIA
S. Ghoshal ChoudhuriHead (NRM)Central Agricultural Research Institute,P.O. Box # 181, Port Blair - 744 101, AndamanINDIA
AbstractThis paper describes the status of
constraints in amenability to agri-cultural mechanization with respect to cropping pattern, labour avail-ability and manufacturers of imple-ments. During monsoon, a single crop of rice is taken in 10,599 ha of total cultivable land, out of which 47 percent is brought under cultivation more than once in dry season. The present production is not sufficient to mitigate the requirement of grow-ing population due to the limited rain fed area for cultivation and low level of mechanization. The share of human and animal power is highest at 57.32 percent followed by mecha-nized power at 42.68 percent and the availability of farm power per hectare is only 0.40 kW. Primitive types of and low capacity animal drawn implements are being used for agriculture, horticulture and forestry. The farm mechanization is very poor in terms of mechani-cal power, matching and efficient
implements and equipment drawn by draft animal power, power til-ler and tractor, water management, renewable energy and post harvest activities. Topography, location and proper input non-availability are constraints. Despite them, there is a great need and effort to increase the productivity of food production by proper mechanization inputs.
IntroductionThe Andaman and Nicobar group
of islands are located in the Bay of Bengal on 6º to 14º N and 92º to 94º E. There is a variety of soil texture ranging from sands along the seacoast to heavy clays in low lands. These islands have maritime climate with temperature between 23.4-30.03 ºC and mean relative hu-midity of 78.4 percent. Annual rain-fall of 3,180 mm has temporal and spatial variation. Out of the total geographical area of 8,249 sq. km, 86 percent is under tropical rainfor-
est and 6 percent is under rain fed agriculture. The islands are not self-sufficient in food production. To feed an estimated population of 0.62 million by 2020, about 83,000 tons of rice is required - production of which is a great challenge. Seventy nine percent of total farmers have not more than 4 ha of land.
Buffaloes/bullocks and agricul-tural workers are the major source of farm power and the farmers still walk behind the plough that is pulled by a pair of buffalo/bullock. Their potential is under utilized due to non-availability of matching implements. Tractor population is low. Farm mechanization is at a low level due to non-availability of im-proved farm machinery and trained operators. There are more losses in post harvest handling, processing, drying, storing, packing and poor marketing.
To increase food production, pro-ductivity of land and labour need to be increased considerably, which will require both higher energy in-

VOL.38 NO.1 2007 AGRICULTURAL MECHANIZATION IN ASIA, AFRICA, AND LATIN AMERICA 79
puts and better management of food production systems. Present level of production can be enhanced through mechanized farming by taking three crops in a year without damaging or depleting the natural resources on which all types of agriculture usu-ally depend.
Status of AgricultureRice is the principal cereal crop of
Andaman and Nicobar islands. Out of the total 50,000 ha available land for agriculture and allied activities, only a single crop of rice is being taken in 10,599 ha during the mon-soon period. The climatic condi-tions permit the raising of two crops from May to December, since a large amount of rain is received dur-ing this period. A third crop can be grown during the dry period (Jan-April), which is suitable for raising vegetables/pulses by conserving moisture in-situ and providing pro-tective irrigation to crops (Gangwar et al., 1990; Gangwar and Bandyo-padhyay, 1996). The coverage of different crops and their production is given in Table 1. The average yield of rice was about 2.68 t/ha.
Presently, 47 percent of paddy area is brought under cultivation more than once, mainly with pulses, oil-seeds and vegetables in dry season. Nearly 80 percent of the cultivable area is suitable for plantation crops like coconut, areca nut, spices and tropical fruits like banana, papaya, mango, guava, jackfruit, custard ap-ple and pineapple, due to undulating topography and congenial climatic condition. The area under vegeta-bles can be increased up to 1.7 times of present area by using paddy fal-low land in dry season through use of improved implements and soil moisture conservation techniques. By following these practices, crop-ping intensity can be enhanced to 200-300 percent and productivity of rice and vegetables can be increased with the aim to make these islands self-sufficient.
Animal husbandry supports ag-riculture in the form of draught animal power (DAP). Farmers also raise goats, pigs, poultry and rabbit (Table 2). Numbers of farmers are following the concept of integrated farming in these islands for opti-mum use of land.
Status of MechanizationFarm Operations
The traditional cultivation prac-tices consists of various operations which are carried out by hand tools and implements adopted by farmers owning bullocks/buffaloes and trac-tors for crop production.
Tillage: Land preparation for rice production is the most power intensive operation. The indigenous (wooden) plough and planker are the main animal drawn implements (Table 3). Three types of indigenous plough (locally made) are being used in the preparation of seedbed and sowing. These types of ploughs have very low field capacity (30-40 h/ha). A minimum of three to six passes are made for land prepara-tion of paddy and after crops and requires more time and drudgery. The dropping of seed behind the plough does the sowing/planting. This method not only consumes more labour but it adversely affects the crop yield. Wooden puddlers are used for puddling. The clod breaking after opening the land is a severe problem, particularly after harvest of paddy. Most of the farm-ers are using traditional plankers
Crop Area,ha
Production, tons
Yield,t/ha
Rice 10,599 28,367 2.68Pulses 878 310 0.35Oilseeds 167 73 0.44Vegetables 3,880 18,000 4.44Coconut 24,996 88.20* 20**Areca nut 4,000 6,100 1.53Fruits 3,987 17,500 4.39Black pepper 428 67 0.16Clove 93 1.57 0.02Cinnamon 49 10.37 0.21Cashew nut 800 262 0.23Ginger 385 1,198 3.11Sugarcane 148 4,662 31.5Gross cropped area 50,410Net criopped area 40,382
Table 1 Area and production of various crops
Category Number
Cattle 60,180Male over 3 years 16,048Male young stock 9,155Female 34,977
Buffalo 14,204He-buffalo over 3 years 4,729He-buffalo young stock 1,822She-buffalo 7,653
Goats 70,923Pigs 42,836Horses and Ponies 8Donkeys 7Rabbits 162
Table 2 Animal population
* Million nuts, ** Nuts/palm/yrSource: A status report of directorate of agriculture, Andaman and Nicobar administration (2000)
Source: A status report of directorate of agriculture, Andaman and Nicobar administration (2000)

AGRICULTURAL MECHANIZATION IN ASIA, AFRICA, AND LATIN AMERICA 2007 VOL.38 NO.180
for clod breaking in paddy fields for sowing of vegetables/pulses.
Transplanting: Transplanting is done manually with raised nursery. Farmers generally transplant indig-enous, long duration paddy varieties with maximum 60-day-old seed-lings at their convenience. In some areas, vegetables/pulses/oilseeds follow paddy. The costly labour prohibits farmers to go in a big way for more of crops. Drills/planters are not available with the farmers surveyed. Other than paddy, all field crops are generally transplanted/planted in furrow opened by plough.
Inter-culturing: Due to conducive atmosphere for growing of flora, all types of weeds and mushrooms grow in the paddy and vegetables fields. Interculturing is a very tedious, en-ergy intensive and time consuming operation carried out manually. In paddy, uprooting of weeds is done while in vegetable/pulses, oilseed interculturing is done with the help of traditional hand hoe (khurpa). Herbicides are applied in paddy.
Plant protection: The incidence of pest and diseases are greater because the high humidity is condu-cive for their growth. Plant protec-
tion is done by sprayers and dusters, which are available on a rent basis from the Department of Agriculture. The technical knowledge of farm-ers on use of chemicals is very low. High spray volume and inefficient spraying technique for chemicals is proving costly to humans and, in the long term, may be to ecology also. Farmers are using the chemicals in a big way because the Department of Agriculture is supplying them free/at a nominal rate. Proper awareness of the use of chemicals is the need of the hour.
Harvesting: Harvesting is an ar-duous function to perform. Farmers use plain sickles for harvesting of crops and grasses because only these are available at a low cost. The out-put through the sickle is low and the effort required in cutting operation is high. Horticultural produce is also harvested manually.
Threshing: Threshing of paddy is done manually or by animal tram-pling. By this method, losses are quite high. Man and animals get fatigued during threshing opera-tion due to tropical climate. Pedal threshers are available only in the Department of Agriculture.
Post harvest operations: Farmers are following the traditional method for drying of paddy, coconut and areca nut. Rice is hulled by hullers in which breakage of grains is high. Uncertainty of rain makes it diffi-cult to dry rice under sun. Coconut and areca nut are dried in smoke dryer, which degrades the quality. The post harvest losses in quality and quantity of rice are very high as farmers have their own way of par-boiling, storing and processing farm products. There is no modern rice mill, coconut oil extraction plant, cashew-processing plant, pulse mill or processing equipment for spices.
It shows that transplanting; in-terculturing, harvesting, threshing, drying and winnowing are done manually both on the animal and tractor farm. Transplanting, inter-culturing and harvesting are the most labour intensive, drudgery-laden and expensive operations in rice production. The use of im-proved farm implements is very low in the Islands as compared to main-land India. Primitive types of hand tools are being used for agriculture, horticulture and forestry.
Implements NumberWooden plough 10,309Soil string plough 333Sprayer/duster 1,914Planker 8,351Wooden puddler 65Diesel engine pump set (5.0 hp) 881Electric pump set (1.0 hp) 36Tractor 121Power tiller 12Disc harrow 16Thresher 141Sugarcane crusher 172Ghanis 22Secateur 2Grafting and budding knife 7Garden hoe 1,455
Source of power Number Average power, hp
Available power, hp
Agricultural worker 19,514 0.1 1,951.4Male cattle over 3 years 16,048 0.5 8,024.0He-buffalo over 3 years 4,729 0.5 2,364.5Tractor
a. Agriculture office 65 45.0 2,925.0b. Farmers owned 56 30.0 1,680.0
Power tillera. Agriculture office 4 12.0 48.0b. Farmers owned 8 12.0 96.0
Diesel engine 881 5.0 4,405.0Electric motor 36 1.0 36.0Total available power, hp 21,529.9Net cropped area, ha 40,382Per hectare power available, kW 0.40
Table 3 Agricultural implements and hand tools
Source: (i) Live stock census 1997, Directore of animal husbandly and veter inary services, Andaman and Nicobar administration, (ii) A status report of directore of agriculture, Andaman and Nicobar administration (2000)
Source: Basic statistics (1996), Directore of economics and statistics, Andaman and Nicobar administration
Table 4 Major sources of farm power

VOL.38 NO.1 2007 AGRICULTURAL MECHANIZATION IN ASIA, AFRICA, AND LATIN AMERICA 81
Manufactures/Workshop FacilityFabrication of hand tools like
khurphi, spade, garden hoe, dab, coconut dehusker areca nut cutter, crowbar, pick axe, rake, digging hoe, grass cutter blade, plane sickle, wooden plough, wooden harness, wooden planker and wooden pud-dler, is done by local artisans only. There is no genuine workshop for repair of animal, power tiller and tractor drawn implements
Farm Power AvailabilityThe availability of farm power
per unit area (kW/ha) has been considered as one of the parameters for expressing level of mechaniza-tion. At present, the availability of farm power is 0.40 kW/ha (Table 4) in the islands whereas the national average is about 1.29 kW/ha as re-ported by Singh (2001). The study revealed that human and animal power is higher at 57.32 percent, while the mechanized power is only 42.68 percent. The availability of farm power in the islands is very low and has much need for further mechanization. Agricultural work-ers, draught animals, power tillers, tractors, diesel engines and electri-cal motors are the sources of farm power. These are as discussed be-low.i. Human and Animal Power Sources
Agricultural workers are the main source of farm power for op-erating hand tools and implements. They are utilized for operations like seed bed preparation, seeding/transplanting, fertilizer application, ridge formation, dusting/spraying of insecticides/herbicides, water lifting, intercultural operations, harvesting, on-farm transportation, threshing and winnowing. As per 1991 census there were 19,514 ag-ricultural workers in these islands and it is estimated that 1951.4 hp is available from agricultural work-ers, assuming that average power developed by agricultural worker is equivalent to 0.1 hp. Thus hu-
man power contributes 9.07 percent of the total farm power available (Table 4).
Male bullocks and buffaloes are the main source of draught animal power (DAP). In the year 1997, the total population of bullocks and he-buffaloes aging over 3 years of age, were 16,048 and 4,729, respectively. They were used as draught animals by the farmers and are subjected to various agricultural operations like tillage, puddling, sowing and threshing. Buffaloes are also used for lifting of woods from the forest. Considering that a single bullock/buffalo can develop approximately 0.5 hp, the total DAP is 10,388.5 hp. At present, the draught animals con-tribute 48.25 percent of total farm power. This shows that DAP con-tributes higher than other mechani-cal sources. It appears that animal power will continue for more years in maxim. ii. Mechanical Power
The second important source of farm power is mechanical power, which is available through tractors, power tillers and diesel engines and electrical motors. As the farmers of these islands are economically back-ward and have smallholdings, they are not in a position to purchase tractors and power tillers them-selves. Therefore, since 1987-88 the government has provided 30 percent subsidy for the purchase of tractors and power tillers (free transportation) under promotion of agriculture mechanization. In this scheme, a total of 56 tractors and 8 power tillers have been provided to farmers. Three matching improved implements like seed-cum-fertilizer drills, puddlers, cage wheels and trailer are given to farmers with the tractors. Besides this, the agricul-ture department has 65 tractors and 4 power tillers. The government provides tractors at the concessional rate of $2.22/hr on a custom hir-ing basis, whereas farmers having their own tractor charge of $4.44/hr. Some of the farmers use tractors on
a custom hiring basis for tillage and puddling operation. Thus, tractors are replacing the draft animals to some extent. At present, 56 tractors of 30 hp, 65 tractors of 45 hp and 12 power tillers of 12 hp are in use for agricultural operations. The total number of diesel engines supplied by the Government of India on sub-sidy is 881 of 5 hp each and this is equivalent to 4,405 hp. Pumps are used for pumping irrigation water. Thus, the total mechanical power worked is 9,154 hp. There are 36 electrical pumps (1 hp each). The pumps are used for irrigation. Thus, the mechanical sources contribute 41.75 percent of total farm power available.
Mechanization PotentialThe farmers face difficulties in
timely completion of field prepara-tion for an area of 10,599 ha under paddy spread all over the union ter-ritory due to shortage of labours, draught animals and mechanical power. Thus, the production of rice is often hampered by lack of mechanization inputs like improved implements for tillage operation, puddling, sowing, interculturaling, harvesting, threshing, modern rice milling and of irrigation equipment.
The farm power availability at 0.40 kW/ha has potential for in-crease, as it is much below the na-tional average of 1.29 kW/ha. There is tremendous need for the tractor, lightweight power tiller and their matching implements to increase the cropping intensity. In these islands, animal power utilization is only 300- 400 hours annually (as against ideal utilization of 2,500 hours) due to the limited period of use for tillage, sowing, and puddling operations. For a very less time, they are used for transportation. Farmers have to spend the money on the main-tenance of draught animals for the entire year. Thus, the animal power is wasted without its optimum uti-
AGRICULTURAL MECHANIZATION IN ASIA, AFRICA, AND LATIN AMERICA 2007 VOL.38 NO.182
lization. However, it is not possible to replace completely the animal power with the mechanical power. Besides, the islands have a good number of draft animals as Animal Husbandry supports agriculture in the form of draught animals. To maintain an eco-friendly system in these islands, there is a need to test and popularise animal operated improved matching implements for tillage, sowing, transplanting, and intercultural operations. This will increase the efficiency of animal and reduce the drudgery of framers.
Efforts to increase rice production should focus on minimizing losses that occur during harvest and post-harvest operations like threshing, transporting, drying and storing. It is estimated that about 10 percent of paddy produced is lost in the above operations including milling. Rice yield could be increased by 2 percent with improved mechanical drying, 1-2 percent by the modern methods of parboiling and mechani-cal drying and 2-3 percent with im-proved milling equipment. The sur-plus vegetable and fruit production could be processed and utilized for dry season. Seasonal, leafy vegeta-bles and fruits like mango, jackfruit, coconut, pineapple and milk could be used for value addition, resulting in island organic products. This will help in reducing the supply-demand deficit in non-availability season.
There is a great need and effort to increase the productivity of paddy, pulses, oilseeds, horticulture and forestry by use of matching imple-ments like mould board plough, ridger plough, patella harrow, cul-tivator, disc harrow, animal drawn puddlers, sowing and planting ma-chines, hand wheel hoe, improved sickles and power operated thresher and winnower.
Conclusion and Sugges-tions
The agricultural mechanization
in the islands, is still in its infancy, has tremendous potential and mer-its immediate attention. There is tremendous scope for agricultural mechanization through the use of improved matching implements for animal, power tiller and trac-tor drawn implements, and the optimum utilization of alternative and renewable energy sources for increasing cropping intensity and boosting production without causing any harm to the fragile ecosystem of these islands. Some suggestions for enhancing the pace of mechaniza-tion in these islands are as follows.
i. Development of a proper agri-cultural engineering package for these islands.
ii. The technology of equipment from other research organiza-tions needs testing, evaluation and modification for their adop-tion to island conditions.
i i i . Demonst rat ions on DAP, power tillers and tractor drawn implements should be arranged at the farmers field and farmers should be trained regarding the operation and maintenance of these improved implements.
iv. Creation of repair facility with a supply of genuine spare parts of farm machinery. Small-scale manufacturers of implements should be encouraged.
vii. Research and development ac-tivities in post harvest and agro processing should be enhanced.
viii. Proper harnessing of human and animal power is required to utilize its full available potential for sustainable agricultural pro-duction maintaining the crucial eco-balance.
REFERENCES
Anon. 1996. Basic Statistics. Direc-torate of economics and statistics, Andaman and Nicobar Adminis-tration.
Anon. 1997. Live stock census, Di-rectorate of Animal Husbandry
and Veterinary services, Anda-man and Nicobar Administration.
Anon. 1997-98. Annual report, Cen-tral Agricultural Research Insti-tute, Port Blair.
Anon. 2000. A status report of Di-rectorate of agriculture, Andaman and Nicobar Administration
Gangawar. B. and A. K. Bandyo-padhyay. 1996. Agricultural pro-duction manual for Andaman and Nicobar islands, Central Agricul-tural Research Institute.
Gangawar. B., A. D. Mongia, and A. K. Bandyopadhyay. 1990. Rice based cropping systems for Bay islands, Central Agricultural Re-search Institute, Port Blair.
Singh, Gajendra. 2001. Relationship between mechanization and Ag-ricultural productivity in various parts of India. AMA, Vol. 32(3): 68-76
■■
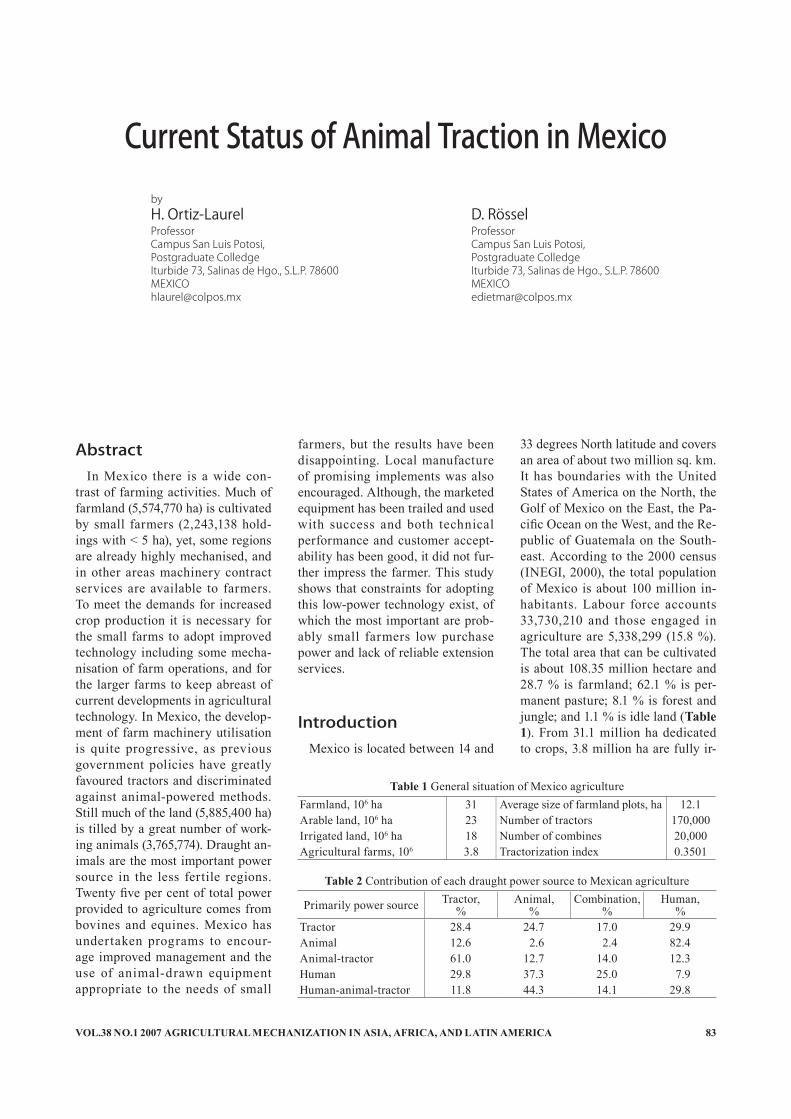
VOL.38 NO.1 2007 AGRICULTURAL MECHANIZATION IN ASIA, AFRICA, AND LATIN AMERICA 83
Current Status of Animal Traction in MexicobyH. Ortiz-LaurelProfessorCampus San Luis Potosi,Postgraduate ColledgeIturbide 73, Salinas de Hgo., S.L.P. [email protected]
D. RösselProfessorCampus San Luis Potosi,Postgraduate ColledgeIturbide 73, Salinas de Hgo., S.L.P. [email protected]
AbstractIn Mexico there is a wide con-
trast of farming activities. Much of farmland (5,574,770 ha) is cultivated by small farmers (2,243,138 hold-ings with < 5 ha), yet, some regions are already highly mechanised, and in other areas machinery contract services are available to farmers. To meet the demands for increased crop production it is necessary for the small farms to adopt improved technology including some mecha-nisation of farm operations, and for the larger farms to keep abreast of current developments in agricultural technology. In Mexico, the develop-ment of farm machinery utilisation is quite progressive, as previous government policies have greatly favoured tractors and discriminated against animal-powered methods. Still much of the land (5,885,400 ha) is tilled by a great number of work-ing animals (3,765,774). Draught an-imals are the most important power source in the less fertile regions. Twenty five per cent of total power provided to agriculture comes from bovines and equines. Mexico has undertaken programs to encour-age improved management and the use of animal-drawn equipment appropriate to the needs of small
farmers, but the results have been disappointing. Local manufacture of promising implements was also encouraged. Although, the marketed equipment has been trailed and used with success and both technical performance and customer accept-ability has been good, it did not fur-ther impress the farmer. This study shows that constraints for adopting this low-power technology exist, of which the most important are prob-ably small farmers low purchase power and lack of reliable extension services.
IntroductionMexico is located between 14 and
33 degrees North latitude and covers an area of about two million sq. km. It has boundaries with the United States of America on the North, the Golf of Mexico on the East, the Pa-cific Ocean on the West, and the Re-public of Guatemala on the South-east. According to the 2000 census (INEGI, 2000), the total population of Mexico is about 100 million in-habitants. Labour force accounts 33,730,210 and those engaged in agriculture are 5,338,299 (15.8 %). The total area that can be cultivated is about 108.35 million hectare and 28.7 % is farmland; 62.1 % is per-manent pasture; 8.1 % is forest and jungle; and 1.1 % is idle land (Table 1). From 31.1 million ha dedicated to crops, 3.8 million ha are fully ir-
Farmland, 106 ha 31 Average size of farmland plots, ha 12.1Arable land, 106 ha 23 Number of tractors 170,000Irrigated land, 106 ha 18 Number of combines 20,000Agricultural farms, 106 3.8 Tractorization index 0.3501
Table 1 General situation of Mexico agriculture
Primarily power source Tractor,%
Animal,%
Combination, %
Human,%
Tractor 28.4 24.7 17.0 29.9Animal 12.6 2.6 2.4 82.4Animal-tractor 61.0 12.7 14.0 12.3Human 29.8 37.3 25.0 7.9Human-animal-tractor 11.8 44.3 14.1 29.8
Table 2 Contribution of each draught power source to Mexican agriculture
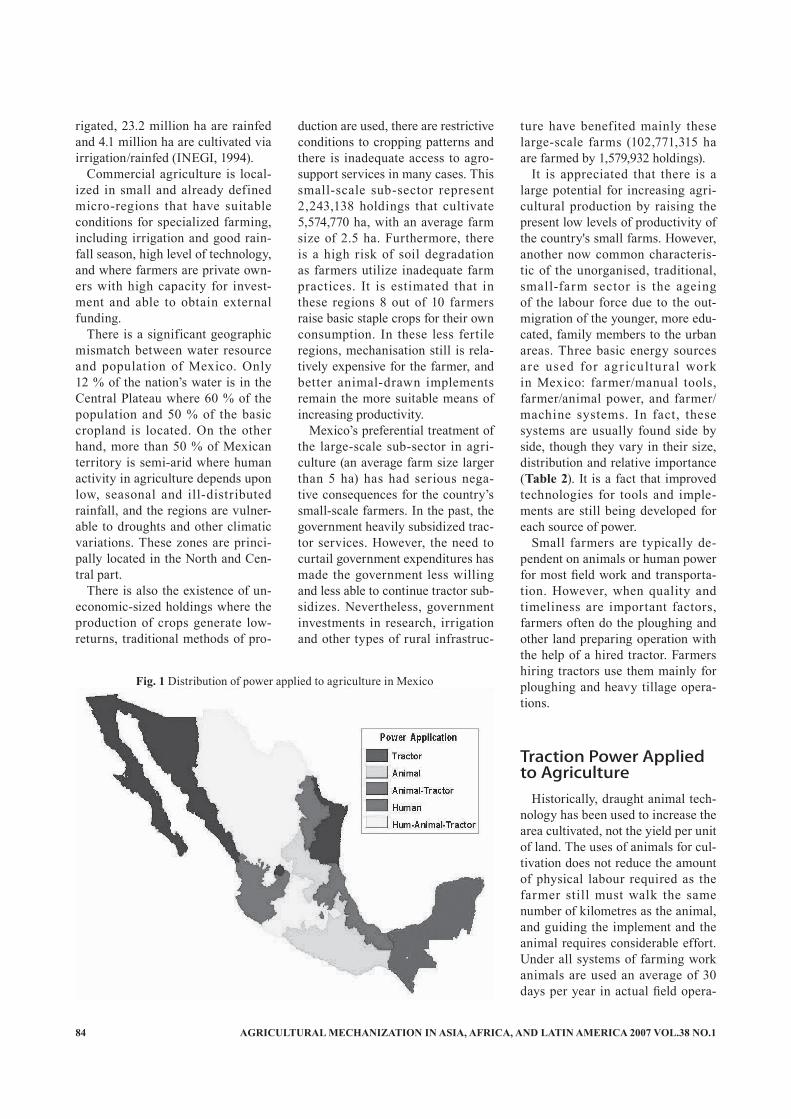
AGRICULTURAL MECHANIZATION IN ASIA, AFRICA, AND LATIN AMERICA 2007 VOL.38 NO.184
rigated, 23.2 million ha are rainfed and 4.1 million ha are cultivated via irrigation/rainfed (INEGI, 1994).
Commercial agriculture is local-ized in small and already defined micro-regions that have suitable conditions for specialized farming, including irrigation and good rain-fall season, high level of technology, and where farmers are private own-ers with high capacity for invest-ment and able to obtain external funding.
There is a significant geographic mismatch between water resource and population of Mexico. Only 12 % of the nation’s water is in the Central Plateau where 60 % of the population and 50 % of the basic cropland is located. On the other hand, more than 50 % of Mexican territory is semi-arid where human activity in agriculture depends upon low, seasonal and ill-distributed rainfall, and the regions are vulner-able to droughts and other climatic variations. These zones are princi-pally located in the North and Cen-tral part.
There is also the existence of un-economic-sized holdings where the production of crops generate low-returns, traditional methods of pro-
duction are used, there are restrictive conditions to cropping patterns and there is inadequate access to agro-support services in many cases. This small-scale sub-sector represent 2,243,138 holdings that cultivate 5,574,770 ha, with an average farm size of 2.5 ha. Furthermore, there is a high risk of soil degradation as farmers utilize inadequate farm practices. It is estimated that in these regions 8 out of 10 farmers raise basic staple crops for their own consumption. In these less fertile regions, mechanisation still is rela-tively expensive for the farmer, and better animal-drawn implements remain the more suitable means of increasing productivity.
Mexico’s preferential treatment of the large-scale sub-sector in agri-culture (an average farm size larger than 5 ha) has had serious nega-tive consequences for the country’s small-scale farmers. In the past, the government heavily subsidized trac-tor services. However, the need to curtail government expenditures has made the government less willing and less able to continue tractor sub-sidizes. Nevertheless, government investments in research, irrigation and other types of rural infrastruc-
ture have benefited mainly these large-scale farms (102,771,315 ha are farmed by 1,579,932 holdings).
It is appreciated that there is a large potential for increasing agri-cultural production by raising the present low levels of productivity of the country's small farms. However, another now common characteris-tic of the unorganised, traditional, small-farm sector is the ageing of the labour force due to the out-migration of the younger, more edu-cated, family members to the urban areas. Three basic energy sources are used for agr icultural work in Mexico: farmer/manual tools, farmer/animal power, and farmer/machine systems. In fact, these systems are usually found side by side, though they vary in their size, distribution and relative importance (Table 2). It is a fact that improved technologies for tools and imple-ments are still being developed for each source of power.
Small farmers are typically de-pendent on animals or human power for most field work and transporta-tion. However, when quality and timeliness are important factors, farmers often do the ploughing and other land preparing operation with the help of a hired tractor. Farmers hiring tractors use them mainly for ploughing and heavy tillage opera-tions.
Traction Power Applied to Agriculture
Historically, draught animal tech-nology has been used to increase the area cultivated, not the yield per unit of land. The uses of animals for cul-tivation does not reduce the amount of physical labour required as the farmer still must walk the same number of kilometres as the animal, and guiding the implement and the animal requires considerable effort. Under all systems of farming work animals are used an average of 30 days per year in actual field opera-
Fig. 1 Distribution of power applied to agriculture in Mexico

VOL.38 NO.1 2007 AGRICULTURAL MECHANIZATION IN ASIA, AFRICA, AND LATIN AMERICA 85
tions and more intensively at some times of the year than at others. The most crucial time is during the sea-son of land preparation and seeding. At this time, feed supplies are most limited in both quality and quantity. The problem is compounded by the fact that the ground is still very hard and temperature is often at the seasonal peak. The animals at this time may be able to work only very slowly or may be too weak to work at all. Consequently, land prepara-tion takes a long time and planting is delayed with a risk of the rains ending before the crop has matured. However, despite to the wide range of climatic, soil types, topography and agricultural production systems, draft animals are still widely used by small farmers. The distribution of power application in agriculture (Fig. 1) shows that human, animal traction, and a combination of me-chanical power and work animals systems are located in the low-re-source areas. This sharing of power source for farm work illustrates the level of technology achieved and draws the required action for im-provement (Rubio Granados, 2000).
According to INEGI, (1994) from the 3.8 million land holdings, 20.2 % employed tractors, 29.7 % used draught animals, 15.6 % employed a combination of animals and trac-tors, and 32.5 % used human force (Table 3). Also, 3.7 (6.25 %) out of 10 holdings owned a tractor. In the decade of 1970, 41 % of arable land was tilled by rented equipment and 35 % with tools owned by farmers. Tractors have been employed on highly productive ground, levelled and irrigated farms larger that 15 ha, and with access to machinery and service workshops.
Land size per holding is still very low in Mexico, as in 1991, 60 % of holdings were of 2.09 ha in size. INEGI, (1994) assumes that 62.2 % of agricultural land is still cultivated with draught animals and human force. Alternatively, 16 million ha of farmland are susceptible to be
farmed by mechanical power. Ac-cording to Masera, 1990, cropped farmland to produce maize em-ployed tractors on 20.0 %, a com-bination of animals and tractors on 31.0 %, draught animals on 34.1 % and human power on 15 %.
The animals have special impor-tance for efficient operation of small farms as they are mainly employed for ploughing, packing and cart pulling. The population of working animals had a fast stride after the 1910 civil war. This trend contin-ued until it reached a maximum in 1970 (Table 4). In the 20 years after 1970 the number of farm animals reduced by 46 %. Only recently were donkeys considered as work animals, because of the assumption was that they were used mostly as pack animals and did little traction work. Alternatively, human energy as power source for farm work has been associated with the slash-burning system and with traditional subsistence farming on very small and hillside plots.
Animal Traction ResearchThe main emphasis in this area has
been in development of improved mechanisation systems for the small-scale farmers. They are typically de-pendent on animals or human power for most fieldwork and transporta-
tion. The foremost ways through which the performance of draught animals as a source of power in ag-riculture can be improved are the design or improvement of the har-ness, research into the performance of soil engaging tools and improve-ments in the design of animal-drawn equipment (Ortiz Laurel, 1992). Studies about physiological and wel-fare (health and nutrition) aspects on animals have not been conducted because they are considered of less importance in the research centres in Mexico. Most of harnesses and ac-cessories needed for draught animals are produced locally including tillage tools. The most common method of harnessing bovines to an implement or cart is by means of a wooden yoke attached to the head, with the animals hitched in pairs abreast. In Mexico, the bovines do not gener-ally have humps, so the yokes are fastened to their horns (Fig. 2). Manufacture of the yoke is expressly on order. It is thoroughly hand-made and follows an artesian tradition. The cost of yoke varies from region to region regarding availability of local materials, it can be found from 50 to 70 USD. The most visible and common problem found in bovine teamwork is the size difference of animals hitched together.
Equines are fitted with the full collar harness, which is considered as the more comfortable and ef-
Type 1930 1940 1950 1960 1970 1980 1990Bovines 1,776,418 1,868,429 2,083,826 1,659,325 1,661,571 746,764 623,794Horses 641,742 480,143 976,006 978,508 1,426,170 653,418 865,853Mules 383,185 447,276 859,773 838,563 1,061,700 466,728 749,009Donkeys 1,527,118Total 2,801,345 2,795,848 3,919,605 3,476,396 4,149,441 1,866,910 3,765,774
Power source Holdings Farmland,000ha Power source Holdings Farmland,
000haTractor 828,258 3,492.6 Human 717,267 10,706.1Animal 796,785 5,885.4 Human-animal-tractor 444,940 2,440.9Animal-tractor 1,011,643 7,993.6 Total 3,798,893 30,518.6
Table 3 Numbers of holdings and agricultural land according to type of power source
Table 4 Population of work animals in Mexico
Adapted and updated from Cluz Leon (1994)

AGRICULTURAL MECHANIZATION IN ASIA, AFRICA, AND LATIN AMERICA 2007 VOL.38 NO.186
ficient device through which trans-mission of draught pull is fully achieved (Fig. 3). However, good management has been difficult to accomplish as mixed teams - horse and mule - are frequently seen and in some teams a marked difference in animals size was also observed. The cost of a full collar assembly ranges from 35-60 USD.
Research on the performance of drawn animal tools has been done at a local level and the results have had a little impact on reducing draught significantly but the cost of the mod-ified tool has increased because of special materials employed and ad-ditional maintenance required (Fig. 4). In addition, experiences obtained cannot extensively be applied to the wide range of different soil types and regional tools. Thus, research has focused on implement design with the idea that a suitable harness has to be complemented by light-weight implements (ploughs, cul-tivators, ridgers, harrows, seeders, etc.) coupled to a common frame.
Cultivation System Under Animal Traction
Power mechanization with con-ventional equipment is unlikely; however, to be economic in mar-ginal semiarid areas where the cash return per hectare is low. Thus, there was a growing interest in ani-mal draught systems, with the main emphasis in this field was in supply-ing low-power equipment to be used
with animals. For the equipment for small farms to be successful, it will be necessary for manufacture to be accurately made, low cost, prefer-ably made near the area of use. New options are now available to farmers because of recent improve-ments in the design of multipur-pose tool-bars, reversible ploughs, wheeled tool-car r iers (Fig. 5), seeders/fertilizers (Fig. 6) and disc harrows (Sims et al., 1988). It could be expected that better field equip-ment would mean that land could be cultivated in a shorter time with less effort, and crops sown earlier in the rainy season. The critical test of the economic worth of such equipment is whether or not the equipment's cost and performance characteris-tics make it in the self-interest of individual farmers to adopt it.
One of the challenges for farmers is to solve the technical problems for adopting the wheeled tool-carrier concept. Social/economic questions are probably more crucial since it will be uneconomical for the small farmer both to own a tool-carrier and still hire a tractor for heavy cul-tivation. Alternatively, several com-ponents on the equipment had to be strengthen because draught cattle used in Mexico are generally larger and stronger than in other countries, making it heavier and more robust than the original toolbar from which it was developed (Sims and Aragon Ramirez, 1989). Nevertheless, work is still proceeding to develop and adapt more implements in order that it may be more versatile.
Animal Traction Mecha-nisation Programs
Animal tools mechanisation pro-grams have had modest success in obtaining a commercial manufac-ture of new, improved equipment. Many significant mechanical in-novations have been invented and developed by small rural machine shops working closely with local farmers. The aim has been to reduce drudgery on the farms, to increase yields by improved timeliness of operation, and to improve the bal-ance of labour demand over the year. However, such programs have generally failed to establish a close and long term working relationship among researchers, farmers, and manufacturers to insure that the proposed equipment is cost-effec-tive. Since only when the necessary equipment is manufactured and sold can the farmer apply the recommen-dations arising from the research programme. The farmers expressed general appreciation for the tech-nical advantages of the improved implements, but faced serious finan-cial constraints due to low incomes and the lack of credit. Some of the factories make and sell the tools only when they receive orders and there is no effort to promote their equipment at field demonstrations or at farm fairs. Other manufactures expressed financial concerns and noted difficulties associated with technical ability and promotion and marketing. This is the case for wheeled tool-carriers that have been
Fig. 2 A hitched team of bovinescarrying cultivation work
Fig. 3 A team of horses usingthe full collar harness
Fig. 4 Field testing of an improvedanimal drawn tool

VOL.38 NO.1 2007 AGRICULTURAL MECHANIZATION IN ASIA, AFRICA, AND LATIN AMERICA 87
rejected because of their high cost, heavy weight, lack of manoeuvrabil-ity, inconvenience in operation, complication of adjustment and dif-ficulty in changing between modes.
The technical problems associ-ated with manufacturing the new equipment fall into three categories: availability of materials, knowledge of the fabrication techniques, and availability of the necessary equip-ment. Most manufacturers do not have the machine tools and other equipment needed to produce the implements, and awareness about prospect of sales may not justify in-vesting in new equipment.
Dissemination and Mar-keting Difficulties
Most manufactures do not con-duct a proper form of market sur-vey. They work exclusively on order, claiming that they are fearful of carrying large stocks because small farmers might have trouble paying. This reduces their willingness to anticipate future sales. Manufactur-ers recognise the role that improved animal-drawn tools could play in in-creasing their product range and re-ducing idle productive capacity. But they always point out the problems of the low and insecure purchasing power of the potential clientele in explaining why they fail to produce such equipment. On the other hand, small farmers f ind that animal drawn equipment is highly durable and this attribute limits replace-
ment demand. Despite that, small, regional, rural workshops continue to make batches of ploughs and seeders for specific crops. A sound estimate is that fifteen to twenty companies in Mexico are still cur-rently manufacturing animal-drawn equipment.
DiscussionThe small farm sector is not with-
out its share of problems stemming, in part, from the widely disparate performance in the country’s two farming segments. On the one hand, the organised, commercial sector has achieved levels of productivity increases in crop yield and produced quality. On the other hand, the poor-ly organised traditional, small-farm sector is “locked” into less efficient production methods and producing crops often of low economic return.
Improving the performance of animal-drawn equipment is an at-tractive possibility where most of the small-scale farmers rely entirely on animal draft power. This study does not suggests or even emphasize that it may be economically more efficient for farmers to use improved animal-drawn equipment than to hire tractors for ploughing and disk-ing. But, diffusion of the new farm tools has been retarded by the sub-sidisation of tractor services. On the other hand, agricultural extension workers have given little attention to farm equipment innovations and often lack the knowledge required
to advise farmers concerning ani-mal-powered and other inexpensive equipment that could increase land productivity. It will be necessary to demonstrate, convincingly, to farmers and to extension services that low energy input cultivation can produce crops equal to those achieved after tractor cultivation.
This type of power will continue within Mexican agriculture yet for many years to come. As there are holdings exclusively for draught animals. However, it is important to emphasise that animal power will continue to be predominant on those marginal regions and where crops are grown for self-consumption. While mechanical power will con-tinue increasing steadily as long as the farmers can afford to hire and to own this equipment.
ConclusionsAbout 5.4 % of Mexico’s cropped
land which is under holdings of less than 5 ha will continue to de-pend heavily on animal power. The middle group of 5-20 ha holdings can afford to use mechanical power in an increasing manner and their dependence on animal power will be substantially reduced. Land hold-ings greater than 20 ha will hardly depend on animal power. Many of those new improved animal-drawn designs have failed to impress farm-ers for a variety of reasons - mainly technical, economic, and agronomic and, often, because of the lack of suff icient training and deficient extension services. Refusal to pur-chase the multi-purpose tool-bar equipment is because of the rela-tively higher cost of the attachments and its rather limited use.
REFERENCES
Cr uz Leon, A. 1994. Tracción animal en la agricultura de México (Animal traction in Mexican
Fig. 5 A pair of bovines ploughingwith a wheeled carrier
Fig. 6 field trials on an animaldrawn seeder/fertiliser

AGRICULTURAL MECHANIZATION IN ASIA, AFRICA, AND LATIN AMERICA 2007 VOL.38 NO.188
agriculture). Unpublished MSc. Thesis. Colegio de Postgraduados. Mexico. p 298.
INEGI. 1994. (National Institute for Statistics, Geography and In-formatics) - VII Censo Nacional Agropecuario (National Agricul-tural-Livestock Census). Tomos I y II. Mexico.
INEGI. 2000. (National Institute for Statistics, Geography and Infor-matics) - XII Censo General de Po-blacion y Vivienda (General Cen-sus on Population and Housing). Mexico.http://www.inegi.gob.mx/est/contenidos/espanol/tematicos/mediano/. Accessed 15 October.
Masera, C. O. 1990. Crisis y me-
canización de la ag r icult u ra campesina (Crisis and mechanisa-tion of peasant agriculture). El Colegio de Mexico. Mexico. 226.
Ortiz Laurel, H. 1992. Medición de fuerzas de tracción en animales de tiro (Measurement of traction forces on draught animals). Pro-ceedings of the II National Con-gress on Agricultural Engineering. México. A59-A63.
Rubio Granados, E. 2000. Catálogo de Tecnología Intermedia (Inter-mediate Technology Catalogue). Secretaría de Agricultura, Ganadería y Desarrollo Rural. Mexico. 3-26.
Sims, B. G., B. F. Johnston, A. L.
Olmstead, and S. Jacome Maldo-nado. 1988. Animal-drawn imple-ments for small farms in Mexico. Food Research Institute Studies. Vol. XXI (1). 69-95.
Sims, B. G. and A. Aragon Ramirez. 1989. Draft oxen energy expendi-ture: a Mexican case study. Agri-cultural Mechanization in Asia, Africa and Latin America. Vol. 20 (2). 9-14.
■■
(Continued from page73)
Oman Traditional Farms: Changes and Improvement of Farms in Oman
Qaboos University, Sultanate of Oman
FAO. 1997. Oman Agricultural Re-view, ROM. WWW.Oman.net/fao/htmp
MAF. 1993. National agricultural census. Sultanate of Oman
Omezzine, A., H. Chebaane, and L. Zaibet. 1997. Reallocations of agricultural water in Oman A po-tential advantage in higher valued crops. International Symposium on water and Arab Gulf Develop-ment, Center of Arab Gulf Stud-ies, University of Exeter, UK
Al-Ghafri, A. and W. R. Norman. 2000. Trad it ional I r r igat ion
Scheduling in Aflaj Irrigation sys-tem of Oman. Aflaj Maintenance in the Sultanate of Oman. Paper presented in the First International symposium on Qanat. Yazd, Iran
Al-Hatmi, H. K. and S. S. Al-Amri. 2000. Aflaj Maintenance in the Sultanate of Oman. Paper pre-sented in the First International symposium on Qanat. Yazd, Iran.
Al-Rawazi, A. and A. W. Hago. 1999. Contruction problems in traditional ir rigation systems: A case study from the Afalj of Oman. Chapter in water manage-ment Purification and Contruc-tion in arid Climates. Edited by
Goosen, M. F and W. H. Shayya. Technomic press.
■■

VOL.38 NO.1 2007 AGRICULTURAL MECHANIZATION IN ASIA, AFRICA, AND LATIN AMERICA 89
ABSTRACTS The ABSTRACTS pages is to introduce the abstracts of the article which cannot be published in whole contents owing to the limited publication space and so many contributions to AMA. The readers who wish to know the contents of the article more in detail are kindly requested to contact the authors.
354A Criteria for Assessing Storage Buildings: Richard
Jinks Bani, Professor, Agricultural Engineering Depart-ment, University of Ghana, Legon, Ghana; Brian Stenning, Cranfield University, Silsoe Campus, UK.
This paper reports the use of a simulation model to identify critical factors affecting the indoor temperatures in stores. A steady state heat transfer analysis was used. The effects of infiltration, solar radiation, transmittance and absorptance were studied. Infiltration was observed as the highest contributor to the heat flux in stores con-tributing as much as 84.85 % in some cases. For highly insulated stores solar radiation and surface absorptance had very little effect on the store temperatures. Increases in surface transmittance increased the store temperatures by small amounts up to 0.14 ºC and 0.24 ºC when trans-mittance values were doubled and tripled respectively. Based on their contributions to the store heat flux it can be concluded that stores can be assessed based on their ability to minimize fluctuations in infiltration during the storage period.
380Dynamics Analysis and Test of Seedling-Pushing
Device in Transplanting Mechanism with Ellipse-Circle Planetary Gears: Zhao Yun, Professor, Zhejiang Institute of Science and Technology, Hangzhou, Zhejiang 310033, P.R. China; Zhao Fengqin, Associate Professor, Shenyang Agri-cultural University, Shenyang, Liaoning 110000, P.R. China; Chen Jianneng, Associate Professor, Fujian Agriculture and Forestry University, Fuzhou, Fujian 350003, P.R. China.
In order to set up the dynamics model of the trans-planting mechanism with ellipse-circle planetary gears of high-speed rice transplanter, the effect of seedling-pushing device on the mechanism must be analyzed. The dynamics characteristics of seedling-pushing device were analyzed by method that was derived by us. The method is analytical form differential equations of rigid compound motion. As a result, dynamics model of seedling-pushing device was deduced. By programming calculation, some conclusions were drawn: (1) the relationship between the angle of gears trunk and the angle of shifter and the posi-tion of seedling-pushing rod in the course of seedling-pushing and collision, (2) the relationship between the an-gle of gears trunk and the bearing force of spring, shifter shaft and seedling-pushing rod in the course of seedling-pushing and collision. The first relationship was tested and proved by high-speed video camera, which can prove the second relationship indirectly. These conclusions were the bases to analyze this kind transplanting mechanism.
386Development of a Low Cost Motorized Cowpea Dehu-
ller: K. Oje, Department of Agricultural Engineering, Fac-ulty of Engineering and Technology, University of Ilorin, P.M.B. 1515, Ilorin 240003, Kwara State, Nigeria; A. M. Olani-yan, same.
The drudgery involved in the post-harvest processing of cowpea, particularly in the dehulling of the seeds to obtain clean beans for further processing, has resulted in the decline of the local production of food items that have this product as its main raw material. A motorized cow-pea dehuller was designed (Fig. 1), fabricated and tested for its performance. Result of tests conducted indicated a maximum dehulling efficiency of 74.96 % at the dehull-ing time of 8 minute. The machine was designed having in view the techno-economic status of the rural dwellers who are the major small-scale processors of cowpea.
390Performance of Pneumatic Seed Metering (Pressur-
ized) Device for Paddy in Puddle: H. M. Khobragade, Senior Research Fellows and Principal Scientist, Central Institute of Agricultural Engineering (ICAR), Nabi Bagh, Berasia Road, Bhopal - 462 038, India; A. K. Dave, Assistant Professor, Faculty of Agricultural Engineering, IGKV Raipur, India; B. G. Yadav, Senior Research Fellows and Principal Scientist, Central Institute of Agricultural Engineering (ICAR), Nabi Bagh, Berasia Road, Bhopal - 462 038, India.
Planting of dry seeds of paddy in puddle is feasible. The pneumatic seed-metering concept is based upon the air pressure developed on the inner surface of rotating cylindrical drum. One end of the seed tube(s) are fixed to the seed cups placed near top dead center and another
Fig. 1 Side view of the cowpea dehullerA: electric motor housing, B: electric motor, C: cover, D: container, E: regulator, F: regulating switch, G: dehulling unit (all dimensions in mm)

AGRICULTURAL MECHANIZATION IN ASIA, AFRICA, AND LATIN AMERICA 2007 VOL.38 NO.190
end is open to the atmosphere in the furrow opener. The seed dropped in the tube at the interaction region of high and low pressure. The desired planting was achieved at injecting pressure of 1,300-1,350 N/m2 and operating speed ranges from 0.228-0.338 m/s when the depth of seed placement was between 0.76-0.77 cm in puddle.
391Apparent Viscosity of Formulations of Inulin Chicory
Extract (Cichorium intybus L) with Modified and Hydro-lyzed Starches: R. I. Nogueira, EMBRAPA Food Technol-ogy, Brazil; K. J. Park, UNICAMP/FEAGRI, Cx. P 6011, 13083 -970, Campinas SP, Brazil; E. Deyrmendjian, same; R. E. Bruns, UNICAMP/IQ, Brazil; J. Bortoloti, same.
Rheological properties of chicory root extracts were determined at 25 ºC, 40 ºC and 55 ºC. Samples consisted of pure concentrated extract and concentrated extract for-mulated with hydrolyzed and modified starch. All suspen-sions exhibited a pseudoplastic behavior, with an index value (n) varying from 0.42 to 0.97 in the shear rate range of 14 to 264 s-1. Statistical models indicate that the appar-ent viscosity of suspensions, formulated with the two dif-ferent starches, are affected principally by the proportion of hydrolyzed starch, the proportion of modified starch and the fraction of the two starches in the total mixture.
396Ergonomical Problems Associated with Agricultural
Operations in Tamil Nadu a Case Study: K. Kathirvel, Professor and Head, Agricultural Engineering College and Research Institute, TNAU, Coimbatore - 641 003, India; R. Manian, Dean, same; T. Senthilkuamr, Ph. D Scholar, same.
With the introduction of modern technology, ergonom-ics become essential for its successful application. The important point here is that the major benefit to the agri-culture is to have safe, healthy and productivity worker. Poorly designed equipment or implements or products often require worker/users to compensate or exert them-selves unnecessarily. Too often such over exertion lead to both job related errors and an increased level of risk – and then the stressors transmit the stress onto the workers directly reducing their ability to do their job safety and effectively. Twelve villages (including hilly region) were selected from seven agro climatic regions of Tamil Nadu State such that they use agricultural machinery extensive-ly for various operations in crop production and process-ing activities to study ergonomics problem in agricultural machinery operation. Based on the survey results, the mean ergonomics score was computed and the farming operations carried by female and male farm workers. The operations which call for ergonomic intervention for re-ducing drudgery and health risk of female farm workers are ranked as harvesting by sickle - 121.5 (1), weeding by hand hoe - 91.1 (2), paddy transplanting - 52.3 (3) and tea leaf picking - 12.3 (4). The farming operations carried
by male farm workers are ranked as sugar cane stubble removal - 76.2 (1), harvesting root crop - 49.8 (2), spray-ing by knapsack sprayer - 30.0 (3), digging by spade/pick axe - 24.8 (4) and tractor driving - 22.3 (5). The drudgery involved in the above operations may be reduced by in-corporating improvement in machine/tool design.
404Effect of Adhesives on the Durability Index of Com-
pacted Olive Cake: Hamid Al-Jalil, Associate Professor, Department of Biosystems Engineering, Faculty of Engi-neering, Jordan University of Science and Technology, P.O. Box 3030, Irbid 22110, Jordan; Mohamad Al-Widyan, As-sociate Professor, same; Fatma Al-Widyan, Undergraduate Student, same.
Generally, briquettes of plain olive cake, OC, lack du-rability. This work involved mixing OC at 35 % moisture with 1 to 4 % of wood adhesive or clay loam and com-pacting the mixture at a stress of 15 to 45 MPa and dwell time of 5 s. An ASAE standard tumbler was used to de-termine the briquette durability, The results showed that adhesives had substantial effect and increased the dura-bility index by more than 11 times compared to plain OC. Overall, clay loam, was the favorable adhesive and when added at 2 % and compared at 35 MPa produced the best desirable outcome.
409Influence of Engine Regime and Cabin Condition on
Noise Level in Agricultural Tractors: J. A. Hilbert, Ing-eniero Agrónomo M.Sc. Instituto de Ingeniería Rural CNIA INTA-c.c. 25 (1712) Castelar, Argentina; M. Borini, Facultad de Agronomía Universidad de Buenos Aires, Argentina; H. Centrangolo, Cátedra de seminario de campo III Facultad de Agronomía Universidad de Buenos Aires, Argentina; A. Amador, same.
At the present state of the economic reality with the priority given to overall efficiency, reduction of produc-tion costs and transformation of farms human factors is becoming an important issue. The sound exposure levels has a direct relation with human health and productivity at work. To study the sound level exposure influence on tractors drivers in tractor cabs, five tractors with differ-ent power, model were employed under normal field work with different machines. The measurement of sound level was made using sound level meter CEL-480 at the op-erator’s ear level following IRAM 4119/1 standard in A weighting. A broad band and spectral frequency analysis, octave and one-third octave was performed Variables in-clude opening of the doors and different engine regimes. According to the results a comparison with NCB (Be-ranek, 1989) and ISO1999 (1975) was made. Significative differences according to the doors situation and engine speed were detected.
■■

VOL.38 NO.1 2007 AGRICULTURAL MECHANIZATION IN ASIA, AFRICA, AND LATIN AMERICA 91
NEWSAgritechnica 2007 starts
World’s leading exhibition for agri-cultural machinery in Hanover from 13 to 17 November 2007 - Closing date for registration is 1 February 2007
(DLG). With the mailing of the stand registration papers to exhibitors, prepa-rations for the international DLG exhibi-tion for agricultural machinery, Agri-technica 2007, are now entering a key phase. The world’s leading exhibition for agricultural machinery will be presented to the international public at the exhibi-tion grounds in Hanover from 13 to 17 November 2007. The organiser DLG (Deutsche Landwirtschafts-Gesellschaft - German Agricultural Society) has once again scheduled two Preview Days on 11 and 12 November 2007. The closing date for registrations for exhibitors is 1 February 2007.
Of all the agricultural machinery ex-hibitions, Agritechnica is the one with the highest proportion of manufacturers and authorised importers among the exhibitors. All the agricultural machin-ery companies operating worldwide and throughout Europe are represented directly here. They offer altogether the most comprehensive and varied exhibi-tion programme for arable farming and plant production. More than 1,600 com-panies from all over the world took part in the last event in 2005. The exhibition date in November is particularly attrac-tive. This is where manufacturers pres-ent their innovations to their partners in distribution and to practical farmers, and where farmers plan their investments for the coming season. With almost 260,000 visitors, including 44,000 from abroad, Agritechnica 2005 exerted a strong power of attraction on private contrac-tors, machine rings and farmers from all over the world. Agricultural machinery dealers and the trade see Agritechnica as their forum and make special use of the Preview Days. Agritechnica will be the communications bourse for the global agricultural branch in 2007 too.
Complete Exhibition ProgrammeThe complete exhibition programme of
Agritechnica 2007 will be presented in modern, ground-level halls at the world’
s largest exhibition grounds in Hanover. Covering more than 20 ha of exhibition floor space, Agritechnica comprises the following sections:
• Machinery and equipment for soil cultivation, sowing, fertilising, sprin-kling and irrigation
• Plant protection and plant care• Harvesting machinery and equipment
for forage crops, grain, root crops, maize
• Harvest processing and conditioning• Tractors, transport vehicles, conveyor
technology• Renewable energy and bioenergy
sources, renewable industrial raw materials
• Machinery and equipment for for-estry work, municipal applications, landscape care
• Field vegetable growing, organic farming
• Machinery and equipment for fruit farming, viticulture and special crops
• Farm inputs (biotechnology/seed, fertilising, plant protection, fuels and lubricants)
• Electronics, agricultural software, Precision Farming
• Components, drive engineering, spare parts, accessories
• Services for marketing used machin-ery and equipment
• Management, information, science and research
New: Soil Cultivation Worldwide - Concepts and Solution
In 2007 special attention will be de-voted to the thematic area “soil and soil cultivation” for the first time at Agri-technica. In this “World Soil and Tillage Show”, the current challenges for soil working in various regions of the world are to be presented as a joint project by the fields of academia, consultants, practical farming and the agricultural machinery industry. Optimal seedbed preparation, or problem complexes such as soil erosion, soil compaction and soil fertility in damp or dry regions in Central and Eastern Europe, North and South America, all call for specific solutions. The “World Soil and Tillage Show” will supply global ideas and vi-sions through site-appropriate solutions: successful machinery and management
systems, examples of best practice in soil cultivation, and experience gained by the workd’s best farmers will be shown and presented there. Trial fields, demonstrations and technical details from leading enterprises will all con-tribute to ensuring that there is a com-prehensive programme. Climate change will be a topic in focus too. It will be shown clearly how the climatic changes are influencing soil and soil cultivation. The “World Soil and Tillage Show” will thus provide farmers with extremely interesting working strategies for their forthcoming investments.
New: Special “ Workshop LIVE”Good provision of services and opti-
mally trained specialists are a key pre-requisite for the agricultural machinery market to function properly. In coop-eration with the Main Association of German Agricultural Machinery Deal-ers and Craft Trades, the requirements made of mechanics for agricultural and construction machinery technology will be shown in an Agritechnica Special “Workshop LIVE”, looking at practi-cal hands-on demonstrations of repair, maintenance and conversion work with expert commentaries.
Innovations and Concepts for Solu-tions to all Aspects of Bioenergy
The dynamic and highly interesting developments in the area of renewable energies and renewable raw materials are providing almost the entire agricul-tural machinery branch with opportuni-ties to present innovations and solution concepts to questions of production, processing and logistics. That is why even more space will be devoted to questions concerning all aspects of bioenergy at Agritechnica 2007, and it will be a theme on many exhibition stands. This will be supplemented by a rich programme with technical lectures from industry, academia, consultants and practical farmers. Furthermore, so-lutions from specialists from the entire field of bioenergy will be shown, pooled in a “Bioenergy Center”. Agritechnica is thus underlining its function as a unique forum of the future for the international agricultural sector. It is not only an in-novations platform for the latest in mod-

AGRICULTURAL MECHANIZATION IN ASIA, AFRICA, AND LATIN AMERICA 2007 VOL.38 NO.192
ern machinery and equipment, but also an ideas tank and an impetus provider for answers to the key future questions concerning agroeconomics and agricul-tural machinery.
Top-flight International Technical Programme
A top-f light side programme with a wide number of international events will complement the machinery and equipment programme presented by the exhibitors. For instance, within the con-text of Agritechnica 2007 conferences
such as the International Agricultural Machinery Congress of VDI/MEG, the second European Wheat Event, an inter-national Seed Congress and an Eastern Europe Congress on Agricultural Ma-chinery will be held. Furthermore, the European Young Farmers’ and Students’ Conference organised jointly by “Young DLG” and European universities for Agritechnica 2007 will attract a great deal of attention. A widely varied tech-nical programme will also be provided in special forums with international ori-entation, in a large number of different
languages.
For further information on Agritech-nica 2007 please contact the DLG, Esch-borner Landstr. 122, D-60489 Frankfurt am Main, Tel. +49/69/24788-252 or -255, Fax:+49/69/24788-113 or e-mail [email protected]. Information about Agritechnica 2007 is also available on the Internet at www.agritechnica.com.
■■
New-Publications from ASABE
Design in Agricultural Engineer-ing
Detailed Description:This textbook covers def ining the
creative problem, scheduling design activity, estimating costs, considering safety and ethics in design, standard-izing for manufacturing considerations, testing and evaluation, understanding business and organization structures, selling the company or marketplace on ideas, arranging for patents, trademarks and copyrights, respecting trade secrets, and working with engineering and non-engineering colleagues, 312 pages, 1986, 6 x 9 inches, softbound.
ISBN: 0-916150-80-1Order No. M1086Member $36.25 /List $41.25
“Problem Solving with Excel”
Author(s):Dennis R. Buckmaster P.E., Purdue
UniversityDetailed Description:
This 70-minute training video on CD-ROM will show you how to make en-gineering problem solving more effec-tive, less time consuming, and easier to communicate to others. Through video,
audio and watching the actual steps on example spreadsheets the user can build skills in working with:
• labels in formulas• data filtering• optimization• goal seeking for iterative solutions• data tables• lookup functions• macros/formsThis CD-ROM will help engineers and
other problems solvers follow a logical format and approach when using Excel spreadsheets to solve engineering prob-lems. The video package, produced by Purdue professor Dennis Buckmaster, grew out of his workshop experiences with students, faculty, and practicing engineers. The presentation assumes the user is familiar with basic spreadsheet skills such as formula editing, graphing, and formatting. In addition to being a training video, the package serves as valuable reference.
Biological Engineering Volume 1, Number 1 February 2007
Purpose and Scope:This journal focuses on a wide range
of biological engineering topics includ-ing bioprocessing, bioreactor design,
cell culture, tissue engineering, meta-bolic engineering, biosensors, bioinstru-mentation, bioenvironmental systems, ecological engineering, bioremediation, modeling of biological processes, mo-lecular technologies, bioconversion, biological structures and mechanics, biofuels, and more.
2007 Volume No. 1Number of Issues per Year: 4ISSN: 1934-27996 x 9 inches
Indexing and Abstracting:Biological Engineering will be indexed
and abstracted in AGRICOLA and CAB International Abstracts. Others will
■■

VOL.38 NO.1 2007 AGRICULTURAL MECHANIZATION IN ASIA, AFRICA, AND LATIN AMERICA 93
-AFRICA-Benedict KayomboAssociate Professor of Soil and Water Engineering, Dept. of Agric. Engineering and Land Planning, Botswana College of Agriculture, University of Bo-tswana, Private Bag 0027, Gaborone, BOTSWANA.TEL(+267)-3650125, FAX(+267)-328753E-mail: [email protected]
Mathias Fru FontehAsst. Professor and Head, Dept. of Agric. Engineer-ing, Faculty of Agriculture, University of Dschang, P.O. Box 447, Dschang, West Province, CAMEROONTEL+237-45-1701/1994, FAX+237-45-2173/1932E-mail: [email protected]
Ahmed Abdel Khalek El BeheryAgric Engineering Research Institute, Agricultural Reserch Center, Nadi El-Said St. P.O. Box 256, Dokki 12311, Giza, EGYPT
Ali Mahmoud El HossarySenior Advisor to the Ministry of Agriculture and Chairman of (AGES)-Agengineering Consulting Group, Ministry of Agriculture - P.O.Box 195 Zama-lek 11211 Cairo, EGYPTTEL00-202-335-9304, FAX00-202-3494-132
B.S. PathakProject Manager, Agric. Implements Research and Improvement Centre, Melkassa, ETHIOPIA
Richard Jinks BaniLecturer & Co-ordinator, Agric. Engineering Div., Faculty of Agriculture, University of Ghana, Legon, GHANA
Israel Kofi DjokotoSenior Lecturer, University of Science and Technol-ogy, Kumasi, GHANA
David Kimutaiarap SomeProfessor, Deputy Vice-chancellor. Moi University, P.O. Box: 2405, Eldoret, KENYA
Karim HoumyProfessor and head of the Farm Mechanization Dept., Institute of Agronomy and Velerinary Medi-cine II, Secteur 13 Immeuble 2 Hay Riad, Rabat, MOROCCO, Tel+212-7-68-05-12, Fax+212-7-775801E-mail: [email protected]
Joseph Chukwugotium IgbekaProfessor, Dept. of Agricultural Engineering, Univ. of Ibadan,, Ibadan, NIGERIATEL+234-2-8101100-4, FAX+234-281030118E-mail: [email protected]
E.U, OdigbohProfessor, Agricultural Engg Dept., Faculty of En-gineering, University of Nigeria, Nsukka, Enugu state, NIGERIA, TEL+234-042-771676, FAX042- 770644/771550, E-mail: [email protected]
Kayode C. OniDirector/Chief Executive, National Centre for Agric. Mechanization (NCAM), P.M.B.1525, Ilorin, Kwara State, NIGERIATEL+234-031-224831, FAX+234-031-226257E-mail: [email protected]
N.G. KuyembehAssociate Professor, Njala University Colle, Univer-sity of Sierra Leone, Private Mail Bag, Free Town, SIERRA LEONETEL+249-778620-780045, FAX+249-11-771779
Abdien Hassan AbdounMember of Board, Amin Enterprises Ltd., P.O. Box 1333, Khartoum, SUDAN
Amir Bakheit SaeedAssoc. Professor, Dept. of Agric. Engineering, Fac-ulty of Agriculture, University of Khartoum, 310131 Shambat, SUDAN, TEL+249-11-310131
Abdisalam I. KhatibuNational Prolect Coordinafor and Direcror, FAO Ir-rigated Rice Production, Zanzibar, TANZANIA
Edward A. BaryehProfessor, Africa University, P.O.Box 1320, Mutare, ZIMBABWE
Solomon Tembo52 Goodrington Drive, PO Mabelreign,Sunridge, Harare, ZIMBABWE
-AMERICAS-Hugo Alfredo CetrangoloFull Professor and Director of Food and Agribusi-ness Program Agronomy College Buenos Aires University, Av. San Martin4453, (1417) Capital Fed-
eral, ARGENTINATEL+54-11-4524-8041/93, FAX+54-11-4514-8737/39E-mail: [email protected]
Irenilza de Alencar NääsProfessor, Agricultural Engineering College, UNI-CAMP, Agricultural Construction Dept.,P.O. Box 6011, 13081 -Campinas- S.P.,BRAZILTEL+55-19-7881039, FAX+55-19-7881010E-mail: [email protected]
A.E. GhalyProfessor, Biological Engineering Deparment Dalhousie University, P.O. Box 1000, Halifax, Nova Scotia, B3J2X4, CANADATEL+1-902-494-6014, FAX+1-902-423-2423E-mail: [email protected]
Edmundo J. HetzProfessor, Dept. of Agric. Eng. Univ. of Concepcion, Av. V.Mendez 595, P.O. Box 537, Chillan, CHILETEL+56-42-216333, FAX+56-42-275303E-mail: [email protected]
A.A. ValenzuelaEmeritus Professor, Ag. Eng. Fac., University of Concepcion,Casilla537Chillan, CHILETEL+56-42-223613, FAX+56-42-221167
Roberto AguirreAssociate Professor, National University of Colom-bia, A.A. 237, Palmira, COLOMBIATEL+57-572-2717000, FAX+57-572-2714235E-mail: [email protected]
Omar Ulloa-TorresProfessor, Escuela de Agricultura de la Region, Tropical Humeda(EARTH), Apdo. 4442- 1000, San Jose, COSTA RICA, TEL+506-255-2000, FAX +506-255-2726, E-mail: [email protected]
S.G. Campos MaganaLeader of Agric. Engineering Dept. of the Gulf of Mexico Region of the National Institute of Forestry and Agricultural Research, Apdo. Postal 429. Vera-cruz, Ver. MEXICO
Hipolito Ortiz-LaurelHead of Agric. Engineering and Mechanization Dept./ Postgraduate College, Iturbide 73, Salinas de Hgo, S.L.P., C.P. 78600, MEXICOTEL+52-496-30448, FAX+52-496-30240
B Kayombo M F Fonteh A A KEl Behery
A MEl Hossary
B S Pathak R J Bani I K Djokoto D K Some K Houmy J C Igbeka
E U-Odigboh K C Oni N GKuyembeh
A HAbdoun
A B Saeed A I Khatibu E A Baryeh S Tembo H ACetrangolo
I de A Nääs
A E Ghaly E J Hetz A AValenzuela
R Aguirre O Ulloa-Torres S G CMagana
H Ortiz-Laurel W JChancellor
M R Goyal A KMahapatra
Co-operating Editors

AGRICULTURAL MECHANIZATION IN ASIA, AFRICA, AND LATIN AMERICA 2007 VOL.38 NO.194
William J. ChancellorProfessor Emeritus, Bio. and Agr. Eng. Dept., Univ. of California, Davis, CA, 95616, U.S.A.TEL+1-530-753-4292, FAX+1-530-752-2640E-mail: [email protected]
Megh R. GoyalProf./Agric & Biomedical Engineering, Univer-sity of Puerto Rico, P.O.Box 5984, Mayaguez PR, 006815984, U.S.A., TEL+1-787-265-4702E-mail: [email protected]
Ajit K. MahapatraPresent add: Agric. & Biosystems Eng. Dept., South Dakota State Univ., P.O. Box2120 Brook-ings, SD 57007-1496, U.S.A., TEL605-6885291, FAX 605-6886764, E-mail: [email protected]
-ASIA and OCEANIA-Graeme R. QuickConsulting Enginner, 83 Morrisons Road, Peaches-ter, Queensland, 4519, AUSTRALIA
Shah M. FaroukProfessor (Retd.),Farm Power & Machinery Dept., Bangladesh Agricultural University, Mymensingh 2200, BANGLADESH, TEL+880-91-5695ext.2596, FAX91-55810, E-mail: [email protected]
Daulat HussainDean, Faculty of Agric. Engineering and Tech-nology, Bangladesh Agricultural University, My-mensingh-2202, BANGLADESH, TEL+880-91-52245, FAX91-55810, E-mail: [email protected]
Mohammed A. MazedMember-Director, Bangladesh Agri. Res. Council, Farmgate, Dhaka, BANGLADESHE-mail: [email protected]
Chetem WangchenProgramme Director Agricultural Machinery Centre Ministry of Agriculture Royal Government of Bhutan, Bondey Paro Bhutan 1228, BHUTAN, E-mail: [email protected]
Wang WanjunPast Vice Director and Chief Engineer/Chinese Academy of Agricultural Mechanization Sciences, 1 Beishatan, Beijing, 100083, CHINATEL+86-(0)83-001-6488-2710, FAX001-6488-2710E-mail: [email protected]
Sarath IllangantilekeRegional Representative for South and West
Asia, International Potato Center (CIP), Regional Office for CIP-South & West Asia, IARI (Indian Ag-ric. Res. Institute) Campus, Pusa, New Delhe-12, 110002, INDIA, TEL+91-11-5719601/5731481, FAX./5731481, E-mail: [email protected]
S.M. IlyasDirector of Central Institute of Post Harvest Engi-neering and Technology (CIPHET), Ludhiana. P.O., P.A.U, Ludhiana - 121004, INDIA, Tel+91-161-808669, Fax:+91-161-808670, E-mail: [email protected]
A.M. Michael1/64, Vattekunnam, Methanam Road, Edappally North P.O., Cochin, 682024, Kerala State, S. INDIA
Gajendra SinghProfessor, Vice Chancellor, Doon University 388/2, India Nagar, Dehradun - 248006, INDIATEL+91-989-738-4111, FAX+91-135-320-1920Email: [email protected]
T.P. OjhaDirector General(Engg.) Retd., ICAR, 110, Vineet Kung Akbarpur, Kolar Road, Bhopal, 462 023, INDIATEL+91-755-290045
S.R. VermaProf. of Agr. Eng, & Dean Eng.(Retd), 14, Good Friends Colony, Barewal Road , Via Ayoli Kalan, Lud-hiana 142027 Punjab, INDIA, TEL+91-(0)161-463096E-mail: [email protected]
SoedjatmikoPresident, MMAI(Indonesian Soc. of Agric. Eng. & Agroindustry), Menara Kadin Indonesia Lt.29 Jl. HR. Rasuna Said X-5/2-3 Jakarta, 12940, INDONESIATEL+62-(0)21-9168137/7560544, FAX(0)21-5274485/5274486/7561109
Mansoor Behroozi-LarProfessor, Agr. Machinery, Ph.D, Tehran University Faculty of Agriculture, Karaj, IRANTEL+98-21-8259240, E-mail: [email protected]
Saeid MinaeiAssistant Professor, Dept. of Agr. Machinery Eng., Tarbiat Modarres Univ., P.O.Box 14115-111, Tehran, IRANTEL+9821-6026522-3(office ext.2060, lab ext.2168)FAX+9821-6026524, E-mail: [email protected]
Jun SakaiProfessor Emeritus, Kyushu University, 2-31-1 Chi-haya, Higashi-ku, Fukuoka city, 813, JAPANTEL+81-92-672-2929, FAX+81-92-672-2929E-mail: [email protected]
Bassam A. SnobarProfessor and Vice President, Jordan University of Science and Technology, P.O.Box 3030 Irbid, 22110, JORDAN, TEL+962-2-295111, FAX+962-2-295123E-mail: [email protected]
Chang Joo ChungEmeritus Professor, Seoul National University, Ag-ricutural Engineering Department, College of Agri-culture and Life Sciences, Suwon, 441-744, KOREATEL+82-(0)331-291-8131, FAX+82-(0)331-297-7478E-mail: [email protected]
Chul Choo LeeMailing Address: Rm. 514 Hyundate Goldentel Bld. 76-3 Kwang Jin Ku,Seoul, KOREATEL+82-(0)2-446-3473, FAX+82-(0)2-446-3473E-mail: [email protected]
Muhamad Zohadie BardaieProfessor, Department of Agricultural and Biosys-tems Engineering, University Putra Malaysia, 43400 upm, Serdang, Serdangor, MALAYSIATEL+60-3-89466410Email: [email protected]
Madan P. PariyarConsultant, Rural Development through Selfhelp Promotion Lamjung Project, German Technical Cooperation. P.O. Box 1457, Kathmandu, NEPAL
David Boakye AmpratwumAssociate Professor, Dept.of Bioresource and Agri-cultural Engineering, College of Agriculture, Sultan Qaboos University, P.O. Box 34, Post Code 123, Muscat, Sultanate of Oman, OMANTEL+968-513866, FAX513866E-mail: [email protected]
EITag Seif Eldin Mailling Address: Dept. of Agric. Mechanization, College of Agriculture, P.O. Box 32484, Al-Khod, Sultan Qaboos University, Muscat, Sultanate of Oman, OMAN
Linus U. OperaAssociate Professor, Agricultural Engineering & Postharvest technology, Director, Agricultural Experiment Station, Sultan Qaboos University, Muscat, Sultanate of Oman, OMAN
Allah Ditta ChaudhryProfessor and Dean Faculty of Agric. Engineering and Technology, University of Agriculture, Faisala-bad, PAKISTAN
G R Quick S M Farouk DaoulatHussain
M A Mazed Chetem Wangchen
Wang Wanjun
S Illangantileke S M Ilyas A M Michael
T P Ojha S R Verma Soedjatmiko M Behroozi-Lar
Saeid Minaei
J Sakai B A Snorbar C J Chung C C Lee M ZBardaie
M P Pariyar D BAmpratwum
E S Eldin A DChaudhry
A Q Mughal R ur Rehmen B TDevrajani
N AAbu-Khalaf
Surya NathL U Opera
G Singh

VOL.38 NO.1 2007 AGRICULTURAL MECHANIZATION IN ASIA, AFRICA, AND LATIN AMERICA 95
R PVenturina
A.Q.A. MughalVice Chancellor, Sindh Agriculture University, Tan-dojam, PAKISTAN
Rafiq ur RehmanDirector, Agricultural Mechanization Reserch Insti-tute, P.O. Box No. 416 Multan, PAKISTAN
Bherulal T. DevrajaniProfessor and Chairman, Faculty of Agricultural En-gineering, Sindh Agriculture University, Tandojam, Sindh, PAKISTANTEL+92-2233-5594
Nawaf A. Abu-KhalafEngineer, the Project Directorate in Palestinian Ag-ricultural Ministry, P.O.Box 405, Hebron, PALESTINETelfax: 972-2-2227846/7E-mail: [email protected]
Surya NathAssoci. Prof., Dept. of Agriculture, Papua New Guinea University of Technology, Private Mail Basg, Lae, PAPUA NEW GUINEA, TEL+675-475-5162, FAX473-4477, E-mail: [email protected]
Reynaldo M. LantinProfessor, College of Engineering and Agro-Indus-trial Technology University of the Philippines Los Banos, Laguna 4031, PHILIPPINESTEL+63-(0)49-536-2792, FAX+63-(0)49-536-2873E-mail: [email protected]
Ricardo P. VenturinaPresident & General Manager, Rivelisa publishing House, 215 F, Angeles St. cor Taft Ave. Ext., 1300 Pasay City, Metro Manila,PHILIPPINES
Saleh Abdulrahman Al-suhaibaniProfessor, Agricultural Engineering Dept.,College of Agriculture, King Saud University,P.O. Box 2460 Riyadh 11451, SAUDI ARABIA
Ali Mufarreh Saleh Al-AmriProfessor, Dept. of Agric. Engineering, Colleg of Agricultural and Food Sciences, King Faisal Univer-sity, Al-Ahsa,SAUDI ARABIAE-Mail: [email protected],[email protected]
Sen-Fuh ChangProfessor, Agric.-Machinery Dept. National Taiwan University, Taipei, TAIWAN
Tieng-song PengDeputy Director, Taiwan Agricultural Mechaniza-tion Research and Development Center. FL. 9-6, No. 391 Sinyi Road, Sec. 4, TAIWAN
Suraweth KrishnasreniSenior Expert in Agricultural En-gineering, Depart-ment of Agricul-ture, Chatuchak, Bangkok 10900, Thailand, Tel5792153,5794497,5798520,Ext.124, Fax9405791, E-mail: [email protected]
Surin PhongsupasamitProfessor of Agricultural Engineering, Dept. of Me-chanical Engineering, Faculty of Engineering, Chu-lalongkom University, Phyathai Road, Patumwan, Bangkok 10330, THAILAND
Chanchai RojanasarojResearch and Development Engineer, Dept. of Ag-riculture, Ministry of Agriculture and Cooperatives, Gang-Khen, Bangkok 10900, THAILAND
Vilas M. SalokheProfessor, AFE Program, Asian Institute of Technol-ogy, P.O. Box 4, Klang Luang. Pathumthani 12120, THAILAND, TEL+66-2-5245479, FAX+66-2-5246200E-mail: [email protected]
Yunus PinarProfessor, and Head, Agric. Machinery Dept, Fac-ulty of Agriculture, University of Ondokuz Mayis, Kurupelit, Samsun, TURKEY
Imad HaffarAssociate Professor of Agric. Engineering, Faculty of Agricultural Sciences, United Arab Emirates Uni-versity, Al Ain, P.O. Box 17555, UAETEL+971-506436385, FAX+971-3-632384E-mail: [email protected]
Nguyen HayAssociate Professor, Dean of Faculty of Engineering, Nonglam University, Linh Trung Ward, Thu Duc Dis-trict, Ho Chi Minh City, VIET NAME-mail: [email protected]
Pham Van LangDirector, Vietnam Institute of Agricultural Engineer-ing, A2-Phuong Mai, Dong Da Hanoi, VIET NAM
Abdulsamad Abdulmalik Hazza,aProfessor and Head of Agricultural Engineering Department, Faculty of Agriculture, Sana,a Univer-sity, P.O.Box 12355, Sana,a YEMENTel+9671-407300, Fax:9671-217711E-mail: [email protected]
-EUROPE-Anastas Petrov KaloyanovProfessor & Head, Research Laboratory of Farm
Mechanization, Higher Institute of Economics, So-fia, BULGARIA
Pavel KicVice-Dean/Technical Faculty, Czech University of Agriculture Prague, 16521 Prague 6-Suchdol, CZECH, Tel+420-2-24383141, Fax+420-2-20921361Email: [email protected]
Henrik HaveProf. of Agric. Machinery and Mechanization at In-stitute of Agric. Engineering, Royal Veterinan/- and Agricultural University, Agrovej 10DK2630 Tastrup, DENMARK
Giuseppe PellizziDirector of the Institute of Agric. Engineering of the University of Milano and Professor of Agric. Machinery and Mechanization, Via G. Celoria, 2-20133 Milano, ITALYTel+39-02-503-16871, Fax+39-02-503-168459E-mail: [email protected]
Aalbert Anne WandersStaff Member, Dept. of Development Cooperation, Netherlands Agricultural Engineering Research Insti-tute (IMAG), Wageningen, NETHERLANDS
Jan PawlakProfessor, head of the Dept. of Economics and Utilization of Farm Machines at IBMER, Professor at the Univ. of Warmia and Mazury in Olsztyn, Fac. of Tech. Sci., POLAND
Oleg S. MarchenkoProfessor and agricultural engineer, Department Head in All-Russia Research Institute for Mechani-zation in Agriculture (VIM), 1st Institutsky proezd, 5, Moscow 109428, RUSSIATel+7(095)174-8700, Fax+7(095)171-4349E-mail: [email protected]
John KilgourSenior Lecturer in Farm Machinery Design at Silsoe College, Silsoe Campus, Silsoe, Bedford, MK45 4DT, UK
Milan MartinovFull Professor on Agricultural Machinery, Univer-sity of Novi Sad, Faculty of Engineering, Institute of mechanization and machine design, TRG D. Obra-dovica 6, 21 121 Novi Sad, PF55, YUGOSLAVIATEL+381-21-350-122(loc.298), FAX+381-21-350-592E-mail: [email protected]
J Kilgour M Martinov
S AAl-Suhaibani
A M SAl-Amri
S F Chang T S Peng S Krishnasreni S Phong-supasamit
C Rojanasaroj V M Salokhe
Y Pinar I Haffar P V Lang A A Hazza,a A P
KaloyanovP Kic H Have G Pellizzi A A
Wanders
Jan Pawlak O SMarchenko
N Hay
R M Lantin

AGRICULTURAL MECHANIZATION IN ASIA, AFRICA, AND LATIN AMERICA 2007 VOL.38 NO.196
Back Issues
AGRICULTURAL MECHANIZATION IN ASIA, AFRICA AND LATIN AMERICA
(Vol.35, No.2, Spring, 2004)On-Farm Evaluation of Current Wheat Till-
age Systems on Irrigated Vertisols in New Scheme, Sudan (Sheikh El-Din Abdel Ga-dir El-Awad) .................................................
Development and Testing of a Seed-Cum-Fertilizer Drilling Attachment to Tractor-Driven Cultivator (R. A. Gupta, Paramond Mohnot, R. M. Satasiya, R. B. Marvia) .....
Development and Evaluation of Weeding Cum Earthing up Equipment for Cotton (R. Manian, K. Kathirvel, Aravinda Red-dy, T.Senthikuamr) .......................................
Design Parameters for Cocoa Pod Breaker (A Issac Bamgboye, Odima-Ojoh) ...................
A Solar Tunnel Dryer for Natural Convection Drying of Vegetables and Other Commodi-ties in Cameroon (Joseph E. Berinyuy) ......
Rural Vegetable Oil Processing in Kenya Sta-tus and Reseach Priorities (D. Shitanda) ....
Design and Development of Agricultural Wastes Shredder (J. B. Savani, V. R. Vaga-dia, R. K. Kathiria) .......................................
Dynamometer Design for Traction Forces Measurement on Draught Horses (H. Ortiz-laurel, P. A. Cowell) ...........................
Reduction of Greenhouse Temperature Using Reflector Sheet (V. P. Seth, Y. P. Gupta, V. S. Hans) .........................................................
Farm Accidents in South India: A Critical Analysis (K. Kathirvel, R. Manian, D. Ananathakrishnan, T. Senthikumar) ..........
Present Status and Future Strategy on Farm Mechanization and Postharvest Technolo-gies for Rice Production and Processing in Bangladesh (Sydul Islam, Abdul Baqui, M Abul Quasem) ...............................................
Mechanization of Polish Agriculture in the Transition Period (Jan Pawlak) ....................
◇ ◇ ◇
AGRICULTURAL MECHANIZATION IN ASIA, AFRICA AND LATIN AMERICA
(Vol.36, No.1, Spring, 2005)Para-Ploghing Effect on Soil Retention (P. R.
Jayan, C. Divaker Durairaj, V. F. J. Kumar) Effect of Storage Conditions on Emergence of
Helthy Seeding of Soyabeen (G. H . Jamro, L. A. Jamali, M. hatim, S. K. Agha)............
Development of a Check Valve Mechanism as an Attachment to a Power Tiller Operated Seeder (D. Dhalin, C. Divaker Durairaj, V. F. J. Kumar) ...................................................
Freely Rear Converging Linkage System for No-Till Planter (Santos G. Campos Magna, Brian M. D. Wills) ........................................
Fablication and Performance Evaluation of Pre-Rasping Unit for Cassava Industries (R. Kailappan, S. Kaleemullah, I. P. Suda-gar, C. T. Devadas, M. Jawaharlal) .............
Agricultural Tractor Ownership and Off-Season Utilisation in the Kgatleng District of Botsuwana (Cecil Patric, Edward A.
Bayeh, Mataba Tapela) .................................Tillage Systems and Their Effect on Some
Soil Properties, Crop Growth and Shoot Yield of Grain-Amaranth (S. O. Afolayan, J. C. Igbeka, O. Babalola) .............................
Effect of Concave Hole Size, Concave Clear-ance and Drum Speed on Rasp-Bar Drum Performance for Threshing Sunf lower (Somposh Sudajan, Vilas M. Salokhe, Somnuk Chusilp) ..........................................
Performance Evaluation of Planters for Cot-ton Crop (K. Kathirvel, Aravinda Reddy, R. Manian, T. Senthilkuamr) .......................
Spatial Distribution of the No-Till Opener Induce Seed Row Incorporated Crop Resi-due and Soil Loosing (E. M. H. Tola, K. Koeller) ........................................................
Farm Mechanization in Lalgudi Taluk of Southern India (S. Ganapathy, R. Karu-nanithi) .........................................................
Comparative Evaluation of Field Performance of a Tractor Drawn Straw Reaper and a Flail Harvesting of Wheat Straw .................
Study on the Development of Agricultural Machines for Small-Scale Farmers “Pt. 1, Applied Technology for Morocco and Af-rica” (Toshiyuki Tsujimoto, Hai Sakurai, Koichi Hashiguchi, Eiji Inoue) ....................
◇ ◇ ◇
AGRICULTURAL MECHANIZATION IN ASIA, AFRICA AND LATIN AMERICA
(Vol.36, No.2, Autumn, 2005)A Mathematical Model for Predicting Output
Capacity of Selected Stationary Grain Threshers (V. I. O. Ndirika) .........................
Study on the Development of Agricultural Machines for Small-Scale Farmers Pt. 2, “Applied Technology to the Improvement of an Animal-Drawn Plow for Morocco and Africa” (Toshiyuki Tsujimoto, Hai Saku-rai, Koichi Hashiguchi, Eiji Inoue) ..............
Development an Indsutrial Yam Peeler (A. C. Ukatu) ..........................................................
Design and Development of a Low-Cost Po-tato Grader (K. C. Roy, M. A. Wohab, A. D. M. Gulam Mustafa) .................................
Extensive Review of Crop Drying and Dri-ers Developed in India (A. Alam, Harpal Singh, Ranjan Mohnot, H. L. Kushwaha) ...
Insect Inhibitive Properties of Some Consum-able Local Plant Materials on Grains in Storage (D. S. Zibokere) ...............................
Evaluation and Performance of Raw Mango Grader (Syed Zameer Hussain, S. C. Man-dhar, S. Javare Gowda) .................................
Engineering the Crop Establishment System for Paddy Wet Seeding (Eden C. Gage-lonia, B. D. Tadeo, E. G. Bautista, J. C. Cordero, J. A. Damian, W. B. Collado, H. Monobe, S. Ishihara, N. Sawamura, M. Daikoku, R. Otani) .......................................
Performance of Cage Wheel with Opposing Circumferential Lugs amd Normal Cage Wheel in Wet Clay Soil (S. Soekarno, V.
M. Salokhe) ...................................................Fabrication and Testing of Tomato Seed Ex-
tractor (R. Kailappan, Parveen Kasur Baig, N. Varadharaju, K. Appavu, V. Krishna-samy) ............................................................
Computer-Aided Analysis of Forces Acting on a Trailed Plough (Ying Yibin, Zhao Yun, Jin Juanqin) ..........................................
The Effects of Some Operational Parameters on Potato Planter’s Performance (Ebubekir Altuntas) .......................................................
The Use of Hot Air from Room Type Coolers for Drying Agricultural Products (Turhan Koyuncu, Yunas Pinar) ................................
Effect of Mechanization level and Crop Rota-tion on Yield Energy Requirements (S.K. Dash, D.K. Das) ............................................
Simple Quality Evaluation of Chili Pepper Based on Continuous Weight Measure-ment During Dehydration Process (T.W. Widodo, H. Ishida, J. Tatsuno, K, Tajima, E. Sakaguchi, K. Tamaki) ............................
◇ ◇ ◇
AGRICULTURAL MECHANIZATION IN ASIA, AFRICA AND LATIN AMERICA
(Vol.37, No.1, Winter, 2006)Evaluation of Solar Drying for Post Harvest
Curing of Turmeric: Curcuma longa L. (J. John Gunasekar, S. Kaleemullah, P. Do-raisamy, S. Kamaraj) ....................................
Front Wheel Drive Effect on the Performance of the Agricultural Tractor (H. Ortiz-Laurel, D. Rössel, J.G. Hermosilo-Nieto) ...
Development and Performance Evaluation of a Test Rig for Mechanical Metering of Sunflower Seeds (Sukhbir Singh, D. N. Sharama, Jagvir Dixit, Dinesh Kumar Vasta) ............................................................
Design Development and Performance Evalu-ation of a Saw Cylinder Cleaner for Me-chanically Picked Cotton (S. K. Shukla, P. G. Patil, V. G. Arude) ...................................
Design Development and Performance Evalu-ation of Portable Cotton Ginning Machines (P. G. Patil, V. G. Arude, S. K. Shukla) .......
Design and Development of Power Operated Roller Type Lac Scraper (Niranjan Prased, K. K. Kumar, S. K. Panday, M. L. Bhagat) .
The Impact of Power Tillers on Small Farm Productivity and Employment in Bangla-desh (R. I. Sarker, D. Barton) ......................
Field Performance Evaluation od Power Tiller Operated Air Assisted Spraying System (A. G. Powar, V. V. Aware, S. K. Jain, A. P. Jaiswal) .........................................................
Effect of Cone Angle on Droplet Spectrum of Hollow Cone Hydraulic Nozzles (S. K. Jain, K. G. Dhande, V. V. Aware, A. P. Jaiswal) .........................................................
Feasibility of Using Yield Monitors for the Development of Soil Management Maps (Jay Radhakrishnan, V. Anbumozhi, Rob-ert H. Hill, Raymond J. Miller) ...................
Improving Whole Kernel Recoverly in Ca-
(Vol.35, No.2, Spring, 2004-)
9
15
21
26
31
36
41
47
51
55
59
67
9
15
18
24
33
41
46
52
61
66
71
76
79
9
14
21
28
32
43
46
49
55
62
67
71
75
80
84
9
14
18
25
30
35
38
46
51
54

VOL.38 NO.1 2007 AGRICULTURAL MECHANIZATION IN ASIA, AFRICA, AND LATIN AMERICA 97
shew Nut Processing Specific to Nigeria Nuts (D. Balasubramanian) .........................
Processing Factor Affecting the Yield and Physicochemical Properties of Starches from Cassava Chips and Flour (O. V. Olo-mo, O. O. Ajibola) .........................................
Influence of Seeding Depth and Compaction on Germination (P. R. Jayan, V. J. F. Ku-mar, C. Divaker Durairaj) ............................
Testing, Evaluation and Modification of Man-ual Coiler for Drip Lateral (S. S. Taley, S. M. Bhende, V. P. Tale) ..................................
Single Hydrocyclone for Cassava Starch Milk (A. Manickavasagan, K. Thangavel) ...........
Utilization Pattern of Power Tillers in Tamil Nadu (B. Shridar, P. K. Padmanathan, R. Manian) ........................................................
◇ ◇ ◇
AGRICULTURAL MECHANIZATION IN ASIA, AFRICA AND LATIN AMERICA
(Vol.37, No.2, Spring, 2006)Perfomance Evaluation of Bullock Drawn
Puddlers (S. K. Dash, D. K. Das).................Design of a Knapsack Sprayer for Local Fa-
blication (R. F. Orge, R. B. Benito) .............Current and Future Trends and Constraints in
Iranian Agricultural Mechanization (Ah-mad Tabatabaeefar, Ali Hajeiahmad) .........
Comparative Evaluation of the Performance of Intermadiate Agricultural Processing Technologies with Traditional Processing Techniques for Cereal Crops in South Af-rica (V. I. O. Ndirika, A. J. Buys) ................
Computer-Aided Design of Extended Oc-tagonal Ring Transducer for Agricultural Implements (H. Raheman, R. K. Sahu).......
Optimization of Seed Rate of Direct Rice Seeder as Influenced by Machine and Op-erational Parameters (S. S. Sivakumar, R. Manian, K. Kathirvel) ..................................
Reliability Analysis of Different Makes of Power Tillers (B. Shridar, P. K. Padmana-than, R. Manian) ...........................................
Design and Development of a Two-Raw Saf-fron Bulb Planter (Mohammad-H. Saiedi Rad) ..............................................................
Determination of the Optimum Moisture Contents for Shelling Maize Using Local Shellers (I. K. Tastra, Erliana Ginting, Richard Merx) ..............................................
The Influence of Various Factors on Tractor Selection (Ali Aybek, Ismet Boz) ................
Effect of Impeller Materials on Centrifugal Pump Characteristics (Bahattin Akdemir, Birol kayisoglu, Senel Kocoglu) ..................
Performance Evaluation of a Safflower Har-vester (Devanand Maski, T. Guruswamy) ..
Semi-Automatic VRT-Based Fertilization System Utilizing GPS (Moustafa A. Fadel, Ahmad El-Mowafy, Abdul Elghaffar Jo-maa) ..............................................................
The Effect of Dilution Volume, Water Tem-perature and Pressing Time on Oil Yield from Thevetia Kernel during Extraction (A. F. Alonge, A. M. Olaniyan) ...................
Postharvest Losses of Tomatoes in Transit (R. J. Bani, M. N. Josiah, E. Y. Kra) ..................
The Present State of Farm Machinery Indus-try (Shin-Norinsha Co., Ltd) ........................
58
65
70
75
80
85
9
12
17
24
29
34
42
48
51
58
62
68
72
79
84
87
◇ ◇ ◇
AGRICULTURAL MECHANIZATION IN ASIA, AFRICA AND LATIN AMERICA
(Vol.37, No.3, Summer, 2006)Optimisation of Machine Parameters of Pnue-
matic Knapsack Cotton Pikker (K. Ran-gasamy, M. Muthamilselvan, C. Divaker Durairaj) .......................................................
Tractor and Implement Ownership and Uti-lization of Haryana (Sandeep Yadav, S. Kumar Lohan) ..............................................
Study on Different Tillage Treatments for Rice-Residue Incorporation and its Effect on Wheat Yield in Tarai Region of Ut-taranchal (T. P. Singh, Jayant Singh, Raj Kumar) .........................................................
A Comparative Study on the Crop Establish-ment Technologies for Lowland Rice (T. Pandiarajan, U. Solaiappan, K. Rubapathi)
Design of Tractor Operated Rotary Cultivator - a Computer Simulation (H. Raheman, R. K. Sahu) ........................................................
Machine-Crop Parameters Affecting Per-formance of an Axial-Flow Soya Been Thresher (Anusorn Vejasit, Vilas M. Sa-lokhe) ............................................................
Prospects and Problems of Power Tillers in Selected Districts of North Eastern Hilly Region in India - a Case Study (E. V. Thomas, C. S. Sahay, K. K. Satapathy) .......
Design and Development of Cylinder Type Cotton Pre-Cleaner (P. G. Patil, V. G. Arude, G. R. Anap) ......................................
The Effect of a Fogging System on Sensible and Latent Heat Transfer in a Rose Green-house (H. H. Öztürk) ....................................
Evaluation of Wheat Bed Planting System in Irrigated Vertisols of Sudan (A. W. Ad-belhadi, S. E. A. El Awad, M. A. Bashir, Takeshi Hata) ...............................................
Subsoiling - a Strategy to Combat Water Scarcity and Enhanced Productivity of Groundnut Crop (K. K. Jain, V. R. Vaga-dia, L. P. Singh, A. H. Memon) ...................
Evaluation of Practical Training in Uganda’s Agricultural Engineering Carriculum (W. S. Kisaalita, J. B. Kawongolo, J. S. Kibalama) .....................................................
Performance Evaluation of a Tractor-Operat-ed Sugarcane Harvester (H. M. Al Sharief, M. A. Haque, N. A. Aviara) .........................
Role of Computers in Eco-Friendly and Sus-tainable Agriculture of the 21th Century (Madan K. Jha, V. M. Salokhe, Satish K. Jain) ..............................................................
◇ ◇ ◇
AGRICULTURAL MECHANIZATION IN ASIA, AFRICA AND LATIN AMERICA
(Vol.37, No.4, Autumn, 2006)Potential of Farm Mechanization in Jammu
and Kashmir State of India- a Review (Jag-vir Dixit, A. S. Jeena, N. C. Shahi, Tahir Wahid) ..........................................................
Case Study in the Conversion of Fired-Wood Fuel to other Suitable ones in the Rural Areas of Vietnam (Nguyen Hay, Le Quang Giang) ...........................................................
Establishment and Performance of an Indege-neous Small Scale Rice Processing Plant in
9
15
18
25
27
32
39
46
52
62
68
71
79
85
9
15
Nigeria (Gbabo Agidi)..................................Evaluation of Soil-Water Conservation Till-
age Systems for Communal Farmers in the Eastern Cape, South Africe (O. T. Mandir-ingana, M. Mabi, T. E. Simalenga) ..............
Recent Developments in Sugarcane Mechani-sation in India (M. P. Sharma, S. R. Misra, Ashutosh Mishra) .........................................
Performance Efficiency of an Active Evapo-rative Cooling System for the Storage of Fruits and Vegetables in a Semi Arid Envi-ronment (Adam U. Dzivama, J. C. Igbeka, I. Audu) .........................................................
Inspection of Watermelon Maturity by Test-ing Transmitting Velocity of Acoustic Wave (Rao Xiuqin, Ying Yibin) ..................
Development and Testing of a Chilli Seed Ex-tractor (M. Balakrishnan, V. Thirupathi, V. V. Sree Narayanan) .......................................
Design and Fabrication of a Small-Scale Fruit Picker of Adjustable Height (Mohamad I. Al-Widyan, Hind M. Al-Qutob, Ahmad H. Hajeer) ..........................................................
Non Polluting Pestcide Application Window for Fruit Orchards in South Central Chile (Edmundo J. Hetz, Fernando A. Venegas, Marco A. Lopez)...........................................
Performance Evaluation of an Evaporative Cooling System for Fruits and Vegitable Storage in the Tropics (F. A. Babarinsa) .....
Development and Testing of a Tomato Pulper Cum Straner (V. Thirupathi, R. Viswana-than, K. Thangavel) ......................................
Comparative Feasibility Analysis of Alterna-tive Renewable Energy Sources for Small Milk Cooling Plants of Southwestern Uganda) ........................................................
Development of Simple Pulper for Leaves of Green Plant (Julius K. Tangka) ....................
Constrains and Prospects of Agricultural Mechanisation in Samoa (Md. Wali Ullah)
Design and Development of an Off-Set Ro-tary Cultivator for Use with a Two-Wheel Tractor for Fruit Tree Cultivation (A. Sena-narong, K. Wannaronk) ................................
■■
21
27
33
36
42
46
49
52
60
66
69
76
81
87

AGRICULTURAL MECHANIZATION IN ASIA, AFRICA, AND LATIN AMERICA 2007 VOL.38 NO.198
are written in the English language;are relevant: to the promotion of agricultural mecha-nization, particularly for the developing countries;have not been previously published elsewhere, or, if previously published are supported by a copyright permission;deal with practical and adoptable innovations by, small farmers with a minimum of complicated for-mulas, theories and schematic diagrams;have a 50 to 100-word abstract, preferably preceding the main body of the article;are printed, double-spaced, under 3,000 words (ap-proximately equivalent to 6 pages of AMA-size pa-per) ; and those thatart: supported by authentic sources, reference or bib-liography.written on floppy disc or CD-R
As a rule, articles that are not chosen for AMA pub-lication are not returned unless the writer(s) asks for their return and are covered with adequate postage stamps. At the earliest time possible, the writer(s) is advised whether the article is rejected or accepted.When an article is accepted but requires revision/modification, the details will be indicated in the re-turn reply from the AMA Chief Editor in which case such revision/modification must be completed and returned to AMA within three months from the date of receipt from the Editorial Staff."The AMA does not pay for articles published. How-ever, the writers are given collectively 5 free copies (one copy air-mailed and 4 copies sent by surface/sea mail) of the AMA issue wherein their articles are published. In addition, a single writer is given 25 off-prints of the article and plural writers are given 35 off-prints (also sent by surface/sea mail)"Complimentary copies: Following the publishing, three successive issue are sent to the author(s).
Articles for publication (original and one-copy) must be sent to AMA through the Co-operating Editor in the country where the article originates. (Please refer to the names and addresses of Co-operating Editors in any issue of the AMA). However, in the absence of any Co-operating Editor, the article may be sent directly to the AMA Chief Editor in Tokyo.Contributors of articles for the AMA for the first time are required to attach a passport size ID photograph (black and white print preferred) to the article. The same applies to those who have contributed articles three years earlier. In either case, ID photographs
Criteria for Article SelectionPriority in the selection of article for publication is given
to those that –a.b.
c.
d.
e.
f.
g.
h.
Rejected/Accepted Articlesa.
b.
c.
d.
Procedurea.
b.
INSTRUCTIONS TO AMA CONTRIBUTORSThe Editorial Staff of the AMA requests of articles for publication to observe the following editorial
policy and guidelines in order to improve communication and to facilitate the editorial process:
taken within the last 6 months are preferred.The article must bear the writer(s) name, title/designation, office/organization, nationality and com-plete mailing address.
Article must be sent on 3.5 inch floppy disk or CD-R with MS DOS format (e.g. Word Perfect, Word for DOS, Word for Windows... Absolutely necessary TEXT FORMAT) along with two printed copy (A4).The data for graphs and the black & white photo-graphs must be enclosed with the article.Whether the article is a technical or popular contribu-tion, lecture, research result, thesis or special report, the format must contain the following features:(i) brief and appropriate title;(ii) the writer(s) name, designation/title, office/organization; and mailing address;(iii) an abstract following ii) above;(iv) body proper (text/discussion);(v) conclusion/recommendation; and a(vi) bibliographyThe printed copy must be numbered (Arabic nu-meral) successively at the top center whereas the disc copy pages should not be number. Tables, graphs and diagrams must likewise be numbered. Table numbers must precede table titles, e.g., "Table 1. Rate of Seed-ing per Hectare". Such table number and title must be typed at the top center of the table. On the other hand, graphs, diagrams, maps and photographs are considered figures in which case the captions must be indicated below the figure and preceded by num-ber, e.g., "Figure 1. View of the Farm Buildings".The data for the graph must also be included. (e.g. EXCEL for Windows)Tables and figures must be preceded by texts or discussions. Inclusion of such tables and figures not otherwise referred to in the text/discussion must be avoided.Tables must be typed clearly without vertical lines or partitions. Horizontal lines must be drawn only to contain the sub-title heads of columns and at the bot-tom of the table.Express measurements in the metric system and crop yields in metric tons per hectare (t/ha) and smaller units in kilogram or gram (kg/plot or g/row).Indicate by footnotes or legends any abbreviations or symbols used in tables or figures.Convert national currencies in US dollars and use the later consistently.Round off numbers, if possible, to one or two deci-mal units, e.g., 45.5 kg/ha instead of 45.4762 kg/ha.When numbers must start a sentence, such numbers must be written in words, e.g., Forty-five workers..., or Five tractors..."instead of 45 workers..., or, 5 trac-tors.
c.
Format/Style Guidancea.
b.
c.
d.
e.
f.
g.
h.
i.
j.
k.
l.


