Am website presentation october 2015
52
Partnership Overview October 2015
-
Upload
anteromidstream -
Category
Investor Relations
-
view
399 -
download
3
Transcript of Am website presentation october 2015

Partnership OverviewOctober 2015

FORWARD-LOOKING STATEMENTSThis presentation contains forward-looking statements. All statements, other than statements of historical facts, included in this presentation that address activities, events or developments that Antero Midstream Partners LP, and its subsidiaries (collectively, the “Partnership”) expect, believe or anticipate will or may occur in the future are forward-looking statements. The words “believe,” “expect,” “anticipate,” “plan,” “intend,” “estimate,” “project,” “foresee,” “should,” “would,” “could,” or other similar expressions are intended to identify forward-looking statements. However, the absence of these words does not mean that the statements are not forward-looking. Without limiting the generality of the foregoing, forward-looking statements contained in this presentation specifically include expectations of plans, strategies, objectives, and anticipated financial and operating results of the Partnership and Antero Resources Corporation (“Antero Resources”). These statements are based on certain assumptions made by the Partnership and Antero Resources based on management’s experience and perception of historical trends, current conditions, anticipated future developments and other factors believed to be appropriate. Such statements are subject to a number of assumptions, risks and uncertainties, many of which are beyond the control of the Partnership, which may cause actual results to differ materially from those implied or expressed by the forward-looking statements. These include the factors discussed or referenced under the heading “Item 1A. Risk Factors” in our Annual Report on Form 10-K for the year ended December 31, 2014 and in the Partnership’s subsequent filings with the SEC.
The Partnership cautions you that these forward-looking statements are subject to risks and uncertainties that may cause these statements to be inaccurate, and readers are cautioned not to place undue reliance on such statements. These risks include, but are not limited to, Antero Resources’ expected future growth, Antero Resources’ ability to meet its drilling and development plan, commodity price volatility, inflation, environmental risks, drilling and completion and other operating risks, regulatory changes, the uncertainty inherent in projecting future rates of production, cash flow and access to capital, the timing of development expenditures, and the other risks discussed or referenced under the heading “Item 1A. Risk Factors” in the Partnership’s Annual Report on Form 10-K for the year ended December 31, 2014 and in the Partnership’s subsequent filings with the SEC.
Our ability to make future distributions is substantially dependent upon the development and drilling plan of Antero Resources, which itself is substantially dependent upon the review and approval by the board of directors of Antero Resources of its capital budget on an annual basis. In connection with the review and approval of the annual capital budget by the board of directors of Antero Resources, the board of directors will take into consideration many factors, including expected commodity prices and the existing contractual obligations and capital resources and liquidity of Antero Resources at the time.
Any forward-looking statement speaks only as of the date on which such statement is made, and the Partnership undertakes no obligation to correct or update any forward-looking statement, whether as a result of new information, future events or otherwise, except as required by applicable law.
1
Antero Midstream Partners LP is denoted as “AM” and Antero Resources Corporation is denoted as “AR” in the presentation, which are their respective New York Stock Exchange ticker symbols.

ANTERO MIDSTREAM – 2015 GUIDANCE
Key Variable Initial Guidance(1) Updated Guidance(2)
Adjusted EBITDA ($MM) $150 - $160 $180 - $190
Distributable Cash Flow ($MM) $135 - $145 $160 - $170
Year-over-Year Distribution Growth(3) 28% - 30% 28% - 30%
Low Pressure Pipelines Added (Miles) 44 27
High Pressure Pipelines Added (Miles) 20 15
Compression Capacity Added (MMcf/d) 545 545
Capital Expenditures ($MM)
Low Pressure Gathering $165 - $170 $90 - $95
High Pressure Gathering $85 - $90 $70 - $75
Compression $160 - $165 $165 - $170
Condensate Gathering $5 - $10 $5
Water Infrastructure(4) - $80 - $90
Maintenance Capital $10 - $15 $15
Total Capital Expenditures ($MM) $425 - $450 $425 - $4501. Financial guidance per Partnership press release dated 1/20/2015.2. Updated financial guidance per Partnership press release dated 10/13/2015. 3. Reflects the expected distribution growth associated with the fourth quarter 2015 over the fourth quarter 2014.4. Includes fresh water delivery system plus waste water treatment capital expenditures.
Key Operating & Financial Assumptions
2

3
0.9x
1.2x
1.3x
0.0x
0.2x
0.4x
0.6x
0.8x
1.0x
1.2x
1.4x
$0.00
$0.05
$0.10
$0.15
$0.20
$0.25
$0.30
$0.35
$0.40
$0.45
$0.50
4Q14A 1Q15A 2Q15A 3Q15A 4Q15E 1Q16E 2Q16E 3Q16E 4Q16E 1Q17E 2Q17E 3Q17E 4Q17E
Distribution Per Unit (Left Axis) DCF Coverage - (Right Axis)
GROWTH – HIGH GROWTH MIDSTREAM THROUGHPUT
• Antero Midstream is targeting 28% to 30% annual distribution growth through 2017
Note: Future distributions subject to AM Board approval.1. Assumes midpoint of target distribution growth range.2. 3Q 2015 distribution per Partnership press release dated 10/13/2015.
$0.17$0.18
$0.19$0.205
(2)

Sustainable Business
Model
High Growth Sponsor Drives AM Throughput
and Distribution Growth
Largest Dedicated Core Liquids-Rich Acreage Position in Appalachia
$1.0+ Billion ofAM Liquidity
4
Premier E&P Operator in Appalachia
100% Fixed Fee and Largest Firm Transport
and Hedge Portfolio
Opportunity to Build Out Northeast Value Chain
Growth Liquids-Rich
Value Chain
Opportunity
HighVisibility
SponsorStrength
LEADING UNCONVENTIONAL MIDSTREAM BUSINESS MODEL
“Just-in Time” Non-Speculative Capital Program
Strong Financial Position
Mitigated Commodity
Risk
1
2 3
4
5
67
8
Premier AppalachianMidstream Partnership
Run by Co-Founders
Consolidated Acreage Position in Lowest
Unit Cost Basin

-
100
200
300
400
500
600 Core Net Acres - Dry Core Net Acres - Liquids-Rich
Largest Liquids-Rich Core Position in
Appalachia
0
2,000
4,000
6,000
8,000
10,000
12,000
14,000Largest Proved Reserve Base in Appalachia
Top Producers in Appalachia (Net MMcfe/d) – 2Q 2015(1)(2) Top 12 U.S. Natural Gas Producers (Net MMcf/d) – 2Q 2015(1)
Appalachian Producers by Proved Reserves (Bcfe) – YE 2014(1)(2)Appalachian Producers by Core Net Acres (000’s) – August 2015(3)(4)
1. Based on company filings and presentations.2. Appalachian only production and reserves where available. Excludes companies that do not break out Appalachian production including CHK, CVX, HES and XOM. 3. Based on Antero geologic interpretation supported by state well data, company presentations and public land data. Peer group includes AEP, CHK, CNX, COG, CVX, EQT, NBL, RICE, RRC, STO, SWN.4. Southwestern leasehold and reserves include the impact from STO and WPX property acquisitions closed in January 2015. 5. Includes proved reserves categorized in “Northern Division” consisting of Utica Shale, Marcellus Shale and Powder River Basin.
0200400600800
1,0001,2001,4001,6001,800
0
500
1,000
1,500
2,000
2,500
3,000
3,500Appalachian Peers
11th Largest U.S. Gas Producer
5
3rd Largest Appalachian
Producer
SPONSOR STRENGTH – LEADERSHIP IN APPALACHIAN BASIN

Note: 2014 SEC prices were $4.07/MMBtu for natural gas and $81.48/Bbl for oil on a weighted average Appalachian index basis.1. All net acres allocated to the WV/PA Utica Shale Dry Gas and Upper Devonian Shale are included among the net acres allocated to the Marcellus Shale as they are stacked pay formations attributable
to the same leasehold. 2. Antero and industry rig locations as of 10/2/2015, and average rig count for 1H 2015, per RigData.
6
COMBINED TOTAL – 12/31/14 RESERVESAssumes Ethane RejectionNet Proved Reserves 12.7 TcfeNet 3P Reserves 40.7 TcfePre-Tax 3P PV-10 $22.8 BnNet 3P Reserves & Resource 53 to 57 TcfeNet 3P Liquids 1,026 MMBbls% Liquids – Net 3P 15%3Q 2015 Net Production 1,506 MMcfe/d- 3Q 2015 Net Liquids 52,250 Bbl/dNet Acres(1) 565,000Undrilled 3P Locations 5,331
UTICA SHALE CORE
Net Proved Reserves 758 BcfeNet 3P Reserves 7.6 TcfePre-Tax 3P PV-10 $6.1 BnNet Acres 147,000Undrilled 3P Locations 1,024
MARCELLUS SHALE CORE
Net Proved Reserves 11.9 TcfeNet 3P Reserves 28.4 TcfePre-Tax 3P PV-10 $16.8 BnNet Acres 418,000Undrilled 3P Locations 3,191
UPPER DEVONIAN SHALE
Net Proved Reserves 8 BcfeNet 3P Reserves 4.6 TcfePre-Tax 3P PV-10 NMUndrilled 3P Locations 1,116
WV/PA UTICA SHALE DRY GASNet Resource 12.5 to 16 TcfNet Acres 186,000Undrilled Locations 1,889
02468
101214
Rig
Cou
nt
Operators
1H 2015 Avg SW Marcellus & Utica(2)
SPONSOR STRENGTH – MOST ACTIVE OPERATORIN APPALACHIA

27.4% 26.3% 26.2%
22.8%
19.7%
15.2%12.5% 11.7% 11.2%
8.7%
2.5%
(0.3%) (1.2%) (1.5%)(4.0%) (4.1%)
(13.6%)
(19.9%)
-25%
-15%
-5%
5%
15%
25%
35%
45%
40%+
7Appalachian Peers
Source: Represents median of Wall Street research estimates for 2015E production growth vs. 2014 actual production. 1. Includes all North American E&P companies with a market capitalization greater than $4.5 billion. 2. Based on publicly announced 2015 production growth target of 40%+.
Antero’s 40%+ production growth guidance for 2015 leads the U.S. large cap E&P industry and drives AM growth(1)
GROWTH – HIGHEST GROWTH LARGE CAP E&P
(2)

$1$5 $7 $8
$11$19
$28$36
$41
$0
$10
$20
$30
$40
$50
$60
$70
26 31 40 36 41 116
222
358
454 435
0
100
200
300
400
500
600
700 Utica Marcellus
10 38 80 126 266
531
908
1,134 1,197 1,216
0
200
400
600
800
1,000
1,200
1,400
1,600Utica Marcellus
108 216
281 331 386 531
738
935 965 1,038
0
200
400
600
800
1,000
1,200
1,400 Utica Marcellus
Low Pressure Gathering (MMcf/d)
Compression (MMcf/d)
High Pressure Gathering (MMcf/d)
EBITDA ($MM)(1)
8
$185
GROWTH – HIGH GROWTH MIDSTREAM THROUGHPUT
1. 2015E EBITDA guidance updated per 9/18/2015 Partnership press release based on 10/1/2015 effective date for water drop down. Y-O-Y growth based on 3Q’14 to 3Q’15.

9
LIQUIDS-RICH – LARGEST CORE POSITION
Source: Core outlines and peer net acreage positions based on investor presentations, news releases and 10-K/10-Qs. Rig information per RigData as of 10/2/2015.1. Based on company filings and presentations. Peer group includes AEP, CHK, CNX, CVX, ECR, EQT, GPOR, NBL, RRC, STO, SWN.
• Antero has the largest core liquids-rich position in Appalachia with ≈371,000 net acres (> 1100 Btu)
• Represents over 21% of core liquids-rich acreage in Marcellus and Utica plays combined
• 2x its closest competitor
Antero has over 3,000 undeveloped rich gas locations with an average lateral length of 6,800’ in its 3P reserves
0
100
200
300
400
(000
s)
Core Liquids-Rich Net Acres(1)

248
13994
254 289
15%
38%47%
35% 40%
11%
29%38%
28% 32%
0
100
200
300
0%
15%
30%
45%
60%
Condensate Highly-RichGas/
Condensate
Highly-RichGas
Rich Gas Dry Gas
Tota
l 3P
Loca
tions
RO
R
Total 3P Locations ROR @ 6/30/2015 Strip-Spot ROR @ 6/30/2015 Strip-Current
664
1,010
628 889
45%31%
14% 16%38%
26%
10% 13%0
500
1,000
1,500
0%
15%
30%
45%
60%
Highly-RichGas/
Condensate
Highly-RichGas
Rich Gas Dry Gas
Tota
l 3P
Loca
tions
RO
R
Total 3P Locations ROR @ 6/30/2015 Strip-Spot ROR @ 6/30/2015 Strip-Current
MARCELLUS WELL ECONOMICS(1)
Marcellus Well Cost Improvement(2)
1. 6/30/2015 pre-tax well economics based on a 9,000’ lateral, 6/30/2015 natural gas and WTI strip pricing for 2015-2024, flat thereafter, NGLs at 32.5% of WTI for 2015–2016 and 50% of WTI thereafter, and applicable firm transportation and operating costs . Well cost estimates include $1.2 million assumed for road, pad and production facilities. Current well costs include legacy contracts. Spot well costs are adjusted for current market drilling and completion rates resulting in a $1.2 million cost saving vs. current well costs. Antero will begin to realize spot well costs as the company utilizes incremental completion crews for deferred completions beginning at year end 2015 and as existing drilling rig contracts begin to roll off during 2016.
2. 2015E well costs based on $10.3 million for a 9,000’ lateral Marcellus well and $11.6 million for a 9,000’ lateral Utica well.
10
UTICA WELL ECONOMICS(1)
72% of Marcellus locations are processable (1100-plus Btu) 72% of Utica locations are processable (1100-plus Btu)
2015Drilling
Plan
Antero has reduced average well costs for a 9,000’ lateral by 16% in the Marcellus and 18% in the Utica as compared to 2014 well costs, through a combination of service cost reductions and drilling and completion efficiencies−Well economics on some wells expected to improve further starting in early 2016 as the Company utilizes incremental market based
contracts for drilling and completion operations which is expected to reduce well costs by another 10 to 12% over time
Utica Well Cost Improvement(2)
$1.357 $1.144
$0.000
$0.500
$1.000
$1.500
$2.000
2014 2015E
$MM
/1,0
00’ L
ater
al
Well Cost ($MM/1,000')
16% Decrease vs. 2014 $1.571
$1.289
$0.000
$0.500
$1.000
$1.500
$2.000
2014 2015E
$MM
/1,0
00’ L
ater
al
Well Cost ($MM/1,000')
18% Decrease vs. 2014
SUSTAINABLE BUSINESS MODEL – AR MULTI-YEAR DRILLING INVENTORY SUPPORTS LOW RISK, HIGH RETURN GROWTH PROFILE

11
HIGH VISIBILITY – PROJECTED MARCELLUS MIDSTREAM BUILDOUT
2014 2015 2016 2017 2018+

12
HIGH VISIBILITY – PROJECTED UTICA MIDSTREAM BUILDOUT2014 2015 2016 2017 2018+
Fixed Fee
100%
13
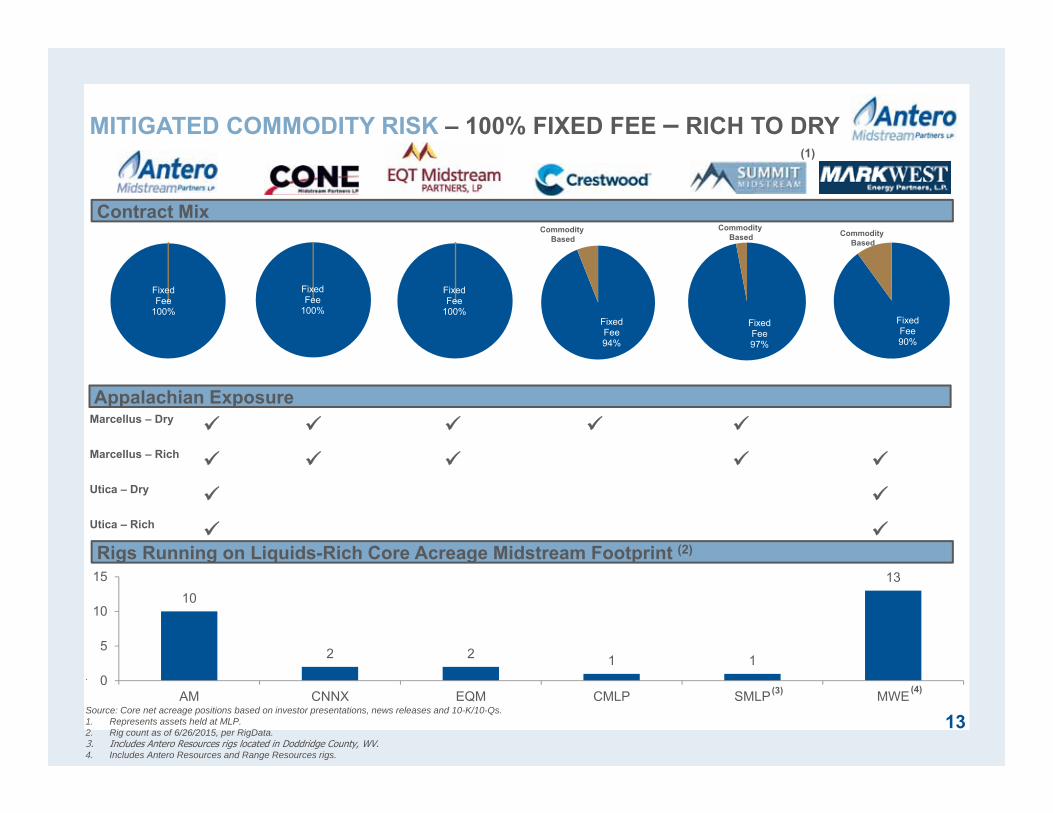
MITIGATED COMMODITY RISK – 100% FIXED FEE – RICH TO DRY
Contract Mix
Fixed Fee97%
Fixed Fee
100%
Fixed Fee
100%Fixed Fee94%
(1)
.
Source: Core net acreage positions based on investor presentations, news releases and 10-K/10-Qs.1. Represents assets held at MLP.2. Rig count as of 6/26/2015, per RigData.3. Includes Antero Resources rigs located in Doddridge County, WV. 4. Includes Antero Resources and Range Resources rigs.
CommodityBased
CommodityBased
CommodityBased
Appalachian ExposureMarcellus – Dry Marcellus – Rich Utica – Dry Utica – Rich Rigs Running on Liquids-Rich Core Acreage Midstream Footprint (2)
Fixed Fee90%
CommodityBased
(3) (4)
10
2 2 1 1
13
0
5
10
15
AM CNNX EQM CMLP SMLP MWE
0.0
0.5
1.0
1.5
2.0
2.5
3.0
3.5
4.0
4.5
5.0
Jan-
13M
ar-1
3
May
-13
Jul-1
3
Sep
-13
Nov
-13
Jan-
14M
ar-1
4
May
-14
Jul-1
4
Sep
-14
Nov
-14
Jan-
15M
ar-1
5
May
-15
Jul-1
5
Sep
-15
Nov
-15
Jan-
16
Mar
-16
May
-16
Jul-1
6
Sep
-16
Nov
-16
Jan-
17M
ar-1
7
May
-17
Jul-1
7
Sep
-17
Nov
-17
Jan-
18M
ar-1
8
May
-18
Jul-1
8
Sep
-18
Nov
-18
AR Gross Gas Production
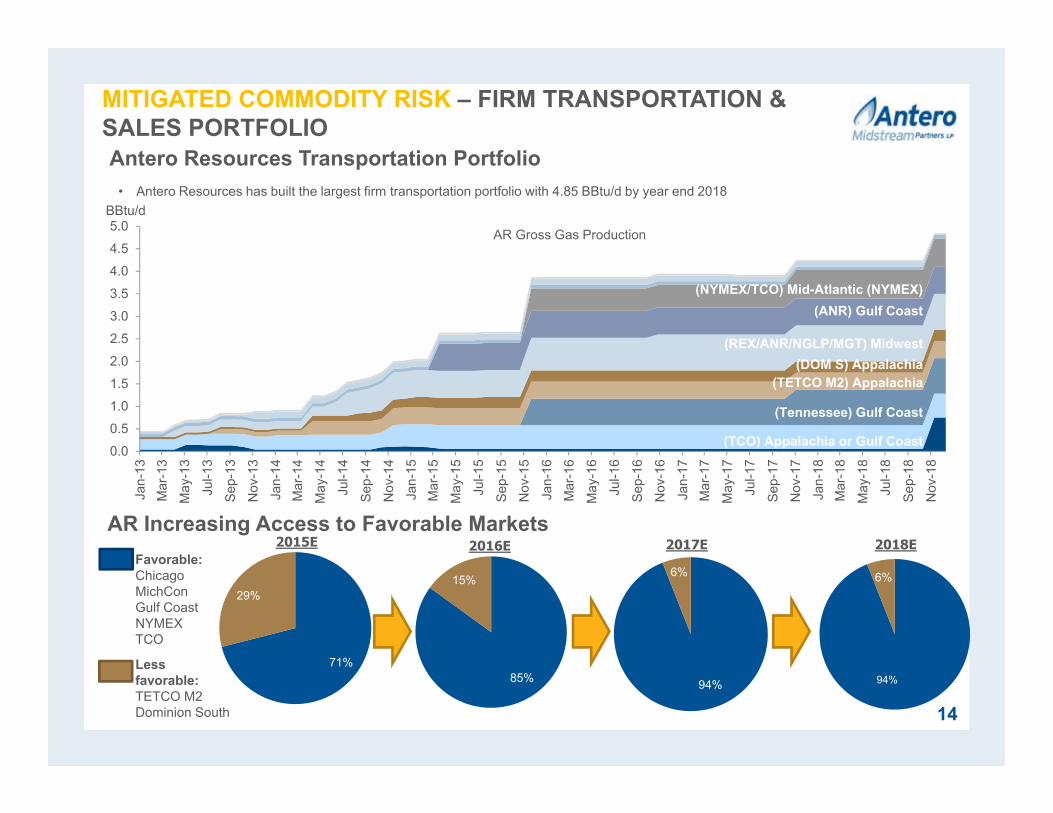
MITIGATED COMMODITY RISK – FIRM TRANSPORTATION & SALES PORTFOLIO
14
BBtu/d
Antero Resources Transportation Portfolio• Antero Resources has built the largest firm transportation portfolio with 4.85 BBtu/d by year end 2018
71%
29%
85%
15%
94%
6%
2015E 2016E 2017E 2018EFavorable:ChicagoMichConGulf CoastNYMEXTCO
AR Increasing Access to Favorable Markets
94%
6%
(NYMEX/TCO) Mid-Atlantic (NYMEX)(ANR) Gulf Coast
(REX/ANR/NGLP/MGT) Midwest(DOM S) Appalachia
(TETCO M2) Appalachia
(Tennessee) Gulf Coast
(TCO) Appalachia or Gulf Coast
Less favorable:TETCO M2Dominion South

$0.00
$1.00
$2.00
$3.00
$4.00
$5.00
$6.00
$0
$50
$100
$150
$200
$250
$MM
15
HEDGING – INTEGRAL TO BUSINESS MODEL
1. 4Q 2015 – 4Q 2021 hedge gains based on current mark-to-market hedge gains.2. Based on NYMEX strip as of 9/30/2015.
Hedging is a key component of Antero’s business model which includes development of a large, repeatable drilling inventory
Antero has realized almost $1.5 billion of gains on commodity hedges since 2009– Gains realized in 26 of last 27 quarters, or 96% of the quarters since 2009
● Based on Antero’s hedge position and assuming strip pricing as of 9/30/2015(2), a further $3.1 billion in hedge gains are projected to be realized through the end of 2021
● Significant additional hedge capacity remains under the credit facility hedging covenant for the 2017 – 2021 period
Quarterly Realized Hedge Gains / (Losses)(1)
Realized Hedge GainsProjected Hedge Gains(2)
NYMEX Natural Gas Historical Spot Prices
($/Mcf)
NYMEX Natural Gas Futures Prices(2)
3.1 Tcfe Hedged at average index price
of $3.93/Mcfethrough 2021
$3.1 Billion in Projected Hedge Gains Through
2021(1)
Average Hedge Prices ($/Mcfe)
$3.94 $3.83$4.06 $3.94
$3.75 $3.67
$4.51
Realized $1.5 Billion in Hedge
Gains Since 2009

Regional Gas Pipelines
Miles Capacity In-Service
Regional Gathering Pipeline(2)
50 1.4 Bcf/d 4Q 2015
161. Acquired by AM from AR for a $1.05 billion upfront payment and a $125 million earn out in each of 2019 and 2020. 2. AM holds option to purchase 15% of regional gathering pipeline at cost plus cost of carry.
EndUsers
EndUsers
Gas Processing
Y-Grade Pipeline
Long-Haul Interstate
Pipeline
InterConnect
NGL Product Pipelines
Fractionation
Compression
Low Pressure Gathering
Well Pad
Terminalsand
Storage
(Miles) YE 2014 YE 2015E
Marcellus 91 108
Utica 45 56
Total 136 164
AM has option to participate in processing, fractionation,
terminaling and storage projects offered to AR
(Miles) YE 2014 YE 2015E
Marcellus 62 76
Utica 35 36
Total 97 112
(MMcf/d) YE 2014 YE 2015E
Marcellus 375 800
Utica 0 120
Total 375 920
AM Owned Assets
Condensate GatheringStabilization
(Miles) YE 2014 YE 2015E
Utica 16 19
EndUsers
AM Option Assets
(Ethane, Propane, Butane, etc.)
VALUE CHAIN OPPORTUNITY – FULL MIDSTREAM VALUE CHAIN
Water Drop Down Completed

Liquidity
STRONG FINANCIAL POSITION – STRONG BALANCE SHEETAND FLEXIBILITY
Antero Resources (NYSE:AR) Antero Midstream (NYSE:AM)(4)
6/30/15 Debt Liquid Non-E&P Assets 6/30/15 Debt Liquid Assets
Debt Type $MMPF Credit facility(1) $324
6.00% senior notes due 2020 525
5.375% senior notes due 2021 1,000
5.125% senior notes due 2022 1,100
5.625% senior notes due 2023 750
Total $3,699
Asset Type $MMCommodity derivatives $3,096
PF AM equity ownership(3) 2,790
Cash 30
Total $5,916
Liquid non-E&P assets of $5.9 Bn pro forma for water drop down significantly exceed total pro forma debt of $3.7 Bn
Asset Type $MMCash (including from water drop down) $30
Credit facility – borrowing base capacity 4,000
Credit facility – drawn (324)
Credit facility – letters of credit (475)
Total $3,231
Debt Type $MMPF Credit facility(4) $439
Total $439
Asset Type $MMPF Cash $0
Total $0
Liquidity
Asset Type $MMCash $-
Credit facility – capacity(5) 1,500
Credit facility – drawn (439)
Credit facility – letters of credit -
Total $1,061
Over $6.0 billion of liquidity at AR including $2.8 billion of liquid AM units Over $1 billion of liquidity at AM
Note: All balance sheet data as of 6/30/2015, except where pro forma.1. Pro forma credit facility outstanding reduced by $794 million of net proceeds from $1.05 billion water drop down to Antero Midstream; additional consideration of 11.0 million AM units also received. 2. Mark-to-market as of 9/30/2015.3. Based on AR ownership of AM units (105.9 million common and subordinated units) plus 11.0 million AM units received in AR water drop down. AM price as of 10/9/2015. 4. Pro forma for $1.05 billion water drop down funded with $113 million of cash, $439 million of debt and net proceeds from 11.0 million units to AR and 12.9 million units from PIPE transaction.5. Credit facility increased to $1.5 billion upon water drop down – 3 new banks added to existing bank group of 17 banks.
17
Only 29% of AM credit facility capacity drawn
(2)

0.0x
1.0x
2.0x
3.0x
4.0x
5.0x
6.0x
Peer 1 Peer 2 Peer 3 Peer 4 Peer 5 Peer 6 Peer 7 Peer 8
Tota
l Deb
t / L
QA
EB
ITD
A
(4)
• $1.5 billion revolver in place to fund future growth capital (5x Debt/EBITDA Cap)
• Pro forma liquidity of $1,061 million at 6/30/2015
• Sponsor (NYSE: AR) has Ba2/BB corporate ratings
AM Liquidity (6/30/2015)(1)
AM Peer Leverage Comparison(3)
($ in millions)
Revolver Capacity(2) $1,500
Less: Borrowings 439
Plus: Cash -
Liquidity $1,061
Financial Flexibility
STRONG FINANCIAL POSITION – SIGNIFICANT FINANCIAL FLEXIBILITY
181. Pro forma for $1.05 billion water drop down funded with $113 million of cash, $439 million of debt and net proceeds from 11.0 million units to AR and 12.9 million units from PIPE transaction. 2. Revolver capacity increased to $1.5 billion at water drop down. 3. As of 6/30/2015. Peers include TEP, EQM, MWE, WES, RMP, SHLX, DM, and CNNX.4. AM pro forma for water drop down; LQA EBITDA for water based on 2016E midpoint of 8.5x – 9.0x purchase price multiple announced.

TOP TIER DISTRIBUTION GROWTH & HEALTHY COVERAGE
19
26% 26%24% 25% 24% 25%
18%
15%
10%12%
6%
1.6x 1.5x
1.2x
1.8x
1.2x 1.2x
1.6x
1.3x
1.2x 1.3x
1.0x
0.00x
0.20x
0.40x
0.60x
0.80x
1.00x
1.20x
1.40x
1.60x
1.80x
2.00x
0%
5%
10%
15%
20%
25%
30%
AM SHLX PSXP VLP DM MPLX EQM TEP CNNX WES MWE
3–Year Expected Distribution Growth Rate and DCF Coverage(1)
1. Based on Bloomberg 2015-2017 consensus distribution and DCF coverage estimates data as of 10/9/2015.

MWE
WES
CNNX
TEP
EQM
MPLX
VLPPSXP
DM
SHLX
0%
1%
2%
3%
4%
5%
6%
7%
8%
9%
10%
3% 8% 13% 18% 23% 28% 33%
Yiel
d (%
)
2015-2018 Distribution Growth CAGRBubble Size Reflects Market Capitalization
R-squared = .83
Note: Based on Bloomberg consensus estimates and market prices as of 10/9/2015.
ATTRACTIVE VALUE PROPOSITION
20
AM - Current Yield: 3.18%Price: $23.87
AM - ImpliedYield: 2.53%Price: $30.05
• Attractive appreciation potential on a relative basis

Antero Midstream (NYSE: AM)Asset Overview
21

1. Represents inception to date actuals as of 12/31/2014 and 2015 midpoint guidance.2. Pro forma for water drop down. Includes $15.0 million of maintenance capex at 2015 midpoint guidance.
22
UticaShale
MarcellusShale
Projected Midstream Infrastructure(1)
Marcellus Shale
Utica Shale Total
YE 2014 Cumulative Gathering/ Compression Capex ($MM) $836 $345 $1,181
Gathering Pipelines(Miles) 153 80 233
Compression Capacity(MMcf/d) 375 - 375
Condensate Gathering Pipelines (Miles) - 16 16
2015E Capex Budget ($MM)(2) $256 $182 $438Gathering Pipelines
(Miles) 31 12 43
Compression Capacity(MMcf/d) 425 120 545
Condensate Gathering Pipelines (Miles) - 3 3
Midstream Assets
ANTERO MIDSTREAM ASSET OVERVIEW
• Gathering and compression assets in core of rapidly growing Marcellus and Utica Shale plays
– Acreage dedication of ~434,000 net leasehold acres for gathering and compression services
– Additional stacked pay potential with dedication on 186,000 acres of Utica deep rights underlying the Marcellus in WV and PA
– 100% fixed fee long term contracts
• AR owns 67% of AM units (NYSE: AM) pro forma

ANTERO MIDSTREAM ASSETS – RICH GAS MARCELLUS
23
• Provides Marcellus gathering and compression services
− Liquids-rich gas is delivered to MWE’s 1.2 Bcf/d Sherwood processing complex
• Significant growth projected over the next twelve months as set out below:
• Antero plans to operate an average of nine drilling rigs in the Marcellus Shale during 2015, including intermediate rigs
− 100% of rigs targeting the highly-rich gas/condensate and highly-rich gas regimes
• Of the 80 gross wells targeted to be completed in 2015, 90% (72 gross wells) are forecast to be completed in the AM dedicated area
− AM dedicated acreage contains 2,165 gross undeveloped Marcellus locations and 313 Upper Devonian locations
• Antero will defer 50 completions originally scheduled to occur in the second and third quarters of 2015 into 2016 in order to limit natural gas volumes sold into unfavorable pricing markets
− 28 of the deferred completions are in the AM dedicated area
Marcellus Gathering & Compression
Note: Antero acreage position reflects tax districts in which greater than 3,000 net acres are owned.
YE 2014 YE 2015E
Low Pressure Gathering Pipelines (Miles)
91 108
High Pressure Gathering Pipelines (Miles)
62 76
Compression Capacity (MMcf/d) 375 800
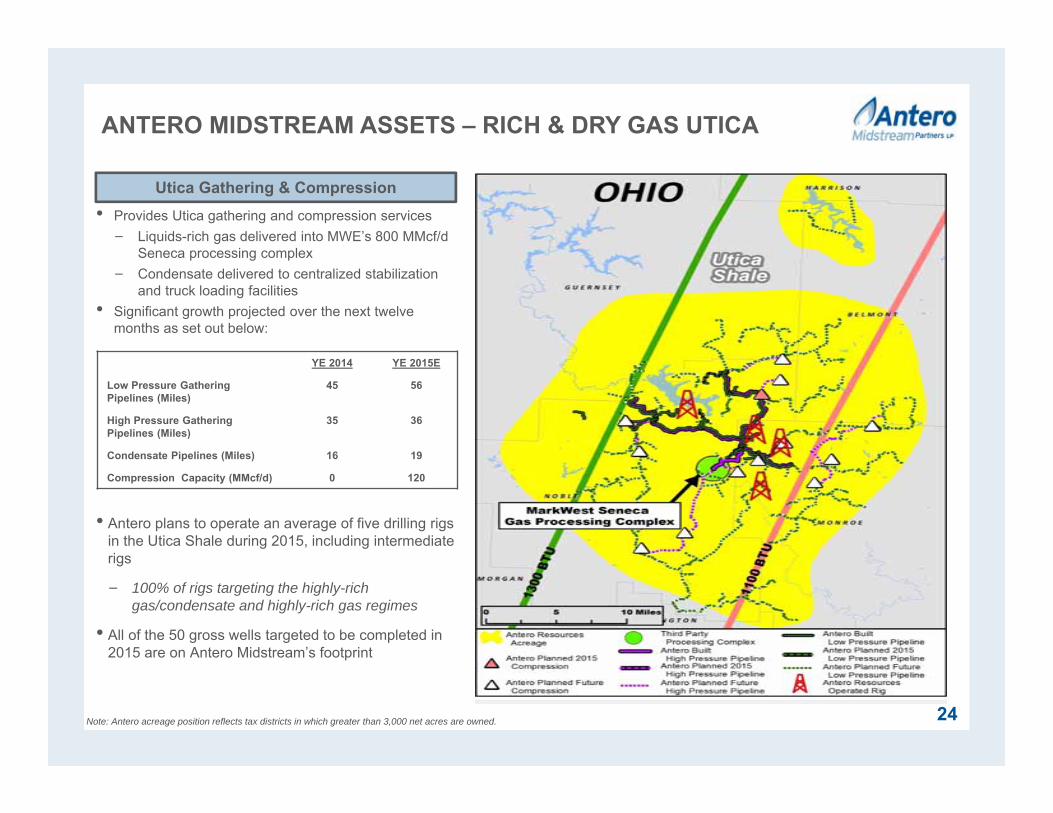
24
• Provides Utica gathering and compression services− Liquids-rich gas delivered into MWE’s 800 MMcf/d
Seneca processing complex− Condensate delivered to centralized stabilization
and truck loading facilities• Significant growth projected over the next twelve
months as set out below:
• Antero plans to operate an average of five drilling rigs in the Utica Shale during 2015, including intermediate rigs
− 100% of rigs targeting the highly-rich gas/condensate and highly-rich gas regimes
• All of the 50 gross wells targeted to be completed in 2015 are on Antero Midstream’s footprint
Utica Gathering & Compression
Note: Antero acreage position reflects tax districts in which greater than 3,000 net acres are owned.
ANTERO MIDSTREAM ASSETS – RICH & DRY GAS UTICA
YE 2014 YE 2015E
Low Pressure Gathering Pipelines (Miles)
45 56
High Pressure Gathering Pipelines (Miles)
35 36
Condensate Pipelines (Miles) 16 19
Compression Capacity (MMcf/d) 0 120

ANTERO INTEGRATED WATER BUSINESS
25
Marcellus Fresh Water System(2)
• Provides fresh water to support Marcellus well completions • Year-round water supply sources: Ohio River and local rivers• Ozone Water treatment facility to be in-service by 3Q 2015• Significant asset growth in 2015 as summarized below:
Note: Antero acreage position reflects tax districts in which greater than 3,000 net acres are owned.1. Represents inception to date actuals as of 06/30/2015 and 2015 guidance.2. All Antero water withdrawal sites are fully permitted under long-term state regulatory permits both in WV and OH. 3. Assumes fee of $3.685 per barrel subject to annual inflation and 250,000 barrels of water per well that utilize the fresh water delivery system based on 9,000 foot lateral. Operating margin excludes G&A.4. Assumes fee of $3.635 per barrel subject to annual inflation and 275,000 barrels of water per well that utilize the fresh water delivery system based on 9,000 foot lateral. Operating margin excludes G&A.
Utica Fresh Water System(2)
• Provides fresh water to support Utica well completions • Year-round water supply sources: local reservoirs and rivers• Significant asset growth in 2015 as summarized below:
Marcellus Water System YE 2014 YE 2015E
Water Pipeline (Miles) 177 226
Fresh Water Storage Impoundments 22 24
Cash Operating Margin per Well ($)(3) $700K -$750K
Utica Water System YE 2014 YE 2015E
Water Pipeline (Miles) 61 90
Fresh Water Storage Impoundments 8 14
Cash Operating Margin per Well ($)(4) $775K -$825K
Projected Fresh Water Delivery Infrastructure(1)
Marcellus Shale
Utica Shale Total
YE 2015E Cumulative Water System Capex ($MM) $340 $113 $453Water Pipelines (Miles) 226 90 316Water Storage Facilities 24 14 38
AM has acquired AR’s integrated water business for $1.05 billion plus earn out payments of $125 million at year-end in each of 2019 and 2020− The acquired business includes Antero’s Marcellus and Utica freshwater delivery business, the fully-contracted future advanced wastewater
treatment complex and all fluid handling and disposal services for Antero
Antero advanced wastewater treatment facility to be constructed – connects to Antero
freshwater delivery system

010,00020,00030,00040,00050,00060,00070,00080,000
Antero Clearwater Advanced Wastewater Treatment Capacity (Bbl/d)
Produced/Flowback Volumes (Bbl/d)
ADVANCED WASTEWATER TREATMENT
Illustrative Produced & Flowback Water VolumesAdvanced Wastewater Treatment
Antero Produced Water Services and Freshwater Delivery Business
Antero AdvancedWastewater Treatment
3rd Party Recyclingand Well Disposal
(Bbl/d)
Advanced Wastewater Treatment ComplexEstimated capital expenditures ($ million)(1) ~$275Standalone EBITDA at 100% utilization(2) ~$55 – $65Implied investment to standalone EBITDA build-out multiple ~4x – 5xEstimated per well savings to Antero Resources ~$150,000Estimated in-service date Late 2017Operating capacity (Bbl/d) 60,000Operating agreement
• Antero has contracted with Veolia to integrate an advanced wastewater treatment complex into its water business
• Veolia will build and operate, and Antero will own largest advanced wastewater treatment complex in Appalachia− Will treat and recycle AR produced and flowback water− Creates additional year-round water source for completions− Will have capacity for third party business over first two years
1. Includes capital to construct pipeline to connect facility to freshwater delivery system. Includes $10 million that AR agreed to fund in the drop down transaction. 2. Standalone EBITDA projection assumes inter-company fixed fee for recycling of $4.00 per barrel and 60,000 barrels per day of capacity. Does not include potential sales of marketable byproducts.
20 Years, Extendable
26Integrated Water Business

ORGANIC GROWTH STRATEGY: “BUILD VS. BUY”
27
• Organic growth strategy provides attractive returns and project economics, while avoiding the competitive acquisition market
• Industry leading organic growth story
– ~$1.06 billion in capital spent through 9/30/2014
– $425 million in additional growth capital forecast for the twelve-month period ending 12/31/15 (excludes $12.5 million of maintenance capital)
Note: Precedent data per IHS Herold’s research and public filings.1. Antero organic multiple calculated as estimated gathering and compression capital expended through Q3 2014 divided by 2015 projected gathering and compression EBITDA, assuming 12-15 month
lag between capital incurred and full system utilization.2. Selected gathering and compression drop down acquisitions since 1/1/2011. Drop down multiples are based on NTM EBITDA. Source: Barclays.
6.8x
11.9x
10.7x
10.0x
9.3x9.0x 9.0x 9.0x 8.9x 8.9x 8.8x 8.6x
8.0x 7.9x
7.0x 6.9x
5.5x
0.0x
1.0x
2.0x
3.0x
4.0x
5.0x
6.0x
7.0x
8.0x
9.0x
10.0x
11.0x
12.0x
Drop Down Multiple(2)
Organic EBITDA Multiple vs. Precedent Drop Down Multiples
Median: 8.9x
Value creation for the AM unit holder =Build at 4x to 7x EBITDA
vs.Drop Down / Buy at 8x to 12x EBITDA

LPGathering
HPGathering Compression
CondensateGathering
Water Business
RegionalPipeline
Processing/Fractionation
Unlevered IRR Range: 25% - 35% 15% - 25% 10% - 20% 25% - 35% 30% - 40% 15% - 25% 15% - 20% Payout (Years): 2.5 - 4.0 3.5 - 4.5 4.0 - 6.5 2.0 - 3.5 2.0 – 3.0 3.5 - 7.0 5.0 - 6.0 Minimum Volume Commitments: N/A 75% 70% N/A Yes 80% 80%
2015 Capex(2) TotalMarcellus $298 $49 $62 $105 - $82 Utica 125 44 11 63 5 3
Growth Capex $423 $93 $73 $168 $5 $85 % of Capex 100% 22% 17% 40% 1% 20%
Included in 2015 Budget: Marcellus & Utica
Marcellus & Utica
Marcellus & Utica
Utica Marcellus & Utica
Not Included Not Included
Additional In-hand Opportunities:
Dry Utica Dry Utica Dry Utica Utica Stabilization
Dry Utica Regional Gathering
Pipeline
Marcellus Processing/
Fractionation
25%
15%
10%
25%
30%
15% 15%
35%
25%
20%
35%
25%20%
40%
0%
10%
20%
30%
40%
Inte
rnal
Rat
e of
Ret
urn
28
Project Economics by Segment(1)
ESTIMATED PROJECT ECONOMICS BY SEGMENT
1. Based on management capex, operating cost and throughput assumptions by project. Capex guidance updated per 9/18/2015 Partnership press release. 2. Excludes $15.0 million of maintenance capex.
Wtd. Avg. 24% IRR
AM Option Opportunities

AM UPSIDE OPPORTUNITY SET
29
ACTIVITY CURRENTLY DEDICATED TO AM
Third Party Business
Processing, Fractionation, Transportation and Marketing
Regional Pipeline Project• Option to participate for up to 15% in regional gathering
pipeline project in West Virginia expected to go in-service in 4Q 2015
• Additive to full value chain model
• Opportunity to expand fresh water, waste water and gathering/compression services to third parties in Marcellus and Utica to enhance asset utilization
• AR must request a bid from AM and can only reject if third party service fees are lower. AM has right to match lower fee offer.
WV/PA Utica Dry Gas• 186,000 net acres of AR Utica dry gas acreage underlying
the Marcellus in West Virginia and Pennsylvania dedicated to AM
• AR drilling its first WV Utica well
Active AR Leasing• Future acreage acquisitions by AR are dedicated to AM• Added 92,000 net acres in 2014 and have added 20,000
net acres in 2015
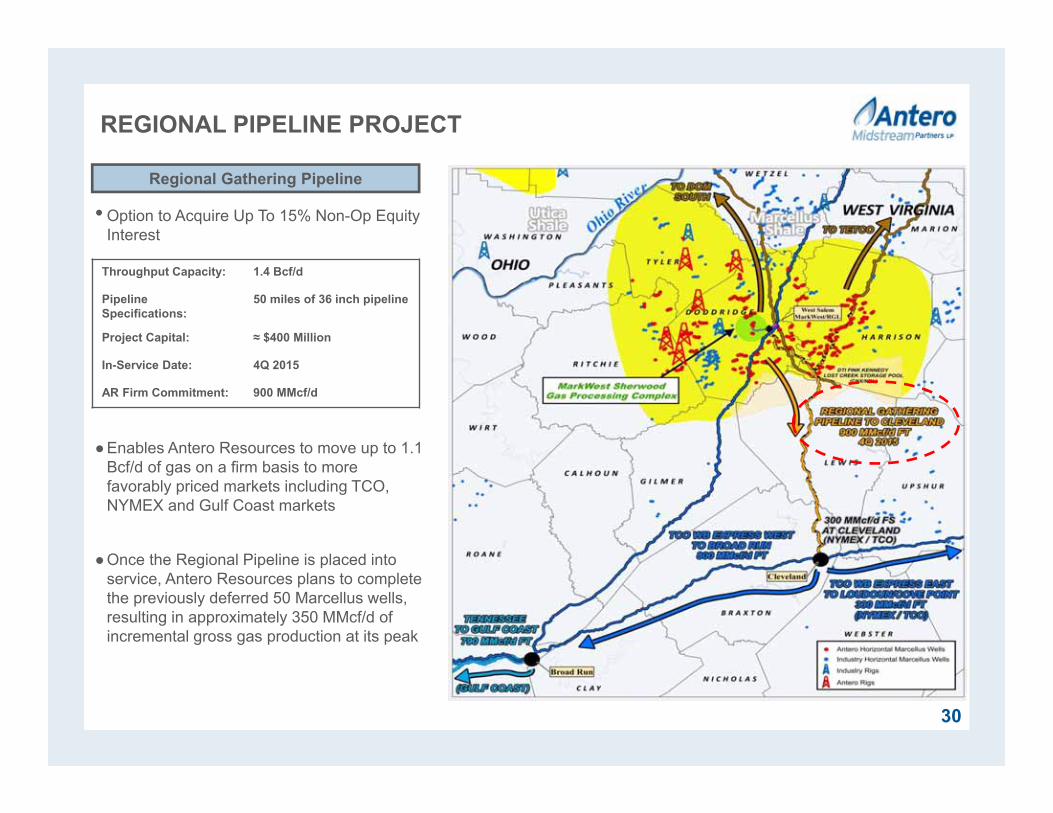
REGIONAL PIPELINE PROJECT
• Option to Acquire Up To 15% Non-Op Equity Interest
●Enables Antero Resources to move up to 1.1 Bcf/d of gas on a firm basis to more favorably priced markets including TCO, NYMEX and Gulf Coast markets
●Once the Regional Pipeline is placed into service, Antero Resources plans to complete the previously deferred 50 Marcellus wells, resulting in approximately 350 MMcf/d of incremental gross gas production at its peak
Regional Gathering Pipeline
Throughput Capacity: 1.4 Bcf/d
Pipeline Specifications:
50 miles of 36 inch pipeline
Project Capital: ≈ $400 Million
In-Service Date: 4Q 2015
AR Firm Commitment: 900 MMcf/d
30
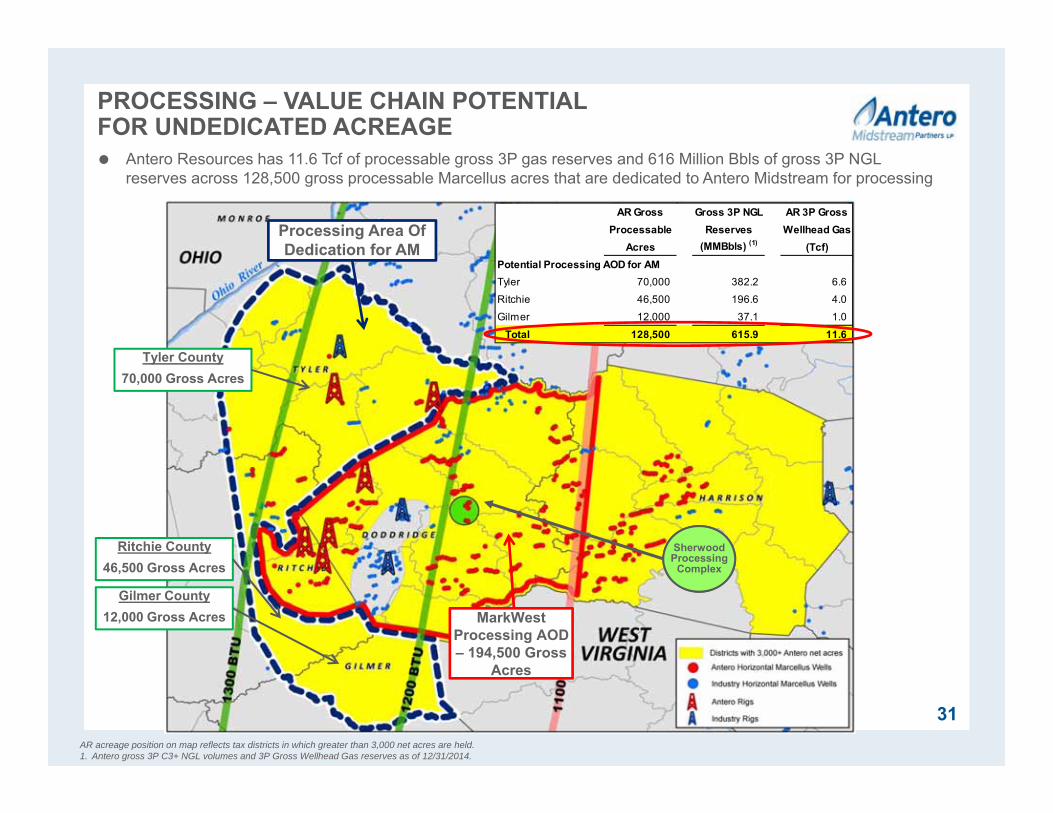
PROCESSING – VALUE CHAIN POTENTIALFOR UNDEDICATED ACREAGE
SherwoodProcessing
Complex
AR acreage position on map reflects tax districts in which greater than 3,000 net acres are held.1. Antero gross 3P C3+ NGL volumes and 3P Gross Wellhead Gas reserves as of 12/31/2014.
Processing Area Of Dedication for AM
MarkWest Processing AOD – 194,500 Gross
Acres
Tyler County70,000 Gross Acres
Ritchie County46,500 Gross Acres
Antero Resources has 11.6 Tcf of processable gross 3P gas reserves and 616 Million Bbls of gross 3P NGL reserves across 128,500 gross processable Marcellus acres that are dedicated to Antero Midstream for processing
31
Gilmer County12,000 Gross Acres
AR Gross Gross 3P NGL AR 3P GrossProcessable Reserves Wellhead Gas
Acres (MMBbls) (1) (Tcf)Potential Processing AOD for AMTyler 70,000 382.2 6.6
Ritchie 46,500 196.6 4.0
Gilmer 12,000 37.1 1.0
Total 128,500 615.9 11.6

LARGE UTICA SHALE DRY GAS POSITION
32
Antero has the right to build gathering and compression infrastructure to move Antero’s future dry gas Utica production− AM pro forma water business would also serve Antero’s
dry gas Utica development Antero drilled and cased its first dry gas Utica well in 3Q
2015 Antero has 226,000 net acres of exposure to Utica dry gas
play Other operators have reported strong Utica Shale dry gas
results including the following wells:
ChesapeakeHubbard BRK #3H
3,550’ LateralIP 11.1 MMcf/d
HessPorterfield 1H-17
5,000’ LateralIP 17.2 MMcf/d
GulfportIrons #1-4H5,714’ Lateral
IP 30.3 MMcf/d
EclipseTippens #6H5,858’ Lateral
IP 23.2 MMcf/d
Magnum HunterStalder #3UH5,050’ Lateral
IP 32.5 MMcf/d
AnteroUtica Well
Drilling
Well Operator24-hr IP(MMcf/d)
LateralLength
(Ft)
IP/1,000’Lateral
(MMcf/d)
Scotts Run EQT 72.9 3,221 22.633
Gaut 4IH CNX 61.0 5,840 11.131
CSC #11H RRC 59.0 5,420 10.886
Stewart-Win 1300U MHR 46.5 5,289 8.792
Bigfoot 9H RICE 41.7 6,957 5.994
Blank U-7H GST 36.8 6,617 5.561
Stalder #3UH MHR 32.5 5,050 6.436
Irons #1-4H GPOR 30.3 5,714 5.303
Pribble 6HU SGY 30.0 3,605 8.322
Simms U-5H GST 29.4 4,447 6.611
Conner 6H CVX 25.0 6,451 3.875
Messenger 3H SWN 25.0 5,889 4.245
Tippens #6H ECR 23.2 5,858 3.960
Porterfield 1H-17 HESS 17.2 5,000 3.440
1. Antero acreage position reflects tax districts in which greater than 3,000 net acres are held in OH, WV and PA.
Magnum HunterStewart Winland 1300U
5,289’ LateralIP 46.5 MMcf/d
RangeClaysville SC #11H
5,420’ LateralIP 59.0 MMcf/d
ChevronConner 6H
6,451’ LateralIP 25.0 MMcf/dGastar
Simms U-5H4,447’ Lateral
IP 29.4 MMcf/d
Utica Shale Dry Gas Acreage in OH/WV/PA(1)
RiceBigfoot 9H
6,957’ LateralIP 41.7 MMcf/d
AR Utica Shale Dry GasWV/PA
Net Resource12.5 to 16 Tcf
1,889 Gross Locations186,000 Net Acres
AR Utica Shale Dry GasOhio
3P Reserves2.4 Tcf
289 Gross Locations40,000 Net Acres
AR Utica Shale Dry GasTotal OH/WV/PA
Net Resource14.9 to 18.4 Tcf
2,178 Gross Locations226,000 Net Acres
Stone EnergyPribble 6HU
3,605’ LateralIP 30.0 MMcf/d
SouthwesternMessenger 3H5,889’ Lateral
IP 25.0 MMcf/d
RiceBlue Thunder
10H, 12H≈9,000’ Lateral
GastarBlake U-7H
6,617’ LateralIP 36.8 MMcf/d
EQTScotts Run
3,221’ LateralIP 72.9 MMcf/d
CNXGaut 4IH
5,840’ LateralIP 61.0 MMcf/d

Low Cost Marcellus/Utica Focus
“Best-in-Class” Distribution Growth
33
CATALYSTS
28% to 30% per year from 2015 to 2017 targeted based on Sponsor planned development; additional third party business expansion opportunities
AM Sponsor is the most active operator in Appalachia; 40%+ production growth targeted for 2015 supported by $1.8 billion capital budget, firm processing and takeaway, long-term natural gas hedges and $3.2 billion of liquidity; targeting 25% to 30% production growth in 2016
Sponsor operations target two of the lowest cost shale plays in North America; attractive well economics support continued drilling at current prices
Multiple opportunities exist for additional gathering and compression, processing and pipeline assets for Sponsor and third party use
Appalachian Basin Midstream Growth
High Growth Sponsor Production Profile
1
2
3
4
5
6
Acquisition of integrated water business from Antero expected to result in distributable cash flow per unit accretion in 2016
Stacked Pay Basin Upside
Development of Utica Shale Dry Gas and Upper Devonian resources provide further midstream infrastructure expansion opportunities
Integrated WaterBusiness Drop Down

APPENDIX
34

Transaction Specifics
ASSETS:• Antero’s Marcellus and Utica freshwater delivery business, the fully contracted future
advanced wastewater treatment complex and 20-year agreement to cover all fluid handling and disposal services for Antero
PURCHASE PRICE: • $1.05 billion initial payment at closing and earn out payments at year-end 2019 and 2020 of $125 million each if 3-year volume threshold is met
MINIMUM VOLUME COMMITMENTS: • 90,000 Bbl/d in 2016, 100,000 Bbl/d in 2017 and 120,000 Bbl/d in 2018 and 2019
FINANCING:• $243 million of units issued via PIPE, $257 million of units issued to Antero Resources and
$552 million from existing cash and revolving credit facility; 23.9 million partnership units issued in total
CLOSING: • Expected to close concurrently with AM PIPE unit offering on September 23, 2015
Transaction Rationale
SCALE/GROWTH:
• Accretive to AM growth story and adds largest Appalachian integrated water business to high growth gathering and compressions assets to create one of the highest growth midstream MLPs in the U.S.
• PIPE cash proceeds to be used by AR to repay debt and fund future development plan
VALUATION: • Accretive purchase price at 8.5x to 9.0x projected 2016 EBITDA
MIDSTREAMINTEGRATION:
• Integrates water delivery, water services and waste water treatment business with existing gas gathering and compression business
THIRD PARTY BUSINESS: • Enhances AM’s ability to attract third party business – fresh water supply to completions and treatment of produced and flowback water
PRO FORMA LEVERAGE: • Net Debt/LTM EBITDAX 1.7x; over $1 billion of AM liquidity post transaction
WATER DROP DOWN COMPLETED
35

MVCS SUPPORT AND EARN OUTS DRIVE RETURNS
361. The 2019 earn out is based on a trailing 36 month fresh water delivery volume average at the end of 2019 of 161,000 Bbl/d while the 2020 earn out is based on a trailing 36 month fresh water delivery volume average at the end of 2020 of 200,000 Bbl/d.
Minimum volume commitments (MVCs) on fresh water delivery volumes, at $3.68 and $3.63 per barrel for the Marcellus and Utica respectively (with CPI adjustments), support revenues and rates of return for the water business acquisition
Earn out payments at year-end 2019 and 2020 provide incentives for the sponsor to perform long-term
0
40
80
120
160
200
2014 2015E 2016E 2017E 2018E 2019E 2020E
MB
bl/d
Actual Volumes Estimated Volumes MVCs
Fresh Water Delivery MVCs and Earn Out Payments(1)17
7 C
ompl
etio
ns
≈ 13
0 C
ompl
etio
ns
≈ 12
5 -1
35 C
ompl
etio
ns
2020 Earn Out – 200 MBbl/d Avg
2019 Earn Out – 161 MBbl/d Avg
MVC90K
MVC100K
MVC120K
MVC120K
125K
80K - 85K
50 Deferred Completions
Transaction Metrics2016E EBITDA: $115MM - $125MM
Estimated Volume: 115K - 125K Bbl/d 2016E Completions: 160 - 170
2016E VolumeMidpoint 120K

IMPACT OF DROP DOWN TRANSACTION ON ANTERO FINANCIAL STATEMENTS
37
Metrics
Pre-Drop DownAntero Resources
(Consolidated)
Pro Forma Drop DownAntero Resources
(Consolidated)Antero Midstream
Partners
Fresh Water Distribution Fees N/A - Eliminated Upon Consolidation
N/A - Eliminated Upon Consolidation Revenue
Fresh Water Operating Expenses ("Opex") Drilling & Completion Capital
Drilling & Completion Capital
Operating Expenses
Fresh Water Infrastructure Capital Water Capital Water Capital Water Capital
Advanced Wastewater Treatment Fees(Upon 4Q ‘17 Expected In-Service) N/A N/A - Eliminated Upon
Consolidation Revenue
Advanced Wastewater Treatment Opex (Upon 4Q ‘17 Expected In-Service) N/A Drilling & Completion
Capital and LOEOperating Expenses
Advanced Wastewater Treatment Capital(Upon 4Q ‘17 Expected In-Service) Water Capital Water Capital Water Capital
2016E EBITDA Multiple of Drop Down N/AN/A - Water Fees are
Eliminated and Opex is Capitalized
8.5x - 9.0x
Implied 2016 EBITDA of Water Business N/AN/A - Water Fees are
Eliminated and Opex is Capitalized
~ $115 - $125 Million

LARGEST FIRM TRANSPORTATION AND PROCESSING PORTFOLIO IN APPALACHIA
Antero Long Term Firm Processing & Takeaway Position (YE 2018) – Accessing Favorable MarketsMariner East 2
62 MBbl/d CommitmentMarcus Hook Export
Shell20 MBbl/d CommitmentBeaver County Cracker
(Pending FID YE‘15)
Sabine Pass (Trains 1-4)50 MMcf/d per Train
Freeport LNG70 MMcf/d
1. November 2015 and full year 2016 futures basis, respectively, provided by Wells Fargo dated 9/30/2015. Favorable markets shaded in green.
Chicago(1)
$.22 / $0.04
CGTLA(1)
$(0.09) / $(0.08)
Dom South(1)
$(1.55) / $(1.05)
TCO(1)
$(0.18) / $(0.22)
38
Cove Point
4.85 Bcf/dFirm GasTakeaway
By YE 2018
4.85 Bcf/d natural gas FT portfolio by YE 2018 with 85% serving favorable markets and an average demand fee of $0.40/MMBtu
YE 2018 Gas Market MixAR 4.85 Bcf/d FT
43%Gulf Coast
16%Midwest
13%Atlantic
Seaboard
12%Dom S/TETCO
(PA)
15%TCO

NORTHEAST NGLS ARE TRANSPORTATION CHALLENGED
1. As an anchor shipper on Mariner East 2, Antero has the right to expand its NGL commitment with notice to operator. 2. 2015 NGL production assumes ethane rejection.
Mariner East 261,500 Bbl/d AR Commitment(1)
4Q 2016 In-Service
Not so much a supply problem but more of a logistics problem for NGLs in the northeast today− The majority of northeast NGL production is being transported by expensive rail and trucking− NGLs that are transported “to the water” are also faced with high shipping rates
Export15%
Gulf Coast13%
Mid-Atlantic
6%Sarnia
3%
Northeast43%
Midwest10%
Edmonton10%
2015 NGL Marketing by Region
39

NORTHEAST NGL GROWTH IS SUPPORTED BY INCREASING TAKEAWAY OPTIONS
1. Chart 10 per BAML research dated 6/5/2015. Pipeline volumes are capacity estimates.
Industry NGL Pipelines – Actual (2015) and Projected(1)
40
ShellBeaver County Cracker
(Pending FID YE’15)
Mariner East 262 MBbl/d Commitment
Marcus Hook ExportAR Has Doubling Rights
Gulf Coast Critical to
NGL Pricing
Appalachia
NGL transportation rates are expected to decline $0.12 to $0.15 per gallon by 2017 as pipeline options to domestic markets and export terminals go in-service (Mariner East 1 and 2, for example)
(MMBbl/d)

$0.00
$0.10
$0.20
$0.30
$0.40
$0.50
$/G
allo
n
Baltic Exchange LPG Freight Futures
Baltic LPG Rate ($/gal) Marcus Hook to Europe ($/gal)
Marcus Hook to Far East ($/gal)
U.S. EXPORTS ARE SUPPORTED BY EXCESSDOCK CAPACITY AND FLEET GROWTH
0200400600800
1,0001,2001,4001,6001,800
2009 2010 2011 2012 2013 2014 2015 2016 2017 2018 2019 2020 2021 2022 2023 2024 2025
MB
bl/d
Butane Exports Propane Exports Total Export Capacity
Excess LPG Export Terminal Capacity vs. Expected Export Volumes(1)
Excess dock capacity supports growing LPG export volumes
through 2025
Fleet Growth Supports U.S. LPG Export Growth(2) LPG Freight Futures Show Declining Freight Costs(3)
Baltic LPG shipping cost declines from $0.14/gal to $0.09-$0.10/gal in early 2017
on fleet supply growth numbers
Projected growth in VLGC fleet supports increasing LPG export volumes and
lower shipping costs
1. Source: Bentek.2. Source: Poten & Partners, August 2015.3. Baltic Rate based on 9/30/2015 Baltic Futures converted to cost per gallon of LPGs, assuming 75/25 propane/butane.
LPG transportation rates from northeast fractionation to Europe and Asia should improve by $0.05 to $0.15 per gallon by YE 2016,driven both by pipelines replacing rail and by lower shipping costs
Excess Dock Capacity
Current Fleet 168New builds +85
41
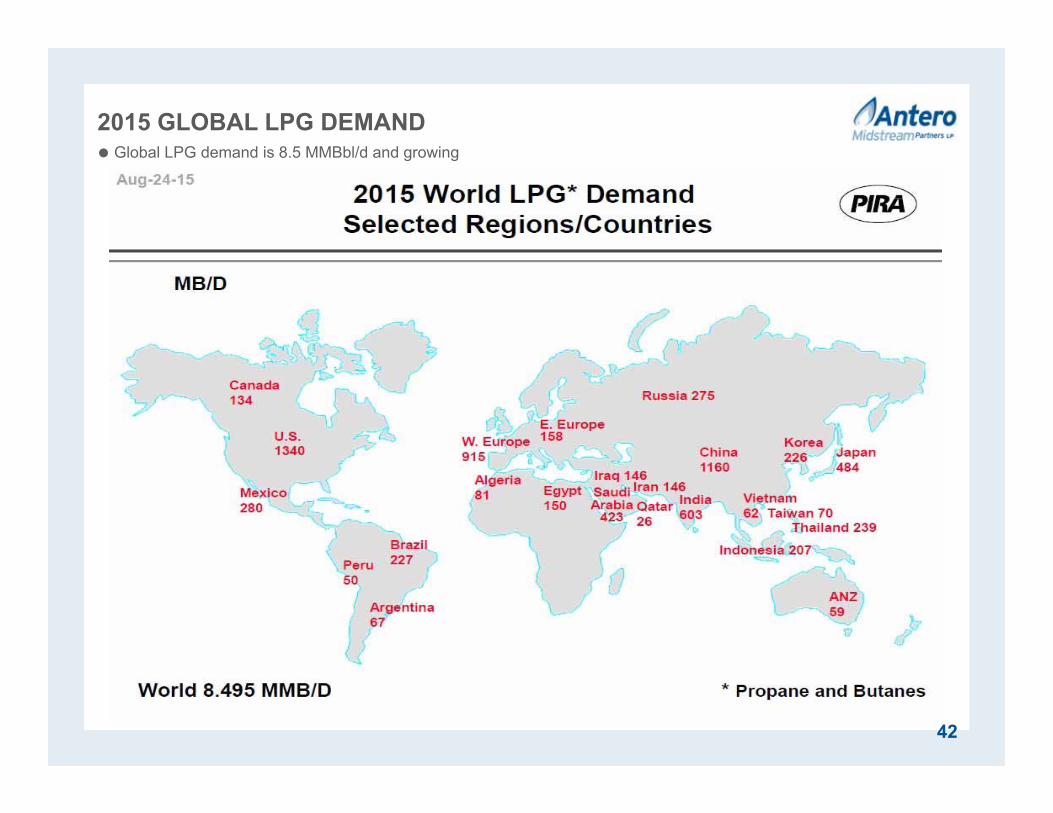
2015 GLOBAL LPG DEMANDGlobal LPG demand is 8.5 MMBbl/d and growing
42
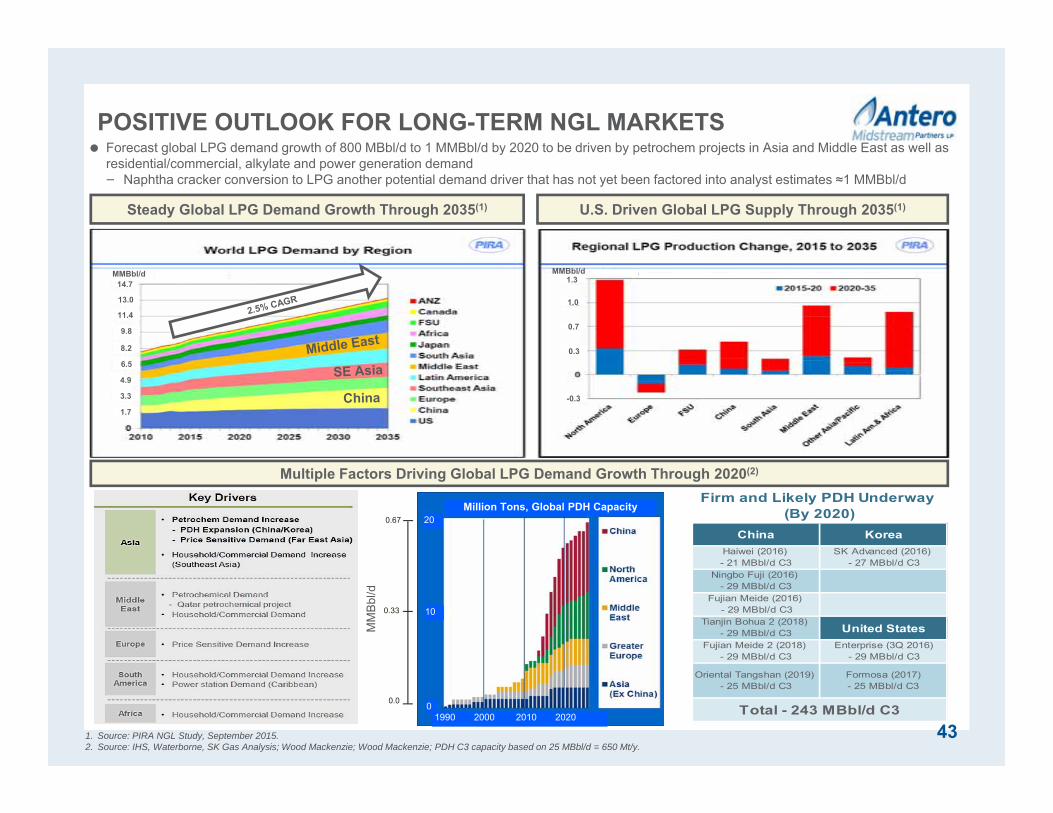
POSITIVE OUTLOOK FOR LONG-TERM NGL MARKETS
Steady Global LPG Demand Growth Through 2035(1)
1. Source: PIRA NGL Study, September 2015.2. Source: IHS, Waterborne, SK Gas Analysis; Wood Mackenzie; Wood Mackenzie; PDH C3 capacity based on 25 MBbl/d = 650 Mt/y.
Multiple Factors Driving Global LPG Demand Growth Through 2020(2)
MM
Bbl
/d
0.0
0.33
0.67
Forecast global LPG demand growth of 800 MBbl/d to 1 MMBbl/d by 2020 to be driven by petrochem projects in Asia and Middle East as well as residential/commercial, alkylate and power generation demand− Naphtha cracker conversion to LPG another potential demand driver that has not yet been factored into analyst estimates ≈1 MMBbl/d
China KoreaHaiwei (2016) - 21 MBbl/d C3
SK Advanced (2016) - 27 MBbl/d C3
Ningbo Fuji (2016) - 29 MBbl/d C3
Fujian Meide (2016) - 29 MBbl/d C3
Tianjin Bohua 2 (2018) - 29 MBbl/d C3 United States
Fujian Meide 2 (2018) - 29 MBbl/d C3
Enterprise (3Q 2016)- 29 MBbl/d C3
Oriental Tangshan (2019) - 25 MBbl/d C3
Formosa (2017)- 25 MBbl/d C3
Firm and Likely PDH Underway (By 2020)
Total - 243 MBbl/d C3
Million Tons, Global PDH Capacity
1990 2000 2010 2020
20
10
0
43
14.7
13.0
11.4
9.8
8.2
6.5
4.9
3.3
1.7
U.S. Driven Global LPG Supply Through 2035(1)
MMBbl/d MMBbl/d1.3
1.0
0.7
0.3
-0.3

GLOBAL LPG DEMAND DRIVEN BYPETCHEM AND RES/COMMLargest end-use sectors for LPG are residential/commercial, which tends to grow with population and improvement in
living standards in the emerging markets− PIRA forecasting >1.0 MMBbl/d over next 5 years and >4.5 MMBbl/d of global LPG demand growth over next 20 years
441. PIRA NGL Study, September 2015.
MMBbl/d14.7
13.0
11.4
9.8
8.2
6.5
4.9
3.3
1.6

GLOBAL LPG TRADE DRIVEN BY U.S. SHALEThe U.S. is the largest single driver of the rapid expansion in LPG trade accounting for over 90% in trade growth
451. PIRA NGL Study, September 2015.
MMBbl/d5.2
4.6
3.9
3.3
2.6
2.0
1.3
0.7
United States
U.S. SHALE NGL EURS SUPPORT LPG TRADE GROWTH
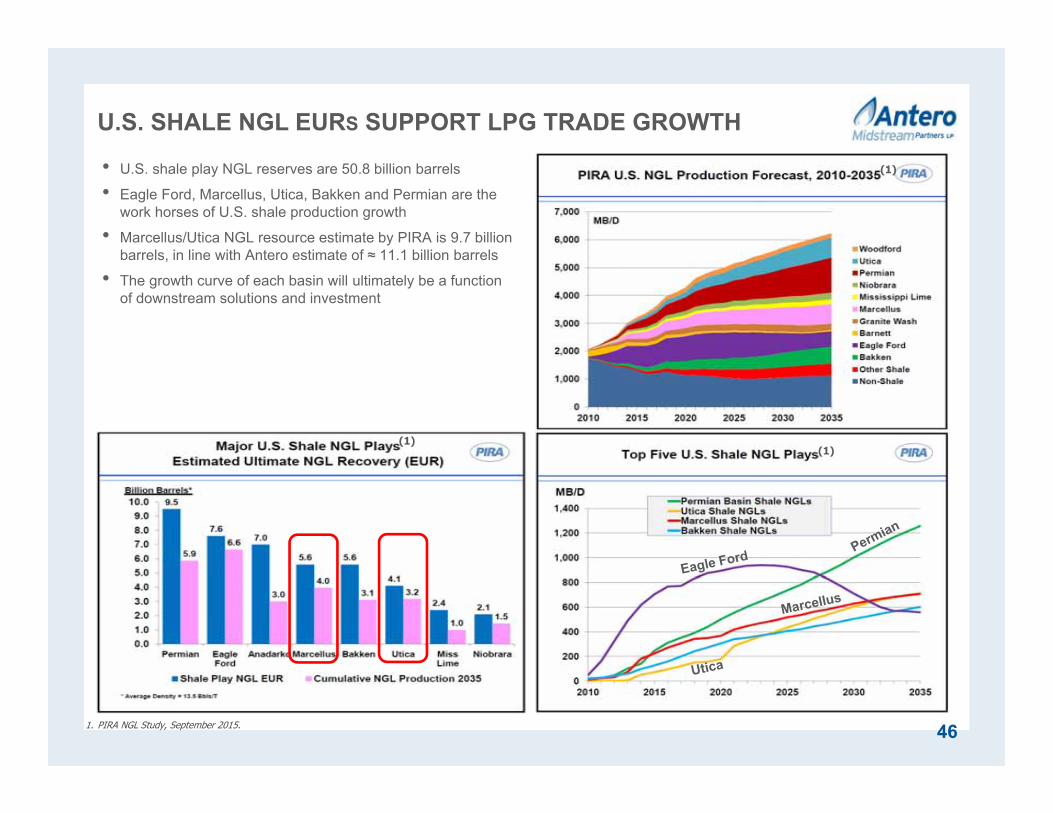
461. PIRA NGL Study, September 2015.
• U.S. shale play NGL reserves are 50.8 billion barrels
• Eagle Ford, Marcellus, Utica, Bakken and Permian are the work horses of U.S. shale production growth
• Marcellus/Utica NGL resource estimate by PIRA is 9.7 billion barrels, in line with Antero estimate of ≈ 11.1 billion barrels
• The growth curve of each basin will ultimately be a function of downstream solutions and investment
(1)
(1)(1)
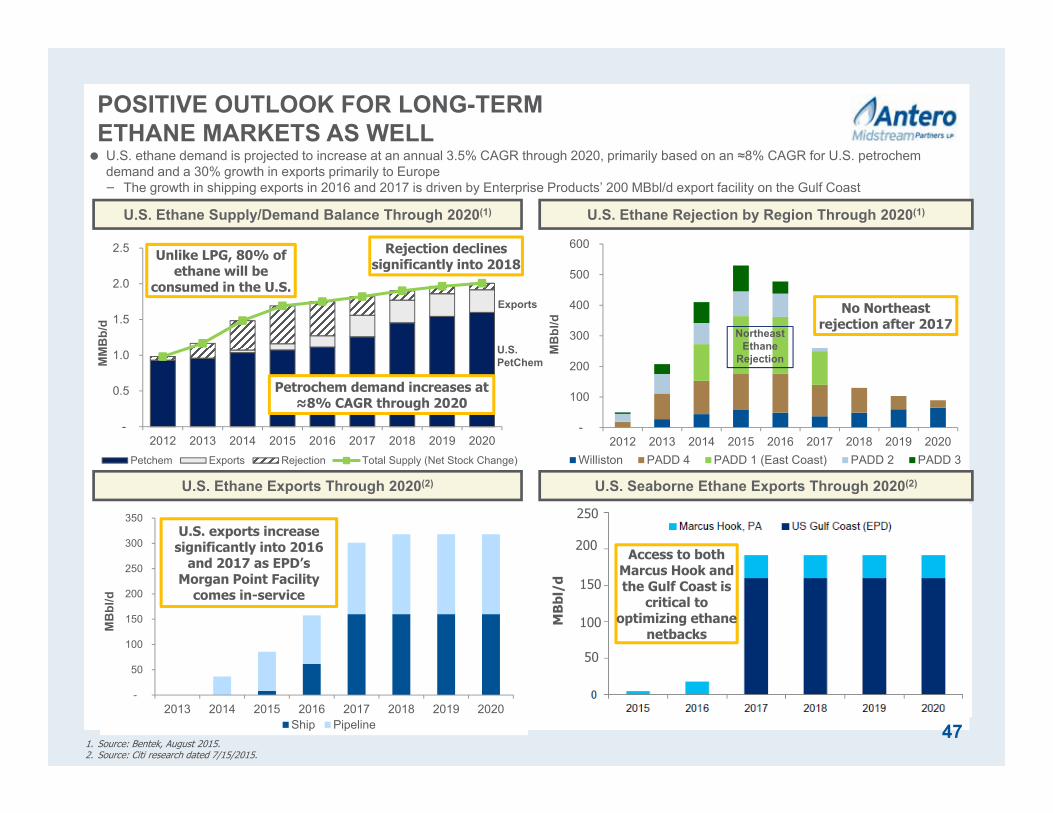
POSITIVE OUTLOOK FOR LONG-TERM ETHANE MARKETS AS WELL
U.S. Ethane Supply/Demand Balance Through 2020(1)
1. Source: Bentek, August 2015.2. Source: Citi research dated 7/15/2015.
U.S. Ethane Exports Through 2020(2)
U.S. ethane demand is projected to increase at an annual 3.5% CAGR through 2020, primarily based on an ≈8% CAGR for U.S. petrochemdemand and a 30% growth in exports primarily to Europe− The growth in shipping exports in 2016 and 2017 is driven by Enterprise Products’ 200 MBbl/d export facility on the Gulf Coast
-
0.5
1.0
1.5
2.0
2.5
2012 2013 2014 2015 2016 2017 2018 2019 2020
MM
Bb/
d
Petchem Exports Rejection Total Supply (Net Stock Change)
U.S. Seaborne Ethane Exports Through 2020(2)
-
50
100
150
200
250
300
350
2013 2014 2015 2016 2017 2018 2019 2020
MB
bl/d
Ship Pipeline
250
200
150
100
50
MB
bl/d
U.S. exports increase significantly into 2016
and 2017 as EPD’s Morgan Point Facility
comes in-service
U.S. Ethane Rejection by Region Through 2020(1)
Access to both Marcus Hook and the Gulf Coast is
critical to optimizing ethane
netbacks
Rejection declines significantly into 2018
Unlike LPG, 80% of ethane will be
consumed in the U.S.
Petrochem demand increases at ≈8% CAGR through 2020
-
100
200
300
400
500
600
2012 2013 2014 2015 2016 2017 2018 2019 2020
MB
bl/d
Williston PADD 4 PADD 1 (East Coast) PADD 2 PADD 3
No Northeast rejection after 2017
47
Northeast Ethane
Rejection
Exports
U.S. PetChem

Plan to defer 50 Marcellus well completions into 2016 to achieve higher gas price realizations, approximately half of which are located on AM areas of dedication− Regional gathering pipeline expected in-service late 2015 will connect incremental Marcellus production to CGTLA (Gulf
Coast) and TCO pricing
AR COMPLETION DEFERRALS – 2016 VOLUME IMPACT
0
50
100
150
200
250
300
350
400
450
500
Jan-16 Mar-16 May-16
Gro
ss W
ellh
ead
Prod
uctio
n (M
Mcf
/d)
Completion Deferral Impact on 2016 Production
Production From 50 Deferred
Completions
48

ANTERO RESOURCES – UPDATED 2015 GUIDANCE
Key Variable 2015 GuidanceNet Daily Production (MMcfe/d) 1,400
Net Residue Natural Gas Production (MMcf/d) 1,175
Net Liquids Production (Bbl/d) 33,000
Net Oil Production (Bbl/d) 4,000
Natural Gas Realized Price Differential to NYMEX Henry Hub Before Hedging ($/Mcf) $(0.20) - $(0.30)
Oil Realized Price Differential to NYMEX WTI Before Hedging ($/Bbl) $(12.00) - $(14.00)
NGL Realized Price (% of WTI)(1) 30% - 35%
Cash Production Expense ($/Mcfe)(2) $1.50 - $1.60
Marketing Expense, Net of Marketing Revenue ($/Mcfe) $0.20 - $0.30
G&A Expense ($/Mcfe) $0.23 - $0.27
Net Income Attributable to Non-Controlling Interest ($MM) $23 - $27
Operated Wells Completed 130
Average Operated Drilling Rigs 14
Capital Expenditures ($MM)
Drilling & Completion $1,600
Water Infrastructure $50
Land $150
Total Capital Expenditures ($MM) $1,800
1. Updated NGL pricing guidance for 2015; 1Q 2015 NGL prices before hedges were 50% of WTI per press release dated 4/29/2015.2. Includes lease operating expenses, gathering, compression and transportation expenses and production taxes. Excludes net marketing expense.
Key Operating & Financial Assumptions
49
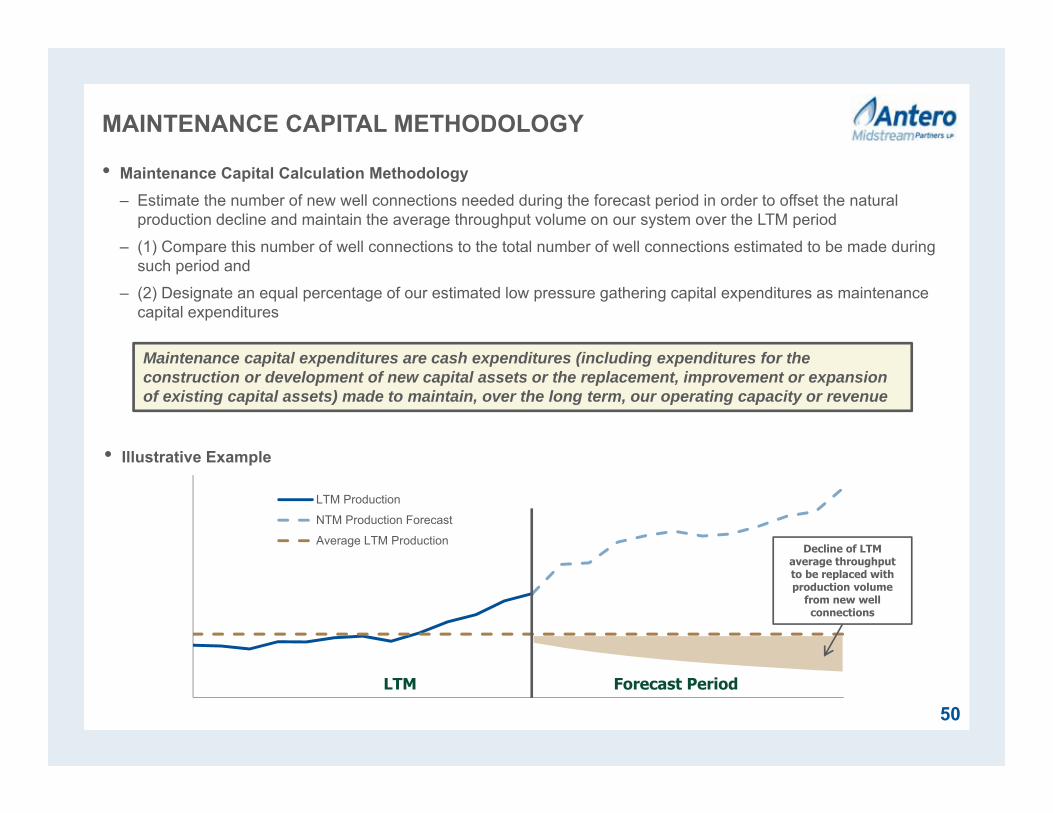
LTM Production
NTM Production Forecast
Average LTM Production
MAINTENANCE CAPITAL METHODOLOGY
• Maintenance Capital Calculation Methodology– Estimate the number of new well connections needed during the forecast period in order to offset the natural
production decline and maintain the average throughput volume on our system over the LTM period
– (1) Compare this number of well connections to the total number of well connections estimated to be made during such period and
– (2) Designate an equal percentage of our estimated low pressure gathering capital expenditures as maintenance capital expenditures
Maintenance capital expenditures are cash expenditures (including expenditures for the construction or development of new capital assets or the replacement, improvement or expansion of existing capital assets) made to maintain, over the long term, our operating capacity or revenue
• Illustrative Example
LTM Forecast Period
Decline of LTM average throughput to be replaced with production volume
from new well connections
50

CAUTIONARY NOTE
The SEC permits oil and gas companies, in their filings with the SEC, to disclose only proved, probable and possible reserve estimates (collectively, “3P”). Antero has provided internally generated estimates for proved, probable and possible reserves in this presentation in accordance with SEC guidelines and definitions, which have been audited by Antero’s third-party engineers. Unless otherwise noted, reserve estimates as of December 31, 2014 assume ethane rejection and strip pricing.
Actual quantities that may be ultimately recovered from Antero’s interests may differ substantially from the estimates in this presentation. Factors affecting ultimate recovery include the scope of Antero’s ongoing drilling program, which will be directly affected by commodity prices, the availability of capital, drilling and production costs, availability of drilling services and equipment, drilling results, lease expirations, transportation constraints, regulatory approvals and other factors, and actual drilling results, including geological and mechanical factors affecting recovery rates.
In this presentation:
• “3P reserves” refer to Antero’s estimated aggregate proved, probable and possible reserves as of December 31, 2014. The SEC prohibits companies from aggregating proved, probable and possible reserves in filings with the SEC due to the different levels of certainty associated with each reserve category.
• “EUR,” or “Estimated Ultimate Recovery,” refers to Antero’s internal estimates of per well hydrocarbon quantities that may bepotentially recovered from a hypothetical future well completed as a producer in the area. These quantities do not necessarily constitute or represent reserves within the meaning of the Society of Petroleum Engineer’s Petroleum Resource Management System or the SEC’s oil and natural gas disclosure rules.
• “Condensate” refers to gas having a heat content between 1250 BTU and 1300 BTU in the Utica Shale.
• “Highly-rich gas/condensate” refers to gas having a heat content between 1275 BTU and 1350 BTU in the Marcellus Shale and 1225 BTU and 1250 BTU in the Utica Shale.
• “Highly-rich gas” refers to gas having a heat content between 1200 BTU and 1275 BTU in the Marcellus Shale and 1200 BTU and 1225 BTU in the Utica Shale.
• “Rich gas” refers to gas having a heat content of between 1100 BTU and 1200 BTU.
• “Dry gas” refers to gas containing insufficient quantities of hydrocarbons heavier than methane to allow their commercial extraction or to require their removal in order to render the gas suitable for fuel use.
Regarding Hydrocarbon Quantities
51