AM #3 - Effect of Voltage Sags on Industrial Equipment Circuit is more susceptible to voltage sag ?...
48
Effects of Voltage Sags on Industrial Equipment Mark Stephens, PE Manager Industrial Studies Electric Power Research Institute 942 Corridor Park Blvd Knoxville, Tennessee 37932 Phone 865.218.8022 [email protected]
Transcript of AM #3 - Effect of Voltage Sags on Industrial Equipment Circuit is more susceptible to voltage sag ?...

Effects of Voltage Sags on Industrial Equipment
Mark Stephens, PEManagerIndustrial Studies Electric Power Research Institute 942 Corridor Park Blvd Knoxville, Tennessee 37932 Phone 865.218.8022 [email protected]

2© 2009 Electric Power Research Institute, Inc. All rights reserved.
Voltage Sag Test Equipment: Porto-Sag

3© 2009 Electric Power Research Institute, Inc. All rights reserved.
Versions of the Porto-Sag
200 Amp Units100 Amp Units30 Amp Units
4© 2009 Electric Power Research Institute, Inc. All rights reserved.
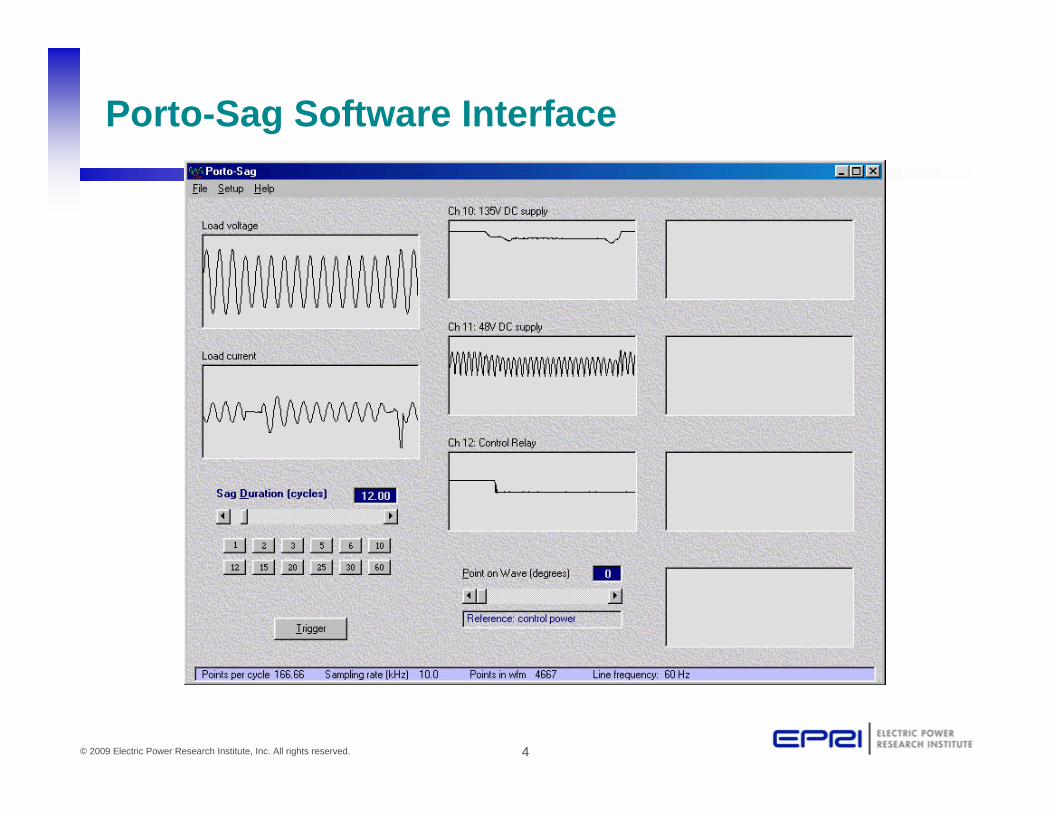
Porto-Sag Software Interface

5© 2009 Electric Power Research Institute, Inc. All rights reserved.
Utility/Equipment Interface: Voltage Sags
• Most Important Power Quality Variation Affecting Sensitive Equipment
• Characterized by Magnitude (here, 50% of Nominal) and Duration (here, 4 Cycles, 1 Cycle = 1/60 sec)
-1
-0.5
0
0.5
1
0 1 2 3 4 5 6 7 8
Duration (4 Cycle)
Magnitude (50% of nominal)
6© 2009 Electric Power Research Institute, Inc. All rights reserved.
Perc
ent o
f Nom
inal
Vol
tage
%
0-5 events persite per year
5-10 events persite per year
10-15 events
15-20 events
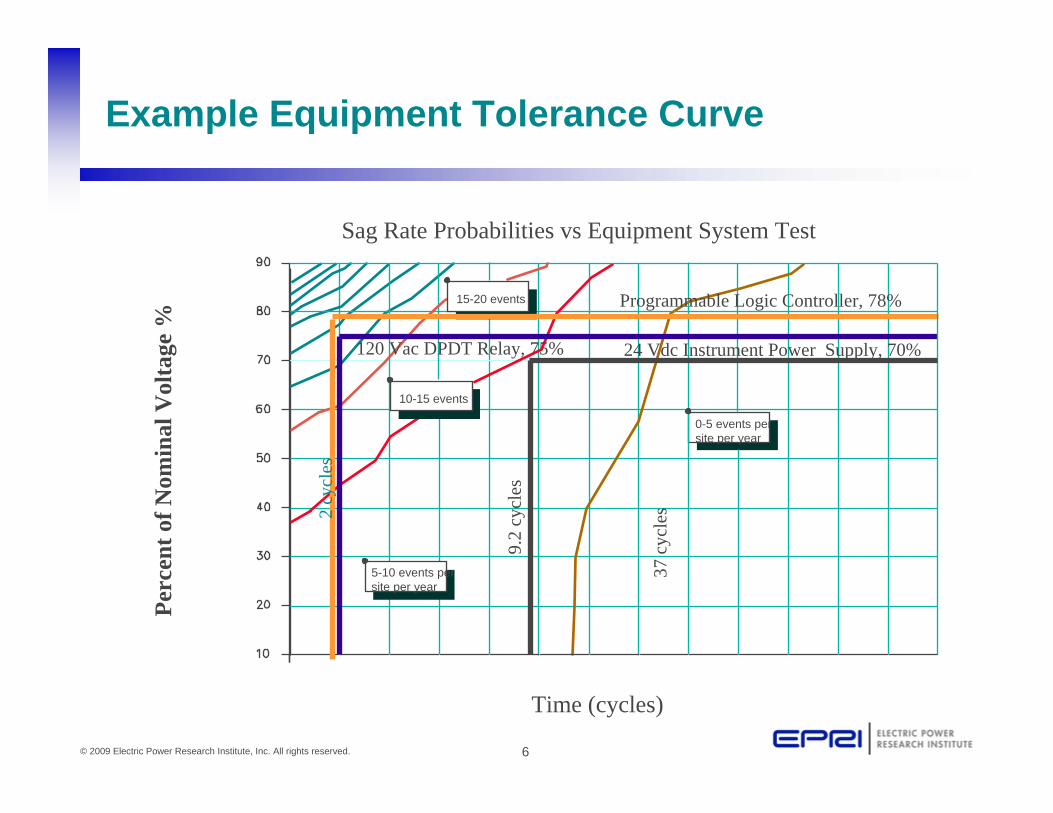
Sag Rate Probabilities vs Equipment System Test
Programmable Logic Controller, 78%
24 Vdc Instrument Power Supply, 70%120 Vac DPDT Relay, 75%2
cycl
es
9.2
cycl
es
37 c
ycle
s
Time (cycles)
Example Equipment Tolerance Curve

7© 2009 Electric Power Research Institute, Inc. All rights reserved.
Voltage Sag Impacts on
• PCs
• Electronic Lighting
• Relays and Contactors and Motor Starters
• DC Power Supplies
• PLC Based Control Systems
• Variable Frequency Drives

8© 2009 Electric Power Research Institute, Inc. All rights reserved.
Switch Mode Power Supply VoltageSag Tolerance (100% Load)
13 Power Supplies Models in Sample Data SetStandard Deviation: 2.65 Cycles, 9.27 %Vnom
Source: EPRI System Compatibility Task 2 Final Report:Performance and Design Evaluation of Switch-Mode Power Supplies - AC Interface Issues, July 1995.
All Power Supplies At 100% Load.

9© 2009 Electric Power Research Institute, Inc. All rights reserved.
Dell Dimension 8250
10© 2009 Electric Power Research Institute, Inc. All rights reserved.
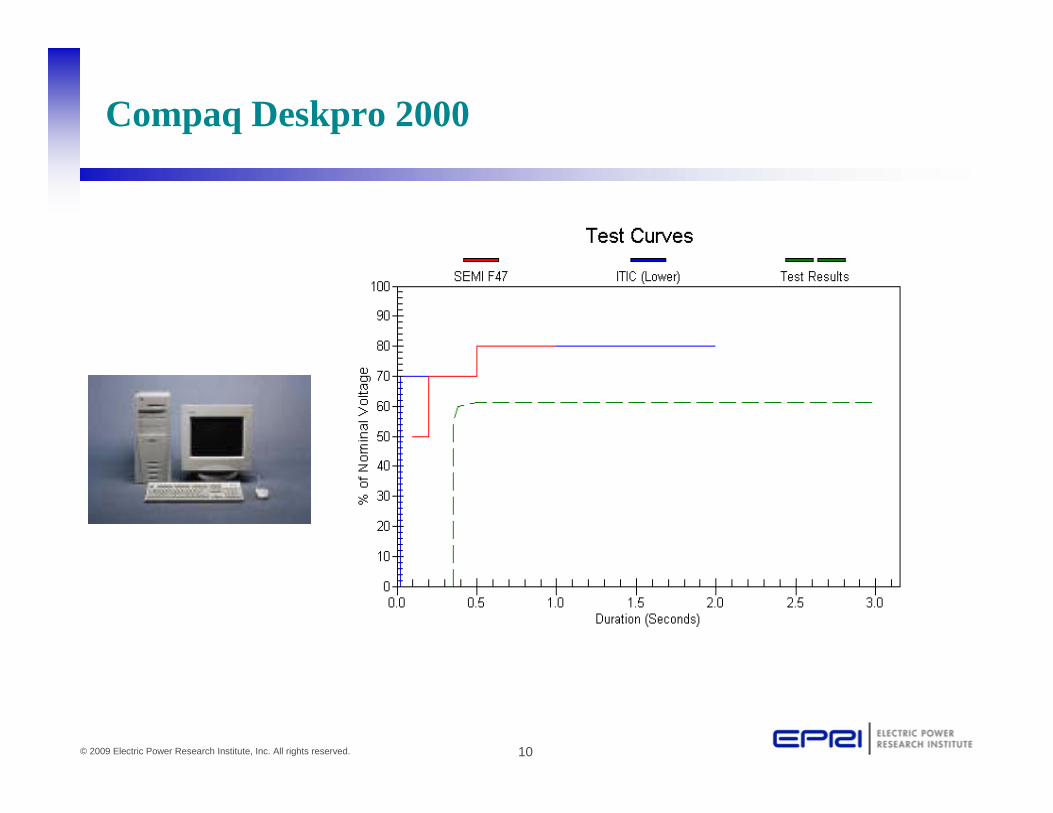
Compaq Deskpro 2000
11© 2009 Electric Power Research Institute, Inc. All rights reserved.
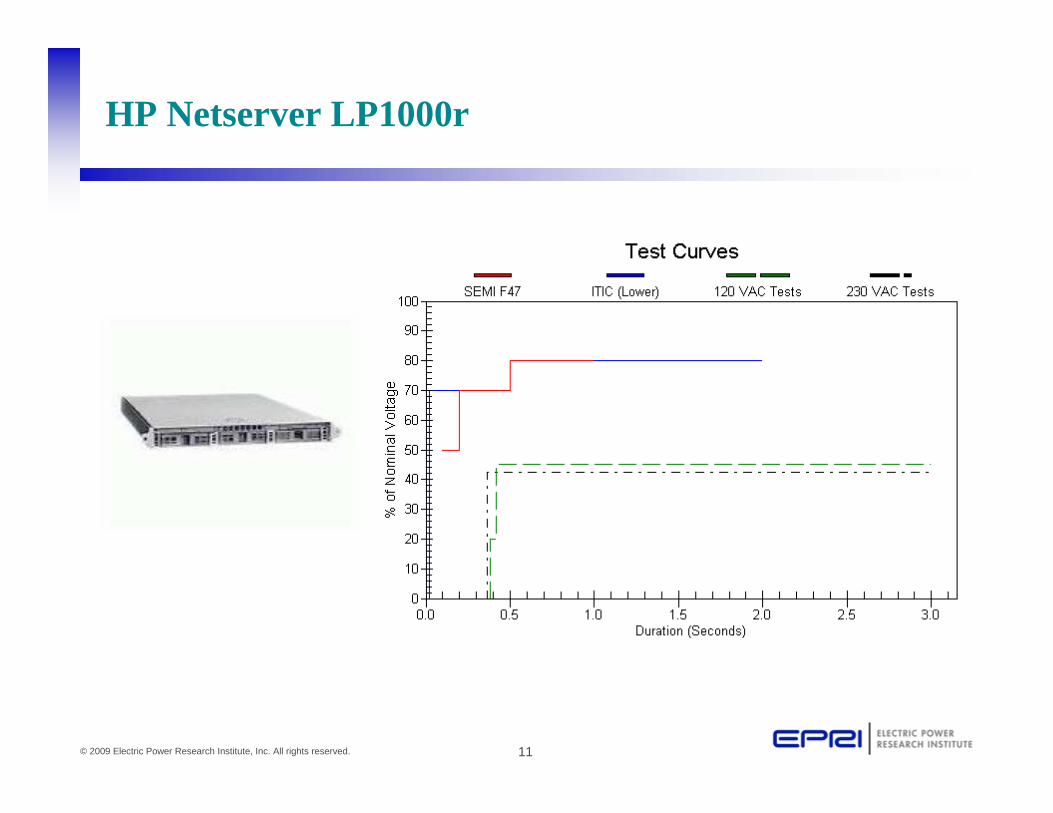
HP Netserver LP1000r

12© 2009 Electric Power Research Institute, Inc. All rights reserved.
Impact on Lighting
PQ Issue:Some HID metal halide
lamp/ballast systems are prone to blackouts due to voltage sags from the normal operation of large electric loads.
Restart times may take as long as 10-15 minutes.

13© 2009 Electric Power Research Institute, Inc. All rights reserved.
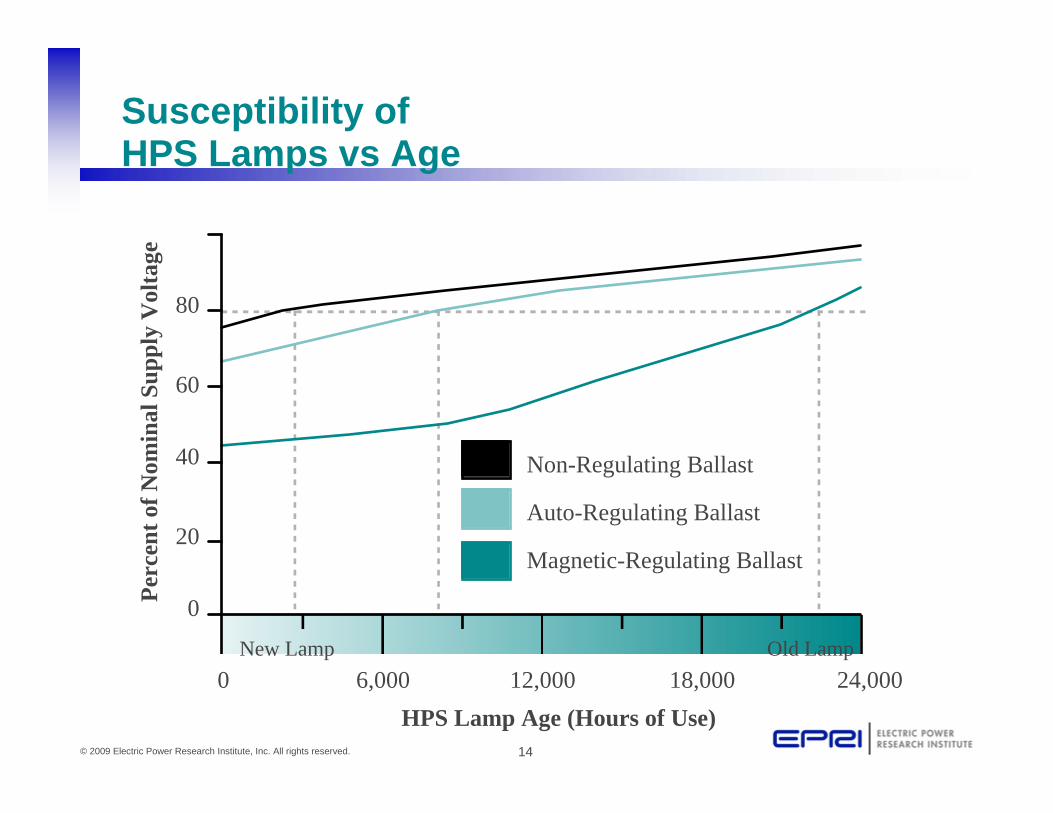
Improving Immunity of Metal Halide Lamps
• Use magnetic-regulator ballast to increase metal halide lamp immunity to sags
• For critical lighting applications install non-HID lighting such as tungsten halogen or use UPS
• Isolate lighting systems from sag-causing loads
• Consider installing instant-restrike metal halide lamps
14© 2009 Electric Power Research Institute, Inc. All rights reserved.
Susceptibility of HPS Lamps vs Age
Non-Regulating Ballast
Auto-Regulating Ballast
Magnetic-Regulating Ballast
HPS Lamp Age (Hours of Use)
Perc
ent o
f Nom
inal
Sup
ply
Vol
tage
New Lamp Old Lamp0 6,000 12,000 18,000 24,000
0
20
40
60
80
15© 2009 Electric Power Research Institute, Inc. All rights reserved.
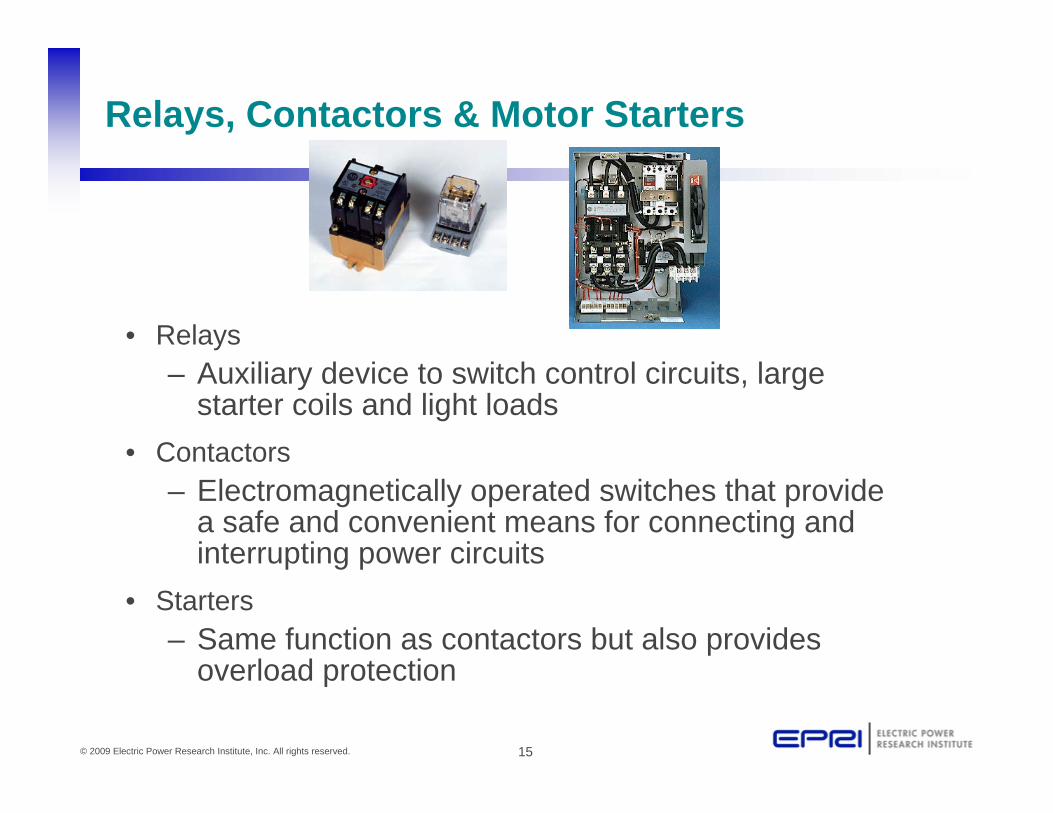
Relays, Contactors & Motor Starters
• Relays– Auxiliary device to switch control circuits, large
starter coils and light loads• Contactors
– Electromagnetically operated switches that provide a safe and convenient means for connecting and interrupting power circuits
• Starters– Same function as contactors but also provides
overload protection

16© 2009 Electric Power Research Institute, Inc. All rights reserved.
Finding the Weakest Link
Contactor2 cycles,
49%
EMO Relay(next gen)0.5 Cycles,
78%
Main Contactor2 cycles,
43%
EMORelay
1 cycles,52%
EMO Relay0.5 cycles,
61%
EMO Relay1 Cycle
45%
Not Shown:EMO Relay 1 Cycle, 38%
17© 2009 Electric Power Research Institute, Inc. All rights reserved.
3
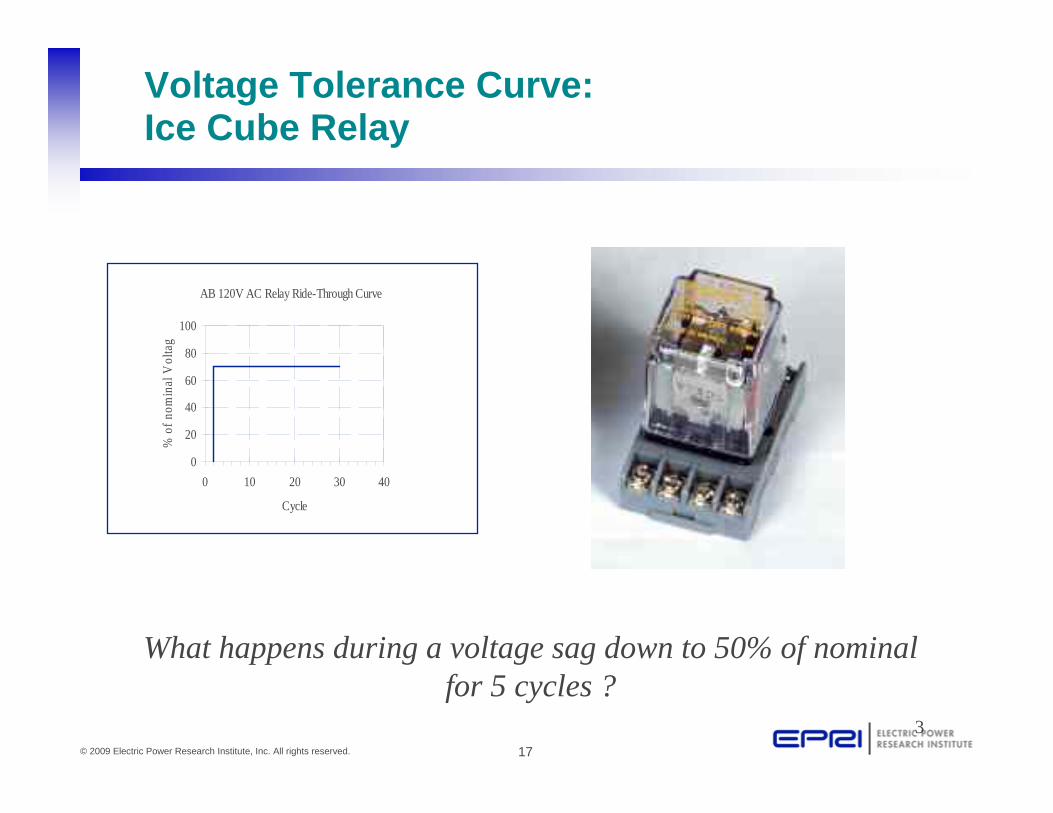
Voltage Tolerance Curve: Ice Cube Relay
AB 120V AC Relay Ride-Through Curve
0
20
40
60
80
100
0 10 20 30 40
Cycle
% o
f nom
inal
Vol
tag
What happens during a voltage sag down to 50% of nominal for 5 cycles ?

18© 2009 Electric Power Research Institute, Inc. All rights reserved.
Voltage Tolerance Curve: Small Contactor
Cutler Hammer NEMA Size 1 Starter Ride-Through Curve
0
20
40
60
80
100
0 10 20 30Cycle
% o
f nom
inal
V
olta
ge
What happens during a voltage sag down to 50% of nominal for 5 cycles ?

19© 2009 Electric Power Research Institute, Inc. All rights reserved.
Hard-Wired Motor Control Circuits
Which Circuit is more susceptible to voltage sag ?
3M OL
L1 L2
3 WIRE CONTROL WITH FUSED CONTROL CIRCUIT TRANSFORMER
STOP START2
M
1FUI
GROUND
PRI.
XI SEC X2
3CR OL
L1 L2
3 WIRE CONTROL WITH FUSED CONTROL CIRCUIT TRANSFORMER
AND CONTROL RELAY
STOP START2
M
1FUI
GROUND
PRI.
XI SEC X2
MCR
CR: AB 120V AC ‘Ice-Cube’ Relay
M: Cuttler Hammer Nema Size 1 Starter

20© 2009 Electric Power Research Institute, Inc. All rights reserved.
Emergency Off (EMO) Circuit(Simplified)
Q1. What happens if the EMO relay or Main Contactor are extremely vulnerable to voltage sags?Q2. What if the plant voltage is low?Q3. What if the transformer rated output voltage does not match the relay and contactor?

21© 2009 Electric Power Research Institute, Inc. All rights reserved.
Impact of MCR
Notes:
1.0 Digital Meter Jumpers must be set for 120VAC.
What happens when an operator hits the E-Stop?

22© 2009 Electric Power Research Institute, Inc. All rights reserved.
Industrial Load Bank

23© 2009 Electric Power Research Institute, Inc. All rights reserved.
Composite Voltage Sag Ride-Through of General Purpose Relays
24© 2009 Electric Power Research Institute, Inc. All rights reserved.
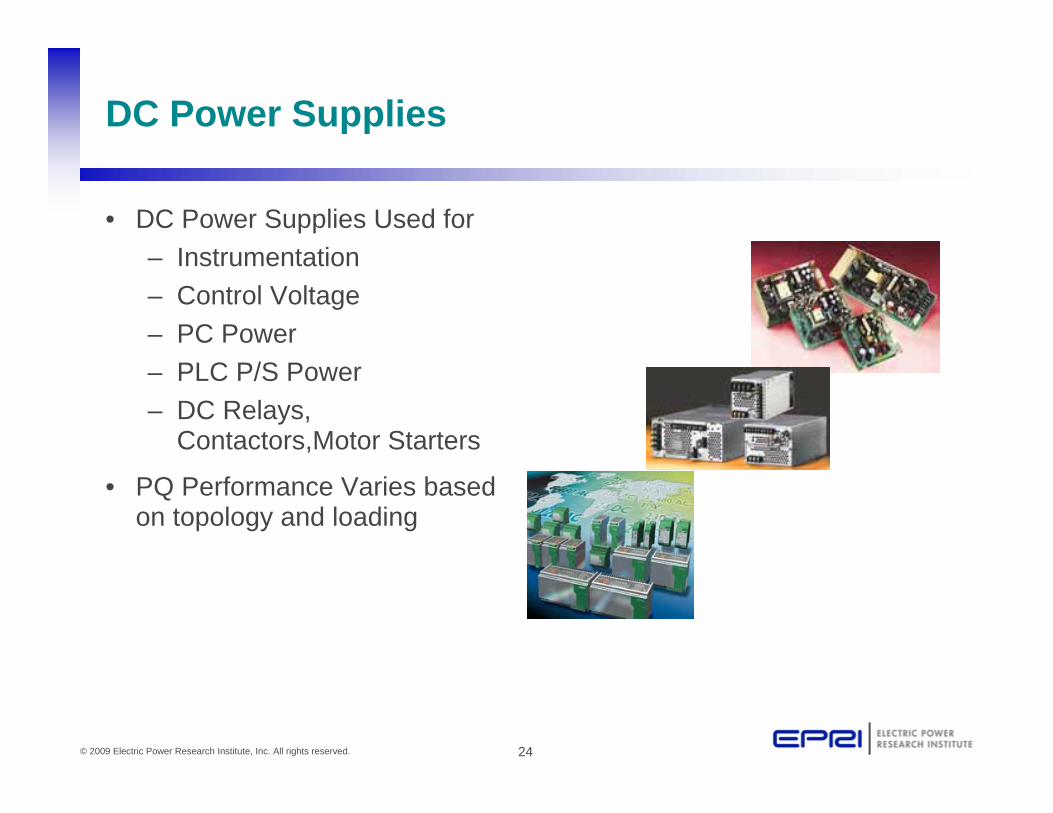
DC Power Supplies
• DC Power Supplies Used for– Instrumentation – Control Voltage– PC Power– PLC P/S Power– DC Relays,
Contactors,Motor Starters
• PQ Performance Varies based on topology and loading

25© 2009 Electric Power Research Institute, Inc. All rights reserved.
Switch Mode Power Supply Voltage Sag Tolerance (100% Load)
13 Power Supplies Models in Sample Data SetStandard Deviation: 2.65 Cycles, 9.27 %Vnom
Source: EPRI System Compatibility Task 2 Final Report:Performance and Design Evaluation of Switch-Mode Power Supplies - AC Interface Issues, July 1995.
All Power Supplies At 100% Load.
26© 2009 Electric Power Research Institute, Inc. All rights reserved.
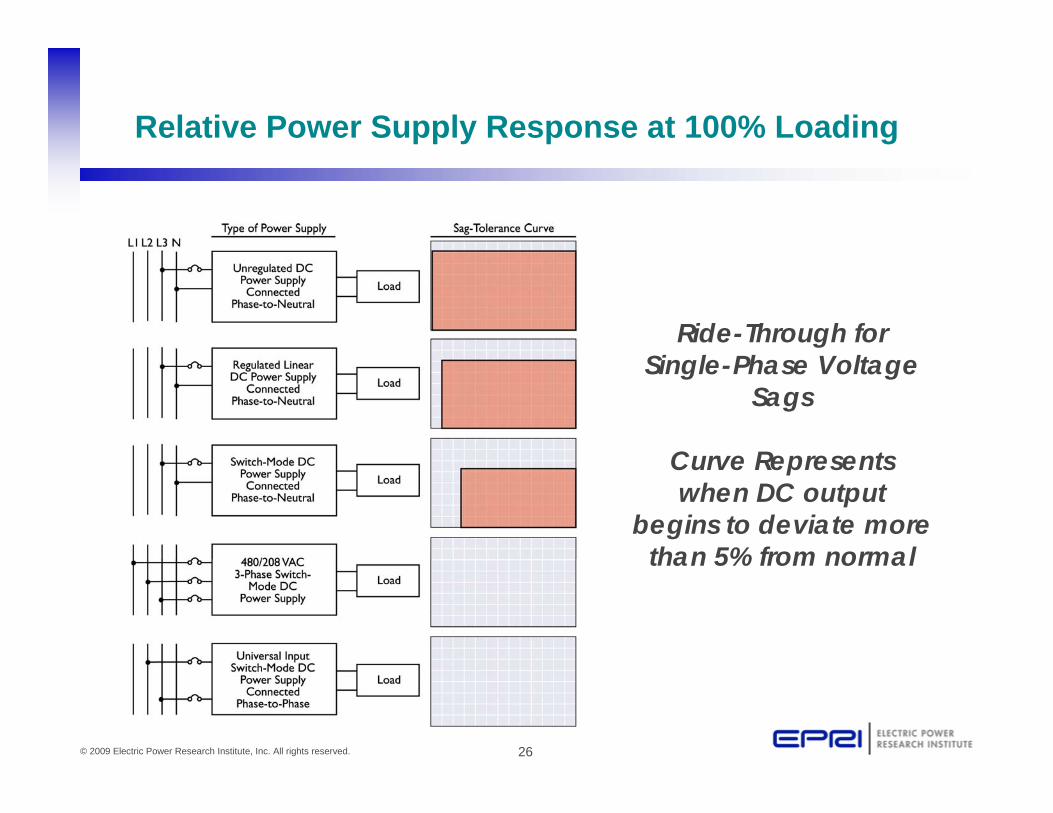
Relative Power Supply Response at 100% Loading
Ride-Through for Single-Phase Voltage
Sags
Curve Represents when DC output
begins to deviate more than 5% from normal

27© 2009 Electric Power Research Institute, Inc. All rights reserved.
Programmable Controllers
28© 2009 Electric Power Research Institute, Inc. All rights reserved.
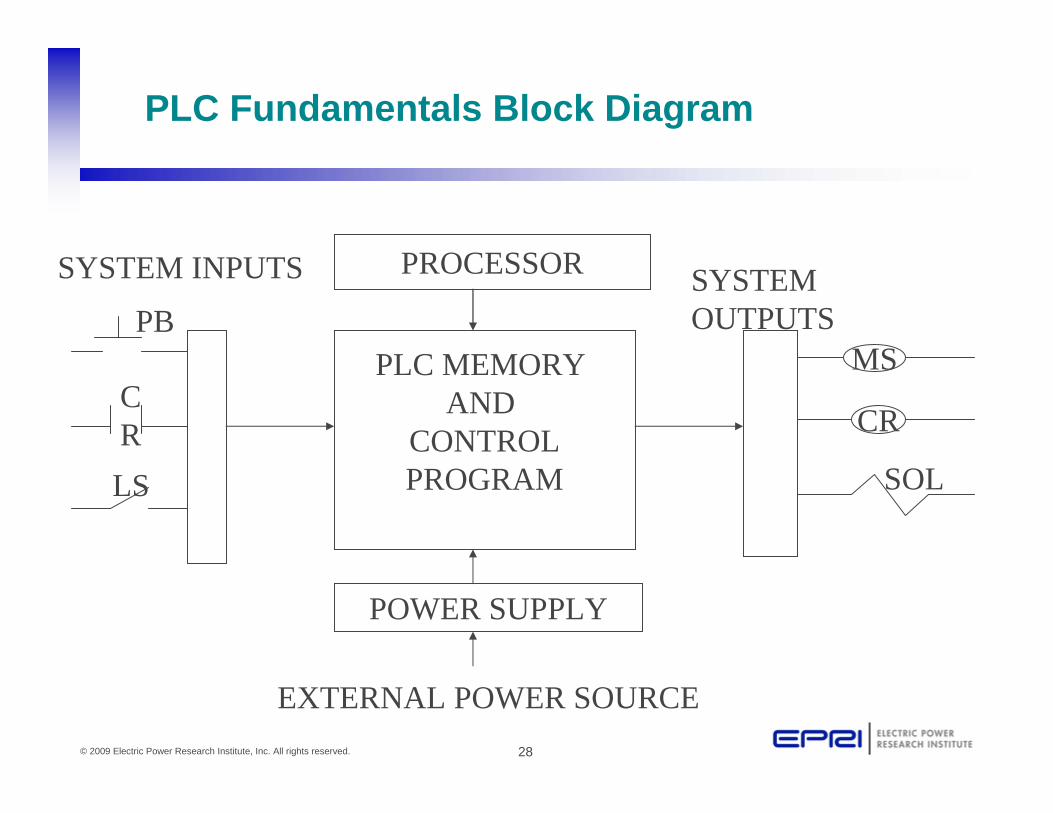
SYSTEM INPUTS PROCESSOR
PLC MEMORY AND
CONTROLPROGRAM
POWER SUPPLY
EXTERNAL POWER SOURCE
PB
CRLS
SYSTEM OUTPUTS
CR
MS
SOL
PLC Fundamentals Block Diagram
29© 2009 Electric Power Research Institute, Inc. All rights reserved.
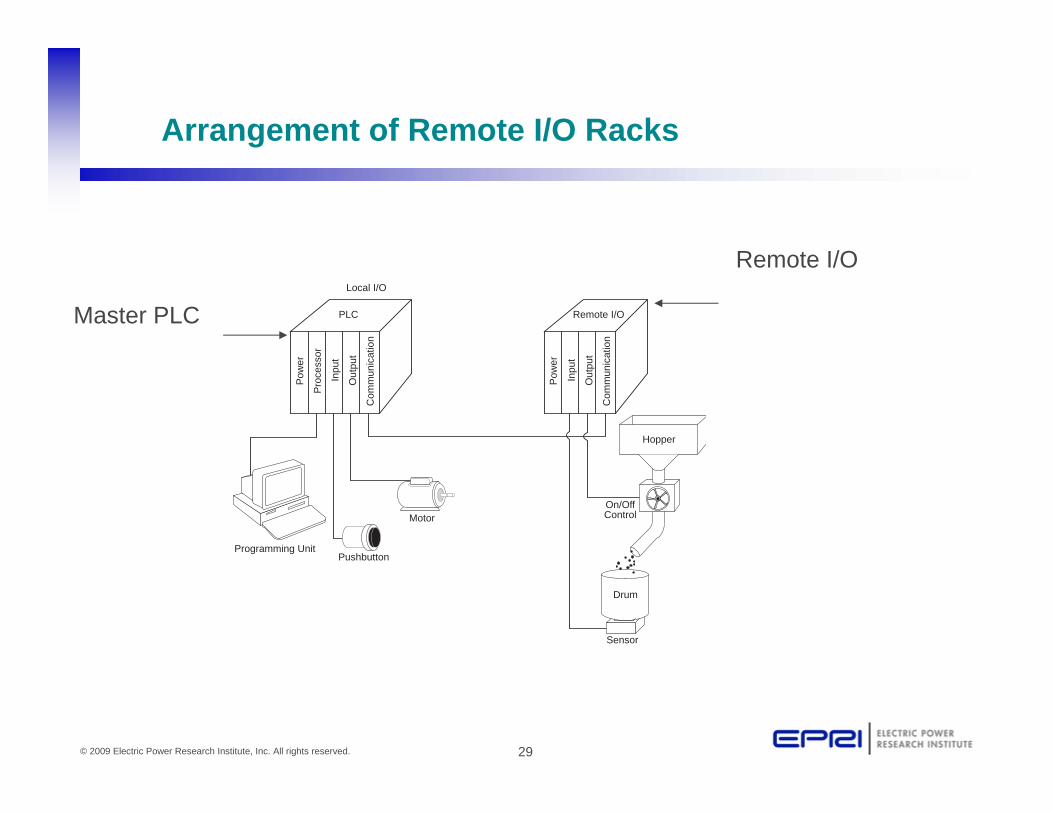
Arrangement of Remote I/O Racks
Pow
er
Pro
cess
or
Inpu
t
Out
put
Com
mun
icat
ion
PLC
Local I/O
Pow
er
Inpu
t
Out
put
Com
mun
icat
ion
Remote I/O
Hopper
Drum
Sensor
On/OffControlMotor
PushbuttonProgramming Unit
Remote I/O
Master PLC

30© 2009 Electric Power Research Institute, Inc. All rights reserved.
AC Powered PLC Power Supply
From Typical PLC Literature:
“
”What that means to you:
- Oversensitive Power Supply- Customer Process Shutdown due to voltage Sags
What can be done about this?

31© 2009 Electric Power Research Institute, Inc. All rights reserved.
PLC System Wiring (Typical)
E-Stop

32© 2009 Electric Power Research Institute, Inc. All rights reserved.
PLC Test Results – Response 1
PLC Shuts down based on incoming AC Voltage beforeControl System is affected.

33© 2009 Electric Power Research Institute, Inc. All rights reserved.
PLC Shuts down on based on power supply DC Bus Voltage.
PLC Test Results – Response 2
What happens if PLC has fewer I/O Cards?What happens if PLC has more I/O Cards?
34© 2009 Electric Power Research Institute, Inc. All rights reserved.
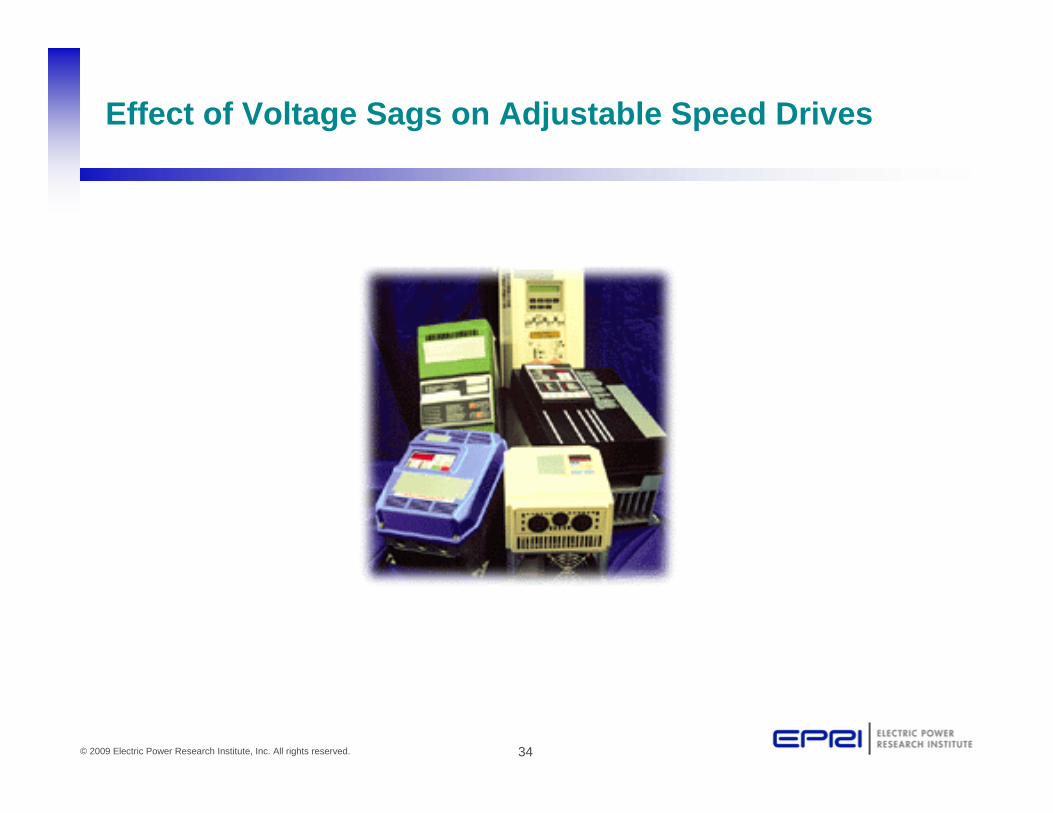
Effect of Voltage Sags on Adjustable Speed Drives

35© 2009 Electric Power Research Institute, Inc. All rights reserved.
AC PWM Drive
RectifierDiode Bridge
DC BusCapacitor
IGBTInverter
60 65 70 75 80 85-800
-600
-400
-200
0
200
400
600
800
Time (mS)
Voltage (V)
60 65 70 75 80 85 0
100
200
300
400
500
600
700
Time (mS)
Voltage (V)
60 65 70 75 80 85-800
-600
-400
-200
0
200
400
600
800
Time (mS)
Voltage (V)
Source Voltage DC Bus Voltage Motor Input Voltage
INPUT SECTION
ENERGY STORAGE SECTION
OUTPUT SECTION

36© 2009 Electric Power Research Institute, Inc. All rights reserved.
Example Response of ASD to Short Interruption
ASD Input Voltage
0 10 20 30 40 50 60Cycle
ASD DC Bus Voltage
0 10 20 30 40 50 60Cycle
Motor Current
0 10 20 30 40 50 60Cycle
Motor Speed
0 10 20 30 40 50 60Cycle
A Two-Cycle Interruption
ASD Motor

37© 2009 Electric Power Research Institute, Inc. All rights reserved.
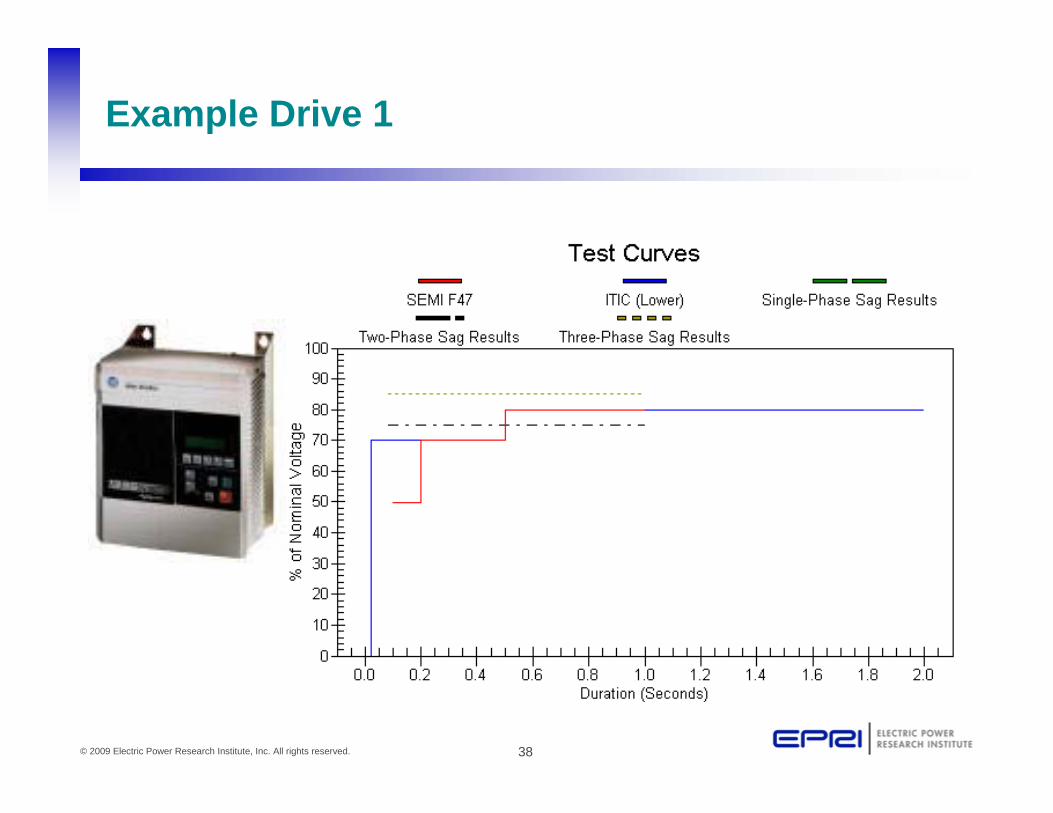
Voltage Sag Impact on ASD
Drive Trips on Undervoltage
InductionMotor
RectifierInverterInverter
dc Link
dc Bus Voltage
trip level
660V
420V
38© 2009 Electric Power Research Institute, Inc. All rights reserved.
Example Drive 1

39© 2009 Electric Power Research Institute, Inc. All rights reserved.
Example Drive 2

40© 2009 Electric Power Research Institute, Inc. All rights reserved.
Example Drive 3

41© 2009 Electric Power Research Institute, Inc. All rights reserved.
• VSI AC Drive During Normal Operating Conditions• (Van = 100%, Vbn = 100%, Vcn = 100%)
0
100
200
300
400
500
600
700
0 0.005 0.01 0.015 0.02Time (in Seconds)
DC
Bus
Vol
tage
(in
Vol
ts)
DC Bus Voltage Bridge Rectifier Output
Why Do ASDs Trip During Single-Phase Voltage Sags?

42© 2009 Electric Power Research Institute, Inc. All rights reserved.
• VSI AC Drive During a Single-Phase Sag• (Van = 100%, Vbn = 100%, Vcn = 0%)
0
100
200
300
400
500
600
700
0 0.005 0.01 0.015 0.02Time (in Seconds)
DC
Bus
Vol
tage
(in
Vol
ts)
DC Bus Voltage Bridge Rectifier Output Trip Level
Why Do ASDs Trip During Single-Phase Voltage Sags?

43© 2009 Electric Power Research Institute, Inc. All rights reserved.
Line-Side and Motor-side Contactors

44© 2009 Electric Power Research Institute, Inc. All rights reserved.
ASD Enable Signal
Contact on
120 V AC relay

45© 2009 Electric Power Research Institute, Inc. All rights reserved.
Latched Start/Stop Control(3-Wire Control Scheme)

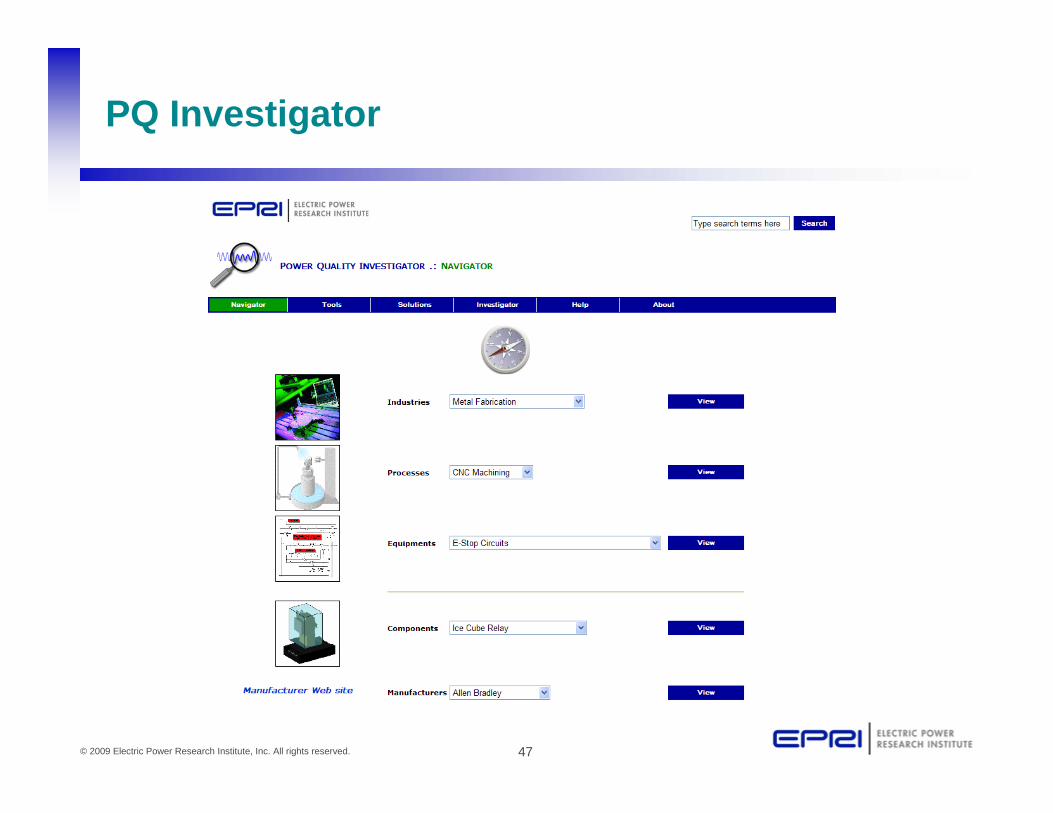
What About Your Plant?
Active Demo Using EPRI’s Power Quality Investigator Software
47© 2009 Electric Power Research Institute, Inc. All rights reserved.
PQ Investigator

48© 2009 Electric Power Research Institute, Inc. All rights reserved.
PQ Investigator