Am-241 Nuclear Safety and Environmental Interactions Reports/FY 2015/15-8599 NEUP... ·...
25
Am-241 Nuclear Safety and Environmental Interactions Reactor Concepts Research Development and Demonstration (RCRD&D) Sudarshan Loyalka University of Missouri - Columbia Scott Harlow, Federal POC Stephen Johnson, Technical POC Project No. 15-8599
Transcript of Am-241 Nuclear Safety and Environmental Interactions Reports/FY 2015/15-8599 NEUP... ·...

Am-241 Nuclear Safety and Environmental Interactions
Reactor Concepts Research Development and Demonstration (RCRD&D)
Sudarshan LoyalkaUniversity of Missouri - Columbia
Scott Harlow, Federal POCStephen Johnson, Technical POC
Project No. 15-8599

15 8599 Final Report Page 1
Am-241 Nuclear Safety and Environmental Interactions
Project: 15-8599
PROJECT PERSONNEL
SUDARSHAN K. LOYALKA, PI MARK A. PRELAS
ROBERT V. TOMPSON FERNANDO DE-LA-TORRE AGUILAR
NATHAN. WHITE MATHEW BORAAS
RAJESH GUTTI
UNIVERSITY OF MISSOURI-COLUMBIA COLUMBIA, MO 65211
15 8599 Final Report Page 2
ABSTRACT:
NASA’s supply of radioisotopes for Radioisotope Heat Units (RHU) and Radioisotope Thermoelectric Generator (RTG) power sources is facing a crisis due to shortages of Pu-238 for future missions. Am-241 is a possible replacement for Pu-238 since its stockpile from the nuclear weapons program has remained relatively intact. The purpose of this project was to assess the safety of Am-241 and the risks associated with it as compared with PU-238. The project has resulted in a journal article, F. De-La-Torre-Aguilar, N. White, M. Prelas, R. V. Tompson, and S. K. Loyalka "Space nuclear power system accidents: Doses from Pu-238 and Am-241 inhalation," Progress in Nuclear Energy vol.100C (2017), pp.171-182, which showed that the radiation dosage resulting from Am-241 inhalation are about 1/2.5 of the dosage resulting from Pu-238 inhalation per KW of Pu-238 power. Considerable progress was also made on the Direct Simulation Monte Carlo Method (DSMC) for simulation of aerosol evolution during accidents resulting in three publications: 1.I. Saldivar, F. De-La-Torre-Aguilar, M. Boraas, and S. K. Loyalka “Benchmark problems in aerosol evolution: Comparison of some exact and DSMC results” in Annals of Nuclear Energy vol.117 (2018), pp.213-222. 2. I. Saldivar and S. K. Loyalka, “Evolution of Aerosols Coupled to Environments: Verification of Direct Simulation Monte Carlo (DSMC)”, Nuclear Technology 204 (2018), pp.172-183. 3. M. Boraas and S. K. Loyalka, “Mesh Free Simulation of Spatially Inhomogeneous aerosols in Arbitrary Geometries” Nuclear Science and Engineering (2018). Further, we have computations on Am-241/Pu-238 vapor and aerosol interactions, and found that the vapor condensation rate is relatively insensitive to the mass effects, confirming some previous results. We have also completed computations of charge effects on evolution of different species aerosols and a manuscript is in preparation. Additionally, we have compared atmospheric dispersion and deposition of Pu-238 and Am-241 using the HYSPLIT code. We have also used a real lung model and the CFD program FLUENT to compute PuO2 and AmO2 deposition to explore improvements upon the ICPR-66 model. We have found that the deposition efficiencies of PuO2 and AmO2 are similar. These results (four manuscripts) will be submitted for publication in the post project period. We have made progress using framework of Mars 2020 mission nuclear risk assessment model to integrate all results, but our progress has been limited as the improved consequence modeling itself has been quite involved and challenging. We will integrate and complete the more extensive risk modeling computations and publish the results in the post-project period. In addition to the above, the project has resulted in research training of four PhD students
15 8599 Final Report Page 3
THE TABLE OF CONTENTS
Title Page 1
Abstract 2
I. Background 4 II. Accomplishments 6
III. Comparison of PuO2 and AmO2 aerosol dispersion 7 IV. Comparison of PuO2 and AmO2 aerosol deposition in real lung models 13 V. The Risk Methodology 17
Selected References 19
Appendix A: Charge Effects on PuO2 and AmO2 aerosol evolution 21

15 8599 Final Report Page 4
I. BACKGROUND NASA’s supply of radioisotopes for Radioisotope Heat Units (RHU) and Radioisotope Thermoelectric Generator (RTG) power sources (we will refer to these together as Radioisotope Power Systems - RPS’s) is facing a crisis due to shortages of Pu-238 for future missions. Am-241 is a possible replacement for Pu-238 since its stockpile from the nuclear weapons program has remained relatively intact. It is imperative that the safety of Am-241 and the risks associated with it use be assessed as compared with PU-238 in order to certify its use in RPS units. Risk from a hazard (potential of an activity to cause harm to an entity) can be defined (McCormick, 1981; Rasmussen 1981) as:
Risk (harm/unit time)=frequency (events or exposure/unit time) ×consequence (harm/event or exposure)
Mathematically considering a number of events i=1, 2,..,n, we can write the total risk R from these events as:
ii
R R=∑ ,
where, i i iR f C= , if is the frequency of a specific type of event and iC is its associated consequence. This definition can be both simplified, and also generalized. For example, relating to use of RPS’s, for an individual subjected to exposure from an accident involving a spacecraft carrying a Pu-238 RPS (Goldman et al. 1991; Frank 1999; Kastenberg and Wilson, 2003), one could find: 610f −= (RPS accident with significant release/launch), 510C −= (Excess cancer over the lifetime to an exposed individual/RPS accident) 1110R −= (Excess cancer over the lifetime to an exposed individual/launch) By all standards, such a value of R is insignificant considering all of the other risks from various hazards that the individual would be exposed to. Assuming this R to be a mean value for all exposed persons (say about 100,000 in Florida near the accident or worldwide), the excess cancer risk to this total population is about 10−6 to 0.05 over the lifetimes of all exposed individuals and is, again, insignificant. There are admittedly large uncertainties in estimations of both f and C . In the launches to date (about 27 launches carrying 46 RPS’s, see NAS study, 2009), there have been no RPS accidents involving any release of Pu-238. Thus, 610f −= is just an estimate based on likely event tree and fault tree type methods (Goldman et al. 1991; Frank, 2002). The estimation of C is likewise based on assumptions regarding release, dispersion, aerosol & dust-Pu-238 interactions, and inhalation/ingestion of Pu-238, dose to critical organs, and cancer/dose relationships.
The project aims were thus to investigate the risks associated with the use of Am-241 as compared to Pu-238. The scope of the proposed research included the following:

15 8599 Final Report Page 5
1. Critical and extensive review of literature on Pu-238, the risk methodologies, and the data and the models that have been used for release, transport, dose, and excess lifetime cancer/dose assessments). 2: Modeling of release and interactions of Am-241 vapor and aerosols with structural and atmospheric aerosols and nanoparticle formations, interactions with dust and the dust facilitated transport, deposition and re-suspension, interactions with water vapor and doses to body and lungs. Use of existing models where possible and also to carry out additional modeling as needed which may include charge related effects. 3: Analysis of the risks and consequences associated with space craft accidents and Am-241 and related (including decay products) releases within the framework of a probabilistic risk analysis methodology. Use of this methodology to develop an integrated model for risk assessment and use it for sensitivity analysis with quantification of uncertainties for Am-241 as well as Pu-238.

15 8599 Final Report Page 6
II. Accomplishments
In realization of the above objectives, we have published the following journal articles: 1. F. De-La-Torre-Aguilar, N. White, M. Prelas, R. V. Tompson, and S. K. Loyalka "Space nuclear power system accidents: Doses from Pu-238 and Am-241 inhalation," Progress in Nuclear Energy vol.100C (2017), pp.171-182. 2. I. Saldivar, F. De-La-Torre-Aguilar, M. Boraas, and S. K. Loyalka “Benchmark problems in aerosol evolution: Comparison of some exact and DSMC results” in Annals of Nuclear Energy vol.117 (2018), pp.213-222. 3. I. Saldivar and S. K. Loyalka, “Evolution of Aerosols Coupled to Environments: Verification of Direct Simulation Monte Carlo (DSMC)”, Nuclear Technology 204 (2018), pp.172-183. 4. M. Boraas and S. K. Loyalka, “Mesh Free Simulation of Spatially Inhomogeneous aerosols in Arbitrary Geometries” Nuclear Science and Engineering (2018). Further, we have completed a manuscript on Am-241/Pu-238 vapor and aerosol interactions, and found that the vapor condensation rate is relatively insensitive to the mass effects, confirming some previous results. We have also completed computations of charge effects on evolution of different species aerosols and a manuscript is in preparation. Both these manuscripts will be submitted for publication in the post award period, but some results on charge effects are noted in Appendix A. We have found that the inhalation doses from Am-241 are lower on a per kW basis than those from Pu-238. We have also developed the DSMC methodology, so that computations of radioactive particle dispersal in the accidents can be more realistic in future. Additionally, we have compared atmospheric dispersion and deposition of Pu-238 and Am-241 using the HYSPLIT code. These results are described below in section III, and will be published separately and in greater detail in the post project period. We have also used a real lung model and the CFD program FLUENT to compute PuO2 and AmO2 deposition to explore improvements upon the ICPR-66 model. We have found that the deposition efficiencies of PuO2 and AmO2 are similar, and we have included a summary of the results in section IV. These results also will be described in greater detail and published in the post project period. We have made progress using framework of Mars 2020 mission nuclear risk assessment model to integrate all results, but our progress has been limited as the improved consequence modeling itself has been quite challenging. We will seek to integrate and complete the more extensive risk modeling computations and publish the results in the post-project period. In addition to the publications, the project has resulted in research training of four PhD students (F. De-La-Torre-Aguilar, M. Boraas, I. Saldivar., and N. White) whose support was leveraged

15 8599 Final Report Page 7
from Nuclear Regulatory Commission and The Department of Education Fellowships as appropriate.

15 8599 Final Report Page 8
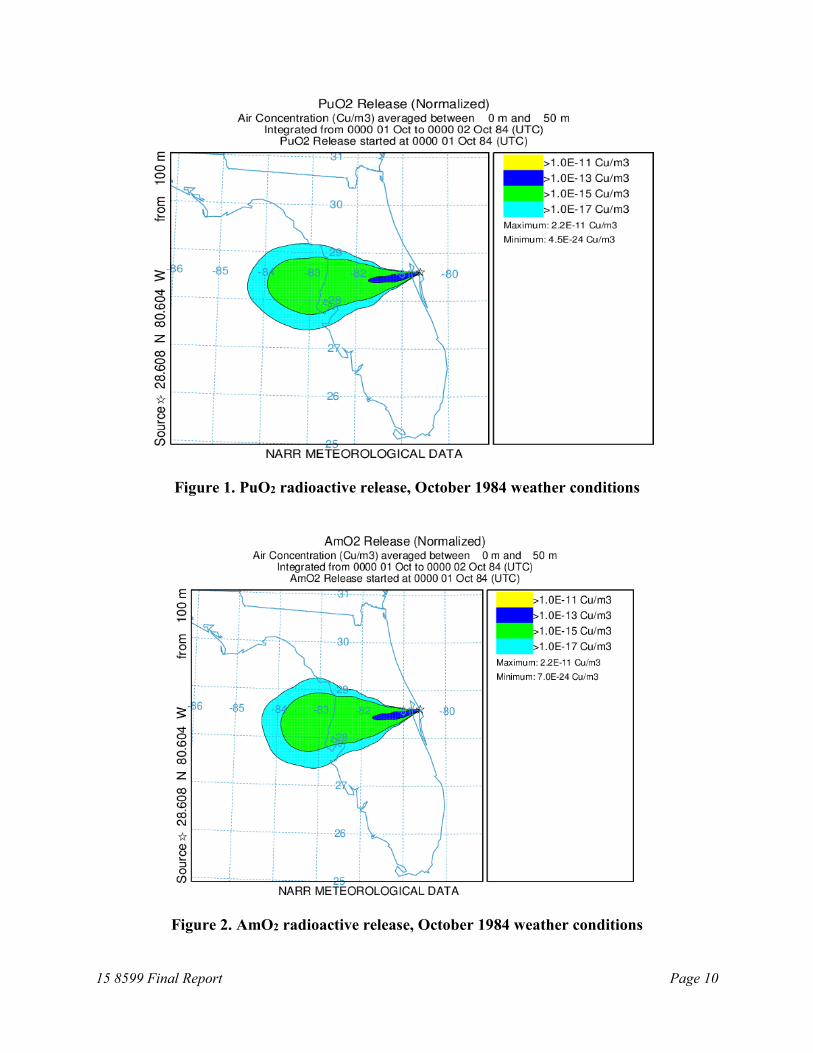
III. Comparison of PuO2 and AmO2 aerosol dispersion for the MARS 2020 and Galileo accident scenarios using the HYSPLIT code and actual atmospheric conditions.
We used the Hybrid Single Particle Lagrangian Integrated Trajectory Model (HYSPLIT) software to model the potential spread of radioactive material from a rocket launch site in Cape Canaveral, Florida. This modeling program was originally created for use by the National Oceanic and Atmospheric Administration (NOAA), and the software has increased in complexity during its more than 30 years of use and development. The current HYSPLIT program is capable of modeling multiple processes. These include air parcel trajectories, transport, dispersion, chemical transformation, and deposition. Due to the extensive modeling capability available with HYSPLIT, it has become widely used in the field of atmospheric science.
For our aerosol dispersion calculations, material was assumed to have originated from the breach of a Radioisotope Thermoelectric Generator (RTG) during a catastrophic accident scenario. While many radioactive isotopes exist within an RTG, only Pu-238 (in the form PuO2) and Am-241 (in the form AmO2) were analyzed.
Particle sizes for the HYSPLIT calculations were based on the Activity Median Aerodynamic Diameter (AMAD) values provided in the work, F. De-La-Torre-Aguilar, N. White, M. Prelas, R. V. Tompson, and S. K. Loyalka "Space nuclear power system accidents: Doses from Pu-238 and Am-241 inhalation," Progress in Nuclear Energy vol.100C (2017), pp.171-182. These AMAD values were then converted into equivalent particle sizes using Aerosol Technology: Properties, Behavior, and Measurement of Airborne Particles by William C. Hinds. The AMAD values and equivalent particle sizes for the two isotopes are given in Table 1 below.
Table 1: AMAD and Equivalent Particle Sizes
AMAD (µm): PuO2 (µm): AmO2 (µm): 0.12 0.03873 0.03508
3 0.96825 0.87706 5.2 1.67829 1.52023 8.4 2.71109 2.45576
Once the particle sizes were calculated, the next step was to determine the proper data sets to be used in HYSPLIT. In the Final Safety Analysis Report (FSAR) for the Galileo mission, the consequences of potential accident scenarios were determined by analyzing archived weather data for specific months. These months consisted of November from 1980-1984, as well as October 1981 and 1983. The upcoming Mars 2020 mission is expected to launch in July or August of 2020, and so recent data for these months was needed as well.
To retrieve the necessary data, the National Oceanic and Atmospheric Administration’s National Climatic Data Center (NOAA-NCDC) electronic database was used. Due to the location of potential particle release, data grid resolution, and available data types, it was decided to work
15 8599 Final Report Page 9
with the North American Regional Reanalysis (NARR) data sets. Since the concern in potential accident scenarios is on predicting overall release behavior, averaged data was used for each month.
Once all the necessary data had been located, the HYSPLIT program was prepared. For each month, two simulations were conducted – one consisted of a pure release of PuO2 while the second consisted of a pure release of AmO2. PuO2 and AmO2 were assigned densities of 9.6g/cm3 and 11.7g/cm3, respectively. The corresponding half-lives were also included. It was assumed that the launch was taking place at NASA launch pad 39A (28.6083º N, 80.6041º W), and that the release occurred 100 meters above ground level. To keep the analysis consistent with the Galileo FSAR accident analysis, a horizontal Gaussian Puff model was used. Lastly, the released particle size was chosen. For both the PuO2 and AmO2 simulations, particles corresponding to AMAD 3 µm were used.
After these preparations, all the simulations were run and graphical results produced. The results were calculated in terms of Curies per cubic meter and integrated from 0 to 50 meters above ground level. Each calculation was also normalized to a one Curie radioactive release from the RTG.
When the Galileo mission was originally simulated in the Galileo FSAR, weather conditions during October and November 1980-1984 were to be used. However, due to poor record keeping and other issues, the weather data for October 1981 and October 1983 were unusable. Instead, the FSAR simulations were conducted with the remaining months: November 1980-1984, as well as October 1980, 1982, and 1984. The data sets for these months were pulled from the NOAA-NCDC electronic database, and computed in HYSPLIT for both PuO2 and AmO2 particles corresponding to AMAD 3 µm. We have shown some typical results in the figures below for both October and November 1984. The normalized PuO2 and AmO2 dispersion results for each month differ mainly because of the different decay constants. Between months, the dispersion result difference is due to shifting weather patterns. We are integrating these results further in to the full analysis.
For the Mars 2020 mission, data sets from July and August 2005 were chosen. This selection was due to a couple of factors. First, NOAA-NCDC had no NARR updates beyond 2014. The second was that HYSPLIT refused to recognize any data sets after the 2005 data year. Again, since the concern in potential accident scenarios is on predicting overall release behavior, averaged data was used for each month. We have shown some typical results for the month of August 2005 in the figures below. As mentioned previously, the normalized PuO2 and AmO2 dispersion results differ mainly because of the different decay constants.
15 8599 Final Report Page 10
Figure 1. PuO2 radioactive release, October 1984 weather conditions
Figure 2. AmO2 radioactive release, October 1984 weather conditions

15 8599 Final Report Page 11
Figure 3. PuO2 radioactive release, November 1984 weather conditions
Figure 4. AmO2 radioactive release, November 1984 weather conditions

15 8599 Final Report Page 12
Figure 5. PuO2 radioactive release, August 2005 weather conditions
Figure 6. AmO2 radioactive release, August 2005 weather conditions

15 8599 Final Report Page 13
IV. Comparison of PuO2 and AmO2 aerosol deposition in real lung models using FLUENT.
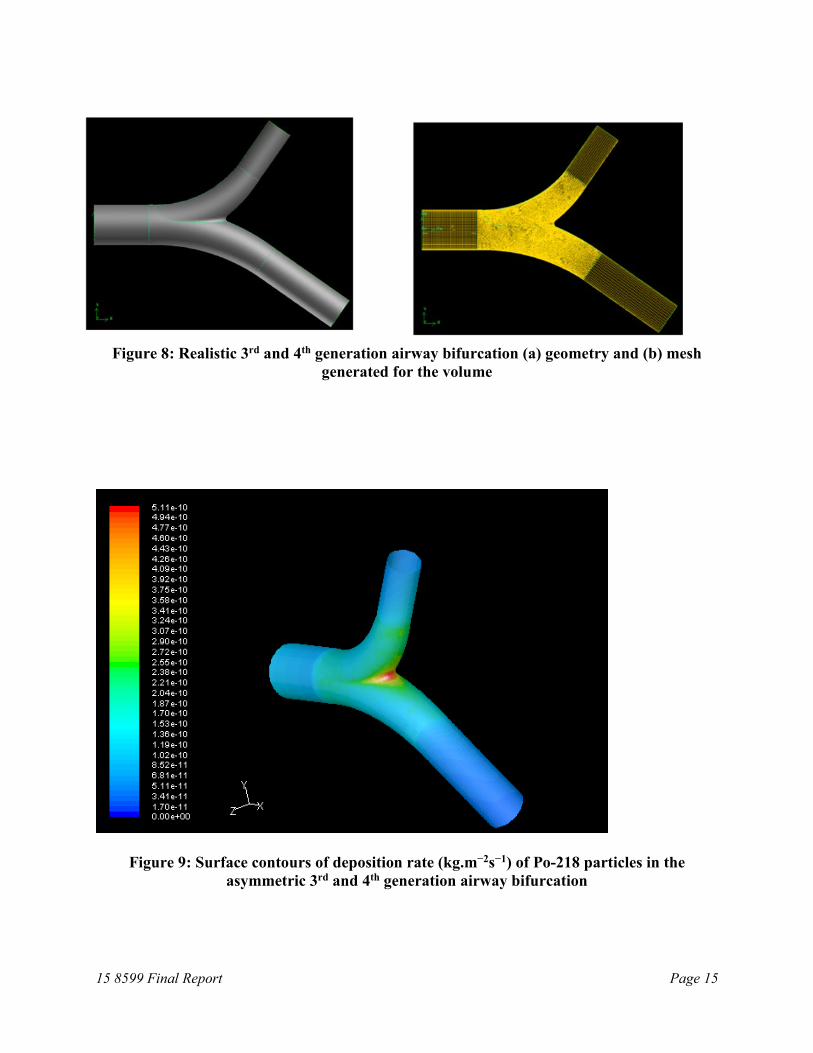
The ICRP-66 models for aerosol inhalation use estimates of deposited fraction in lungs as a function of aerosol mean aerodynamic diameter. These models are based on some animal data and simple models, and are often considered adequate for first order estimations. These do have limitations in that damage (cancer) to lungs is often local (greater local deposition on carina or at lung bifurcations) as in the case of radon progenies (Polonium particles), and better understandings and models are of interest.
In our recent work, we (Gutti et al., to be published) had noted that deposition of airborne particles in human respiratory tract is largely governed by their aerodynamic size and diffusion characteristics. The site and magnitude of particle deposition in the respiratory tract is determined by physical mechanisms and the biology of the individual inhaling the particles. Use of real lung airway geometry is important to estimate deposition patterns and efficiency, and to estimate risk from inhalation of toxic particles and radiation dose from inhaled radioactive particles. We had used a CFD code FLUENT to simulate particle transport and predict aerosol/nanoparticle deposition patterns. Deposition of molecular phase species in gas phase was modeled using species transport and reaction model. Chest CT scan image data was used to obtain real lung airway geometry for computational purposes by selective contouring of the airway regions on each image slice of the CT image data. The selected airway region was further processed and meshed to obtain a discretized geometry for CFD computation. We had benchmarked the computations against some available experimental data for a model geometry. We had successfully extracted real lung airway geometry from CT image data up to 6th generation and processed for use in CFD computations (see figure below). Nanoparticle deposition patterns were obtained for normal quiet breathing conditions in real lung airway geometry. We had obtained and used real lung airway geometry for estimation of aerosol/particulate deposition efficiency, and local deposition patterns in human lung airways. We found that the real lung airway deposition and air flow patterns are different compared to symmetrical smooth cylindrical tube models.

15 8599 Final Report Page 14
Figure 7: Airway surface displayed in mimics (Materialise) program that was generated from image segmentation in Amira (Visage Imaging®) program
15 8599 Final Report Page 15
Figure 8: Realistic 3rd and 4th generation airway bifurcation (a) geometry and (b) mesh generated for the volume
Figure 9: Surface contours of deposition rate (kg.m−2s−1) of Po-218 particles in the asymmetric 3rd and 4th generation airway bifurcation

15 8599 Final Report Page 16
We have used this previous work as the basis, with some appropriate changes, to model PuO2 and AmO2 deposition in the real lung model noted above. Since particles of interest span a wide size range, we ran separate simulations for each of the four particle sizes (ICRP-66) with interaction with continuous phase (air) using Discrete Particle Model (DPM) in FLUENT. We used the following conditions:
Fluid used: air, Wall surface: trap boundary condition, Particle type: inert spherical particles (non-reacting), Inlet velocity: 0.25 m/s based on breathing flow rate, Fully developed flow at the inlet of the area of interest (airway wall surface), Densities: PuO2 = 9600 kg/m3 and AmO2 = 11700 kg/m3. We also assumed a particle concentration of 107 particles/m3 for all sizes of particles, and breathing flow rate of 2200 cc/s (in this model, both coagulation and effects of humidity- condensation- are neglected, as well as the charge effects). We used an inlet flow rate (kg/s) for the particles based on this assumption and mass was calculated for each particle based on its size in microns.
Our results are summarized in Table 2:
Table 2: Deposition of PuO2 and AmO2 particles in a real lung model using FLUENT
Particle composition
Size Particles
AMAD diameter (µm)
# total @ inlet
# trapped on wall % trapped
PuO2
0.12 0.0387 3010 100 3.322% 3 0.968 3010 100 3.322%
5.2 1.6783 3010 107 3.555% 8.4 2.711 3010 125 4.153%
AmO2
0.12 0.035 3010 62 2.060% 3 0.877 3010 70 2.326%
5.2 1.52 3010 100 3.322% 8.4 2.455 3010 180 5.980%
Indicating that there is some difference in the deposition efficiencies of PuO2 and AmO2 particles, but that they are all of the order of a few percent. We will describe the full results. Including local deposition rates, and comparison with ICRP-66 model in a publication in the post project period.

15 8599 Final Report Page 17
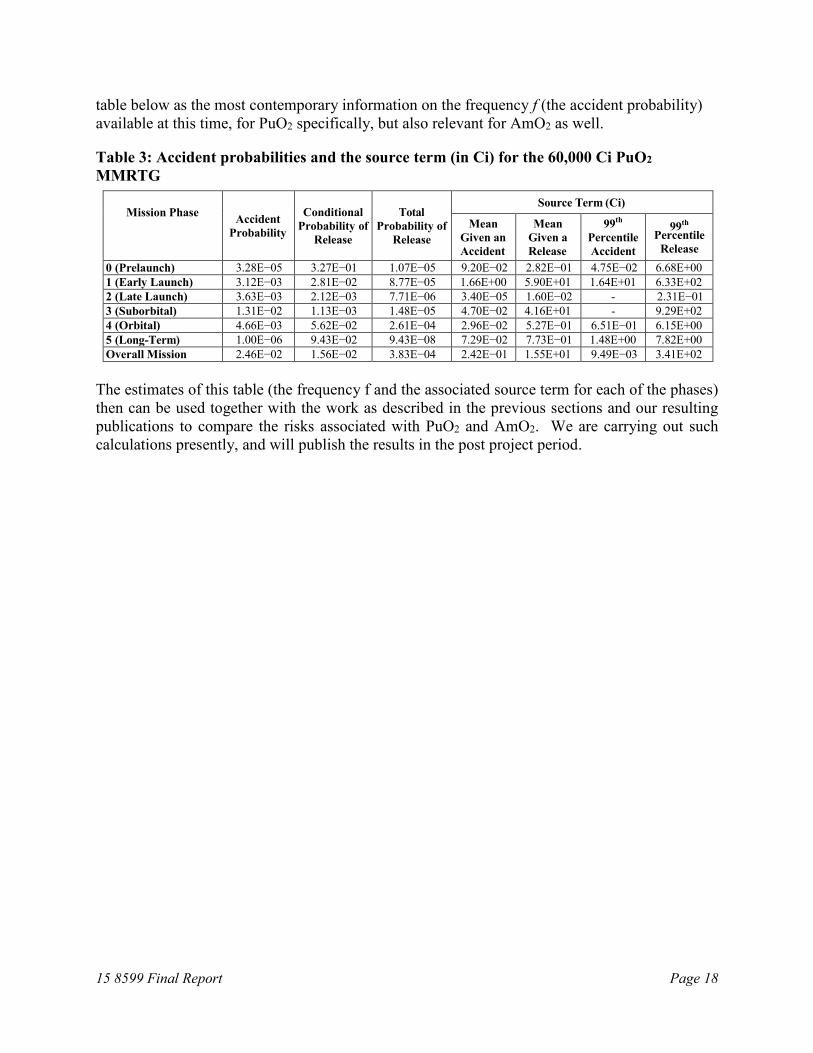
V. The Risk Methodology We have noted basic aspects of risk estimation in the introduction to the report, and have also concluded in De-La-Torre-Aguilar et al (2017) that consequences of Am-241 use are about a half of those from Pu-238 on a per kW basis assuming the same accidental release and atmospheric transport. We have made considerable progress on the DSMC methodology that would permit more detailed modeling of the aerosol evolution, atmospheric dispersion and lung deposition than has been possible otherwise, and effects of multiple components, different charge distribution, condensation, and radioactive decays between PuO2 and AmO2, can be now explored and accounted for given an accident scenario. Regarding the frequency f, one needs to hypothesize various accident scenarios of a launch (es), and identify the scenarios that can lead to significant releases and their frequencies. One most recent analysis of these scenarios and the associated frequencies has been conducted by Clayton et al. in conjunction with the MARS 2020 mission. They considered ….. “1) Potential accidents associated with the launch, and their probabilities and accident environments; 2) The response of the radioisotope hardware to accident environments with respect to source terms (that portion of the release that becomes airborne) and their probabilities, and 3) The radiological consequences and mission risks associated with such releases. The radioactive material inventory of interest, for a single MMRTG, is about 60,000 Ci of primarily Pu-238 [1]” And divided the mission into five phases the basis of the mission elapsed time (MET, the time (T) relative to launch), reflecting principal events during the mission as follows: Phase 0: Pre-Launch, T < t1, from installation of the MMRTG to just prior to start of the Stage 1 Liquid Rocket Engines (LREs) at t1. Phase 1: Early Launch, t1 < T < tx, from start of Stage 1 LREs, to just prior to tx, where tx is the time after which there would be no potential for debris or intact vehicle configurations resulting from an accident to impact land in the launch area, and water impact would occur. Phase 2: Late Launch, from tx < T to when the LV reaches an altitude of nominally 30,480 m (100,000 ft), an altitude above which reentry heating could occur. Phase 3: Suborbital Reentry, from nominally 30,480 m (100,000 ft) altitude to the end of Stage 2 burn 1 and the Command Destruct System (CDS) is disabled. Phase 4: Orbital Reentry, from end of Stage 2 burn 1 to Stage 2 / spacecraft separation. Phase 5: Long-Term Reentry, after spacecraft separation until no chance of Earth reentry.” The table below is their summary of their results for the PuO2 MMRTG, as determined by a Monte Carlo simulation using 150,000 trials or more for each of the various accident scenarios and launch vehicle options. They had assumed 100 percent of released material with a physical diameter less than 100 microns to be airborne and neglected trapping, by the graphites and other debris (their simulations show that particles larger than 100 microns would fall to the ground within a few meters of the source). From their report it is not clear as to what was assumed regarding the initial aerosol distribution, aerosol processes and evolution during the accident, and the details of their modeling are not available to us. Nevertheless, one can perhaps regard the
15 8599 Final Report Page 18
table below as the most contemporary information on the frequency f (the accident probability) available at this time, for PuO2 specifically, but also relevant for AmO2 as well. Table 3: Accident probabilities and the source term (in Ci) for the 60,000 Ci PuO2 MMRTG
Mission Phase
Accident Probability
Conditional
Probability of Release
Total
Probability of Release
Source Term (Ci) Mean
Given an Accident
Mean Given a Release
99th
Percentile Accident
99th
Percentile Release
0 (Prelaunch) 3.28E−05 3.27E−01 1.07E−05 9.20E−02 2.82E−01 4.75E−02 6.68E+00 1 (Early Launch) 3.12E−03 2.81E−02 8.77E−05 1.66E+00 5.90E+01 1.64E+01 6.33E+02 2 (Late Launch) 3.63E−03 2.12E−03 7.71E−06 3.40E−05 1.60E−02 - 2.31E−01 3 (Suborbital) 1.31E−02 1.13E−03 1.48E−05 4.70E−02 4.16E+01 - 9.29E+02 4 (Orbital) 4.66E−03 5.62E−02 2.61E−04 2.96E−02 5.27E−01 6.51E−01 6.15E+00 5 (Long-Term) 1.00E−06 9.43E−02 9.43E−08 7.29E−02 7.73E−01 1.48E+00 7.82E+00 Overall Mission 2.46E−02 1.56E−02 3.83E−04 2.42E−01 1.55E+01 9.49E−03 3.41E+02
The estimates of this table (the frequency f and the associated source term for each of the phases) then can be used together with the work as described in the previous sections and our resulting publications to compare the risks associated with PuO2 and AmO2. We are carrying out such calculations presently, and will publish the results in the post project period.

15 8599 Final Report Page 19
V. Selected References: Blanchardon E., Davesne E., Paquet F., Bailey M., (2014), Absorption of americium compounds in the respiratory tract. International Journal of Radiation Biology 90, 959-965. Clayton, D.J., Bignell, J., Jones, C.A., Rohe, D.P., Flores, G.J., Bartel, T.J., Gelbard, F., Le, S., Morrow, C.W., Potter, D.L. and Young, L.W., (2014). Nuclear Risk Assessment for the Mars 2020 Mission Environmental Impact Statement. SAND2013-10589, SNL, Albuquerque, NM. Davesne E., Paquet F., Ansoborlo E., Blanchardon E., (2010), Absorption of plutonium compounds in the respiratory tract. Journal of Radiological Protection 30, 5. De La Torre Aguilar F., White N.E., Prelas M.A., Tompson R.V., Loyalka S.K., (2017), Space nuclear power system accidents: Doses from Pu-238 and Am-241 inhalation. Progress in Nuclear Energy 100, 171-182. DiNunno J.J., Anderson F.D., Baker R.E., Waterfield R.L., (1962), Calculation of distance factors for power and test reactor sites. TID-14844. Division of Licensing and Regulation, USAEC. Frank M.V., (1999), Treatment of uncertainties in space nuclear risk assessment with examples from Cassini mission applications. Reliability Engineering & System Safety 66, 203-221. General Electric Company, (1988), Final Safety Analysis Report for the Galileo Mission, Accident Model Document. Goldman M., Nelson R.C., Bollinger L., Hoover M.D., Templeton W., Anspaugh L., (1991), Potential health risks from postulated accidents involving the Pu‐238 RTG on the Ulysses solar exploration mission. AIP Conference Proceedings 217, 152-164. ICRP, (1979), Limits for Intakes of Radionuclides by Workers, ICRP Publication 30, Annals of the ICRP. ICRP, (1991), 1990 Recommendations of the International Commission on Radiological Protection, ICRP Publication 60, Annals of the ICRP 21 (1-3). ICRP, (1994), Human Respiratory Tract Model for Radiological Protection, ICRP publication 66, Annals of the ICRP 24 (1-3). ICRP, (1994), Dose Coefficients for Intakes of Radionuclides by Workers, ICRP publication 68, Annals of the ICRP 24 (4). ICRP, (1995), Age-dependent Doses to Members of the Public from Intake of Radionuclides – Part 3 Ingestion Dose Coefficients, ICRP publication 69, Annals of the ICRP 25. ICRP, (1995), Age-dependent Doses to Members of the Public from Intake of Radionuclides – Part 4 Inhalation Dose Coefficients, ICRP publication 71, Annals of the ICRP 25 (3-4).

15 8599 Final Report Page 20
ICRP, (1995), Age-dependent Doses to Members of the Public from Intake of Radionuclides – Part 5 Compilation of Ingestion and Inhalation, ICRP publication 72, Annals of the ICRP 26 (1). ICRP, (2005), Low-dose Extrapolation of Radiation-related Cancer Risk, ICRP publication 99, Annals of the ICRP 35 (4). Ishigure N., Inaba J., (1996), Analytical Solution of the Compartment Model for Respiratory Tract Clearance Used in the New ICRP Lung Model. Journal of Nuclear Science and Technology 33, 179-186. Kastenberg W.E., Wilson R., (2004), Risk of nuclear powered space probes. Reliability Engineering & System Safety 86, 53-59. Kruger, J., P. J. Kruger, D. J. J. C. Bouwer, and J. Albasini, (1992), A case study of an accidental inhalation of Am-241 from a ruptured source, In 8. International congress of the International Radiation Protection Association (IRPA8). McCormick N.J., (1981), Reliability and risk analysis: methods and nuclear power applications. Academic Press San Diego, CA. National Research Council Radioisotope Power Systems Committee, (2009), Radioisotope Power Systems: An Imperative for Maintaining US Leadership in Space Exploration. National Academies Press, Washington, D.C. NUS Corporation, (1989), Final Safety Analysis Report for the Galileo Mission, Nuclear Risk Analysis Document Appendices. Rasmussen N.C., (1981), The Application of Probabilistic Risk Assessment Techniques to Energy Technologies. Annual Review of Energy 6, 123-138. Smith J.R.H., Birchall A., Etherington G., Ishigure N., Bailey M.R., (2013), A Revised Model for the Deposition and Clearance of Inhaled Particles in Human Extra-Thoracic Airways. Radiation Protection Dosimetry 158, 135-147. U.S. Nuclear Regulatory Commission, (1991), NRC Regulations 10 CFR Part 20. Volf, V., (1996) Chelation therapy by DFO-HOPO and 3, 4, 3-LIHOPO for injected Pu-238 and Am-241 in the rat: effect of dosage, time and mode of chelate administration. International journal of radiation biology, 70(6), 765-772. Witze A., (2014), Nuclear power: Desperately seeking plutonium, Nature 515, 484-486.

15 8599 Final Report Page 21
Appendix A: Charge Effects on Aerosol Evolution: Graphite-AmO2 and PuO2 aerosols
a. Introduction: We have developed a DSMC model for multi-component aerosol evolution which includes the following processes: deposition, electrostatic dispersion, coagulation (considering charge effects) and condensation, assuming a spatially homogeneous medium and spherical particles (F. De-La-Torre-Aguilar and S. K. Loyalka, to be published). DSMC being a physically based simulation method, we can include more realistic models for these processes, especially regarding component densities and charge effects. In models based on the sectional technique, some unrealistic assumptions about the density of the different aerosol components need to be made and these lead to errors (Campbell and Loyalka, 2015). Moreover, models based on sectional technique are very challenging when consider the effect of charge in aerosols are included. And it has been shown that aerosol charge distribution has a significant effect in the coagulation of even single component particles, particularly for bipolar charge distributions (Palsmeier and Loyalka, 2013).
b. DSMC program: The program considers each particle as an entity having a specific percentage of several components with an electric charge, see Figure A.1. Each component making up the particle can have a different density. The information for all simulated particles is stored in a list that is dynamically updated at each time step according to the processes included. The rate models for the physical processes are not included here but a brief description of the processes is presented next. In electrostatic dispersion particles are tested for removal basically by comparing their electric charge with the net charge of the aerosol. In deposition, the processes of gravitational settling and convection diffusion determine the deposition rate. Coagulation uses the No Time Counter (NTC) method to estimate the number of pairs of particles interacting, then these pairs are tested for coagulation comparing their coagulation kernel (considering charge effects) with the maximum value of the coagulation kernel found so far in the simulation. Condensation uses a generalization of Mason’s formula to calculate the mass gained by each particle. The program can show the effects of each process for each time step, such as: particles removed, particles coalescing, and mass gained by condensation. Moreover, size and charge distributions and component mass distributions can be generated from the particle lists stored at the different times of simulation.
Figure A.1. Representation of a simulated particle having two components (graphite and AmO2) and water with a charge q.

15 8599 Final Report Page 22
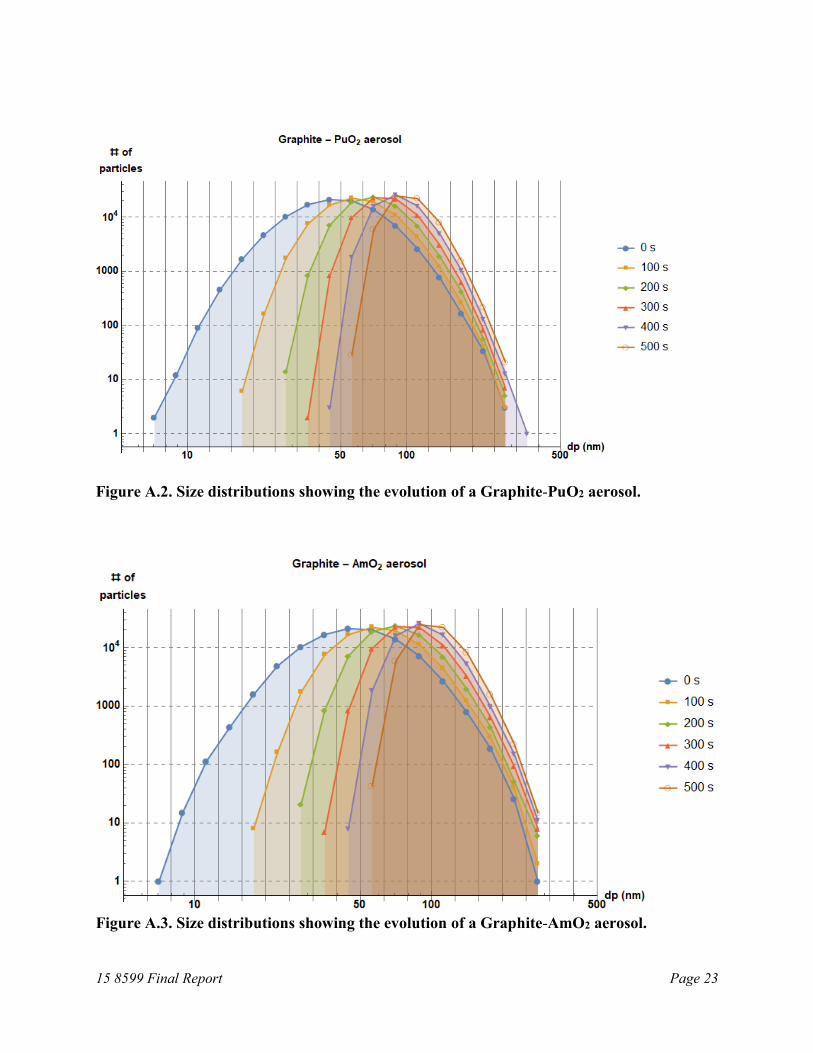
c. Results: The program described above was used to compare results for two scenarios: the evolution of aerosols with particles made up of 90% mass of graphite and 10% mass of PuO2, and with particles with 90% mass of graphite and 10% mass of AmO2. The initial particle distribution for this simulation was obtained from size and charge distributions that we measured from graphite particles generated by spark discharge. These distributions were obtained using a Tandem Differential Mobility Analyzer (TDMA) and were fitted to lognormal distributions to use their sizes and charges as reference and generate simulated particles by acceptance-rejection technique. The volume of the components for each particle was assigned considering the percentages of mass mentioned above, taking the total volume from the measured distributions. Simulation parameters are given in Table A.1.
Table A.1. Simulation parameters and constants
Parameter Value Units PuO2 density 9,600 kg/m3
AmO2 density 11,700 kg/m3 Number of particles simulated 100,000 - Number of real particles represented 1.9×10¹¹ - Time step 10 s Number of runs 50 - Ambient temperature 296.15 K Ambient pressure 95,000 Pa Reference temperature 293 K Reference pressure 101,300 Pa Sutherland’s constant (air) 110.4 K Reference gas mean free path 6.73×10⁻⁸ m Boltzmann Constant 1.38065×10⁻²³ J/K Air viscosity @ ~300 K 1.83245×10⁻⁵ kg m−1 s−1 Gravitational acceleration 9.81 m s−2 Permittivity of free space 8.854187818×10⁻¹² F/m Elementary electric charge 1.6019×10⁻¹⁹ C Ratio of floor area to volume (aerosol chamber) 1.07 m−1 Ratio of ceiling area to volume (aerosol chamber)
1.07 m−1
Ratio of walls area to volume (aerosol chamber) 2.29 m−1 Diffusion boundary layer thickness 10−5 m Saturation density of vapor @ 25°C 23×10−3 kg/m3
Diffusion coefficient of vapor 0.289×10⁻⁴ m2/s Saturation ratio 1.0000001 - Thermal conductivity of a gas-vapor mixture 2.7×10⁻² W m−1 K−1 Latent heat of vaporization 2.257×10⁶ J/kg Vapor molecular mass 2.989×10⁻²⁶ kg Gas molecular mass 4.65×10⁻²⁶ kg
15 8599 Final Report Page 23
Figure A.2. Size distributions showing the evolution of a Graphite-PuO2 aerosol.
Figure A.3. Size distributions showing the evolution of a Graphite-AmO2 aerosol.
15 8599 Final Report Page 24
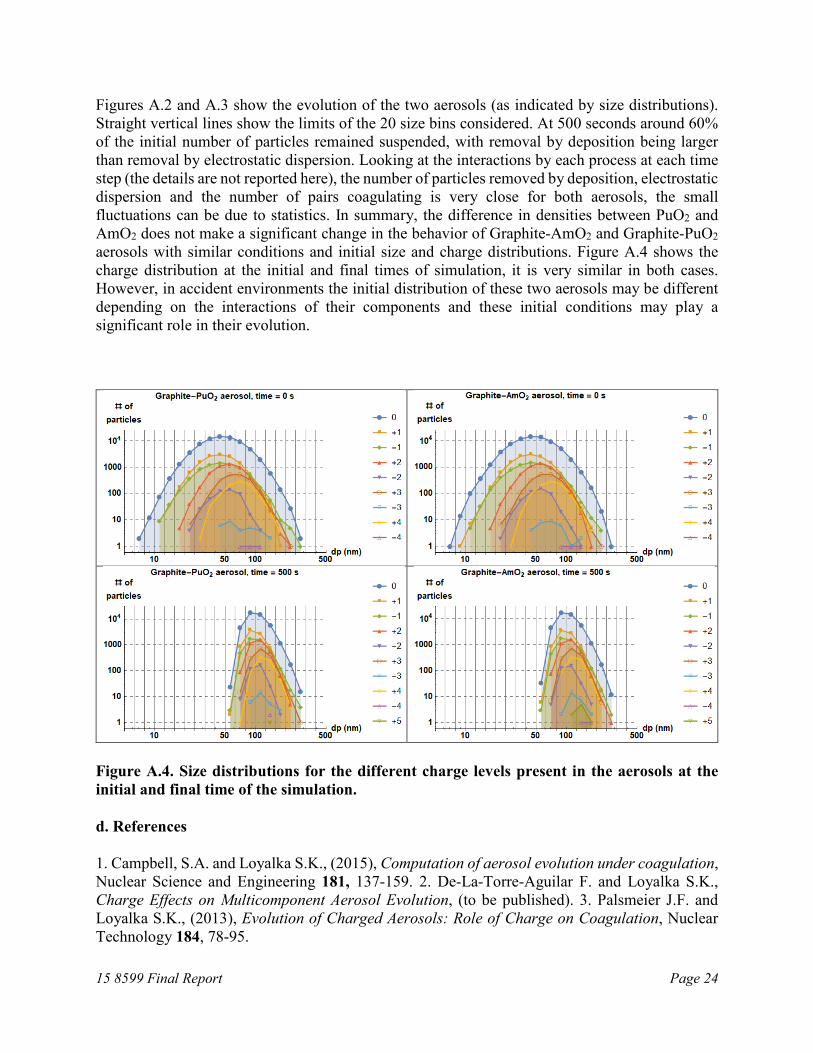
Figures A.2 and A.3 show the evolution of the two aerosols (as indicated by size distributions). Straight vertical lines show the limits of the 20 size bins considered. At 500 seconds around 60% of the initial number of particles remained suspended, with removal by deposition being larger than removal by electrostatic dispersion. Looking at the interactions by each process at each time step (the details are not reported here), the number of particles removed by deposition, electrostatic dispersion and the number of pairs coagulating is very close for both aerosols, the small fluctuations can be due to statistics. In summary, the difference in densities between PuO2 and AmO2 does not make a significant change in the behavior of Graphite-AmO2 and Graphite-PuO2 aerosols with similar conditions and initial size and charge distributions. Figure A.4 shows the charge distribution at the initial and final times of simulation, it is very similar in both cases. However, in accident environments the initial distribution of these two aerosols may be different depending on the interactions of their components and these initial conditions may play a significant role in their evolution.
Figure A.4. Size distributions for the different charge levels present in the aerosols at the initial and final time of the simulation.
d. References
1. Campbell, S.A. and Loyalka S.K., (2015), Computation of aerosol evolution under coagulation, Nuclear Science and Engineering 181, 137-159. 2. De-La-Torre-Aguilar F. and Loyalka S.K., Charge Effects on Multicomponent Aerosol Evolution, (to be published). 3. Palsmeier J.F. and Loyalka S.K., (2013), Evolution of Charged Aerosols: Role of Charge on Coagulation, Nuclear Technology 184, 78-95.