Alveolar Epithelial Damage
11
Alveolar Epithelial Damage A Critical Difference between High Pressure and Oleic Acid-induced Low Pressure Pulmonary Edema J. S. G. Montaner, J. Tsang, K. G. Evans, J. B. M. Mullen, A. R. Bums, D. C. Walker, B. Wiggs, and J. C. Hogg University of British Columbia, Pulmonary Research Laboratory, St. Paul's Hospital, Vancouver, British Columbia V6Z I Y6 Canada Abstract The present study was designed to compare high pressure pul- monary edema (HPPE) and oleic acid-induced low pressure pul- monary edema (OAPE) in dogs when similar amounts of extra vascular water were present in the lung. The high pressure edema was produced by intravenous fluid overload and by inflating an aortic balloon catheter (n = 6). The low pressure edema was produced by the injecting 0.08 mg/kg oleic acid suspended in 5 ml saline (n = 6). Comparison of the difference between initial control measurements and final measurements in the edematous states showed that the animals with OAPE had a greater fall in percent oxygen saturation and a greater increase in shunt frac- tions. The light microscopic studies showed that OAPE was associated with greater amounts of alveolar flooding than HPPE where the edema fluid was located to a greater extent in the peribronchial interstitial space. The electron microscopy studies showed that the alveolar flooding in OAPE was associated with epithelial disruption, and tracer studies carried out in rabbits showed that dextran (150,000 mol wt) could pass from blood to airspace and that dextran (40,000 mol wt) could pass from air- space to blood in OAPE. We conclude that epithelial disruption is responsible for the excessive alveolar flooding in OAPE and that this results in a greater impairment in gas exchange. Introduction In a study of fluid accumulation in high pressure and alloxan- induced low pressure pulmonary edema, Staub et al. (1) reported that edema fluid first accumulated in the interstitial compartment around the large vessel before it flooded the airspace. In a sub- sequent study Vreim and Staub (2) also showed that in alloxan- induced low pressure pulmonary edema (LPPE),1 alveolar flooding occurs more readily and the fluid has a higher protein content and an increased number of cells compared with high pressure pulmonary edema (HPPE) (3). These observations sug- gest that epithelial permeability may be quite different under Address correspondence to Dr. Hogg. Receivedforpublication 26 July 1985 and in revisedform 6 February 1986. 1. Abbreviations used in this paper: ARDS, adult respiratory distress syndrome; BP, blood pressure; CO, cardiac output; EVLW, extravascular lung water per gram of blood-free dry lung; FITC, fluorescein isothio- cyanate; HPPE, high pressure pulmonary edema; LPPE, low pressure pulmonary edema; OAPE, oleic acid-induced low pressure pulmonary edema; PL, transpulmonary pressure; Ppa, pulmonary artery pressure; Ppaw, pulmonary wedge pressure; Qs/Qt, shunt fractions; RA, right atrium; SAT, percent oxygen saturation; V/Q, ventilation-perfusion. the two conditions, and this is supported by the observations that HPPE clears rapidly with therapy (4) compared with LPPE, which takes days to resolve (5). This study was designed to de- termine the nature of the epithelial disruption in the early stages of oleic acid-induced low pressure pulmonary edema (OAPE) and whether this is associated with a different distribution of edema fluid in the lung. The studies show that with similar amounts of edema present there was greater alveolar flooding and less interstitial edema in OAPE than in HPPE. Electron microscopy and tracer studies show greater disruption of the epithelium in OAPE. The physiological data show a greater de- terioration in gas exchange with OAPE, particularly when dif- ferences in cardiac output (CO) are taken into account. Methods Physiological studies. Mongrel dogs weighing 15.6±1.2 kg were anes- thetized with pentobarbital sodium (25-30 mg/kg), placed in a supine position, and intubated with a cuffed endotracheal tube. They were ven- tilated with a Harvard animal ventilator at a tidal volume of 12-15 ml/ kg and a respiratory rate of 10-15 per min where the inspired gas was 100% oxygen during the entire experimental procedure. A 7 Fr double lumen Swan-Ganz, thermistor-tipped catheter (702-027 Edwards Lab- oratory, Sandusky, OH) was placed in the pulmonary artery under flu- oroscopic control for the measurements of pulmonary artery pressure (Ppa), pulmonary wedge pressure (Ppaw), and CO by the thermodilution technique. A multiple side-hole catheter was placed into the right atrium (RA) and a balloon-tipped catheter was placed in the intrathoracic portion of the descending aorta via one of the carotid arteries. A catheter was placed in the descending aorta, proximal to the balloon catheter, for measurements of the arterial blood pressure (BP), and a catheter was placed in a femoral vein to infuse fluids. The ureters were ligated to minimize diuresis during the experiments. All the pressures were referred to the midchest. Vascular pressures were recorded using an 8 channel recorder (model 77528, Hewlett Packard Co., Palo Alto, CA). Mixed venous and arterial blood was sampled simultaneously for blood gas analysis (Radiometer ABL 2, Denmark, Copenhagen). After CO was measured, albumin ma- croaggregates labeled with '25I were injected into the right atrium to mark regional pulmonary blood flow (6). When these initial measure- ments were completed the animals were divided into three groups. Group I (n = 6) served as a control and the animals were monitored for 2 h without further intervention. HPPE was produced in group II (n = 6) by inflating the balloon-tipped catheter in the aorta and by infusing 0.9% saline solution equivalent to 25% of body weight over 2 h. Ppa was kept within a range of 35-45 cm H20 by varying the inflation of the aortic balloon to modify the cardiac afterload. With the ongoing infusion of fluid and the inflation of the aortic balloon, systemic BP ranged between 150 and 200 mmHg. An experimental model of LPPE was produced in group III (n = 6) by injecting oleic acid (0.08 mg/kg suspended in 5 ml of 0.9% saline) (7) in a bolus through the multiple side-hole catheter in the right atrium. As CO tended to fall in oleic acid pulmonary edema, and tended to increase or remain the same in HPPE, two additional experiments were performed where OAPE was produced and arterio- venous shunts were opened in the groin to increase CO to levels com- parable with that seen in HPPE. After 2 h the measurements of Ppa, Ppaw, BP, mixed venous and 1786 Montaner, Tsang, Evans, Mullen, Burns, Walker, Wiggs, and Hogg J. Clin. Invest. © The American Society for Clinical Investigation, Inc. 0021-9738/86/06/1786/1 1 $1.00 Volume 77, June 1986, 1786-1796
Transcript of Alveolar Epithelial Damage

Alveolar Epithelial DamageA Critical Difference between High Pressure and Oleic Acid-induced Low Pressure Pulmonary Edema
J. S. G. Montaner, J. Tsang, K. G. Evans, J. B. M. Mullen, A. R. Bums, D. C. Walker, B. Wiggs, and J. C. HoggUniversity of British Columbia, Pulmonary Research Laboratory, St. Paul's Hospital, Vancouver, British Columbia V6Z I Y6 Canada
Abstract
The present study was designed to compare high pressure pul-monary edema (HPPE) and oleic acid-induced low pressure pul-monary edema (OAPE) in dogs when similar amounts of extravascular water were present in the lung. The high pressure edemawas produced by intravenous fluid overload and by inflating an
aortic balloon catheter (n = 6). The low pressure edema was
produced by the injecting 0.08 mg/kg oleic acid suspended in 5ml saline (n = 6). Comparison of the difference between initialcontrol measurements and final measurements in the edematousstates showed that the animals with OAPEhad a greater fall inpercent oxygen saturation and a greater increase in shunt frac-tions. The light microscopic studies showed that OAPEwasassociated with greater amounts of alveolar flooding than HPPEwhere the edema fluid was located to a greater extent in theperibronchial interstitial space. The electron microscopy studiesshowed that the alveolar flooding in OAPEwas associated withepithelial disruption, and tracer studies carried out in rabbitsshowed that dextran (150,000 mol wt) could pass from blood toairspace and that dextran (40,000 mol wt) could pass from air-space to blood in OAPE. Weconclude that epithelial disruptionis responsible for the excessive alveolar flooding in OAPEandthat this results in a greater impairment in gas exchange.
Introduction
In a study of fluid accumulation in high pressure and alloxan-induced low pressure pulmonary edema, Staub et al. (1) reportedthat edema fluid first accumulated in the interstitial compartmentaround the large vessel before it flooded the airspace. In a sub-
sequent study Vreim and Staub (2) also showed that in alloxan-induced low pressure pulmonary edema (LPPE),1 alveolarflooding occurs more readily and the fluid has a higher proteincontent and an increased number of cells compared with highpressure pulmonary edema (HPPE) (3). These observations sug-gest that epithelial permeability may be quite different under
Address correspondence to Dr. Hogg.Receivedforpublication 26 July 1985 and in revisedform 6 February
1986.
1. Abbreviations used in this paper: ARDS, adult respiratory distresssyndrome; BP, blood pressure; CO, cardiac output; EVLW, extravascular
lung water per gram of blood-free dry lung; FITC, fluorescein isothio-
cyanate; HPPE, high pressure pulmonary edema; LPPE, low pressurepulmonary edema; OAPE, oleic acid-induced low pressure pulmonaryedema; PL, transpulmonary pressure; Ppa, pulmonary artery pressure;Ppaw, pulmonary wedge pressure; Qs/Qt, shunt fractions; RA, rightatrium; SAT, percent oxygen saturation; V/Q, ventilation-perfusion.
the two conditions, and this is supported by the observationsthat HPPEclears rapidly with therapy (4) compared with LPPE,which takes days to resolve (5). This study was designed to de-termine the nature of the epithelial disruption in the early stagesof oleic acid-induced low pressure pulmonary edema (OAPE)and whether this is associated with a different distribution ofedema fluid in the lung. The studies show that with similaramounts of edema present there was greater alveolar floodingand less interstitial edema in OAPEthan in HPPE. Electronmicroscopy and tracer studies show greater disruption of theepithelium in OAPE. The physiological data show a greater de-terioration in gas exchange with OAPE, particularly when dif-ferences in cardiac output (CO) are taken into account.
Methods
Physiological studies. Mongrel dogs weighing 15.6±1.2 kg were anes-thetized with pentobarbital sodium (25-30 mg/kg), placed in a supineposition, and intubated with a cuffed endotracheal tube. They were ven-tilated with a Harvard animal ventilator at a tidal volume of 12-15 ml/kg and a respiratory rate of 10-15 per min where the inspired gas was100% oxygen during the entire experimental procedure. A 7 Fr doublelumen Swan-Ganz, thermistor-tipped catheter (702-027 Edwards Lab-oratory, Sandusky, OH) was placed in the pulmonary artery under flu-oroscopic control for the measurements of pulmonary artery pressure(Ppa), pulmonary wedge pressure (Ppaw), and COby the thermodilutiontechnique. A multiple side-hole catheter was placed into the right atrium(RA) and a balloon-tipped catheter was placed in the intrathoracic portionof the descending aorta via one of the carotid arteries. A catheter wasplaced in the descending aorta, proximal to the balloon catheter, formeasurements of the arterial blood pressure (BP), and a catheter wasplaced in a femoral vein to infuse fluids. The ureters were ligated tominimize diuresis during the experiments. All the pressures were referredto the midchest.
Vascular pressures were recorded using an 8 channel recorder (model77528, Hewlett Packard Co., Palo Alto, CA). Mixed venous and arterialblood was sampled simultaneously for blood gas analysis (RadiometerABL 2, Denmark, Copenhagen). After COwas measured, albumin ma-croaggregates labeled with '25I were injected into the right atrium tomark regional pulmonary blood flow (6). When these initial measure-ments were completed the animals were divided into three groups. GroupI (n = 6) served as a control and the animals were monitored for 2 hwithout further intervention. HPPEwas produced in group II (n = 6)by inflating the balloon-tipped catheter in the aorta and by infusing 0.9%saline solution equivalent to 25% of body weight over 2 h. Ppa was keptwithin a range of 35-45 cm H20 by varying the inflation of the aorticballoon to modify the cardiac afterload. With the ongoing infusion offluid and the inflation of the aortic balloon, systemic BP ranged between150 and 200 mmHg.An experimental model of LPPE was produced ingroup III (n = 6) by injecting oleic acid (0.08 mg/kg suspended in 5 mlof 0.9% saline) (7) in a bolus through the multiple side-hole catheter inthe right atrium. As COtended to fall in oleic acid pulmonary edema,and tended to increase or remain the same in HPPE, two additionalexperiments were performed where OAPEwas produced and arterio-venous shunts were opened in the groin to increase COto levels com-parable with that seen in HPPE.
After 2 h the measurements of Ppa, Ppaw, BP, mixed venous and
1786 Montaner, Tsang, Evans, Mullen, Burns, Walker, Wiggs, and Hogg
J. Clin. Invest.© The American Society for Clinical Investigation, Inc.0021-9738/86/06/1786/1 1 $1.00Volume 77, June 1986, 1786-1796

arterial blood gases were repeated in all three groups. After measuringCO, albumin macroaggregates labeled with 9'9Tc were injected into theright atrium as a second blood flow marker. Autologus red blood cellslabelled with 5'Cr (8) were then injected to mark the intravascular space.Four 5-cm3 blood samples were obtained 5 min later and the animalswere killed with a bolus of saturated KCL in the left ventricle. The chestwas opened and the pulmonary vessels ligated while the lungs were keptinflated with 3 cm H20 positive end expiratory pressure. The tracheawas then clamped and the lungs were removed and inflated to a trans-pulmonary pressure (PL) of 30 cm H20, deflated to a PL of 12 cm H20,and then frozen over liquid nitrogen vapor. After freezing, the lungs wereseparated and cut into 2-cm slices from the dorsal (dependant) to theventral surface. Each slice was divided into small samples that were placedin preweighed vials. These vials were then reweighed to obtain the wetweight of the sample and counted in a gamma scintillation counter(Gamma7000, Beckman Instruments, Inc., Fullerton, CA) for all threeisotopes with appropriate corrections for overlap, decay, and background.The vials were dried in an oven (60°C) to a constant weight to obtainthe dry weight of the sample.
Shunt fractions (Qs/Qt) were calculated using standard equations(9). Qs/Qt = (Cc - Ca)/(Cc - Cv) X 100%, where Cc, Ca, and Cv arethe oxygen contents of the pulmonary capillary blood, the arterial blood,and the central venous blood, respectively, with the inspired oxygen at100%. The oxygen content of each sample can be calculated by measuringthe oxygen tension, the percentage of oxygen saturation, and the amountof hemoglobin in each sample. Extravascular lung water per gram ofblood free dry lung (EVLW) was calculated using the measurements ofwet weight and dry weight and 51Cr-counts in each sample as previouslydescribed (10). The result was expressed in grams of water per gram ofblood-free dry tissue. Regional blood flow was obtained by using themeasurements of COand the 1251I or 99mTc-counts in each sample (6),calculated as follows: regional blood flow (ml/min) = (radioactive countsin sample X CO)/(total radioactive counts in both lungs) X (ml/min).
The data concerning vascular pressures, cardiac outputs, pulmonaryvascular resistances, blood gases, and Qs/Qt within each group were an-alyzed by comparing the initial to the final values using a t test for paireddata. The differences between the groups were analyzed by comparingthe change from initial to final value by using an analysis of variance.The data concerning the regional blood flows to each lung slice beforeand after the development of edema were compared using a t test forpaired data. The change in regional blood flow (AQR) after edema for-mation was correlated to the EVLWin each sample by using linearregression analysis.
Light microscopic studies. Tissues from one control and two of eachtype of experimental animal were examined by light microscopy. Randomsamples taken from the frozen lung slices were placed in Carnoy's solutionthat was precooled to -70°C in dry ice. After 24 h, the samples weregradually rewarmed to room temperature over a period of 6 d. Thesamples were processed for histology in the usual manner and sectionswere stained with hematoxylin and eosin. A minimum of 25 and a max-imum of 35 slides were prepared from each animal and coded beforeexamination by two observers. These slides were sorted into those thatwere normal, those with only interstitial edema, and those with bothalveolar flooding and interstitial edema. A chi-square analysis ( 11) wasused to test for the differences in the distribution of edema fluid betweenthe interstitial and alveolar spaces in the two treatment groups. A dif-ference at the level of P < 0.05 was accepted as significant. The remainderof the lung not used for histology was divided into multiple samples andused to calculate extra vascular water, which was expressed as mean±SD.
The same coded slides were also examined using a microscopeequipped with a camera lucida so that the histological features of thevessel and cuff areas could be traced on the digitizing board of an Applecomputer. The internal and external areas of 1,836 vessels and the areasof the cuff of interstitial space were traced and recorded. The presenceor absence of hemorrhage into the cuff was also noted. An analysis ofvariance was then used to compare the size of the fluid cuff and the ratioof the cuff areas with the vessel areas.
Electron microscopic studies. The cardiac lobes were removed from
the lungs of 12 dogs (4 controls, 3 HPPE, and 5 OAPE) just beforefreezing. Samples of lung tissue were excised from the ventral, mid, anddorsal surface of the lobe. Each sample was cut into 1-mm-thick blocksthat were fixed in ice-cold 2.5% glutaraldehyde in 0.1 Mcacodylate bufferat pH 7.3. The tissue was postfixed in 1% OS04, stained en bloc withsaturated uranyl acetate in distilled water, dehydrated in a graded ethanolseries (propylene oxide), and then embedded in Spurr's resin (12). Thinsections were cut using glass knives on a Reichert ultracut ultramicrotome,mounted on 200-mesh copper grids, stained with uranyl acetate and leadsalts, and viewed with a Philips 400 EMelectron microscope. Weex-amined and photographed the thin sections without prior knowledge ofthe treatment that the dog had received. A total of 910 photographs weretaken, 580 of which were suitable for grading epithelia. They were ex-amined by two observers who independently assigned a grade based onwhether the epithelial cells were normal (grade I), showed evidence ofvesiculation and/or abnormal cytoplasmic density and/or endomembranehypertrophy (grade II), or showed evidence of epithelial cellular disruptionwith discontinuous epithelium and/or cells migrating through the epi-thelium (grade III).
Tracer studies. To minimize the cost of the fluorescein isothiocyanate(FITC)-labeled dextran tracer, these experiments were performed on NewZealand rabbits. 15 animals (1.99±0.17 kg body weight, mean±SD) wereanesthetized with pentobarbital sodium (8-12 mg/kg i.v.) and placed inthe supine position so that the skin could be further anesthetized with2% lidocaine hydrochloride before performing a tracheostomy. The an-imals were ventilated at 12-15 ml/kg tidal volume at a rate of 50-60breaths/min using a Harvard small animal ventilator. The left carotidartery was cannulated to measure systemic arterial pressure and a balloon-tipped catheter was placed in the aorta. A multiple side-holed catheterwas placed in the right ventricle via the right internal jugular vein. Bothureters were then ligated. FITC-dextran 150 (500 mg/kg of a 5%solution,average molecular weight 150,000, Sigma Chemical Co., St. Louis, MO)was injected intravenously. The animals were then randomly dividedinto control experiments (n = 5), OAPEexperiments (n = 5) where oleicacid 0.1 mg/kg was injected into the right ventricle and HPPEexperiments(n = 5) where pulmonary edema was produced by infusing a volume of0.9% saline equivalent to 25% of body weight and inflating the aorticballoon to keep right ventricle systolic pressure in the range of 35-40cm H20.
In all of these studies, the animals were killed 2 h after the injectionof the dextran by injecting a bolus of saturated KCI into the aortic root.The chest was then opened, the vessels ligated, and the lungs and heartremoved as a single block. The lungs were inflated with air to a trans-pulmonary pressure of 20 cm H20 and frozen over liquid nitrogen vapor.Random samples of the frozen tissue were fixed in cold (-70°C) 4%glutaraldehyde in 100% ethanol for 3 h. The blocks were dehydrated inice-cold ethanol (1 h) and embedded in glycolmethacrylate (JB4, Poly-sciences Inc., Warrington, PA). 5-,Mm serial sections were cut, counter-stained with Congo red 0.1% for 45 s at 60°C (Fisher Scientific Co.,Forrest Lawn, NJ), then mounted in equal volumes of phosphate-bufferedsaline (pH 8.6) and glycerol containing the antioxidant 1-4 diazobicyclo[2,2,2]octane (Dabco, 100 mg/ml) (Sigma Chemical Co.). Sections pre-pared in this way were examined in a single blind fashion by two inde-pendent observers using a Zeiss Universal epi-fluorescence microscopeequipped with an HBO5OWilluminator, 450-490-nm exciter filter,FT510 nanometer beam splitter, and LP520 nanometer barrier. Eachobserver estimated the percentage of alveolar spaces containing FITC-dextran and classified them into four groups depending on the degreeof alveolar space filling (group I, 0-25%, group II, 26-50%, group III,51-75%, and group IV, 76-100%). Bivariate prediction success and cor-rected contingency coefficients ( 11) were calculated to assess the repro-ducibility of the visual grading system. A chi-square analysis was per-formed using the pooled data from two observers to test for differencesin alveolar fluorescence among the three groups (11). The remaininglung tissue was processed for the estimation of the wet and dry weightsand a one-way analysis of variance was used to test for differences betweenthe groups. The wet weight to dry weight ratios of the three groups wereanalyzed using one-way analysis of variance.
Epithelial Damage in Low Pressure Edema 1787
In nine additional experiments, FITC-dextran 40 (average molecularweight 40,000, Sigma Chemical Co.) was instilled in the airways via atracheostomy in a 5%solution at a dose of 100 mg/kg 1-ml blood sampleswere taken from the carotid artery before and at 15-min intervals afterthe FITC-dextran instillation. Blood withdrawn was replaced with anequal volume of 0.9% saline. In four of the nine animals, oleic acid (0.1mg/kg) was injected into the right ventricle to produce OAPEat 1 hafter the FITC-dextran 40 had been instilled in the airway. The remainingfive animals served as controls. The blood samples were centrifuged at1,500 rpm for 15 min. Plasma fluorescence was detected using a spec-trophotofluorometer (Aminco SPF- 125, American Instrument Co., SilverSprings, MD). The excitation monochromator was set at 490 nm andthe emission monochromator was set at 515 nm (13).
Results
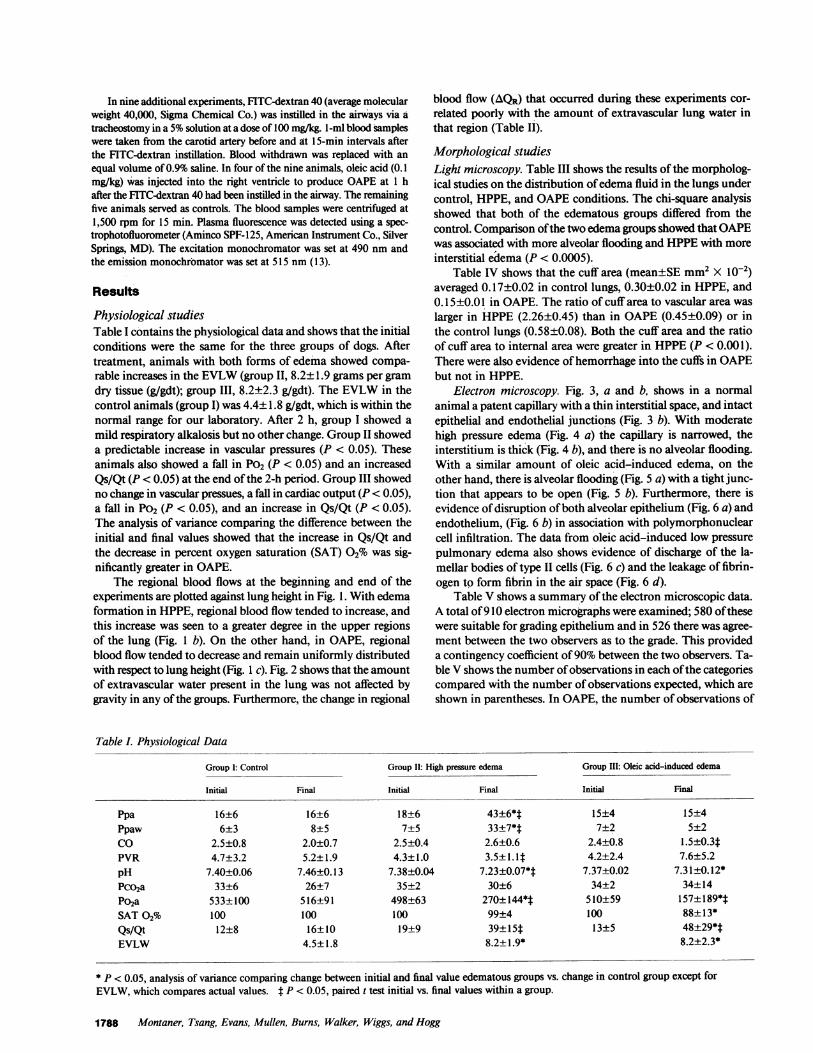
Physiological studiesTable I contains the physiological data and shows that the initialconditions were the same for the three groups of dogs. Aftertreatment, animals with both forms of edema showed compa-rable increases in the EVLW(group II, 8.2±1.9 grams per gramdry tissue (g/gdt); group III, 8.2±2.3 g/gdt). The EVLWin thecontrol animals (group I) was 4.4±1.8 g/gdt, which is within thenormal range for our laboratory. After 2 h, group I showed amild respiratory alkalosis but no other change. Group II showeda predictable increase in vascular pressures (P < 0.05). Theseanimals also showed a fall in P02 (P < 0.05) and an increasedQs/Qt (P < 0.05) at the end of the 2-h period. Group III showedno change in vascular pressues, a fall in cardiac output (P < 0.05),a fall in P02 (P < 0.05), and an increase in Qs/Qt (P < 0.05).The analysis of variance comparing the difference between theinitial and final values showed that the increase in Qs/Qt andthe decrease in percent oxygen saturation (SAT) G2%was sig-nificantly greater in OAPE.
The regional blood flows at the beginning and end of theexperiments are plotted against lung height in Fig. 1. With edemaformation in HPPE, regional blood flow tended to increase, andthis increase was seen to a greater degree in the upper regionsof the lung (Fig. 1 b). On the other hand, in OAPE, regionalblood flow tended to decrease and remain uniformly distributedwith respect to lung height (Fig. 1 c). Fig. 2 shows that the amountof extravascular water present in the lung was not affected bygravity in any of the groups. Furthermore, the change in regional
blood flow (AQR) that occurred during these experiments cor-related poorly with the amount of extravascular lung water inthat region (Table II).
Morphological studiesLight microscopy. Table III shows the results of the morpholog-ical studies on the distribution of edema fluid in the lungs undercontrol, HPPE, and OAPEconditions. The chi-square analysisshowed that both of the edematous groups differed from thecontrol. Comparison of the two edema groups showed that OAPEwas associated with more alveolar flooding and HPPEwith moreinterstitial edema (P < 0.0005).
Table IV shows that the cuff area (mean±SE mm2X 10-2)averaged 0.17±0.02 in control lungs, 0.30±0.02 in HPPE, and0.15±0.01 in OAPE. The ratio of cuff area to vascular area waslarger in HPPE (2.26±0.45) than in OAPE(0.45±0.09) or inthe control lungs (0.58±0.08). Both the cuff area and the ratioof cuff area to internal area were greater in HPPE(P < 0.001).There were also evidence of hemorrhage into the cuffs in OAPEbut not in HPPE.
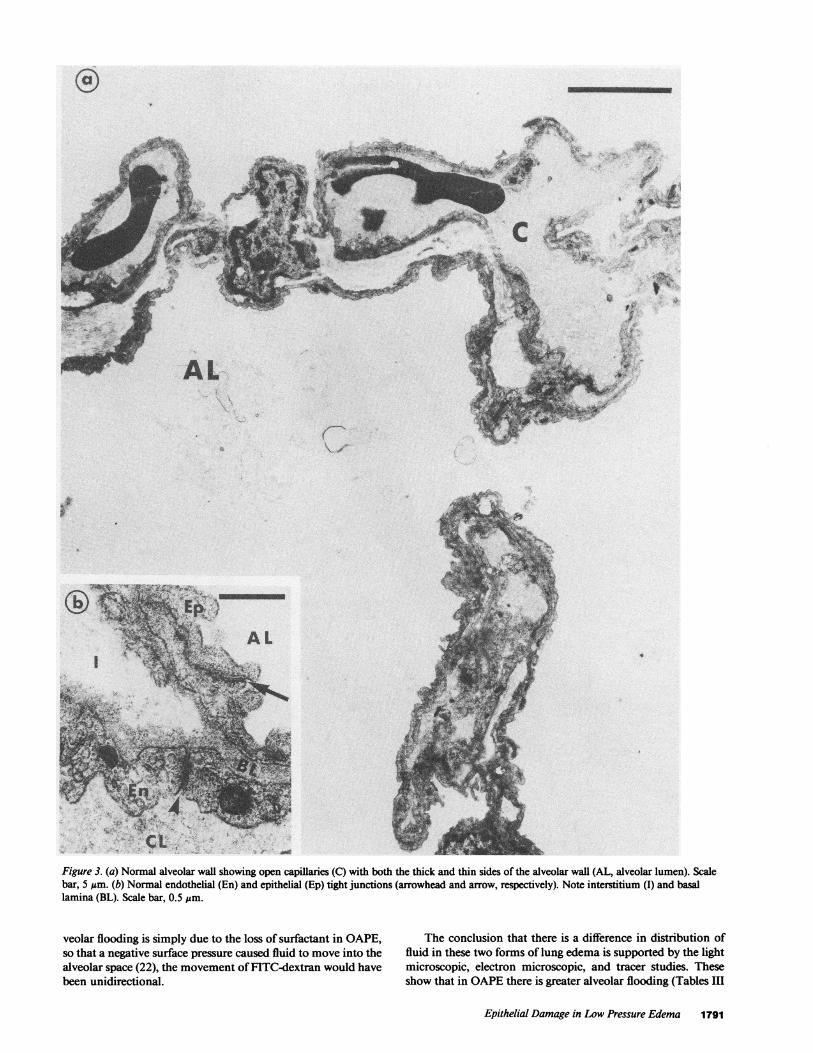
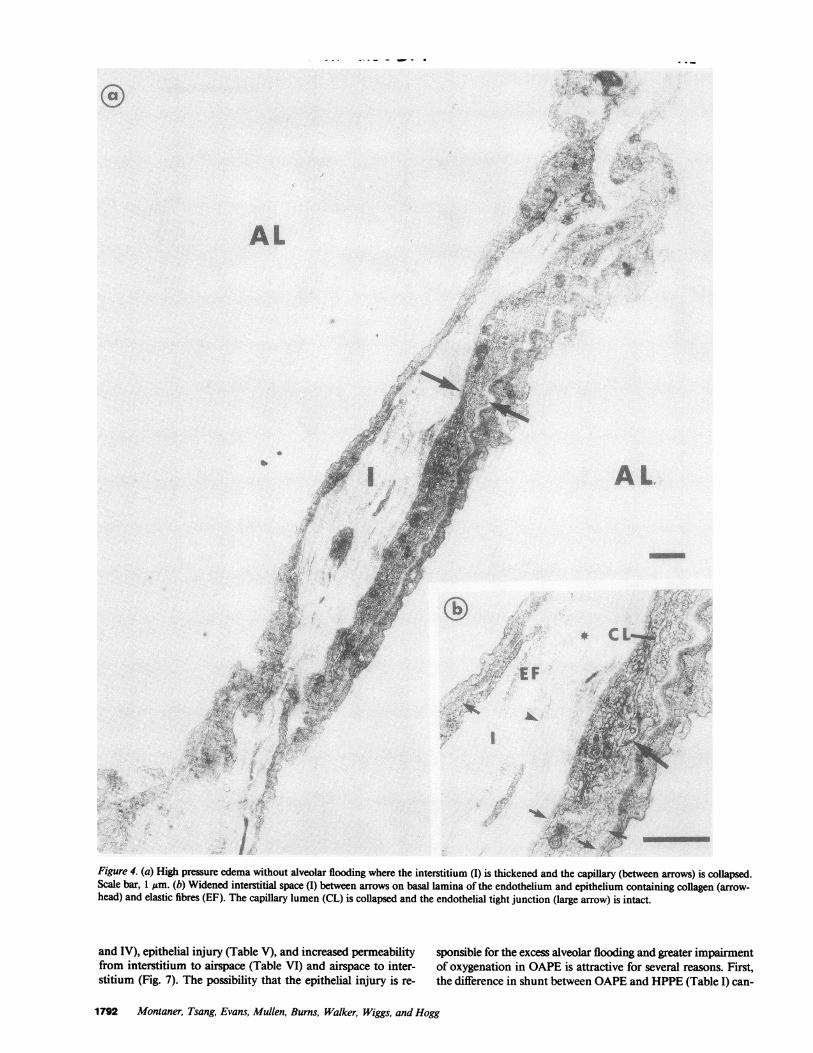
Electron microscopy. Fig. 3, a and b, shows in a normalanimal a patent capillary with a thin interstitial space, and intactepithelial and endothelial junctions (Fig. 3 b). With moderatehigh pressure edema (Fig. 4 a) the capillary is narrowed, theinterstitium is thick (Fig. 4 b), and there is no alveolar flooding.With a similar amount of oleic acid-induced edema, on theother hand, there is alveolar flooding (Fig. 5 a) with a tight junc-tion that appears to be open (Fig. 5 b). Furthermore, there isevidence of disruption of both alveolar epithelium (Fig. 6 a) andendothelium, (Fig. 6 b) in association with polymorphonuclearcell infiltration. The data from oleic acid-induced low pressurepulmonary edema also shows evidence of discharge of the la-mellar bodies of type II cells (Fig. 6 c) and the leakage of fibrin-ogen to form fibrin in the air space (Fig. 6 d).
Table V shows a summary of the electron microscopic data.A total of 910 electron micrographs were examined; 580 of thesewere suitable for grading epithelium and in 526 there was agree-ment between the two observers as to the grade. This provideda contingency coefficient of 90%between the two observers. Ta-ble V shows the number of observations in each of the categoriescompared with the number of observations expected, which areshown in parentheses. In OAPE, the number of observations of
Table I. Physiological Data
Group 1: Control Group II: High pressure edema Group III: Oleic acid-induced edema
Initial Final Initial Final Initial Final
Ppa 16±6 16±6 18±6 43±6*t 15±4 15±4Ppaw 6±3 8±5 7±5 33±7*t 7±2 5±2CO 2.5±0.8 2.0±0.7 2.5±0.4 2.6±0.6 2.4±0.8 1.5±0.3tPVR 4.7±3.2 5.2±1.9 4.3±1.0 3.5± 1.1 t 4.2±2.4 7.6±5.2pH 7.40±0.06 7.46±0.13 7.38±0.04 7.23±0.07*t 7.37±0.02 7.3 i ±0.12*Pco2a 33±6 26±7 35±2 30±6 34±2 34± 14Po2a 533±100 516±91 498±63 270±144*t 510±59 157±189*tSAT 02% 100 100 100 99±4 100 88±13*Qs/Qt 12±8 16±10 19±9 39±15t 13±5 48±29**EVLW 4.5±1.8 8.2±1.9* 8.2±2.3*
* P < 0.05, analysis of variance comparing change between initial and final value edematous groups vs. change in control group except forEVLW, which compares actual values. t P < 0.05, paired t test initial vs. final values within a group.
1788 Montaner, Tsang, Evans, Mullen, Burns, Walker, Wiggs, and Hogg

CONTROL
a
-p
---a
6-
64-5 -
0)
-j3-
2--V
25 50 75 100 125 150 175 200
Regional Blood Flow (ml/min/g dry tissue)
HPPE
225
102 4 6 8Extra Vascular Lung Water (g/g dry tissue)
Figure 2. Shows the amount of extravascular lung water (mean±SE) atdifferent lung heights in the control group (m). High pressure edemagroup (0) and oleic acid edema group (0).
b
,I25 50 75 100 125 150 175 200Regional Blood Flow (ml/min/g dry tissue)
OAPEC
moderate and severe disruption (i.e. grades 2 and 3) exceed theexpected values, with 31 of 108 micrographs (28%) showing ev-idence of damage. This was not true for control animals, whereonly 1.4% of 295 micrographs showed damage, or of the HPPEanimals, where change was found in 2.4% of the 125 observed.Chi-square analysis (1 1) of this data showed greater epithelialdisruption in OAPE(P < 0.0001).
FITC tracer studiesThe data concerning the appearance of tracer in the alveolarspaces are shown in Table VI. The reproducibility of the visualgrading system between the two observers was assessed andshowed a bivariate prediction success of 0.872 and a correctedcontingency coefficient of 88%. The chi-square analysis per-formed in the data showed that the control and HPPEgroups
225 had equivalent degrees of alveolar fluorescence that were sig-nificantly less than the OAPEgroup (P < 0.01).
The appearance of FITC-dextran in the blood after it wasplaced on the lung surface (Fig. 7) shows that oleic acid injectionwas associated with an immediate rise in the plasma concentra-tion of FITC-dextran. However, after this rapid rise the slope oftwo curves are quite similar until the end of the experiment.
Figure 1. (a) Regional blood flows (milliliters per minute per gram ofblood-free dry lung) at different lung heights in the control group.There is no systematic redistribution of regional blood flow during theexperiments. The solid line represents initial regional blood flows andthe dotted line represents final regional blood flows after 2 h. (b) Re-gional blood flows at different lung height before and after edema for-mation in the high pressure pulmonary edema group. The dotted linerepresents final regional blood flows after edema formation at 2 h.There is an increase in blood flow to most regions and a shift in re-gional blood flows away from the dependent regions after edema for-mation. (c) Regional blood flows at different lung height before and af-ter edema formation in the oleic acid-induced low pressure pulmo-nary edema group. The dotted line represents final regional bloodflows after edema formation at 2 h. There is a decrease in blood flow
225 to most regions and no systematic shift of blood flow between regionsafter edema formation. The data points are represented by mean±SE.
Epithelial Damage in Low Pressure Edema 1789
7 -
6-
5-0)
(X) 4-0)c:3-J
3-
2-
1 -
7-
6-
5-0)
cn0) 4
-J3
2-
1
7 -
6-
5-0)
a 4-c
-J3-
2-
1-
I I25 5o 75 100 125 150 175 200
Regionad Blood Flow (ml/min/g dry tissue)
.i
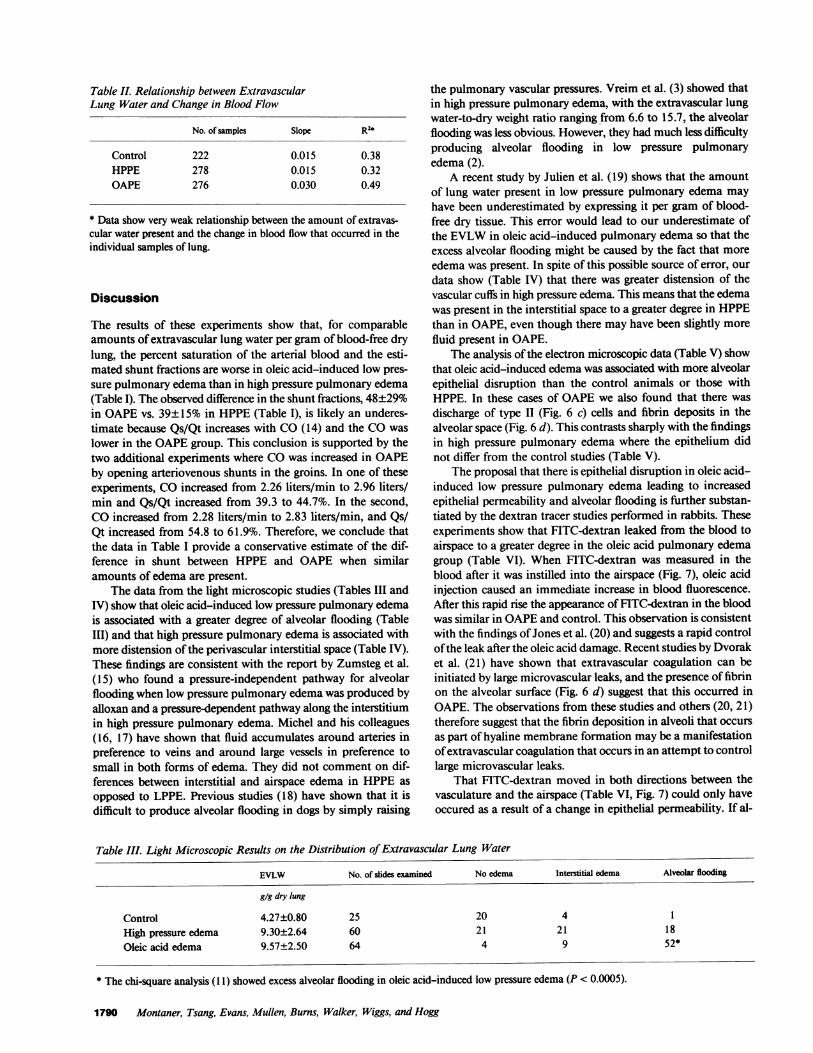
Table II. Relationship between ExtravascularLung Water and Change in Blood Flow
No. of samples Slope R2*
Control 222 0.015 0.38HPPE 278 0.015 0.32OAPE 276 0.030 0.49
* Data show very weak relationship between the amount of extravas-cular water present and the change in blood flow that occurred in theindividual samples of lung.
Discussion
The results of these experiments show that, for comparableamounts of extravascular lung water per gram of blood-free drylung, the percent saturation of the arterial blood and the esti-mated shunt fractions are worse in oleic acid-induced low pres-sure pulmonary edema than in high pressure pulmonary edema(Table I). The observed difference in the shunt fractions, 48±29%in OAPEvs. 39±15% in HPPE(Table I), is likely an underes-timate because Qs/Qt increases with CO(14) and the COwaslower in the OAPEgroup. This conclusion is supported by thetwo additional experiments where COwas increased in OAPEby opening arteriovenous shunts in the groins. In one of theseexperiments, COincreased from 2.26 liters/min to 2.96 liters/min and Qs/Qt increased from 39.3 to 44.7%. In the second,COincreased from 2.28 liters/min to 2.83 liters/min, and Qs/Qt increased from 54.8 to 61.9%. Therefore, we conclude thatthe data in Table I provide a conservative estimate of the dif-ference in shunt between HPPE and OAPE when similaramounts of edema are present.
The data from the light microscopic studies (Tables III andIV) show that oleic acid-induced low pressure pulmonary edemais associated with a greater degree of alveolar flooding (TableIII) and that high pressure pulmonary edema is associated withmore distension of the perivascular interstitial space (Table IV).These findings are consistent with the report by Zumsteg et al.(15) who found a pressure-independent pathway for alveolarflooding when low pressure pulmonary edema was produced byalloxan and a pressure-dependent pathway along the interstitiumin high pressure pulmonary edema. Michel and his colleagues(16, 17) have shown that fluid accumulates around arteries inpreference to veins and around large vessels in preference tosmall in both forms of edema. They did not comment on dif-ferences between interstitial and airspace edema in HPPEasopposed to LPPE. Previous studies (18) have shown that it isdifficult to produce alveolar flooding in dogs by simply raising
the pulmonary vascular pressures. Vreim et al. (3) showed thatin high pressure pulmonary edema, with the extravascular lungwater-to-dry weight ratio ranging from 6.6 to 15.7, the alveolarflooding was less obvious. However, they had much less difficultyproducing alveolar flooding in low pressure pulmonaryedema (2).
A recent study by Julien et al. (19) shows that the amountof lung water present in low pressure pulmonary edema mayhave been underestimated by expressing it per gram of blood-free dry tissue. This error would lead to our underestimate ofthe EVLWin oleic acid-induced pulmonary edema so that theexcess alveolar flooding might be caused by the fact that moreedema was present. In spite of this possible source of error, ourdata show (Table IV) that there was greater distension of thevascular cuffs in high pressure edema. This means that the edemawas present in the interstitial space to a greater degree in HPPEthan in OAPE, even though there may have been slightly morefluid present in OAPE.
The analysis of the electron microscopic data (Table V) showthat oleic acid-induced edema was associated with more alveolarepithelial disruption than the control animals or those withHPPE. In these cases of OAPEwe also found that there wasdischarge of type II (Fig. 6 c) cells and fibrin deposits in thealveolar space (Fig. 6 d). This contrasts sharply with the findingsin high pressure pulmonary edema where the epithelium didnot differ from the control studies (Table V).
The proposal that there is epithelial disruption in oleic acid-induced low pressure pulmonary edema leading to increasedepithelial permeability and alveolar flooding is further substan-tiated by the dextran tracer studies performed in rabbits. Theseexperiments show that FITC-dextran leaked from the blood toairspace to a greater degree in the oleic acid pulmonary edemagroup (Table VI). When FITC-dextran was measured in theblood after it was instilled into the airspace (Fig. 7), oleic acidinjection caused an immediate increase in blood fluorescence.After this rapid rise the appearance of FITC-dextran in the bloodwas similar in OAPEand control. This observation is consistentwith the findings of Jones et al. (20) and suggests a rapid controlof the leak after the oleic acid damage. Recent studies by Dvoraket al. (21) have shown that extravascular coagulation can beinitiated by large microvascular leaks, and the presence of fibrinon the alveolar surface (Fig. 6 d) suggest that this occurred inOAPE. The observations from these studies and others (20, 2 1)therefore suggest that the fibrin deposition in alveoli that occursas part of hyaline membrane formation may be a manifestationof extravascular coagulation that occurs in an attempt to controllarge microvascular leaks.
That FITC-dextran moved in both directions between thevasculature and the airspace (Table VI, Fig. 7) could only haveoccured as a result of a change in epithelial permeability. If al-
Table III. Light Microscopic Results on the Distribution of Extravascular Lung Water
EVLW No. of slides examined No edema Interstitial edema Alveolar flooding
g/g dry lung
Control 4.27±0.80 25 20 4 1
High pressure edema 9.30±2.64 60 21 21 18Oleic acid edema 9.57±2.50 64 4 9 52*
* The chi-square analysis (11) showed excess alveolar flooding in oleic acid-induced low pressure edema (P < 0.0005).
1790 Montaner, Tsang, Evans, Mullen, Burns, Walker, Wiggs, and Hogg
C4.a
4-sr ,fb
_
'3
.
r'V
5
. PIC v,14 itA1q44t '4~ !
C'1.I-.. R. a
Figure 3. (a) Normal alveolar wall showing open capillaries (C) with both the thick and thin sides of the alveolar wall (AL, alveolar lumen). Scalebar, 5 um. (b) Normal endothelial (En) and epithelial (Ep) tight junctions (arrowhead and arrow, respectively). Note interstitium (I) and basallamina (BL). Scale bar, 0.5 Am.
veolar flooding is simply due to the loss of surfactant in OAPE,so that a negative surface pressure caused fluid to move into thealveolar space (22), the movement of FITC-dextran would havebeen unidirectional.
The conclusion that there is a difference in distribution offluid in these two forms of lung edema is supported by the lightmicroscopic, electron microscopic, and tracer studies. Theseshow that in OAPEthere is greater alveolar flooding (Tables III
Epithelial Damage in Low Pressure Edema 1791
,. -. r
.._ *S
X :k^;
.. .;,, g
s ,^<3t 4e.. ''it r tX
,9 ;t .,64}'
,gyALI
b11
. .:*'1
'Ity .
AL
EF
l
I/Figure 4. (a) High pressure edema without alveolar flooding where the interstitium (I) is thickened and the capillary (between arrows) is collapsed.Scale bar, 1 Aum. (b) Widened interstitial space (I) between arrows on basal lamina of the endothelium and epithelium containing collagen (arrow-head) and elastic fibres (EF). The capillary lumen (CL) is collapsed and the endothelial tight junction (large arrow) is intact.
and IV), epithelial injury (Table V), and increased permeabilityfrom interstitium to airspace (Table VI) and airspace to inter-stitium (Fig. 7). The possibility that the epithelial injury is re-
sponsible for the excess alveolar flooding and greater impairmentof oxygenation in OAPEis attractive for several reasons. First,the difference in shunt between OAPEand HPPE(Table I) can-
1792 Montaner, Tsang, Evans, Mullen, Burns, Walker, Wiggs, and Hogg
.^;

eof 4.
4k-,. v.
AL
A'
Figure 5. (a) Oleic acid-induced low pressure edema with alveolar flooding showing fluid and marcrophages in the alveolar lumen (AL). Scale bar,5 gm. (b) Alveolar wall with a tight junction (arrow) between epithelial cells that appear to be open (Ep 1 and Ep 2). BL, basal lamina; scale bar,0.1 Inm.
not be explained by differences in the regional blood flow. The mulated in the region in either OAPEor HPPE(Table II). Thischange in regional blood flow after edema formation was not implies that the difference in oxygenation in the two forms ofaffected by the amount of extravascular lung water that accu- edema is more likely due to the difference in airspace flooding
Epithelial Damage in Low Pressure Edema 1793

L.*
0
i--
Figure 6. (a) Oleic acid-induced edema. Note a polymorphonuclearcell (PMN) entering the alveolar lumen (AL) through an epithelial dis-ruption (Ep 1 and Ep 2). Scale bar, I Mm. (b) Disruption of the endo-thelium (note arrows outlining space between endothelial cells En 1
(Table III). An increase in airspace fluid would lead to increasedalveolar instability and collapse (23), which would reduce thesurface area available for gas exchange. Furthermore, as oxygendissolves poorly in water and 02 diffuses 300,000 times slowerthrough liquid than gas (24), the oxygen content in the floodedalveoli would be rapidly depleted unless the fluid was in close
and En 2) by a polymorphonuclear cell (PMN). BL, basal lamina. I,interstitium; scale bar, 0.1 Am. (c) Type II cells with discharging lamel-lar body (LB). Scale bar, 1 Am. (d) Fibrin (F) deposited in the alveolarlumen (AL). Scale bar, 1 Am.
and constant contact with a gaseous reservoir. In addition, thepressure perfusing the vascular bed is lower in OAPE, so thatcapillary blood volume will be smaller and diffusing capacitywill be lower than the HPPE(25).
Dantzker (26) has analyzed the ventilation-perfusion (V/Q)distributions in patients with adult respiratory distress syndrome
1794 Montaner, Tsang, Evans, Mullen, Burns, Walker, Wiggs, and Hogg

Table IV. Light Microscopic Results on the Distributionof Lung Water Around the Vascular Cuffs
Control HPPE OAPE
No. of animals 1 2 2No. of vessels 220 871 745Cuff area±SE
(XI0 2 mm2) 0.17±0.02 0.30±0.02* 0.15±0.01Cuff/internal area 0.58±0.08 2.26±0.45* 0.45±0.09Intracuff hemorrhage 0 3 30EVLW(mean±SD) 4.27±0.80 9.30±2.64 9.57±2.50
* The analyses of variance showed larger cuff areas and a greater cuffto internal vascular area ratio in HPPE(P < 0.001).
(ARDS) by inert gas technique and reported that the gas exchangeunits under such conditions exist either as normal units or unitswith very low V/Q ratio. Assuming that oleic acid-inducededema is a realistic model of clinical ARDS, our data suggestthat the units with very low V/Q ratios might be accounted forby the excess flooding of alveoli. The fact that gas exchange wasless effected in HPPEcould be explained by the fact that thefluid was in the interstitium rather than the airspace, and in-creased thickness of the interstitium does not significantly impairoxygen diffusion (27).
The data reported here are consistent with the results of Nobleand his associates (28, 29), who have shown that alveolar to
Table V. Electron Microscopic Results
Number of samples
Group Grade 1* Grade 2 Grade 3 Total
Control 291 (275)t 2 (5) 2 (5) 295OAPE 77 (101) 6 (2) 25 (5)§ 108HPPE 122 (114) 1 (2) 0 (7) 125Total 490 9 27 526
* Grade I, normal epithelium; grade II, epithelial abnormality; gradeIII, epithelial disruption (see Methods for further description).t The numbers in parentheses represent the number of samples ex-pected in each category if they were randomly distributed among thethree groups.§ Chi-square analysis showed greater epithelial disruption in OAPE(P< 0.0001).
Table VI. FITC Dextran in Alveolar Space
Number of samples
Control HPPE OAPE
None 15 13 61-25 5 7 526-50% 0 0 651-75% 0 0 376-100% 0 0 0Present/total 5/20 7/20 14/20*
400-
370-
.c 340-
(0C, 310-
SK 280-
t 20z 90oh
oin
Zw 220
as t90~
0
E
130 -
.--.
x Xx
Oleic acid(0.1 mg/kg i.v.)
A\ * ^~~~~~
0 tS 30 4 75 90Time (min)
Figure 7. Shows the mean change in plasma fluorescence caused bythe instillation of FITC-labeled dextran down the airway at time zero
in two groups of animals. When oleic acid was injected intravenouslyin one group of animals there was a sharp rise in plasma fluoresence,which indicated a rapid increase in permeability.
arterial (A-a) gradient remains low in interstitial edema but in-creases markedly when alveolar edema develops. This increasein alveolar to arterial (A-a) gradient was found to be out ofproportion to the increase in the amounts of lung water presentwhen interstitial edema progressed to alveolar flooding. The ob-servation that abnormal gas exchange correlated better with theamount of alveolar flooding than the amount of edema presentcould help to explain the data of Brigham et al. (30). They foundthat the impairment of oxygenation correlated poorly with theamount of extravascular lung water. The fact that the method-ology they used would not allow them to determine whether theexcess water was in the airspace or interstitium could explaintheir finding.
These results show that the epithelial injury occurs in OAPEand that it represents a critical difference between lungs withOAPEand HPPEwhen similar amounts of edema are present.This epithelial disruption leads to an increased number of fluid-filled alveoli which have preserved regional blood flow resultingin regions with very low V/Q. The lack of epithelial disruptionin HPPEallows more of the extravascular lung water to be storedin the interstitium, where it has less effect on gas exchange.
Acknowledgments
The authors thank E. M. Baile and A. MacKenzie for their technicalassistance and Lee Kowk for her help in preparing the manuscript.
The work was supported by the British Columbia Heart Foundationand the Medical Research Council (MRC) of Canada (grant 4219 to Dr.Montaner). Dr. Evans and Dr. Walker were supported by the BritishColumbia Lung Association, and Dr. Mullen by a postdoctoral Fellowshipfrom the MRCof Canada. Dr. Tsang was supported by the B. C. HealthCare Research Foundation.
References
1. Staub, N. C., H. Nagano, and M. L. Pearce. 1967. Pulmonaryedema in dogs, especially the sequence of fluid accumulation in the lungs.J. Appl. Physiol. 22:227-240.
2. Vreim, C. E., and N. C. Staub. 1976. Protein composition of lungfluids in acute alloxan edema in dogs. Am. J. Physiol. 230:376-379.
Epithelial Damage in Low Pressure Edema 1795
* Chi-square analysis showed significantly greater alveolar fluorescencein the OAPEgroup compared with both the control and HPPEgroups(P= 0.01).
-- I I I Ies 120 135 150

3. Vreim, C. E., P. D. Snashall, and N. C. Staub. 1976. Protein com-position of lung fluids in anaesthetized dogs with acute cardiogenic edema.Am. J. Physiol. 231:1466-1469.
4. Staub, N. C. Pulmonary edema. 1974. Physiol. Rev. 54:678-721.5. Schoene, R. B., H. T. Robertson, D. R. Thorning, S. C. Spring-
meyer, M. P. Hlastala, and I. W. Cheney. 1984. Pathophysiological pat-terns of resolution from acute oleic acid lung injury in the dog. J. Appl.Physiol. 56(2):472-48 1.
6. Hogg, J. C., P. Holst, P. Corry, F. Ruff, E. Honsley, and E. Morris.1971. Effect of regional lung expansion and body position on pulmonaryperfusion in dogs. J. Appl. Physiol. 31:97-101.
7. Derks, C. M., and D. Jacobovitz-Derks. 1977. Embolic pneu-mopathy induced by oleic acid. Am. J. Pathol. 87:143-151.
8. Gray, S. J., and K. Sperling. 1950. The tagging of red cells andplasma protein with radioactive chromium. J. Clin. Invest. 29:1604-1613.
9. McIlroy, M. B. 1965. Pulmonary Shunts Handbook of Physiology,Section III, Vol. 2. W. 0. Lenn and H. Rahn, editors. American Phys-iological Society, Washington, D.C. 65:1519-1524.
10. Baile, E. M., P. D. Pare, R. W. Dahlby, and J. C. Hogg. 1979.Regional distribution of extra vascular lung water and hematocrit in thelung. J. Appl. Physiol. 46:937-942.
11. Sachs, L. 1982. Applied Statistics: A Handbook of Technique.Springer Series in Statistics, NewYork (English translation). 6:462-493.
12. Spur, R. A. 1969. A low viscosity epoxy resin embedding mediumfor electron microscopy. J. Ultrastruct. Res. 26:31-43.
13. Takada, K., M. Yamamoto, and S. Masada. 1978. Evidence forthe pulmonary absorption of fluorescent labelled macromolecular com-pounds. J. Pharm. Dyn. 1:281-287.
14. Lynch, J. P., J. G. Mhyre, and D. R. Dantzker. 1979. Influenceof cardiac output on the intrapulmonary shunt. J. Appl. Physiol. 46:315-321.
15. Zemsteg, T. A., A. M. Havill, and M. H. Gee. 1982. Relationshipsamong lung extravascular fluid components with alveolar flooding. J.Appl. Physiol. 53:267-271.
16. Michel, R. P., T. S. H. Akinn, T. T. Smith, and R. S. Paulsen.1983. Quantitative morphology of permeability edema in dogs inducedby napthylthiouria. Lab. Invest. 149:412-419.
17. Michel, R. P., T. T. Smith, S. Meterissian, and R. S. Paulsen.
1984. Distribution of interstitial fluid in hydrostatic lung edema: a mor-phometric study. Am. Rev. Respir. Dis. 129:A347 (Abstr.)
18. Guyton, A. C., and A. W. Lindsey. 1959. Effect of elevated leftatrial pressure and decreased plasma protein concentration on the de-velopment of pulmonary edema. Circ. Res. 7:649-657.
19. Julien, M., M. R. Flick, J. M. Hoeffel, and J. F. Murray. 1984.Accurate reference measurement of postmortem lung water. J. Appl.Physiol. 56:248-253.
20. Jones, J. G., B. D. Minty, J. M. Beeley, D. Royston, J. Crow,and R. F. Grossman. 1982. Pulmonary epithelial permeability is im-mediately increased after embolization with oleic acid but not with neutralfat. Thorax. 37:169-174.
21. Dvorak, H. F., D. R. Senger, A. M. Dvorak, V. S. Harvey, andJ. McDonagh. 1985. Regulation of extravascular coagulation by micro-vascular permeability. Science (Wash. DC). 227:1059-1061.
22. Avery, M. E., and J. Mead. 1959. Surface properties in relationto atelectasis and hyaline membrane disease. Am. J. Dis. Child. 97:517-523.
23. Bachofen, H., P. Gehr, and E. R. Weibel. 1979. Alteration ofmechanical properties and morphology in excised rabbit lungs rinsedwith a detergent. J. Appl. Physiol. 47:1002-1010.
24. Weibel, E. R. 1984. The Pathway for Oxygen: Structure andFunction in the Mammalian Respiratory System. Harvard UniversityPress, Cambridge. 1: 12-13.
25. Bachofen, H., J. Weber, D. Wangensteen, and E. R. Weibel.1983. Morphometric estimates of diffusing capacity in lungs fixed underZone II and Zone III conditions. Respir. Physiol. 52:41-52.
26. Dantzker, D. R., J. P. Lyuch, and J. G. Weg. 1980. Depressionof cardiac output is a mechanismn of shunt reduction in the therapy ofacute respiratory failure. Chest. 77:636-642.
27. McHardy, G. J. R. 1972. Diffusing capacity and pulmonary gasexchange. Br. J. Dis. Chest. 66:1-20.
28. Noble, W. H., K. Kovacs, and J. C. Kay. 1974. Fine structurechanges in hemodynamic pulmonary edema. Can. Anaesth. Soc. J. 21:275-284.
29. Noble, W. H., J. C. Kay, and J. Obdrzalek. 1975. Lung mechanicsin hypervolemic pulmonary edema. J. Appl. Physiol. 38:681-687.
30. Brigham, K. L., K. Kariman, T. Harris, J. R. Snapper, G. R.Bernard, and S. L. Young. 1983. Correlation of oxygenation with vascularpermeability-surface area but not with lung water in humans with acuterespiratory failure and pulmonary edema. J. Clin. Invest. 72:339-349.
1796 Montaner, Tsang, Evans, Mullen, Burns, Walker, Wiggs, and Hogg