Aluminum Content in Cars Advancing Growth - Summary … · Peugeot 2008 (A94) Peugeot 308 (T9)...
13
Advancing Growth Aluminum Content in Cars - Summary Report - - Public version - Prepared Exclusively for: June 2016
Transcript of Aluminum Content in Cars Advancing Growth - Summary … · Peugeot 2008 (A94) Peugeot 308 (T9)...
Advancing Growth
Aluminum Content in Cars
- Summary Report -- Public version -
Prepared Exclusively for:
June 2016
CONFIDENTIAL - © DUCKER WORLDWIDE
Introduction: Vehicle Scope
Extrapolation
Combined Sample
Modelling Method
3
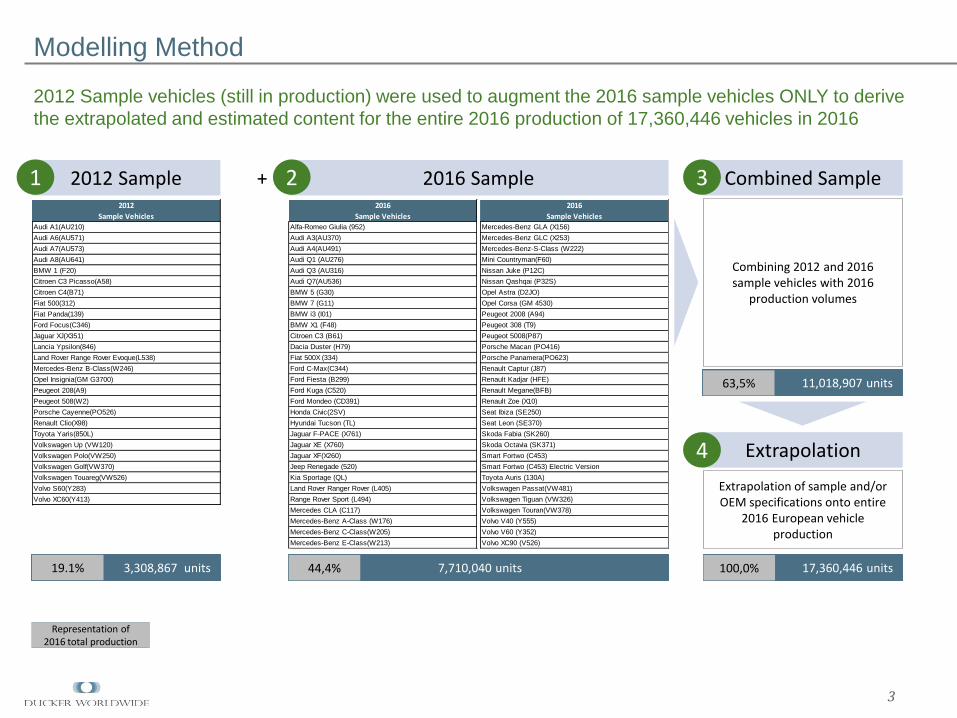
2012 Sample 2016 Sample+
Combining 2012 and 2016 sample vehicles with 2016
production volumes
3,308,867 units19.1% 7,710,040 units44,4%
11,018,907 units63,5%
Representation of 2016 total production
Extrapolation of sample and/or OEM specifications onto entire
2016 European vehicle production
1 2 3
4
17,360,446 units100,0%
2012 Sample vehicles (still in production) were used to augment the 2016 sample vehicles ONLY to derive
the extrapolated and estimated content for the entire 2016 production of 17,360,446 vehicles in 2016
2012
Sample Vehicles
Audi A1(AU210)
Audi A6(AU571)
Audi A7(AU573)
Audi A8(AU641)
BMW 1 (F20)
Citroen C3 Picasso(A58)
Citroen C4(B71)
Fiat 500(312)
Fiat Panda(139)
Ford Focus(C346)
Jaguar XJ(X351)
Lancia Ypsilon(846)
Land Rover Range Rover Evoque(L538)
Mercedes-Benz B-Class(W246)
Opel Insignia(GM G3700)
Peugeot 208(A9)
Peugeot 508(W2)
Porsche Cayenne(PO526)
Renault Clio(X98)
Toyota Yaris(850L)
Volkswagen Up (VW120)
Volkswagen Polo(VW250)
Volkswagen Golf(VW370)
Volkswagen Touareg(VW526)
Volvo S60(Y283)
Volvo XC60(Y413)
2016
Sample Vehicles
Alfa-Romeo Giulia (952)
Audi A3(AU370)
Audi A4(AU491)
Audi Q1 (AU276)
Audi Q3 (AU316)
Audi Q7(AU536)
BMW 5 (G30)
BMW 7 (G11)
BMW i3 (I01)
BMW X1 (F48)
Citroen C3 (B61)
Dacia Duster (H79)
Fiat 500X (334)
Ford C-Max(C344)
Ford Fiesta (B299)
Ford Kuga (C520)
Ford Mondeo (CD391)
Honda Civic(2SV)
Hyundai Tucson (TL)
Jaguar F-PACE (X761)
Jaguar XE (X760)
Jaguar XF(X260)
Jeep Renegade (520)
Kia Sportage (QL)
Land Rover Ranger Rover (L405)
Range Rover Sport (L494)
Mercedes CLA (C117)
Mercedes-Benz A-Class (W176)
Mercedes-Benz C-Class(W205)
Mercedes-Benz E-Class(W213)
2016
Sample Vehicles
Mercedes-Benz GLA (X156)
Mercedes-Benz GLC (X253)
Mercedes-Benz-S-Class (W222)
Mini Countryman(F60)
Nissan Juke (P12C)
Nissan Qashqai (P32S)
Opel Astra (D2JO)
Opel Corsa (GM 4530)
Peugeot 2008 (A94)
Peugeot 308 (T9)
Peugeot 5008(P87)
Porsche Macan (PO416)
Porsche Panamera(PO623)
Renault Captur (J87)
Renault Kadjar (HFE)
Renault Megane(BFB)
Renault Zoe (X10)
Seat Ibiza (SE250)
Seat Leon (SE370)
Skoda Fabia (SK260)
Skoda Octavia (SK371)
Smart Fortwo (C453)
Smart Fortwo (C453) Electric Version
Toyota Auris (130A)
Volkswagen Passat(VW481)
Volkswagen Tiguan (VW326)
Volkswagen Touran(VW378)
Volvo V40 (Y555)
Volvo V60 (Y352)
Volvo XC90 (V526)

Product group and component overview
4
Overview of product groups and components
Engine Chassis & Suspension Trim & Interior Heat Transfer Body Structures Body Closures
Engine Block Suspension arms Sunroofs Heat Exchangers Complete Body Structure Hoods
Heads Knuckles Roof Rail Heat Sinks Shock Towers Fenders
Pistons Subframes Glass Surrounds Heat Shields Rails Boots
Mounts Radiator Support Front Doors
Anti-Vibration Structural Members Rear Doors
Other Engine IP-Structures Window Frames
Floor Group Door Intrusion Beams
Body Side Panels Roofs
Other
Steering Wheels & Brakes DrivelineCrash Management
Systems
Steering Rack Wheels Transmission Case Crash Boxes
Brakes Transfer Case Bumpers
Other Other Transmission
CONFIDENTIAL - © DUCKER WORLDWIDE
2016 Aluminum Content
6
Total European Car Production – Component Weight Distribution
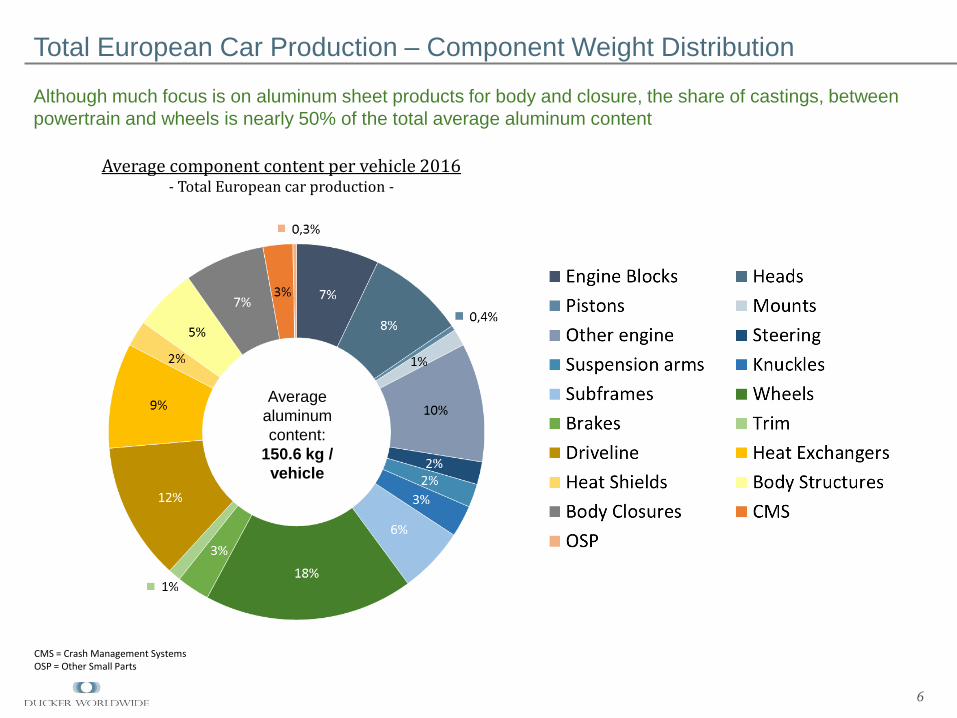
Although much focus is on aluminum sheet products for body and closure, the share of castings, between
powertrain and wheels is nearly 50% of the total average aluminum content
Average component content per vehicle 2016- Total European car production -
Average
aluminum
content:
150.6 kg /
vehicle
CMS = Crash Management Systems OSP = Other Small Parts
Average Aluminum Content
7
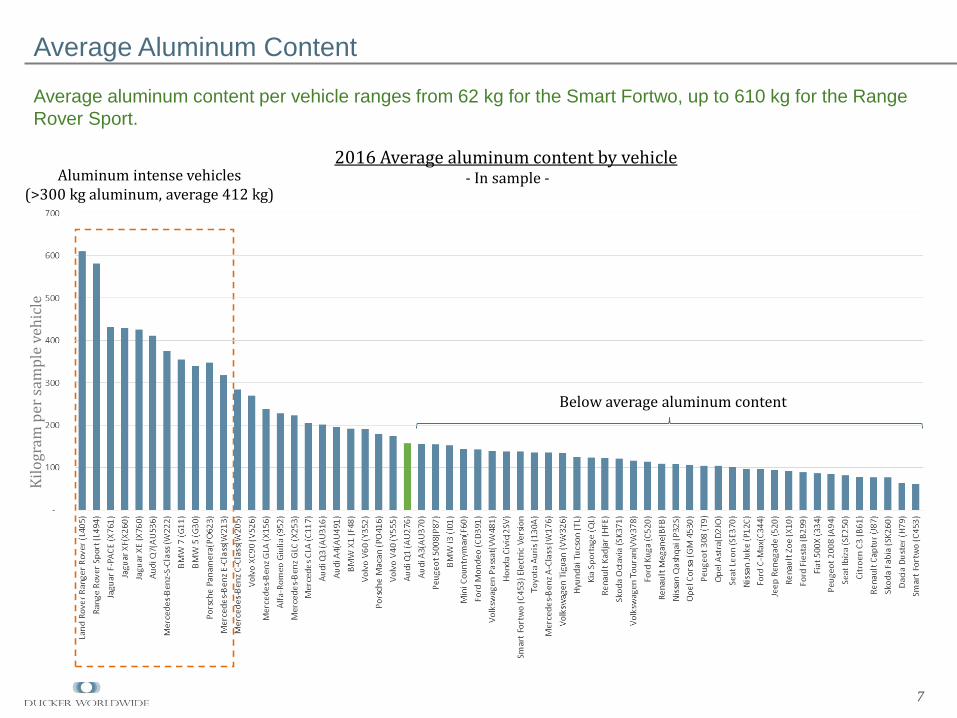
Average aluminum content per vehicle ranges from 62 kg for the Smart Fortwo, up to 610 kg for the Range
Rover Sport.
Aluminum intense vehicles(>300 kg aluminum, average 412 kg)
2016 Average aluminum content by vehicle- In sample -
Below average aluminum content
Kil
ogr
am p
er s
amp
le v
ehic
le
8
Total Production Component Comparison by Segment
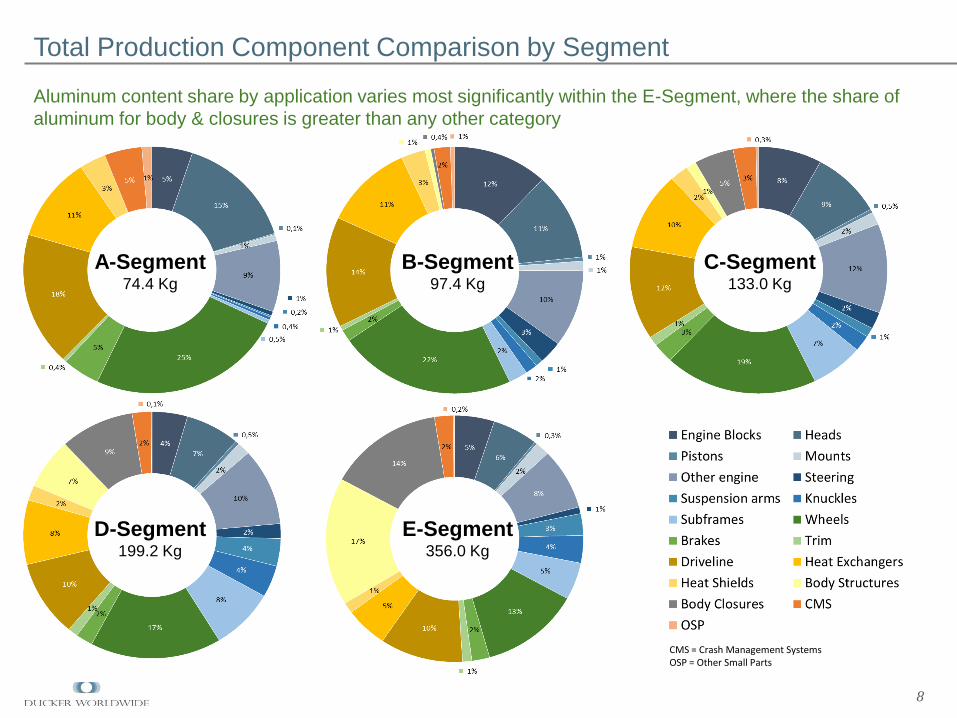
A-Segment74.4 Kg
B-Segment97.4 Kg
C-Segment133.0 Kg
D-Segment199.2 Kg
E-Segment356.0 Kg
Aluminum content share by application varies most significantly within the E-Segment, where the share of
aluminum for body & closures is greater than any other category
CMS = Crash Management Systems OSP = Other Small Parts
Product Form Analysis – Total Market
9
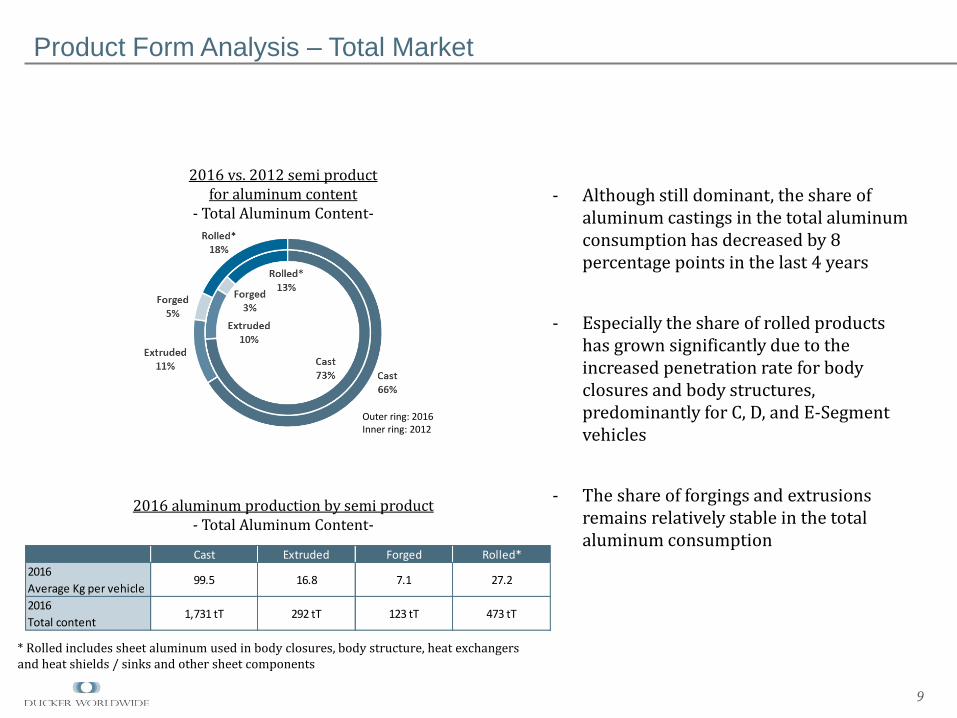
2016 vs. 2012 semi productfor aluminum content
- Total Aluminum Content-
Outer ring: 2016Inner ring: 2012
2016 aluminum production by semi product - Total Aluminum Content-
- Although still dominant, the share of aluminum castings in the total aluminum consumption has decreased by 8 percentage points in the last 4 years
- Especially the share of rolled products has grown significantly due to the increased penetration rate for body closures and body structures, predominantly for C, D, and E-Segment vehicles
- The share of forgings and extrusions remains relatively stable in the total aluminum consumption
Cast Extruded Forged Rolled*
2016
Average Kg per vehicle99.5 16.8 7.1 27.2
2016
Total content1,731 tT 292 tT 123 tT 473 tT
* Rolled includes sheet aluminum used in body closures, body structure, heat exchangers and heat shields / sinks and other sheet components
CONFIDENTIAL - © DUCKER WORLDWIDE
Future Aluminum Use
11
2020 semi productsfor aluminum content
- Total Content -
2020 aluminum production by semi products- Total Production -
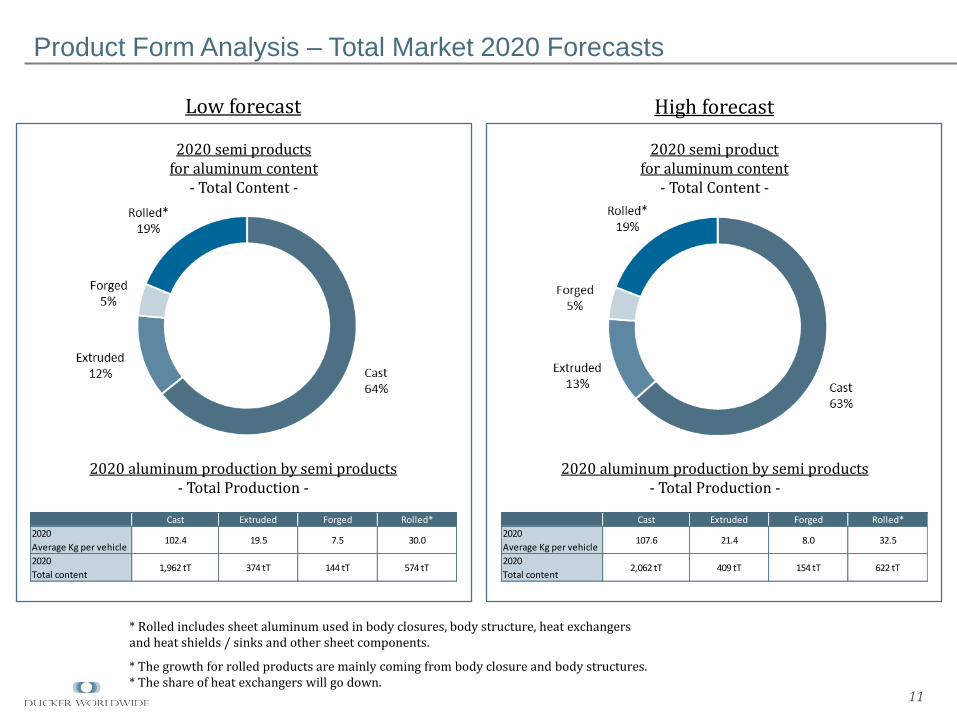
Product Form Analysis – Total Market 2020 Forecasts
2020 semi productfor aluminum content
- Total Content -
2020 aluminum production by semi products- Total Production -
High forecastLow forecast
Cast Extruded Forged Rolled*
2020
Average Kg per vehicle107.6 21.4 8.0 32.5
2020
Total content2,062 tT 409 tT 154 tT 622 tT
Cast Extruded Forged Rolled*
2020
Average Kg per vehicle102.4 19.5 7.5 30.0
2020
Total content1,962 tT 374 tT 144 tT 574 tT
* Rolled includes sheet aluminum used in body closures, body structure, heat exchangers and heat shields / sinks and other sheet components.
* The growth for rolled products are mainly coming from body closure and body structures. * The share of heat exchangers will go down.
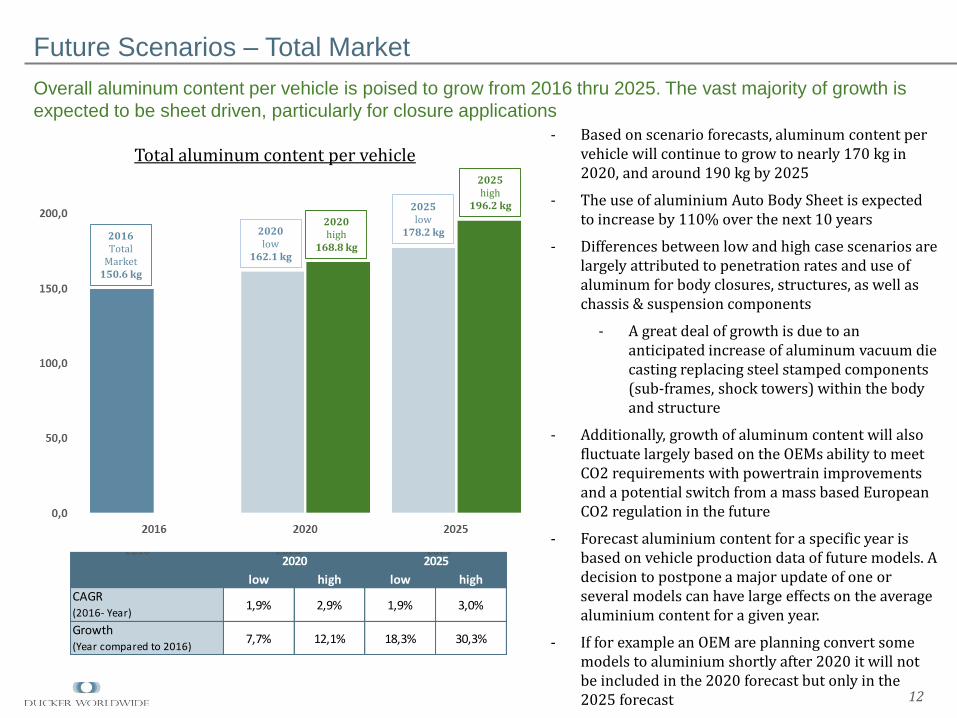
Future Scenarios – Total Market
12
Overall aluminum content per vehicle is poised to grow from 2016 thru 2025. The vast majority of growth is
expected to be sheet driven, particularly for closure applications
Total aluminum content per vehicle
2016 Total
Market150.6 kg
2020 low
162.1 kg
2020 high
168.8 kg
2025 low
178.2 kg
2025 high
196.2 kg
low high low high
CAGR(2016- Year)
1,9% 2,9% 1,9% 3,0%
Growth(Year compared to 2016)
7,7% 12,1% 18,3% 30,3%
202520202016 2020 2025
- Based on scenario forecasts, aluminum content per vehicle will continue to grow to nearly 170 kg in 2020, and around 190 kg by 2025
- The use of aluminium Auto Body Sheet is expected to increase by 110% over the next 10 years
- Differences between low and high case scenarios are largely attributed to penetration rates and use of aluminum for body closures, structures, as well as chassis & suspension components
- A great deal of growth is due to an anticipated increase of aluminum vacuum die casting replacing steel stamped components (sub-frames, shock towers) within the body and structure
- Additionally, growth of aluminum content will also fluctuate largely based on the OEMs ability to meet CO2 requirements with powertrain improvements and a potential switch from a mass based European CO2 regulation in the future
- Forecast aluminium content for a specific year is based on vehicle production data of future models. A decision to postpone a major update of one or several models can have large effects on the average aluminium content for a given year.
- If for example an OEM are planning convert some models to aluminium shortly after 2020 it will not be included in the 2020 forecast but only in the 2025 forecast
This presentation was prepared by Ducker Worldwide LLC. Opinions and estimates constitute judgment as of the date of this materialand are subject to change without notice. Any interpretations derived from this document are the sole responsibility of the client.Reproduction without the explicit consent of Ducker Worldwide LLC is strictly prohibited.
Ducker Worldwide, a premier consulting and research firm, is driven to help its clients achieve their most ambitious growth goals. Custom market intelligence, strategic consulting and transaction advisory services are delivered by fully-engaged Ducker principals and a diverse team of global
talent. With exclusive access to industry leaders and opportunities, Ducker applies robust analytics and critical thinking to every engagement, delivering unique, fact-based solutions for our clients – solutions which produce confident decisions to advance growth. Ducker is headquartered in Troy, Mich., with offices around the world, including Paris, Berlin, Bangalore, Shanghai and London. Founded by William H. Ducker in 1961; Ducker
celebrates over 50 years in business. For more information, go to www.ducker.com.
13
Proven. Wisdom. Results. Trusted Since 1961
Your contacts: Hélène Wagnies, Principal Wouter Vogelaar, Project Manager
[email protected] [email protected]: +49 30 92 10 16 64 Tel: +49 30 92 10 16 69
Jochen Kemnitz, Managing Principal Abey Abraham, [email protected] [email protected]: +33 1 46 99 59 60 Tel: +1 248 644 0086