Alumina Limited
104
The transformation of Alumina Limited Annual Report 2016
Transcript of Alumina Limited

The transformation of Alumina Limited
Annual Report2016

Alumina Limited has elected to release its 2016 Corporate Governance Statement only on the Company website at: www.aluminalimited.com/governance
At a Glance 02
Chairman and Chief Executive Officer’s report 05
Sustainability 1 1
Director’s Report 1 4
Operating and Financial Review 1 9
Letter by Chair of Compensation Committee 34
Remuneration Report 35
Financial Report 60
Shareholder Information 98
Financial History 100

Alumina Limited has renegotiated its joint venture agreement with Alcoa and has emerged more autonomous, more flexible and stronger than ever.
Alumina will continue to enjoy the benefits of that partnership, with fresh potential to forge an exciting future as we unlock significant value and opportunities for our business, our people and our shareholders.
1

Lower average realised alumina prices and charges associated with the continuing portfolio restructuring and repositioning, resulted in a reduction of the overall operating performance of AWAC and negatively impacted Alumina Limited’s results for the year. Whilst portfolio restructuring results in additional costs to AWAC, these actions are necessary to strengthen its competitive position. In 2016 Alumina Limited (Alumina) recorded a net loss after tax of $30.2 million compared to a net profit of $88.3 million in 2015. In context, the Company would have made a net profit of $84.7 million (2015: $258.2 million) excluding significant item.
Alumina Limited is a leading Australian company listed on the Australian Securities Exchange (ASX) and trades in the US on the OTCQX market. We invest worldwide in bauxite mining, alumina refining and selected aluminium smelting operations through our 40% ownership of Alcoa World Alumina and Chemicals (AWAC).
Our partner, Alcoa Corporation (Alcoa), owns the remaining 60% of AWAC, and is the manager. The AWAC joint venture was formed in 1995 and our relationship with Alcoa dates back to 1961.
Alumina Limited represents a unique opportunity for a pure investment in AWAC, one of the world’s largest bauxite and alumina producers.
In 2016 AWAC recorded a net profit after tax of $49.0 million compared to a net profit after tax of $318.2 million in 2015. In both years, AWAC’s results were affected by one-off significant items related to the restructuring and repositioning of AWAC’s portfolio. AWAC’s EBITDA, excluding significant items declined by $607.3 million to $757.2 million. Cash from operations was also affected by significant items as well as timing differences, such as tax payments and movements in working capital. Adjusted for these items, operating cash flow improvement would be more in line with EBITDA growth.
The origins of the Alcoa Worldwide Alumina and Chemicals (AWAC) partnership between Alcoa Inc. and WMC Limited (now Alumina Limited) began in the early 1960’s following the discovery of bauxite deposits and other resources by WMC Limited and two other Australian companies. Alcoa Inc. was invited to join the project to provide technology, aluminium expertise and finance.
Over the following years the venture grew to include refineries and smelter interests as the partners sought to take opportunities to expand the business. By 1990, WMC Limited’s interests in Alcoa of Australia had grown to 48.25% through acquiring the minority interests of other participants, other than Alcoa.
In July 1994, WMC decided to expand this interest as a worldwide bauxite, alumina and alumina-based chemicals enterprise.
WMC Limited and Alcoa Inc. combined their respective bauxite, alumina and alumina-based chemicals businesses and investments and some selected smelting operations to create Alcoa World Alumina and Chemicals (AWAC) in January 1995.
Following the separation of Alcoa Inc. into Alcoa Corporation and Arconic Inc., on 1 November 2016, Alcoa Corporation replaces Alcoa Inc. as Alumina’s joint venture partner in the AWAC joint venture.
The completion of the separation also saw changes to the joint venture agreements which are intended to align more closely the partners’ interests in AWAC, while establishing greater strategic flexibility and autonomy for both partners.
AT A glance
AWAC – A GLOBAL business
2

$(30.2)MNET LOSS AFTER TAX US$30.2 MILLION (2015: NET PROFIT AFTER TAX: US$88.3 MILLION)
$232.8MCASH RECEIPTS OF US$232.8 MILLION (2015: US$106.3 MILLION)
$83.8MNET DEBT US$83.8 MILLION (2015: US$101.2 MILLION)
$84.7MPROFIT EXCLUDING SIGNIFICANT ITEMS OF US$84.7 MILLION (2015: PROFIT: US$258.2 MILLION)
$49.0MAWAC NET PROFIT AFTER TAX US$49.0 MILLION (2015: NET LOSS AFTER TAX: US$318.2 MILLION)
$355.2MNET PROFIT EXCLUDING SIGNIFICANT ITEMS US$355.2 MILLION (2015: NET PROFIT EXCLUDING SIGNIFICANT ITEMS US$703.6 MILLION)
12.6M TONNESALUMINA PRODUCTION OF 12.6 MILLION TONNES (2015: 15.1 MILLION TONNES)
6.3M BONE DRY TONNES (BDT)BAUXITE THIRD PARTY SALES OF 6.3 BDT (2015: 2.0 MILLION BDT)
ALUMINA LIMITED AWAC
ALUMINA LIMITED ANNUAL REPORT 2016 3

4
Alumina Limited has had limited flexibility to change or restructure its interest to increase shareholder value. It has sought to restructure the AWAC joint venture for many years. Agreements to give effect to transformational changes were executed on 1 September 2016 following lengthy negotiations.
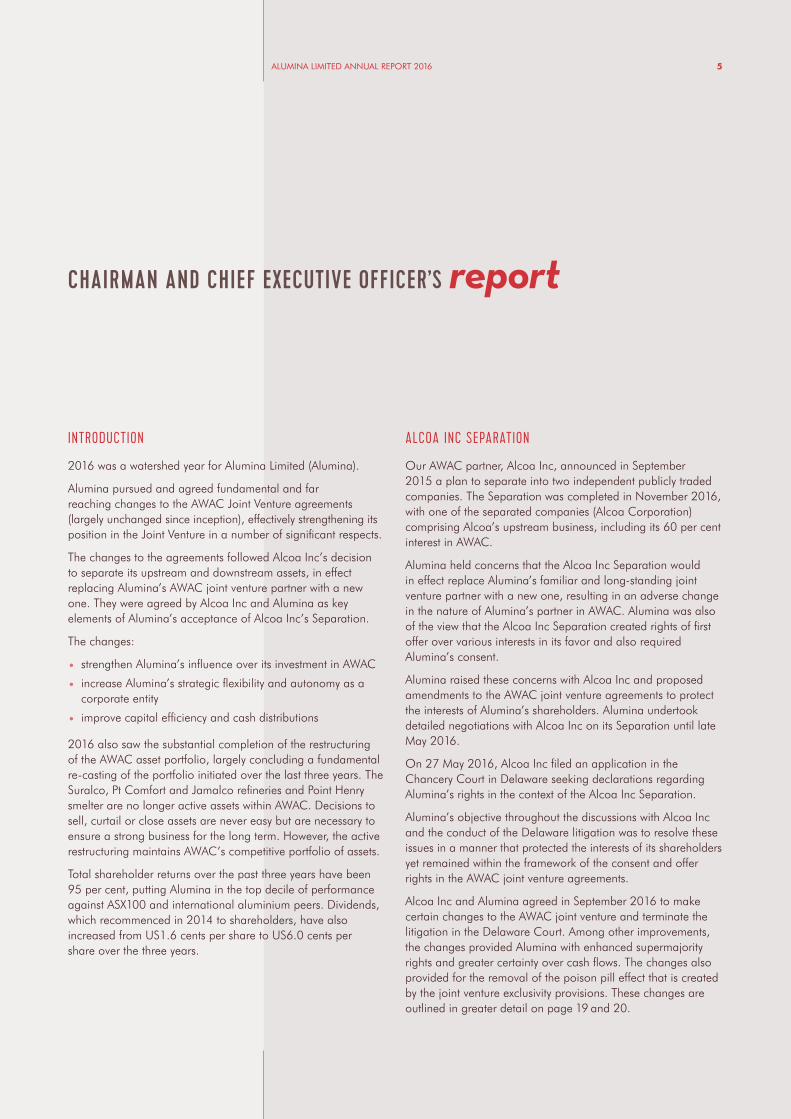
INTRODUCTION
2016 was a watershed year for Alumina Limited (Alumina).
Alumina pursued and agreed fundamental and far reaching changes to the AWAC Joint Venture agreements (largely unchanged since inception), effectively strengthening its position in the Joint Venture in a number of significant respects.
The changes to the agreements followed Alcoa Inc’s decision to separate its upstream and downstream assets, in effect replacing Alumina’s AWAC joint venture partner with a new one. They were agreed by Alcoa Inc and Alumina as key elements of Alumina’s acceptance of Alcoa Inc’s Separation.
The changes:
• strengthen Alumina’s influence over its investment in AWAC
• increase Alumina’s strategic flexibility and autonomy as a corporate entity
• improve capital efficiency and cash distributions
2016 also saw the substantial completion of the restructuring of the AWAC asset portfolio, largely concluding a fundamental re-casting of the portfolio initiated over the last three years. The Suralco, Pt Comfort and Jamalco refineries and Point Henry smelter are no longer active assets within AWAC. Decisions to sell, curtail or close assets are never easy but are necessary to ensure a strong business for the long term. However, the active restructuring maintains AWAC’s competitive portfolio of assets.
Total shareholder returns over the past three years have been 95 per cent, putting Alumina in the top decile of performance against ASX100 and international aluminium peers. Dividends, which recommenced in 2014 to shareholders, have also increased from US1.6 cents per share to US6.0 cents per share over the three years.
ALCOA INC SEPARATION
Our AWAC partner, Alcoa Inc, announced in September 2015 a plan to separate into two independent publicly traded companies. The Separation was completed in November 2016, with one of the separated companies (Alcoa Corporation) comprising Alcoa’s upstream business, including its 60 per cent interest in AWAC.
Alumina held concerns that the Alcoa Inc Separation would in effect replace Alumina’s familiar and long-standing joint venture partner with a new one, resulting in an adverse change in the nature of Alumina’s partner in AWAC. Alumina was also of the view that the Alcoa Inc Separation created rights of first offer over various interests in its favor and also required Alumina’s consent.
Alumina raised these concerns with Alcoa Inc and proposed amendments to the AWAC joint venture agreements to protect the interests of Alumina’s shareholders. Alumina undertook detailed negotiations with Alcoa Inc on its Separation until late May 2016.
On 27 May 2016, Alcoa Inc filed an application in the Chancery Court in Delaware seeking declarations regarding Alumina’s rights in the context of the Alcoa Inc Separation.
Alumina’s objective throughout the discussions with Alcoa Inc and the conduct of the Delaware litigation was to resolve these issues in a manner that protected the interests of its shareholders yet remained within the framework of the consent and offer rights in the AWAC joint venture agreements.
Alcoa Inc and Alumina agreed in September 2016 to make certain changes to the AWAC joint venture and terminate the litigation in the Delaware Court. Among other improvements, the changes provided Alumina with enhanced supermajority rights and greater certainty over cash flows. The changes also provided for the removal of the poison pill effect that is created by the joint venture exclusivity provisions. These changes are outlined in greater detail on page 19 and 20.
CHAIRMAN AND CHIEF EXECUTIVE OFFICER’S report
ALUMINA LIMITED ANNUAL REPORT 2016 5

The changes to the AWAC joint venture and its agreements are the first substantive changes since AWAC’s formation in 1995. The expenses incurred in undertaking this process were significant but necessary and we believe resulted in a transformational change in our position as 40 per cent co-venturer.
Alumina Limited has enjoyed a successful relationship with Alcoa for over 50 years, and look forward to working together in this next phase. We believe Alumina’s interests are now more aligned with Alcoa Corporation and there is the opportunity to deepen the working relationship between the two companies. Alumina’s partner in AWAC, Alcoa Corporation is now focused solely on upstream assets, including AWAC. The early stages of working with the new management of Alcoa have been very productive.
OPERATING HIGHLIGHTS
AWAC’s world class assets continued to produce solid returns for shareholders in 2016. This was underpinned by recent restructuring of the asset portfolio and strong productivity improvements which enabled AWAC to withstand the low alumina prices prevailing through much of 2016.
In the past 3 years the AWAC joint venture has improved its position on the alumina industry cost curve from the 25th percentile to the 17th percentile. This has enabled AWAC to generate average EBITDA alumina margins of $69 per tonne of alumina produced over that period.
Alumina Limited’s full year net profit after tax was US$84.7 million, excluding significant items. The curtailment and closure of the Point Comfort and Suralco refineries resulted in restructuring charges of $69.9 million. Those charges, together with non cash writedowns of $45.0 million reduced the Company’s result to a loss of $30.2 million.
AWAC’s EBITDA margin for alumina production in 2016 was $63 per tonne, lower than the $91 margin for 2015. This reflected the 15.5 per cent decline in alumina spot prices for the year. Alumina prices traded in a range between $197 and $351 per tonne in 2016.
AWAC responded quickly to the low pricing environment in 2016 – it achieved an excellent cost reduction in the alumina operations of $25 per tonne during 2016. Lower energy costs, a stronger US dollar and productivity initiatives in materials, maintenance and transport all contributed to the reduction. This has positioned AWAC well to deliver strong cash flows in 2017.
AWAC’s low cost operations in Australia and Brazil again achieved production records in 2016. AWAC’s operating portfolio now reflects bauxite and alumina assets located in the first and second quartile on the industry cost curve. The Australian and Brazilian refineries have achieved average annual production increases of one per cent since 2013.
The ramping up of the Saudi Arabian bauxite mine and alumina refinery with Ma’aden proceeded during 2016 and will add low cash cost production to AWAC. The refinery is expected to reach its full production capacity of 1.8 million mtpy during 2017 and be within the lowest quartile on a cash cost basis.
There was a continued progression by AWAC to sales on a spot or index basis, which also contributed to improved margins. During 2016, 84 per cent of AWAC’s total sales were on an indexed or spot basis. The move to have alumina priced on its own fundamentals has been beneficial to AWAC and should continue to be so.
Alumina prices have experienced significant volatility in recent years, similar to many other commodities. From record lows in early 2016, alumina prices rebounded in late 2016 and 2017. A number of market developments have resulted in this price recovery, including supply restrictions and increased demand in China.
While alumina prices were at low levels for the year, Alumina Limited continued to receive cash distributions from AWAC. This enabled payment of a final dividend of US3.1 cents per share, bringing the total declared dividend for the year to US6.0 cents per share.
AWAC continued to develop bauxite mining as a separate business unit during 2016. The bauxite business unit has made great strides in implementing its strategy of developing bauxite sales to third parties.
AWAC also secured its first major third party contract to supply approximately 400,000 tonnes of bauxite from its Huntly mine in Western Australia. The Western Australian State Government has also granted approval for AWAC to export up to 2.5 million metric tonnes per annum of bauxite for five years to third party customers. Bauxite exports from the Western Australian operations have the potential to create a supplementary income stream for AWAC.
AWAC now supplies over 6 million tonnes annually to the third party bauxite market.
The Juruti mine has been successfully expanded from an initial design capacity of 2.6 million mtpa to 6 million mtpa with very little additional capital investment. The resource potential is very significant and additional installed but latent capacity exists at the port and other key infrastructure components. Together these provide the scope for significant and profitable expansions in the future as the bauxite market continues to grow.
Further investment to grow the bauxite business is planned for 2017. Alumina is supportive of AWAC growing third party sales to meet market demand and seeking forms of index pricing for bauxite that reflects its fundamentals.
CHAIRMAN AND CHIEF EXECUTIVE OFFICER’S report
6

CAPITAL MANAGEMENT
Alumina Limited is a vehicle that primarily passes through to shareholders the cash flow from its interest in AWAC. Alumina’s dividend policy is that the Board intends on an annual basis to distribute cash from operations after debt servicing and corporate costs commitments have been met. The Board will also consider the capital structure of Alumina Limited, the capital requirements for the AWAC business and market conditions.
Corporate costs for Alumina Limited in 2016 were higher as a result of expenses incurred to reach agreement on the Alcoa Inc Separation. The expenses (including legal, financial and other advisors) also included significant costs for the Delaware litigation. Whilst these expenses were substantial, they were required to protect Alumina’s interests and ultimately enabled a substantial improvement in our joint venture interest. Corporate costs are expected to revert in 2017 to historical norms.
The Company’s strategy is to maintain a balance sheet that can meet the demands of the commodity cycle and enable cash flows to be readily distributed to shareholders. Alumina’s debt levels have been, on average below $140 million since 2014, whilst consistent dividends have been paid to shareholders. A total of US13.9 cents per share has been distributed to shareholders for the last 3 years.
Alumina’s net debt is at low levels and gearing is 4.0 per cent. The resilience of Alumina’s balance sheet served it well during the challenging market conditions in 2016. The Company’s debt levels enabled total dividends to shareholders of US6.0 cents per share to be paid in respect of 2016. This is particularly pleasing as the 2016 dividends were paid in a year of record low alumina prices.
ALUMINA LIMITED ANNUAL REPORT 2016 7

ALUMINA LIMITED STRATEGY
The Company’s strategy is to invest worldwide in bauxite mining and alumina refining operations through its 40 per cent ownership of AWAC, one of the world’s largest alumina and bauxite producers.
Alumina ensures it has a thorough understanding of the industry so that it can effectively participate in the AWAC joint venture and manage its own position in the industry. There are many facets to the joint venture which require discussion and resolution with our partner, such as the Alcoa Inc Separation. A key part of the Alumina’s strategy is to protect the value of our joint venture interest.
The bauxite and alumina industry continues to change rapidly. The bauxite industry in particular has seen production spikes move from Indonesia to Malaysia and now Guinea. It is difficult to predict the future stance by various governments on bauxite exports.
AWAC’s strategy over several years has been to achieve an asset portfolio of tier one assets and ensure other refineries are cash positive throughout the cycle. AWAC has tier one assets in the Pinjarra, Wagerup, Sao Luis and Ma’aden refineries and their associated mines. Substantial improvements have been made to the Kwinana and San Ciprian refineries. AWAC’s strategy has seen its portfolio rationalised with assets sold, curtailed or closed. Together with cost reduction programs over the last 3 years, this has resulted in cash production costs reducing by $67 per tonne.
The 30 year electricity contract for the Portland smelter expired in October 2016. The smelter was faced with a very substantial increase in energy costs, including transmission costs. The smelter’s position was further hampered by an interruption in energy supply in December 2016, which disabled approximately 80 per cent of production capacity. In 2017, Alcoa of Australia entered into arrangements for a new 4 year power supply and agreements with Victorian and Australian Federal Governments for the restart of the smelter. These arrangements enable the smelter’s challenges to be better managed while a long term energy solution is sought. Power prices paid by the smelter are approximately 50 to 100 per cent higher than prices paid by similar operations in the Western World.
Portland’s future is secured only for the medium term. It faces numerous uncertainties now gripping Eastern Australia in the wake of many years of energy policy-making that have weakened the economy’s traditional competitive energy strengths. The closure of Hazelwood power station in Victoria will raise Victoria’s energy costs for industry. Victoria and other Australian States have imposed limits on gas exploration, delays on coal project developments and over-ambitious intermittent
energy targets, which together inspire great concerns about the case for reinvestment in energy intensive manufacturing industries. Although the Company’s core alumina assets are not yet impacted by these East Coast developments, there is no room for complacency. The Company is seriously concerned and intends to support collective industry initiatives to submit current policies to scrutiny and where appropriate to support raising the quality of the policy debate.
GOVERNANCE
The Remuneration Report reviews Alumina’s remuneration strategy, policy and outcomes. The transformation of our joint venture position achieved by executives in 2016 was recognised in awarding of short term incentives above target levels. The 2016 Remuneration Report provides full details of this and assessment of performance against personal objectives in awarding short term incentives for the year.
Alumina Limited reports its governance practices consistent with the 3rd Edition of the Corporate Governance Principles and Recommendations of the ASX Corporate Governance Council. Alumina’s compliance with the Corporate Governance Principles and Recommendations is defined in the Appendix 4G lodged with the ASX.
For Non-Executive Directors, there is no increase in fees for the 2016 year and fees have been unchanged since 1 January 2011.
SUSTAINABILITY
AWAC is a substantial energy and capital intensive global business and its social, environmental and economic impacts extend like a ripple effect to affect direct and indirect stakeholders. Management at Alumina Limited and Alcoa Corporation (the manager/operator) have identified a number of material aspects of the business that impact stakeholders and provide a challenge to achieve improved outcomes. Alcoa has developed a number of stretch targets to improve the efficiency of the business. The material aspects and their targets are disclosed on page 12 of this report. The underlying approach to improving sustainability outcomes is the incorporation of the targets into business strategy and ultimately, the day to-day operation of the business. AWAC continues to focus on achieving those goals and assessing its performance. This dedication at an operational level has resulted in positive outcomes, such as reducing energy consumption and greenhouse gas emission intensity. Other critical targets, such as the elimination of fatalities, require a sustained effort. Alumina Limited’s Sustainability Update on Alumina’s website discloses the approach to sustainability, goals and results.
CHAIRMAN AND CHIEF EXECUTIVE OFFICER’S report
8
OUTLOOK
The alumina price increased by 78 per cent over the course of 2016. This was primarily due to widespread refining curtailments around the start of the year, an increase in smelter production over the year and Chinese alumina supply restrictions.
The Chinese alumina utilisation rate was reported to be running at 93 per cent of installed capacity in January 2017, and there will be relatively few additions to alumina capacity brought on outside China this year. Supply and demand for alumina over 2017 is expected to be broadly balanced.
There are various uncertainties in the industry’s outlook which will impact bauxite and alumina prices. For example, there have been recent reports that China is considering compulsory cuts to production of energy intensive industries for seasonal pollution control reasons from November 2017 to March 2018. This could include alumina and aluminium. Also, Indonesia may resume bauxite exports.
CONCLUSION
The last year has been a very significant one for Alumina Limited. The changes and developments which occurred should see a different and exciting future.
Alumina Limited was well prepared for and withstood the weak alumina prices during 2016. The AWAC asset portfolio is stronger than ever and we are well positioned to benefit from the recent price recovery. At the level of commodity prices and exchange rates in early 2017, AWAC is positioned to produce strong cash flows.
We thank our employees for their work to sustain and improve Alumina Limited during 2016.
ALUMINA LIMITED ANNUAL REPORT 2016 9
GJ Pizzey Chairman
Peter Wasow Chief Executive Officer

10
AWAC harnesses the resourcefulness, competency, capability and strength of its workforce to develop the business responsibly and create a positive legacy for its numerous stakeholders.
ABILITY RESOURCEFULNESS, COMPETENCY, CAPABILITY, STRENGTH, APTITUDE
SUSTAIN FOSTER, NUTURE, PRESERVE, SUPPORT, BOLSTER
Alumina Limited shares a common belief with Alcoa Corporation, that is, the impacts of a business stretch beyond its corporate boundaries to affect economic, social and environmental aspects of stakeholders. Stakeholders range from people directly affected by the business; employees, shareholders, suppliers, customers and the people of the localities in which the business operates to people indirectly impacted such as product end users. To operate sustainably means to recognise the responsibility to these various interested parties and to act accordingly. AWAC harnesses the resourcefulness, competency, capability and strength of its workforce to develop the business responsibly and create a positive legacy for its numerous stakeholders.
We believe that sustainability is about working more effectively and efficiently to improve environmental outcomes and limit the impact on the environment, improve the quality of life of people impacted by Alcoa World Alumina and Chemicals (AWAC) operations including the safety and health of AWAC employees and drive business performance and long-term stakeholder value.
To be effective, we believe that sustainability goals need to be incorporated into business strategy and processes rather than a subordinate effort that risks being diluted. Also, sustainability goals must be measureable, accountable and impact performance indicators.
As a non-operating partner in AWAC, we turn to, and support, AWAC’s operating manager Alcoa, in its sustainability program. Alcoa, the operator/manager of AWAC’s business is a world leader of best-practice sustainability.
GOVERNANCE AND RISK
Alumina Limited supports Alcoa’s sustainability vision and also seeks to protect its own stakeholder interests by engaging in a governance process with Alcoa that includes participation in:
• AWAC’s Strategic Council (the formal governing body of AWAC),
• The Board of Alcoa of Australia,
• The Board of Alcoa World Alumina LLC and
• The AWA of Brazil SA Advisory Board.
Representation on the above bodies enables Alumina Limited access to consider, amongst other matters:
• AWAC’s long-term strategy
• detailed reporting of sustainability performance against targets and key indicators
• industry and market outlook
• occupational health, safety and environmental performance.
In addition, Alumina Limited’s management holds regular discussions with AWAC management on operational matters. Alumina Limited’s Board and management also visit AWAC operational sites to gain first-hand insight into operational matters.
Alumina Limited has a Risk Management Framework to assess sustainability risk levels and identify strategies to minimise impact and maximise opportunity.
Regarding the AWAC joint venture, Alcoa is the manager and has a key risk management role over the operations, administration and marketing functions. Alcoa have, as a result of their assessments, established group wide sustainability goals that have implications for AWAC operations.
Separately Alumina Limited conducted an internal assessment to identify the key AWAC sustainability matters that can affect Alumina’s stakeholders.
SUSTAIN ability
ALUMINA LIMITED ANNUAL REPORT 2016 11
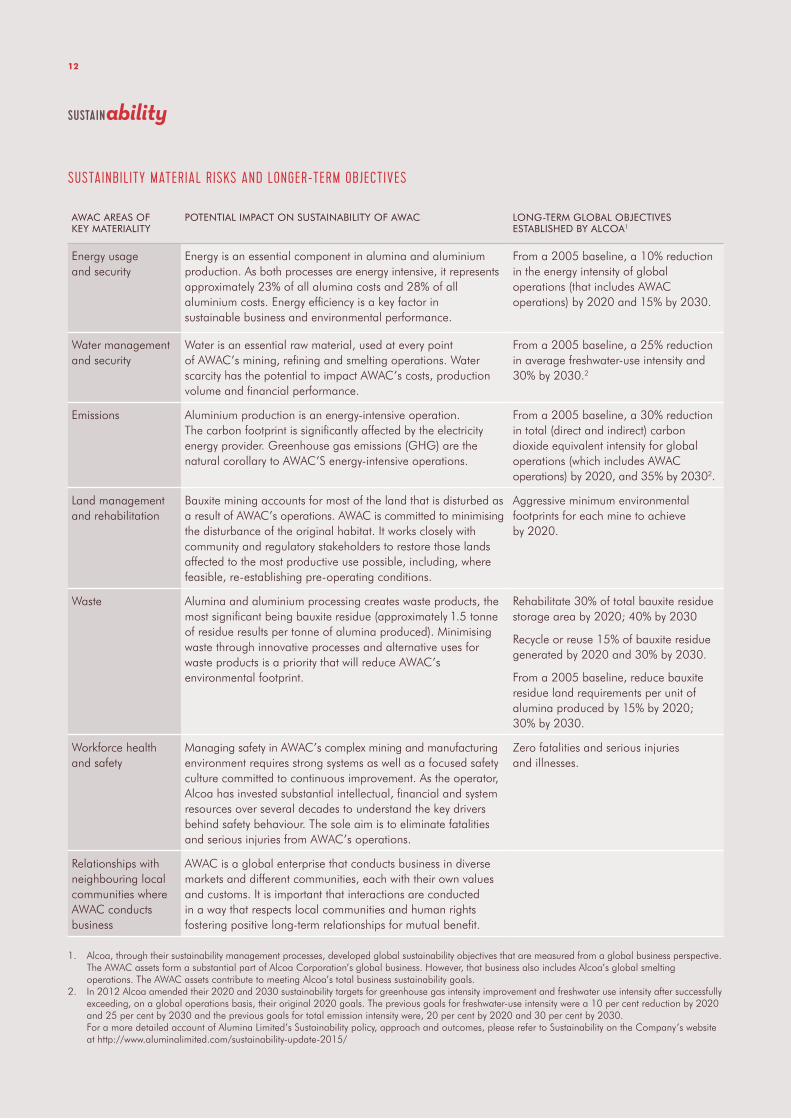
AWAC AREAS OF KEY MATERIALITY
POTENTIAL IMPACT ON SUSTAINABILITY OF AWAC LONG-TERM GLOBAL OBJECTIVES ESTABLISHED BY ALCOA1
Energy usage and security
Energy is an essential component in alumina and aluminium production. As both processes are energy intensive, it represents approximately 23% of all alumina costs and 28% of all aluminium costs. Energy efficiency is a key factor in sustainable business and environmental performance.
From a 2005 baseline, a 10% reduction in the energy intensity of global operations (that includes AWAC operations) by 2020 and 15% by 2030.
Water management and security
Water is an essential raw material, used at every point of AWAC’s mining, refining and smelting operations. Water scarcity has the potential to impact AWAC’s costs, production volume and financial performance.
From a 2005 baseline, a 25% reduction in average freshwater-use intensity and 30% by 2030.2
Emissions Aluminium production is an energy-intensive operation. The carbon footprint is significantly affected by the electricity energy provider. Greenhouse gas emissions (GHG) are the natural corollary to AWAC’S energy-intensive operations.
From a 2005 baseline, a 30% reduction in total (direct and indirect) carbon dioxide equivalent intensity for global operations (which includes AWAC operations) by 2020, and 35% by 20302.
Land management and rehabilitation
Bauxite mining accounts for most of the land that is disturbed as a result of AWAC’s operations. AWAC is committed to minimising the disturbance of the original habitat. It works closely with community and regulatory stakeholders to restore those lands affected to the most productive use possible, including, where feasible, re-establishing pre-operating conditions.
Aggressive minimum environmental footprints for each mine to achieve by 2020.
Waste Alumina and aluminium processing creates waste products, the most significant being bauxite residue (approximately 1.5 tonne of residue results per tonne of alumina produced). Minimising waste through innovative processes and alternative uses for waste products is a priority that will reduce AWAC’s environmental footprint.
Rehabilitate 30% of total bauxite residue storage area by 2020; 40% by 2030
Recycle or reuse 15% of bauxite residue generated by 2020 and 30% by 2030.
From a 2005 baseline, reduce bauxite residue land requirements per unit of alumina produced by 15% by 2020; 30% by 2030.
Workforce health and safety
Managing safety in AWAC’s complex mining and manufacturing environment requires strong systems as well as a focused safety culture committed to continuous improvement. As the operator, Alcoa has invested substantial intellectual, financial and system resources over several decades to understand the key drivers behind safety behaviour. The sole aim is to eliminate fatalities and serious injuries from AWAC’s operations.
Zero fatalities and serious injuries and illnesses.
Relationships with neighbouring local communities where AWAC conducts business
AWAC is a global enterprise that conducts business in diverse markets and different communities, each with their own values and customs. It is important that interactions are conducted in a way that respects local communities and human rights fostering positive long-term relationships for mutual benefit.
1. Alcoa, through their sustainability management processes, developed global sustainability objectives that are measured from a global business perspective. The AWAC assets form a substantial part of Alcoa Corporation’s global business. However, that business also includes Alcoa’s global smelting operations. The AWAC assets contribute to meeting Alcoa’s total business sustainability goals.
2. In 2012 Alcoa amended their 2020 and 2030 sustainability targets for greenhouse gas intensity improvement and freshwater use intensity after successfully exceeding, on a global operations basis, their original 2020 goals. The previous goals for freshwater-use intensity were a 10 per cent reduction by 2020 and 25 per cent by 2030 and the previous goals for total emission intensity were, 20 per cent by 2020 and 30 per cent by 2030.
For a more detailed account of Alumina Limited’s Sustainability policy, approach and outcomes, please refer to Sustainability on the Company’s website at http://www.aluminalimited.com/sustainability-update-2015/
SUSTAINBILITY MATERIAL RISKS AND LONGER-TERM OBJECTIVES
SUSTAIN ability
12

To be effective, we believe that sustainability goals need to be incorporated into business strategy and processes rather than a subordinate effort that risks being diluted. Also, sustainability goals must be measureable, accountable and impact performance indicators.
ALUMINA LIMITED ANNUAL REPORT 2016 13
DIRECTOR’S report
DIRECTORS
Unless otherwise indicated, the following persons were Directors of the Company during the whole of the financial year and up to the date of this report:
G J Pizzey (Chairman)
P C Wasow (Managing Director and Chief Executive Officer)
E R Stein
C Zeng
W P Day
M P Ferraro
BOARD OF DIRECTORS
The Company’s Directors in office as at 31 December 2016 were:
MR G JOHN PIZZEYB.E (CHEM), FELL. DIP. MANAGEMENT., FTSE, FAICD
Independent Non-Executive Director and Chairman
Mr Pizzey was elected a Non-Executive Director of the Company on 8 June 2007. He is a Non-Executive Director of Orora Limited (appointed December 2013) and former Non-Executive Director and Chairman of Iluka Resources Ltd (appointed November 2005 and resigned December 2013) and a former Non-Executive director of Amcor Limited (appointed September 2003 and resigned December 2013).
Mr Pizzey is a life governor of Ivanhoe Grammar School and a former chairman and director of the London Metal Exchange.
He is a member of the Audit and Risk Management Committee and of the Nomination and Compensation Committees and was Chair of the then Audit Committee to 30 November 2011. Mr Pizzey has extensive business experience including 33 years as an executive in the alumina and aluminium industries.
MS EMMA R STEINBSC (PHYSICS) HONS, MBA, FAICD, HON FELLOW WSU
Independent Non-Executive Director
Ms Stein was elected as a Non-Executive Director of the Company on 3 February 2011. Ms Stein is currently a Non-Executive Director of Diversified Utilities Energy Trust (appointed June 2004), Programmed Maintenance Services Ltd (appointed June 2010), and Transpacific Industries Group Ltd (appointed August 2011). She is a former Non- Executive Director of Clough Limited (appointed July 2008 and resigned December 2013). Formerly the UK Managing Director for French utility Gaz de France’s energy retailing operations, Ms Stein moved to Australia in 2003. Before joining Gaz de France she was UK Divisional Managing Director for British Fuels.
Ms Stein is Chair of the Compensation Committee since 1 January 2014, current member and former Chair of the Audit and Risk Management Committee (Chair 28 November 2013 to 31 December 2013), and current member and former Chair of the Nomination Committee (Chair 3 March 2011 to February 2014). As a senior executive, she gained considerable international experience in management and leadership, strategy development and implementation in global industrial, energy and utilities markets. She has over a decade of experience as a listed non-executive director and board committee chair for capital intensive companies spanning resources, oil and gas and related sectors.
The Directors present their report on the consolidated entity consisting of Alumina Limited (the Company) and the entities it controlled at the end of, or during, the year ended 31 December 2016 (the Group).
14

MR PETER C WASOWBCOM, GRADDIPMGMT, FCPA
Managing Director and Chief Executive Officer
Mr Wasow was appointed Managing Director and Chief Executive Officer effective from 1 January 2014. He has responsibility for the overall management of Alumina Limited in accordance with the strategy, policies and business processes adopted by the Board. Prior to his appointment as CEO, Mr Wasow was a Non-Executive Director of the Company, appointed on 26 August 2011 and was a member of the Nomination Committee and Compensation Committee and a former member and Chair of the then Audit Committee (December 2011 to November 2013). Mr Wasow served more than eight years at major Australian oil and gas producer Santos Limited from 2002 to 2010. Initially appointed as CFO, he assumed the additional role of Executive Vice President from 2008. Prior to joining Santos in 2002, Mr Wasow held several senior roles over a 23 year career at BHP including Vice President of Finance. Mr Wasow brings to the Board extensive financial skills and experience in the resource and energy industries.
MR CHEN ZENGMIF
Non-Executive Director
Mr Zeng was appointed as a Non-Executive Director of the Company on 15 March 2013. He is a member of the Nomination, Compensation and Audit and Risk Management Committees (appointed 7 August 2014). Mr Zeng is also currently a director of CITIC Pacific Limited, Chief Executive Officer of CITIC Pacific Mining and Chief Executive Officer of CITIC Mining International, the new holding company of CITIC Pacific Mining. He is a former director of CITIC Limited (listed on the Hong Kong Exchange), CITIC Dameng (listed on the Hong Kong Exchange), Macarthur Coal Limited (2007 to 2011) and Marathon Resources Limited (resigned 31 January 2014). Mr Zeng also served as a director on the Board of CITIC Group between 2010 and 2011. Before joining CITIC Pacific Mining, Mr Zeng was the Vice Chairman and CEO of CITIC Resources, a CITIC Group controlled Hong Kong listed company focused on crude oil production, metal mining and refining, and commodity trading. Mr Zeng is also the Chairman of CITIC Australia. Mr Zeng has over 26 years of experience in project development, management, and a proven record in leading cross-cultural professionals in the resources sector.
He has been working in Australia since 1994 and has extensive experience in various industries including aluminium smelting and coal mining.
MR W PETER DAYLLB (HONS), MBA, FCA, FCPA, FAICD
Independent Non-Executive Director
Mr Day was appointed as a Non-Executive Director of the Company on 1 January 2014. He is a member of the Nomination and Compensation Committees and is Chair of the Audit and Risk Management Committee. Mr Day is also currently a Non-Executive Director of Ansell (appointed August 2007), Australian Office Fund (appointed September 2015), and Boart Longyear (appointed February 2014), and a former director of Federation Centres (October 2009–February 2014), Orbital Corporation (August 2007–February 2014) and SAI Global (August 2008–December 2016). Mr Day brings extensive experience in the resource, finance and manufacturing sectors, having held a number of senior positions with Bonlac Foods, Rio Tinto, CRA, Comalco and the Australian Securities and Investments Commission. He is a former CFO of Amcor Limited. He also supports initiatives in disability services and mentoring.
MR MICHAEL P FERRAROLLB (HONS)
Independent Non-Executive Director
Mr Ferraro was appointed a Non-Executive Director of the Company on 5 February 2014. He is a member of the Audit and Risk Management and Compensation Committees and is Chair of the Nomination Committee. Mr Ferraro is Partner, Client Development-Asia Pacific at Herbert Smith Freehills, a global law firm, and was formerly head of the Corporate Group at the firm. He was also a member of their executive management team. Mr Ferraro is also a Non-Executive Director of Helloworld Limited (appointed January 2017).
Between 2008 and 2010 Mr Ferraro was Chief Legal Counsel at BHP Billiton Ltd. Mr Ferraro has considerable experience in the resources sector and has over 30 years of experience in joint ventures, mergers and acquisitions, fund raising, and regulatory issues across a wide range of sectors and countries. He also has considerable experience in the commercial and financing aspects of large transactions gained from a number of years in investment banking as a corporate adviser.
ALUMINA LIMITED ANNUAL REPORT 2016 15
MR W PETER DAYMR CHEN ZENG MR MICHAEL P FERRAROMR PETER C WASOWMR G JOHN PIZZEY MS EMMA R STEIN

COMPANY SECRETARY
MR STEPHEN FOSTERBCOM LLB (HONS) GDIPAPPFIN (SEC INST)GRADDIP CSP, ACIS
General Counsel/Company Secretary
Mr Foster is responsible for legal, company secretarial, shareholder services, insurance and human resources. He has a wide range of legal and commercial experience gained over 30 years, more recently at Village Roadshow and WMC Limited, after working with the legal firm of Arthur Robinson & Hedderwicks (now Allens). The appointment of the Company Secretary/General Counsel is ratified by the Board. As defined in the Board Charter, the Company Secretary is accountable directly to the Board, through the Chair, on all matters to do with the proper functioning of the Board.
The role of Company Secretary/General Counsel in Alumina Limited includes:
• providing legal advice to the Board and management as required
• advising the Board on corporate governance principles
• generally attending all Board meetings and preparing the minutes
• monitoring that the Board and Committee policies and procedures are followed
• facilitating the induction of Directors
• managing compliance with regulatory requirements.
MEETINGS OF DIRECTORSParticulars of the numbers of meetings of the Company’s Directors (including meetings of committees of Directors) during the financial year, and the number of those meetings attended by each Director (as applicable), are detailed in the table below.
INTERESTS OF DIRECTORSParticulars of relevant interests in shares in the Company or in any related body corporate held by the Directors of the Company as at the date of this report are set out in the Remuneration Report on page 59 of this report. Particulars of rights or options over shares in the Company or in any related body corporate held by the Directors of the Company as at the date of this report are set out in the Remuneration Report on page 58 of this report.
INSURANCE OF OFFICERSDuring or since the end of the financial year, the Group has paid the premiums in respect of a contract to insure Directors and other officers of the Group against liabilities incurred in the performance of their duties on behalf of the Group. The officers of the Group covered by the insurance policy include any natural person acting in the course of duties for the Group who is or was a Director, secretary or executive officer as well as senior and executive staff. The Company is prohibited, under the terms of the insurance contract, from disclosing details of the nature of liability insured against and the amount of the premium.
16
ALUMINA LIMITED DIRECTORS’ ATTENDANCE AT MEETINGS JANUARY TO DECEMBER 2016
BOARD MEETING
AUDIT AND RISK MANAGEMENT COMMITTEE MEETINGS
COMPENSATION COMMITTEE MEETINGS
NOMINATIONS COMMITTEE MEETINGS
Directors Eligible to attend
Attended Eligible to attend
Attended Eligible to attend
Attended Eligible to attend
Attended
G J Pizzey 12 12 8 71 5 41 4 4
E R Stein 12 12 8 8 5 5 4 4
C Zeng 12 12 8 72 5 5 4 4
P Day 12 12 8 8 5 5 4 4
M Ferraro 12 12 8 8 5 5 4 4
P Wasow 12 12 na na na na na na
Notes: 1. Mr Pizzey was granted leave of absence for one Audit and Risk Management Committee meeting and one Compensation Committee meeting.2. Mr Zeng was an apology for one meeting of the Audit and Risk Management Committee.

ALUMINA LIMITED ANNUAL REPORT 2016 17
INDEMNITY OF OFFICERS
Rule 75 of the Company’s Constitution requires the Company to indemnify each officer of the Company (and, if the Board of the Company considers it appropriate, any officer of a wholly owned subsidiary of the Company) out of the assets of the Company against any liability incurred by the officer in or arising out of the conduct of the business of the Company or the relevant wholly-owned subsidiary or in or arising out of the discharge of the duties of the officer, where that liability is owed to a person other than the Company or a related body corporate of the Company. This requirement does not apply to the extent that the liability arises out of conduct on the part of the officer which involved a lack of good faith, or to the extent that the Company is otherwise precluded by law from providing an indemnity. It also does not apply to the extent and for the amount that the officer is not otherwise entitled to be indemnified and is not actually indemnified by another person (such as an insurer under any insurance policy). Officer in this context means: a director, secretary, senior manager or employee; or a person appointed as a trustee by, or acting as a trustee at the request of, the Company or a wholly owned subsidiary of the Company, and includes a former officer. The Constitution also permits the Company, where the Board considers it appropriate, to enter into documentary indemnities in favour of such officers. The Company has entered into such Deeds of Indemnity with each of the Directors, which indemnify them consistently with rule 75 of the Constitution.
DIVIDENDS
Details of the dividends paid to members of the Company during the financial year are referred to in Note 6 of the Consolidated Financial Statements found on page 77.
PRINCIPAL ACTIVITIES
The principal activities of the Group relate to its 40 per cent interest in the series of operating entities forming Alcoa World Alumina and Chemicals (AWAC). AWAC has interests in bauxite mining, alumina refining, and aluminium smelting. There have been no significant changes in the nature of the principal activities of the Group during the financial year.
REVIEW OF OPERATIONS AND RESULTS
The financial results for the Group include the 12 month results of AWAC and associated corporate activities. The Group’s net loss after tax for the 2016 financial year attributable to members of the Company was US$(30.2) million (2015: US$88.3 million profit). Excluding significant items, there would have been a net profit after tax of US$84.7 million (2015: US$258.2 million). For further information on the operations of the Group during the financial year and the results of these operations refer to the Operating and Financial Review on pages 19 to 33 of this report.
MATTERS SUBSEQUENT TO THE END OF THE FINANCIAL YEAR
Other than as reported in Note 15 of the Consolidated Financial Statements (refer to page 86), there are no significant matters, circumstances or events that have arisen since the end of the financial year that have significantly affected, or may significantly affect, the Group’s operations, the results of those operations, or the Group’s state of affairs, in the financial years subsequent to the financial year ended 31 December 2016.
LIKELY DEVELOPMENTS
In the opinion of the Directors, it would prejudice the interests of the Group to provide additional information, except as reported in this Directors’ Report, relating to likely developments in the operations of the Group and the expected results of those operations in the financial years subsequent to the financial year ended 31 December 2016.
ENVIRONMENTAL REGULATION
AWAC’s Australian operations are subject to various Commonwealth and state laws governing the protection of the environment in areas such as air and water quality, waste emission and disposal, environmental impact assessments, mine rehabilitation, and access to and use of ground water. In particular, most operations are required to be licensed to conduct certain activities under the environmental protection legislation of the state in which they operate, and such licences include requirements specific to the subject site.
ROUNDING OF AMOUNTS
The Company is of a kind referred to in the ASIC Corporations (Rounding in Financial/Directors’ Reports) Instrument 2016/191. Amounts shown in the Financial Report and this Directors’ Report have been rounded off to the nearest hundred thousand dollars, except where otherwise required, in accordance with that Instrument.

18
SIGNIFICANT CHANGES IN THE STATE OF AFFAIRS
There have been no significant changes in the state of affairs of the Group during the financial year.
AUDITOR
PricewaterhouseCoopers continues in office, in accordance with the Corporations Act 2001 (Cth) (Corporations Act). A copy of the Auditor’s Independence Declaration as required under section 307C of the Corporations Act 2001 is set out below.
NON-AUDIT SERVICES
The Group may decide to employ the auditor on assignments additional to their statutory audit duties where the auditor’s expertise and experience with the Company and/or the Group are important. Details of the amounts paid or payable to the auditor (PricewaterhouseCoopers) for audit and non-audit services provided by (or on behalf of) the auditor and its related practices are disclosed in Note 13 of the Notes to the Consolidated Statement in the Financial Report on page 86.
The Board of Directors has considered the position and, in accordance with advice received from the Audit and Risk Management Committee, is satisfied that the provision of
non-audit services during the financial year by (or on behalf of) the auditor and its related practices, is compatible with the general standard of independence for auditors imposed by the Corporations Act. The Directors are satisfied that the provision of those non-audit services did not compromise the auditor independence requirements of the Corporations Act 2001 for the following reasons:
• All non-audit services have been reviewed by the Audit and Risk Management Committee to ensure they do not impact the impartiality and objectivity of the auditor
• None of the services undermine the general principles relating to auditor independence as set out in APES 110 Code of Ethics for Professional Accountants. The fees paid or payable during the financial year for services provided by (or on behalf of) the auditor of the parent entity are disclosed in Note 13 of the Notes to the Consolidated Statement in the Financial Report on page 86.
CORPORATE GOVERNANCE STATEMENT
The Company has, for the 2016 reporting year, elected to disclose the Corporate Governance Statement only on the Company web site. The Corporate Governance Statement can be found at URL http://www.aluminalimited.com/governance/
AUDITOR’S INDEPENDENCE DECLARATION
As lead auditor for the audit of Alumina Limited for the year ended 31 December 2016, I declare that to the best of my knowledge and belief, there have been: a) no contraventions of the auditor independence requirements of the Corporations Act 2001 in relation to the audit; and b) no contraventions of any applicable code of professional conduct in relation to the audit. This declaration is in respect of Alumina Limited and the entities it controlled during the period.
Nadia Carlin Partner
Melbourne 23 March 2017 PricewaterhouseCoopers Liability limited by a scheme approved under Professional Standards Legislation

OPERATING AND FINANCIAL review
NOTE REGARDING NON-IFRS FINANCIAL INFORMATION
The Operating and Financial Review contains certain non-IFRS financial information. This information is presented to assist in making appropriate comparisons with prior year periods and to assess the operating performance of the business.
Alcoa World Alumina & Chemicals (AWAC) financial information, except as stated below, is extracted from audited financial statements prepared in conformity with accounting principles generally accepted in the United States of America.
CONTENTS
1. STRATEGY AND BUSINESS MODEL 19
2. PRINCIPAL RISKS 22
3. REVIEW OF AWAC OPERATIONS 24
4. AWAC FINANCIAL REVIEW 27
5. ALUMINA LIMITED FINANCIAL REVIEW 30
6. MARKET OUTLOOK AND GUIDANCE 32
The Operating and Financial Review should be read in conjunction with the financial statements, which are presented on pages 60 to 92 of this annual report.
1. STRATEGY AND BUSINESS MODEL
BUSINESS MODEL
Alumina Limited’s sole business undertaking is in the global bauxite, alumina and aluminium industry, which it conducts primarily through bauxite mining and alumina refining, with some minor alumina-based chemicals businesses, aluminium smelting and the marketing of those products. All of those business activities are conducted through its 40% investment in AWAC.
Alumina Limited’s net profit/(loss) is principally comprised of a return on its equity investment, and revenues are limited to small amounts of interest income and occasional one-off revenues.
AWAC was formed on 1 January 1995 by Alumina Limited and Alcoa Inc combining their respective global bauxite, alumina and alumina-based chemicals business and investments and their respective aluminium smelting operations in Australia. AWAC is one of the world’s largest alumina producers and bauxite miners.
Following the separation of Alcoa Inc. into Alcoa Corporation and Arconic Inc. on 1 November 2016, Alcoa Corporation (Alcoa) replaced Alcoa Inc as Alumina Limited’s partner in the AWAC joint venture. This partnership provides investors with a direct investment in the bauxite and alumina industry. Alcoa owns the 60% interest in the joint venture and manages the day-to-day operations.
Prior to the separation of Alcoa Inc and as announced by Alumina Limited on 2 September 2016, Alcoa Inc. and Alumina Limited agreed certain changes to the governance and financial policies of the joint venture. The changes align more closely the partners’ interests in AWAC, promote faster decision-making, provide for joint input on significant decisions, improve information sharing and streamline the dispute resolution process.
ALUMINA LIMITED ANNUAL REPORT 2016 19

The changes also simplified AWAC’s dividend and cash management policies. Each company in the AWAC joint venture will pay a minimum quarterly distribution of 50% of the prior quarter’s net profit, instead of the current payment of an annual dividend equal to 30% of after tax operating income (ATOI). In addition, any surplus cash (as defined in the Agreements) within certain AWAC companies will be distributed quarterly. The agreement also requires that AWAC raise a limited amount of debt to fund future mutually agreed growth projects.
The Strategic Council remained the principal forum for Alcoa and Alumina Limited to provide direction and counsel to the AWAC entities in respect of strategic and policy matters. The Alcoa and Alumina Limited representatives on the boards of the AWAC entities are required, subject to their general fiduciary duties, to carry out the directions and the decisions of the Strategic Council. The Strategic Council has five members, three appointed by Alcoa (of which one is Chairman) and two by Alumina Limited (of which one is the Deputy Chairman). Decisions are made by majority vote except for matters which require a “super-majority” vote, which is a vote of at least 80% of the members appointed to the Strategic Council.
The following decisions historically required a super-majority vote:
• change of the scope of AWAC.
• change in the dividend policy.
• equity calls on behalf of AWAC totalling, in any one year, in excess of $1 billion.
Following Alcoa Inc’s separation on 1 November 2016, the following matters also require a super-majority vote:
• acquisitions, divestitures, expansions and curtailments exceeding 2 million tonnes per annum of bauxite or 0.5 million tonnes per annum of alumina or which have a sale price, acquisition price, or project total capital cost of US$50 million or greater.
• implementation of related party transactions in excess of US$50 million.
• implementation of financial derivatives, hedges and other commodity price or interest rate protection mechanisms.
• decision to file for insolvency in respect of any AWAC company.
Under the general direction of the Strategic Council, Alcoa is the “industrial leader” and provides the operating management of AWAC and of all affiliated operating entities within AWAC.
Alumina Limited is entitled to representation in proportion to its ownership interest on the board of each entity in the AWAC structure and is currently represented on the boards of Alcoa of Australia Ltd (AofA), Alcoa World Alumina Brazil Ltda (AWA Brazil) and Alcoa World Alumina LLC (AWA LLC). In addition to the Strategic Council meetings, Alumina Limited’s Management and Board visit and review AWAC’s operations each year.
Subject to the exclusivity provisions of the AWAC agreements, AWAC is the exclusive vehicle for the pursuit of Alumina Limited’s and Alcoa’s (and their related corporations as defined) interests in the bauxite, alumina and inorganic industrial chemicals businesses, and neither party can compete with AWAC so long as they maintain an ownership interest in AWAC. In addition, Alumina Limited may not compete with the businesses of the integrated operations of AWAC (being the primary aluminium smelting and fabricating facilities and certain ancillary facilities that existed at the formation of AWAC). Effective upon Alcoa Inc’s separation on 1 November 2016, immediately on and from a change in control of either Alumina or Alcoa, the exclusivity provisions would terminate.
Also effective immediately on and from a change in control of either Alumina or Alcoa are:
• Future alumina off-take rights, whereby from a date nominated by Alumina, Alumina or its acquirer will be entitled to buy, subject to its 40% ownership cap:
• its net short position (calculated as total consumption less total owned production per annum) of alumina at market price for its internal consumption; plus
• up to 1 million tonnes per annum alumina off-take, (equal to approximately 7.5% of AWAC’s current total annual production) at market prices, which it may market and sell as it sees fit;
• in all cases subject to AWAC third party customer contracts being satisfied;
• Future bauxite off-take rights, whereby from a date nominated by Alumina, Alumina or its acquirer will be entitled to buy, at market prices, up to its net short position of bauxite for internal consumption, subject to its 40% ownership cap.
• Increased opportunity for development projects and expansions, whereby if either Alumina or Alcoa Corporation wishes to expand an existing AWAC operation, develop a new project on AWAC tenements or pursue a project outside of AWAC, it is entitled to do so on a sole basis after providing 180 days for the other party to explore joint participation in the proposed project. A partner that avails itself of such an opportunity would pay for all costs related to the project, including for AWAC resources and shared facilities used, and would be entitled to all of the project’s resulting off-take.
20

STRATEGY ANALYSIS
AWAC is primarily focused on bauxite and alumina assets, and this is the key investment concern of Alumina Limited. That is, to invest in long-life, low cost bauxite and alumina assets through AWAC.
Alumina Limited and Alcoa are different companies with different shareholders and different governance requirements. While AWAC is governed by constitutional documents, in a practical sense, the reconciliation of the differing interests requires challenge, debate and negotiation. To do this well, Alumina Limited needs to have (and has) an independent understanding of the bauxite, alumina and aluminium market and views on the impact of changes in the market, in particular around capacity investment, pricing and the development of the Chinese industry. Through the role of Alumina Limited representatives on the Strategic Council and AWAC-entity boards and working with Alcoa, Alumina Limited contributes to the strategic and high-level commercial actions of AWAC.
ALUMINA LIMITED ANNUAL REPORT 2016 21
Australia Huntly & Willowdale
Brazil Trombetas (9.6%) & Juruti
Guinea Sangaredi (23%)
Suriname Moengo, Klaverblad & Kaimangrassie (closed)
Saudi Arabia Al Ba'itha (25.1%)
Australia Kwinana, Pinjarra & Wagerup
Brazil Sao Luis (39%)
Spain San Ciprian
Suriname Paranam (closed)
USA Point Comfort (curtailed)
Saudi Arabia Ras Al Khair (25.1%)
Australia Portland (55%)
Australia Kwinana
Spain San Ciprian
USA Point Comfort (curtailed)
Bauxite deposits: AWAC’s bauxite deposits have long term mining rights. Bauxite mining is planned on an incremental basis after detailed assessment of the deposits to achieve a uniform quality in the supply of blended feedstock to the relevant refinery.
Refineries: Refineries are generally located in proximity to bauxite deposits.
Smelters: The Portland aluminium smelter is supplied alumina by the Australian refineries.
Alumina Chemicals: The refineries produce chemical grade alumina as well as smelter grade alumina.
Shipping Operations: AWAC’s shipping operations use owned and chartered vessels to transport dry and liquid bulk cargoes, including bauxite, alumina, caustic soda, fuel oil, petroleum, coke and limestone.
ALL OPERATIONS 100% OWNED, UNLESS OTHERWISE INDICATED
ALCOA WORLD ALUMINA & CHEMICALS
BAUXITE MINES ALUMINIUM SMELTERSALUMINA REFINERIES ALUMINA CHEMICALS SHIPPING OPERATIONS

2. PRINCIPAL RISKS
The risk management processes are summarised in the Corporate Governance Statement located on the Company web site at www.aluminalimited.com/governance/.
Alumina Limited’s risk management framework provides for the production of a Group risk matrix, which sets out Alumina Limited’s most significant risks and the steps taken to mitigate those risks. These risks are rated on the basis of their potential impact on the current operations and profitability and/or the long term value of the Group. Set out below are some of the key risks faced by Alumina Limited. However, there are other risks not listed below associated with an investment in Alumina Limited.
• Movements in the market prices of bauxite, alumina and aluminium – AWAC’s, and hence Alumina Limited’s, performance is heavily dependent on the market prices of bauxite, alumina and aluminium, which are affected by numerous factors outside Alumina Limited’s control. These include the overall performance of world economies, the related cyclicality of industries that are significant consumers of aluminium and movement in production disproportionate to demand (whether as a result of changes to production levels at existing facilities or the development of new facilities). A fall in the market prices of bauxite, alumina and aluminium can adversely affect Alumina Limited’s financial performance. AWAC seeks to identify ways in which to lower costs of production and thus achieving a low position on the cost curve. Achieving a low position on the cost curve allows AWAC to remain competitive in the event of unfavourable market movements. AWAC and Alumina Limited generally do not undertake hedging to manage this risk.
• Fluctuations in exchange rates – while a significant proportion of AWAC’s costs are incurred in Australian dollars, its sales are denominated in US dollars. Accordingly, AWAC and Alumina’s Limited’s future profitability can be adversely affected by a strengthening of the Australian dollar against the US dollar and a strengthening against the US dollar of other currencies in which operating or capital costs are incurred by AWAC outside Australia, including the Brazilian Real. Also, given that China is a significant part of the world alumina and aluminium markets, fluctuations in the Chinese Renminbi against the US dollar could have some impact on other parts of the industry. AWAC and Alumina Limited generally do not undertake hedging activities to manage this risk.
• Increase in AWAC’s production costs or a decrease in production – AWAC’s operations are subject to conditions beyond its control that may increase its costs or decrease its production, including increases in the cost of key inputs (including energy, raw materials, labour, caustic and freight), the non-availability of key inputs (including secure energy), weather and natural disasters, fires or explosions at facilities, unexpected maintenance or technical problems, key equipment failures, disruptions to or other problems with infrastructure and supply. In addition, industrial disruptions, work stoppages, refurbishments and accidents at operations may adversely affect profitability. Some cost inputs are subject to long term contracts to increase the certainty of input pricing. AWAC’s operating and maintenance systems and business continuity planning seek to minimise the impact of non-availability of key inputs. AWAC’s portfolio restructuring and repositioning continues to ensure that operations as a whole remain competitive. AWAC also invests in capital expenditure projects that will reduce cash costs over the long term.
• AWAC structure – Alumina Limited does not hold a majority interest in AWAC, and decisions made by majority vote may not be in the best interests of Alumina Limited. There is also a risk that the Alumina Limited and Alcoa may have differing priorities. During 2016, the joint venture agreements were modified to ensure that certain key decisions require Alumina Limited’s consent by a super-majority vote.
• Greenhouse gas emission regulation – energy, specifically electricity, is a significant input in a number of AWAC’s operations, making AWAC an emitter of greenhouse gases. The introduction of regulatory change by governments in response to greenhouse gas emissions may represent an increased cost to AWAC and may affect Alumina Limited’s profitability. AWAC and Alumina Limited monitor regulatory changes, and understand their effect on AWAC.
• Political, legal and regulatory impacts – AWAC and Alumina Limited operate across a broad range of legal, regulatory or political systems. The profitability of those operations may be adversely impacted by changes in the regulatory regimes. AWAC and Alumina Limited’s financial results could be affected by new or increasingly stringent laws, regulatory requirements or interpretations, or outcomes of significant legal proceedings or investigations adverse to AWAC or Alumina Limited. This may include a change in effective tax rates or becoming subject to unexpected or rising costs associated with business operations or provision of health or welfare benefits to employees, regulations or policies.
22
AWAC is also subject to a variety of legal compliance risks. These risks include, among other things, potential claims relating to product liability, health and safety, environmental matters, intellectual property rights, government contracts, taxes and compliance with US and foreign export laws, anti-bribery laws, competition laws and sales and trading practices. Failure to comply with the laws regulating AWAC’s businesses may result in sanctions, such as fines or orders requiring positive action by AWAC, which may involve capital expenditure or the removal of licenses and/or the curtailment of operations. This relates particularly to environmental regulations. Alumina Limited and AWAC undertake a variety of compliance training and governance functions to mitigate these risks. Furthermore, AWAC maintains a spread of assets and customers across a portfolio of countries and regions to minimise disruption and concentration risk.
• Closure/impairment of assets – Alumina Limited may be required to record impairment charges as a result of adverse developments in the recoverable values of its assets. To the extent that the recoverable value of an asset is impaired, such impairment may negatively impact Alumina Limited’s profitability during the relevant period. Closure, curtailment or sale of AWAC’s operations may result in an impairment being incurred as a result of the carrying value of an asset exceeding its recoverable value, but may be necessary to ensure the ongoing competitiveness of AWAC operations.
• Customer risks – AWAC’s relationships with key customers for the supply of alumina (including Alcoa) are important to AWAC’s financial performance. The loss of key customers or changes to sales agreement could adversely affect AWAC’s and Alumina Limited’s financial performance. AWAC mitigates customer risk by having a broad customer base across many countries and regions. In addition, new alumina sales agreements are on an alumina index basis. In 2016, sales of alumina to Alcoa’s smelters were renegotiated to an alumina index basis, except for some legacy contracts totalling approximately 0.5 million tonnes.
• Debt refinancing – Alumina Limited’s ability to refinance its debt on favorable terms as it becomes due or to repay its debt, its ability to raise further finance on favorable terms, and its borrowing costs, will depend upon a number of factors, including AWAC’s operating performance, general economic conditions, political, capital and credit market conditions, external credit ratings and the reputation, performance and financial strength of Alumina Limited’s business. If a number of the risks outlined in this section eventuate (including the cyclicality of the alumina industry and adverse movements in the market prices of aluminium and alumina) and Alumina Limited’s operating performance, external credit rating or profitability is negatively impacted as a result of these risks, there is a risk that Alumina Limited may not be able to refinance expiring debt facilities or the costs of refinancing its debt may increase substantially.
Other risks include:
• an alumina and/or aluminium market in supply surplus may lead to downward price pressure;
• Chinese growth slowing further and affecting aluminium consumption and hence aluminium and alumina demand;
• Greater Chinese aluminium production at lower cost, combined with lower demand in China, may lead to a greater level of Chinese primary aluminium and semi-finished product exports, depressing the world prices of aluminium;
• Alcoa and its subsidiaries have a variety of obligations to Alumina Limited and AWAC, the fulfilment of which depends on their financial position. Adverse changes to the financial position of Alcoa and its subsidiaries could result in such obligations not being met;
• a greater outflow of aluminium stocks from warehouses’ inventories could impact the world alumina market;
• a sustained increase in the supply of cheap bauxite from Asia to China, that could lower Chinese alumina production costs;
• a technology breakthrough that could lower Chinese alumina production costs.
ALUMINA LIMITED ANNUAL REPORT 2016 23

3. REVIEW OF AWAC OPERATIONS
Following the separation of Alcoa Inc. into Alcoa Corporation and Arconic Inc. on 1 November 2016, Alcoa Corporation replaced Alcoa Inc as Alumina Limited’s joint venture partner in the AWAC joint venture.
As announced by Alumina Limited on 2 September 2016, Alcoa Inc. and Alumina Limited agreed certain changes to the governance and financial policies of the joint venture. The changes align more closely the partners’ interests in AWAC, promote faster decision-making, provide for joint input on significant decisions, improve information sharing and streamline the dispute resolution process.
The changes also simplified AWAC’s dividend and cash management policies and require that AWAC raise a limited amount of debt to fund future mutually agreed growth projects. The changes to the joint venture arrangements have not affected the nature of AWAC’s operations. Furthermore, AWAC’s portfolio restructuring and repositioning continued on under the new management with the closure of Suriname operations.
Increased third party sales of bauxite in 2016 reaffirmed the decision to create the separate mining business unit, which recognises the growing commercial value of bauxite, and the extensive resource, mining capabilities and infrastructure capacity of AWAC.
Whilst portfolio restructuring results in additional costs to AWAC, these actions are necessary to strengthen its competitive position.
MINING
AWAC’s own mines produced 37.5 million BDT of bauxite, a decrease of 0.5 million tonnes compared to 2015, which was due to the closure of the Suralco mine, offset by increased production in Australia and Brazil. The Juruti mine in Brazil set an annual production record. Including equity interests, total bauxite production in 2016 was 42.7 million BDT (2015: 43 million BDT).
24
San Ciprian
Point Comfort
Suralco
Juruti
Alumar
CBG
Ras Al Khair Al Ba’itha
Portland
MRN
Bauxite minesAWAC OPERATIONS
EQUITY INTEREST Bauxite mines
Refineries
Refineries
Smelter Location
NOVEMBER 2015 Suralco operations fully curtailed
JUNE 2016 Point Comfort fully curtailed
JANUARY 2017 Suralco operations closed
FEBRUARY 2015 San Ciprian refinery completed its conversion of energy source from oil to natural gas
APRIL 2015 12-year gas supply agreement secured
AUGUST 2015 Anglesea power station closed following the Point Henry smelter closure
APRIL 2016 Sale of equity interest in natural gas pipeline
DECEMBER 2016 WA Government approved 2.2 million bone dry tonnes (BDT) per annum bauxite export for five years
JANUARY 2017 Government assistance and long term energy contract secured allowing Portland to restart capacity lost following a power outage
Kwinana
Huntly
Pinjarra
Willowdale
Wagerup

The 2016 average cash cost per tonne of bauxite produced by AWAC’s own mines decreased by 24% to $9.8 per BDT compared to $12.8 per BDT in 2015.
Approximately $2 per BDT of the decrease was as a result of the curtailment of the higher cost Suralco mine. The balance of the decrease was predominately due to productivity improvements and the stronger US dollar against the Australian dollar and the Brazilian real.
Whilst AWAC remains focused on leveraging its strategic advantage of having mining operations generally in close proximity to its refining operations, it is also expanding its third party bauxite business.
In April 2016, AWAC announced that it signed bauxite supply contracts with customers in China, Europe and Brazil worth more than $350 million over two years. AWAC also completed its first trial cargo shipment of Western Australian bauxite to China during the first half of 2016, which has led to further orders for over 0.4 million BDT of bauxite, most of which will be satisfied during 2017.
Furthermore, on 19 December 2016, Alcoa announced that the Western Australian government had granted approval for AWAC to export approximately 2.3 million BDT annually for a period of 5 years.
In 2016 AWAC sold a total of 6.3 million BDT of bauxite to third parties and have approximately 6.8 million BDT committed sales for 2017.
During 2017 AWAC is expected to complete an incremental increase in the capacity of the Juruti mine, which could be the foundation for further expansions, and to invest in infrastructure development to facilitate further exports from Western Australia.
REFINING
Production of alumina was 12.6 million tonnes in 2016, compared to 15.1 million tonnes in 2015, and alumina shipments were 13.3 million and 15.5 million tonnes respectively. The reduction in both production and sales volume is mainly due to the closure of Suralco and curtailment of Point Comfort refineries.
The Ma’aden refinery produced 1.4 million tonnes of alumina in 2016 compared to 0.9 million tonnes in 2015 (AWAC’s share is approximately 359,000 and 220,000 respectively). The 2016 results included $42.6 million of equity losses relating to the Ma’aden joint venture, compared to $46.2 million in 2015. It is expected that production at Ma’aden refinery will achieve nameplate capacity during 2017.
* The Ma’aden joint venture mine is not included.
BAUXITE PRODUCTION (MILLION BDT)
Huntly & Willowdale CBGMRNJuruti
32.3
5.2
37.5 fromown mines
5.2 proportionalequity basis*
1.6
3.6
CASH COST PER BDT OF BAUXITE PRODUCED (OWN MINES)
2016
$9.8
2015
$12.8
Suriname
($2.0)
Other
($0.8)
Labor
($0.1)
Services
($0.1)
Energy
_
Fuel
_
12,644(54) 86
(1,741)
16
(748)15,085
2015 Suralco PointComfort
SaoLuis
SanCiprian
PinjarraWagerupKwinana
2016
* Production of AWAC’s operated refineries. Therefore, the Ma’aden joint venture refinery is not included.
ALUMINA PRODUCTION*: CHANGE BY REFINERY (KT)
ALUMINA LIMITED ANNUAL REPORT 2016 25

In 2016, sales of alumina to Alcoa’s smelters were renegotiated to an alumina index basis, except for legacy contracts totalling to approximately 0.5 million tonnes.
Therefore, approximately 84% of AWAC’s total SGA shipments were priced on spot or alumina indexed basis for 2016 compared to 79% for 2015. For 2017, SGA shipments on a spot or alumina indexed basis are expected to be approximately 85% of the total, rising to 92% in 2018.
The 2016 average realised alumina price decreased by 18% to $242 per tonne compared to $296 per tonne in 2015.
AWAC’s average 2016 cash cost per tonne of alumina produced (which includes the mining business unit at cost) decreased by 11% to $191 per tonne compared to $216 per tonne in 2015. Approximately seven dollars per tonne of the decrease is as a result of the curtailment of the higher cost Suralco mine and refinery which were fully curtailed in November 2015. The Suralco operations were subsequently closed.
The Point Comfort refinery was fully curtailed in June 2016. If this refinery was excluded from the year-end results, then 2016 cash costs would have been $187 per tonne, which would be 13% lower than the 2015 costs on the same basis. The balance of the decrease was due to productivity improvements, the stronger US dollar and lower energy costs driven by lower energy prices.
The EBITDA margin was $63 per tonne of alumina produced in 2016, a decrease of $28 per tonne compared to 2015. Lower margins were a result of the lower average realised alumina prices partially offset by lower costs of production and an increase in sales of bauxite to third parties.
SMELTING
The Portland smelter, in which AWAC has a 55% equity interest, is the remaining smelting operation in the AWAC portfolio.
AWAC’s share of aluminium production was approximately 154,000 tonnes in 2016, which is 5% lower than 2015, mostly due to a power outage in December 2016. Prior to the electrical fault the smelter had been operating at nearly 85 percent of its nameplate capacity of 358,000 metric tonnes per year. The power outage reduced production to approximately 21% of capacity.
In January, agreements were reached with the Victorian State and Australian Federal governments and energy provider AGL Energy Limited, which allow the restart of the lost smelting capacity. Restoring the curtailed production is expected to take approximately six months.
Portland’s 2016 average cash cost of aluminium per tonne produced, up to the point of molten metal exiting the potrooms, decreased by 7% to $1,471 per tonne, mainly due to lower alumina prices.
The average realised aluminium price decreased by 11% to $1,702 per tonne, mainly as a result in the weakening of the LME aluminium price.
Portland contributed $5 million in EBITDA, at a margin of $34 per tonne of aluminium produced.
($7)$4 ($3)
($11)
($9)$1
CASH COST PER TONNE OF ALUMINA PRODUCED
2015 Suralco PointComfort
Energy Bauxite Conversion 2016YTD
Caustic
$191
$216
26

4. AWAC FINANCIAL REVIEW
The decline in AWAC’s net profit was largely due to the lower average realised alumina price, which was partially offset by lower charges for significant items, net productivity improvements, lower energy costs and an increase in third party bauxite sales.
AWAC PROFIT AND LOSS (US GAAP) US$ MILLION
YEAR ENDED 31 DEC 2016
YEAR ENDED 31 DEC 2015
Net profit after tax 49.0 318.2
Add back: Income tax charge 72.3 367.1
Add back: Depreciation and amortisation 271.8 302.9
Add back: Net interest 0.4 1.3
EBITDA 393.5 989.5
Add back: Significant items (pre-tax) 363.7 375.0
EBITDA excluding significant items 757.2 1,364.5
The AWAC’s net profit included the following significant items:
SIGNIFICANT ITEMS (US GAAP) US$ MILLION
YEAR ENDED 31 DEC 2016
YEAR ENDED 31 DEC 2015
Suralco restructuring charges (132.8) (178.4)
Point Comfort restructuring charges (31.0) (85.7)
Anglesea restructuring charges (4.3) (68.2)
Gain on sale of interest in the Dampier Bunbury Gas Pipeline 27.1 –
Capital work in progress write-offs – (33.0)
Impairment in an interest in a gas field in Western Australia (72.3) –
Portland impairment charge1 (125.8) –
Other (includes severance and redundancy charges, US GAAP pension adjustment) (24.6) (9.7)
Total significant items (pre-tax) (363.7) (375.0)
Total significant items (after-tax)2 (306.2) (385.4)
1. For US GAAP purposes the Portland impairment charge was fully recognised in 2016. For AAS, the charge was recognised over the period of two years, 2016 and 2015.
2. For the year ended 31 December 2016, after-tax significant items included a $5.0 million deferred tax assets write-off in relation to the sale of DBNGP. For the year ended 31 December 2015, after-tax significant items included a $85.2 million tax charge for a revaluation of certain deferred tax assets of Suralco, which mainly related to employee benefits and the carrying forward of tax losses.
ALUMINA LIMITED ANNUAL REPORT 2016 27

AWAC BALANCE SHEET (US GAAP) US$ MILLION
31 DEC 2016 31 DEC 2015
Cash and cash equivalents 251.2 531.8
Receivables 395.7 329.1
Related party notes receivable - 113.6
Inventories 425.9 436.8
Property, plant & equipment 3,634.2 3,691.8
Other assets 2,064.5 2,032.7
Total Assets 6,771.5 7,135.8
Short term borrowings 2.2 10.0
Accounts payable 561.6 635.8
Taxes payable and deferred 184.9 306.5
Capital lease obligations & long term debt 2.7 3.6
Other liabilities 1,220.4 1,308.8
Total Liabilities 1,971.8 2,264.7
Equity 4,799.7 4,871.1
The value of assets and liabilities denominated in foreign currencies increased, mainly due to the effect of the weaker US dollar at year-end particularly against the Brazilian real.
The reduction of property plant & equipment is predominantly due to a $125.8 million impairment charge in relation to the Portland smelter offset by the increase in value of the foreign assets.
In 2015, Alcoa of Australia Limited secured a 12 year gas supply agreement, beginning in July 2020, which required a prepayment of $500 million to be made in two instalments. The first instalment of $300 million was paid in June 2015, the second and final instalment of $200 million was made in April 2016. These instalments are included in other assets (non-current) on the AWAC consolidated balance sheet in the respective reporting periods.
The other movements in other assets include an increase in the value of deferred tax assets of approximately $33 million, a reduction in investments of $135 million primarily due to the sale of DBNGP and reduction in other assets due to the $72.3 million impairment in an interest in a gas field in Western Australia.
The reduction in other liabilities includes the $74 million Alba settlement paid in January 2016. In accordance with the allocation agreement with Alcoa, the payment was funded by Alcoa as a part of its assumption of the additional 25% equity share of the Alba settlement payments and costs. The remaining instalment payments totalling $148 million will also be fully funded by Alcoa.
Further movements in other liabilities include the decrease in value of derivative contracts of approximately $53 million and severance reserves of approximately $53 million offset by an additional $115 million liabilities arising from the closure of Suriname operations.
28

AWAC CASH FLOW (US GAAP) US$ MILLION
YEAR ENDED 31 DEC 2016
YEAR ENDED 31 DEC 2015
Cash from operations (26.2) 808.9
Capital contributions arising from the allocation agreement1 74.0 71.2
Capital contributions from partners 120.0 5.9
Net movement in borrowings (7.0) (49.6)
Capital expenditure (129.9) (178.4)
Proceeds from sale of 20% interest in the DBNGP 145.0 –
Other financing and investing activities2 122.3 (54.1)
Effects of exchange rate changes on cash and cash equivalents 6.8 (42.3)
Cash flow before distributions 305.0 561.6
Distributions paid to partners (585.6) (268.0)
Net change in cash and cash equivalents (280.6) 293.6
1. Contributions by Alcoa in accordance with the allocation agreement whereby Alcoa assumes an additional 25% equity share relating to the Alba settlement payment and costs.
2. Made up of changes to capital lease obligations, related party notes receivable and other.
Cash from operations includes the final instalment of $200 million for the 12-year gas supply agreement (2015: $300 million), payment for the Alba settlement of $74 million (2015: $74 million) and payments relating to significant items.
Adjusting for the gas instalment and the Alba settlement, cash from operations would have been a positive $250.5 million, despite SGA prices falling to a multi-year low during 2016. In 2016, sustaining capital expenditure was $121.1 million compared to $171.8 million in 2015.
Significant refinery capital expenditure in 2016 included residue storage at Alumar, residue filtration at Kwinana and water treatment at Point Comfort.
The mining business unit’s capital expenditure was $27 million in 2016, which included replacement of fleet management systems, haul roads and tailing ponds uplift.
Growth capital expenditure for 2016 was $8.8 million compared to $6.6 million in 2015. The expenditure largely related to digestion improvements at the Pinjarra refinery in Western Australia and production creep at Juruti.
ALUMINA LIMITED ANNUAL REPORT 2016 29

5. ALUMINA LIMITED FINANCIAL REVIEW
ALUMINA LIMITED PROFIT AND LOSS US$ MILLION
YEAR ENDED 31 DEC 2016
YEAR ENDED 31 DEC 2015
Share of net profit of associates accounted for using the equity method 18.1 109.9
General and administrative expenses (25.7) (11.9)
Finance costs (9.1) (6.6)
Foreign exchange losses, tax and other (13.5) (3.1)
(Loss)/profit for the year after tax (30.2) 88.3
Total significant items after tax (114.9) (169.9)
Net profit after tax excluding significant items 84.7 258.2
SIGNIFICANT ITEMS (IFRS, POST-TAX) US$ MILLION
YEAR ENDED 31 DEC 2016
YEAR ENDED 31 DEC 2015
Suralco restructuring charges and deferred tax assets adjustment (57.5) (88.4)
Point Comfort restructuring charges (12.4) (34.3)
Anglesea restructuring charges (1.2) (15.4)
Portland impairment charge1 (24.7) (20.0)
Capital work in progress write-offs – (9.2)
Impairment in an interest in a gas field in Western Australia (20.2) –
Gain on sale of interest in the DBNGP 2.5 –
Other (includes severance and redundancy charges) (1.4) (2.6)
Total significant items (114.9) (169.9)
1. For US GAAP purposes the Portland impairment charge was fully recognised in 2016. For AAS the charge was recognised over the period of two years 2016 and 2015.
Alumina Limited recorded a net loss after tax of $30.2 million compared to a profit of $88.3 million in 2015.
The decline in net profit was largely due to AWAC’s decline in profitability predominantly due to the lower average realised alumina price, which was partially offset by AWAC’s lower charges for significant items.
Significant items were the result of restructuring activities to improve the portfolio mix of AWAC. These activities included the curtailment and subsequent closure of the Suralco mine and refinery and curtailment of the Point Comfort refinery, closure of the Anglesea coal mine and power station and the sale of an interest in DBNGP.
Excluding significant items, net profit would have been $84.7 million (2015: $258.2 million).
The increase in Alumina Limited’s general and administrative expenses compared to 2015 includes $14.0 million of costs arising from the Company’s actions in relation to Alcoa’s corporate separation.
Excluding the above costs, the remaining 2016 general and administrative expenses were consistent with 2015.
A change in credit rating for Alumina Limited triggered a step up in the fixed interest rate note’s coupon from 5.5% to 7.25% per annum, effective 20 November 2016. To reflect this, an interest expense adjustment of A$3.5 million (US$2.6 million) was included in finance costs.
For 2016 Alumina Limited recorded US$14.3 million of non-cash foreign exchange losses related to the return of capital from the Enterprise Partnership, an AWAC entity.
30

ALUMINA LIMITED BALANCE SHEET US$ MILLION
31 DEC 2016 31 DEC 2015
Cash and cash equivalents 8.6 9.3
Investment in associates 2,106.0 2,098.0
Other assets 3.2 3.4
Total assets 2,117.8 2,110.7
Payables 1.3 1.7
Interest bearing liabilities – non-current 92.4 110.5
Other liabilities 17.2 15.6
Total Liabilities 110.9 127.8
Net Assets 2,006.9 1,982.9
Alumina Limited’s net debt as at 31 December 2016 was $83.8 million.
Alumina Limited has $300 million of committed bank facilities, which expire as follows:
• $150 million in December 2017 (no amounts drawn under these facilities as at 31 December 2016).
• $150 million in July 2020 (no amounts drawn under these facilities as at 31 December 2016).
In addition to the bank facilities Alumina Limited has an A$125 million fixed rate note on issue, which matures on 19 November 2019.
ALUMINA LIMITED CASH FLOW US$ MILLION
YEAR ENDED 31 DEC 2016
YEAR ENDED 31 DEC 2015
Dividends received 150.2 61.4
Distributions received 0.7 1.5
Net finance costs paid (5.7) (6.5)
Payments to suppliers and employees (27.9) (12.1)
GST refund, interest received & other 1.1 (0.7)
Cash from operations 118.4 43.6
Net receipts – investments in associates 33.9 41.0
Free cash flow1 152.3 84.6
1. Free cash flow calculated as cash from operations less net investments in associates.
Alumina Limited’s free cash flow is comprised of the net capital, dividends and income distributions received from the AWAC entities offset by the Company’s general, administrative and finance costs.
Payments for suppliers and employees included $13.7 million arising from the Company’s actions in relation to Alcoa’s corporate separation.
Alumina Limited’s total receipts from AWAC during 2016 were $232.8 million ($150.9 million of dividends and distributions, and $81.9 million of capital returns).
For 2015 Alumina Limited’s total receipts from AWAC were $106.3 million, comprised of: $61.4 million of dividends, $43.4 million of capital returns and $1.5 million of distributions.
Alumina Limited’s cash contributions to AWAC during 2016 were $48.0 million compared to $2.4 million during 2015.
As a result, free cash flow was $67.7 million higher in 2016 compared to 2015.
ALUMINA LIMITED ANNUAL REPORT 2016 31
6. MARKET OUTLOOK AND GUIDANCE
In 2016, global consumption of primary aluminium grew by over 4%, with the main sectors of growth being transportation, electrical, construction, engineering and consumer durables. Aluminium demand growth of over 4% is expected for 2017. Global aluminium production in 2016 grew by over 2% and is forecast to increase by nearly 7% in 2017, reaching total global production of almost 63 million tonnes. China contributed almost 32 million tonnes of production in 2016. Although LME and Chinese warehouse stocks of aluminium fell during 2016, overall world aluminium inventories remain high and thus likely to overhang the market during 2017. Outside China, new aluminium production is expected to enter the market in 2017 from India, Norway and Vietnam.
Following the oversupply of alumina around the start of 2016 which contributed to alumina prices as low as $197 per tonne, there were significant curtailments of alumina production within China and to a lesser extent outside China. The curtailments tightened supply of alumina considerably and, together with a subsequent ramping up of aluminium capacity, led to a tighter alumina market in the second half of 2016. Various environmental audits were introduced by the Chinese Government, which coincided with unforeseen domestic transport disruptions to reduce Chinese alumina production and delivery in the second half of 2016. The global alumina balance ended 2016 with a modest deficit and an alumina price of $349 per tonne. Most of the currently curtailed capacity is likely to remain idled, although some scope remains for modest volumes to re-start if prices remain high. China, for instance, was estimated to be running at an alumina utilisation rate of 93% of installed capacity in January 2017.
Supply and demand for alumina are forecast to each grow by around 7% over 2017 and be broadly balanced. Refineries in Saudi Arabia and Indonesia are expected to ramp up to full capacity during 2017 and a new refinery is currently under construction in the United Arab Emirates due for completion in 2018.
Alumina pricing in January 2017 was influenced by on-going strong Chinese alumina demand growth, higher alumina production costs (coal in China and caustic soda globally) and a rally in LME aluminium prices. Following the Chinese Lunar New Year break, there is usually a flatter period in production and demand and a potential reduction in the world alumina price until smelting production ramps up.
Malaysia’s bauxite mining ban has been extended until March 2017 and could be extended until 2018. New alumina production in China may require some drawdown of Chinese bauxite stockpiles, even with expected larger bauxite volumes supplied to China from Brazil and Australia in 2017.
In January 2017, the Indonesian Government announced some amendments to its January 2014 minerals export ban. The amendments would appear to allow the export of bauxite from Indonesia subject to a number of conditions, key amongst them being that the exporter would need to have an alumina refinery project approved by the Government and under construction (and needing to meet six-monthly progress milestones over a five-year period). This would seem to allow some exports of higher quality bauxite ore provided that the miners, or other refiners in Indonesia, process at least 30% of their production using low grade ore. Foreign companies may only own up to 49% of the refinery project. It is premature to reliably estimate the likely impact on bauxite exports under this new policy, pending further detail on the amendments and an understanding of how the amendments will be interpreted and applied in practice. There has only been one refinery constructed in Indonesia since the ban was brought in. In any event, it appears that some bauxite exports from Indonesia are likely in the near to medium term.
Also in January 2017 another area of uncertainty as to the outlook has emerged. There have been reports that the Chinese Ministry of Environmental Protection is consulting industry on cuts to production of energy-intensive industries for seasonal pollution control reasons from November 2017 to March 2018. This could include alumina and primary aluminium and potentially lead to temporary shutdowns of up to 30% of alumina and 30% of aluminium production in the provinces of Shandong, Hebei, Henan and Shanxi over that period. Also unclear is whether this would be a one-off exercise or intended to be an annual requirement.
Over the medium to longer term, AWAC’s bauxite production costs are expected to remain relatively stable compared with the imported bauxite costs of Chinese merchant refiners. By 2025, the annual share of Chinese alumina production based on imported bauxite is expected to increase to 120 million tonnes from the 2016 total of 52 million tonnes. For these bauxite needs, it is expected that from around 2020, new and large greenfields mines outside China will be increasingly required to feed China’s growing needs.
32

AWAC GUIDANCE
The following 2017 guidance is provided to assist the understanding of the sensitivity of AWAC results to key external factors. The guidance cannot be expected to be predictive of exact results; rather it provides direction and approximate quantum of the impact on profit before tax of movements around a given base figure. Actual results will vary from those computed using the guidance. Guidance is not linear, hence significant movement away from the base rates used may result in different sensitivities. Sensitivity of each element of the guidance has been considered in isolation and no correlation with movements in other elements within the guidance has been made.
ITEM 2017 GUIDANCE
Production – alumina Approximately 12.6 million tonnes
Production – aluminium Approximately 120,000 tonnes
Bauxite third party committed sales Approximately 6.8 million tonnes
Alumina Price Index sensitivity1: +$10/t Approximately +$100 million EBITDA
Caustic price sensitivity: +$100/dry metric tonne Approximately -$90 million EBITDA
Australian $ Sensitivity: +1¢ in USD/AUD Approximately -$20 million EBITDA
Brazilian $ Sensitivity: +1¢ in BRL/USD Minimal impact
SGA shipments expected to be based on alumina price indices or spot Approximately 85% for the year
AWAC sustaining capital expenditure Approximately $140 million
AWAC growth capital expenditure Approximately $85 million
AWAC Point Comfort after tax restructuring2
Charges (IFRS) Approximately $35 million
Cash Flows Approximately $50 million
AWAC Suralco after tax restructuring2
Charges (IFRS) Approximately $10 million
Cash Flows Approximately $30 million
AWAC Point Henry and Anglesea after tax restructuring2
Charges (IFRS) Approximately $1 million
Cash Flows Approximately $40 million
1. Excludes equity accounted income/losses for the Ma’aden joint venture.2. Ongoing costs will be recognised in future financial years relating to the curtailments and closures.
ALUMINA LIMITED GUIDANCE
The financial results of Alumina Limited are dependent upon AWAC’s operational performance and profitability, and the ability of Alumina Limited to influence the performance of AWAC to ensure that the Company’s interests are protected. Alumina Limited’s objectives are to achieve the position where AWAC is sustainable in the long term, that it has adequate governance procedures in place, and that long term capital allocation is implemented to maximise AWAC’s returns.
Alumina Limited’s expectations for cash receipts from AWAC in 2017 are that total receipts by Alumina Limited should exceed its corporate needs.
In 2017, Alumina Limited anticipates there could be equity calls by AWAC entities in relation to working capital support. However, this is subject to market conditions.
ALUMINA LIMITED ANNUAL REPORT 2016 33

LETTER BY CHAIR OF THE COMPENSATION committee
34
Dear Shareholders,
It gives me pleasure to present Alumina’s 2016 remuneration report. The annual report has highlighted that 2016 has been a year of transformation for your company.
In the past, the limitations of the old AWAC joint venture structure were very real and hampered Alumina’s autonomy and strategic options. Our small executive team worked on many ideas to reshape the joint venture. However, in September 2015 when Alcoa Inc. announced their intended company separation, there was a catalyst for change. Throughout 2016, facing the prospect of the substitution of a quite different joint venture partner to replace the formerly unified Alcoa, the team worked tirelessly to protect Alumina’s shareholders’ interests and to develop and pursue strategies to strengthen the Company’s position. Whilst the board considered carefully the risks of particular negotiating strategies, Alumina’s CEO and senior executives built and positioned our case, and developing and crystallising options as negotiations ebbed and flowed. Without any doubt, the final achievement has strengthened the relationship with Alcoa Corporation and enabled Alumina Limited to participate significantly in decisions determining the growth of AWAC in the short term and allowed for more positive developments of the joint venture in the future.
In the course of the year, the Compensation Committee re-considered whether Alumina’s remuneration tools remained appropriate. The Committee concluded that a combination of the company’s Short Term Incentives (STI) and Long Term Incentive (LTI) schemes remained structurally appropriate but that the rewards could only be decided when shareholders could readily identify and value the achievements too.
For the 2016 STI determinations, the Compensation Committee tested the scorecard for performance against all elements. Then it considered the quantum of rewards in the context of returns to shareholders in the year. The Company’s 2016 financial result was a US$30.2 million loss (which after excluding significant items was a $84.7 million profit). However returns to shareholders through dividends and share price performance was strong during the year. The Committee’s view of value created as a result of the company transformation was aided by positive feedback from shareholders. In the Committee’s judgement, the achievements of the senior executive team were so significant that it recommended to the Board uplifts to the 2016 STI scorecard results based on each executive’s role in the transformation
and, their specific and demonstrable achievements. The transformation of the Company was an exceptional achievement not anticipated by the design of the STI framework. Accordingly, the 2016 STI payments exceeded the designed maximum benefits of our scheme.
In particular, I am pleased that the board recognised the CEO and the company’s General Counsel and Company Secretary for their skilful navigation and delivery of shareholder benefits ranging from improved access to cash, enhanced decision making rights, governance disciplines and an unimpeded platform for future strategic partnerships. The CEO received an STI payment of $725,000 and General Counsel and Company Secretary $500,000 for their efforts and outcomes.
On other remuneration matters:-
• The Company’s continued share price growth of 58 per cent over the year triggered 2016 LTI vesting.
• Having kept executives’ Fixed Annual Remuneration (FAR) flat in 2016, and drawing on market data, their FAR will increase by 2.5% in 2017.
• Non-Executive Director (NED) fees have not increased since 2011. The Compensation Committee has introduced a policy to review fees every other year, but with judgements still made in the context of company performance. This work considered ongoing workloads with these main conclusions – in 2017, our Chairman’s fee will increase from $375,000 to $410,000p.a., Committee chairmanship fees will be aligned with market practice and NED base fees will remain unchanged.
Finally, our CEO has moved into his fourth year of employment and delivered significant value for shareholders in his period of continued service. As a result, the Compensation Committee recommended to the Board that the share rights in his FAR (which aligns his base pay with shareholder experience) should remain subject to a three year holding lock, but vest after six months for the 2017 grant rather than eighteen months. This will allow for more flexibility in an eventual succession.
I look forward to your continued support and welcome discussion on the report.
Emma Stein Chair
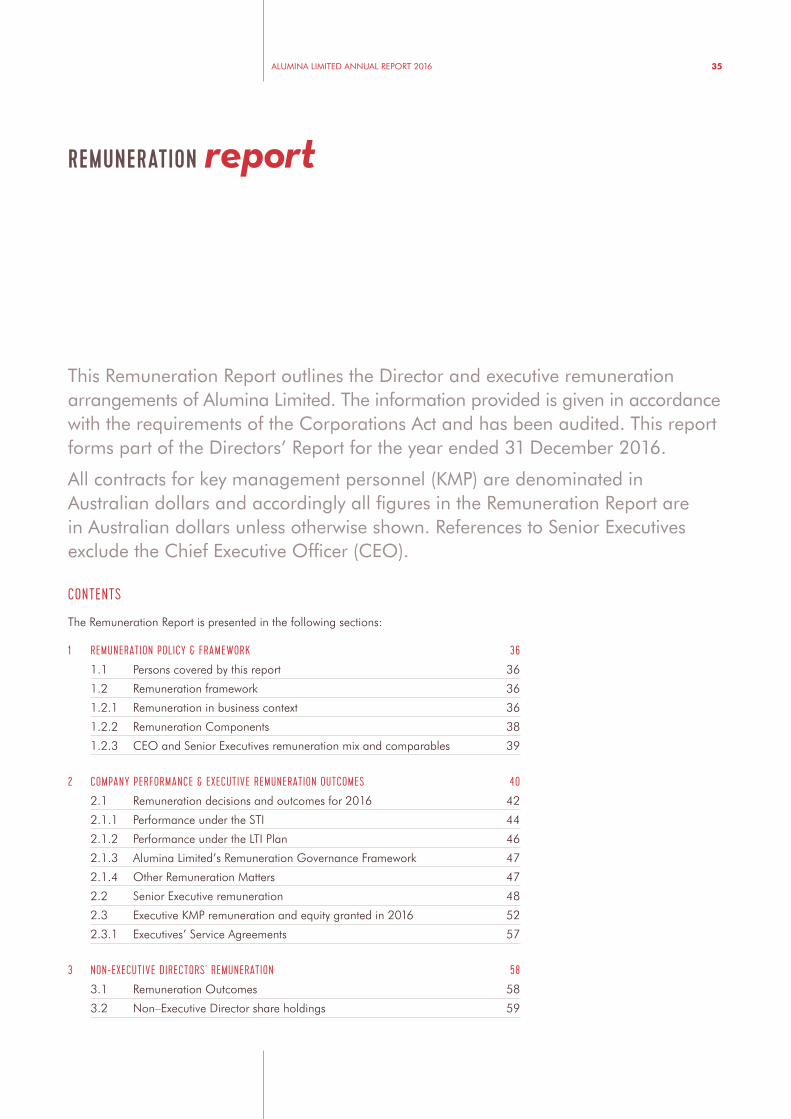
REMUNERATION report
This Remuneration Report outlines the Director and executive remuneration arrangements of Alumina Limited. The information provided is given in accordance with the requirements of the Corporations Act and has been audited. This report forms part of the Directors’ Report for the year ended 31 December 2016.
All contracts for key management personnel (KMP) are denominated in Australian dollars and accordingly all figures in the Remuneration Report are in Australian dollars unless otherwise shown. References to Senior Executives exclude the Chief Executive Officer (CEO).
CONTENTS
The Remuneration Report is presented in the following sections:
1 REMUNERATION POLICY & FRAMEWORK 36
1.1 Persons covered by this report 36
1.2 Remuneration framework 36
1.2.1 Remuneration in business context 36
1.2.2 Remuneration Components 38
1.2.3 CEO and Senior Executives remuneration mix and comparables 39
2 COMPANY PERFORMANCE & EXECUTIVE REMUNERATION OUTCOMES 40
2.1 Remuneration decisions and outcomes for 2016 42
2.1.1 Performance under the STI 44
2.1.2 Performance under the LTI Plan 46
2.1.3 Alumina Limited’s Remuneration Governance Framework 47
2.1.4 Other Remuneration Matters 47
2.2 Senior Executive remuneration 48
2.3 Executive KMP remuneration and equity granted in 2016 52
2.3.1 Executives’ Service Agreements 57
3 NON-EXECUTIVE DIRECTORS’ REMUNERATION 58
3.1 Remuneration Outcomes 58
3.2 Non–Executive Director share holdings 59
ALUMINA LIMITED ANNUAL REPORT 2016 35

1. REMUNERATION POLICY & FRAMEWORK1.1 PERSONS COVERED BY THIS REPORT
This report covers remuneration arrangements and outcomes for the following key management personnel of Alumina Limited:
NAME ROLE
Non-Executive Directors
John Pizzey Non-Executive Chairman Appointed Chairman 1 December 2011 (director since 8 June 2007)
Emma Stein Non-Executive Director Appointed 3 February 2011
Chen Zeng Non-Executive Director Appointed 15 March 2013
Peter Day Non-Executive Director Appointed 1 January 2014
Mike Ferraro Non-Executive Director Appointed 5 February 2014
Executive Director
Peter Wasow Chief Executive Officer (CEO) Appointed CEO 1 January 2014
Other KMP
Chris Thiris Chief Financial Officer (CFO) Appointed 13 December 2011
Stephen Foster General Counsel/Company Secretary Appointed 4 December 2002
Andrew Wood Group Executive Strategy & Development Employed 1 September 2008
1.2 REMUNERATION FRAMEWORK
1.2.1 REMUNERATION IN BUSINESS CONTEXTAlumina Limited’s remuneration strategy and policy has been developed in recognition of the unique nature of the Company, the complexities of managing a significant but non-controlling interest in a global joint venture and the significance of external factors’ influence on the sector and the Company’s performance.
Alumina Limited owns a 40 per cent interest in the multi-billion dollar world-wide enterprise, AWAC, the world’s largest bauxite and alumina producer. AWAC is a large capital-intensive business operating in a number of jurisdictions, some in remote locations. Alumina Limited’s executives are responsible for protecting and advancing the interests of its 53,000 shareholders in actions undertaken to manage the AWAC portfolio of assets. This was never more evident than in 2016 when the Company’s joint venture partner Alcoa Inc. (Alcoa) pursued a process to separate itself into two separate entities.
Prior to separation, Alcoa owned 60 per cent of the AWAC joint venture and additionally, was responsible for AWAC’s operational management. Post separation, that ownership of the AWAC assets would be (and now is) held by a new entity, Alcoa Corporation. Alumina Limited is invested solely in the AWAC joint venture and is bound to protect its interest and rights in the joint venture on behalf of its shareholders. Alcoa’s planned separation raised concerns that the change may disadvantage
Alumina Limited and trigger certain joint venture rights. As a result Alumina Limited’s management engaged in detailed negotiations with Alcoa to protect the interest of Alumina Limited’s shareholders.
This matter intensified when Alcoa initiated legal action seeking declarations regarding Alumina Limited’s rights under the joint venture agreements in the context of the Alcoa separation. In September 2016, an agreement was finally concluded resulting in substantive changes to the AWAC joint venture and the litigation was terminated. This agreement included a reshaped joint venture in which Alumina Limited has enhanced decision-making rights, improved access to cash flows from the underlying business, greater flexibility and more strategic options. The joint venture change was a once in a generation event and the result of a year-long process that included several months of litigation and substantial effort on behalf of Alumina Limited’s management.
In 2016 the Board also specifically directed the CEO and Senior Executives with maintaining Alumina Limited’s financial metrics consistent with investment grade rating, maximizing cash flow from AWAC and supporting the joint venture in its efforts to improve its relative cost position and strategic options. With only four key executive officers, Alumina Limited requires high calibre people with strong skills sets and commercial experience to ensure the Company and its investment are managed well. The Company and its investment are also subject to rigorous governance regimes and financial and reporting controls.
36

ALUMINA LIMITED ANNUAL REPORT 2016 37
Alumina Limited’s cash flow optimisation – above minimum joint venture dividends and year on year overhead discipline
Managing Alumina Limited’s investment as a tier one largely pure play global bauxite and alumina producer
Maximising cash flow from AWAC and maintaining Alumina Limited’s investment grade balance sheet and metrics in a highly cyclical industry
To deliver on Alumina Limited’s business strategy, the remuneration strategy has been designed to:
• Attract executives who are highly commercial, strategic and have tactical experience, and
• Be competitive in a market context.
REWARD RESULTS DELIVERED BY EXECUTIVES
• The remuneration framework gives greater prominence to strategic, corporate and commercial initiatives so that the impact of short-term financial metrics are appropriately weighted.
• When compared with peers, executives are rewarded lower levels of maximum short term incentives reflecting the Board’s intention that executive reward should not peak merely because commodities are at the ‘top of cycle’.
ALIGN COMPANY, EXECUTIVE AND BOARD AND STAKEHOLDER INTERESTS THROUGH SHARE OWNERSHIP
• The remuneration structure has been designed so that the fixed annual remuneration (FAR) and Long Term Incentive (LTI) components of the CEO’s remuneration are impacted by the Company’s share price.
• Alumina Limited has a minimum shareholding policy for Non-Executive Directors.
• Different mechanisms across all the remuneration components (FAR, Short Term Incentive (STI) and LTI) expose executives to the Company’s share price, facilitate executives in building meaningful equity positions, and some rewards are deferred so that executives are encouraged to be committed for a meaningful period of time.
REMUNERATION IN BUSINESS CONTEXTAlumina Limited’s Executives are charged with delivering on Alumina’s business strategy
The remuneration strategy is delivered via the following remuneration components:
FIXED ANNUAL REMUNERATION (FAR)
• Set to attract, retain and motivate the right talent to deliver on the Company’s strategy. The Board takes in to account individual performance, skills, expertise and experience as well as external benchmarking to determine executives’ fixed remuneration.
‘AT RISK’ REMUNERATION (STI AND LTI)
• The ‘at risk’ components are based on performance against key financial, commercial and strategic measures that are linked to generating satisfactory returns for shareholders. The STI scorecard is a vehicle for aligning executives with Company priorities as agreed by the Board and hence is part of a performance management discipline. Awarding of the STI component is also dependent on achievement of certain financial “gateway” measures.
• The LTI component involves two performance measures, one domestic and the other international. The performance measures adopted are relative TSRs to recognise that Alumina Limited must out-perform relative to other investment choices.
• More detail on the ‘at risk’ remuneration components and their link to company performance is included in section 2 of this report.
Influencing AWAC’s strategy, competitive position and options

38
1.2.2 REMUNERATION COMPONENTSThe following table sets out the different components of the CEO and Senior Executive remuneration, the performance measures used to determine the amount of remuneration executives will receive and how the performance measures drive achievement of Alumina Limited’s strategic objectives.
TABLE 1 COMPONENTS OF EXECUTIVE REMUNERATION
COMPONENT PERFORMANCE MEASURE STRATEGIC OBJECTIVE
Fixed Remuneration (FAR)
(delivered through cash and equity (share rights) for the CEO and through cash for other executives)
Considerations:
• Individual’s role and responsibilities
• Depth of knowledge and skill set
• Level of expertise and effectiveness
• Market benchmarking
Secure, retain and motivate a highly skilled and experienced executive team.
Short Term Incentive (STI) (delivered through cash for the CEO and Mr Wood and a mix of cash and equity (shares) for the CFO and General Counsel)
Corporate Scorecard (50% of STI Award)
Minimum Performance Threshold
To trigger payment under the Corporate Scorecard, a minimum threshold of performance is required being:
• The achievement of a profit after significant items; or
• The payment of a dividend to shareholders
This reinforces discipline in financial management and goal setting also providing determinable outcomes that are linked to the Company’s performance.
Financial objectives based on controllable metrics:
• Free Cash flow
• Investment rating
• Cash flow from AWAC is fundamental to Alumina Limited’s capacity to pay dividends and to meet the terms of external financing.
• A sound balance sheet with key banking relationships is critical to the Company’s strength, stability and future success.
Strategic and individual objectives • Aligned to strategic and growth objectives.
• Improve long-term cost curve positioning and strategic options to develop the business.
• Protect Alumina Limited’s interests through increased clarity on AWAC governance.
• Ensuring Alcoa treats AWAC transactions at arm’s length and Alumina Limited’s shareholders’ interests are protected in short and long term.
Personal Scorecard (50% of STI Award)
Implementation of business initiatives for which individual executives have defined accountabilities.
• Delivery on commercial and financial projects and contracts that aid AWAC’s and Alumina Limited’s performance and attribute costs fairly to the equity owners.
Long-term Incentive Plan (LTI) (delivered as equity in the form of performance rights (Performance Rights))
Three year Company TSR performance equal to or outperforming 50 per cent of the two comparator groups results (half of the LTI is attributable to each group).
• A result below 50 per cent for a group will not result in an award of equity to the Company participants for that half of the LTI.
• Emphasises the importance for management to strive to maintain the share price through the volatility involved in a capital intensive business heavily impacted by external factors.
• Linked to long-term business strategy and focuses executives on key performance drivers for sustainable growth.
• Links rewards of participants in the LTI plan to the experience of the shareholders.

ALUMINA LIMITED ANNUAL REPORT 2016 39
1.2.3 CEO AND SENIOR EXECUTIVES REMUNERATION MIX AND COMPARABLES Remuneration Mix Overview
The CEO and Senior Executives share the same remuneration principles. However, there are differences in the structures and relativities.
In setting the CEO and Senior Executive remuneration quantum and mix, the Board takes into account a number of factors including:
• The scope of the individual’s role
• Their skills and experience
• Role-critical factors
• Company performance
• External market practice.
48%
19%
AT RISKFIXED (FAR)
AT RISKFIXED (FAR)
Fixed annual remuneration (FAR) FAR Conditional rights (equity) LTI at face value (equity)STI maximum (cash)
Fixed annual remuneration LTI at face value
53% 9% 19%
33%
STI maximum (50% cash)
19%
STI maximum (50% equity)2
SENIOR EXECUTIVES1 2016 TOTAL OPPORTUNITY REMUNERATION MIX
48%
19%
AT RISKFIXED (FAR)
AT RISKFIXED (FAR)
Fixed annual remuneration (FAR) FAR Conditional rights (equity) LTI at face value (equity)STI maximum (cash)
Fixed annual remuneration LTI at face value
53% 9% 19%
33%
STI maximum (50% cash)
19%
STI maximum (50% equity)2
CEO 2016 TOTAL OPPORTUNITY REMUNERATION MIX
1. Mr Wood’s remuneration mix differs from the other senior executives. His maximum potential award is FAR 55%, STI 28% and LTI 17%. Mr Wood’s STI is received in cash only.
2. Under the terms of the STI rules, Senior Executives (other than Mr Wood) are required to apply 50 per cent of their after tax STI award in purchasing shares that must be held for three years.
CEO
The CEO’s 2016 ‘at target’ remuneration package is significantly different to the ‘at target’ profile of the previous CEO:
• The CEO’s remuneration has a higher weighting to fixed remuneration, reflective of the fact that his STI and LTI opportunity have been substantially reduced when compared to his predecessor.
• The reweighting of the CEO’s package aligns with Alumina Limited’s remuneration strategy, in particular to have lower levels of maximum short term incentives when compared with peers, reflecting the Board’s intention that executive reward should not peak merely because commodities are at the ‘top of cycle’.
• The CEO’s fixed remuneration also includes an annual share right component. As mentioned in the letter by the Chair of the Compensation Committee the share rights are subject to a service condition, and if satisfied, are deferred for three years from the date of grant. This component of the CEO’s pay is therefore subject to share price fluctuations.
• Including the LTI component of 19 per cent, the CEO has approximately 30 percent of his ‘at target’ remuneration allocated as equity. This reinforces the remuneration policy that the CEO acts in the longer term interests of the Company and its shareholders.
• The CEO’s fixed remuneration remained unchanged for 2016 when compared to the previous year.

40
2. COMPANY PERFORMANCE & EXECUTIVE REMUNERATION OUTCOMESTough market conditions prevailed in the first half of 2016 which witnessed a decline in alumina prices over the period of 33 per cent. However, despite the challenging market, the progressive strategy of restructuring AWAC’s asset portfolio and a focus on cost cutting within AWAC resulted in a solid financial performance. At the same time, considerable management resources were dedicated to pursuing the Company’s rights in the AWAC joint venture stemming from Alcoa’s proposed separation into two separate entities. Senior management vigorously sought to protect its rights in the timeframe imposed by the Alcoa separation process and legal action taken by Alcoa. In the second half of 2016, management’s diligence and endeavour resulted in amended terms of the AWAC joint venture agreements which resulted in meaningful transformational benefits that include:
• Improved control over the investment in AWAC (via enhanced governance rights) and improved capital efficiency
• Increased strategic flexibility and autonomy as a corporate entity via termination of exclusivity provisions and increased opportunity for development of projects and expansion and offtake rights for bauxite and alumina on a change of control situation.
These outcomes are the most transformational and commercially significant changes in Alumina Limited’s business since the formation of AWAC in 1995. The removal of the “poison pill” resulting from exclusivity provisions in the joint venture agreements and transforming the Company’s rights in the joint venture have unlocked significant long-term value. The changes also provide greater certainty and control of the cash flows from AWAC including the potential for access to product. There was an immediate recognition by the investors of the potential benefits of the changes to the joint venture agreements with the Company’s share price rising approximately 15 per cent in the 48 hours following the announcement.
The second half of the year also benefited from a rising alumina price. However, AWAC’s decision to close its alumina refinery and bauxite mines in Suriname, which have been fully curtailed
since November 2015, resulted in restructuring-related charges, after tax, to Alumina Limited of $57.5 million. Alumina Limited had a statutory loss of US$(30.2) million (a decrease of $118.5 million compared to the previous year) including restructuring related charges. Without those restrucuring-related charges, Alumina Limited would have reported a profit of US$84.7 million. Earnings per share were negative US1.0 cents in 2016, (US3.1 cents in 2015). AWAC distributed US$150.9million in dividends and distributions and Alumina Limited distributed a 4.7 US cents per share dividends to shareholders.
The diagrams that follow highlight Alumina Limited’s performance against market indicators.
The Board is satisfied that the CEO’s target remuneration is appropriate for Alumina Limited, as a non-operating partner of the AWAC joint venture (and his total opportunity is very modest at the 4th percentile when compared to peers of the ASX51–100). That said, the bauxite, alumina and aluminium industry is global, complex and dynamic. Moreover in 2016, Alumina Limited’s CEO led and successfully concluded the Company’s negotiations with Alcoa, reshaping the joint venture and lifting Alumina Limited’s standing within it. So, as detailed further in section 2.1 of this report, his 2016 awarded remuneration reached the 18th percentile ranking within the ASX51–100, which in the circumstances, and with reference to the enhanced shareholder value unlocked, the Board does not consider to be excessive.
ALUMINA FY16 TSR VS ASX indices 2016 (A$)
80Jan
Alumina Ltd. TSR (incl. franking credits)
ASX200 Materials Accumulation IndexASX100 Accumulation
DecFeb Mar
Announce amendmentsto AWAC joint venture
Apr May Jun Jul Aug Sep Oct Nov
100
120
140
160
180
PERC
ENTA
GE
CH
AN
GE
ALUMINA FY16 SHARE PRICE PERFORMANCE VS ASX INDICES (A$)
80Jan
Alumina Ltd.
All Ordinaries Index
DecFeb Mar
Announce amendmentsto AWAC joint venture
Apr May Jun Jul Aug Sep Oct Nov
100
120
140
160
180
ASX100 IndexASX200 Materials Index
PERC
ENTA
GE
CH
AN
GE
$0m
1. Data valid for 12 months to 30 June 2016.
ASX51–100 TOTAL AWARDED REMUNERATION 2016 ($M)1
$1m $2m $3m $4m $5m $6m
75th
Median
Wasow(18th)
25th

ALUMINA LIMITED ANNUAL REPORT 2016 41
REMUNERATION INDICATORS
REMUNERATION INDICATORS 2016 2015 2014 2013 2012
Per cent increase in fixed remuneration1 Nil 3.50% 3.00% 3.80% 3.00%
Per cent short-term incentive2 64% 38% 40% 22% 41%
Per cent long-term incentive2 23% 23% 10% 8% Nil
1. Percentage is calculated by reference to FAR as at 31 December in the stated financial year relative to FAR as at 31 December in the immediately preceding financial year.
2. Represents the average of total ‘at risk’ incentives expressed as a percentage of FAR applicable to Senior Executives and the CEO.
HISTORICAL COMPANY PERFORMANCE
2016 2015 2014 2013 2012 2011
Net (Loss)/Profit After Tax ($million)
(30.2) 88.3 (98.3) 0.5 (55.6) 126.6
Dividends declared per share (US cents per share)
6.0 6.3 1.6 – – 6.0
Percentage change in share price
58% -35% 61% 20% -21% -55%
Market Capitalisation (US$million)
3,802 2,418 4,114 2,789 2,282 2,782
Net debt ($million) 83.8 101.2 86.6 135.2 664.4 471.6

42
2.1.REMUNERATION DECISIONS AND OUTCOMES FOR 2016
TABLE 2
FIXED REMUNERATION
2016 outcomes As disclosed in last year’s report, to reflect the challenging market conditions, the fixed remuneration for the CEO and Senior Executives did not increase for 2016.
SHORT TERM INCENTIVE
2016 outcomes Corporate Scorecard
In 2016, STI payments exceeding the maximum opportunity were awarded to the CEO and Senior Executives.
The catalyst for these payments was the landmark outcome and effort required in transforming the foundational joint venture agreements and relationship between the Company and Alcoa, its joint venture partner.
At the beginning of the year, overall the renegotiation project was given a scorecard weighting of 37.5 per cent in recognition of the likely importance of the project. At the same time, the Compensation Committee emphasised to senior management that meaningful shareholder value was a pre-requisite for 2016’s STI awards.
At the end of the year, the Committee assessed performance on each element of the scorecard (Corporate and Individual), with most financial and commercial targets met. The exceedance of targets relating to the joint venture restructuring option and Alcoa separation meant the resultant average score was 107 per cent of target or 83 per cent of the maximum STI award. Having used its discretion, using the uplift factors, the Board’s final awards ranged from maximum to 138 per cent of maximum for executives (other than the CEO) reflecting their relative contribution to the restructuring outcomes.
In addition, the Committee concluded that:
• the outcome of the joint venture renegotiation had created immediate shareholder value in terms of a share price uplift and through greater certainty and control of cash flows from AWAC
• the protection measures developed to address changes brought about by Alcoa’s separation were the most significant in the history of the Company.
• the joint venture renegotiation had successfully and fundamentally transformed Alumina Limited.The renegotiation project exceeded target and was considered such a pivotal change that the STI framework for measuring its impact was not sufficient
• the significance of the once in a generation event and the transformative outcome of the joint venture re-negotiation was deserving of an uplift to the scorecard results for Mr. Wasow and in varying degrees, to the Senior Executives. The uplift factors ranged from 1.2 to 2.1 across the KMP, judged by role and specific achievements. This resulted in awards above the scorecard maximum, with the CEO and General Counsel and Company Secretary receiving meaningful uplifts.
Mr. Wasow’s STI payment of $725,000 (compared with $414,000 maximum on a scorecard basis) recognised his key role in directing the project to a successful outcome, his critical strategic and tactical decisions. He was crucial in resolving negotiations with Alcoa on the fundamental joint venture agreements that have remained virtually intact since 1995.
An independent benchmarking assessment was conducted to crosscheck whether his award was appropriate. The benchmarking was against CEO remuneration in peer group companies in the ASX51–100 and also against a select group of companies that performed strongly in 2016. The analysis indicated that in regard to Mr. Wasow:
• his STI maximum opportunity, in dollar terms , is the lowest in the ASX51–100
• even taking into consideration the uplift provided, Mr Wasow’s final STI award fell at the 36th percentile & his total awarded remuneration ranked 18th
• his total remuneration opportunity remains amongst the lowest in the ASX51–100
Mr Wasow was due to receive approximately $339,000 in STI payment compared to his maximum of $414,000 however the Board exercised its discretion in recognition of his critical contribution to the transformation project.
The Board was satisfied that Mr. Wasow’s final award is not ‘excessive’ in the context of the market and the exceptional outcomes achieved.
For a detailed summary of performance against the Corporate Scorecard see page 44.

ALUMINA LIMITED ANNUAL REPORT 2016 43
SHORT TERM INCENTIVE CONTINUED
Personal Scorecard
In 2016, in aggregate, executives performed well against the Personal Scorecard. The Compensation Committee recommended individual executive performance ratings and STI payments based on:
• assessment of Balanced scorecard outcomes
• appropriateness in the context of shareholder returns
• consideration of other factors (e.g. highly valuable outcomes which were not on the Personal Scorecard.)
For a detailed performance against the Personal Scorecard see page 45
In total, in 2016, Alumina Limited’s STI scheme paid $1,910,000 to its KMPs, which was an increase of $784,000 on 2015’s level.
Net Profit/(Loss) after tax excluding significant items
The reported full year net loss after tax of US$(30.2) million however, excluding significant items would be US$84.7 million.
In 2016, in line with the policy outlined in the 2015 Remuneration Report, when calculating STI outcomes the Board determined to exclude costs associated with the curtailment of Point Comfort and charges associated with the closure of the Suralco operations on the basis that these decisions were consistent with the strategy to reposition AWAC’s asset portfolio, and in the best long-term interest of shareholders.
Further information outlining the Board’s decision to exclude these items are outlined on page 46.
LONG TERM INCENTIVE
2016 outcomes Two tranches of Performance Rights were tested in 2016, Performance Rights granted in 2013 (retesting) and Performance Rights granted in 2014 (first and final test).
In relation to the year 2013 grant, 98 percent of the Performance Rights tested against the International Comparator Group vested on the initial test conducted in December 2015. The remaining 2 percent of Performance Rights pertaining to the International Comparator Group vested as a result of the first retest in June 2016. For the Performance Rights tested against the ASX Comparator Group (ASX component), none vested at the initial test held in December 2015. Approximately 66 percent of the ASX component tested at the first retest in June 2016 vested and the remainder vested at the second retest in December 2016. The 2013 year grant was the final tranche subject to retesting. For Performance Right grants from 2014 onwards, retesting has been abolished.
In relation to the year 2014 grant, 100 percent of the Performance Rights vested as a result of the Company’s TSR performance exceeding the maximum vesting criteria of the 75th percentile result of both the ASX and International Comparator Groups.
The ASX Comparator Group consists of Australian listed entities in the S&P/ASX 100 excluding Property Trusts and Alumina Limited; and excluding the top 20 companies by market capitalisation.
The International Comparator Group for Performance Rights tested in 2016 consisted of:
• United Company Rusal
• Shandong Nanshan Aluminium
• Hindalco Industries
• Norsk Hydro
• Century Aluminium
• Aluminium Corporation of China
• Noranda Aluminium Holdings
• Alcoa1
1. Alcoa Inc. split into two publicly-traded independent companies, Arconic Inc. and Alcoa Corporation, effective 1 November 2016. The TSR result for Alcoa was independently determined by Mercer Consulting based on a combination of the TSR of Alcoa Inc. up to 31 October 2016, and on the combined TSR of Arconic Inc. and Alcoa Corporation from 31 October 2016. As mentioned in the 2016 Remuneration Report, in 2015 the Compensation Committee conducted a rigorous review of the applicability of the companies in the International Comparator Group. Refer to Table 5 on page 49 for further detail on the composition of the International Comparator Group for the 2016 grant.
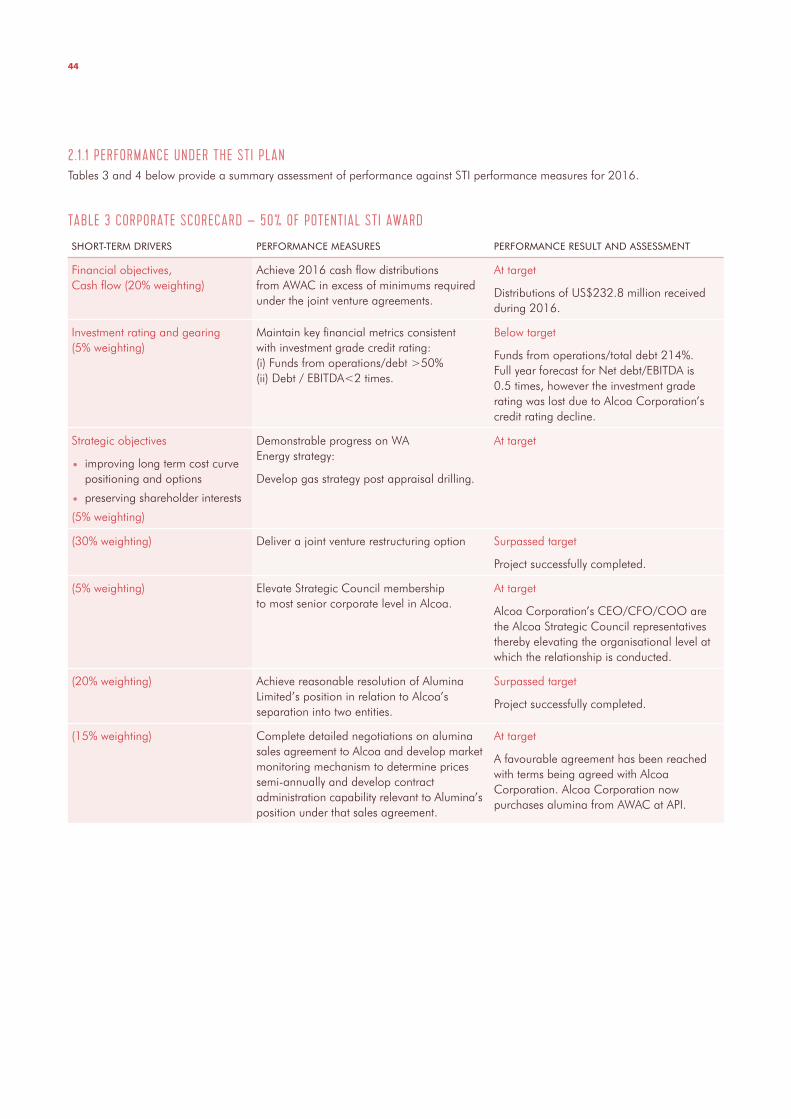
44
2.1.1 PERFORMANCE UNDER THE STI PLANTables 3 and 4 below provide a summary assessment of performance against STI performance measures for 2016.
TABLE 3 CORPORATE SCORECARD – 50% OF POTENTIAL STI AWARD
SHORT-TERM DRIVERS PERFORMANCE MEASURES PERFORMANCE RESULT AND ASSESSMENT
Financial objectives, Cash flow (20% weighting)
Achieve 2016 cash flow distributions from AWAC in excess of minimums required under the joint venture agreements.
At target
Distributions of US$232.8 million received during 2016.
Investment rating and gearing (5% weighting)
Maintain key financial metrics consistent with investment grade credit rating: (i) Funds from operations/debt >50% (ii) Debt / EBITDA<2 times.
Below target
Funds from operations/total debt 214%. Full year forecast for Net debt/EBITDA is 0.5 times, however the investment grade rating was lost due to Alcoa Corporation’s credit rating decline.
Strategic objectives
• improving long term cost curve positioning and options
• preserving shareholder interests
(5% weighting)
Demonstrable progress on WA Energy strategy:
Develop gas strategy post appraisal drilling.
At target
(30% weighting) Deliver a joint venture restructuring option Surpassed target
Project successfully completed.
(5% weighting) Elevate Strategic Council membership to most senior corporate level in Alcoa.
At target
Alcoa Corporation’s CEO/CFO/COO are the Alcoa Strategic Council representatives thereby elevating the organisational level at which the relationship is conducted.
(20% weighting) Achieve reasonable resolution of Alumina Limited’s position in relation to Alcoa’s separation into two entities.
Surpassed target
Project successfully completed.
(15% weighting) Complete detailed negotiations on alumina sales agreement to Alcoa and develop market monitoring mechanism to determine prices semi-annually and develop contract administration capability relevant to Alumina’s position under that sales agreement.
At target
A favourable agreement has been reached with terms being agreed with Alcoa Corporation. Alcoa Corporation now purchases alumina from AWAC at API.

ALUMINA LIMITED ANNUAL REPORT 2016 45
TABLE 4 PERSONAL OBJECTIVES – 50% OF POTENTIAL STI AWARD (THE APPLICATION OF PERSONAL OBJECTIVES VARY FOR EACH EXECUTIVE)
PERFORMANCE MEASURES PERFORMANCE RESULT ASSESSMENT
Resolve specific sales contract matters. (15% weighting)
At target
Agreement reached with a payment due to AWAC from Alcoa.
Hold Alumina Limited costs flat to 2015.
(10% weighting)
At target
Achieved, excluding expenses directly related in activities to finalise the joint venture restructure
Implement process and information gathering in relation to treatment of pre-existing liabilities at the Point Comfort refinery.
(10% weighting)
At target
Alcoa engaged, data gathering underway and progressing according to plan.
Protect Alumina’s rights in Suriname closure and that pre-existing liabilities are correctly allocated.
(15% weighting)
At target
Progressing according to Plan.
Review and where appropriate amend financial exposures to the demerged company in relation to cash management, trade credit, guarantees and credit support.
(15% weighting)
At target
Achieved.
Ensure AWAC is not disadvantaged on AWAC related party matters or portfolio restructuring (such as the sale of AWAC assets).
(15% weighting)
Surpassed target
Achieved.
Verify intercompany charges for AWAC and related party transactions with Alcoa and isolate separation costs
(5% weighting)
At target
Achieved.
Resolve the treatment of certain Alcoa Brazilian alumina tonnage
(15% weighting)
At target
Achieved.
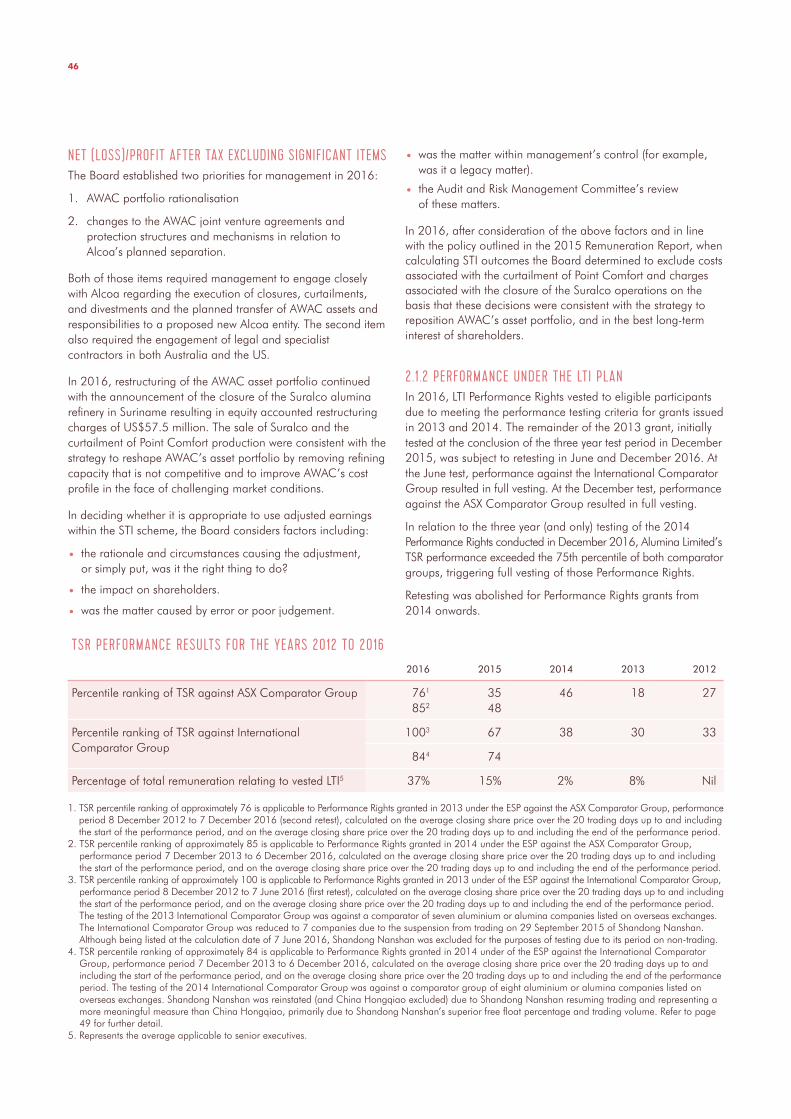
46
NET (LOSS)/PROFIT AFTER TAX EXCLUDING SIGNIFICANT ITEMSThe Board established two priorities for management in 2016:
1. AWAC portfolio rationalisation
2. changes to the AWAC joint venture agreements and protection structures and mechanisms in relation to Alcoa’s planned separation.
Both of those items required management to engage closely with Alcoa regarding the execution of closures, curtailments, and divestments and the planned transfer of AWAC assets and responsibilities to a proposed new Alcoa entity. The second item also required the engagement of legal and specialist contractors in both Australia and the US.
In 2016, restructuring of the AWAC asset portfolio continued with the announcement of the closure of the Suralco alumina refinery in Suriname resulting in equity accounted restructuring charges of US$57.5 million. The sale of Suralco and the curtailment of Point Comfort production were consistent with the strategy to reshape AWAC’s asset portfolio by removing refining capacity that is not competitive and to improve AWAC’s cost profile in the face of challenging market conditions.
In deciding whether it is appropriate to use adjusted earnings within the STI scheme, the Board considers factors including:
• the rationale and circumstances causing the adjustment, or simply put, was it the right thing to do?
• the impact on shareholders.
• was the matter caused by error or poor judgement.
• was the matter within management’s control (for example, was it a legacy matter).
• the Audit and Risk Management Committee’s review of these matters.
In 2016, after consideration of the above factors and in line with the policy outlined in the 2015 Remuneration Report, when calculating STI outcomes the Board determined to exclude costs associated with the curtailment of Point Comfort and charges associated with the closure of the Suralco operations on the basis that these decisions were consistent with the strategy to reposition AWAC’s asset portfolio, and in the best long-term interest of shareholders.
2.1.2 PERFORMANCE UNDER THE LTI PLAN In 2016, LTI Performance Rights vested to eligible participants due to meeting the performance testing criteria for grants issued in 2013 and 2014. The remainder of the 2013 grant, initially tested at the conclusion of the three year test period in December 2015, was subject to retesting in June and December 2016. At the June test, performance against the International Comparator Group resulted in full vesting. At the December test, performance against the ASX Comparator Group resulted in full vesting.
In relation to the three year (and only) testing of the 2014 Performance Rights conducted in December 2016, Alumina Limited’s TSR performance exceeded the 75th percentile of both comparator groups, triggering full vesting of those Performance Rights.
Retesting was abolished for Performance Rights grants from 2014 onwards.
TSR PERFORMANCE RESULTS FOR THE YEARS 2012 TO 2016 2016 2015 2014 2013 2012
Percentile ranking of TSR against ASX Comparator Group 761
852
35 48
46 18 27
Percentile ranking of TSR against International Comparator Group
1003 67 38 30 33
844 74
Percentage of total remuneration relating to vested LTI5 37% 15% 2% 8% Nil
1. TSR percentile ranking of approximately 76 is applicable to Performance Rights granted in 2013 under the ESP against the ASX Comparator Group, performance period 8 December 2012 to 7 December 2016 (second retest), calculated on the average closing share price over the 20 trading days up to and including the start of the performance period, and on the average closing share price over the 20 trading days up to and including the end of the performance period.
2. TSR percentile ranking of approximately 85 is applicable to Performance Rights granted in 2014 under the ESP against the ASX Comparator Group, performance period 7 December 2013 to 6 December 2016, calculated on the average closing share price over the 20 trading days up to and including the start of the performance period, and on the average closing share price over the 20 trading days up to and including the end of the performance period.
3. TSR percentile ranking of approximately 100 is applicable to Performance Rights granted in 2013 under of the ESP against the International Comparator Group, performance period 8 December 2012 to 7 June 2016 (first retest), calculated on the average closing share price over the 20 trading days up to and including the start of the performance period, and on the average closing share price over the 20 trading days up to and including the end of the performance period. The testing of the 2013 International Comparator Group was against a comparator of seven aluminium or alumina companies listed on overseas exchanges. The International Comparator Group was reduced to 7 companies due to the suspension from trading on 29 September 2015 of Shandong Nanshan. Although being listed at the calculation date of 7 June 2016, Shandong Nanshan was excluded for the purposes of testing due to its period on non-trading.
4. TSR percentile ranking of approximately 84 is applicable to Performance Rights granted in 2014 under of the ESP against the International Comparator Group, performance period 7 December 2013 to 6 December 2016, calculated on the average closing share price over the 20 trading days up to and including the start of the performance period, and on the average closing share price over the 20 trading days up to and including the end of the performance period. The testing of the 2014 International Comparator Group was against a comparator group of eight aluminium or alumina companies listed on overseas exchanges. Shandong Nanshan was reinstated (and China Hongqiao excluded) due to Shandong Nanshan resuming trading and representing a more meaningful measure than China Hongqiao, primarily due to Shandong Nanshan’s superior free float percentage and trading volume. Refer to page 49 for further detail.
5. Represents the average applicable to senior executives.

ALUMINA LIMITED ANNUAL REPORT 2016 47
2.1.3 ALUMINA LIMITED’S REMUNERATION GOVERNANCE FRAMEWORKThe Board of Directors
Reviews and approves the Charter of the Compensation Committee. The Board approves the remuneration philosophy, policies and practices.
Compensation Committee
Delegated authority to:
• Take advice from management and where relevant, independent advisers.
• Devise a remuneration framework, strategy, policies and practices.
• Oversee the implementation of the remuneration strategy and policy.
• Establish appropriate performance objectives and measures.
• Monitor performance against objectives and recommend incentive awards.
• Approve remuneration outcomes.
External Consultants
• Provide independent advice on remuneration trends and practices.
• Provide benchmarking data and analysis.
• Support the Compensation Committee in relation to changes to remuneration policy, employment contracts, structures and practices etc.
• Provide governance and legal advice on remuneration related matters.
Management
• Provides the Compensation Committee with information to assist in its remuneration decisions including remuneration recommendations.
The Compensation Committee is solely formed of Non-Executive Directors and is chaired by Ms Emma Stein.
The duties and responsibilities delegated to the Compensation Committee by the Board are set out in the Compensation Committee’s Charter, which is available on the Company’s website at www.aluminalimited.com/compensation-committee.
Remuneration Consultants
The Compensation Committee has the authority to seek advice from independent remuneration consultants on matters relating to remuneration including developing and implementing executive remuneration strategies, associated statutory obligations and the quantum of remuneration.
Alumina Limited has established protocols for the engagement of remuneration consultants and the processes to be followed regarding recommendations. Relevant executives are trained on an annual basis to ensure they understand the procedures.
In seeking remuneration advice from consultants, the Compensation Committee ensures that the advice is free from undue influence by:
• selecting the consultant
• briefing the consultant
• receiving the report directly from the consultant rather than via Company executives
• the consultant declaring that a remuneration recommendation is free from undue influence by the Key Management Personnel to whom it relates.
In 2016, no remuneration recommendation, as defined in the Corporations Act, was received.
2.1.4 OTHER REMUNERATION MATTERSClawback Policy
Alumina Limited has a Clawback Policy that provides scope for the Board to recoup incentive remuneration paid to the CEO and senior executives where:
• material misrepresentation or material restatement of Alumina Limited’s financial statements occurred as a result of fraud or misconduct by the CEO or any senior executives; and
• the CEO or senior executives received incentive remuneration in excess of that which should have been received if the Alumina Limited financial statements had been correctly reported.
The Board also may seek to recover gains from the sale or disposition of vested shares and determine to cancel unvested equity awards.
Change of Control
In the event of a change in control, the Board may bring forward the testing date for the LTI performance conditions, or waive those conditions, and/or (in the case of Performance Rights granted from 2016) shorten the exercise period for Performance Rights that have already vested or that vest subsequently. The Board may also, in its discretion, determine that cash settlement amounts will be paid in respect of any vested Performance Rights.
Cessation of Employment
On cessation of employment, prior to Performance Rights vesting, except to the extent that the Board otherwise determines in its absolute discretion within 20 business days after employment ceasing, a pro rata number of unvested Performance Rights will lapse. The number of unvested Performance Rights that lapse will be proportional to the amount of the testing period that has not yet elapsed at the time of employment ceasing. In these circumstances, the Board also has discretion under the LTI plan rules to determine, within two months of employment ceasing, that any of the remaining unvested Performance Rights are forfeited.

48
Rights issues
If a rights issue occurs, the Trustee will seek instructions from the participants in the Plan, regarding how to deal with them. If no instructions are received, the Trustee will sell the relevant rights, proceeds (sale price net of any charges) of which will be used to pay the participant.
In relation to any remaining unvested Performance Rights that do not lapse and are not forfeited, they will continue on foot under the LTI plan rules and be tested for vesting in the normal way unless the exercise period is shortened or the Board in its discretion determines that any or all performance conditions in respect of all or some of the Performance Rights will be tested at a date determined by the Board or waived, and/or cash settlement amounts will be paid in respect of Performance Rights that vest and are exercised.
Share Trading And Hedging Prohibitions
Performance Rights granted under Alumina Limited’s LTI plan must remain at risk until fully vested. This is consistent with Alumina Limited’s Share Trading Policy that prohibits Directors and employees from engaging in:
• short-term trading of any Alumina Limited securities
• buying or selling Alumina Limited securities if they possess unpublished, price-sensitive information; or
• trading in derivative products over the Company’s securities, or entering into transactions in products that limit the economic risk of their security holdings in the Company.
2.2 SENIOR EXECUTIVE REMUNERATION
TABLE 5This section outlines how the STI and LTI ‘at risk’ components of executive remuneration operate.
2016 KEY FEATURES OF THE STI PLAN KEY FEATURES OF THE LTI PLAN
Description • The Board sets financial and non-financial performance objectives at the start of each year, and company and executive performance is then assessed against each objective at the end of each year to determine whether executives receive payment under the STI plan.
• The STI is delivered in cash for the CEO and Mr Wood, and cash and equity for all other executives.
The LTI is delivered in the form of Performance Rights that are tested over a three year performance period (in the case of Performance Rights issued prior to 2014, the Performance Rights are also subject to two further tests at six months and 12 months after the initial test). Each Performance Right that vests delivers to the holder an ordinary share in Alumina Limited upon vesting (for Performance Rights granted prior to 2016) or upon vesting and exercise (for Performance Rights granted from 2016).
Performance Period Financial Year Three years
Performance levels Level of Performance
Below expectations
At Target
Maximum (with discretion to be adjusted annually)
Percentage of FAR
0% received
Mr Wasow $310,500
Mr Thiris 56%
Mr Foster 56%
Mr Wood 35%
Mr Wasow $414,000
Mr Thiris 70%
Mr Foster 70%
Mr Wood 50%
• The CEO Performance Right entitlement is limited to a maximum benefit of up to $414,000 equivalent in Alumina Limited shares (which, valued at grant date, is approximately 30 per cent of FAR)
• For Mr Thiris and Mr Foster the maximum is 40 per cent of FAR and 30 per cent for Mr Wood.
The annual dollar value of the LTI grant is divided by the average Company share price over the 20 trading days leading up to the time that the Board determined to make offers of Performance Rights to Senior Executives under the LTI plan for the relevant year, in order to determine the number of Performance Rights to be offered.

ALUMINA LIMITED ANNUAL REPORT 2016 49
2016 KEY FEATURES OF THE STI PLAN KEY FEATURES OF THE LTI PLAN
Performance hurdles • Based on a scorecard comprising of corporate (50 per cent weighting) and personal (50 per cent weighting) objectives focused on key financial outcomes for the year ahead together with critical initiatives, issues and projects (which could be at the asset, joint venture or industry level). The required performance against each objective is set against a specific quantifiable metric or a specific minimum milestone (e.g. agreement to the initiative by the joint venture and delivery of a detailed assessment of options).
• The Board is responsible for approving the scorecard. Through the year, as part of a suite of reporting, the CEO presents updates on progress against the scorecard. Details of the Corporate and Personal scorecards are set out on page 44 and 45.
• Alumina Limited’s performance is tested using relative TSR compared against two comparator groups.
• Relative TSR was chosen as a performance measure as an appropriate means of measuring Company performance as it incorporates both capital growth and dividends. The two comparator groups against which Alumina’s performance is tested are:
(Test 1 – ASX Comparator Group) S&P ASX 100 Index companies which are alternative investments for the Company’s shareholders, excluding the Company, the top 20 companies by market capitalisation and property trusts. This test is applied to half of the LTI award.
(Test 2 – International Comparator Group) reflecting the Company’s direct competitors in the market comprising eight selected companies in the alumina and/or aluminium industries that are listed in Australia or overseas, excluding the Company. This test is applied to half of the LTI award.
• In determining the companies that comprise the International Comparator Group, consideration is given to individual companys’ free float or liquidity in their shares for realistic performance measurement. As disclosed in last year’s report (following a rigorous review by the Compensation Committee in 2015), the initially approved comparator companies for the International Comparator Group for LTI grants from 2016 onwards was Alcoa, South32 (new), Chalco, Hindalco Industries, Norsk Hydro, Century Aluminium, Yunnan Aluminium (new) and China Hongqiao (new).
• China Hongqiao was introduced to replace Shandong Nanshan which had previously been included in the International Comparator Group but was initially excluded on the basis that Shandong Nanshan had temporarily ceased trading at the time. However, for grants from 2017 onwards, Shandong Nanshan has been reinstated (and China Hongqiao excluded) due to Shandong Nanshan resuming trading and representing a more meaningful measure due to superior free float percentage and trading volume.
• The Board considers the reasonableness of the International Comparator Group each year and due to the limited number of relevant companies against which to test on a like basis Alumina Limited’s performance, believes that the eight companies currently comprising the comparator group remains appropriate.

50
2016 KEY FEATURES OF THE STI PLAN KEY FEATURES OF THE LTI PLAN
Performance assessment The Compensation Committee reviews individual performance against the scorecard at year-end, taking into account actual performance outcomes and internal and external factors that may have contributed to the results. The Compensation Committee receives a report from the CEO detailing:
• financial targets and underlying assumptions.
• key activities underpinning each non-financial objective.
• management commentary around key factors and management decisions leading to performance outcomes.
• individual performance objectives and indicative performance.
In determining its recommendations to the Board on the level of STI payments, the Compensation Committee decides and, through discussion, tests:
• what weighting to apply to the individual scorecard components, weighting more highly those that had the potential to significantly impact shareholder value.
• whether each individual element was achieved.
• if an element was achieved and surpassed.
• if an element was not achieved, whether and for what reason a positive rating is given, otherwise likely to be zero.
Given the nature of the building blocks to the Alumina Limited STI scheme, a simple distinction between threshold, at target and stretch performance is not always apparent, especially at the beginning of the year. But in making its assessments as described above, the Compensation Committee is focused on a scheme which is sufficiently demanding and rewards hard-won achievements by executives.
Performance hurdles are independently measured by Mercer Consulting (Australia) at the conclusion of the relevant performance period. Alumina Limited’s TSR is ranked against the TSR of companies in each of the comparator groups.
Percentile ranking (in the relevant comparator group)
Percentage of annual vesting of Performance Rights in the relevant half of the LTI award
Below 50th percentile 0% vesting
Equal to 50th percentile
50% vesting
Between 50th & 75th percentile (ASX Comparator Group)1
An additional 2% of awards for each percentile increase
Equal to or greater than 75th percentile
100% vesting
Following testing, any Performance Rights that have not vested will lapse.
1. If the Company’s TSR performance is equal to that of any entity (or security) between the 50th percentile and the 75th percentile of the International Comparator Group ranked by TSR performance, the number of Performance Rights in the relevant half of the LTI award that vest will be equal to the vesting percentage assigned by the Board to that entity (or security). If the Company’s TSR performance is between that of any two such entities (or securities) in the International Comparator Group, the number of Performance Rights in the relevant half of the LTI award that vest will be determined on a pro-rata basis relative to the vesting percentages assigned

ALUMINA LIMITED ANNUAL REPORT 2016 51
2016 KEY FEATURES OF THE STI PLAN KEY FEATURES OF THE LTI PLAN
Retesting • Not applicable. Retesting has been abolished in respect of Performance Rights issued from 2014 onwards.
Entitlements and benefits • There is no entitlement to dividends, bonus issues or other benefits payable until the performance conditions applicable to Performance Rights are satisfied (or waived) and the Performance Rights vest (and, in the case of Performance Rights granted from 2016, are exercised).
• If the Performance Rights or a portion of the Performance Rights vest, the participant is entitled to proportionally receive all dividends and other distributions, bonus issues or other benefits payable to the Trustee in respect of the shares allocated upon such vesting (or, in the case of Performance Rights granted from 2016, upon vesting and exercise).
• For Performance Rights granted from 2016, shares are not automatically allocated upon vesting. Instead, participants are entitled to exercise each relevant Performance Right at any time during the applicable exercise period (Exercise Period) after vesting. The Exercise Period will generally end seven years after vesting of the relevant Performance Rights. However, the Exercise Period may be shortened in certain circumstances such as cessation of employment or a change of control event. Performance Rights that do not vest as at the end of the vesting period will lapse.
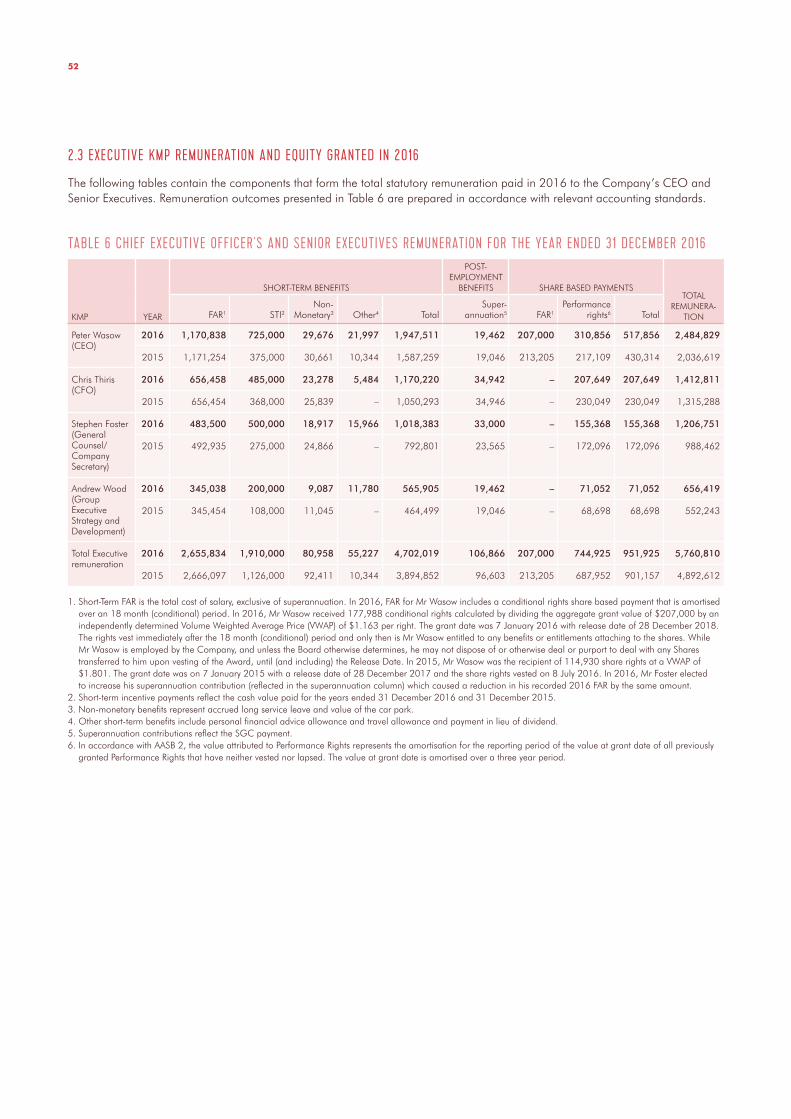
52
2.3 EXECUTIVE KMP REMUNERATION AND EQUITY GRANTED IN 2016
The following tables contain the components that form the total statutory remuneration paid in 2016 to the Company’s CEO and Senior Executives. Remuneration outcomes presented in Table 6 are prepared in accordance with relevant accounting standards.
TABLE 6 CHIEF EXECUTIVE OFFICER’S AND SENIOR EXECUTIVES REMUNERATION FOR THE YEAR ENDED 31 DECEMBER 2016
KMP YEAR
SHORT-TERM BENEFITS
POST-EMPLOYMENT
BENEFITS SHARE BASED PAYMENTSTOTAL
REMUNERA- TIONFAR1 STI2
Non- Monetary3 Other4 Total
Super- annuation5 FAR1
Performance rights6 Total
Peter Wasow (CEO)
2016 1,170,838 725,000 29,676 21,997 1,947,511 19,462 207,000 310,856 517,856 2,484,829
2015 1,171,254 375,000 30,661 10,344 1,587,259 19,046 213,205 217,109 430,314 2,036,619
Chris Thiris (CFO)
2016 656,458 485,000 23,278 5,484 1,170,220 34,942 – 207,649 207,649 1,412,811
2015 656,454 368,000 25,839 – 1,050,293 34,946 – 230,049 230,049 1,315,288
Stephen Foster (General Counsel/Company Secretary)
2016 483,500 500,000 18,917 15,966 1,018,383 33,000 – 155,368 155,368 1,206,751
2015 492,935 275,000 24,866 – 792,801 23,565 – 172,096 172,096 988,462
Andrew Wood (Group Executive Strategy and Development)
2016 345,038 200,000 9,087 11,780 565,905 19,462 – 71,052 71,052 656,419
2015 345,454 108,000 11,045 – 464,499 19,046 – 68,698 68,698 552,243
Total Executive remuneration
2016 2,655,834 1,910,000 80,958 55,227 4,702,019 106,866 207,000 744,925 951,925 5,760,810
2015 2,666,097 1,126,000 92,411 10,344 3,894,852 96,603 213,205 687,952 901,157 4,892,612
1. Short-Term FAR is the total cost of salary, exclusive of superannuation. In 2016, FAR for Mr Wasow includes a conditional rights share based payment that is amortised over an 18 month (conditional) period. In 2016, Mr Wasow received 177,988 conditional rights calculated by dividing the aggregate grant value of $207,000 by an independently determined Volume Weighted Average Price (VWAP) of $1.163 per right. The grant date was 7 January 2016 with release date of 28 December 2018. The rights vest immediately after the 18 month (conditional) period and only then is Mr Wasow entitled to any benefits or entitlements attaching to the shares. While Mr Wasow is employed by the Company, and unless the Board otherwise determines, he may not dispose of or otherwise deal or purport to deal with any Shares transferred to him upon vesting of the Award, until (and including) the Release Date. In 2015, Mr Wasow was the recipient of 114,930 share rights at a VWAP of $1.801. The grant date was on 7 January 2015 with a release date of 28 December 2017 and the share rights vested on 8 July 2016. In 2016, Mr Foster elected to increase his superannuation contribution (reflected in the superannuation column) which caused a reduction in his recorded 2016 FAR by the same amount.
2. Short-term incentive payments reflect the cash value paid for the years ended 31 December 2016 and 31 December 2015.3. Non-monetary benefits represent accrued long service leave and value of the car park.4. Other short-term benefits include personal financial advice allowance and travel allowance and payment in lieu of dividend.5. Superannuation contributions reflect the SGC payment.6. In accordance with AASB 2, the value attributed to Performance Rights represents the amortisation for the reporting period of the value at grant date of all previously
granted Performance Rights that have neither vested nor lapsed. The value at grant date is amortised over a three year period.

ALUMINA LIMITED ANNUAL REPORT 2016 53
TABLE 7 2016 STI OUTCOMESThe following table indicates the actual value of STI paid to the CEO and Senior Executives and the percentage of total potential STI paid and forfeited by each executive.
KMP YEAR STI PAID PERCENTAGE PAID
PERCENTAGE FORFEITED
Peter Wasow (CEO) 2016 725,000 175% –
2015 375,000 91% 9%
Chris Thiris (CFO) 2016 485,000 100% –
2015 368,000 76% 24%
Stephen Foster (General Counsel/Company Secretary)
2016 500,000 138% –
2015 275,000 76% 24%
Andrew Wood (Group Executive Strategy and Development)
2016 200,000 110% –
2015 108,000 59% 41%
Total Executive Remuneration 2016 1,910,000 132% –
2015 1,126,000 78% 22%

54
The terms and conditions of each grant of Performance Rights affecting remuneration in the previous, current or future reporting periods are as follows:
TABLE 8 PERFORMANCE RIGHTS GRANTED AS REMUNERATION FOR THE YEARS ENDED 31 DECEMBER 2016 AND 31 DECEMBER 2015
YEAR1 NUMBER OF PERFORMANCE
RIGHTS AS AT 1 JANUARY2
NUMBER GRANTED DURING THE YEAR
AS REMUNERATION3
VALUE OF PERFORMANCE
RIGHTS AT GRANT DATE4
NUMBER VESTED DURING YEAR5
VALUE VESTED DURING YEAR6
NUMBER LAPSED DURING YEAR7
VALUE LAPSED DURING YEAR8
VALUE AS PROPORTION OF REMUNERATION %9
NUMBER OF PERFORMANCE RIGHTS
AS AT 31 DECEMBER10
MINIMUM VALUE OF GRANTS YET TO VEST
MAXIMUM VALUE OF GRANTS YET TO VEST11
CEO
Peter Wasow 2016 647,900 356,000 $281,240 (404,000) $715,080 – – 40.10% 599,900 – $556,847
2015 404,000 243,900 $275,607 – – – – 13.58% 647,900 – $651,327
Senior Executives
Chris Thiris 2016 581,076 237,800 $187,862 (418,176) $701,329 – – 62.94% 400,700 – $371,939
2015 561,400 162,900 $184,077 (143,224) $163,991 – – 26.46% 581,076 – $564,826
Stephen Foster 2016 434,737 177,600 $140,304 (312,337) $523,828 – – 55.03% 300,000 – $278,616
2015 555,600 122,400 $138,312 (168,035) $192,400 (75,228) ($59,204) 27.47% 434,737 – $422,695
Andrew Wood 2016 174,566 94,000 $74,260 (110,166) $184,760 – – 39.46% 158,400 – $147,032
2015 195,900 64,400 $72,772 (59,241) $67,831 (26,493) ($20,850) 21.68% 174,566 – $173,078
TABLE 8.1 CONDITIONAL RIGHTS GRANTED TO THE CEO AS REMUNERATION FOR THE YEARS ENDED 31 DECEMBER 2016 AND 31 DECEMBER 2015
YEAR NUMBER OF CONDITIONAL
RIGHTS AS AT 1 JANUARY
NUMBER GRANTED DURING THE YEAR
AS REMUNERATION1
VALUE OF CONDITIONAL
RIGHTS AT GRANT DATE2
NUMBER VESTED DURING YEAR3
VALUE VESTED DURING YEAR4
NUMBER LAPSED DURING YEAR6
VALUE LAPSED DURING YEAR7
VALUE AS PROPORTION OF REMUNERATION %8
NUMBER OF CONDITIONAL RIGHTS
AS AT 31 DECEMBER9
MAXIMUM VALUE OF GRANTS YET TO VEST10
CEO
Peter Wasow 2016 114,930 177,988 $207,000 (114,930) $151,708 – – 14.44% 177,988 –
2015 164,908 114,930 $207,000 (164,908) $206,135 – – 18.21% 114,930 –
1. For Performance Rights granted on 19 February 2016, Performance Rights vest on satisfaction of the performance criteria on 7 December 2018. The eligible participant then enters an exercise period that concludes at 5:00pm (Melbourne time) on the date that is seven years after vesting. Vested ESP entitlements that are not exercised by the end of the Exercise Period will lapse (and consequently no Shares will be allocated, and no Cash Settlement Amounts will be paid, in respect of those vested ESP entitlements). However, if any of a eligible participants vested ESP entitlements would otherwise lapse at the end of the Exercise Period because of this rule, and they have not previously notified Alumina Limited that they do not wish those vested ESP entitlements to exercised, then they will be deemed to be exercised by the eligible participant. For Performance Rights granted on 5 January 2015, if at the end date for testing on 11 December 2017, less than 100 percent of the ESP entitlements vest on the basis of the performance tests, those that do not vest will lapse.
2. Includes the number of Performance Rights granted that were subject to testing in 2016.
3. Performance Rights granted on 19 February 2016 (2015: 5 January 2015) for the three year performance test period concluding 7 December 2018
(2015: 11 December 2017). The value of 2016 Performance Right at grant date was $0.79 (2015: $1.13).Value per Performance Right is independently calculated by Mercer Consulting (Australia) using the assumptions underlying the Black-Scholes methodology to produce a Monte Carlo simulation model which allows the incorporation of the hurdles that must be met before the Performance Rights vest.
4. The value of Performance Rights granted in the year reflects the value of a Performance Right, multiplied by the number of Performance Rights granted during 2016. Performance Rights were valued independently by Mercer Consulting (Australia) using the assumptions underlying the Black-Scholes methodology to produce a Monte Carlo simulation model that accommodates features associated with Alumina Limited’s ESP such as exercise, lapse and performance hurdles. The rights are those granted in 2016.
5. The number of Performance Rights that vested in 2016 due to testing of grants made in 2013 and 2014. For Performance Rights granted in 2014, 100 per cent of that tranche vested as a result of their performance exceeding the 75th percentile of the comparator groups. For Performance Rights granted in 2013, 98 per cent of that tranche tested against the International Comparator Group vested initial test in December 2015.
1. Mr Wasow receives annually, Conditional Rights to a set value as an equity component of his FAR. In 2016 the number of Conditional Rights was equal to the set value of $207,000 divided by an independently determined Volume Weighted Average Price (VWAP) which, for 2016 was $1.163 (177,988 shares).
2. Mr Wasow FAR did not increase between 2015 and 2016 therefore total value of the initial grant of Conditional Rights was $207,000.3. The number of Conditional Rights vested is the number granted in the prior year following the completion of the service condition of 18 months.4. Value vested is equal to the number of Conditional Rights that have satisifed the service condition multiplied by the share price at the time of vesting. In 2016
it was 114,930 Conditional Rights by the share price of $1.32 on 16 September 2016 (2015: 164,908 Conditional Rights by the share price of $1.25 on 24 August 2015.) Although Mr Wasow’s Conditional Rights vested at the conclusion of the 18 month service period on 8 July 2016, due to a trading lockout for employees in trading, Mr Wasow did not receive his shares until 16 September 2016 after a trading lockout was lifted.

ALUMINA LIMITED ANNUAL REPORT 2016 55
The terms and conditions of each grant of Performance Rights affecting remuneration in the previous, current or future reporting periods are as follows:
TABLE 8 PERFORMANCE RIGHTS GRANTED AS REMUNERATION FOR THE YEARS ENDED 31 DECEMBER 2016 AND 31 DECEMBER 2015
YEAR1 NUMBER OF PERFORMANCE
RIGHTS AS AT 1 JANUARY2
NUMBER GRANTED DURING THE YEAR
AS REMUNERATION3
VALUE OF PERFORMANCE
RIGHTS AT GRANT DATE4
NUMBER VESTED DURING YEAR5
VALUE VESTED DURING YEAR6
NUMBER LAPSED DURING YEAR7
VALUE LAPSED DURING YEAR8
VALUE AS PROPORTION OF REMUNERATION %9
NUMBER OF PERFORMANCE RIGHTS
AS AT 31 DECEMBER10
MINIMUM VALUE OF GRANTS YET TO VEST
MAXIMUM VALUE OF GRANTS YET TO VEST11
CEO
Peter Wasow 2016 647,900 356,000 $281,240 (404,000) $715,080 – – 40.10% 599,900 – $556,847
2015 404,000 243,900 $275,607 – – – – 13.58% 647,900 – $651,327
Senior Executives
Chris Thiris 2016 581,076 237,800 $187,862 (418,176) $701,329 – – 62.94% 400,700 – $371,939
2015 561,400 162,900 $184,077 (143,224) $163,991 – – 26.46% 581,076 – $564,826
Stephen Foster 2016 434,737 177,600 $140,304 (312,337) $523,828 – – 55.03% 300,000 – $278,616
2015 555,600 122,400 $138,312 (168,035) $192,400 (75,228) ($59,204) 27.47% 434,737 – $422,695
Andrew Wood 2016 174,566 94,000 $74,260 (110,166) $184,760 – – 39.46% 158,400 – $147,032
2015 195,900 64,400 $72,772 (59,241) $67,831 (26,493) ($20,850) 21.68% 174,566 – $173,078
TABLE 8.1 CONDITIONAL RIGHTS GRANTED TO THE CEO AS REMUNERATION FOR THE YEARS ENDED 31 DECEMBER 2016 AND 31 DECEMBER 2015
YEAR NUMBER OF CONDITIONAL
RIGHTS AS AT 1 JANUARY
NUMBER GRANTED DURING THE YEAR
AS REMUNERATION1
VALUE OF CONDITIONAL
RIGHTS AT GRANT DATE2
NUMBER VESTED DURING YEAR3
VALUE VESTED DURING YEAR4
NUMBER LAPSED DURING YEAR6
VALUE LAPSED DURING YEAR7
VALUE AS PROPORTION OF REMUNERATION %8
NUMBER OF CONDITIONAL RIGHTS
AS AT 31 DECEMBER9
MAXIMUM VALUE OF GRANTS YET TO VEST10
CEO
Peter Wasow 2016 114,930 177,988 $207,000 (114,930) $151,708 – – 14.44% 177,988 –
2015 164,908 114,930 $207,000 (164,908) $206,135 – – 18.21% 114,930 –
The remainder of the Rights tested against the International Comparator Group vested at the first retest in June 2016. For the 2013 Performance Rights tested against the ASX Comparator Group, none vested at the initial test conducted in December 2015. Approximately 66 per cent of the ASX component tested at the first retest in June 2016 vested and the remainder vested at the second retest in December 2016.
6. The value of Performance Rights vested is determined by the number of vested Rights multiplied by the market price at the vesting date. The 2013 Performance Rights retested in June 2016 did not vest to the senior executives until 21 September 2016 due to an internal embargo on trading in the Company’s shares while the Company was in negotiations with Alcoa on their separation and the pending court action against Alumina Limited. On settlement of the negotiations and the termination of the court action, the trading lockout was lifted and shares awarded vested to the account of the senior executives on 21 September 2016. The 2014 Performance Rights, tested in December 2016, vested to the account of the senior executives on 15 December 2016.
7. The number of the Performance Rights that did not meet the criteria for vesting and are not subject to further testing and therefore lapsed. 100 per cent of the 2013 and 2014 Performance Rights granted, vested in 2016 (refer note 4 above). Therefore, no Performance Rights lapsed in 2016. In 2015, approximately 55 percent of the Performance Rights granted on 9 March 2012 did not vest and therefore lapsed.
8. Value is nil due to no Performance Rights lapsing in 2016.9. Value of granted and vested Performance Rights represented as a percentage
of total remuneration.10. Number of Performance Rights granted subject to future testing.11. Maximum value of Performance Rights subject to future testing. Maximum
value is determined by multiplying the number of untested Performance Rights by the fair value that is independently calculated by Mercer Consulting (Australia) using the assumptions underlying the Black-Scholes methodology to produce a Monte Carlo simulation model which allows the incorporation of the hurdles that must be met before the Performance Right vest. The minimum value of the Performance Rights for any given year is zero.
6. No Conditional Rights lapsed7. No Conditional Rights lapsed8. Percentage proportion of remuneration is determined by value of granted and vested Conditional Rights as a percentage of total remuneration.9. Number of Conditional Rights yet to meet the service condition and have not lapsed.10. The maximum value of the Conditional Rights is based on the number of rights that vest and are released at the expiration of the three year restricted
period multiplied by share price on the date of release.

56
SENIOR EXECUTIVE SHAREHOLDINGTABLE 9 SENIOR EXECUTIVE SHAREHOLDINGS FOR THE YEARS ENDED 31 DECEMBER 2016 AND 31 DECEMBER 2015
BALANCE OF SHARES AS AT
1 JANUARY1
SHARES ACQUIRED DURING THE YEAR UNDER EMPLOYEE
SHARE PLAN2
OTHER SHARES ACQUIRED DURING
THE YEAR
SHARES SOLD DURING THE YEAR
BALANCE OF SHARES HELD AT
31 DECEMBER
Peter Wasow 2016 214,908 404,000 114,930 (278,000) 455,838
2015 50,000 – 164,908 – 214,908
Chris Thiris 2016 263,224 418,176 132,600 – 814,000
2015 69,500 143,224 50,500 – 263,224
Stephen Foster 2016 511,842 312,337 125,538 (210,000) 739,717
2015 346,304 168,035 37,503 (40,000) 511,842
Andrew Wood 2016 111,010 110,166 – (71,176) 150,000
2015 51,769 59,241 – – 111,010
1. Balance of shares held at 1 January and 31 December of the respective years include directly held, and nominally held shares, and shares held by personally related entities.
2. Includes vested 2013 Performance Rights that were tested in June 2016 and December 2016 and 2014 Performance Rights that were tested in December 2016.

ALUMINA LIMITED ANNUAL REPORT 2016 57
2.3.1 EXECUTIVES’ SERVICE AGREEMENTSRemuneration and other terms of employment for executives are formalised in service agreements. The service agreements specify the components of remuneration, benefits and notice periods. Participation in the STI and LTI plans is subject to the Board’s discretion. On cessation of employment, all executives are entitled to a pro-rata payment of long service leave (after three or more years of continuous service) and accrued annual leave.
In addition, Mr Wasow is entitled to obtain personal financial advice up to a maximum of $3,000 per annum and receive an additional 10 days of paid leave for each completed year of service.
Major provisions of the agreements relating to remuneration are set out below.
Termination benefits are within the limits set by the Corporations Act 2001 (Cth) such that they do not require shareholder approval.
TERM OF AGREEMENT AND NOTICE PERIOD
TERMINATION PAYMENTS1
Peter Wasow
No fixed term
12 month written notice from either party. Mr Wasow’s employment may be terminated immediately for any conduct that would justify summary dismissal.
• A severance payment of 2.5 weeks per complete year of service, pro-rated for completed months of service.
• 13 weeks ex gratia payment.
• Number of shares equal to the granted conditional rights that would have vested during notice period.
• Company may make a discretionary payment in lieu of some or all of the notice period.
• If the Board determines that he is a good leaver, any unvested conditional share rights that have been granted and would have vested had he remained in employment during any period for which he is paid in lieu of notice, will immediately vest and the applicable shares will be transferred to him upon termination.
• If the Board determine that his status is not that of a good leaver, the shares received on vesting may be subject to immediate forfeiture.
Chris Thiris and Stephen Foster
No fixed term
Six month notice from the Company, three month notice from Mr Thiris and Mr Foster
An additional payment which is the greater of:
• A payment equivalent to six months Base Remuneration; or
• A payment comprising:
• Notice payment (the greater of 12 weeks or notice provided within employment contract).
• severance payment of 2.5 weeks per complete year of service, pro-rated for completed months of service; and
• nine weeks ex gratia payment.
Andrew Wood
No fixed term,
Four month notice from the Company, two month notice from Mr Wood
An additional payment which is the greater of:
• A payment equivalent to six months Base Remuneration; or
• A payment comprising:
• Notice payment (the greater of 12 weeks or notice provided within employment contract).
• severance payment of 2.5 weeks per complete year of service, pro-rated for completed months of service; and
• six weeks ex gratia payment.
1. Payable upon termination with notice and without the cause (eg for reasons other than unsatisfactory performance) and suitable alternative employment is not offered or if they do not accept other employment or in the event of a significant change (which is defined to be if Alumina Limited ceases to be listed on the ASX or if there is a significant change to the executives status and/or responsibilities that is detrimental to the executive). Calculated according to the “Base Remuneration”, which is defined as FAR for Mr Wasow; and FAR + STI at target for Mr Thiris, Mr Foster and Mr Wood. The above termination entitlements are subject to any restrictions imposed by the Corporations Act.

58
3. NON-EXECUTIVE DIRECTORS REMUNERATION
The maximum remuneration for Non-Executive Directors is determined by resolution of shareholders. At the 2016 AGM, shareholders approved a maximum aggregate remuneration of $1,500,000 per annum for Non-Executive Directors. A total of $1,117,670 was paid in Non-Executive Director fees in 2016.
In 2016 Non-Executive Director’s base fees remained unchanged from the fee level set in 2011. In addition to the base fee, Non-Executive Directors receive fees for participation on the Board Committees and Superannuation Guarantee Contributions.
Committee Member $10,000 (aggregate)
Compensation Committee Chair $15,000
Audit & Risk Committee Chair $15,000
Other Committee Chair $10,000
Non-Executive Directors participation on Board Committees is set out on page 16.
Non-Executive Directors do not receive any other retirement benefits or performance based incentives, rights or options.
The Board reviewed Non-Executive Directors’ fees and determined in the context of business conditions that there would be no increase for the 2016 year.
3.1 REMUNERATION OUTCOMESNon-Executive Directors’ remuneration details are set out below in Table 10.
TABLE 10
SHORT-TERM BENEFITS POST EMPLOYMENT TOTAL REMUNERATION
FEES – CASH NON-MONETARY BENEFITS
SUPERANNUATION GUARANTEE1
John Pizzey 2016 357,008 – 19,462 376,470
2015 357,425 – 19,045 376,470
Emma Stein 2016 174,193 – 16,557 190,750
2015 174,174 – 16,576 190,750
Chen Zeng 2016 159,262 – 15,138 174,400
2015 159,430 – 14,969 174,399
Peter Day 2016 174,193 – 16,557 190,750
2015 174,174 – 16,576 190,750
Mike Ferraro 2016 169,216 – 16,084 185,300
2015 169,198 – 16,102 185,300
Total 2016 1,033,872 – 83,798 1,117,670
2015 1,034,216 – 82,033 1,117,669
1. Non-Executive Directors receive, in addition to their fees, a SGC. The applicable rate for 2016 was 9.5 per cent. For 2015, the applicable rate was 9.5 per cent. Non-Executive Directors do not receive any other retirement benefits.

ALUMINA LIMITED ANNUAL REPORT 2016 59
3.2 NON–EXECUTIVE DIRECTOR SHARE HOLDINGS
Each Non-Executive Director is required to hold shares in the Company having a value at least equal to 50 per cent of their annual base fees at the expiry of five years from appointment as a director. The requirement is satisfied when shares are acquired or by the expiry of the five year term. In 2016, all Non-Executive Directors satisfied this Company policy for minimum shareholding.
TABLE 11 NON–EXECUTIVE DIRECTOR SHAREHOLDINGS FOR THE YEARS ENDED 31 DECEMBER 2016 AND 31 DECEMBER 2015
BALANCE OF SHARES AS AT 1 JANUARY1
OTHER SHARES ACQUIRED DURING THE YEAR
BALANCE OF SHARES HELD AT 31 DECEMBER
John Pizzey 2016 82,111 – 82,111
2015 65,445 16,6662 82,111
Emma Stein 2016 75,808 – 75,808
2015 58,408 17,400 75,808
Chen Zeng3 2016 4,804 – 4,804
2015 4,804 – 4,804
Peter Day4 2015 75,720 – 75,720
2015 54,800 20,920 75,720
Mike Ferraro5 2016 25,000 43,000 68,000
2015 – 25,000 25,000
1. Balance of shares held at 1 January and 31 December of the respective years include directly held shares, nominally held shares, and shares held by personally related entities.
2. Shares acquired in November 2015 were inadvertently not reported in 2015 and have been inserted for completeness3. Mr Zeng is a nominee of CITIC and CITIC holds 527,032,812 ordinary fully paid shares in Alumina Limited.4. Mr Ferraro purchased 43,000 shares indirectly via the trustee company of the Ferraro Super Fund, of which Mr Ferraro is a beneficiary.
This report is made in accordance with a resolution of the Directors.
GJ Pizzey Chairman 23 March 2017

FINANCIAL report
The financial report covers the consolidated entity consisting of Alumina Limited (the Company) and its subsidiaries. The financial report is presented in US dollars.
Alumina Limited is a Company limited by shares, incorporated and domiciled in Australia. Its registered office and principal place of business is: Alumina Limited, Level 12, IBM Centre, 60 City Road, Southbank Victoria 3006.
A description of the nature of the consolidated entity’s operations and its principal activities is included in the operating and financial review on pages 19– 33 of the annual report. The operating and financial review is not part of this financial report.
The financial report was authorised for issue by the Directors on 23 March 2017.
Through the use of the internet, we have ensured that our corporate reporting is timely and complete. All press releases, financial reports and other information are available at our Investor Centre on our website: www.aluminalimited.com.
CONTENTS
CONSOLIDATED FINANCIAL STATEMENTS
Consolidated Statement of Profit or Loss and Other Comprehensive Income 61
Consolidated Balance Sheet 62
Consolidated Statement of Changes in Equity 63
Consolidated Statement of Cash Flows 64
NOTES TO THE CONSOLIDATED FINANCIAL STATEMENTS FOR THE YEAR ENDED 31 DECEMBER 2016
ABOUT THIS REPORT 65
GROUP STRUCTURE AND AWAC PERFORMANCE 66
1. Segment Information 66
2. Investments In Associates 67
3. Investments In Controlled Entities 70
FINANCIAL AND CAPITAL RISK 71
4. Financial Assets And Liabilities 71
5. Financial Risk Management 73
6. Capital Management 77
KEY NUMBERS
7. Expenses 78
8. Income Tax Expense 79
9. Equity 82
10. Cash Flow Information 83
OTHER INFORMATION
11. Related Party Transactions 84
12. Share-Based Payments 85
13. Remuneration Of Auditors 86
14. Commitments And Contingencies 86
15. Events Occurring After The Reporting Period 86
16. Parent Entity Financial Information 87
17. Deed Of Cross Guarantee 89
18. New Accounting Standards And Interpretations Not Yet Adopted 91
SIGNED REPORTS
Directors’ Declaration 92
Independent Auditor’s Review Report to the Members of Alumina Limited 93
60

CONSOLIDATED STATEMENT OF PROFIT OR LOSS AND OTHER COMPREHENSIVE INCOME FOR THE YEAR ENDED 31 DECEMBER 2016
NOTES US$ MILLION
2016 2015
Revenue from continuing operations 0.6 0.1
Share of net profit of associates accounted for using the equity method 2(c) 18.1 109.9
General and administrative expenses 7(a) (25.7) (11.9)
Change in fair value of derivatives/foreign exchange losses (14.1) (3.2)
Finance costs 7(b) (9.1) (6.6)
(Loss)/profit before income tax (30.2) 88.3
Income tax expenses 8 – –
(Loss)/profit for the year attributable to the owners of Alumina Limited (30.2) 88.3
Other comprehensive income/(loss)
Items that may be reclassified to profit or loss
Share of reserve movements accounted for using the equity method 4.4 (0.7)
Foreign exchange translation difference 9(b) 178.5 (452.2)
Items that will not be reclassified to profit or loss
Re-measurements of retirement benefit obligations accounted for using the equity method 9(b) 7.5 32.0
Other comprehensive income/(loss) for the year, net of tax 190.4 (420.9)
Total comprehensive income/(loss) for the year attributable to the owners of Alumina Limited 160.2 (332.6)
Earnings per share for (loss)/profit from continuing operations attributable to the ordinary equity holders of the Company:
Basic earnings per share 9(a) (1.0¢) 3.1¢
Diluted earnings per share 9(a) (1.0¢) 3.1¢
The above consolidated statement of profit or loss and other comprehensive income should be read in conjunction with the accompanying notes.
61

CONSOLIDATED BALANCE SHEET AS AT 31 DECEMBER 2016
NOTES US$ MILLION
2016 2015
CURRENT ASSETS
Cash and cash equivalents 4(a) 8.6 9.3
Receivables 0.1 –
Other assets 3.0 3.3
Total current assets 11.7 12.6
NON-CURRENT ASSETS
Investment in associates 2(c) 2,106.0 2,098.0
Property, plant and equipment 0.1 0.1
Total non-current assets 2,106.1 2,098.1
TOTAL ASSETS 2,117.8 2,110.7
CURRENT LIABILITIES
Payables 1.3 1.7
Provisions 0.3 0.2
Other liabilities 0.1 0.2
Total current liabilities 1.7 2.1
NON-CURRENT LIABILITIES
Borrowings 4(b) 92.4 110.5
Derivative financial instruments 4(c) 16.2 14.7
Provisions 0.6 0.5
Total non-current liabilities 109.2 125.7
TOTAL LIABILITIES 110.9 127.8
NET ASSETS 2,006.9 1,982.9
EQUITY
Contributed equity 9(a) 2,682.9 2,682.9
Treasury shares 9(a) – (1.4)
Reserves 9(b) (1,125.3) (1,305.9)
Retained earnings 449.3 607.3
TOTAL EQUITY 2,006.9 1,982.9
The above consolidated balance sheet should be read in conjunction with the accompanying notes.
62

CONSOLIDATED BALANCE SHEET AS AT 31 DECEMBER 2016
NOTES US$ MILLION
2016 2015
CURRENT ASSETS
Cash and cash equivalents 4(a) 8.6 9.3
Receivables 0.1 –
Other assets 3.0 3.3
Total current assets 11.7 12.6
NON-CURRENT ASSETS
Investment in associates 2(c) 2,106.0 2,098.0
Property, plant and equipment 0.1 0.1
Total non-current assets 2,106.1 2,098.1
TOTAL ASSETS 2,117.8 2,110.7
CURRENT LIABILITIES
Payables 1.3 1.7
Provisions 0.3 0.2
Other liabilities 0.1 0.2
Total current liabilities 1.7 2.1
NON-CURRENT LIABILITIES
Borrowings 4(b) 92.4 110.5
Derivative financial instruments 4(c) 16.2 14.7
Provisions 0.6 0.5
Total non-current liabilities 109.2 125.7
TOTAL LIABILITIES 110.9 127.8
NET ASSETS 2,006.9 1,982.9
EQUITY
Contributed equity 9(a) 2,682.9 2,682.9
Treasury shares 9(a) – (1.4)
Reserves 9(b) (1,125.3) (1,305.9)
Retained earnings 449.3 607.3
TOTAL EQUITY 2,006.9 1,982.9
The above consolidated balance sheet should be read in conjunction with the accompanying notes.
CONSOLIDATED STATEMENT OF CHANGES IN EQUITY FOR THE YEAR ENDED 31 DECEMBER 2016
NOTES US$ MILLION
CONTRIBUTED EQUITY1 RESERVES
RETAINED EARNINGS TOTAL
Balance as at 1 January 2015 2,618.8 (853.0) 658.2 2,424.0
Profit for the year – – 88.3 88.3
Other comprehensive (loss)/income for the year – (452.9) 32.0 (420.9)
Transactions with owners in their capacity as owners:
Dividends paid – – (171.2) (171.2)
Dividend reinvestment plan 9(a) 62.9 – – 62.9
Movement in treasury shares 9(a) (0.2) – – (0.2)
Balance as at 31 December 2015 2,681.5 (1,305.9) 607.3 1,982.9
Balance as at 1 January 2016 2,681.5 (1,305.9) 607.3 1,982.9
Loss for the year – – (30.2) (30.2)
Other comprehensive income/(loss) for the year – 182.9 7.5 190.4
Transactions with owners in their capacity as owners:
Dividends paid – – (135.3) (135.3)
Movement in treasury shares 9(a) 1.4 – – 1.4
Movement in share based payments reserve – (2.3) – (2.3)
Balance as at 31 December 2016 2,682.9 (1,125.3) 449.3 2,006.9
1. Treasury shares have been deducted from contributed equity.
The above consolidated statement of changes in equity should be read in conjunction with the accompanying notes.
63

CONSOLIDATED STATEMENT OF CASH FLOWS FOR THE YEAR ENDED 31 DECEMBER 2016
NOTES US$ MILLION
2016 2015
Cash flows from operating activities
Payments to suppliers and employees (inclusive of goods and services tax) (27.9) (12.1)
GST refund received 0.9 0.4
Dividends received from associates 150.2 61.4
Distributions received from associates 0.7 1.5
Finance costs paid (7.2) (8.4)
Interest paid under cross currency interest rate swap (3.5) (3.3)
Interest received under cross currency interest rate swap 5.0 5.2
Other 0.2 (1.1)
Net cash inflow from operating activities 10(a) 118.4 43.6
Cash flows from investing activities
Payments to investments in associates (48.0) (2.4)
Proceeds from return of invested capital 81.9 43.4
Net cash inflow from investing activities 2(c) 33.9 41.0
Cash flows from financing activities
Proceeds from borrowings 30.0 110.0
Repayment of borrowings (50.0) (100.0)
Dividends paid (135.3) (108.2)
Net cash outflow from financing activities (155.3) (98.2)
Net decrease in cash and cash equivalents (3.0) (13.6)
Cash and cash equivalents at the beginning of the financial year 9.3 24.9
Effects of exchange rate changes on cash and cash equivalents 2.3 (2.0)
Cash and cash equivalents at the end of the financial year 4(a) 8.6 9.3
The above consolidated statement of cash flows should be read in conjunction with the accompanying notes.
64

NOTES TO THE CONSOLIDATED FINANCIAL STATEMENTS FOR THE YEAR ENDED 31 DECEMBER 2016
ABOUT THIS REPORT
Alumina Limited (Company or parent entity) is a for profit company limited by shares incorporated and domiciled in Australia whose shares are publicly traded on the Australian Securities Exchange. The consolidated financial report of the Group for the year ended 31 December 2016 was authorised for issue in accordance with a resolution of the Directors on 23 March 2017.
The consolidated financial report is a general purpose financial report which:
• incorporates assets, liabilities and results of operations of wall Alumina Limited’s subsidiaries and equity accounts its associates. For the list of the Company’s associates and subsidiaries refer Notes 2(a) and 3 respectively.
• has been prepared in accordance with the requirements of the Corporations Act 2001, Australian Accounting Standards (AAS) and Interpretations issued by the Australian Accounting Standards Board (AASB). Alumina Limited is a for profit entity for the purpose of preparing the financial statements.
• complies with International Financial Reporting Standards (IFRS) as issued by the International Accounting Standards Board.
• has been prepared under historical cost convention, as modified by the revaluation of certain financial assets and liabilities (including derivative instruments) at fair value through profit or loss.
• the Company is of a kind referred to in the Australian Securities and Investments Commission Corporations Instrument 2016/191, relating to the “rounding off” of amounts in the financial report. Amounts in the financial report have been rounded off in accordance with that Legislative Instrument to the nearest hundred thousand dollars, and presented in US dollars, except where otherwise required.
• adopts all new and amended Accounting Standards and Interpretations issued by the AASB that are effective for the annual reporting beginning 1 January 2016.
• does not early adopt Accounting Standards and Interpretations that have been issued or amended but are not yet effective.
• presents reclassified comparative information where required for consistency with the current year’s presentation.
THE NOTES TO THE FINANCIAL STATEMENTS
The notes include information, which is required to understand the financial statements and is material and relevant to the operations, financial position and performance of the Group. Information is considered material and relevant if, for example:
• the amount in question is significant because of its size or nature.
• it is important for the understanding of the results of the Group.
• it relates to an aspect of the Group’s operations that is important to its future performance.
The notes are organised into the following sections:
• Group structure and AWAC performance: explains the group structure and information about AWAC’s financial position and performance and its impact on the Group.
• Financial and capital risk: provides information about the Group’s financial assets and liabilities and discusses the Group’s exposure to various financial risks and explains how these affect the Group’s financial position and performance and what the Group does to manage these risks. It also describes capital management objectives and practices of the Group.
• Key numbers: provides a breakdown of individual line items in the financial statements that the Directors consider most relevant and summarises the accounting policies, judgements and estimates relevant to understanding these line items.
• Other Information: provides information on items, which require disclosure to comply with Australian Accounting Standards and other regulatory pronouncements. However, they are not considered critical in understanding the financial performance of the Group and are not immediately related to the individual line items in the financial statements.
ACCOUNTING POLICIES
Significant and other accounting policies that summarise the measurement basis used and are relevant to the understanding of the financial statements are provided throughout the notes to the financial statements.
NOTES TO THE CONSOLIDATED FINANCIAL STATEMENTS 65FOR THE YEAR ENDED 31 DECEMBER 2016

ABOUT THIS REPORT (CONTINUED)
FOREIGN CURRENCY TRANSLATION
The consolidated financial statements are presented in US dollars, which is Alumina Limited’s presentation and functional currency.
Foreign currency transactions are translated into functional currency using the exchange rates prevailing at the dates of these transactions. Foreign exchange gains and losses resulting from the settlement of such transactions and from the translation at year-end exchange rates of monetary assets and liabilities denominated in foreign currencies are recognised in the profit or loss, except when they are deferred in other equity as qualifying cash flow hedges and qualifying net investment hedges or are attributable to part of the net investment in a foreign operation.
The results and financial position of the Group entities and associates that have a functional currency different from the presentation currency are translated into the presentation currency as follows:
• assets and liabilities for each balance sheet presented are translated at the closing rate at the date of that balance sheet.
• income and expenses are translated at average exchange rates (unless this is not a reasonable approximation of the cumulative effect of the rates prevailing on the transaction dates, in which case income and expenses are translated at the dates of the transactions).
• all resulting exchange differences are recognised in other comprehensive income.
• on consolidation, exchange differences arising from the translation of any net investment in foreign entities, and of borrowings and other financial instruments designated as hedges of such investments, are recognised in other comprehensive income. When a foreign operation is sold, its proportionate share of such exchange differences are reclassified to the profit or loss, as part of the gain or loss on sale.
GROUP STRUCTURE AND AWAC PERFORMANCE
1. SEGMENT INFORMATION
Alumina Limited’s sole business undertaking is in the global bauxite, alumina and aluminium industry, which it conducts primarily through bauxite mining and alumina refining. All of those business activities are conducted through its 40% investments in AWAC. Alumina Limited’s equity interests in AWAC form a reportable segments. A full description of Alumina Limited’s business model is included in the operating and financial review on pages 19– 33 of the Annual Report.
The equity interest in AWAC is represented by investments in a number of entities in different geographical locations (refer Note 2(a)).
YEAR ENDED 31 DECEMBER 2016 US$ MILLION
AUSTRALIA BRAZIL OTHER TOTAL
Investments in Associates 1,043.1 761.2 301.7 2,106.0
Other assets 6.4 5.1 0.3 11.8
Liabilities (110.9) – – (110.9)
Consolidated net assets 938.6 766.3 302.0 2,006.9
YEAR ENDED 31 DECEMBER 2015 US$ MILLION
Australia Brazil Other Total
Investments in Associates 1,132.3 617.4 348.3 2,098.0
Other assets 12.0 0.4 0.3 12.7
Liabilities (127.8) – – (127.8)
Consolidated net assets 1,016.5 617.8 348.6 1,982.9
NOTES TO THE CONSOLIDATED FINANCIAL STATEMENTS FOR THE YEAR ENDED 31 DECEMBER 2016
66

2. INVESTMENTS IN ASSOCIATES
(A) ALCOA WORLD ALUMINA AND CHEMICALS
Alumina Limited has an interest in the following entities forming AWAC:
NAMEPRINCIPAL ACTIVITIES
COUNTRY OF INCORPORATION
PERCENTAGE OWNERSHIP
2016 2015
Alcoa of Australia Limited Bauxite, alumina & aluminium production Australia 40 40
Alcoa World Alumina LLC Bauxite and alumina production America 40 40
Alumina Espanola S.A. Alumina production Spain 40 40
Alcoa World Alumina Brasil Ltda. Bauxite and alumina production Brazil 40 40
AWA Saudi Ltda. Bauxite and alumina production Hong Kong 40 40
Enterprise Partnership Finance lender Australia 40 40
The audited combined financial statements of the entities forming AWAC are prepared in accordance with Accounting Principles Generally Accepted in the United States of America (US GAAP). Alcoa of Australia Limited and Enterprise Partnership (AWAC entities) further issue audited financial statements prepared in accordance with the requirements of the Corporations Act 2001, Australian Accounting Standards and interpretations issued by Australian Accounting Standards Board.
For the remaining AWAC entities, adjustments are made to convert the accounting policies under US GAAP to Australian Accounting Standards. The principal adjustments are to the valuation of inventories from last in first-out basis to a basis equivalent to weighted average cost, create an additional asset retirement obligation for dismantling, removal and restoration of certain refineries and differences in the recognition of actuarial gains and losses on certain defined pension plans and the reversal of certain fixed asset uplifts included in Alcoa World Alumina Brasil Ltda.
In arriving at the value of these GAAP adjustments, Management is required to use accounting estimates and exercise judgement in applying the Group’s accounting policies. The note below provides an overview of the areas that involved a higher degree of judgement or complexity.
(B) CRITICAL ACCOUNTING ESTIMATES AND JUDGEMENTS
Estimates and judgements are continually evaluated and are based on historical experience and other factors, including expectations of future events that may have a financial impact on the Group and that are believed to be reasonable under the circumstances. The resulting accounting estimates will by definition, seldom equal the related actual results. The estimates and judgements that have a significant risk of causing a material adjustment to the carrying amounts of assets and liabilities within the next financial year are disclosed below.
Retirement benefit obligations
The Group recognised a net liability for retirement benefit obligations under the defined benefit superannuation arrangements through its investment in AWAC. All plans are valued in accordance with AASB 119 Employee Benefits. These valuations require actuarial assumptions to be made. All re-measurements are recognised in other comprehensive income.
Asset retirement obligations
The estimated costs of rehabilitating mined areas and restoring operating sites are reviewed annually and fully provided at the present value. The amount of obligations recognised under US GAAP by AWAC is adjusted to be in compliance with IFRS. This requires judgemental assumptions regarding the extent of reclamation activities required, plant and site closure and discount rates to determine the present value of these cash flows.
Carrying value of investments in associates
The Group assesses at each reporting period whether there is objective evidence that the investment in associates is impaired by:
• Performing an impairment trigger assessment to consider whether indicators of impairment exist;
• Calculating the value in use of the investment in AWAC using a discounted cash flow model (“DCF model”); and
• Comparing the resulting value to the book value.
The key assumptions used in the DCF model to estimate future cash flows are those relating to future aluminium and alumina prices, energy prices and exchange rates. Key assumptions are determined with reference to industry participants and brokers’ forecasts, commodity and currency forward curves, industry consultant views and brokers’ consensus.
NOTES TO THE CONSOLIDATED FINANCIAL STATEMENTS 67FOR THE YEAR ENDED 31 DECEMBER 2016

2. INVESTMENTS IN ASSOCIATES (CONTINUED)
These cash flows are then discounted to net present value using the weighted average cost of capital (WACC) of 9.5%.
Furthermore, the following sensitivity analyses (stress testing) are performed over the value in use calculations:
• Commodities, including aluminium, alumina, caustic, coal, oil and gas price fluctuation (plus or minus 10%). AWAC’s future cash flows are more sensitive to alumina price fluctuations.
• Currency rate fluctuation (plus or minus 10%).
• Increased discount rate (WACC).
As a final check, the book value of the investment in associates is compared to Alumina Limited’s market capitalisation and to major analysts’ valuations.
An impairment loss is recognised for the amount by which the asset’s carrying amount exceeds its recoverable amount. The recoverable amount is the higher of an asset’s fair value less costs to sell and value in use.
No impairment loss was recognised in the years ended 31 December 2016 and 31 December 2015.
(C) SUMMARISED FINANCIAL INFORMATION FOR AWAC
The information disclosed in the tables below reflects the amounts presented in the AWAC financial statements amended to reflect adjustments made by Alumina Limited when using equity method, including adjustments for differences in accounting policies.
SUMMARISED BALANCE SHEET US$ MILLION
2016 2015
Current assets 1,180.4 1,504.9
Non-current assets 5,726.7 5,643.0
Current liabilities (1,127.1) (1,311.6)
Non-current liabilities (1,282.7) (1,436.9)
Net assets 4,497.3 4,399.4
Group Share as a percentage 40% 40%
Group Share in dollars 1,799.0 1,759.7
Goodwill 175.8 175.8
Net value of mineral rights and bauxite assets 107.0 109.2
Deferred tax liability (DTL) on mineral rights and bauxite assets (34.9) (35.5)
Allocation of Alba settlement 59.1 88.8
Carrying value 2,106.0 2,098.0
Reconciliation of carrying amount:
Opening carrying value 1 January 2,098.0 2,514.5
Net additional (return)/funding in AWAC entities (33.9) (41.0)
Profit for the year 18.1 109.9
Other comprehensive loss for the year 174.7 (422.5)
Dividends and distributions paid (150.9) (62.9)
Closing net assets 2,106.0 2,098.0
NOTES TO THE CONSOLIDATED FINANCIAL STATEMENTS FOR THE YEAR ENDED 31 DECEMBER 2016
68

2. INVESTMENTS IN ASSOCIATES (CONTINUED)
SUMMARISED STATEMENT OF PROFIT OR LOSS AND OTHER COMPREHENSIVE INCOME US$ MILLION
2016 2015
Revenues 4,057.1 5,380.4
Profit from continuing operations 48.9 278.5
Profit for the year 48.9 278.5
Other comprehensive income/(loss) for the year 475.8 (1,052.3)
Total comprehensive income/(loss) for the year 524.7 (773.8)
Group Share of profit for the year as a percentage 40% 40%
Group Share of profit for the year in dollars 19.6 111.4
Mineral rights and bauxite amortisation (2.1) (2.1)
Movement in deferred tax liability on mineral rights and bauxite assets 0.6 0.6
Share of profit from associate accounted for using equity method 18.1 109.9
Dividends and distributions received from AWAC 150.9 62.9
(D) COMMITMENTS AND CONTINGENT LIABILITIES IN RESPECT OF AWAC
St Croix proceedings
Lockheed Martin Corporation (“Lockheed”) filed a complaint (the “Lockheed Action”) against Virgin Islands Aluminium Company (“Vialco”) and its parent Glencore Xstrata Plc (“Glencore”) in the United States District Court, Southern District of New York following Lockheed’s settlement of environmental lawsuits previously brought by the Government of the US Virgin Islands against Lockheed and Vialco in connection with the past ownership and operation of the alumina refinery.
Glencore demanded that St Croix Alumina LLC (“SCA”) and Alcoa World Alumina LLC (“AWA”), AWAC entities, indemnify Glencore from any losses incurred as a result of the Lockheed Action under the 19 July 1995 Acquisition Agreement (the “1995 Agreement”) between Vialco and AWA pursuant to which SCA purchased the refinery from Vialco. AWA has denied that it owes Glencore any such obligation of indemnity and has filed a declaratory judgement action in Delaware seeking clarification of its rights and obligations under the 1995 Agreement.
By order dated 8 February 2016, the court granted AWA’s motion and denied Glencore’s motion, resulting in AWA not being liable to indemnify Glencore for the Lockheed action. On 17 February 2016, Glencore filed notice of its application for interlocutory appeal of the 8 February ruling. AWA and SCA filed an opposition to that application on 29 February 2016. On 10 March 2016, the court denied Glencore’s motion for interlocutory appeal and on the same day entered judgment on claims other than Glencore’s claims for costs and fees it incurred in defending and settling the earlier Superfund action brought against Glencore by the Government of the Virgin Islands.
On 29 March 2016, Glencore filed a withdrawal of its notice of interlocutory appeal and on 6 April 2016, Glencore filed an appeal of the court’s 10 March 2016 judgement to the Delaware Supreme Court which set the appeal for argument for 2 November 2016. On 4 November 2016, the Delaware Supreme Court affirmed the judgement of the Delaware Superior Court. Remaining in the case are Glencore’s claims for costs and fees it incurred related to the previously described Superfund action; these claims are not material.
Other claims
There are potential obligations that may result in a future obligation due to the various lawsuits and claims and proceedings which have been, or may be, instituted or asserted against entities within AWAC, including those pertaining to environmental, product liability, safety and health and tax matters. While the amounts claimed may be substantial, the ultimate liability cannot now be determined because of the considerable uncertainties that existed at balance date. Also, not every plaintiff has specified the amount of damages sought in their complaint. Therefore, it is possible that results of operations or liquidity in a particular period could be materially affected by certain contingencies. Pursuant to the terms of the AWAC Formation Agreement, Arconic Inc, Alcoa Corporation and Alumina Limited have agreed to remain liable for Extraordinary Liabilities (as defined in the agreement) as well as for certain other pre-formation liabilities, such as environmental conditions, to the extent of their pre-formation ownership of the AWAC’s entity or asset with which the liability is associated.
NOTES TO THE CONSOLIDATED FINANCIAL STATEMENTS 69FOR THE YEAR ENDED 31 DECEMBER 2016
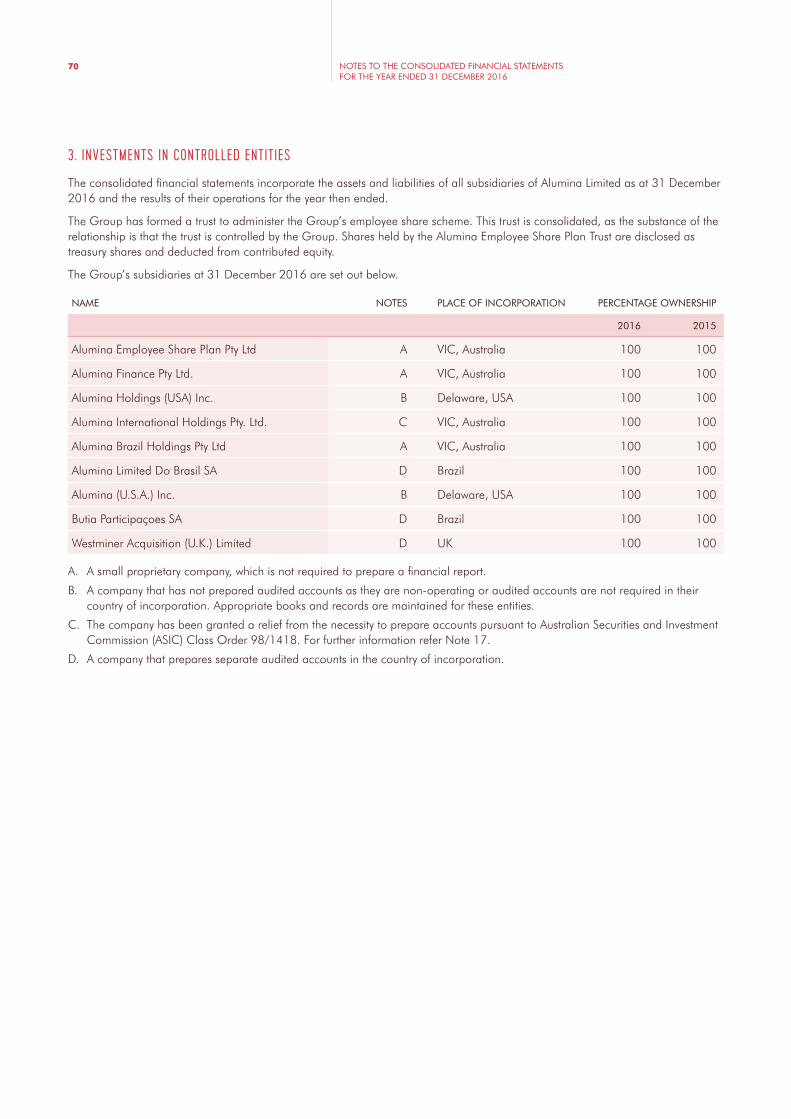
3. INVESTMENTS IN CONTROLLED ENTITIES
The consolidated financial statements incorporate the assets and liabilities of all subsidiaries of Alumina Limited as at 31 December 2016 and the results of their operations for the year then ended.
The Group has formed a trust to administer the Group’s employee share scheme. This trust is consolidated, as the substance of the relationship is that the trust is controlled by the Group. Shares held by the Alumina Employee Share Plan Trust are disclosed as treasury shares and deducted from contributed equity.
The Group’s subsidiaries at 31 December 2016 are set out below.
NAME NOTES PLACE OF INCORPORATION PERCENTAGE OWNERSHIP
2016 2015
Alumina Employee Share Plan Pty Ltd A VIC, Australia 100 100
Alumina Finance Pty Ltd. A VIC, Australia 100 100
Alumina Holdings (USA) Inc. B Delaware, USA 100 100
Alumina International Holdings Pty. Ltd. C VIC, Australia 100 100
Alumina Brazil Holdings Pty Ltd A VIC, Australia 100 100
Alumina Limited Do Brasil SA D Brazil 100 100
Alumina (U.S.A.) Inc. B Delaware, USA 100 100
Butia Participaçoes SA D Brazil 100 100
Westminer Acquisition (U.K.) Limited D UK 100 100
A. A small proprietary company, which is not required to prepare a financial report.
B. A company that has not prepared audited accounts as they are non-operating or audited accounts are not required in their country of incorporation. Appropriate books and records are maintained for these entities.
C. The company has been granted a relief from the necessity to prepare accounts pursuant to Australian Securities and Investment Commission (ASIC) Class Order 98/1418. For further information refer Note 17.
D. A company that prepares separate audited accounts in the country of incorporation.
NOTES TO THE CONSOLIDATED FINANCIAL STATEMENTS FOR THE YEAR ENDED 31 DECEMBER 2016
70
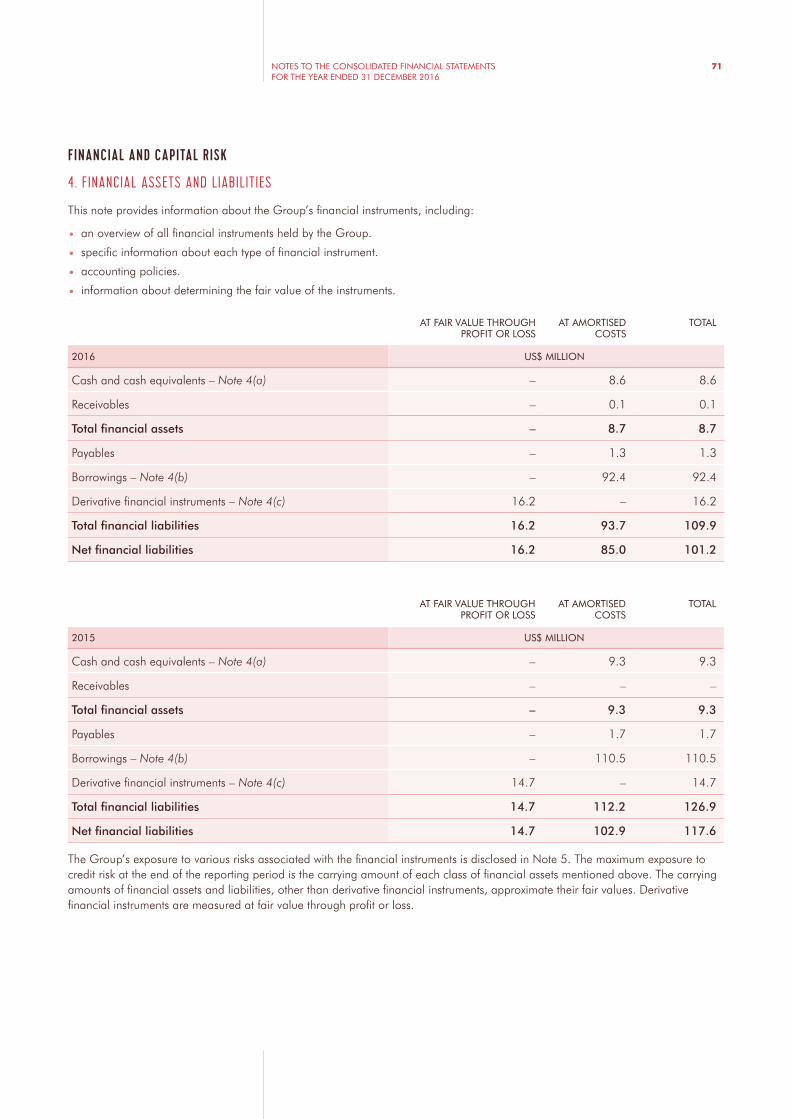
FINANCIAL AND CAPITAL RISK
4. FINANCIAL ASSETS AND LIABILITIES
This note provides information about the Group’s financial instruments, including:
• an overview of all financial instruments held by the Group.
• specific information about each type of financial instrument.
• accounting policies.
• information about determining the fair value of the instruments.
AT FAIR VALUE THROUGH PROFIT OR LOSS
AT AMORTISED COSTS
TOTAL
2016 US$ MILLION
Cash and cash equivalents – Note 4(a) – 8.6 8.6
Receivables – 0.1 0.1
Total financial assets – 8.7 8.7
Payables – 1.3 1.3
Borrowings – Note 4(b) – 92.4 92.4
Derivative financial instruments – Note 4(c) 16.2 – 16.2
Total financial liabilities 16.2 93.7 109.9
Net financial liabilities 16.2 85.0 101.2
AT FAIR VALUE THROUGH PROFIT OR LOSS
AT AMORTISED COSTS
TOTAL
2015 US$ MILLION
Cash and cash equivalents – Note 4(a) – 9.3 9.3
Receivables – – –
Total financial assets – 9.3 9.3
Payables – 1.7 1.7
Borrowings – Note 4(b) – 110.5 110.5
Derivative financial instruments – Note 4(c) 14.7 – 14.7
Total financial liabilities 14.7 112.2 126.9
Net financial liabilities 14.7 102.9 117.6
The Group’s exposure to various risks associated with the financial instruments is disclosed in Note 5. The maximum exposure to credit risk at the end of the reporting period is the carrying amount of each class of financial assets mentioned above. The carrying amounts of financial assets and liabilities, other than derivative financial instruments, approximate their fair values. Derivative financial instruments are measured at fair value through profit or loss.
NOTES TO THE CONSOLIDATED FINANCIAL STATEMENTS 71FOR THE YEAR ENDED 31 DECEMBER 2016
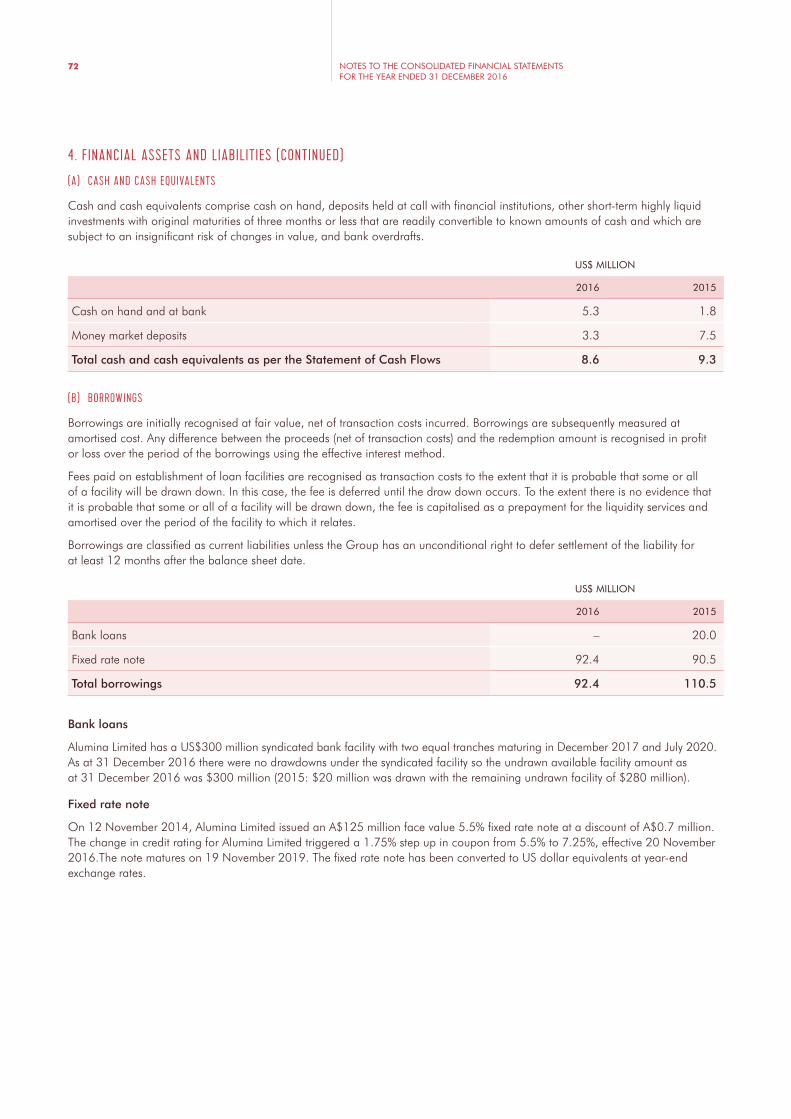
4. FINANCIAL ASSETS AND LIABILITIES (CONTINUED)
(A) CASH AND CASH EQUIVALENTS
Cash and cash equivalents comprise cash on hand, deposits held at call with financial institutions, other short-term highly liquid investments with original maturities of three months or less that are readily convertible to known amounts of cash and which are subject to an insignificant risk of changes in value, and bank overdrafts.
US$ MILLION
2016 2015
Cash on hand and at bank 5.3 1.8
Money market deposits 3.3 7.5
Total cash and cash equivalents as per the Statement of Cash Flows 8.6 9.3
(B) BORROWINGS
Borrowings are initially recognised at fair value, net of transaction costs incurred. Borrowings are subsequently measured at amortised cost. Any difference between the proceeds (net of transaction costs) and the redemption amount is recognised in profit or loss over the period of the borrowings using the effective interest method.
Fees paid on establishment of loan facilities are recognised as transaction costs to the extent that it is probable that some or all of a facility will be drawn down. In this case, the fee is deferred until the draw down occurs. To the extent there is no evidence that it is probable that some or all of a facility will be drawn down, the fee is capitalised as a prepayment for the liquidity services and amortised over the period of the facility to which it relates.
Borrowings are classified as current liabilities unless the Group has an unconditional right to defer settlement of the liability for at least 12 months after the balance sheet date.
US$ MILLION
2016 2015
Bank loans – 20.0
Fixed rate note 92.4 90.5
Total borrowings 92.4 110.5
Bank loans
Alumina Limited has a US$300 million syndicated bank facility with two equal tranches maturing in December 2017 and July 2020. As at 31 December 2016 there were no drawdowns under the syndicated facility so the undrawn available facility amount as at 31 December 2016 was $300 million (2015: $20 million was drawn with the remaining undrawn facility of $280 million).
Fixed rate note
On 12 November 2014, Alumina Limited issued an A$125 million face value 5.5% fixed rate note at a discount of A$0.7 million. The change in credit rating for Alumina Limited triggered a 1.75% step up in coupon from 5.5% to 7.25%, effective 20 November 2016.The note matures on 19 November 2019. The fixed rate note has been converted to US dollar equivalents at year-end exchange rates.
NOTES TO THE CONSOLIDATED FINANCIAL STATEMENTS FOR THE YEAR ENDED 31 DECEMBER 2016
72

4. FINANCIAL ASSETS AND LIABILITIES (CONTINUED)
(C) DERIVATIVES
Derivatives are only used for economic hedging purposes and not as trading or speculative instruments. Derivatives are classified as held for trading and accounted for at fair value through profit or loss as they are not designated as hedges. They are presented as current assets or liabilities if they are expected to be settled within 12 months after the end of the reporting period.
To provide an indication about the reliability of the input used in determining the fair value, the Group has classified its financial instruments into three levels prescribed under the accounting standards. An explanation of each level follows underneath the table.
LEVEL 1 LEVEL 2 LEVEL 3 TOTAL
2016 US$ MILLION
Cross-currency interest rate swap (CCIRS AUD/USD) – 16.2 – 16.2
Total financial liabilities at fair value through profit or loss – 16.2 – 16.2
2015
Cross-currency interest rate swap (CCIRS AUD/USD) – 14.7 – 14.7
Total financial liabilities at fair value through profit or loss – 14.7 – 14.7
Level 1: Financial instruments traded in active markets (such as publicly traded derivatives, trading and available for sale securities) for which the fair value is based on quoted market prices at the end of the reporting period.
Level 2: Financial instruments that are not traded in an active market (for example, over the counter derivatives) for which the fair value is determined using valuation techniques which maximise the use of observable market data and rely as little as possible on entity specific estimates.
Level 3: If one or more of the significant inputs is not observable market data, the instrument is included in level 3. This is the case for unlisted equity securities.
5. FINANCIAL RISK MANAGEMENT
This note explains the Group’s exposure to financial risks and how these risks could affect the Group’s future financial performance.
RISK EXPOSURE ARISING FROM MEASUREMENT MANAGEMENT
Market risk: foreign currency Financial assets and liabilities denominated in currency other than US$
Cash flow forecasting & sensitivity analysis
Cross-currency interest rate swaps
Market risk: interest rate Long-term borrowings at fixed rates
Sensitivity analysis Cross-currency interest rate swaps
Credit risk Cash and cash equivalent, and derivative financial instruments
Credit ratings Credit limits, letters of credit, approved counterparties list
Liquidity risk Borrowings and other liabilities
Cash flow forecasting Availability of committed borrowing facilities
Financial risk management is carried out by the Treasury Committee which is responsible for developing and monitoring risk management policies. Risk management policies are established to identify and analyse the risks faced by the Group to set appropriate risk limits and controls, and to monitor risks and adherence to limits. Risk management policies and systems are reviewed regularly to reflect changes in market conditions and the Group’s activities.
NOTES TO THE CONSOLIDATED FINANCIAL STATEMENTS 73FOR THE YEAR ENDED 31 DECEMBER 2016

5. FINANCIAL RISK MANAGEMENT (CONTINUED)
(A) MARKET RISK
Foreign exchange risk
Foreign exchange risk for the Group arises when future commercial transactions and recognised assets and liabilities are denominated in a currency that is not the Group’s functional currency.
The fixed rate note is issued in Australian dollars. To mitigate the exposure to the AUD/USD exchange rate and Australian interest rates the Group entered into CCIRS for the full amount of the face value of the fixed rate note to swap the exposure back to US dollars.
Except as described above, the Group generally does not hedge its foreign currency exposures except through the near-term purchase of currency to meet operating requirements.
The Group’s exposure to foreign currency risk at the end of the reporting period, as expressed in US$, was as follows:
USD AUD OTHER TOTAL
2016 US$ MILLION
Cash and cash equivalents 3.8 0.1 4.7 8.6
Receivables – 0.1 – 0.1
Total financial assets 3.8 0.2 4.7 8.7
Payables – 1.3 – 1.3
Borrowings – 92.4 – 92.4
Total non-derivative financial liabilities – 93.7 – 93.7
Net non-derivative financial (liabilities)/assets 3.8 (93.5) 4.7 (85.0)
Derivative financial instruments (notional principal) (108.4) 108.4 – –
Net financial assets/(liabilities) (104.6) 14.9 4.7 (85.0)
USD AUD OTHER TOTAL
2015 US$ MILLION
Cash and cash equivalents 8.1 1.0 0.2 9.3
Receivables – – – –
Total financial assets 8.1 1.0 0.2 9.3
Payables – 1.7 – 1.7
Borrowings 20.0 90.5 – 110.5
Total non-derivative financial liabilities 20.0 92.2 – 112.2
Net non-derivative financial (liabilities)/assets (11.9) (91.2) 0.2 (102.9)
Derivative financial instruments (notional principal) (108.4) 108.4 – –
Net financial assets/(liabilities) (120.3) 17.2 0.2 (102.9)
NOTES TO THE CONSOLIDATED FINANCIAL STATEMENTS FOR THE YEAR ENDED 31 DECEMBER 2016
74

5. FINANCIAL RISK MANAGEMENT (CONTINUED)
Cash flow and fair value interest rate risk
The Group’s main interest rate risk arises from its borrowings.
Borrowings by the Group at variable rates expose it to cash flow interest rate risk. Borrowings at fixed rates would expose the Group to fair value interest rate risk. When managing interest rate risk the Group seeks to reduce the overall cost of funds. Group policy is to generally borrow at floating rates subject to availability of attractive fixed rate deals.
In 2016 and 2015, CCIRS for the whole face value of the fixed rate note were used to manage the exposure to Australian interest rates over the life of the note.
The change in credit rating for Alumina Limited triggered a 1.75% step up in coupon from 5.5% to 7.25%. To cover the increased interest rate exposure an additional CCIRS was entered into.
The consolidated entity’s exposure to interest rate risk and the effective weighted interest rate after the effect of derivative instruments is set out below:
FLOATING INTEREST FIXED INTEREST
NON-INTEREST BEARING TOTAL
2016 US$ MILLION
Cash and cash equivalents 8.6 – – 8.6
Receivables – – 0.1 0.1
Total financial assets 8.6 – 0.1 8.7
Payables – – 1.3 1.3
Borrowings – 92.4 – 92.4
Total non-derivative financial liabilities – 92.4 1.3 93.7
Net non-derivative financial (liabilities)/assets 8.6 (92.4) (1.2) (85.0)
Weighted average interest rate before derivatives 1.6% 5.8%
Weighted average interest rate after derivatives 1.6% 3.4%
FLOATING INTEREST FIXED INTEREST
NON-INTEREST BEARING TOTAL
2015 US$ MILLION
Cash and cash equivalents 9.3 – – 9.3
Receivables – – – –
Total financial assets 9.3 – – 9.3
Payables – – 1.7 1.7
Borrowings 20.0 90.5 – 110.5
Total non-derivative financial liabilities 20.0 90.5 1.7 112.2
Net non-derivative financial liabilities 10.7 90.5 1.7 102.9
Weighted average interest rate before derivatives 1.6% 5.5%
Weighted average interest rate after derivatives 1.6% 3.1%
Had interest rates on floating rate debt during 2016 been one percentage point higher/lower than the average, with all other variables held constant, pre-tax profit for the year would have been US$0.6 million lower/higher (2015: US$0.7 million lower/higher).
NOTES TO THE CONSOLIDATED FINANCIAL STATEMENTS 75FOR THE YEAR ENDED 31 DECEMBER 2016
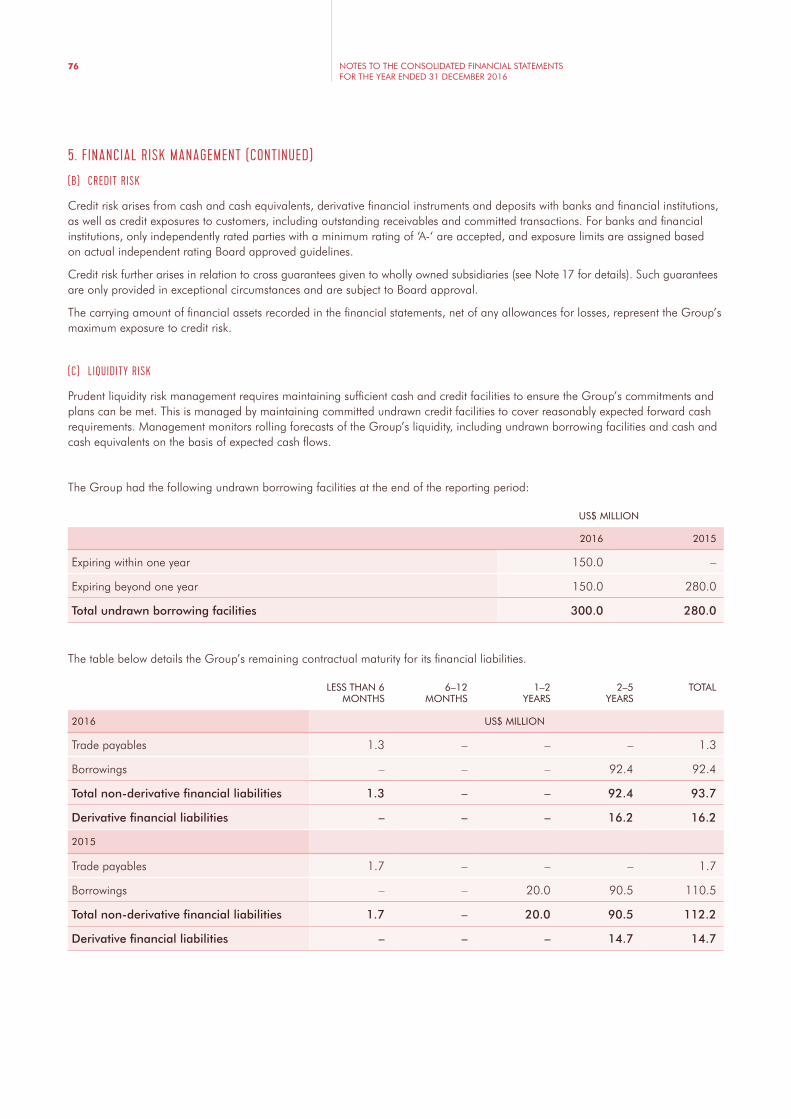
5. FINANCIAL RISK MANAGEMENT (CONTINUED)
(B) CREDIT RISK
Credit risk arises from cash and cash equivalents, derivative financial instruments and deposits with banks and financial institutions, as well as credit exposures to customers, including outstanding receivables and committed transactions. For banks and financial institutions, only independently rated parties with a minimum rating of ‘A-‘ are accepted, and exposure limits are assigned based on actual independent rating Board approved guidelines.
Credit risk further arises in relation to cross guarantees given to wholly owned subsidiaries (see Note 17 for details). Such guarantees are only provided in exceptional circumstances and are subject to Board approval.
The carrying amount of financial assets recorded in the financial statements, net of any allowances for losses, represent the Group’s maximum exposure to credit risk.
(C) LIQUIDITY RISK
Prudent liquidity risk management requires maintaining sufficient cash and credit facilities to ensure the Group’s commitments and plans can be met. This is managed by maintaining committed undrawn credit facilities to cover reasonably expected forward cash requirements. Management monitors rolling forecasts of the Group’s liquidity, including undrawn borrowing facilities and cash and cash equivalents on the basis of expected cash flows.
The Group had the following undrawn borrowing facilities at the end of the reporting period:
US$ MILLION
2016 2015
Expiring within one year 150.0 –
Expiring beyond one year 150.0 280.0
Total undrawn borrowing facilities 300.0 280.0
The table below details the Group’s remaining contractual maturity for its financial liabilities.
LESS THAN 6 MONTHS
6–12 MONTHS
1–2 YEARS
2–5 YEARS
TOTAL
2016 US$ MILLION
Trade payables 1.3 – – – 1.3
Borrowings – – – 92.4 92.4
Total non-derivative financial liabilities 1.3 – – 92.4 93.7
Derivative financial liabilities – – – 16.2 16.2
2015
Trade payables 1.7 – – – 1.7
Borrowings – – 20.0 90.5 110.5
Total non-derivative financial liabilities 1.7 – 20.0 90.5 112.2
Derivative financial liabilities – – – 14.7 14.7
NOTES TO THE CONSOLIDATED FINANCIAL STATEMENTS FOR THE YEAR ENDED 31 DECEMBER 2016
76

6. CAPITAL MANAGEMENT
(A) RISK MANAGEMENT
The Group’s objectives when managing capital is to safeguard the ability to continue as a going concern, so that it can continue to provide returns for shareholders and to maintain an optimal capital structure to reduce the cost of capital.
The Board’s policy is to maintain a strong capital base so as to maintain investor, creditor and market confidence and to sustain future development of the business. In order to maintain or adjust the capital structure, the Company may adjust the amount of dividends paid to shareholders, return capital to shareholders, issue new shares or sell assets to reduce debt.
The Group calculates the gearing ratio as net debt divided by total capital. Net debt is calculated as total borrowing less cash and cash equivalents. Total capital is calculated as ‘equity’ as shown in the balance sheet plus debt.
The gearing ratios at 31 December 2016 and 31 December 2015 were as follows:
US$ MILLION
2016 2015
Total borrowings 92.4 110.5
Less: cash and cash equivalents (8.6) (9.3)
Net debt 83.8 101.2
Total borrowings 92.4 110.5
Total equity 2,006.9 1,982.9
Total capital 2,099.3 2,093.4
Gearing ratio 4.0% 4.8%
(B) DIVIDENDS
US$ MILLION
2016 2015
Interim dividend of US2.9 cents fully franked at 30% per fully paid share declared 24 August 2016 and paid on 15 September 2016 (2015: US4.5 cents fully franked at 30% per fully paid share declared 19 August 2015 and paid on 28 September 2015)
83.5 126.3
Final dividend of US1.8 cents fully franked at 30% per fully paid share declared 25 February 2016 and paid on 23 March 2016 (2015: US1.6 cents fully franked at 30% per fully paid share declared 26 February 2015 and paid on 25 March 2015)
51.8 44.9
Total dividends 135.3 171.2
Since the year-end the Directors have recommended the payment of a final dividend of US3.1 cents per share (2015: US1.8 cents per share), fully franked based on the tax paid at 30%. Record date to determine entitlements to the dividend is 2 March 2017. The aggregate amount of the proposed dividend expected to be paid on 22 March 2017 out of retained earnings at 31 December 2016, but not recognised as a liability at the year-end, is $89.3 million.
NOTES TO THE CONSOLIDATED FINANCIAL STATEMENTS 77FOR THE YEAR ENDED 31 DECEMBER 2016

6. CAPITAL MANAGEMENT (CONTINUED)
(C) FRANKED DIVIDENDS
A$ MILLION
2016 2015
Franking credits available for subsequent financial years, based on a tax rate of 30% (2015: 30%)
347.5 339.5
The above amounts are calculated from the balance of the franking credits as at the end of the reporting period, adjusted for franking credits and debits that will arise from the settlement of liabilities and receivables for income tax and dividends after the end of the year.
US$ MILLION
2016 2015
The fully franked dividends received from AWAC in the financial year were 150.2 56.2
KEY NUMBERS
7. EXPENSES
(A) EMPLOYEE BENEFITS EXPENSE
Liabilities for salaries and annual leave are recognised in current provisions (i.e. short-term employee benefits), and are measured as the amount unpaid at reporting date at expected pay rates in respect of employees’ services up to that date, including related on-costs.
The liability for long service leave is recognised in the provision for employee benefits and measure as the present value of expected future payments to be made in respect of services provided by employees up to the reporting date. Consideration is given to expected future wage and salary levels, experience of employee departures and periods of service. Expected future payments are discounted using market yields at the end of the reporting period of high-quality corporate bonds with terms to maturity and currency that match, as closely as possible, the estimated future cash flows.
All employees of Alumina Limited are entitled to benefits on retirement, disability or death from the Group’s superannuation plan. Alumina employees are members of an Alumina Limited Super Plan managed by MLC MasterKey Super, except for employees who elected to contribute to an alternate fund. The plan is an accumulation category plan which offers a minimum Company contribution (subject to certain cashing out options and legislation) of 9.5 per cent of basic salary to each member’s account. Members also have the option to make voluntary contributions to their account. Employer contributions to these funds are recognised as an expense.
US$ MILLION
2016 2015
Profit/(loss) before income tax included the following specific expenses:
Defined contribution superannuation expense 0.2 0.2
Other employee benefits expense 5.8 4.9
Total employee benefits expense 6.0 5.1
NOTES TO THE CONSOLIDATED FINANCIAL STATEMENTS FOR THE YEAR ENDED 31 DECEMBER 2016
78

(B) FINANCE COSTS
Finance costs comprise interest payable on borrowings using the effective interest rate method, commitment fees and amortisation of capitalised facility fees.
US$ MILLION
2016 2015
Finance costs:
Interest expense 6.5 3.6
Commitment and upfront fees 2.0 2.1
Amortisation of capitalised upfront fees 0.6 0.8
Bank charges – 0.1
Total finance costs 9.1 6.6
8. INCOME TAX EXPENSE
(A) INCOME TAX EXPENSE AND DEFERRED TAXES
The income tax expense/benefit for the period is the tax payable/receivable on the current period’s taxable income based on the applicable income tax rate for each jurisdiction adjusted by charges in deferred tax assets and liabilities attributable to temporary differences and to unused tax losses.
The current income tax charge is calculated on the basis of the tax laws enacted or substantively enacted at the reporting period in the countries where the Company’s subsidiaries and associates operate and generate taxable income.
US$ MILLION
2016 2015
Current tax – –
Deferred tax – –
Aggregate income tax expense – –
Deferred income tax is provided in full, using the liability method, on temporary differences arising between the tax bases of assets and liabilities and their carrying amounts in the consolidated financial statements. Deferred income tax is determined using tax rates (and laws) that have been enacted or substantially enacted by the reporting date and are expected to apply when the related deferred income tax asset is realised or the deferred income tax liability is settled.
Deferred tax assets are recognised for deductible temporary differences and unused tax losses only if it is probable that future taxable amounts will be available to utilise those temporary differences and losses.
Deferred tax liabilities and assets are not recognised for temporary differences between the carrying amount and tax bases of investments in controlled entities where the parent entity is able to control the timing of the reversal of the temporary differences and it is probable that the differences will not reverse in the foreseeable future.
Deferred tax assets and liabilities are offset when there is a legally enforceable right to offset current tax assets and liabilities and when the deferred tax balances relate to the same taxation authority. Current tax assets and liabilities are offset where the entity has a legally enforceable right to offset and intends either to settle on a net basis, or to realise the asset and settle the liability simultaneously.
Alumina Limited and its wholly-owned Australian controlled entities have implemented the tax consolidation legislation. As a consequence, these entities are taxed as a single entity and the deferred tax assets and liabilities of these entities are set off in the consolidated financial statements.
NOTES TO THE CONSOLIDATED FINANCIAL STATEMENTS 79FOR THE YEAR ENDED 31 DECEMBER 2016

8. INCOME TAX EXPENSE (CONTINUED)
The Group’s deferred tax assets and liabilities are attributable to the following:
US$ MILLION
2016 2015
Deferred tax liabilities
Unrealised foreign exchange gains 4.6 3.4
Total deferred tax liabilities 4.6 3.4
Deferred tax assets
Employee benefits 0.3 0.2
Derivative financial instruments 0.4 3.2
Transaction costs and other 0.2 0.3
Total deferred tax assets other than tax losses 0.9 3.7
Net deferred tax (liabilities)/assets before tax losses (3.7) 0.3
Deductible temporary differences and tax losses not recognised 3.7 (0.3)
Net deferred tax (liabilities)/assets – –
Deferred tax assets are recognised only to the extent of deferred tax liabilities existing at reporting date. Remaining deferred tax assets are not recognised as it is not probable that future taxable amounts will be available to utilise those temporary differences and losses.
(B) NUMERICAL RECONCILIATION OF INCOME TAX EXPENSE TO PRIMA FACIE TAX PAYABLE
US$ MILLION
2016 2015
(Loss)/profit before income tax (30.2) 88.3
Prima facie tax benefit/(expense) for the period at the rate of 30% 9.1 (26.5)
The following items caused the total charge for income tax to vary from the above:
Share of equity accounted profit not assessable for tax (18.1) (109.9)
Foreign income subject to accruals tax 2.8 1.8
Share of Partnership income assessable for tax 3.0 1.5
Timing differences not recognised – (1.4)
Tax losses not recognised 26.3 17.8
Previously unrecognised tax losses now recouped to reduce current tax expense (0.2) –
Non-deductible expenses 16.4 1.9
Net movement 30.2 (88.3)
Consequent (increase)/decrease in charge for income tax (9.1) 26.5
Aggregate income tax expense – –
NOTES TO THE CONSOLIDATED FINANCIAL STATEMENTS FOR THE YEAR ENDED 31 DECEMBER 2016
80

(C) TAX EXPENSE RELATING TO ITEMS OF COMPREHENSIVE INCOME
Current and deferred tax balances attributable to amounts recognised directly in other comprehensive income and equity are also recognised directly in other comprehensive income and equity.
US$ MILLION
2016 2015
Cash flow hedges 2.4 (0.3)
Actuarial gains on retirement benefit obligations 2.3 15.2
Total tax expense relating to items of other comprehensive income 4.7 14.9
(D) TAX LOSSES
US$ MILLION
2016 2015
Tax losses – revenue 973.9 912.2
Tax losses – capital 951.5 951.5
Total unused tax losses 1,925.4 1,863.7
Potential tax benefit – revenue 319.1 298.8
Potential tax benefit – capital 285.4 285.4
Total potential tax benefit 604.5 584.2
NOTES TO THE CONSOLIDATED FINANCIAL STATEMENTS 81FOR THE YEAR ENDED 31 DECEMBER 2016

9. EQUITY
(A) CONTRIBUTED EQUITY
Ordinary shares are classified as equity. Incremental costs directly attributable to the issue of new shares are shown in equity as a deduction, net of tax, from the proceeds.
MOVEMENT IN SHARE CAPITAL NUMBER OF SHARES US$ MILLION
2016 2015 2016 2015
Balance brought forward 2,879,843,498 2,806,225,615 2,682.9 2,620.0
Movement for the period – 73,617,8831 – 62.9
Total issued capital 2,879,843,498 2,879,843,498 2,682.9 2,682.9
1. The Company’s Dividend Reinvestment Plan was applicable to the 2015 interim dividend resulting in 73,617,883 shares issued in September 2015 at a 1.5% discount to the market price.
Treasury shares
Treasury shares are Alumina Limited shares held by the Alumina Employee Share Plan Trust for the purposes of issuing shares under the Alumina Employee Share Plan.
MOVEMENT IN TREASURY SHARES NUMBER OF SHARES US$ MILLION
2016 2015 2016 2015
Balance brought forward 61,717 423,695 1,413,606 1,176,904
Shares acquired by Alumina Employee Share Plan Pty Ltd (average price A$1.37 per share (2015: A$1.78 per share)
1,508,604 600,000 1,558,319 827,340
Employee performance rights vested (1,568,465) (961,978) (2,970,020) (590,638)
Total treasury shares 1,856 61,717 1,905 1,413,606
Weighted average number of ordinary shares used as the denominator in the calculation of basic earnings per share calculated as weighted average number of ordinary shares outstanding during the financial year, adjusted for treasury shares issued.
NUMBER OF SHARES
2016 2015
Weighted average number of ordinary shares used as the denominator in the calculation of basic and diluted earnings per share
2,879,474,499 2,824,328,800
NOTES TO THE CONSOLIDATED FINANCIAL STATEMENTS FOR THE YEAR ENDED 31 DECEMBER 2016
82

(B) OTHER RESERVES
Other Reserves include Assets revaluation reserve, Capital reserve, Option premium on convertible bonds reserve, Share-based payments reserve, Cash-flow hedge reserve and Foreign currency translation reserve.
Foreign currency translation reserve
The foreign currency translation reserve represents exchange differences arising on the translation of non-US dollar functional currency operations within the Group into US dollars.
US$ MILLION
2016 2015
Balance at the beginning of the financial year (1,370.7) (918.5)
Currency translation differences arising during the year 178.5 (452.2)
Balance at the end of the financial year (1,192.2) (1,370.7)
10. CASH FLOW INFORMATION
(A) RECONCILIATION OF (LOSS)/PROFIT AFTER INCOME TAX TO NET CASH (OUTFLOW)/INFLOW FROM OPERATING ACTIVITIES
US$ MILLION
2016 2015
(Loss)/profit from continuing operations after income tax (30.2) 88.3
Share of net profit of associates accounted for using equity method 18.1 (109.9)
Dividends and distributions received from associates 150.9 62.9
Share based payments 0.9 0.8
Other non-cash items (depreciation, net exchange differences, other) 15.1 2.1
Sub-total 118.6 44.2
Change in assets and liabilities
Decrease/(increase) in receivables (0.1) 0.2
Decrease/(increase) in other assets 0.3 0.2
(Decrease)/increase in payables (0.4) (0.2)
(Decrease)/increase in current tax liability – (0.8)
Net cash inflow from operating activities 118.4 43.6
(B) NON-CASH FINANCING AND INVESTING ACTIVITIES
There were no non-cash financing or investing activities during 2016.
In September 2015, 73,617,883 shares in Alumina Limited, valued at $62.9 million were issued to shareholders who elected to participate in the dividend reinvestment plan which was applicable to the interim dividend for 2015.
NOTES TO THE CONSOLIDATED FINANCIAL STATEMENTS 83FOR THE YEAR ENDED 31 DECEMBER 2016

OTHER INFORMATION
11. RELATED PARTY TRANSACTIONS
The parent entity within the Group is Alumina Limited. Balances and transactions between the parent entity and its subsidiaries have been eliminated on consolidation and are not disclosed in this note.
(A) OWNERSHIP INTERESTS IN RELATED PARTIES
Interests held in the following classes of related parties are set out in the following notes:
• associates – Note 2.
• controlled entities – Note 3.
(B) COMPENSATION OF KEY MANAGEMENT PERSONNEL
Detailed remuneration disclosures for the key management personnel, defined as Group Directors, CEO and Senior Executives, are provided in the remuneration report on pages 35 to 59 of this annual report.
The remuneration report has been prepared in Australian dollars, whilst the financial report has been prepared in US dollars. The average exchange rate for 2016 of 0.7439 (2015: 0.7519) has been used for conversion.
DIRECTORS AND SENIOR EXECUTIVES US$
2016 2015
Short-term employee benefits 4,242,211 3,706,166
Post-employment benefits 141,834 135,385
Share based payments 708,137 677,580
Total 5,092,182 4,519,131
(C) OTHER TRANSACTIONS AND BALANCES WITH RELATED PARTIES
There have been no other related party transactions made during the period or balances outstanding as at 31 December 2016, between the Group, its related parties, the Directors or key management personnel (2015: Nil).
NOTES TO THE CONSOLIDATED FINANCIAL STATEMENTS FOR THE YEAR ENDED 31 DECEMBER 2016
84

12. SHARE-BASED PAYMENTS
The Group provides benefits to employees (including CEO and Senior Executives) through share based incentives. Employees are incentivised for their performance in part through participation in the grant of conditional entitlement to fully paid ordinary shares (a Performance Right) via the Alumina Limited Employee Share Plan (ESP).
For further details on key features of the ESP refer to the remuneration report on pages 48 to 51 of this annual report.
Set out below are summaries of performance rights granted under the ESP.
2016
GRANT DATE EXPIRY DATE
BALANCE AT START OF THE
YEAR NUMBER
GRANTED DURING THE
YEAR NUMBER
VESTED DURING THE
YEAR NUMBER
LAPSED DURING THE
YEAR NUMBER
BALANCE AT END OF THE
YEAR NUMBER
8/2/2013 7/12/2015 687,768 – (687,768) – –
10/2/2014 6/12/2016 1,110,770 – (1,109,102) (1,668) –
5/1/2015 11/12/2017 694,250 – – (4,384) 689,866
19/12/2016 7/12/2018 – 1,016,250 – (11,513) 1,004,737
Total 2,492,788 1,016,250 (1,796,870) (17,565) 1,964,603
2015
GRANT DATE EXPIRY DATE
BALANCE AT START OF THE
YEAR NUMBER
GRANTED DURING THE
YEAR NUMBER
VESTED DURING THE
YEAR NUMBER
LAPSED DURING THE
YEAR NUMBER
BALANCE AT END OF THE
YEAR NUMBER
9/3/2012 11/12/2014 666,040 – (297,646) (368,394) –
8/2/2013 7/12/2015 1,354,880 – (664,332) (2,780) 687,768
10/2/2014 6/12/2016 1,113,350 – – (2,580) 1,110,770
5/1/2015 11/12/2017 – 695,810 – (1,560) 694,250
Total 3,134,270 695,810 (961,978) (375,314) 2,492,788
The weighted average remaining contractual life of performance rights outstanding at the end of the period was 2.6 years (2015: 2.0 years).
In addition to the ESP, the CEO’s fixed remuneration includes an annual share right component. This share based component of the CEO’s fixed remuneration is conditional on a minimum of 18 months service and deferred for three years from the date of the grant.
For further details refer to the remuneration report on pages 39 to 40 of this annual report.
Total expenses arising from share-based payment transactions recognised during the period as part of employee benefits expense were as follows:
US$ 000’S
2016 2015
Performance rights granted under the Alumina Employee Share Plan 645 607
CEO annual conditional share rights grant 154 160
Total 809 767
NOTES TO THE CONSOLIDATED FINANCIAL STATEMENTS 85FOR THE YEAR ENDED 31 DECEMBER 2016

13. REMUNERATION OF AUDITORS
During the period the following fees were paid or payable for services provided by the auditor of the parent entity, and its related practices and non-related audit firms:
US$ 000’S
2016 2015
PricewaterhouseCoopers Australia:
Audit and review of the financial reports 383 355
Other assurance services 32 28
Related practices of PricewaterhouseCoopers Australia:
Audit and review of the financial reports – 37
Overseas taxation services 8 8
Total 423 428
It is the Group’s policy to employ PricewaterhouseCoopers on assignments additional to their statutory audit duties where PricewaterhouseCoopers’ expertise and experience with the Group are important provided such arrangements do not compromise audit independence. These assignments are principally tax advice or where PricewaterhouseCoopers is awarded assignments on a competitive basis.
14. COMMITMENTS AND CONTINGENCIES
Capital commitments
There are no contractual capital commitments at reporting date but there could be future equity calls by AWAC entities in relation to working capital support. However, this is subject to market conditions.
Contingent Liabilities
There are no contingent liabilities of the Group as at 31 December 2016 and 31 December 2015, other than as disclosed in Note 2(e) and Note 16.
15. EVENTS OCCURRING AFTER THE REPORTING PERIOD
Except as disclosed in the Director’s report or elsewhere in the Financial Statements, there have been no significant events occurring since 31 December 2016.
NOTES TO THE CONSOLIDATED FINANCIAL STATEMENTS FOR THE YEAR ENDED 31 DECEMBER 2016
86

16. PARENT ENTITY FINANCIAL INFORMATION
The financial information for the parent entity has been prepared on the same basis as the consolidated financial statements, except as set out below.
Investments in subsidiaries, associates and joint venture entities
Investments in subsidiaries, associates and joint venture entities are accounted for at cost in the financial statements of Alumina Limited. Dividends received from associates are recognised in the parent entity’s profit or loss, rather than being deducted from the carrying amount of these investments.
Where the parent entity has provided financial guarantees in relation to loans and payable of subsidiaries for no compensation, the fair values of these guarantees are accounted for as contributions and recognised as part of the cost of the investment.
Intercompany Loans
Loans granted by the parent entity to its subsidiaries are classified as non-current assets.
Tax consolidation legislation
Alumina Limited and its wholly-owned Australian controlled entities have implemented tax consolidation legislation. The head entity, Alumina Limited, and the controlled entities in the tax consolidated Group account for their own current and deferred tax amounts. These tax amounts are measured as if each entity in the tax consolidated Group continues to be a standalone taxpayer in its own right. In addition to its own current and deferred tax amounts, Alumina Limited also recognises the current tax liabilities (or assets) and the deferred tax assets arising from unused tax losses and unused tax credits assumed from controlled entities in the tax consolidated Group.
(A) SUMMARISED FINANCIAL INFORMATION
The individual financial statements for the parent entity show the following aggregate amounts:
US$ MILLION
2016 2015
BALANCE SHEET
Current assets 7.8 13.4
Total assets 3,815.1 3,867.5
Current liabilities 1.7 1.9
Total liabilities 116.3 133.0
SHAREHOLDERS’ EQUITY
Issued capital 2,682.9 2,682.9
Reserves 237.2 239.3
Retained earnings 778.7 812.3
TOTAL SHAREHOLDERS’ EQUITY 3,698.8 3,734.5
Profit for the year 101.8 38.1
Total comprehensive income for the year 101.8 38.1
NOTES TO THE CONSOLIDATED FINANCIAL STATEMENTS 87FOR THE YEAR ENDED 31 DECEMBER 2016

16. PARENT ENTITY FINANCIAL INFORMATION (CONTINUED)
(B) GUARANTEES ENTERED INTO BY THE PARENT ENTITY
The parent entity has provided guarantees to certain third parties in relation to the performance of contracts by various AWAC companies.
In order to facilitate the full conversion of the San Ciprian alumina refinery from fuel oil to natural gas, in October 2013, Alumina Espanola SA (Espanola) signed a take or pay gas pipeline utilization agreement. In November 2013, Alumina Limited agreed to proportionally (i.e. 40%) guarantee the payment of Espanola’s contracted gas pipeline utilization over the four years of the commitment period. Such commitment came into force six months after the gas pipeline was put into operation. The gas pipeline was completed in January 2015 and the refinery has switched to natural gas consumption for 100% of its needs.
Three supply contracts were signed in 2014 for the supply of natural gas to the San Ciprian refinery for the 2015 period and further extended for the 2016 period. Alumina Limited agreed to proportionally guarantee the payment of Espanola’s obligations under those contracts.
There is also a guarantee to Banco di Bilbao in respect of Espanola’s bank facility.
In late 2011, Alcoa Inc, on behalf of AWAC, issued guarantees to the lenders of the Ma’aden bauxite mining/refining joint
venture in Saudi Arabia. Alcoa Corporation guarantees for the Ma’aden Bauxite and Alumina Company cover total debt service requirements through 2019 and 2024. In the event Alcoa would be required to make payments under the guarantees, 40% of such amount would be contributed by Alumina Limited.
In addition, the parent entity has entered into a Deed of Cross Guarantee with the effect that it guarantees the debts of its wholly-owned subsidiaries. Further details of the Deed of Cross Guarantee are disclosed in Note 17.
No liability was recognised by the parent entity of the group in relation to the abovementioned guarantees, as the fair value of the guarantees are immaterial.
(C) CONTINGENT LIABILITIES OF THE PARENT ENTITY
The parent entity did not have any contingent liabilities as at 31 December 2016 or 31 December 2015. For information about guarantees given by the parent entity refer above.
(D) CONTRACTUAL COMMITMENTS FOR THE ACQUISITION OF PROPERTY, PLANT AND EQUIPMENT
There are no contractual commitments by the parent entity for the acquisition of property, plant and equipment at reporting date.
NOTES TO THE CONSOLIDATED FINANCIAL STATEMENTS FOR THE YEAR ENDED 31 DECEMBER 2016
88

17. DEED OF CROSS GUARANTEE
Alumina Limited and Alumina International Holdings Pty. Ltd. Are parties to the cross guarantee under which each of these companies guarantees the debts of the other. By entering into the deed, wholly-owned entities have been relieved from the requirement to prepare a financial report and directors’ report under Class Order 98/1418 (as amended) issued by the Australian Securities and Investments Commission.
The above companies represent a “closed group” as defined in the Class Order, and there are no other parties to the deed of cross guarantee that are controlled by Alumina Limited, they also represent the “extended closed group”.
(A) CONSOLIDATED STATEMENT OF PROFIT OR LOSS AND OTHER COMPREHENSIVE INCOME AND SUMMARY MOVEMENTS IN CONSOLIDATED RETAINED EARNINGS
US$ MILLION
CONSOLIDATED STATEMENT OF PROFIT OR LOSS AND OTHER COMPREHENSIVE INCOME 2016 2015
Dividends and distributions 150.9 62.9
Other income 0.2 –
General and administrative expenses (25.3) (11.5)
Change in fair value of derivatives/foreign exchange losses (14.8) (1.4)
Finance costs (9.2) (6.7)
Profit from ordinary activities before income tax 101.8 43.3
Income tax expense – –
Net profit for the year 101.8 43.3
Other comprehensive income net of tax – –
Total comprehensive income for the year 101.8 43.3
MOVEMENT IN CONSOLIDATED RETAINED EARNINGS 2016 2015
Retained profits at the beginning of the financial year 679.7 807.6
Net profit for the year 101.8 43.3
Dividend provided for or paid (135.3) (171.2)
Retained profits at the end of the financial year 646.2 679.7
NOTES TO THE CONSOLIDATED FINANCIAL STATEMENTS 89FOR THE YEAR ENDED 31 DECEMBER 2016

17. DEED OF CROSS GUARANTEE (CONTINUED)
(B) CONSOLIDATED BALANCE SHEET
US$ MILLION
2016 2015
Current assets
Cash and cash equivalents 3.9 9.1
Receivables 72.9 71.3
Other assets 2.4 2.8
Total current assets 79.2 83.2
Non-current assets
Investment in associates 1,669.6 1,672.4
Other financial assets 1,933.6 1,979.2
Property, plant and equipment 0.1 0.1
Total non-current assets 3,603.3 3,651.7
Total assets 3,682.5 3,734.9
Current liabilities
Payables 1.3 1.7
Provisions 0.4 0.2
Total current liabilities 1.7 1.9
Non-current liabilities
Borrowings 97.8 115.8
Derivative financial instruments 16.2 14.7
Provisions 0.5 0.5
Total non-current liabilities 114.5 131.0
Total liabilities 116.2 132.9
Net assets 3,566.3 3,602.0
Equity
Contributed equity 2,682.9 2,682.9
Reserves 237.2 239.4
Retained profits 646.2 679.7
Total equity 3,566.3 3,602.0
NOTES TO THE CONSOLIDATED FINANCIAL STATEMENTS FOR THE YEAR ENDED 31 DECEMBER 2016
90

18. NEW ACCOUNTING STANDARDS AND INTERPRETATIONS NOT YET ADOPTED
Certain new accounting standards and interpretations have been published that are not mandatory for the 31 December 2016 reporting period and have not been early adopted by the Group. The Group’s assessment of the impact of these new standards and interpretations is set out below:
(A) AASB 15 REVENUE FROM CONTRACTS WITH CUSTOMERS (EFFECTIVE 1 JANUARY 2018)
The AASB has issued a new standard for the recognition of revenue. AASB 15 Revenue from Contracts with Customers replaces AASB 118 which covers contracts for goods and services and AASB 111 which covers construction contracts. The new standard is based on the principle that revenue is recognised when control of a good or a service transfers to a customer – so the notion of control replaces the existing notion of risks and rewards. The standard permits a modified retrospective approach for the adoption. Under this approach entities will recognise transitional adjustments to retained earnings on the date of initial application (e.g. 1 January 2017), i.e. without restating the comparative period. They will only need to apply the new rules to contracts that are not completed as of the date of initial application. The standard is not applicable until 1 January 2018 but is available for early adoption. The Group is in the process of assessing the impact of AASB 15.
AASB 16 LEASES (EFFECTIVE 1 JANUARY 2019)
The new standard will replace AASB 117 Leases. Once effective, the new requirements will apply to new and pre-existing lease arrangements. The key changes have been outlined below:
• Lessees will recognise a lease liability reflecting future lease payments and a ‘right-of-use asset’ for virtually all lease contracts (optional exemption available for certain short-term leases and leases of low-value assets).
• Lessees will have to present interest expense on the lease liability and depreciation on the right-of-use assets in their income statement.
• Lease payments that reflects interest on the lease liability can be presented as an operating cash flow. Cash payments for the principal portion of the lease liability should be classified within financing activities. Payments for short-term leases, for leases of low-value assets could be presented within operating activities.
The Group is in the process of assessing the impact of AASB 16.
NOTES TO THE CONSOLIDATED FINANCIAL STATEMENTS 91FOR THE YEAR ENDED 31 DECEMBER 2016

DIRECTORS’ DECLARATION
In the Directors’ opinion:
a) the financial statements and notes set out on pages 60 to 91 are in accordance with the Corporations Act 2001, including:
(i) complying with Accounting Standards, the Corporations Regulations 2001 and other mandatory professional reporting requirements; and
(ii) giving a true and fair view of the consolidated entity’s financial position as at 31 December 2016 and of its performance for the financial year ended on that date; and
b) there are reasonable grounds to believe that the Company will be able to pay its debts as and when they become due and payable; and
c) at the date of this declaration, there are reasonable grounds to believe that the members of the Extended Closed Group identified in Note 3 will be able to meet any obligations or liabilities to which they are, or may become, subject by virtue of the deed of cross guarantee described in Note 17.
The financial statements also comply with International Financial Reporting Standards as issued by the International Accounting Standards Board.
The Directors have been given the declarations by the Chief Executive Officer and Chief Financial Officer required by section 295A of the Corporation Act 2001.
This declaration is made in accordance with a resolution of the Directors.
92
GJ Pizzey Chairman 23 March 2017

INDEPENDENT AUDITOR’S REPORTTO THE SHAREHOLDERS OF ALUMINA LIMITED
REPORT ON THE AUDIT OF THE FINANCIAL REPORT
OUR OPINION In our opinion:
The accompanying financial report of Alumina Limited (the Company) and its controlled entities (together, the Group) is in accordance with the Corporations Act 2001, including:
a) giving a true and fair view of the Group’s financial position as at 31 December 2016 and of its financial performance for the year then ended
b) complying with Australian Accounting Standards and the Corporations Regulations 2001.
What we have audited
The Group’s financial report comprises:
• the consolidated balance sheet as at 31 December 2016
• the consolidated statement of profit or loss and other comprehensive income for the year then ended
• the consolidated statement of changes in equity for the year then ended
• the consolidated statement of cash flows for the year then ended
• the notes to the consolidated financial statements, and
• the Directors’ declaration.
BASIS FOR OPINION We conducted our audit in accordance with Australian Auditing Standards. Our responsibilities under those standards are further described in the Auditor’s Responsibilities for the Audit of the Financial Report section of our report.
We believe that the audit evidence we have obtained is sufficient and appropriate to provide a basis for our opinion.
Independence
We are independent of the Company in accordance with the auditor independence requirements of the Corporations Act 2001 and the ethical requirements of the Accounting Professional and Ethical Standards Board’s APES 110 Code of Ethics for Professional Accountants (the Code) that are relevant to our audit of the financial report in Australia. We have also fulfilled our other ethical responsibilities in accordance with the Code.
OUR AUDIT APPROACH An audit is designed to provide reasonable assurance about whether the financial report is free from material misstatement. Misstatements may arise due to fraud or error. They are considered material if individually or in aggregate, they could reasonably be expected to influence the economic decisions of users taken on the basis of the financial report.
We tailored the scope of our audit to ensure that we performed enough work to be able to give an opinion on the financial report as a whole, taking into account the geographic and management structure of the Group, its accounting processes and controls and the industry in which it operates.
PricewaterhouseCoopers, ABN 52 780 433 7572 Riverside Quay, SOUTHBANK VIC 3006, GPO Box 1331, MELBOURNE VIC 3001T: 61 3 8603 1000, F: 61 3 8603 1999, www.pwc.com.auLiability limited by a scheme approved under Professional Standards Legislation
ALUMINA LIMITED ANNUAL REPORT 2016 93

Alumina Limited’s (“Alumina”) sole business undertaking is investing globally in bauxite mining, alumina refining with some minor alumina-based chemical businesses and aluminium smelting operations. All of these business activities are conducted through Alumina’s 40% investment in several entities which collectively form Alcoa World Alumina and Chemicals (AWAC). Alcoa Corporation owns the remaining 60% of AWAC and is the manager of these business activities. Alumina participates in AWAC through the Strategic Council, which consists of three members appointed by Alcoa Corporation and two members appointed by Alumina. As Alumina does not control or operate the AWAC assets, its role involves strategic investment management on behalf of its shareholders. Accordingly, this investment has been determined to be an associate and is accounted for under the equity method.
Materiality Audit scope Key audit matters
• For the purpose of our audit we used an overall materiality of $21 million, which represents approximately 1% of the Group’s total assets.
• We applied this threshold, together with qualitative considerations, to determine the scope of our audit and the nature, timing and extent of our audit procedures and to evaluate the effect of misstatements on the financial report as a whole.
• We chose total assets primarily because of the nature of Alumina’s operations, noting that it is a generally accepted benchmark for investment management companies.
• We selected 1% based on our professional judgement, noting that it is an accepted investment industry threshold.
• We instructed auditors from other PwC network firms (“component auditors”) to report to us on the AWAC financial statements.
• We audited the equity accounting for Alumina’s 40% investment in AWAC. This process included auditing certain adjustments made by Alumina to convert the AWAC results (which were prepared under US GAAP), to comply with Australian Accounting Standards.
• We audited the remainder of Alumina’s balance sheet and statement of profit or loss and other comprehensive income.
• Our audit also focused on where the Directors made subjective judgements; for example, significant accounting estimates involving assumptions and inherently uncertain future events.
• Amongst other relevant topics, we communicated the following key audit matters to the Audit and Risk Management Committee:
• Equity accounting for Alumina’s investment in AWAC
• Impairment indicator assessment for Alumina’s equity accounted investment in AWAC
• Impact of Alcoa Inc’s separation into Alcoa Corporation and Arconic Inc. on Alumina
• These are further described in the Key audit matters section of our report.
KEY AUDIT MATTERS Key audit matters are those matters that, in our professional judgement, were of most significance in our audit of the financial report for the current period. The key audit matters were addressed in the context of our audit of the financial report as a whole, and in forming our opinion thereon, and we do not provide a separate opinion on these matters. Further, any commentary on the outcomes of a particular audit procedure is made in that context.
Materiality
Audit Scope
Key audit matters
94

Equity accounting for Alumina’s investment in AWAC
(Refer to note 2 in the financial report)
Alumina’s equity accounted investment in AWAC is $2.1 billion and its share of the net profit of AWAC accounted for using the equity method was $18.1 million.
For AWAC entities other than Alcoa of Australia Limited and Enterprise Partnership, adjustments are required to convert the accounting treatment under US GAAP to comply with Australian Accounting Standards.
We determined the equity accounting to be a key audit matter because of the magnitude of the Investment in associates balance and the complexity of the adjustments to convert from US GAAP to Australian Accounting Standards.
Complexity is involved in determining the differences in the accounting for areas such as the valuation of inventory, asset retirement obligation provisions and defined benefit plans. In arriving at the value of these US GAAP to Australian Accounting Standards adjustments, the Group is required to use accounting estimates and significant judgement.
To assess the equity accounting of Alumina’s 40% investment in AWAC, we:
• Compared the equity accounting schedule prepared by the Group to the financial statements of AWAC (as audited by our component auditors under our instruction) and found them to be consistent.
• Assessed the appropriateness and completeness of the material US GAAP to Australian Accounting Standards adjustments.
• Considered whether other transactions that had occurred during the year required a different treatment under Australian Accounting Standards compared with US GAAP.
• Reconciled the opening equity accounted investment balance to the final position reflected in the financial report. To do this we:
• Recalculated the share of net profit and changes in reserves of AWAC by examining the audited AWAC financial statements and recalculating Alumina’s 40% share. No material differences were identified.
• Compared dividends, distributions and capital returns received from AWAC and additional investments made through cash calls to the relevant declaration documents and bank statements.
• We also evaluated the impairment indicator assessment performed by the Group in relation to the investment balance (refer to the following Key audit matter).
Key audit matter How our audit addressed the key audit matter
Impairment indicator assessment for Alumina’s equity accounted investment in AWAC
(Refer to note 2b in the financial report)
Alumina’s equity accounted investment in AWAC ($2.1 billion) is the most material balance sheet item in the consolidated financial statements.
We therefore focused on the assessment which was performed by Alumina to determine whether there was any objective evidence that the equity accounted investment in AWAC could be impaired as at 31 December 2016.
The long term alumina price is the key assumption to which the valuation of AWAC is most sensitive.
Alumina’s conclusion was that there was no indicator for impairment for the year ended 31 December 2016.
To evaluate the impairment indicator assessment of the AWAC investment we:
• Obtained an understanding of process by which the impairment indicator assessment was conducted.
• Compared the Group’s long term alumina price assumption to economic analyst and industry forecasts. We found that the long term alumina price assumption used by the Group was consistent with market data and industry research.
• Compared the Group’s market capitalisation to its net assets as at 31 December 2016, noting that market capitalisation exceeded its net assets by approximately $1.7 billion.
• Evaluated the Group’s assessment of whether there were any other external or internal sources of information that could indicate that the investment may be impaired.
ALUMINA LIMITED ANNUAL REPORT 2016 95

Impact of Alcoa Inc’s separation into Alcoa Corporation and Arconic Inc. on Alumina
(Refer to operating and financial review in the financial report)
Effective from 1 November 2016, Alcoa Inc. completed its separation into two independent listed companies. Alcoa Corporation separated from its former parent company (Alcoa Inc.), which was subsequently renamed Arconic Inc. As a result, Alcoa Corporation replaced Alcoa Inc. as Alumina’s joint venture partner in the AWAC joint venture.
Associated with the separation, Alumina and Alcoa Corporation negotiated several amendments to the AWAC Joint Venture agreements. The new agreements resulted in amendments to the AWAC Joint Venture governance and debt funding and distribution policies, which took effect upon completion of the Alcoa separation and other changes that will only be effective on a change of control.
We determined this to be a key audit matter because the Group had to make judgements on the above with respect to Alumina’s business, in particular, whether future profitability or sustainability were adversely affected by these changes and whether there were other financial reporting implications arising from the Alcoa Inc. separation (for example, any implications for Alumina’s treatment of AWAC as an associate).
We performed the following procedures, amongst others, in evaluating the potential impact of Alcoa Inc’s separation on Alumina:
• Obtained the revised AWAC Joint Venture agreements and Charter of the Strategic Council of AWAC and assessed the nature of the amendments negotiated by Alumina and Alcoa Corporation.
• We evaluated the Group’s conclusion that the investment in AWAC should continue to be accounted for as an associate.
• Evaluated other potential financial reporting implications of these changes on Alumina, including the need for any additional adjustments to convert from US GAAP to Australian Accounting Standards.
Key audit matter How our audit addressed the key audit matter
OTHER INFORMATION The Directors are responsible for the other information included in the Group’s annual report for the year ended 31 December 2016, which comprises:
• At a glance
• Chairman and Chief Executive Officer’s Report
• Sustainability
• Director’s Report
• Operating and Financial Review
• Letter by Chair of the Compensation Committee
• Shareholder Information
• Financial History
but does not include the financial report and our auditor’s report thereon.
96

Our opinion on the financial report does not cover the other information and accordingly we do not express any form of assurance conclusion thereon.
In connection with our audit of the financial report, our responsibility is to read the other information identified above and, in doing so, consider whether the other information is materially inconsistent with the financial report or our knowledge obtained in the audit, or otherwise appears to be materially misstated.
If, based on the work we have performed, we conclude that there is a material misstatement of this other information, we are required to report that fact. We have nothing to report in this regard.
RESPONSIBILITIES OF THE DIRECTORS FOR THE FINANCIAL REPORTThe Directors of the Company are responsible for the preparation of the financial report that gives a true and fair view in accordance with Australian Accounting Standards and the Corporations Act 2001 and for such internal control as the Directors determine is necessary to enable the preparation of the financial report that gives a true and fair view and is free from material misstatement, whether due to fraud or error.
In preparing the financial report, the Directors are responsible for assessing the ability of the Group to continue as a going concern, disclosing, as applicable, matters related to going concern and using the going concern basis of accounting unless the Directors either intend to liquidate the Group or to cease operations, or has no realistic alternative but to do so.
AUDITOR’S RESPONSIBILITIES FOR THE AUDIT OF THE FINANCIAL REPORTOur objectives are to obtain reasonable assurance about whether the financial report as a whole is free from material misstatement, whether due to fraud or error, and to issue an auditor’s report that includes our opinion. Reasonable assurance is a high level of assurance, but is not a guarantee that an audit conducted in accordance with the Australian Auditing Standards will always detect a material misstatement when it exists. Misstatements can arise from fraud or error and are considered material if, individually or in the aggregate, they could reasonably be expected to influence the economic decisions of users taken on the basis of the financial report.
A further description of our responsibilities for the audit of the financial report is located at the Auditing and Assurance Standards Board website at: http://www.auasb.gov.au/auditors_files/ar2.pdf. This description forms part of our audit report.
REPORT ON THE REMUNERATION REPORT
OUR OPINION ON THE REMUNERATION REPORTWe have audited the remuneration report included in pages 35 to 59 of the Directors’ report for the year ended 31 December 2016.
In our opinion, the remuneration report of Alumina Limited for the year ended 31 December 2016 complies with section 300A of the Corporations Act 2001.
RESPONSIBILITIES The Directors of the Company are responsible for the preparation and presentation of the remuneration report in accordance with section 300A of the Corporations Act 2001. Our responsibility is to express an opinion on the remuneration report, based on our audit conducted in accordance with Australian Auditing Standards.
Melbourne 23 March 2017
ALUMINA LIMITED ANNUAL REPORT 2016 97
Nadia Carlin Partner
PricewaterhouseCoopers

98
DETAILS OF SHAREHOLDINGS AND SHAREHOLDERS LISTED SECURITIES – 1 MARCH 2017
Alumina Limited has 2,879,843,498 issued fully paid ordinary shares.
SIZE OF SHAREHOLDINGS AS AT 1 MARCH 2017
RANGE TOTAL HOLDERS UNITS % OF ISSUED CAPITAL
1 - 1,000 19,502 8,968,207 0.31
1,001 - 5,000 20,191 49,514,926 1.72
5,001 - 10,000 6,239 45,836,354 1.59
10,001 - 100,000 6,550 165,178,533 5.74
100,001 - 9,999,999,999 371 2,610,345,478 90.64
Total 52,853 2,879,843,498 100.00
Of these, 6,547 shareholders held less than a marketable parcel of $500 worth of shares (274) a total of 979,288 shares. In accordance with ASX Business Rules, the last sale price on the Company’s shares on the ASX on 1 March 2017 was used to determine the number of shares in a marketable parcel.
NAME NO. OF FULLY PAID ORDINARY SHARES
%
1. HSBC CUSTODY NOMINEES (AUST) 706,302,835 24.53
2. J P MORGAN NOMINEES AUSTRALIA LIMITED 489,458,496 17.00
3. CITICORP NOMINEES 303,816,766 10.55
4. CITIC RESOURCES AUSTRALIA PTY LTD 219,617,657 7.63
5. BESTBUY OVERSEAS CO LTD 154,114,590 5.35
6. NATIONAL NOMINEES 148,095,534 5.14
7. BNP PARIBAS NOMS PTY LTD <AGENCY LENDING DRP A/C> 102,521,467 3.56
8. CITIC RESOURCES AUSTRALIA PTY LTD 59,282,343 2.06
9. RBC GLOBAL SERVICES AUSTRALIA 55,713,216 1.93
10. BESTBUY OVERSEAS CO LTD 54,219,014 1.88
11. BNP PARIBAS NOMS PTY LTD <DRP> 43,612,488 1.51
12. CITIC AUSTRALIA PTY LTD 39,799,208 1.38
13. UBS NOMINEES PTY LTD 28,033,008 0.97
14. AMP LIFE 24,113,574 0.84
15. HSBC CUSTODY NOMINEES (AUSTRALIA) LIMITED <NT-COMNWLTH SUPER CORP A/C> 17,491,197 0.61
16. ARGO INVESTMENTS LIMITED 12,429,285 0.43
17. CITICORP NOMINEES PTY LIMITED <COLONIAL FIRST STATE INV A/C) 9,752,234 0.34
18. NATIONAL NOMINEES LIMITED <DB A/C> 9,249,840 0.32
19. RBC INVESTOR SERVICES AUSTRALIA NOMINEES PTY LIMITED <PISELECT> 8,953,427 0.31
20. BNP PARIBAS NOMS (NZ) <DRP> 7,049,506 0.24
Totals: Top 20 holders of ORDINARY FULLY PAID SHARES (TOTAL) 2,493,625,865 86.59
Total Remaining Holders Balance 386,217,633 13.41
2,879,843,498 100.00

ALUMINA LIMITED ANNUAL REPORT 2016 99
Each ordinary shareholder is entitled on a show of hands to vote and on a poll one vote for each share held.
The Company does not have a current on market buy-back of its shares. There are no restricted securities or securities subject to voluntary escrow.
During the reporting period, 1,508,604 Alumina Limited fully paid ordinary shares were purchased on market by the Alumina Employee Share Plan at an average price of $1.3657.
SUBSTANTIAL SHAREHOLDING AS AT 1 MARCH 2017 SHAREHOLDING %
CITIC Resources Australia Pty. Ltd. 527,032,812 18.3
Allan Gray Australia Pty. Ltd. 265,942,188 9.23
Perpetual Investments Limited 255,387,781 8.87
Schroder Investment Management (Australia) Limited 197,288,221 6.85
Lazard Asset Management Pacific Limited 185,129,712 6.43

FINANCIAL history
100
ALUMINA LIMITED AND CONTROLLED ENTITIES
AS AT 31 DECEMBER 2016
US$ MILLION
2015
US$ MILLION
2014
US$ MILLION
2013
US$ MILLION
2012
US$ MILLION
Revenue from continuing operations 0.6 0.1 0.1 0.3 0.1
Share of net profit/(loss) of associates accounted for using the equity method
18.1 109.9 (73.6) (97.4) (7.5)
Other income – – 1.5 137.1 –
General and administrative expenses (25.7) (11.9) (13.5) (17.2) (19.0)
Change in fair value of derivatives/foreign exchange losses (14.1) (3.2) 1.6 3.0 0.6
Finance costs (9.1) (6.6) (13.6) (25.3) (29.4)
Income tax (expense)/benefit from continuing operations – – (0.8) – (0.4)
Net (loss)/profit attributable to owners of Alumina Limited (30.2) 88.3 (98.3) 0.5 (55.6)
Total assets 2,117.8 2,110.7 2,543.2 2,964.0 3,311.4
Total liabilities 110.9 127.8 119.2 170.6 682.9
Net assets 2,006.9 1,982.9 2,424.0 2,793.4 2,628.5
Shareholders’ funds 2,006.9 1,982.9 2,424.0 2,793.4 2,628.5
Dividends paid 135.32 171.2 – – 73.22
Dividends received from AWAC 150.2 61.4 16.0 100.0 86.0
Statistics
Dividends declared per ordinary share US6.0c US6.3c US1.6c –3 –3
Dividend payout ratio – 202% – – –
Return on equity1 (1.5)% 3.9% (3.5)% 0.02% (2.0)%
Gearing (net debt to equity) 4.0% 4.8% 3.4% 4.6% 20.1%
Net tangible assets backing per share $0.61 $0.60 $0.77 $0.91 $0.97
1. Based on net (loss)/profit attributable to owners of Alumina Limited.2. Final dividend for the financial year ended 31 December 2015, declared and paid in 2016 and interim dividend for the year ended 31 December 2015,
declared and paid in 2015.3. No interim or final dividend declared for the years ended 31 December 2013 and 31 December 2012.

ALUMINA LIMITED
ABN 85 004 820 419 Registered Corporate Head Office Level 12, IBM Centre 60 City Road Southbank Victoria 3006 Australia
GPO Box 5411 Melbourne Victoria 3001 Australia Telephone +61 (0)3 8699 2600 Facsimile +61 (0)3 8699 2699 Website www.aluminalimited.com Email [email protected]
AMERICAN DEPOSITARY RECEIPTS
BNY Mellon shareowner services telephone and internet correspondence: Toll free number (for callers within the USA) 1-888-BNY-ADRS (1-888-269-2377) Telephone (for non-US callers) +1 201-680-6825 Website: www.bnymellon.com/shareowner Email: [email protected]
Shareowner correspondence should be mailed to: BNY Mellon Shareowner Services P.O. Box 30170 College Station, TX 77842-3170
Overnight Shareowner correspondence should be mailed to: 211 Quality Circle, Suite 210 College Station, TX 77845
SHARE REGISTRY
Computershare Investor Services Pty Limited Yarra Falls 452 Johnston Street Abbotsford Victoria 3067 Australia
GPO Box 2975 Melbourne Victoria 3001 Australia Telephone +61(0)3 9415 4027 Or 1300 556 050 (for callers within Australia) Facsimile +61(0)3 9473 2500 Email [email protected]
Neither Alumina nor any other person warrants or guarantees the future performance of Alumina or any return on any investment made in Alumina securities. This document may contain certain forward-looking statements, including forward-looking statements within the meaning of the US Private Securities Litigation Reform Act of 1995. The words “anticipate”, “aim”, “believe”, “expect”, “project”, “estimate”, “forecast”, “intend”, “likely”, “should”, “could”, “will”, “may”, “target”, “plan” and other similar expressions (including indications of “objectives”) are intended to identify forward-looking statements. Indications of, and guidance on, future financial position and performance and distributions, and statements regarding Alumina’s future developments and the market outlook, are also forward-looking statements.
Any forward-looking statements contained in this document are not guarantees of future performance. Such forward-looking statements involve known and unknown risks, uncertainties and other factors, many of which are beyond the control of Alumina and its directors, officers, employees and agents that may cause actual results to differ materially from those expressed or implied in such statements. Those risks, uncertainties and other factors include (without limitation): (a) material adverse changes in global economic conditions, alumina or aluminium industry conditions or the markets served by AWAC; (b) changes in production or development costs, production levels or sales agreements; (c) changes in laws, regulations or policies; (d) changes in alumina or aluminium prices or currency exchange rates; (e) Alumina Limited does not hold a majority interest in AWAC and decisions made by majority vote may not be in the best interests of Alumina Limited; and (f) the other risk factors summarised in Alumina’s Annual Report 2016. Readers should not place undue reliance on forward-looking statements. Except as required by law, Alumina disclaims any responsibility to update or revise any forward- looking statements to reflect any new information or any change in the events, conditions or circumstances on which a statement is based or to which it relates.
DESIGN ERD.COM.AU PRINT BAMBRA PRESS