alu-druckguss GmbH ADB Group - TASE · 2013-08-15 · According to the expert valuation, there is a...
46
alu-druckguss GmbH ADB Group Purchase Price Allocation December 2012
Transcript of alu-druckguss GmbH ADB Group - TASE · 2013-08-15 · According to the expert valuation, there is a...

alu-druckguss GmbH ADB Group Purchase Price Allocation
December 2012

Section 1: The Acquisition
Purchase Price Allocation | ADB Group 2
BDO Ziv Haft Amot Bituach House Building B, 48
Menachem Begin Road, Tel Aviv 66180 Israel www.bdo.co.il
August 16, 2013
Tadir-Gan Europe Ltd.
Re: A Purchase Price Allocation of alu-druckguss GmbH
In accordance with a request by Tadir-Gan Europe LTD (Hereinafter: "Tadir-
Gan Europe" or "The purchaser"),subsidiary company of Tadir-Gan Precision
Products (1993) LTD. (Hereinafter: "Tadir-Gan") BDO Ziv Haft Consulting &
Management Ltd. (Hereinafter: "BDO"), has performed an investigation and
valuation of the net assets of ADB Group (Hereinafter: "The Company"
or/and the "ADB Group"), acquired by Tadir-Gan Europe, on January 8, 2013
(Hereinafter: the "Valuation Date").
The valuation is based upon data and information delivered to us by the
purchaser and its management. Among data and information used are:
The Company's unaudited financial reports as of December 31, of the
years 2011-2012;
The acquisition Details;
The Company's budget for 2013;
The Company's sales program for 2013-2017;
Customers sales planning for 2013-2017;
Valuation of current market value of the equipment, as of December
31, 2012, by an independent estimator;
Other information provided by the management, written or oral;
Discussions with the management;
Publicly available information regarding the industry.
While making this PPA, BDO used the data and information supplied by the
purchaser without examining its correctness and completeness. The data
and information received from the purchaser were assumed correct, and any
reliance thereof is neither confirmation nor verification of their validity.
BDO and its employees are not responsible for the completeness or accuracy
of the aforementioned data, or for any inaccuracy, error, omission or any
other fault caused by using the aforementioned data.
The valuation of the Company's assets involves assumptions, estimates and
forecasts, yet supposed to reasonably assess the economic value based on
the available information at the time of the evaluation. Any change in the
different variables or supplemental information may affect the outcomes of
the evaluation, and consequently the conclusions of the analysis.
This Purchase Price Allocation report contains forward-looking statements,
with respect to the Company, its financial condition and projected results of
its operations.

Section 1: The Acquisition
Purchase Price Allocation | ADB Group 3
These forward-looking statements are subject to risks and uncertainties,
including, but not limited to, changes in general economic conditions,
failure to forecast the market trends, and specific risks associated with the
nature of target markets and unanticipated events or circumstances.
Changes in economic conditions and market trends might significantly affect
the valuation.
Details regarding the valuation specialist
BDO was founded by the partners of BDO Certified Public Accountants. BDO
is part of the international BDO network, provides a full range of business
services required for national and international businesses in any sector.
BDO has vast experience in the following fields: business valuations,
financial and tax due diligence, goodwill and intangible assets valuations,
financial analyses, business plans, project finance PFI/PPP advisory, M&A,
investment banking and more.
Your exclusive remedy and BDO’s sole liability to you, for any cause
whatsoever will be limited to the fees paid to BDO under this Agreement.
The foregoing limitation will apply regardless of the form of action, whether
contract or tort, including without limitation, negligence, except that such
limitation shall not apply in the case of gross negligence, revenue, data, use
of other commercial injury, or any special, incidental, indirect or
consequential damages, suffered by Tadir-Gan or any third party, whether
or not BDO has been advised of the possibility of such loss, injury, damages
or third party claim, under any cause of action arising out of or relating to
this Agreement.
You acknowledge that Tadir-Gan Europe is solely responsible for the
payment of all fees, expenses, indemnification or other amounts due under
or in connection with this engagement. Tadir-Gan Europe shall indemnify,
defend, hold harmless, and release BDO from and against any and all claims,
lawsuits, judgments, proceedings, damages, costs, and expenses (including
court costs and reasonable attorney’s fees) in any manner relating to,
arising out or associated with this engagement or any of the services
provided by BDO under this Agreement, except that such indemnity shall not
apply in the case of gross negligence or willful misconduct by BDO.
BDO reserves the right to update the evaluation in light of new information,
which was not introduced prior to this analysis.
We would be delighted to be of any assistance.
Respectfully submitted,
BDO Ziv Haft
Consulting & Management Ltd.

Section 1: The Acquisition
Purchase Price Allocation | ADB Group 4
Results
Results Results
The balance sheets data as of the Valuation Date is based on the Company's
financial data as of December 31, 2012.
According to the assumptions detailed in this report, we have arrived to the
conclusion that some of the acquired intangible assets were needed to
revaluate to reflect market value. The following table provides details
regarding the Company's assets and liabilities (in thousands €):
Source: Company's financial reports and BDO analysis.
Source: company's financial reports and BDO analysis.
Thousands € Note Book Value Fair value Difference% of
Purchase Price
Assets
Current Assets
Cash and Cash Equivalents 2,029 2,029 – 26.7%
Account Receivable 1,805 1,805 – 23.7%
Other Receivable 1 954 954 – 12.6%
Inventories 2 2,377 2,377 – 31.3%
Fixed assets 3 12,549 14,076 1,526 185.2%
Deferred tax 4 – (473) (473) -6.2%
Intangible assets 34 34 – 0.4%
Total Current Assets 19,748 20,801 1,053 273.7%
Non Current Assets
Long Term Investments 8 8 – 0.1%
Total Non Current Assets 8 8 – 0.1%
Total assets 19,756 20,809 1,053 273.8%
Thousands € Note Book Value Fair value Difference% of
Purchase Price
Liabilities
Current Liabilities
Short term Liabilities 5 399 399 – 5.3%
Account Payable 6 1,602 1,602 – 21.1%
Other Payable 1,817 1,817 – 23.9%
Employee provision 7 – 198 198 2.6%
Deferred tax 4 – (61) (61) 0.0%
Total Non Current Liabilities 3,819 3,956 137 52.1%
Non Current Liabilities
Long term Liabilities 8 5,781 5,781 – 76.1%
Employee provision 9 – 247 247 3.2%
Deferred tax 4 – (76) (76) 0.0%
Total Current Liabilities 5,781 5,951 170 78.3%
Total Liabilities 9,600 9,907 307 130.4%
Total net assets 10,155 10,902 746 143.4%
Intangible Assets
Customers Relationships 10 – – 0.0%
Total Intangible Assets – – 0%
Gain from bargain purchase 11 (3,302) (43%)
Purchase Price 12 7,600

Section 1: The Acquisition
Purchase Price Allocation | ADB Group 5
Results
Notes Notes
1. Other Receivable- According to the Company, the receivable, as of the
Valuation Date, is attributed to short-term operating amounts, which
received by the customers during the last business year and expected to
be charged during the current year. Therefore, there is no difference
between the book value and the fair value of the Trade and Other
Receivable balance and no adjustments have been made.
2. Inventory- The book value of the Company's inventory is €2,377 thousand
and consists of raw materials and other (22%), finished goods (1%) and
work in process (77%). According to Company's management and our
analysis there is no difference between the book value and the fair value
of the Inventory balance and no adjustments have been made.
3. Fixed Assets- The Company's fixed assets, as presented in its financial
report, consist mostly of buildings improvements, Moulds and machinery,
office furniture and prepayments and construction in progress. The fixed
assets are located at the Company's facilities in Germany and Poland and
serve the Company's operating activity.
According to Company's management, the book value of the buildings
improvements, office furniture and prepayments and construction in
progress, represents their fair value. However, the book value of the
machinery does not reflect their fair value. Therefore, we based the
machinery value on an assessor valuation, as of December 31, 2012,
which was received by Tadir-Gan Europe. This valuation was made by an
expert, on behalf of the Company, and was not examined by us.
According to the expert valuation, there is a difference between the book
value and the fair value of the machinery assets of €1,526 thousand. In
addition, the weighted average economic useful life of the machinery,
according to the assessor valuation, is about 18 years.
4. Deferred Tax – received by Company's management.
5. Short term Liabilities- According to the Company, the Company's short
term financial liabilities consists of liabilities to banks. Since this
liability is expected to be paid in the coming year, no adjustments have
been made.
6. Account Payable- According to the Company, the Account Payable, as of
the Valuation Date, is attributed to short-term operating amounts,
which are received by the suppliers during the last business year and
expected to be charged during the current year. Therefore, there is no
difference between the book value and the fair value of this balance and
no adjustments have been made.
7. Current Employee Provision- According to Tadir-Gan Europe's
management, as part of the reorganization attributed to the business
combination, Mr. Jochen Krüger (former owner), which was also one of
the Company's two CEO's, has finished his role in ADB as of April 1st,
2013.

Section 1: The Acquisition
Purchase Price Allocation | ADB Group 6
Results
Notes Notes
According to his constrain agreement; the Company will continue to pay
salary to Mr. Krüger until the restrictive employment agreement will
terminate, at the end of 2014. We evaluated the fair value of the
liability to pay Mr. Krüger's salary in an amount of €445 thousand, while
the Current Liability was set on €198 thousand. For more information
see appendix D.
8. Long term Liabilities- According to the Company, the Company's long
term financial liabilities are liabilities to banks, which are presented in
its fair value, since the interest on these liabilities is fixed and
represents the market interest for company in ADB risk level. Therefore,
no adjustments have been made.
9. Non Current Employee Provision- As mentioned in note 5, we evaluated
the fair value of the liability to pay Mr. Krüger's salary in an amount of
€445 thousand, while the Non Current Liability was set on €247
thousand. For more information see appendix D.
10. Customers Relationships- As part of the business combination, we
evaluated the fair value of the Company's Customers Relationships, as an
intangible asset, using the Income Approach. According to the valuation
the fair value of the intangible asset was set to zero. For more details
see Chapter 7- Valuation of Intangible Assets.
11. Gain from bargain purchase- The difference between the purchase
price and the fair value of the Company's net assets and intangible
assets, represents the gain from bargain purchase. The gain from
bargain purchase is attributed to the seller's pressure to sell their
holdings in the Company. In 2007, IKB Equity Capital Fund bought 49% of
the Company. During the global economic crisis, in 2009, the Company's
activities declined and the Company entered into the process of self
insolvency by the end of 2010. IKB fund decided to close their business
in the automotive area as of few investments that fail to achieve yield
along with few years of constrains in the industry in Europe, there for
they made a decision to sale the Company as soon as possible. 51% of
the Company's shares were held by private shareholders, which were
required by contract, to sell their holdings whether IKB Fund decides to
(Bring Along). In this transaction, Tadir-Gan Europe seized the
opportunity, and acquired 100% of the Company's shares, at a bargain
price. The Purchase Price is allocated to the tangible, with any
remainder allocated to gain from bargain purchase. Accordingly, the fair
value of the gain from bargain purchase totalled to approximately
€3,637 thousand.
12. The purchase price- According to the transaction agreement the
purchase price of the Company was €7,600 thousands. For more
information see Section 1- The Acquisition.

Section 1: The Acquisition
Purchase Price Allocation | ADB Group 7
Table of Contents
The Acquisition 8
Company Overview 10
Financial Statements 15
The Purchaser 18
Market Overview 20
Methodology 23
Valuation of Intangible Assets 32
Results 39
Appendix 43

Section 1: The Acquisition
Purchase Price Allocation | ADB Group 8
Section 1
The Acquisition

Section 1: The Acquisition
Purchase Price Allocation | ADB Group 9
The Acquisition
The Acquisition The Acquisition
On October 25th, Tadir-Gan Europe signed an agreement to acquire the full
ownership of ADB Group, a limited partnership incorporated in accordance
with German law, operating in the production, processing and marketing of
the assemblies mechanical parts from aluminum for the automotive industry
(hereinafter: "the agreement").
According to the agreement, the purchaser will acquire, on the closing date,
through the partners of ADB Group, their full rights of the Company, so that
ADB will become a wholly owned corporation of the purchaser.
Consideration of the agreement, Tadir-Gan Europe will pay an amount of
€7,600 thousands (€7,200 thousands for ADB and €400 thousands for ADP).
The transaction is subject to several conditions: the approval of the German
antitrust authority, absence of any prohibiting regarding the closing of the
transaction, no change has occurred regarding the companies and removing
enslaves on the Company's selling rights. From the amount of €7,600
thousands, €5,600 thousands will be paid to the sellers at the closing date
and €2,000 thousands will be held in a trust account for a period of 18 and
24 months from the closing date, until all conditions detailed above are
fulfilled.
ADB Group is engaged in the production, processing and marketing of
products manufactured by precision pressure casting of aluminum alloys.
The products are manufactured using complex casting systems. Most of the
Company's products are intended for vehicles, and include, in particular,
various mechanical assemblies for the automotive industry.
On January 8th, 2013, the agreement was closed between ADB group and
Tadir-Gan Europe.
On March 12th, 2013 the agreement was closed between ADP and ADB.
Section 2: Company Overview
Purchase Price Allocation | ADB Group 10
Section 2
Company Overview

Section 2: Company Overview
Purchase Price Allocation | ADB Group 11
Company Overview
General Description General Description
ADB Group is engaged in the production, processing and marketing of
products manufactured by precision pressure casting of aluminum alloys.
The products are manufactured using complex casting systems. Most of the
Company's products are intended for the various types of automotive and
mechanical assemblies industries.
The Company employs 354 workers of which approximately 296 employees
are based in Brieselang, Germany, and 58 employees in Nowa Sól, Poland.
Processing works are carried out in Germany, the main production plant of
the Company, whereas the manpower-intensive work, such as processing,
trimming or sandblasting, is carried out in Poland. The process in Poland is
required for approximately 90% of the products made in Germany.
In 1869, Ludwig Loewe & Co. was founded in Berlin. The company was the
first supplier of die-casting in Europe, since 1906. In 1983 alu-druckguss
GmbH & Co. Berlin KG was founded as it took over Ludwig Loewe's die-
casting operation and opened another facility in Brieselang, Germany. As the
Company expanded its manufacturing capacities, in 1991 alu-druckguss was
founded and in 2001 another factory was built in Nowa Sól, Poland, with the
purpose of lowering cost production.
In 2010, the Company entered into controlled insolvency proceedings,
following the difficulties that have been created on account of a sharp
decline in automotive industry in general, due to the economic crisis that
began in 2008.
In 2011, the facility in Berlin was shut down on the account of unprofitable
manufacturing. As a result, the Company lost 15% of its revenues (the other
products manufactured in another factory), however the Company's profit
increased due to the reduced production of products with small margins.

Section 2: Company Overview
Purchase Price Allocation | ADB Group 12
Company Overview
Products Products
ADB Group is a supplier of aluminum die-casting components, mostly for the
German automotive industry. The Company offers its customers a full range
of services for high-quality die-cast aluminum with complex mechanical
machining and for the assembly of system components.
Die-casting is a metal casting process which occurs by compressing the
molten metal under pressure into the mold cavity using vacuum technique.
Most die castings are made from no ferrous metals. This method is suitable
for a large number of medium-sized castings. These castings have a very
good surface finishing and dimensional consistency. The Company mainly
produces aluminium die-casting components for the automotive industry:
engine components, transmission and steering components. The Company
also manufactures non- automotive products, representing 2% of its total
sales. The Company's products are characterized by their design and
production process. The main distinct features are: flatness, stiffness and
pressure tightness.
Engine components
Sealing flanges- form the interface between engine and transmission.
Sealing flanges is the core product of the Company and its special
expertise.
Cylinder heads- seals the combustion engine. The Company provides
benefits for its customers, as the products are pre- finished and pre-
assembled so that it's ready for immediate installation.
Filter housings- hold the oil filter. Provided for commercial vehicles
only.
Oil pans- produce the engine oil for lubrication of engine components.

Section 2: Company Overview
Purchase Price Allocation | ADB Group 13
Company Overview
Products Customers
Transmission and steering
Gearboxes- close the transmission which transfers the engine power to
the axle. Manufactured using a sensitive electronic system.
Gear shift covers- hold the shift fork. Manufactured with sensors used
in modern transmission systems.
Transmission support- transmission isolation from passenger's
compartment and intensifying the transmission in a specific location.
OEM Customers
The Company is an original equipment manufacturer for several clients.
The automotive OEMs are the Company's main customers group. These
close relations are characterized by a long term relationship, joint R&D
and high loyalty. Among the OEM customers are: VW Group (VW 49%, Audi
30%), MAN (2%) and DAIMLER. The OEM customers represent 81% of the
Company's customers.
Tier-1 customers
The Company manufactures vehicle parts for its Tier-1 customers, which
are not original car spare parts. Joint ventures between the Company and
the customer create a standardization of products and provide the
customer with a shorter response time. Main customers of this group are:
Koki (9%), ZF (3%), Hengst (2%) and DeltaTech (1%). The Tier-1 customers
represent 16% of the Company's customers.

Section 2: Company Overview
Purchase Price Allocation | ADB Group 14
Company Overview
Customers Research and Development
ADB Group is a single source supplier for almost all of its products. The
Company carries out sales to its customers while signing employment
contracts of 5-7 years with each client. The Company has established a
strong and stable relationship with its customers: during the insolvency
proceeding in 2010-2011, the Company did not suffer from any customer
desertion or withdrawal of orders. Furthermore, the Company was awarded
the title of being one of the top 10 suppliers for aluminum die-casting
components of the VW Group 2018 supplier strategy. The Company employs
a loyal workforce and its employees were highly committed as witnessed
during the insolvency proceedings. ADB Group expects a positive market
development for aluminum die-casting, which will be driven by a growing
automobile industry. Due to strong customer service and close R&D
collaboration with its main OEM customers, the Company expects to benefit
from the relations with its customers well beyond the expected term of five
years, in which the scope of work with the clients is known.
The R&D department concentrates primarily on the development of new
casting cells and trimming tools and on designing CAD (computer aided
design). The main virtue of the R&D department is that it is able to help the
Company's clients to improve their products. The OEM collaboration creates
initial components and the R&D department optimizes the die-casting and
machining.
Aluminum is an eco- friendly material: in 2012, up to 95% of the aluminum
used in automobiles is collected and reused. According to the European
guideline for the abandonment of vehicles, by 2015, 95% of their weight
should be recovered or re-used.
Employees
All employees of the Company received substantial training and have high
level of expertise. Even thought majority the workers are not unionized,
they remain loyal to the Company. One way of pointing out the motivation
and dedication is by looking at the consistency and stability of manufacture
levels over time. The Company motivates its employees using a fitness bonus
and performance bonus. As of the valuation date, the Company's employees
are total to 354 (318 are production employees, 5 are marketing employees
and the rest are at the management department).

Section 3: Financial Statements
Purchase Price Allocation | ADB Group 15
Section 3
Financial Statements

Section 3: Financial Statements
Purchase Price Allocation | ADB Group 16
Financial Statements
Profit and Loss Statement Profit and Loss Statement
The following table presents the Company's profit and loss statements for
the twelve months ending on December 31, for the years 2011-2012
(thousands €);
Source: The Company's financial reports.
The following graph presents the Company's revenue (thousands €) and gross
profit tendency, during the years 2011-2012;
Source: BDO analysis.
Thousands € 2011 2012
Net Revenue 39,658 34,665
% growth (13%)
Costs Of Products 34,650 30,903
% of revenue 87% 89%
Gross Profit 5,008 3,762
Gross profit % 13% 11%
Sales and marketing 813 826
% of revenue 2% 2%
General and Administrative 1,656 1,932
% of revenue 4% 6%
Opereating expenses 2,469 2,758
% of revenue 6% 8%
Operating Profit 2,539 1,003
% Operating Profit 6% 3%
Income from banks loan forgiveness 10,333 26
% of revenue 26% 0%
Finance income, net 9,939 (424)
% of revenue 25% (1%)
Other expenses (4,441) 545
% of revenue (13%) 2%
Profit before Tax 16,919 34
% Profit before tax 43% 0%
Tax expenses (income) (8) (2)
% of revenue (0%) (0%)
Net profit 16,911 32
% Net Profit 43% 0%
39,658
34,665
13%
11%
10%
10%
11%
11%
12%
12%
13%
13%
32,000
33,000
34,000
35,000
36,000
37,000
38,000
39,000
40,000
41,000
Net Revenue % Gross profit

Section 3: Financial Statements
Purchase Price Allocation | ADB Group 17
Financial Statement
Balance Sheet Balance Sheet
The following table presents the Company's balance sheets as of December
31, for the years 2011-2012 (thousands €);
Source: Company's financial reports.
Source: Company's financial reports.
Thousands €
Current Assets
Cash and Cash Equivalents 2,463 2,029
Account Receivable 837 1,805
Other Receivable 719 954
Inventory 2,695 2,377
Tangible assets 13,408 12,549
Intangible assets 60 34
Total Current Assets 20,182 19,748
Non Current Assets
Long Term Investments 8 8
Total Non Current Assets 8 8
Total assets 20,190 19,756
December
31, 2012
December
31, 2011 Thousands €
Current Liabilities
Short term Liabilities – 399
Account Payable 171 1,602
Other Payable 3,186 1,817
Total Current Liabilities 3,357 3,819
Non Current Liabilities
Long term Liabilities 6,163 5,781
Other financial liabilities 604 –
Total Non Current Liabilities 6,768 5,781
Equity 10,065 10,155
Total Capital & Liabilities 20,190 19,756
December
31, 2012
December
31, 2011
Section 4: The Purchaser
Purchase Price Allocation | ADB Group 18
Section 4
The Purchaser

Section 4: The Purchaser
Purchase Price Allocation | ADB Group 19
The Purchaser
General
Tadir-Gan was established in October, 1993. The company has since
gathered wide experience in the fields of Aluminum HPDC and the
machinery industry. In 2004, Tadir Gan's shares were listed for trade on the
Tel Aviv stock exchange.
Tadir-Gan is engaged in the manufacturing and marketing of aluminum
complexes, and magnesium. The main products which the company
manufactures are oil pans, valve covers, transmission parts and other
aluminum products. Tadir Gan's main market is the automotive industry.
ADB group, As a result of the financial crisis which took place in 2009,
entered into self insolvency proceedings in 2010. The Company's minority
shares were held by IKB Equity Capital Fund, since 2007, as well as the
company's sales rights.
During the years 2009 and 2010 ADB experienced financial difficulties and
operational losses, Tadir-Gan Europe has acquired the ADB shares after two
years of profitability (2011 and 2012).
Tadir-Gan and the ADB Group are looking forward to a good synergy. By
using the integration between the companies, both companies sales volume,
for each existing or new customer, are expected to grow fundamentally.

Section 2: Market Overview
Purchase Price Allocation | ADB Group 20
Section 2
Market Overview

Section 2: Market Overview
Purchase Price Allocation | ADB Group 21
Market Overview
Industry background Industry background
According to the Global Economic Crisis study, made by the International
Labour Office of Geneva, Switzerland, by the end of 2009, it was evident
that the automotive sector was one of the industries hardest hit by the
financial and economic crisis of 2008 and 2009.
During 2008, the demand in the automotive industry collapsed to a degree
never experienced before. In the United States, the beginning of 2008 had
already seen a significant fall in demand for light trucks, and the overall fall
in demand that followed was felt significantly.
The following chart presents the international car sales (in millions of units):
Source: International Labor Office of Geneva, 2010.
In several markets, such as Europe, Japan and the United States, financial
measures were taken to support this sector, such as subsidies for the
purchase of cars (under the cover of Magritte programs: polluting old cars).
The United States also enabled the massive aid program in history, saving
two companies vehicles: General Motors and Chrysler. In the European
industry, the sales of private cars decreased by 15% and commercial vehicles
decreased 30%, the production of passenger cars decreased by 25% and
commercial vehicles by 60%.
According to the ACEA (Europian Automobile Manufacturers Association)
Europe is the world’s largest vehicle producer with an output of over 17
million passenger cars, vans, trucks and buses per year, accounting for 24%
of world vehicle production. The automotive sector contributes positively to
the EU trade balance with a €114.1 billion surplus. This contribution is highly
significant today as the EU economy as a whole struggles with a total trade
deficit for goods of €152.8 billion (november 2012).
The 16 ACEA members operate in 22 European countries with a total of 210
plants, producing passenger cars, light commercial vehicles or vans, buses
and coaches, medium sized and heavy-duty trucks, and engines. Typically,
automobile plants group a large number of automotive suppliers at the same
location or in the vicinity, contributing enormously to the economy of
-
2.0
4.0
6.0
8.0
10.0
12.0
14.0
16.0
18.0
- - 2012f 2013f
Canada
United States
Mexico
Germany
Russia
China
India
Brazil

Section 2: Market Overview
Purchase Price Allocation | ADB Group 22
Market Overview
Industry background Industry background
regions and countries. Other materials and automotive parts are supplied
from elsewhere in Europe and around the globe.
Between 2007 and the end of 2012 new car registrations are expected to
have dropped by over 3 million. This translates into a fall from 15.5 million
to about 12 million units - making 2012 the worst year since 1995. However,
the decrease in demand and manufacturing is not consistent; some
manufacturers are operating at 50-60% of their capacity, whereas others are
at 80-90% or even higher.
Even though the automotive markets in Germany and Western Europe were
strongly knocked by the financial and economic crisis starting in 2008, the
Sales figures for the three largest markets – Germany, France and Italy – are
softening the devastating situation in Europe.
According to J.P.Morgan, the global economy is beginning to recover from
the recession. Growth should gradually increase, even as the Euro area
experiences recession. Although growth is expected to be modest, with the
US rising 2.5%, a recognition that the global expansion remains on track will
lift confidence and asset prices. ]
According to the Global Economic Research of 2013, of the Scotiabank of
Canada (published on December 27, 2012) the cyclical recovery in global
auto sales that began in mid-2009 is expected to remain intact. Over the
past three years the average growth in the auto industry was at 7%. The
economists of the Scotiabank of Canada expect a further 4% advance in
2013, driving global volumes to the fourth consecutive annual record.
According to Automotive News Europe, Volkswagen's desire to launch a low-
cost brand. IHS Automotive analysts expect the world auto market to grow
by 3.4 million cars between 2012 and 2015, which most of that growth can
be tapped with affordable types of vehicles aimed at new buyers.
Competitors- there are many aluminum cast houses around the world. The
Company cannot estimate the share of the total global production of
aluminum die- cast, but it believes that the Company's share of global
production is even smaller. The Company's main competitors include Albert
Handtmann, BDW Group, Rufini and Druckguss Heidenau. The Company also
competes with its Indirect competitors on limited extent, such as KSM
Casting, Brabant, Gruber & Kaja and others.
Substitute products- competition between manufacturers that produce by
die- casting process, makes attempts to produce similar parts at lower costs
using other raw materials rather than aluminum.

Section 4: Methodology
Purchase Price Allocation | ADB Group 23
Section 4
Methodology

Section 4: Methodology
Purchase Price Allocation | ADB Group 24
Methodology
General The Acquisition Method
According to IFRS 3R, An entity shall account for each business combination
by applying the acquisition method.
Applying the acquisition method requires:
a) identifying the acquirer;
b) determining the acquisition date;
c) recognising and measuring the identifiable assets acquired, the
liabilities assumed and any non-controlling interest in the acquire; and
d) recognising and measuring goodwill or a gain from a bargain purchase.
Identifying the acquirer
For each business combination, one of the combining entities shall be
identified as the acquirer.
Determining the acquisition date
The acquirer shall identify the acquisition date, which is the date on which
it obtains control of the acquiree.
The date on which the acquirer obtains control of the acquiree is generally
the date on which the acquirer legally transfers the consideration, acquires
the assets and assumes the liabilities of the acquiree—the closing date.
Recognising and measuring the identifiable assets acquired, the liabilities
assumed and any non-controlling interest in the acquiree
As of the acquisition date, the acquirer shall recognise, separately from
goodwill, the identifiable assets acquired, the liabilities assumed and any
non-controlling interest in the acquiree.
Classifying or designating identifiable assets acquired and liabilities
assumed in a business combination
At the acquisition date, the acquirer shall classify or designate the
identifiable assets acquired and liabilities assumed as necessary to apply
other IFRSs subsequently. The acquirer shall make those classifications or
designations on the basis of the contractual terms, economic conditions, its
operating or accounting policies and other pertinent conditions as they exist
at the acquisition date.

Section 4: Methodology
Purchase Price Allocation | ADB Group 25
Methodology
Measurement principle Bargain purchases
The acquirer shall measure the identifiable assets acquired and the
liabilities assumed at their acquisition-date fair values.
Recognising and measuring goodwill or a gain from a bargain purchase
The acquirer shall recognise goodwill as of the acquisition date measured as
the excess of (a) over (b) below:
(a) The aggregate of:
1. the consideration transferred measured in accordance with this IFRS,
which generally requires acquisition-date fair value;
2. the amount of any non-controlling interest in the acquiree
measured;
3. in a business combination achieved in stages, the acquisition-date
fair value of the acquirer’s previously held equity interest in the
acquiree.
(b) The net of the acquisition-date amounts of the identifiable assets
acquired and the liabilities assumed measured in accordance with this IFRS.
Bargain purchases
Occasionally, an acquirer will make a bargain purchase, which is a business
combination in which the Net assets Acquired exceed the purchase price. If
that excess remains after applying the requirements, the acquirer shall
recognise the resulting gain in profit or loss on the acquisition date. The gain
shall be attributed to the acquirer.
Before recognising a gain on a bargain purchase, the acquirer shall reassess
whether it has correctly identified all of the assets acquired and all of the
liabilities assumed and shall recognise any additional assets or liabilities that
are identified in that review. The acquirer shall then review the procedures
used to measure the amounts this IFRS requires to be recognised at the
acquisition date for all of the following:
(a) the identifiable assets acquired and liabilities assumed;
(b) the non-controlling interest in the acquiree, if any;
(c) for a business combination achieved in stages, the acquirer’s
previously held equity interest in the acquiree; and
(d) the consideration transferred.
The objective of the review is to ensure that the measurements
appropriately reflect consideration of all available information as of the
acquisition date.

Section 4: Methodology
Purchase Price Allocation | ADB Group 26
Methodology
Approaches to Valuation Approaches to Valuation
There are few accepted approaches to valuate an asset's fair value:
1. Market approach;
2. Income approach;
3. Asset-based approach.
Within each category, a variety of methodologies exist to assist in the
estimation of fair value. The following sections contain a brief overview of
the theoretical basis of each approach, as well as a discussion of the specific
methodologies relevant to the analyses performed.
Market Approach
The market approach references actual transactions in the equity of the
enterprise being valued or transactions in similar enterprises that are traded
in the public markets. Third-party transactions in the equity of an enterprise
generally represent the best estimate of fair market value if they are done
at arm’s length. Under this approach, there are two primary methods. The
first often referred to as the Guideline Transactions Method, involves
determining valuation multiples from sales of enterprises with similar
financial and operating characteristics and applying those multiples to the
subject enterprise.
The second, often referred to as the Guideline Public Company Method
involves identifying and selecting publicly traded enterprises with financial
and operating characteristics similar to the enterprise being valued. Once
publicly traded enterprises are identified, valuation multiples can be
derived, adjusted for comparability, and then applied to the subject
enterprise to estimate the value of its equity or invested capital.
Income Approach
The income approach focuses on the income producing capability of the
asset. The underlying premise of this approach is that the value of an asset
is the present value of the future earning capacity that is available for
distribution to investors in the security or asset. A commonly used method
under the income approach is the discounted cash flow analysis. A
discounted cash flow analysis involves forecasting the appropriate cash flow
stream over an appropriate period and then discounting it back to a present
value at an appropriate discount rate. This discount rate should consider the
time value of money, inflation, and the risk inherent in ownership of the
asset or security interest being valued.

Section 4: Methodology
Purchase Price Allocation | ADB Group 27
Methodology
Approaches to Valuation
Valuation of the intangible assets
Asset-Based Approach
The Asset-Based Approach is based upon the concept of replacement as an
indicator of value. A prudent investor would pay no more for an asset than
its replacement or reproduction cost. This approach may be adjusted such as
depreciation from physical deterioration and functional obsolescence. This
approach generally provides the most reliable indication of the value of land
improvements, special-purpose buildings, special structures, systems, and
special machinery and equipment.
Valuation of the intangible assets
The valuation of the intangible assets of acquired companies is particularly
important since the most valuable assets of this type of company generally
are not recorded on the balance sheet before acquisition. Intangibles that
may exist at the time of the acquisition include: (a) base (or core),
developed and in-process technologies; (b) customer- related intangibles
(such as a distribution network or a customer base); (c) trademark(s), trade
name(s), and related intellectual property; and (d) covenants not-to-
compete.
In the determination of the Fair Value for each intangible asset, each
assessment should consider specific factors of the asset, including (but not
limited to):
The value of economic or monetary benefit to market participants;
The remaining economic life;
The relative risk profile.
Assembled workforce was also identified for the valuation analysis, but was
incorporated as part of goodwill. IFRS3R - Business Combinations, requires
that the assembled workforce shall not be recognized as an intangible asset
apart from goodwill in a business combination. Nevertheless, the assembled
workforce was identified separately for the purpose of calculating the
appropriate contributory charge needed to arrive at the Fair Value of each
of the Intangible Assets on a standalone basis.
As a result of our review, one intangible asset category (which meets the
criteria for separate recognition apart from goodwill) was identified for
analysis: customer relationship.

Section 4: Methodology
Purchase Price Allocation | ADB Group 28
Methodology
Valuation of the intangible assets
Valuation of the intangible assets
Listed below are other potential intangible assets that we examined and
which did not satisfy the material or accounting criteria for recognition:
1. Trade Name – Trade Name is occasionally recognized as an intangible
asset due to the criteria for separate recognition.
According to the Company's management, companies in the aluminum
die-casting components market could not charge a premium regarding a
Trade Name, since there is no added value to their products attributed
to a Trade name. In addition, most of these companies' sales derived
from strong commercial and personal relations with the customer.
Therefore, the Trade Name does not stand alone and cannot be
recognize according to the criteria for separate recognition. Hence, the
asset is not been recognized and we didn’t estimate its fair value.
2. Know How – Know How is usually recognized as an intangible asset due
to the criteria for separate recognition.
In this case, the specific knowledge which the company uses in order to
develop its products is not distinctive to the company. Customers can
purchase similar products from other companies in the sector. The
products that the company offers to its customers, are designed in joint
R&D process of the company and its customers and do not represent or
need exclusive knowledge.
Therefore, the Know How does not stand alone and cannot be recognize
according to the criteria for separate recognition. Hence, the asset is
not been recognized and we didn’t estimate its fair value.

Section 4: Methodology
Purchase Price Allocation | ADB Group 29
Methodology
WACC WACC
When applying the Income Approach, the cash flows expected to be
generated by a business are discounted to their present value equivalent
using a rate of return that reflects the relative risk of the investment, as
well as the time value of money. This return, known as the weighted
average cost of capital (“WACC”) is calculated by weighting the required
returns on interest-bearing debt and common equity capital in proportion to
their estimated percentages in an expected industry capital structure.
The general formula for calculating the WACC is:
WACC = Kd (D%) + Ke (E%)
Where:
WACC= Weighted average rate of return on invested capital;
Kd= After-tax rate of return on debt capital;
D%= Debt capital as a percentage of the sum of the debt, preferred and
common equity capital (“Total Invested Capital”);
Ke= Rate of return on common equity capital; and
E%= Common equity capital as a percentage of the Total Invested Capital.
CAPM has been empirically tested and is widely accepted for the purpose of
estimating a company’s required return on capital. In applying the CAPM,
the rate of return on capital is estimated as the current risk-free rate of
return on US Treasury bonds, plus a market risk premium expected over the
risk-free rate of return, multiplied by the “beta” for the valued company.
Beta is defined as a risk measure that reflects the sensitivity of a company’s
stock (or capital) price to the movements of the stock market as a whole.
The CAPM rate of return on capital is calculated using the formula:
Ke = Rf + β (Rm * Rf) + Scp + Srp , Where:
Ke= Rate of return on capital;
Rf= Risk free rate of return;
Β= Beta or systematic risk for this type of capital investment (in this case,
asset beta);
Rm – Rf= Market risk premium; the expected return on a broad portfolio of stocks
in the market (Rm) less the risk free rate (Rf);
Scp Small cap premium - Ibbotson valuation edition 2013 yearbook; and
Srp Specific Premium.

Section 4: Methodology
Purchase Price Allocation | ADB Group 30
DCF Approach
WACC WACC
We based on the Capital Asset Pricing Model (CAPM) in calculating the
WACC.
The following table presents the parameters used for the calculation of the
Company's WACC, as of December 31, 2012:
Source: BDO analysis.
D/V Ratio - Since the study is conducted from the market participants'
point of view, we examined the comparable companies' rate of debt out
of equity. Due to the fact, that the market's D/V ratio is approximately
35%, the Company's D/V ratio was also determined as 35%.
Risk Free Rate of Return (Rf) – based on German real government bond
for 10 years.
Market Risk Premium (Rm-Rf) - since the company's activity is only in
Germany, we used the German market risk premium (Source:
Damodaran).
Beta – the Beta was calculated according to comparable companies:
Tadir- Gan, national aluminum production, trinity precision technology
co ltd, klil industries ltd, Hulamin ltd, Hoganas ab-b and Catcher
technology co.
Scp – a premium was added to the price of equity. That premium
reflects the excess risk of investments in small companies. This premium
is due to the fact that investments in small companies carry greater risk
than investing in large and established, and therefore investors expect a
higher return when they invest in small companies. A premium of 6.03%
is attributed to the Company (Ibbotson edition 2013 yearbook).
Srp - Specific premium of 1% is attributed to the dependency in few
main customers.
Terminal growth rate of 2% was determined based upon the real economy
expected growth rate in the long run, and upon a conservative element of
the Unit's internal growth.
Name Source Symbol Value
Company's Debt Rate Comparable Companies D/V 35%
Company's Equity Rate Comparable Companies E/V 65%
Cost of Debt BDO analysis Kd 4%
Tax Rate Corporate Tax Rate in Germany T 31%
Risk Free Rate of Return Bloomberg, German Real Government Bonds 10 Yr Rf 0.0%
Market Risk Premium Damodaran Rm-Rf 5.80%
Beta Comparable Companies Beta 1.12
small cap premium Ibbotson valuation edition 2013 yearbook Scp 6.03%
specific premium Dependence on few major customers Srp 1%
Cost of Capital Rf +β*(Rm-Rf)+Scp+Srp Ke 14%
WACC (D/V)*(1-T)*Kd + (E/V)*Ke 10.0%

Section 4: Methodology
Purchase Price Allocation | ADB Group 31
DCF Approach
WACC WACC
While implementing the Income Approach to evaluate different assets, each
asset should be discounted in a rate reflecting its own risk. The risk and
liquidity of each type of asset being acquired may be greater than, equal to
or less than the overall discount rate of the company (regardless of how it
was computed). In most businesses that possess an array of asset types,
certain acquired assets may be:
a) More risky and/or less liquid (e.g., technology/patents, IPR&D, goodwill);
b) Comparably risky and/or liquid (e.g., customer lists,); or,
c) Less risky and/or more liquid (e.g., fixed assets and working capital).
It is generally appropriate to address this issue by assigning reasonable
premiums or discounts to the overall company discount rate when valuing
specific assets. Individually, each asset requires a higher or lower return
specifically related to the risks associated with that asset achieving its
estimated cash flows. Working capital assets (e.g., cash, accounts
receivable and inventory) and other tangible assets (e.g., machinery and
equipment and real property) have lower risks than intangible assets (e.g.,
Engineering drawings, trained work force, patents, etc.) And therefore have
lower required returns.
In the aggregate, however, the firm's required return represents the
weighted average return of the value of each asset multiplied by its
required return.
The required rates of return for the each of the following intangible asset
were used to derive the appropriate capital “charges” for estimating cash
flows under the income approach[1]: fixed assets – 5.4%; Working Capital –
3.4%; and assembled workforce – 10%;

Section 5: Valuation of Intangible Assets
Purchase Price Allocation | ADB Group 32
Section 5
Valuation of Intangible Assets

Section 5: Valuation of Intangible Assets
Purchase Price Allocation | ADB Group 33
Valuation of Intangible Assets
Customer Relationship
General
General
When an operating entity is sold, the company that was bought is often part
to agreements or relationships that are of material value to the acquirer.
These may include existing agreements with customers and/or returning
customers. Due to the fact that the future cash flow of the business would
be negatively affected in the absence of these agreements or relationships,
they are deemed to have an economic value.
Customer relationship can arise from contracts, but also from other sources
such as ordinary supplier-customer sales-related communications. However,
customer lists are often leased or exchanged. Therefore, customer lists,
acquired in a business combination, normally can be identified separately
from goodwill.
The Company's main customers in the sale of aluminium are manufacturers
of automotive and are the end customers (OEM). This group of customers
represents 78% of all customers. Most of the customers are multinational
corporations, employing thousands of workers, and have continuous working
relationship with the Company trades.
The engagement with the customer is mostly over 7 years. For the first two
years, the Company creates certain components and adjust its production.
For the next five years the production is carried out. There are further 5% to
7% sales which are sold to the Tier-1 customer, as parts. Moreover, most of
the Company's customers have been working with ADB more than 7 years.
The following chart describes the OEM's main customers sales for 2009-2012
and the booked sales for 2013-2017:
The Company has an established relationship with its large customers of the
OEM. The VW Group, which holds the largest share of customer's sale (49% in
2012), is engaged in business with the Company for years. Audi and MAN are
also important customers for the Company. The customers listed above have
sales contracts for the coming years and maintain a close working and
personal relationship with the Company.
-
2,000,000
4,000,000
6,000,000
8,000,000
10,000,000
12,000,000
14,000,000
16,000,000
18,000,000
Audi MAN VW

Section 5: Valuation of Intangible Assets
Purchase Price Allocation | ADB Group 34
Valuation of Intangible Assets
General General
Most of the Tier 1 customers are contractors in the vehicle industry, which
sell the products to the final consumer. Some customers are subcontractors
in the automotive industry, providing the products it manufactures, by
invitation, to the final customer (automobile manufacturer). Most of the
Company's customers in these sectors are international corporations which
employs thousands of workers.
As customary in the industry, the Company establishes framework
agreements with its customers, base on the commercial relations for the
next 7 years. To this forecast was added a short-term occasional orders each
year.
The following chart describes the Tier-1 customers sales for 2009-2012 and
the booked sales for 2013-2017:
All of the listed tier-1 customers have been working with the Company for
years. The fair value of customer relationship derived from the future cash
flows that expected to arise from each existing customers.
-
500,000
1,000,000
1,500,000
2,000,000
2,500,000
3,000,000
3,500,000
DeltaTech KOKI ZF
Section 5: Valuation of Intangible Assets
Purchase Price Allocation | ADB Group 35
Valuation of Intangible Assets
The Valuation of the Intangible Asset
The Valuation of the Intangible Asset
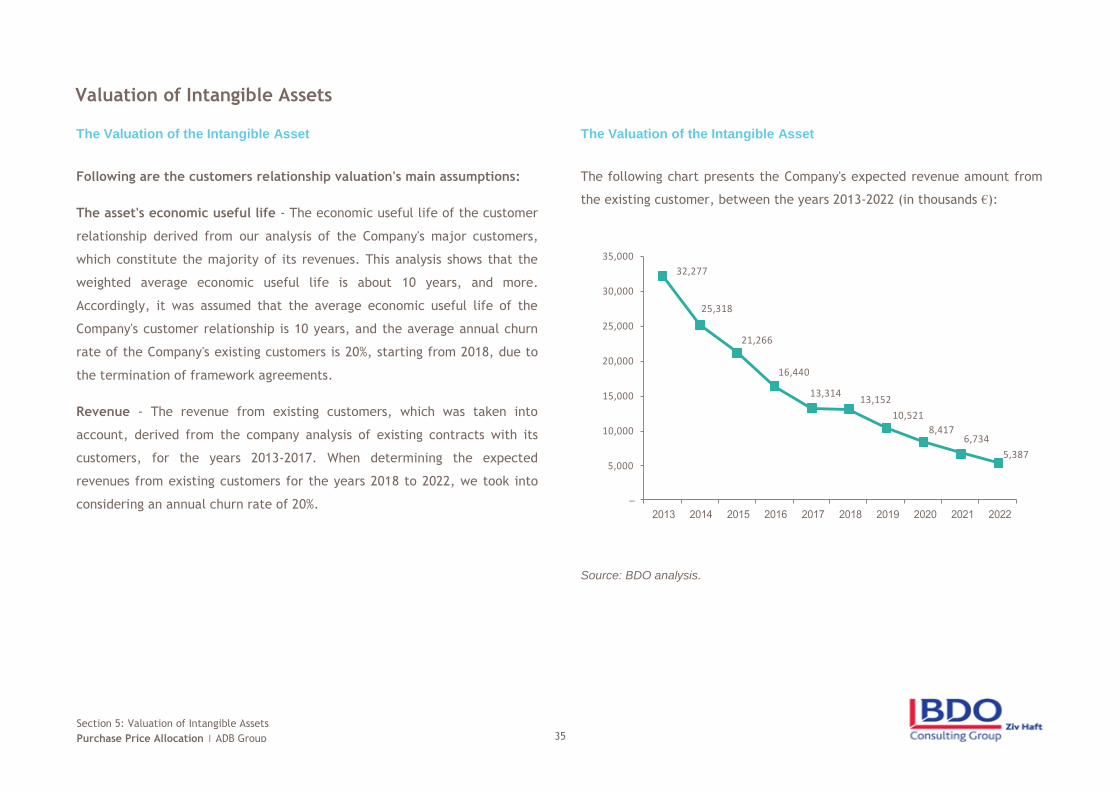
Following are the customers relationship valuation's main assumptions:
The asset's economic useful life - The economic useful life of the customer
relationship derived from our analysis of the Company's major customers,
which constitute the majority of its revenues. This analysis shows that the
weighted average economic useful life is about 10 years, and more.
Accordingly, it was assumed that the average economic useful life of the
Company's customer relationship is 10 years, and the average annual churn
rate of the Company's existing customers is 20%, starting from 2018, due to
the termination of framework agreements.
Revenue - The revenue from existing customers, which was taken into
account, derived from the company analysis of existing contracts with its
customers, for the years 2013-2017. When determining the expected
revenues from existing customers for the years 2018 to 2022, we took into
considering an annual churn rate of 20%.
The following chart presents the Company's expected revenue amount from
the existing customer, between the years 2013-2022 (in thousands €):
Source: BDO analysis.
32,277
25,318
21,266
16,440
13,314 13,152
10,521
8,417 6,734
5,387
–
5,000
10,000
15,000
20,000
25,000
30,000
35,000

Section 5: Valuation of Intangible Assets
Purchase Price Allocation | ADB Group 36
Valuation of Intangible Assets
The Valuation of the Intangible Asset
The Valuation of the Intangible Asset
Gross Profit - the forecasted customer relationships' gross profit is based on
the profitability rates presented in the acquisition model (see Appendix A),
as obtained by Tadir- Gan's management. In addition, the gross profit was
found reasonable in light of Company's outcomes in the years 2011-2012.
Sales and Marketing expenses – It was assumed, that over the entire
forecasted period, the Sales and Marketing expenses ratio from existing
customers, out of the revenue, will be at the corresponding rate in the
acquisition model due to high marketing efforts, attributed to existing
customers, in order to preserve those customers.
General and Administration Expenses – It was assumed, that over the
entire forecasted period, the general and administration expenses ratio from
existing customers, out of the revenue, will be at the corresponding rate in
the acquisition model.
Income Tax – A 31% tax rate was deducted from the forecasted cash flow,
according to the effective applicable to the Company in Germany.
Contributory Charges - Contributory charges were applied to the after-tax
cash flow, to reflect the returns on other assets required to sustain the
customer relationship. These assets included assembled workforce, fixed
assets, and working capital (for details about the contributory charges
calculation see Appendix B).
Tax Benefit - Tax savings due to amortization of the asset were added to
derive the Fair Value of the customer relationship. These tax savings reflect
the future tax benefits associated with amortizing the asset for income tax
purposes. Accordingly, the value of the estimated tax benefit is 21% (see
Appendix C).
Discount Rate - Net cash flows were capitalized at discount rate of 10%
according to the Company's weighted average cost of capital (see section
methodology – WACC calculation).
Asset Valuation - Based upon the above assumptions, the value of the
customer relationship was estimated at a negative value. Therefore, we
assumed that the fair value is equivalent to zero.

Section 5: Valuation of Intangible Assets
Purchase Price Allocation | ADB Group 37
Valuation of Intangible Assets
The Valuation of the Intangible Asset
The following table presents the valuation of the fair value of the customer relationship, for the Closing Date (in thousands €):
Thousands € 2013 2014 2015 2016 2017 2018 2019 2020 2021 2022
Income 32,277 25,318 21,266 16,440 15,977 13,152 10,521 8,417 6,734 5,387
Costs Of Products 28,488 22,289 18,621 14,372 13,954 11,486 9,189 7,351 5,881 4,705
Gross Profit 3,789 3,030 2,646 2,068 2,023 1,665 1,332 1,066 853 682
% of revenue 11.7% 12.0% 12.4% 12.6% 12.7% 12.7% 12.7% 12.7% 12.7% 12.7%
Operating Expenses 2,609 2,025 1,664 1,278 1,237 1,018 815 652 521 417
% of revenue 8.1% 8.0% 7.8% 7.8% 7.7% 7.7% 7.7% 7.7% 7.7% 7.7%
Operating Profit 1,181 1,005 982 790 786 647 518 414 331 265
% of revenue 3.7% 4.0% 4.6% 4.8% 4.9% 4.9% 4.9% 4.9% 4.9% 4.9%
profit before tax 1,181 1,005 982 790 786 647 518 414 331 265
% tax 31% 31% 31% 31% 31% 31% 31% 31% 31% 31%
tax 366 312 305 245 244 201 161 128 103 82
profit (loss) afret tax 815 693 678 545 542 447 357 286 229 183
% profit (loss) afret tax 2.5% 2.7% 3.2% 3.3% 3.4% 3.4% 3.4% 3.4% 3.4% 3.4%
contributory charges
Fixed Assets 723 567 477 368 358 295 236 189 151 121
Working capital 55 43 36 28 27 22 18 14 12 9
Workforce 214 168 141 109 106 87 70 56 45 36
net cash flow- after tax (178) (85) 24 40 51 42 34 27 22 17
period for discount 0.5 1.5 2.5 3.5 4.5 5.5 6.5 7.5 8.5 9.5
DCF (169) (74) 19 28 33 25 18 13 10 7
Total DCF (89)
Tax Benefit Factor 20%
Tax Benefit (22)
Fair value (112)

Section 5: Valuation of Intangible Assets
Purchase Price Allocation | ADB Group 38
Valuation of Intangible Assets
Assembled Workforce Assembled Workforce The assembled workforce was valued for the purpose of calculating the
appropriate contributory charge to be deducted from each of the intangible
assets cash flows. We used the Cost Approach to value the trained workforce
of the Company as of the Valuation Date. The Company has realized savings
from obtaining a fully efficient, pre-existing, trained workforce totalling 354
employees, rather than incurring the costs to assemble such a workforce.
These savings have been achieved by employing the following methods:
Recruiting and screening expenses - Recruiting fees include recruiting
costs and placement fees (executive search firms) typically incurred to
hire new employees. Screening potential employees includes reviewing
resumes, interviewing and performing reference checks on the
candidates.
Training and orientation expenses - Training and orientation expenses
were calculated by multiplying the average time required to train a new
employee by the compensation rate, including benefits of the trained
employee. Training costs include the start-up time for the trainee to
become oriented with the organization and reasonably proficient at his
or her task. Orientation costs were calculated by multiplying the
average time needed by a new employee to attain a full level of
productivity (the start up time) by the compensation, including the
benefits, of the new employee.
Based on this analysis, the Fair Value of the assembled workforce of the
Company was estimated at € 2.3 million (see Appendix B).

Section 6: Results
Purchase Price Allocation | ADB Group 39
Section 6
Results

Section 6: Results
Purchase Price Allocation | ADB Group 40
Results
Results Results
The balance sheets data as of the Valuation Date is based on the Company's
financial data as of December 31, 2012.
According to the assumptions detailed in this report, we have arrived to the
conclusion that some of the acquired intangible assets were needed to
revaluate to reflect market value. The following table provides details
regarding the Company's assets and liabilities (in thousands €):
Source: Company's financial reports and BDO analysis.
Source: company's financial reports and BDO analysis.
Thousands € Note Book Value Fair value Difference% of
Purchase Price
Assets
Current Assets
Cash and Cash Equivalents 2,029 2,029 – 26.7%
Account Receivable 1,805 1,805 – 23.7%
Other Receivable 1 954 954 – 12.6%
Inventories 2 2,377 2,377 – 31.3%
Fixed assets 3 12,549 14,076 1,526 185.2%
Deferred tax 4 – (473) (473) -6.2%
Intangible assets 34 34 – 0.4%
Total Current Assets 19,748 20,801 1,053 273.7%
Non Current Assets
Long Term Investments 8 8 – 0.1%
Total Non Current Assets 8 8 – 0.1%
Total assets 19,756 20,809 1,053 273.8%
Thousands € Note Book Value Fair value Difference% of
Purchase Price
Liabilities
Current Liabilities
Short term Liabilities 5 399 399 – 5.3%
Account Payable 6 1,602 1,602 – 21.1%
Other Payable 1,817 1,817 – 23.9%
Employee provision 7 – 198 198 2.6%
Deferred tax 4 – (61) (61) 0.0%
Total Non Current Liabilities 3,819 3,956 137 52.1%
Non Current Liabilities
Long term Liabilities 8 5,781 5,781 – 76.1%
Employee provision 9 – 247 247 3.2%
Deferred tax 4 – (76) (76) 0.0%
Total Current Liabilities 5,781 5,951 170 78.3%
Total Liabilities 9,600 9,907 307 130.4%
Total net assets 10,155 10,902 746 143.4%
Intangible Assets
Customers Relationships 10 – – 0.0%
Total Intangible Assets – – 0%
Gain from bargain purchase 11 (3,302) (43%)
Purchase Price 12 7,600

Section 6: Results
Purchase Price Allocation | ADB Group 41
Results
Notes Notes
1. Other Receivable- According to the Company, the receivable, as of the
Valuation Date, is attributed to short-term operating amounts, which
received by the customers during the last business year and expected to
be charged during the current year. Therefore, there is no difference
between the book value and the fair value of the Trade and Other
Receivable balance and no adjustments have been made.
2. Inventory- The book value of the Company's inventory is €2,377
thousand and consists of raw materials and other (22%), finished goods
(1%) and work in process (77%). According to Company's management
and our analysis there is no difference between the book value and the
fair value of the Inventory balance and no adjustments have been made.
3. Fixed Assets- The Company's fixed assets, as presented in its financial
report, consist mostly of buildings improvements, Moulds and machinery,
office furniture and prepayments and construction in progress. The fixed
assets are located at the Company's facilities in Germany and Poland and
serve the Company's operating activity.
According to Company's management, the book value of the buildings
improvements, office furniture and prepayments and construction in
progress, represents their fair value. However, the book value of the
machinery does not reflect their fair value.
Therefore, we based the machinery value on an assessor valuation, as of
December 31, 2012, which was received by Tadir-Gan Europe. This
valuation was made by an expert, on behalf of the Company, and was not
examined by us. According to the expert valuation, there is a difference
between the book value and the fair value of the machinery assets of
€1,526 thousand. In addition, the weighted average economic useful life
of the machinery, according to the assessor valuation, is about 18 years.
4. Deferred Tax – received by Company's management.
5. Short term Liabilities- According to the Company, the Company's short
term financial liabilities consists of liabilities to banks. Since this
liability is expected to be paid in the coming year, no adjustments have
been made.
6. Account Payable- According to the Company, the Account Payable, as of
the Valuation Date, is attributed to short-term operating amounts,
which are received by the suppliers during the last business year and
expected to be charged during the current year. Therefore, there is no
difference between the book value and the fair value of this balance and
no adjustments have been made.
7. Current Employee Provision- According to Tadir-Gan Europe's
management, as part of the reorganization attributed to the business
combination, Mr. Jochen Krüger (former owner), which was also one of
the Company's two CEO's, has finished his role in ADB as of April 1st,
2013.

Section 6: Results
Purchase Price Allocation | ADB Group 42
Results
Notes Notes
According to his constrain agreement; the Company will continue to pay
salary to Mr. Krüger until the restrictive employment agreement will
terminate, at the end of 2014. We evaluated the fair value of the
liability to pay Mr. Krüger's salary in an amount of €445 thousand, while
the Current Liability was set on €198 thousand. For more information
see appendix D.
8. Long term Liabilities- According to the Company, the Company's long
term financial liabilities are liabilities to banks, which are presented in
its fair value, since the interest on these liabilities is fixed and
represents the market interest for company in ADB risk level. Therefore,
no adjustments have been made.
9. Non Current Employee Provision- As mentioned in note 5, we evaluated
the fair value of the liability to pay Mr. Krüger's salary in an amount of
€445 thousand, while the Non Current Liability was set on €247
thousand. For more information see appendix D.
10. Customers Relationships- As part of the business combination, we
evaluated the fair value of the Company's Customers Relationships, as an
intangible asset, using the Income Approach. According to the valuation
the fair value of the intangible asset was set to zero. For more details
see Chapter 7- Valuation of Intangible Assets.
11. Gain from bargain purchase- The difference between the purchase
price and the fair value of the Company's net assets and intangible
assets, represents the gain from bargain purchase. The gain from
bargain purchase is attributed to the seller's pressure to sell their
holdings in the Company. In 2007, IKB Equity Capital Fund bought 49% of
the Company. During the global economic crisis, in 2009, the Company's
activities declined and the Company entered into the process of self
insolvency by the end of 2010. IKB fund decided to close their business
in the automotive area as of few investments that fail to achieve yield
along with few years of constrains in the industry in Europe, there for
they made a decision to sale the Company as soon as possible. 51% of
the Company's shares were held by private shareholders, which were
required by contract, to sell their holdings whether IKB Fund decides to
(Bring Along). In this transaction, Tadir-Gan Europe seized the
opportunity, and acquired 100% of the Company's shares, at a bargain
price. The Purchase Price is allocated to the tangible, with any
remainder allocated to gain from bargain purchase. Accordingly, the fair
value of the gain from bargain purchase totalled to approximately
€3,637 thousand.
12. The purchase price- According to the transaction agreement the
purchase price of the Company was €7,600 thousands. For more
information see Section 1- The Acquisition.

Section 7: Appendix
Purchase Price Allocation | ADB Group 43
Section 7
Appendix

Section 7: Appendix
Purchase Price Allocation | ADB Group 44
Appendix A
The Acquisition Model
The following table shows the acquisition model- Base Case Scenario (in thousands €):
Source: Company Management.
Thousands € 2011 2012 2013 2014 2015 2016 2017 Terminal year
Net Revenue 39,658 34,665 34,537 36,413 40,810 42,120 42,962 43,821
% growth (13%) (0%) 5% 12% 3% 2% 2%
Costs Of Products 34,650 30,903 30,482 32,055 35,733 36,822 37,522 38,272
% of revenue 87% 89% 88% 88% 88% 87% 87% 87%
Gross Profit 5,008 3,762 4,055 4,358 5,077 5,298 5,440 5,549
% Gross profit 13% 11% 12% 12% 12% 13% 13% 13%
Total Operating Expences 2,469 2,758 2,791 2,912 3,192 3,274 3,326 3,393
% of revenue 6% 8% 8% 8% 8% 8% 8% 8%
Operating Profit 2,539 1,003 1,263 1,445 1,885 2,024 2,114 2,156
% Operating Profit 6% 3% 4% 4% 5% 5% 5% 5%
Tax (392) (448) (584) (627) (655) (668)
Tax Rate 31% 31% 31% 31% 31% 31%
Net Profit After Tax 872 997 1,301 1,396 1,459 1,488
Change in Working Capital 17 97 228 68 44 43
Investment In Fixed Assets – (3,821) (3,664) (3,798) (3,780) (3,856) (3,933)
Depreciation – – 3,605 3,664 3,798 3,780 3,856 3,933
Annual Cash Flow 638 900 1,073 1,328 1,415 1,445
Time 0.50 1.50 2.50 3.50 4.50 4.50
Residual Value 18,057
DCF 608 780 846 952 921 11,759
WACC 10%
Total DCF 15,866
None Operatinal Assets 2,029
Less Financial Liabilities 6,181
Equity Value 11,715

Section 7: Appendix
Purchase Price Allocation | ADB Group 45
Appendix B
Workforce and Contributory Charges Contributory Charges
Workforce
The following table presents the workforce fair value calculation as for the
Valuation Date (in thousands €):
Source: BDO analysis.
Contributory Charges
The following table presents the contributory charges calculation:
Source: BDO analysis.
Fixed Assets – The fixed assets' Fair Value is based on an external expert
valuation which was received by the Company management and was not
tested or examined by us. The difference between the book value and the
fair value is attributed to the machinery expert's valuation, of the Company's
plants and machinery. The fixed assets contributory charge was calculated
as 2.2% of the revenues for any given period.
Working capital – Based on the working capital's fair value, which is similar
to the book value, except the inventory balance fair value (see appendix D).
The working capital contributory charge was calculated as 0.2% of the
revenues for any given period.
Workforce – the value of the workforce asset was estimated according to
the Cost Approach and calculated as the cost of recruiting and training
personnel. According to management opinion, the cost of recruiting
activities is equal to one working month salary per employee. The duration
of training and recruiting activities is four to six working months per
employee.
Representative Income – the revenue of 2012 was taken as a representative
income for the Company's activity.
Thousands €
Department
Production 318 2.0 4
Marketing 5 3.2 4
Administration 31 3.5 6
Total employees 354
Total asset value 3,326
Corporate tax 31%
Asset value, net 2,295
Average Training &
Recruiting period
Average monthly
wage (gross)
Number of
employees
fair
value
rate of return
(before tax)
rate of return
(after tax)
annual
charge
representing
income
percentage of
total revenues
Fixed Assets 14,076 8% 5.5% 777 34,665 2.2%
Working Capital 1,716 5% 3.5% 59 34,665 0.2%
Workforce 2,295 10.0% 229 34,665 0.7%

Section 7: Appendix
Purchase Price Allocation | ADB Group 46
Appendix C Appendix D
Tax Benefit Employee Provision
The following table presents the Tax Benefit factor of the Company's
Customer Relationship Asset;
Source: BDO analysis.
The payroll payments of Mr Krüger, for the years 2013 and 2014, were set at
€445 thousand.
When calculating the Company's liability to Mr. Krüger, we addressed these
expenses as a loan which was taken from Mr. Krüger, by the Company.
Hence, we have capitalized the amounts, paid each month, by the
Company's cost of debt, as of December 31, 2012 for a period of 2 years.
Therefore, we have recognized a Non Current Liability in an amount of €247
thousand, and a Current Liability in an amount of €198 thousand, which
represents the liability's fair value.
The following table is the Company's specified salary payments, for Mr.
Jochen Krüger, for the years 2013-2014:
Source: BDO analysis.
NO Capitalization Period % Yearly Amortization % Tax C * D PV(E) @10%
1 0.50 10% 31% 3% 3.0%
2 1.50 10% 31% 3% 2.7%
3 2.50 10% 31% 3% 2.4%
4 3.50 10% 31% 3% 2.2%
5 4.50 10% 31% 3% 2.0%
6 5.50 10% 31% 3% 1.8%
7 6.50 10% 31% 3% 1.7%
8 7.50 10% 31% 3% 1.5%
9 8.50 10% 31% 3% 1.4%
10 9.50 10% 31% 3% 1.3%
20.0%Tax Benefit Factor
Tax Benefit Calculation
Thousands € Base Social Car
Total per
month
Total per
year
Discounted
salary per year
2013 15 1 1 17 201 198
2014 20 1 1 21 256 247
457 445 Total amount