ALTERNATIVE STORMWATER SORPTION MEDIA and Gold Sorption Media.pdf · This disorder is also known as...
52
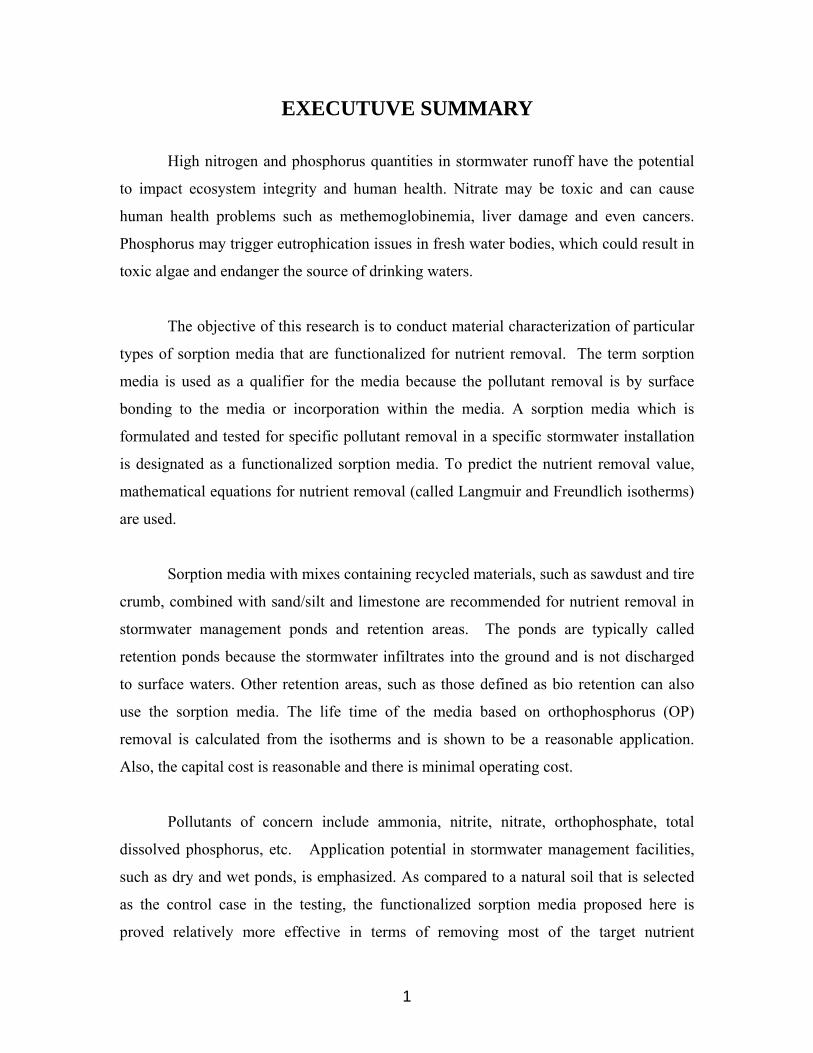
Final Report: Project #B236 Alternative Stormwater Sorption Media for the Control of Nutrients Submitted by Marty Wanielista Ni-Bin Chang Stormwater Management Academy University of Central Florida Orlando, FL 32816 September 2008
Transcript of ALTERNATIVE STORMWATER SORPTION MEDIA and Gold Sorption Media.pdf · This disorder is also known as...
Final Report: Project #B236
Alternative Stormwater Sorption Media for the Control of Nutrients
Submitted by
Marty Wanielista Ni-Bin Chang
Stormwater Management Academy
University of Central Florida Orlando, FL 32816
September 2008
EXECUTUVE SUMMARY
High nitrogen and phosphorus quantities in stormwater runoff have the potential
to impact ecosystem integrity and human health. Nitrate may be toxic and can cause
human health problems such as methemoglobinemia, liver damage and even cancers.
Phosphorus may trigger eutrophication issues in fresh water bodies, which could result in
toxic algae and endanger the source of drinking waters.
The objective of this research is to conduct material characterization of particular
types of sorption media that are functionalized for nutrient removal. The term sorption
media is used as a qualifier for the media because the pollutant removal is by surface
bonding to the media or incorporation within the media. A sorption media which is
formulated and tested for specific pollutant removal in a specific stormwater installation
is designated as a functionalized sorption media. To predict the nutrient removal value,
mathematical equations for nutrient removal (called Langmuir and Freundlich isotherms)
are used.
Sorption media with mixes containing recycled materials, such as sawdust and tire
crumb, combined with sand/silt and limestone are recommended for nutrient removal in
stormwater management ponds and retention areas. The ponds are typically called
retention ponds because the stormwater infiltrates into the ground and is not discharged
to surface waters. Other retention areas, such as those defined as bio retention can also
use the sorption media. The life time of the media based on orthophosphorus (OP)
removal is calculated from the isotherms and is shown to be a reasonable application.
Also, the capital cost is reasonable and there is minimal operating cost.
Pollutants of concern include ammonia, nitrite, nitrate, orthophosphate, total
dissolved phosphorus, etc. Application potential in stormwater management facilities,
such as dry and wet ponds, is emphasized. As compared to a natural soil that is selected
as the control case in the testing, the functionalized sorption media proposed here is
proved relatively more effective in terms of removing most of the target nutrient
1

pollutants under various conditions of influent waste loads. Colum tests with unsaturated
followed by saturated conditions indicate removal of nitrate. These tests were conducted
under natural conditions and then under non biological conditions (abiotic). Comparing
the natural to the non biological testing showed that the reactions in a short period of time
are due to sorption and other physiochemical means and not to biological. It is
understood however that biological removal would take place in a longer time period. A
second order reaction kinetic appears to more closely represent the removals of most
nutrient species. The determination of the reaction order is important to obtain the best
predictive mathematical relationship for nutrient removal.
Future research should be encouraged to mix the selected media with other
sorption media for both stormwater and wastewater treatment. It may also focus on the
detection of microbiological activities, such as ammonia oxidizing bacteria (AOB),
nitrogen oxidizing bacteria (NOB) and denitrifiers, to ensure the denitrification process is
prevalent.
2
ACKNOWLEDGMENTS The research team deeply appreciates and acknowledges the support of the Southwest
Florida Water Management District and the professional advice and guidance of Chris
Zajac from the District.
3

TABLE of CONTENTS
EXECUTUVE SUMMARY ............................................................................................... 1
ACKNOWLEDGMENTS .................................................................................................. 3
LIST OF TABLES .............................................................................................................. 5
LIST OF FIGURES ............................................................................................................ 6
INTRODUCTION .............................................................................................................. 7
LITERATURE REVIEW ................................................................................................... 9
Nutrient Concentrations in Groundwater Systems in Florida ......................................... 9
Stormwater Best Management Practices ...................................................................... 10
Sorption Media Used for Nitrogen Species Removal ................................................... 10
Sorption Media Used for Phosphorus Species Removal .............................................. 12
APPROACH ..................................................................................................................... 18
Material Preparation and Characterization ................................................................... 18
Isotherm Study for the Sorption Media Mixture .......................................................... 20
Life Expectancy of the Sorption Media (when it no longer removes pollution) .......... 22
Removal Efficiency, Kinetics, and Head Loss ............................................................. 22
Abiotic Test ................................................................................................................... 26
RESULTS AND DISCUSSION ....................................................................................... 27
Material Characterization .............................................................................................. 27
Isotherm Study for the Sorption Media Mixture .......................................................... 28
Life Expectancy of the Media (does not include biological uptake) ............................ 31
Removal Efficiency ...................................................................................................... 32
Kinetic Reactions .......................................................................................................... 34
APPLICATION POTENTIAL ......................................................................................... 37
Head Loss...................................................................................................................... 37
Engineering Feasibility Study ....................................................................................... 37
Cost and Benefit ............................................................................................................ 40
CONCLUSIONS............................................................................................................... 43
LIST OF REFERENCES .................................................................................................. 45
4

LIST OF TABLES Table 1 Sorption media used to remove nitrogen and phosphorus from stormwater or
wastewater ................................................................................................. 13
Table 2 Multi-decision Criteria Matrix Example ....................................................... 19
Table 3 Method used to determine effluent concentration for each chemical species ..... 25
Table 4 Data showing the physical properties of natural sand and sorption media. ........ 27
Table 5 Data showing the properties of Langmuir isotherm for different species. ......... 29
Table 6 Data showing the properties of Freundlich isotherm for different species. ........ 29
Table 7 Life expectancy of sorption media mixture for different nutrient ..................... 32
Table 8 Summary of removal efficiency in column test ............................................ 34
Table 9(a) Summary table of kinetics for the sorption media mixture .......................... 36
Table 9(b) Summary table of kinetics for the natural soil (Hunter’s Trace soil) ............ 36
Table 10 Pond Cost Comparisons ……………………………...………….………...…..41
5

LIST OF FIGURES Figure 1 Schematic diagram of the column setup and whole system ............................ 24
Figure 2 Particle size distribution of natural soil (a) collected from Hunter’s Trace pond
and sorption media mixture (b) ..................................................................... 28
Figure 3 Figure showing the isotherm study for ammonia. (a) is Langmuir isotherm plot
and (b) is Freundlich isotherm plot ............................................................... 29
Figure 4 Figure showing the isotherm study for orthophosphate. (a) is Langmuir isotherm
plot and (b) is Freundlich isotherm plot ......................................................... 30
Figure 5 Figure showing the isotherm study for nitrate. (a) is Langmuir isotherm plot and
(b) is Freundlich isotherm plot ..................................................................... 30
Figure 6 Figure showing the isotherm study for nitrite. (a) is Langmuir isotherm plot and
(b) is Freundlich isotherm plot ..................................................................... 30
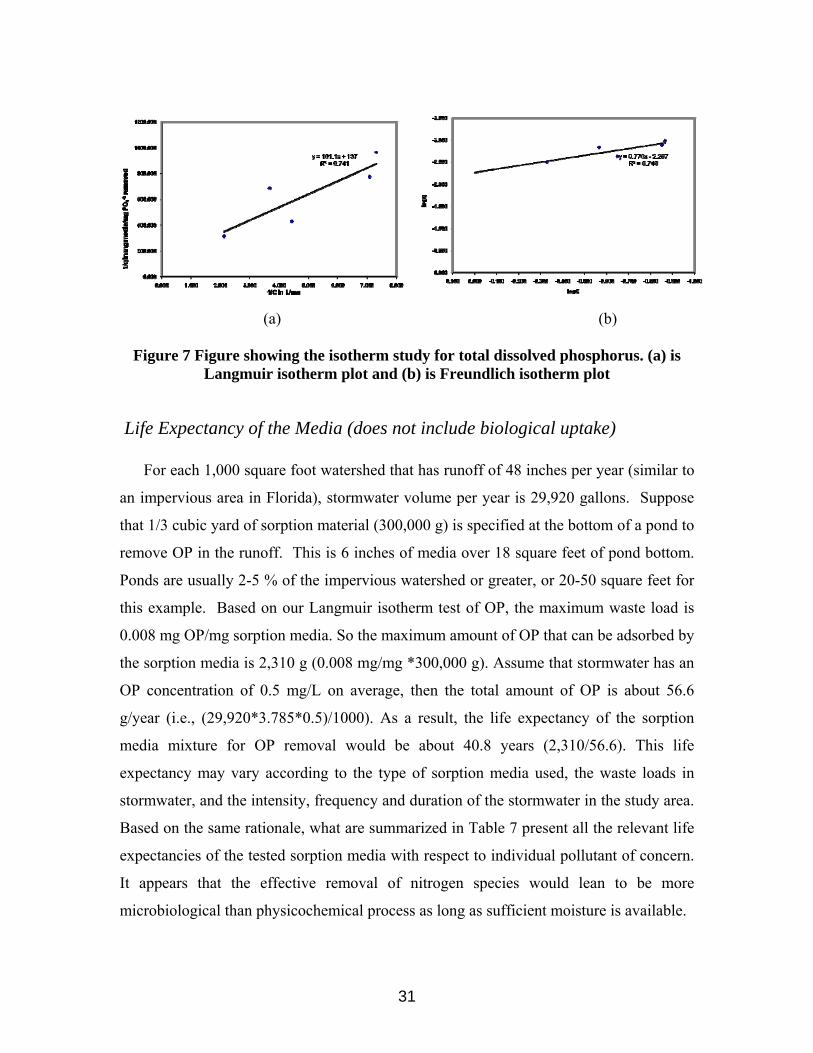
Figure 7 Figure showing the isotherm study for total dissolved phosphorus. (a) is
Langmuir isotherm plot and (b) is Freundlich isotherm plot ............................ 31
Figure 8 Wet pond with in-situ treatment units and low infiltration ............................. 39
Figure 9 Retention pond with in-situ treatment ......................................................... 40
6

INTRODUCTION
Nutrients such as ammonia, nitrate, nitrite orthophosphate and dissolved phosphorus
are common contaminants in water bodies all over the world. Nutrient levels are an
important consideration within the State of Florida and unquestionably within the
Southwest Florida Water Management District. Nutrient removal is very important for
the sustainability of the aquatic ecosystem and environment. All these nutrients have
acute and chronic harmful outcomes for human beings and ecosystems directly or
indirectly. According to USEPA, unionized ammonia is very toxic for many fish species
(USEPA, 1993). Fish mortality, health and reproduction can be hampered by the presence
of 0.100 mg/L to 10.000 mg/L of ammonia (USEPA, 1993). Nitrate is more toxic than
nitrite and can cause human health problems such as liver damage and even cancers
(Gabel et al., 1982; Huang et al., 1998). Nitrate can also bind with hemoglobin and create
a situation of oxygen deficiency in infant’s body called methemoglobinemia (i.e., a blood
disorder of infants) (WEF, 2005). This disorder is also known as “blue baby” syndrome.
Nitrite, however, can react with amines chemically or enzymatically to form nitrosamines
that are very strong carcinogens (Sawyer et al., 2003).
Nitrogen and phosphorus compounds are the most frequent measurements to indicate
nutrient loadings. Nitrogen and phosphorous-containing compounds are found in urban
stormwater runoff primarily from highways (USEPA, 1999). Nitrates normally result
from vehicular exhaust on the road itself and adjacent soils from fertilization of
landscaped areas beside the roads and the neighboring residential areas (German, 1989;
Vitousek et al., 1997). On the other hand, when urban regions gradually expand due to
regional development, centralized sewage collection, treatment, and disposal is often
unavailable for both geographic and economic reasons. Thus, decentralized or on-site
wastewater treatment systems (OWTS) may be necessary to protect public health.
7

Nationwide, wastewater effluent from OWTS can represent a large fraction of nutrient
loads to groundwater aquifers.
Nitrogen, particularly nitrate-N, easily moves from terrestrial ecosystems into
surface and ground waters, including lakes, streams, rivers, and estuaries (Baker, 1992;
Kahl et al., 1993; Peterjohn et al., 1996). According to USEPA, nitrate and nitrite levels
in the water bodies should not be above 10.000 mg/L N03--N and 1.000 mg/L NO2-N,
respectively (USEPA, 1988). These are drinking water standards and not related to the
ecology of surface waters. For effective stormwater management, bioretention or
biofiltration ponds are a relatively new urban stormwater best management practice
(BMP) (Hsieh and Davis, 2005). Yet the use of differing sorption media in wet and dry
bioretention ponds turns out to be an appealing engineering approach in dealing with the
increasing trend of higher nutrient concentrations that is expected to continue in the
surface and groundwater systems. Large-scale implementation with different sorption
media to remove nutrients will be popular in the future (Mothersill et al., 2000; Birch et
al., 2005).
The main purpose of this research is to examine the material property, sorption
capacity and reaction kinetics of selected mixes of sorption media for nutrient
removal using batch and column tests. Pollutants of concern mainly include ammonia,
nitrate, nitrite, and orthophosphate. Sorption media of interest include but are not limited
to tire crumb, sawdust, activated carbon, iron amended resins, orange peel, peat, leaf
compost, naturally occurring sands, zeolites, coconut husks, polymers, soy bean hulls,
etc. The expected findings in this study are to: 1) determine the sorption isotherm for
different nitrogen and phosphorus species, 2) determine the life expectancy of sorption
media to be used in field, 3) estimate the removal efficiency of nutrients from
stormwater, 4) understand the kinetics of sorption media mixture, and 5) decide the fate
and transport of nutrient in stormwater and describe the field implementation potential.
8
LITERATURE REVIEW
Nutrient Concentrations in Groundwater Systems in Florida
The Upper Floridan aquifer is particularly vulnerable to impacts from land-use
activities in karst/high recharge areas, where the aquifer is not confined or only thinly
confined. Nitrate concentrations have increased in many Upper Floridan aquifer springs
since the 1950s. Phelps (2004) reported that nitrate concentrations ranged from less than
0.020 to 12.000 mg/L, with a median of 1.200 mg/L, for 56 Upper Floridan aquifer wells
sampled in Marion County during 2000-2001. It is known that nitrate concentrations have
exceeded 1.000 mg/L in recent years at some springs in Lake, Marion, Orange, Seminole,
and Volusia Counties according to Phelps et al. (2006) and the St. Johns River Water
Management District (2008). Increasing trends in nitrate concentration have been
documented in Volusia County springs, such as DeLeon and Gemini Springs (Phelps et
al, 2006) and Blue Spring (SJRWMD, 2008).
Stormwater runoff is one possible source of nitrogen, among others such as septic
tanks and land-based application of reclaimed wastewater or fertilizer, which can
contribute to elevated nitrate and nitrite concentrations in the Upper Floridan aquifer. The
Florida Department of Environmental Protection (FDEP) and St. Johns River Water
Management District (SJRWMD) also did research in 1998 to determine the nutrient
concentration in stormwater (Graves et al., 1998). They reported maximum total
phosphorus was 0.329 mg/L, orthophosphate was 0.265 mg/L, total nitrogen was 1.300
mg/L, ammonia-nitrogen (NH3-N) was 0.046 mg/L, and the combined nitrate-nitrogen
(NO3-N) and nitrite-nitrogen (NO2-N) was 0.048 mg/L (Graves et al., 1998).
9

Stormwater Best Management Practices
A number of devices, collectively known as structural Best Management Practices
(BMPs), were employed to treat contaminated stormwater with respect to either
physicochemical or microbiological principles (Ray et al., 2006). Nutrient in stormwater
and groundwater can be removed by using physicochemical processes, such as activated
carbon adsorption, ion exchange with synthetic resins, reverse osmosis, and
electrodialysis. Biofiltration processes with differing sorption media have been gaining
popularity over the other physicochemical processes due to their cost-effectiveness.
Within the context of biofiltration or biological plus filtration removal, two important
processes that result in the transformation of nitrate are nitrification and denitrification.
Nitrification is a process in which ammonium is oxidized and denitrification is a process
in which nitrate is reduced back to nitrogen gas before escaping into the air. However,
only denitrification as a microbiologically mediated process occurring under anaerobic
(oxygen depleted) conditions can result in the permanent removal of nitrate. This deeply
affects the design philosophy of stormwater biofiltration ponds. Also, sorption media
may improve solid-liquid contact and prevent channeling via physicochemical processes,
such as adsorption, absorption, and ion exchange. In general, higher surface area of clay
in natural soil might be able to provide more contact area for the solid to adsorb and more
space for bacteria to develop the colony. A sorption media which is formulated and tested
for specific pollutant removal in a specific stormwater installation is called a
functionalized sorption media. It might have a better ion exchange capacity to support
adsorption/desorption capacity. Consequently, a comparative study for a quantitative
process-based understanding of the kinetics due to stormwater impact would gain a
renewed interest for promoting the biofiltration process in BMPs.
Sorption Media Used for Nitrogen Species Removal
Many researchers have tried to remove nitrogen species from stormwater runoff by
using sorption media. Kim et al., (2000) used different kinds of sorption media, such as
alfalfa, mulch compost, newspaper, sawdust, wheat straw, and wood chips. They found
that alfalfa and newspaper had 100% nitrate removal efficiency while mulch compost had
10
60% nitrate removal efficiency. They also found that sawdust, wheat straw and wood
chips had good removal efficiency (>95%), but wood chips showed consistently better
performance in nitrate removal over sawdust. From their experiment, it could be
concluded that all of these were electron donors and good carbon sources for promoting
denitrification. They suggested that increasing the retention time may gain better removal
efficiency. Kim et al. (2000) also found that soil could only remove 7% to 10% of nitrate
due to its anionic form.
Güngör and Ünlü (2005) conducted nitrate and nitrite removal experiments by using
only three types of soils, including sandy clay loam (SCL), loamy sand (LS) and sandy
loam (SM). They found a high nitrate removal using all three soils (i.e., over 90%). Hsieh
and Davis (2005) found that mulch was very effective in removing nitrate, unlike sand.
But they had not gained good ammonia removal efficiency by using mulch. They
concluded that soil with higher silt/clay and cation (Mg/Ca/K) contents might be very
effective in nutrient removal. They concluded that course media might not be able to
retain the nutrient in repetitive loading due to small surface area so that sand should not
be used.
Darbi et al., (2002) used sulfur and limestone for nitrate removal from potable water.
In their experiment, sulfur was used as an electron donor and limestone was used to
maintain the pH. They found that the optimum mixing ratio of sulfur and limestone is 1:1
for nitrate removal (i.e., about 98% nitrate removal was observed). They also suggested
that increasing the retention time may obtain higher nitrate removal efficiency. Lisi et al.
(2004) tried to use granulated tire for the removal of nitrate. They found 48 g of tire
crumb can remove 16.2 g of NO3--N. Sengupta and Ergas (2006) did an experiment to
remove nitrate from wastewater by using marble chips, limestone and oyster shell. Their
experiment gave some significant outcomes when using those solids as sorption media.
They found that oyster shell (almost 98% CaCO3) and limestone could remove 80% and
56% of nitrate, respectively. The pH and alkalinity were higher in testing using oyster
shell rather than limestone and marble chips. Oyster shell was very efficient to reduce
nitrite accumulation and dissolved oxygen (DO) did not work as a denitrification
inhibitor when oyster shell was used as a sorption media. From these findings, it can be
concluded that oyster shell is much more effective than limestone or marble chips for
11
removing nitrate. Oyster shell can also be a good candidate for controlling the pH that is
sensitive for denitrification.
Savage and Tyrrel (2005) used a mix of wood mulch, compost, soil, broken brick and
polystyrene packaging for removal of NH3-N from compost leachate. They reached a
conclusion that a blend of wood mulch and compost had better removal efficiency for
NH3-N than other media and polystyrene was the least capable in removing NH3-N. Soil
and broken brick could remove 38% and 35% of NH3-N, respectively. All these media
had the same capability to remove BOD5 by microbial oxidation process. The research
group found that compost and wood mulch had a tendency to increase the pH. They
concluded that specific surface area, void space, permeability, and adsorption capacity
might influence the removal efficiency.
Sorption Media Used for Phosphorus Species Removal
Phosphorus removal from stormwater involves both precipitation and adsorption
processes due to chemical reaction. As phosphorus has a significant effect on aquatic
ecosystems, researchers have been trying to discover an economically feasible removal
procedure. Some functionalized sorption media that can be used for phosphorus removal
are sand rich with Fe, Ca or Mg, gravel, limestone, shale, light weight aggregates (LWA),
zeolite (natural mineral or artificially produced alumino silicates), pelleted clay (along or
in combination with soils), opaka (a siliceous sedimentary rock), pumice (natural porous
mineral), wollastonite (a calcium metasilicate), fly ash, blast furnace slag (BFGS – a
porous non-metallic co-product in iron industry), alum, goethite (a hydrous ferric oxide),
hematite (a mineral form of iron(III) oxide), dolomite and calcite (Korkusuz, 2007).
Table 1 summarizes all the sorption media used by different researchers to remove
nutrients (both nitrogen and phosphorus species) from stormwater and wastewater
(Chang et al., 2008).
DeBusk et al. (1997) used sand (with quartz), fresh organic (peat) soil, crushed lime
rock (2.5 cm nominal size) and wollastonite (a mine containing calcium metasilicate plus
ferrous metasilicate) to remove phosphorus (P), nickel (Ni) and cadmium (Cd) from
stormwater. They found that wollastonite had very good removal efficiency for their
targeted contaminants. Wollastonite could remove about 87.8% P, 97.7% Cd and 80.3%
12
Ni. On the other hand, limerock, peat and sand could remove 41.4%, 44%, and 41.4% P
respectively. It can be concluded that wollastonite is very effective in phosphorus
removal because it contains calcium and ferrous ions. Calcium and ferrous ions can
remove phosphorus by precipitation reaction or adsorption.
Hsieh and Davis (2005) found good TP removal (about 41% to 48%) by sand and
concluded that it might happen due to simple adsorption or complex
sorption/precipitation processes. They found that mulch was not a good candidate for
total phosphorus (TP) removal. This research group concluded that TP removal was
highly variable and it might be related to properties of sorption media used and flow
patterns of nutrient laden water through the sorption media. Again, organic matter could
also accelerate TP removal up to 93%.
Richman (1997) found that compost had good removal efficiency for 90% solids,
85% oil and greases and 90% heavy metals. Clark and Pitt (2001) tried to remove
contaminants in aerobic and anaerobic conditions from stormwater runoff by using
activated carbon, peat moss, compost and sand. They found good phosphorus removal
efficiency by all four media in both conditions. They also found no desorption condition
in their system for phosphorus. But they observed that sorption was better and leaching
was lesser in aerobic conditions for compost. Forbes et al. (2005) used lightweight
expanded shale and masonry sand for the removal of phosphorus. They summarized that
sand is a poor candidate for retaining phosphorus and expanded shale has greater removal
efficiency due to its larger surface area.
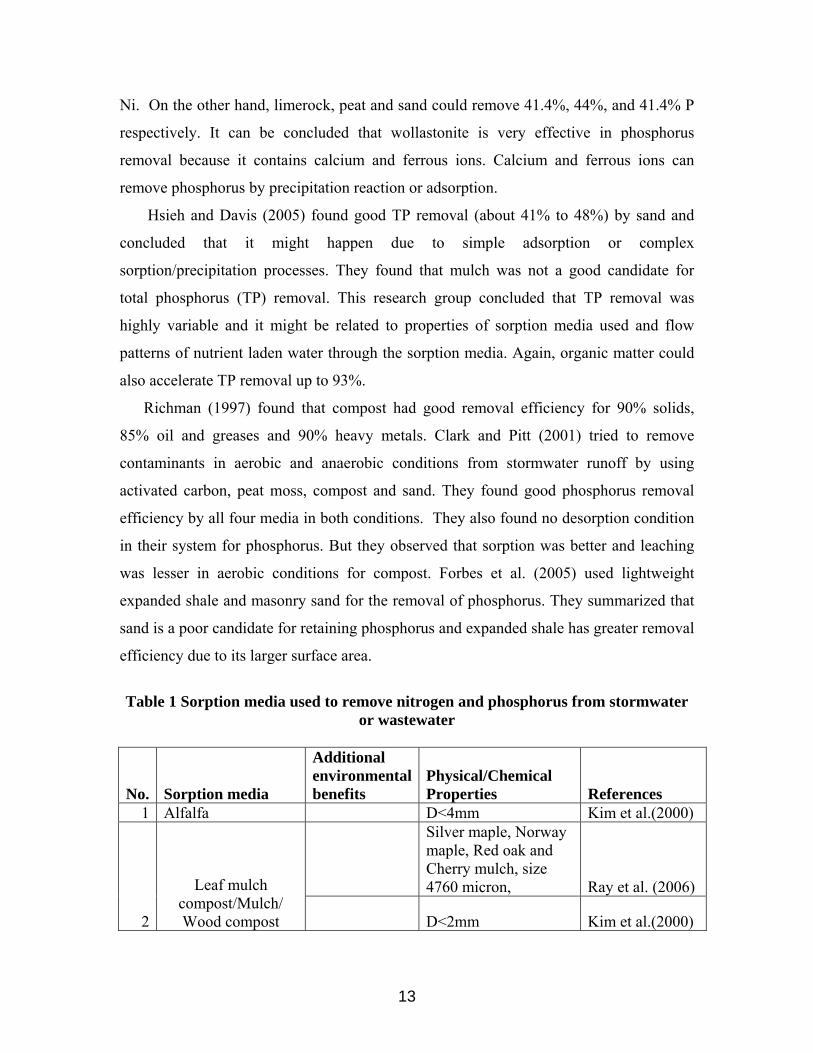
Table 1 Sorption media used to remove nitrogen and phosphorus from stormwater
or wastewater
No. Sorption media
Additional environmental benefits
Physical/Chemical Properties References
1 Alfalfa D<4mm Kim et al.(2000)
2
Leaf mulch compost/Mulch/ Wood compost
Silver maple, Norway maple, Red oak and Cherry mulch, size 4760 micron, Ray et al. (2006)
D<2mm Kim et al.(2000)
13
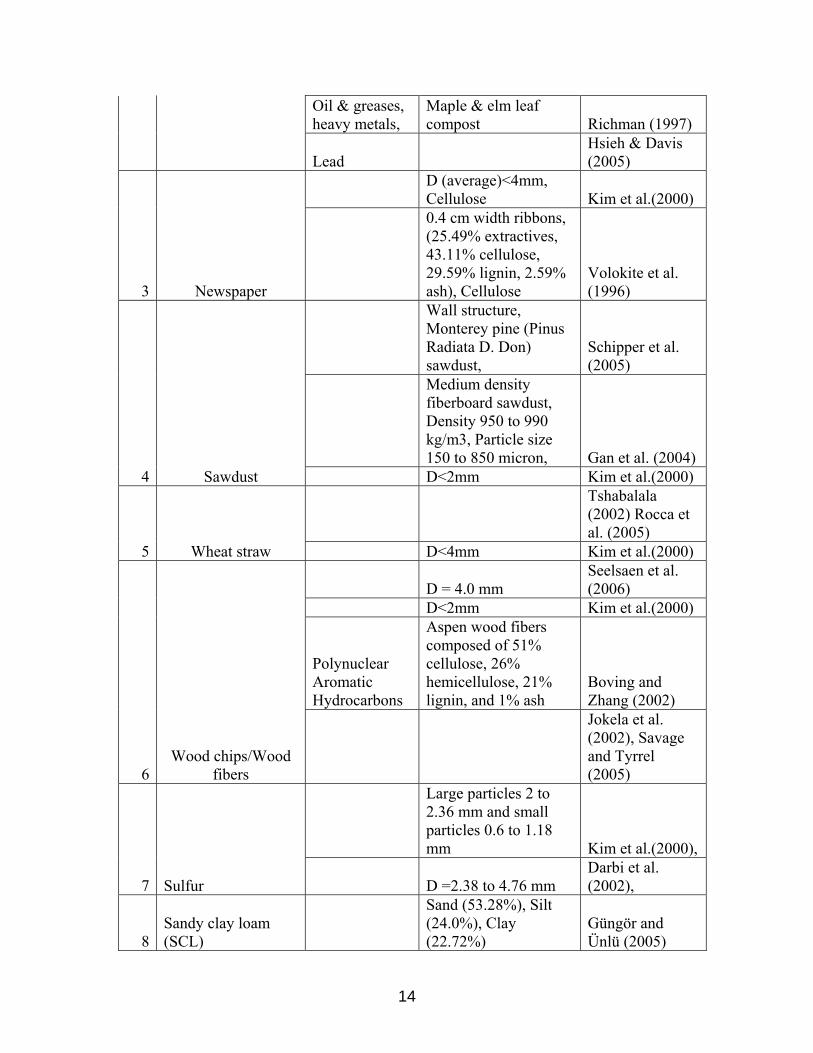
Oil & greases, heavy metals,
Maple & elm leaf compost Richman (1997)
Lead Hsieh & Davis (2005)
3 Newspaper
D (average)<4mm, Cellulose Kim et al.(2000)
0.4 cm width ribbons, (25.49% extractives, 43.11% cellulose, 29.59% lignin, 2.59% ash), Cellulose
Volokite et al. (1996)
4 Sawdust
Wall structure, Monterey pine (Pinus Radiata D. Don) sawdust,
Schipper et al. (2005)
Medium density fiberboard sawdust, Density 950 to 990 kg/m3, Particle size 150 to 850 micron, Gan et al. (2004)
D<2mm Kim et al.(2000)
5 Wheat straw
Tshabalala (2002) Rocca et al. (2005)
D<4mm Kim et al.(2000)
6 Wood chips/Wood
fibers
D = 4.0 mm Seelsaen et al. (2006)
D<2mm Kim et al.(2000)
Polynuclear Aromatic Hydrocarbons
Aspen wood fibers composed of 51% cellulose, 26% hemicellulose, 21% lignin, and 1% ash
Boving and Zhang (2002)
Jokela et al. (2002), Savage and Tyrrel (2005)
7 Sulfur
Large particles 2 to 2.36 mm and small particles 0.6 to 1.18 mm Kim et al.(2000),
D =2.38 to 4.76 mm Darbi et al. (2002),
8 Sandy clay loam (SCL)
Sand (53.28%), Silt (24.0%), Clay (22.72%)
Güngör and Ünlü (2005)
14
9 Loamy sand (LS)
Sand (78.28%), Silt (10.64%), Clay (11.08%)
Güngör and Ünlü (2005)
10 Sandy loam (SL)
Sand (70.28%), Silt (14.64%), Clay (15.08%)
Güngör and Ünlü (2005)
11 Limestone
with sulfur, D= 2.38 to 4.76 mm Zhang (2002)
D =2.38 to 4.76 mm
Darbi et al. (2002), Sengupta and Ergas (2006)
D= 0.6 to 1.18 mm Kim et al. (2000)
12 Oyster shell
Powder form, 28% Calcium, Average particle size 200 micron, Surface area 237 m2/g,
Namasivayam et al. (2005)
Sengupta and Ergas (2006)
13 Marble chips Mg(OH)2 and CaCO3 Sengupta and Ergas (2006)
14 Peat
Cu, Zn, Ni, PAHs (Polyaromatic hydrocarbons)
DeBusk et al. (1997), Clark and Pitt (1999), Clark et al. (2001), Kietlińska and Renman (2005)
15 Activated carbon Cu, Fe, Pb, Zn Clark et al. (2001)
16
Carbon sand, enretech sand or sand
Bell et al. (1995), DeBusk et al. (1997), Clark and Pitt (1999), Clark et al. (2001), Seelsaen et al. (2006)
17 Tire crumb
2,4-dichlorophenol (DCP), 4-chlorophenol (CP) 20 to 40 mm, Shin et al. (1999)Volatile organic carbon Lisi et al. (2004)
15
18
Zeolites
Benzene, Sulfate, Chromate
Clark and Pitt (1999), Li (2003), Seelsaen et al. (2006)
19 Cotton waste Cellulose Rocca et al. (2005),
20 Perlite Redco II (2007)
21 Clay
Thiocyanates, Cadmium, Lead, Nickel
Harris et al. (1996), Gálvez et al. (2003), Lazaridis (2003)
22 Zeolite+ Clay Gisvold et al. (2000)
23 Expanded shale and masonry sand
Expanded shale (SiO2 62.06%, Al2O3 15.86%, Fe2O3 5.80%, CaO 1.44%, MgO 1.68%)
Forbes et al. (2005)
24 Opoka Braun-Howland (2003)
25 Wollastonite
a mine containing calcium metasilicate plus ferrous metasilicate
DeBusk et al. (1997) Hedström (2006)
26 Iron Sulfide
Tesoriero et al. (2000), Baeseman et al. (2006)
27 Limerock 2.5 cm nominal size DeBusk et al. (1997)
28 Polyurethane porous media
Porous structure, Average diameter 3-5 mm, External pore diameter 300 micron. Han et al. (2001)
29 Blast furnace slag
Hedström (2006)
Zn, Ni, Co, Cu, Ba,
SiO2 36.2%, CaO 35%, MgO 13.4%, Al2O3 10.6%,
Kietlińska and Renman (2005)
30 Allophane
Clay-sized mineral containing silica, alumina and water AEC (2007)
16

31 Chitin
A natural polymer, technically known as polyacetylglucosamine AEC (2007)
32 Pumice
A light, porous volcanic rock composed of iron (18.2 %), aluminum (13.7%), calcium (12.7%) and magnesium (7.3%) and other. AEC (2007)
33 Bentonite
Montmorillonite mineral with about 4%-8% calcium carbonate, AEC (2007)
34 Clinoptilolite Hedström (2006)
35 Oversized pulverized brick
Savage and Tyrrel (2005)
36 Polystyrene packing Savage and Tyrrel (2005)
37
Polonite
Zn, Ni, Co, Ti, Cu, Ba,
Manufactured from cretaceous rock Opoka (SiO2 39.4%, CaO 42%, Al2O3 4.3%, Fe2O3 2.0%)
Kietlińska and Renman (2005),
38 Glass D= 4.0 mm Seelsaen et al. (2006)
39 Waste foundry sand
TCE, Zn, Metolachlor, Alachlor, Benson (2001)
40 Lignocelluloses material
Basically pine bark chips,
Tshabalala (2002)
17
APPROACH
Material Preparation and Characterization
Additional laboratory evaluation for nutrient removal is necessary to further
document removal potential and design properties of each media or a mix of media. It is
very important to understand the physical properties (i.e. density, void ratio, porosity,
specific gravity, surface area and conductivity) of the sorption media available for Florida
use and to document in a laboratory these properties. These properties are used to
determine the hydraulic residence time and adsorption area available. These properties
with other criteria are used to screen the possible sorption media before laboratory
studies. The five criteria for screening are: 1) the relevance of nitrification or
denitrification process or both with documented literature effectiveness, 2) the hydraulic
permeability or permeability, 3) the cost, 4) the availability in Florida, and 5) additional
environmental benefits. All of these criteria were equally weighted and a qualitative
assessment of each was made. The qualitative assessment was then converted to a
numerical value. An example of some of the media assessments are shown in Table 2,
and illustrates the procedure, assumptions and depth of review in a multi-decision matrix.
All of the media were assessed in the same manner. The process is subjective in nature,
but is an attempt to quantitatively decide on the media that can be investigated further.
Not all media could be investigated further to document potential nutrient removal
because of budget constraints. Initial thinking was to eliminate all non-Florida available
media. However, it was decided not to limit the selection to Florida based materials
alone because of the potential for eliminating a cost effective solution.
Seven sorption media were selected for final consideration according to a multi-
criteria decision making process. They include peat, sandy loam, sawdust, wood chip, tire
crumb, crushed limestone, and crusted oyster. A mix of these is considered for final
selection and for physical laboratory analyses, kinetic estimates, and isotherm studies.
Newspaper was eliminated from additional considerations when it was found to contain
toxic ink and its toxicity could not be determined from the literature. Compost was also
eliminated when the consistency of materials could not be documented.
18

Table 2 Multi-decision Criteria Matrix Example
No. Sorption Media Criteria 1
Criteria 2
Criteria 3
Criteria 4
Criteria 5
Overall*
1a 1b 1. Florida Peat 5 5 5 5 5 5 5 2. Alfalfa 3 3 1 1 0 5 2 3. Activated carbon 5 1 1 1 0 5 2 4. Carbon sand 5
1 1 1 0 5 2
5 Sandy Loam (SL), Loamy Sand (LS), and Sandy Clay Loam (SCL), Planting soil
5
5 3 5 5 5 4.6
6. Sawdust (untreated wood)
3 5 3 5 5 5 4.4
7. Lignocellulosic Materials/wheat straw
3
3 1 1 0 5 2
8 Tire Crumb 4 5 3 3 5 5 4.1 9. Crushed
Limestone 2 5 1 5 5 5 4.9
10. Crushed oyster 2 5 1 5 5 5 4.9
11. Wood chips 3
4 1 5 5 5 4.9
12. Zeolites 4 3 1 1 0 5 2.1 Criteria matrix: 1. Relevance and literature based removal effectiveness, 2. permeability, 3. cost, 4. availability in Florida, 5. additional environmental benefits 1a. phosphorous (unsaturated and saturated) 1b. Nitrogen saturated Quantitative evaluation (qualitative evaluation) Criteria 1: 5 (excellent), 4 (very good), 3 (good), 2 (Fair), 1 (Poor) Criteria 2 and 3: 1(Low), 3 (Medium), 5 (High) Criteria 4 and 5: 5 (Yes) or 0 (No) * Overall is calculated as weighted average based on equal weight among five criteria NOTE. Bold lettering designates those media used to quantify removal.
Both tire crumb and sawdust are lighter than water. Tire regeneration from scrap tire
is not economically possible due to the process of making rubber for tires (Lisi et al.,
2004). Blrkholz et al. (2003) did toxicological testing on tire crumb and found that no
19
DNA and chromosome damaging chemicals are present due to the use of tire crumb in
the environment. Wanielista (2008) also showed a very high LC50 value or basically no
acute toxicity for tire crumb. Hence, the inclusion of tire crumb and sawdust is viewed as
part of the resources recovery with sustainable implication in this study. Limestone was
crushed by Universal Testing Machine (UTM) and particle size was about 250 microns.
A mix of citrus grove sand, tire crumb, saw dust, and limestone are used as the proposed
sorption media. The natural soil was collected from a dry pond (Hunter’s Trace) in
Marion County, Florida and used as a control in the column test. This soil showed
significant difference in hydraulic conductivity in both wet and dry condition. For this
reason, physical properties of both wet and dry natural soil were determined.
The ASTM procedures were followed to determine the properties of sorption media.
The specific gravity was determined by following the standard test method for specific
gravity of soils (ASTM, D854-92). The procedure follows the Method A (Procedure for
oven dry specimen). The pycnometer was a volumetric flask having a capacity of 500 mL
and 100 g of sample was taken for the experiment. The specific gravity was measured
using the ASTM D-854-92 Standard Test Method for Specific Gravity of Soils. The
measured volume of the media was 100 g. The pycnometer was a volumetric flask
having the capacity of 1,000 mL. The permeability test was conducted by following the
standard test method for permeability of granular soils (Constant head) (ASTM, D2434-
68). Several trials were run and averaged. The permeability was converted to a test
temperature of water at 20ºC. The particle size was determined by following the standard
practice for dry preparation of soil samples for particle size analysis and determination of
soil constants (ASTM, D421-85). The sample size was 1,000 g for this analysis. The
surface area of sorption media mixture was determined by using Multipoint BET with
nitrogen adsorption (Vacuum volumetric method) conducted by the Quantachrome
Instruments, Boynton Beach, Florida. About 20 g of sample was used to determine the
surface area of the proposed sorption media mixture (Moberg, 2008).
Isotherm Study for the Sorption Media Mixture
20

In absorption processes, pollutants in one form have a tendency to concentrate on the
surface of a sorption media. In general, pollutants in liquid phase would condense on the
solid surface of sorption media. Isotherms are used to predict the removal by exposing a
known quantity of pollutant to various quantities of media and at a constant temperature.
The isotherm gives a predictive equation that indicates when a certain amount of
pollutant reaches the maximum removal for a fixed mass of media. The term isotherm
also indicates that the test needs to be performed at a given temperature (Crittenden et al.,
2005).
Ammonia nitrogen (NH3-N) solution was prepared from anhydrous NH4Cl from
Fisher Scientific (dried at 1000C), nitrate (NO3-N) solution was prepared from KNO3
from Fisher Scientific (dried at 1050C for 24 hours) and nitrite (NO2-N) solution was
prepared from NaNO2 from Fisher Scientific. Each time the solutions were freshly
prepared to avoid possible contamination. Sometimes ammonia (100 mg/L) and nitrate
(10 mg/L) stock solutions were purchased commercially from HACH (Loveland, CO).
Standard phosphorus solution (50 mg/L) was purchased commercially from HACH.
In this experiment, about 800 g sorption media mixture was prepared by using 50%
sand (400 g), 20% limestone (160 g), 15% sawdust (120 g) and 15% tire crumb (120 g).
A known concentration of pollutant solution (i.e. 1 mg/L) was prepared from stock
solution. 300mL of that solution was transferred into each Erlenmeyer flask and five
flasks were used in this experiment. Now 50 g of sorption media mixture was placed in
flask one, 100 g in flask two, 150 g in flask three, 200 g in flask four, and 250 g in flask
five simultaneously. The top of the each flask was covered by parafilm so that it will be
free from outside disturbance during the waiting period. All the flasks were kept on a
shacking platform (Innova 2000, New Brunswick Scientific) with 50 rpm for a certain
amount of time (time varies for different pollutant removal). When the waiting time had
expired, the flasks were removed from shacking platform and samples were collected
from the flask. The test temperature was in between 220C and 230C (i.e. in room
temperature). Isotherm curves for ammonia, nitrate, nitrite, orthophosphate (OP), total
dissolved phosphorus (TDP) were created via this procedure.
The Freundlich and Langmuir isotherms, which are commonly accepted methods,
were used to draw the isotherm curves. The Langmuir isotherm assumes that each side of
21

the media can bind a molecule of pollutant. The Langmuir isotherm is determined by
plotting a graph between 1/q and 1/C, in which q is media and C is aqueous concentration
of pollutant. The Freundlich isotherm is based on an empirical equation, however. It can
be determined by plotting a graph between logq and logC. Overall, the following two
equations were applied in this study.
• Freundlich isotherm equation is (Sawyer et al., 2003),
Cn
Kq log1loglog += (1)
• Langmuir isotherm equation is (Sawyer et al., 2003),
madsm qCKqq1)1(11
+= (2)
where,
q = Sorbed concentration (mass pollutant/mass sorption media)
qm = Maximum capacity of media for pollutant (mass pollutant/mass media)
C = Aqueous concentration of pollutant (mass/volume)
Kads = Measure of affinity of pollutant for the media
K = Measure of the capacity of the media
Life Expectancy of the Sorption Media (when it no longer removes pollution)
With the isotherm testing, the life expectancy of the sorption media in BMP operation
can be estimated. This life expectancy can be estimated with respect to each type of
pollutant of concern in the study. The maximum capacity of sorption media for a
particular type of pollutant may be retrieved from the corresponding isotherm plot. The
life expectancy of sorption media depends on amount of sorption media used in a specific
system, concentration of nutrient in stormwater and flow rate of stormwater. If the inlet
concentration of nutrient is known with the flow rate of stormwater, the amount of
nutrient per year in the stormwater can be calculated, and then the life expectancy of
sorption media may be easily calculated.
Removal Efficiency, Kinetics, and Head Loss A laboratory column test method is a physical model, or microcosm, which attempts
to simulate, on a small scale, a portion of the real world subsurface environment under a
22

controlled set of experimental conditions. Five columns were prepared in a laboratory to
do the experiment. The plexiglas columns were purchased commercially from an outside
vendor with a diameter of 5 cm (2 inch) and length of 30 cm (1 foot). All five columns
were tied by rope with a wooden frame built in the laboratory. All joints of the columns
are leak proof by using pipe thread sealant (Rectorsell 5 and Plumbing Amazing
Goop). The top and bottom of the column were closed. There is a removable screw cap
system to add media from the top and remove the media from the bottom of the column.
A filter with glass beads (diameter of 4 mm) was placed at the bottom of the column to
prevent the outward flow of finer particles from the column during the collection of
samples. Although the column is 30 cm long, the media was filled up to about 22.5 cm (9
inch) from the bottom. Tygon (Saint-Gobain, no. 16) tubes are added to both the top and
bottom of the column for the flow of influent to the column and effluent from the
column. Influent is added to the column from a reservoir by using a peristaltic pump
(Master flex L/S, Cole-Parmer instrument). Overall, seven parameters were used to assess
the scenarios in five columns to address the process design issues.
Kinetics is a study that focuses on how fast the anticipated reaction may happen. It is
not equivalent to removal efficiency but it is an engineering parameter that is critical to
the size of reactor required to accommodate such a chemical or biological reaction. In
this study, the spectrum of chemicals of concern in kinetics include ammonia, nitrate,
nitrite, total nitrogen, orthophosphate, total phosphorus, and total dissolved phosphorus
and such a parameter (i.e., size of reactor) can be derived from our column study. To
explore the dynamics of a system, kinetics may be derived for each species with different
influent concentrations that mimic the actual fluctuations in stormwater ponds. The
ultimate design of the size of a reactor, however, has to be tied with a conservative option
among all pollutants of interest so as to guarantee a reliable treatment across all
pollutants.
A schematic diagram of the column setup is given in Figure 1. Four columns were
loaded with same media (580 g of media mixture), and the fifth column was loaded with
natural soil collected from the Hunter’s Trace pond in Marion County, Florida, which
was used as the control case. The reason for such separation of testing in different
columns with respect to different chemical species is to avoid the cross contamination by
23
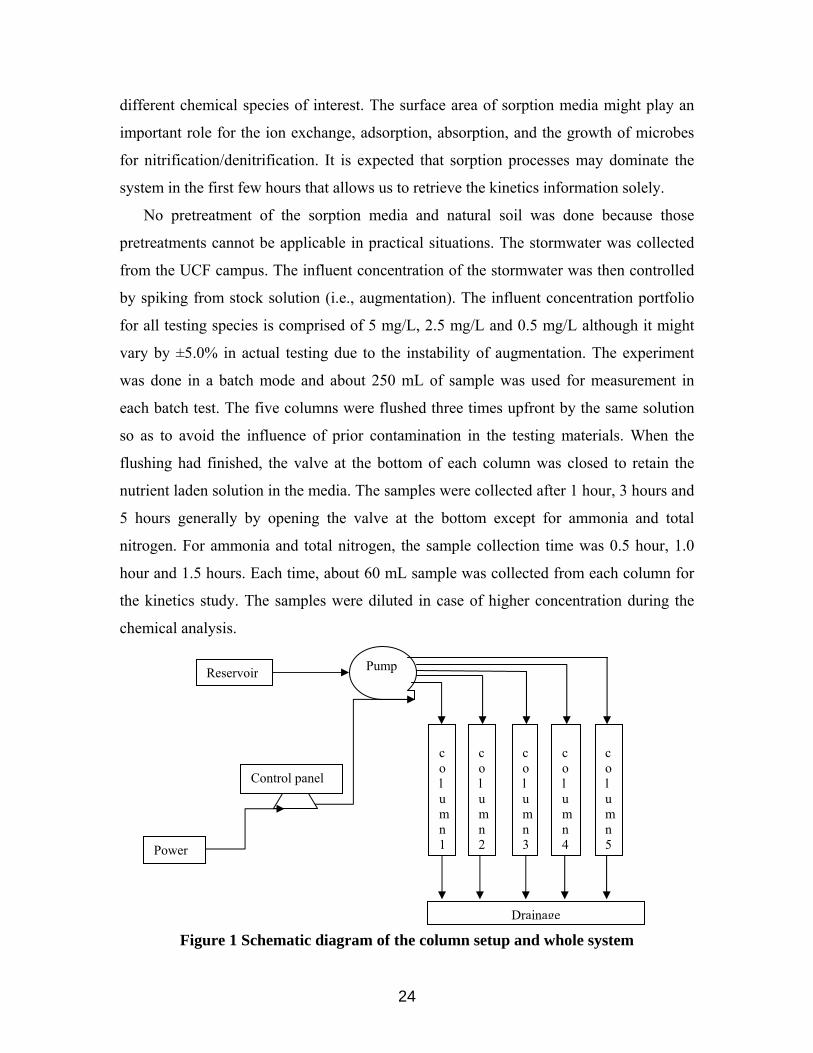
different chemical species of interest. The surface area of sorption media might play an
important role for the ion exchange, adsorption, absorption, and the growth of microbes
for nitrification/denitrification. It is expected that sorption processes may dominate the
system in the first few hours that allows us to retrieve the kinetics information solely.
No pretreatment of the sorption media and natural soil was done because those
pretreatments cannot be applicable in practical situations. The stormwater was collected
from the UCF campus. The influent concentration of the stormwater was then controlled
by spiking from stock solution (i.e., augmentation). The influent concentration portfolio
for all testing species is comprised of 5 mg/L, 2.5 mg/L and 0.5 mg/L although it might
vary by ±5.0% in actual testing due to the instability of augmentation. The experiment
was done in a batch mode and about 250 mL of sample was used for measurement in
each batch test. The five columns were flushed three times upfront by the same solution
so as to avoid the influence of prior contamination in the testing materials. When the
flushing had finished, the valve at the bottom of each column was closed to retain the
nutrient laden solution in the media. The samples were collected after 1 hour, 3 hours and
5 hours generally by opening the valve at the bottom except for ammonia and total
nitrogen. For ammonia and total nitrogen, the sample collection time was 0.5 hour, 1.0
hour and 1.5 hours. Each time, about 60 mL sample was collected from each column for
the kinetics study. The samples were diluted in case of higher concentration during the
chemical analysis.
Figure 1 Schematic diagram of the column setup and whole system
c o l u m n 5
c o l u m n 4
c o l u mn 3
c o l u mn 2
c o l u mn 1
Pump Reservoir
Control panel
Power
Drainage
24
A list of methods used in the chemical analysis is shown in Table 3. HACH method
was used to determine the effluent concentration of ammonia, nitrate and orthophosphate.
A HACH 2800 spectrophotometer is used to determine the effluent concentration.
Powder pillows (purchased from HACH Company, Loveland, CO) were used for the
experiment. The pH values were measured by using an Accumet research meter (AR 50-
duel channel pH meter). In these columns, however, nitrification/denitrification and
sorption mechanism may work together in the removal process.
Table 3 Method used to determine effluent concentration for each chemical species
Chemical Species Title of Method Method No. Ammonia as nitrogen Salicylate method Method 8155 Nitrate as nitrogen Cadmium reduction method Method 8192, 8171 Nitrite as nitrogen Diazotization method Method 8507 Total nitrogen Persulfate digestion method Method 10071 Total dissolved phosphorus Acid persulfate digestion method Method 8190 Total phosphorus Acid persulfate digestion method Method 8190 Orthophosphate PhosVer 3 (Ascorbic acid) method Method 8048
Kinetic studies have a significant role for the design of a proper reactor to produce the
desired product. In most studies, it is common to first assume reaction order as a first-
order (see Equation 3a), and rate constant k (hr-1) is calculated from the slope of the line
for ln[C0/C] vs. reaction time. Integration of equation results in
-dC/dt = k [C] ln [C0/C] = kt (3a)
where, C0 is the influent concentration of dissolved contaminant (i.e., nutrient
pollutant).
Rates of the reaction orders may be calculated from liner regression of ln[C0/C] vs.
reaction time for the reduction of ammonia, nitrite, nitrate, orthophosphate, etc. if the
first-order kinetics works well. If first-order reaction is not a good fit, a second-order
reaction may be assumed as the kinetics by a similar approach in which graphs between
1/C vs. time for each species may be plotted for identification (see Equation 3b).
25
-dC/dt = k [C][H+] 1/[C] = 1/[C0]+kt (3b)
The head loss of the column, which is something to do with permeability or
percolation rate indirectly, was also measured to provide us with the information related
to the flow regime. Two new columns with the same size as the column tests were built
in the laboratory. Each column has three holes: one is at the top, one is at the bottom
and one is at the middle. The distance between top and bottom holes is about 22.86 cm
and the middle hole is about 11.43 cm below the top one. A tube with an inner diameter
of 5 cm was connected with each hole by glue as a piezometric tube. The water was
directed to flow continuously into the column from a reservoir that is about 120 cm
above the datum line (Floor of the room is considered the datum line and column
bottom is about 10.16 cm above the floor). The reading of head loss was taken after 15
minutes of the water flow.
Abiotic Test An abiotic column test is one without living organisms. It is believed that the primary
mechanism for nutrient removal is non biological in the short time column test, but this
must be proven. It is a major concern during the experiments as to whether the removal
process of nutrients from stormwater is due to either the physicochemical or
microbiological process. An abiotic test is conducted to confirm the removal process. A
stock solution of 2000 mg/L of HgCl2 was prepared for abiotic control. Nine ml of HgCl2
was added into every liter of influent. The retention time was 5 hours for nitrate and OP
and 1 hour for ammonia, respectively. The abiotic test was conducted for ammonia in
response to the presence of the nitrifier organisms, whereas the testing is conducted for
nitrate and phosphorus in response to the presence of denitrifiers and Phosphorus
Accumulating Bacteria (PAB), respectively.
26

RESULTS AND DISCUSSION
Material Characterization
Table 4 shows the physical properties of natural soil and sorption media mix used in
the experiment. Sorption media proposed in this study has larger porosity and void ratio
than natural soil at Hunter’s Trace pond. The soil packed into the columns cannot be oven
dried, so the permeability was also tested using a moist sample. The permeability of the
moist sample of Hunter’s Trace soil and sorption media were measured to be 4.470 cm/hr
(1.759 in/hr) and 3.580 cm/hr (1.410 in/hr), respectively. The Hunter’s Trace soil
contains clay particles that are small, therefore a larger surface area was observed. The
sorption media is composed of larger particles, like saw dust and tire crumb, thus making
the surface area smaller than that of Hunter Trace soil.
Table 4 Data showing the physical properties of natural sand and sorption media.
Hunter’s Trace (dry sample)
Hunter’s Trace (moist sample)
Sorption media mix
Dry density (g/cm3) 1.560 1.730 1.210 Void Ratio 0.670 0.510 0.740 Porosity 0.400 0.340 0.420 Specific Gravity (Gs) 2.620 2.620 2.110 Surface Area (m2/g) - - 0.604 Intrinsic Permeability (cm/hr) 62.480 4.470 3.580
To determine the particle-size distribution a sieve analysis was performed. Figures
2(a) and 2(b) present the gradation curves of natural soil at Hunter’s Trace site and
sorption media comparatively. The Hunter’s Trace pond soil had a larger fraction
retained on various sieve sizes as compared to the others. For example, approximately
91% was retained on the 100 U.S. Standard size sieve for the Hunter’s Trace location
whereas only approximately 75% was retained for the media mix proposed. The particle-
size distribution of media mix is well graded. Size characteristics of both natural soil and
sorption media, such as effective size and uniformity factor, reveal some features that are
related to the kinetics, absorption capacity, homogeneity, and permeability that
collectively form the system function. For example, the effective sizes of natural soil and
27

sorption media are 0.165 mm and 0.150 mm, respectively; and it implies that the
effective pore-spaces within the soil architecture are relatively smaller than that of the
sorption media. It therefore implies that sorption media may have lower filter media
hydraulic resistance effect.
0.00
10.00
20.00
30.00
40.00
50.00
60.00
70.00
80.00
90.00
100.00
0.01 0.1110 Grain Size, D (mm)
(a)
0.00
10.00
20.00
30.00
40.00
50.00
60.00
70.00
80.00
90.00
100.00
0.010.1110Grain
si
ze, D (mm)
Perc
ent f
iner
(b)
Figure 2 Particle size distribution of natural soil (a) collected from Hunter’s Trace pond and sorption media mixture (b)
Isotherm Study for the Sorption Media Mixture
From Table 6, it is observed that the value of n is above 1 for nitrate and TDP. When
the n=1 or less, it indicates that all cases of media have equal affinity for the pollutant.
For greater removal, the value of n should be less than one. When n>1, it means affinity
decreases with increasing adsorption density (Sawyer et al., 2003). The value of
28

maximum capacity of pollutant for sorption media is also shown by qm. The isotherm
graphs (Figures 3-7) are shown below to illustrate the results of the analyses.
Table 5 Data showing the properties of Langmuir isotherm for different species.
Species
Isotherm equation for Langmuir
R-square value 1/(qmKads) qmKads
1/qm in mg/mg
qm in mg/mg
NH3-N y=10233x-8880.7 0.941 10233 0.000 -8880.7 -0.000 OP y=272.85x-129.74 0.970 272.85 0.004 -129.74 -0.008
NO3-N y=128.74x+1030 0.801 128.74 0.008 1030 0.001 NO2-N y=229620x-229133 0.844 229620 0.000 -229133 -0.000 TDP y=101.12x+137 0.741 101.12 0.010 137 0.007
Note: y= 1/q and x=1/C
Table 6 Data showing the properties of Freundlich isotherm for different species.
Species Isotherm equation
for Freundlich
R-square value 1/n n LogK
K in mg/mg
NH3-N y=3.951x-3.213 0.951 3.951 0.253 -3.213 0.001 OP y=1.293x-2.215 0.955 1.293 0.774 -2.215 0.006
NO3-N y=0.231x-3.043 0.847 0.231 4.331 -3.043 0.001 NO2-N y=34.571x-3.389 0.754 34.571 0.029 -3.389 0.000 TDP y=0.771x-2.268 0.747 0.771 1.298 -2.268 0.005
Note: y=logq and x=logC
(a) (b) Figure 3 Figure showing the isotherm study for ammonia. (a) is Langmuir isotherm
plot and (b) is Freundlich isotherm plot
29
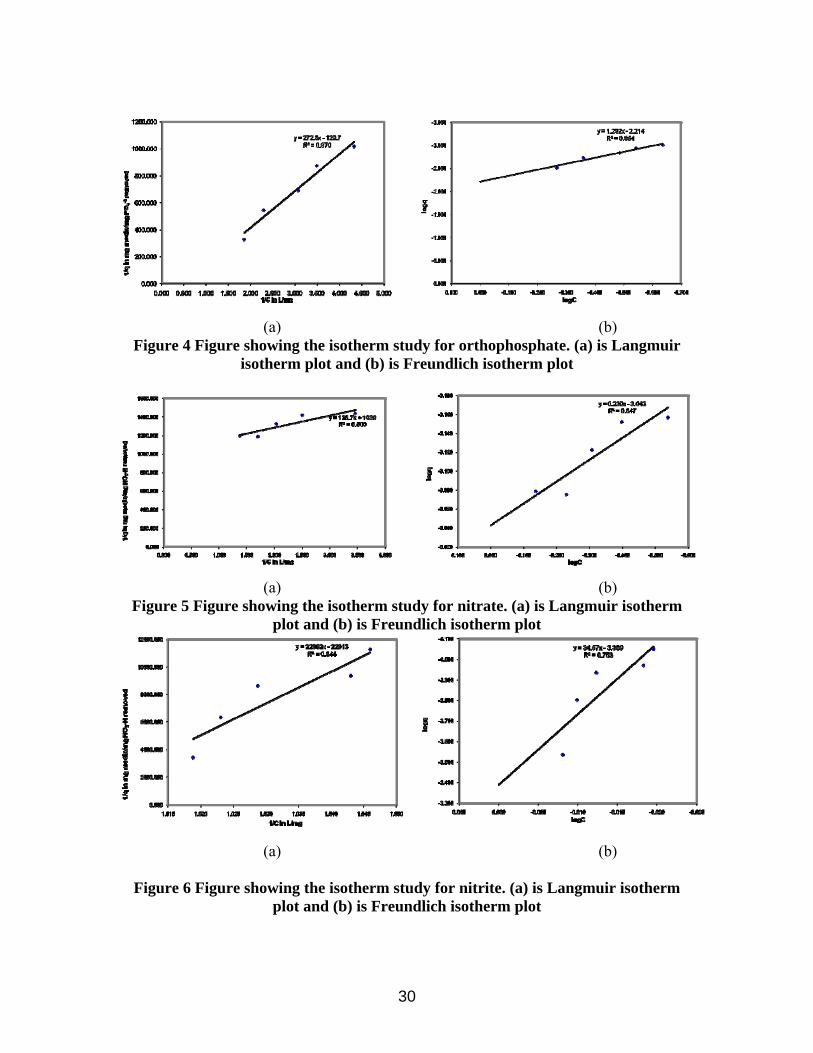
(a) (b)
Figure 4 Figure showing the isotherm study for orthophosphate. (a) is Langmuir isotherm plot and (b) is Freundlich isotherm plot
(a) (b)
Figure 5 Figure showing the isotherm study for nitrate. (a) is Langmuir isotherm plot and (b) is Freundlich isotherm plot
(a) (b)
Figure 6 Figure showing the isotherm study for nitrite. (a) is Langmuir isotherm
plot and (b) is Freundlich isotherm plot
30
(a) (b)
Figure 7 Figure showing the isotherm study for total dissolved phosphorus. (a) is Langmuir isotherm plot and (b) is Freundlich isotherm plot
Life Expectancy of the Media (does not include biological uptake)
For each 1,000 square foot watershed that has runoff of 48 inches per year (similar to
an impervious area in Florida), stormwater volume per year is 29,920 gallons. Suppose
that 1/3 cubic yard of sorption material (300,000 g) is specified at the bottom of a pond to
remove OP in the runoff. This is 6 inches of media over 18 square feet of pond bottom.
Ponds are usually 2-5 % of the impervious watershed or greater, or 20-50 square feet for
this example. Based on our Langmuir isotherm test of OP, the maximum waste load is
0.008 mg OP/mg sorption media. So the maximum amount of OP that can be adsorbed by
the sorption media is 2,310 g (0.008 mg/mg *300,000 g). Assume that stormwater has an
OP concentration of 0.5 mg/L on average, then the total amount of OP is about 56.6
g/year (i.e., (29,920*3.785*0.5)/1000). As a result, the life expectancy of the sorption
media mixture for OP removal would be about 40.8 years (2,310/56.6). This life
expectancy may vary according to the type of sorption media used, the waste loads in
stormwater, and the intensity, frequency and duration of the stormwater in the study area.
Based on the same rationale, what are summarized in Table 7 present all the relevant life
expectancies of the tested sorption media with respect to individual pollutant of concern.
It appears that the effective removal of nitrogen species would lean to be more
microbiological than physicochemical process as long as sufficient moisture is available.
31
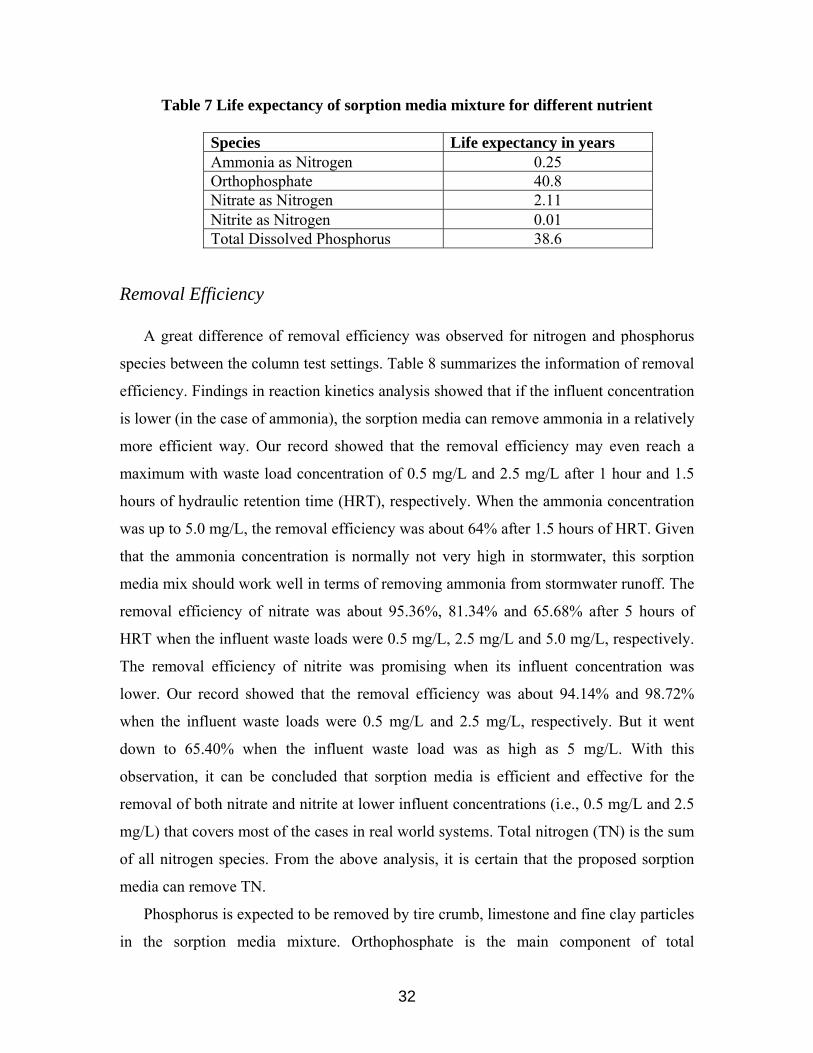
Table 7 Life expectancy of sorption media mixture for different nutrient
Species Life expectancy in years Ammonia as Nitrogen 0.25 Orthophosphate 40.8 Nitrate as Nitrogen 2.11 Nitrite as Nitrogen 0.01 Total Dissolved Phosphorus 38.6
Removal Efficiency
A great difference of removal efficiency was observed for nitrogen and phosphorus
species between the column test settings. Table 8 summarizes the information of removal
efficiency. Findings in reaction kinetics analysis showed that if the influent concentration
is lower (in the case of ammonia), the sorption media can remove ammonia in a relatively
more efficient way. Our record showed that the removal efficiency may even reach a
maximum with waste load concentration of 0.5 mg/L and 2.5 mg/L after 1 hour and 1.5
hours of hydraulic retention time (HRT), respectively. When the ammonia concentration
was up to 5.0 mg/L, the removal efficiency was about 64% after 1.5 hours of HRT. Given
that the ammonia concentration is normally not very high in stormwater, this sorption
media mix should work well in terms of removing ammonia from stormwater runoff. The
removal efficiency of nitrate was about 95.36%, 81.34% and 65.68% after 5 hours of
HRT when the influent waste loads were 0.5 mg/L, 2.5 mg/L and 5.0 mg/L, respectively.
The removal efficiency of nitrite was promising when its influent concentration was
lower. Our record showed that the removal efficiency was about 94.14% and 98.72%
when the influent waste loads were 0.5 mg/L and 2.5 mg/L, respectively. But it went
down to 65.40% when the influent waste load was as high as 5 mg/L. With this
observation, it can be concluded that sorption media is efficient and effective for the
removal of both nitrate and nitrite at lower influent concentrations (i.e., 0.5 mg/L and 2.5
mg/L) that covers most of the cases in real world systems. Total nitrogen (TN) is the sum
of all nitrogen species. From the above analysis, it is certain that the proposed sorption
media can remove TN.
Phosphorus is expected to be removed by tire crumb, limestone and fine clay particles
in the sorption media mixture. Orthophosphate is the main component of total
32
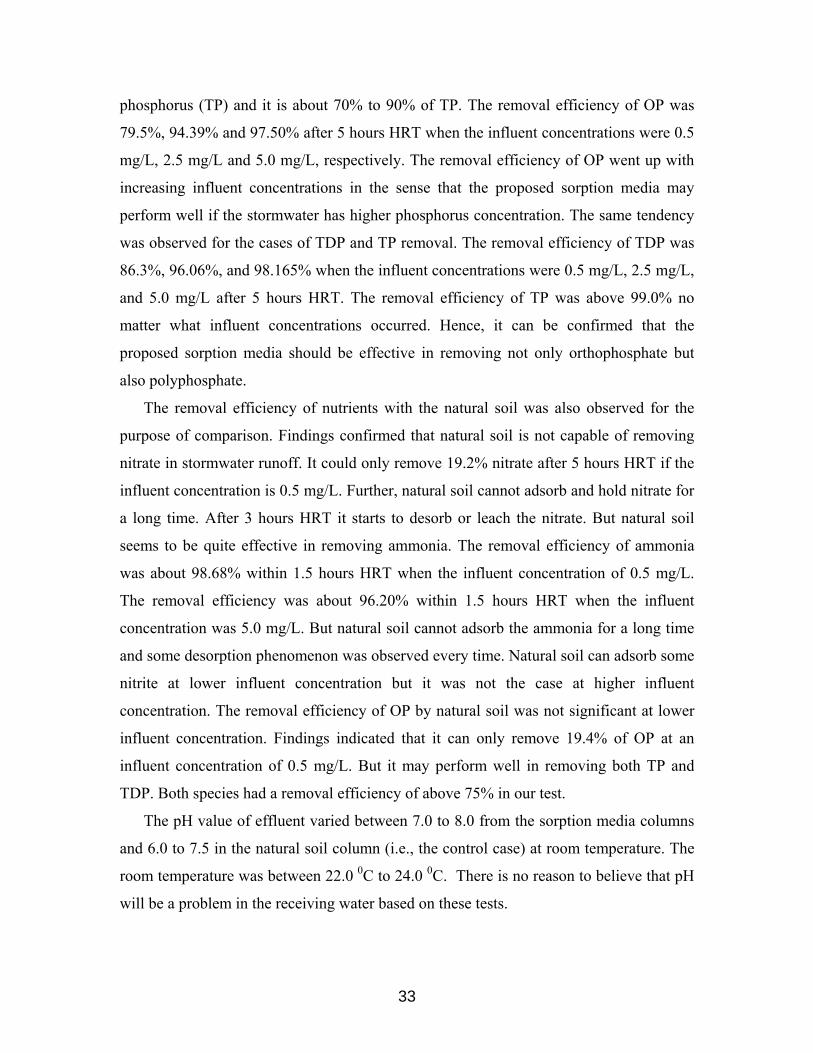
phosphorus (TP) and it is about 70% to 90% of TP. The removal efficiency of OP was
79.5%, 94.39% and 97.50% after 5 hours HRT when the influent concentrations were 0.5
mg/L, 2.5 mg/L and 5.0 mg/L, respectively. The removal efficiency of OP went up with
increasing influent concentrations in the sense that the proposed sorption media may
perform well if the stormwater has higher phosphorus concentration. The same tendency
was observed for the cases of TDP and TP removal. The removal efficiency of TDP was
86.3%, 96.06%, and 98.165% when the influent concentrations were 0.5 mg/L, 2.5 mg/L,
and 5.0 mg/L after 5 hours HRT. The removal efficiency of TP was above 99.0% no
matter what influent concentrations occurred. Hence, it can be confirmed that the
proposed sorption media should be effective in removing not only orthophosphate but
also polyphosphate.
The removal efficiency of nutrients with the natural soil was also observed for the
purpose of comparison. Findings confirmed that natural soil is not capable of removing
nitrate in stormwater runoff. It could only remove 19.2% nitrate after 5 hours HRT if the
influent concentration is 0.5 mg/L. Further, natural soil cannot adsorb and hold nitrate for
a long time. After 3 hours HRT it starts to desorb or leach the nitrate. But natural soil
seems to be quite effective in removing ammonia. The removal efficiency of ammonia
was about 98.68% within 1.5 hours HRT when the influent concentration of 0.5 mg/L.
The removal efficiency was about 96.20% within 1.5 hours HRT when the influent
concentration was 5.0 mg/L. But natural soil cannot adsorb the ammonia for a long time
and some desorption phenomenon was observed every time. Natural soil can adsorb some
nitrite at lower influent concentration but it was not the case at higher influent
concentration. The removal efficiency of OP by natural soil was not significant at lower
influent concentration. Findings indicated that it can only remove 19.4% of OP at an
influent concentration of 0.5 mg/L. But it may perform well in removing both TP and
TDP. Both species had a removal efficiency of above 75% in our test.
The pH value of effluent varied between 7.0 to 8.0 from the sorption media columns
and 6.0 to 7.5 in the natural soil column (i.e., the control case) at room temperature. The
room temperature was between 22.0 0C to 24.0 0C. There is no reason to believe that pH
will be a problem in the receiving water based on these tests.
33
Table 8 Summary of removal efficiency in column test
Species HRT in hours
Initial Concentration
in mg/L
Effluent concentration in
mg/L Removal
efficiency in %
Ammonia
1.5 0.5 0 100 1.5 2.5 0 100 1.5 5 1.977 64.876
Nitrate
5 0.5 0.023 95.362 5 2.5 0.476 81.347 5 5 1.775 65.674
Nitrite
5 0.5 0.031 94.144 5 2.5 0.032 98.726 5 5 1.751 65.395
OP
5 0.5 0.117 79.51 5 2.5 0.144 94.39 5 5 0.124 97.506
TP
5 0.5 0.006 99.055 5 2.5 0.013 99.464 5 5 0.018 99.638
TDP
5 0.5 0.067 86.299 5 2.5 0.097 96.068 5 5 0.092 98.165
Kinetic Reactions
With the aid of the column test, it is now known that the proposed sorption media can
uptake and remove the nutrient in about 5 hours from stormwater runoff whereas the
natural soil can remove part of the nutrient if the HRT is long enough. HRT is critical for
sorption media to achieve the necessary absorption/adsorption. Filtration kinetics of real
filter media is currently modeled by applying a first-order kinetic model for some
targeted constitutes (Gomer et al., 2007). This is different with the biodegradation
kinetics associated with microbial communities via nitrification and denitrification. In
this study, a broader viewpoint was evaluated that the proposed sorption media in this
research may follow either the first-order or the second-order filtration kinetics. The
confirmation of this may provide us with a necessary link between the size of reactor and
the possible removal efficiency. Therefore, graphs between ln(C0/C) vs. time and 1/C vs.
time for each species with different influent concentrations were plotted to verify this
assumption. The equation, R-square value and rate constant may be determined from
34

these graphs. We found that it is very difficult to determine the kinetics for ammonia as it
can be removed very quickly by the proposed sorption media. Overall, the OP follows the
second-order reaction kinetics. In the case of OP testing, the second-order reaction
kinetics may be derived with respect to a good R-square value of 0.70 to 0.94. The
removal of OP by natural soil also confirmed that the same kinetics works well or as well
as the other media. Also nitrate and nitrite also followed the second-order reaction
kinetics. The R-square values of these two cases are 0.88 for nitrate and 0.81 for nitrite.
In Tables 9(a) and 9(b) the reaction kinetic analysis is summarized for the sorption
media and natural soil. It can be concluded that all the species follow the second-order
reaction kinetics more closely. This judgment was made based on the R-square values.
Apparently, the proposed sorption media exhibits better removal efficiency in terms of all
chemical species of concern (i.e. ammonia, nitrate, nitrite, total nitrogen, total
phosphorus, total dissolved phosphorus and orthophosphate). Our justification is that
ammonia, nitrate, nitrite, and total nitrogen were mainly removed by saw dust and tire
crumb via adsorption whereas total phosphorus, total dissolved phosphorus and
orthophosphate were mainly removed by tire crumb and limestone. However, phosphorus
species may also be removed by other chemical reactions.
Finally, the chemical analysis for the abiotic test confirmed that the nutrient removal
process in the natural state was mainly a physicochemical process. After 5 hours of
hydraulic retention time, the removal efficiency of nitrate and OP was 83.32% and
92.20%, respectively with an initial concentration of 0.5 mg/L. The ammonia removal
efficiency was about 100% after 1.5 hours of hydraulic retention time and the same initial
concentration. All of the removal efficiencies remain about equal to what was observed in
the kinetics analysis. Since the columns were not seeded with organisms or sludge added
to the columns to foster any amenable microbial environment and the natural citrus grove
sand was heated up to 1050C, it is believed that it is not possible for bacteria to grow in
such a short hydraulic retention time in the media. In other word, no
nitrification/denitrification process is triggered in our testing and the abiotic analysis
proved the assumption (Hossain, 2008).
35

Table 9(a) Summary table of kinetics for the sorption media mixture
Species Initial
concentration in mg/L
first order equation
R2 for first
order equation
K for first
order equation (1/sec)
second order equation
R2 for second order
equation
K for second order
equation (L/mghr)
Nitrate
5 y=0.230x 0.653 0.749 y=0.074x+0.193 0.996 0.074 2.5 y=0.330x 0.998 0.330 y=0.302x+0.391 0.920 0.302 0.5 y=0.749x 0.265 0.249 y=9.516x+2.000 0.880 9.516
Ortho-Phosphate
5 y=0.521x 0.275 0.521 y=1.637x+0.201 0.859 1.637 2.5 y=0.420x 0.114 0.420 y=1.511x+0.389 0.698 1.511 0.5 y=0.105x 0.780 0.105 y=1.340x+1.754 0.940 1.34
Nitrite
5 y=0.222x 0.831 0.222 y=0.072x+0.198 0.919 0.072 2.5 y=0.897x 0.990 0.897 y=5.088x+0.402 0.818 5.088 0.5 y=0.683x 0.649 0.683 y=6.736x+1.879 0.929 6.736
TP
5 y=1.328x 0.781 1.328 y=11.275+0.202 0.961 11.275 2.5 y=1.314x 0.523 1.314 y=19.46x+0.413 0.725 19.46 0.5 y=0.954x 0.935 0.954 y=27.53x+1.68 0.751 27.53
TDP
5 y=0.942x 0.443 0.942 y=2.089x+0.199 0.912 2.089 2.5 y=0.692x 0.738 0.692 y=1.715x+0.405 0.862 1.715 0.5 y=0.519x 0.231 0.519 y=3.454x+2.045 0.358 3.454
Note: for first order y=ln(C0/C) and x=t; for second order y=1/C and x=t
Table 9(b) Summary table of kinetics for the natural soil (Hunter’s Trace soil)
Species Initial
concentration in mg/L
First order
Equation
R2 for first
order equation
K for first
order equation
(1/sec)
Second order Equation
R2 for second order
equation
K for second order
equation (L/mghr)
Nitrate 5 y=0.230x 0.653 0.749 y=0.074x+0.1903 0.996 0.074
0.5 y=0.066x 0.222 0.066 y=1.635x+2.146 0.213 1.635
Ortho-Phosphate
5 y=0.577x 0.388 0.577 y=0.443x+0.202 0.705 0.443 0.5 y=0.036x 0.836 0.036 y=0.065x+1.650 0.820 0.065
Nitrite 5 y=0.146x 0.254 0.146 y=0.039x+0.197 0.305 0.039
0.5 y=0.652x 0.881 0.652 y=6.101x+1.820 0.964 6.101
TP 5 y=1.003x 0.745 1.003 y=3.344x+0.221 0.912 2.090
0.5 y=0.336x 0.846 0.336 y=1.425x+1.981 0.971 1.425
TDP
5 y=0.953x 0.412 0.953 y=1.946x+0.176 0.460 1.946
0.5 y=0.620x 0.334 0.620 y=5.502x+2.083 0.663 5.502 Note: for first order y=ln(C0/C) and x=t; for second order y=1/C and x=t
36

APPLICATION POTENTIAL
Head Loss
The head loss, which reflects the permeability or peculation rate, is calculated based
on the assumption of inter-event flow. Runoff is considered inter-event or not continuous
as in a batch run. Stormwater retention ponds or dry ponds are areas that are normally
dry, but function to infiltrate the water in the reservoirs during and after storm events.
Within the natural soil column, the head loss was about 57.15 cm of water (22.5 inches of
water) and in sorption media column the head loss was about 83.820 cm in water (34
inches of water). This is the head loss to allow the maximum infiltration capacity. The
head loss information may be used to design the minimum depth of the retention pond so
as the stormwater infiltrates at the design rate.
Engineering Feasibility Study
The engineering feasibility of dry ponds for nutrient removal should be considered in
a relatively flexible way. Aerobic conditions in the batch testing showed the removal of
phosphorus while anaerobic conditions in the column showed removal of nitrogen
species. Without having functionally designed sorption media, typical removal rates for
pollutants not discharged to surface waters in dry detention ponds are between 10%-20%
(Urbonas and Stahre, 1993), while wet ponds may achieve up to 40% of nitrogen removal
(Harper, 2007). Retention pond removal is a function of the size of the pond and the
climatic zone, and typically 80% or more is achieved. But these efficiencies only address
reduced surface water discharges and not what mass of pollutants enter the ground.
However the rate of removal from discharges to both surface and ground waters can be
increased with the use of sorption media that follow the recipes and the hydraulic
retention times (HRT) noted in the previous results section and discussion. That media
mix is referred to a functionally designed media. The thickness of sorption media layer at
the bottom of the ponds required to achieve the target removal efficiency is related to the
37

HRT. From the kinetic column studies, this retention time is of the order of 5 hours. In
an actual field condition, there may exist preferred path-ways in the media mix so that a
prudent HRT should be specified that is greater than the laboratory column results. A
design to hold the stormwater from double the laboratory time of 5 hours, or the use of 10
hours is not unreasonable. An engineered containment system can provide a control on
retention time or a selection of media with infiltration rate limits can also achieve the
same results.
The detention pond or wet pond is perhaps one of the most common types of
stormwater treatment systems in Florida and the world. It provides a basin sized to hold a
permanent pool of water while reducing peak flow runoff. The treatment of stormwater
occurs during the inter-event storm period when long holding times allow for particle
settling and biodegradation. One popular design is to utilize a sedimentation fore-bay that
holds a percentage of the pond water and drains slowly through a standpipe into the main
basin. When the fore bay capacity is reached, the contiguous storm events provide a fresh
influx of stormwater which force some of the standing water out of the system and flow
occurs over a weir into the permanent pool. However, many of the wet ponds might not
have such a sedimentation forebay. The basic detention pond includes only the permanent
pool which serves to remove pollution and attenuate peak flows by storing a specified
volume of stormwater. Stormwater treatment with in-situ treatment units filled with
sorption media can be used to treat stormwater that is being discharged normally from the
pond. The captured water can also be withdrawn by a sump pump. The pump can be
used to remove water near the bottom of the pond. Also the water in the pond can be re-
circulated for treatment with improved water added to the pond at the upper layers.
Figure 8 shows the layout of such a system in the wet ponds.
Another design is called a dry detention pond. Stormwater enters the pond and if not
infiltrated, it is released. It operates until all the stormwater is either infiltrated or
discharged. The effectiveness is typically less than the wet detention pond or a retention
pond. Thus the effectiveness can be improved by treating the stored water with
functional mix media. Thus, the design is similar to a wet pond, except the design pond
storage is removed by a pump or gravity through the functional mixed media before the
next runoff event.
38
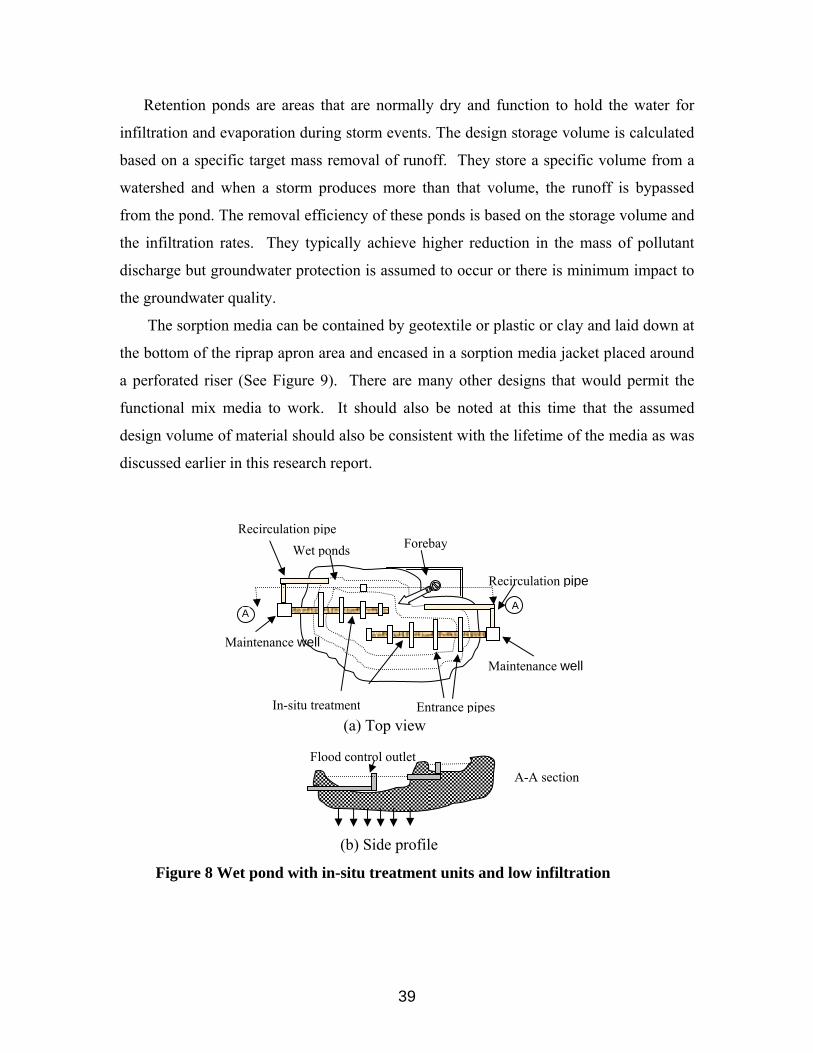
Retention ponds are areas that are normally dry and function to hold the water for
infiltration and evaporation during storm events. The design storage volume is calculated
based on a specific target mass removal of runoff. They store a specific volume from a
watershed and when a storm produces more than that volume, the runoff is bypassed
from the pond. The removal efficiency of these ponds is based on the storage volume and
the infiltration rates. They typically achieve higher reduction in the mass of pollutant
discharge but groundwater protection is assumed to occur or there is minimum impact to
the groundwater quality.
The sorption media can be contained by geotextile or plastic or clay and laid down at
the bottom of the riprap apron area and encased in a sorption media jacket placed around
a perforated riser (See Figure 9). There are many other designs that would permit the
functional mix media to work. It should also be noted at this time that the assumed
design volume of material should also be consistent with the lifetime of the media as was
discussed earlier in this research report.
Figure 8 Wet pond with in-situ treatment units and low infiltration
ForebayWet ponds
Maintenance well
Maintenance well
In-situ treatment Entrance pipes
Recirculation pipe
Recirculation pipe
A A
Flood control outletA-A section
(a) Top view
(b) Side profile
39

Riprap Apron
Cost and Benefit
The cost of the mixed media is about $150 per cubic yard based on 2008 cost indices
and at the point of supply. Travel or shipping cost plus placement and design costs are
not included. Assuming that the final project cost is double the materials cost results in a
capital cost of $300 per cubic yard. One third of a yard was calculated in the life
expectancy section of this report for 40 years of operation as needed for each 1,000
square feet of impervious watershed. Thus, the capital cost would be $100 per 1,000
impervious square feet of watershed. For an acre of impervious area, the capital cost of
media placement would be $4,356 (100 x 43.56 thousand square feet in an acre). The
cost of constructing a pond to store 3 inches of runoff (about 10,000 cubic feet) from an
impervious acre is about $20,000-$30,000 (Brown and Schueler, 1997) adjusted to 2008
prices. A detention pond cost for 6 inches of runoff per impervious acre is assumed at
$35,000. When media is added to a detention pond, there is an additional cost for
pumping and operation.
Figure 9 Retention pond with in-situ treatment
(a) Top view
(b) Side profile
Shallow Marsh
Sorption Media Layer
Bypass
Water Surface Elevation set to accommodate a design volume
Stored water infiltrates
Bypass Flow Channel Shallow Marsh
OutfallBuffer Landscape with Natives
Stabilized Inlet
Top Stage (Normal Dry)
Gentle Slope for Drainage
40
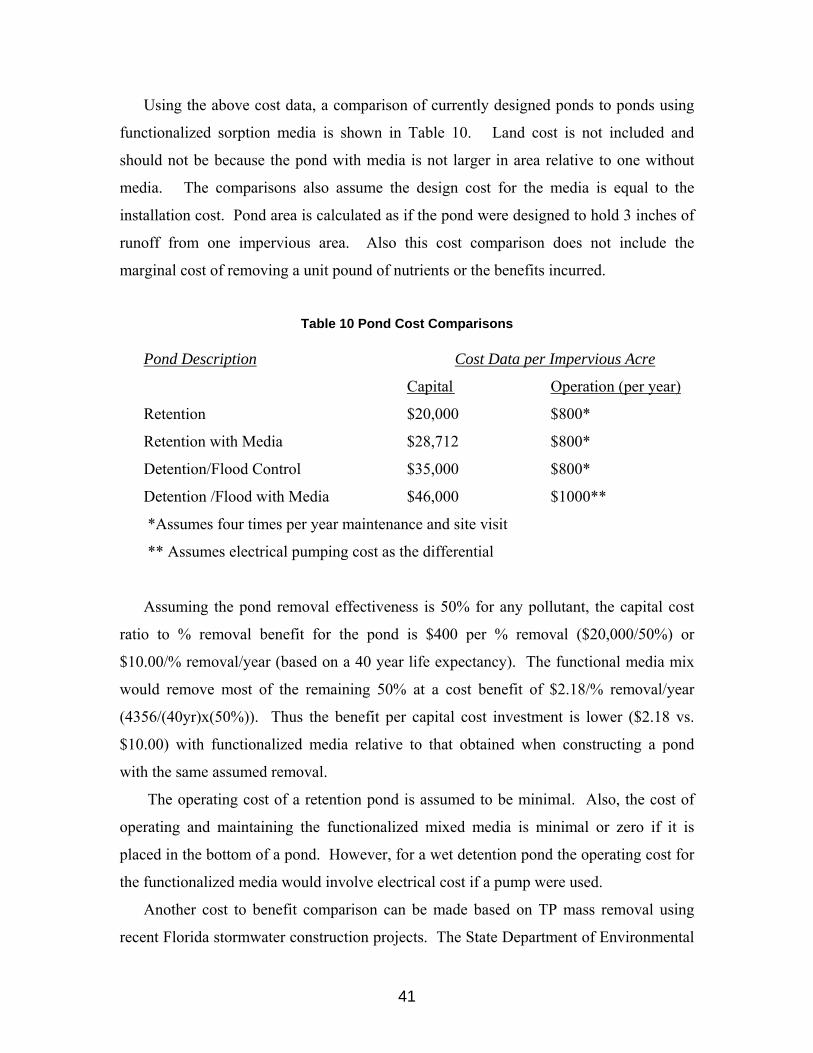
Using the above cost data, a comparison of currently designed ponds to ponds using
functionalized sorption media is shown in Table 10. Land cost is not included and
should not be because the pond with media is not larger in area relative to one without
media. The comparisons also assume the design cost for the media is equal to the
installation cost. Pond area is calculated as if the pond were designed to hold 3 inches of
runoff from one impervious area. Also this cost comparison does not include the
marginal cost of removing a unit pound of nutrients or the benefits incurred.
Table 10 Pond Cost Comparisons
Pond Description Cost Data per Impervious Acre
Capital Operation (per year)
Retention $20,000 $800*
Retention with Media $28,712 $800*
Detention/Flood Control $35,000 $800*
Detention /Flood with Media $46,000 $1000**
*Assumes four times per year maintenance and site visit
** Assumes electrical pumping cost as the differential
Assuming the pond removal effectiveness is 50% for any pollutant, the capital cost
ratio to % removal benefit for the pond is $400 per % removal ($20,000/50%) or
$10.00/% removal/year (based on a 40 year life expectancy). The functional media mix
would remove most of the remaining 50% at a cost benefit of $2.18/% removal/year
(4356/(40yr)x(50%)). Thus the benefit per capital cost investment is lower ($2.18 vs.
$10.00) with functionalized media relative to that obtained when constructing a pond
with the same assumed removal.
The operating cost of a retention pond is assumed to be minimal. Also, the cost of
operating and maintaining the functionalized mixed media is minimal or zero if it is
placed in the bottom of a pond. However, for a wet detention pond the operating cost for
the functionalized media would involve electrical cost if a pump were used.
Another cost to benefit comparison can be made based on TP mass removal using
recent Florida stormwater construction projects. The State Department of Environmental
41
Protection (Livingston, 2008) keeps records of stormwater construction projects for a
variety of methods (alum injection, wet ponds, retention ponds swales, and separators).
Their records indicate an average capital cost to remove one pound of phosphorus per
year per acre of watershed (not all impervious) to be about $150. Ninety percent (90%)
of the time the cost of removal is less than $303 per pound of phosphorus per year per
acre. The average percent impervious for all projects is assumed at 20%, thus the
construction cost per impervious acre per pound of TP removed per year is on the
average about $750 per impervious acre and 90% of the time the cost is less than $1515.
Using the assumption of 0.5 mg/l TP, 4 feet of runoff, and one acre of impervious area,
the TP from an impervious acre per year is 5.44 pounds (0.5 x (3.79L/gal) x (43,560sq ft)
x 4 feet of runoff x 7.48gal/CF/(1000 x 454 g/lb)). The construction cost per impervious
acre per pound of TP removed per year is calculated as $800 (4356/5.44). Thus when
compared using construction cost to current Florida stormwater management projects of
all types the functionalized sorption media cost is approximately equal to the average
($800 vs. $750).
It should be obvious that costs vary widely. For each pond location, the cost and
benefit may have to be calculated; however it should be apparent that the marginal cost of
construction per percent removal (benefit) decreases when the mixed media is used
relative to the initial pond construction cost. Also the average capital cost of current
stormwater projects per % removal is about equal to those of the functionalized media.
42
CONCLUSIONS
One result of this research is the specification of a recipe for sorption media mix. The
media mix is a combination of sandy loam material, limestone, tire crumb and sawdust.
There are other media mixes readily available in Florida that may also be used, however
with the specified mix, removal efficiencies and kinetics have been determined. As an
example, Moberg (2008) eliminated limestone from the media mix and showed overall
removals in bath and column testing to be equal to the results reported within this work.
The methodologies of this research should be followed for other testing. The testing
conditions were done in columns and batch modes to simulate the practical or functional
application of the media mix. Thus the resulting media mix can be called a
functionalized media mix.
The results of batch and column tests indicated that the functionalized media mix has
the potential to effectively and efficiently remove most of the nutrient species within an
appropriate detention time via the sorption processes. The life expectancy of the proposed
sorption media is reasonably long in terms of orthophosphate removal. Using half the
volume of media will reduce the life expectancy by half. For an example unit size
impervious watershed, the life time was calculated as 40 years for a specific volume of
material and based on chemical reactions. When biological removals are considered, the
life time of the mixed media should increase.
The removal of the nitrate ion (NO3-) is minimal in soils that are negatively charged
so the NO3- ion is not bound to the soil. Therefore, nitrate ions move freely with the soil
solution and are readily leachable. Nitrogen, particularly nitrate, easily moves from
terrestrial ecosystems into surface and groundwater, including lakes, streams, rivers, and
estuaries. The removal of nitrates will rely on the microbes, such as ammonia oxidizing
bacteria (AOB), nitrogen oxidizing bacteria (NOB) and denitrifiers. Microbe
identification is out of the scope of this research. However, removal under saturated and
anaerobic laboratory column conditions is possible and was demonstrated. A HRT of 5
hours was considered sufficient to remove nitrate under anaerobic conditions. Design
implications for depth and holding times are possible with this data.
43
The column test was set up in a manner that may prove its functionality for
application in retention ponds where stormwater impact is in a batch mode. Furthermore,
the design of wet ponds may follow the same philosophy. The assurance of HRT would
be a major challenge in applying this concept because the time for the intermittent flow
(i.e., infiltrate) to pass through the sorption media layer constitutes the legitimate HRT.
However, both wet and dry ponds in real world systems may count on microbiological
effects to remove nitrogen as well, and thus the contribution from adsorption and
absorption would not dictate the ultimate removal efficiency. The ultimate removal
effectiveness with biological activity is most likely significant. This is especially true in
the wet ponds.
Sorption media are not expensive or in the order of less than $150 per cubic yard of
material at the point of mixing at 2008 market conditions. Thus such systems for
removing nutrients should be cost effective. There is little maintenance cost associated
with the functional media mix. Based on capital cost, the additional removal obtained
before either discharge from a wet pond on infiltration from a retention pond is less than
the per unit removal cost associated with construction of the pond.
Future research should also be done with other sorption media mixes for both
stormwater and wastewater treatment. The research may also focus on the detection of
microbiological activities, such as AOB, NOB, and denitrifiers, to ensure the
denitrification process using real-time PCR instrumentation. In case of practical
application the retention time is a most important issue that needs to be considered but it
may be difficult to ensure on-site. Construction methods to achieve an HRT however are
possible. There is also a need to develop the design-based simulation model that may aid
in the illumination of the system configuration and assess the effectiveness of nutrient
control for the real world facilities.
44
LIST OF REFERENCES Analytical & Environmental Consultants (AEC) (2005), locally available adsorbing
materials, sediment sealing, and flocculants for chemical remediation of lake and
stream water,
http://www.ebop.govt.nz/media/pdf/report/Chemicalremediationstudy.pdf,
accessed in June, 2007.
ASTM (D854-92), Standard test method for specific gravity of soils, ASTM
international.
ASTM (D2434-68), Standard test method for permeability of granular soils (Constant
head), ASTM international.
ASTM (D421-85), standard practice for dry preparation of soil samples for particle size
analysis and determination of soil constants, ASTM international.
Baeseman, J. L., Smith, R. L., and Silverstein, J. (2006), Denitrification potential in
stream sediments impacted by acid mine drainage: effects of pH, various electron
donors and iron, Microbial Ecology, 51(2), 232-241.
Baker, L. A. (1992). Introduction to nonpoint source pollution in the United States and
prospects for wetland use. Ecological Engineering, 1, 1-26.
Bell, W., Stokes, L., Gavan, L. J., and Nguyen, T. N. (1995), Assessment of the pollutant
removal efficiency of Delaware Sand filter BMPs, City of Alexandria,
Department of Transportation and Environmental Services, Alexandria, VA.
Benson, C. H. (2001), Using waste foundry sands as reactive media in permeable reactive
barriers, DNR project #147.
Boving, T.B. and Zhang, W. (2004), Removal of aqueous-phase polynuclear aromatic
hydrocarbons using aspen wood fibers, Chemosphere, 54, 831-839.
Blrkholz, D. A., Belton, K. L. and Guldottl, T. L. (2003). Toxicological evaluation for the
hazard assessment for tire crumb use in public playground, Journal of the Air and
Waste Management Association, 53, 903-907.
Birch, G. F., Fazeli, M. S., and Matthai, C. (2005). Efficiency of an infiltration basin in
removing contaminants from urban stormwater. Environmental Monitoring and
Assessment, 101, 23–38.
45

Braun-Howland, E. (2003), Validity assessment of methods to distinguish between
ruminant and human sources of fecal contamination in watersheds, New Work
State Water Resources Institute Annual Technical Report-FY 2003, Cornell
University, Ithaca, NY.
Brown, W., and Schueler, T. (1997), The Economics of Stormwater BMPs in the Mid-
Atlantic Region: Final Report, Center for Watershed Protection, Maryland.
Clark, S., and Pitt, R. (1999), Stormwater treatment at critical areas: Evaluation of filter
media, EPA 600/R-00/010, Washington D. C., USA.
Clark, S., Pitt, R., and Brown, D., (2001), Effect of anaerobiosis on filter media pollutant
retention, Presented at the Engineering Foundation and the American Society of
Civil Engineers Conference on Information & monitoring needs for evaluating the
mitigation effects of BMPs, Snowmass, CO.
Chang, N. B., Wanielista, M., and Hossain, F., (2008). “Material Characterization and
Kinetics Study of Green Sorption Media for Nutrient Removal in Stormwater
Management Facilities,” World Environmental and Water Resources Congress,
ASCE/EWRI-2008 Conference, May 13-16, 2008, Honolulu, Hawaii, oral
presentation.
Crittenden, J. C., Trussell, R. R., Hand, D. W. (2005). Water treatment: principles and
design, 2nd edition, John Wiley & Sons inc., USA.
Darbi, A., Viraraghavan, T., Butler, R., and Corkal, D. (2002). Batch studies on nitrate
removal from potable water, Water South Africa, 28(3), 319-322.
DeBusk, T. A., Langston, M. A., Schwegler, B. R., and Davidson, S. (1997). An
evaluation of filter media for treating stormwater runoff, Proceedings of the fifth
Biennial Stormwater Research Conference, 82-89.
Forbes, M. G., Dickson, K. L., Saleh, F., Doyle, R. D., Hudak, P., and Waller, W. T.,
(2005), Recovery and fractionation of phosphate retained by lightweight
expanded shale and masonry sand used as media in subsurface flow treatment
wetlands, Environmental Science & Technology, 39(12), 4621-4627.
Gabel, B., Kozicki, R., Lahl, U., Podbielski, A., Stachel, B., and Struss, S. (1982).
Pollution of drinking water with nitrate, Chemosphere, 11, 1147-1154.
46

Gálvez, J. M., Gómez, M. A., Hontoria, E., and López, J. G. (2003). Influence of
hydraulic loading and air flow rate on urban wastewater nitrogen removal with a
submerged fixed-file reactor, Journal of Hazardous Materials, B101, 219-229.
Gan, Q., Allen, S. J., and Matthews, R. (2004). Activation of waste MDF sawdust
charcoal and its reactive dye adsorption characteristics, Waste Management, 24,
841-848.
Gisvold, B., Ødegaard, H., and Føllesdal, M. (2000). Enhanced removal of ammonium by
combined nitrification/ adsorption in expanded clay aggregate filters, Water
Science and Technology, 41(4-5), 409-416.
Graves, G. A., Strom, D. G., and Robson, B. E. (1998). Stormwater impact to the fresh
water Savannas Preserve marsh, Florida, Department of Environment protection
and St. Johns River Water Management District, Florida, USA.
German, E. R. (1989). Quantity and quality of stormwater runoff recharged to the
Floridan Aquifer system through two drainage wells in the Orlando, Florida area.
US Geological Survey – Water Supply paper 2344. Prepared in corporation with
the Florida Department of Environmental Regulation. Denver, CO.
Görner, H., Engh, T. A., Syvertsen, M., and Zhang, L. (2007). Removal of Na and Ca
from aluminum scrap through filtration, Materials Science Forum, 546-549, 801-
806.
Güngör, K. and Ünlü, K. (2005). Nitrite and nitrate removal efficiencies of soil aquifer
treatment columns, Turkish J. Eng. Env. Sci., 29, 159-170.
Harper, H.H., (2007). Evaluation of Current Design Criteria within the State of Florida.
Department of Environmental Protection, Tallahassee, Florida.
Harris, W. G., Rhue, R. D., Kidder, G., Brown, R. B., and Littell, R. (1996). Phosphorus
retention as related to morphology of sandy coastal plain soil materials, Soil
Science Society of American Journal, 60(5), 1513-1521.
Han, D. W., Yun, H. J., and Kim D. J. (2001). Autotrophic nitrification and
denitrification characteristics of an up flow biological aerated filter, Journal of
Chemical Technology and Biotechnology, 76, 1112-1116.
47
Hedström, A. (2006). Reactive filter materials for ammonium and phosphorus sorption in
small scale wastewater treatment, Doctoral Dissertation, Luleå University of
Technology, IAAN: 1402-1544.
Hossain, F. (2008). Nutrient Removal from Stormwater By Using Green Sorption Media,
Master’s Thesis, University of Central Florida.
Hsieh, C. H. and Davis, A. P. (2003). Multiple-event study of bioretention for treatment
of urban stormwater runoff, Diffuse Pollution Conference Dublin, Ireland.
Hsieh, C. H. and Davis, A. P. (2005). Evaluation and optimization of bioretention media
for treatment of urban stormwater runoff, Journal of Environmental Engineering
(ASCE), 131(11), 1521-1531.
Huang, C. P., Wang, H. W., and Chiu, P.C. (1998). Nitrate reduction by metallic iron,
Water Research, 32(8), 2257-2264.
Jokela, C. H. Y., Kettunen, R.H., Sormunen, K. M., and Rintala, J. A. (2002). Biological
nitrogen removal from municipal landfill leachate: low-cost nitrification in
biofilters and laboratory scale in-site denitrification, Water Research, 36, 4079-
4087.
Kahl, J. S., Norton, S. A., Fernandez, I. J., Nadelhoffer, K. J., Driscoll, C. T., and Aber,
J. D. (1993). Experimental inducement of nitrogen saturation at the watershed
scale. Environmental Science and Technology, 27, 565-568.
Kietlińska, A., and Renman G. (2005). An evaluation of reactive filter media for treating
landfill leachate, Chemosphere, 61, 933-940.
Kim, H., Seagren, E. A., and Davis A. P. (2000) Engineering Bioretention for Removal
of Nitrate from Stormwater Runoff, in WEFTEC 2000 Conference Proceedings
on CDROM Research Symposium, Nitrogen Removal, Session 19, Anaheim CA,
Oct. 2000.
Korkusuz, E. A., Beklioglu, M., and Demirer, G. N. (2007). Use of blast furnace
granulated slag as a substrate in vertical flow reed beds: field application,
Bioresourse Technology, 98, 2089-2101.
Lazaridis, N. K. (2003). Sorption removal of anions and cations in single batch systems
by uncalcined and calcined Mg-Al-Co3 hydrocalcite, Water, Air and Soil
Pollution, 146, 127-139.
48

Li, Z. (2003). Use of surfactant-modified zeolite as fertilizer carriers to control nitrate
release, Micro porous and Mesoporous Materials, 61(1), 181-188.
Lisi, R. D., Park, J. K., and Stier, J. C. (2004). Mitigation nutrient leaching with a sub-
surface drainage layer of granulated tires, Waste Management, 24, 831-839.
Livingston, E., (2008). TMDL Project list construction cost and removal data, FDEP file
records, Tallahassee, Florida, June.
Moberg, M., (2008). The Effectiveness of Specifically Designed Filter Media to Reduce
Nitrate and Orthophosphate in Stormwater Runoff, MS Thesis, UCF, Orlando.
Mothersill, C. L., Anderson, B. C., Watt, W. E., and Marsalek, J. (2000). Biological
filtration of stormwater: field operations and maintenance experiences. Water
Quality Research Journal Canada, 35(3), 541-562.
Namasivayam, C., Sakoda, A., and Suzuki, M. (2005). Removal of phosphate by
adsorption onto oyster shell powder-kinetic studies, Journal of Chemical
Technology and Biotechnology, 80, 356-358.
Peterjohn, W. T., Adams, M. B., and Gilliam, F. S. (1996). Symptoms of nitrogen
saturation in two central Appalachian hardwood forest ecosystems.
Biogeochemistry, 35, 507-522.
Phelps, G. G. (2004). Chemistry of ground water in the Silver Springs basin, Florida,
with emphasis on nitrate: U.S. Geological Survey Scientific Investigations Report
2006-1107, 51 p.
Phelps, G. G., Walsh, S. J., Gerwig, R.M., and Tate, W. B. (2006). Characterization of
the Hydrology, Water Chemistry, and Aquatic Communities of Selected Springs
in the St. Johns River Water Management District, Florida, 2004: U.S. Geological
Survey Scientific Investigations Report 2004-5144, 54 p.
Ray, A. B., Selvakumar, A., and Tafuri, A. N. (2006). Removal of selected pollutants
from aqueous media by hardwood mulch, Journal of Hazardous Materials, B136,
213-218.
Richman, M. (1997). Compost media capture pollutants from stormwater runoff, Water
Environment & Technology, 9, 21-22.
Rebco II (2007). www.perlite.net, accessed in June, 2007.
49
Rocca, C.D., Belgiorno, V., and Meric, S. (2005). Cotton-supported heterotrophic
denitrification of nitrate-rich drinking water with a sand filtration post-treatment,
Water South Africa, 31(2), 229-236.
Savage A. J. and Tyrrel, S. F. (2005). Compost liquor bioremediation using waste
materials as biofiltration media, Bioresource Technology, 96, 557-564.
Sawyer, C. N., McCarty, P. L. and Parkin, G. F. (2003). Chemistry for environmental
engineering and science, 5th edition, McGraw Hill Publishing, New York, pp-663.
Schipper, L. A., Barkle, G. F. and Vukovic, M. V. (2005). Maximum rates of nitrate
removal in a denitrification wall, Journal of Environmental Quality, 1270-1276.
Seelsaen, N., McLaughlan, R., Moore, S., Ball, J., and Stuetz, R. (2006). Pollutants
removal efficiency of alternative filtration media in stormwater treatment, Water
Science & Technology, 54(6-7), 299-305.
Sengupta, S. and Ergas, S. J. (2006). Autotrophic biological denitrification with
elemental sulfur or hydrogen for complete removal of nitrate-nitrogen from a
septic system wastewater, a report submitted to The NOAA/UNH cooperative
institute for costal and estuarine environmental technology (CICEET).
Shin, H. S., Yoo, K. S. and Park, J. K. (1999). Removal of polychlorinated phenols in
sequential anaerobic-aerobic biofilm reactors packed with tire chips, Water
Environment Research, 71(3), 363-367.
St. Johns River Water Management District (SJRWMD) (2008). Springs of the St. Johns
River Water Management District, [cited March 2008]
http://www.sjrwmd.com/springs/index.html
Tshabalala, M. A. (2002). Use of Lignocelluloses materials as sorbents for pesticide and
phosphate residues, USDA Forest Division, Madison, WI 53705-2398.
Tesoriero, A. J., Liebscher, H., and Cox, S. E. (2000). Mechanism and rate of
denitrification in an agricultural water sheds: electron and mass balance along
groundwater flow paths, Water Resources Research, 36(6), 1545-1559.
Urbonas, B. and Stahre, P. (1993). Stormwater: Best Management Practices and
Detentions for Water Quality, Drainage, and CSO Management. Prentice Hall,
Englewood Cliffs, NJ.
50

51
United States Environmental Protection Agency (USEPA) (1988), Design manual-
constructed wetlands and aquatic plant systems for municipal wastewater
treatment, EPA/525/1-88/022, US Environmental Protection Agency, Center for
Environmental Research Information, Cincinnati, OH, USA.
United States Environmental Protection Agency (USEPA) (1993). Nitrogen control
manual, EPA-625/R-93-010, Office of Research and Development, U.S.
Environmental Protection Agency, Washington, D.C., USA.
United States Environmental Protection Agency (USEPA) (1999). Stormwater Treatment
at Critical Areas Evaluation of Filtration Media. EPA 600/R-00/010, Office of
Research and Development, U.S. Environmental Protection Agency, Washington,
D.C., USA.
Urbonas, B. and Stahre, P. (1993). Stormwater: Best Management Practices and
Detentions for Water Quality, Drainage, and CSO Management. Prentice Hall,
Englewood Cliffs, NJ, USA.
Volokita, M., Belkin, S., Abeliovich, A., and Soares, M. I. M., (1996), Biological
denitrification of drinking water using newspaper, Water Res., 30(4), 965-971.
Vitousek, P. M., Aber, J., Howarth, R. W., Likens, G. E., Matson, P. A., Schindler, D.
W., Schlesinger, W. H., and Tilman, G. D. (1997). Human alteration of the global
nitrogen cycle: causes and consequences. Ecology, 1, 1-16.
Water Environment Federation; American Society of Civil Engineers; Environmental and
Water Resource Institution (WEF, 2005), Biological nutrient removal (BNR)
operation in wastewater treatment plants, Manual of practice no. 30, WEF press
and McGraw Hill, USA.
Wanielista, M. (2008). Feasibility Study of Waste Tire Use in Pollution Control for
Stormwater Management and Water Conservation in Florida. Final Report,
University of Central Florida, August 2008.
Zhang, T. C. (2002). Nitrate removal in sulfur: limestone pond reactor, Journal of
Environmental Engineering, ASCE, 128(1), 73-84.