Alternative South African mid-year estimates, 2013 · The purpose of this exercise was not to...
31
Centre for Actuarial Research (CARe) A Research Unit of the University of Cape Town Alternative South African mid-year estimates, 2013 Rob Dorrington Centre for Actuarial Research University of Cape Town CARe Monograph No. 13
Transcript of Alternative South African mid-year estimates, 2013 · The purpose of this exercise was not to...

Centre for Actuarial Research
(CARe)
A Research Unit of the University of Cape Town
Alternative South African mid-year
estimates, 2013
Rob Dorrington
Centre for Actuarial Research
University of Cape Town
CARe Monograph No. 13

ii Alternative mid-year estimates, 2013
ISBN: 978-0-7992-2501-3 © 2013 Rob Dorrington
Centre for Actuarial Research
University of Cape Town Private Bag
7701 Rondebosch
SOUTH AFRICA
+27 (0)21 650 2475 (T) +27 (0)21 689 7580 (F)
Suggested citation: Dorrington R. E. (2013) Alternative South African mid-
year estimates, 2013. Centre for Actuarial Research Monograph 13, University of Cape Town.
Available from: www.commerce.uct.ac.za/Research_Units/CARE/Monographs/Monographs/mono13.pdf

Alternative mid-year estimates, 2013 i
Centre for Actuarial Research
(CARe) A Research Unit of the University of Cape Town
Alternative South African mid-year
estimates, 2013
Rob Dorrington
Centre for Actuarial Research
University of Cape Town
CARe Monograph No. 13

ii Alternative mid-year estimates, 2013

Alternative mid-year estimates, 2013 iii
Summary
The 2013 series of mid-year estimates (OffMYE) of the population of South Africa released by
Stats SA in May 2013 have, as is shown in the figure below, an age-distribution that is very
different from that of the 2011 Census, particularly for ages under 40. Despite Stats SA’s
assurances that “neither source is more right than the other; (because) they serve different
purposes” there is concern in many quarters about the consequences of estimating and planning
on the basis of an incorrect age distribution. Thus it was decided to produce an alternative set of
mid-year estimates (AltMYE) that are similar in magnitude to the official mid-year estimates but
maintain an age distribution that is consistent with that of the 2011 Census to allow users to
check if the alternative age distribution has a significant impact on their estimates or
interpretation of trends over time.
0
1,000,000
2,000,000
3,000,000
4,000,000
5,000,000
6,000,000
0–
4
5–
9
10
–1
4
15
–1
9
20
–2
4
25
–2
9
30
–3
4
35
–3
9
40
–4
4
45
–4
9
50
–5
4
55
–5
9
60
–6
4
65
–6
9
70
–7
4
75
–7
9
80
+
OffMYE
2011 census
The alternative mid-year estimates were essentially produced by simply projecting the 2011
Census numbers annually backwards to 2001 and forwards to 2013 taking into account
immigration and the migration between provinces as recorded in the 2011 census. Emigration of
South African-born Whites was set such that the net migration for the population group was the
same as that assumed in the official mid-year estimates and fertility rates for 2012 and 2013 were
assumed to be the same as those implied by the 2011 Census numbers under age 1.
Not only do these alternative mid-year estimates have an age distribution that is
consistent with that of the 2011 census but for the country as a whole and for the African,
Coloured and Indian population groups this age distribution is remarkably consistent also with
that of the 2001 Census (except for ages below 15), as is shown for the country as a whole in the
figure below. This is not the case for the official mid-year estimates.

iv Alternative mid-year estimates, 2013
0
200,000
400,000
600,000
800,000
1,000,000
1,200,000
0 6
12
18
24
30
36
42
48
54
60
66
72
78
84
90
+
AltMYE
2001 census
OffMYE
In the case of the White population group both sets of mid-year estimates suggest that the 2011
Census overestimates the size of this population group relative to the estimate from the 2001
Census. This contradiction between the two censuses will need further investigation before one is
able to decide which, if either is correct.
In the case of provincial estimates the back-projected alternative mid-year estimates
correspond closely (with the exception of a general undercount of numbers under age 5) for four
provinces (Free State, North West, Limpopo, and KwaZulu-Natal) and for three other provinces
(Mpumalanaga, Western Cape and Northern Cape) the age distributions are similar, with the
back-projected numbers being slightly higher throughout than the 2001 Census numbers.
However, for Gauteng and Eastern Cape there are significant differences in the age distribution
below age 20 that need further investigation to decide which, if either, of the censuses is correct.
The purpose of this exercise was not to produce the best estimates of the
population, but rather to produce an alternative set of estimates of the mid-year populations
which, in common with the official mid-year estimates, aggregate to the same total numbers (by
sex, population group and province) as the 2011 Census (allowing for population growth
between the middle of the year and the reference date of the census), but in addition accept the
age distribution of the population as estimated by the census.
While there are a number of issues that need further investigation before one is able to
decide on the best estimate of the population of South Africa by population group and province,
the age distribution of the alternative mid-year estimates are consistent with both the 2001 and
2011 Censuses. Thus it is recommended that these estimates be used in preference to the official
estimates, or, at the very least, calculations and planning be performed using both to assess the
effect of the alternative age distributions.

Alternative mid-year estimates, 2013 v
Authors’ Note
Boboh Kamangira assisted with the preparation of the provincial reconstructions and rebalanced
the provincial estimates to ensure that they summed to the national estimates by sex, population
group and age. Thanks also go to the reviewers for their helpful suggestions. However, all errors
are the responsibility of the author.
Rob Dorrington
Cape Town, October 2013

vi Alternative mid-year estimates, 2013

Alternative mid-year estimates, 2013 vii
Table of Contents
1 Introduction ............................................................................................................................. 9
2 Illustration of the problem .................................................................................................. 10
3 Method ................................................................................................................................... 12
3.1 Mortality ................................................................................................................................. 13
3.2 Fertility .................................................................................................................................... 13
3.3 Migration ................................................................................................................................ 13
4 Results ..................................................................................................................................... 15
4.1 Assessment of the age distribution of the alternative mid-year estimates .................... 15
5 Conclusion ............................................................................................................................. 23
Appendix 1: Comparison of assumptions underlying the alternative and official mid-year estimates ................................................................................................................................. 25
Appendix 2: Comparison of official mid-year estimates for 2011 with the 2011 Census ............... 26
Appendix 3: Comparison of assumptions underlying the alternative mid-year estimates with 2001 Census ........................................................................................................................... 28
List of Tables
Table 1 Mid-year population estimate by population group, age and sex, 2013 ........................ 18
Table 2 Provincial population estimates by age and sex, 2013 ..................................................... 19
Table 3 Comparison of Alternative mid-year estimate and Official mid-year estimate indicators of fertility and mortality ..................................................................................... 25
Table 4 International migration assumptions for the period 1 July 2001 to 30 June 2016 ...... 25
List of Figures
Figure 1 Comparison of the numbers by age group for 2011 from the 2013 official mid-year estimates and the 2011 Census ................................................................................... 10
Figure 2 Comparison of the numbers by age group for 2011 from the 2013 official mid-year estimates and the 2011 Census: Gauteng .................................................................. 11

viii Alternative mid-year estimates, 2013
Figure 3 Comparison of the numbers by age group for 2011 from the 2013 official mid-year estimates and the 2011 Census: Whites ..................................................................... 11
Figure 4 Comparison of the 2011 census back-projected to the 2001 Census for the African population aged over 60 at the time of the 2011 Census ................................. 12
Figure 5 Mid-year populations back-projected to 2001 vs 2001 Census, national population .............................................................................................................................. 15
Figure 6 Mid-year populations back-projected to 2001 vs 2001 Census, White population .............................................................................................................................. 17
Figure 7 Alternative 2013 mid-year population back-projected to 2001 vs 2001 Census, Gauteng .................................................................................................................................. 21
Figure 8 Alternative 2013 mid-year population back-projected to 2001 vs 2001 Census, Eastern Cape .......................................................................................................................... 22
Figure 9 Alternative 2013 mid-year population back-projected to 2001 vs 2001 Census, Mpumalanga Coloureds ....................................................................................................... 22
Figure 10 Comparison of the numbers by age group for 2011 from the 2013 official mid-year estimates and the 2011 Census by population group .............................................. 26
Figure 11 Comparison of the numbers by age group for 2011 from the 2013 official mid-year estimates and the 2011 Census by province ............................................................. 27
Figure 12 Alternative 2013 mid-year population back-projected to 2001 vs 2001 Census by population group ............................................................................................................. 28
Figure 13 Alternative 2013 mid-year population back-projected to 2001 vs 2001 Census by province ............................................................................................................................ 29

Alternative mid-year estimates, 2013 9
1 Introduction
In May 2013 Statistics South Africa (Stats SA) released the 2013 mid-year estimates after an hiatus which saw no estimates released in 2012, pending the release of the 2011 census results (Statistics South Africa 2013). Although Stats SA do release, from time to time, a note briefly describing the methods used to produce the estimates, the most recent being 2011 (Statistics South Africa 2011), there still remains some uncertainty about how their numbers are arrived at, apart from the fact that new projections are produced each year using the Spectrum projection
model1 from a base population in 1985. Their versions of the models are not made public. While Stats SA constrained the estimates to ensure that the aggregate mid-2011
population estimates, (nationally, by sex and population group, and by sex and province) matched those from the 2011 Census (allowing for population growth between the date of the census and the middle of the year), no effort appears to have been made to ensure that the distribution of the numbers by age correspond with that of the census. Although there may well be good reason not to match exactly the census numbers by age, perhaps significantly for some ages, where there is reason to suspect an error in the census (e.g. an undercount of the young children, or age exaggeration at the extreme ages) or maybe small differences due to smoothing of age misstatements such as digit preferences, the differences between the published mid-year estimates for 2011 and the census age distribution tend to be much more extensive than this.
The age distribution of those under age 30 revealed in the 2011 Census was quite different from that expected based on projections from the previous censuses. Despite Stats SA’s assertion that “neither source is more right than the other; (because) they serve different purposes” (Press Statement, 17 July 2013), these differences have the potential to confuse, researchers, demographers and planners as to which numbers to use for planning, monitoring, and weighting data from surveys. For this reason, we have decided to produce an alternative set of mid-year estimates (AltMYE) with an age distribution that is consistent with that of the 2011 Census. However, although there is mounting evidence that the age distribution of the census is probably closer to the truth than that of the official mid-year estimates (OffMYE), the indefinite delay in the release of the 10% unit record sample from the census means that the census has yet to be fully evaluated, and so the alternative mid-year estimates do not represent the best estimates of the population. They are merely mid-year estimates with an age distribution that is consistent with that of the 2011 Census (and as will be shown, also largely consistent with the age distribution of the 2001 Census).
1 Maintained by the Futures Institute (www.futuresinstitute.org).

10 Alternative mid-year estimates, 2013
2 Illustration of the problem
There are considerable differences between the age distributions of the 2011 Census and the official mid-year estimates for 2011 from the projections used to produce the 2013 official mid-year population estimates. Figure 1 compares the estimates, in five-year age groups, of the population in the middle of 2011 produced by the projection model used to produce the 2013
official mid-year estimates2 to those from the 2011 Census (Statistics South Africa 2012). The inconsistency under age 40 (and even more so under age 30) is plain to see. The differences at ages under 15 imply a very different annual fertility over the past 15 years than allowed for in the projection used to produce the official mid-year population estimates, while the difference between ages 20 and 30 reflects much higher immigration than has been allowed for in the projection model (while the opposite is the case between ages 30 and 40). However, the excess over age 80 in the census, or at least a large part of it, may well be an error due to age exaggeration in the census, and not an error in the official mid-year estimates. Not only do such differences in numbers have implications for planning for the provision of things such as the number of classrooms and teachers, but they also impact on the estimates of rates, such as rates of mortality, child immunisation coverage, estimating the completeness of official registration of births and deaths, and the weighting of data from surveys.
0
1,000,000
2,000,000
3,000,000
4,000,000
5,000,000
6,000,000
0–
4
5–
9
10
–1
4
15
–1
9
20
–2
4
25
–2
9
30
–3
4
35
–3
9
40
–4
4
45
–4
9
50
–5
4
55
–5
9
60
–6
4
65
–6
9
70
–7
4
75
–7
9
80
+
OffMYE
2011 census
Figure 1 Comparison of the numbers by age group for 2011 from the 2013 official mid-year estimates and the 2011 Census
2 As published in the “Country projection by population group, sex and age (2002-2013).xlsx” downloaded from http://www.statssa.gov.za/Publications/P0302/Country projection by population group, sex and age (2002-2013).zip on 14 August 2013.

Alternative mid-year estimates, 2013 11
The deviations are even more marked for some of the provinces3, such as Gauteng, as shown in Figure 2, and some population groups, such as the White population, as shown in Figure 3. (Other comparisons are shown in Figure 10 and Figure 11 in Appendix 2.)
0
200,000
400,000
600,000
800,000
1,000,000
1,200,000
1,400,000
1,600,0000
–4
5–
9
10
–1
4
15
–1
9
20
–2
4
25
–2
9
30
–3
4
35
–3
9
40
–4
4
45
–4
9
50
–5
4
55
–5
9
60
–6
4
65
–6
9
70
–7
4
75
–7
9
80
+
OffMYE
2011 census
Figure 2 Comparison of the numbers by age group for 2011 from the 2013 official mid-year estimates and the 2011 Census: Gauteng
0
50,000
100,000
150,000
200,000
250,000
300,000
350,000
400,000
0–
4
5–
9
10
–1
4
15
–1
9
20
–2
4
25
–2
9
30
–3
4
35
–3
9
40
–4
4
45
–4
9
50
–5
4
55
–5
9
60
–6
4
65
–6
9
70
–7
4
75
–7
9
80
+
OffMYE
2011 census
Figure 3 Comparison of the numbers by age group for 2011 from the 2013 official mid-year estimates and the 2011 Census: Whites
3 As published in the “Provincial projection by sex and age (2002-2013).xlsx” downloaded from http://www.statssa.gov.za/Publications/P0302/Provincial projection by sex and age (2002-2013).zip on 14 August 2013.

12 Alternative mid-year estimates, 2013
3 Method
As it is not the purpose of this exercise to produce the best estimate of the population for the years 2001 to 2013, but instead to produce an alternative to the official mid-year population estimates we start by assuming, as Stats SA did, that the 2011 Census estimates are correct in total for the population as a whole, and in total for each sex and population group combination. For the provinces we assume that the census estimates are correct in total for each sex in each province. However, in addition, in contrast to Stats SA, we assume that the census population estimates by five-year age groups within each of the above categories are correct. In actual fact, since we are concerned with producing estimates in single-year time intervals and wish to avoid having to make additional assumptions when applying age-specific rates to five-yearly age intervals, we worked with numbers by single ages and then aggregated the estimates into five-year age intervals. Some minor adjustments were made to the 2011 census data so that it is in a form compatible with mid-year projections by population groups. First, in order to confine ourselves to four population groups, those in the “Other” population group (about 0.5% of the total census population) were aggregated with the African population group. The effect of this assumption is immaterial. Second, the numbers by single age were adjusted to reflect estimates of the population as at the middle of the year (i.e. 0.277 years prior to the census) by multiplying by
xr
e277.0− , where
xr is the continuously compounding average annual rate of growth of the
population aged x between the 2001 and 2011 censuses. Initial attempts to reconstruct the past mid-year estimates suggested that, as is shown in
Figure 4 for the African population, the 2011 Census overestimated (possibly due to age exaggeration by respondents to the census questions) the population at the older ages. This was noticeable in the case of the African population. The 2011 mid-year population estimate was therefore corrected for this. This was done by estimating, for each population group, the numbers in the mid-year population aged 70 and older by redistributing the total aged 70 and older to individual ages in proportion to the age distribution of the number of survivors aged 70 and older expected from a projection of the 2001 Census population to 2011.
0
50,000
100,000
150,000
200,000
250,000
300,000
60 62 64 66 68 70 72 74 76 78 80 82 84 86 88 90+
AltMYE
2001 census
Figure 4 Comparison of the 2011 census back-projected to the 2001 Census for the African population aged over 60 at the time of the 2011 Census

Alternative mid-year estimates, 2013 13
In order to project these numbers forward to produce mid-year estimates for 2012 and 2013, and backward to produce mid-year estimates for 2001 to 2010, one needs estimates of mortality (in the form of proportions in each age surviving each year), fertility and migration. These were estimated as follows.
3.1 Mortality Although a case could be made for their accuracy, it is also convenient to use survival factors based on the estimates of mortality from the ASSA2008 full model, which allows us to produce separate factors for each population group and sex. By way of comparison, the IMR, under-five mortality rate (U5MR) and life expectancy at birth for the 12 months prior to mid-year 2011 are: 34 per 1,000, 50 per 1,000 and 58 years; while those of the basis underlying the official mid-year estimates are: 45 per 1 000, 63 per 1,000 and 58 years. However, it should be pointed out that the IMR and U5MR underlying the official mid-year estimates are certainly too high – significantly higher than rates being estimated by any other reputable source (Bradshaw, Dorrington and Laubscher 2012; UNCEF 2012; United Nations 2013; Wang, Dwyer-Lindgren, Lofgren et al. 2012). Comparison of the IMR, U5MR and life expectancy at birth for all years from 2002 to 2013 underlying the two sets of estimates are presented in Table 3 in Appendix 1. It is important to stress that over such short periods of projection differences in assumptions about mortality are not particularly material when it comes to estimating the size of
the population4.
3.2 Fertility Since fertility rates only impact on the estimates of the numbers aged 0 in 2012 and 0 and 1 in 2013, errors in the estimated fertility rates also do not have a big impact on the mid-year estimates of those under age five in these two years, and they have no impact on the rest of the age groups. Thus for the purposes of this exercise we assumed, for each population group, that the fertility rates for 2012 and 2013 were the same as those implied by a back-projection of the locally-born survivors in the 2011 Census (i.e. the number of locally-born births that there would have to have been in the year before the census to have produced the number of survivors under
age 1 counted in the 2011 Census)5. This assumes that the 2011 Census estimates of the population aged under age 1 are an accurate reflection of the number of surviving births but as already pointed out, errors will have minimal impact.
The total fertility rate (TFR) for the year preceding the 2011 mid-year estimate is 2.60, compared with 2.44 underlying the official mid-year estimates. Comparison of the number of births for all years from 2002 to 2013 corresponding to the 2011 Census age distribution is presented in Table 3 in Appendix 1. A similar approach was employed for the provincial projections.
3.3 Migration Immigration of those born outside the country between two censuses was determined by differencing the numbers of foreign-born people identified in the two censuses and the Community Survey. Specifically the number of foreign-born people counted at the first census who are expected to have survived to the second census deducted from the number alive at the
4 For example, if the mortality rate is 0.001 then the probability of survival is 0.999, and the impact of even a 100% error in the estimate of mortality would change the estimate in projected population by less than 0.1%. 5 Since age-specific fertility rates remain a matter of some debate until the 10% sample unit record data are released by Stats SA, the number of births were estimated to be the number estimated to have occurred in the year prior to the census scaled by the ratio of number of women aged 15-49 in year in question to the number aged 15-49 in the census (i.e. the ratio of the child to women ratios).

14 Alternative mid-year estimates, 2013
second census give the number of surviving immigrants (less any immigrants who left during the period). To get the number who moved during the period we adjusted the number of survivors by adding back and estimate of the number of migrants who died since moving to the country. In order to get numbers by age and single year during the period, we worked with cohorts in five-year age intervals from two pairs of estimates of the number of foreign-born in the population, namely the 2001 Census and the 2007 Community Survey, and the 2007 Community Survey and the 2011 Census. For the purpose of this exercise annual numbers were derived by dividing the numbers of migrants in each inter-survey period by 5. Finally, numbers by single age were derived by disaggregating the numbers in five-yearly age groups using Beers’ six-parameter disaggregation coefficients (Beers 1945; Siegel and Swanson 2004). The numbers of immigrants for 2011/12 and 2012/13 were assumed to be the same as the annual average for the five-year period prior to the 2011 Census. The numbers of immigrants were estimated for each of the population groups separately. Estimating the number of people who have left the country is more problematic. Technically, if the censuses estimated the number of native-born population accurately one could apply the same approach to that used to estimate the number of immigrants (net of out-movement of immigrants). However, censuses are almost never sufficiently accurate to estimate the number of native-born emigrants, which are usually small in comparison to the errors in the count of the census population. This is the case in South Africa, particularly for the White population, which is assumed to be the source of most emigration. For the purposes of this exercise, because there is much uncertainty as to the level of emigration from South Africa and to avoid this being a focus of comparisons between the alternative mid-year estimates and official mid-year estimates, it was decided to assume that all South African-born emigrants were from the White population and to set the numbers of South African-born emigrants such that the total change in population for the periods 5-10 years and 0-5 years before mid-year 2011 equalled the net-number of numbers of White emigrants assumed in the official mid-year estimates for the periods labelled 2001-2005 and 2005-2010
(namely 133 800 and 112 000)6. Numbers of South African-born emigrants by five-year age groups were estimated from the totals using the age distribution of South African-born immigrants estimated from the change in numbers of South African-born by age group counted in the Australian censuses7. Comparison of the total number of immigrants net of emigrants assumed by the two sets of mid-year estimates for the two periods, the years ending on 30 June 2002-2006 and the years ending 30 June 2006-2011, are presented in Table 4 in Appendix 1.
The numbers of in-migrants from one province to another were estimated in a similar way to international immigration using the estimates of the numbers by province of birth8. The numbers of immigrants were included, and the numbers of emigrants allowed for by apportioning the numbers of South African-born emigrants to the provinces according to the proportion of the White population living in the provinces in the respective periods interpolated from the 2001 and 2011 Census numbers.
6 The implied number of South African-born emigrants were thus 195 200 and 105 700 for the two periods, respectively. However, it should be noted that numbers are below estimates from some sources such as the OECD and World Bank. 7 Provided by the Australian Bureau of Statistics for 2001, 2006 and 2011.
8 For the purposes of this exercise the numbers with unspecified or unknown province of birth in the 2011 census were ignored.

Alternative mid-year estimates, 2013 15
4 Results
The alternative mid-year estimates for 2013 are presented in Table 1 and Table 2, and are provided for earlier years back to 2001 in the supplementary workbook9. Estimates, unsmoothed, for single years of age, can be provided upon request.
4.1 Assessment of the age distribution of the alternative mid-year estimates In order to assess the reasonableness of the age distribution of the alternative mid-year estimates as opposed to that of the official mid-year estimates, the age distribution of the back-projected estimates of the alternative and the official mid-year populations are compared to that of the 2001 Census in Figure 5.
0
200,000
400,000
600,000
800,000
1,000,000
1,200,000
0 6
12
18
24
30
36
42
48
54
60
66
72
78
84
90
+
AltMYE
2001 census
OffMYE
Figure 5 Mid-year populations back-projected to 2001 vs 2001 Census, national population
The correspondence between the distribution of the population by age of the back-projected alternative mid-year estimate and the 2001 Census is quite remarkable. With the exception of a relatively small difference under age 15 the numbers in the population appear to match very closely even at individual ages (although the correspondence is exaggerated to some extent by the regular peaks at 31, 41, 51, through to 81, which undoubtedly reflect the consistency of year of birth digit preferences (for years 1980, 1970, etc.) for both censuses, rather than the reproduction of the true numbers in the population). To some extent the difference under age five probably reflects an undercount in this age group in the 2001 Census, but the cause of the differences between ages 5 and 14 is unclear at this stage. Less noticeable is the fact that the back-projected alternative mid-year estimate for ages 35+ exceeds the census population by nearly 500,000, which, together with the overestimate under age 15 suggests an incompatibility between the two censuses: either an overestimation in 2011 or an underestimation in 2001 (or some combination of both).
9 http://www.commerce.uct.ac.za/Research_Units/CARE/Monographs/Monographs/Alternative mid-year estimates 2001 to 2013.xlsx

16 Alternative mid-year estimates, 2013
In contrast, the estimated numbers produced by projecting the 2013 official mid-year estimate of the 2002 population backwards by one year (i.e. to mid-2001, since Stats SA’s revised series of estimates extend back only to 2002) has a very different age distribution from the 2001 Census10 (the black dotted line in Figure 5). While one can ignore differences due to smoothing that inevitably results from disaggregating numbers in five-year age groups into individual ages, the distortion in the age distribution below age 30 is clearly not supported. Thus the age distribution of the official mid-year estimated does not seem to be supported by either census. Less clear from the figure, though, is that an overall excess in numbers below 30 of the official estimates over the census is to some extent counterbalanced (since the total is set to match that of the 2011 Census) by an underestimation of the population for ages 35+ of nearly 750,000.
Despite the differences in numbers, there is clearly more support for the age distribution of the alternative mid-year estimate than for that of the official mid-year estimate. While the strong correspondence of the age distribution found nationally is replicated to a large extent in the African, Coloured and Indian population groups (with the exception that the difference under age 15 is relatively more marked for the smaller the population groups), it is not to the same extent in the White population group. As can be seen from Figure 6, although there appears to be a general correspondence in the age distribution (with the strange exception of ages around 10 to 1911) there is a marked difference between the levels of the alternative mid-year estimate and the 2001 census population suggesting that either the 2001 Census undercounted the population, or the 2011 Census over-counted the population or (quite unlikely) that there was significantly more immigration or less emigration12 than has been allowed for in the back projection (or a combination of these). Further research is needed to decide the extent to which these possible explanations apply.
However, for the purpose of this exercise the comparison shows, once again, that the age distributions of the alternative mid-year estimates, although possibly not ideal, is more sensible than those of the official mid-year estimates.
10 Numbers by single age were derived by disaggregating the numbers in five-year age groups using the Sprague
multipliers as recommended and provided by Stats SA. 11 These people would have been aged 20-29 in 2011. Thus a possible explanation is that crude method used to
estimate the number of emigrants fails to capture youth who have left the country. This requires further investigation. 12 Although even assuming there was not emigration of the South African-born population over the 10 years would
not completely account for the difference between the two censuses.

Alternative mid-year estimates, 2013 17
0
10,000
20,000
30,000
40,000
50,000
60,000
70,000
80,000
90,000
0 6
12
18
24
30
36
42
48
54
60
66
72
78
84
90
+
AltMYE
2001 census
OffMYE
Figure 6 Mid-year populations back-projected to 2001 vs 2001 Census, White population

18 Alternative mid-year estimates, 2013
Table 1 Mid-year population estimate by population group, age and sex, 2013
African Coloured Indian/Asian White South Africa
Age Male Female Total Male Female Total Male Female Total Male Female Total Male Female Total
0-4 2,460,661 2,436,894 4,897,555 236,199 231,186 467,385 46,413 44,899 91,311 136,714 130,516 267,230 2,879,987 2,843,494 5,723,481
5-9 2,245,188 2,218,948 4,464,136 225,504 219,938 445,442 43,805 42,349 86,153 129,806 121,975 251,780 2,644,303 2,603,209 5,247,511
10-14 1,910,551 1,876,958 3,787,510 209,384 204,784 414,169 42,702 41,012 83,714 127,275 118,377 245,652 2,289,912 2,241,132 4,531,044
15-19 2,050,821 2,015,180 4,066,001 213,637 208,396 422,033 48,887 46,077 94,964 139,147 131,622 270,769 2,452,492 2,401,275 4,853,767
20-24 2,270,334 2,251,151 4,521,484 217,573 221,523 439,096 60,717 53,694 114,411 154,056 151,317 305,373 2,702,679 2,677,685 5,380,364
25-29 2,179,445 2,148,978 4,328,423 193,750 202,642 396,392 68,071 56,513 124,584 158,022 160,847 318,869 2,599,288 2,568,980 5,168,268
30-34 1,839,992 1,775,809 3,615,801 173,022 183,288 356,310 65,600 55,269 120,869 162,235 164,932 327,167 2,240,849 2,179,299 4,420,147
35-39 1,381,281 1,391,267 2,772,548 145,338 157,589 302,927 56,401 52,024 108,425 157,222 162,537 319,759 1,740,242 1,763,418 3,503,660
40-44 1,105,110 1,201,007 2,306,117 152,368 170,946 323,313 51,466 50,283 101,749 171,701 179,696 351,398 1,480,645 1,601,933 3,082,578
45-49 847,558 1,035,342 1,882,900 134,593 156,737 291,330 41,935 44,406 86,341 154,033 165,636 319,669 1,178,119 1,402,121 2,580,241
50-54 724,373 922,371 1,646,744 118,780 141,236 260,016 36,863 41,165 78,028 153,677 165,465 319,143 1,033,694 1,270,237 2,303,930
55-59 562,656 718,788 1,281,444 88,575 107,939 196,514 30,376 35,624 66,000 141,991 154,832 296,823 823,598 1,017,183 1,840,781
60-64 433,809 578,885 1,012,695 64,407 82,294 146,701 25,196 30,924 56,119 124,648 140,036 264,684 648,061 832,138 1,480,199
65-69 259,695 389,269 648,964 42,125 56,159 98,285 18,671 23,085 41,757 110,253 126,124 236,377 430,745 594,638 1,025,383
70-74 195,594 342,169 537,763 24,788 36,909 61,698 11,271 15,471 26,742 79,808 97,161 176,969 311,461 491,710 803,172
75-79 104,728 222,678 327,406 14,735 25,089 39,824 6,021 9,468 15,489 51,225 70,419 121,643 176,708 327,654 504,362
80+ 87,405 256,547 343,952 12,203 24,674 36,878 4,688 8,409 13,097 47,443 87,021 134,465 151,740 376,652 528,392
Total 20,659,202 21,782,240 42,441,443 2,266,982 2,431,330 4,698,312 659,081 650,674 1,309,755 2,199,258 2,328,512 4,527,770 25,784,523 27,192,757 52,977,280
% of
national 80.1% 80.1% 80.1% 8.8% 8.9% 8.9% 2.6% 2.4% 2.5% 8.5% 8.6% 8.5%

Alternative mid-year estimates, 2013 19
Table 2 Provincial population estimates by age and sex, 2013
Eastern Cape Free State Gauteng KwaZulu-Natal Limpopo
Age Male Female Total Male Female Total Male Female Total Male Female Total Male Female Total
0-4 363,614 357,762 721,376 142,703 144,885 287,587 638,999 633,821 1,272,821 590,839 585,828 1,176,667 348,218 345,113 693,332
5-9 397,711 387,622 785,333 140,507 139,394 279,901 498,263 494,397 992,660 567,607 556,933 1,124,540 332,700 329,707 662,407
10-14 334,305 321,272 655,578 121,477 119,780 241,257 415,119 414,722 829,842 506,633 494,113 1,000,746 292,504 282,068 574,573
15-19 365,676 347,025 712,702 124,060 122,172 246,233 462,790 464,335 927,125 543,713 538,083 1,081,796 311,737 297,806 609,543
20-24 315,918 313,928 629,846 139,050 136,457 275,507 694,227 679,043 1,373,270 537,323 556,724 1,094,047 289,597 280,991 570,588
25-29 240,787 258,408 499,195 124,855 122,174 247,029 800,682 733,007 1,533,688 485,749 514,797 1,000,546 223,011 247,845 470,857
30-34 199,952 223,027 422,979 110,110 107,333 217,442 727,627 631,706 1,359,334 391,617 414,290 805,907 175,600 206,859 382,459
35-39 161,416 194,003 355,419 84,399 90,035 174,434 561,528 491,095 1,052,623 294,305 320,679 614,983 139,312 178,460 317,772
40-44 145,990 192,601 338,591 73,374 87,765 161,139 452,999 417,425 870,424 242,999 285,387 528,386 118,394 157,367 275,761
45-49 126,249 179,208 305,456 62,340 78,107 140,447 337,062 347,253 684,315 186,856 251,919 438,775 99,850 143,994 243,844
50-54 121,782 176,565 298,346 56,562 69,737 126,300 283,244 301,493 584,736 165,114 233,697 398,810 85,615 128,924 214,539
55-59 104,417 146,277 250,694 44,812 58,515 103,327 216,786 237,462 454,248 134,372 188,446 322,818 69,694 98,381 168,075
60-64 88,479 126,212 214,690 34,258 48,222 82,480 154,037 178,431 332,469 117,010 167,799 284,809 59,671 81,848 141,519
65-69 61,236 89,511 150,747 23,214 34,776 57,989 99,160 121,186 220,346 74,878 113,737 188,614 39,285 67,754 107,038
70-74 49,535 85,670 135,205 16,368 26,542 42,910 64,008 87,679 151,687 53,574 98,628 152,202 35,112 60,671 95,782
75-79 27,461 53,338 80,799 8,854 18,017 26,871 35,870 57,442 93,312 29,056 62,271 91,327 20,966 47,022 67,988
80+ 23,995 62,589 86,584 7,383 21,224 28,608 31,855 63,430 95,285 23,044 70,644 93,688 17,962 60,879 78,842
Total 3,128,522 3,515,017 6,643,539 1,314,326 1,425,135 2,739,460 6,474,257 6,353,929 12,828,185 4,944,688 5,453,974 10,398,662 2,659,229 3,015,689 5,674,918
% of
national 12.1% 12.9% 12.5% 5.1% 5.2% 5.2% 25.1% 23.4% 24.2% 19.2% 20.1% 19.6% 10.3% 11.1% 10.7%

20 Alternative mid-year estimates, 2013
Mpumalanga Northern Cape North West Western Cape South Africa
Age Male Female Total Male Female Total Male Female Total Male Female Total Male Female Total
0-4 228,251 227,289 455,540 58,820 56,392 115,212 213,881 209,546 423,428 294,663 282,857 577,520 2,879,987 2,843,494 5,723,481
5-9 208,335 207,530 415,865 55,512 53,703 109,216 192,927 189,229 382,155 250,740 244,694 495,433 2,644,303 2,603,209 5,247,511
10-14 184,991 184,247 369,238 51,332 49,451 100,783 165,121 157,375 322,496 218,429 218,104 436,532 2,289,912 2,241,132 4,531,044
15-19 195,886 193,625 389,511 50,472 47,897 98,369 166,811 156,070 322,880 231,347 234,263 465,610 2,452,492 2,401,275 4,853,767
20-24 206,527 200,209 406,736 49,810 48,266 98,076 183,723 170,692 354,415 286,503 291,376 577,879 2,702,679 2,677,685 5,380,364
25-29 196,696 191,193 387,889 48,046 45,750 93,796 177,736 160,934 338,670 301,726 294,872 596,598 2,599,288 2,568,980 5,168,268
30-34 163,097 157,500 320,597 45,173 42,547 87,720 158,314 141,628 299,942 269,358 254,408 523,766 2,240,849 2,179,299 4,420,147
35-39 122,040 125,052 247,092 36,182 35,581 71,763 125,923 117,032 242,956 215,138 211,479 426,618 1,740,242 1,763,418 3,503,660
40-44 105,173 115,532 220,705 33,739 35,029 68,768 108,695 105,646 214,341 199,280 205,182 404,463 1,480,645 1,601,933 3,082,578
45-49 85,669 100,785 186,455 28,053 30,367 58,420 89,026 91,523 180,549 163,015 178,965 341,980 1,178,119 1,402,121 2,580,241
50-54 74,276 86,988 161,264 24,980 28,546 53,526 81,185 83,940 165,125 140,937 160,347 301,284 1,033,694 1,270,237 2,303,930
55-59 59,375 70,412 129,787 20,134 23,772 43,906 65,966 67,866 133,832 108,044 126,051 234,095 823,598 1,017,183 1,840,781
60-64 45,863 56,165 102,028 15,308 19,020 34,328 50,035 54,182 104,217 83,400 100,260 183,660 648,061 832,138 1,480,199
65-69 28,398 37,520 65,919 10,971 14,161 25,132 34,518 42,005 76,523 59,086 73,988 133,074 430,745 594,638 1,025,383
70-74 20,937 33,308 54,245 7,683 10,950 18,633 24,241 33,271 57,512 40,005 54,992 94,997 311,461 491,710 803,172
75-79 11,884 22,936 34,820 4,267 6,732 10,999 13,807 22,240 36,046 24,543 37,656 62,199 176,708 327,654 504,362
80+ 10,159 25,188 35,347 3,837 8,085 11,922 11,533 24,672 36,205 21,970 39,941 61,911 151,740 376,652 528,392
Total 1,947,558 2,035,478 3,983,036 544,319 556,251 1,100,570 1,863,442 1,827,849 3,691,291 2,908,183 3,009,435 5,917,618 25,784,523 27,192,757 52,977,280
% of
national
7.6% 7.5% 7.5% 2.1% 2.0% 2.1% 7.2% 6.7% 7.0% 11.3% 11.1% 11.2%

Alternative mid-year estimates, 2013 21
When it comes to comparing the provincial population numbers one needs to take into account the fact that the boundaries of seven of the provinces changed between 2001 and 2011. Unfortunately, Stats SA has yet to release a detailed redistribution of the 2001 Census numbers according to the 2011 provincial boundaries, providing only numbers in five year age groups according to “2005 boundaries”. Thus in order to allow for the changes (or at least most of them), the ratio of the numbers in five-year age groups according to the 2005 boundaries to those according to the 2001 boundaries were used to adjust the numbers in individual ages within each five-year age group. Although not entirely accurate, any errors are likely to be too small to distort the comparisons.
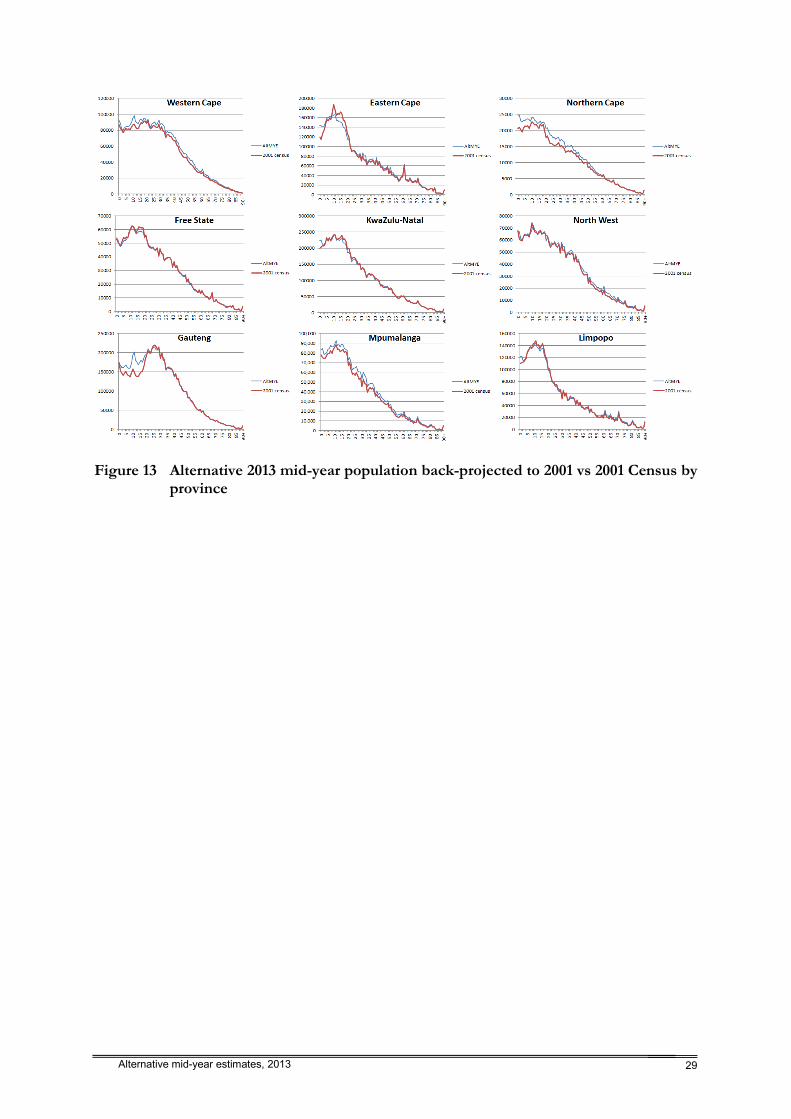
Comparison of the back-projected numbers to the 2001 Census for the provinces show that the numbers by age of the back-projected alternative mid-year estimate correspond closely (with the exception of a general undercount of numbers under age 5) for four provinces (Free State, North West, Limpopo, and KwaZulu-Natal) and for three other provinces (Mpumalanaga, Western Cape and Northern Cape) the age distribution is similar but the back-projected numbers are higher throughout than the 2001 census numbers. However, as is shown in Figure 7 and Figure 8 for the remaining two provinces (Gauteng and Eastern Cape) there are significant differences in the age distribution below age 20 that need further investigation in future to decide which, if either, of the censuses is correct.
0
50000
100000
150000
200000
250000
0 5
10
15
20
25
30
35
40
45
50
55
60
65
70
75
80
85
90
+
AltMYE
2001 census
Figure 7 Alternative 2013 mid-year population back-projected to 2001 vs 2001 Census, Gauteng

22 Alternative mid-year estimates, 2013
0
20000
40000
60000
80000
100000
120000
140000
160000
180000
200000
0 5
10
15
20
25
30
35
40
45
50
55
60
65
70
75
80
85
90
+
AltMYE
2001 census
Figure 8 Alternative 2013 mid-year population back-projected to 2001 vs 2001 Census, Eastern Cape
Apart from this, there are some noticeable differences in level for smaller populations such as Indians in the Northern and Eastern Cape, and Coloureds in Mpumalanga, etc. (see Figure 9 as an illustration). These differences are probably due mostly to efforts by Stats SA to correct the censuses for rather large undercounts using a post-enumeration survey which is too small to make adjustments at such low levels of detail. However, by and large these populations are small so the impact on the provincial estimates is negligible.
0
100
200
300
400
500
600
700
800
900
1,000
0 6
12
18
24
30
36
42
48
54
60
66
72
78
84
90
+
AltMYE
2001 census
Figure 9 Alternative 2013 mid-year population back-projected to 2001 vs 2001 Census, Mpumalanga Coloureds

Alternative mid-year estimates, 2013 23
5 Conclusion
To reiterate, the purpose of this exercise was not to produce the best estimates of the population, but rather to produce an alternative set of estimates of the mid-year populations which, in common with the official mid-year estimates, aggregate to the same total numbers (by sex, population group and province) as the 2011 Census (allowing for population growth between the middle of the year and the reference date of the census), but in addition accept the age distribution of the population as revealed by the census.
Evaluation of the results from this exercise indicates that this age distribution is almost entirely consistent with that from the 2001 Census, suggesting that, although not necessarily entirely accurate, it is probably more sensible than the one underlying the 2013 official mid-year estimates.
One of the major implications of the alternative mid-year estimates is that the annual number of births over the past 10 or so years is much closer to those implied by the 2011 Census than those underlying the official mid-year estimates (Stats SA 2013). A second implication is that the pattern (and possibly level) of international (and possibly internal) migration underlying the official mid-year estimates is wrong, in that it is not sufficiently concentrated in the 20-29 year age group, but appears to be excessive at older ages. A third implication is that the mortality assumptions underlying the official mid-year estimates appear to be inappropriate, in particular the IMR and U5MR, which not only exceed those underlying the alternative mid-year estimates, but exceed those of all other reputable researchers (e.g. IGME, UN Population Division and IHME). Finally, comparison of the 2011 Census population numbers with the numbers expected from projecting the 2001 Census numbers to 2011 allowing for international migration suggests that the 2011 Census overestimated the numbers aged 80 and older, particularly of the African population. For the purposes of producing the alternative mid-year estimates it was assumed that this was due to age exaggeration from age 70 and above.
While there are a number of issues that need further investigation before one is able to decide on the best estimate of the population of South Africa by population group and province, the age distribution of the alternative mid-year estimates are consistent with both the 2001 and 2011 Censuses. Thus it is recommended that these estimates be used in preference to the official estimates, or, at the very least, calculations and planning be performed using both sets of estimates to assess the effect of the alternative age distributions.
Better estimates of the population unfortunately have to wait until the release of the 10% unit record sample of the census, which was originally scheduled for release in March 2013, but was subsequently delayed indefinitely, and the recast of previous censuses and the Community Survey to 2011 provincial and municipal district boundaries. These are needed in order to check on the reasonableness of the estimates of the various components of a cohort component population projection, namely, base population, fertility, mortality and migration, by population group, province and sex. CARe intends to produce a series of monographs on the results of the 2011 Census as indicated by these data once the data are in the public domain.
Finally, since the District Council/Metro estimates in the official mid-year estimates were derived to be consistent with the provincial estimates, they too suffer from the distorted age distribution of the provincial estimates and should be used with care for any work that is sensitive to distribution of the DC/Metro population by age, taking further cognisance of the fact that the method used to correct both the 2011 and 2001 Census data for undercount is not robust at levels of spatial disaggregation finer than those defined by the provincial boundaries.

24 Alternative mid-year estimates, 2013
References
Beers, H. S. 1945. "Six-term formulas for routine actuarial interpolation", The Record of the American Institute of Actuaries 34(1):59-60.
Bradshaw, D., Dorrington, R. E. and Laubscher, R. 2012. Rapid Mortality Surveillance Report 2012. Cape Town: South African Medical Research Council. http://www.mrc.ac.za/bod/RapidMortality2011.pdf
Siegel, J. S. and Swanson, D. 2004. The Methods and Materials of Demography. Amsterdam: Elsevier. Statistics South Africa. 2011. A methodology for population estimation at the national and provincial levels:
The approach used by Statistics South Africa. Pretoria: Statistics South Africa. Statistics South Africa. 2012. Census 2011 Statistical release (Revised). P0301.4. Pretoria: Statistics
South Africa. Statistics South Africa. 2013. Mid-year population estimates, 2013. Pretoria: Statistics South Africa.
http://www.statssa.gov.za/publications/statsdownload.asp?PPN=P0302&SCH=4203 UNCEF. 2012. Levels and trends in child mortality report 2012: estimates developed by the UN Inter-agency
group for child mortality estimation. New York: UNICEF, the World Health Organization, the World Bank, and the United Nations Population Division. http://www.childinfo.org/files/Child_Mortality_Report_2012.pdf
United Nations. 2013. World Population Prospects: The 2012 Revision. New York: Department of Economic and Social Affairs.
Wang, H., Dwyer-Lindgren, L., Lofgren, K. T., Rajaratnam, J. K., Marcus, J. R., Levin-Rector, A., Levitz, C. E., Lopez, A. D. and Murray, C. J. L. 2012. "Age-specific and sex-specific mortality in 187 countries, 1970–2010: a systematic analysis for the Global Burden of Disease Study 2010", Lancet 380:2071-2094.

Alternative mid-year estimates, 2013 25
Appendix 1: Comparison of assumptions underlying the alternative and official mid-year estimates
Table 3 Comparison of Alternative mid-year estimate and Official mid-year estimate indicators of fertility and mortality
Year1 Births
Life expectancy at
birth IMR U5MR
y
Official
mid-year
estimate
Alternative
mid-year
estimate2
Official
mid-
year
estimate
Alternative
mid-year
estimate3
Official
mid-
year
estimate
Alternative
mid-year
estimate3
Official
mid-
year
estimate
Alternative
mid-year
estimate3
2002 1,117,731 968,527 52.7 57.3 63.5 52.1 92.9 73.6
2003 1,119,820 992,321 52.1 56.1 62.6 52.2 91.9 74.7
2004 1,105,534 1,049,406 51.7 55.0 60.1 51.6 89.3 74.4
2005 1,095,999 1,133,773 51.6 54.4 58.0 49.8 85.4 73.0
2006 1,092,768 1,145,752 52.5 54.3 55.6 47.1 80.9 69.5
2007 1,098,959 1,147,337 54.0 54.6 53.6 44.6 76.7 65.4
2008 1,107,603 1,169,827 55.5 55.1 50.8 42.0 72.3 61.9
2009 1,114,301 1,191,536 56.8 56.4 49.1 37.8 68.5 55.7
2010 1,123,409 1,172,279 57.6 57.6 47.1 35.2 65.2 50.9
2011 1,109,926 1,177,636 58.1 58.2 45.1 34.5 62.1 49.9
2012 1,095,669 1,189,312 58.7 58.4 43.5 33.8 59.5 48.8
2013 1,084,397 1,198,515 59.6 58.5 41.7 33.2 56.6 47.7
1 Year y runs from 1 July y-1 to 30 June y
2 Set to be consistent with numbers of births implied by the number of survivors in the 2011 Census
3 ASSA2008 full model
Table 4 International migration assumptions for the period 1 July 2001 to 30 June 2016
African Indian/Asian White Coloured
Period1
Official
mid-year
estimate
Alternative
mid-year
estimate
Official
mid-year
estimate
Alternative
mid-year
estimate
Official
mid-year
estimate
Alternative
mid-year
estimate
Official
mid-year
estimate
Alternative
mid-year
estimate
2001-2005 864,000 259,166 23,300 20,671 -133,800 -133,833 0 3,959
2006-2010 974,000 864,038 34,700 40,744 -112,000 -111,968 0 2,654
2011-2015 998,000 864,038 40,900 40,744 -95,200 -111,968 0 2,654
1 Assumed that the years refer to 12 months starting 1 July of the year in question, e.g. 2001-2005 refers to the period
1 July 2001 to 30 June 2006

26 Alternative mid-year estimates, 2013
Appendix 2: Comparison of official mid-year estimates for 2011 with the 2011 Census
0
1,000,000
2,000,000
3,000,000
4,000,000
5,000,000
6,000,000
0–
4
5–
9
10
–1
4
15
–1
9
20
–2
4
25
–2
9
30
–3
4
35
–3
9
40
–4
4
45
–4
9
50
–5
4
55
–5
9
60
–6
4
65
–6
9
70
–7
4
75
–7
9
80
+
African
OffMYE
2011 census
0
50,000
100,000
150,000
200,000
250,000
300,000
350,000
400,000
450,000
500,000
0–
4
5–
9
10
–1
4
15
–1
9
20
–2
4
25
–2
9
30
–3
4
35
–3
9
40
–4
4
45
–4
9
50
–5
4
55
–5
9
60
–6
4
65
–6
9
70
–7
4
75
–7
9
80
+
Coloured
OffMYE
2011 census
0
20,000
40,000
60,000
80,000
100,000
120,000
140,000
0–
4
5–
9
10
–1
4
15
–1
9
20
–2
4
25
–2
9
30
–3
4
35
–3
9
40
–4
4
45
–4
9
50
–5
4
55
–5
9
60
–6
4
65
–6
9
70
–7
4
75
–7
9
80
+
Indian
OffMYE
2011 census
0
50,000
100,000
150,000
200,000
250,000
300,000
350,000
400,000
0–
4
5–
9
10
–1
4
15
–1
9
20
–2
4
25
–2
9
30
–3
4
35
–3
9
40
–4
4
45
–4
9
50
–5
4
55
–5
9
60
–6
4
65
–6
9
70
–7
4
75
–7
9
80
+
White
OffMYE
2011 census
Figure 10 Comparison of the numbers by age group for 2011 from the 2013 official mid-year estimates and the 2011 Census by population group

Alternative mid-year estimates, 2013 27
Figure 11 Comparison of the numbers by age group for 2011 from the 2013 official mid-year estimates and the 2011 Census by province

28 Alternative mid-year estimates, 2013
Appendix 3: Comparison of assumptions underlying the alternative mid-year estimates with 2001 Census
0
100,000
200,000
300,000
400,000
500,000
600,000
700,000
800,000
900,000
1,000,000
0 6
12
18
24
30
36
42
48
54
60
66
72
78
84
90
+
African
AltMYE
2001 census
0
10,000
20,000
30,000
40,000
50,000
60,000
70,000
80,000
90,000
100,000
0 6
12
18
24
30
36
42
48
54
60
66
72
78
84
90
+
Coloured
AltMYE
2001 census
0
5,000
10,000
15,000
20,000
25,000
0 6
12
18
24
30
36
42
48
54
60
66
72
78
84
90
+
Indian
AltMYE
2001 census
0
10,000
20,000
30,000
40,000
50,000
60,000
70,000
80,000
90,0000 6
12
18
24
30
36
42
48
54
60
66
72
78
84
90
+
White
AltMYE
2001 census
Figure 12 Alternative 2013 mid-year population back-projected to 2001 vs 2001 Census by population group
Alternative mid-year estimates, 2013 29
Figure 13 Alternative 2013 mid-year population back-projected to 2001 vs 2001 Census by province