Alternative Service Delivery—Southeast King
15
Alternative Service Delivery—Southeast King County Phase 1 outreach: mobility needs assessment (April 21 – May 5, 2015) Summary of what we heard Overview Our primary goal for this phase of outreach was to engage existing and future riders in sharing: How they use public transportation today and how well it’s working for them. If they are not using public transportation, why not. What’s most important in terms of public transportation in these communities (i.e., places served and design features). Their general awareness of and/or experience with existing alternative service options. This document summarizes our key activities during this outreach period and the results of the online survey. See the attached “Face to Face Survey Results” for a description of key themes we identified from these conversations. How we notified people Transit alerts sent to route subscribers—Emails and/or texts were delivered to some 3,257 subscribers to routes DART 907, DART 915, 143, 168, and 186. The emails had an open rate of 10 percent and a click rate of 1 percent. Take‐away cards—We distributed 1,000 take‐away cards to riders at transit centers and at other face‐to‐face outreach events, and gave the cards to DART operators to place on buses. We also mailed cards to places we were not able to hold outreach events such as presentations or information tables. News release, media coverage—We sent a news release to the Auburn Reporter, Maple Valley Reporter, Renton Reporter, Enumclaw Courier Herald, Enumclaw Patch, Voice of the Valley, Seattle Times, and Seattle Transit Blog. The story was picked up by the Voice of the Valley and the Covington Maple Valley Reporter. Working Group activities—We asked members of our Working Group to forward our materials to their networks and help spread the word. How people gave us feedback Online survey—When this phase of outreach ended, 660 people had completed the online survey. Onboard conversations with riders—Metro staff members rode DART routes 907 and 915 and talked with riders. Other face‐to‐face conversations—Metro staff members spoke with riders at the Renton and
Transcript of Alternative Service Delivery—Southeast King

Alternative Service Delivery—Southeast King County Phase 1 outreach: mobility needs assessment (April 21 – May 5, 2015)
Summary of what we heard
Overview
Our primary goal for this phase of outreach was to engage existing and future riders in sharing:
How they use public transportation today and how well it’s working for them.
If they are not using public transportation, why not.
What’s most important in terms of public transportation in these communities (i.e., places served and design features).
Their general awareness of and/or experience with existing alternative service options. This document summarizes our key activities during this outreach period and the results of the online survey. See the attached “Face to Face Survey Results” for a description of key themes we identified from these conversations.
How we notified people
Transit alerts sent to route subscribers—Emails and/or texts were delivered to some 3,257 subscribers to routes DART 907, DART 915, 143, 168, and 186. The emails had an open rate of 10 percent and a click rate of 1 percent.
Take‐away cards—We distributed 1,000 take‐away cards to riders at transit centers and at other face‐to‐face outreach events, and gave the cards to DART operators to place on buses. We also mailed cards to places we were not able to hold outreach events such as presentations or information tables.
News release, media coverage—We sent a news release to the Auburn Reporter, Maple Valley Reporter, Renton Reporter, Enumclaw Courier Herald, Enumclaw Patch, Voice of the Valley, Seattle Times, and Seattle Transit Blog. The story was picked up by the Voice of the Valley and the Covington Maple Valley Reporter.
Working Group activities—We asked members of our Working Group to forward our materials to their networks and help spread the word.
How people gave us feedback
Online survey—When this phase of outreach ended, 660 people had completed the online survey.
Onboard conversations with riders—Metro staff members rode DART routes 907 and 915 and talked with riders.
Other face‐to‐face conversations—Metro staff members spoke with riders at the Renton and
King County Metro Transit 2
Alternative Service Delivery—Southeast King County Summary of Phase 1 Outreach
Auburn transit centers, with the goal of reaching 143 and 186 riders. Staff members also talked with people at the Enumclaw and Greater Maple Valley senior centers, Auburn YMCA, and Green River College.
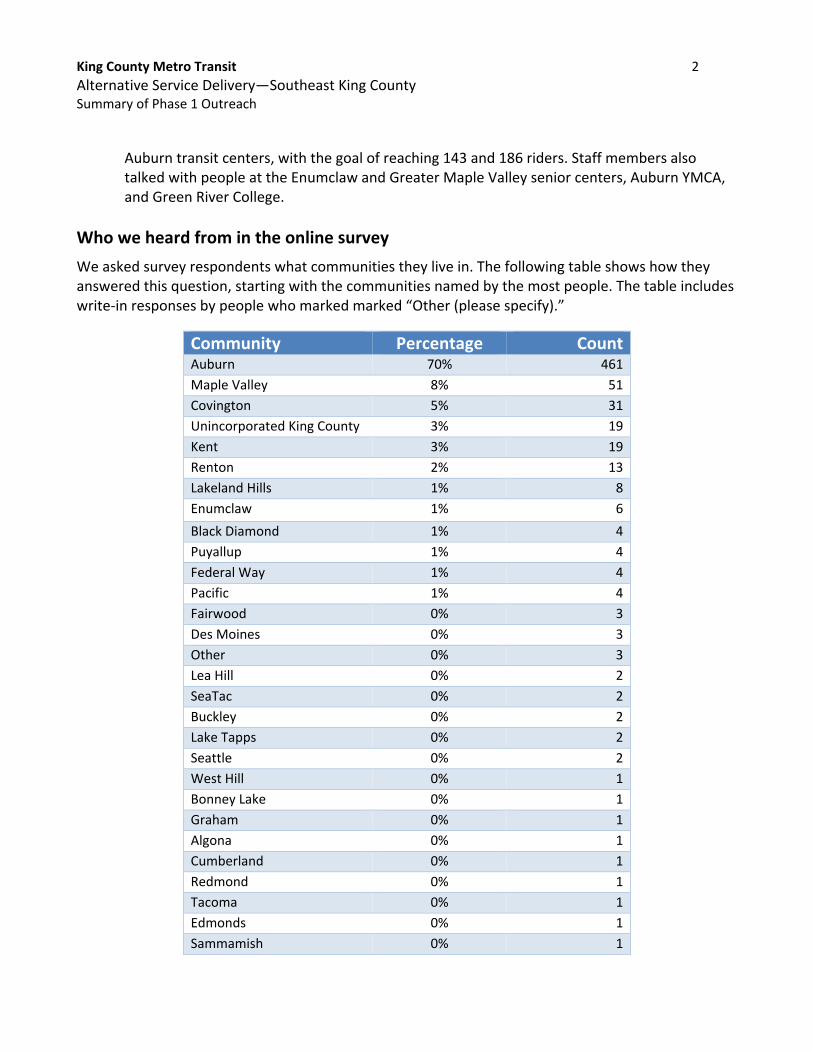
Who we heard from in the online survey
We asked survey respondents what communities they live in. The following table shows how they answered this question, starting with the communities named by the most people. The table includes write‐in responses by people who marked marked “Other (please specify).”
Community Percentage Count Auburn 70% 461
Maple Valley 8% 51
Covington 5% 31
Unincorporated King County 3% 19
Kent 3% 19
Renton 2% 13
Lakeland Hills 1% 8
Enumclaw 1% 6
Black Diamond 1% 4
Puyallup 1% 4
Federal Way 1% 4
Pacific 1% 4
Fairwood 0% 3
Des Moines 0% 3
Other 0% 3
Lea Hill 0% 2
SeaTac 0% 2
Buckley 0% 2
Lake Tapps 0% 2
Seattle 0% 2
West Hill 0% 1
Bonney Lake 0% 1
Graham 0% 1
Algona 0% 1
Cumberland 0% 1
Redmond 0% 1
Tacoma 0% 1
Edmonds 0% 1
Sammamish 0% 1

King County Metro Transit 3
Alternative Service Delivery—Southeast King County Summary of Phase 1 Outreach
Fifty two percent of respondents told us they use public transit (buses or trains). They identified the following
routes as ones they ride three or more times per week:
Sounder Train—nearly 50%
Route 143—17%
Route 186—5%
DART 907—2%
DART 915—5%
Here’s how respondents said they use these and other routes:
King County Metro Transit 4
Alternative Service Delivery—Southeast King County Summary of Phase 1 Outreach
Almost 70 percent of respondents said they reach transit by car; 40 percent said they walk to their bus stops; and 16 percent said they take transit to a transit center or park‐and‐ride. Six percent said they ride a bike to reach transit.
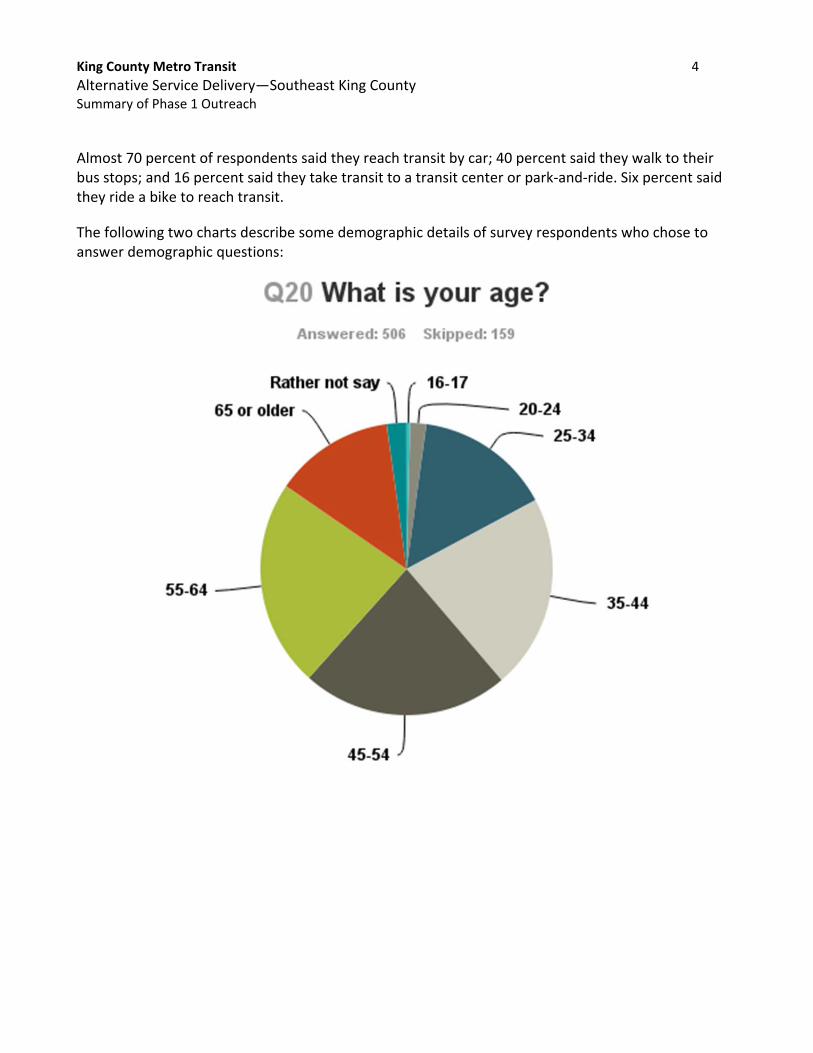
The following two charts describe some demographic details of survey respondents who chose to answer demographic questions:

King County Metro Transit 5
Alternative Service Delivery—Southeast King County Summary of Phase 1 Outreach
Seventy‐two percent identified themselves as White (Caucasian); 14 percent as African‐American, Asian‐American, American Indian, Hispanic, or multiple ethnicities. Another 13 percent said they would rather not answer the question.

King County Metro Transit 6
Alternative Service Delivery—Southeast King County Summary of Phase 1 Outreach
Most (98 percent) survey responders said they speak English as their primary language at home. Other languages spoken at home by survey responders include Amharic, Chinese, Punjabi, Russian, Somali, Spanish, Ukrainian, and Vietnamese.
Twenty‐three percent of respondents told us they have a disability. Eight percent said they do not have access to a car or truck for personal use.

King County Metro Transit 7
Alternative Service Delivery—Southeast King County Summary of Phase 1 Outreach
What we heard
We asked people to tell us the three most common destinations they go to now using public transit. The following table summarizes these destinations (from most to least mentioned).
Response Percent CountSouth Lake Union 33% 192
Downtown Seattle (including downtown retail, Pike Place Market, offices)
24% 141
Southend of downtown Seattle (including stadiums, SODO, King Street Station)
9% 50
Downtown Auburn (including Auburn Station, Auburn TC) 6% 37
Kent (including Kent Station) 3% 20
Bellevue 3% 15
Southcenter 2% 13
Tacoma 1% 8
Federal Way 1% 7
Harborview 1% 6
Renton 1% 6
Group Health ‐ Federal Way 1% 5
Puyallup 1% 5
Auburn Outlet Collection 1% 4
SeaTac Airport 1% 4
Swedish Medical Center ‐ First Hill 1% 4
Queen Anne 1% 4
Covington (including Covington Square) 1% 3
Enumclaw 1% 3
Lakeland Hills 1% 3
Maple Valley (including Four Corners) 1% 3
SuperMall 1% 3
Tukwila Sounder Station 1% 3
UW Medical Center/UW 1% 3
VA Hospital 1% 3
Auburn Senior Center 0% 2
Green River College 0% 2
Issaquah 0% 2
Lea Hill 0% 2
Tukwila Light Rail 0% 2
Virginia Mason ‐ First Hill 0% 2
Auburn YMCA 0% 2

King County Metro Transit 8
Alternative Service Delivery—Southeast King County Summary of Phase 1 Outreach
Response Percent CountEdmonds 0% 2
Boeing‐Tukwila 0% 1
Burien 0% 1
Evergreen Health 0% 1
Fremont 0% 1
Group Health ‐ Capitol Hill 0% 1
Group Health ‐ Kent 0% 1
IKEA 0% 1
Kent East Hill 0% 1
Kent Senior Center 0% 1
Multicare ‐ Kent 0% 1
Overlake Transit Center 0% 1
Providence Health Services ‐ Renton 0% 1
Raisbeck Aviation High School 0% 1
SeaMar ‐ Kent 0% 1
SeaTac 0% 1
Seattle Pacific University 0% 1
Tukwila 0% 1
Wilderness Village 0% 1
Valley Health 0% 1
Seattle University 0% 1
Valley Cities Counseling 0% 1
Seattle Central College 0% 1
Southeast Seattle 0% 1
Eastgate‐Factoria 0% 1
Redmond 0% 1
We also asked where people would like to get to by transit that they can’t get to now. Many of the destinations are similar. Many people mentioned they would like to get to these places faster than they can now on transit or at times they can’t get there now – e.g. on the weekend.
Response Percent CountDowntown Seattle (including downtown retail, Pike Place Market, offices)
12% 47
Downtown Auburn (including Auburn Station, Auburn TC) 9% 33
Southend of downtown Seattle (including stadiums, SODO, King Street Station)
6% 21
Bellevue 5% 20

King County Metro Transit 9
Alternative Service Delivery—Southeast King County Summary of Phase 1 Outreach
Response Percent CountTacoma 5% 18
Federal Way 4% 17
SeaTac Airport 4% 15
Renton 3% 13
Kent (including Kent Station) 2% 9
Redmond (includes Microsoft, Nintendo) 2% 9
Covington (including Covington Square) 2% 8
Lakeland Hills 2% 8
Issaquah 2% 7
Maple Valley (including Four Corners) 2% 7
UW Medical Center/UW 2% 7
Puyallup 2% 6
South Lake Union 2% 6
Southcenter 2% 6
Weekend service ‐ Renton, Seattle, Bellevue, Woodinville, Muckleshoot Casino, Enumclaw, Kirkland
2% 6
Eastgate‐Factoria 1% 5
Des Moines 1% 5
Auburn Outlet Collection 1% 4
Green River College 1% 4
SuperMall 1% 4
Lacey/Olympia/Tumwater 1% 4
Kirkland (includes South Kirkland P&R) 1% 4
Joint Base Lewis McChord 1% 4
Sumner 1% 4
Greater Maple Valley Community Center 1% 4
West Seattle 1% 4
Enumclaw 1% 3
Kent East Hill 1% 3
Lea Hill 1% 3
Tukwila 1% 3
Belltown 1% 3
Auburn Senior Center 1% 2
Burien 1% 2
Multicare ‐ Kent 1% 2
Queen Anne 1% 2
Tukwila Light Rail 1% 2
Valley Medical 1% 2

King County Metro Transit 10
Alternative Service Delivery—Southeast King County Summary of Phase 1 Outreach
Response Percent CountAuburn Black Diamond Road‐midday 1% 2
Federal Way Community Center 1% 2
Everett 1% 2
South Park 1% 2
Bonney Lake(including Bonney Lake High School) 1% 2
White River Amphitheater 1% 2
Harborview 0% 1
IKEA 0% 1
Swedish Medical Center ‐ First Hill 0% 1
VA Hospital 0% 1
Wilderness Village 0% 1
Auburn Food Bank 0% 1
Bellevue College 0% 1
Bothell 0% 1
Beacon Hill 0% 1
Capitol Hill 0% 1
Denny Regrade 0% 1
Kentwood High School 0% 1
Green Lake 0% 1
Muckleshoot Casino 0% 1
Kent Meridian Park & Ride 0% 1
King County Aquatic Center 0% 1
Seattle Center 0% 1
Polyclinic‐First Hill 0% 1
Swedish Medical Center ‐ Cherry Hill 0% 1
Wallingford 0% 1
Buckley 0% 1
Swedish Medical Center ‐ Issaquah 0% 1
Emerald Downs 0% 1
Auburn Public Library 0% 1
Shoreline 0% 1
Renton Technical College 0% 1
Snoqualmie 0% 1
Eastlake 0% 1
Auburn ‐ FAA 0% 1
Renton Highlands 0% 1
Woodinville 0% 1
Mukilteo 0% 1
King County Airport 0% 1

King County Metro Transit 11
Alternative Service Delivery—Southeast King County Summary of Phase 1 Outreach
We asked survey participants to tell us what barriers they perceive to taking public transit. The following chart lists things people identified as “significant barriers” to taking transit.
Response Percent CountTransit routes don’t go where you want to go 49% 267
Overall frequency of service 47% 258
Having to plan around transit schedules 43% 239
Lack of availability of service after 6 p.m. 43% 237
Lack of availability of service on weekends 41% 229
Time it takes to travel by transit 41% 228
Lack of parking at park and ride 38% 213
Work/school hours are irregular 21% 117
Overcrowded 21% 114
Need a car during the day 20% 109
Concerns about personal safety while waiting for or riding transit 19% 103
Not knowing how to use the transit system 9% 48
Concerned about riding transit because of a disability 4% 24
We asked about people’s awareness of alternative services. Survey respondents were least familiar with Metro’s Taxi Scrip, Access Transportation (paratransit), and community shuttle (such as the Hyde Shuttle) services. They were most familiar with carpools, Vanpools and Vanshares, and car shares.
Fifty‐two percent of respondents said they would be willing to try a carpool, Vanpool, or Vanshare sponsored by Metro.
We asked people who had experience with any of the alternative services listed in the survey to tell us what those experiences were like. Their responses are summarized below.
Response Percent CountWorked well 27% 23
Service schedule is too limited 6% 5
Don’t provide parking at Sounder stations 6% 5
Have poor customer service 5% 4
Didn’t work out because of group conflict 5% 4
Too expensive 3% 3
Car2Go is great for short trips 3% 3
Too difficult to use 3% 3
Didn’t work to find a match 3% 3
Too hard to fit my schedule 2% 2
Poor vehicle quality 1% 1

King County Metro Transit 12
Alternative Service Delivery—Southeast King County Summary of Phase 1 Outreach
Response Percent CountLost service when fixed‐route cuts were made 1% 1
Too unreliable 1% 2
Too restrictive 1% 1
Other customers are filthy 1% 1
Too inconvenient 1% 1
Access takes too much time out of day 1% 1
Provide great customer service 1% 1
Were great when they were available‐in reference to the MVCC [CA1]shuttle
1% 1
We asked how satisfied people are with their current service and what they would like to see improved. They told us:

King County Metro Transit 13
Alternative Service Delivery—Southeast King County Summary of Phase 1 Outreach
The following chart lists key themes brought up in the survey.
Response Percent CountLack of parking 14% 42
Good, works for me 11% 33
Train or bus service is unreliable 11% 32
Need more service 10% 30
Overcrowded 7% 22
Need more train service - weekends, midday, late night, reverse commute
6% 19
Takes too long 6% 19
More service - increase frequency, add trips 6% 19
Doesn't go where I need it to go 5% 14
More service - after 6 pm 3% 10
More service - shoulder peak 3% 9
Upset about cancelled routes (e.g. 152) 3% 8
Unexpected trips are too difficult 2% 6
More service - on weekends 2% 6
More service - on PT 497 2% 5
It's inaccessible (travel too far to access it) 2% 5
Extend the light rail or train service 2% 5
If train cancelled, emergency buses and better communication needed 1% 4Long waits to make connections 1% 4
It's unsafe 1% 3
Add a park-and-ride in Enumclaw 1% 2
Change the vehicle size - e.g. 180 use a bigger coach? 1% 2
More service - late at night 0% 1
Concern about more cuts 0% 1
Taking the bus is inconvenient or stressful 0% 1
Need more express service 0% 1
Better coordination needed between agencies 0% 1
We asked what would be most important to people if fixed route service were to be supplemented with or changed to provide some form of alternative service. Survey respondents told us the following factors are important to them.
Response Percent CountPicks me up near my house 44% 200
Guaranteed parking at my transit facility or park-and-ride 42% 188
Costs the same as, or less than, current transit service 39% 177
King County Metro Transit 14
Alternative Service Delivery—Southeast King County Summary of Phase 1 Outreach
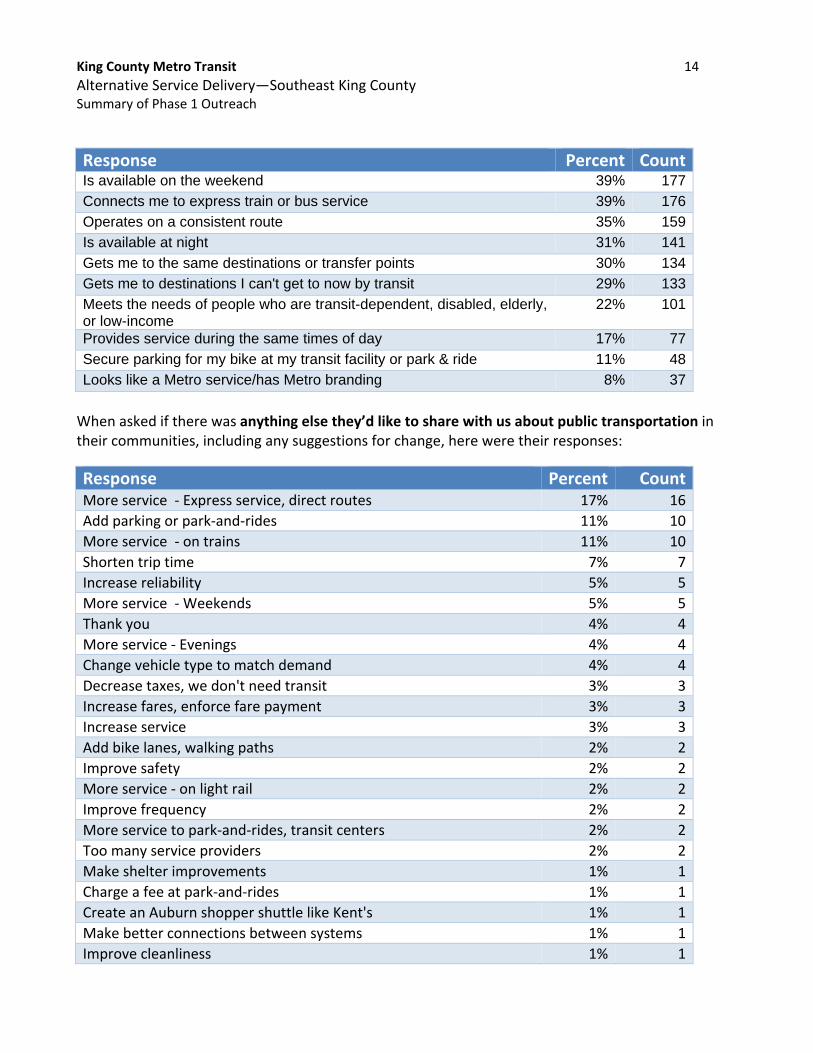
Response Percent CountIs available on the weekend 39% 177
Connects me to express train or bus service 39% 176
Operates on a consistent route 35% 159
Is available at night 31% 141
Gets me to the same destinations or transfer points 30% 134
Gets me to destinations I can't get to now by transit 29% 133
Meets the needs of people who are transit-dependent, disabled, elderly, or low-income
22% 101
Provides service during the same times of day 17% 77
Secure parking for my bike at my transit facility or park & ride 11% 48
Looks like a Metro service/has Metro branding 8% 37
When asked if there was anything else they’d like to share with us about public transportation in their communities, including any suggestions for change, here were their responses:
Response Percent CountMore service ‐ Express service, direct routes 17% 16
Add parking or park‐and‐rides 11% 10
More service ‐ on trains 11% 10
Shorten trip time 7% 7
Increase reliability 5% 5
More service ‐ Weekends 5% 5
Thank you 4% 4
More service ‐ Evenings 4% 4
Change vehicle type to match demand 4% 4
Decrease taxes, we don't need transit 3% 3
Increase fares, enforce fare payment 3% 3
Increase service 3% 3
Add bike lanes, walking paths 2% 2
Improve safety 2% 2
More service ‐ on light rail 2% 2
Improve frequency 2% 2
More service to park‐and‐rides, transit centers 2% 2
Too many service providers 2% 2
Make shelter improvements 1% 1
Charge a fee at park‐and‐rides 1% 1
Create an Auburn shopper shuttle like Kent's 1% 1
Make better connections between systems 1% 1
Improve cleanliness 1% 1

King County Metro Transit 15
Alternative Service Delivery—Southeast King County Summary of Phase 1 Outreach
Response Percent CountWhen train breaks down, add bus service 1% 1
Make it more cost effective 1% 1
Increase Vanpools 1% 1
Don't cut more service 1% 1
Face‐to‐face survey results
We collected face‐to‐face survey data in two ways:
Onboard conversations with riders on routes 915 and 907, and with riders at the Auburn and Renton transit centers.
In conversations with people at the following events: Enumclaw Senior Lunch, Greater Maple Valley Community Center Senior Lunch, Green River College, and Auburn Healthy Kids Day.
Staff members asked people the following question: if service in your community were changed or supplemented with a new transportation service, what would be most important to you for using a new service?
Total people reached: 144
Commuters: 84
Midday: 60
Type of rider Percentage
Feature cited Mentions Commuter Midday Commuter Midday
Service later in evening 41 16 25 19% 42%
More frequency 40 28 12 33% 20%
Better reliability 29 21 8 25% 13%
Provide (more) Sunday service 23 11 12 13% 20%
Provide (more) Saturday service 14 7 7 8% 12%
Improve quality/cleanliness of facilities 11 9 2 11% 3%
Increase speed of service 7 3 4 4% 7%
Reduce or maintain current cost of trip 7 6 1 7% 2%
Increase coverage 6 2 4 2% 7%
Reduce crowding 5 2 3 2% 5%
Provide shorter transfers 4 0 4 0% 7%
Drivers should be more professional 4 0 4 0% 7%
Expand park‐and‐ride supply 3 3 0 4% 0%