Alternative Investment Options in DB and DC...
9
Moderator: Timothy Pollard, CAIA, Data Editor, Pensions & Investments M. Nicolas J. Firzli, LL.M., Director-General, World Pensions Council Advisory Board Member, World Bank Global Infrastructure Facility Kevin T. Hanney, CFA, Director, Pension Investments, United Technologies Corporation (UTC) Kamilla Svajgl, FSA, MAAA , Principal & Consulting Actuary, Milliman Financial Risk Management LLC Alternative Investment Options in DB and DC Plans
Transcript of Alternative Investment Options in DB and DC...

Moderator: Timothy Pollard, CAIA, Data Editor, Pensions & Investments
M. Nicolas J. Firzli, LL.M., Director-General, World Pensions Council Advisory Board Member, World Bank Global Infrastructure Facility
Kevin T. Hanney, CFA, Director, Pension Investments, United Technologies Corporation (UTC)
Kamilla Svajgl, FSA, MAAA , Principal & Consulting Actuary, Milliman Financial Risk Management LLC
Alternative Investment Options in DB and DC Plans

61.5%
28%
7.2%
1.4% 1.9%
49.5%
25.7%21.3%
1.8% 1.7%
0%
10%
20%
30%
40%
50%
60%
70%
Equity Fixed income Alternatives Cash Other
2004 2014
Alternative asset class Allocation
Private equity 8.4%
Real estate 7.1%
Other (incl. hedge funds) 5.8%
Source: Pensions & Investments
Asset mix of P&I top 1,000 DB plans as of Sept. 30

$0
$1
$2
$3
$4
$5
$6
$7
$8
$9
$10
2004 2005 2006 2007 2008 2009 2010 2011 2012 2013 2014
Defined benefit Defined contributionSource: Pensions & Investments
Annualized growth rates
Defined benefit 4.3%
Defined contribution
8.1%
Asset growth of P&I top 1,000 – DB vs. DC plans over the past 10 years

Kevin T. Hanney, CFA
Director, Pension Investments
United Technologies Corporation (UTC)
Alternative Investment Options in DB and DC Plans
Kamilla SvajglPrincipalMilliman
Alternative Investment Options in DB and DC Plans

Actual Risk Levels Rarely Match Expectations
Source: Milliman Financial Risk Management LLC, as of 1/1/00–12/31/13. The data quoted represents hypothetical past volatility, is for illustrative purposes and is not intended to represent any actual investments. Current performance may be lower or higher than the performance data quotedabove. Investment return and principal value will fluctuate, so that shares, when redeemed, may be worth more or less than their original cost. Past performance is no guarantee of future results.
70/30 allocation is defined as a 70% and 30% allocation to the S&P 500 Index and Barclay’s U.S. Aggregate Bond Index, respectively. The S&P 500 Index is a commonly used benchmark comprised of all the stocks in the S&P 500 weighted by market value. The Barclay’s U.S. Aggregate BondIndex is a universally accepted benchmark for bond performance and is comprised of bonds with a maturity over one year. The index performance shown is for informational purposes only and is not reflective of any investment. It is not possible to invest directly in an index. Unmanaged indexreturns do not reflect any fees, expenses, or sales charges.
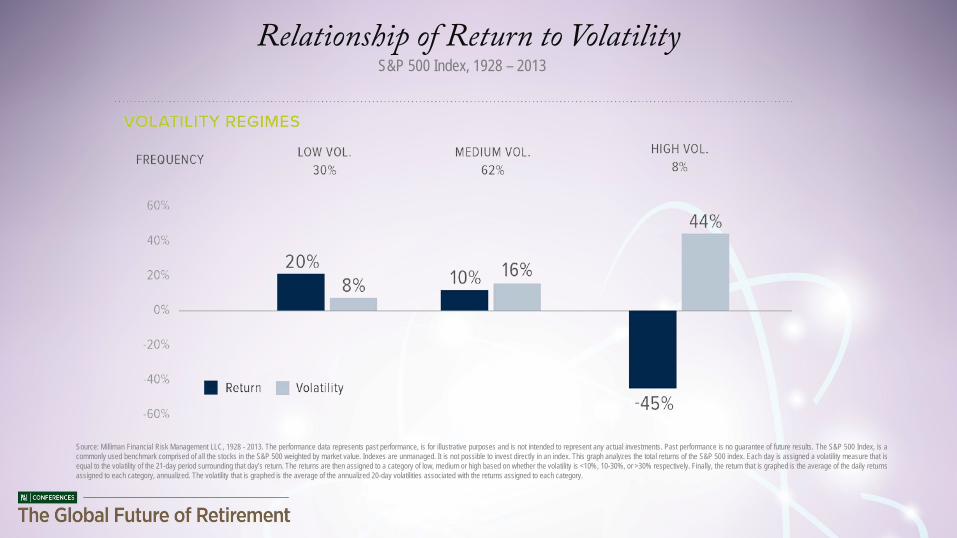
Relationship of Return to VolatilityS&P 500 Index, 1928 – 2013
Source: Milliman Financial Risk Management LLC, 1928 - 2013. The performance data represents past performance, is for illustrative purposes and is not intended to represent any actual investments. Past performance is no guarantee of future results. The S&P 500 Index, is acommonly used benchmark comprised of all the stocks in the S&P 500 weighted by market value. Indexes are unmanaged. It is not possible to invest directly in an index. This graph analyzes the total returns of the S&P 500 index. Each day is assigned a volatility measure that isequal to the volatility of the 21-day period surrounding that day’s return. The returns are then assigned to a category of low, medium or high based on whether the volatility is <10%, 10-30%, or >30% respectively. Finally, the return that is graphed is the average of the daily returnsassigned to each category, annualized. The volatility that is graphed is the average of the annualized 20-day volatilities associated with the returns assigned to each category.

Risk Management Using FuturesHow do farmers protect themselves from fluctuating commodity prices? How do universities protect the value of their endowments? How do major financial institutions and insurance companies manage risks on their balance sheets?
1. Low execution costs2. Liquidity3. 24-hour trading4. Straightforward accounting5. Daily settlement – no counterparty risk6. Potential tax advantages over trading individual securities
With the world’s economy relying in futures contracts for price stability, risk management and long-term planning, it also makes sense to include this type of risk management into DC and DB plans in an effort to provide investors with sustainable income in retirement.
Futures contract positions may not provide an effective hedge because changes in futures contract prices may not track those of the securities they are intended to hedge. Futures create leverage, which can magnify the Fund’s potential for gain or loss and, therefore, amplify theeffects of market volatility on the Fund’s share price and which can have a significant impact on the Fund’s performance.Futures are also subject to credit risk (the counterparty may default) and liquidity risk. If an investment is linked to the performance of an index, it will be subject to the risks associated with changes in that index. Overall securities market risks may affect the value of securitiesheld by the Fund.There is no guarantee that any investment will achieve its objectives, generate positive returns, or avoid losses.

Moderator: Timothy Pollard, CAIA, Data Editor, Pensions & Investments
M. Nicolas J. Firzli, LL.M., Director-General, World Pensions Council Advisory Board Member, World Bank Global Infrastructure Facility
Kevin T. Hanney, CFA, Director, Pension Investments, United Technologies Corporation (UTC)
Kamilla Svajgl, FSA, MAAA , Principal & Consulting Actuary, Milliman Financial Risk Management LLC
Alternative Investment Options in DB and DC Plans