Alternative Fuels:Alternative Fuels: What have we · PDF fileAlternative Fuels:Alternative...
50
Alternative Fuels: Alternative Fuels: Alternative Fuels: Alternative Fuels: What have we learned? What have we learned? David L. Greene David L. Greene Corporate Fellow, Oak Ridge National Laboratory Corporate Fellow, Oak Ridge National Laboratory Senior Fellow, Howard H. Baker, Jr. Center for Public Policy, U. of Tennessee Senior Fellow, Howard H. Baker, Jr. Center for Public Policy, U. of Tennessee ARPA ARPA e ARPA ARPA-e Transportation Behavior and New Technology Workshop Transportation Behavior and New Technology Workshop Berkeley, California Berkeley, California March 16, 2012 March 16, 2012
-
Upload
trinhduong -
Category
Documents
-
view
216 -
download
2
Transcript of Alternative Fuels:Alternative Fuels: What have we · PDF fileAlternative Fuels:Alternative...

Alternative Fuels:Alternative Fuels:Alternative Fuels:Alternative Fuels:What have we learned?What have we learned?
David L. GreeneDavid L. GreeneCorporate Fellow, Oak Ridge National LaboratoryCorporate Fellow, Oak Ridge National Laboratory
Senior Fellow, Howard H. Baker, Jr. Center for Public Policy, U. of TennesseeSenior Fellow, Howard H. Baker, Jr. Center for Public Policy, U. of Tennessee
ARPAARPA eeARPAARPA--eeTransportation Behavior and New Technology WorkshopTransportation Behavior and New Technology Workshop
Berkeley, CaliforniaBerkeley, CaliforniaMarch 16, 2012March 16, 2012
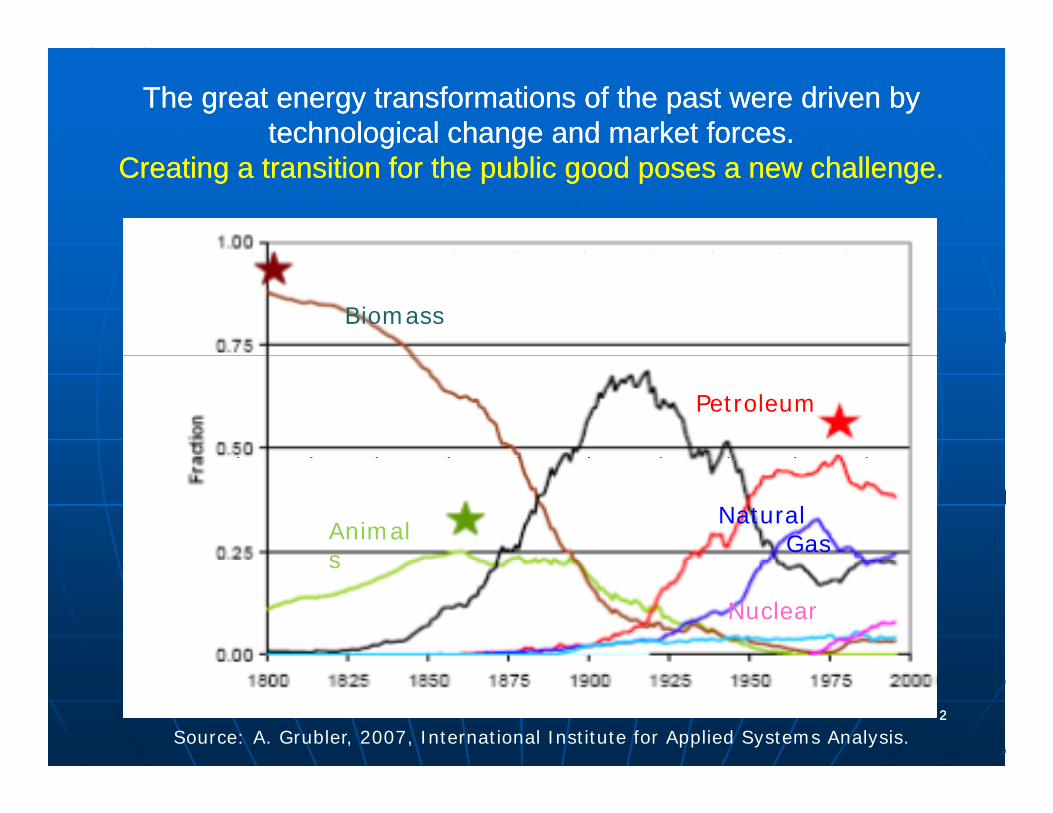
The great energy transformations of the past were driven by The great energy transformations of the past were driven by technological change and market forces. technological change and market forces.
Creating a transition for the public good poses a new challenge.Creating a transition for the public good poses a new challenge.
Biomass
Coal Petroleum
Animals
NaturalGas
s
Nuclear
22
Source: A. Grubler, 2007, International Institute for Applied Systems Analysis.

Our transportation sectorOur transportation sector consumes more petroleum than consumes more petroleum than any other nation’s entire economy: 6,500 gallons per second.any other nation’s entire economy: 6,500 gallons per second.But petroleum also provides 95% of global transport energyBut petroleum also provides 95% of global transport energyBut petroleum also provides 95% of global transport energy.But petroleum also provides 95% of global transport energy.
35
Transportation Energy Use by Type of Energy
30
35
20
25
les
15Exajou
Electricity
BioFuel
Petroleum
5
10Natural Gas
Coal
01950 1960 1970 1980 1990 2000 2010
Energy Information Administration, Annual Energy Review 2010, table 2.1e.
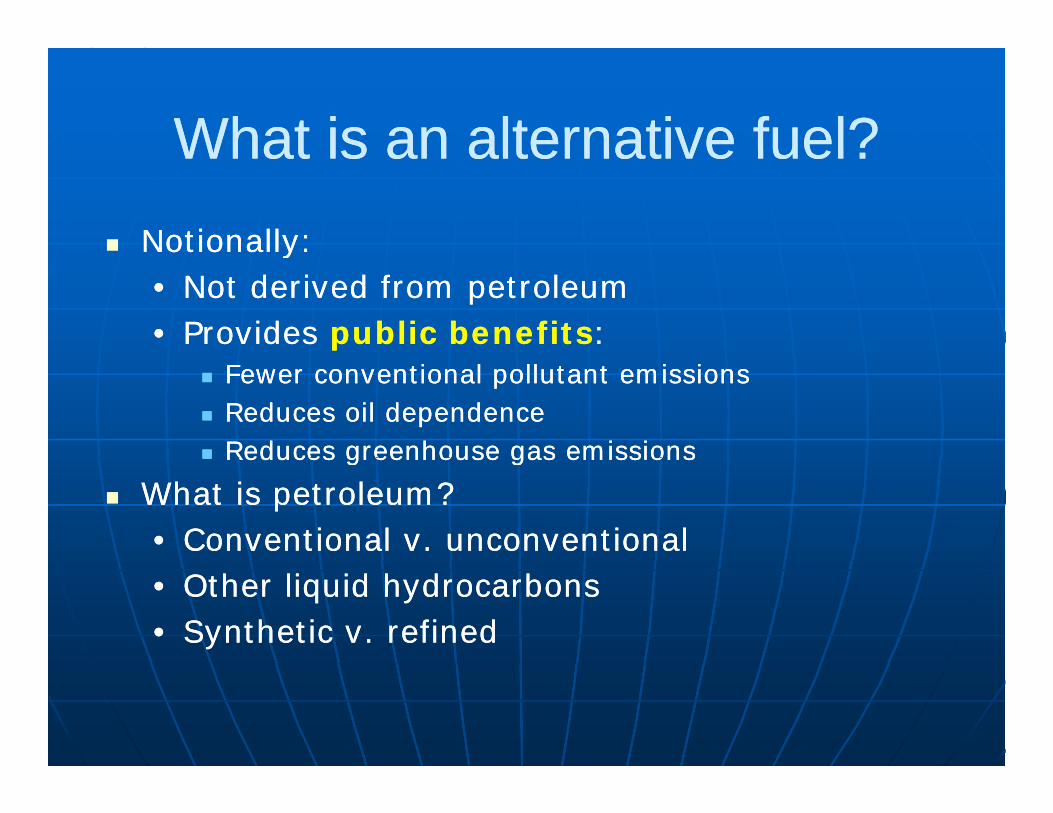
What is an alternative fuel?What is an alternative fuel?What is an alternative fuel?What is an alternative fuel? Notionally:Notionally:yy
•• Not derived from petroleumNot derived from petroleum•• Provides Provides public benefitspublic benefits::
Fewer conventional pollutant emissionsFewer conventional pollutant emissions Reduces oil dependenceReduces oil dependence Reduces greenhouse gas emissionsReduces greenhouse gas emissions Reduces greenhouse gas emissionsReduces greenhouse gas emissions
What is petroleum?What is petroleum?•• Conventional v. unconventionalConventional v. unconventional•• Other liquid hydrocarbonsOther liquid hydrocarbons•• Synthetic v. refinedSynthetic v. refined
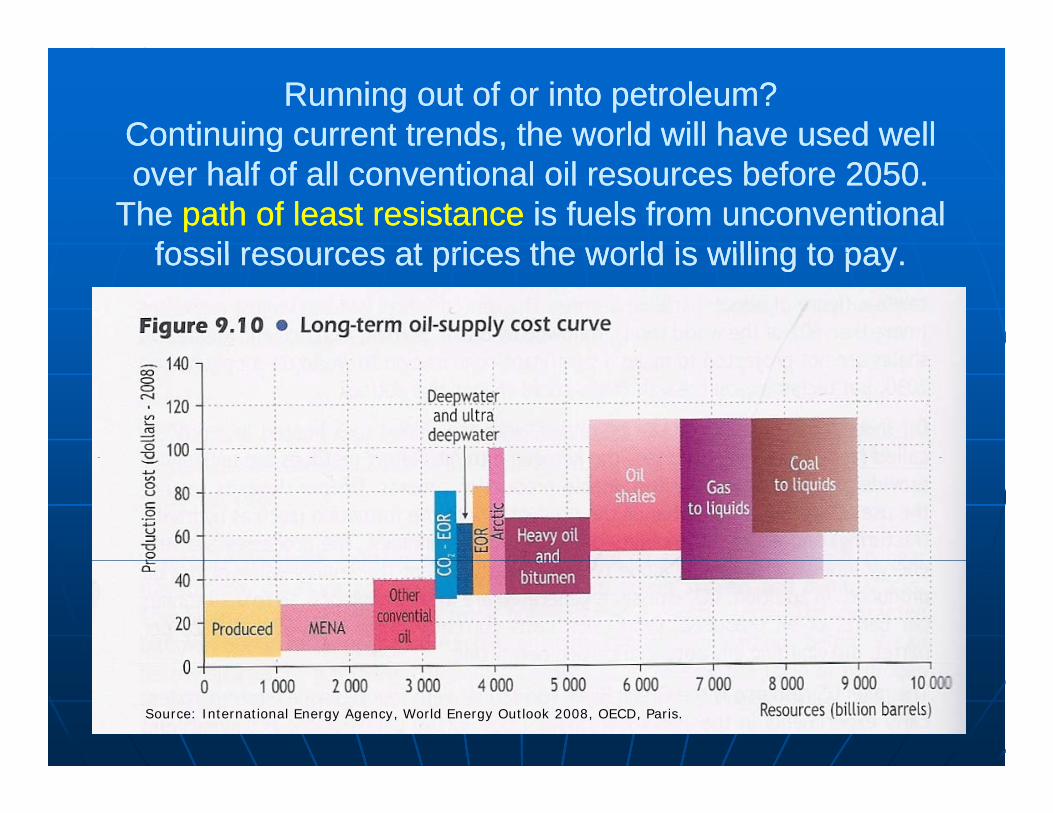
Running out of or into petroleum?Running out of or into petroleum?Continuing current trends, the world will have used well Continuing current trends, the world will have used well ggover half of all conventional oil resources before 2050.over half of all conventional oil resources before 2050.
The The path of least resistance path of least resistance is fuels from unconventional is fuels from unconventional fossil resources at prices the world is willing to payfossil resources at prices the world is willing to payfossil resources at prices the world is willing to pay. fossil resources at prices the world is willing to pay.
Source: International Energy Agency, World Energy Outlook 2008, OECD, Paris.
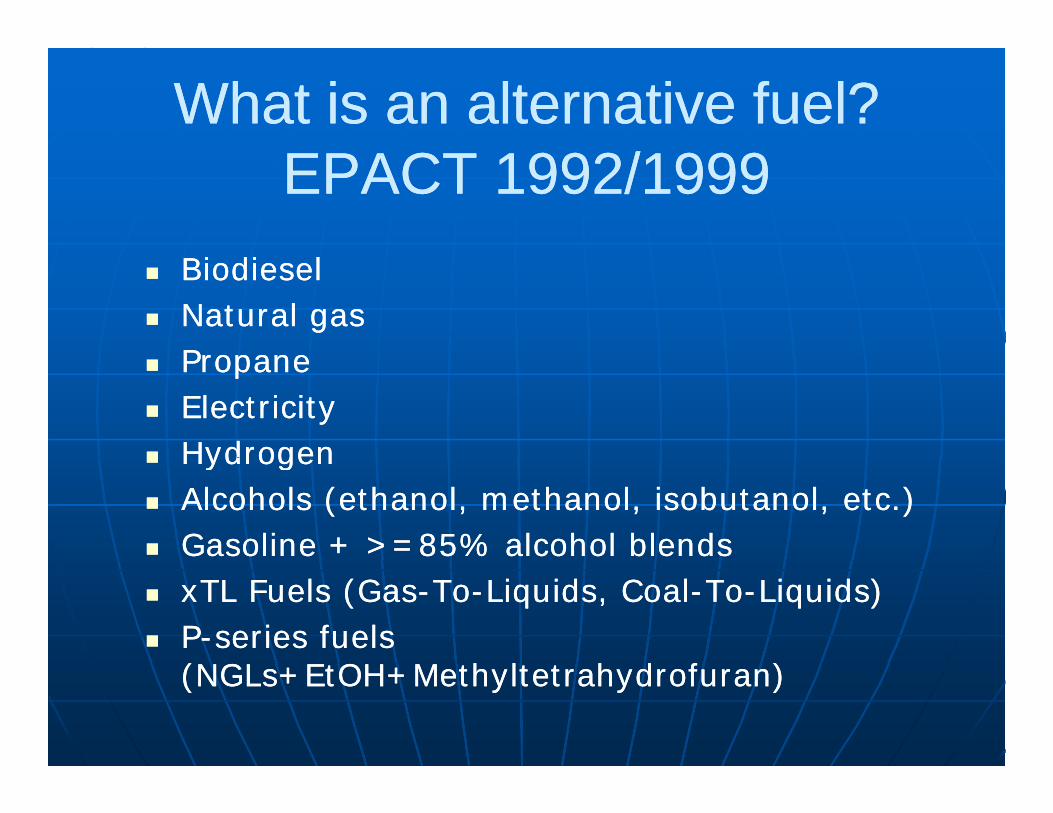
What is an alternative fuel?What is an alternative fuel?EPACT 1992/1999EPACT 1992/1999
BiodieselBiodiesel Natural gasNatural gas
PropanePropane PropanePropane ElectricityElectricity HydrogenHydrogen HydrogenHydrogen Alcohols (ethanol, methanol, Alcohols (ethanol, methanol, isobutanolisobutanol, etc.), etc.) Gasoline + >=85% alcohol blendsGasoline + >=85% alcohol blends xTLxTL Fuels (GasFuels (Gas--ToTo--Liquids, CoalLiquids, Coal--ToTo--Liquids)Liquids) PP--series fuels series fuels
((NGL E OH M h l h d fNGL E OH M h l h d f ))((NGLs+EtOH+MethyltetrahydrofuranNGLs+EtOH+Methyltetrahydrofuran))
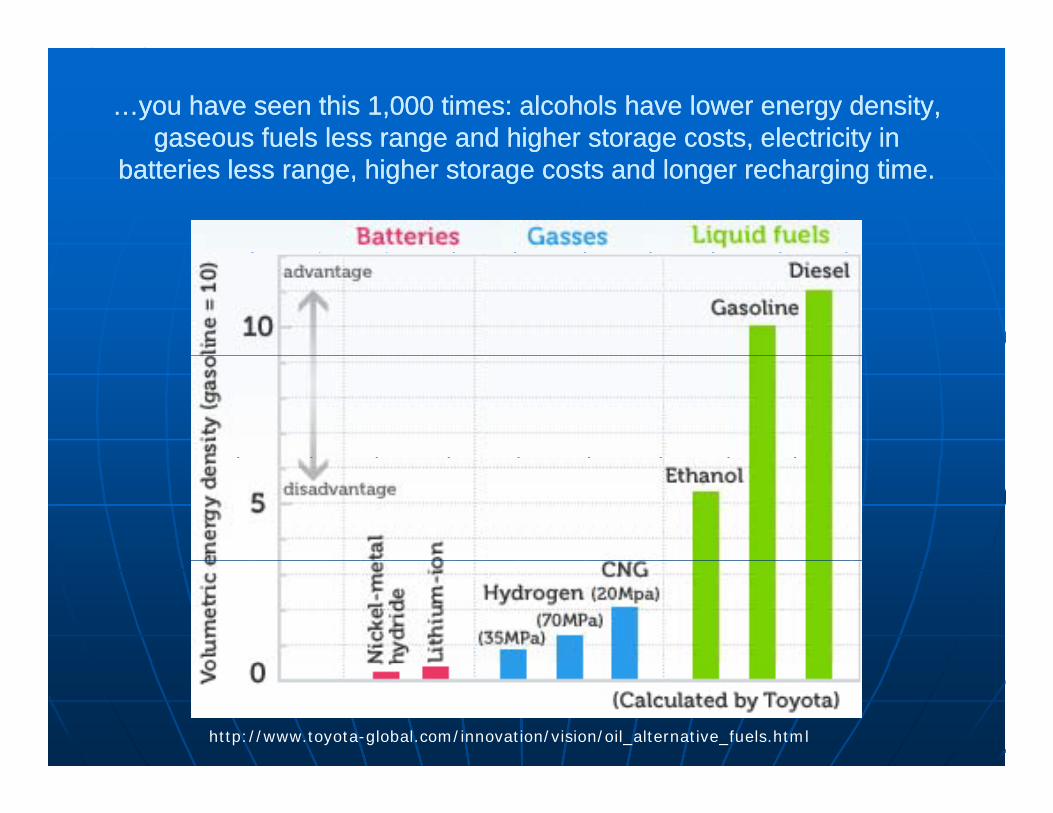
…you have seen this 1,000 times: alcohols have lower energy density, …you have seen this 1,000 times: alcohols have lower energy density, gaseous fuels less range and higher storage costs, electricity in gaseous fuels less range and higher storage costs, electricity in g g g g yg g g g y
batteries less range, higher storage costs and longer recharging time.batteries less range, higher storage costs and longer recharging time.
http://www.toyota-global.com/innovation/vision/oil_alternative_fuels.html

McNutt and Rogers (2004) summarized the McNutt and Rogers (2004) summarized the b t l f d b lt ti f lb t l f d b lt ti f lobstacles faced by alternative fuels.obstacles faced by alternative fuels.
Lack of refueling infrastructureLack of refueling infrastructure Lack of refueling infrastructureLack of refueling infrastructure Lack of vehicles engineered to operate on Lack of vehicles engineered to operate on
the fuelthe fuel High costHigh cost Difficulty breaking into an established Difficulty breaking into an established
marketmarket Perceived or real issues of safety and Perceived or real issues of safety and
reliabilityreliabilityreliabilityreliability Lack of driving rangeLack of driving range
McNutt, B. and D. Rodgers, 2004. “Lessons Learned from 15 Years of Alternative Fuels Experience: 1988 to 2003”, in D. Sperling and J.S. Cannon, eds., The Hydrogen Energy Transition, Elsevier, London.
They noted the following key elements of They noted the following key elements of early and continuing efforts to expand theearly and continuing efforts to expand theearly and continuing efforts to expand the early and continuing efforts to expand the
use of alternative fuels.use of alternative fuels.
Research and developmentResearch and development Demonstration projectsDemonstration projects Fleet deploymentFleet deployment Niche market developmentNiche market development PublicPublic--private partnershipsprivate partnerships PublicPublic private partnershipsprivate partnerships
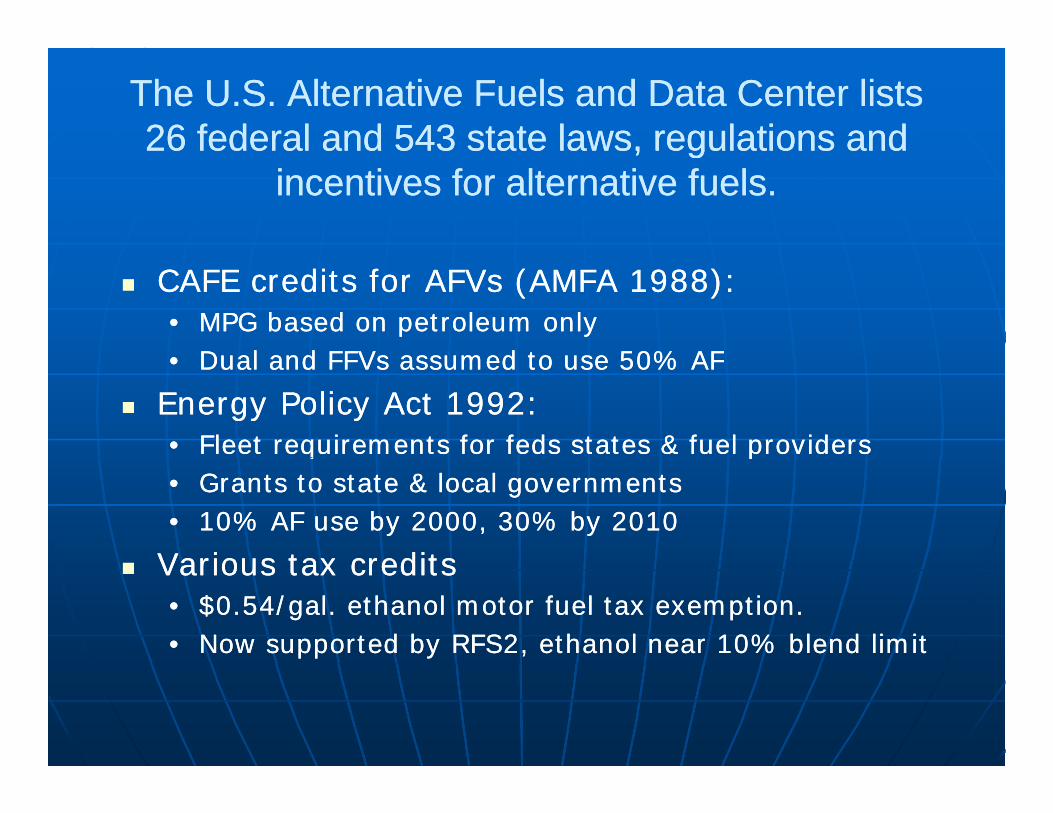
The U.S. Alternative Fuels and Data Center lists The U.S. Alternative Fuels and Data Center lists 26 federal and 543 state laws, regulations and26 federal and 543 state laws, regulations and26 federal and 543 state laws, regulations and 26 federal and 543 state laws, regulations and
incentives for alternative fuels. incentives for alternative fuels.
CAFE credits for AFVs (AMFA 1988): CAFE credits for AFVs (AMFA 1988): •• MPG based on petroleum onlyMPG based on petroleum only
Dual and FFVs assumed to use 50% AFDual and FFVs assumed to use 50% AF•• Dual and FFVs assumed to use 50% AFDual and FFVs assumed to use 50% AF
Energy Policy Act 1992:Energy Policy Act 1992:•• Fleet requirements for feds states & fuel providersFleet requirements for feds states & fuel providersq pq p•• Grants to state & local governmentsGrants to state & local governments•• 10% AF use by 2000, 30% by 201010% AF use by 2000, 30% by 2010
Various tax creditsVarious tax credits Various tax creditsVarious tax credits•• $0.54/gal. ethanol motor fuel tax exemption.$0.54/gal. ethanol motor fuel tax exemption.•• Now supported by RFS2, ethanol near 10% blend limitNow supported by RFS2, ethanol near 10% blend limit
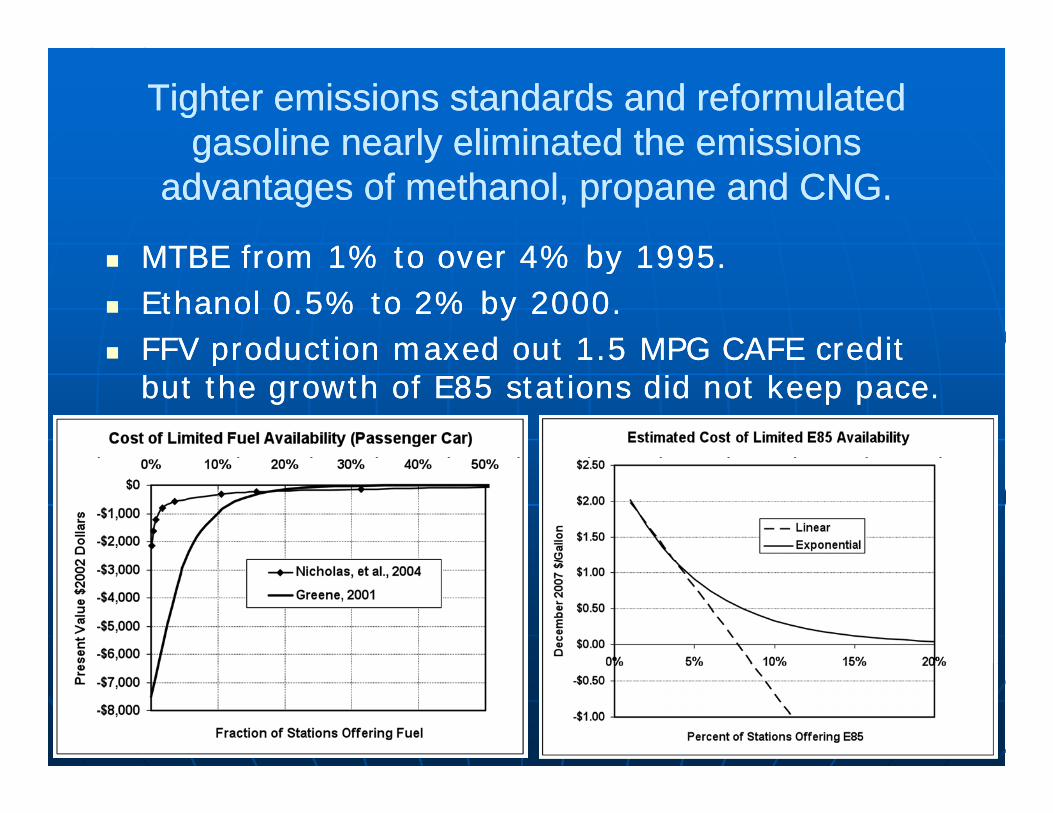
Tighter emissions standards and reformulated Tighter emissions standards and reformulated gasoline nearly eliminated the emissionsgasoline nearly eliminated the emissionsgasoline nearly eliminated the emissions gasoline nearly eliminated the emissions
advantages of methanol, propane and CNG.advantages of methanol, propane and CNG.
MTBE from 1% to over 4% by 1995MTBE from 1% to over 4% by 1995 MTBE from 1% to over 4% by 1995.MTBE from 1% to over 4% by 1995. Ethanol 0.5% to 2% by 2000.Ethanol 0.5% to 2% by 2000. FFV production maxed out 1.5 MPG CAFE credit FFV production maxed out 1.5 MPG CAFE credit FFV production maxed out 1.5 MPG CAFE credit FFV production maxed out 1.5 MPG CAFE credit
but the growth of E85 stations did not keep pace.but the growth of E85 stations did not keep pace.

The United States has conducted a broad and The United States has conducted a broad and expanding alternative fuel program since 1988.expanding alternative fuel program since 1988.expanding alternative fuel program since 1988. expanding alternative fuel program since 1988. What has been the result? What has been the result? (McNutt & Rodgers, 2004)(McNutt & Rodgers, 2004)
No significant change in alternative fuel useNo significant change in alternative fuel use No significant change in alternative fuel use.No significant change in alternative fuel use. Cleaner conventional fuels and significantly lower Cleaner conventional fuels and significantly lower
vehicle emissions.vehicle emissions.•• In 1999 the Toyota In 1999 the Toyota PriusPrius and Honda Insightand Honda Insight•• Honda’s lowHonda’s low--emission Accord produced tailpipe emission Accord produced tailpipe
emissions cleaner that the ambient L A airemissions cleaner that the ambient L A airemissions cleaner that the ambient L.A. air.emissions cleaner that the ambient L.A. air.
Millions of alternative fuel compatible vehicles on Millions of alternative fuel compatible vehicles on the road dominated by ethanol compatible the road dominated by ethanol compatible
hi lhi lvehicles.vehicles. Better understanding of alternative and Better understanding of alternative and
conventional fuel markets, and consumerconventional fuel markets, and consumer--conventional fuel markets, and consumerconventional fuel markets, and consumerproducer behavior.producer behavior.
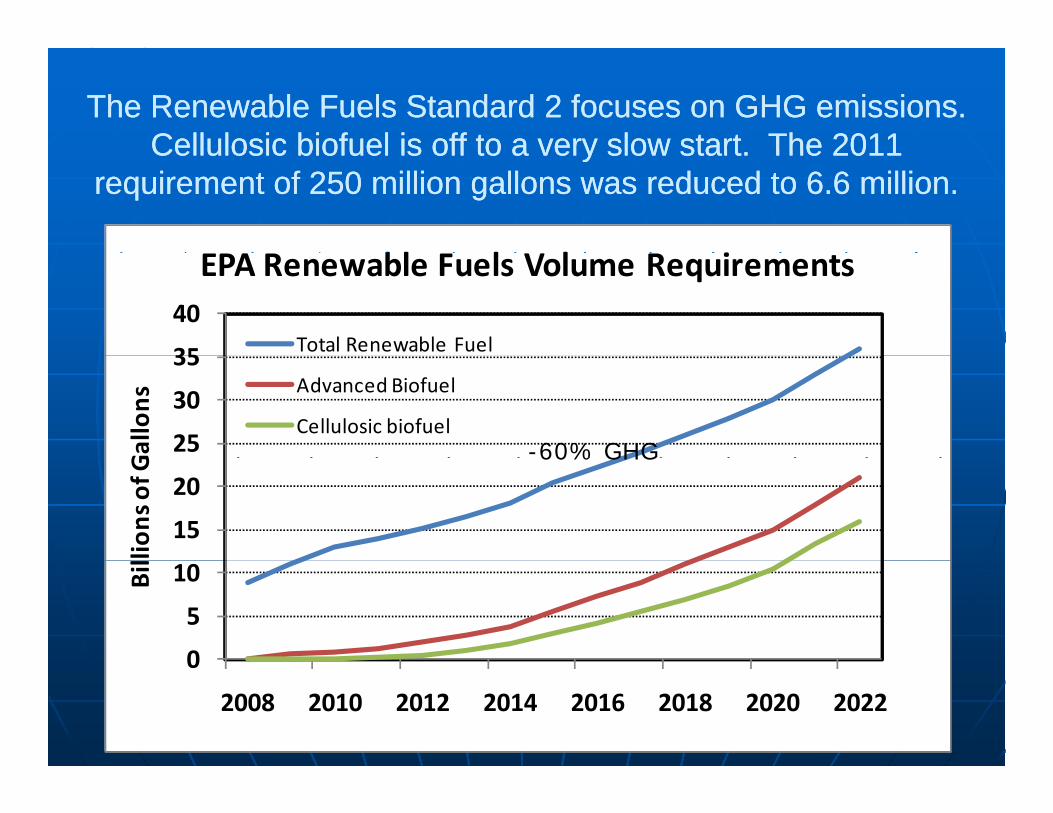
The Renewable Fuels Standard 2 focuses on GHG emissions. The Renewable Fuels Standard 2 focuses on GHG emissions. CellulosicCellulosic biofuelbiofuel is off to a very slow start The 2011is off to a very slow start The 2011Cellulosic Cellulosic biofuelbiofuel is off to a very slow start. The 2011 is off to a very slow start. The 2011
requirement of 250 million gallons was reduced to 6.6 million.requirement of 250 million gallons was reduced to 6.6 million.
bl l l i
35
40
EPA Renewable Fuels Volume Requirements
Total Renewable Fuel
25
30
35
Gallons
Advanced Biofuel
Cellulosic biofuel
-20% GHG
-50% GHG
-60% GHG
15
20
lions of G
60% GHG
0
5
10Bil
0
2008 2010 2012 2014 2016 2018 2020 2022
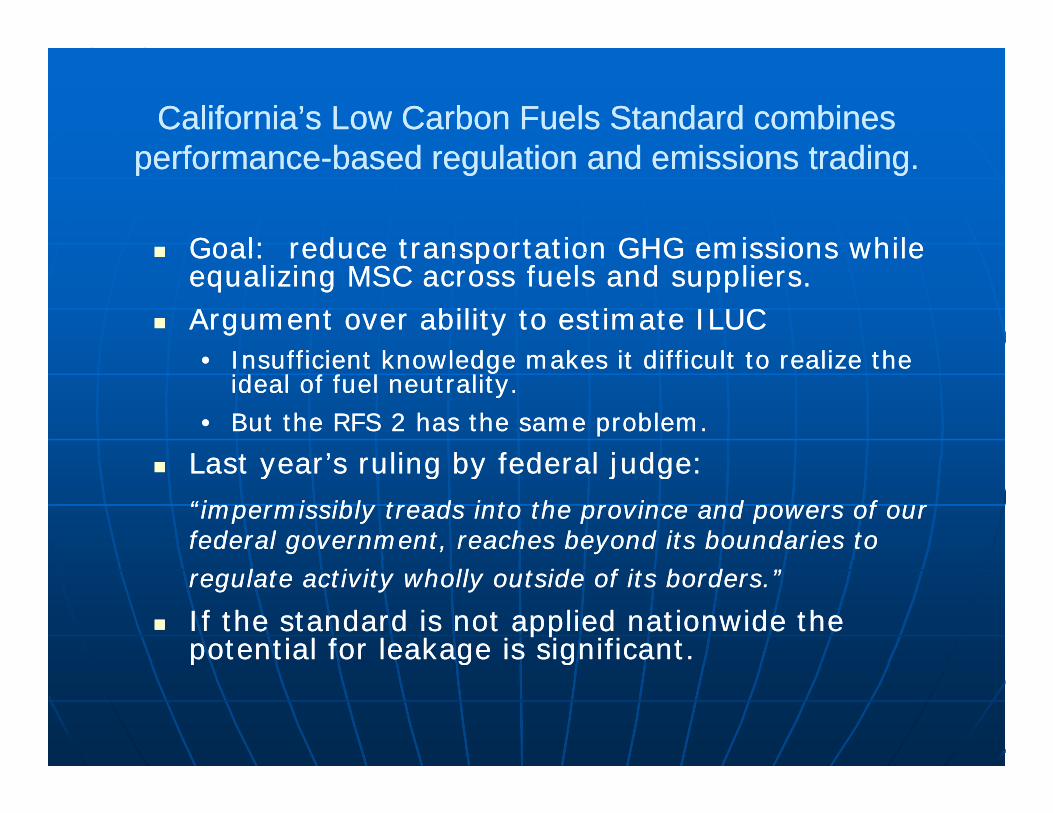
California’s Low Carbon Fuels Standard combines California’s Low Carbon Fuels Standard combines ff b d l ti d i i t dib d l ti d i i t diperformanceperformance--based regulation and emissions trading.based regulation and emissions trading.
Goal: reduce transportation GHG emissions while Goal: reduce transportation GHG emissions while Goal: reduce transportation GHG emissions while Goal: reduce transportation GHG emissions while equalizing MSC across fuels and suppliers.equalizing MSC across fuels and suppliers.
Argument over ability to estimate ILUCArgument over ability to estimate ILUCInsufficient knowledge makes it difficult to realize the Insufficient knowledge makes it difficult to realize the •• Insufficient knowledge makes it difficult to realize the Insufficient knowledge makes it difficult to realize the ideal of fuel neutrality.ideal of fuel neutrality.
•• But the RFS 2 has the same problem.But the RFS 2 has the same problem.
Last year’s ruling by federal judge:Last year’s ruling by federal judge: Last year’s ruling by federal judge:Last year’s ruling by federal judge:
“impermissibly treads into the province and powers of our “impermissibly treads into the province and powers of our federal government, reaches beyond its boundaries to federal government, reaches beyond its boundaries to
regulate activity wholly outside of its borders.”regulate activity wholly outside of its borders.”
If the standard is not applied nationwide the If the standard is not applied nationwide the potential for leakage is significant.potential for leakage is significant.p g gp g g
Lesson 1:Lesson 1:The incumbent technology will adapt.The incumbent technology will adapt.

Oil prices statistically appear to be a random walk, but they respond Oil prices statistically appear to be a random walk, but they respond to market changes and the limits on OPEC’s market powerto market changes and the limits on OPEC’s market powerto market changes and the limits on OPEC s market power.to market changes and the limits on OPEC s market power.Low oil prices can strand investments in alternative fuels.Low oil prices can strand investments in alternative fuels.
World Crude Oil Prices 1930 2010
$100
$120
World Crude Oil Prices, 1930‐2010
$ 2009 After OPECAlgeria
$80
$100
Barrel
$ NominalAlgeria Angola Ecuador Iran Iraq
$40
$60
Dollars per Iraq
Kuwait Libya Nigeria Qatar
$20
$40
2009
Before OPEC
Qatar Saudi Arabia UAE Venezuela
$0
1930 1940 1950 1960 1970 1980 1990 2000 2010
Source: BP Statistical Review 2010.Venezuela

Lesson 2:Lesson 2:M k t d ’t ilM k t d ’t ilMass markets don’t necessarily grow Mass markets don’t necessarily grow
out of niche markets.out of niche markets.

Lesson 3:Lesson 3:Fleets are often not the best place toFleets are often not the best place toFleets are often not the best place to Fleets are often not the best place to nurture alternative fuels and vehicles.nurture alternative fuels and vehicles.

Lesson 4:Lesson 4:Lesson 4:Lesson 4:The political system has not yet shown The political system has not yet shown
illi t i i ifi tilli t i i ifi ta willingness to impose significant a willingness to impose significant visible costs on private players.visible costs on private players.

Lesson 5:Lesson 5:Lesson 5:Lesson 5:Unregulated and unsubsidized private Unregulated and unsubsidized private
sector investment in refuelingsector investment in refuelingsector investment in refueling sector investment in refueling infrastructure has been very limited.infrastructure has been very limited.
(vehicle manufacturing)(vehicle manufacturing)

L 6L 6Lesson 6:Lesson 6:Mainstream consumers are unwilling to Mainstream consumers are unwilling to
accept the disadvantages of alternative fuels.accept the disadvantages of alternative fuels.
The social benefits of alternative fuels are not The social benefits of alternative fuels are not valued by mainstream consumers.valued by mainstream consumers.yy
Lesson 7:Lesson 7:CCCoordination between auto and oil Coordination between auto and oil
industries is vital.industries is vital.

Lesson 8:Lesson 8:In both the auto and oil industriesIn both the auto and oil industriesIn both the auto and oil industries, In both the auto and oil industries,
scale is critically important.scale is critically important.
McNutt and Rodgers conclusions McNutt and Rodgers conclusions ill lid dill lid dstill seem valid today.still seem valid today.
Lower energy density fuels significantly raise the Lower energy density fuels significantly raise the gy y g ygy y g ycost of infrastructure and impose ongoing time cost of infrastructure and impose ongoing time costs on consumers.costs on consumers.Th i t l i t b fit f AFV t Th i t l i t b fit f AFV t The incremental private benefits of AFVs to The incremental private benefits of AFVs to consumers are likely to be small. Policies to consumers are likely to be small. Policies to value the social benefits will be needed.value the social benefits will be needed.
Infrastructure development may be the limiting Infrastructure development may be the limiting factor. Private sector investment is likely to be factor. Private sector investment is likely to be inadequate to traverse the “valley of death”inadequate to traverse the “valley of death”inadequate to traverse the valley of death .inadequate to traverse the valley of death .
What’s different:What’s different:•• Climate ChangeClimate ChangeClimate ChangeClimate Change•• SustainabilitySustainability

Achieving climate protection goals will likely require a largeAchieving climate protection goals will likely require a large--scale energy transition. There are real economic barriers scale energy transition. There are real economic barriers gygy
to displacing the incumbent technology.to displacing the incumbent technology.
Lack of scale economiesLack of scale economies Lack of scale economiesLack of scale economies Need for learning by doingNeed for learning by doing Lack of choice diversityLack of choice diversityyy Risk aversion Risk aversion Fuel availability “chicken or egg”Fuel availability “chicken or egg” Uncertainty of technological changeUncertainty of technological change Petroleum price responsePetroleum price response
k t i f ti k t i f ti + market imperfections+ market imperfections•• ExternalitiesExternalities•• Energy efficiency paradox (behavioral economics)Energy efficiency paradox (behavioral economics)gy y p ( )gy y p ( )•• Monopoly power in world oil marketsMonopoly power in world oil markets

Upfront costs of a fuel transition can prevent or Upfront costs of a fuel transition can prevent or significantly delay the transitionsignificantly delay the transitionsignificantly delay the transition.significantly delay the transition.
Simulated Auto Industry Cash Flow From Sale of Hydrogen Fuel Cell Vehicles, No Policy Case
$3
Cash Flow for H2 Transition Scenario
150
-$1
$0
$1
$2
2010 2015 2020 2025
of D
olla
rs
Scenario3Scenario2Scenario1
-50
0
50
100
2005 2010 2015 2020 2025
dolla
rs/y
ear
Capital
O&M
-$4
-$3
-$2
-$1
Billi
ons
o
-250
-200
-150
-100
Mill
ion
d
H2 sales
Cash flow
Cumulative cash-$5 Year flow Ogden and Nicholas, 2011.Greene et al., 2008
NRC 2008
NRC 2010

Technological progress is uncertain.Technological progress is uncertain.(And the incumbent technology will adapt.)(And the incumbent technology will adapt.)
Cost Estimates of Automotive Fuel Cell Systems at Full Scale and Learning (DTI 2011 2009) and Extrapolations
$275
$250
$300
and Learning (DTI, 2011, 2009) and Extrapolations
DTI Estimates
Power
$200
kW
Quadratic
Logarithmic
Exponential
$106$$100
$150
Dollars per Exponential
$94$75
$61
$51$48$50
$100
$02002 2004 2006 2008 2010 2012 2014 2016 2018 2020
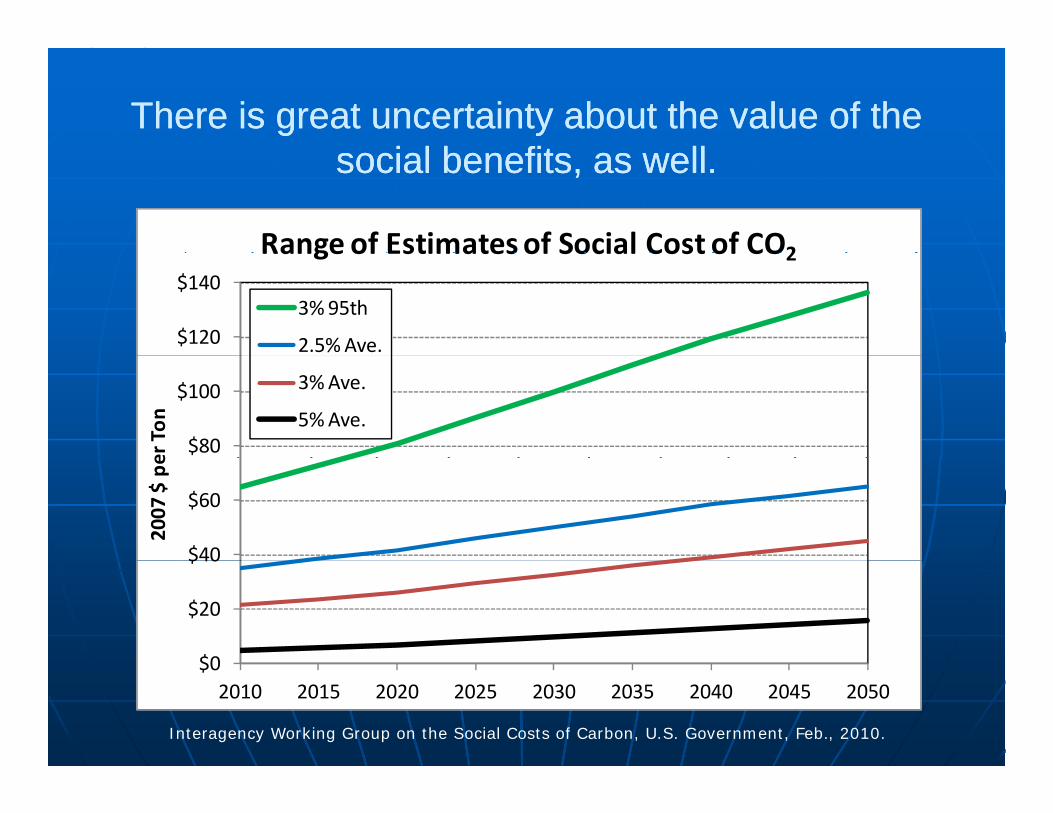
There is great uncertainty about the value of the There is great uncertainty about the value of the i l b fit lli l b fit llsocial benefits, as well.social benefits, as well.
Range of Estimatesof Social Cost of CO2
$120
$140
Range of Estimates of Social Cost of CO2
3% 95th
2.5% Ave.
$80
$100
er Ton
3% Ave.
5% Ave.
$40
$60
2007
$ pe
$0
$20
$40
$02010 2015 2020 2025 2030 2035 2040 2045 2050
Interagency Working Group on the Social Costs of Carbon, U.S. Government, Feb., 2010.
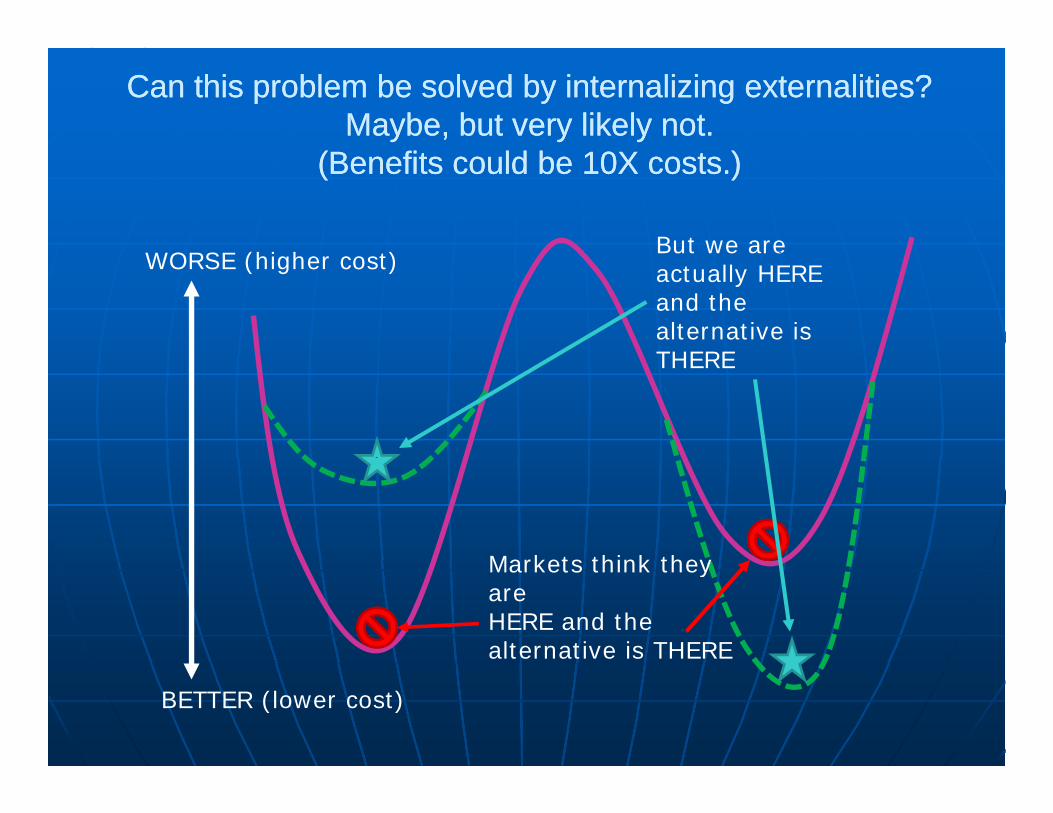
Can this problem be solved by internalizing externalities? Can this problem be solved by internalizing externalities? Maybe, but very likely not.Maybe, but very likely not.
(Benefits could be 10X costs.)(Benefits could be 10X costs.)
WORSE (hi h t)But we are
WORSE (higher cost)But we are actually HERE and the alternative is THERETHERE
Markets think they Markets think they are HERE and the alternative is THERE
BETTER (lower cost)
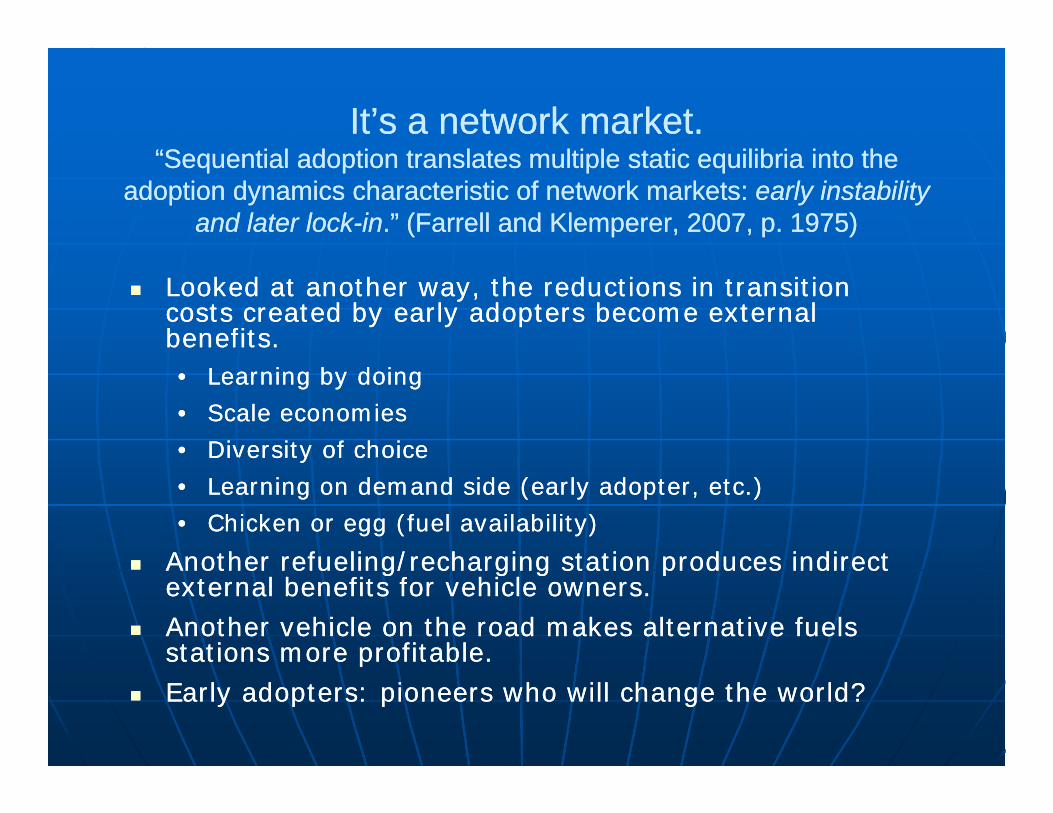
It’s a network market.It’s a network market.““S ti l d ti t l t lti l t tiS ti l d ti t l t lti l t ti ilib iilib i i t thi t th““Sequential adoption translates multiple static Sequential adoption translates multiple static equilibriaequilibria into the into the
adoption dynamics characteristic of network markets: adoption dynamics characteristic of network markets: early instability early instability and later lockand later lock--inin.” (Farrell and Klemperer, 2007, p. 1975).” (Farrell and Klemperer, 2007, p. 1975)
Looked at another way, the reductions in transition Looked at another way, the reductions in transition costs created by early adopters become costs created by early adopters become external external benefits.benefits.•• Learning by Learning by doingdoing
•• Scale economiesScale economies
•• Diversity of choiceDiversity of choicee s ty o c o cee s ty o c o ce
•• Learning on demand side (early adopter, etc.)Learning on demand side (early adopter, etc.)
•• Chicken or egg (fuel availabilityChicken or egg (fuel availability))
Another refueling/recharging station produces indirect Another refueling/recharging station produces indirect Another refueling/recharging station produces indirect Another refueling/recharging station produces indirect external benefits for vehicle owners.external benefits for vehicle owners.
Another vehicle on the road makes alternative fuels Another vehicle on the road makes alternative fuels stations more profitable.stations more profitable.pp
Early adopters: pioneers who will change the world?Early adopters: pioneers who will change the world?

Thank you.Thank you.
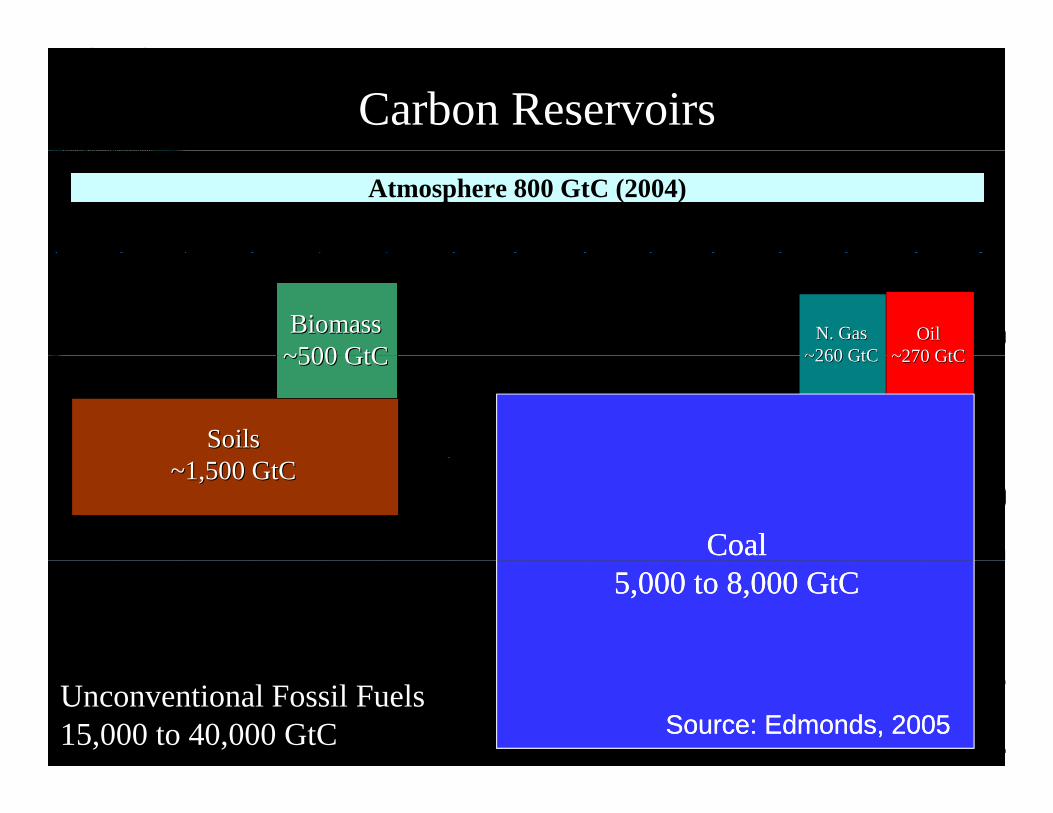
Carbon ReservoirsAtmosphere 800 GtC (2004)
BiomassBiomass500500 GtCGtC
OilOil270270 GtCGtC
N. GasN. Gas260~260 GtCGtC~500 ~500 GtCGtC
SoilsSoils
~270 ~270 GtCGtC~260 ~260 GtCGtC
~1,500 ~1,500 GtCGtC
CoalCoal5,000 to 8,000 GtC5,000 to 8,000 GtC
14
Unconventional Fossil Fuels15,000 to 40,000 GtC Source: Edmonds, 2005Source: Edmonds, 2005
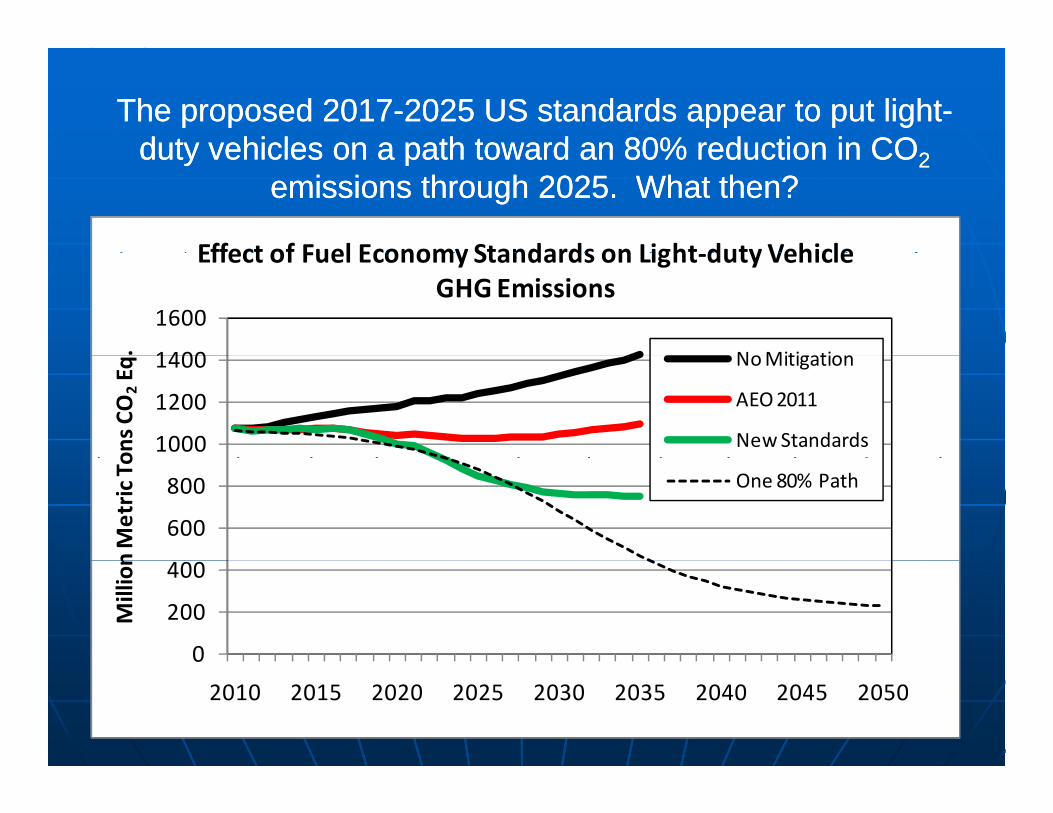
The proposed 2017The proposed 2017--2025 US standards appear to put light2025 US standards appear to put light--duty vehicles on a path toward an 80% reduction in COduty vehicles on a path toward an 80% reduction in COduty vehicles on a path toward an 80% reduction in COduty vehicles on a path toward an 80% reduction in CO22
emissions through 2025. What then? emissions through 2025. What then?
Effect of Fuel Economy Standards on Light duty Vehicle
1400
1600
.
Effect of Fuel Economy Standards on Light‐duty Vehicle GHG Emissions
NoMitigation
1000
1200
1400
ons CO
2Eq
No Mitigation
AEO 2011
New Standards
600
800
n Metric To One 80% Path
0
200
400
Million
2010 2015 2020 2025 2030 2035 2040 2045 2050

Argonne’s Multipath study, like MIT’s Argonne’s Multipath study, like MIT’s On the Road in On the Road in 20352035 foresees gradual improvements in technology but foresees gradual improvements in technology but g p gyg p gy
not enough to make their prices less than an ICE.not enough to make their prices less than an ICE.
Long‐run Cost Estimates of ANL 2009 Multipath Study
$40 000
$45,000
$50,000
Markup
$30,000
$35,000
$40,000 Markup
Glider Cost
Other
Exhaust
Fuel System
$15 000
$20,000
$25,000Fuel System
High V Energy Storage
Transmission
Controller Inverter
M
$5,000
$10,000
$15,000 Motor
Generator
Fuel Cell
Engine
$02015 2030 2045 2015 2030 2045 2015 2030 2045 2015 2030 2045 2015 2030 2045
ICE 2007 EV FCV HEV PHEV40
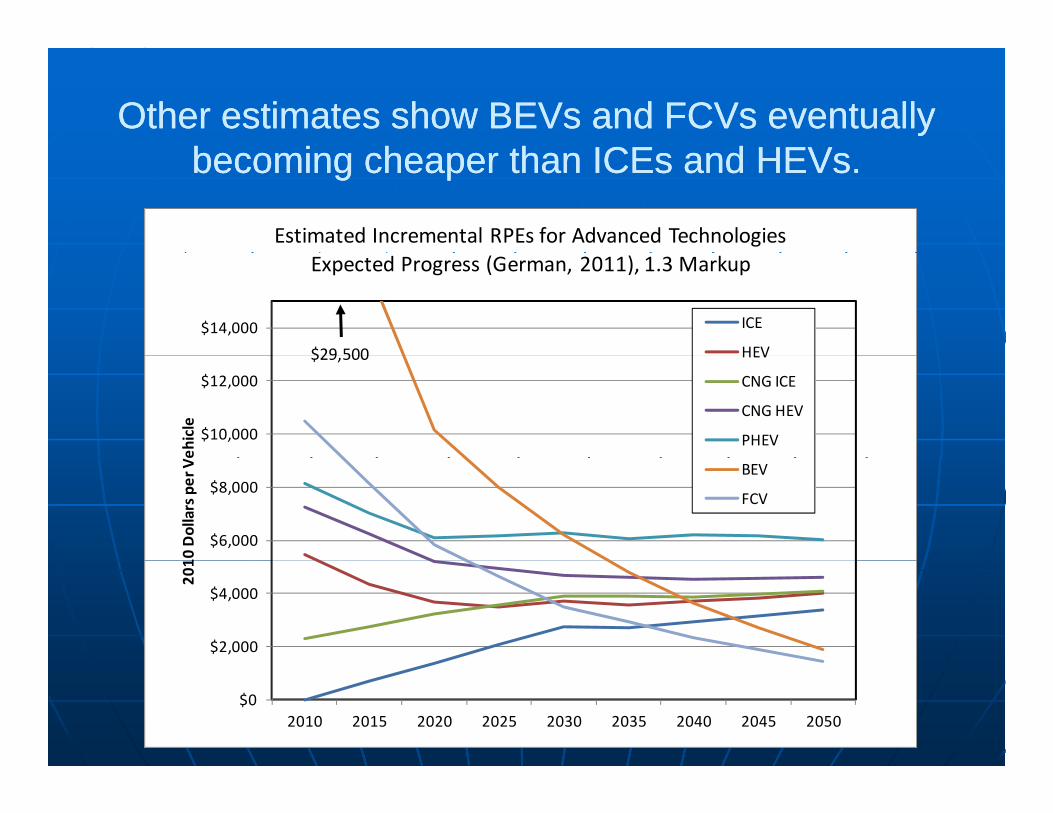
Other estimates show BEVs and FCVs eventually Other estimates show BEVs and FCVs eventually b i h th ICE d HEVb i h th ICE d HEVbecoming cheaper than ICEs and HEVs.becoming cheaper than ICEs and HEVs.
Estimated Incremental RPEs for Advanced Technologies
$14,000
Expected Progress (German, 2011), 1.3 Markup
ICE
HEV$29 500
$10,000
$12,000
ehicle
HEV
CNG ICE
CNG HEV
PHEV
$29,500
$6,000
$8,000
10 Dollars per V BEV
FCV
$2,000
$4,000
201
$02010 2015 2020 2025 2030 2035 2040 2045 2050

Is a transition Is a transition to to alternative energy vehicles alternative energy vehicles likely to be worth it?likely to be worth it?likely to be worth it?likely to be worth it?
Based on the NRC 2009 study of “maximum Based on the NRC 2009 study of “maximum practicable” hydrogen fuel cell vehicles study.practicable” hydrogen fuel cell vehicles study. Rough estimation based on figures 6.32 and 6.33:Rough estimation based on figures 6.32 and 6.33:
Approx. 20 Approx. 20 GigatonsGigatons cumulative COcumulative CO22 reduction by reduction by 20502050
Approx. 50 billion barrels of reduced petroleum Approx. 50 billion barrels of reduced petroleum consumptionconsumption
C ti t d ll & C ti t d ll & di t ddi t d Converting to dollars & Converting to dollars & undiscounted:undiscounted: CO2 at $50/tonCO2 at $50/ton $$1 Trillion1 Trillion Oil security at $20/bblOil security at $20/bbl $$1 Trillion1 Trillion Oil security at $20/bblOil security at $20/bbl $$1 Trillion1 Trillion
Very roughly, estimated Very roughly, estimated excess cost of transition excess cost of transition appears to be an order appears to be an order of of magnitude smaller than magnitude smaller than the estimated value the estimated value of public of public benefits (assuming benefits (assuming the estimated value the estimated value of public of public benefits (assuming benefits (assuming technology development is successful).technology development is successful).

If the external benefits of early adoption were “visible” If the external benefits of early adoption were “visible” there there would would bb i t l “ illii t l “ illi tt ”” f l i hi l if l i hi l ibe be a a societal “willingnesssocietal “willingness--toto--pay” pay” for placing more vehicles in for placing more vehicles in
operation operation as well as consumers’ “willingnessas well as consumers’ “willingness--toto--accept” accept” a vehiclea vehicle..
$ Required subsidy per vehicle(willingness to accept)
SocialSurplus (willingness to accept)
External benefits per vehicle(willingness to pay)
Consumers’ SurplusPt
Number of Vehicles Year t
(willingness to pay)
0 Nt Number of Vehicles, Year t

The transition process contains important positive The transition process contains important positive feedbacks loops, making it path dependent. feedbacks loops, making it path dependent. p g p pp g p p
Parameters& Policies
Technical Attributes& Prices Of Vehicles
Innovators& Majority
BaselineProjectionsj y j
Vehicle ChoiceCalibration
Vehicle Choice &Utility Decompositiony p
Vehicle SalesEnergy
Vehicle Stock
Vehicle Use
Infrastructure& Costs
Results Summary e c e Use
Energy UsePHEV Energy Use
esu ts Su a y
ScenariosSt d
GHG EmissionsStored
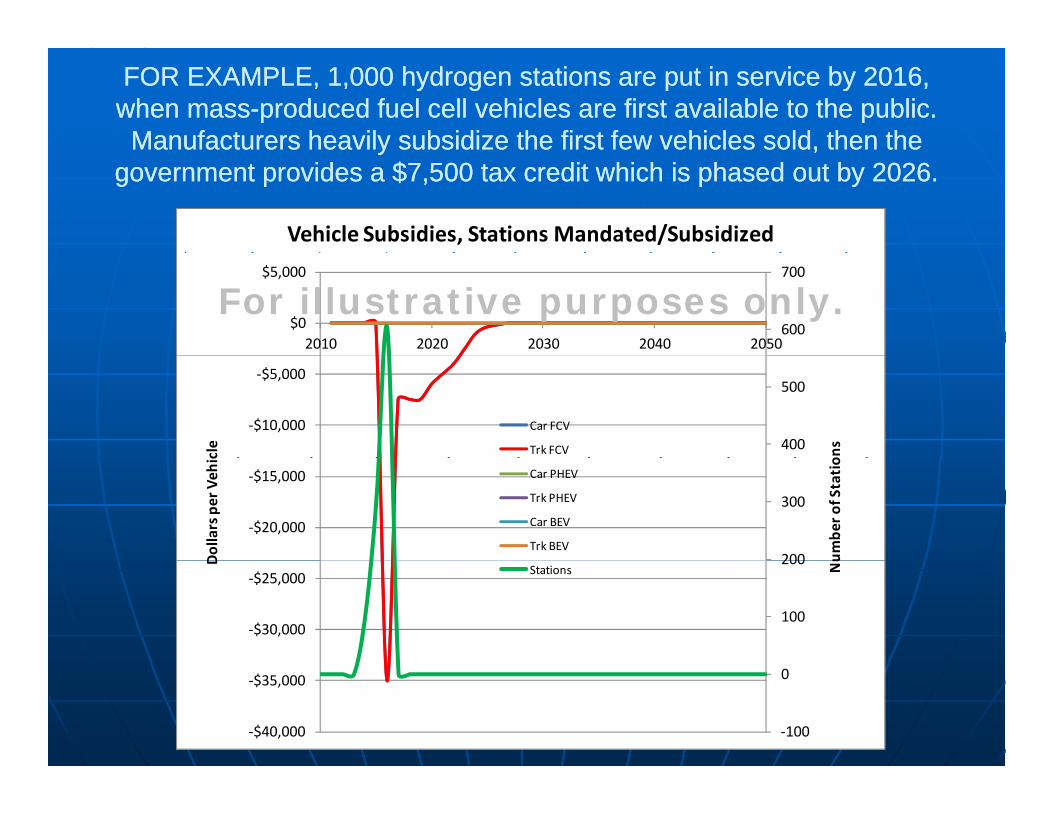
FOR EXAMPLE, 1,000 hydrogen stations are put in service by 2016, FOR EXAMPLE, 1,000 hydrogen stations are put in service by 2016, when masswhen mass--produced fuel cell vehicles are first available to the public. produced fuel cell vehicles are first available to the public.
Manufacturers heavily subsidize the first few vehicles sold, then the Manufacturers heavily subsidize the first few vehicles sold, then the y ,y ,government provides a $7,500 tax credit which is phased out by 2026.government provides a $7,500 tax credit which is phased out by 2026.
Vehicle Subsidies, Stations Mandated/Subsidized
600
700
$0
$5,000
2010 2020 2030 2040 2050
For illustrative purposes only.
400
500
‐$10,000
‐$5,000
ons
cle
Car FCV
Trk FCV
200
300
‐$20,000
‐$15,000
umbe
r of Statio
Dollars per Veh
ic
Car PHEV
Trk PHEV
Car BEV
Trk BEV
100
200
‐$30,000
‐$25,000
NuD
Stations
‐100
0
‐$40,000
‐$35,000
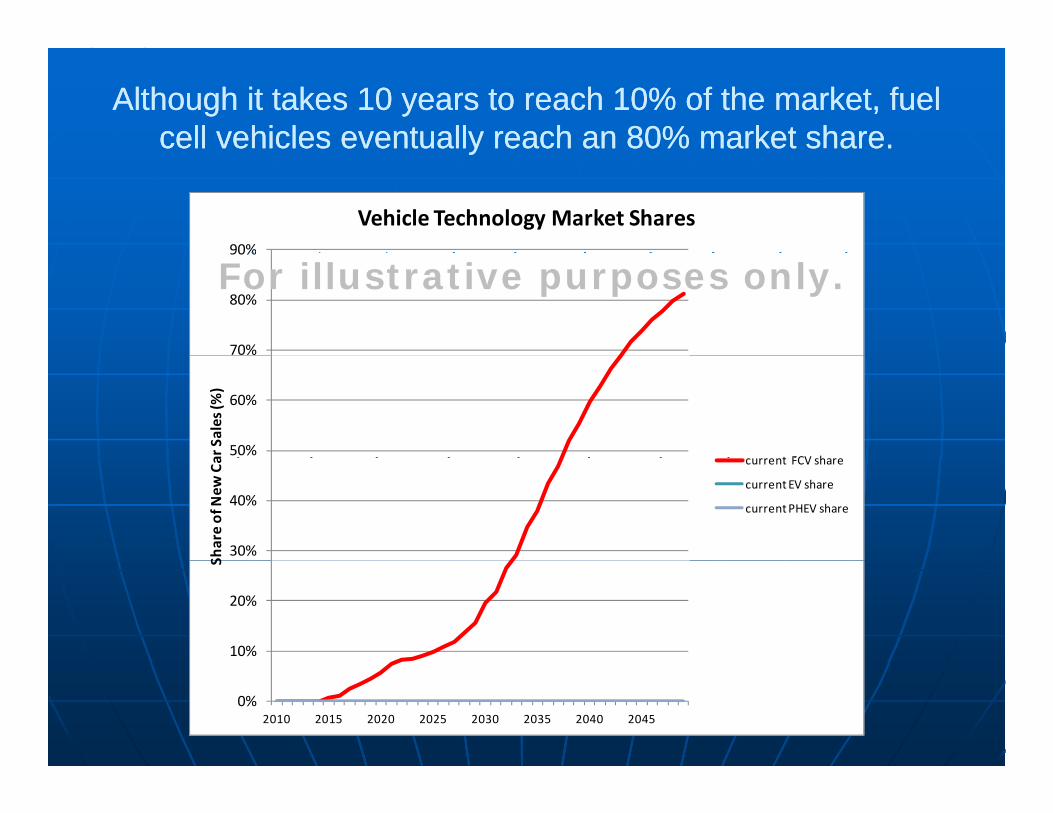
Although it takes 10 years to reach 10% of the market, fuel Although it takes 10 years to reach 10% of the market, fuel cell vehicles eventually reach an 80% market share.cell vehicles eventually reach an 80% market share.yy
90%
Vehicle Technology Market Shares
70%
80%
90%
For illustrative purposes only.
50%
60%
ar Sales (%
)
t FCV h
30%
40%
Share of New
Ca current FCV share
current EV share
current PHEV share
10%
20%
S
0%2010 2015 2020 2025 2030 2035 2040 2045
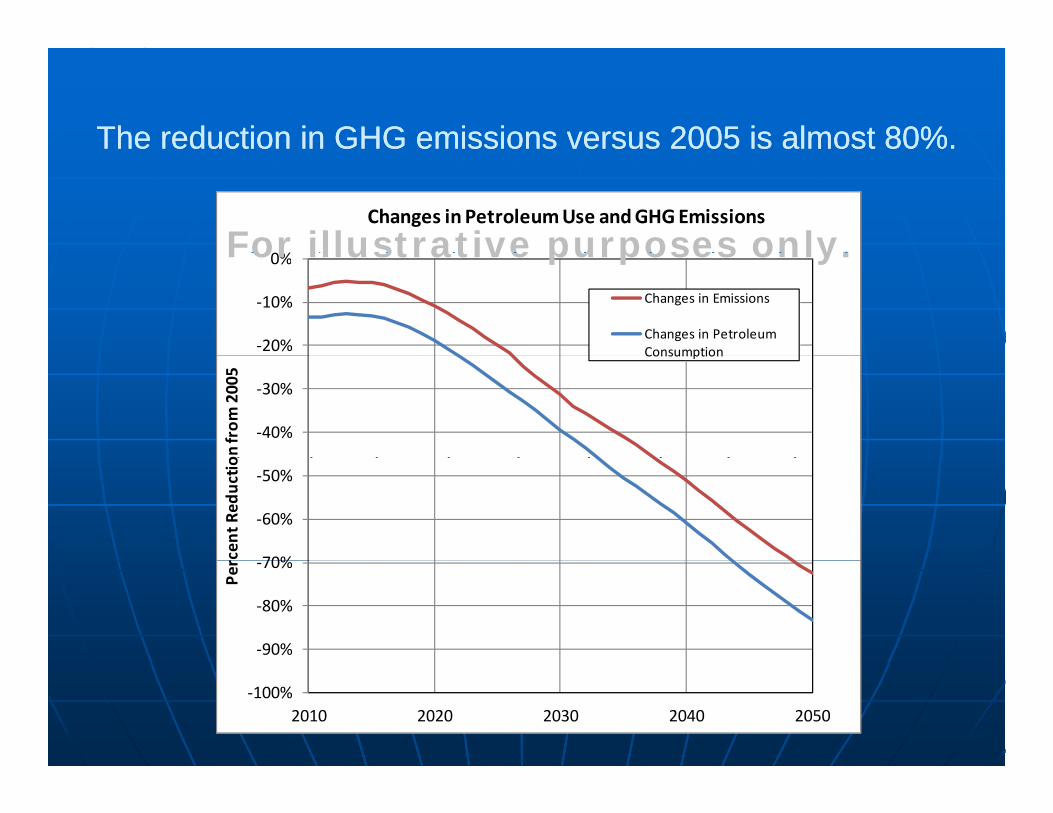
The reduction in GHG emissions versus 2005 is almost 80%.The reduction in GHG emissions versus 2005 is almost 80%.
0%
Changes in Petroleum Use and GHG Emissions
For illustrative purposes only.
‐20%
‐10%
0%
Changes in Emissions
Changes in Petroleum Consumption
For illustrative purposes only.
‐40%
‐30%
on from
2005
Consumption
70%
‐60%
‐50%
rcen
t Red
uctio
‐90%
‐80%
‐70%
Per
‐100%2010 2020 2030 2040 2050
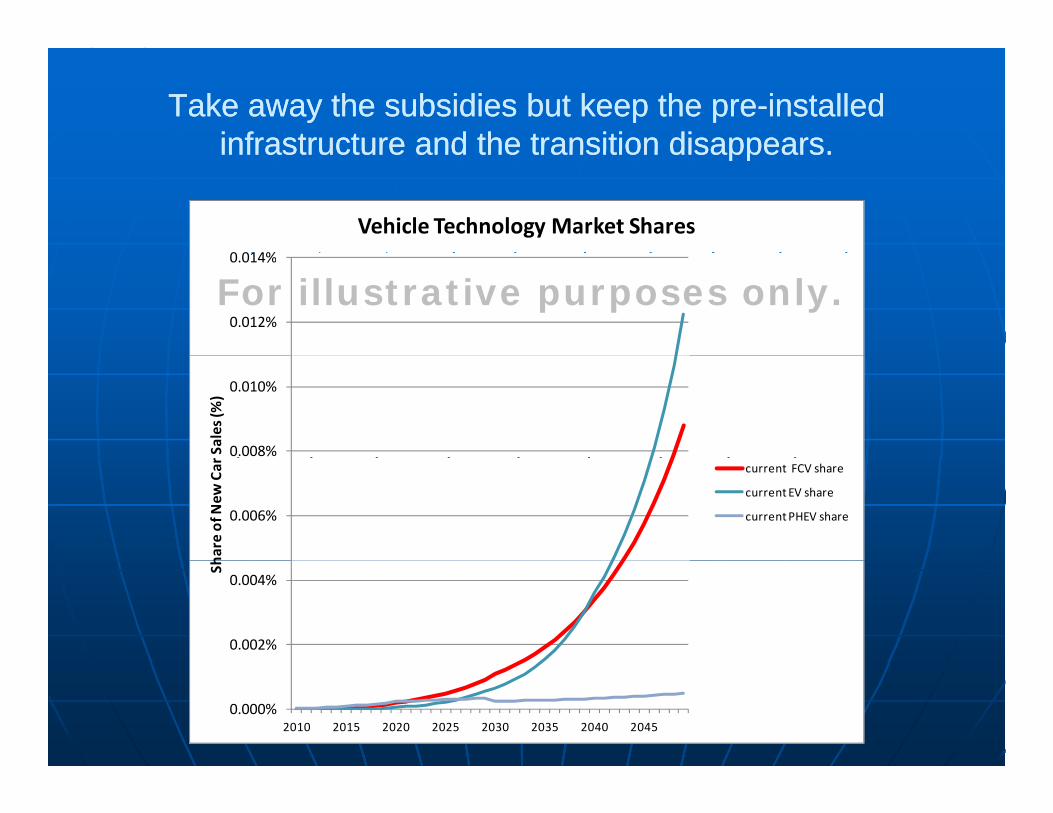
Take away the subsidies but keep the preTake away the subsidies but keep the pre--installed installed infrastructure and the transition disappearsinfrastructure and the transition disappearsinfrastructure and the transition disappears.infrastructure and the transition disappears.
0 014%
Vehicle Technology Market Shares
0.012%
0.014%
For illustrative purposes only.
0.008%
0.010%
Sales (%
)
0.006%
hare of N
ew Car current FCV share
current EV share
current PHEV share
0.002%
0.004%
Sh
0.000%2010 2015 2020 2025 2030 2035 2040 2045
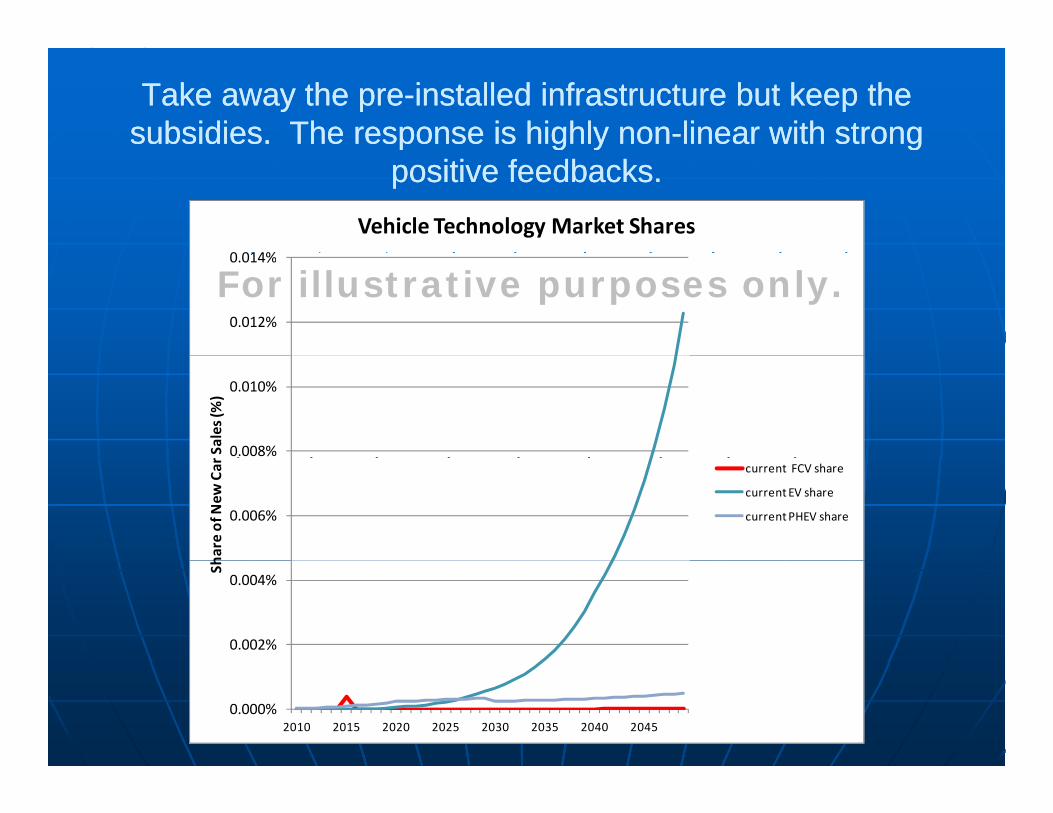
Take away the preTake away the pre--installed infrastructure but keep the installed infrastructure but keep the subsidies. The response is highly nonsubsidies. The response is highly non--linear with strong linear with strong g yg y gg
positive feedbacks.positive feedbacks.
0 014%
Vehicle Technology Market Shares
0.012%
0.014%
For illustrative purposes only.
0.008%
0.010%
Sales (%
)
0.006%
hare of N
ew Car current FCV share
current EV share
current PHEV share
0.002%
0.004%
Sh
0.000%2010 2015 2020 2025 2030 2035 2040 2045
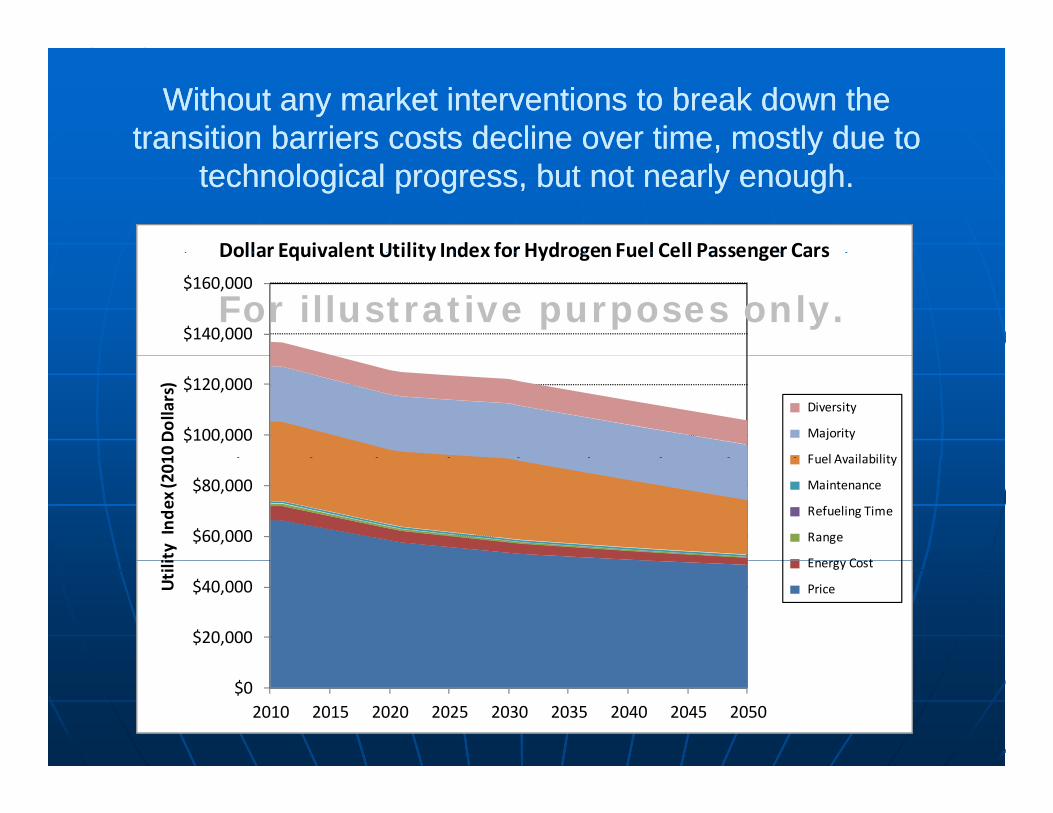
Without any market interventions to break down the Without any market interventions to break down the transition barriers costs decline over time, mostly due to transition barriers costs decline over time, mostly due to , y, y
technological progress, but not nearly enough.technological progress, but not nearly enough.
Dollar Equivalent Utility Index for HydrogenFuel Cell Passenger Cars
$140,000
$160,000
Dollar Equivalent Utility Index for Hydrogen Fuel Cell Passenger Cars
For illustrative purposes only.
$100,000
$120,000
10 Dollars)
Diversity
Majority
Fuel Availability
$60,000
$80,000
ity In
dex (201 Fuel Availability
Maintenance
Refueling Time
Range
E C t
$20,000
$40,000Utili Energy Cost
Price
$02010 2015 2020 2025 2030 2035 2040 2045 2050
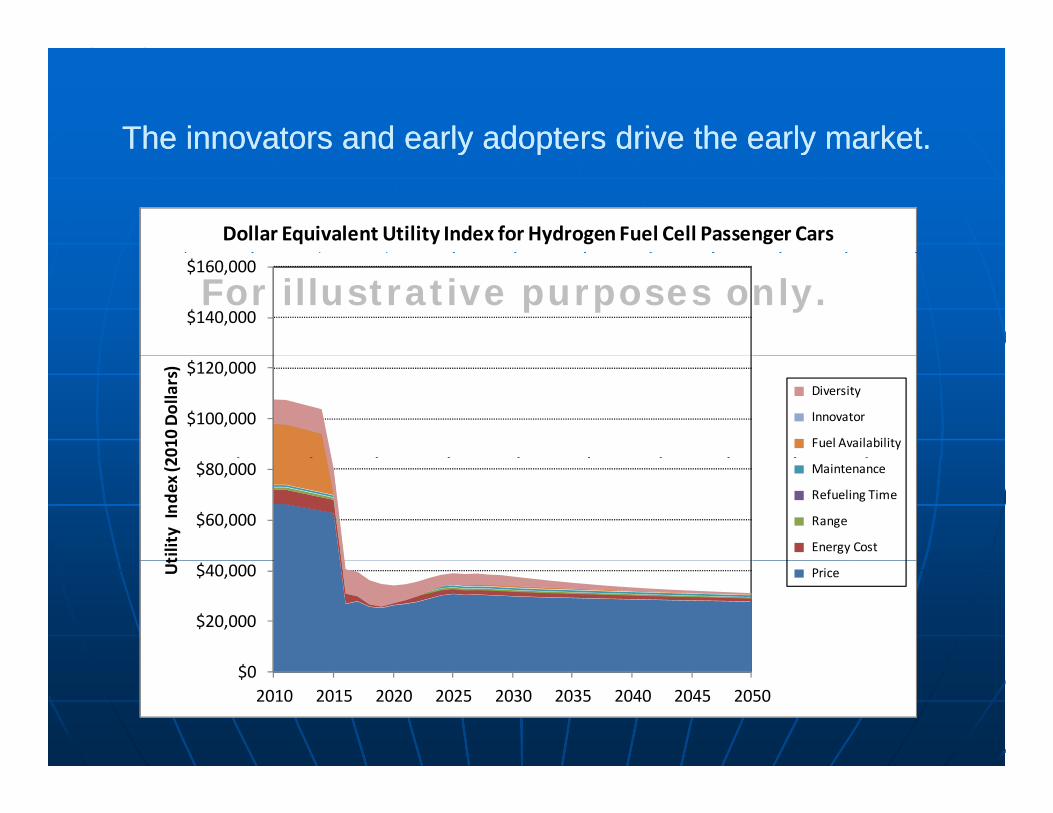
The innovators and early adopters drive the early market.The innovators and early adopters drive the early market.y p yy p y
Dollar Equivalent Utility Index for Hydrogen Fuel Cell Passenger Cars
$140,000
$160,000
For illustrative purposes only.
$100,000
$120,000
2010
Dollars)
Diversity
Innovator
Fuel Availability
$60,000
$80,000
tility In
dex (2 Maintenance
Refueling Time
Range
Energy Cost
$20,000
$40,000Ut
Price
$02010 2015 2020 2025 2030 2035 2040 2045 2050

PrePre--installation of refueling infrastructure and vehicle installation of refueling infrastructure and vehicle subsidies are effective even though majority consumers’ subsidies are effective even though majority consumers’
risk aversion, lack of diversity in vehicle choices, and risk aversion, lack of diversity in vehicle choices, and higher fuel costs must still be overcome.higher fuel costs must still be overcome.
$140,000
$160,000
Dollar Equivalent Utility Index for Hydrogen Fuel Cell Passenger Cars
For illustrative purposes only.
$100,000
$120,000
$ 0,000
Dollars)
Diversity
Majority
$60,000
$80,000
$ ,
y In
dex (2010
Fuel Availability
Maintenance
Refueling Time
Range
$20,000
$40,000Utility
Energy Cost
Price
$02010 2015 2020 2025 2030 2035 2040 2045 2050

Important questions remain to be answered.Important questions remain to be answered.Important questions remain to be answered.Important questions remain to be answered.
How can we accomplish largeHow can we accomplish large--scale energy scale energy p gp g gygytransitions for the public good?transitions for the public good?•• Are there ways to transform the market so that Are there ways to transform the market so that
positive external benefits are valued?positive external benefits are valued?pp•• How can the private benefits of alternative How can the private benefits of alternative
technologies be made known and enhanced?technologies be made known and enhanced?•• How can we cope with technology & market How can we cope with technology & market •• How can we cope with technology & market How can we cope with technology & market
uncertainties?uncertainties?•• What are the robust, efficient supporting policies?What are the robust, efficient supporting policies?
How much can we reduce uncertainty about the How much can we reduce uncertainty about the How much can we reduce uncertainty about the How much can we reduce uncertainty about the transition processes and parameters so that we transition processes and parameters so that we better understand the challenges?better understand the challenges?
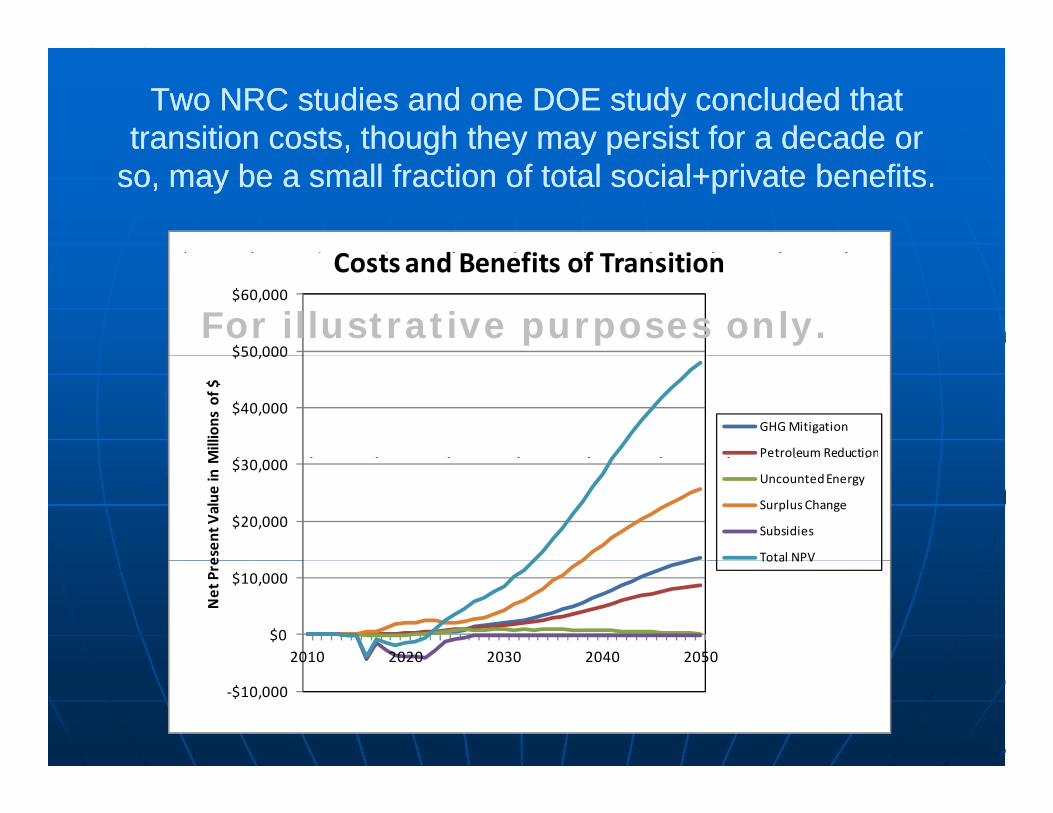
Two NRC studies and one DOE study concluded that Two NRC studies and one DOE study concluded that transition costs, though they may persist for a decade or transition costs, though they may persist for a decade or , g y y p, g y y p
so, may be a small fraction of total so, may be a small fraction of total social+privatesocial+private benefits. benefits.
C d fi f i i
$50,000
$60,000
Costs and Benefits of Transition
For illustrative purposes only.
$40,000
$50,000
Millions of $
GHG Mitigation
Petroleum Reduction
$20,000
$30,000
esen
t Value
in M
Uncounted Energy
Surplus Change
Subsidies
Total NPV
$0
$10,000
2010 2020 2030 2040 2050
Net Pre
Total NPV
‐$10,000
Thesis: We lack a public policy paradigm and the Thesis: We lack a public policy paradigm and the analytical tools to manage such a large scaleanalytical tools to manage such a large scaleanalytical tools to manage such a large scale analytical tools to manage such a large scale
energy transition for the public good.energy transition for the public good.
Technological outcomes are uncertain.Technological outcomes are uncertain. Energy prices are uncertain.Energy prices are uncertain.gy pgy p Magnitudes of the market barriers are Magnitudes of the market barriers are
uncertain.uncertain. Consumer values are uncertain.Consumer values are uncertain. Value of public goods also uncertain.Value of public goods also uncertain.p gp g And yet, solutions appear to require And yet, solutions appear to require
urgent, transforming action.urgent, transforming action.
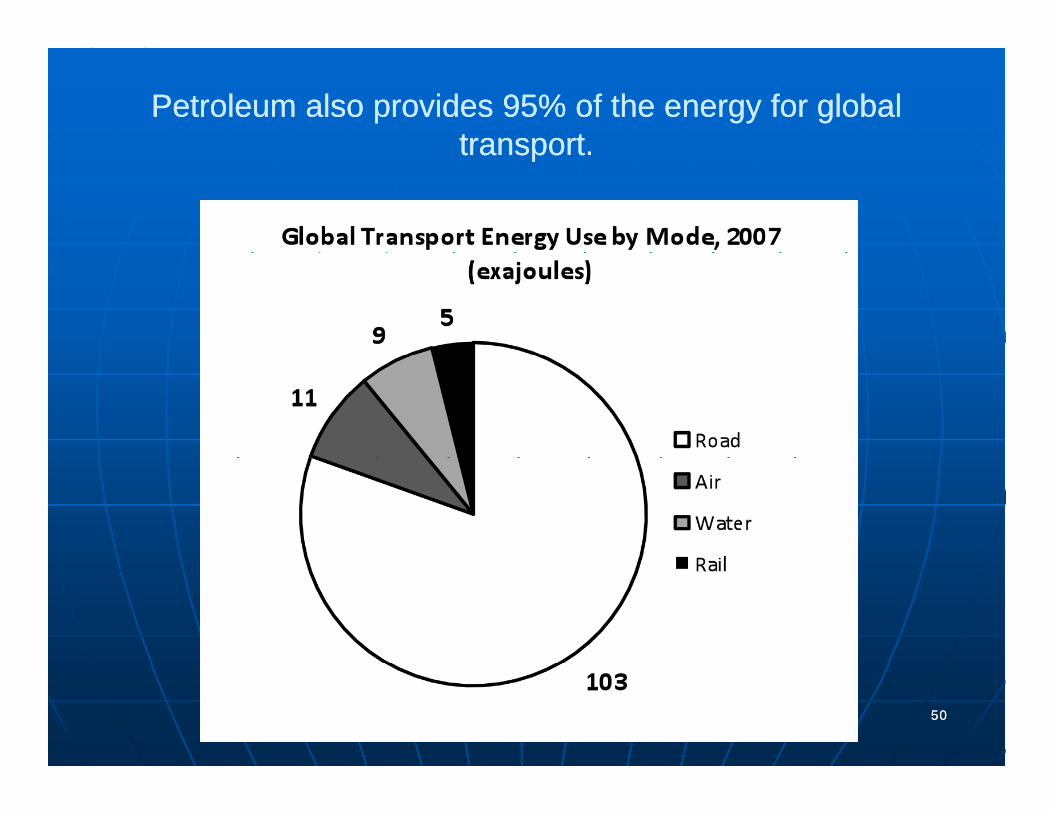
Petroleum also provides 95% of the energy for global Petroleum also provides 95% of the energy for global transporttransporttransport. transport.
5050