Alternative Energy Sources
55
Alternative Energy Sources San Jose State University FX Rongère January 2009
description
Alternative Energy Sources. San Jose State University FX Rongère January 2009. Introduction The Time is now. San Jose State University FX Rongère January 2009. Renewable Energies: the Time is now. What has changed? Global Warming China and emerging countries Technology - PowerPoint PPT Presentation
Transcript of Alternative Energy Sources

Alternative Energy Sources
San Jose State UniversityFX Rongère
January 2009

Introduction
The Time is now
San Jose State UniversityFX Rongère
January 2009
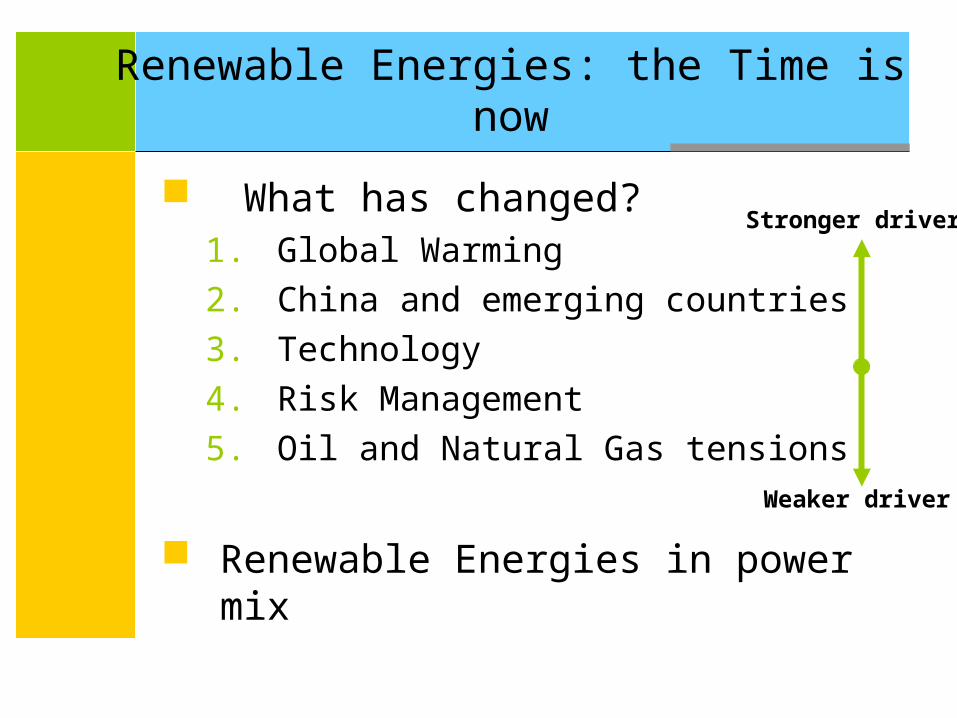
Renewable Energies: the Time is now
What has changed?1. Global Warming2. China and emerging countries3. Technology4. Risk Management5. Oil and Natural Gas tensions
Renewable Energies in power mix
Stronger driver
Weaker driver

1. Global Warming

Global Warming
A wise assumption
Wikipedia.orghttp://en.wikipedia.org/wiki/Image:Instrumental_Temperature_Record.png Dan Cayan
ETCC Summit 2007luncheon_cayan.pdf

Global Warming Evidences
Glacier retreat:
Whitechuck Glacier in North Cascades National Park has retreated 1.2 miles since 1973
1973 2006

Artic ice-pack shrinking
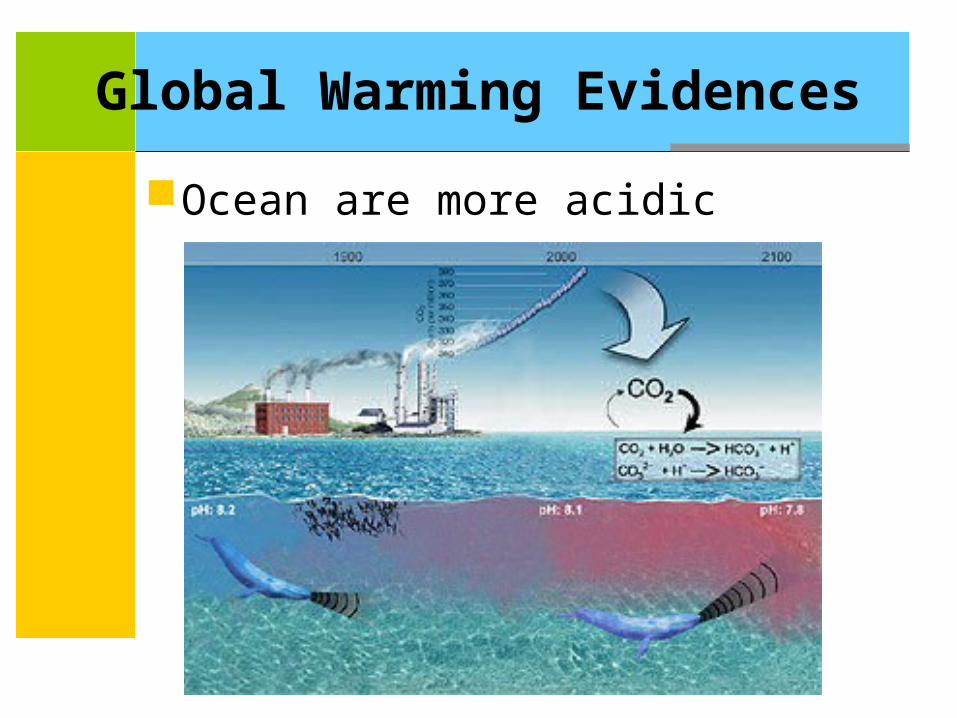
Global Warming Evidences
Ocean are more acidic

Global warming impact in California
Source: CEC 500-2006-077

Global warming impact in California
Potential impact in California
Dan CayanETCC Summit 2007luncheon_cayan.pdf
Source: CEC 500-2006-077

Global Warming
Sector contributions in the USA: 6,000 M Tons (metric) in 2006
CO2 Generation USA 2006
Transportation
31%
Electricity
Generation
39%
Industrial
14%
Commercial
4%
Non-Energy
use
7%
Residential
5%

Kyoto Protocol Reduction of GHG emissions by 5.2% for
industrialized countries (Annex1) in 2008-2012 compared to 1990
Signed and ratified
Signed ratification pending
Signed not ratified
Not signed
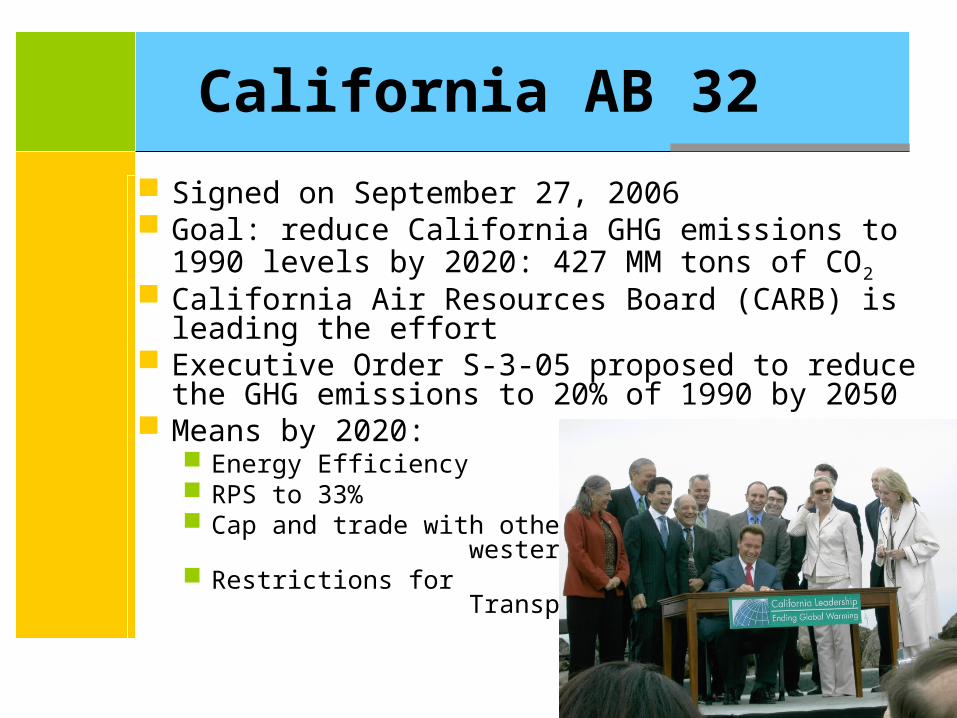
California AB 32
Signed on September 27, 2006 Goal: reduce California GHG emissions to 1990
levels by 2020: 427 MM tons of CO2 California Air Resources Board (CARB) is
leading the effort Executive Order S-3-05 proposed to reduce the
GHG emissions to 20% of 1990 by 2050 Means by 2020:
Energy Efficiency RPS to 33% Cap and trade with other
western states (WCI) Restrictions for
Transportation emissions

Targets for AB32
Source: Climate Change, Proposed Scoping Plan, CARB, October 2008

2. China and Emerging Countries
China is building 2 large power plants per week

China and emerging countries
Carbon intensity of developed economies
$ 50
,000
GDP/c
/y
$ 25,000 GDP/c/y
$ 12,500 GDP/c/y
Source: CECIntensity (Tons of CO2 per 1,000 US$ )

China and emerging countries
Carbon intensity of India and China
$ 12,500 GDP/c/y
China (2007)
China passed the USA for CO2 emissions in 2006 with 6,200 MM Tons/year
Intensity (Tons of CO2 per 1,000 US$ )
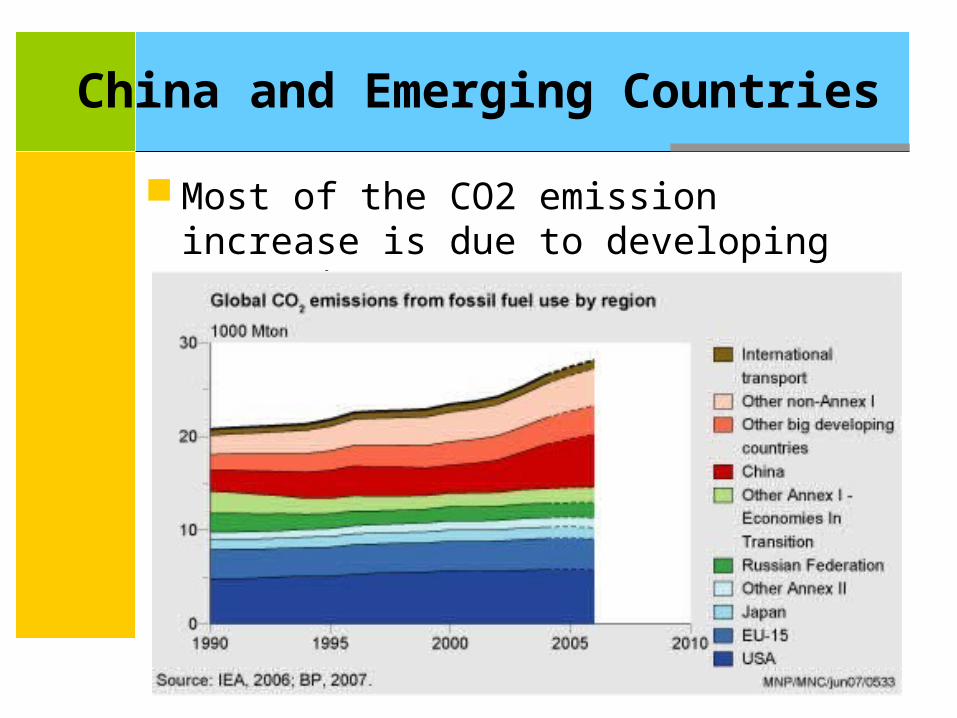
China and Emerging Countries
Most of the CO2 emission increase is due to developing countries

Carbon foot print
Action is required

3. Technologies

Technologies
Major technology improvements

Wind turbines
Bigger is better
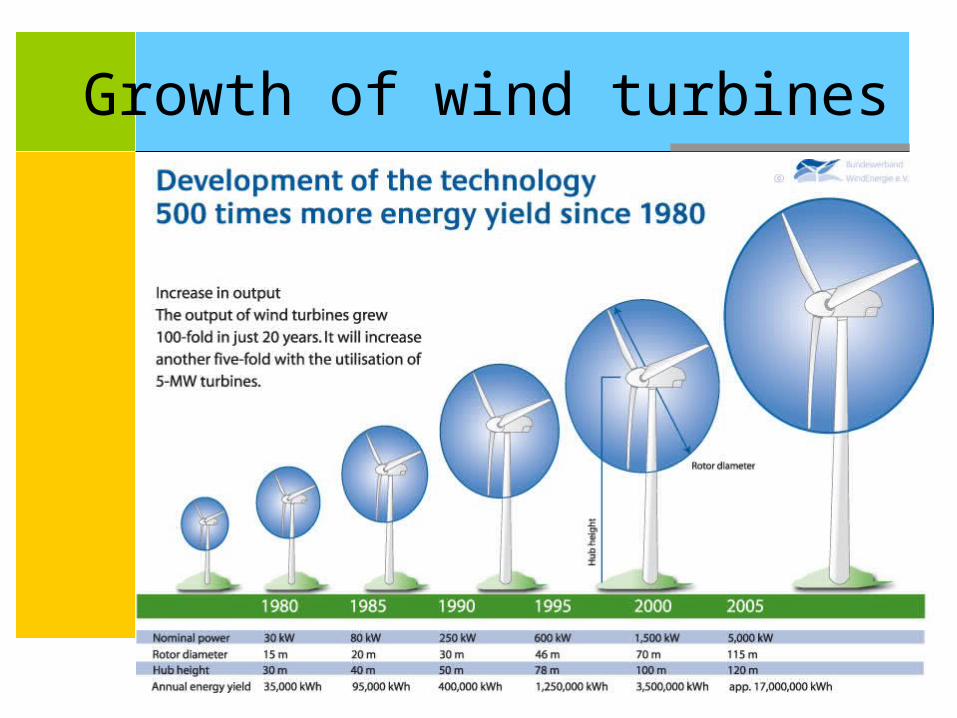
Growth of wind turbines
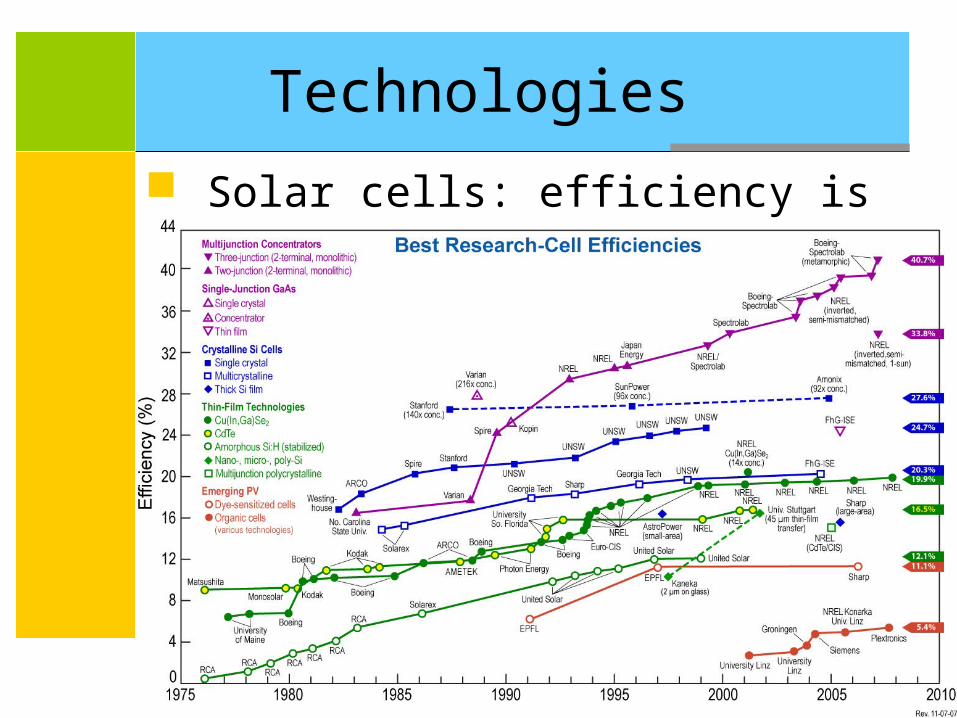
Technologies
Solar cells: efficiency is everything

4. Risk Management

Risk Management
Electricity generation has moved from optimization to risk management
Hig
h i
nv
estm
ent
cost
-
Hig
h o
per
atio
n c
os
t
Time of operation per year
Base line
Peakers
Traditional portfolio

Risk Management
Typical cost variability
Investment cost ($/kW)
Ope
ratio
n co
st (
$/kW
h) Gas
Coal
Nuclear Hydro
Wind
Solar

5. Oil & Gas Tensions
From: www.dfo-mpo.gc.ca/oceans-habitat/oceans/oap-pao/img/hudsonrig.jpg

Oil and Gas Tensions
Oil Price1 barrel = 42 Gallons July 12, 2008
$147.27
January 16, 2009$36.51

Oil Price over 2008
Source: Crude Oil Price NYMEX, http://www.wtrg.com/daily/crudeoilprice.html

Weak dollar currency impact
Oil and Gas Tensions
Source: Federal Bank of Texas – Quarterly Report (2nd Quarter 2008)

Oil and Gas Tensions
Crude oil peak (M. King Huppert 1956)

Crude Oil Peak
Non OPEC countries

Oil and Gas Tension
The USA have been increasingly dependent on foreign oil

Oil and Gas Tensions
Natural Gas Price Volatility

Renewable in Energy mix
Electricity generation in the world

Power Generation in the USA
U.S. Power PlantsThe size of each circlerepresents the quantity of emissions in 2002
24 million tons
15 million tons 4 million tons Coal Gas Oil
Source: MJ Bradley and Associates
Nuclear19%
Hydro7%
Coal50%
Gas19%
Petrol3%
Renewables2%
USA Power Generation
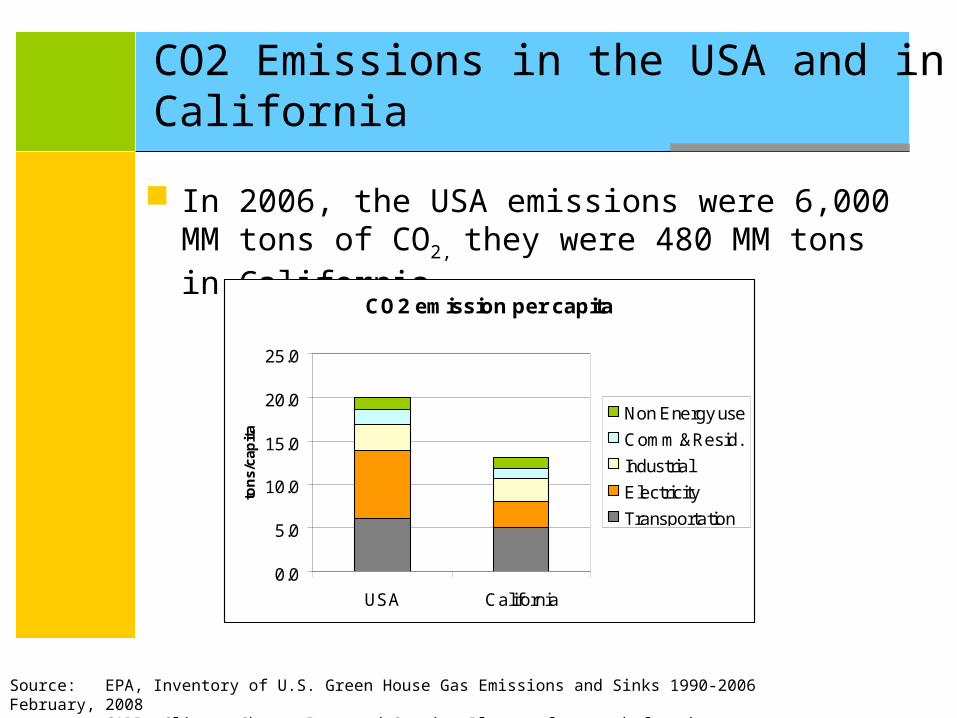
CO2 Emissions in the USA and in California
In 2006, the USA emissions were 6,000 MM tons of CO2, they were 480 MM tons in California
Source: EPA, Inventory of U.S. Green House Gas Emissions and Sinks 1990-2006 February, 2008CARB, Climate Change Proposed Scoping Plan, a framework for change October, 2008
CO2 emission per capita
0.0
5.0
10.0
15.0
20.0
25.0
USA California
ton
s/ca
pit
a
Non Energy use
Comm.&Resid.
Industrial
Electricity
Transportation

California Energy Mix
California Gross System Power for 2006 (GWh)
Fuel Type In-State NW Imports SW Imports GSP GSP PercentageCoal 17,573 5,467 23,195 46,235 15.70%Large Hydro 43,088 10,608 2,343 56,039 19.00%Natural Gas 106,968 2,051 13,207 122,226 41.50%Nuclear 31,959 556 5,635 38,150 12.90%Renewables 30,514 1,122 579 32,215 10.90%
Biomass 5,735 430 120 6,285 2.10%Geothermal 13,448 0 260 13,708 4.70%Small Hydro 5,788 448 0 6,236 2.10%
Solar 616 616 0.20%Wind 4,927 244 199 5,370 1.80%
TOTAL 230,102 19,804 44,959 294,865 100.00%
Source: CEC http://www.energy.ca.gov/electricity/gross_system_power.html
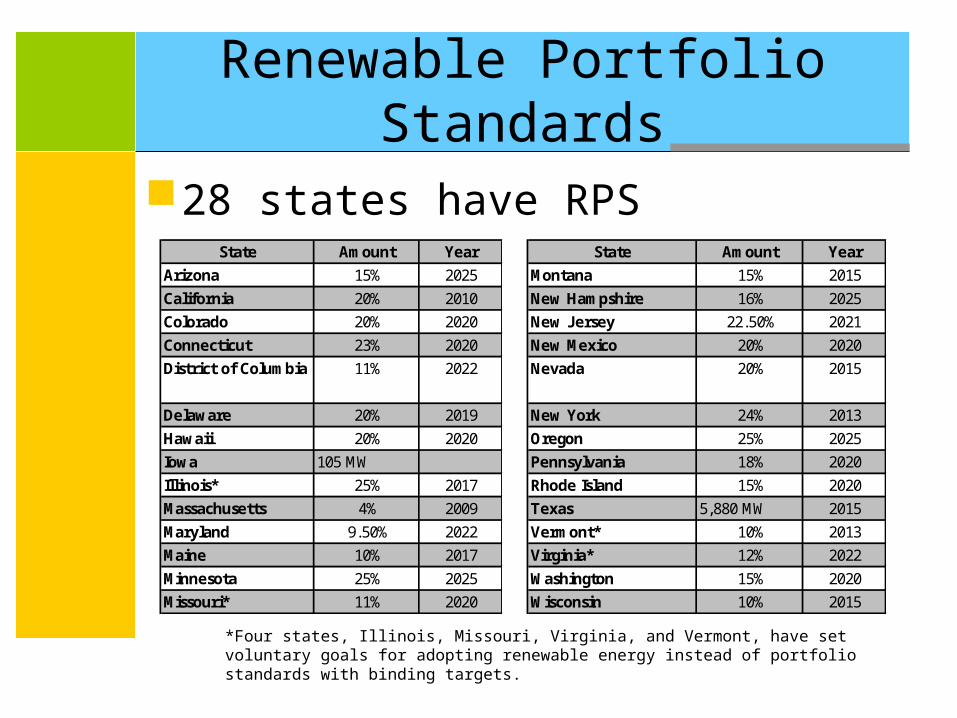
Renewable Portfolio Standards
28 states have RPS
*Four states, Illinois, Missouri, Virginia, and Vermont, have set voluntary goals for adopting renewable energy instead of portfolio standards with binding targets.
State Amount Year
Arizona 15% 2025
California 20% 2010
Colorado 20% 2020
Connecticut 23% 2020
District of Columbia 11% 2022
Delaware 20% 2019
Hawaii 20% 2020
Iowa 105 MW
Illinois* 25% 2017
Massachusetts 4% 2009
Maryland 9.50% 2022
Maine 10% 2017
Minnesota 25% 2025
Missouri* 11% 2020
State Amount Year
Montana 15% 2015
New Hampshire 16% 2025
New Jersey 22.50% 2021
New Mexico 20% 2020
Nevada 20% 2015
New York 24% 2013
Oregon 25% 2025
Pennsylvania 18% 2020
Rhode Island 15% 2020
Texas 5,880 MW 2015
Vermont* 10% 2013
Virginia* 12% 2022
Washington 15% 2020
Wisconsin 10% 2015

Renewable Portfolio Standard
Source: http://www.eere.energy.gov/states/maps/renewable_portfolio_states.cfm#map

Fast growing Renewable Energy Sector
Wind is booming in the USA

Fast growing Renewable Energy Sector
1999
2007
Total 16,819 MWAs 12/31/07
Source: awea

World wide
94,000

Solar is booming
Cumulative Solar Power Worldwide
0
2,000
4,000
6,000
8,000
10,000
1992
1993
1994
1995
1996
1997
1998
1999
2000
2001
2002
2003
2004
2005
2006
2007
Cum
ulat
ive
Inst
alle
d PV
pow
er (M
W)

Ethanol is booming
Historic U.S. Fuel Ethanol Production
0
1,000
2,000
3,000
4,000
5,000
6,000
7,000
1980
1981
1982
1983
1984
1985
1986
1987
1988
1989
1990
1991
1992
1993
1994
1995
1996
1997
1998
1999
2000
2001
2002
2003
2004
2005
2006
2007
Millions
of Gal
lons

Ethanol plants (2007)

Biodiesel is booming
Historic U.S. Biodiesel Production
0
100
200
300
400
500
1999
2000
2001
2002
2003
2004
2005
2006
2007
Million
s of
Gal
lons
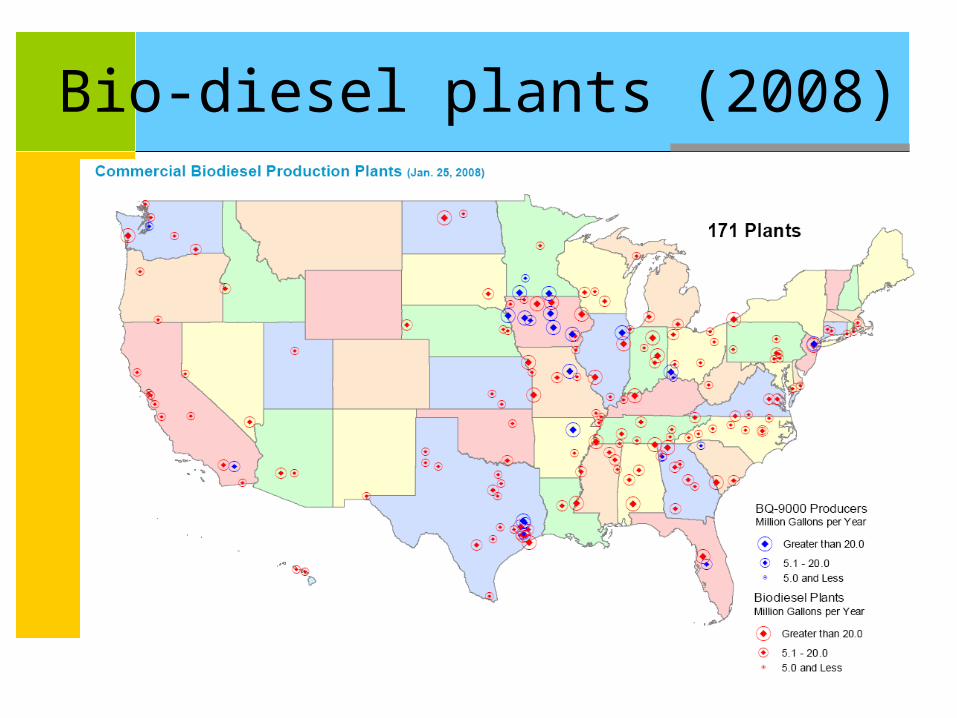
Bio-diesel plants (2008)

CleanTech Venture Capital
VC Investment in Clean Energy in North America
-
500
1,000
1,500
2,000
2,500
3,000
1995 1996 1997 1998 1999 2000 2001 2002 2003 2004 2005 2006 2007
$MM
0%
1%
2%
3%
4%
5%
6%
7%
8%
9%
10%
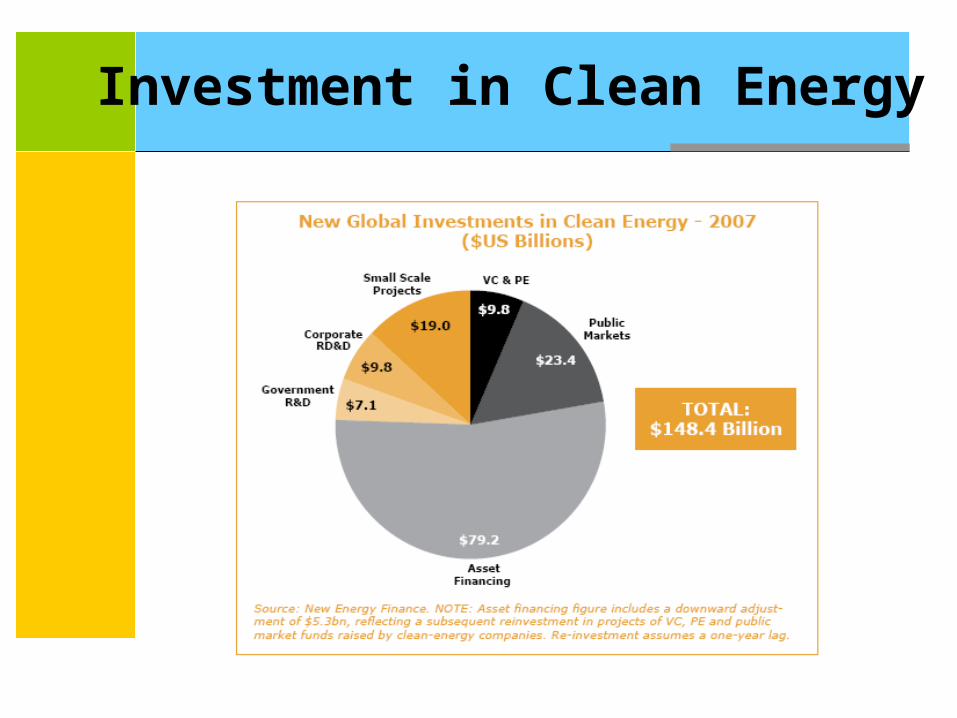
Investment in Clean Energy

Renewable Energy: the Time is now
“The use of vegetables oils for engine fuels may seem insignificant today but such oils may become in the course of the time as important as the petroleum and the coal tar products of the present time”
“The fuel of the future is going to come from fruit like sumac out by the road, or from apples, weeds, sawdust-almost everything”
“I’d put my money on the sun and solar energy. What a source of power! I hope we don’t have to wait until oil and coal run out before we tackle that”
Rudolph Diesel 1912
Henry Ford 1925
Thomas Edison 1931

Our Nation will then have a major conservation effort, important initiatives to develop solar power, realistic pricing based on the true value of oil, strong incentives for the production of coal and other fossil fuels in the United States, and our Nation's most massive peacetime investment in the development of synthetic fuels. Jimmy Carter “State of the Union” 1980
Renewable Energy: the Time is now
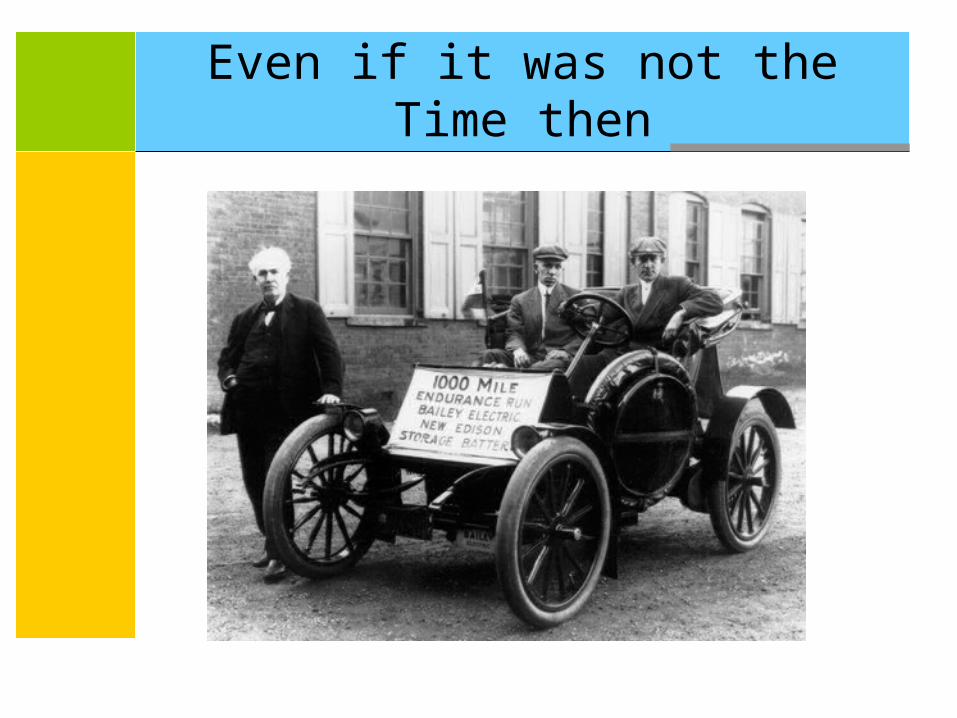
Even if it was not the Time then

References “Our Changing Climate – Assessing the risk for California”,
CEC-500-2006-077 July 2006 www.awea.org www.ethanolrfa.org www.nbb.org “2006 Net System Power Report”, CEC-300-2007-007 April
2007 http://www.eia.doe.gov/ www.nrel.gov “INVENTORY OF U.S. GREENHOUSE GAS EMISSIONS AND
SINKS: 1990 – 2006”, EPA 430-R-08-005, April 5, 2008 “Carbon Dioxide Emissions from the Generation of Electric
Power in the United States”, DOE, July 2000 “Climate Change - Proposed Scoping Plan - A framework for
change”, CARB, October 2008