Alternative Approaches for Regulating Greenhouse … Alternative Approaches for Regulating...
40
NORTHBRIDGE Alternative Approaches for Regulating Greenhouse Gas Emissions from Existing Power Plants under the Clean Air Act: Practical Pathways to Meaningful Reductions Bruce Phillips The NorthBridge Group Prepared at the Request of the Clean Air Task Force February 27, 2014
-
Upload
vuongthuan -
Category
Documents
-
view
221 -
download
3
Transcript of Alternative Approaches for Regulating Greenhouse … Alternative Approaches for Regulating...

NORTHBRIDGE
Alternative Approaches for Regulating Greenhouse Gas Emissions from Existing Power Plants under the Clean Air Act:
Practical Pathways to Meaningful Reductions
Bruce Phillips
The NorthBridge Group
Prepared at the Request of the Clean Air Task Force
February 27, 2014
NORTHBRIDGE 1
Alternative Approaches for Regulating Greenhouse Gas Emissions from Existing Power Plants under the Clean Air Act:
Practical Pathways to Meaningful Reductions
Bruce Phillips
Executive Summary
During the fall of 2013, the Environmental Protection Agency (EPA) began stakeholder engagement and regulatory processes to develop a proposed rule to regulate greenhouse gas emissions (GHG) from existing fossil fuel-fired power plants under Section 111(d) of the Clean Air Act (CAA). To date, stakeholders have offered several policy proposals and other design concepts for discussion. This whitepaper presents a taxonomy of alternative policy designs, discusses their benefits, weaknesses and tradeoffs and provides an economic analysis for the most promising alternatives.
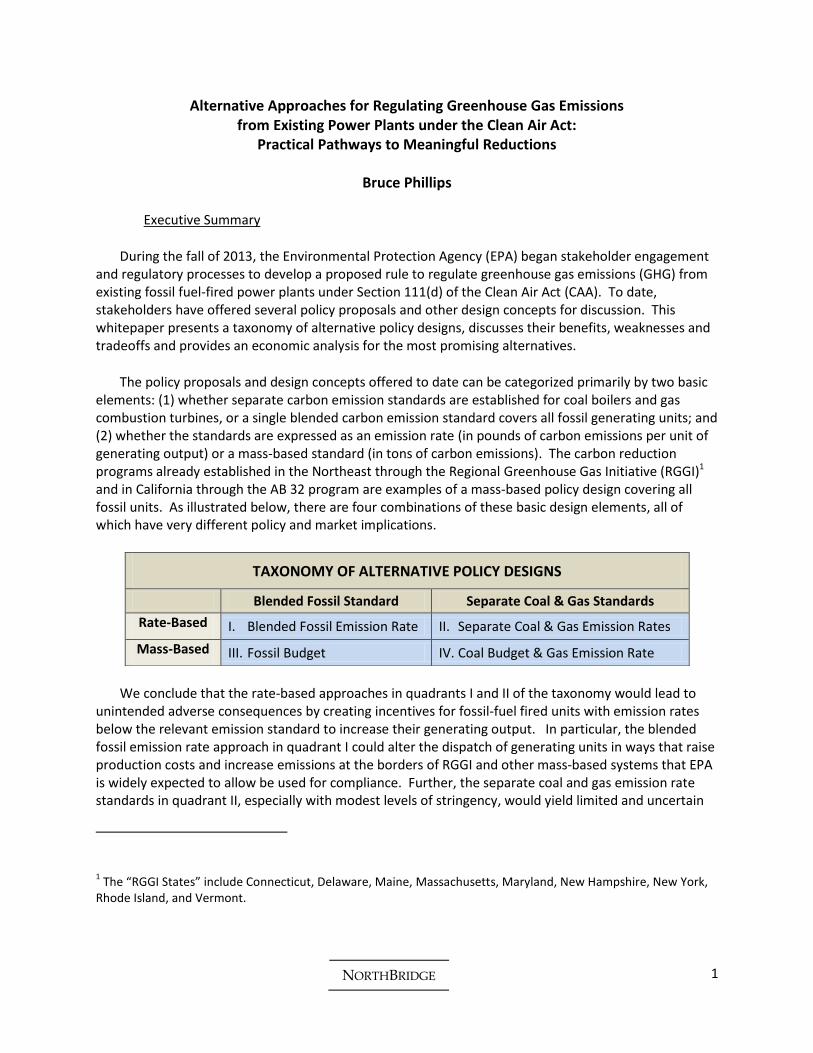
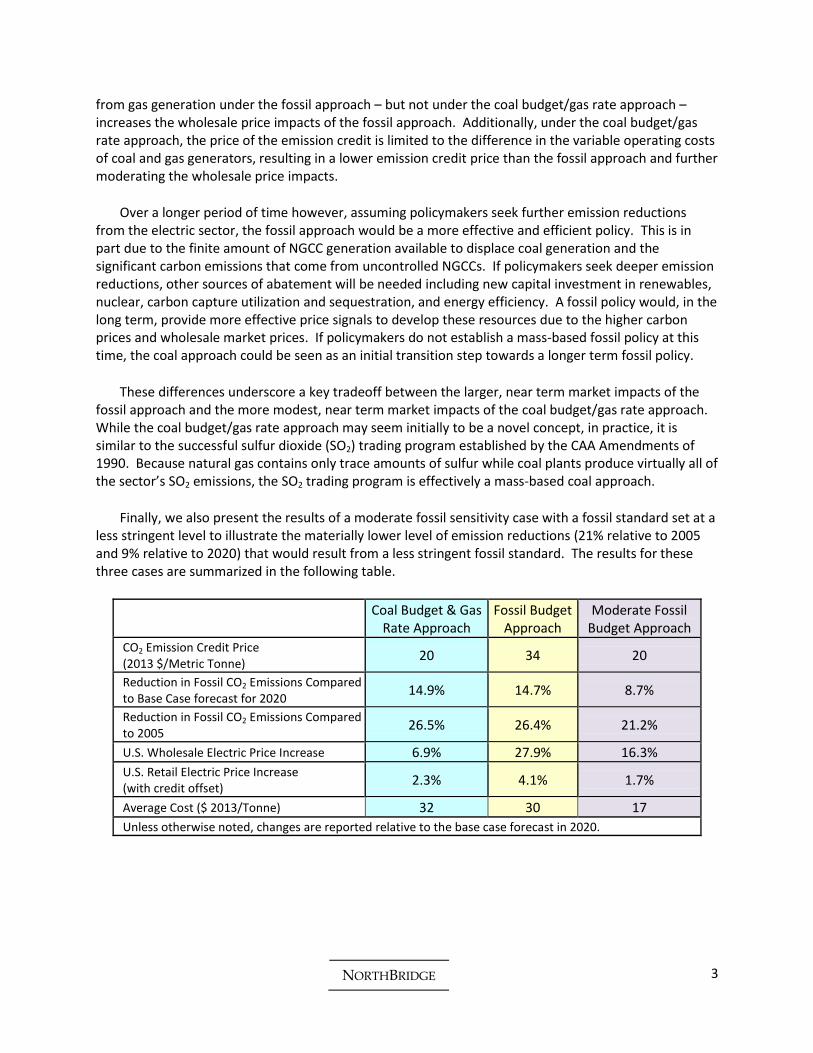
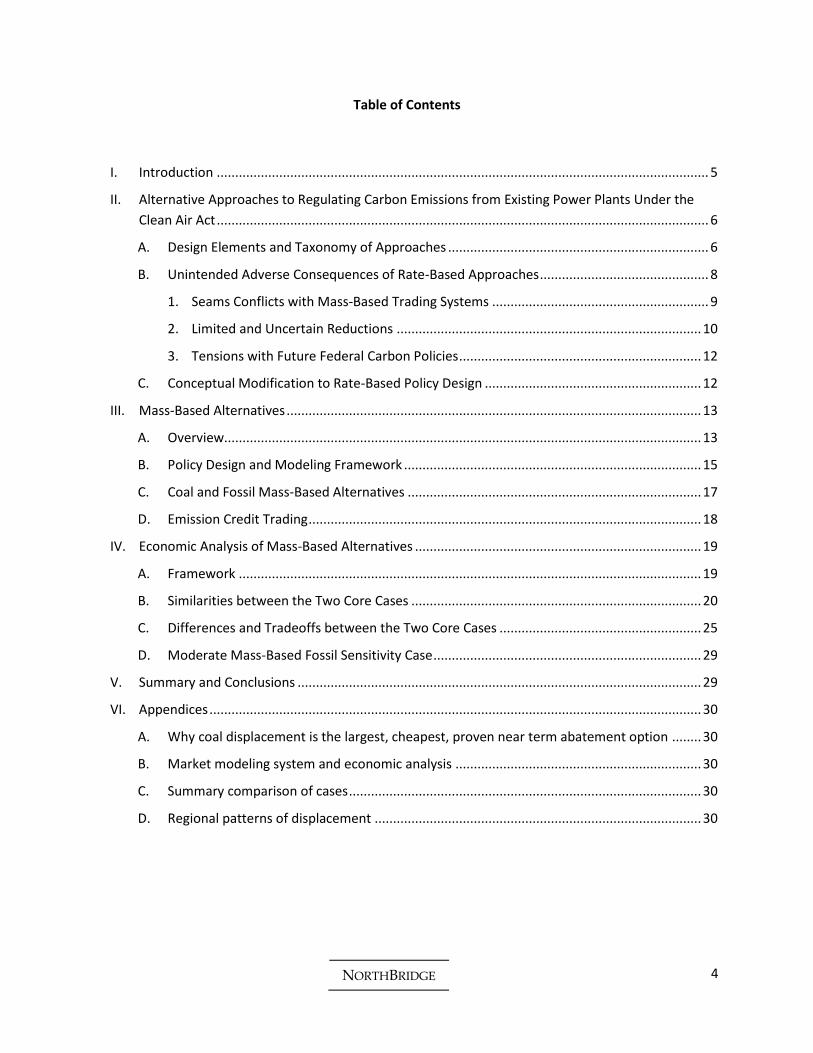
The policy proposals and design concepts offered to date can be categorized primarily by two basic elements: (1) whether separate carbon emission standards are established for coal boilers and gas combustion turbines, or a single blended carbon emission standard covers all fossil generating units; and (2) whether the standards are expressed as an emission rate (in pounds of carbon emissions per unit of generating output) or a mass-based standard (in tons of carbon emissions). The carbon reduction programs already established in the Northeast through the Regional Greenhouse Gas Initiative (RGGI)1 and in California through the AB 32 program are examples of a mass-based policy design covering all fossil units. As illustrated below, there are four combinations of these basic design elements, all of which have very different policy and market implications.
We conclude that the rate-based approaches in quadrants I and II of the taxonomy would lead to
unintended adverse consequences by creating incentives for fossil-fuel fired units with emission rates below the relevant emission standard to increase their generating output. In particular, the blended fossil emission rate approach in quadrant I could alter the dispatch of generating units in ways that raise production costs and increase emissions at the borders of RGGI and other mass-based systems that EPA is widely expected to allow be used for compliance. Further, the separate coal and gas emission rate standards in quadrant II, especially with modest levels of stringency, would yield limited and uncertain
1 The “RGGI States” include Connecticut, Delaware, Maine, Massachusetts, Maryland, New Hampshire, New York,
Rhode Island, and Vermont.
TAXONOMY OF ALTERNATIVE POLICY DESIGNS
Blended Fossil Standard Separate Coal & Gas Standards
Rate-Based I. Blended Fossil Emission Rate II. Separate Coal & Gas Emission Rates
Mass-Based III. Fossil Budget IV. Coal Budget & Gas Emission Rate
NORTHBRIDGE 2
emission reductions. Moreover, both rate-based approaches would exacerbate the challenge of transitioning to longer term federal carbon policies which would likely measure emission reductions in tons rather than emission rates.
The production incentive concern could be mitigated at least to some extent by modifying the form of a rate-based standard to determine a unit’s emission obligation based on measures other than current generating output. However we find the mass-based approaches in quadrants III and IV of the taxonomy, one a budget on carbon emissions from all fossil units (the “fossil budget”) and the other a budget on carbon emissions from coal units along with an emission rate standard for gas units (the “coal budget and gas rate” approach), are preferable to the rate-based approaches.2 The mass-based approaches avoid the concerns with rate based approaches, offer greater compliance flexibility to the states and covered generators, and can be structured to achieve important policy objectives including meaningful emission reductions, compliance through proven abatement pathways, reasonable costs, and mitigation of impacts on merchant coal and retail ratepayers.
The economic analysis presented in this whitepaper demonstrates that both of the mass-based approaches could achieve substantial emission reductions by 2020 at reasonable costs. In short:
Electric sector carbon emission reductions could be reduced by 26% to 27% relative to 2005 levels (15% relative to a base case forecast in 2020);
Almost 70% of these emission reductions would be achieved through changes in the mix of electric generation from existing fossil fuel-fired power plants (i.e. displacing generation from higher emission rate coal plants with generation from existing natural gas combined cycle units) which would increase the national demand for natural gas by 2.6 to 3.0 TCF; and
The cost of the program (including increased fuel, O&M and capital costs) would be $8.6 to $9.4 billion when fully implemented in 2020, which translates to an average of $30 to $32 per metric tonne of carbon emissions (all in 2013 dollars).
The analysis also highlights that the two mass-based approaches differ in their near term emission credit prices and their impacts on wholesale electricity prices and retail rates. At the level of emission stringency evaluated in this analysis, the coal budget/gas rate approach (from quadrant IV of the taxonomy) would produce an emission credit price of $20/metric tonne (2013 dollars), a 7% increase in wholesale prices and a 2.3% increase in retail rates (net of emission trading credits). By comparison, assuming equivalent emission reductions, the fossil approach (from quadrant III) would produce an emission credit price of $34/tonne, a 28% increase in wholesale prices and a 4.1% increase in retail rates – all higher than the coal budget/gas rate approach.
The larger price increases under the fossil approach result from the fact that the emission credit price would apply to both coal- and natural gas-fired generation, while under the coal budget/gas rate approach the emission credit price would only apply to coal generation. Because gas generators set the market price of energy in many regional power markets, applying an emission credit price to emissions
2 The terms “mass-based” and “budget” are used interchangeably in this whitepaper.
NORTHBRIDGE 3
from gas generation under the fossil approach – but not under the coal budget/gas rate approach – increases the wholesale price impacts of the fossil approach. Additionally, under the coal budget/gas rate approach, the price of the emission credit is limited to the difference in the variable operating costs of coal and gas generators, resulting in a lower emission credit price than the fossil approach and further moderating the wholesale price impacts.
Over a longer period of time however, assuming policymakers seek further emission reductions from the electric sector, the fossil approach would be a more effective and efficient policy. This is in part due to the finite amount of NGCC generation available to displace coal generation and the significant carbon emissions that come from uncontrolled NGCCs. If policymakers seek deeper emission reductions, other sources of abatement will be needed including new capital investment in renewables, nuclear, carbon capture utilization and sequestration, and energy efficiency. A fossil policy would, in the long term, provide more effective price signals to develop these resources due to the higher carbon prices and wholesale market prices. If policymakers do not establish a mass-based fossil policy at this time, the coal approach could be seen as an initial transition step towards a longer term fossil policy.
These differences underscore a key tradeoff between the larger, near term market impacts of the fossil approach and the more modest, near term market impacts of the coal budget/gas rate approach. While the coal budget/gas rate approach may seem initially to be a novel concept, in practice, it is similar to the successful sulfur dioxide (SO2) trading program established by the CAA Amendments of 1990. Because natural gas contains only trace amounts of sulfur while coal plants produce virtually all of the sector’s SO2 emissions, the SO2 trading program is effectively a mass-based coal approach.
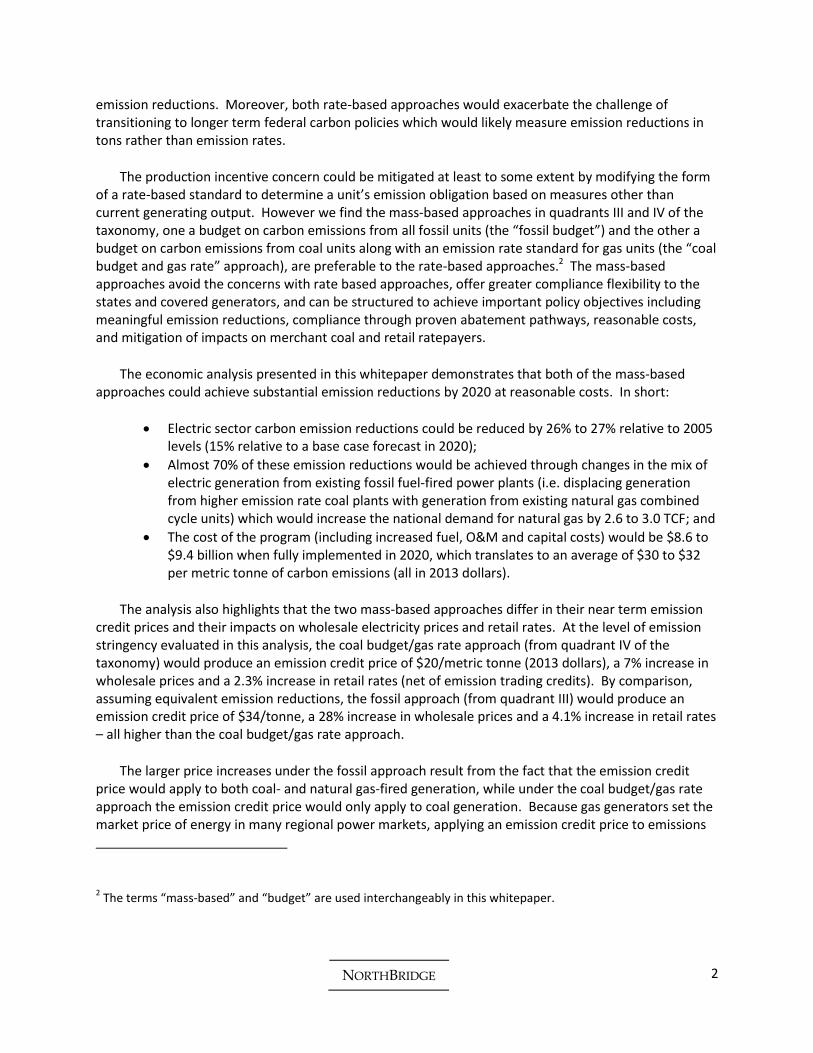
Finally, we also present the results of a moderate fossil sensitivity case with a fossil standard set at a less stringent level to illustrate the materially lower level of emission reductions (21% relative to 2005 and 9% relative to 2020) that would result from a less stringent fossil standard. The results for these three cases are summarized in the following table.
Coal Budget & Gas Rate Approach
Fossil Budget Approach
Moderate Fossil Budget Approach
CO2 Emission Credit Price (2013 $/Metric Tonne)
20 34 20
Reduction in Fossil CO2 Emissions Compared to Base Case forecast for 2020
14.9% 14.7% 8.7%
Reduction in Fossil CO2 Emissions Compared to 2005
26.5% 26.4% 21.2%
U.S. Wholesale Electric Price Increase 6.9% 27.9% 16.3%
U.S. Retail Electric Price Increase (with credit offset)
2.3% 4.1% 1.7%
Average Cost ($ 2013/Tonne) 32 30 17
Unless otherwise noted, changes are reported relative to the base case forecast in 2020.
NORTHBRIDGE 4
Table of Contents
I. Introduction ...................................................................................................................................... 5
II. Alternative Approaches to Regulating Carbon Emissions from Existing Power Plants Under the
Clean Air Act ...................................................................................................................................... 6
A. Design Elements and Taxonomy of Approaches ....................................................................... 6
B. Unintended Adverse Consequences of Rate-Based Approaches .............................................. 8
1. Seams Conflicts with Mass-Based Trading Systems ........................................................... 9
2. Limited and Uncertain Reductions ................................................................................... 10
3. Tensions with Future Federal Carbon Policies .................................................................. 12
C. Conceptual Modification to Rate-Based Policy Design ........................................................... 12
III. Mass-Based Alternatives ................................................................................................................. 13
A. Overview.................................................................................................................................. 13
B. Policy Design and Modeling Framework ................................................................................. 15
C. Coal and Fossil Mass-Based Alternatives ................................................................................ 17
D. Emission Credit Trading ........................................................................................................... 18
IV. Economic Analysis of Mass-Based Alternatives .............................................................................. 19
A. Framework .............................................................................................................................. 19
B. Similarities between the Two Core Cases ............................................................................... 20
C. Differences and Tradeoffs between the Two Core Cases ....................................................... 25
D. Moderate Mass-Based Fossil Sensitivity Case ......................................................................... 29
V. Summary and Conclusions .............................................................................................................. 29
VI. Appendices ...................................................................................................................................... 30
A. Why coal displacement is the largest, cheapest, proven near term abatement option ........ 30
B. Market modeling system and economic analysis ................................................................... 30
C. Summary comparison of cases ................................................................................................ 30
D. Regional patterns of displacement ......................................................................................... 30
NORTHBRIDGE 5
Alternative Approaches for Regulating Greenhouse Gas Emissions from Existing Power Plants under the Clean Air Act:
Practical Pathways to Meaningful Reductions
Bruce Phillips 3
I. Introduction
In June 2013, the President directed the EPA to develop carbon pollution standards under Section 111 of the CAA to reduce carbon emissions from new and existing fossil fuel-fired power plants.4 Power plants emit nearly 40% of the Nation’s carbon pollution and nearly one-third of its total GHG emissions.5 EPA is developing separate GHG reduction frameworks for new plants under Section 111(b) and for existing plants under Section 111(d). On September 20, 2013, EPA issued its proposed rule covering carbon emissions from new power plants.6 It has also initiated a stakeholder engagement and regulatory process to develop a proposed rule covering carbon emissions from existing fossil power plants.7
The NorthBridge Group (NorthBridge) has worked with the Clean Air Task Force (CATF)8 to explore alternative policy approaches for the existing unit rule that meet the following critical design considerations: achieve meaningful carbon emission reductions at reasonable cost; rely on practical and proven compliance actions; recognize stakeholders’ previous actions and commitments to reduce carbon emissions; mitigate the financial impact on merchant coal generating assets; have limited rate impacts; and comport with existing state carbon policies and other carbon policies that may be adopted at the federal level in the future.
3 Bruce Phillips is a Director of the NorthBridge Group, an economic and strategic consulting firm serving the
electric and natural gas industries including regulated utilities and companies active in the competitive wholesale and retail markets. The author appreciates the assistance of Iain Kaplan, Ellen Ludlow and Eric Tang, and comments from Chris Van Atten, Susan Tierney and Dallas Burtraw. All opinions and errors are the responsibility of the author. For questions or comments, contact Bruce Phillips at the NorthBridge Group, 30 Monument Square, Concord Massachusetts 01742. Email address: [email protected]. 4 The President’s Climate Action Plan, June 2013
5 EPA, Inventory of U.S. Greenhouse Gas Emissions and Sinks: 1990-2011, at ES-5,ES-7(Apr. 2013), available at
http://www.epa.gov/climate change/Downloads/ghgemissions/US-GHG-Inventory-2013-Main-Text.pdf. 6 Environmental Protection Agency, 40 CFR Part 60, [EPA-HQ-OAR-2013-0495; FRL-9839-4], RIN 2060-AQ91,
Standards of Performance for Greenhouse Gas Emissions from New Stationary Sources: Electric Utility Generating Units 7 http://www2.epa.gov/carbon-pollution-standards/what-epa-doing
8 The Clean Air Task Force is a non-profit that works to help safeguard against the worst impacts of climate change
by catalyzing the rapid global development and deployment of low carbon energy and other climate-protecting technologies through research and analysis, public advocacy leadership, and partnership with the private sector. http://www.catf.us/.
NORTHBRIDGE 6
This whitepaper is organized in four sections:
1. The first section presents a taxonomy of alternative regulatory approaches, including policy proposals made to date, other policy concepts and the policy designs developed with CATF, highlighting whether they establish separate emission standards for coal boilers and gas combustion turbines or a blended standard for all covered fossil fuels, and whether they express the standards as an emission rate or a mass-based standard. Building on the taxonomy, we discuss several concerns with rate-based approaches and the advantages of mass-based approaches.
2. The second section describes in greater detail the mass-based policy designs developed with CATF, including a mass-based fossil design (the “fossil approach”) and a mass-based coal design coupled with an emission rate standard for gas units (the “coal budget/gas rate” or “coal” approach), and discusses the importance of an inter-state emission credit trading system to flexible, cost-effective compliance for states and covered generators.
3. The third section of the whitepaper reviews the results of NorthBridge’s economic analysis of the two mass-based approaches, illustrating their similarities (including fossil sector carbon emission reductions of 26% to 27% in 2020 relative to 2005 levels, compliance through displacement of high emission rate coal with natural gas generation from existing natural gas-fired combined cycle (NGCC) units, roughly $9 billion of program costs and average abatement costs of $30 to 32/metric tonne); as well as the differences and tradeoffs that would be involved in selecting one approach over the other (including the lower emission credit price, lower wholesale prices and lower retail rate impacts of the coal budget/gas rate approach in the short term versus the longer term advantages of the fossil budget approach.)
4. Finally, an appendix further details several aspects of the analysis including the potential to displace high emission rate coal generation with additional generation from existing NGCC plants – the largest proven and low cost opportunity currently available to reduce carbon emissions in the U.S. electric sector – the modeling platform and assumptions, the results for the three cases analyzed, and the regional pattern of generation and compliance.
II. Alternative Approaches to Regulating Carbon Emissions from Existing Power Plants Under the Clean Air Act
A. Design Elements and Taxonomy of Approaches
The proposals and policy concepts that have been offered to date can be distinguished by the stringency of their emission standards (that is, the level of carbon emission reductions expected to result from the standards) and the structure of their policy design (as discussed further below, the form of the emission standard and other policy design features).
This distinction between stringency and structure is meaningful because, as EPA considers how to design its proposed rule, it may decide to incorporate certain structural elements of one or more proposals but with a higher or lower level of stringency. Later in this whitepaper, we present modeling results for policy cases that illustrate the emission tradeoffs of a less stringent emission standard. However the focus of this section is on some of the more important structural design elements regardless of the stringency of the emission standard.
NORTHBRIDGE 7
Focusing only on the structure of the policy design, the proposals and policy concepts can be differentiated by two basic design elements: 9
1. Whether the rule establishes separate emission standards for covered coal and natural gas-fired generation or a blended emission standard for all covered fossil generation (both coal and natural gas.)
2. Whether the emission standards are expressed as an emission rate (in pounds of carbon emissions per unit of generating output) or a mass-based standard (in tons of carbon emissions.)
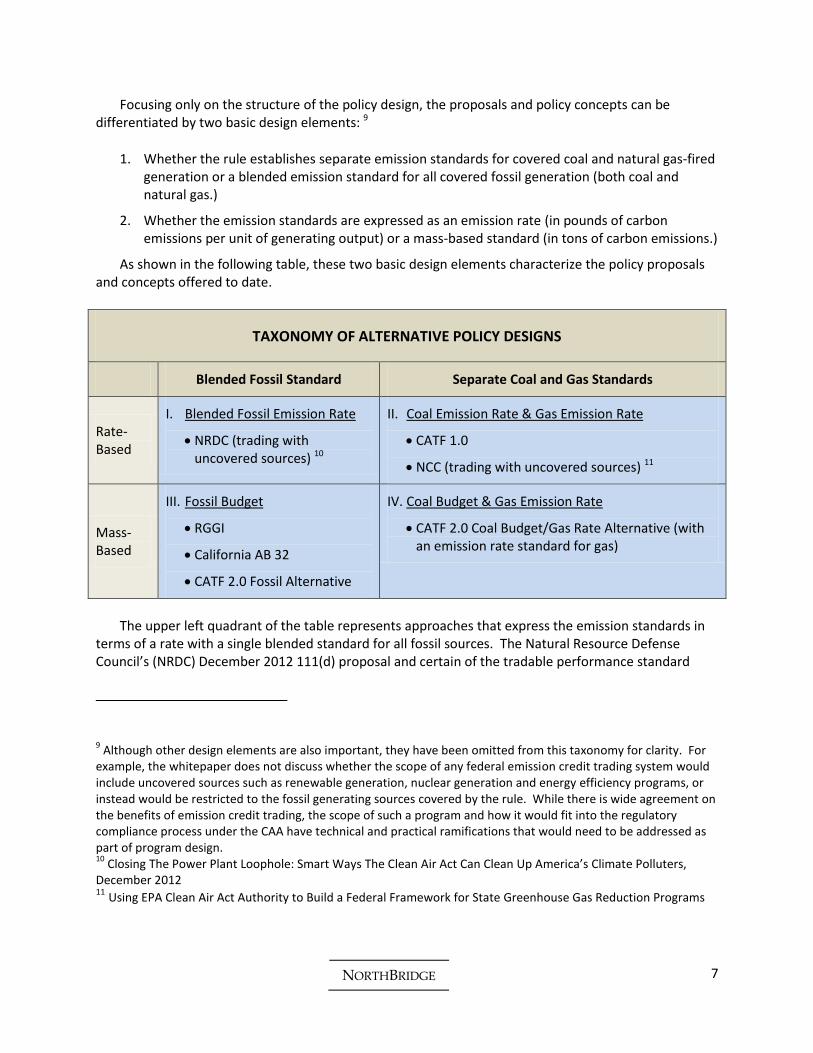
As shown in the following table, these two basic design elements characterize the policy proposals and concepts offered to date.
TAXONOMY OF ALTERNATIVE POLICY DESIGNS
Blended Fossil Standard Separate Coal and Gas Standards
Rate-Based
I. Blended Fossil Emission Rate
NRDC (trading with uncovered sources) 10
II. Coal Emission Rate & Gas Emission Rate
CATF 1.0
NCC (trading with uncovered sources) 11
Mass-Based
III. Fossil Budget
RGGI
California AB 32
CATF 2.0 Fossil Alternative
IV. Coal Budget & Gas Emission Rate
CATF 2.0 Coal Budget/Gas Rate Alternative (with an emission rate standard for gas)
The upper left quadrant of the table represents approaches that express the emission standards in
terms of a rate with a single blended standard for all fossil sources. The Natural Resource Defense Council’s (NRDC) December 2012 111(d) proposal and certain of the tradable performance standard
9 Although other design elements are also important, they have been omitted from this taxonomy for clarity. For
example, the whitepaper does not discuss whether the scope of any federal emission credit trading system would include uncovered sources such as renewable generation, nuclear generation and energy efficiency programs, or instead would be restricted to the fossil generating sources covered by the rule. While there is wide agreement on the benefits of emission credit trading, the scope of such a program and how it would fit into the regulatory compliance process under the CAA have technical and practical ramifications that would need to be addressed as part of program design. 10
Closing The Power Plant Loophole: Smart Ways The Clean Air Act Can Clean Up America’s Climate Polluters, December 2012 11 Using EPA Clean Air Act Authority to Build a Federal Framework for State Greenhouse Gas Reduction Programs
NORTHBRIDGE 8
policy design concepts outlined by Resources for the Future (RFF)12 are examples of this type of approach. 13
The upper right quadrant of the table identifies approaches in which the emission standards are expressed as an emission rate with separate standards for coal and gas sources. Examples of this approach include a coal-only emission rate design previously discussed by CATF (labeled as “CATF 1.0” in the table), certain of the tradable performance standard policy concepts described by RFF, and the policy concept articulated by the National Climate Coalition (NCC).14
The lower left quadrant represents the most familiar form of a mass-based approach in which the standard applies to carbon emissions from all covered fossil generating units. The RGGI states and California carbon programs are well known examples of this approach. One of the policy designs developed with CATF and detailed later in this whitepaper, labeled “CATF 2.0 Fossil Alternative” in the taxonomy, also falls into this group.
The lower right quadrant describes an alternate approach which would apply a mass-based standard to emissions from covered coal plants and a rate-based standard to emissions from covered gas plants. Thus emissions from both coal and gas generation would be subject to regulation under this approach, but with different regulatory mechanisms. The “CATF 2.0 Coal Budget/Gas Rate Alternative”, described in detail later in this whitepaper, is an example of this approach.
Although the coal budget/gas rate approach is less familiar than the fossil budget approach, there are several advantages. It provides similar compliance flexibility and cost effectiveness to the fossil approach, and during the initial years of a 111(d) power plant policy results in lower emission credit prices, wholesale market prices and potentially lower retail rate impacts. Also, it is fundamentally quite similar to the sulfur dioxide (SO2) trading program established by the CAA Amendments of 1990 and successfully operated since then. Coal plants produce virtually all of the electric sector’s SO2 emissions, while natural gas emits only trace amounts. Consequently, the SO2 trading program is effectively a type of mass-based coal regulation. Given these characteristics and advantages, the mass-based coal approach deserves close consideration.
B. Unintended Adverse Consequences of Rate-Based Approaches
Rate-based approaches, whether structured with separate rates for coal and gas or a single blended fossil rate, are typically established so that some covered generating sources have emission rates above the standard and others have rates below the standard. Generating sources with emission rates above
12 The RFF example is a policy design concept rather than a policy proposal. Variations on the concept, referred to
as a tradable performance standard, have been analyzed in a series of papers including most recently Technology Flexibility and Stringency for Greenhouse Gas Regulations, July 2013, RFF DP 13-24. 13
The NRDC and RFF examples differ significantly in their treatment of trading with uncovered sources such as renewables and energy efficiency programs. 14
The NCC policy concept calls for renewable and demand side efficiency crediting to play a critical role in the rule.
NORTHBRIDGE 9
the standard must undertake actions to come into compliance. Generating sources with emission rates below the standard have a financial incentive to increase their production, assuming an emission credit trading program, because every additional unit of generating output “earns” that generator additional emission credits which have a financial value under the trading program.
In the case of a single blended fossil rate standard covering both coal and gas generation, NGCC units would typically be awarded emission credits whenever they generate output. For example, assuming a blended rate standard of 1,400 lbs/MWh for all fossil units, an NGCC unit with an emission rate of 800 lbs/MWh would earn 600 lbs/MWh of emission credits beyond what it needed to demonstrate compliance with the standard. Because emission credits have a financial value, they provide the gas units with a financial subsidy supporting their operations. With an emission credit price of $20/tonne, the value of the surplus credit in this example would exceed $5/MWh. This would allow gas units to sell power for less than their direct variable fuel and O&M costs. The value of the credits earned by generating additional output partially offsets the unit’s variable cost of production, reducing the marginal cost of dispatch and making the unit more competitive with other sources of generation in that power market without comparable production incentives.
Such production incentives can lead to unintended adverse consequences. As discussed in more detail below, they create what often are referred to as “seams” conflicts at the borders of mass-based trading programs such as RGGI and other mass-based programs, emissions “rebound”, and greater difficulty in transitioning to longer term national carbon policies.
This is not to say that rate-based approaches are without advantages. For example, rate-based approaches can accommodate growth in electric demand through increased output from generating sources that meet the emission rate-based standards (for instance, new NGCC generation with relatively low heat and emission rates). In contrast, a mass-based budget or cap on total fossil emissions would require any increased emissions resulting from demand growth to be offset by emission reductions elsewhere in the system. 15
1. Seams Conflicts with Mass-Based Trading Systems
As EPA is expected to provide sufficient flexibility in its guidance to allow the RGGI states and California to use their existing carbon trading programs for compliance,16 it would make sense for EPA to also deter other states from adopting compliance approaches that materially interfere or conflict with these and other mass-based programs.
15 Note that a mass-based coal policy would allow for growth in gas generation and emissions in response to load
growth and not require offsetting emissions reductions. 16
See EPA Administrator Gina McCarthy’s remarks on December 2, 2013 at the Center for American Progress. Also see the December 2, 2013 letter and comments from the RGGI states to EPA Administrator Gina McCarthy. In those comments, the RGGI States supported the establishment of a model rule based on the RGGI program and suggested principles to guide EPA’s program similar to those suggested here.
NORTHBRIDGE 10
However the production incentive from a blended emission rate standard would do just that: The production incentive would allow gas units located in states with a blended rate standard to reduce the price at which they dispatch, which could distort unit operations and emissions in neighboring states with mass-based standards.
To illustrate this point, consider the simple example of two neighboring states in the same or interconnected electric markets, with one state implementing a mass-based system and the other state implementing a blended rate standard (a single emission rate applied to both coal and gas units). Assume the gas units in the mass-based state are slightly more efficient than those in the rate-based state and historically have been dispatched before the gas units in the rate-based state. Yet under a blended rate standard, the less efficient gas units in the rate-based state could displace the more efficient units in the mass-based state because the production incentives in the rate-based state enable those gas units to lower their dispatch bids. With fewer emissions from the gas units in the mass-based state, the mass-based state achieves its mass-based emission budget. Further, the increased generation from the gas units in the rate-based state lowers the average fossil emission rate in that state allowing it to meets its blended emission rate standard. Both states satisfy their GHG obligations, but simply by shifting generation and emissions from the mass-based state to the rate-based state, not by reducing overall carbon emissions. On the contrary, looking at the two states together, overall emissions and production costs increase and the economic efficiency of the power system declines.17
Note this issue extends beyond just RGGI and California as other states seeking to comply with the existing unit rule may choose to join those carbon trading programs or establish new mass-based programs. This raises the possibility of a patchwork of rate-based and mass-based systems across the country and widespread seams conflicts arising from the differing policy designs. Encouraging or requiring all states within a given Regional Transmission Organization (RTO) to adopt a common policy design would mitigate this concern as it applies to state boundaries within an individual RTO but not between neighboring RTOs.
2. Limited and Uncertain Reductions
Under a typical emission rate standard applied to coal units (that is, not on a blended basis to all fossil units) the most efficient coal units would have emission rates below the performance standard. This not only would create seams issues as discussed above for a single blended standard, but also the potential for an emission “rebound” problem.
For example, in today’s power markets, some coal units dispatch after NGCC units.18 But with a production incentive and investments to reduce emission rates through heat rate improvements, some of these coal units might be dispatched before rather than after NGCC units. In the absence of an
17 These seams issues exist to some extent today at the boundaries of RGGI, but have been mitigated by the low
carbon prices in the RGGI market to date. As carbon prices rise over time, however, they would be expected to worsen, and implementing a single blended fossil standard in neighboring states would exacerbate the problem. 18
This occurs particularly in eastern regions with relatively high delivered coal prices and relatively modest delivered natural gas prices.
NORTHBRIDGE 11
emissions budget, this would cause lower carbon emission generation to be displaced with higher carbon emission generation, increasing net system emissions. The magnitude of this effect would depend on the spread between delivered coal and gas commodity prices; regions and years with relatively small commodity price spreads would experience larger emissions rebound impacts while greater price spreads would create smaller rebound impacts. An examination of the dispatch patterns of coal and gas units in a southeastern region during 2012 suggests that reducing coal unit heat rates by 5 percent would cause coal generation to displace gas generation such that net fossil system emissions would rise by almost 2 percent. 19
Emissions rebound could also result from extending the life of coal units that would otherwise be retired. Lower operating costs and higher capacity factors driven by the production incentive and heat rate improvements could increase the economic value of some coal units. Since generating units typically operate for as long as they are profitable to their owners or produce value for ratepayers, higher annual economic values typically translate into longer operating lives. Notably, even a very short unit life extension could erase the emission reductions from heat rate improvements. For example, operating a coal unit just two additional years could offset the emission reductions from a 5% heat rate improvement on a coal unit expected to operate for 20 years.
Regulatory approaches with modest coal emission rate standards are also problematic for other reasons. From an environmental perspective, they would result in limited if any meaningful emission reductions. Some studies have suggested basing a coal emission rate standard only on the opportunity to reduce the heat rate of generating plants, without consideration of other inside-the-fence or on-site technologies such as co-firing with lower carbon fuels or coal drying. However, heat rate investments by themselves often are characterized as resulting in a 3 to 5% reduction in unit emission rates, with 4% being a common estimate.20 This range may be overstated given the heat rate improvements already underway to comply with the Mercury and Air Toxics Standards (MATS) rule. But even if achievable, a 4% improvement in fleet-wide coal unit efficiency would translate to only a 3% reduction in fossil sector emissions. Thus, to the extent the heat rate improvement range is overstated, actual fossil emission reductions resulting from a standard based only on heat rate improvements could be even lower than 3%. In any case, a 3% emission reduction is quite modest relative to the President’s economy wide goal of a 17% reduction in GHG emissions by 2020 relative to 2005 levels or the potential to reduce electric
19 Dallas Burtraw also noted this effect and estimated that is corresponds to about one half a percentage point
relative to a policy case structured to achieve a 4 percent emission reduction (or roughly 15% of the policy case reductions). See Burtraw and Woerman, Technology Flexibility and Stringency for Greenhouse Gas Regulations, July 2013, RFF DP 13-24. 20 For example, see Sargent & Lundy, Coal-Fired Power Plant Heat Rate Reductions, SL-009597, FINAL REPORT,
JANUARY 22, 2009, PROJECT 12301-001, www.sargentlundy.com; and Regulating Greenhouse Gases from Coal Power Plants under the Clean Air Act, Joshua Linn, Erin Mastrangelo, and Dallas Burtraw, Resources for the Future, February 2002.
NORTHBRIDGE 12
sector emissions cost effectively by displacing high emission rate coal generation with generation from existing NGCC units as shown in this whitepaper.21
3. Tensions with Future Federal Carbon Policies
Furthermore, both the rate-based approaches would exacerbate the challenge of transitioning to future federal carbon policies.
In the event that federal legislation establishes a national carbon tax or a cap and trade system covering at least the electric sector of the economy, those policies – both of which are mass-based approaches – would impose a carbon price on all covered fossil emissions. This would tend to discourage generation from uncontrolled fossil sources and raise electric prices in a manner generally similar to the carbon programs in the RGGI states or California. As such, those policies would conflict with the fossil production incentives that would already have been established under a rate-based approach.
Technically and conceptually, it should be possible to transition from a rate-based system under the CAA to a federal mass-based system such as a carbon tax or cap and trade system. However, this would require overcoming the conflicts between two regulatory approaches, which would likely be difficult. In contrast, the transition from a mass-based system under the CAA to a federal mass-based system would almost certainly be much more manageable.
C. Conceptual Modification to Rate-Based Policy Design
While the production incentive problem that underlies these unintended consequences is common to many rate-based formulations, a modified rate-based design could in part mitigate the issue by removing the incentive to increase generation and emissions.
Under a typical rate-based standard with emission credit trading, the net emissions obligation owed by a covered generating plant at the end of the compliance period is equal to the difference between the emission rate standard and the actual emission rate times actual generation (the amount of generation actually emitted from the facility). The key term in this equation is “actual generation”.
This net emissions obligation can be decomposed mathematically into a gross obligation and a credit. The gross obligation is equal to the actual emission rate times actual generation. The credit is equal to the emission rate standard times actual generation. 22
21 In practice, it is also likely to prove difficult to calibrate a modest coal emission rate standard. Beyond the
uncertainty in the amount of cost effective heat rate improvements, the opportunity to switch between types of coal with varying carbon contents and the efficiency impact of dispatching coal units as intermediate duty cycling units should also be considered. These complexities would contribute to the uncertainty of any emission reductions resulting from such an approach. 22
Net Obligation = (Emission Rate Standard – Actual Emission Rate) * Actual Generation.
NORTHBRIDGE 13
Because the credit is based on the actual amount of generation produced by the covered generating plant, it creates the production incentive problem discussed earlier: plants with emission rates below the standard have an incentive to increase their production or extend their lives because every additional unit of generating output earns that generator additional emission credits.
One solution to the production incentive problem would be to fully sever the link between credit allocation and actual generation. This could be done by modifying the net obligation formula so that the calculation of the credit is not based on actual generation but, instead, some other independent metric. For instance, the amount of generation used to calculate the credit could be based on the amount of generation produced during a historic baseline period. Instead of allocating credits based on actual generation, this would have the effect of allocating credits on a basis that is independent of the way generating plants are operated and sever the link between credit allocation and actual generation. Because covered generating plants with emission rates below the standard would not earn credits for each unit of electric output generated, all covered generating plants would see a positive emission credit price and the production incentive would be eliminated.
Alternately, the formula might be modified so that some credits were allocated on a fixed basis independent of generation as in the first example and others were allocated on the basis of actual generation as they would be under a typical emission rate standard. As long as the emission rate used in the formula to allocate credits based on actual generation was at or below the lowest emission rate in the covered generating fleet, all plants would see a positive emission credit price and the production incentive would be eliminated. The fixed credit allocation would make up the balance of the credits allocated to covered plants. While more complicated than the first approach, this hybrid approach would not necessarily establish a fixed number of credits and so could be more flexible from an operational perspective.
Either way, only the obligation term in the equation would influence dispatch and retirement decisions, and the production incentive would be eliminated. By doing away with the production incentive, the seams conflicts between rate-based and mass-based states would be removed, the risk of emissions rebound would be addressed and the tension with longer term mass-based policies would be mitigated.
III. Mass-Based Alternatives
A. Overview
As recognized by EPA and others, there are many types of compliance options potentially available to control carbon emissions in the electric sector. These include:
Net Obligation = Credit – Gross Obligation Gross Obligation = Actual Emission Rate * Actual Generation Credit = Emission Rate Standard * Actual Generation
NORTHBRIDGE 14
On-Site generation and emission control technologies: heat rate improvements, coal drying, switching between different coals with varying carbon contents, gas co-firing, and, in some circumstances, partial carbon capture utilization and storage (CCUS),
Changes in the Mix of Fossil Generation: Shifting the mix of generation from carbon intensive source of generation to lower or zero carbon emitting generation, in particular generation from existing NGCC units,
Off-site Actions Beyond Covered Fossil Generating Facilities: State energy efficiency, state renewable energy programs and nuclear generating facilities.
The technical and economic opportunity to reduce carbon emissions through these compliance options will differ from region-to-region and from state-to-state.
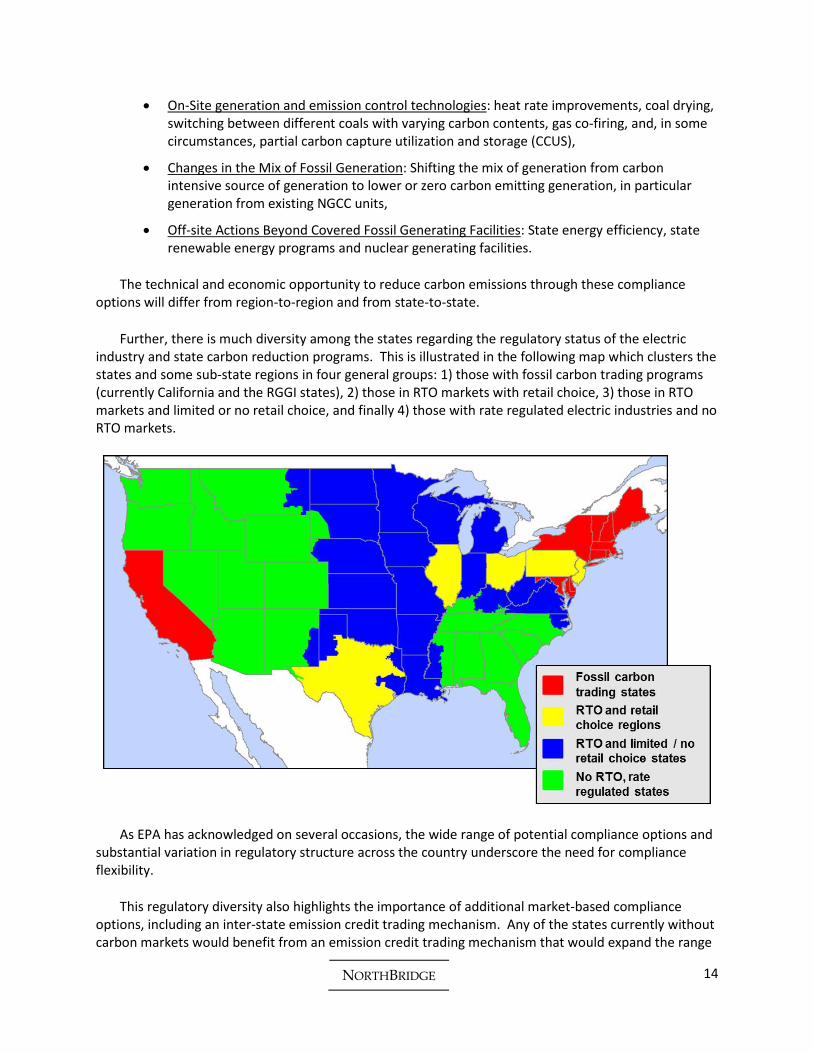
Further, there is much diversity among the states regarding the regulatory status of the electric industry and state carbon reduction programs. This is illustrated in the following map which clusters the states and some sub-state regions in four general groups: 1) those with fossil carbon trading programs (currently California and the RGGI states), 2) those in RTO markets with retail choice, 3) those in RTO markets and limited or no retail choice, and finally 4) those with rate regulated electric industries and no RTO markets.
As EPA has acknowledged on several occasions, the wide range of potential compliance options and substantial variation in regulatory structure across the country underscore the need for compliance flexibility.
This regulatory diversity also highlights the importance of additional market-based compliance options, including an inter-state emission credit trading mechanism. Any of the states currently without carbon markets would benefit from an emission credit trading mechanism that would expand the range

NORTHBRIDGE 15
of compliance options, allow for cost effective abatement through dispatch of electric generation with varying levels of carbon intensity, and provide covered generators with a market price signal regarding the value of changes in generation dispatch, unit commitment, unit retirement and alternative compliance options. States that are in RTO markets already benefit from market-based prices for energy and related power products, and a market-based emission credit trading mechanism that would be factored into generation dispatch would complement those market systems.
The mass-based approaches discussed in this whitepaper fully comport with this need for flexible, cost-effective compliance and new market-based compliance mechanisms.
B. Policy Design and Modeling Framework
In this analysis, we assume that EPA will establish separate emission rate standards for fossil boilers and gas-fired combustion turbines consistent with the definitions used in the proposed new unit rule. 23 For ease of communication, the fossil boiler sub-category is often referred to in this whitepaper as “coal” and the gas-fired combustion turbine sub-category is often referred to as “gas.”
EPA’s proposed emission rate standards will be based on what it identifies to be the Best System of Emission Reduction (BSER) for each sub-category. For purposes of this analysis, we assume that when fully implemented after a phase-in period, those standards will be consistent with the following:
For coal, a 35% reduction in national average carbon emission rate relative to a 2011 – 2012 baseline period, which is equal to an average output-based emission rate of approximately 1,450 lbs/MWh, and
For gas, an emission rate standard set a level that has an operational impact on only a limited percentage of covered natural gas units.
As detailed later, when coupled with an emissions credit trading program, these emission rate standards are expected to result in a 26% to 27% reduction in fossil sector carbon emissions relative to 2005 and a 15% reduction relative to a base case forecast for 2020. 24
23 These would be separate sub-categories under the existing unit rule.
24 The issues associated with the legal definition of BSER are beyond the scope of this whitepaper. However the
emission reductions discussed in this whitepaper are consistent with the experience and expectations of a number of states that have developed and begun to implement programs to reduce power sector carbon emissions. They are also consistent with more than one approach to establishing BSER for the fossil boiler sub-category. The analysis presented in this whitepaper and similar analyses by other organizations including MIT and the Congressional Research Service demonstrate the opportunity to achieve substantial carbon emission reductions by displacing coal generation with additional generation from existing NGCC capacity. This analysis shows the potential to reduce carbon emissions from coal plants to approximately 1,100 million metric tonnes and carbon emissions from all fossil plants to approximately 1,750 million metric tonnes. More precisely, using the 1,630 TWh of coal generation produced annually during the 2011 to 2012 period as a historic baseline, the 1,069 million
NORTHBRIDGE 16
In its guidance to the states, we also assume EPA will articulate the criteria it will use to review the plans proposed by states to meet EPA guidance. EPA may choose to rely on multiple criteria to review the proposed state plans. We assume these criteria will specify how California and the RGGI states would demonstrate compliance through their existing carbon programs. Presumably, this would involve EPA providing those states with a mass-based budget for the carbon emissions emitted by covered fossil generating units.
Importantly, we assume EPA would also provide states not participating in the RGGI and California carbon programs with a mass-based budget, allowing them to meet EPA’s guidance by complying with either the emission rate standards described earlier or this mass-based alternative. If a state elects to comply through its mass-based budget, it would not need to also meet the emission rate standards in order to demonstrate compliance with EPA’s guidelines.
Further, we assume that EPA will issue a model trading rule whereby states electing the mass-based alternative could choose to participate in a trading program with allocated emission credits. This would allow covered electric generating units, if they choose, to comply with the mass-based standard in part or in whole through emission credit trading on an intra- or interstate basis.
Under this policy design, states would have the flexibility to comply with the emission standards in several ways:
1. Meeting the emission rate standards themselves
2. Participating in an existing carbon trading program (such as RGGI or California) that otherwise meets EPA’s guidance
3. Meeting the alternative mass-based standard through a state resource planning process
4. Meeting the mass-based standard through the model trading rule.
Notably, the last approaches on this list are not mutually exclusive, as states may choose to comply through a mix of state resource planning decisions and emission credit trading. The RGGI states and California are using a mix of such measures including energy efficiency and renewable policies to achieve the emission caps established under those programs.
metric tonnes of carbon emissions from coal estimated in this analysis is consistent with a 1,446 lb/MWh equivalent emission rate. This represents roughly a 30% reduction relative to recent and current levels. Alternately, there are a number of on-site (or “inside the fence”) technologies that might be used to reduce the carbon emission rates of coal plants and establish BSER. These include heat rate improvements, coal drying, coal rank switching, co-firing with natural gas and perhaps in some circumstances partial carbon capture, utilization and sequestration (CCUS). From a technical perspective, using natural gas as a fuel in coal boilers or partial CCUS, particularly in combination with one or more of the other technologies listed earlier, could be used to achieve a 1,450 lb/MWh emission rate.
NORTHBRIDGE 17
Finally, we assume that EPA’s guidance would require compliance to begin January 2018, with the standards becoming incrementally more stringent until they reach the levels suggested in this whitepaper in 2020. The emission standards would then remain fixed for an indefinite period or until EPA chooses to revise them in a later rulemaking process. The phase-in period not only would allow time for industry to engage in prudent resource planning and implementation, but also would prevent or mitigate any undue impacts on the electric or natural gas markets.
C. Coal and Fossil Mass-Based Alternatives
In this whitepaper, we consider two forms of a mass-based standard:
Mass-Based Fossil Standard – This form is the most familiar, as it would involve a budget for carbon emissions from all covered fossil units, both coal and gas. The RGGi and California AB 32 programs are examples of a mass-based fossil standard.
Mass-Based Coal Standard & Emission Rate Standard for Gas – This form would involve a budget for carbon emissions from covered coal units. The gas emission rate standard would remain in effect, so both sub-categories would be regulated under the rule. This approach is referred to as the “coal budget/gas rate” or, more simply, the “coal approach”.
Although these two alternatives are similar in many respects, there are a number of tradeoffs to consider. In particular, at an equivalent level of emission stringency (that is, reduction in tons emitted) the coal budget/gas rate alternative would produce materially lower emission credit prices, wholesale electric prices and retail electric rate impacts during the initial years of a 111(d) power plant policy would the fossil alternative. However, over a longer period of time, achieving much deeper emission reductions than analyzed in this whitepaper in an economically efficient manner will require some form of a fossil approach because it would provide stronger incentives to invest in low carbon and zero carbon resources. These similarities and tradeoffs are detailed later in this whitepaper.
The mass-based standards would be derived from each state’s emission rate standards and a historic generation baseline, assumed in this analysis to be the years 2011 and 2012. Given the emission rates identified earlier, the mass-based fossil standard would be consistent with a national budget for carbon emissions from fossil plants of approximately 1,750 million metric tonnes and the mass-based coal standard would be consistent with a national budget for carbon emissions from coal plants of approximately 1,100 million metric tonnes. 25
Both mass-based approaches provide numerous benefits. First, the positive price on carbon emissions and lack of production incentives means they would diminish or avoid the previously described emission rebound, seams and longer term regulatory transition concerns associated with most rate-based approaches. Also, they would give states another proven, practical compliance
25 Both budgets are essentially equivalent on a total electric fossil sector basis as illustrated in the figure on page
20 showing historical and projected electric sector emissions. In this analysis, the budgets cover emissions from both existing and new generating units.
NORTHBRIDGE 18
pathway and greater flexibility than if every state were restricted to complying through a mandatory emission rate standard. This flexibility comes both from having the option to elect a mass-based or rate-based standard and from the broader range of compliance options available under such a standard. 26 Further, the accounting rules required to reflect the impact of new renewable facilities, energy efficiency programs and nuclear uprates, would be much more straightforward under a mass-based system than a rate-based system. Consistent with these points, a number of states, electric generating companies and policy groups have pointed out the compliance flexibility and other advantages of mass-based and market-based options.27 As well, adopting the mass-based alternative would provide states with greater certainty regarding emission reductions than a rate-based approach, and would provide a framework for establishing an emissions trading program.
D. Emission Credit Trading
It is noteworthy that essentially all of the major policy proposals and policy concepts offered to date related to the forthcoming existing power plant GHG rule include some form of emission credit trading. This reflects a wide recognition among policy analysts and stakeholders that emission credit trading encourages flexible and cost effective compliance, and highlights the central role a federal trading program should play in any policy design.
In the context of the mass-based approaches discussed in this whitepaper, an emission credit trading program, would benefit states outside of RGGI and California by providing them a market-based compliance option, greater compliance flexibility and transparent market price signals to assess the value of alternative compliance options.
Of particular importance, an emissions credit trading program would facilitate cost-effective compliance by displacing high emission rate coal with generation from existing NGCC units. As described in the appendix to this whitepaper, in the near term such displacement offers the largest, low cost, proven source of carbon abatement available in the electric sector.
Importantly, the model trading rule and mass-based alternative would require an allocation of emission credits to covered entities in participating states. EPA could establish the methodology for
26 The primary compliance options for an emissions rate-based standard likely would be limited to heat rate
improvements, co-firing with natural gas or possibly biomass, and in some circumstances perhaps partial carbon capture, utilization and sequestration. In contrast, a mass-based approach would facilitate compliance through a wider range of abatement options including the dispatch of existing NGCC and coal units. 27
For example, see: 1) Greenhouse Gas Policy Implications for Kentucky under Section 111(d) of the Clean Air Act. Commonwealth of Kentucky Energy and Environment Cabinet, October 2013. 2) American Electric Power presentation to the Bipartisan Policy Center GHG Workshop on December 6, 2013, 3) Letter from state environment agency leaders in 15 states on December 16, 2013 to EPA Administrator Gina McCarthy, 4) Structuring Power Plant Emissions Standards under the Clean Air Act – Standards for Existing Power Plants, Chris Van Atten of M.J. Bradley Associates, September 2013, prepared on behalf of eight electric generating companies. 5) Midwestern Power Sector Collaborative, Initial Recommendations to the U.S. Environmental Protection Agency on Regulation of Existing Power Plant Sources Under Section 111(d) of the Clean Air Act, November 2013.
NORTHBRIDGE 19
allocating emission credits to covered entities as general guidelines, through a detailed methodology, or more simply leave it to the states to determine. Regardless, any such an allocation should:
1. Be simple, practical and transparent, 2. Mitigate retail rate increases, 3. Seek to mitigate the financial impact of the rule on merchant coal generators whose
revenues are tied to current wholesale market prices,28 and 4. Give appropriate credit to those entities that have previously initiated measures to reduce
emissions.
IV. Economic Analysis of Mass-Based Alternatives
A. Framework
To facilitate a comparison of mass-based alternatives, NorthBridge performed an economic analysis examining the mass-based fossil and coal policies outlined earlier. This analysis assumes that states are allowed to choose between an emission rate standard and a mass-based alternative and that all states would elect to comply with EPA’s guidance through the mass-based standard.
Both of these “core” policy cases are structured to reduce electric sector carbon emissions to approximately 1,765 million metric tonnes by 2020. This is equivalent to a 15% reduction relative to the forecasted base case emissions in 2020 and a 26% to 27% reduction compared to 2005 emissions. We also analyzed a third mass-based fossil policy but with a less stringent emission standard as a sensitivity case to illustrate the reduced level of emission reductions achieved under a lower emission credit price.
Although the two core policy cases are similar in many respects, they differ in several important ways. As both achieve the same level of emission reductions in largely the same manner, primarily by substituting high emission rate coal generation with lower emission generation from existing NGCC units, the compliance costs and cost per tonne of abatement are generally similar. Nonetheless, important differences and tradeoffs exist between the two cases. In particular, the fossil approach has larger near term impacts on emission credit prices, wholesale electric prices and retail rates.29
28 The decision to allocate emission credits to merchant coal generators is an equity issue rather than an economic
efficiency issue. The approach here follows in general terms the approach adopted in final versions of the economy wide cap and trade legislation proposed but not approved in 2009. As then, it remains a controversial issue among policy analysts and stakeholders that is subject to debate. 29
Mechanically, the analysis was conducted by assuming an emission credit price is applied to the carbon emissions from some or all fossil generating units. In the mass-based fossil cases, the carbon price is applied to the emissions from all fossil generating units, and in the mass-based coal case the carbon price is applied only to the emissions from coal generating units. While the mass-based coal policy also envisions an emission rate standard is applied to the carbon emissions from gas units, that standard is assumed to be set a level that has an operational impact on only a limited percentage of gas units. Because of this and for simplicity, the gas emission rate standard
NORTHBRIDGE 20
These similarities and differences are explained in the following section.
B. Similarities between the Two Core Cases
As discussed, the core fossil and coal mass-based alternatives operate in basically the same way, achieving similar emission reductions as a result of how they were structured with similar compliance patterns and costs. Both alter the dispatch of fossil generation displacing high emission rate coal with lower emission rate gas, and also achieve compliance through other means.
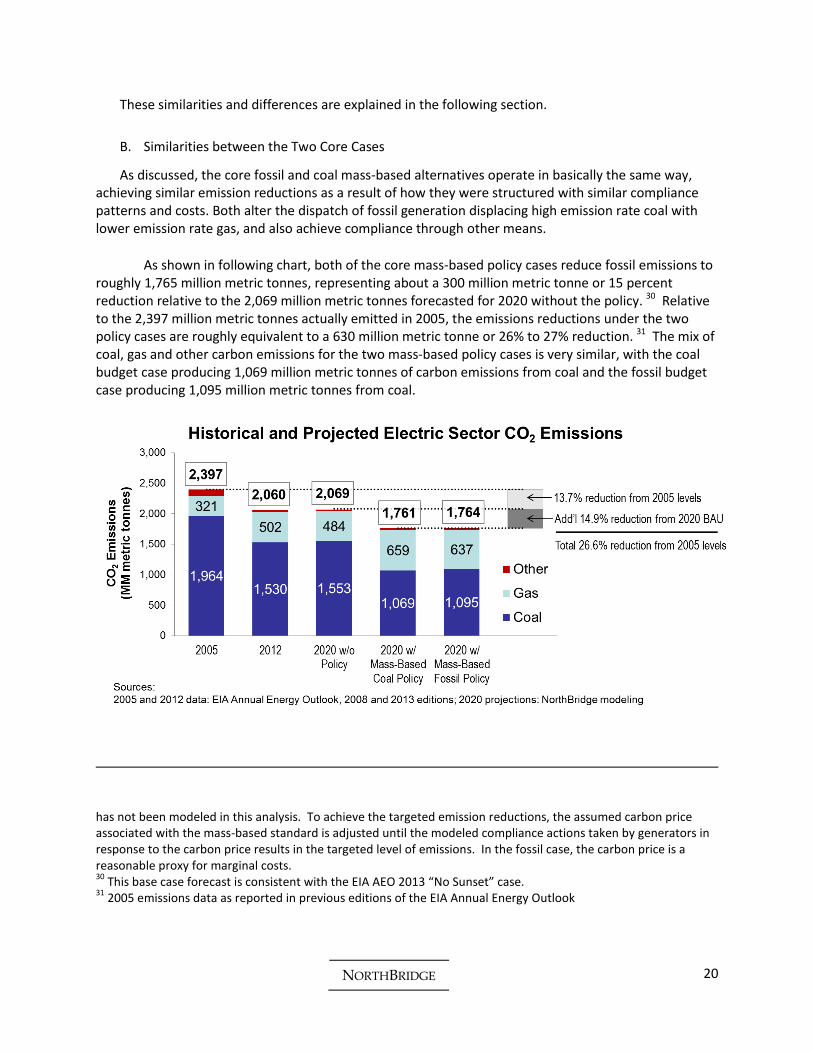
As shown in following chart, both of the core mass-based policy cases reduce fossil emissions to roughly 1,765 million metric tonnes, representing about a 300 million metric tonne or 15 percent reduction relative to the 2,069 million metric tonnes forecasted for 2020 without the policy. 30 Relative to the 2,397 million metric tonnes actually emitted in 2005, the emissions reductions under the two policy cases are roughly equivalent to a 630 million metric tonne or 26% to 27% reduction. 31 The mix of coal, gas and other carbon emissions for the two mass-based policy cases is very similar, with the coal budget case producing 1,069 million metric tonnes of carbon emissions from coal and the fossil budget case producing 1,095 million metric tonnes from coal.
has not been modeled in this analysis. To achieve the targeted emission reductions, the assumed carbon price associated with the mass-based standard is adjusted until the modeled compliance actions taken by generators in response to the carbon price results in the targeted level of emissions. In the fossil case, the carbon price is a reasonable proxy for marginal costs. 30
This base case forecast is consistent with the EIA AEO 2013 “No Sunset” case. 31
2005 emissions data as reported in previous editions of the EIA Annual Energy Outlook
NORTHBRIDGE 21
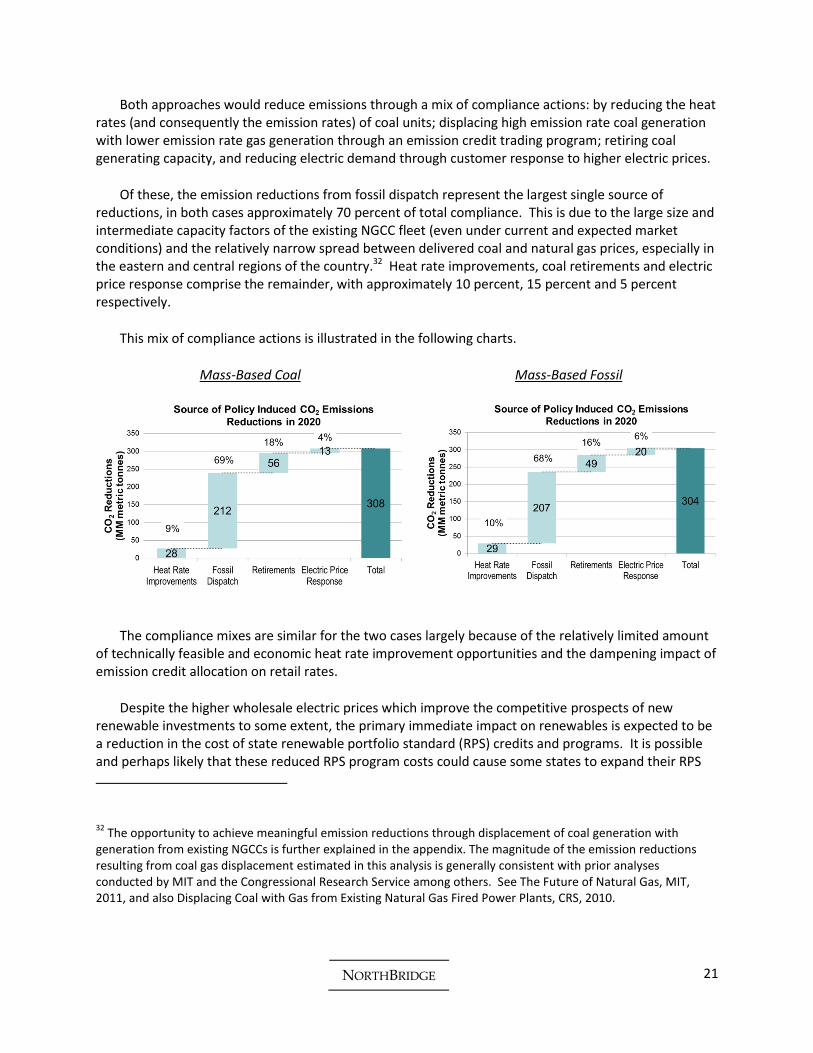
Both approaches would reduce emissions through a mix of compliance actions: by reducing the heat rates (and consequently the emission rates) of coal units; displacing high emission rate coal generation with lower emission rate gas generation through an emission credit trading program; retiring coal generating capacity, and reducing electric demand through customer response to higher electric prices.
Of these, the emission reductions from fossil dispatch represent the largest single source of reductions, in both cases approximately 70 percent of total compliance. This is due to the large size and intermediate capacity factors of the existing NGCC fleet (even under current and expected market conditions) and the relatively narrow spread between delivered coal and natural gas prices, especially in the eastern and central regions of the country.32 Heat rate improvements, coal retirements and electric price response comprise the remainder, with approximately 10 percent, 15 percent and 5 percent respectively.
This mix of compliance actions is illustrated in the following charts.
Mass-Based Coal Mass-Based Fossil
The compliance mixes are similar for the two cases largely because of the relatively limited amount of technically feasible and economic heat rate improvement opportunities and the dampening impact of emission credit allocation on retail rates.
Despite the higher wholesale electric prices which improve the competitive prospects of new renewable investments to some extent, the primary immediate impact on renewables is expected to be a reduction in the cost of state renewable portfolio standard (RPS) credits and programs. It is possible and perhaps likely that these reduced RPS program costs could cause some states to expand their RPS
32 The opportunity to achieve meaningful emission reductions through displacement of coal generation with
generation from existing NGCCs is further explained in the appendix. The magnitude of the emission reductions resulting from coal gas displacement estimated in this analysis is generally consistent with prior analyses conducted by MIT and the Congressional Research Service among others. See The Future of Natural Gas, MIT, 2011, and also Displacing Coal with Gas from Existing Natural Gas Fired Power Plants, CRS, 2010.
NORTHBRIDGE 22
programs which would drive new renewable investments, but the potential and impact of this have not been examined in this analysis.
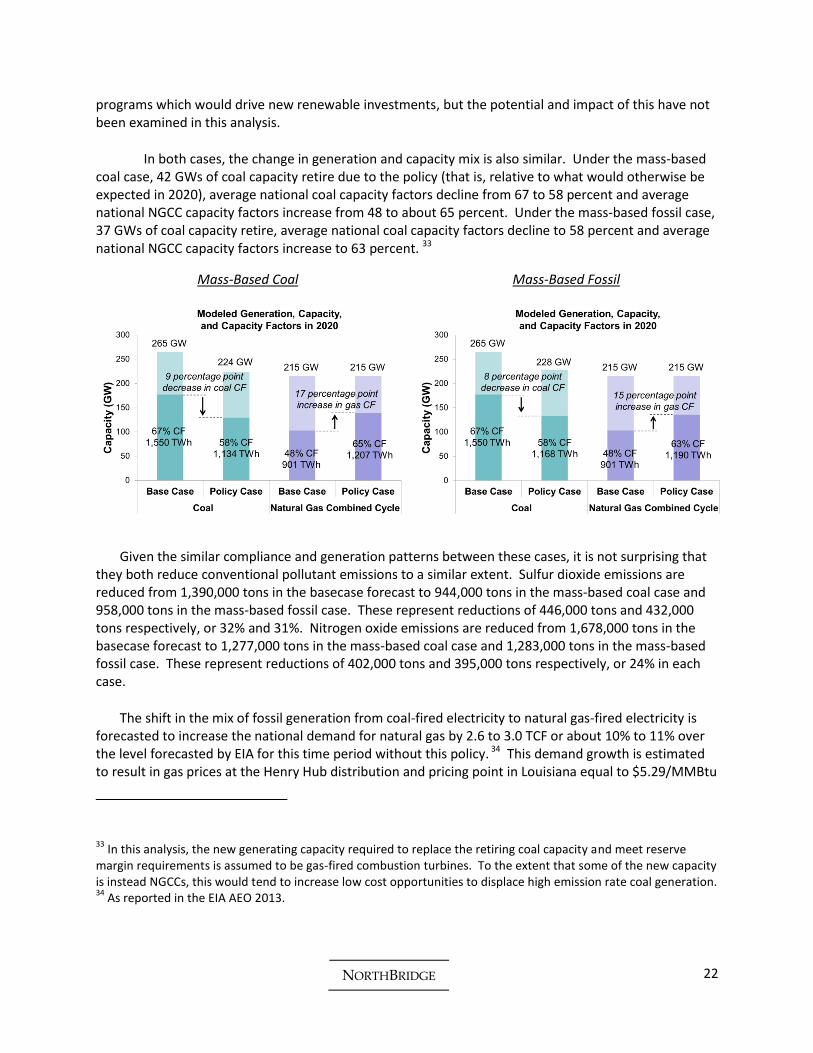
In both cases, the change in generation and capacity mix is also similar. Under the mass-based coal case, 42 GWs of coal capacity retire due to the policy (that is, relative to what would otherwise be expected in 2020), average national coal capacity factors decline from 67 to 58 percent and average national NGCC capacity factors increase from 48 to about 65 percent. Under the mass-based fossil case, 37 GWs of coal capacity retire, average national coal capacity factors decline to 58 percent and average national NGCC capacity factors increase to 63 percent. 33
Mass-Based Coal Mass-Based Fossil
Given the similar compliance and generation patterns between these cases, it is not surprising that they both reduce conventional pollutant emissions to a similar extent. Sulfur dioxide emissions are reduced from 1,390,000 tons in the basecase forecast to 944,000 tons in the mass-based coal case and 958,000 tons in the mass-based fossil case. These represent reductions of 446,000 tons and 432,000 tons respectively, or 32% and 31%. Nitrogen oxide emissions are reduced from 1,678,000 tons in the basecase forecast to 1,277,000 tons in the mass-based coal case and 1,283,000 tons in the mass-based fossil case. These represent reductions of 402,000 tons and 395,000 tons respectively, or 24% in each case.
The shift in the mix of fossil generation from coal-fired electricity to natural gas-fired electricity is forecasted to increase the national demand for natural gas by 2.6 to 3.0 TCF or about 10% to 11% over the level forecasted by EIA for this time period without this policy. 34 This demand growth is estimated to result in gas prices at the Henry Hub distribution and pricing point in Louisiana equal to $5.29/MMBtu
33 In this analysis, the new generating capacity required to replace the retiring coal capacity and meet reserve
margin requirements is assumed to be gas-fired combustion turbines. To the extent that some of the new capacity is instead NGCCs, this would tend to increase low cost opportunities to displace high emission rate coal generation. 34
As reported in the EIA AEO 2013.
NORTHBRIDGE 23
for the mass-based coal case and $5.22/MMBtu for the mass-based fossil case (both in nominal 2020 dollars). These prices are a 10% to 11% increase at Henry Hub, a somewhat lower percentage increase on a delivered basis, and well below the absolute level of prices experienced during the 2005 to 2008 time period. Much of the increased natural gas production would likely come from the Gulf Coast and Northeast regions (primarily in the area of the Marcellus shale formation). 35
Moreover, the regional pattern of displacement of high emission rate coal with natural gas is quite similar for the two cases. There is also a generally similar pattern of regional and state emission reductions: states with little or no coal generation, that are expected to retire substantial amounts of coal capacity in coming years without this policy, that currently have carbon trading programs requiring future reductions or that have otherwise made actionable commitments to reduce carbon emissions going forward would generally have limited if any further regulatory obligations.
In general, the pattern of displacement across regions is driven by the amount of coal and NGCC capacity in each region, how hard the NGCC capacity runs in the base case and the commodity spreads between delivered coal and natural gas prices. Regions with relatively large NGCC fleets operating at relatively low capacity factors or with narrow commodity spreads tend to displace more coal. Regions with smaller NGCC fleets, higher base case capacity factors or wider commodity spreads tend to displace less coal.
These factors cause much of the displacement to happen in the eastern and gulf regions of the country, with less in the western regions. Because displacement is expected to be less costly in the eastern and gulf regions than in the West due to the more narrow commodity spreads, the analysis also shows some eastern and gulf states reducing their emissions below the assumed mass-based standards and selling credits to states in the western regions, allowing them to comply with the regulations at a lower cost than otherwise possible. Because the two cases create essentially the same pricing differential for coal and gas generation dispatch prices, the general pattern of regional compliance is quite similar for both. 36
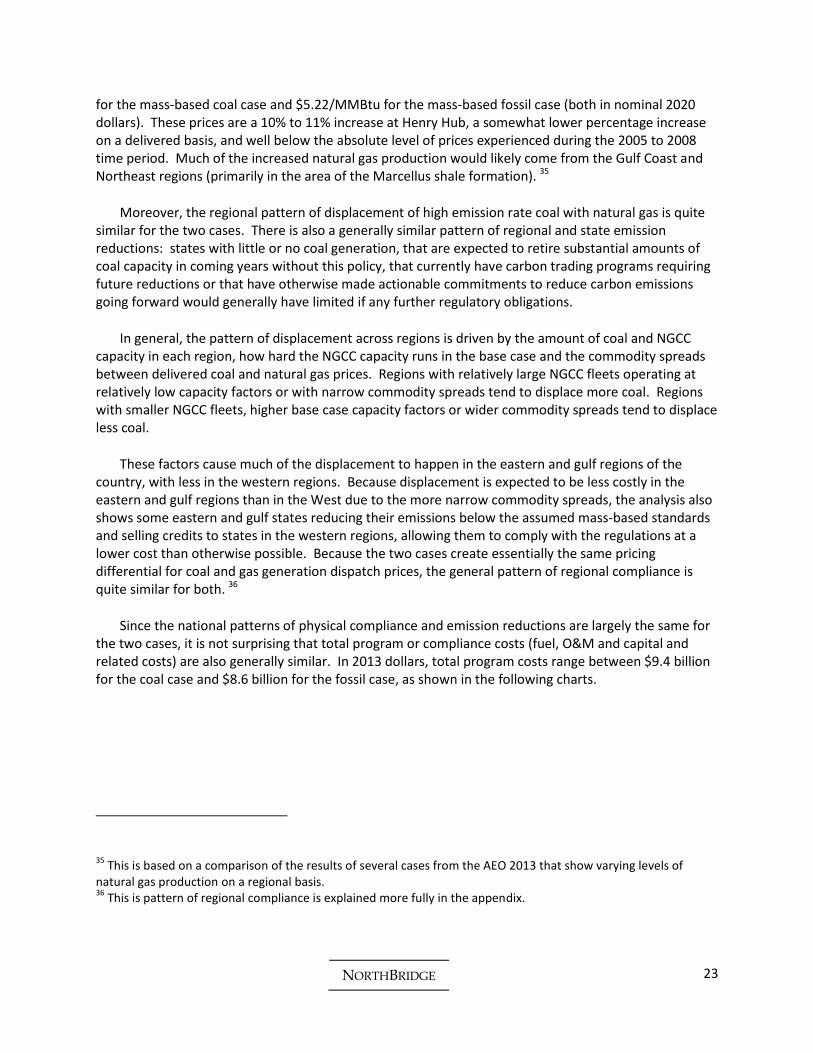
Since the national patterns of physical compliance and emission reductions are largely the same for the two cases, it is not surprising that total program or compliance costs (fuel, O&M and capital and related costs) are also generally similar. In 2013 dollars, total program costs range between $9.4 billion for the coal case and $8.6 billion for the fossil case, as shown in the following charts.
35 This is based on a comparison of the results of several cases from the AEO 2013 that show varying levels of
natural gas production on a regional basis. 36
This is pattern of regional compliance is explained more fully in the appendix.
NORTHBRIDGE 24
Mass-Based Coal Mass-Based Fossil
Of these totals, fuel and variable O&M costs are the largest single component, representing 75% of total costs in the coal case and nearly 60% in the fossil case. Rate regulated electric utilities would then typically recover most of their compliance costs through state-approved fuel clause mechanisms, with the remainder recovered through base rates.
It should be noted that these results, like those from other studies relying on long term projections of natural gas prices, are subject to forecast uncertainty. In this analysis, the results for the policy cases depend in part on the extent to which natural gas prices rise in response to the higher demand for natural gas. Assuming the gas price response is 50% higher or lower than in the core policy case and the mix of compliance actions is unchanged, the total cost of compliance for the mass-based coal case would be $12.5 billion or $6.2 billion, a change of $3.2 billion or 34% relative to the core policy case result of $9.4 billion. Under the same range of assumptions, emission credit prices for the mass-based coal case would be $22.5/tonne or $17.8/tonne (compared to the core policy case of $20/tonne) and retail electric rates would rise by 3.5% or 1.1% (compared to the core policy case of 2.3% as will be discussed later). Two factors would tend to limit the impacts of a higher gas price response. One, reflected these sensitivity estimates, is the higher emission credit price raises the value of the emission credit allocation that dampens the net impact on retail rates. The other, not reflected in these sensitivity estimates, is the higher cost of coal-gas displacement makes other compliance options more cost effective on a relative basis. This shifts the mix of compliance options away from coal-gas displacement to the lower cost options. Since this second factor is not reflected in these sensitivity estimates, they are likely to be somewhat conservative.
Given the compliance costs and emission reduction estimates for the two policy cases, the average cost per tonne of abatement ranges between $32 and $30/tonne, which is within current estimates of the social cost of carbon. The marginal cost of abatement for the two cases is essentially the same, $34/tonne.
The similarity in total program compliance costs and carbon abatement costs per tonne also suggests that the two approaches have generally similar levels of economic efficiency, at least during the initial phase of carbon regulation covering existing electric power plants under the CAA. This may seem somewhat counter-intuitive as expanding the scope of trading programs generally is considered to increase economic efficiency.

NORTHBRIDGE 25
In this analysis however, putting a price on the carbon emissions from natural gas plants (and thus raising the wholesale and retail price of electricity more than under the coal approach) does not drive economic responses that materially reduce carbon emissions beyond the level resulting from a price just on the carbon emissions from coal units. In part, this may be attributable to the modeling platform used for this analysis, which is limited to the electric sector, or the horizon of the policies which are assumed to achieve full implementation by 2020 and then remain unchanged. Perhaps more significantly, it reflects the view that, during the period of this analysis, there are limited opportunities to improve the operating efficiency of covered gas generating units, few gas generating units would be retired, and that existing renewable capacity cannot dispatch at higher levels to displace gas generation. Reductions in electric demand in response to higher retail electric prices would reduce emissions, but to the extent emission credit allocations mitigate most retail rate increases, the electric price response would be limited. Further, it is likely that the primary impact of higher wholesale electric prices on renewables would be to reduce the cost of state RPS programs rather than increase the deployment of new renewable generation. While it is possible that other factors not captured in this analysis may come into play – for instance, states expanding their RPS programs in response to the lower cost of those programs or demand response to higher gas prices in other sectors of the economy – this analysis does not reveal substantial efficiency gains from the fossil approach over the coal approach during this initial period of regulation under the CAA.
However, it should be noted here that over a longer period of time, particularly with increasing stringent emission standards, the fossil approach would result in greater and more cost effective emission reductions than the coal approach. This point is discussed further in the next section.
Finally, while not a result of the economic analysis, it is worth noting that both the coal and fossil mass-based approaches similarly address issues important to the electric industry.
Early Action – The mass-based standards would be established with a historic baseline, providing credit for abatement actions undertaken since that time.
Implementation Time – The phase-in period would provide time for prudent resource planning and implementation.
Market Compatibility – The approaches would not create incentives for coal unit life extension or seams conflicts with the existing carbon trading programs in the RGGI states and California.
Unit Retirements – Expected coal unit retirements likely would occur towards the end of the phase-in period with compensation through the credit allocation process that would be based on a historic generation baseline.
Impact on Merchant Coal Assets – Credit allocations could mitigate the financial impact of the regulation on the owners of merchant coal generating facilities.
C. Differences and Tradeoffs between the Two Core Cases
Although both mass-based cases would achieve similar physical compliance and emission reductions at generally similar program costs and abatement costs per tonne, significant differences exist between the cases creating tradeoffs in choosing one policy approach over another. These include the lower near term emission credit prices, wholesale electric prices and retail rates of the mass-based coal approach
NORTHBRIDGE 26
and, assuming policymakers elect to further reduce carbon emissions in the electric sector, the eventual need for some type of a mass-based fossil policy. 37
First, assuming the same level of emission reductions, the emission credit trading price under the mass-based fossil approach would be higher than under the coal approach, $34/metric tonne in 2013 dollars for fossil as opposed to $20/metric tonne for coal.
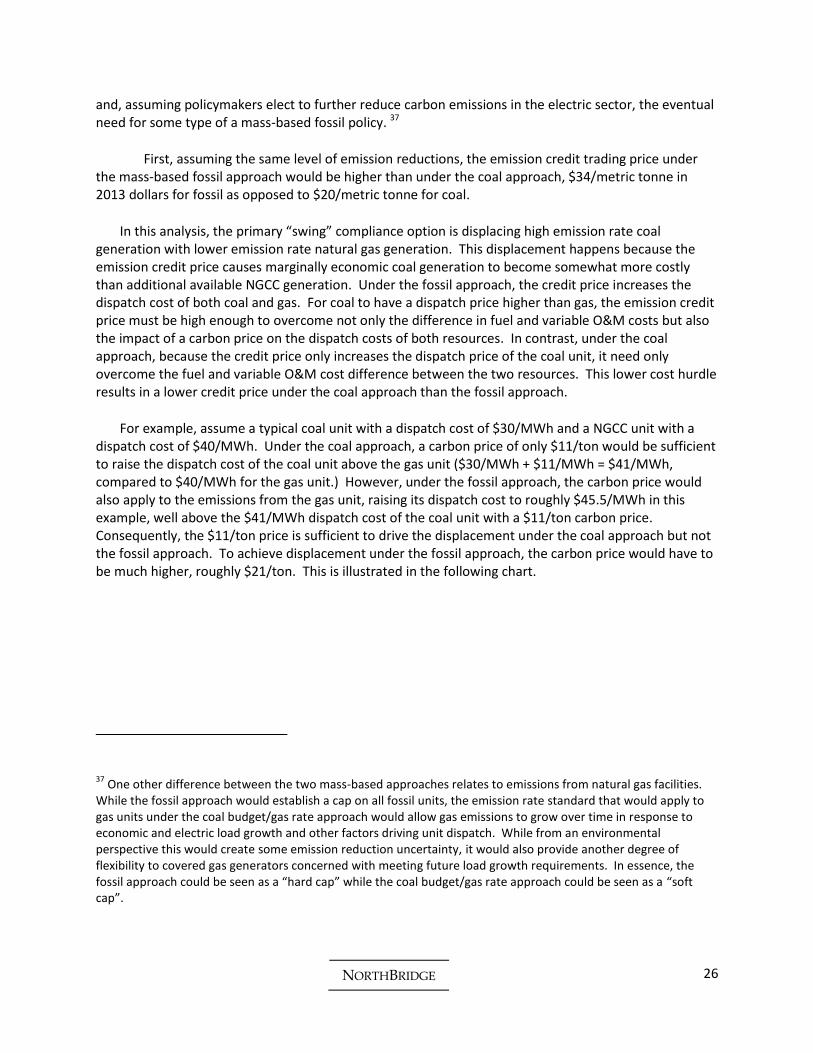
In this analysis, the primary “swing” compliance option is displacing high emission rate coal generation with lower emission rate natural gas generation. This displacement happens because the emission credit price causes marginally economic coal generation to become somewhat more costly than additional available NGCC generation. Under the fossil approach, the credit price increases the dispatch cost of both coal and gas. For coal to have a dispatch price higher than gas, the emission credit price must be high enough to overcome not only the difference in fuel and variable O&M costs but also the impact of a carbon price on the dispatch costs of both resources. In contrast, under the coal approach, because the credit price only increases the dispatch price of the coal unit, it need only overcome the fuel and variable O&M cost difference between the two resources. This lower cost hurdle results in a lower credit price under the coal approach than the fossil approach.
For example, assume a typical coal unit with a dispatch cost of $30/MWh and a NGCC unit with a dispatch cost of $40/MWh. Under the coal approach, a carbon price of only $11/ton would be sufficient to raise the dispatch cost of the coal unit above the gas unit ($30/MWh + $11/MWh = $41/MWh, compared to $40/MWh for the gas unit.) However, under the fossil approach, the carbon price would also apply to the emissions from the gas unit, raising its dispatch cost to roughly $45.5/MWh in this example, well above the $41/MWh dispatch cost of the coal unit with a $11/ton carbon price. Consequently, the $11/ton price is sufficient to drive the displacement under the coal approach but not the fossil approach. To achieve displacement under the fossil approach, the carbon price would have to be much higher, roughly $21/ton. This is illustrated in the following chart.
37 One other difference between the two mass-based approaches relates to emissions from natural gas facilities.
While the fossil approach would establish a cap on all fossil units, the emission rate standard that would apply to gas units under the coal budget/gas rate approach would allow gas emissions to grow over time in response to economic and electric load growth and other factors driving unit dispatch. While from an environmental perspective this would create some emission reduction uncertainty, it would also provide another degree of flexibility to covered gas generators concerned with meeting future load growth requirements. In essence, the fossil approach could be seen as a “hard cap” while the coal budget/gas rate approach could be seen as a “soft cap”.
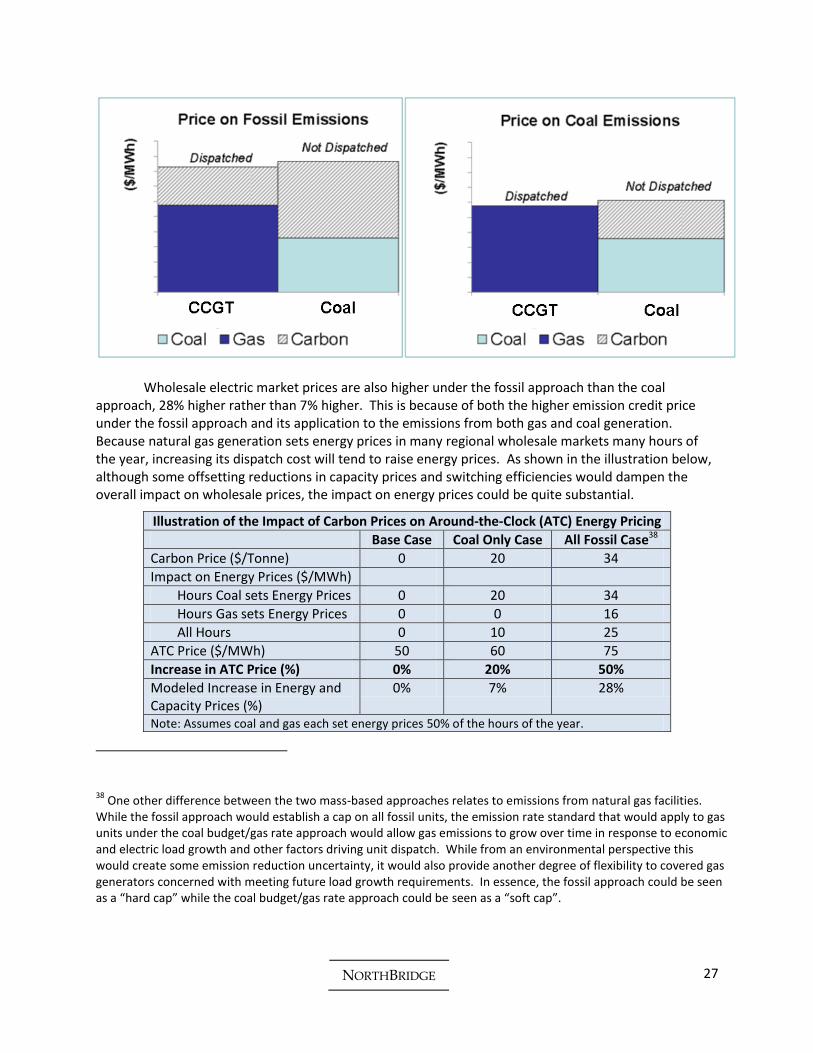
NORTHBRIDGE 27
Wholesale electric market prices are also higher under the fossil approach than the coal approach, 28% higher rather than 7% higher. This is because of both the higher emission credit price under the fossil approach and its application to the emissions from both gas and coal generation. Because natural gas generation sets energy prices in many regional wholesale markets many hours of the year, increasing its dispatch cost will tend to raise energy prices. As shown in the illustration below, although some offsetting reductions in capacity prices and switching efficiencies would dampen the overall impact on wholesale prices, the impact on energy prices could be quite substantial.
Illustration of the Impact of Carbon Prices on Around-the-Clock (ATC) Energy Pricing
Base Case Coal Only Case All Fossil Case38
Carbon Price ($/Tonne) 0 20 34
Impact on Energy Prices ($/MWh)
Hours Coal sets Energy Prices 0 20 34
Hours Gas sets Energy Prices 0 0 16
All Hours 0 10 25
ATC Price ($/MWh) 50 60 75
Increase in ATC Price (%) 0% 20% 50%
Modeled Increase in Energy and Capacity Prices (%)
0% 7% 28%
Note: Assumes coal and gas each set energy prices 50% of the hours of the year.
38 One other difference between the two mass-based approaches relates to emissions from natural gas facilities.
While the fossil approach would establish a cap on all fossil units, the emission rate standard that would apply to gas units under the coal budget/gas rate approach would allow gas emissions to grow over time in response to economic and electric load growth and other factors driving unit dispatch. While from an environmental perspective this would create some emission reduction uncertainty, it would also provide another degree of flexibility to covered gas generators concerned with meeting future load growth requirements. In essence, the fossil approach could be seen as a “hard cap” while the coal budget/gas rate approach could be seen as a “soft cap”.
NORTHBRIDGE 28
Average U.S. retail rates are also somewhat higher under the fossil approach than the coal approach, primarily due to the impacts on states with restructured electric industries.
For states with rate regulated retail electric service, assuming free allocation of emission credits, the generation component of retail rates will rise due to the shift in generation mix from coal to gas, upward pressure on natural gas prices resulting from displacement and the capital and operating costs of other compliance measures. Since the increase in production costs for the two approaches is generally similar for the two cases ($9.4 billion for the coal approach and $8.6 billion for the fossil approach) the average increase in national regulated rates would also be generally similar for the two approaches. However, for states that have restructured their electric industries and allowed retail choice, this would not be the case. In those states, the increase in wholesale electric prices would flow through to retail customers, raising their electric rates. And since the increase in wholesale prices is greater under the fossil approach than the coal approach, the increase in retail rates would also be greater under the fossil approach.
In this analysis, assuming emission credits are allocated to mitigate retail rates and impacts on merchant coal generators, the average U.S. retail rate impact would be 2.3% under the coal approach and 4.1% under the fossil approach.
Beyond an initial period of GHG regulation under the CAA, if policymakers seek further emission reductions materially beyond the level assumed in this analysis, the fossil approach would likely be a more effective and efficient policy than the coal approach. Some of this is due to the simple consideration that there is a finite amount of additional generation available to displace coal from existing NGCCs and also that NGCCs without carbon capture technology are significant carbon emitters. So if policymakers decide to eventually achieve deeper emission reductions, either in regions where gas has fully displaced coal or regions where a mix of coal and gas remains in place, other sources of abatement beyond those expected to result from the coal approach will be needed. Deeper emission reductions will require new capital investment in zero carbon emissions generation technology such as renewables and nuclear, supporting technology such as electricity storage, carbon capture and sequestration, and energy efficiency. Whether established through a subsequent rulemaking effort by EPA under the CAA or federal legislation establishing a national cap and trade program or a carbon tax, a fossil policy would, in the longer term, provide stronger and more effective price signals to develop these resources than the coal approach. Finally, it should be noted that either mass-based approach discussed in this whitepaper could be converted into one of these longer term fossil policies. Considered in this context, the coal approach could be seen as an initial transition step towards a longer term fossil policy.
These similarities and differences between the two mass-based approaches create tradeoffs for policymakers. While both approaches can be designed to achieve meaningful and cost effective emission reductions and share other attractive features, other issues also arise. With the fossil approach, the higher emission credit prices, wholesale prices and retail rate impacts may be a concern. With the coal approach, establishing a budget for coal and an emission rate standard for gas may appear uneven, even though the mass-based coal standard would be an attractive alternative to the emission rate standard because it provides greater compliance flexibility and the opportunity for cost effective compliance and retail rate mitigation.
NORTHBRIDGE 29
D. Moderate Mass-Based Fossil Sensitivity Case
To further illustrate the tradeoffs associated with these policy designs, we analyzed a third case structured to achieve a lower level of emission reductions by implementing a mass-based fossil policy using the same allowance price as the coal approach ($20/tonne).
With the lower fossil emission credit price, wholesale price increases are reduced from 28% to 16% and retail price impacts (after allocation of credits) are reduced from 4.1% to 1.7%. But while a less stringent standard results in lower short term price and rate impacts, it also of course results in a lower level of emission reductions – in this case, 8.7% relative to the base case forecast rather than 15%. 39 This is roughly equivalent to a 200 million metric tonne reduction relative to forecast levels instead of a 300 million metric tonne reduction, or 33% less than in the two core policy cases. As demonstrated by this analysis, however, these potentially lost emission reductions could be achieved cost effectively and with modest rate and price impacts through the coal approach.
V. Summary and Conclusions
In considering how best to structure a policy to reduce GHG emissions from existing power plants under the CAA, mass-based approaches have a number of distinct advantages over rate-based policy designs. Mass-based approaches can provide for flexible and cost-effective compliance while at the same time driving meaningful emission reductions with limited retail rate impacts. They also avoid the pitfalls of rate-based approaches including the unintended adverse consequences arising from production incentives: conflicts and inefficiencies at the seams of RGGI, California and other mass-based systems; potentially limited and uncertain emission reductions; and tensions with longer term federal carbon policies.
Moreover, the alternative mass-based fossil and coal approaches analyzed in this whitepaper could achieve 26% to 27% fossil emission reductions relative to 2005 (15% relative to the basecase forecast) using very similar proven compliance pathways.
However, there are also material differences and tradeoffs between the two approaches. These include lower near term emission credit prices, wholesale electric prices and retail rate impacts of the coal approach and the likely eventual need to establish some form of a mass-based fossil policy. Although adopting a less stringent fossil standard would reduce the short term impacts of a more stringent fossil standard, such an approach would also result in substantially lower emission reductions than what could be achieved cost-effectively through a mass-based coal approach.
39 Under this moderate fossil case, total carbon emissions from the electric sector are 1,890 million metric tonnes
while carbon emissions from coal generation are approximately 1,300 million metric tonnes. The comparable numbers for the two core policy cases are 1,750 and 1,100 million metric tonnes respectively.
NORTHBRIDGE 30
VI. Appendices
A. Why coal displacement is the largest, cheapest, proven near term abatement option
B. Market modeling system and economic analysis
C. Summary comparison of cases
D. Regional patterns of displacement
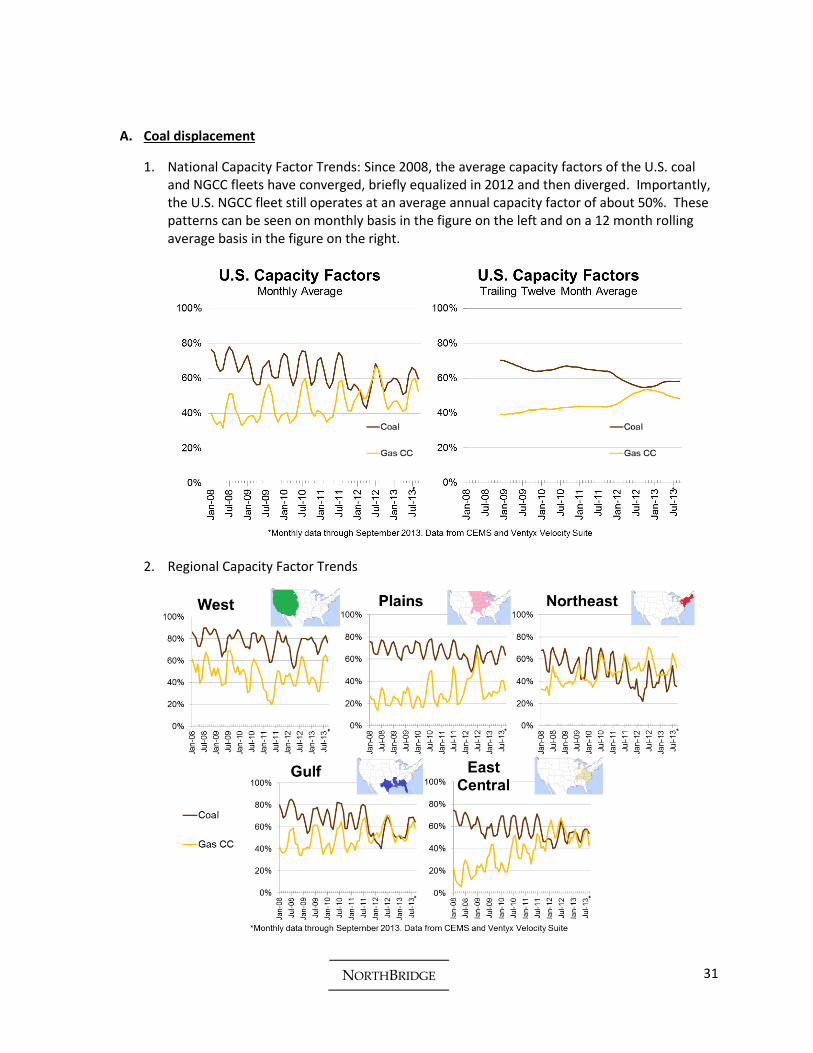
NORTHBRIDGE 31
A. Coal displacement
1. National Capacity Factor Trends: Since 2008, the average capacity factors of the U.S. coal and NGCC fleets have converged, briefly equalized in 2012 and then diverged. Importantly, the U.S. NGCC fleet still operates at an average annual capacity factor of about 50%. These patterns can be seen on monthly basis in the figure on the left and on a 12 month rolling average basis in the figure on the right.
2. Regional Capacity Factor Trends
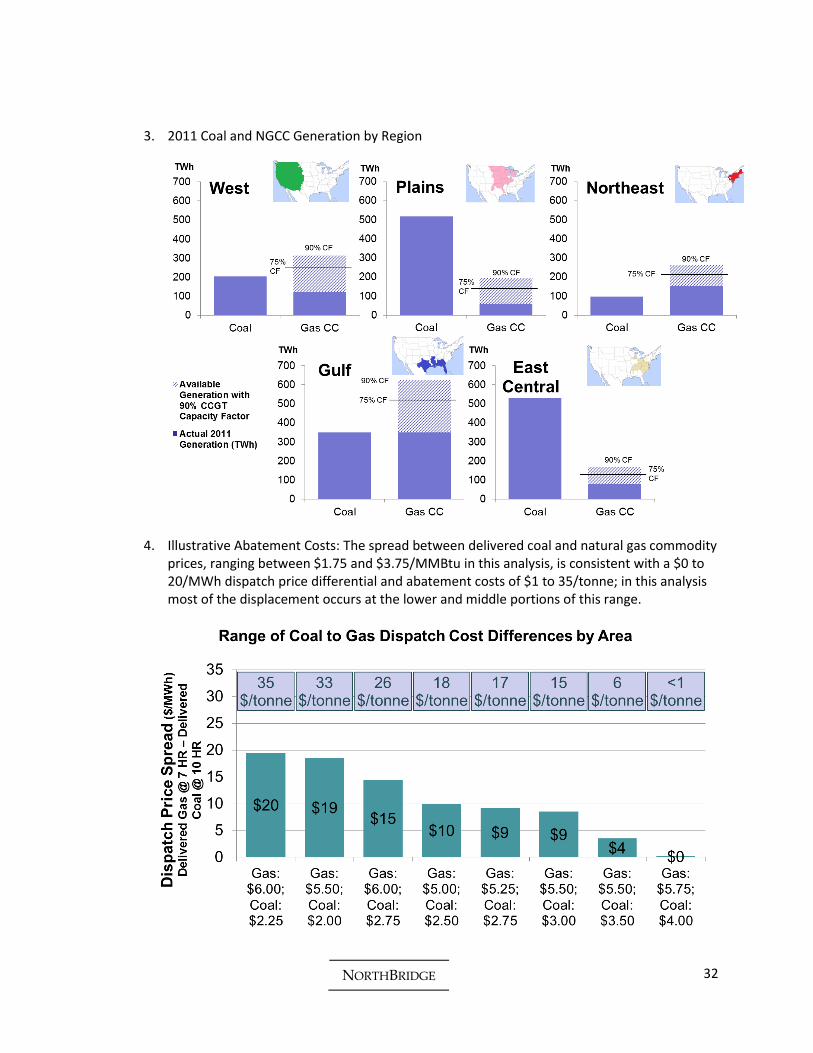
NORTHBRIDGE 32
3. 2011 Coal and NGCC Generation by Region
4. Illustrative Abatement Costs: The spread between delivered coal and natural gas commodity prices, ranging between $1.75 and $3.75/MMBtu in this analysis, is consistent with a $0 to 20/MWh dispatch price differential and abatement costs of $1 to 35/tonne; in this analysis most of the displacement occurs at the lower and middle portions of this range.
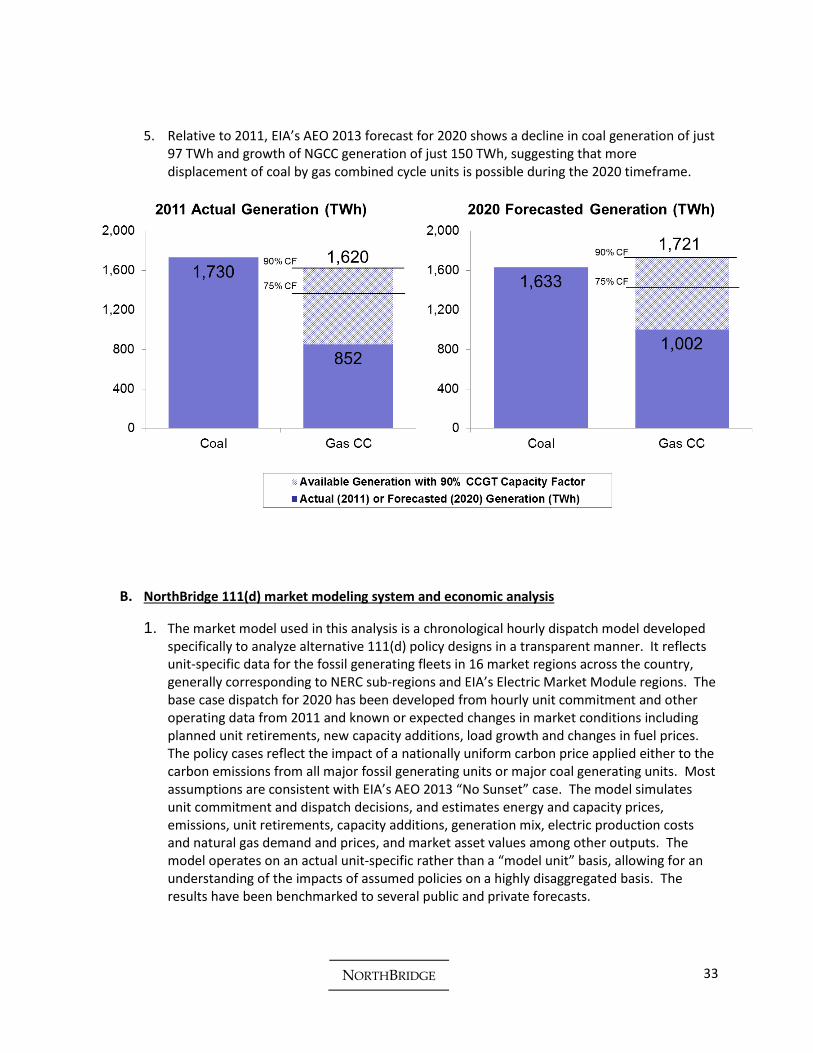
NORTHBRIDGE 33
5. Relative to 2011, EIA’s AEO 2013 forecast for 2020 shows a decline in coal generation of just 97 TWh and growth of NGCC generation of just 150 TWh, suggesting that more displacement of coal by gas combined cycle units is possible during the 2020 timeframe.
B. NorthBridge 111(d) market modeling system and economic analysis
1. The market model used in this analysis is a chronological hourly dispatch model developed specifically to analyze alternative 111(d) policy designs in a transparent manner. It reflects unit-specific data for the fossil generating fleets in 16 market regions across the country, generally corresponding to NERC sub-regions and EIA’s Electric Market Module regions. The base case dispatch for 2020 has been developed from hourly unit commitment and other operating data from 2011 and known or expected changes in market conditions including planned unit retirements, new capacity additions, load growth and changes in fuel prices. The policy cases reflect the impact of a nationally uniform carbon price applied either to the carbon emissions from all major fossil generating units or major coal generating units. Most assumptions are consistent with EIA’s AEO 2013 “No Sunset” case. The model simulates unit commitment and dispatch decisions, and estimates energy and capacity prices, emissions, unit retirements, capacity additions, generation mix, electric production costs and natural gas demand and prices, and market asset values among other outputs. The model operates on an actual unit-specific rather than a “model unit” basis, allowing for an understanding of the impacts of assumed policies on a highly disaggregated basis. The results have been benchmarked to several public and private forecasts.
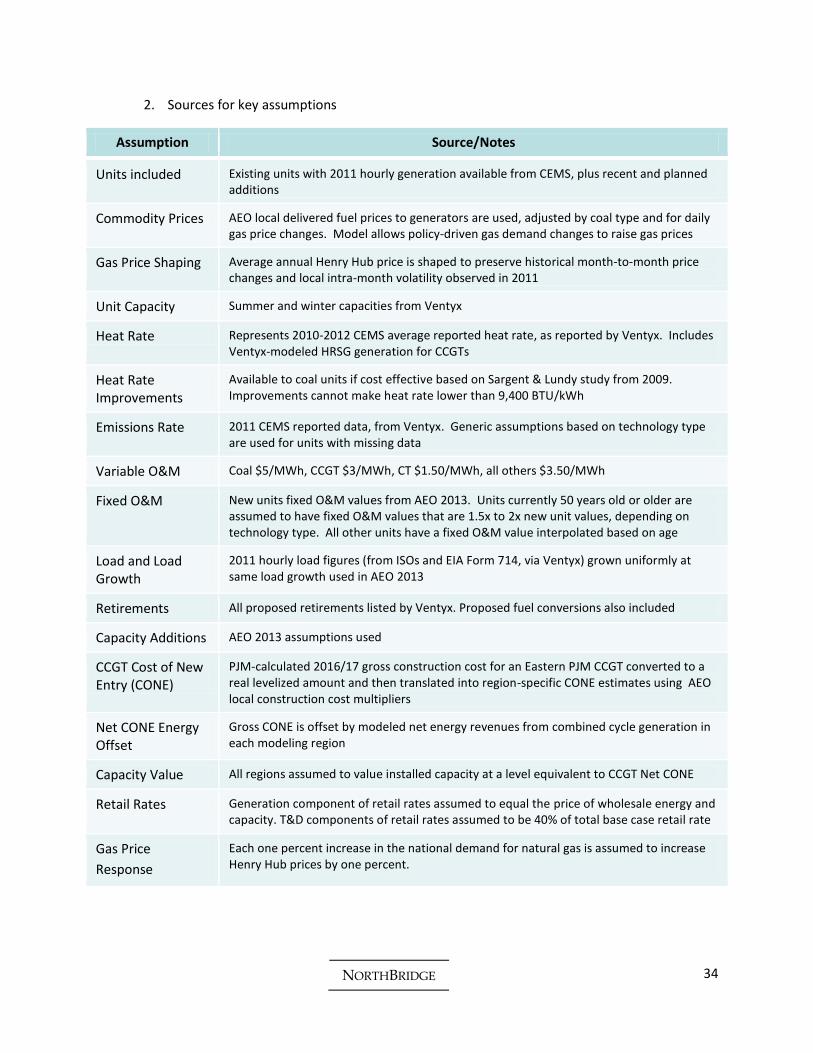
NORTHBRIDGE 34
2. Sources for key assumptions
Assumption Source/Notes
Units included Existing units with 2011 hourly generation available from CEMS, plus recent and planned additions
Commodity Prices AEO local delivered fuel prices to generators are used, adjusted by coal type and for daily gas price changes. Model allows policy-driven gas demand changes to raise gas prices
Gas Price Shaping Average annual Henry Hub price is shaped to preserve historical month-to-month price changes and local intra-month volatility observed in 2011
Unit Capacity Summer and winter capacities from Ventyx
Heat Rate Represents 2010-2012 CEMS average reported heat rate, as reported by Ventyx. Includes Ventyx-modeled HRSG generation for CCGTs
Heat Rate Improvements
Available to coal units if cost effective based on Sargent & Lundy study from 2009. Improvements cannot make heat rate lower than 9,400 BTU/kWh
Emissions Rate 2011 CEMS reported data, from Ventyx. Generic assumptions based on technology type are used for units with missing data
Variable O&M Coal $5/MWh, CCGT $3/MWh, CT $1.50/MWh, all others $3.50/MWh
Fixed O&M New units fixed O&M values from AEO 2013. Units currently 50 years old or older are assumed to have fixed O&M values that are 1.5x to 2x new unit values, depending on technology type. All other units have a fixed O&M value interpolated based on age
Load and Load Growth
2011 hourly load figures (from ISOs and EIA Form 714, via Ventyx) grown uniformly at same load growth used in AEO 2013
Retirements All proposed retirements listed by Ventyx. Proposed fuel conversions also included
Capacity Additions AEO 2013 assumptions used
CCGT Cost of New Entry (CONE)
PJM-calculated 2016/17 gross construction cost for an Eastern PJM CCGT converted to a real levelized amount and then translated into region-specific CONE estimates using AEO local construction cost multipliers
Net CONE Energy Offset
Gross CONE is offset by modeled net energy revenues from combined cycle generation in each modeling region
Capacity Value All regions assumed to value installed capacity at a level equivalent to CCGT Net CONE
Retail Rates Generation component of retail rates assumed to equal the price of wholesale energy and capacity. T&D components of retail rates assumed to be 40% of total base case retail rate
Gas Price
Response
Each one percent increase in the national demand for natural gas is assumed to increase Henry Hub prices by one percent.
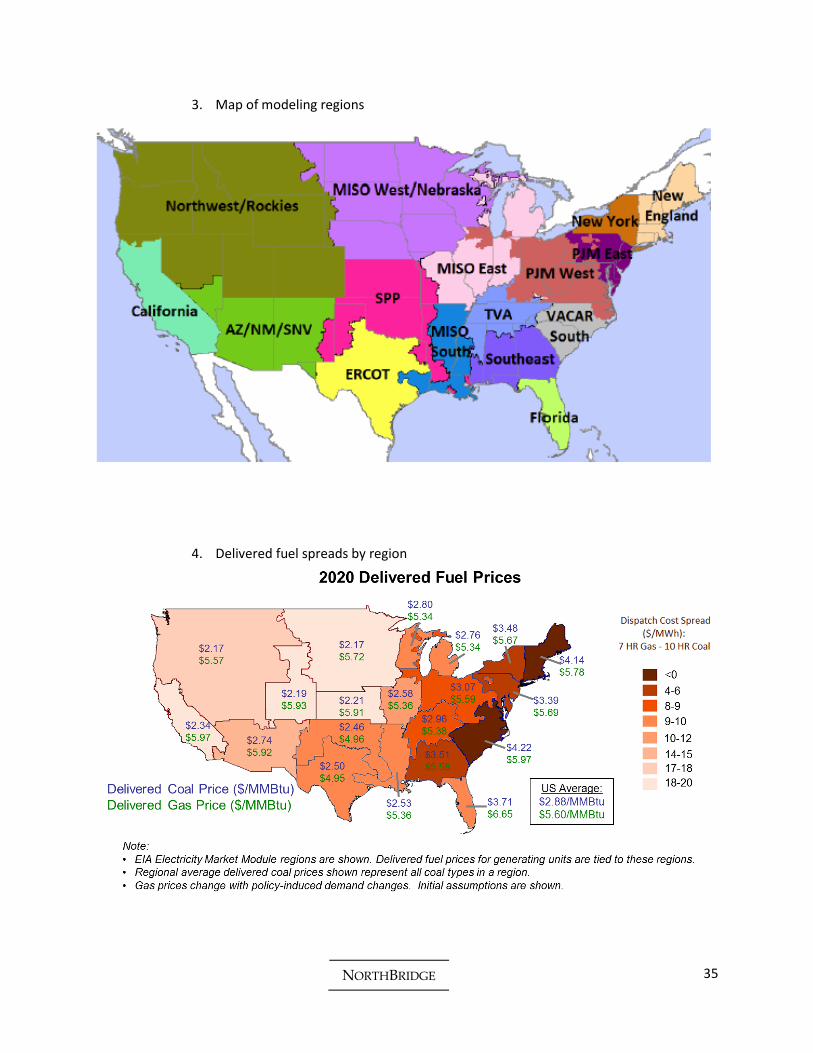
NORTHBRIDGE 35
3. Map of modeling regions
4. Delivered fuel spreads by region

NORTHBRIDGE 36
5. Comparison of total base case emissions to EIA AEO 2013
C. Summary table
1. Three mass-based cases (note: unless otherwise noted, all results are reported as changes relative to the base case forecast in 2020.)
Source of Emissions with Carbon Price Coal Fossil Fossil
CO2 Emission Credit Price (2013 $/Metric Tonne) 20 34 20
Reduction in Coal TWh (%) -27% -25% -12%
Coal Retirements (GW) 42 37 9
Reduction in Fossil CO2 Emissions compared to 2020 (%) -14.9% -14.7% -8.7%
Reduction in Fossil CO2 Emissions compared to 2005 (%) -26.5% -26.4% -21.2%
Increase in Gas Consumption (TCF) 3.0 2.6 1.1
Increase in Henry Hub Gas Price ($/MMBtu) 11.4% 9.8% 4.6%
Increase in U.S. Wholesale Electric Price (%) 6.9% 27.9% 16.3%
Increase in U.S. Retail Electric Price – with credit offset (%) 2.3% 4.1% 1.7%
Total Program Costs ($ 2013 Billion) 9.4 8.6 3.0
Average Cost ($ 2013/Tonne) 32 30 17
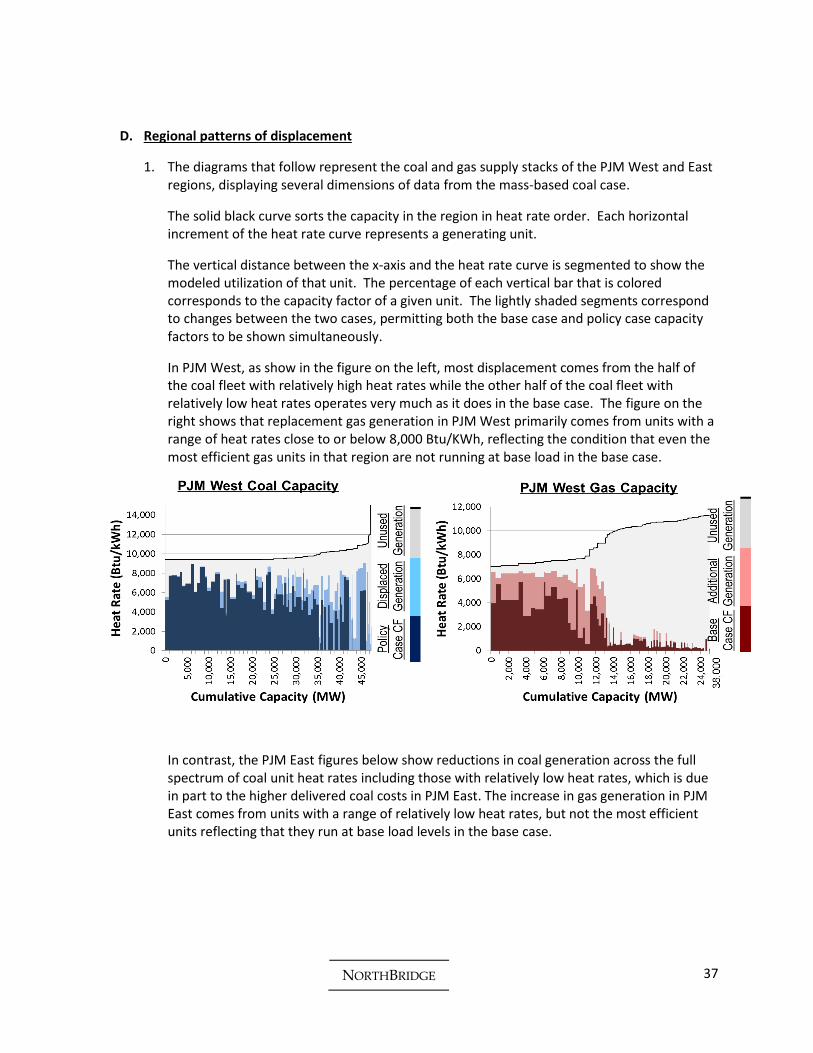
NORTHBRIDGE 37
D. Regional patterns of displacement
1. The diagrams that follow represent the coal and gas supply stacks of the PJM West and East regions, displaying several dimensions of data from the mass-based coal case.
The solid black curve sorts the capacity in the region in heat rate order. Each horizontal increment of the heat rate curve represents a generating unit.
The vertical distance between the x-axis and the heat rate curve is segmented to show the modeled utilization of that unit. The percentage of each vertical bar that is colored corresponds to the capacity factor of a given unit. The lightly shaded segments correspond to changes between the two cases, permitting both the base case and policy case capacity factors to be shown simultaneously.
In PJM West, as show in the figure on the left, most displacement comes from the half of the coal fleet with relatively high heat rates while the other half of the coal fleet with relatively low heat rates operates very much as it does in the base case. The figure on the right shows that replacement gas generation in PJM West primarily comes from units with a range of heat rates close to or below 8,000 Btu/KWh, reflecting the condition that even the most efficient gas units in that region are not running at base load in the base case.
In contrast, the PJM East figures below show reductions in coal generation across the full spectrum of coal unit heat rates including those with relatively low heat rates, which is due in part to the higher delivered coal costs in PJM East. The increase in gas generation in PJM East comes from units with a range of relatively low heat rates, but not the most efficient units reflecting that they run at base load levels in the base case.

NORTHBRIDGE 38
2. Across regions, displacement is driven by the amount of installed coal and NGCC capacity, base case capacity factors and the spread in delivered fuel costs. That causes proportionately greater displacement in the southeastern and gulf regions and proportionately less displacement in the west.
The charts below illustrate the reductions in coal generation by region relative to the base case forecast. They show the net impacts of reducing coal generation to achieve the state budgets and also the tendency of the east and gulf regions to further reduce coal generation (beyond what is required to meet local state budgets) in order to support the sale of profitable emission credits to other regions that are expected to comply in part through the purchase of credits. On an average national basis, coal generation declines by 26%.
Mass-Based Coal Mass-Based Fossil
The following charts illustrate the corresponding increases in gas generation by region, reflecting the consequences of complying with local state budgets and further emission reductions to support the sale of credits to other states. On a national average basis, U.S. gas generation increases by 35%.
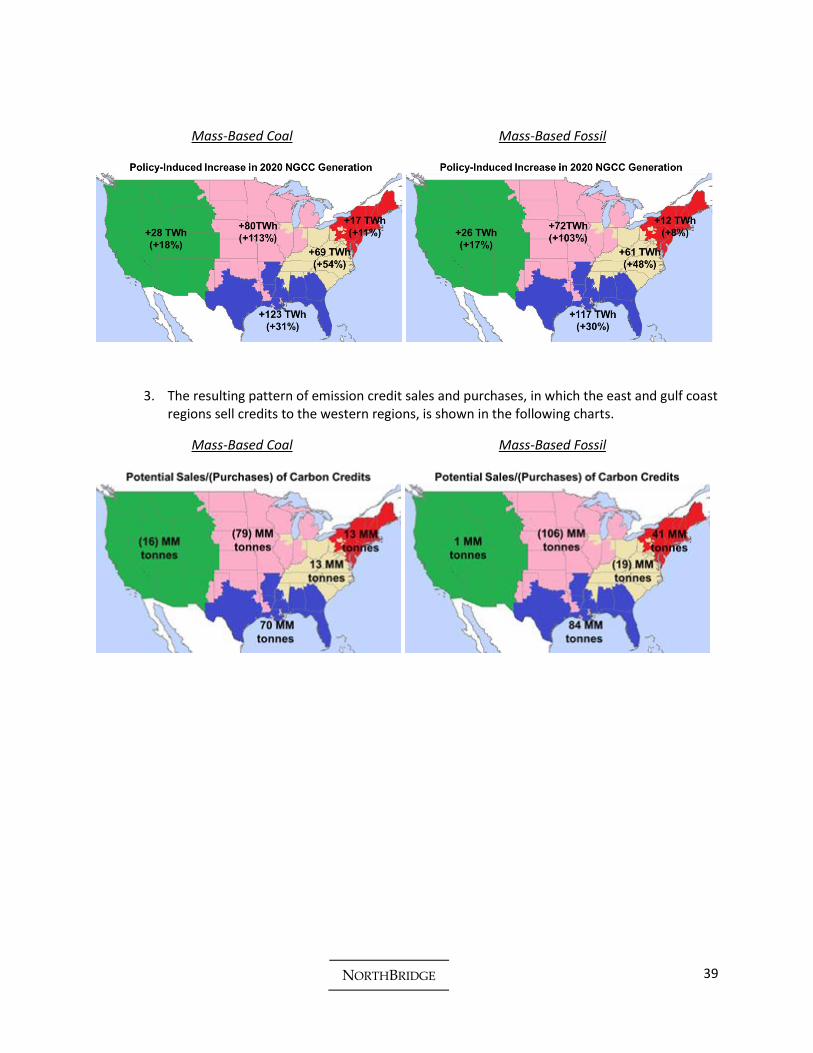
NORTHBRIDGE 39
Mass-Based Coal Mass-Based Fossil
3. The resulting pattern of emission credit sales and purchases, in which the east and gulf coast regions sell credits to the western regions, is shown in the following charts.
Mass-Based Coal Mass-Based Fossil