ALTERING LIFE HISTORY TRAITS: A SIZE-SELECTIVE PREDATOR DECREASES
30
ALTERING LIFE HISTORY TRAITS: A SIZE-SELECTIVE PREDATOR DECREASES THE SIZE OF ITS PREY THESIS Presented in Partial Fulfillment of the Requirements for graduation with research distinction in Evolution and Ecology in the College of Biological Sciences of The Ohio State University By Chelsea O. Bennice * * * * * The Ohio State University 2008 Thesis Committee: Approved by Professor David A. Culver, Advisor Dr. Joseph D. Conroy, Co-Advisor _______________________________ Advisor Professor Peter S. Curtis Department of Evolution, Ecology, and Organismal Biology Professor John W. Wenzel
Transcript of ALTERING LIFE HISTORY TRAITS: A SIZE-SELECTIVE PREDATOR DECREASES
ALTERING LIFE HISTORY TRAITS: A SIZE-SELECTIVE PREDATOR DECREASES THE SIZE OF ITS PREY
THESIS
Presented in Partial Fulfillment of the Requirements for
graduation with research distinction in Evolution and Ecology
in the College of Biological Sciences of The Ohio State University
By
Chelsea O. Bennice
* * * * *
The Ohio State University 2008
Thesis Committee: Approved by Professor David A. Culver, Advisor Dr. Joseph D. Conroy, Co-Advisor _______________________________ Advisor Professor Peter S. Curtis Department of Evolution, Ecology, and Organismal Biology Professor John W. Wenzel

2
Abstract
Predators negatively influence prey primarily through decreasing their total
abundance. However, size-selective predators may also decrease fecundity through
selective removal of large, more fecund individuals. To determine how size-selective
predators affect life history traits of their prey, we examined size at first reproduction,
maximum size, and neonate size of the zooplankter Bosmina as a function of saugeye
(walleye, Sander vitreus, females x sauger, S. canadense, males) density in fish hatchery
ponds. We hypothesized that prey size would decrease with increased predation
according to the size-efficiency hypothesis. From linear regression analyses we found
marginally significantly smaller size at first reproduction (SFR) and smaller maximum
size (MAX) with increased predation. We found marginally smaller neonate size (NEO)
with increased predation. Due to the marginal explanatory power of predation, additional
factors (bottom-up, maternal, and time effects) were examined. Ponds were fertilized
with either 20 or 30 µg L-1 of phosphorus allowing us to look at the bottom-up effect.
From a one-way ANOVA, we found significantly larger SFR and a marginally
significantly larger MAX in the 30 µg L-1 of phosphorus ponds. We used a multivariate
analysis to examine simultaneously the effects of predation and fertilization. The results
showed that sizes decreased at the same rate with increased predation independent of the
fertilization rate. Additionally, from linear regression, we found that maternal effects
played a significant role in determining Bosmina NEO and MAX. Finally, we found that
SFR significantly decreased while MAX significantly increased temporally during the
production season. These results indicated that this system has multiple factors that
contribute to altering Bosmina life history traits and that the removal of large individuals
3
may lead to decreased trophic efficiency by decreasing the energy reaching higher trophic
levels, which will lead to less fish production in a hatchery.
Introduction
The relationship between predator and prey may be exceptionally influential to
the surrounding biotic community. This “consumer controlled” (top-down effect) could
alter the prey population in various ways. A large number of predators could reduce
biodiversity of the prey community or result in a decrease in the density of the prey
population. Predators have been known to strongly impact the zooplankton community
by acting as a selective force influencing the evolution of defense strategies in the prey
(Hellsten et al. 1999). Predator-prey relationships have been studied numerous times
using different organisms, with different results (Brooks and Dodson 1965, Lampert
1993, Declerck and Weber 2003). The importance of fish predation has been evaluated
relative to the structure of zooplankton communities (e.g., Mills et al. 1987), but few
studies have investigated the importance of zooplankton size in fish production. The
information collected on zooplankton size and how predators alter it could provide
helpful cues to a successful predator-prey abundance ratio and consequently, successful
fish production in a hatchery setting (Mills et al. 1987).
Fish are known to be size-selective predators (Brooks and Dodson 1965, Mayer
and Wahl 1997, Declerck and Weber 2003, Gliwicz et al. 2004). Zooplanktivorous fish
prey selectively on conspicuous zooplankton, selecting large, pigmented, and/or actively
moving individuals (Brooks and Dodson 1965, Ślusarczyk 1997). Fish predation varies
seasonally, having a great effect on zooplankton size through the spring to the summer

4
period (Kerfoot 1974, Stenson 1976, Culver 1980, Lampert 1993). This variation in the
predator community can cause zooplankton life history traits to be phenotypically altered
in response to the presence or absence of a predator (Ślusarczyk 1997, Vos et al. 2002,
Pangle et al. 2007). This alteration, although costly, may be advantageous to the
zooplankton population when high predation exists (Declerck and Weber 2003). Larger
zooplankton individuals are suppressed during high predation and small-bodied
zooplankton are favored or benefit from the presence of fish (Brooks and Dodson 1965,
Ślusarczyk 1997, Vos et al. 2002). Although size-selective predation may cause the
majority of the zooplankton population to be small in size, it allows the zooplankton
community to persist despite predation.
Predator-prey studies usually focus on the change in abundance of prey due to
predation (Mills et al. 1987, Spencer et al. 1999 Gliwicz et al. 2004, Nagata et al. 2005).
However, Ślusarczyk (1997) found that Bosmina’s size distribution was strongly affected
by a size-selective predator. The purpose of our experiment was to investigate how the
presence of a size-selective predator affects the size distribution of the zooplankton
community. We proposed three predation-related hypotheses based on the Size-
Efficiency Hypothesis (Brooks and Dodson 1965):
Hypothesis 1. As fish predation increases, zooplankter size at first reproduction
(SFR) will decrease. Zooplankters are more visible to their predators if they are
carrying eggs and, therefore, maturing at a smaller SFR may increase the chance
of survival and reproduction.
5
Hypothesis 2. As fish predation increases, zooplankter maximum size (MAX) will
decrease. When fish are present, smaller zooplankers will prevail because fish are
size-selective predators. Therefore, zooplankton population MAX will decline
when predators are abundant. Also, an earlier maturing population will lead to a
smaller zooplankter MAX.
Hypothesis 3. As fish predation increases, zooplankter neonate size (NEO) will
decrease. Reduced NEO may simply be a physiological consequence of a reduced
SFR as NEO commonly depends on adult female size (Kerfoot 1974, Arts and
Sprules 1988, Lampert 1993, Vos et al. 2002). Doksæter and Vijverberg (2001)
observed both a reduced SFR and a smaller NEO in D. hyaline x galeata with fish
predation.
Further, we proposed and tested a fourth hypothesis examining the relative importance of
top-down versus bottom-up (e.g., fertilization) effects:
Hypothesis 4. The top-down, consumer-controlled effect will be more important
or have a stronger influence than the bottom-up, nutrient limitation-controlled
effect in this particular ecosystem due to the high density of fish stocked in each
pond.
We tested these hypotheses by determining three life history traits in Bosmina sp.: (1)
size at first reproduction, (2) maximum size, and (3) neonate size and examining how

6
they varied against an index of pond-specific predation and as a function of pond-specific
fertilization regimen. Further, we examined the role of other factors, such as maternal
and/or temporal effects.
Methods
We originally sought to use the water flea Daphnia sp. as the zooplankton prey
due to the long record of studies on the life history of this genus, but due to the high
preference for this genus by the zooplanktivorous fish (young-of-year saugeye, Sander
vitreus females x S. canadense males) stocked into the aquaculture ponds, density of this
species were low and we therefore studied life history variation as a function of predation
and fertilization rates in the smaller cladoceran Bosmina sp.
Field sampling
Zooplankton samples were collected from 12 ponds at the Hebron State Fish
Hatchery located in southern Licking County, Ohio, in 2003. The ponds were all stocked
at a density = 50 saugeye m-3, but through time the ponds experienced different rates of
fish mortality, resulting in different levels of predation at the end of the experiment. A
predation index (# of saugeye returned m-3 in each pond) was calculated to estimate
predator density. All hatchery ponds were fertilized to maintain water concentrations of
either 20 or 30 µg L-1 of phosphorus (P). Consequently, both top-down (predation) and
bottom-up (productivity) effects are possible in a particular pond.
Bosmina was usually sampled twice a week, from 12 April through 19 May 2003,
using a 0.5-m diameter zooplankton net (64-µm mesh). Zooplankton samples were
7
preserved with sugared formalin and stored in The Ohio State University’s Limnology
Laboratory.
Laboratory sample processing
The first 100 Bosmina individuals encountered in a sample were measured (with a
Wild Heerbrug dissecting microscope at 50x magnification) from the top of the head to
the base of the spine (Culver 1980, Tollrian 1995) with the lengths and number of eggs
(if any) recorded. All raw ocular micrometer length measurements were converted to mm
using an established conversion factor (1 ocular unit = 0.0183 mm). If fewer than 10
ovigerous females were encountered in the first 100 individuals, additional subsamples
were examined. All calculations of SFR, MAX, and NEO followed Culver (1980) and are
given in the following equations:
SFR = the 10th percentile length of ovigerous females,
MAX = the 95th percentile length of all females, and
NEO = the 5th percentile length of non-ovigerous females.
Testing the relationship between life history traits and predation and fertilization rates
A simple linear regression of life history size versus predation index was used to
test for predation effects. We hypothesized a negative correlation between SFR, MAX,
and NEO versus predation index if size-selective predation affected prey size.
8
An analysis of covariance (ANCOVA) was used to test simultaneously for the
effects of fertilization and predation. We hypothesized that sizes would decrease more
quickly in 20 µg P L-1 ponds than 30 µg P L-1 ponds.
An analysis of variance (ANOVA) was used to determine whether there was a
significant bottom-up, nutrient effect. Data for SFR and MAX were separated into 20 and
30 µg P L-1 groups to determine whether 30 µg P L-1 ponds had individuals with a larger
SFR or MAX.
A simple linear regression was used to test whether maternal size (SFR)
influenced NEO or MAX. We hypothesized that individuals from a population with a
smaller SFR would have small NEO and MAX, if mothers’ size was an important
predictor of NEO and MAX.
Using an ANOVA, we also examined the importance of time through the
aquaculture season. We first separated the SFR and MAX data into early and late dates.
The first three dates in the data set were used for the “early” times and the last three dates
in the data set were used for the “late” times. We hypothesized that through time, SFR
and MAX would decrease due to juvenile fish’s selection for larger zooplankton.
Results
Top-down, predation effect
SFR marginally significantly decreased (P = 0.058, R2 = 3.3%; Fig. 1A) as
predation index increased whereas MAX significantly decreased (P = 0.006, R2 = 6.8%;
Fig. 1B) and NEO marginally significantly decreased (P = 0.088, R2 = 2.7%; Fig. 1C).
However, very little variation was explained by any of the regression relationships (Fig.
9
1). Due to the marginally significant results for NEO, it was not examined for bottom-up
or time effect.
Both SFR and MAX were larger in the 30 µg P L-1 ponds even when the
predation index was the same (Figs. 1A-B). SFR reached a greater size in the 30 µg P L-1
ponds even when the predation index was high. The SFR decreased further in the 20 µg P
L-1 ponds. MAX in both the 20 and 30 µg P L-1 reached a high size of around 0.40 mm
with exception of one 30 µg P L-1 pond, which had a maximum size of 0.43 mm. MAX
for Bosmina appeared to decrease further in 20 µg P L-1 ponds than in 30 µg P L-1 ponds.
Bottom-up, nutrient effect
When we examined the bottom-up effect for SFR and MAX, we found that SFR
increased with increasing P loading (one-way ANOVA, F1,108 = 4.66, P = 0.033; Fig.
2A). This was statistically significant, but is unknown if it is biologically significant
because the size difference between the 20 µg P L-1 and the 30 µg P L-1 ponds was < 0.04
mm. Similarly, MAX increased with increased P loading (one-way ANOVA, F1,108 =
3.84, P = 0.053; Fig. 2B). Although these results are statistically significant it is unknown
if they are biologically significant because the size difference was only 0.04 mm.
Simultaneously comparing the importance of predation and fertilization on SFR
(Table 1) and MAX (Table 2), we found that these sizes decreased at similar rates
independent of fertilization rate.
Maternal effect
10
NEO significantly increased with SFR (P < 0.001, R2 = 48.4%; Fig. 2A)
suggesting that females with larger SFR produce larger neonates. However, the pond with
the largest SFR, 0.37 mm, did not exhibit the largest NEO possibly due to high predation
(47.1 m-3). Similarly, MAX increased with increased SFR (P < 0.001, R2 = 22.6%; Fig.
2B). These results supported our hypothesis with the largest SFR, 0.37 mm, having the
largest MAX, 0.43 mm and were also from a 30 µg P L-1 pond.
Time effect
To determine whether life history traits varied through time, data were divided
into early and late time periods. Sampling was done during the months of April and May,
thus early time became April’s three earliest dates and late time became May’s three
latest dates. We found that SFR significantly decreased through time (one-way ANOVA,
F1,108 = 44.86, P < 0.001; Fig. 3A) and MAX increased through time (one-way ANOVA,
F1,108 = 4.72, P = 0.034; Fig 3B)
Discussion
Bosmina SFR decreased marginally with increased predation, but this decrease
was not as dramatic as our first hypothesis predicted. In the presence of a visual predator,
planktonic animals grow more slowly (Pangle et al. 2007). Bosmina allocates more
energy to reproduction than to somatic growth with increased predators, which enables
them to mature earlier at a smaller size, and produce more eggs (Ślusarczyk 1997).
Therefore, a female with a smaller SFR may have a greater chance of survival and
reproduction than a female maturing at a larger SFR.
11
Size-selective predation may lead to a change in clonal composition of the
population. Previous studies have shown that differences in life history traits between
clones is the main reason for specific clone survival when predators are present (Culver
1980, Arts and Sprules 1988, Ebert 1991, Tessier and Consolatti 1991, Glazier 1992,
Tessier et al. 1992, Lampert 1993). Clones with a low SFR are favored with predation.
SFR may also respond phenotypically in the presence of a predator. This idea of a
phenotypic response under variable predation pressure was discussed in Weider and
Pijanowska (1993). These two mechanisms of altering life history do not have to be
looked at as separate hypotheses, but may be combined. Our findings support those of
Lampert (1993), who stated that selective predation favors clones with a more effective
phenotypic response; therefore, SFR may be enhanced by a genotype-by-environment
interaction.
Supporting our second hypothesis was the decrease in MAX with an increase in
predation. Lampert (1993) examined the correlation between SFR and NEO, so we
decided to extend analysis of the maternal effect and we found a tight correlation between
SFR and MAX. Maturing at a smaller size will lead to a smaller maximum size, which is
a beneficial tradeoff in the presence of a size-selective predator.
The results of NEO versus predation were contrary to our expectations, because
NEO did not decrease steadily with predation, but decreased until a minimum size
threshold was met (0.18 mm). Neonates can decrease in size, but only to a certain point
until they reach the smallest possible size for a neonate. As predation increased, NEO
decreased from a maximum size of 0.22 mm to a common minimum of 0.18 mm.
Therefore, neonates are still affected by predation. Due to predation, SFR and MAX were

12
affected and as a result, affected the NEO. The more intense the predation is, the smaller
the SFR, leading to a smaller NEO.
Another factor that positively contributed to size was increased P loading. The
extra phosphorus allowed for more productivity and, consequently, larger zooplankter
size, similar to the findings of Tew et al. (2006). Higher phosphorus loading facilitated
the persistence of the Bosmina population. Since there still was a decrease in
zooplankton size with an increase in phosphorus, it is possible for predation (top-down
effect) to be the dominating effect in these pond systems. The negative relationship
between planktivores and zooplankton found in this study supports the “cascading trophic
interaction” hypothesis (Brooks and Dodson 1965, Carpenter et al. 1985, Galbraith 1967,
Hall et al. 1970, Hutchinson 1971, Stenson 1972, O’Brien and de Noyelles 1974,
Anderson et al. 1978, McQueen et al. 1986). However, the results also showed that
phosphorus is important for stimulating continued zooplankton production, even in these
highly nutrient-rich systems.
Time also played an important role in this experiment. Predation increased
through the duration of the sampling period. Our results for decreased SFR were
congruent with our hypothesis. Although predation index was greatest at the early dates,
larval fish may have been too small to consume larger Bosmina due to gape-limitation
(Nagata et al. 2005). Arumugam and Geddes (1987) found that fish growth, mouth gape
and daily food consumption all show exponential increases with time; therefore the
impact of larval fish on zooplankton would be insignificant at the early stages, but would
become marked at later stages (Arumugam and Geddes 1996). As a result, predation did

13
not have a huge impact on Bosmina’s early SFR. This may have triggered Bosmina to
mature and reproduce early, resulting in a smaller SFR later in the season.
The results we found for MAX were not what we hypothesized. Instead of
decreasing through time, MAX increased through time. This result cannot be easily
explained. One hypothesis about this result may be due to environmental factors.
Although this was statistically significant, the graph shows an increase in maximum size
from early to late dates. Fig. 4A shows a decrease in SFR, but with more favorable
environmental factors (e.g., temperature) later in the season, Bosmina with a smaller SFR
may have been able to have the same or larger MAX as individuals earlier in the season.
According to Persson (1987) the attack of perch decreases with decreasing
cladoceran size, but also decreases with increasing fish size for perch > 100mm (Persson
et al 1996). Since fish are still present in the system, Bosmina is still reproducing at a
smaller size, while fish may have switched to feeding on benthic macroinvertebrates or
even cannibalism. This switch in food preference for the fish may only be present in last
date sampled, but may have a large enough effect to increase MAX in the “late” category.
This experiment is a valid model of a trophic cascade that can be applied to lake
and hatchery systems. If there is a large top-down effect in a lake, there will be a decline
in zooplankton abundance and size. With larger cladocerans absent in the system,
zooplankton cannot reduce the phytoplankton biomass (McQueen et al. 1986). This will
then lead to an abundance of phytoplankton and possibly algal blooms. The resulting
blooms would likely discourage tourists from visiting certain aquatic vacation sites. In an
area that relies on tourist dollars for financial stability, the resulting lack of visitors could
have an economic impact on the area.

14
However, this study was directly associated with fish production in an aquaculture
setting and was broadly designed to examine predator-prey interactions in order to
facilitate maximum fish production. Many assume there is a predation threshold in these
ponds, so ponds can be stocked with a certain amount of fish before they completely
deplete their food source (zooplankton). If the predation index exceeds the threshold, fish
will switch to benthic invertebrates (e.g., chronomids and ostracods), which are less
nutritious than zooplankters, causing the fish to be malnourished and possibly smaller, or
they will switch to cannibalism, decreasing final yields. In this study, we found that the
number of fish stocked in each pond did not affect greatly the SFR and MAX, and the
zooplankton community, consequently, was able to survive and reproduce. The addition
of phosphorus helped counteract these levels of predation, but the level of fertilization
must be carefully monitored. If exceeded, an abundance of phytoplankton may cause low
dissolved oxygen, a condition that is directly lethal to fish (Tew et al. 2006). In an
aquaculture setting, optimizing the number of fish that can be stocked before a drastic
zooplankton community decline would be extremely beneficial.
To improve or build on the results from this experiment, various future projects
could be performed. Increasing the sample size, to > 100 individuals would result in more
accurate measurements of SFR, MAX, and NEO. Stocking ponds with a greater
abundance of fish could better identify the threshold for a predation effect. This may also
contribute to a more abrupt decline in zooplankter size and further support the
experimental hypotheses. Zooplankter egg number and size was not examined, but future
work on these parameters could be used to determine how a size-selective predator
affects these life history traits. We would expect, in the presence of a predator, Bosmina

15
with a smaller SFR would have many small eggs, maximizing the chance of one of their
offspring surviving. A quantitative analysis of egg-bearing individuals could be done
comparing high- and low-predation ponds. Ślusarczyk (1997) compared egg-bearing
females between fish and fish-free enclosures and found that large, egg-carrying
individuals were absent in the presence of fish, which would also be expected for high
predation ponds. Further, synthesizing fish diets with an analysis such as that performed
here would help quantify changes in consumptive demand through time. We expect that
fish would eat larger zooplankters and zooplankters with eggs, but we were unable to
examine this directly in this experiment.
We demonstrated that a size-selective predator altered the SFR and MAX of its
prey. However, this is not a simple system where all changes in prey life history traits
result from a single factor. To better understand this system, multiple other factors
(bottom-up, maternal, and time effects) were investigated and either showed a positive of
negative effect on the zooplankton population. This should be taken into consideration
when conducting future experiments.
Acknowledgements
We thank the Hebron Fish Hatchery personnel for providing access to
experimental ponds; C. Doyle, D. Glover, A. Jacob, and A. McCollum for their assistance
in the field; C. Doyle, K. Hershey, M. Kulasa, and A. Martyn for their laboratory
assistance; R. Briland and E. Brumbaugh for their valuable suggestions and comments; J.
Conroy for his assistance as my co-advisor. The original collection of the zooplankton
samples was supported by funds from the Ohio Division of Wildlife, Department of
Natural Resources as part of the Federal Aid in Sportfish Restoration Program (Project F-
16
69-P, Fish Management in Ohio) administered jointly by the U.S. Fish and Wildlife
Service and the Ohio Department of Natural Resources. Subsequent measurements of
Bosmina for this project were funded by The Ohio State University’s Honors
Undergraduate Research Scholarship.
Literature Cited
Arts, M.T. and W.G. Sprules. 1988. Evidence for indirect effects of fish predation on
maternal lipid movement in Holopedium gibberum. Canadian Journal of Fisheries and
Aquatic Sciences 45:2147-2155.
Arumugam, P.T. and M.C. Geddes. 1987. Feeding and growth of golden perch larvae and
fry (Macquaria ambigua Richardson). Transactions of the Royal Society of South
Australia, Inc. 111:59-65.
Arumugam, P.T. and M.C. Geddes. 1996. Effects of golden perch (Macquaria ambigua
(Richardson)) larvae, fry and fingerlings on zooplankton communites in larval-rearing
ponds” an enclosure study. Marine and Freshwater Research 47:847-844.
Brooks, J. L., S. I. Dodson. 1965. Predation, body size, and composition of plankton.
Science 150:28-35.
Carpenter, S.R., J.K. Kitchell, and J.R. Hodgson. 1985. Cascading trophic interactions
and lake productivity. BioScience 35:634-639.
Culver, D.A., 1980. Seasonal variation in the sizes at birth and at first reproduction in
Cladocera. Pages 358-3666 in W.C. Kerfoot, editor. Evolution and ecology of
zooplankton communities. Unversity press of New England, Hanover, New
Hampshire, USA.
17
Declerck, S. and A. Weber. 2003. Genetic differention in life history between Daphnia
galeata populations: an adaptation to local predation regimes? Journal of Plankton
Research 25:93-102.
Doksæter, A. and J. Vijverberg. 2001. The effects of food and temperature regimes on
life-history responses to fish kairmones in Daphnia hyalina x galeata. Hydrobiologia
442:207-214.
Ebert, D. 1991. The effect of size at birth, maturation threshold and genetic differences
on the life-history of Daphnia magna. Oecologia 86:243-250.
Galbraith, M.G. 1967. Size selective predation of Daphnia by rainbow trout and yellow
perch. TransPhysical Scienceactions of the American Fisheries Society 96:1-10.
Glazier, D.S. 1992. Effects of food, genotype, and maternal size and age on offspring
investment in Daphnia magna. Ecology 73:910-926.
Gliwicz, Z.M., A. Jawiński, and M. Pawlowicz. 2004. Cladoceran densities, day-to-day
variability in food selection by smelt, and the birth-rate-compensation hypothesis.
Hydrobiologia 526:171-186.
Hall, D.J., W.E. Cooper, and E.E. Werner. 1970. An experimental approach to the
production dynamics and structure of freshwater animal communities. Limnology and
Oceanography 15:839-929.
Hellsten, M., R. Lagergren, and J. Stenson. 1999. Can extreme morphology in Bosmina
reduce predation risk from Leptodora? An experimental test. Oecologia 118:23-28.
Hutchinson, B.P. 1971. The effect of fish predation on the zooplankton of ten Adirondack
lakes with particular reference to the alewife Alosa pseudoharengus. Transactions of
the American Fisheries Society 100:325-335.
18
Kerfoot, W.C. 1974. Egg-size cycle of a cladoceran. Ecology 55:1259-1270.
Lampert, W. 1993. Phenotypic plasticity of the size at first reproduction in Daphnia: the
importance of maternal size. Ecology 74:1455-1466.
Mayer, C.M. and D.H. Wahl. 1997. The relationship between prey selectivity and growth
and survival in a larval fish. Canadian Journal of Fisheries and Aquatic Science
54:1504-1512.
McQueen, D.J., J.R. Post., and E.L. Mills. 1986. Trophic relationships in freshwater
pelagic ecosystems. Canadian Journal of Fisheries and Aquatic Science 43:1571-
1681.
Mills, E.L., D.M. Green, and A. Schiavone, Jr. 1987. Use of zooplankton size to assess
the community structure of fish populations in freshwater lakes. North American
Journal of Fisheries Management 7:369-378.
Nagata, T., JY. Ha, and T. Hanazato. 2005. The predation impact of larval
Pseudorasbora parva (Cyprinidae) on zooplankton: A mesocosm experiment. Journal
of Freshwater Ecology 20:757-763.
O’Brien, W.J., and De Noyelles, Jr. 1974. Relationship between nutrient concentration,
phytoplankton density, and zooplankton density in nutrient enriched experimental
ponds. Hydrobiologia 44:105-125.
Pangle, K.L., S.D. Peacor, and O.E. Johannsson. 2007. Large nonlethal effects of an
invasive invertebrate predator on zooplankton population growth rate. Ecology
88:402-412.
Persson, L. 1987. The effects of resource availability and distribution on resource
utilization in perch (Perca fluviatilis). Oikos 48:148-160.

19
Persson, L., J. Andersson, E. Wahlstrom, and P. Eklov. 1996. Size-selective interactions
in lake systems: predator gape limitations and prey growth rate and mortality.
Ecology 77:900-911.
Ślusarczyk, M. 1997. Impact of fish predation on a small-bodied cladoceran: limitation or
stimulation? Hydrobiologia 342/343:215-221.
Spencer, C.N., D.S. Potter, R.T. Bukantis, and J.A. Stanford. 1999. Impact of predation
by Mysis relicta on zooplankton in Flathead Lake, Montana, USA. Journal of
Plankton Research 21:51-64.
Stenson, J.A.E. 1976. Significance of predator influence on composition of Bosmina sp.
Populations. Limnology and Oceanography 21:814-822.
Tessier, A.J. and N. Consolatti. 1991. Resource quantity and offspring quality in
Daphnia. Ecology 72:468-478.
Tessier, A.J., A. Young, and M. Leibold. 1992. Population dynamics and body-size
selection in Daphnia. Limnology and Oceanography 37:1-13.
Tew, K.S., J.D. Conroy, and D.A. Culver. 2006. Effects of lowered inorganic phosphorus
fertilization rates on pond production of percid fingerlings. Aquaculture 255:436-446.
Tollrian, R. 1995. Predator-induced morphological defenses: costs, life history shifts, and
maternal effects in Daphnia pulex. Ecology 76:1691-1705.
Vos, M., J.G. B. J.G. Flik, J. Vijverberg, J. Ringelberg, and W.M. Mooij. 2002. From
inducible defences to population dynamics: modeling refuge use and life history
changes in Daphnia. Oikos 99:386-396.
Weider, L.J. and J. Pijanowska. 1993. Plasticity of Daphnia life histories in response to
chemical cues from predators. Oikos 67:385-392.
20
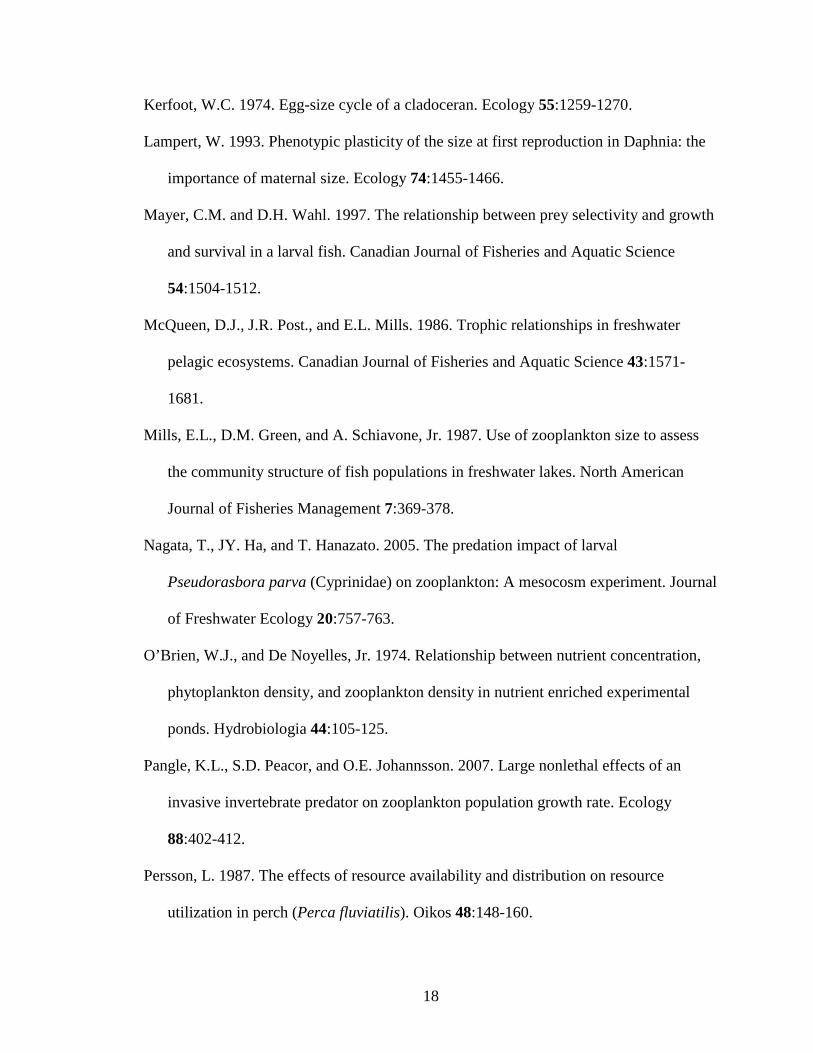
Table 1. The simultaneous effects of predation and fertilization on SFR determined with
ANCOVA. Our results show that SFR decreased at the same rate with increased
predation independent of fertilization rate (e.g., interaction term is non-significant).
Analysis of Covariance
df F P
3 3.4 0.02
Parameter Estimates
Estimate Std. Error P
Predation -6 x 10⁻⁴ 2.7 x 10⁻⁴ 0.03
Fertilization - 6.3 x 10⁻³ 2.5 x 10⁻³ 0.01
Fertilization*Predation 4.7 x 10⁻⁸ 2.7 x 10⁻⁴ 1

21
Table 2. The simultaneous effect of predation and fertilization on MAX determined by
ANCOVA. Our results show that MAX decreased at the same rate independent of
fertilization rate (e.g., non-significant interaction term).
Analysis of Covariance
df F P
3 4.9 0.00
Parameter Estimates
Estimate Std. Error P
Predation -9.7 x 10⁻⁴ 1.1 x 10⁻² 0.00
Fertilization -7.1 x 10⁻³ 2.8 x 10⁻³ 0.01
Fertilization*Predation -1.3 x 10⁻⁴ 3.1 x 10⁻⁴ 0.68
22
Predation Index (fish m-3)
0 10 20 30 40 50
SF
R (
mm
)
0.0
0.1
0.2
0.3
0.420 µg P L-1
30 µg P L-1
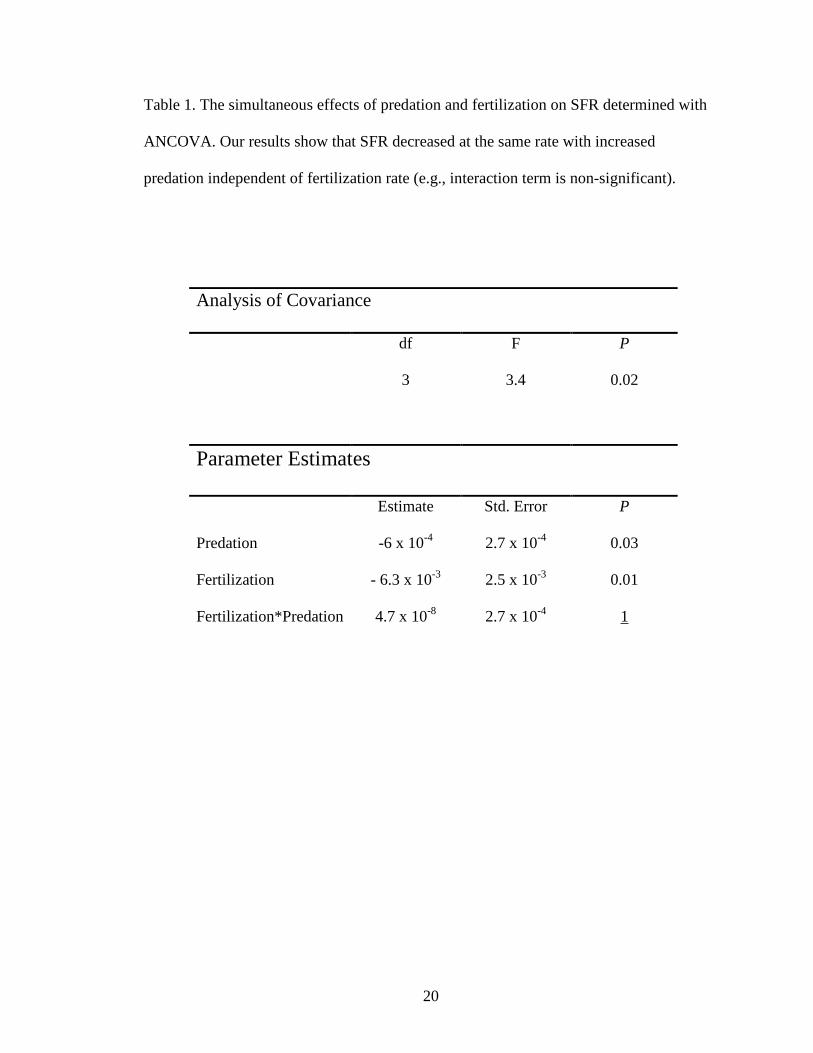
Figure 1A. The relationship between predation and SFR in ponds with different
fertilization regimens. The non-filled circle data points represent ponds fertilized to 20 µg
P L-1 and filled circles represent ponds fertilized with 30 µg P L-1. The relationship
between Bosmina SFR and fish predation is marginally significant (F1,108 = 3.67, P =
0.058, R2 = 3.3%; SFR (mm) = 0.303-0.000504 Pred. Index (m-3)). As predation
increases, SFR decreases. This graph further compares the SFR versus predation between
different levels of fertilization. With predators present, the ponds with 30 µg P L-1 have
larger SFR than ponds with 20 µg P L-1.
23
Predation Index (fish m-3)
0 10 20 30 40 50
Max
(m
m)
0.0
0.1
0.2
0.3
0.4
20 µg P L-1
30 µg P L-1
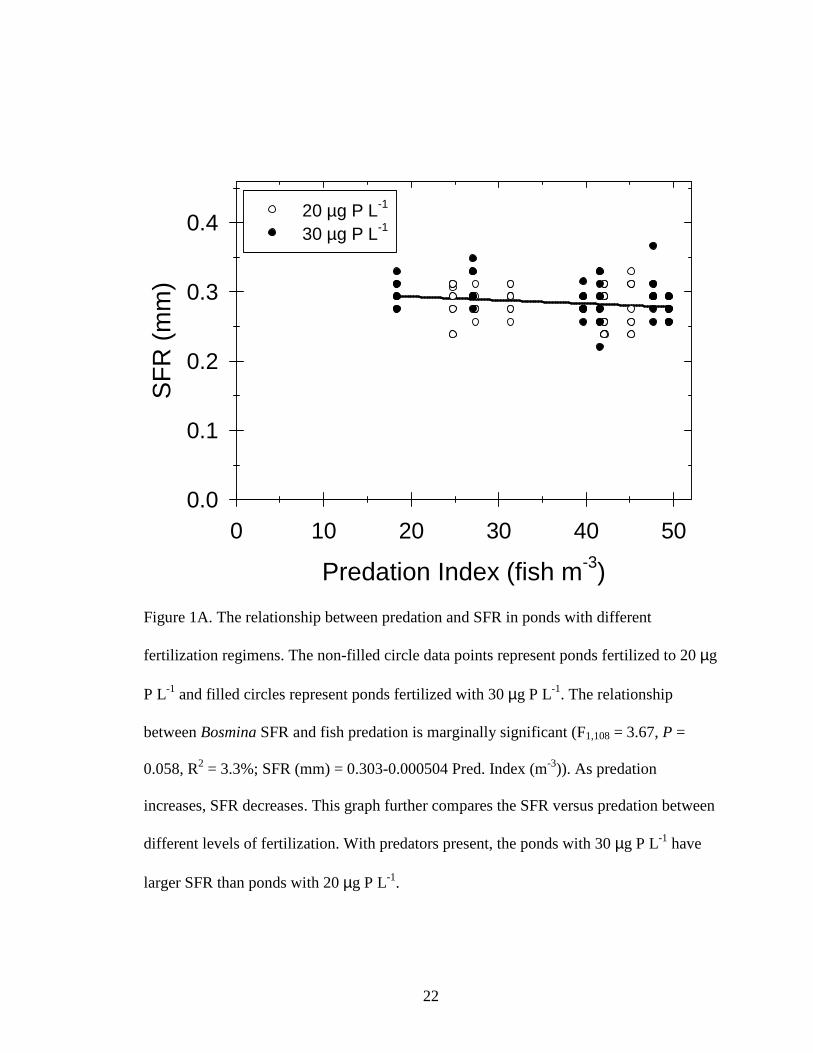
Figure 1B. The relationship between predation and MAX in ponds with different
fertilization regimens. The non-filled circle data points represent ponds fertilized with 20
µg P L-1 and filled circles represent ponds fertilized with 30 µg P L-1. Our results showed
a significant decrease in MAX with an increase in predation (F1,108 = 7.85, P = 0.006, R2
= 6.8%; MAX (mm) = 0.372-000822 Pred. Index (m-3)).
24
Predation Index (fish m-3)
0 10 20 30 40 50
Neo
nate
(m
m)
0.0
0.1
0.2
0.3
0.4
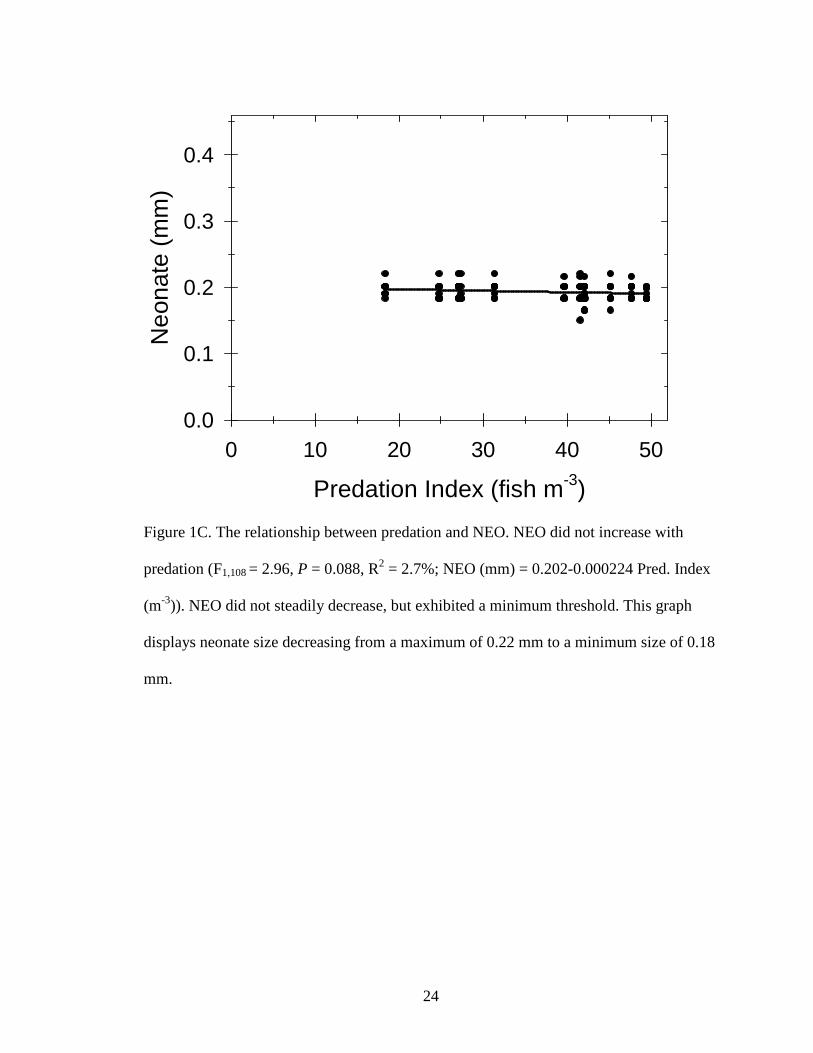
Figure 1C. The relationship between predation and NEO. NEO did not increase with
predation (F1,108 = 2.96, P = 0.088, R2 = 2.7%; NEO (mm) = 0.202-0.000224 Pred. Index
(m-3)). NEO did not steadily decrease, but exhibited a minimum threshold. This graph
displays neonate size decreasing from a maximum of 0.22 mm to a minimum size of 0.18
mm.

25
Fertilization (µg PO4-P L-1)
20 30
SF
R (
mm
)
0.0
0.1
0.2
0.3
0.4
Figure 2A. The relationship between fertilization (bottom-up, nutrient effect) and SFR.
Ponds were fertilized with either 20 µg P L-1 (represented in the graph by the 20) or 30
µg P L-1 (represented in the graph by the 30). SFR was significantly larger in the 30 µg P
L-1 (one-way ANOVA, P = 0.033).
26
Fertilization (µg PO4-P L-1)
20 30
Max
(m
m)
0.0
0.1
0.2
0.3
0.4
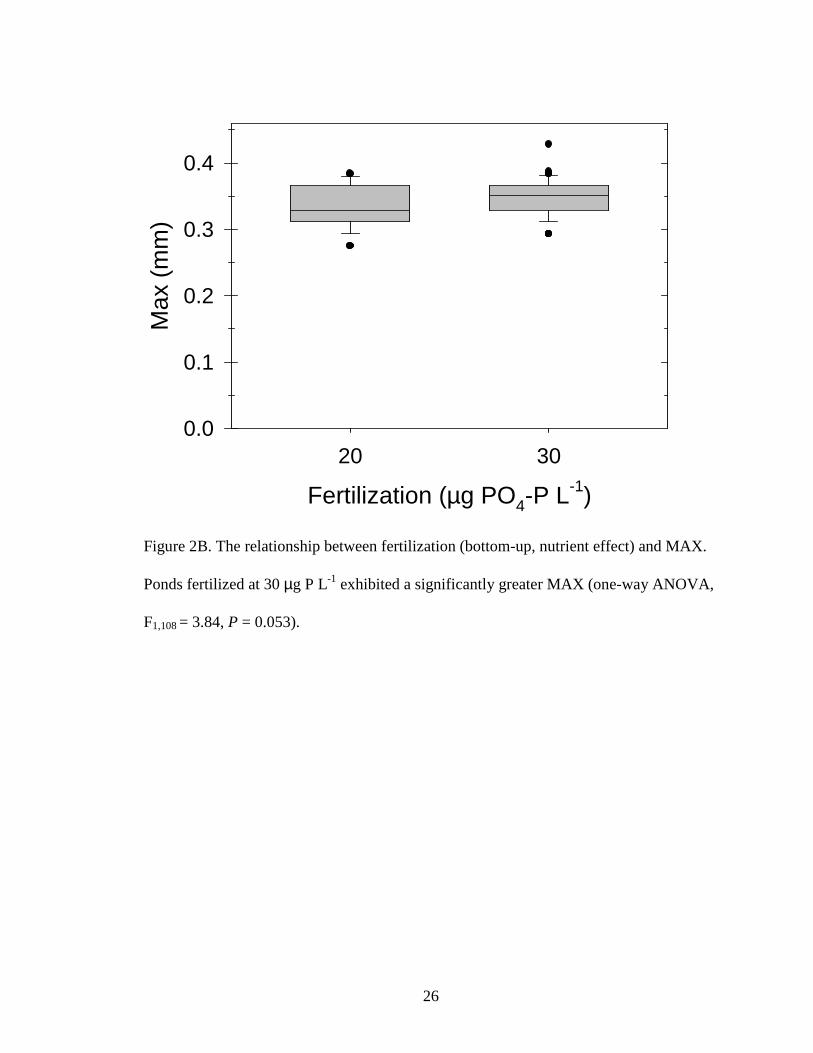
Figure 2B. The relationship between fertilization (bottom-up, nutrient effect) and MAX.
Ponds fertilized at 30 µg P L-1 exhibited a significantly greater MAX (one-way ANOVA,
F1,108 = 3.84, P = 0.053).
27
SFR (mm)
0.0 0.1 0.2 0.3 0.4
Neo
nate
(m
m)
0.0
0.1
0.2
0.3
0.4
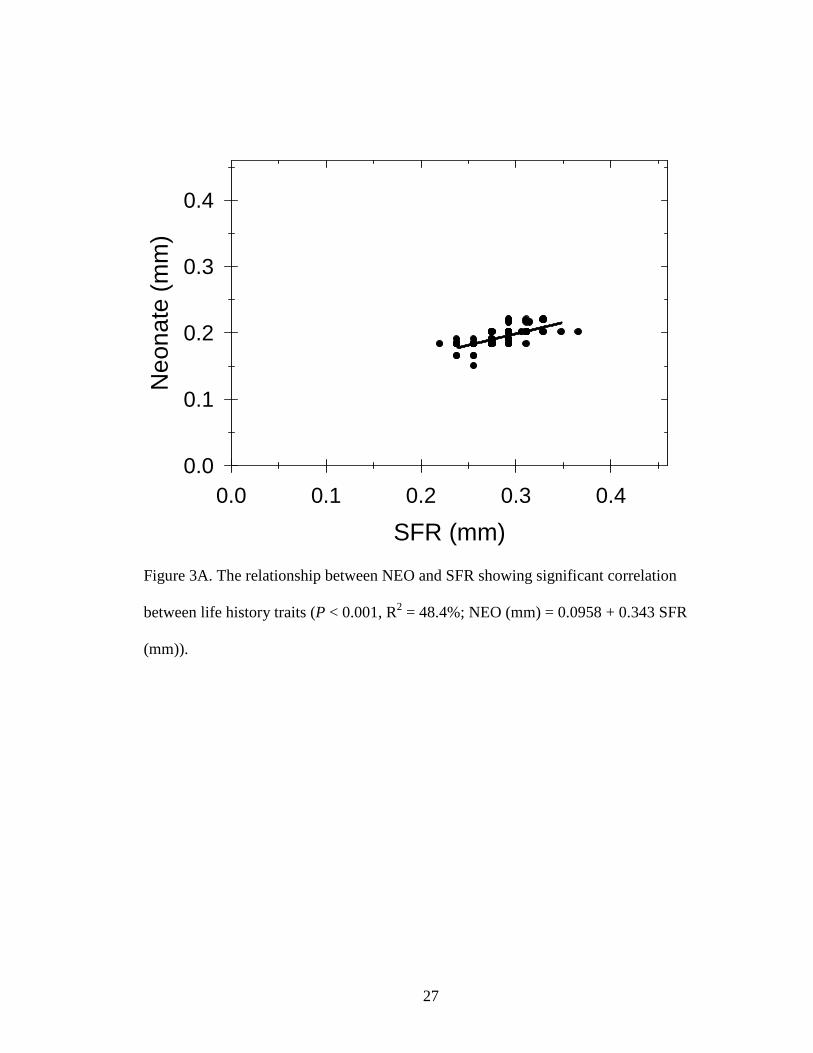
Figure 3A. The relationship between NEO and SFR showing significant correlation
between life history traits (P < 0.001, R2 = 48.4%; NEO (mm) = 0.0958 + 0.343 SFR
(mm)).
28
SFR (mm)
0.0 0.1 0.2 0.3 0.4
Max
(m
m)
0.0
0.1
0.2
0.3
0.4
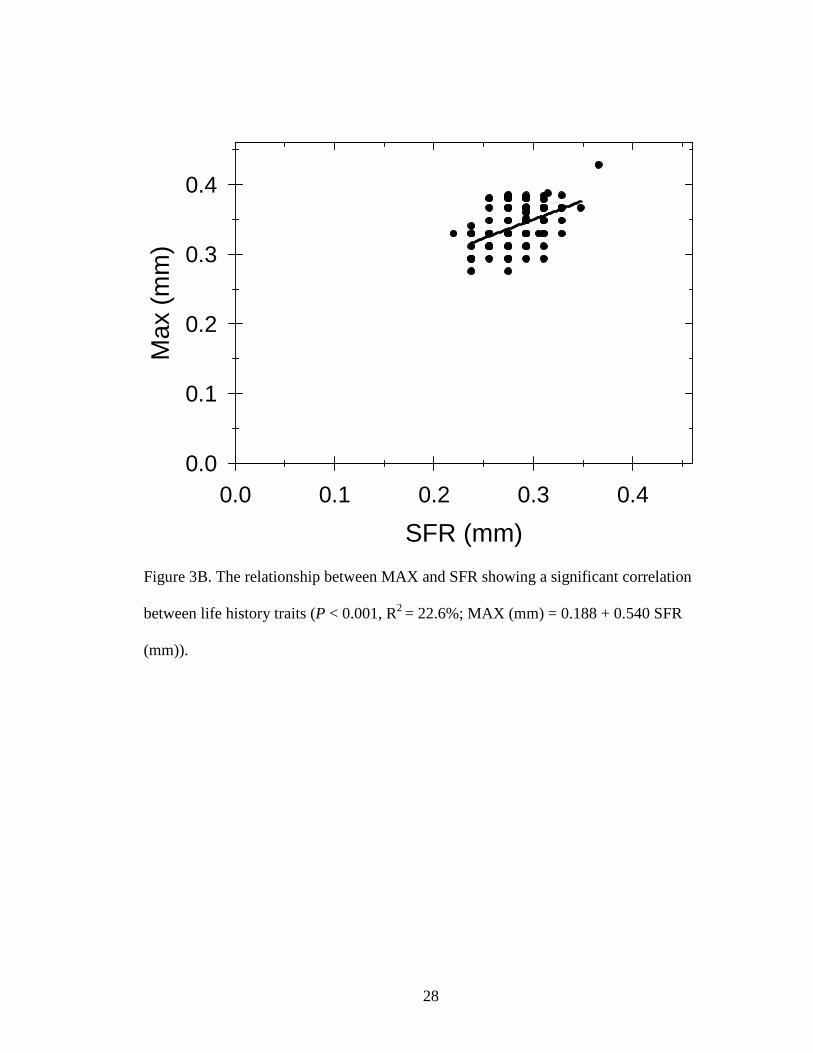
Figure 3B. The relationship between MAX and SFR showing a significant correlation
between life history traits (P < 0.001, R2 = 22.6%; MAX (mm) = 0.188 + 0.540 SFR
(mm)).
29
SFR (mm)
Late Early
0.4
0.3
0.2
0.1
0.0
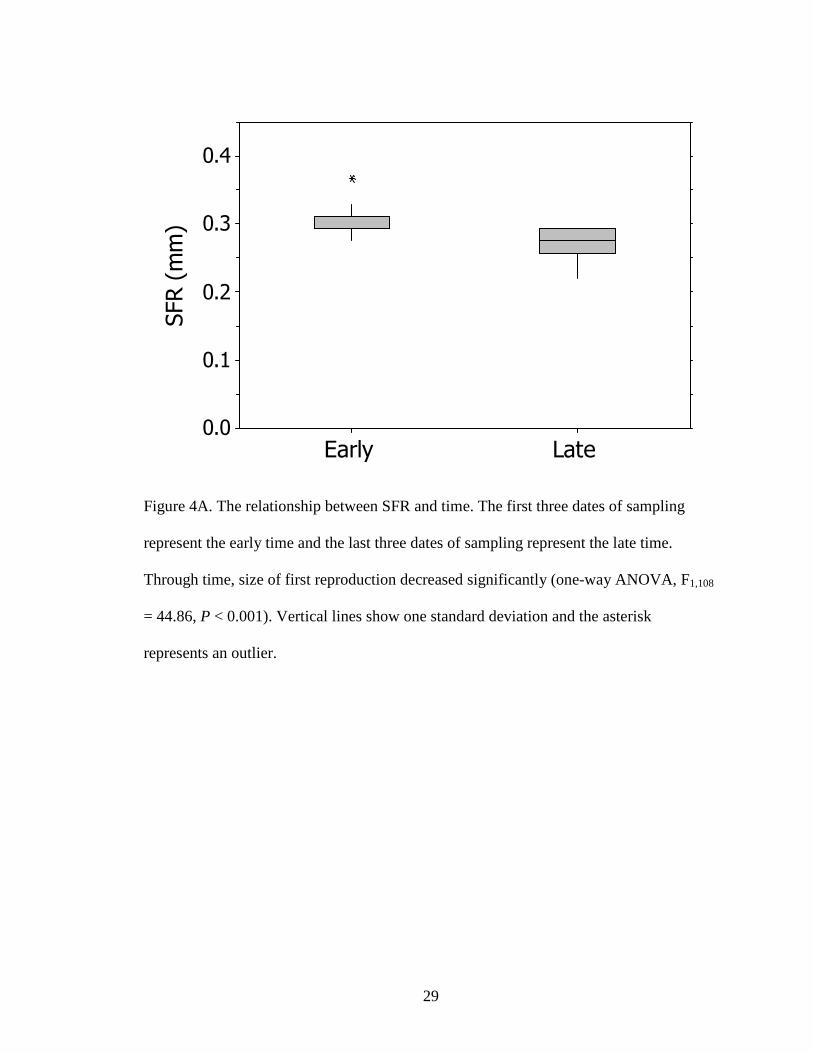
Figure 4A. The relationship between SFR and time. The first three dates of sampling
represent the early time and the last three dates of sampling represent the late time.
Through time, size of first reproduction decreased significantly (one-way ANOVA, F1,108
= 44.86, P < 0.001). Vertical lines show one standard deviation and the asterisk
represents an outlier.
30
Max (mm)
LateEarly
0.4
0.3
0.2
0.1
0.0
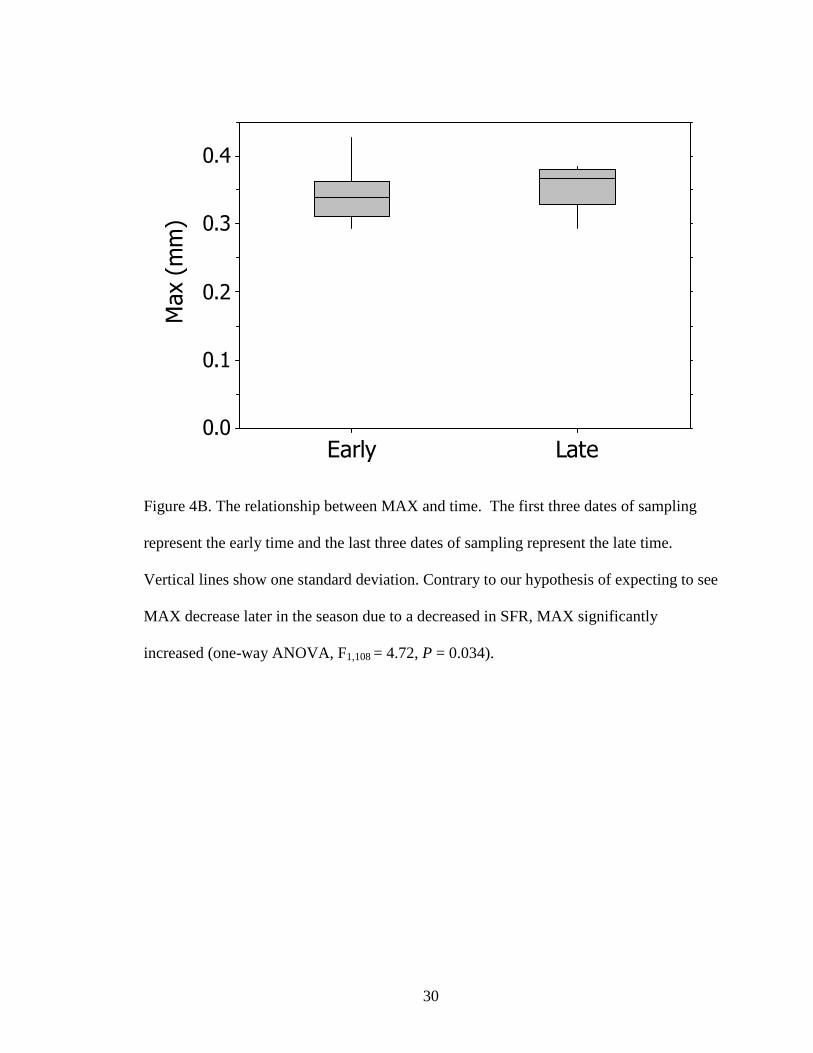
Figure 4B. The relationship between MAX and time. The first three dates of sampling
represent the early time and the last three dates of sampling represent the late time.
Vertical lines show one standard deviation. Contrary to our hypothesis of expecting to see
MAX decrease later in the season due to a decreased in SFR, MAX significantly
increased (one-way ANOVA, F1,108 = 4.72, P = 0.034).
![€¦ · Web view2009. 4. 23. · [Cr2O72-] Reverse Rate. A. increases increases. B. increases decreases. C. decreases decreases. D. decreases increases. 31. A small amount of H2SO4](https://static.fdocuments.in/doc/165x107/608f2c47b9e3f5096f2e5efc/web-view-2009-4-23-cr2o72-reverse-rate-a-increases-increases-b-increases.jpg)