Altered reward-related effective connectivity in obsessive ...
12
J Psychiatry Neurosci 1 © 2019 Joule Inc. or its licensors Research Paper Altered reward-related effective connectivity in obsessive-compulsive disorder: an fMRI study Ana Alves-Pinto, PhD; Oana Georgiana Rus, PhD; Tim Jonas Reess, PhD; Afra Wohlschläger, PhD; Gerd Wagner, PhD; Götz Berberich, MD; Kathrin Koch, PhD Introduction Obsessive–compulsive disorder (OCD) is characterized by anxiety-provoking, obsessive thoughts (i.e., obsessions), which patients react to with repetitive behaviours (i.e., com- pulsions) to counteract anxiety. Patients perceive their obses- sive thoughts as involuntary and uncontrollable. Reactive compulsive behaviours, in turn, are often perceived as addic- tive and remunerating because of their rewarding impact after reducing obsession-related anxiety. Hence, reward plays a central role in the psychopathology of OCD. Another link between OCD and reward is that current neuroanatomical models of both reward processing and OCD are based on functional loops involving, among others, frontostriatal networks including lateral and medial orbito- frontal cortices. 1,2 Key regions of the frontostriatal system in the context of reward processing contain the striatum and the orbitofrontal cortex (OFC). The ventral part of the striatum (i.e., nucleus accumbens) is known to be strongly involved in the processing of rewarding stimuli. 3 Studies showing that the ventral striatum/nucleus accumbens is a successful target for deep brain stimulation in the treatment of OCD highlight the psychopathological relevance of this structure in the con- text of OCD. 4–6 Thus, areas and networks involved in the processing of reinforcement and reward correspond to frontostriatal net- works that are known to be of major psychopathological rele- vance for OCD. 7 In line with this congruence, a growing number of studies report altered frontostriatal involvement in OCD in association with the processing of reinforcement and reward. Jung and colleagues 8 reported increased activa- tion in a frontostriatal network during reward outcome as well as an increased ventral–striatal activation when compar- ing no-loss versus loss outcomes between patients with OCD and healthy controls. Figee and colleagues 9 could not find any activation differences between the groups during reward outcome, but they observed reduced activity in the ventral striatum during reward anticipation in patients with OCD compared with healthy controls. Activation alterations in association with reward anticipa- tion in OCD were also reported in a study by Kaufman and colleagues. 10 In that study, patients exhibited increased Correspondence to: A. Alves-Pinto, Department of Orthopedics and Sports Orthopedics, School of Medicine, Klinikum rechts der Isar, Tech- nical University of Munich, Ismaningerstr 22, 81675 Munich, Bavaria, Germany; [email protected] Submitted Oct. 18, 2018; Revised Jan. 16, 2019; Accepted Jan. 28, 2019 DOI: 10.1503/jpn.180195 Background: Obsessive–compulsive disorder (OCD) is characterized by anxiety-provoking, obsessive thoughts. Patients usually react to these thoughts with repetitive behaviours that reduce anxiety and are perceived as rewarding. Hence, reward plays a major role in the psychopathology of OCD. Previous studies showed altered activation in frontostriatal networks, among others, in association with the processing of reward in patients with OCD. Potential alterations in connectivity within these networks have, however, barely been explored. Methods: We investigated a sample of patients with OCD and healthy controls using functional MRI and a reward learning task presented in an event-related design. Dynamic causal modelling (DCM) was used to estimate effective connectivity. Results: Our sample included 37 patients with OCD and 39 healthy controls. Analyses of task-related changes in connectivity showed a significantly altered effective connectivity between the ventromedial prefrontal cortex (vmPFC) and the orbitofrontal cortex (OFC), among others, both in terms of endogenous connectivity as well as modulatory effects under positive feedback. Clinical measures of compulsion correlated with the effect of feedback input on visual sensory areas. Limitations: The reported alterations should be interpreted within the context of the task and the a priori–defined network considered in the analysis. Conclusion: This disrupted connectivity in parts of the default mode network and the frontostriatal network may indicate increased rumination and self-related processing impairing the responsiveness toward external rewards. This, in turn, may underlie the general urge for reinforcement accompanying compulsive behaviours. Published online on Apr. 9, 2019; subject to revision
Transcript of Altered reward-related effective connectivity in obsessive ...
J Psychiatry Neurosci 1
© 2019 Joule Inc. or its licensors
Research Paper
Altered reward-related effective connectivity in obsessive-compulsive disorder: an fMRI study
Ana Alves-Pinto, PhD; Oana Georgiana Rus, PhD; Tim Jonas Reess, PhD; Afra Wohlschläger, PhD; Gerd Wagner, PhD; Götz Berberich, MD; Kathrin Koch, PhD
Introduction
Obsessive–compulsive disorder (OCD) is characterized by anxiety-provoking, obsessive thoughts (i.e., obsessions), which patients react to with repetitive behaviours (i.e., com-pulsions) to counteract anxiety. Patients perceive their obses-sive thoughts as involuntary and uncontrollable. Reactive compulsive behaviours, in turn, are often perceived as addic-tive and remunerating because of their rewarding impact after reducing obsession-related anxiety. Hence, reward plays a central role in the psychopathology of OCD.
Another link between OCD and reward is that current neuroanatomical models of both reward processing and OCD are based on functional loops involving, among others, frontostriatal networks including lateral and medial orbito-frontal cortices.1,2 Key regions of the frontostriatal system in the context of reward processing contain the striatum and the orbitofrontal cortex (OFC). The ventral part of the striatum (i.e., nucleus accumbens) is known to be strongly involved in the processing of rewarding stimuli.3 Studies showing that the ventral striatum/nucleus accumbens is a successful target
for deep brain stimulation in the treatment of OCD highlight the psychopathological relevance of this structure in the con-text of OCD.4–6
Thus, areas and networks involved in the processing of reinforcement and reward correspond to frontostriatal net-works that are known to be of major psychopathological rele-vance for OCD.7 In line with this congruence, a growing number of studies report altered frontostriatal involvement in OCD in association with the processing of reinforcement and reward. Jung and colleagues8 reported increased activa-tion in a frontostriatal network during reward outcome as well as an increased ventral–striatal activation when compar-ing no-loss versus loss outcomes between patients with OCD and healthy controls. Figee and colleagues9 could not find any activation differences between the groups during reward outcome, but they observed reduced activity in the ventral striatum during reward anticipation in patients with OCD compared with healthy controls.
Activation alterations in association with reward anticipa-tion in OCD were also reported in a study by Kaufman and colleagues.10 In that study, patients exhibited increased
Correspondence to: A. Alves-Pinto, Department of Orthopedics and Sports Orthopedics, School of Medicine, Klinikum rechts der Isar, Tech-nical University of Munich, Ismaningerstr 22, 81675 Munich, Bavaria, Germany; [email protected]
Submitted Oct. 18, 2018; Revised Jan. 16, 2019; Accepted Jan. 28, 2019
DOI: 10.1503/jpn.180195
Background: Obsessive–compulsive disorder (OCD) is characterized by anxiety-provoking, obsessive thoughts. Patients usually react to these thoughts with repetitive behaviours that reduce anxiety and are perceived as rewarding. Hence, reward plays a major role in the psychopathology of OCD. Previous studies showed altered activation in frontostriatal networks, among others, in association with the processing of reward in patients with OCD. Potential alterations in connectivity within these networks have, however, barely been explored. Methods: We investigated a sample of patients with OCD and healthy controls using functional MRI and a reward learning task presented in an event-related design. Dynamic causal modelling (DCM) was used to estimate effective connectivity. Results: Our sample included 37 patients with OCD and 39 healthy controls. Analyses of task-related changes in connectivity showed a significantly altered effective connectivity between the ventromedial prefrontal cortex (vmPFC) and the orbitofrontal cortex (OFC), among others, both in terms of endogenous connectivity as well as modulatory effects under positive feedback. Clinical measures of compulsion correlated with the effect of feedback input on visual sensory areas. Limitations: The reported alterations should be interpreted within the context of the task and the a priori–defined network considered in the analysis. Conclusion: This disrupted connectivity in parts of the default mode network and the frontostriatal network may indicate increased rumination and self-related processing impairing the responsiveness toward external rewards. This, in turn, may underlie the general urge for reinforcement accompanying compulsive behaviours.
Published online on Apr. 9, 2019; subject to revision
Alves-Pinto et al.
2 J Psychiatry Neurosci
activation in association with the anticipation of punishment and decreased activation in association with the anticipation of reward in mainly medial and superior frontal regions.
In addition, decreased responsiveness in the OFC and dorso-ventral striatum regions has been reported in patients with OCD during reward outcome in the context of reinforcement-based reversal learning.11 In a reward-based spatial learning task,12 patients with OCD failed to activate the striatum (i.e., ventral putamen) and amygdala during reward anticipation or the hippocampus, amygdala and striatum (i.e., putamen) during reward outcome.
In sum, there is a growing body of evidence for altered acti-vation predominantly in the dorsal and ventral striatum and orbitofrontal cortex in patients with OCD in association with the processing of reward (anticipation v. positive/negative outcome), even though findings must be regarded as rather heterogeneous. Nonetheless, the observation of structural alterations in areas beyond frontostriatal circuits (as high-lighted in a recent review by Piras and colleagues13) sug-gests that changes in network dynamics in patients with OCD are likely widespread. In particular, circuits associated with executive functions, such as prefrontal cortices, as well as frontosubcortical circuits may also be involved, contrib-uting further to increase the palette and complexity of OCD symptomatology.
Despite the fact that — from a functional perspective — there are reasonable grounds to assume that alterations in activation may be associated with altered network connec-tivity, surprisingly little is known about potential altera-tions in connectivity between these regions in the context of reward processing, although altered connectivity in OCD has been reported in association with other processes14,15 or during the resting state.16 To our knowledge, only 2 studies have investigated connectivity in association with the pro-cessing of reward in OCD.17,18 In the first study, patients with OCD showed decreased functional connectivity be-tween the ventral striatum (i.e., nucleus accumbens) and limbic areas, such as the amygdala, and increased func-tional connectivity between the ventral striatum (i.e., nu-cleus accumbens) and posterior insula, cerebellum, calca-rine and temporal pole during reward anticipation, apart from mainly decreased connectivity during loss anticipa-tion. The second study, a recent one by our group investi-gating functional connectivity during reward processing in an OCD sample partly overlapping with the current one, showed stronger functional connectivity between the pos-terior cingulate and the ventromedial prefrontal cortex (vmPFC) in patients compared with controls. These findings provide first evidence that abnormal connectivity between core regions involved in the processing of reinforcement and reward may constitute a central mechanism of OCD psychopathology.
Against this background, the present study used a reward-based learning task to explore potential alterations in connec-tivity during reward processing in a relatively large sample of patients with OCD and healthy controls. To obtain more specific information on the connectivity within relevant net-works, in the present study we investigated effective connec-
tivity that, as opposed to the method of functional connectiv-ity, provides additional information on direct influences between neuronal populations within the modelled network. Based on the current literature we expected connectivity alterations between regions previously reported to show alter ations in activation in patients with OCD in the context of reward processing (i.e., mainly frontostriatal regions and the OFC), though not exclusively.
Methods
Participants
We recruited patients with OCD and healthy controls matched for age and sex to participate in this study. Patients were recruited from the inpatient hospital ward specialized in OCD of the Windach Institute and Hospital of Neurobe-havioural Research and Therapy, Germany. Healthy volun-teers were recruited from the community of the Klinikum rehcts der Isar, Technical University of Munich, and through local advertisements. Exclusion criteria for both groups were a history of clinically important head injuries, seizures or neurologic diseases. Healthy controls with a history of psychi atric illness were excluded.
Handedness was assessed using Annett’s questionnaire.19 The diagnosis of OCD was established by an experienced psychiatrist based on DSM-IV criteria. We assessed OCD symptom severity using the Yale–Brown Obsessive Com-pulsive Scale (Y-BOCS;20). The Beck Depression Inventory (BDI) was used for determining potential presence of depressive symptoms.21 Patients taking medication and with comorbidities were included, provided that OCD was the primary diagnosis.
All participants gave written informed consent to the study protocol. The protocol was developed in accordance with the Declaration of Helsinki and was approved by the ethics committee of the School of Medicine, Technical Uni-versity of Munich.
Experimental design
We used the Presentation software package (Neurobehav-ioural Systems Inc.) to project the stimuli on a screen inside the MRI scanner that could be viewed by participants through a mirror system. The task was similar to that described by Koch and colleagues.22 Stimuli consisted of a card containing a geometrical figure: a cross, a half-moon, a triangle or a pentagon. Each figure predicted a number higher or lower than 5, with a probability of either 50% or 100%. Participants were asked to guess whether the figure on the card predicted a value higher or lower than 5. Though participants were informed about the different probabilities, they were unaware of the exact probability of each contingency. Each correct/incorrect response was rewarded/charged with €0.5, respectively. Thus, the task had a probabilistic character in order to investigate the extent to which reward processing was affected by reward probability.

Altered reward-related effective connectivity in obsessive-compulsive disorder
J Psychiatry Neurosci 3
An experimental run was completed after 64 trials, with 32 trials for each probability condition. As shown in Figure 1, each trial started with the presentation of the stimu lus for 1.5 s, followed by the presentation of a ques-tion mark for 2.5 s during which participants indicated their response by button press. Feedback was provided in the fol-lowing 2.5 s, and finally an interstimulus interval of 3.5 s was introduced before the following trial was presented. Participants were paid according to their performance, but a minimum of €20 was guaranteed for participation. Overall scanning time was 10 min.
Functional MRI data acquisition and processing
Functional MRIs were acquired in a 3 T whole-body scanner (Achieva, Philips) using an 8-channel phased-array head coil. The data consisted of 644 scans, which were collected using a gradient echo echo-planar imaging sequence with the following parameters: echo time (TE) 30 ms, repetition time (TR) 2000 ms, flip angle 90°, field of view 192 × 192 × 122 mm, matrix 64 × 64, 37 slices, slice thickness 3 mm, and interslice gap 0 mm.
High-resolution, anatomical T1-weighted scans were ob-tained using a magnetization-prepared rapid acquisition gradient echo (MPRAGE) sequence with the following scan-ning parameters: TR 9 ms, TE 4 ms, inversion time 1000 ms, flip angle 8°, matrix size 240 × 240 mm2, 170 slices, acceleration factor (SENSE) 2 with an isotropic resolution of 1 × 1 × 1 mm3.
Images were processed and statistical analysis was per-formed with SPM 12 (www.fil.ion.ucl.ac.uk/spm; Wellcome Trust Centre for Neuroimaging, University College London) in MATLAB 8.2.0 (R2015a, Mathworks). Preprocessing started with scan realignment to the mean image of every session, unwarping and linear and nonlinear normalization to the Montreal Neurological Institute (MNI) reference brain (MNI 152). The 6 head movement parameters were com-puted using the realignment algorithm and examined on a participant-by-participant basis. Participants with motion artifacts larger than 3 mm were excluded from further analy-ses. Data were then spatially smoothed using an isotropic Gaussian kernel (8 mm, full-width at half-maximum) and high-pass filtered with a 128 s cut-off.
General linear model analysis
We used the general linear model (GLM) at first level to cal-culate statistical parametric maps of t statistics at the voxel
level. The onsets of each event, each with a variable duration of 1.5 s for stimulus presentation and 2.5 s for feedback and reward presentation, were convolved with a canonical hemodynamic response function (HRF). These modelled HRFs were then used as regressors within the GLM. Regres-sors of interest included the stimulus encoding (cross, half-moon, triangle or pentagon), the stimuli probabilities (50% and 100%) and the feedback (positive or negative). Individ-ual movement parameters were also included as regressors of no interest.
A full factorial model was then generated at the group level to identify regions of interest to be included in dynamic causal modelling (DCM). These were regions activated for both posi-tive and negative feedback (f-contrast, p < 0.05 family-wise error [FWE]-corrected), since statistical maps obtained from positive feedback overlapped with those obtained from the negative feedback condition (i.e., no activated regions after the t contrasts positive > negative and negative > positive, p < 0.05 FWE-corrected for control group and for patient group separately). The same procedure was performed for the pa-tient and control groups. Regions were identified using the Anatomy toolbox for SPM.23–25
Dynamic causal modelling
Hypothetical differences in the neuronal processing of positive/negative feedback between patients and controls were investigated by analyzing and comparing effective connectivity, indicating causal interactions in a proposed neuronal network involving regions known to be involved in feedback or reward processing. Effective connectivity was inferred using deterministic bilinear DCM.26,27 This method simulates neuronal dynamics in a predefined neur-onal network and how the dynamics change in response to experimental manipulations. Neuronal dynamics is inferred for a limited range of network models defined according to prior knowledge about the system being studied, and is characterized by distinct groups of parameters, described in 3 matrices: A, B and C. Matrix A contains the parameters describing endogenous connections between the volumes of interest; that is, describing the effects between the regions of interest in the absence of experimental perturba-tions.26 Parameters describing modulatory effects of exter-nal manipulations on the connections are described in ma-trix B and parameters characterizing the driving inputs into the network in matrix C.
Fig. 1: Experimental design.
Stimuluspresentation
Feedbackpresentation
Response
2.5 s2.5 s1.5 s
Intertrial interval
3.5 s Time

Alves-Pinto et al.
4 J Psychiatry Neurosci
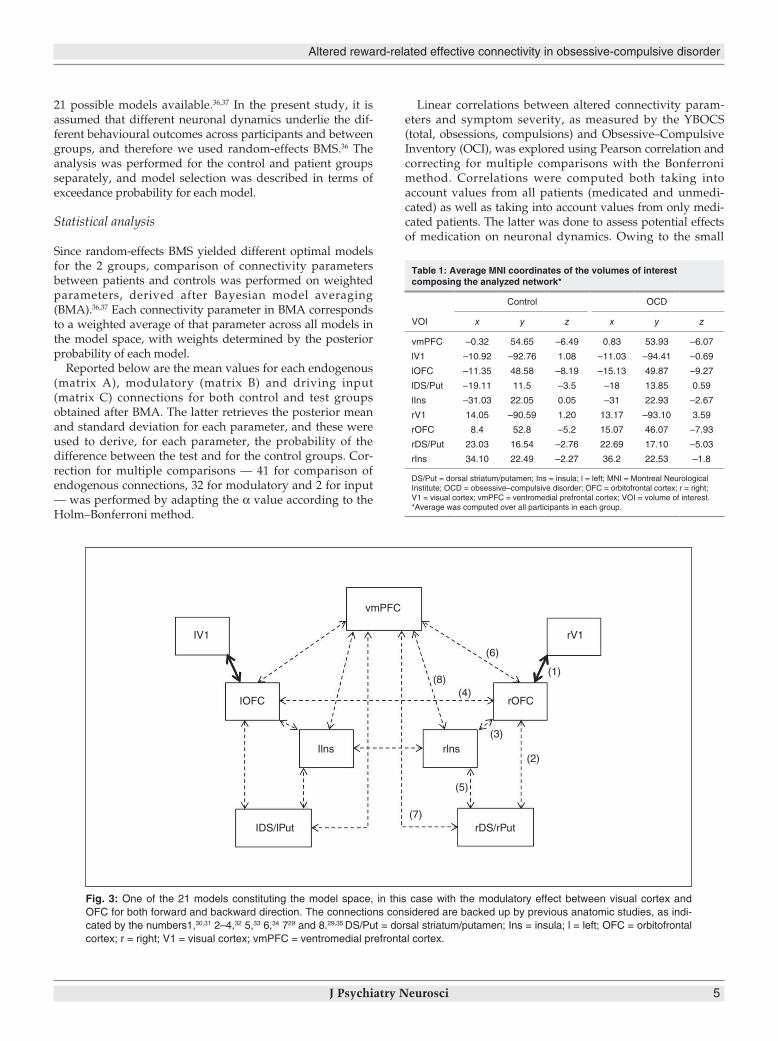
Regions of interest for the DCM analysisVolumes of interest (VOI) were selected based on 1) the statis-tical parametric maps generated after full factorial second-level analysis for both positive and negative feedback (f- contrast, p < 0.05 FWE-corrected) both for the control and patient group, and 2) on networks assumed to be relevant for the pathophysiology of OCD and/or the processing of reward that have been frequently reported in OCD studies.1,10,28 These regions are the right and left OFC; the right and left insula; the right and left dorsal striatum/putamen; the right and left visual cortex, considered here to be the region of input to the network as feedback was provided visually; and the vmPFC, connecting the subnetworks from the left and right hemi-spheres (Fig. 2). Connections with other VOIs were con-sidered according to the available literature on reward pro-cessing.29 Average MNI coordinates of the VOIs are shown in Table 1 and the localization of the average VOIs for the con-trol group are illustrated in Figure 2.
For each participant, regional time series for each of the above-mentioned VOIs were extracted from 4 mm spheres cen-tred on the activation maxima for the f-contrast “positive/ negative feedback” (p < 0.001, uncorrected; when no time series could be defined, then the criterion p < 0.01 or p < 0.05 uncor-rected was used) and that were located in the same anatomical region as indicated by the Anatomy toolbox for SPM.23–25 Time series were adjusted for the effects of interest. Not all partici-pants showed activation within the selected areas. Only those who showed activation maxima in all areas and for whom the network could be set up were included in DCM analysis: 30 pa-tients with OCD and 37 control participants. All but 1 of these 30 patients and all healthy controls were part of a larger (44 pa-tients, 37 controls), recently published study investigating seed-based functional connectivity.18
Defining the model spaceFigure 3 illustrates the base model from which the range of possible models evaluated in DCM was defined.29–35 Intrinsic and modulatory connections are identified by dotted black and continuous black arrows, respectively. In the model shown here, external manipulations specifically affect the con-nection between the visual cortex and the OFC bilaterally. In this study, external manipulations correspond to the type of feedback received by participants (positive or negative). The model presented differs from the other models in the location of the modulatory effect. Assuming that the external manipu-lations can affect any of the 9 connections in the network (no distinction between left and right hemisphere), this makes 9 different possible models. Furthermore, assuming that modu lation can affect differentially the forward or backward connection or both directions simultaneously, then the model space is composed by a total of 27 (i.e., 9 × 3) possible models. This number of possible models was finally reduced to 21 after removing the models that considered modulatory effects to occur on the forward and backward connections between the left and right OFC and insula (i.e., only bidirectional con-nectivity was assumed between the right and left OFC and between the right and left insula).
Each of the 21 models was computed on an individual level using the DCM12 analysis tool as implemented in SPM12.26,27
Bayesian model selectionModels estimated on an individual level were then subjected to Bayesian model selection (BMS), a statistical tool that com-putes the probability of obtaining the measured data, y, given the model, m; i.e., the model evidence, p(y|m). The model chosen is that with highest log-evidence from the set of
Fig. 2: Localization of volumes of interest (VOIs) used in the dynamic causal modelling analysis. The regions illustrated cor-respond to 4 mm spheres at average Montreal Neurological Institute coordinates of the group of control participants. DS/Put = dorsal striatum/putamen; Ins = insula; OFC = orbitofrontal cortex; V1 = visual cortex; vmPFC = ventromedial prefrontal cortex.
Altered reward-related effective connectivity in obsessive-compulsive disorder
J Psychiatry Neurosci 5
21 possible models available.36,37 In the present study, it is assumed that different neuronal dynamics underlie the dif-ferent behavioural outcomes across participants and between groups, and therefore we used random-effects BMS.36 The analysis was performed for the control and patient groups separately, and model selection was described in terms of exceedance probability for each model.
Statistical analysis
Since random-effects BMS yielded different optimal models for the 2 groups, comparison of connectivity parameters between patients and controls was performed on weighted parameters, derived after Bayesian model averaging (BMA).36,37 Each connectivity parameter in BMA corresponds to a weighted average of that parameter across all models in the model space, with weights determined by the posterior probability of each model.
Reported below are the mean values for each endogenous (matrix A), modulatory (matrix B) and driving input (matrix C) connections for both control and test groups obtained after BMA. The latter retrieves the posterior mean and standard deviation for each parameter, and these were used to derive, for each parameter, the probability of the difference between the test and for the control groups. Cor-rection for multiple comparisons — 41 for comparison of endogenous connections, 32 for modulatory and 2 for input — was performed by adapting the α value according to the Holm–Bonferroni method.
Linear correlations between altered connectivity param-eters and symptom severity, as measured by the YBOCS (total, obsessions, compulsions) and Obsessive–Compulsive Inventory (OCI), was explored using Pearson correlation and correcting for multiple comparisons with the Bonferroni method. Correlations were computed both taking into account values from all patients (medicated and unmedi-cated) as well as taking into account values from only medi-cated patients. The latter was done to assess potential effects of medication on neuronal dynamics. Owing to the small
Table 1: Average MNI coordinates of the volumes of interest composing the analyzed network*
VOI
Control OCD
x y z x y z
vmPFC –0.32 54.65 –6.49 0.83 53.93 –6.07
lV1 –10.92 –92.76 1.08 –11.03 –94.41 –0.69
lOFC –11.35 48.58 –8.19 –15.13 49.87 –9.27
lDS/Put –19.11 11.5 –3.5 –18 13.85 0.59
lIns –31.03 22.05 0.05 –31 22.93 –2.67
rV1 14.05 –90.59 1.20 13.17 –93.10 3.59
rOFC 8.4 52.8 –5.2 15.07 46.07 –7.93
rDS/Put 23.03 16.54 –2.76 22.69 17.10 –5.03
rIns 34.10 22.49 –2.27 36.2 22.53 –1.8
DS/Put = dorsal striatum/putamen; Ins = insula; l = left; MNI = Montreal Neurological Institute; OCD = obsessive–compulsive disorder; OFC = orbitofrontal cortex; r = right; V1 = visual cortex; vmPFC = ventromedial prefrontal cortex; VOI = volume of interest.*Average was computed over all participants in each group.
Fig. 3: One of the 21 models constituting the model space, in this case with the modulatory effect between visual cortex and OFC for both forward and backward direction. The connections considered are backed up by previous anatomic studies, as indi-cated by the numbers1,30,31 2–4,32 5,33 6,34 729 and 8.29,35 DS/Put = dorsal striatum/putamen; Ins = insula; l = left; OFC = orbitofrontal cortex; r = right; V1 = visual cortex; vmPFC = ventromedial prefrontal cortex.
vmPFC
IOFC rOFC
rDS/rPut
(6)
(8)(4)
(3)
(2)
(1)
(5)
(7)IDS/lPut
rlnsIlns
IV1 rV1

Alves-Pinto et al.
6 J Psychiatry Neurosci
number of unmedicated patients, no correlations could be computed separately for this subgroup. All statistical tests were performed with the statistics toolbox of MATLAB R2015b.
Results
Participants
Our sample included 37 patients with OCD and 39 healthy controls. All participants were right-handed. Participant characteristics are described in Table 2.
Dynamic causal modelling
Model selectionThe model with highest exceedance probability for the con-trol group was model 1 (exceedance probability 55%), describing an effect of modulation at the forward connection between the visual cortex and the OFC. For the OCD group, the winning model was model 3 (exceedance probability 89%), for which the modulatory effect influenced both the forward and backward connections between the visual cortex and OFC (Fig. 4). Given that the winning model was different for both groups, statistical comparison of effective connectiv-ity between the 2 groups was based on average parameters estimates derived after BMA.37
Differences in effective connectivityTable 3 contains group average estimates of endogenous con-nectivity parameters (matrix A in DCM) inferred after BMA. Statistically significant differences were found after correcting for multiple comparisons for parameters describing influences between the following VOIs: between the vmPFC and the left and right OFC in both forward (diffPFC > lOFC = –0.095, p < 0.001; diffPFC > rOFC = –0.0714, p < 0.003) and backward directions (difflOFC > PFC = 0.1053, p < 0.001; diffrOFC > PFC = –0.0653, p < 0.005), between the left visual cortex and left OFC for both forward (difflV1 > lOFC = –0.0318, p < 0.002) and backward directions (difflOFC > lV1 = 0.0734, p < 0.002), from the right OFC to the right visual cortex (diffrOFC > rV1 = 0.171, p < 0.0001), from the right OFC to the left OFC (diffrOFC > lOFC = 0.099, p < 0.0001), from the right insula to the left insula (diffrIns > lIns = 0.0726, p < 0.002) and within the left visual cortex (difflV1 > lV1 = –0.1318, p < 0.0001).
Statistically significant differences between patients and controls were obtained for the following positive feedback -related connectivity parameters (matrix B, Table 4): from the vmPFC to the left OFC (mean difference = –0.1325, p < 0.006) and to the right OFC (mean difference = –0.1395, p < 0.008). Significant differences were also found, independent of type of feedback, from the left visual cortex to the left OFC (posi-tive: mean difference = 0.1631, p < 0.001; negative: mean dif-ference = –0.2412, p < 0.001), from the left to the right insula (positive: mean difference = –0.1084, p < 0.001; negative: mean difference = –0.0938, p < 0.007), from the right to the left OFC (positive: mean difference = 0.0843, p < 0.002; negative: mean difference = –0.0811, p < 0.002). In addition to these, a signifi-cant difference was found for negative feedback–related
connectivity from the left to the right OFC (mean difference = –0.0656, p < 0.008).
Finally, significant differences between the groups were observed in terms of input parameters (matrix C in DCM; Table 5) for the left visual cortex for negative feedback only (mean difference = 0.2304, p < 0.001) and for the right visual cortex for both positive and negative feedback (positive: mean difference = 0.165, p < 0.001; negative: mean difference = 0.2989, p < 0.001).
Correlation between effective connectivity parameters and clinical scoresSignificant correlations (after Bonferroni correction) were found between the parameter describing the effect of the input in the left visual cortex and the severity of compulsions, when all pa-tients, medicated and unmedicated, were considered (r = 0.44, p < 0.0141; Fig. 5A); the severity of compulsions when only the 19 medicated patients were considered (r = 0.66, p < 0.0023; Fig. 5B); and the OCI level obtained for the 19 medicated pa-tients only (r = 0.54, p < 0.0178; Fig. 5C). No correlations between the effect of the input on the left visual cortex (C-parameter) with age of onset or with the time since onset were found.
Table 2: Demographic and clinical characteristics of study participants
Group; mean ± SD*
CharacteristicOCD n = 37
Control n = 39
Sex, male:female 14:23 16:23
Age, yr 33.7 ± 10.1 32.2 ± 8.3
Medication, yes:no 24:13 —
Medication type, no. of patients†
SSRI 16 —
SNRI 2 —
Tricyclic antidepressant 3 —
Benzodiazepine 1 —
NDRI 1 —
Atypical antipsychotic 1 —
Comorbidities,present:not present
22:15 —
Comorbidity, no. of patients‡
Depression 18 —
Anxiety disorder 6 —
Personality disorder 2 —
Y-BOCS
Total score 19.5 ± 6.4 —
Obsessions 10.1 ± 3.7 —
Compulsions 9.4 ± 3.8 —
BDI 16.6 ± 11.1 —
Age of onset, yr 15.9 ± 6.4 —
Time since onset, yr 17.7 ± 10.4 —
BDI = Beck Depression Inventory; NA = not applicable; NDRI = norepinephrine-dopamine reuptake inhibitor; SD = standard deviation; SNRI = serotonin-norepinephrine reuptake inhibitor; SSRI = selective serotonin reuptake inhibitor; Y-BOCS = Yale–Brown Obsessive Compulsive Scale.*Unless indicated otherwise.†Two patients were taking more than 1 medication.‡Three patients had more than 1 comorbidity.

Altered reward-related effective connectivity in obsessive-compulsive disorder
J Psychiatry Neurosci 7
Discussion
Dynamic causal modelling is a generic method to infer effec-tive connectivity in a dynamic system, such as a neuronal cir-cuit, from experimental measures of brain activity, in this case fMRI as an indirect measure of brain activity. Effective connectivity between 2 neuronal populations reflects how the activity of one population affects the activity of the other, expressed in units of rate (Hz), and how this interaction is affected by external stimulation.26,37
In the present study, DCM of neuronal activity associated with a reward learning task showed altered neuronal dynam-ics in parts of the frontostriatal system; i.e., mainly the vmPFC and the OFC, in patients with OCD compared with healthy controls. In particular, alterations in the influence of the vmPFC on both the left and right OFC were found for
endogenous connectivity and also for task-related connectiv-ity. Average endogenous parameters were positive in both groups but larger in the patient group, which suggests a stronger effective connectivity between these areas in the OCD group. Similar to the present findings, we also detected an increased reward-related connectivity of the vmPFC in a recent study in patients with OCD compared with controls.18 It should be noted that here, in an analysis performed in-dependently from the previous one and by a different researcher, we analyzed effective connectivity, which investi-gates the directional influence different regions exert on each other under external stimulation. Therefore, the analysis per-formed in the present work provides supplementary infor-mation to that obtained with functional connectivity analysis. Although the results presented here are more complex, they are partly consistent with the increased connectivity between
Fig. 4: (A) Model exceedance probabilities. (B) Winning model (highest exceedance probability) for patients with OCD (model 3) and control (model 1) groups. DS/Put = dorsal striatum/putamen; Ins = insula; l = left; OCD = obsessive–compulsive disorder; OFC = orbito-frontal cortex; r = right; V1 = visual cortex; vmPFC = ventromedial prefrontal cortex.
rV1vmPFCvmPFC
OCD
Model
Controls
A
B
OCD
Exc
eeda
nce
prob
abili
ty
1 2 3 4 5 6 7 8 9 10 11 12 13 14 15 16 17 18 19 20 21 22 23 24 25
0.9
0.8
0.7
0.6
0.5
0.4
0.3
0.2
0.1
0
Controls
IOFC rOFCIOFC rOFC
rDS/rPutIDS/lPutrDS/rPutIDS/lPut
rlnsIlnsrlnsIlns
IV1 IV1 rV1

Alves-Pinto et al.
8 J Psychiatry Neurosci
the vmPFC and the posterior cingulate cortex (PCC)18 found with functional connectivity analysis, also for the positive feedback condition. The vmPFC constitutes a central com-ponent of the default mode network, an intrinsic brain net-work that is assumed to be active when a person is thinking about himself instead of the outside world.38 A recent com-prehensive meta-analysis of resting state functional connec-
tivity in OCD illustrated the central role that the vmPFC plays in the context of the disorder. It showed a dysconnec-tivity within the default mode network peaking in the anter-ior cingulate cortex (ACC) and the vmPFC in adult patients with OCD.39 Considering that the vmPFC is assumed to be predominantly responsible for the processing of internal mental states and events, its increased effective connectivity
Table 3: Group average endogenous parameters (matrix A) in Hz
Controls – OCD
Connection Control OCD Difference mean Difference SD 1 – p*
vmPFC to vmPFC –0.1164 –0.1387 0.0224 0.0294 0.7767
vmPFC to lOFC 0.0095 0.1045 –0.095 0.0249 0.9999
vmPFC to lDS/Put 0.0242 0.0218 0.0024 0.0223 0.543
vmPFC to lIns –0.0325 –0.0576 0.0251 0.0235 0.8578
vmPFC to rOFC 0.0041 0.0756 –0.0714 0.0255 0.9974
vmPFC to rDS/Put 0.0457 0.021 0.0247 0.0217 0.8734
vmPFC rIns 0.0199 0.0084 0.0115 0.024 0.6839
lV1 to lV1 –0.3203 –0.1885 –0.1318 0.0227 1
lV1 to lOFC 0.0075 0.0393 –0.0318 0.011 0.9982
lOFC to vmPFC 0.1525 0.0472 0.1053 0.0246 1
lOFC to lV1 0.1426 0.0692 0.0734 0.0252 0.9982
lOFC to lOFC –0.0795 –0.0627 –0.0167 0.0291 0.7175
lOFC to lDS/Put 0.1003 0.0618 0.0385 0.022 0.9603
lOFC lIns 0.0399 0.031 0.0089 0.0237 0.6464
lOFC rOFC 0.0566 0.0032 0.0534 0.0253 0.9826
lDS/Put to vmPFC 0.0463 0.0149 0.0314 0.0286 0.8643
lDS/Put to lOFC 0.0154 0.0445 –0.0291 0.0289 0.8427
lDS/Put to lDS/Put –0.0479 –0.0626 0.0147 0.0295 0.6906
lDS/Put to lIns 0.0449 0.0275 0.0175 0.0275 0.7377
lIns to vmPFC 0.0377 –0.0035 0.0412 0.028 0.929
lIns to lOFC 0.0624 0.0351 0.0273 0.0273 0.8414
lIns to lDS/Put 0.0927 0.0902 0.0025 0.0259 0.539
lIns to lIns –0.0748 –0.0683 –0.0065 0.0299 0.5865
lIns to rIns 0.1088 0.0814 0.0274 0.0273 0.842
rV1 to rV1 –0.2492 –0.2393 –0.0098 0.023 0.6656
rV1 to rOFC 0.0287 0.0271 0.0016 0.0116 0.5558
rOFC to vmPFC 0.1187 0.1841 –0.0653 0.025 0.9955
rOFC to lOFC 0.0954 –0.0036 0.099 0.0254 1
rOFC to rV1 0.1325 –0.0385 0.171 0.0251 1
rOFC to rOFC –0.0917 –0.0894 –0.0023 0.0297 0.531
rOFC to rDS/Put 0.0793 0.0459 0.0334 0.0227 0.9294
rOFC to rIns 0.0278 –0.0195 0.0473 0.0236 0.9777
rDS/Put to vmPFC 0.0434 0.0496 –0.0063 0.0288 0.5863
rDS/Put to rOFC 0.0439 0.0346 0.0093 0.0303 0.6205
rDS/Put to rDS/Put –0.0537 –0.0493 –0.0044 0.0299 0.5588
rDS/Put to rIns 0.049 0.0696 –0.0205 0.0284 0.7655
rIns to vmPFC 0.0417 0.0983 –0.0566 0.027 0.982
rIns to lIns 0.1281 0.0555 0.0726 0.0248 0.9983
rIns to rOFC 0.0671 0.0822 –0.0151 0.0264 0.7158
rIns to rDS/Put 0.0819 0.0627 0.0192 0.0253 0.7763
rIns to rIns 0.0898 –0.0719 –0.0179 0.0298 0.726
DS/Put = dorsal striatum/putamen; Ins = insula; l = left; OCD = obsessive–compulsive disorder; OFC = orbitofrontal cortex; r = right; SD = standard deviation; V1 = visual cortex; vmPFC = ventromedial prefrontal cortex.*Posterior probabilities of the parameter difference. Text in bold indicates a significant difference from zero, after applying the Holm–Bonferroni correction for multiple comparisons.

Altered reward-related effective connectivity in obsessive-compulsive disorder
J Psychiatry Neurosci 9
to the OFC in the patient group in the present context might reflect excessive internal, self-related processing impairing normal responsiveness toward external rewards and incen-tives. This may explain the constant need for additional rewarding stimulation reflected in the incapacity to suppress
compulsive behaviours. Interestingly, increased connectivity of the vmPFC has also been observed in patients with psych-osis both during rest40 and during tasks (e.g., in association with a self- reflection task).41 Hence, altered vmPFC con-nectivity might constitute a common neuropathological
Table 4: Group average modulation parameters (matrix B), strength in HZ
Control OCD
Control – OCD
+Feedback –Feedback
Connection +Feedback –Feedback +Feedback –Feedback Mean SD 1 – p* Mean SD 1 – p*
vmPFC to lOFC –0.0451 0.0521 0.0874 0.0716 –0.1325 0.0523 0.9944 –0.0194 0.0577 0.6318
vmPFC to lDS/Put –0.0211 0.0381 –0.0827 –0.0156 0.0616 0.0498 0.8921 0.0537 0.0486 0.8653
vmPFC to lIns 0.0315 0.0706 –0.0177 –0.0198 0.0492 0.0432 0.8727 0.0904 0.0589 0.9377
vmPFC to rOFC –0.0553 0.0720 0.0842 –0.0370 –0.1395 0.0575 0.9924 0.1089 0.0721 0.9345
vmPFC to rDS/Put –0.0186 0.0218 0.0085 0.0492 –0.0272 0.0511 0.7024 –-0.0274 0.0475 0.7180
vmPFC to rIns –0.0795 –0.0108 –0.0146 0.0003 –0.0649 0.0554 0.8790 -0.0111 0.0580 0.5759
lV1 to lOFC 0.1267 –0.1774 –0.0364 0.0638 0.1631 0.0365 1.0000 –0.2412 0.0609 1.0000
lOFC to vmPFC 0.0229 0.0645 –0.0044 0.0168 0.0273 0.0751 0.6419 0.0477 0.0744 0.7393
lOFC to lV1 –0.0205 0.0129 0.1129 –0.1459 –0.1335 0.1299 0.8480 0.1588 0.1276 0.8934
lOFC to lDS/Put –0.0502 –0.0392 –0.0051 –0.0011 –0.0451 0.0422 0.8576 –0.0381 0.0435 0.8095
lOFC to lIns –0.0858 –0.0779 –0.0580 0.0196 –0.0278 0.0524 0.7022 –0.0975 0.0471 0.9807
lOFC to rOFC 0.0001 0.0000 0.0046 0.0656 –0.0044 0.0245 0.5716 –0.0656 0.0270 0.9924
lDS/Put to vmPFC 0.0012 0.0155 0.0342 –0.0855 –0.0330 0.0547 0.7268 0.1010 0.0501 0.9782
lDS/Put to lOFC 0.0001 0.0001 0.0044 0.0033 –0.0043 0.0248 0.5690 –0.0032 0.0226 0.5559
lDS/Put to lIns –0.0414 –0.0100 0.0021 –0.0079 –0.0436 0.0531 0.7941 –0.0021 0.0413 0.5204
lIns to vmPFC –0.0529 0.1088 0.0015 0.0027 –0.0544 0.0454 0.8848 0.1062 0.0506 0.9820
lIns to lOFC –0.0284 0.0486 0.0780 –0.0415 –0.1064 0.0596 0.9628 0.0900 0.0545 0.9508
lIns to lDS/Put 0.0623 0.0138 –0.0073 0.0038 0.0697 0.0537 0.9028 0.0100 0.0385 0.6028
lIns to rIns –0.0002 –0.0001 0.1082 0.0937 –0.1084 0.0320 0.9996 –0.0938 0.0295 0.9993
rV1 to rOFC 0.0788 –0.1125 0.0063 –0.2692 0.0724 0.0428 0.9547 0.1567 0.0707 0.9866
rOFC to vmPFC –0.0138 0.0190 –0.0462 0.0566 0.0324 0.0720 0.6737 –0.0377 0.0894 0.6633
rOFC to lOFC — –0.0002 –0.0843 0.0809 0.0843 0.0283 0.9986 –0.0811 0.0281 0.9980
rOFC to rV1 0.0251 0.0203 –0.0068 –0.0524 0.0319 0.1280 0.5985 0.0726 0.1275 0.7156
rOFC to rDS/Put 0.0869 0.0691 –0.0028 0.0000 0.0897 0.0617 0.9272 0.0691 0.0474 0.9277
rOFC to rIns 0.0224 –0.0962 0.0697 –0.0184 –0.0473 0.0693 0.7523 –0.0779 0.0488 0.9446
rDS/Put to vmPFC 0.023 0.0190 –0.0281 0.0926 0.0510 0.0528 0.8332 –0.0736 0.0483 0.9360
rDS/Put to rOFC 0 0 0.0079 0.0030 –0.0079 0.0293 0.6063 –0.0030 0.0240 0.5489
rDS/Put to rIns –0.0155 0.0047 –0.0119 –0.0094 –0.0036 0.0569 0.5252 0.0140 0.0469 0.6178
rIns to vmPFC –0.0259 0.0364 0.0051 0.0043 –0.0311 0.0427 0.7666 0.0320 0.0459 0.7576
rIns to lIns –0.0001 0.0000 0.0265 0.0690 –0.0266 0.0336 0.7858 –0.0690 0.0420 0.9499
rIns to rOFC –0.0892 –0.0493 –0.0516 –0.0318 –0.0375 0.0617 0.7284 –0.0175 0.0450 0.6514
rIns to rDS/Put –0.0003 0.0427 0.0041 0.0066 –0.0044 0.0404 0.5434 0.0361 0.0437 0.7959
DS/Put = dorsal striatum/putamen; Ins = insula; l = left; OCD = obsessive–compulsive disorder; OFC = orbitofrontal cortex; r = right; SD = standard deviation; V1 = visual cortex; vmPFC = ventromedial prefrontal cortex. *Posterior probabilities of differences were corrected (Holm-Bonferroni) for multiple comparisons. Text in bold indicates a parameter difference significantly different from zero.
Table 5: Group average input parameters (matrix C), strength in Hz*
Controls OCD
Controls – OCD
Positive feedback Negative feedback
Input Positive Negative Positive Negative Difference mean Difference SD 1 – p Difference mean Difference SD 1 – p
lV1 1.4195 1.3098 1.3489 1.0795 0.0706 0.0366 9.73E-01 0.2304 0.0449 1
rV1 1.5021 1.3457 1.3369 1.0468 0.165 0.0417 1.00E+00 0.2989 0.0434 1
l = left; OCD = obsessive–compulsive disorder; SD = standard deviation; V1 = visual cortex.*Text in bold indicates a parameter difference significantly different from zero.

Alves-Pinto et al.
10 J Psychiatry Neurosci
mechanism that might not only account for the frequent occurrence of OCD symptoms in psychosis, but also might also explain why both patient groups suffer from an exces-
sive internal self-related processing at the expense of recog-nizing and internalizing external facts and evidence.
When taking a closer look at the connectivity parameters, we notice that average parameters derived from positive feedback conditions were negative for the control group and positive for patients with OCD. Parameters derived for negative feedback conditions were not significantly differ-ent between the 2 groups. Negative parameters indicate that neuronal activity in the vmPFC induces a decrease in neuronal activity in the OFC and vice versa. Hence, these results point to a smaller inhibitory influence of the vmPFC, known to exert inhibitory effects on networks involved in mainly emotional processing,42,43 on the OFC in patients rel-ative to controls under positive feedback conditions. The OFC constitutes the final common pathway of the cortico–striato–thamalo–cortical (CSTC) system.7 Within this sys-tem it is possible to distinguish 2 main pathways: the direct loop, constituting a positive feedback loop, and the indirect loop, representing a negative feedback loop.7 According to the CTSC model of OCD, patients suffer from an imbal-anced activation of the direct and the indirect loop7,44 in terms of an excessive activation of the excitatory positive feedback loop (direct loop). Consequently, the indirect loop is no longer able to regulate the activity of the direct path-way, resulting in an increased cortical, or more specifically OFC, activation. The present findings extend this model by indicating that, under certain conditions, a decreased inhib-itory influence of the vmPFC on the OFC might likewise underlie excessive OFC activation in patients with OCD. Whether this excessive OFC activation and altered connec-tivity to the vmPFC in patients with OCD plays a role in the context of compulsive behaviour and the affective pro-cesses going along with it as well as which of the 2 mech-anisms is the predominant cause of the frequently reported excessive OFC activation in patients with OCD remain to be clarified.
Moreover, our results show different effects of input in sensory areas between patients and controls, a finding that might emphasize the assumption of a deficient processing of the valence of external stimuli and rewards, as dis-cussed earlier. Alterations in effective connectivity be-tween the visual cortex and OFC, namely the mutual en-dogenous influence between the left visual cortex and the left OFC and the task-related connectivity from the left visual cortex to the left OFC for both positive and negative feedback suggest that sensitivity of sensory areas to posi-tive or negative feedback is also influenced by its valence. The opposite sign of average parameters (Table 4) indi-cates that the modulatory effect induced by positive and negative feedback is different for both groups.
The correlation between the effect of negative input in the left visual cortex and behavioural measures of compul-sion and OCI in medicated patients (Fig. 5) with higher levels of compulsion associated with larger effects of nega-tive input in the left visual cortex, indicates that the differ-ential impact of negative feedback in patients with OCD with regard to sensory areas might be of clinical rele-vance.45 From a clinical perspective, one could assume that
Fig. 5: (A) Compulsion measure of Y-BOCS as a function of input effect on the left visual cortex for negative feedback in all patients, and (B) in medicated patients only. (C) OCI as a function of input effect on the left visual cortex for negative feedback and for medi-cated patients only. OCI = Obsessive–Compulsive Inventory; V1 = visual cortex; Y-BOCS = Yale–Brown Obsessive–Compulsive Scale.
Y-B
OC
S, c
ompu
lsio
nY-
BO
CS
, com
puls
ion
OC
I
20
15
10
5
0
20
15
10
5
0
40
30
20
10
0
–1 0 1 2 3
–1 0 1 2 3
–1 0 1 2 3
Input left V1 after negative feedback
Input left V1 after negative feedback
Input left V1 after negative feedback
Medicated patients n = 19
Medicated patients n = 19
All patients n = 30
rho = 0.44p = 0.0141
rho = 0.66p = 0.0023
A
B
C

Altered reward-related effective connectivity in obsessive-compulsive disorder
J Psychiatry Neurosci 11
a disrupted connectivity between regions involved in the sensory processing of external events may affect the ability to update internal reference frames and consequently in-duce an enhanced response to negative stimulus valence going along with compulsive behaviour.
Limitations
Some limiting factors need to be addressed. First, we need to take into account that effective connectivity depends on the architecture of the network considered — in this case, on how many neuronal regions/nodes are considered and how they are interconnected — as well as on the nature of external manipulations.26,37 That is why the specificity of the changes in connectivity that we found will likely differ depending on the nature of the task investigated as well as on the individual specificities of the condition. Hence, the results do not disregard the clinical relevance of other areas for OCD.
The nature of the task, together with the analysis per-formed, highlighted one of the several neuronal substrates that likely determine the clinical features of OCD. Addition-ally, the multitude of contexts in which the symptoms of OCD can manifest, with a multitude of experimental manipulation likely to induce measurable changes in neuro-nal dynamics, makes this condition particularly suitable to be addressed with DCM.
Conclusion
Alterations in effective connectivity in parts of the default mode and frontostriatal networks in patients with OCD rela-tive to healthy controls during a reward-learning task sug-gest a disruption in responses to external rewards in patients. This may underlie the urge for reinforcement and accompa-nying compulsive behaviour in OCD.
Acknowledgement: This work was supported by the German Re-search Foundation (DFG) and the Technical University of Munich within the funding programme Open Access Publishing.
Affiliations: From the Department of Neuroradiology, School of Medicine, Klinikum Rechts der Isar, Technical University of Munich, Munich, Germany (Rus, Reess, Wohlschläger, Koch); the TUM- Neuroimaging Center (TUM-NIC) School of Medicine of Klinikum rechts der Isar, Technische Universität München TUM, Ismaninger Strasse 22, 81675 Munich, Germany (Rus, Reess, Wohlschläger, Koch); the Research Unit of the Buhl-Strohmaier Foundation for Pediatric Neuroorthopaedics and Cerebral Palsy, Department of Orthopedics and Sports Orthopedics, School of Medicine, Klinikum Rechts der Isar, Technical University of Munich, Munich, Germany (Alves-Pinto); the Graduate School of Systemic Neurosciences GSN, Ludwig-Maximilians-Universität, Biocenter, Munich, Germany (Rus, Reess, Koch); the Department of Psychiatry and Psychotherapy, Jena University Hospital, Jena, Germany (Wagner); the Windach Institute and Hospital of Neurobehavioural Research and Therapy (WINTR), Windach, Germany (Berberich); and the Department of Neuroradiol-ogy, University of Zürich, Zürich, Switzerland (Rus).
Funding: This study was supported by a Deutsche Forschungsge-meinschaft grant to K. Koch (KO 3744/2-1) and G. Wagner (WA 3001/3-1).
Competing interests: None declared.
Contributors: O. Rus, G. Wagner, G. Berberich and K. Koch designed the study. O. Rus, T. Reess, G. Berberich and K. Koch acquired the data, which A. Alves-Pinto, A. Wohlschläger and K. Koch analyzed. A. Alves-Pinto and K. Koch wrote the article, which all authors re-viewed. All authors approved the final version to be published and can certify that no other individuals not listed as authors have made substantial contributions to the paper.
References
1. Milad MR, Rauch SL. Obsessive-compulsive disorder: beyond seg-regated cortico-striatal pathways. Trends Cogn Sci 2012;16:43-51.
2. Sescousse G, Caldú X, Segura B, et al. Processing of primary and secondary rewards: a quantitative meta-analysis and review of hu-man functional neuroimaging studies. Neurosci Biobehav Rev 2013; 37:681-96.
3. Berridge KC, Kringelbach ML. Pleasure systems in the brain. Neuron 2015;86:646-64.
4. Denys D, Mantione M, Figee M, et al. Deep brain stimulation of the nucleus accumbens for treatment-refractory obsessive- compulsive disorder. Arch Gen Psychiatry 2010;67:1061-8.
5. Huff W, Lenartz D, Schormann M, et al. Unilateral deep brain stimulation of the nucleus accumbens in patients with treatment-resistant obsessive-compulsive disorder: outcomes after one year. Clin Neurol Neurosurg 2010;112:137-43.
6. Sturm V, Lenartz D, Koulousakis A, et al. The nucleus accumbens: a target for deep brain stimulation in obsessive–compulsive-and anxiety-disorders. J Chem Neuroanat 2003;26:293-9.
7. Saxena S, Rauch SL. Functional neuroimaging and the neuroanat-omy of obsessive-compulsive disorder. Psychiatr Clin North Am 2000; 23:563-86.
8. Jung W, Kang DH, Han J, et al. Aberrant ventral striatal responses during incentive processing in unmedicated patients with obsessive–compulsive disorder. Acta Psychiatr Scand 2011;123: 376-86.
9. Figee M, Vink M, de Geus F, et al. Dysfunctional reward circuitry in obsessive-compulsive disorder. Biol Psychiatry 2011;69:867-74.
10. Kaufmann C, Beucke J, Preuße F, et al. Medial prefrontal brain ac-tivation to anticipated reward and loss in obsessive–compulsive disorder. Neuroimage Clin 2013;2:212-20.
11. Remijnse PL, Nielen MM, van Balkom AJ, et al. Reduced orbitofrontal-striatal activity on a reversal learning task in obsessive-compulsive disorder. Arch Gen Psychiatry 2006;63: 1225-36.
12. Marsh R, Tau GZ, Wang Z, et al. Reward-based spatial learning in unmedicated adults with obsessive-compulsive disorder. Am J Psychiatry 2015;172:383-92.
13. Piras F, Piras F, Chiapponi C, et al. Widespread structural brain changes in OCD: a systematic review of voxel-based morphometry studies. Cortex 2015;62:89-108.
14. Han H, Jung W, Yun J-Y, et al. Disruption of effective connectivity from the dorsolateral prefrontal cortex to the orbitofrontal cortex by negative emotional distraction in obsessive–compulsive disor-der. Psychol Med 2016;46:921-32.
15. Jhung K, Ku J, Kim SJ, et al. Distinct functional connectivity of lim-bic network in the washing type obsessive–compulsive disorder. Prog Neuropsychopharmacol Biol Psychiatry 2014;53:149-55.
16. Peterson A, Thome J, Lanius RA. Resting-state neuroimaging stud-ies: A new way of identifying differences and similarities among the anxiety disorders? Can J Psychiatry 2014;59:294.
17. Jung WH, Kang D-H, Kim E, et al. Abnormal corticostriatal- limbic functional connectivity in obsessive–compulsive disorder during reward processing and resting-state. Neuroimage Clin 2013;3:27-38.
18. Koch K, Reess TJ, Rus OG, et al. Increased default mode network connectivity in obsessive–compulsive disorder during reward pro-cessing. Front Psychiatry 2018;9:254.
19. Annett M. A classification of hand preference by association analysis. Br J Psychol 1970;61:303-21.
20. Goodman WK, Price LH, Rasmussen SA, et al. The Yale-Brown Obsessive Compulsive Scale: I. development, use, and reliability. Arch Gen Psychiatry 1989;46:1006-11.

Alves-Pinto et al.
12 J Psychiatry Neurosci
21. Beck A, Ward C, Mendelson M, et al. An inventory for measuring depression. Arch Gen Psychiatry 1961;4:561-71.
22. Koch K, Wagner G, Schachtzabel C, et al. Association between white matter fiber structure and reward‐related reactivity of the ventral striatum. Hum Brain Mapp 2014;35:1469-76.
23. Eickhoff SB, Paus T, Caspers S, et al. Assignment of functional acti-vations to probabilistic cytoarchitectonic areas revisited. Neuroimage 2007;36:511-21.
24. Eickhoff SB, Stephan KE, Mohlberg H, et al. A new SPM toolbox for combining probabilistic cytoarchitectonic maps and functional imaging data. Neuroimage 2005;25:1325-35.
25. Eickhoff SB, Heim S, Zilles K, et al. Testing anatomically specified hypotheses in functional imaging using cytoarchitectonic maps. Neuroimage 2006;32:570-82.
26. Friston KJ, Harrison L, Penny WD. Dynamc causal modelling. Neuroimage 2003;19:1273-302.
27. Penny WD, Stephan KE, Mechelli A, et al. Modelling functional integration: a comparison of structural equation and dynamic causal and models. Neuroimage 2004;23:264-74.
28. Becker MP, Nitsch AM, Schlösser R, et al. Altered emotional and BOLD responses to negative, positive and ambiguous performance feedback in OCD. Soc Cogn Affect Neurosci 2014;9:1127-33.
29. Gottfried JA. Neurobiology of sensation and reward. CRC Press; 2011.30. Barbas H. Organization of cortical afferent input to orbitofrontal
areas in the rhesus monkey. Neuroscience 1993;56:841-64.31. Carmichael S, Price JL. Sensory and premotor connections of the
orbital and medial prefrontal cortex of macaque monkeys. J Comp Neurol 1995;363:642-64.
32. Cavada C, Tejedor J, Cruz-Rizzolo RJ, et al. The anatomical con-nections of the macaque monkey orbitofrontal cortex. A review. Cereb Cortex 2000;10:220-42.
33. Chikama M, McFarland NR, Amaral DG, et al. Insular cortical projec-tions to functional regions of the striatum correlate with cortical cyto-architectonic organization in the primate. J Neurosci 1997;17: 9686-705.
34. Calzavara R, Mailly P, Haber SN. Relationship between the cortico striatal terminals from areas 9 and 46, and those from area
8A, dorsal and rostral premotor cortex and area 24c: an anatomical substrate for cognition to action. Eur J Neurosci 2007;26:2005-24.
35. Carmichael S, Price J. Connectional networks within the orbital and medial prefrontal cortex of macaque monkeys. J Comp Neurol 1996;371:179-207.
36. Stephan KE, Penny WD, Daunizeau J, et al. Bayesian model selec-tion for group studies. Neuroimage 2009;46:1004-17.
37. Stephan KE, Penny WD, Moran RJ, et al. Ten simple rules for dynamic causal modeling. Neuroimage 2010;49:3099-109.
38. Raichle ME. The brain’s default mode network. Annu Rev Neurosci 2015;38:433-47.
39. Gürsel DA, Avram M, Sorg C, et al. Frontoparietal areas link im-pairments of large-scale intrinsic brain networks with aberrant fronto-striatal interactions in OCD: a meta-analysis of resting-state functional connectivity. Neurosci Biobehav Rev 2018;87:151-60.
40. Eryilmaz H, Tanner AS, Ho NF, et al. Disrupted working memory circuitry in schizophrenia: disentangling fMRI markers of core pathology vs other aspects of impaired performance. Neuropsychopharmacology 2016;41:2411.
41. Curcic‐Blake B, van der Meer L, Pijnenborg GH, et al. Insight and psychosis: functional and anatomical brain connectivity and self‐reflection in Schizophrenia. Hum Brain Mapp 2015;36:4859-68.
42. Quirk GJ, Beer JS. Prefrontal involvement in the regulation of emo-tion: convergence of rat and human studies. Curr Opin Neurobiol 2006;16:723-7.
43. Ochsner KN, Silvers JA, Buhle JT. Functional imaging studies of emotion regulation: a synthetic review and evolving model of the cognitive control of emotion. Ann N Y Acad Sci 2012;1251:E1-24.
44. Baxter LR Jr, Saxena S, Brody AL, et al., eds. Brain mediation of obsessive-compulsive disorder symptoms: evidence from func-tional brain imaging studies in the human and nonhuman pri-mate. Semin Clin Neuropsychiatry 1996;1:32-47.
45. Stern ER, Welsh RC, Fitzgerald KD, et al. Hyperactive error re-sponses and altered connectivity in ventromedial and frontoinsular cortices in obsessive-compulsive disorder. Biol Psychiatry 2011; 69:583-91.