altas FINAL(1)
22
BALANCE SHEET AS AT JUNE 30, 2010 2010 2010 ASSETS in 000 EQUITY AND LIABILITIES in 000 NON CURRENT ASSETS CAPITAL AND RESERVES 756,339 Authorised Capital - 100,000 Long term deposits 517 Long term loans 270 83,911 757,126 General reserves 375,500 CURRENT ASSETS Unappropriated profit 224,743 22,413 684,154 Stock-in-trade 531,597 Trade debts 100,396 Loans and advances 2,350 - leasehold land 173,786 Deposits and prepayments 5,928 NON CURRENT LIABILITIES Investments 26,224 Deferred liabilities 111,246 Accrued mark-up / interest 195CURRENT LIABILITIES Other receivables - Trade and other payables 368,911 Sales tax - net 31,050 Accrued mark-up / interest 1,245 Advance tax - net 6,792 Short term borrowing - secured 174,598 Cash and bank balances 29,869 Provision for taxation - net - 756,814 544,754 OTHER INFORMATIONS Depereciation charge 54,226,000 Common share outstanding 83,911,000 INVESTOR INFORMATION Earning Per Share 26.52 Market Price Per Share 185.13 Book Value Per Share 81.53 Cash flow per share 3 Property, plant and Investments - Available for 10,000,000 ordinary shares of 10 each Issued, subscribed and paid up capital 8,391,094 ordinary shares of 10 each Stores, spares and loose SURPLUS ON REVALUATION OF PROPERTY, PLANT AND EQUIPMENT 1,513,94 0 1,513,94 0
-
Upload
abeer-m-pirzada -
Category
Documents
-
view
217 -
download
0
Transcript of altas FINAL(1)

8/8/2019 altas FINAL(1)
http://slidepdf.com/reader/full/altas-final1 1/22
BALANCE SHEET
AS AT JUNE 30, 2010
2010 2010
ASSETS in 000 EQUITY AND LIABILITIES in 000
NON CURRENT ASSETS CAPITAL AND RESERVES
756,339 Authorised Capital
- 100,000Long term deposits 517
Long term loans 270 83,911757,126 General reserves 375,500
CURRENT ASSETS Unappropriated profit 224,743
22,413 684,154
Stock-in-trade 531,597
Trade debts 100,396
Loans and advances 2,350 - leasehold land 173,786
Deposits and prepayments 5,928 NON CURRENT LIABILITIESInvestments 26,224 Deferred liabilities 111,246
Accrued mark-up / interest 195CURRENT LIABILITIES
Other receivables - Trade and other payables 368,911
Sales tax - net 31,050 Accrued mark-up / interest 1,245
Advance tax - net 6,792 Short term borrowing - secured 174,598
Cash and bank balances 29,869 Provision for taxation - net -
756,814 544,754
OTHER INFORMATIONS
Depereciation charge 54,226,000
Common share outstanding 83,911,000
INVESTOR INFORMATION
Earning Per Share 26.52
Market Price Per Share 185.13
Book Value Per Share 81.53
Cash flow per share 3
Property, plant and
Investments - Available for 10,000,000 ordinary shares of 10eachIssued, subscribed and paid upcapital8,391,094 ordinary shares of 10each
Stores, spares and loose
SURPLUS ON REVALUATION OFPROPERTY, PLANT AND EQUIPMENT
1,513,94
0
1,513,940

8/8/2019 altas FINAL(1)
http://slidepdf.com/reader/full/altas-final1 2/22
8/8/2019 altas FINAL(1)
http://slidepdf.com/reader/full/altas-final1 3/22
PROFIT AND LOSS ACCOUNTFOR THE YEAR ENDED JUNE 30, 2010
2010
in 000
Sales 4,024,422
Cost of sales -3,433,222Gross profit 591,200
Distribution cost -128,861
Administrative expenses -80,548
Other operating income 5,258
Other operating expenses -25,903
Profit from operations 361,146
Finance cost -19,857
Profit before tax 341,289
Taxation -118,755
Profit after tax 222,534Other comprehensive income -
222,534
Basic & Diluted earnings per share 26.52
Total comprehensive income for theyear

8/8/2019 altas FINAL(1)
http://slidepdf.com/reader/full/altas-final1 4/22

8/8/2019 altas FINAL(1)
http://slidepdf.com/reader/full/altas-final1 5/22
CASH FLOW STATEMENTFOR THE YEAR ENDED JUNE 30, 2010
2010
in 000
CASH FLOWS FROM OPERATING ACTIVITIES 190,487CASH FLOWS FROM INVESTING ACTIVITIES 406,363
Fixed capital expenditure -177,831
Investments acquired -210,700
2,867
Proceeds from disposal of investments 194,227
Cash used in investing activities -191,437
Net cash flow before financing activities -950
FINANCING ACTIVITIES
Increase / (decrease) in short term borrowing 70,982
Dividend paid -69,055Net cash generated / (used) from financing activities 1,927
Increase/(decrease) / in cash & cash equivalent 977
28,892
Cash and cash equivalent as at June 30 29,869
Proceeds from disposal of property, plant and
Cash and cash equivalent as at the beginning of the

8/8/2019 altas FINAL(1)
http://slidepdf.com/reader/full/altas-final1 6/22

8/8/2019 altas FINAL(1)
http://slidepdf.com/reader/full/altas-final1 7/22
2010
in "000"
Liquidity Ratios
Current Ratio:
Current Assets 756,814
Current Liabilities 544,7541.39
Quick Ratio:
Current Assets - Inventories 225,217
Current Liabilities 544,754
0.41
Asset Management Ratio
Inventory Turn over Ratio:
Sales 4,024,422
inventories 531,597
7.57Days Sales Outstanding:
Account Receivable 100,396
Annual sales/365 11025.81
9.11
Fixed Assets Turn over Ratio:
Sales 4,024,422
Net fixed assets 757,126
5.32
Total Assets Turn over Ratio:
Sales 4,024,422
Total Assets 1,513,940
2.66
Debt Management Ratio
Debt Ratio:
Total Debt 100,396
Total Assets 1,513,940
6.6%
Time Interest Earned Ratio:
EBIT 341,289
Interest Charges 19,857
17.19
DU Pont Equation
Net Income 222,534
Equity 684,154
0.33

8/8/2019 altas FINAL(1)
http://slidepdf.com/reader/full/altas-final1 8/22
2010
in "000"
Profitability Ratios
Profitability Margin on Sales: Net operating profit after t
Net income 222,534 NOPAT = EBIT ( 1 - tax)
Sales 4,024,422
% 5.5% Net Cash Flow (NCF)Basic Earning Power Ratio:
EBIT 361,146 Net income + Depreciation
Total Assets 1,513,940
% 23.9% Operating Cash Flow (OCF)
Return on Total Assets:
Net income 222,534 NOPAT+ depreciation
Total Assets 756,814
% 29.4% Net operating working cap
Return on Common Equity:
Net income 222,534 Current assets-Current Laibilit
Common Equity 83,911% 265.2% Operating Capital (OC)
Market Value Ratios
Price Earning Ratio: Net operating working capital
Price Per Share 185.13
Earnings Per Share 26.52 Free Cash Flow (FCF)
(Times) 6.98
Price/Cash flow Ratio: NOPAT- ( Change in operating
Price Per Share 185.13
Cash flow per share 3.30 Market Value Added (MVA)
56.13
Market Book Ratio: ( Market price per share* # o
Market Price Per Share 185.13
Book Value Per Share 81.53
(Times) 2.27
8/8/2019 altas FINAL(1)
http://slidepdf.com/reader/full/altas-final1 9/22
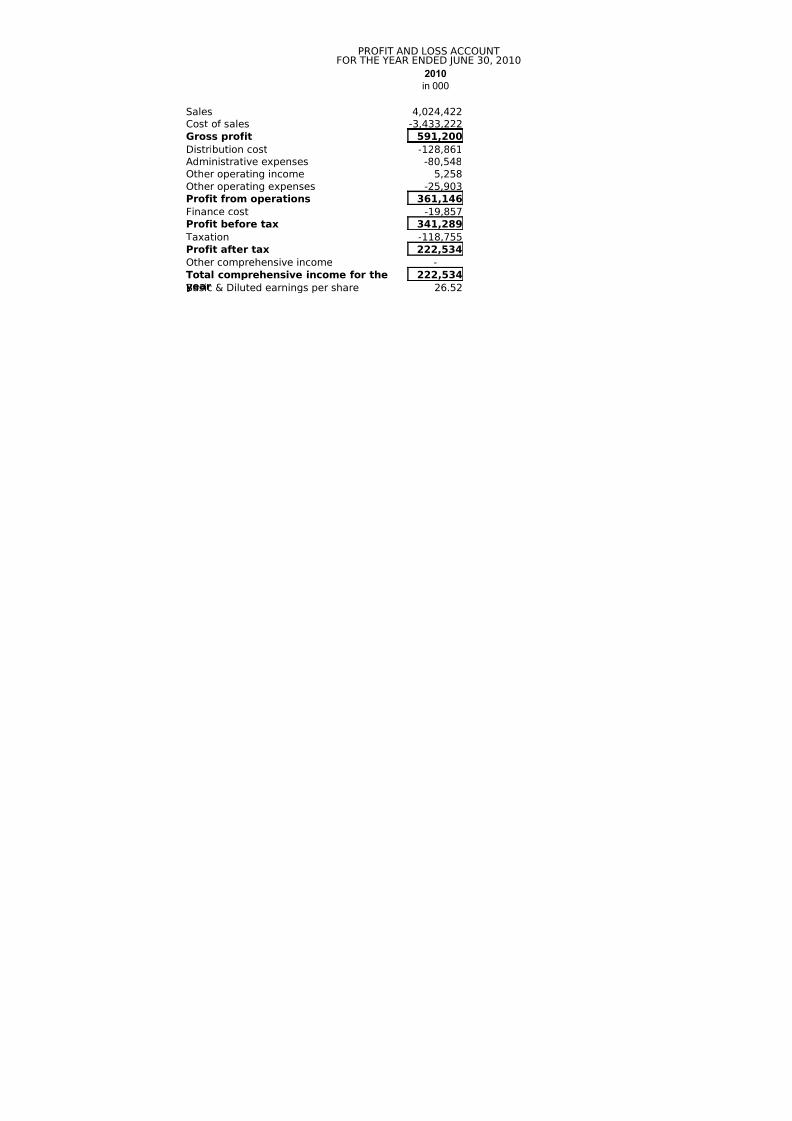
2010
in 000
Liquidity Ratios
ax (NOPAT) Current Ratio
221,838 Quick Ratio
Asset Management Ratios
Inventory Turnover RatioDays Sales Outstanding
276,760 Fixed Assets Turnover Ratio
Total Assets Turnover Ratio
Debt Management Ratios
Debt Ratio
276,760 Times-Interest-Earned Ratio
tal(NOWC) Profitability Ratios
Profit Margin on Sales
ies 212,060 Basic Earning Power Ratio
Return on Total AssetsReturn on Common Equity
Market Value Ratios
Net fixed assets 969,186 Price/Earning Ratio
Price/Cashflow Ratio
Market/Book Ratio
working Capital) 9,778 Other Calculations
Net Operating profit After Tax - NOPAT
Net Operating Working Capital - NOWC
Operating Cash Flow - OCF
f shares)- B.V of Equity 869,247,277 Net Cash Flow - NCF
Market Value Added - MVA
8/8/2019 altas FINAL(1)
http://slidepdf.com/reader/full/altas-final1 10/22
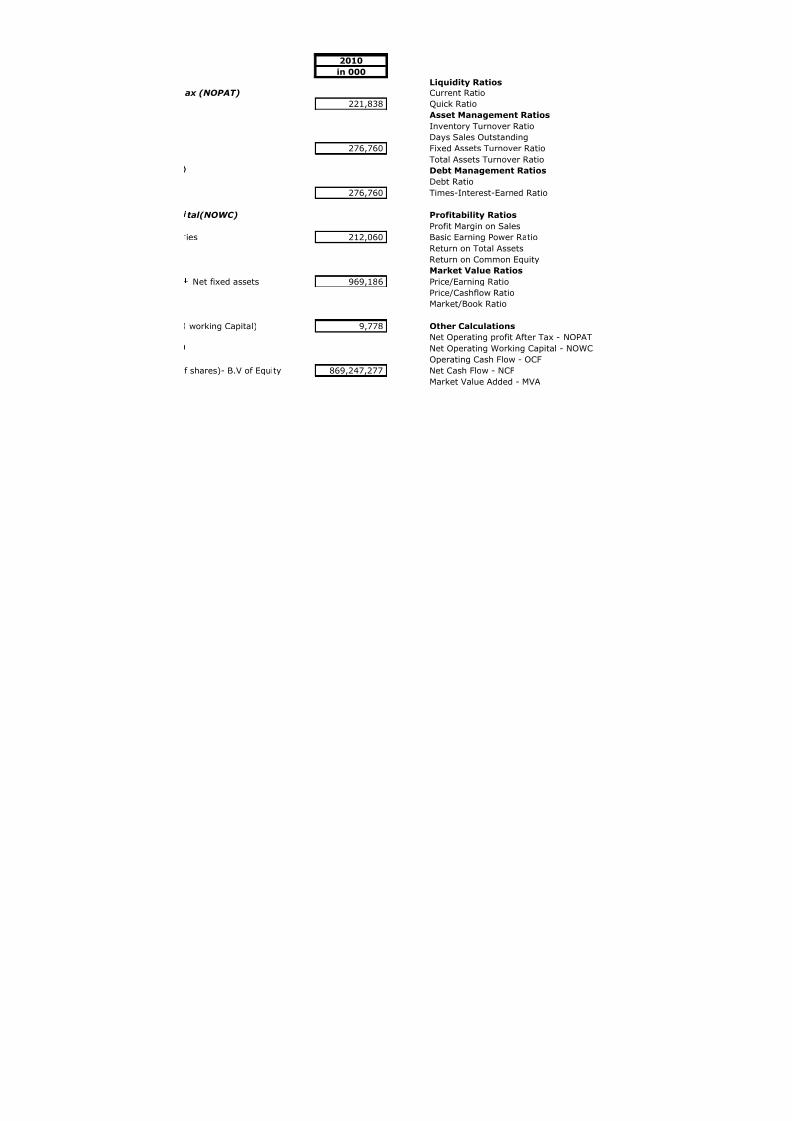
Abbott
1.39
0.41
7.579.11
5.32
2.66
6.6%
17.19
5.5%
23.9%
29.4%265.2%
6.98
56.13
2.27
221837.9
212060.0
276760.0
276760.0
869247276.8

8/8/2019 altas FINAL(1)
http://slidepdf.com/reader/full/altas-final1 11/22
Part I Dividend Growth Model
=
Po 185.13
working
2006 2007 2008 2009
total dividend distributed 11290000 15669000 36046000 51671000
total number of shares 52874000 60805000 69926000 69926000
dividend per share 0.21 0.26 0.52 0.74
Year sales difference growth in sales net profit
2006 1209033000 41323000
2007 1585648000 376615000 31.15% 87510000
2008 2628820000 1043172000 65.79% 106797000
2009 3156807000 527987000 20.08% 177678000
2010 4024422000 867615000 27.48% 222534000
Average Growth (g) 36.13%
Year EPS difference growth in EPS
2006 7.82
2007 14.39 6.57 84.02%
2008 15.27 0.88 6.12%
2009 25.41 10.14 66.40%
2010 26.52 1.11 4.37%
Average Growth 40.23%
I have selected the growth with repsect to sales
Overall Po with respect to average growth and dividend as per 2010.
Ks= 36.73%
The corporate Value Model
Do(1+g)/K
s-g

8/8/2019 altas FINAL(1)
http://slidepdf.com/reader/full/altas-final1 12/22
Part II FCF/(1+WACC)
164729173.47
working for free cash flow
EBIT NOPAT Current Assets Current Liabilities Ne
2003 818000000 531700000
2004 1080000000 702000000
2005 1366000000 887900000
2006 1440000000 936000000
2007 1744197000 1133728050 3129129000 881681000
2008 544822000 354134300 3421308000 1346771000
Dividend Yield Capital G
Part III 0.61%
Working
1.12
Total Return (Ks) = Dividend yield+Capital gain yield
0.72%+10.57%
36.73%
Vcompany
Dividend Yield = D1/P
0Capital Gain Yie
D1 = D0 (1+g)1 P1 = P0 (1+g)

8/8/2019 altas FINAL(1)
http://slidepdf.com/reader/full/altas-final1 13/22
WACC Book Value WACC Market Value
0 + 36.73188255498390% 0 +
WACC= 36.73% WACC= 36.73%
working Book Value Working Market Value
2010
Kd Kd
Kp Kp
Ks 36.73% Ks
% age of total
long term debt Wd 0 0.00% long term debt Wd
commmon stock Wc 83911000 100.00% Common Stock (market Value) W1
total 83911000
W1
No of Shares 8
Po
market value of Wc
WACC = wdk
d(1-T) + w
pk
p+ w
ck
sWACC = w
dk
d(1-T) + w
pk
p+ w

8/8/2019 altas FINAL(1)
http://slidepdf.com/reader/full/altas-final1 14/22

8/8/2019 altas FINAL(1)
http://slidepdf.com/reader/full/altas-final1 15/22
Cost 50,000,000
Shipping 1,000,000
Installation 3,000,000
Total cost 54,000,000
Life (Years) 10
Market Value 1,000,000
Annual sales 50,000
Price / Unit 2,000
Cost / Unit 1,200
NOWC 29.4%
Tax 39%
WACC 36.73%
Growth / Year 40.23%
0 1
Units sold 50,000
Unit price 2,000
Unit cost (1,200)
sales 100,000,000
costs (60,000,000)
NOWC (29,400,000) (11,827,620)Depreciation (5,400,000)
EBIT 22,772,380
Tax @ 39% (8,881,228)
NOPAT 13,891,152
NOCF 19,291,152
Salvage
Capital G / L
Tax on salvageNet CF -
Terminal CF (83,400,000) 19,291,152
Incremental CF (64,108,848)

8/8/2019 altas FINAL(1)
http://slidepdf.com/reader/full/altas-final1 16/22
NPV 115,799,302
IRR 55%
MIRR 47%
n the basis of these values of NPV and IRR the pr

8/8/2019 altas FINAL(1)
http://slidepdf.com/reader/full/altas-final1 17/22
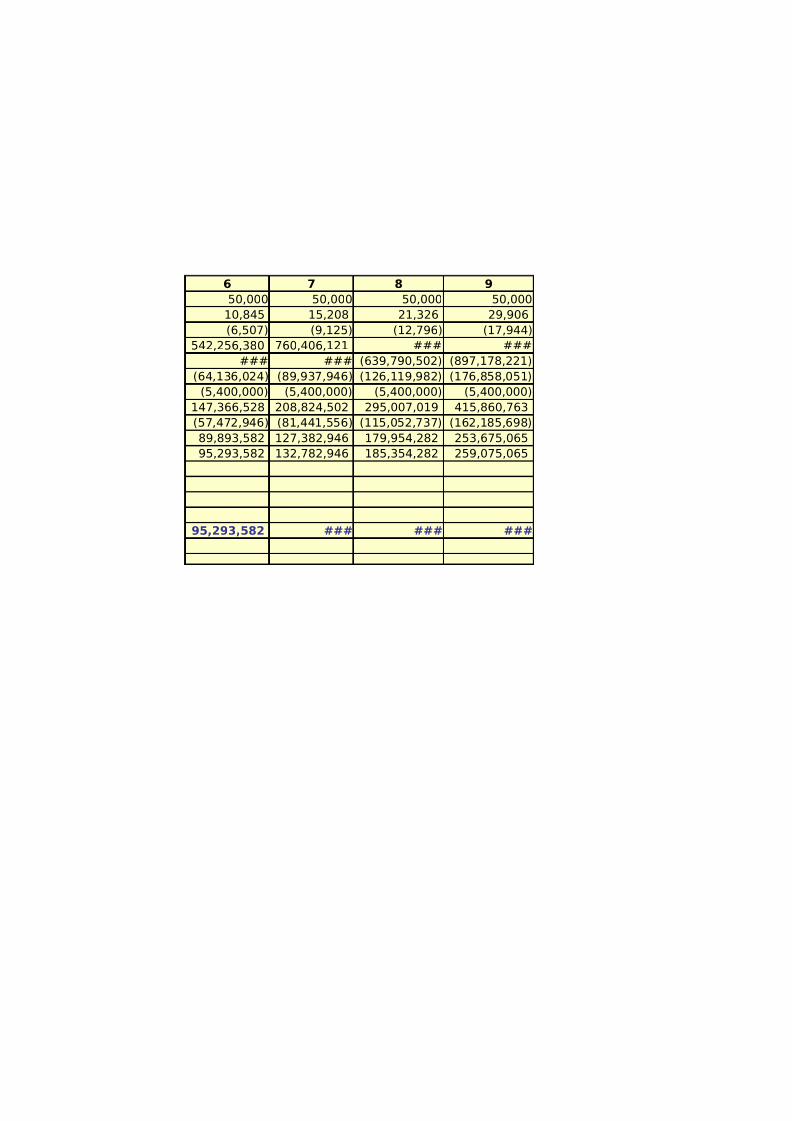
5,400,000
(straight line)
2 3 4 5
50,000 50,000 50,000 50,000
2,805 3,933 5,515 7,734
(1,683) (2,360) (3,309) (4,640)
140,230,000 196,644,529 275,754,623 386,690,708
(84,138,000) (117,986,717) ### ###
(16,585,872) (23,258,368) (32,615,209) (45,736,308)(5,400,000) (5,400,000) (5,400,000) (5,400,000)
34,106,128 49,999,444 72,286,640 103,539,976
(13,301,390) (19,499,783) (28,191,790) (40,380,591)
20,804,738 30,499,661 44,094,851 63,159,385
26,204,738 35,899,661 49,494,851 68,559,385
-
26,204,738 35,899,661 49,494,851 68,559,385
(37,904,110)

8/8/2019 altas FINAL(1)
http://slidepdf.com/reader/full/altas-final1 18/22
ject should be accepted as NPV is positive and the IRR is also
8/8/2019 altas FINAL(1)
http://slidepdf.com/reader/full/altas-final1 19/22

8/8/2019 altas FINAL(1)
http://slidepdf.com/reader/full/altas-final1 20/22
8/8/2019 altas FINAL(1)
http://slidepdf.com/reader/full/altas-final1 21/22
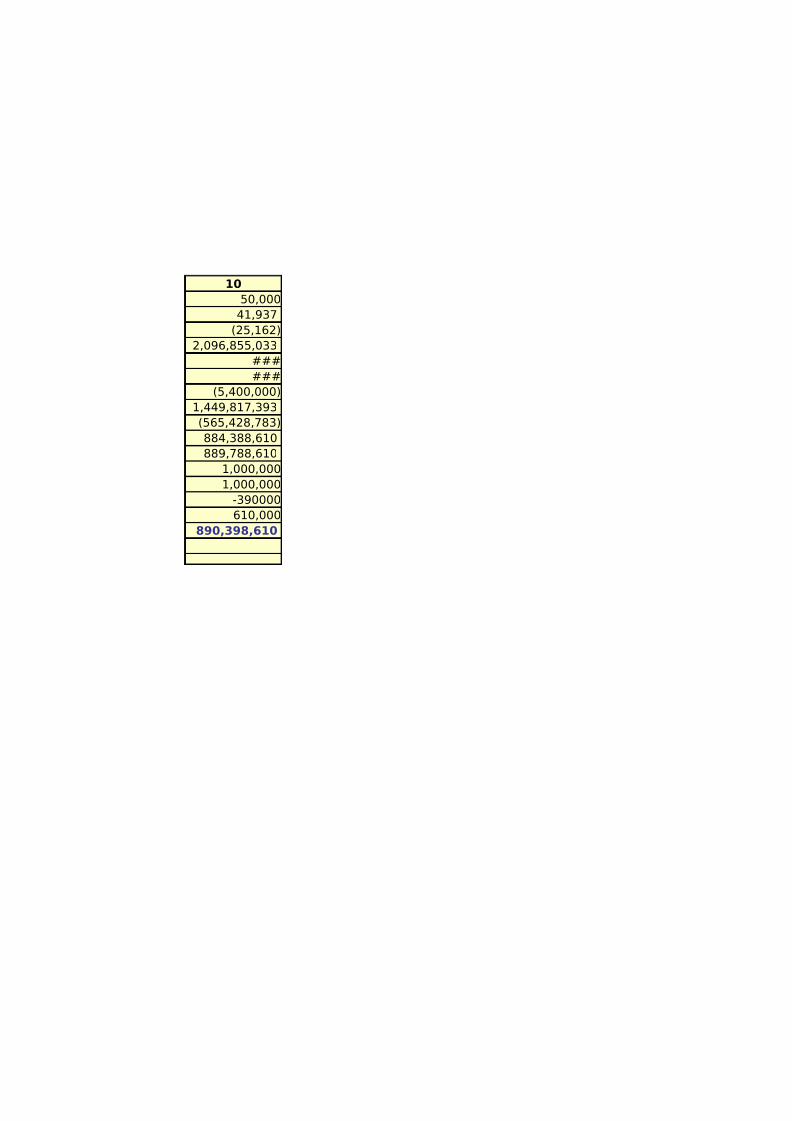
10
50,000
41,937
(25,162)
2,096,855,033
###
###(5,400,000)
1,449,817,393
(565,428,783)
884,388,610
889,788,610
1,000,000
1,000,000
-390000610,000
890,398,610

8/8/2019 altas FINAL(1)
http://slidepdf.com/reader/full/altas-final1 22/22