Alstom Renewable Power Analyst Day · Alstom Renewable Power Analyst Day ... (Global Power Sales)...
49
Alstom Renewable Power Analyst Day Nantes 28 th February 2013 Jérôme Pécresse
Transcript of Alstom Renewable Power Analyst Day · Alstom Renewable Power Analyst Day ... (Global Power Sales)...
Alstom Renewable PowerAnalyst Day
Nantes28th February 2013
Jérôme Pécresse

Agenda
I. Renewable Power within Alstom
IV. Hydro
V. Wind
II. Renewable market
P 2
VI. New Energies
VII. Conclusion
III. Financials

Renewable Power Sector creation
• Sector created in July 2011
• Agile organisation with empowermentand leaner decision-making processes
Renewable Power Saleswithin Alstom Group
10%
Rest of Alstom
90%
Renewable Power
P 3 Source: Alstom
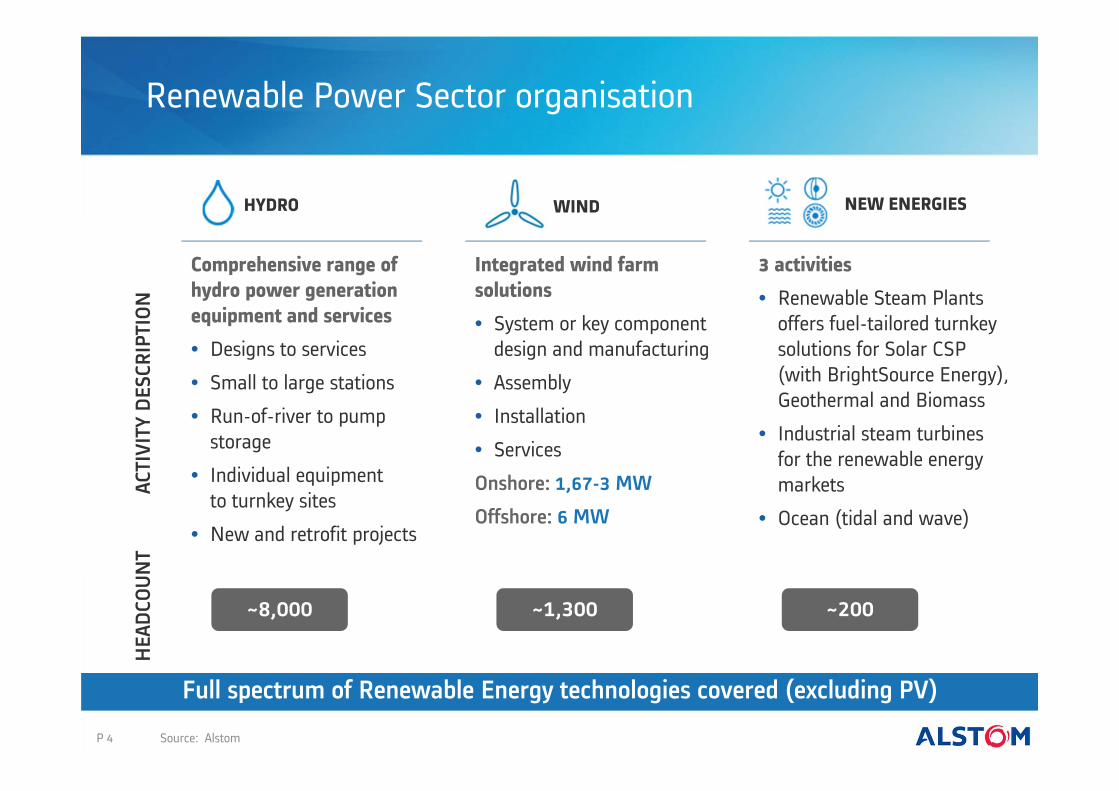
Renewable Power Sector organisation
HYDRO WIND NEW ENERGIES
Comprehensive range of hydro power generation equipment and services
• Designs to services
• Small to large stations
• Run-of-river to pump storage
• Individual equipmentto turnkey sites
• New and retrofit projects
3 activities
• Renewable Steam Plants offers fuel-tailored turnkey solutions for Solar CSP (with BrightSource Energy), Geothermal and Biomass
• Industrial steam turbinesfor the renewable energy markets
• Ocean (tidal and wave)
Integrated wind farm solutions
• System or key component design and manufacturing
• Assembly
• Installation
• Services
Onshore: 1,67-3 MW
Offshore: 6 MW
ACTI
VITY
DES
CRIP
TION
HEA
DCO
UNT
P 4
~8,000 ~1,300 ~200
Source: Alstom
Full spectrum of Renewable Energy technologies covered (excluding PV)
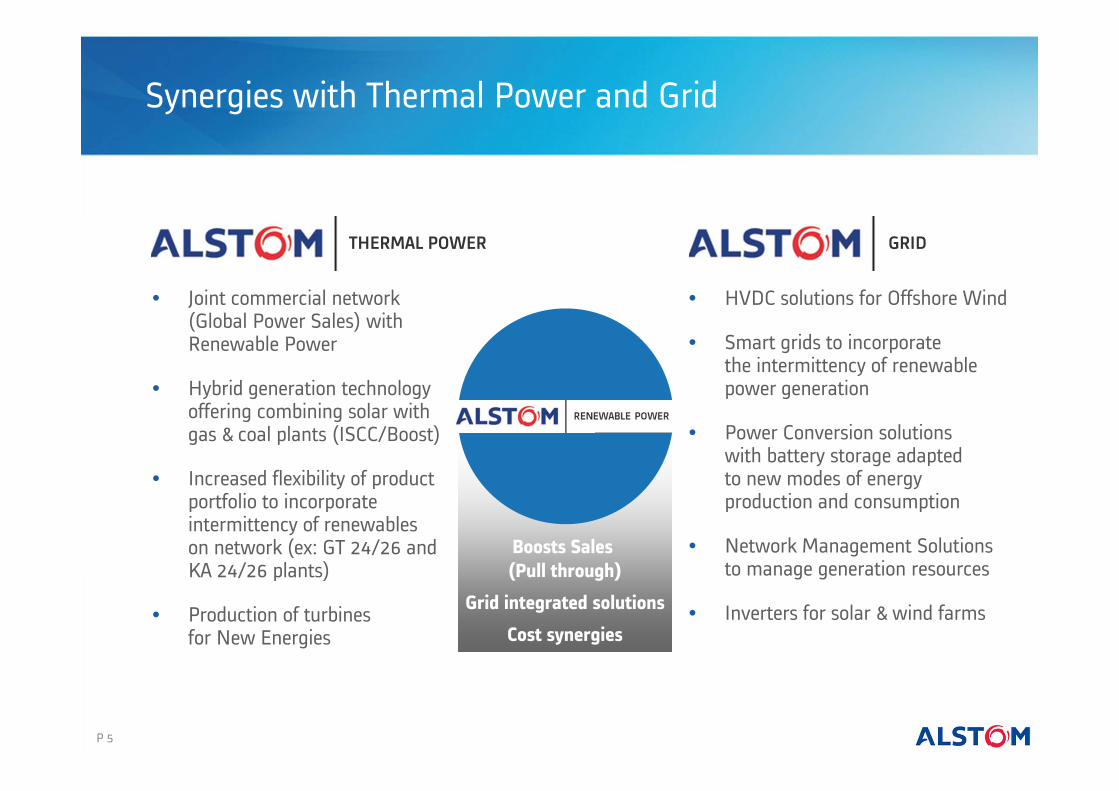
Synergies with Thermal Power and Grid
THERMAL POWER
• Joint commercial network (Global Power Sales) with Renewable Power
• Hybrid generation technology offering combining solar with gas & coal plants (ISCC/Boost)
• Increased flexibility of product portfolio to incorporate intermittency of renewableson network (ex: GT 24/26 and KA 24/26 plants)
• Production of turbinesfor New Energies
• HVDC solutions for Offshore Wind
• Smart grids to incorporatethe intermittency of renewable power generation
• Power Conversion solutionswith battery storage adaptedto new modes of energyproduction and consumption
• Network Management Solutionsto manage generation resources
• Inverters for solar & wind farms
P 5
GRID
Boosts Sales (Pull through)
Grid integrated solutions
Cost synergies
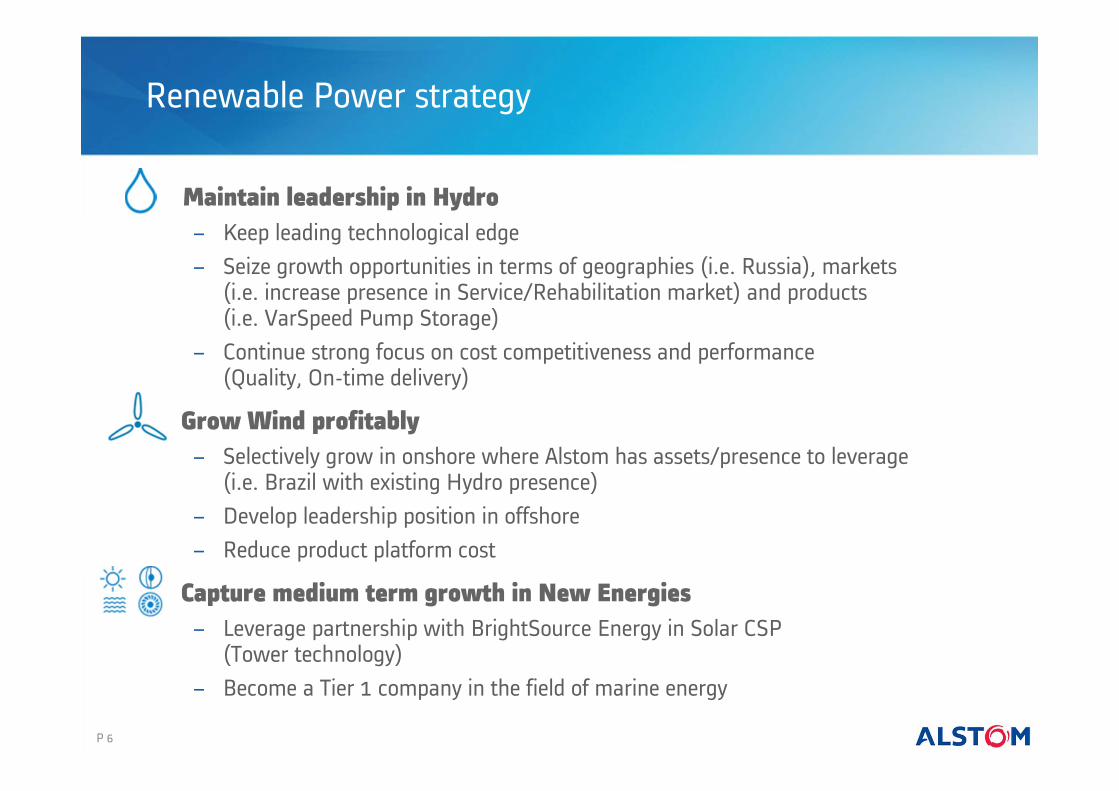
Renewable Power strategy
Maintain leadership in Hydro − Keep leading technological edge− Seize growth opportunities in terms of geographies (i.e. Russia), markets
(i.e. increase presence in Service/Rehabilitation market) and products(i.e. VarSpeed Pump Storage)
− Continue strong focus on cost competitiveness and performance(Quality, On-time delivery)
Grow Wind profitably− Selectively grow in onshore where Alstom has assets/presence to leverage
(i.e. Brazil with existing Hydro presence)− Develop leadership position in offshore − Reduce product platform cost
Capture medium term growth in New Energies − Leverage partnership with BrightSource Energy in Solar CSP
(Tower technology) − Become a Tier 1 company in the field of marine energy
P 6
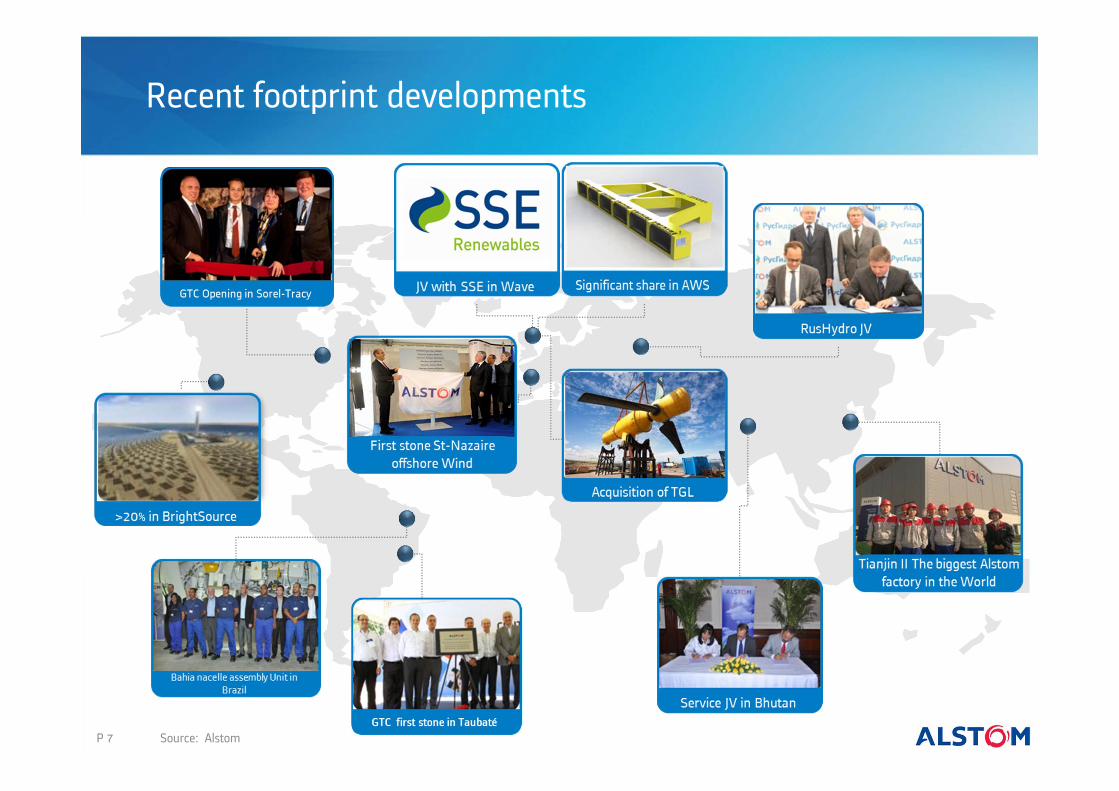
Recent footprint developments
P 7 Source: Alstom
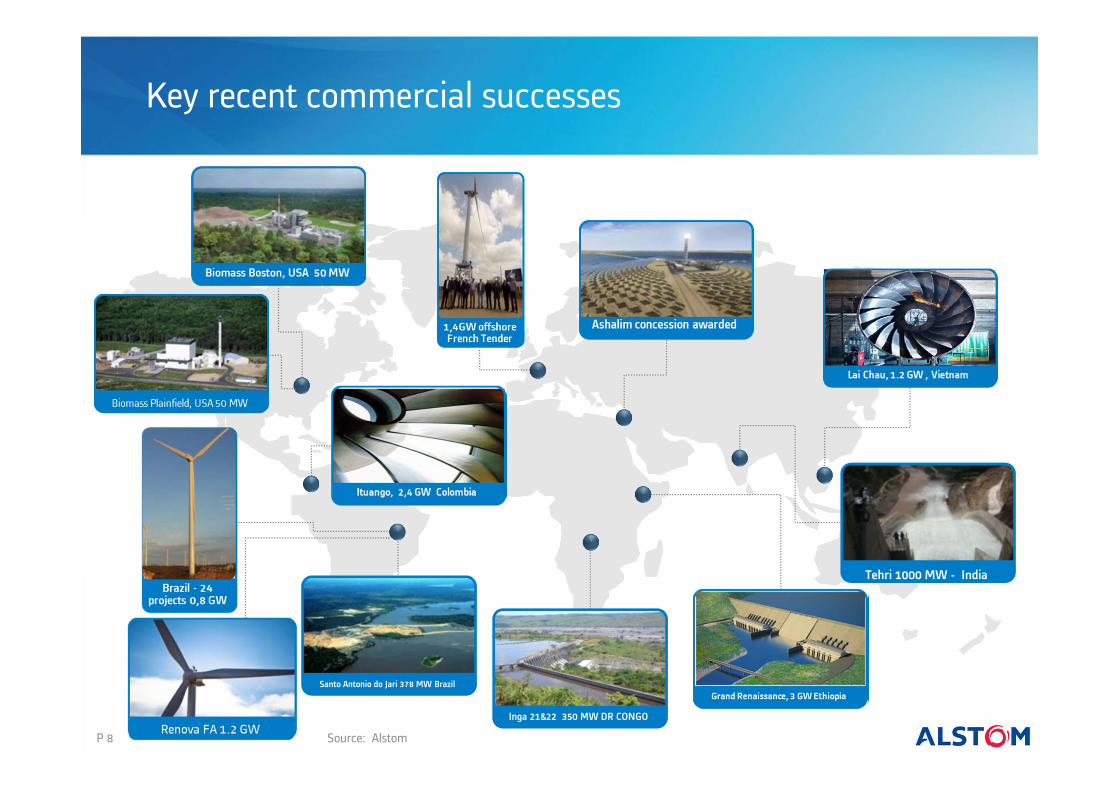
Key recent commercial successes
P 8
Santo Antonio do Jari 378 MW Brazil
Tehri 1000 MW - India
Source: Alstom
Inga 21&22 350 MW DR CONGO

Agenda
P 9
I. Renewable Power within Alstom
IV. Hydro
V. Wind
II. Renewable market
VI. New Energies
VII. Conclusion
III. Financials
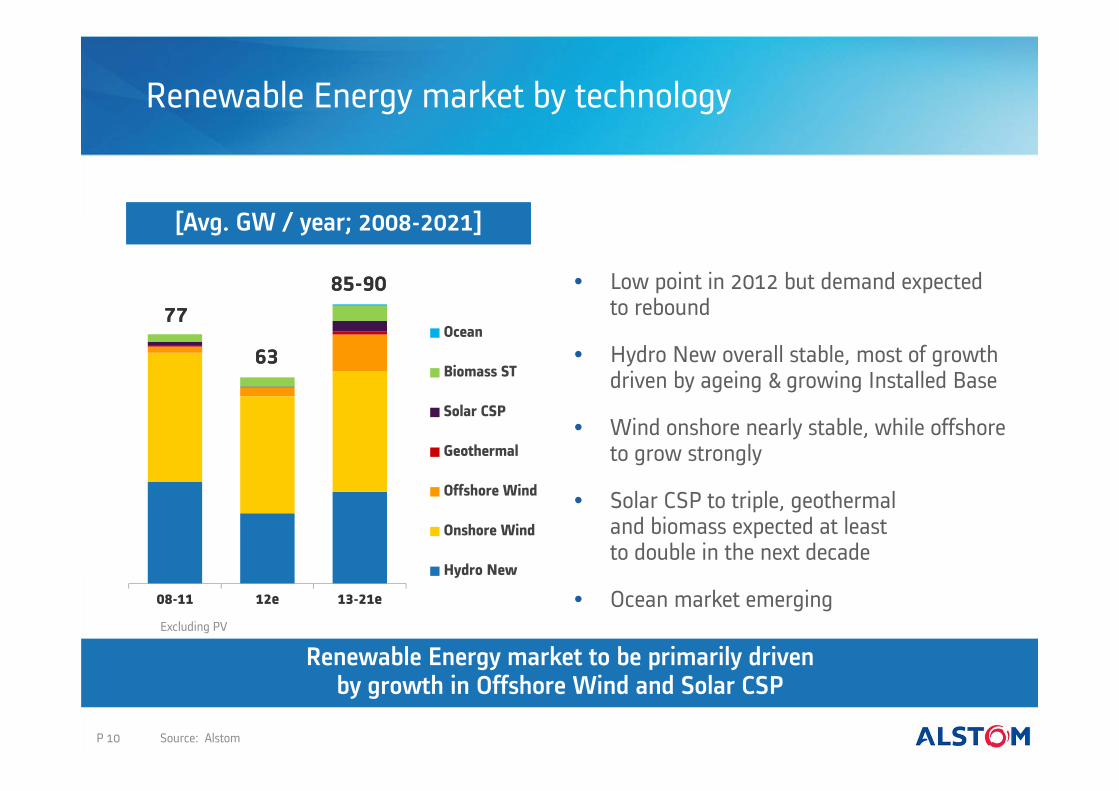
Renewable Energy market by technology
P 10
[Avg. GW / year; 2008-2021]
Renewable Energy market to be primarily drivenby growth in Offshore Wind and Solar CSP
0
100
08-11 12e 13-21e
Ocean
Biomass ST
Solar CSP
Geothermal
Offshore Wind
Onshore Wind
Hydro New
777785-9085-90
Excluding PV
6363
• Low point in 2012 but demand expectedto rebound
• Hydro New overall stable, most of growth driven by ageing & growing Installed Base
• Wind onshore nearly stable, while offshore to grow strongly
• Solar CSP to triple, geothermaland biomass expected at leastto double in the next decade
• Ocean market emerging
Source: Alstom

08-11 12e 13-21e
China
Oceania
India
Asia
LAM
NAM
MEA
Russia & CIS
Europe
Renewable Energy market by geography
P 11
[Avg. GW / year; 2008-2021]
• Most regions to increase
• China to sustain growth and represent almost half of the market
• Fewer very large hydro projects in LAMbut more wind to come
• Europe growth driven by offshore wind
Growth to come largely from Europe, MEA and China
Excluding PV
777785-9085-90
6363
Source: Alstom
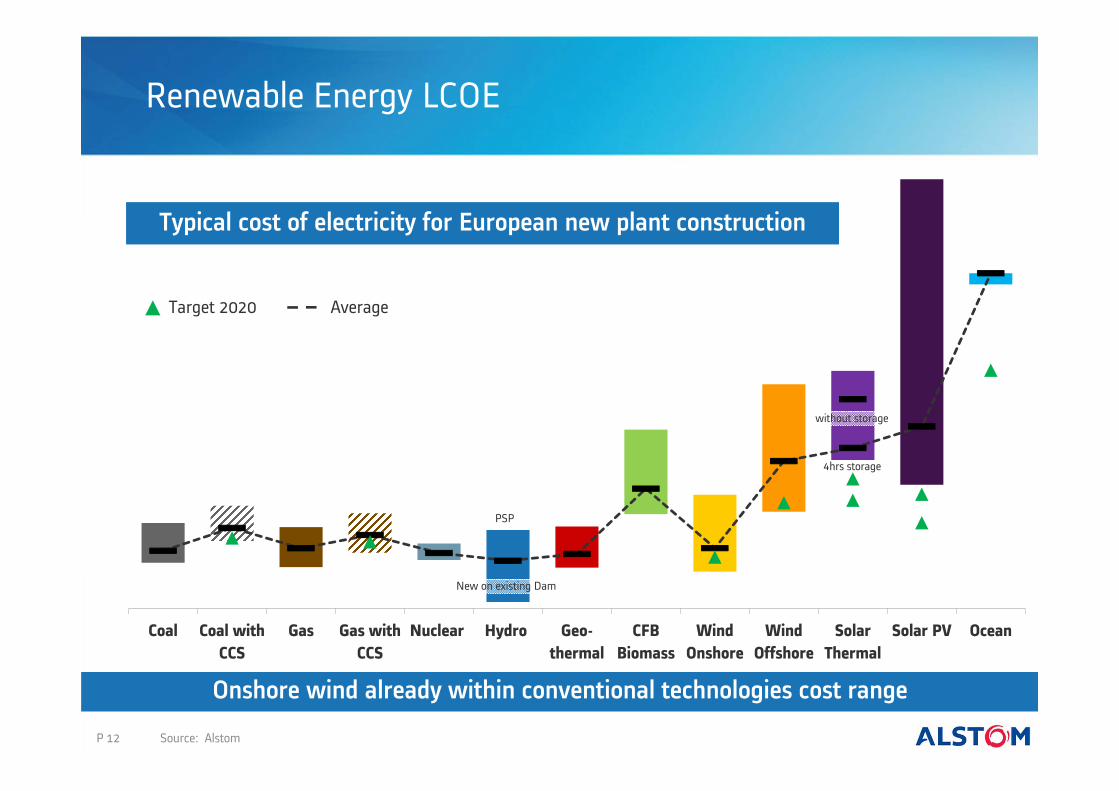
Renewable Energy LCOE
Onshore wind already within conventional technologies cost range
Coal Coal withCCS
Gas Gas withCCS
Nuclear Hydro Geo-thermal
CFBBiomass
WindOnshore
WindOffshore
SolarThermal
Solar PV Ocean
without storage
PSP
Target 2020
4hrs storage
New on existing Dam
Average
P 12
Typical cost of electricity for European new plant construction
Source: Alstom

Agenda
P 13
I. Renewable Power within Alstom
IV. Hydro
V. Wind
II. Renewable market
VI. New Energies
VII. Conclusion
III. Financials

Order growth vs. market growth
1,936 2,026
1,324 1,218
FY 10/11 FY 11/12 FY 11/12 9m FY 12/13 9m
-8%
P 14
Excluding PV
Low level of market due to project delays (permitting ,etc …)Good resistance of the order book in a difficult market environment
Orders [€ million] Renewable Power market [GW]
63
36
9m 2011 9m 2012
-43%
Source: Alstom

Orders by geography and business
78%
20% 2%New EnergiesWind
Hydro
13%
18%
10%
12%11%
37%MEA
NorthAmerica
EasternEurope
Asia / PacificWestern
Europe
Southand Central
America
P 15
Orders by business [FY 11/12]Orders by geography [FY 11/12]
Geographical and technological diversity allowing better resistanceto specific market downturns
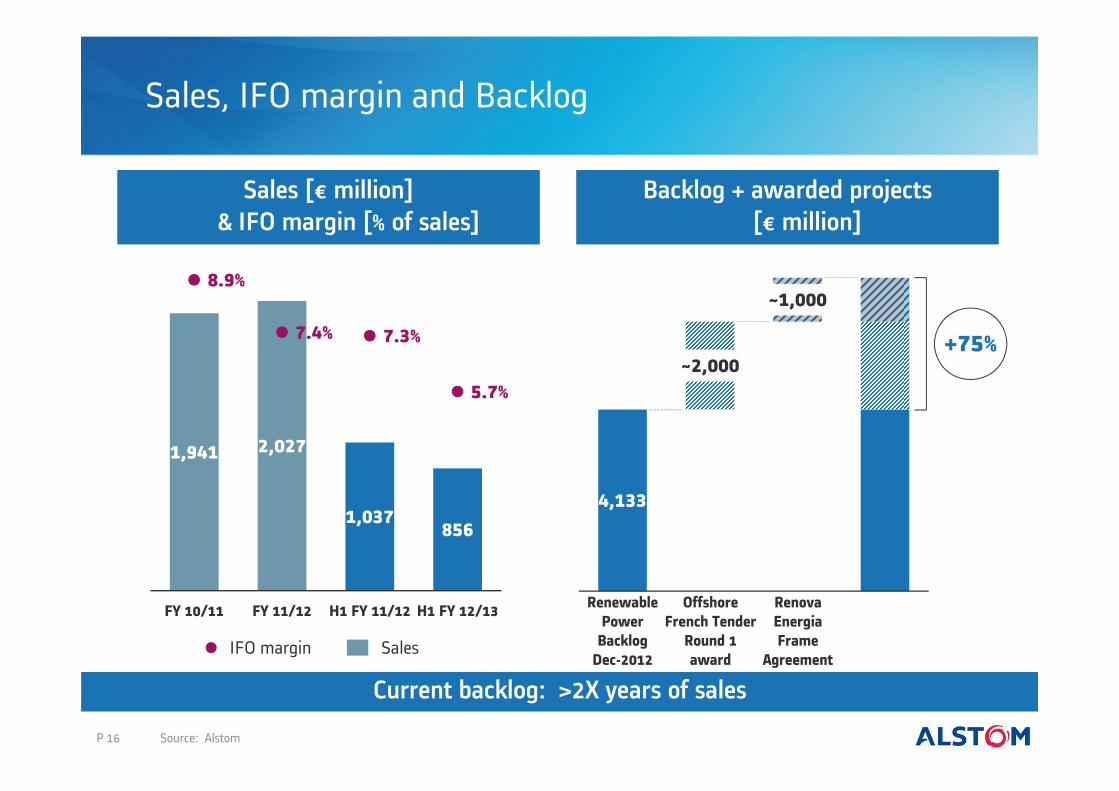
4,133
~2,000
~1,000
Sales, IFO margin and Backlog
RenovaEnergiaFrame
Agreement
OffshoreFrench Tender
Round 1award
RenewablePower
BacklogDec-2012
1,941 2,027
1,037 856
8.9%
7.4% 7.3%
5.7%
0
1
2
3
4
5
6
7
8
9
FY 10/11 FY 11/12 H1 FY 11/12 H1 FY 12/13
SalesIFO margin
P 16
Backlog + awarded projects[€ million]
Sales [€ million]& IFO margin [% of sales]
Current backlog: >2X years of sales
Source: Alstom
+75%

Agenda
P 17P 17
I. Renewable Power within Alstom
IV. Hydro
V. Wind
II. Renewable market
VI. New Energies
VII. Conclusion
III. Financials

Hydro market
P 18
08-11 12e 13-21e
China
Oceania
India
Asia
LAM
NAM
MEA
Russia & CIS
Europe
313127-3227-32
2222
Hydro market by region – New market[Avg. GW / year; 2008-2021] New market
− “Incentive free” and self sustainable new build market, except a few mini-hydro
− Short-term slowdown to be overcomewith China resuming large projects
− China by far the largest market− Fewer very large projects in LAM, but still
a strong market− Pump-Storage to increase in Europe & China
Installed Base− Need for rehabilitations driven by ageing
Installed Base (NAM, Europe, Russia & CIS)− Growing IB and increasing trend for O&M
outsourcing pushing for a solid service market− Half of the overall Hydro Market in value
coming from IB
Strong Hydro market potential in both New build & Retrofit
Source: Alstom

Zoom on Pump-Storage technology
• Increase in grid stability
• Optimisation of power plant fleet and electrical network infrastructures
• High cycle efficiency (~80%)
• Quick response for peak load energy supply
• Environmentally friendly
P 19
Key benefitsHow does a Pump-Storage Plant work ?
Source: Alstom

Alstom Hydro installed base market share
P 20 Source: Alstom
World IB = 1,060 GW
Half of the Hydro Market in value driven by Installed BaseAlstom has # 1 Hydro fleet - ~30 % of World Installed Base*
*ALSTOM supplied Turbine or Generator
ALSTOM
Installed base activityaccounting today
for ~20% of Hydro saleswith significantgrowth potential
Asia98 GW
China230 GW
India43 GW
Russia & Cis68 GW
Europe225 GW
MEA50 GW
NAM169 GW
LAM166 GW
Oceania14 GW
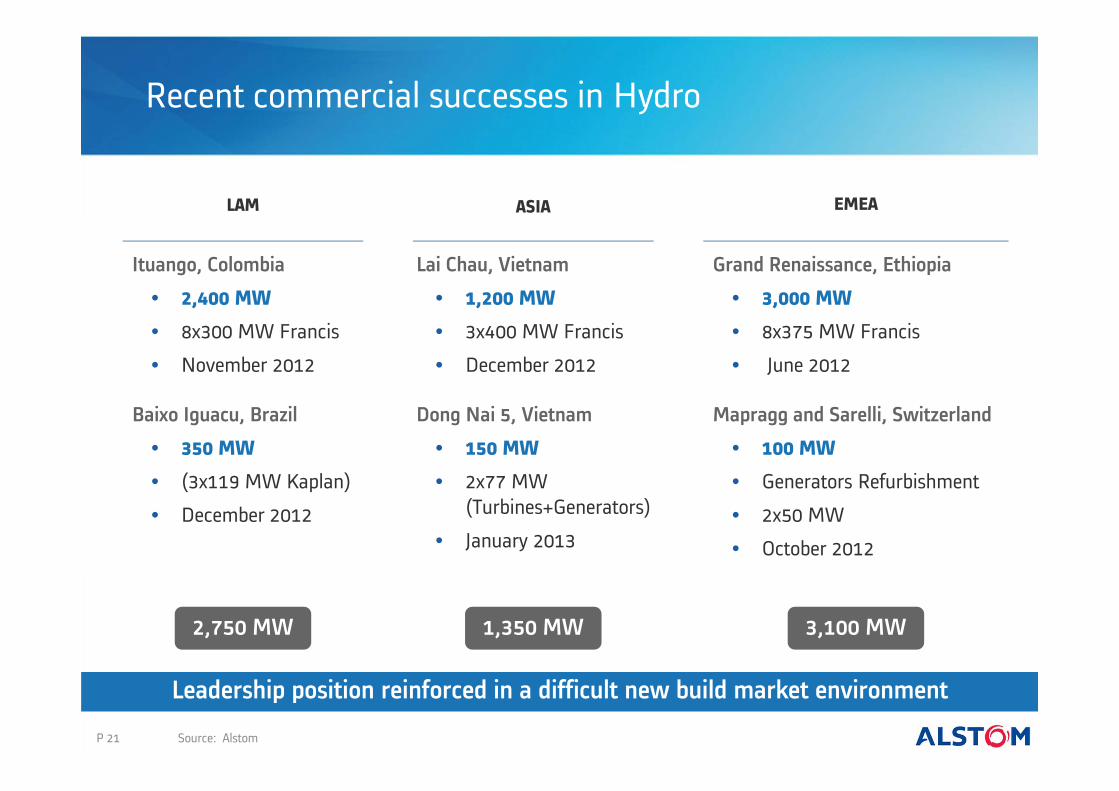
Recent commercial successes in Hydro
P 21
LAM
Ituango, Colombia
• 2,400 MW
• 8x300 MW Francis
• November 2012
Baixo Iguacu, Brazil
• 350 MW
• (3x119 MW Kaplan)
• December 2012
2,750 MW
ASIA
Lai Chau, Vietnam
• 1,200 MW
• 3x400 MW Francis
• December 2012
Dong Nai 5, Vietnam
• 150 MW
• 2x77 MW (Turbines+Generators)
• January 2013
1,350 MW
EMEA
Grand Renaissance, Ethiopia
• 3,000 MW
• 8x375 MW Francis
• June 2012
Mapragg and Sarelli, Switzerland
• 100 MW
• Generators Refurbishment
• 2x50 MW
• October 2012
3,100 MW
Leadership position reinforced in a difficult new build market environment
Source: Alstom

Alstom Hydro industrial base
BRAZIL Taubaté, Hydro - Since 1956- Turbines + Generators
Porto Velho, Hydro - Since 2010- HME
CHINA Tianjin, Hydro Present since 1995 Turbines + Generators
INDIA Baroda, Hydro Since 2004 Turbines + Generators
FRANCE Grenoble, Hydro Since 1917 Turbines
SPAIN Bilbao, Hydro Since 1930 Generators
SWITZERLAND Birr, Hydro Since 1960 Generators
CANADA Tracy, Hydro Since 1950’s Turbines + Generators
Manufacturing sites
RUSSIA• Ufa
P 22
BHUTAN•
Source: Alstom
Good market coverage in key Hydro regionsUnder construction/development
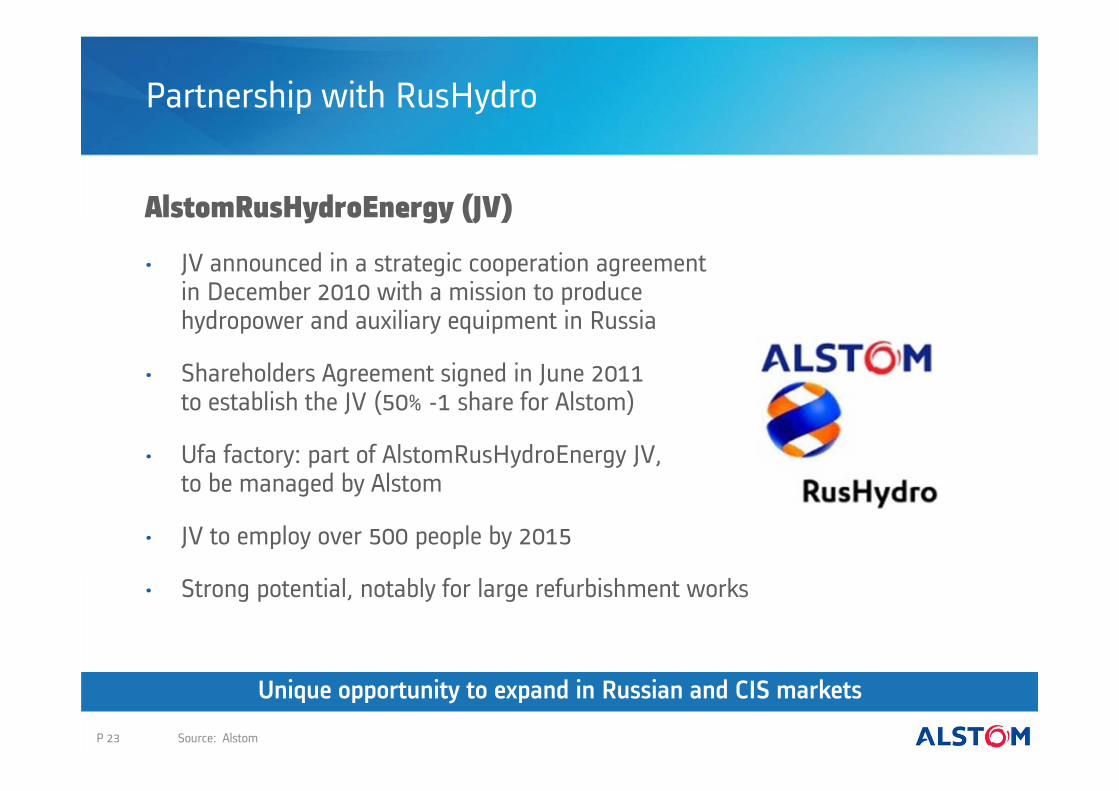
Partnership with RusHydro
AlstomRusHydroEnergy (JV)
• JV announced in a strategic cooperation agreementin December 2010 with a mission to producehydropower and auxiliary equipment in Russia
• Shareholders Agreement signed in June 2011to establish the JV (50% -1 share for Alstom)
• Ufa factory: part of AlstomRusHydroEnergy JV,to be managed by Alstom
• JV to employ over 500 people by 2015
• Strong potential, notably for large refurbishment works
P 23
Unique opportunity to expand in Russian and CIS markets
Source: Alstom

Alstom Hydro products & services offering
• Head: 3 – 25 m• Max. Diameter: 8 m• Axial flow• Horizontal axis• Output < 80 MW
• Head: 10 – 50 m• Max. Diameter: 11 m• Axial flow• Vertical axis• Output < 250 MW
• Head: 30 – 800 m• Runner dia. < 10.6 m• Tangential inlet flow,
axial outlet flow• Vertical or horizontal axis• Output < 1,000 MW
• Head: 200 – 1,800 m• Runner in air• Tangential jet inlet• Vertical or horizontal axis• Output < 350 MW
• Head: from 10 to 1,200 m• Reversible single, double or multi- stage
centrifugal units• Axial, mixed or centrifugal flow• Output < 500 MW
BULB
KAPLAN
FRANCIS
PELTON
PUMP TURBINE
• Small, medium and large generators(up to 1,000 MVA)
• Hydro Mechanical Equipment (valves, gates, penstocks, lifting equipment, pipes, pumps)
• Control systems (>250 references)• Balance of Plant, Electrical/Mechanical
engineering/ systemsOTHER
P 24
Full spectrum of the hydro market covered
Source: Alstom

Adapting to market environment
• Price pressure since 2010 with some limitedrecent signs of stabilisation
• Rationalisation of the European footprintlaunched, starting with the groupingof most French Hydro engineeringand support activities in Grenoble
• Initiatives launched to optimise the full hydrocost base: focus on sourcing, product management, engineering, manufacturing, reduction of non quality costs and S&A
• Continued investment in R&D/Innovation with technical centresin Grenoble (turbines) and Birr (generators) and regional outfitsin all worldwide production locations
P 25
Ongoing cost optimisation to deal with challenging market environment and progressively improve margin levels

Agenda
P 26
I. Renewable Power within Alstom
IV. Hydro
V. Wind
II. Renewable market
VI. New Energies
VII. Conclusion
III. Financials

Wind market
P 27
Onshore− Tightening market & overcapacity − Local content requirement in emerging markets
(Brazil, Morocco, Saudi Arabia, South Africa,…)− Repowering opportunities in mature markets
(Germany, USA, Spain)− Push for larger & more efficient products
(high towers, large rotors)− Wind O&M market size growing (x3 by 2021)
08-11 12e 13-21e
ChinaOceaniaIndiaAsiaLAMNAMMEARussia&CISEurope
08-11 12e 13-21e
ChinaOceaniaIndiaAsiaLAMNAMMEARussia&CISEurope
5% of total Wind Market
>20% of total Wind Market
4040
22
35-4035-40
9-119-11
3535
33
Onshore Wind market by region[Avg. GW / year; 2008-2021]
Source: Alstom
Offshore to drive market growth, local opportunities in Onshore
Offshore− Europe (UK, North Sea, France) & China
on the forefront of offshore developments− Few players with ready-to-market products
Offshore Wind market by region[Avg. GW / year; 2008-2021]

050
100150200
2004 2006 2008 2010 2012
Increase in overcapacity in 2012− Uncertain/revamped renewables
support policies(e.g. Spain, Italy, UK, USA)
− Tight financing conditions
Local content requirement in new countries (Brazil, Morocco, KSA, RSA,…) likely to contribute to global capacity build-up
Supply-demand gap expected to narrow thanks to increasing demand and decisions to take some capacity out
Wind market current dynamics
0%
20%
40%
60%
80%
100%
2013e20122011
Demand
Supply
Average regional prices excluding China
P 28
Nacelle capacity vs. Demand[2011 - 2013]
Price evolution[2004-2012; BASE 100 = 2004]
Source: Alstom
Overcapacity still putting pressure on prices but some recent stabilisation observed

>10 MW
Alstom well positioned to address Wind market
Fit with Alstom’s core competencies− Designer-integrator business− Innovation business− Increasing technological content− Strong project management
competencies− Developing service activity
Success factors
− Global commercial network
− Access to a broad range of Utilities clients worldwide
− Strong global mastery of technologyat the heart of Alstom’s know-how (generators with/without gearboxes, control systems, …)
− Basis for a global service network
− Synergies with Alstom Grid, particularlyin HVDC activities
− Leverage Hydro commercialand operational footprint
P 29 Source: Alstom
Evolution of wind turbine characteristics

Alstom’s traditional customers active in Wind
• Two primary client types:large Utilities and IPPs, both traditional Alstom customers
• Large Utilities looking to optimisetheir energy portfolio and progressively increasing their market shareat the expense of IPPs− working with a limited number
of “preferred suppliers”, oftenwithin the context of multi-year "frame agreements“
− requiring global supplierswith adapted local products,local industrial presence and service network, etc…GW
Iberdrola
NextEra
Longyuan
0
10864
14
2
12
EDP
Datang
Acciona
Huaneng
E.ON
Enel
Huadian
GDF Suez
MidAm
erican
EDF EN
Guohua
CPI
Guodian
CGNW
P
Edison Mission
Invenergy
CL&P
Infigen
RWE
P 30
0%
20%
40%
60%
80%
100%
2007 2009 2010 11-20e
Inst
alle
d GW
Wind IPPs,S/M developers
Multi-businessIPPs
Utilities
Alstom’s traditional Utilities/IPP customers also active in Wind with growing ambitions
Added Wind capacity in the USA & Europe [by client segment type]
Cumulative wind capacity of the main players [end 2011]
ALSTOM CUSTOMERS
Sources: IHS, Alstom

Develop leadership position in Offshore− Top technology available in the market− Good platform with French tender− Opportunities in Europe and beyond
Grow selectively in Onshore− Focus on LAM with strong volume growth− Selective expansion in new markets
(e.g. North Africa, South Africa, Middle East,Japan), leveraging on Alstom’s local presenceand customer contacts
Focus on competitiveness− Cost optimisation with continuous efforts on
sourcing, engineering, manufacturing, quality,project execution, etc…
Strategy in Wind
46% 43%
53% 52%
1% 5%
4 yrs ago 1 yr ago Today
100%
EMEALAMOther
P 31 Source: Alstom
1
2
3
Historical Alstom Wind Orders by geography

Industrial footprint in Wind
P 32
USA onshore Nacelles (800 MW)
Wind industrial footprint prudently sized, expected to develop based on order intake
BRAZIL onshore Nacelles (600 MW) Towers (120 units)
FRANCE offshore Nacelles (proto, pre-series) Nacelles (600 MW) Generators JV (600 MW)
SPAIN onshore Buñuel – Nacelles (1,500 MW) Altamira – Towers (150 towers) Somozas – Cabinets& Extenders
Current factories Planned factories to support growth
Source: Alstom

Haliade-150: a technological edge in the market
P 33
• Simpleincreasing reliability whilst lowering maintenance− Direct drive (few moving parts, low
rotation speed, proven technology)− Permanent magnets (no excitation
of rotor required, less electrical parts)
• EfficientLarge rotor giving higher yield(+15% vs. current generation)
• RobustGenerator rotor receivingonly PURE TORQUE®− Separation between the main rotor
and the generator rotor protectingthe drive train and increasing reliability
Product roadmap
Source: Alstom

Offshore French tender – Round 1
• Three zones awarded in April 2012 to a consortium led by EDF (Alstom, Dong Energy, Nass & Wind and WPD Offshore): Saint-Nazaire, Courseulles-sur-Merand Fécamp
• Alstom exclusive turbine supplier to EDF for these orders worth over €2 billion (240 turbines)
• Orders to be booked over 2-3 years startingin FY15/16
• Related revenues to be booked over at least 5 years starting in FY15/16
• Industrial plan with the setup of 4 factories for a total investment of ~ € 100 million− Production ramp-up starting in 2014
• Announcement by the French Governmentin January 2013 of the Round 2 offshore tenderfor ~1 GW (two wind farms) with tender awards expected January 2014
Fécamp500 MWCourseulles-Sur-Mer
450 MW
FRANCE
P 34
St. Nazaire
Cherbourg
Planned factories Wind farm sites
Source: Alstom
480 MW
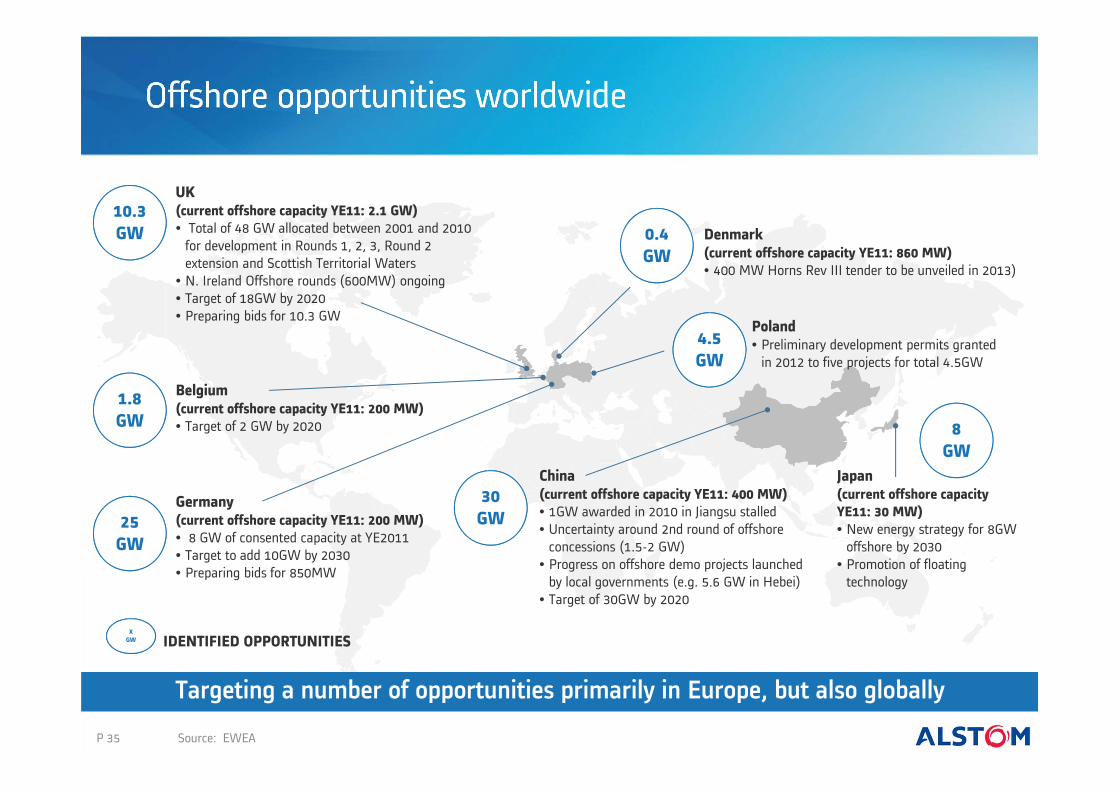
Offshore opportunities worldwide
UK(current offshore capacity YE11: 2.1 GW) • Total of 48 GW allocated between 2001 and 2010
for development in Rounds 1, 2, 3, Round 2 extension and Scottish Territorial Waters
• N. Ireland Offshore rounds (600MW) ongoing• Target of 18GW by 2020• Preparing bids for 10.3 GW
Germany(current offshore capacity YE11: 200 MW) • 8 GW of consented capacity at YE2011• Target to add 10GW by 2030• Preparing bids for 850MW
China(current offshore capacity YE11: 400 MW) • 1GW awarded in 2010 in Jiangsu stalled• Uncertainty around 2nd round of offshore
concessions (1.5-2 GW)• Progress on offshore demo projects launched
by local governments (e.g. 5.6 GW in Hebei)• Target of 30GW by 2020
Japan(current offshore capacity YE11: 30 MW) • New energy strategy for 8GW
offshore by 2030• Promotion of floating
technology
Poland• Preliminary development permits granted
in 2012 to five projects for total 4.5GW
Denmark(current offshore capacity YE11: 860 MW) • 400 MW Horns Rev III tender to be unveiled in 2013)
Belgium(current offshore capacity YE11: 200 MW) • Target of 2 GW by 2020
10.3 GW
1.8 GW
30GW25
GW
8GW
0.4 GW
4.5 GW
XGW IDENTIFIED OPPORTUNITIES
P 35
Targeting a number of opportunities primarily in Europe, but also globally
Source: EWEA

Commercial success in Brazil for Wind Onshore
• Brazilian wind market expectedto be ~2GW / year through 2020
• Entry in the Wind market in Brazil leveraging a strong historical presence through Hydro
• Key successes:
− First project:96 MW Brotas, installed in 2011
− ~300 MW under construction
− ~400 MW additional contracts signed recently
− Frame agreement with RenovaEnergia for 1.2 GW
Total ~2,000~800 1,200
2013 (ytd) 1,200
2012 ~500
2011 ~200
2010 ~100
Successes in Brazil[MW; 2010 – 2013 YTD]
Orders Renova Frame Agreement
• 57 x ECO86 (1.67 MW)
• 41 x ECO86 (1.67 MW)• 36 x ECO86 (1.67 MW)• 35 x ECO86 (1.67 MW)
• ~20 projects• 190 x ECO122(2.7 MW)
Mainly ECO122 (2.7MW)
P 36 Source: Alstom
Recent successes in Brazil validating a selective growth strategy

Zoom on Renova Energia Frame Agreement
P 37
• Renova Energia: the largest wind power generation company in Latin America
• Signature of a Frame Agreement (FA) between Renova Energia and Alstomfor the supply of 1.2 GW of Wind turbines (mainly ECO-122)
• FA part of a larger plan for Renova Energia(~2.4 GW until 2020)
• Projects to be developed in the Bahia interior region, the #1 wind region in Brazil which represents ~45% of the market
• Commissioning expected to take placein 2015 through 2018
• Key components to be sourced locally
CAMACARI PLANT
CANOAS PLANT
SAO PAULO OFFICES
Location of Renova Energia Frame Agreement supply
Brazilian Wind market overview
Sources: Alstom , UTM

ECO-122 well positioned to capture future growth
P 38
• Complements our product offeringfor low-wind sites
• High power− Rotor diameter of 122m− Nominal power of 2.7 MW
• Higher Capacity Factor: up to 42%or over 3,600 hours per year
• Land optimisation: up to 25% increased wind farm yield compared with today's 1.5-2 MW turbines
• CAPEX optimisation: 10-15% lower balance of plant cost
• Increased reliability: PURE TORQUE™ transmitting only the torque tothe drive train for higher reliability
Source: Alstom
Product roadmap
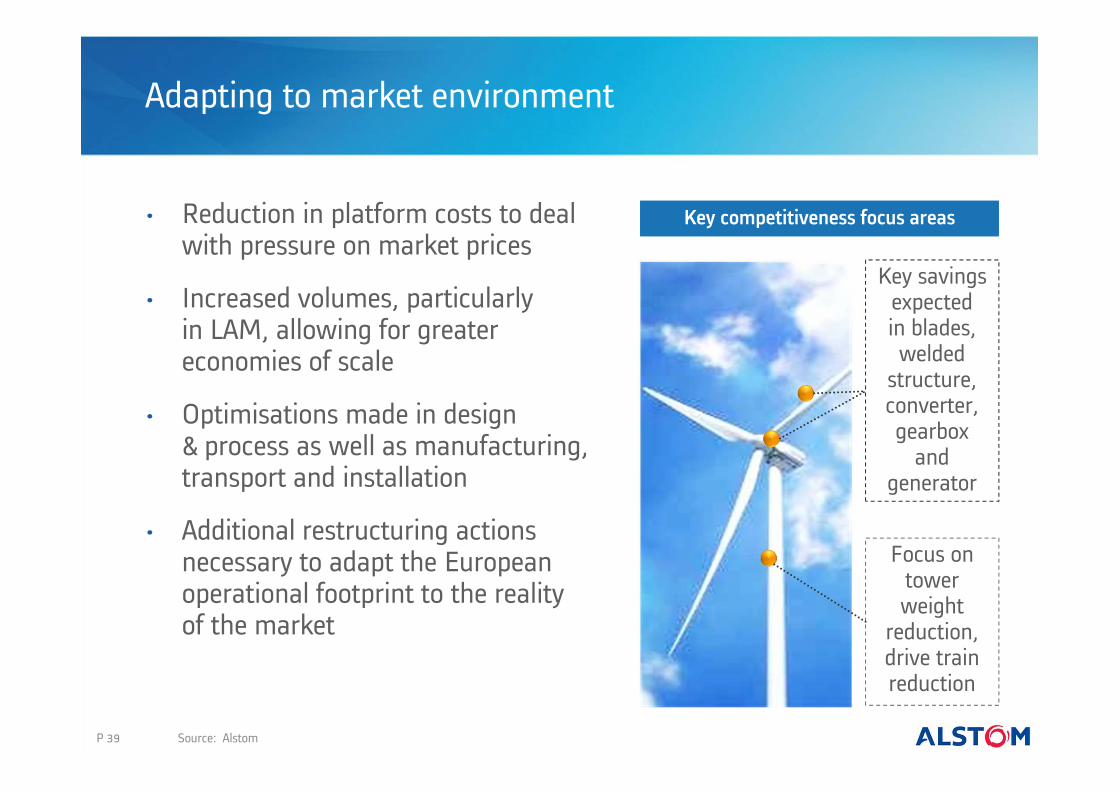
Adapting to market environment
Key savings expectedin blades, welded
structure, converter, gearbox
and generator
P 39 Source: Alstom
Focus on tower weight
reduction, drive train reduction
Key competitiveness focus areas• Reduction in platform costs to dealwith pressure on market prices
• Increased volumes, particularlyin LAM, allowing for greater economies of scale
• Optimisations made in design& process as well as manufacturing, transport and installation
• Additional restructuring actions necessary to adapt the European operational footprint to the realityof the market

Agenda
P 40
I. Renewable Power within Alstom
IV. Hydro
V. Wind
II. Renewable market
VI. New Energies
VII. Conclusion
III. Financials
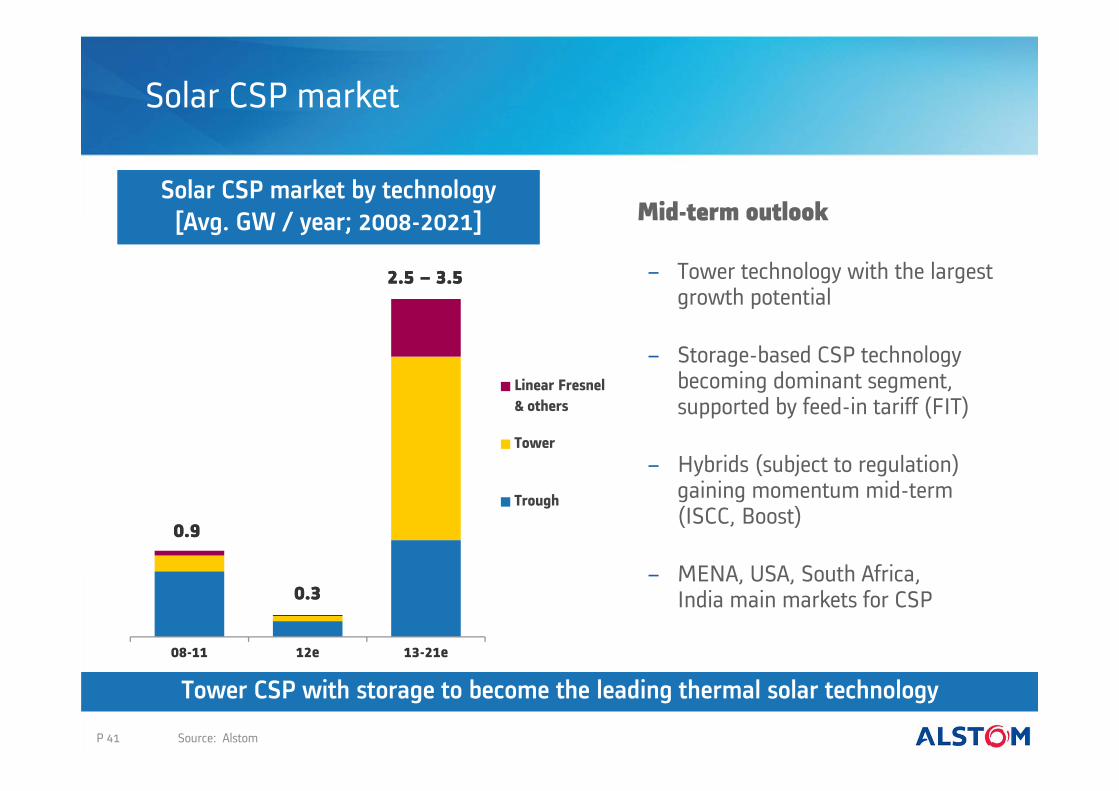
Solar CSP market
P 41
Mid-term outlook
− Tower technology with the largest growth potential
− Storage-based CSP technology becoming dominant segment, supported by feed-in tariff (FIT)
− Hybrids (subject to regulation) gaining momentum mid-term(ISCC, Boost)
− MENA, USA, South Africa,India main markets for CSP
08-11 12e 13-21e
Linear Fresnel& others
Tower
Trough
0.90.9
2.5 – 3.52.5 – 3.5
0.30.3
Solar CSP market by technology[Avg. GW / year; 2008-2021]
Source: Alstom
Tower CSP with storage to become the leading thermal solar technology

Tower technology overview
P 42 Sources: Alstom, BrightSource Energy
GRID
RENEWABLE POWER
RENEWABLE POWER
Scope

LCOE
To be proven
Solar technology comparison
P 43 Sources: Bloomberg New Energy Finance, Alstom estimations
ParabolicTrough
LinearFresnel Dish TowerPV
( )
( )
Utility ScaleExperience
Bankable
Storage
Value chainLocalisation
Hybridisationpotential
( )
expensive
short-term only
limited synergies
+ Higher efficiency today, with potential for further efficiency improvement
+ Low specific costs vs. Through (less piping, flat mirrors)
+ Highest thermal storage effectiveness
+ Most suitable for large scale hybridisation
+ Large scale projects >125MW under construction and bankable technology
+ Growing differentiation vs. PV considering dispatchability
- Limited operationalexperience to date
Tower technology combining key advantages
with storage2018 expectedLCOE evolution with storage
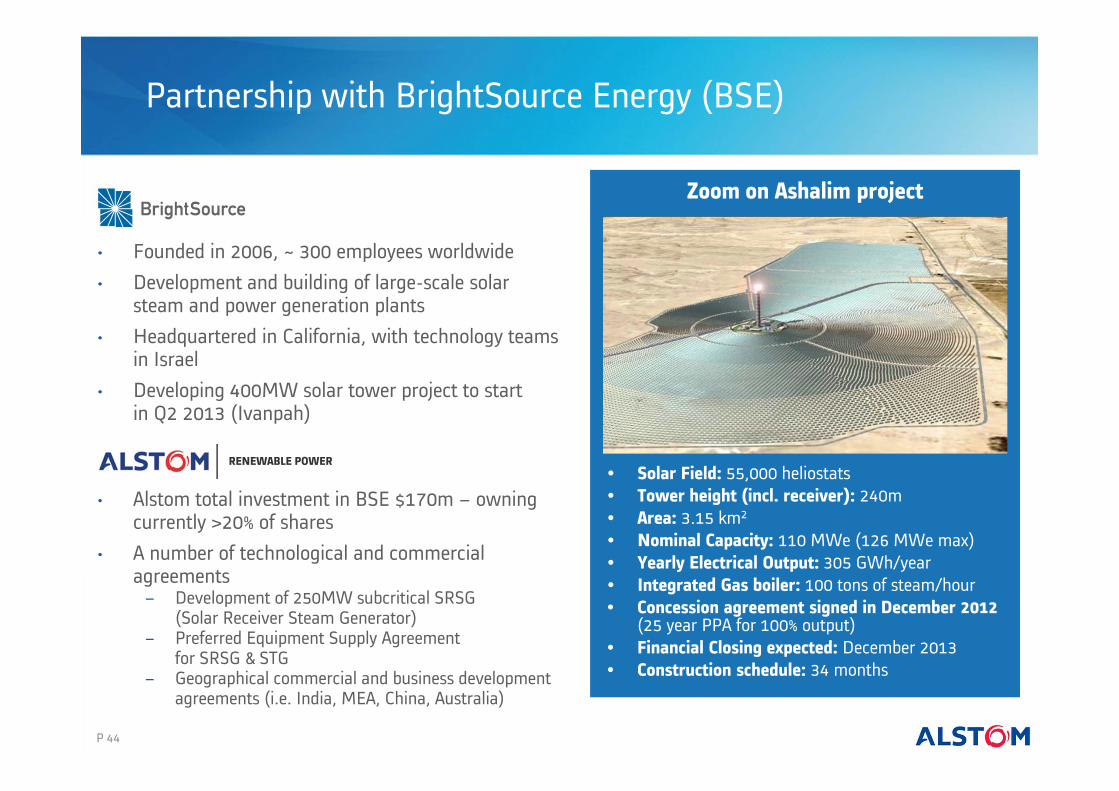
Partnership with BrightSource Energy (BSE)
• Founded in 2006, ~ 300 employees worldwide• Development and building of large-scale solar
steam and power generation plants • Headquartered in California, with technology teams
in Israel• Developing 400MW solar tower project to start
in Q2 2013 (Ivanpah)
• Alstom total investment in BSE $170m – owning currently >20% of shares
• A number of technological and commercial agreements− Development of 250MW subcritical SRSG
(Solar Receiver Steam Generator)− Preferred Equipment Supply Agreement
for SRSG & STG− Geographical commercial and business development
agreements (i.e. India, MEA, China, Australia)
• Solar Field: 55,000 heliostats • Tower height (incl. receiver): 240m• Area: 3.15 km2
• Nominal Capacity: 110 MWe (126 MWe max)• Yearly Electrical Output: 305 GWh/year• Integrated Gas boiler: 100 tons of steam/hour• Concession agreement signed in December 2012
(25 year PPA for 100% output)• Financial Closing expected: December 2013• Construction schedule: 34 months
P 44
Zoom on Ashalim project
RENEWABLE POWER

77%
23%Tidal
Wave
Ocean Energy market
P 45
49%
14%
21%
11%1% 4%
UK
Rest of Europe
Asia
NAM
India
RoW
• Global Market to reach ~1 GW per year in 2020
• Tidal to dominate and first to come
• Wave technology taking off later(no technological convergence yet)
• UK to lead the market, followed by France− UK: Feed-in-tariff in place, leased sites
for 1 GW of Tidal & 0.6 GW of Wave − France: call for tender expected by 2015
• Beyond Europe− Multi GW potential in Canada − Potential in Korea, India, Indonesia,
and to a lower extent Philippines and Japan
Source: Alstom
Ocean energy expected to reach ~1 GW p.a. by 2020 – European tenders expected soon
Ocean energy by technology [2020]
Ocean energy by geography [2020]

Acquisition of Tidal Generation Limited (TGL)
Model / Component
tests
Optimised design
Full scale prototype (>1MW)
Concept
Half scale prototype
Simple design
• Blades with variable pitch• Flow tracking system
• Fixed blades• Fixed yaw• Sometimes a duct
• Two types of design− Simple design:
finally tending to have more technical issues (heavy) resulting in higher costs
− Optimised design:ensuring high performance, preferred by most technology developers (incl. the oneshaving produced electricityon the UK grid)
• Impact of TGL acquisition− Time-to-market shortened to
benefit from upcoming tenders − In-house technology upgraded
Atlantis(1MW)
Hammerfest (Andritz)
(1MW)
OpenHydro/DCNS
(2 x 0.5MW)
Voith(1MW)
TGL(1 MW)
MCT (Siemens)
(2 x 0.6MW)
Alstom
P 46 Source: Alstom
TGL securing technological leadership position in Tidal
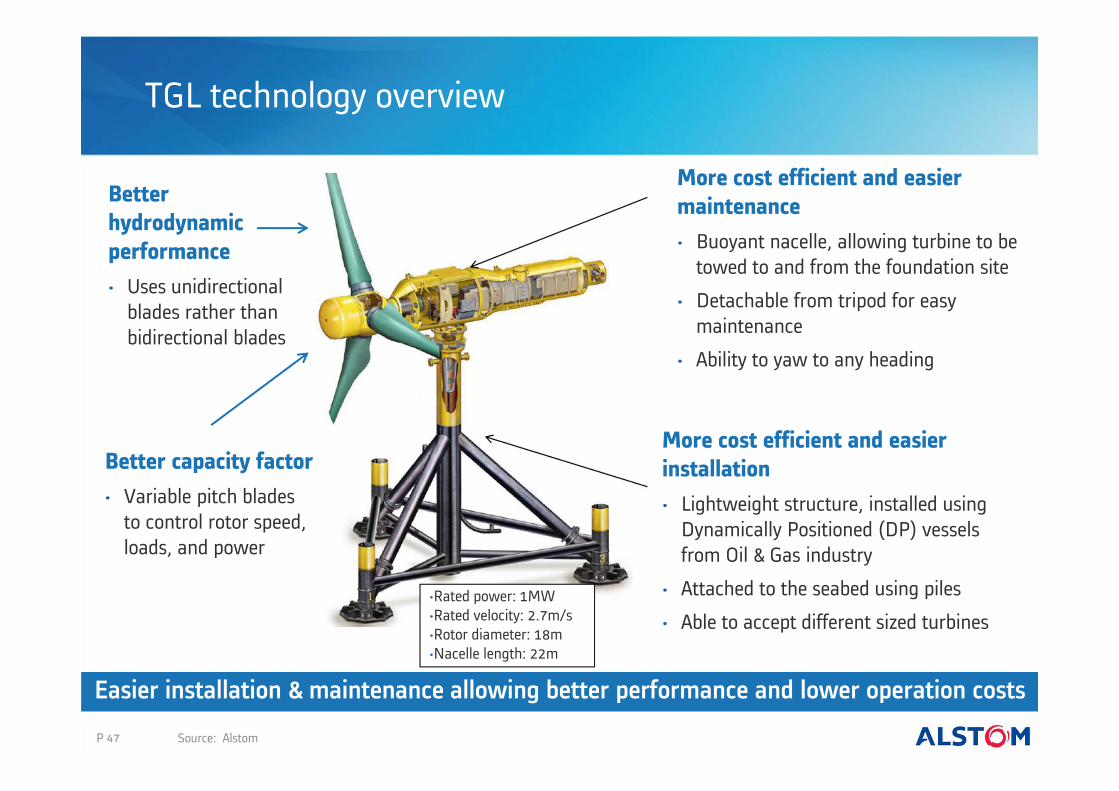
TGL technology overview
More cost efficient and easier installation• Lightweight structure, installed using
Dynamically Positioned (DP) vesselsfrom Oil & Gas industry
• Attached to the seabed using piles
• Able to accept different sized turbines
More cost efficient and easier maintenance• Buoyant nacelle, allowing turbine to be
towed to and from the foundation site
• Detachable from tripod for easy maintenance
• Ability to yaw to any heading
Better capacity factor• Variable pitch blades
to control rotor speed, loads, and power
•Rated power: 1MW•Rated velocity: 2.7m/s•Rotor diameter: 18m•Nacelle length: 22m
Better hydrodynamic performance• Uses unidirectional
blades rather than bidirectional blades
P 47 Source: Alstom
Easier installation & maintenance allowing better performance and lower operation costs

Agenda
P 48
I. Renewable Power within Alstom
IV. Hydro
V. Wind
II. Renewable market
VI. New Energies
VII. Conclusion
III. Financials

Conclusion
• Ambition to grow in profitable Renewable Energy segments− Build on Hydro worldwide leadership and generate
more Service revenues− Succeed in Offshore Wind industrial and commercial ramp up
• Pursue selective growth in Onshore
• Improve cost competitiveness and operational performance across the product lines
• Prepare longer term profitable growth in New Energiesby building offering portfolio
P 49
Expected rebound of operating margin from current low point