Alok - Annual Report FY 2011-12_new
220
I IN NN NO OV V A A T TI IV VE E T TE EX XT TI IL LE E S SO OL LU UT TI IO ON NS S 26 Annual Report 2011-12 Ready Future
-
Upload
kanika-khandelwal -
Category
Documents
-
view
43 -
download
5
description
Annual Report
Transcript of Alok - Annual Report FY 2011-12_new

IINNNNOOVVAATTIIVVEE TTEEXXTTIILLEE SSOOLLUUTTIIOONNSS
26 Annual Report 2011-12
ReadyFuture

- Key Highlights 2011-12 1- About Us 2-Vision and Mission 3- General Information 4- Milestones 6- Key Ratios 30- Board of Directors 32- Chairman’s Message 35- Managing Director’s Message 38- Joint Managing Director’s Message 39- Young Leaders 40- Leaders Speak 41- Notice 56- Annexure to the Notice 60- Director’s Report to the Shareholder 61- Management Discussion and Analysis Report 70- Report on Corporate Governance 108- Shareholders Information 119- Auditors Certificate on Corporate Governance 125- Company Secretarial Compliance Certificate 126- Certification by MD and CFO 127- Auditor’s Report 128- Annexure to the Auditor’s Report 129- Balance Sheet 132- Profit and Loss Account 133- Cash Flow Statement 134- Notes To Financial Statements- Statement Pursuant to Section 212 (3) and 212 (5) of the 170 Companies Act 1956 Relating to Subsidiary Companies- Auditor’s Report on Consolidated Statements 172- Consolidated Balance Sheet 174- Consolidated Profit and Loss Statement 175- Consolidated Cash Flow Statements 176- Notes To Consolidated Financial Statements- Proxy 215
. . . . . . . . . . . . . . . . . . . . . . . . . . . . .. . . . . . . . . . . . . . . . . . . . . . . . . . . . . . . . . . . . . . . .
. . . . . . . . . . . . . . . . . . . . . . . . . . . . . . . . .. . . . . . . . . . . . . . . . . . . . . . . . . . . . . . .
. . . . . . . . . . . . . . . . . . . . . . . . . . . . . . . . . . . . . . .
. . . . . . . . . . . . . . . . . . . . . . . . . . . . . . . . . . . . . .. . . . . . . . . . . . . . . . . . . . . . . . . . . . . . . .
. . . . . . . . . . . . . . . . . . . . . . . . . . . . .. . . . . . . . . . . . . . . . . . . . . . .
. . . . . . . . . . . . . . . . . .. . . . . . . . . . . . . . . . . . . . . . . . . . . . . . . . . .. . . . . . . . . . . . . . . . . . . . . . . . . . . . . . . . . .
. . . . . . . . . . . . . . . . . . . . . . . . . . . . . . . . . . . . . . . . .. . . . . . . . . . . . . . . . . . . . . . . . . . . .
. . . . . . . . . . . . . . . . .. . . . . . . . . .
. . . . . . . . . . . . . . . . . .. . . . . . . . . . . . . . . . . . . . . . . . .
. . . . . . . . .. . . . . . . . . .
. . . . . . . . . . . . . . . . . . . . . .. . . . . . . . . . . . . . . . . . . . . . . . . . . . . . . .
. . . . . . . . . . . . . . . . . . .. . . . . . . . . . . . . . . . . . . . . . . . . . . . . . . . . .
. . . . . . . . . . . . . . . . . . . . . . . . . .. . . . . . . . . . . . . . . . . . . . . . . . . . . .
. . . . . . . . . . . . . . . . . . . . .
. . . . . . . . .. . . . . . . . . . . . . . . . . . . . . . .
. . . . . . . . . . . . . .. . . . . . . . . . . . . . . .
. . . . . . . . . .. . . . . . . . . . . . . . . . . . . . . . . . . . . . . . . . . . . . . . . . .
136
178
26 Annual Report 2011-12
Table of Contents

Key Highlights 2011-12
1Innovative Textile Solutions
INNOVATIVE TEXTILE SOLUTIONS
Turnover increased by 39.33% to ` 8,900.86 crores
Exports increased by 36.62% to ` 3,029.55 crores
EBIDTA increased by 39.64% to ` 2,624.75 crores
Operating PBT increased by 21.95% to ` 761.77 Crores
Dividend at ` 0.30 per share
Total Assets at ` 18,238.35 crores
Total Networth at ` 3,655.50 crores
Book Value at ` 44.24
EPS at ` 4.69
CEPS at ` 14.47

Alok Industries Limited, India's largest vertically integratedtextile company, provides end-to-end solutions through fivecore divisions Cotton Yarn, Apparel Fabric, Home Textiles,Garments and Polyester Yarn.
The Following chart aptly brings out Alok’ presence across thetextile value chain
With over two decades of experience, Alok is the choice forquality textile products at internationally competitive prices anddependable delivery schedules. The company constantly adoptsnew technology to widen its product range. Through a plannedand focused expansion, Alok is today a leading player in each ofits product segments.
Alok's large customer base comprises domestic and overseasretailers, garment exporters in India and converter countrieswho are vendors to major international labels, they includesome of the world's largest retailers and India's largestmanufacturers of apparel and home textiles.
About 35% of Alok's production is exported to over 90 countrieswith major markets being US, Europe, Latin America, Asia andAfrica
TMInnovative Textile Solutions
2 26 Annual Report 2011-12
About Us

VISION
To be the world's best integrated textile enterprise, with a leadership
position across products & markets exceedingcustomer & stakeholder expectations
driven by research & innovation,
The barometer of our success would be the ROCE
OUR MISSION We will:
�
businesses
�Maximize people development initiatives
�Optimize use of all resources
�Become a process driven organization
�Exceed compliance and global quality standards
�Actively explore potential market & products
�Offer innovative, customized and value added services to our customers
�Be an ethical, transparent and responsible global organization
Be a knowledge leader & an innovator in our
3Innovative Textile Solutions
INNOVATIVE TEXTILE SOLUTIONS
Vision and Mission

4 26 Annual Report 2011-12
BankersAllahabad BankAndhra BankAxis Bank LimitedBank of BarodaBank of IndiaBank of MaharashtraCanara BankCentral Bank of IndiaCorporation BankDBS Bank LimitedDena BankExport Import Bank of IndiaIndian BankIDBI Bank LimitedIndian Overseas BankING Vysya Bank LimitedOriental Bank Of CommercePunjab National BankStandard Chartered Bank.State Bank of Bikaner & JaipurState Bank of HyderabadState Bank of IndiaState Bank of MysoreState Bank of PatialaState Bank of TravancoreSyndicate BankThe Jammu & Kashmir Bank LimitedThe Federal Bank LimitedThe Karur Vysya Bank LimitedUCO BankUnited Bank Of IndiaUnion Bank Of IndiaVijaya Bank
Statutory AuditorsDeloitte Haskins & SellsChartered Accountants
Gandhi & ParekhChartered Accountants
Internal AuditorsBhandarkar & Co.Chartered Accountants
Devdhar Joglekar & SrinivasanChartered Accountants
N.T. Jain & Co.,Chartered Accountants
Shah Gupta & Co.Chartered Accountants
T.R. Chadha & Co.Chartered Accountants
Legal Advisors & SolicitorsKanga & Co.
Chief Financial Offi cerSunil O. Khandelwal
President Corporate Affairs & Company SecretaryK. H. Gopal
Demat ISIN Number in NSDL & CSDLEquity Shares – INE 270A01011
Website Addresswww.alokind.com
E-mail [email protected]
Registered Offi ce17/5/1 & 521/1 Rakholi/ Saily, Silvassa-396230Union Territory of Dadra and Nagar Haveli
Corporate Offi cePeninsula Tower, ‘A’ Wing,Peninsula Corporate Park,G. K. Marg, Lower Parel,Mumbai – 400 013
Marketing Offi cesDomesticDelhiF-2/9, 1st Floor, Okhla Industrial EstatePhase INew Delhi – 110 020
Bengaluru8-3/1, Pentaford Tower,Langford Town, Shanti Nagar,Langford RoadBengaluru – 560 025
Chennai156, First Floor, Doshi TowersPoonamallee High Road, Kilpauk,Chennai – 600 010
OverseasSri Lanka26, Hallmark Building, Vajira Road,Colombo – 04,Sri Lanka
GENERAL INFORMATION

INNOVATIVE TEXTILE SOLUTIONSINNOVATIVE TEXTILE SOLUTIONS
5Innovative Textile Solutions
BangladeshAsset Rosedale,Unit B1 (1st fl oor), House # 2 Road,# 55, Gulshan Avenue, Gulshan – 2,Dhaka – 1212, Bangladesh
ChinaRoom No 701,Youngong Communication Plaza,East Wing Building, Zheijiang,China
Dubai6 WA, 232, 2nd Floor,P. O. Box 54917,Dubai Airport Free Zone
USA1) 7 West, 34th Street,Suite # 607, New York NY– 10001
2) 123 Oaklawn Avenue,DALLAS, TX 75207
Czech RepublicHusova 734, 508 01 HoriceCzech Republic
British Virgin IslandsPasea Estate,Road Town, TortolaBritish Virgin Islands
Store Twenty OneUnit 1, Plot C1Central Boulevard, Blythe Valley Business ParkSolihull - B90 8AH
Listing & CodeBSE Limited (521070)National Stock Exchange of India Limited (ALOKTEXT EQ)
Registrar & Share Transfer AgentLink Intime India Private LimitedC-13 Pannalal Silk Mill Compound,L.B.S. Marg Bhandup (West),Mumbai – 400 078
WorksSpinning412 (15) Saily, Silvassa,Union Territory of Dadra & Nagar Haveli
Weavinga) 17/5/1 & 521/1, Rakholi / Saily, Silvassa,Union Territory of Dadra & Nagar Haveli.
b) 209/1 & 209/4,Dadra, U. T. of Dadra and Nagar Haveli.
c) Babla Compound, Kalyan Road,Bhiwandi – Dist. Thane
Processinga) 254, 261, 268, Balitha,Taluka Pardi, Dist. Valsad, Gujarat
b) C-16/2, Village Pawane,TTC Industrial Area, MIDC, Navi MumbaiDist. Thane.
Knitting412 (15) Saily, SilvassaUnion Territory of Dadra & Nagar Haveli
Hemming103/2, Rakholi, Silvassa,Union Territory of Dadra & Nagar Haveli
Polyester Yarn (POY & Texturised Yarn)17/5/1, 521/1, Rakholi / Saily and 409/1 Saily Silvassa, Union Territory of Dadra & Nagar Haveli
Garmentsa) 374/2/2, Saily, Silvassa Khanvel Road,Union Territory of Dadra & Nagar Haveli.
b) 17/5/1, Rakholi, Silvassa,Union Territory of Dadra & Nagar Haveli
c) 273/1/1, Hingraj Industrial Estate,Atiawad, Daman, Union Territory
d) 50/P2, 52/P1, Morai, Taluka Pardi, Dist. Valsad, Gujarat
Home TextilesBed Linena) 374/2/2, Saily, SilvassaUnion Territory of Dadra & Nagar Haveli
b) 149/150, Morai Taluka,Pardi, Dist. Valsad,Gujarat
Terry Towel263/P1/P1 and 251/2/P1 Balitha,Taluka Pardi, Dist. ValsadGujarat
GENERAL INFORMATION

1998
1986
1993
1995
1996
1997
2000
2001
2002
2003
2004
6 26 Annual Report 2011-12
Milestones

20052006
2007
2008
2009
2010
2011
2012 Turnover crosses ` 8900 crores Exports reach 3030 crores.
Completion of Expansion of polyester production from 900 tons/day to 1400 tons/day.
The amalgamation of Grabal Alok Impex Limited (GAIL) into the company was completed on 1 March 2012 with effectfrom 1 April 2011.
`
Gold Trophy for Global Exports of Bleached / Dyed / Yarn Dyed /
Printed Fabrics in Fabrics Category
Gold Trophy for Exports of Bed Linen / Bed Sheets /Quilts in
Made-ups Category
Silver Trophy for Highest Global Exports Category
Silver Trophy for second best export performance for the year
2010-11 in the category of Polyester Yarn
7Innovative Textile Solutions
INNOVATIVE TEXTILE SOLUTIONS
900

Future Ready
Foresight is one's ability to sense the future ahead of others.Maturity is ones trait to spot and ascertain the rightopportunities. Agility is ones intrinsic strength to act quicklyand precisely. Resolve is ones commitment to prepare hardand master the art of maximising from ones rigour. The sumtotal of foresight, maturity, agility and resolve is FutureReady.
8 26 Annual Report 2011-12

Future companies are the ones that successfullyencounter current challenges and also constantly evolve andbuild capabilities to face unpredictable, unforeseen futurechallenges. They develop and grow a unique business modelto mitigate risk and make business sustainable under allcircumstances. These companies not only quickly attain butalso maintain their leadership position. Future Readycompanies are gloriously ahead of time and the industrylooks up to them for direction and trends.
At Alok, we saw the unfolding of the golden decade of Indian Textileyears ago. We spotted integrated operations and diverse product mixas tight opportunities. We acted with speed and purpose to expandour manufacturing competence in India and marketing capabilitiesacross the globe. We prepared hard towards optimising efficiencies,maximising quality and reducing turnaround time.
At a time when the world is looking at India for their textile needs, weare ready to respond with the only thing that we have mastered allthese years. Making textiles and making it well. Yes we are ready.
We are ready to strike an intricate balance among interests of ourvaried stakeholders. We are ready to embark on a phase of sustainedprofitable growth to capitalize on opportunities and face challenges.
ready
9Innovative Textile Solutions
INNOVATIVE TEXTILE SOLUTIONS

India: Emerging
sourcing destination
for global buyers
26 Annual Report 2011-12

The global textile trade which was governed by quotas till December 2004 has sincethen started shifting there sourcing to low cost Asian countries. The USD 600 bnglobal textile trade is growing at a CAGR of 5% and it is expected to reach USD 1000bn by 2020. This growth would be due to both shifting of manufacturing base as wellas increase in textile consumption.
China, the largest exporter of textile in the world is shifting focus towards high-endtechnological industry being its transformation into the world's second biggest economy.China's competitiveness is also gradually eroding with high wage inflation and appreciation ofChinese Yuan. Rising per capita income in China is also leading to higher domesticconsumption, limiting further its ability to exports.
Market share of another key producer, Europe hasbeen on a consistent decline due to higher cost ofproduction. The above factors are giving India anedge to play a bigger role in global textile trade.
The global textile buyers therefore are looking atIndia as one of the major sourcing destination.Indian textile industry is competitively placed vis-à-
2005 2010
ChinaEU - 27IndiaTurkeyUnited StatesOthersTotal
132.8148.316.118.917.4
149.5483
27.5%30.7%3.3%3.9%3.6%31%100
216166242217
157602
35.9%27.6%4.0%3.7%2.8%
26.0%100%
Value Value% %Top exporters
10Innovative Textile Solutions
INNOVATIVE TEXTILE SOLUTIONS
vis other global destinations. India offers higher skills, lower costs, modern technology, globalacceptance, and a highly creative pool of design talent. A supportive policy regime andabsolute commitment of private enterprises is further strengthening India's prospects.
India is amongst few textiles manufacturing countries, which is fully integrated from fiber tofinished products. It is also only textile manufacturing country, which is cotton surplus. It isaccordingly, poised to double its share in global textile market from present 4% to about 8%by 2020 to reach USD 80 bn exports from present USD 24 bn.
India is ready to be a top souring destination for global buyers and to take off into what couldpossibly be her brightest decade in textiles.
4.6015.00
24.12
45.00
80.00
1990
India Textile & Apparel Export Trend& Future Potential USD Billion
20.40
11.40
2000 2005 2008 2010 2015(P) 2020(P)
1990 1995 2000 2005 2008 2009 2010 2015(P) 2020(P)
108104
158
152 157 205 253 211 251 300 350198
278365 316
351
500
650
212310 355
483618
527602
800
1000
In USD Billion
CAGR : 5.6%
Quota Phase OutRegime
Post Quota GlobalSlowdown &
RecoveryCAGR : 8.6%
CAGR : 6%
CAGR : 5%
CAGR : 5.5%
The Way Ahead...
-1.2% Growth
E: Figures of 2010 have been estimated based on US & EU imports for 2010P: Projections
Source: WTO, OTEXA, Euostat, Technopak Analysis TextileApparel Total

India: A
burgeoning
domestic textile
market
26 Annual Report 2011-12

India continues to be the second fastest growing economyin the world. It is home to more than 16% of the globalpopulation, 60% of which is between the earning age groupof 15-60 years. India's favourable demographics,burgeoning middle class, growing urban population, fasteradoption of global lifestyles, and growing consumerismaugur well for domestic textile industry.
Country's per capita consumption of all kind of fibres is at just 8kg as against the global average of 12 kg. The same stands at 31kg for North America, 22 kg for West Europe and 17 kg for China.
In line with the growth in the GPD of the country, Per CapitalIncome would also go up, which would increase consumption.As a result, the domestic market is poised to grow at a CAGR of10% to reach USD 140 bn by 2020 from present about USD 55 bn.
13Innovative Textile Solutions
INNOVATIVE TEXTILE SOLUTIONS
30
47 52
89
140
2005 2009 2010(E) 2015(P) 2020(P)
India Domestic Textile & Apparel Market
31
22
17
812
North America
Fibre consumption per capita (kgs) - 2011
Europe China India World
CAGR 11%
USD Billion

Alok: Reaping
benefits of
integrated
operations
26 Annual Report 2011-12

Future Ready companies strive to be the best in theirrespective segment.
We are India's largest integrated textile company. We are present across the entire valuechain in textile, from fiber to garments and made ups. Integrated operations allow us toexpand our margins with maximum value addition. It also empowers us to sell products atvarious stages of our value chain like yarn, fabric and garments and thereby enhancemargins. Besides, this high level of integration gives us full control on the quality of input andoutput and also insulates the business from fluctuations in input prices.
The high level of automation also optimizes manpower requirement and improves quality byminimizing the human element. With strategically planned balanced capacity at each level,we are ensuring an optimum utilization, self-sufficiency and better margins. We aregradually moving up the value chain by increasing the proportion of higher value addproducts that should further improve the realizations. Lately, we are carefully expanding ourcapacities across various divisions that should result in higher volume growth and margins inyears ahead. The integration of Alok in cotton and polyester is depicted in the graph below
Our huge economies of scale help us to plan and procure raw material at competitive pricing,while our expanded and diversified product portfolio help us in addressing the need of ourcustomers across the value chain. We have established a strong global presence, including a100% stake in an integrated textile company based out of Czech Republic with a strong well-established distribution network in USA and Europe. We have a well-diversified customerbase across various geographies and we export about 35% of our total production. Ourglobal clientele includes most reputed retailers, brands and importers from over 90countries.
Capitalising on our integrated business model, we are ready to expand our geographies &products and enhance our market share in the domestic and overseas markets.
15Innovative Textile Solutions
INNOVATIVE TEXTILE SOLUTIONS

Alok: Leveraging
technology and
R&D prowess
26 Annual Report 2011-12

Future Ready companies constantly seek to adopt the latesttechnology in their operations and driven by innovation.
We are new generation textile company which has effectively leveraged technology.We have created process driven organization with state of art facilities and integratedmanagement system that requires minimum human intervention.
Our personnel ceaselessly invest efforts and resources in research and developmentin order to introduce new products and finishes and to remain ahead of competition.We are also in the process of setting up an Innovation Centre that will constantly usebreakthrough technology with revolutionary thinking for the introduction of newproducts. We are providing added impetus on specialized products with specialemphasis on technical textiles and working towards achieving integration in technicaltextiles too from fiber to finished garments. This new thrust on innovation andspecialized products has driven the change in our motto from “Integrated TextileSolutions” to “Innovative Textile Solutions”.
As a quality conscious company we have in-house quality assurance department thatensure adherence to processes and quality. Our Quality Control (QC) departmentinspects incoming and outgoing material against the indicated specifications. Theoutput of same is recorded in our centralized SAP system.
With the purpose of improving asset turnover of our integrated cotton business, weare scaling up our production of value added and specialized products, with clearinvestment strategy for future. With our high investments in technology, ouralternative fibres like polyester offer not just an alternative to cotton but a distinctadvantage over it. Yesterday's 100% cotton wear of athletes have today been replacedby polyester. Our high investment in polyester would not only help us to serve thegrowing demand of polyester but also improve our returns given the high assetturnover and low working capital requirement of polyester as compared to cotton.
Backed by state of the art technology and unique R & D centre, Alok is ready to providespecialized textile products with a high degree of attention to innovation and productdevelopment to further consolidate its leadership position.
17Innovative Textile Solutions
INNOVATIVE TEXTILE SOLUTIONS

26 Annual Report 2011-12
Alok: Focusing on
core strengths

Future ready companies are focused companies. Theyunderstand their core strengths and continuously sharpencapabilities to remain ahead in the market curve.
At Alok, our core strength is our integrated textile business model. We havethree core businesses: Integrated Apparel Fabrics - Woven & Knits, IntegratedHome Textile - Bed Linens & Towel and Integrated Polyester Yarn Business. Weare further consolidating our position in these segments by focusing on highervalue added products, developing newer products and expanding marketboundaries.
We have decided to exit our non-core businesses i.e. realty. Our efforts tomonetize our real estate assets have started yielding positive results. Theseefforts should provide us with strong cash flows and yield decent profits. Amajor portion of the real estate monitisation should happen in 2012-13 and thebalance realization by next financial year. These funds will be utilized to retirethe debt of the company at the consolidated as well as standalone level. We arealso finalizing a strategy for our domestic and overseas retail businesses whichinclude turning them around and / or exiting them at an opportune time.
With focus on our core business where we are well entrenched, we are ready toencash the emerging opportunities in the Indian textile industry which is likelyto grow three times in this decade from USD 77 bn in 2010 to about USD 220 bnby 2020 (Source: Technopak).
With focused attention on core textile business, we are ready to grow andenhance our stakeholder value.
19Innovative Textile Solutions
INNOVATIVE TEXTILE SOLUTIONS

Alok: Ensuring
sustainable and
inclusive growth
26 Annual Report 2011-12

Future Ready companies are sensitive to the environmentand believe in sustained and inclusive growth. They alwaysmanage to strike the right balance between businessobjectives and sustaining natural resources.
At Alok, we are conscious about our responsibility towards Mother Nature and have ensured that ourmanufacturing operations are carried out in an environment friendly manner. We have taken severalmeasures towards this:
�We have developed green belts in and around our plants.�We ensure that our plants not only strive to be fully compliant on social and environment
audits but exceed the norms stipulated by the various governmental agencies, ourinternational clients and lenders.
�We have invested heavily in state of the art effluent treatment and reverse osmosis plants toremove harmful elements before discharge of treated water and to recycle water for use insanitation and gardening.
�Our captive power plants use gas as fuel, which is much greener and cleaner way ofgenerating power.
�We actively promote use of organic cotton and, fair trade cotton products. Organic cotton isproduced without using fertilizers and pesticides and hence is environment friendly. FairTrade cotton ensures that the farmer gets a just and equitable price for his produce.
�We maintain world class facilities with strong adherence to environment, health and safetystandards.
We are amongst the first Indian textile companies to be awarded certifications for our eco-friendlyproducts. Being a responsible corporate, we have been consistently working for the development ofthe towns and its people where we have our manufacturing units. We have started a public schoolunder CBSE Board in Silvassa and also plan to set up a charitable hospital there. To provide gainfulemployment to tribal women, we provide intensive training and orientation to them on weavinglooms and garment stitching.
We have entered into Private Public Partnership with the local administration to convert theIndustrial Training Institute into contemporary knowledge driven centers of excellence.
Alok in now ready to harmonize its operations with Nature to embark on a phase of sustainedprofitable and inclusive growth.
21Innovative Textile Solutions
INNOVATIVE TEXTILE SOLUTIONS

Alok:
Acknowledging and
Appreciating Human
Capital
26 Annual Report 2011-12

Future Ready companies respect and appreciate thathuman capital is the one resource that appreciates withtime and take exceptional care to develop and nurturepeople employed with them.
We acknowledge that human resource is the most valuableresource that we possess and have invested significantly todevelop and retain talent. The result is our present committedwork force of about 30000 Alokians working for a common goalof making Alok the world's best textile enterprise. All divisionsand key functions are headed by professionals cultivated to beentrepreneurs and empowered to take independent decisions.The work environment at plants and offices is congenial and
informal with two way communication at all levels. Suggestionboxes have been provided at strategic locations to invite ideas and suggestions for constant improvements in all areas of thebusiness. We have built quality housing for our staff andworkers near our plants along with quality recreational facilitiesincluding a cricket stadium at Silvassa.
Alok is now ready to provide a competitive environment forhigh performers to flourish in for personal growth and to figureamongst the 'preferred companies' to work for.
23Innovative Textile Solutions
INNOVATIVE TEXTILE SOLUTIONS

Alok: Adhering to a
high level of
Corporate
Governance
26 Annual Report 2011-12

Future ready companies adopt best practices and thehighest level of corporate governance.
At Alok, we believe in following best practices in all spheres of business be itmanufacturing, procurement, dealings with employees, customers, suppliers,lenders, investors and society at large.
We are certified under the Integrated Management System which encompasses fourcertifications, namely:
ISO 9001: 2008 (Quality Management System)ISO 14001: 2004 (Environment Management System)OHSAS 18001: 2007 (Operational Health & Safety Assessment System), andSA 8000:2008 (Social Accountability)
We have an eminent Board of Directors comprising Five representatives from lendersand investors, Two independent and Four executive directors. Our committees likeAudit committee, Remuneration committee, etc are headed by independent /nominee directors.
We have adopted the SAP platform as our IT backbone for transacting our businessand have appointed the best of audit firms to ensure adherence and compliance withaccounting standards, internal controls and processes.
We maintain a cordial relationship with our work force and our track record withsuppliers and lenders are impeccable. Our endeavor is to share information with allstake holders and we put in efforts to provide company and industry relatedinformation in a detailed manner.
We are always available to meet our investors & equity analysts and take initiatives toreach out proactively to them. We believe our plants are the real strength of thecompany and actively encourage our stake holders to inspect our plants for betterunderstanding of the company.
Alok is now ready to imbibe best practices in its functioning to transform into aresponsible and ethical corporate citizen.
25Innovative Textile Solutions
INNOVATIVE TEXTILE SOLUTIONS

Alok: Renewing
Focus on ROCE
26 Annual Report 2011-12

Future Ready companies continuously work on addressingtheir weaknesses and improving their strengths. By bettermanagement of their assets, they attain a ROCE better thantheir peers and generate adequate free cash flow.
We have worked out a strategy to address weaknesses and build upon our strengthsand are following a multi-pronged strategy to progressively boost our return ratios.The key components of the strategy are:
�
Improve debt-equity by:
�Exiting the non–core real estate business and monetising the same. Theproceeds would be used towards repayment of consolidated / standalonedebt.
�Equity infusion in the company to boost the net worth and improve thedebt equity ratio and rating of the company
�Increase Asset Turnover and ROCE:
Double the asset turnover and the ROCE in next two years by:
�Improving the asset turnover of the Cotton Integrated Business from 0.50times to 1 time by focusing on value added products like yarn dyed andtechnical textiles.
�Focus more on increasing the share of polyester division, where the assetturnover is 2.25 times and ROCE is about 26%.
�Free Cash Flow:
Focus on generation of free cash flow by:
�Restricting the capital expenditure to the extent of depreciation charge�Reducing the working capital cycle
With a clear road map, Alok is ready to achieve ROCE superior to industry standardsand to work towards attaining the mantle of being the world's best textile companyon all parameters.
Improvement in Debt Equity:
27Innovative Textile Solutions
INNOVATIVE TEXTILE SOLUTIONS

28 26 Annual Report 2011-12
FINANCIAL HIGHLIGHTS
Particulars 31-Mar-12 31-Mar-11 31-Mar-10 31-Mar-09 Operating profi tsNet Sales 8,900.86 6,388.43 4,311.17 2,976.93 EBITDA 2,624.75 1,879.70 1,272.48 822.61 Depreciation 713.43 518.79 362.61 233.50 Misc. Exp. W/off - - - - PBIT 1,911.32 1,360.91 909.87 589.11 Interest 1,149.55 736.27 535.08 304.12 PBT (operating) 761.77 624.64 374.80 284.99 Exceptional Items (Forex MTM - Non Cash)
121.27 41.45 - -
PAT 380.53 404.36 247.34 188.37 Cash Profi t 1,334.19 1,083.98 711.89 513.98 Dividend 28.81 22.97 22.97 17.28 Net Cash Accruals 1,305.38 1,061.01 688.93 496.70 Financial PositionGross Fixed Assets 11,840.67 9,920.88 8,215.61 6,692.71 Net Fixed Assets 9,466.25 8,333.76 7,145.11 5,983.86 Current Assets 8,596.31 5,793.77 4,801.88 2,685.93 Foreign Currency Translation A/c - - 0.17 11.20 Investments 175.79 139.93 229.69 478.58 Total Assets 18,238.36 14,267.46 12,176.85 9,159.57 Equity Share Capital 826.28 787.79 787.79 196.97 Reserves & Surplus 2,829.22 2,309.81 1,928.40 1,410.39 Miscellaneous Expenses - - - -Share Application Money - - - 137.50 Share Warrants - - - 10.20 Tangible Net worth - 1 3,655.50 3,097.60 2,716.19 1,755.06 Deferred tax liability - 2 626.77 507.66 406.98 307.97Total Long Term BorrowingsPreference Share Capital - - - -Secured Loans 6,926.44 5,956.06 6,056.69 4,948.43 Unsecured Loans - FCCB - - 107.21 121.01 Unsecured Loans 86.62 95.34 272.81 51.09
7,013.06 6,051.40 6,436.71 5,120.53 Total Short Term BorrowingsSecured Loans 2,233.10 1,851.37 1,186.19 608.64 Unsecured Loans 569.39 881.83 43.00 168.02 Working Capital Borrowings 2,956.67 1,034.60 843.78 699.16
5,759.16 3,767.80 2,072.97 1,475.82 Total Borrowings - 3 12,772.22 9,819.20 8,509.68 6,596.35 Total Current LiabilitiesCurrent Liabilities & Provisions - 4 * 1,183.87 843.00 544.00 500.19Total Liabilities - 1 to 4 18,238.36 14,267.46 12,176.85 9,159.58 Capital Employed 15,132.88 11,611.32 9,835.58 8,006.47 EPS 4.69 5.13 4.57 9.64 CEPS 15.80 13.47 9.04 24.04 Book Value 44.24 39.32 34.48 89.10
Note:
* The current maturity component of debt is included in short term borrowings and excluded from current liabilities

INNOVATIVE TEXTILE SOLUTIONSINNOVATIVE TEXTILE SOLUTIONS
29Innovative Textile Solutions
FINANCIAL HIGHLIGHTS(` In Crores)
31-Mar-08 31-Mar-07 31-Mar-06 31-Mar-05 31-Mar-04 31-Mar-03
2,170.41 1,824.68 1,420.70 1,224.50 1,068.85 795.41 547.75 410.96 301.26 244.53 198.40 137.14 161.96 123.04 80.48 57.56 38.28 25.42
- - - - 1.15 0.85 385.79 287.92 220.78 186.97 158.97 110.87 131.83 89.04 66.78 63.68 66.40 51.51 253.96 198.88 154.00 123.29 92.57 59.36
- - - - - -
167.73 135.18 109.21 89.25 71.08 42.31 393.14 302.50 189.69 146.81 110.51 68.58 26.28 28.75 30.20 27.92 11.65 7.04
366.86 273.75 159.49 118.89 98.86 61.54
4,368.05 2,954.20 2,121.89 1,047.57 690.84 453.59 3,891.30 2,583.80 1,874.24 879.27 579.53 380.39 3,377.53 1,992.66 1,403.87 1,359.21 846.68 593.15
618.96 219.49 39.70 7.85 4.07 4.07 7,887.79 4,795.95 3,317.81 2,246.33 1,430.28 977.61
187.17 170.37 157.47 134.02 88.23 87.69 1,134.01 854.07 650.06 460.73 218.00 162.73
1.15 - - - - 18.10 -
110.16 - - 3.32 3.32 - 1,431.34 1,024.44 807.53 598.07 327.65 249.27
210.48 141.82 100.10 75.10 50.52 36.33
- - 68.00 84.33 83.67 5.00 3,706.66 2,049.13 1,392.13 823.89 371.48 262.70
94.87 202.87 220.63 - - - 103.28 6.48 61.32 17.63 19.97 15.95
3,904.81 2,258.48 1,742.08 925.85 475.12 283.65
550.00 215.00 85.00 102.08 75.00 27.80 745.01 294.36 62.34 61.77 50.77 34.43 567.49 568.92 323.08 313.54 301.20 203.29
1,862.50 1,078.28 470.42 477.39 426.97 265.52 5,767.31 3,336.76 2,212.50 1,403.24 902.09 549.17
478.66 292.93 197.68 169.92 150.02 142.84 7,887.79 4,795.95 3,317.81 2,246.33 1,430.28 977.61 5,524.91 3,575.90 2,487.00 1,504.51 1,072.47 775.44
11.40 9.70 6.68 7.25 7.90 7.36 20.53 16.99 12.61 12.68 12.53 12.07 76.47 60.13 1.96 2.05 34.70 28.43

30 26 Annual Report 2011-12
`cr
ore
Net Sales900080007000600050004000300020001000
0
8,900.86 Export Sales
1036.89
1558.99
3500
3000
2500
2000
1500
1000
500
0
`cr
ore
3029.55
`cr
ore
1272.48
547.75301.26198.40
2624.75
2003-04 2005-06 2007-08 2009-10 2011-12 2003-04 2005-06 2007-08 2009-10 2011-12
4,311.17
2,170.411,420.701,068.85 394.55
111.48
3000
2500
2000
1500
1000
500
02003-04 2005-06 2007-08 2009-10 2011-12
EBITDA
KEY RATIOS
Particulars 31-Mar-12 31-Mar-11 31-Mar-10 31-Mar-09
Profi tability Ratios
EBITDA (%) 29.49% 29.42% 29.52% 27.63%
Profi t Before Tax Margin (%) 8.56% 9.78% 8.69% 9.57%
Profi t After Tax Margin (%) 4.28% 6.33% 5.74% 6.33%
Return on Capital Employed (%) 12.63% 11.72% 9.25% 7.36%
Return on Net worth (%) 13.88% 13.05% 9.11% 10.73%
Balance Sheet Ratios
Net Total Debt - Equity 3.14 2.75 2.62 3.56
Net Total Debt / EBITDA 4.37 4.53 5.59 7.60
Current Ratio 1.24 1.26 1.53 1.22
Coverage Ratios
PBDIT/Interest 2.28 2.55 2.38 2.70
Net Fixed Assets/Secured Loans (1st Charge holders)
2.31 2.58 2.27 1.89
Debtors Turnover - Days 88 99 93 108
Inventory Turnover - Days 139 114 125 116

INNOVATIVE TEXTILE SOLUTIONSINNOVATIVE TEXTILE SOLUTIONS
31Innovative Textile Solutions
KEY RATIOS31-Mar-08 31-Mar-07 31-Mar-06 31-Mar-05 31-Mar-04 31-Mar-03
25.24% 22.52% 21.21% 19.97% 18.56% 17.24%
11.70% 10.90% 13.19% 12.80% 11.79% 11.67%
7.73% 7.41% 9.78% 9.71% 9.43% 9.05%
6.98% 8.05% 10.22% 14.65% 17.94% 18.61%
11.72% 13.11% 16.13% 18.28% 30.22% 28.51%
2.86 2.49 2.08 1.52 2.27 2.10
7.47 6.21 5.57 3.71 3.75 3.83
1.33 1.32 1.82 1.92 1.34 1.33
4.15 4.62 4.51 3.84 2.99 2.66
1.73 1.46 1.56 1.44 1.56 1.45
102 109 91 120 149 122
116 93 92 108 70 128
2,716.19
807.53
3,655.50380.53
Net BlockGross Block
1,87
4.24
579.
5369
0.84 2,
121.
89
3,89
1.30
4,36
8.05
7,14
5.11
8,21
5.61
12,00011,00010,0009,0008,0007,0006,0005,0004,0003,0002,0001,000
0
9466
.25
2003-04
2003-04 2005-06 2007-08 2009-10 2011-12
2005-06 2007-08 2009-10 2011-12 2003-04 2005-06 2007-08 2009-10 2011-12
400
350
300
250
200
150
100
50
0
4000
3500
3000
2500
2000
1500
1000
500
0
247.34
167.73
109.2171.08
Operating Profit After Tax
Fixed Assets
Net Worth
1184
0.67
1,431.34
327.65
` cr
ore
` cr
ore
` cr
ore

61
55
53
59
32 26 Annual Report 2011-12
BOARD OF DIRECTORS

63
70
65
33Innovative Textile Solutions
INNOVATIVE TEXTILE SOLUTIONS
BOARD OF DIRECTORS
Mr. David Rasquinha (51) is an Independent Nominee Director ofthe company since October 2009, nominated by Export ImportBank of India. He holds a first class graduate degree in Economicsfrom Bombay University. He also holds a Post Graduatequalification in Business Management from XLRI, Jamshedpur,where he was awarded a Gold Medal in Economics. He is withExport Import Bank of India since 1985, and is working asExecutive Director.
He has a wide range of exposure and experience in the fields ofexport credit, treasury, multilateral agency funded projects,planning & research, risk management, trade finance and projectfinance.

60
66
47
26 Annual Report 2011-1234
BOARD OF DIRECTORS

INNOVATIVE TEXTILE SOLUTIONSINNOVATIVE TEXTILE SOLUTIONS
35Innovative Textile Solutions
Dear Shareholders,
The global economies in 2011-12, witnessed slowdown. Euro zone was worst affected. US economy, though impacted, has now started showing sign of mild recovery. China and Indian economies which were driving the global economy for some time are also showing signals of slow down.
Surely, the prevailing economic environment has had an impact on the global apparel and textiles industry. Having said so, we strongly believe that economic cycles will always exist and companies like Alok, which have a long term vision will have to rely on identifying and delivering on pockets of opportunity that are always there even in the worst of economic conditions. The healthy growth in revenue in 2011-12 is testimony of the same as indicated below:
� Domestic sales was up 41% to ` 5871 crore; Exports was up 37% to ` 3,030 crore; and total sales was up 39% to ` 8,901 crore
� Operating EBIDTA increased by 40% to ` 2,625 crore in 2011-12, while operating PBT increased by 22% to ` 762 crore in 2011-12
However, the Profi t After Tax in 2011-12 was ` 381 crore as compared to ` 404 crore in 2010-11 representing a decline of 6%. This is mainly on account of Mark to Market (MTM) losses on foreign exchange transactions taken by the Company due to the unusual depreciation in the value of the Indian Rupee (INR) against US Dollar (USD) during the year. The same has been booked as an exceptional item loss of ` 121 crore. These losses are an accounting entry, which have not yet materialised and subsequent reverse movements in the rupee dollar exchange rate could actually wipe out this loss. So, looking at operations based parameters for the Company one fi nds a healthy growth in profi ts.
This ability to deliver even in diffi cult times is attributable to Alok’s strategic positioning as an integrated business across both the cotton and polyester value chains catering to diversifi ed global markets. Let me explain this:
On the supply side, Alok has integrated production facilities right from raw material processing to the fi nished garment manufacturing for both cotton and polyester. The market goes through various ups and downs in each segment of the value chain and the integrated facilities help Alok focus on the specifi c segments that provide the
CHAIRMAN’S MESSAGE

36 26 Annual Report 2011-12
Company with greatest value
On the demand side, the Company continues to penetrate newer markets in terms of geography and products. Today, exports account for close to 34% of the Company’s stand-alone sales and it has established strong relationships with leading global brands across the globe – the exports are well diversifi ed with 36% to the US, 29% in Asia, 18% in South America and 14% in Europe. The diversifi cation helps de-risk against local market downturns. Also, the customer base is well distributed between traders, converters and fi nal product users.
Similarly, the presence in cotton and polyester, which are often treated as substitutes in the market, gives the Company the scope to best leverage market conditions. In fact, today, polyester’s share in the Company’s total sales has grown to 34% and the focus on value added polyester products like Cationic yarn is paying dividend.
The major capex programme for developing this large integrated production capacity was completed by March 2012. Going forward, in the next few years the focus is on value added and balancing capex related capital investments. The new capital investment would, however, be limited to the extent of the annual depreciation so as to generate free cash fl ow. Clearly, the Company is moving from a phase of large investments to create global scale capacities to a phase of consolidation when efforts will focus on getting optimum returns from these capacities.
� There are three fundamental goals in this phase:
� Maximising ROCE (Return on Capital Employed)
� Monetising and exiting non-core businesses
� Generating free cash fl ow and deleveraging the company
Maximising ROCE
The Company is implementing a change management programme across its facilities that is specifi cally targeting for effi ciencies in terms of optimising cost of operations to maximise ROCE. This programme is progressing well and one expects to see substantial positive results soon.
In addition, the Company is pursuing a specifi c strategy to improve asset turnover of the integrated cotton business by increasing the volume of value added products like yarn dyed (structured) fabrics, technical textiles and institutional work wear. There also stress at growing the share of the Polyester business where asset turnover and ROCE is signifi cantly higher.
Exiting and Monetising non-core businesses
The Company has in-principle decided to exit all non-core businesses. Active steps are being taken to sell the commercial real estate that the Company had invested in. For Ashford Centre and Peninsula Business Park, we have appointed a leading global real estate consultant and have already entered into around ` 500 crore worth of transactions. Cash fl ows from these are expected by the end of the second quarter of 2012-13. New strategies are being developed for the retail businesses in India and UK to make them thin on capital intensity and bring back some of the capital invested in these ventures back into Alok.
Generating free cash fl ow and de-leveraging the company
With the intensive capex programme almost complete, the efforts at monetisation of non-core business assets and improvement in working capital cycle, one expects improved cash fl ows in Alok’s system. This improved cash fl ow with the decision to undertake marginal incremental investments; would result in generation of free cash fl ow. In this way, with clear focus on operations and ‘sweating assets’ we should be able to substantially reduce our debt burden and de-leverage the Company.
CHAIRMAN’S MESSAGE

INNOVATIVE TEXTILE SOLUTIONSINNOVATIVE TEXTILE SOLUTIONS
37Innovative Textile Solutions
I urge you to read the details of our operations in 2011-12 that has been elucidated in the chapter on Management Discussion and Analysis.
Going forward, we expect the macro-economic conditions to be subdued in the next couple of years. At Alok, we have the integrated capacity base in place supported by the increasing growth in customer relationships. We are going to leverage both these to gain market share and continue with our growth path. We remain cautiously optimistic on delivering results with a strong focus on delivering improved returns on capital employed.
In fact, apart from competing and delivering in the domestic market, we believe we are ready to drive India’s export thrust in global markets. In the last 10 years global textile trade has been dominated by China. But, recently, China is witnessing an increase in labour costs, currency appreciation and environmental concerns that have affected their competitiveness. In the long run, the need to cater to a growing domestic demand with the shift to becoming an advance economy that has less emphasis on sectors like textiles will provide an opportunity to country like India to expand its market share. This opens up opportunities for Alok.
This ambition and vision, which focuses on continuous delivery at the highest standards is only possible with the right quality of people. Consequently, effective HR practises play a critical role in Alok’s business. Systemic efforts are made to ensure that the most appropriate people are recruited into the organisation. Across the Company and its subsidiaries and associates, we seek to continuously promote a culture of training, people development and meritocracy to ensure that maximum human capital effi ciency. From the employee’s perspective, there is satisfaction of working in an organisation that encourages skill development and learning and monitors career growth.
I would like to take this opportunity to thank each and everyone associated with the Alok Group. Let me also extend a special word of gratitude to all our vendors, employees and customers. Finally, thank you to our shareholders for reposing faith in our business.
Yours Sincerely,
Ashok B JiwrajkaExecutive Chairman
CHAIRMAN’S MESSAGE

38 26 Annual Report 2011-12
Having built sizeable capacities across the value chain in cotton as well as in polyester, your company has now commenced its phase of consolidation in right earnest. We would be taking several initiatives towards this end:
- exiting all non-core businesses
- being more disciplined in our use of cash, rationalization of new capital expenditure and intensifying our focus on high profi table areas in textiles;
- expanding our product portfolio and business markets;
- continuing to effectively manage costs and improve plant effi ciencies;
- sharpening customer focus; and fi nally
- creating and encouraging a high performance culture.
We will internally reinforce strategies to bring about overhead reductions, procurement savings and newer products that carry the stamp of our cutting edge innovation. We will endeavor to improve cash fl ows and leverage that to accelerate revenue and earnings growth. We would continue our efforts to be the market leadership through product innovation and expand our presence in new business geographies.
Our objective now is to be seen as the innovation leader for our industry. This focus cements our commitment to customers to continually improve the value proposition we offer.
With optimization of new expanded capacities and the completion of the balancing capex programmes, we anticipate our sales, profi ts and cash fl ows to improve substantially from fi scal year 2013. Going forward, the objective would be to focus on innovation, expanding our position across new markets and to leverage our dominant position to accelerate growth.
Your company now embarks on the most important leg of its journey thus far. This is an exciting time for the company and we expect sustained growth and continued improvement in shareholder returns since all building blocks are in place.
Dilip B. JiwrajkaManaging Director
MANAGING DIRECTOR’S MESSAGE

INNOVATIVE TEXTILE SOLUTIONSINNOVATIVE TEXTILE SOLUTIONS
39Innovative Textile Solutions
In the 26 years of our existence, Alok has gained in strength in all aspects of its operations.
Our remarkable journey to the forefront of the textile business is achieved out of a vision to be rated alongside the best in the world. As our journey steams ahead, we are expanding our vision to conquer new horizons.
We at Alok strive to be distinct in our efforts to provide textile solutions that are innovative and the best. We will continue to stay true to our values and mission – a company focused on becoming the world’s best integrated textile enterprise, driven by the quality of our products and the passion of our human capital. Our entire value system revolves around Innovation and Excellence. For over two decades, we have relentlessly invested in cutting edge technology that has provided us the ability to offer a wide suite of products across the cotton and polyester segments on a scale and at price points that match global standards.Our country is witnessing, perhaps her most exciting phase in textiles and we see Alok being fully ready to ride this opportunity.
We are committed to adhere to socially responsible business practices that ensures the well-being of the communities in which our business operates. We have set high standards for our operating divisions in the area of environmental responsibility — by striving for performance that reduces our environmental impacts. We try to maximize use of renewable energy and optimize use of natural resources.
Over the past few years, we have successfully created an enterprise of global standards in terms of capacity, size, infrastructure, product range and innovative approach. We will continue our march towards transforming ourselves into a company that will stand for inclusive growth and reward stakeholders consistently.
I would like to convey my thanks to all our shareholders for their unfl inching support. I would also like to thank our customers, legal counsel, suppliers, bankers, auditors and various government authorities for their cooperation. I also would like to appreciate the tremendous efforts and enthusiasm of our employees who are primarily responsible for the results.
Surendra B. JiwrajkaJoint Managing Director
JOINT MANAGING DIRECTOR’S MESSAGE

The skills required to start a business are often very different fromthe ones required to lead it. As second generation entrepreneurs,we draw a huge advantage in terms of getting a ready platform inAlok to work from.
Of course there are different set of challenges that we have toface, as the company which is in operation for more than twodecades has developed a certain culture and set mind-set ofdoing business.
We have realized that our main role will be to constantly evolve toanother level of efficiency and level of service. We need to be notonly effective managers but also process innovators.
We do understand that the business environment and challengeswere quite different when this business was founded and built.Now in this fast paced world, everything is changing fromtechnology, competition, processes to human aspects. This is thereal challenge for new generation entrepreneurs.
We believe that imbibing of the following traits are key toachieving success consistently: vision, constant learning, trust,values and people skills.
Alok has offered us the opportunity to:
�Scale the business further from where we started our careerand freedom to add value and build something of our own;
�Follow the path already laid, extend it further and evenmake new roads, and
�Allow people to think outside the box and make thoughtswork.
It will be our endeavor to build on the efforts of the existing teamto take Alok to greater heights.
We are committed to transform Alok into the largest and besttextile company in the world for all stake holders with specialemphasis on R&D, product innovation, generating free cash flowand improving key ratios, especially the ROCE.
“We are committed totransform Alok into the largest and best textilecompany in the worldfor all stake holderswith special emphasis on R&D, productinnovation, generatingfree cash flow and improving key ratios,especially the ROCE. ”
Seated: Niraj D. JiwrajkaStanding L to R : Alok A. Jiwrajka,
Varun S. Jiwrajka
40 26 Annual Report 2011-12
YOUNG LEADERS

Mr. Sunil O. KhandelwalChief Financial Officer
Under the challenging market conditions prevailing last year, Alok'ssales growth of 39% and export growth of 37% to reach Rs. 8901 croreand 3030 crore respectively is creditable.
What clearly emerges is that the strategy adopted by Alok i.e. that ofaggressive expansion since 2005 and building up a large scaleintegrated model in cotton and polyester with state of the arttechnology, is now proving to be a prudent one.
The journey till here for Alok has been eventful. We have grown intothe largest integrated textile company in the country and amongst thebiggest in the world. We realize our core strength is textiles. Havingderived much insight into our business and a clear path to follow, webelieve our journey from here onwards will be more interesting andrewarding.
We have formulated following strategy to improve the performanceand return ratio significantly from here:
Exiting the non-core business of real estate and use itsproceeds to reduce debt.
�Equity infusion into the company to improve debt equity andrating. The improved rating would reduce our interest cost.
�We have formulated a strategy to nearly double our ROCE inthe next few years by focusing on:
�Improving the asset turnover of the capitalintensive integrated cotton textile business from0.5 time to 1 time by focusing more on value addedproducts such as yarn dyed fabrics and technicaltextiles; and
�Gradually increasing the capacities of polyesterintegrated yarn business which commands a higherasset turnover of 2.25 times, lower working capitaldays and thereby higher ROCE (Return on CapitalEmployed).
�Start generating free cash flow by limiting our capitalexpenditure and reducing working capital cycle.
I have also rediscovered my role as CFO as ‘Cash Flow fromOperations’ and making every one in the company ROCE conscious.
We believe in the current golden phase of Indian textile industry,Alok is well placed to capitalize on both domestic & exportopportunity. With a clear focus on our above mentioned strategy,we are committed to meet the expectations of our stake holdersand are now better equipped and confident of delivering betterreturns in times to come.
�
“I have also rediscovered my role as CFO as ‘Cash Flow fromOperations’ and making every one in the company ROCEconscious.”
41Innovative Textile Solutions
INNOVATIVE TEXTILE SOLUTIONS
MANAGEMENT SPEAK : FINANCE

It is with a feeling of pride and satisfaction that we look back onthe last 26 years that have rolled by. We have been growing at aconsistent rate on both, sales and PAT, a fitting testimony to ourconviction and vision. We have invested close to USD 2 billion inthe last six years in vertically integrating ourselves in the cottonand polyester value chains. This smart move provides a naturalhedge to the business model while allowing for growthopportunities in both segments to be capitalized on.
Having achieved critical economies of scale, we are nowstreamlining efficiencies, reducing costs of production effectively,right-sizing manpower, sharpening risk management tools andenhancing levels of governance. These measures are part of ourstrategy to transform ourselves into the largest and best textileenterprise in the world well before the end of this decade.
As our company comprehensively moves towards attaining adominant position in the global textile arena, we will reinforce ourEnterprise Risk Management (ERM) tools and techniques. Ouraim will be to move beyond a “silo” scope of risk to acomprehensive, fact-based scope of risk that allows for risk to bemanaged coherently and facilitate strategic decision-making. Wewill develop and implement rigorous processes to assess andaddress risks from all sources that threaten the achievement ofour strategic objectives
We will also continue to inculcate best-in-class corporategovernance practices to ensure commitment of the Board inmanaging the company in a transparent manner for maximizinglong-term value of the company for its shareholders and all otherpartners. Our fundamental objective of governance is to enhanceshareholders' value and protect the interests of otherstakeholders by improving the corporate performance andaccountability.
We will focus on our invaluable human resources with renewedvigour. We will endeavor to develop a HRD framework for helpingemployees develop their personal and organizational skills,knowledge, and abilities. Our transformational focus of all aspectsof HRD will be on developing the most superior workforce so thatthe organization and individual employees can accomplish theirwork goals in service to customers.
As our country confidently embarks on what could be toutedIndia's most exciting decade in textiles, we at Alok are realisticallyoptimistic of carving out a dominant share in the global markets aswe now possess the necessary size, skills, knowledge,infrastructure, products, ethics, values, talent and management.
“confidently embarks on what could be toutedIndia's most excitingdecade in textiles, we atAlok are realisticallyoptimistic of carving out a dominant share in the global markets as wenow possess the necessary size, skills, knowledge,infrastructure, products,ethics, values, talentand management.”
As our country
Mr. K. H. GopalPresident (Corporate Affairs) & Secretary
42 26 Annual Report 2011-12
MANAGEMENT SPEAK : RISK, GOVERNANCE & HR
Mr. Sapan MukherjeeChief Executive Officer-Spinning'Spinning a Web of Success'
Alok's Spinning division was set up in 2007, as a backwardintegration measure. Commencing operations with a rather modest50000 ring spindles and 900 rotors, we consistently addedcapacities to become amongst the largest spinning units in thecountry with 4,11,000 ring spindles and 5960 open end rotors.
The technology adopted is highly modern and automated. The unitis capable of producing wide range of cotton / blended yarn startingfrom 6 OE count to 120 count ring yarn both compact and regularyarn. We also have in-house gassing and doubling capacities forhigher applications.
All these were made possible through the able guidance,continuous support and vision of the top management and oureminent Board. Of course, part of the credit also goes to thededicated team of spinning professionals who have contributedimmensely into the company through their vast experience anduntiring efforts.
Since our inception, we have crossed many milestones and reachedgood levels of productivity and quality of yarns. Almost 95% of ourproduction is consumed in-house in our weaving and knitting units.The requirement, however of our weaving, knitting, terry and yarndyeing divisions is much higher than our production with ourdivision contributing to about 60% of the total yarn requirement. Inview of this, we may consider adding some more capacities inSpinning in the near future to de-risk vagaries of the markets.
Alok has identified technical and specialized fabrics as its area ofgrowth in future and towards this end, we are setting up a dedicatedspinning unit of 11332 spindles and 360 rotors capable of producingspecialized yarn, thus making Alok integrated in technical textiles aswell.
In the years to come we will further improve aspects likeproductivity, quality to make this business unit even moreprofitable. We are ready to face challenges of a tougher,competitive and uncertain market. We will continue to put in ourbest efforts and retain skilled work force through good trainingprograms which will be vital when we add capacities and achievegreater milestones.
Achieving the highest level of productivity with the lowest possibleinput cost and maintaining the highest level of quality acrossproducts lines will be the key area that we intend to focus for thetimes ahead.
“Achieving the highestlevel of productivitywith the lowestpossible input cost and maintaining the highestlevel of quality acrossproducts lines will be the key area that weintend to focus for the times ahead.”
43Innovative Textile Solutions
IINNNNOOVVAATTIIVVEE TTEEXXTTIILLEE SSOOLLUUTTIIOONNSS
MANAGEMENT SPEAK : COTTON SPINNING

The polyester division recorded sales of Rs. 2979.22 crore in 2011-12,a growth of 76.48 % over 2010-11. Revenues from polyesterconstituted about 33.47% of the overall revenues of the company.
Our continuous polymerization plant produces melt to producevarious types of polyester yarn in capacities that match a global scale.The CP plants are set up with state-of-the art technology fromChemtex- USA, POY machinery from Barmag- Germany, FDYmachinery from TMT- Japan & Barmag- Germany and PolyesterStaple Fibre from CTMTC.
With this unique set-up, the company offers a wide range of productsthat include POY, DTY, FDY, polyester chips, cationic yarn and PSF fordiverse applications. The distinguishing feature of Alok's polyesterdivision is its focus towards finished products, which constitutesalmost 70% of its polyester capacity.
Polyester business is highly volatile in nature on account of largefluctuations in raw material prices which are linked with movementin cotton prices as well as crude oil and global demand and supply.Our objective is to mitigate this risk effectively and position ourselvesas a dominant player in the segments that we operate.
Our philosophy is to produce products with a wide range ofapplications at the lowest possible cost in order to be competitivewith the product quality exceeding global standards for customerdelight. The entire strategy is to place our volumes in niche marketsglobally for a wide array of specialized applications. With the launchof PSF in the second half of this year, we should be able to offer alarger product basket and higher profitability.
Our key initiative for the current year would be to place at least 75%of our production (which would be a wide range of products likeDope Dyed Yarn, Cationic Yarn, Full Dull Yarn and Micro Filament) inthe overseas market, where margins are better. Our large investmentin automation should result in better product quality with minimaldamage and a superior product for the customer.
We are confident about the prospects of the Indian Textile industryand will contribute our part in making it a reality. The innovation inpolyester in improving its feel and breathability to provide similarcomfort like cotton should be the order of the day for the growingIndian domestic market. We look forward to the future with quiteoptimism.
“the prospects of the Indian Textile industry and will contribute our part in making it a reality. The innovation in polyester in improving its feel and breathability to providesimilar comfort like cottonshould be the order of the day for the growing Indian domestic market. We look forward to the future with quite optimism.”
We are confident about
Mr. Reshabh RaizadaChief Executive Officer-Polyester & Retail
44 26 Annual Report 2011-12
MANAGEMENT SPEAK : POLYESTER YARN
“With our fully integrated business setup, large scale, modern plants and infrastructure, webelieve Alok is bestequipped to derivemaximum advantage of the emergingopportunities in the Indian Textile industry.”
Mr. Rohit SeruPresident-Apparel Fabrics
Alok is leader in woven apparel fabric segment and our range iswide enough to capture almost all requirements of ourdemanding customers. It's also a major revenue segment for Alok,constituting about 43.41% of the total revenue of the company.Our key result areas in 2011-12 have been:
Total woven apparel fabric sales achieved a growth of41%, which increased to Rs. 3863 crores in 2011-12 fromRs. 2731 crores in 2010-11.
Exports sales recorded higher growth of 108% andincreased to Rs. 568 crore in 2011-12 from Rs. 272 in2010-11.
Average price realisation increase from Rs.103 per meterto Rs. 107 per meter.
Alok is looking forward to a robust business plan in woven apparelfabrics. We shall strive to continue to hold a leadership position inthis segment. Our passion is to continuously strive for highstandards of quality and delivery and have a delighted customeralways.
Our focus in 2012-13 would be to:
Achieve sales growth by focusing on volume growth andimprovement in overall average rate per meter.
Change our product mix in line with our focus on valueadded products, such as:
I. Yarn dyed woven fabric business,
ii. Printed apparel and institutional business; and
iii. increase our presence in the specialized WorkWear and technical textile business
Develop business with major Work Wear brands in USA &Europe. And target international defence business in theuniform and specialty business.
With our fully integrated business set up, large scale, modernplants and infrastructure, we believe Alok is best equipped toderive maximum advantage of the emerging opportunities in theIndian Textile industry.
�
�
�
�
�
�
45Innovative Textile Solutions
IINNNNOOVVAATTIIVVEE TTEEXXTTIILLEE SSOOLLUUTTIIOONNSS
MANAGEMENT SPEAK: WOVEN APPAREL FABRICS
Mr. Tulsi KarnaniChief Executive Officer-Weaving
“Having built the country's largestweaving capacity wefeel this is just the beginning. With our special thrust on research and innovation, we arecommitted to make our textiles “a differentbusiness for a differentfuture. ”
The products manufactured by our weaving unit are normal widthand wider width greige fabrics. The financial year 2011-12 in manyways was a landmark year for our weaving plant:
We are privileged to have the largest number of air jet/ rapierlooms at one location in the country. Also with about 800 Airjetlooms under one shed, we possess probably, the largest weavingshed in the world.
In the year under discussion, we achieved a record production.And we are getting ready to break our own record in 2012-13 aswe optimize our capacities and increase the running speed andefficiency of the looms.
We produce a wide range of fabrics with different weaves such asplain weave, satin weave, twills, dobbies, jacquard, yarn dyed andtechnical fabrics, amongst others.
We continuously put in efforts to improve efficiency, reduceinventory and make our products more competitive. We alsocontinuously explore efficient means to reduce our cost per pick(thereby cost per meter), shrink our total lead times and enhancecustomer satisfaction by producing quality products andintroducing new developments.
For example, in case of woven apparel fabrics, yarn dyed fabric,our value added product segment, we reduced the overall lead time of 131 days in April-2011 to 60-65 days in Feb-2012 / March2012. Similarly, we improved the production of this value addedfabric during the year. We are further increasing the production ofthis value added yarn dyed fabric and expect to double it from thepresent level in the next few months by increasing yarn dyedcapacities.
Having built the country's largest weaving capacity we feel this isjust the beginning. With our special thrust on research andinnovation, we are committed to make our textiles “a differentbusiness for a different future.
46 26 Annual Report 2011-12
MANAGEMENT SPEAK : WEAVING

Our splendidly modern plants covering almost all kinds of narrow
and wider width fabrics, knits, yarn dyeing and terry towel
possess dye-print-finish capabilities of the highest order.
Being at the end of the final value chain for finished fabrics, we
impart maximum value addition to the fabrics. The testimony of
the quality of our products is indicated by the fact that the
company is a preferred vendor to blue chip retailers, importers
and brands around the world and in the domestic market.
Alok has invested heavily in the processing segment and boasts of
having the highest processing capacity in the country. Alok's
processing facilities occupy the pride of place not only for the
company but also for the country.
With the most versatile and largest processing capacity, we are
quite naturally and justifiably proud of our set-up and aim to turn
it into the best in the world, in terms of production, cost and
quality.
We have targeted higher productivity with lower cost of
production by intelligent use of our resources and conversion of
fuel from CNG to coal within the third and fourth quarter of the
current year. In addition to this, rationalization and development
of right skills in employees has also been initiated to encounter
shortage of skilled manpower.
With strategic focus on value added fabrics such as yarn dyed,
technical and specialty fabrics, we will be strategically expanding
capacities in order to capitalize on the opportunities available to
the Indian Textile Industry as also to better balance out the
integrated set up of our company.
“With strategic focus on value added fabrics such as yarn dyed, technicaland specialty fabrics, wewill be strategicallyexpanding capacities in order to capitalize on the opportunities availableto the Indian TextileIndustry as also to betterbalance out the integrated set up of our company.”
Mr. S. S. AichChief Executive Officer-Processing
47Innovative Textile Solutions
INNOVATIVE TEXTILE SOLUTIONS
MANAGEMENT SPEAK : PROCESSING

Mr. Sanjay BhattChief Executive Officer- Embroidery
“As a strategicinitiative for 2012-13, we propose topenetrate the South American market tosell our products. ”
At our embroidery plants, we produce an exquisite range of schiffli
and multi head embroidered products that impart high value
addition to dress materials, garments and home furnishings.
Last year was challenging for us as our major market; the African
continent was facing a downturn; no different from the rest of the
world. We managed to tide over the circumstances and posted
sales of Rs. 161 crore, including exports of Rs. 105 crore.
We were co-promoted by Alok and an Austrian collaborator as an
independent company called Grabal Alok Impex Ltd., but with the
amalgamation of our business with Alok during financial year
2011-12, we have become an integral part of our parent company.
We see a lot of synergy in our business merging with Alok and
hope to provide an incisive edge to Alok's already formidable
range of products.
We can rightfully classify as having the largest embroidery
capacity in the country and amongst the largest in the world too.
We believe in a simple philosophy which has helped us grow our
business year on year. We believe that our customer's shop is our
shop and our factory is the customer's factory. We complement
each other - we have grown because of our customers and our
customers look up to our support in terms of new designs and
developments to grow their business.
We cater to various markets, domestic and overseas. Our
marketing strategy is rather unique in the sense that we add two
or three markets every year. Also, to maintain exclusivity of our
designs and as a measure of comfort to our existing clients, we
avoid adding new customers in existing markets.
As a strategic initiative for 2012-13, we propose to penetrate the
South American market to sell our products.
48 26 Annual Report 2011-12
MANAGEMENT SPEAK : EMBROIDERY

Mr. Arvind MauryaChief Executive Officer-Knits
“Our goal would be tomake the most of this situation and position our division as a preferred / nominatedvendor for global buying houses and retailers due to our QCD (Quality, Costand Delivery)parameters.”
Last year was a bit challenging year as our major markets, USAand Europe witnessed slow down. But we believe, challengesdo not come alone, they bring with them opportunities andglory. Accordingly, we were able to sight opportunity to growour business on domestic turf and recorded a growth of 11% insales which increased to Rs. 268crores in 2011-12 as comparedto Rs. 241crores in 2010-11.
Looking at the growing opportunities in domestic and exportmarkets, we are increasing our knitting capacity from thecurrent 18200 tons per annum to 25000 tons per annum in thecurrent fiscal year.
It would be our endeavor to establish ourselves as the best andbiggest weft knitted fabric supplier in the SAARC (The SouthAsian Association for Regional Cooperation) region by the endof fiscal year 2012-13. The other important area where wewould be focusing this year is on developing technical wear andsportswear fabric segments. To support us in these endeavors,we are setting up a competent and world class R&D facilitywithin Alok.
We realize that India is on the threshold of an exciting newphase of prolonged growth in textiles with the domestic marketalso offering sizeable opportunities.
Our goal would be to make the most of this situation andposition our division as a preferred / nominated vendor forglobal buying houses and retailers due to our QCD (Quality, Costand Delivery) parameters.
49Innovative Textile Solutions
IINNNNOOVVAATTIIVVEE TTEEXXTTIILLEE SSOOLLUUTTIIOONNSS
MANAGEMENT SPEAK : KNITTED APPAREL FABRICS

Alok's home textile division recorded Sales of Rs. 1250 crore in 2011-12, a growth of 25% over the previous year. This division's exportrevenue of Rs. 1220 crore accounted for 40% of Alok's overall exportrevenue and can rightfully be regarded as the export growth driverfor the company. It has recorded a consistent CAGR of 29% over thepast 8 years, i.e. from the time it was incepted.
In a year where global economy was in turbulence and the marketsize of the Home Textile remained flat, Alok had a healthy growth inthe Home Textiles business. We achieved some major milestones:
�We expanded more 'owned brands' and had proprietarytechnologies placed in the private label programs of majorretailers, giving us a distinct competitive advantage.
�Alok also received patent in a fitted sheet technology –Optifit. We signed rights to major brands – Ellen Tracy, RoyalSateen, Mary Jane Farms, Caribbean Joe. This helped usgrab market share in areas where we were unable tocompete earlier.
�We launched new categories – Table top, Soft Window,which should be major growth vehicles in the years tocome.
�Terry towels took a firm footing with strong programs inmarket place and product being placed in better and bestend of the market.
Our division secures its strength from the impressive spinning,weaving and finishing facilities of our company. This infrastructuraladvantage is unique and unparalleled when combined with themarketing acumen of a group of strongly motivated professionals.
To retain our advantage in an increasingly competitive world:
�We will continue to boost operational efficiency
�We will be keeping one eye on our existing customers andendeavouring to delight them, while keeping the other eyeon diversifying our markets further into new territories.
�We will strive not only to meet their expectations, but toexceed them. This would translate into excelling on quality,delivery and price.
�Also, in order to retain our competitive edge, we willcontinuously introduce innovative products customized tomeet specific customer needs.
As our company marches assertively towards carving out a nichespace in the new exciting phase of the Indian textile industry, we willfocus efforts in reinforcing our triple bottom line of: Delightingcustomers, Empowering employees; and Rewarding stakeholders.
“Our division secures its strength from the impressive spinning,weaving and finishing facilities of our company.This infrastructuraladvantage is unique and unparalleled when combined with the marketing acumen of a group of stronglymotivatedprofessionals.”
Mr. Arun AgarwalChief Executive Officer,Alok International Inc.
50 26 Annual Report 2011-12
MANAGEMENT SPEAK : HOME TEXTILES - BAD LINEN

Mr. Sanjay Deora Chief Executive Officer-TerryTowels
For Alok's Home Textile division, already with a strong foot hold inthe sheeting business, investment in terry towels was just a steptowards making Alok a one stop destination for Home TextileBuyers.
Alok's Terry Division started two years back and has recentlydoubled its capacity to 1100 tonnes / month, with plans to doublethis in the next two years.
We achieved revenues of Rs. 159 crore (about USD 30 mn) in salesfor fiscal 2011-12 and are targeting to double sales in the currentyear backed by the additional capacities and a strong order book.
Currently our major markets are USA, UK, Japan, Australia and NewZealand. We are exploring new markets like Russia and SouthAmerica and will b constantly looking to expand our markets.
In the competing environment, especially from domesticcompanies, we are making our mark with major retailers worldwidethrough strong R&D. In two years we have launched newtechnologies like Cloud Zero, Dura and quick dry towels , giving us aleading edge with many leading retailers.
Our major focus remains introducing terry towels throughinnovation in new fiber and process technologies. With atomizationat every stage of production we are confident of achieving bettermargins and high economies of scales as we add capacities.
Though markets globally are bit slow and India's terry capacity ispoised to increase further. We do boast an overflowing order book for the next 9 months. We aim to position ourselves as the best inthe terry industry and plan to aggressively increase our market shareyear on year.
We would continue our endeavor to be a ONE STOP SOURCE for ourHome textile buyers and are confident of growing our business bydelighting our customers with our service and product innovation.
“We would continueour endeavor to be a ONE STOP SOURCE forour Home textilebuyers and areconfident of growingour business bydelighting our customers with our service and productinnovation.”
51Innovative Textile Solutions
IINNNNOOVVAATTIIVVEE TTEEXXTTIILLEE SSOOLLUUTTIIOONNSS
MANAGEMENT SPEAK : HOME TEXTILE - TERRY TOWELS

The previous year was a satisfactory one for us. Despite aslowdown in our major markets we could achieve revenue of Rs.217 crore, representing a growth of 25 %.
As we look ahead, prospects seem bright for the garment businessat Alok. Till date, we were oriented towards fashion garments. Weare, however now focusing on new emerging opportunities inIndustrial and Work Wear garments. There are some prerequisitesto be strictly adhered to in this segment like constant innovation,networking and better supply chain management with ability tolink up to the global value chain. This would also complement ourTechnical Textile division, where we make specialized fabric forvarious applications.
Though our garment division is presently export oriented, wefirmly believe that the readymade garment segment will be theprinciple driver of growth in the domestic industry once the FDI inthe retail sector is opened up, which in our opinion is just a matterof time.
Having built up the right size with the right infrastructure, Alok is ideally placed to take on competition by offering large volumes atcompetitive prices with attractive lead times. Alok, with itsvertically integrated operations and a varied product basket,offers itself as an ideal partner for any brand in the Indian andoverseas markets.
The "Women Empowerment Program" started in year 2007 hasbrought about a social change and given a productive and stablework force. It has made the division grow by almost 500% sincethen.
Every individual in the division is tuned to operate with amarketing focus rather than production, as with a marketing focusone operates from a position of servicing a client while withproduction focus one operates mainly from a position of cost. Thiscontinues to remain our mantra for success.
“Every individual in the division is tuned tooperate with a marketing focus ratherthan production, as with a marketing focus one operates from a position of servicing a clientwhile with productionfocus one operatesmainly from a position of cost. This continues toremain our mantra forsuccess.”
Mr. Romi AgarwalChief Executive Officer-Garments
52 26 Annual Report 2011-12
MANAGEMENT SPEAK : GARMENTS

Mrs. Mala MukherjeeHead-Hemming
“Integrating Business Opportunities to Sustainability”
At Alok's Hemming division, the products manufactured are'Handkerchiefs' and 'Cotton Bags' with a strong focus on'Sustainability'. These products are not only value additions interms of revenue and volumes to the mainstream fabricbusiness but aim at supplying Organic, Fair Trade and BetterCotton products to Alok's global customer base.
Over the years we have not only created a new business groupbut have been successful business partners with global retailgiants.
For the year 2011-12, our division recorded a sales of about Rs.20 crores.
Going forward we want to expand our horizon to cover manymore customers across the globe. Towards this end, we haveadded more products to our existing product line such as table-linen and other fashion accessories which will further reinforceour vision.
“Going forward we wantto expand our horizon tocover many morecustomers across the globe. Towards this end, we have added moreproducts to our existingproduct line such as table-linen and other fashion accessories which will further reinforce our vision.”
53Innovative Textile Solutions
IINNNNOOVVAATTIIVVEE TTEEXXTTIILLEE SSOOLLUUTTIIOONNSS
MANAGEMENT SPEAK : HANDKERCHIEF & ORGANIC BAGS

Despite the tough market conditions Mileta a.s. keeps its position
amongst the top European shirting producers, delivering fashion
and quality to international brands. Last financial year was not easy
in Mileta's core markets. South Europe is slowing economically and
the strong markets in the North are not fully compensating it. We
continue our efforts to grow in non-European markets. In shirting
our American and Canadian customers together with China, Middle
East and Turkey contribute positively to our turnover. Our next
target is South America and Russia, where we recently opened a
new office for the Alok Group.
Our African business in local fashion fabrics got a boost due to a
new product line launched. We expect to double our turnover as
against the last two years. Similar growth is to be expected in
Middle East, where we are becoming an important player in Arabic
robes and headscarves.
Being a proud member of Alok Group, Mileta a.s. benefits mainly
from combined purchasing power and focused sourcing. We are
extending lines for Home and Hotel collection, produced by Alok
and distributed by Mileta in Central European markets.
We would continue our endeavor to be a ONE STOP SOURCE for our
Home textile buyers and are confident of growing our business by
delighting our customers with our service and product innovation.
“We would continueour endeavor to be a ONE STOP SOURCE forour Home textilebuyers and areconfident of growingour business bydelighting our customers with our service and productinnovation.”
Mr. Petracek OtakarChief Executive Officer,Mileta a.s., Czech Republic
54 26 Annual Report 2011-12
MANAGEMENT SPEAK : MILETA - CZECH REPUBLIC

Mr Anupam Jhunjhunwala,Chief Executive Officer,Store Twenty One
Last year represented a very challenging trading climate for the wholeclothing Retail Industry across the UK. This was mainly due to Globalrecession, Cotton price increase, Adverse weather conditions,Increased competition within the value clothing market from otherretailers and internet sites, Massive discounting within the middlemarket brands thus eroding price differentials
This turmoil in the Retail Industry affected the sales and profitabilityof Store Twenty One as well.
Going forward, our plans are to be totally focused on being responsiveand reactive to the changing market and the economic conditions in the UK.
Our strategic focus is to be Value led as this is what the customerwants and needs. We will be buying less weather dependent rangesand focus heavily into core and essential products to ensure that wehave something to offer our customer, no matter what.
A huge amount of work has recently gone into bench marking ourprices against the supermarkets to ensure that we remaincompetitive and can offer an edge to our price sensitive customer. Forthis we are looking objectively at our marketing strategy.
Additionally in terms of marketing our brand; we are focusing on ourwindows as they are our key way to communicate to our customers.We will be much more aggressive with their stance and make themmuch more promotional and offer-led to continue driving this Valuemessage.
We have also brought in some external industry expertise to helpdrive the business into profit. These new additions will help instrengthening our management team and driving the companyforward.
We have established a strong niche in the UK market and we are in agood position to significantly drive the company forward this year.
“We have establisheda strong niche in theUK market and we arein a good position tosignificantly drive thecompany forward thisyear.”
55Innovative Textile Solutions
IINNNNOOVVAATTIIVVEE TTEEXXTTIILLEE SSOOLLUUTTIIOONNSS
MANAGEMENT SPEAK : STORE TWENTY ONE- UK

56 26 Annual Report 2011-12
NOTICE is hereby given that the Twenty Sixth Annual General Meeting of the members of ALOK INDUSTRIES LIMITED will be held on Tuesday, the 14 August 2012 at 12.00 noon at the Registered Offi ce of the Company at Survey Nos.17/5/1 & 521/1, Village Rakholi/ Saily, Silvassa – 396230, Union Territory of Dadra and Nagar Haveli, to transact the following businesses.
ORDINARY BUSINESS:
1. To receive, consider and adopt the Audited Balance Sheet as at 31 March 2012, the Profi t & Loss Account for the year ended on that date together with the Reports of the Directors and Auditors thereon.
2. To declare dividend on Equity Shares for the year ended 31 March 2012.
3. To appoint a Director in place of Mr. Ashok B. Jiwrajka who retires by rotation and being eligible, offers himself for re-appointment.
4. To appoint a Director in place of Mr. Dilip B. Jiwrajka who retires by rotation and being eligible, offers himself for re-appointment.
5. To appoint M/s. Deloitte Haskins & Sells, Chartered Accountants, as Auditors of the Company to hold offi ce from the conclusion of this Annual General Meeting until the conclusion of next Annual General Meeting and to fi x their remuneration.
In this connection, to consider and if thought fi t, to pass the following resolution, with or without modifi cation(s), as an Ordinary Resolution:
“RESOLVED that M/s. Deloitte Haskins & Sells, Chartered Accountants, (Registration No. 117366W) be and are hereby appointed as Auditors of the Company to hold offi ce from the conclusion of this Annual General Meeting until the conclusion of next Annual General Meeting, on such remuneration, plus service tax as applicable and reimbursement of out of pocket expenses in connection with the audit as shall be fi xed by the Board of Directors fi x in this behalf.”
SPECIAL BUSINESS:
6. To Consider, and if thought fi t, to pass, with or without modifi cation(s), the following resolution as a Special Resolution:
“RESOLVED THAT in accordance with the provisions contained in the Articles of Association and Sections 81 (1A) and all other applicable provisions of the Companies Act, 1956 (“the Act”) and the provisions contained in the Securities and Exchange Board of India (Employee Stock Option Scheme and Employee Stock Purchase Scheme) Guidelines, 1999 (“the Guidelines”) (including any statutory modifi cation(s) or re-enactment of the Act or the Guidelines, for the time being in force) and subject to such other approvals, permissions and sanctions as may be necessary and subject to such conditions and modifi cations as may be prescribed or imposed while granting such approvals, permissions and sanctions which may be agreed to by the Board of Directors of the Company (hereinafter referred to as “the Board” which term shall be deemed to include Remuneration or Compensation Committee to exercise its powers, including the powers conferred by this resolution), consent of the members of the Company be and is hereby accorded to the Board to extend the benefi ts of Alok Industries Limited Employee Stock Option Scheme 2010 (Alok ESOS 2010) approved by the postal ballot on 15th April, 2010 to employees/Directors of subsidiary Companies, whether Indian or Foreign Subsidiaries, existing and as and when formed, under prevailing laws, rules and regulations and /or amendments thereto from time to time on such terms and conditions as may be fi xed or determined by the Board on the basis of Salient Features of ESOS mentioned in the resolution which was approved by postal ballot on 15th April, 2010 and its annexure.
“RESOLVED FURTHER THAT the said Equity shares may be allotted directly to such employees/ Directors in accordance with a Scheme framed in that behalf and that the scheme also provides for any fi nancial assistance to the employee(s) to enable the employee(s) to acquire purchase or subscribe to the equity shares of the Company.”
“RESOLVED FURTHER THAT the new Equity Shares to be issued and allotted by the Company in the manner aforesaid shall rank pari passu in all respects with the then existing Equity Shares of the Company; unless otherwise decided by the Board of Directors of the Company.”
7. To consider and, if thought fi t, to pass, with or without modifi cations, the following resolution as a Special Resolution:
“RESOLVED THAT subject to statutory approvals, if any and in pursuance of the provisions of Section 314 of the Companies Act, 1956, consent of the Company be and is hereby accorded to Mr. Varun S. Jiwrajka,
NOTICE

INNOVATIVE TEXTILE SOLUTIONSINNOVATIVE TEXTILE SOLUTIONS
57Innovative Textile Solutions
a relative of Mr. Ashok B. Jiwrajka, Mr. Dilip B. Jiwrajka and Mr. Surendra B. Jiwrajka, Wholetime Directors of the Company, to hold an offi ce of profi t of the Company at an aggregate consolidated remuneration of upto ` 2,50,000/ – per month with effect from 01st September, 2012.”
8. To consider and, if thought fi t, to pass, with or without modifi cations, the following resolution as a Special Resolution:
“RESOLVED THAT subject to statutory approvals, if any and in pursuance of the provisions of Section 314 of the Companies Act, 1956, consent of the Company be and is hereby accorded to Mr. Niraj D. Jiwrajka, a relative of Mr. Ashok B. Jiwrajka, Mr. Dilip B. Jiwrajka and Mr. Surendra B. Jiwrajka, Wholetime Directors of the Company, to hold an offi ce of profi t of the Company at an aggregate consolidated remuneration of upto ` 2,50,000/ – per month with effect from 01st September, 2012.”
9. To consider and, if thought fi t, to pass, with or without modifi cations, the following resolution as a Special Resolution:
“RESOLVED THAT subject to statutory approvals, if any and in pursuance of the provisions of Section 314 of the Companies Act, 1956, consent of the Company be and is hereby accorded to Mr. Alok A. Jiwrajka, a relative of Mr. Ashok B. Jiwrajka, Mr. Dilip B. Jiwrajka and Mr. Surendra B. Jiwrajka, Wholetime Directors of the Company, to hold an offi ce of profi t of the Company at an aggregate enhanced consolidated remuneration of upto ` 2,50,000/ – per month with effect from 01st September, 2012.”
By Order of the Board
K.H. Gopal President (Corporate Affairs) & Company Secretary
Registered Offi ce:17/5/1 & 521/1,Rakholi / Saily,Silvassa – 396 230,Union Territory of Dadra & Nagar Haveli
Date : May 18, 2012
NOTES:
1. A MEMBER ENTITLED TO ATTEND AND VOTE AT THE MEETING IS ENTITLED TO APPOINT A PROXY TO ATTEND AND VOTE INSTEAD OF HIMSELF/HERSELF AND SUCH PROXY NEED NOT BE A MEMBER OF THE COMPANY. PROXIES IN ORDER TO BE EFFECTIVE MUST BE RECEIVED BY THE COMPANY AT ITS REGISTERED OFFICE NOT LATER THAN 48 HOURS BEFORE THE COMMENCEMENT OF THE MEETING.
2. Corporate members intending to send their authorised representatives to attend the Meeting are requested to send to the Company a certifi ed true copy of the Board Resolution authorizing their representative to attend and vote on their behalf at the meeting.
3. The relevant Explanatory Statement pursuant to Section 173 (2) of the Companies Act, 1956, is enclosed hereto.
4. The Register of Members and Share Transfer Books of the Company will be closed from Tuesday, the 7 August 2012 to Tuesday, the 14 August 2012 (both days inclusive).
5. If the dividend on shares, as recommended by the Board of Directors, is declared at the Meeting, payment thereof will be made:
(i) to those members whose names appear on the Register of Members of the Company after giving effect to all valid share transfers in physical form lodged with the Company’s Registrars and Share Transfer Agent (R&TA) M/s. Link Intime India Private Limited as on 7 August 2012; and
(ii) in respect of shares held in electronic form, the dividend will be payable on the basis of benefi cial ownership as per details furnished by National Securities Depository Limited and Central Depository Services (India) Limited, as on 7 August 2012 in case of shares held in demat form.
6. Members are requested to notify immediately any change of their address:
(a) To their Depository Participants (DPs) in respect of their electronic share accounts, and
(b) To the Company at its Registered Offi ce address or Link Intime India Private Limited, the Registrar and
NOTICE

58 26 Annual Report 2011-12
Share Transfer Agent of the Company at C-13, Kantilal Maganlal Estate, Pannalal Silk Mills Compound, LBS Marg, Bhandup (W), Mumbai 400 078, India, Tel: +91 22 2596 0320, Fax: +91 22 2596 0329, in respect of their physical shares, if any, quoting their folio nos.
7. Members are advised to submit their Electronic Clearing Service (ECS) mandates to the Company’s R&TA at their aforesaid address to facilitate remittance by means of ECS.
8. Members are requested to bring their copy of the Annual Report to the Meeting and produce the Attendance Slip at the entrance where the Annual General Meeting will be held.
9. The Securities and Exchange Board of India (SEBI) has mandated the submission of Permanent Account Number (PAN) by every participant in securities market. Members holdings shares in electronic form are, therefore, requested to submit the PAN to their Depository Participants with whom they are maintaining their demat accounts. Members holding shares in physical form can submit their PAN details to the Company / Registrars and Transfer Agents, M/s.Link Intime India Private Limited.
10. The Company has already transferred the unclaimed Dividend, declared upto the fi nancial year ended 31st March 2004 to the Investor Education and Protection Fund (IEPF).
Members who have not encashed their dividend warrants pertaining to the year 2004–2005 have already been informed through a separate individual written notice to approach the Company’s R&TA on or before 14 August 2012, to check up and send their claims, if any, before the amounts become due for transfer to IEPF.
Pursuant to the provisions of Section 205A of the Companies Act, 1956 dividends for the fi nancial year ended 31 March 2005 and thereafter, which remain unpaid or unclaimed for a period of 7 years from respective dates of transfer to the unpaid dividend account of the Company are due for transfer to the IEPF on the dates given in table below:
Financial year ended Date Declaration Last date for claiming unpaid dividend
Due date for Transfer to IEPF
31.03.2005 29.09.2005 28.09.2012 28.10.201231.03.2006 29.09.2006 28.09.2013 28.10.201331.03.2007 25.09.2007 24.09.2014 24.10.201431.03.2008 29.09.2008 28.09.2015 28.10.201531.03.2009 25.09.2009 24.09.2016 24.10.201631.03.2010 17.09.2010 16.09.2017 16.10.201731.03.2011 29.09.2011 28.09.2018 28.10.2018
Details of IEPF of the amalgamated Company i.e M/s. Grabal Alok Impex Limited
Financial Year ended Date of declaration Last date for claiming unpaid dividend
Due date for transfer to IEPF
31.03.2005 30.09.2005 29.09.2012 29.10.201231.03.2006 30.09.2006 29.09.2013 29.10.201331.03.2007 30.09.2007 29.09.2014 29.10.201431.03.2008 30.09.2008 29.09.2015 29.10.201531.03.2009 30.09.2009 29.09.2016 29.10.201631.03.2010 30.09.2010 29.09.2017 29.10.201731.03.2011 29.09.2011 28.09.2018 28.10.2018
Members who have so far not encashed their dividend warrants pertaining to the aforesaid years are advised to submit their claim to the Company’s R&TA at the address mentioned above immediately quoting their folio number/ DP ID & Client ID. It may be noted that once unclaimed divided is transferred to IEPF as aforesaid, no claim shall lie in respect of such amount by the members.
11. Members may avail themselves of the facility of nomination in terms of Section 109A of the Companies Act, 1956 by nominating in the prescribed form a person to whom their shares in the Company shall vest in the event of their death. The prescribed form can be obtained from the Company’s R&TA at the aforesaid address.
NOTICE

INNOVATIVE TEXTILE SOLUTIONSINNOVATIVE TEXTILE SOLUTIONS
59Innovative Textile Solutions
12. Re-appointment of Directors:
At the forthcoming Annual General Meeting, Mr. Ashok B. Jiwrajka and Mr. Dilip B. Jiwrajka retire by rotation and being eligible offer themselves for re-appointment. The information/details pertaining to the above two Directors that is to be provided in terms of Clause 49 of the Listing Agreement executed by the Company with the Stock Exchanges are furnished in the statement of Corporate Governance published elsewhere in this Annual Report.
13. Equity Shares of the Company are listed on the following Stock Exchanges:
BSE LimitedFloor 25, P. J. Towers,Dalal Street, Fort,Mumbai – 400 001.
National Stock Exchange of India Limited,Exchange Plaza, 5th Floor, Plot No.C/1,“G” Block, Bandra-Kurla Complex,Bandra (East), Mumbai – 400 051.
The Listing fees in all the above stated Exchanges have been paid upto 31 March 2013.
14. Members desiring any information as regards to Accounts are requested to write to the Company at an early date so as to enable the management to keep the information ready.
By Order of the Board
K. H. Gopal President (Corporate Affairs) &
Company Secretary
Registered Offi ce:17/5/1 & 521/1,Rakholi/ Saily,Silvassa – 396230,Union Territory of Dadra & Nagar Haveli
Date : May 18, 2012
Important Communication to membersThe Ministry of Corporate Affairs has taken a “Green Initiative in the Corporate Governance” by allowing paperless compliances by the companies and has issued circulars stating that the service of notice / documents including Annual Report can be sent by e-mail to its members. To support this green initiative of the Government in full measure, members who have not registered their e-mail address, so far, are requested to register their e-mail address in respect of electronic holdings with the Depository through their concerned Depository Participants. We are sure, that as a responsible citizen, you will whole-heartedly support this initiative and will co-operate with the Company in implementing the same.
NOTICE

60 26 Annual Report 2011-12
ANNEXURE TO THE NOTICEExplanatory Statement Pursuant To Section 173(2) of the Companies Act, 1956
Item No.6
The Company has one/two subsidiary Companies in India (and abroad). It is also likely that Company may have more subsidiaries in future. As stipulated by SEBI guidelines, a separate resolution is required to be passed if the benefi ts of ESOS are to be extended to employees/ Directors of subsidiaries.
Thus, a separate resolution has been proposed. The features of scheme mentioned in the resolution and explanatory notes of the resolution passed by postal ballot on 15th April 2010 are same for employees/ Directors of subsidiary Companies.
The Board recommends the resolution for approval by the shareholders.
None of the Directors of the Company are in any way, concerned or interested in the resolution except to the extent of options which may be granted to them.
Item nos. 7 and 8
The members may note that Mr. Varun S. Jiwrajka and Mr. Niraj D. Jiwrajka relatives of Mr. Ashok B. Jiwrajka, Mr. Dilip B. Jiwrajka and Mr. Surendra B.Jiwrajka-promoter directors of the Company, have been working with the Company’s subsidiaries since last two years. It is proposed to absorb them in the Company effective from 01st September, 2012 at a consolidated remuneration of upto ` 2,50,000/ – per month each considering their qualifi cations, responsibilities and position. Under Section 314 of the Companies Act, 1956, remuneration payable to a relative of any director (offi ce of profi t) requires approval of the members in a General Meeting. Hence your Directors recommend the resolutions at item nos.7 and 8 for approval of the members.
Apart from Mr. Ashok B. Jiwrajka, Mr. Dilip B. Jiwrajka and Mr. Surendra B. Jiwrajka, none of the other directors of the Company is, in any way concerned or interested in this resolution.
Item no. 9
The members may note that the remuneration of Mr. Alok A. Jiwrajka, relative of Mr. Ashok B. Jiwrajka, Mr. Dilip B. Jiwrajka and Mr. Surendra B. Jiwrajka – promoter directors of the Company, was increased to ` 1,50,000/ – with effect from 21st July, 2008 as per the approval received from Central Government pursuant to Section 314 of the Companies Act, 1956. It is now proposed that the remuneration payable to Mr. Alok Jiwrajka be enhanced upto ` 2,50,000/ – per month considering his present comprehensive responsibilities and position in the interests of the Company. Under Section 314 of the Companies Act, 1956, remuneration payable to a relative of any director (offi ce of profi t) requires approval of the members in a General Meeting. Hence your Directors recommend the resolution at item no.9 for approval of the members.
Apart from Mr. Ashok B. Jiwrajka, Mr. Dilip B. Jiwrajka and Mr. Surendra B. Jiwrajka, none of the other directors of the Company is, in any way concerned or interested in this resolution.
By Order of the Board
K. H. GopalPresident (Corporate Affairs) &
Company Secretary
Registered Offi ce:17/5/1 & 521/1,Rakholi/ Saily, Silvassa – 396230,Union Territory of Dadra & Nagar Haveli
Date : May 18, 2012
NOTICE

INNOVATIVE TEXTILE SOLUTIONSINNOVATIVE TEXTILE SOLUTIONS
61Innovative Textile Solutions
Dear Shareholders:
We have pleasure in presenting the 26 Annual Report of your Company together with the Audited Accounts for the fi nancial year ended 31 March 2012. The summarized fi nancial results (stand-alone and consolidated) are given below in Table 1.
Table 1: Financial Highlights: Stand-Alone and Consolidated
(` Crore)
PARTICULARS Stand alone Consolidated2011-12 2010-11 2011-12 2010-11
Sales / Job charges (net of excise) 8,900.86 6,388.43 9,784.72 6,614.90Other Income 65.60 41.09 95.51 67.07Total Income 8,966.46 6,429.52 9,880.23 6,681.97Total Expenditure 6,341.71 4,549.82 7,408.31 4,827.74Operating Profi t Before Interest, Depreciation & Taxes 2,624.75 1,879.70 2,471.92 1,854.23Interest 1,149.55 736.27 1,234.70 782.15Depreciation 713.43 518.79 749.14 530.97Profi t Before exceptional items & Tax 761.77 624.64 488.08 541.11Exceptional Items 121.27 41.45 121.27 39.87Profi t Before Tax 640.50 583.19 366.81 501.24Less: Provision For Taxation— Current Tax (157.64) (78.15) (172.93) (81.16)— Deferred (102.33) (100.68) (100.97) (97.34)Profi t After Tax 380.53 404.36 92.91 322.74Add/(Less):Share of Profi t of Associates - - 0.08 (10.89)Minority Interest - - - (0.31)Profi t After Tax after Minority Interest 380.53 404.36 92.99 311.54
Notes:
Previous years’ fi gures have been regrouped wherever necessary to bring them in line with the current year’s representation of fi gures
Performance
During the fi nancial year, your Company recorded sales of ` 8,900.86 crore an increase of 39.33% over the previous year and exports (including incentives) increased by 36.62% to ` 3,029.55 crore. The operating profi t before tax during the year stood at ` 761.77 crore an increase of 21.95% over the previous year.
All the divisions of your company recorded growth with lead being taken by Cotton Yarn, Polyester Yarn, Home Textiles and Apparel Fabrics.
Details of your Company’s performance for the year under review are given in the ‘Management Discussion and Analysis’, which forms part of this Directors’ Report.
Dividend
Your Directors have recommended a dividend of ` 0.30 per equity share of ` 10/ – each (previous year ` 0.25 per share) for the fi nancial year ended 31 March 2012 and seek your approval for the same. If approved, the total amount of dividend to be paid to the equity shareholders will be ` 24.79 crores (excluding tax of ` 4.02 crores) as against ` 19.69 crore paid last year (excluding tax of ` 3.27 crore). Based on the above dividend payout (including dividend tax), the dividend payout ratio works out to 7.57% of Profi t After Tax (PAT) as against 5.68% for 2010-11.
Capital
During the year under review your Company issued and allotted 1,60,00,000 Equity Shares to a Promoter Group Company, against the conversion of warrants. The said warrants were originally issued to Arum Investments
DIRECTORS’ REPORT TO THE SHAREHOLDERS

62 26 Annual Report 2011-12
Private Limited by M/s. Grabal Alok Impex Limited and the same were subsequently purchased by M/s. Jiwrajka Investments Private Limited.
Pursuant to the amalgamation of M/s Grabal Alok Impex Limited with the Company, your Company has issued and allotted 2,24,85,000 Equity Shares of ` 10/ – each to the existing equity shareholders of M/s. Grabal Alok Impex Limited, whose names appeared in the register of members of the Company on the record date i.e. 14th March, 2012 in the ratio of 1:1.
The Company’s equity share capital as on 31 March 2012 stands at ` 826.28 crore divided into 82,62,69,357 fully paid equity shares of ` 10/ – each.
Reserves
The balance available for appropriation as at 31 March 2012 amounted to ` 1,356.99 crores. After providing for dividend and dividend tax of ` 28.73 crore, your Company proposes to transfer ` 51.90 crore to Debenture Redemption Reserve. After providing for these, the balance of the Profi t & Loss Account would stand at ` 1,380.16 crore.
At the end of the fi nancial year, the total reserves of the Company thus, stood at ` 2,829.22 crore; the corresponding fi gure at the end of the previous year was ` 2309.80 crore.
Loans
During the year under review, your Company has raised incremental debt of ` 2,241.89, both secured and unsecured, by way of rupee loans, foreign currency loans and non-convertible debentures for meeting capital expenditure and working capital requirements. The total debt at the end of year stood at ` 11,139.48 crore compared to ` 8,897.59 crore at the end of previous year.
Capital Expenditure
During the year under review, your company has incurred a capital expenditure of ` 1,919.79 crore across various divisions. A major portion of these were towards cotton spinning, expansion of weaving and processing capacities, setting up additional Continuous Polymerization (CP) Plant ,expansion of Texturising and regular capex.
Details of your Company’s capacities across various divisions are provided under the head ‘Capacity Expansion’ in the Management Discussion and Analysis annexed to this Report.
Amalgamation
During the year under review, the Hon’ble High Court, Bombay had vide its Order dated February 03, 2012 sanctioned the Scheme of Amalgamation (the “Scheme”) of Grabal Alok Impex Limited with your Company with appointed date April 01, 2011 and the Scheme has become effective on 1st March, 2012.
Pursuant to the aforesaid merger, your Company have allotted 2,24,85,000 Equity Shares of ` 10/ – each to the existing equity shareholders of M/s. Grabal Alok Impex Limited in the ratio of 1:1 and the said shares are listed with BSE and NSE.
Subsidiary Companies
At the end of the fi nancial year under review, your Company had the following subsidiaries:
Subsidiaries of Alok Industries Limited1. Alok International Inc. 2. Alok Infrastructure Limited3. Alok H&A Limited4. Alok Retail (India) Limited5. Alok Apparels Private Limited6. Alok Land Holdings Private Limited7. Alok International (Middle East) FZE8. Alok Singapore Pte Limited
DIRECTORS’ REPORT TO THE SHAREHOLDERS

INNOVATIVE TEXTILE SOLUTIONSINNOVATIVE TEXTILE SOLUTIONS
63Innovative Textile Solutions
Step-down subsidiaries of Alok Industries LimitedParent Company Subsidiary %HoldingAlok Infrastructure Limited Alok Realtors Private Limited 100%
Springdale Information and Technologies Private Limited 100%Kesham Developers & Infotech Private Limited 100%Alok Industries International Ltd. 100%Grabal Alok International Limited 100%
Alok Industries International Ltd. Mileta, a.s. 100%Alok European Retail, s.r.o. 98.05%Grabal Alok (UK) Limited 41.72%
Grabal Alok International Limited Grabal Alok (UK) Limited 48.71%
The Ministry of Corporate Affairs, Government of India has issued a Circular No.2 / 2011 dated 8th February 2011 granting general exemption to Companies under section 212 (8) from attaching the documents referred to in section 212 (1) pertaining to its subsidiaries, subject to approval by the Board of Directors of the Company and furnishing of certain fi nancial information in the Annual Report.
The Board of Directors of the Company have accordingly accorded approval to the Company dispensing with the requirement of attaching to its Annual Report the annual audited accounts of the Company’s subsidiaries.
Accordingly, the Annual Report of the Company does not contain the individual fi nancial statements of these subsidiaries, but contains the audited consolidated fi nancial statements of the Company, its subsidiaries and associate. The Annual Accounts of these subsidiary companies and the related detailed information will be made available to the shareholder seeking such information at any point of time. The annual accounts of the Subsidiary Companies will also be kept for inspection by any shareholder at its registered / corporate offi ce and that of the concerned subsidiary companies. The statement pursuant to the approval under section 212 (8) of the Companies Act, 1956 is annexed together with the Annual Accounts of the Company.
Consolidated fi nancial statements
The Consolidated Financial Statements of the Company prepared as per the Accounting Standard AS21 and Accounting AS 23, consolidating the Company’s accounts with its subsidiaries and an associate have also been included as part of this Annual Report.
Business and Operations
A detailed review of the operations, performance and future outlook of the Company and its businesses is given in the Management’s Discussion and Analysis, which forms part of this Report.
Awards and Recognition
During the year under review, your Company has been given the following awards and recognitions by the Cotton Textile Exports Council of India (TEXPROCIL) in three categories:
• GOLD Trophy for Global Exports of Bleached / Dyed / Yarn Dyed / Printed Fabrics in Fabrics Category
• GOLD Trophy for Exports of Bed Linen / Bed Sheets /Quilts in Made-ups Category
• SILVER Trophy for Highest Global Exports Category
• SILVER Trophy for second best export performance for the year 2010-11 in the category of Polyester Yarn
Corporate Social Responsibility
Details of your Company’s Corporate Social Responsibility (CSR) initiatives are given in a separate section, ‘Sustainability’, which forms part of the accompanying Management Discussion and Analysis and Annual Report.
Corporate Governance
The Company is committed to maintain the highest standards of Corporate Governance. Your Company continues to be compliant with the requirements enshrined in clause 49 of the Listing Agreement which relates to Corporate Governance.
DIRECTORS’ REPORT TO THE SHAREHOLDERS

64 26 Annual Report 2011-12
A separate report on Corporate Governance is enclosed as a part of this Annual Report. A certifi cate from the Statutory Auditors of your Company regarding compliance with Corporate Governance norms stipulated in Clause 49 of the Listing Agreement is also annexed to the report on Corporate Governance.
Fixed Deposits
Your Company does not have any fi xed deposits under section 58A and 58AA of The Companies Act, 1956 read with Companies (Acceptance of Deposits) Rule, 1975.
Insurance
All the insurable interests of your Company including inventories, buildings, plant and machinery are adequately insured.
Directors
Mr. Ashok B. Jiwrajka and Mr. Dilip Jiwrajka will retire from offi ce by rotation at the ensuing Annual General Meeting and, being eligible, offer themselves for reappointment. Brief resumes of these Directors, in line with the stipulations of Clause 49 of the Listing Agreement, are provided elsewhere in this Annual Report.
During the year, Mr. Rakesh Kapoor, nominee director of IFCI Limited, resigned from the Board of Directors w.e.f. 29th April, 2011 and in his place Mr. M.V.Muthu was appointed as IFCI nominee. Mr. Debashish Mallick, nominee director of IDBI Bank Limited, resigned from the Board of Directors w.e.f. 23rd June, 2011 and in his place Mrs. Maya Chakravorty was appointed as IDBI nominee and Mr. K.D. Hodavdekar, nominee director of IDBI Bank Limited, resigned from the Board of Directors w.e.f. 04th July, 2011. The Board wishes to place on record their appreciation for the contribution of Mr. Rakesh Kapoor Mr. Debashish Mallick and Mr. K.D. Hodavdekar during their tenure as Directors of your Company.
Directors’ Responsibility Statement
Your directors affi rm that the audited accounts containing the fi nancial statements for the fi nancial year 2011 – 12 are in conformity with the requirements of the Companies Act, 1956. They believe that the fi nancial statements refl ect fairly the form and substance of transactions carried out during the year and reasonably present the Company’s fi nancial condition and results of operations.
Pursuant to section 217(2AA) of the Companies Act, 1956, your Directors subscribe to the ‘Directors’ Responsibility Statement’ and hereby confi rm that:
• in the preparation of the annual accounts for the fi nancial year ended 31 March 2012, the applicable Accounting Standards have been followed and there has been no material departure;
• the Directors have selected such accounting policies, consulted and applied them consistently and made judgements and estimates that are reasonable and prudent so as to give a true and fair view of the state of affairs of your Company as at 31 March 2012 and of the profi t of your Company for the year on that date;
• the Directors have taken proper and suffi cient care for the maintenance of adequate accounting records in accordance with the provisions of the Companies Act,1956 for safeguarding the assets of your Company and for preventing and detecting fraud and other irregularities;
• they have prepared the annual accounts for the fi nancial year ended 31 March 2012 on a ‘going concern’ basis.
Auditors and Auditors’ Report
M/s. Gandhi & Parekh, Chartered Accountants and M/s. Deloitte Haskins & Sells, Chartered Accountants, Statutory Auditors of the Company, hold offi ce until the conclusion of the ensuing Annual General Meeting and are eligible for re-appointment.
The Company has received the letter from M/s. Deloitte Haskins & Sells to the effect that their re-appointment, if made, would be within the prescribed limits under section 224 (1B) of the Companies Act, 1956 and that they have not disqualifi ed for re-appointment within the meaning of the section 226 of the said Act.
DIRECTORS’ REPORT TO THE SHAREHOLDERS

INNOVATIVE TEXTILE SOLUTIONSINNOVATIVE TEXTILE SOLUTIONS
65Innovative Textile Solutions
The observations made in the Auditors’ Report are self-explanatory and therefore, do not call for any further comments under section 217(3) of the Companies Act, 1956.
Cost Auditor
Pursuant to the directives of the Central Government under the provisions of Section 233B of the Companies Act, 1956 and subject to the approval of the Central Government, M/s B. J. D. Nanabhoy & Co., Cost Accountants, Mumbai have been appointed as Cost Auditors to conduct cost audit relating to the products manufactured by your Company.
Employees Stock Option Plans
Alok ESOS 2010 was approved by shareholders in the previous year. During the year Remuneration Committee of the Board granted 1,05,87,950 options net of lapse at an exercise price of ` 18.90 and at ` 21.42 per option. The information as required pursuant to the Securities & Exchange Board of India (Employees’ Stock Option Scheme and Employees’ Stock Purchase Scheme) Guidelines, 1999 is annexed hereto as Annexure I and forms part of this report.
A certifi cate from M/s Gandhi & Parekh, Chartered Accountants, Statutory Auditors, with regard to the implementation of the Company’s ESOP 2010, would be open for inspection in the ensuing Annual General Meeting.
Particulars of Employees
The information required on particulars of employees as per Section 217(2A) of the Companies Act, 1956, read with Companies (Particulars of Employees) Rules, 1975 forms part of this report. As per the provisions of Section 219(1)(b)(iv) of the Companies Act, 1956, the Report and Accounts are being sent to all shareholders of your Company excluding the Statement of Particulars of Employees. Any shareholder interested in obtaining a copy of the said statement may write to your Company Secretary at the Corporate Offi ce of your Company.
More details on the Human Resources function of your Company and its various activities are given in the ‘Human Resources’ and ‘Sustainability’ sections of the attached Management Discussion & Analysis.
Your Directors appreciate the signifi cant contribution made by the employees to the operations of your Company during the year.
Conservation of Energy, Technology absorption, Foreign Exchange Earnings and Outgo
The particulars as prescribed under Section 217(1)(e) of the Companies Act, 1956, read with the Companies (Disclosure of Particulars in the Report of the Board of Directors) Rules, 1988 are attached as Annexure ‘II’ to this report.
Acknowledgements
Your Directors wish to place on record their deep sense of appreciation for all the stake holders of the Company who have been continuously supporting the growth of your Company. In particular, the Directors value the dedication and commitment of your Company’s employees and thank the Central and State Governments, Financial Institutions, Banks, Government authorities, customers, vendors and shareholders for their continued cooperation and support.
For and on behalf of the Board
Place: Mumbai Dilip B. JiwrajkaDate: May 18, 2012 Managing Director
DIRECTORS’ REPORT TO THE SHAREHOLDERS
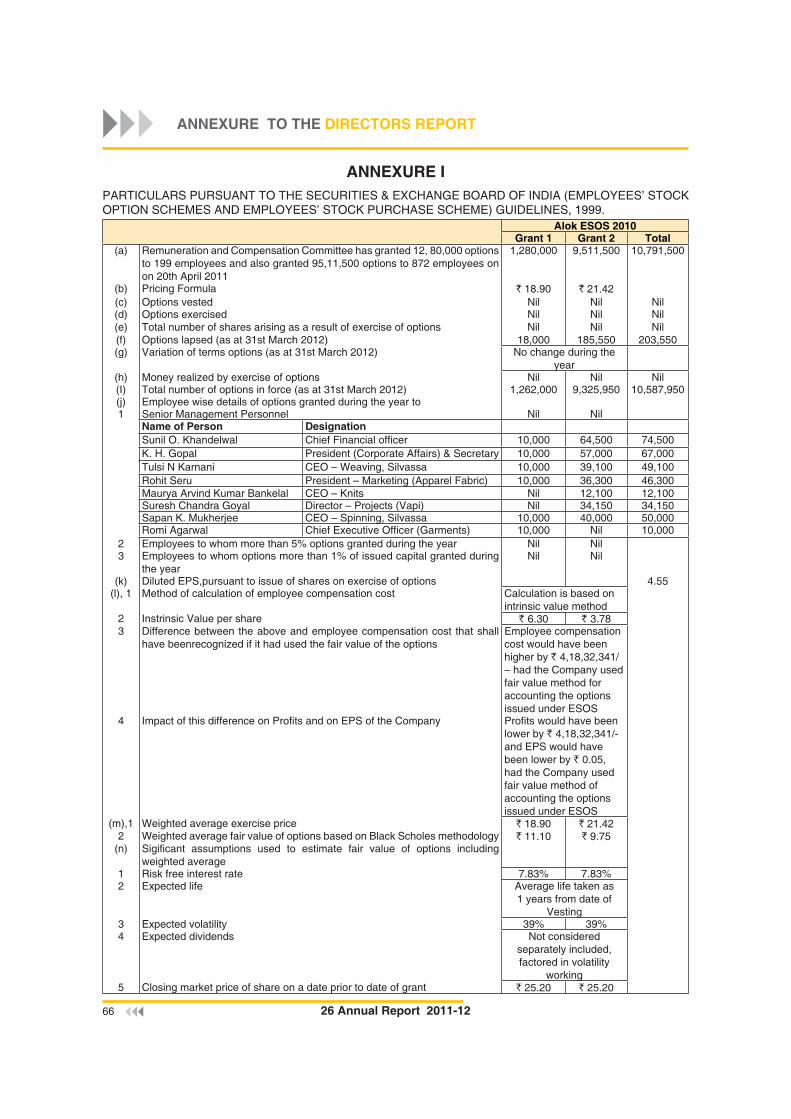
66 26 Annual Report 2011-12
ANNEXURE IPARTICULARS PURSUANT TO THE SECURITIES & EXCHANGE BOARD OF INDIA (EMPLOYEES’ STOCK OPTION SCHEMES AND EMPLOYEES’ STOCK PURCHASE SCHEME) GUIDELINES, 1999.
Alok ESOS 2010Grant 1 Grant 2 Total
(a) Remuneration and Compensation Committee has granted 12, 80,000 options to 199 employees and also granted 95,11,500 options to 872 employees on on 20th April 2011
1,280,000 9,511,500 10,791,500
(b) Pricing Formula ` 18.90 ` 21.42(c) Options vested Nil Nil Nil(d) Options exercised Nil Nil Nil(e) Total number of shares arising as a result of exercise of options Nil Nil Nil(f) Options lapsed (as at 31st March 2012) 18,000 185,550 203,550(g) Variation of terms options (as at 31st March 2012) No change during the
year(h) Money realized by exercise of options Nil Nil Nil(I) Total number of options in force (as at 31st March 2012) 1,262,000 9,325,950 10,587,950(j) Employee wise details of options granted during the year to1 Senior Management Personnel Nil Nil
Name of Person DesignationSunil O. Khandelwal Chief Financial offi cer 10,000 64,500 74,500K. H. Gopal President (Corporate Affairs) & Secretary 10,000 57,000 67,000Tulsi N Karnani CEO – Weaving, Silvassa 10,000 39,100 49,100Rohit Seru President – Marketing (Apparel Fabric) 10,000 36,300 46,300Maurya Arvind Kumar Bankelal CEO – Knits Nil 12,100 12,100Suresh Chandra Goyal Director – Projects (Vapi) Nil 34,150 34,150Sapan K. Mukherjee CEO – Spinning, Silvassa 10,000 40,000 50,000Romi Agarwal Chief Executive Offi cer (Garments) 10,000 Nil 10,000
2 Employees to whom more than 5% options granted during the year Nil Nil3 Employees to whom options more than 1% of issued capital granted during
the yearNil Nil
(k) Diluted EPS,pursuant to issue of shares on exercise of options 4.55(l), 1 Method of calculation of employee compensation cost Calculation is based on
intrinsic value method2 Instrinsic Value per share ` 6.30 ` 3.783 Difference between the above and employee compensation cost that shall
have beenrecognized if it had used the fair value of the optionsEmployee compensation cost would have been higher by ` 4,18,32,341/ – had the Company used fair value method for accounting the options issued under ESOS
4 Impact of this difference on Profi ts and on EPS of the Company Profi ts would have been lower by ` 4,18,32,341/-and EPS would have been lower by ` 0.05, had the Company used fair value method of accounting the options issued under ESOS
(m),1 Weighted average exercise price ` 18.90 ` 21.422 Weighted average fair value of options based on Black Scholes methodology ` 11.10 ` 9.75
(n) Sigifi cant assumptions used to estimate fair value of options including weighted average
1 Risk free interest rate 7.83% 7.83%2 Expected life Average life taken as
1 years from date of Vesting
3 Expected volatility 39% 39%4 Expected dividends Not considered
separately included, factored in volatility
working5 Closing market price of share on a date prior to date of grant ` 25.20 ` 25.20
ANNEXURE TO THE DIRECTORS REPORT

INNOVATIVE TEXTILE SOLUTIONSINNOVATIVE TEXTILE SOLUTIONS
67Innovative Textile Solutions
ANNEXURE IIPARTICULARS OF INFORMATION REQUIRED UNDER SECTION SECTION 217(1)(E) OF THE COMPANIES ACT, 1956, READ WITH THE COMPANIES (DISCLOSURE OF PARTICULARS IN THE REPORT OF THE BOARD OF DIRECTORS) RULES, 1988 AND FORMING PART OF THE DIRECTORS’ REPORT FOR THE YEAR ENDED 31ST MARCH 2012.
(A) CONSERVATION OF ENERGY
(a) Energy conservation measures taken:
The company is engaged in the continuous process of energy conservation through improved operational and maintenance practices. Accordingly and in line with the company’s commitment to conservation of natural resources, all units continued with their endeavor to make more effi cient use of energy.
Some of the measures undertaken in this direction during the year under review were as under:
• Replacement of existing small capacity cooling tower pumps with energy effi cient pumps
• Power saving in soft water supply by pumping system modifi cation (replacing submersible pump by self priming)
• Energy saving by increasing the life of air filter by installing pre-filter and improving the cleaning process.
• Power saving in compressed air system through better and more effective utilization.
• Optimization of fuel viscosity and other related parameters of DG Set.
• Optimal use of cooling tower fan as per climate conditions.
• Optimization of use of engine hall ventilation fans as per climate conditions.
• Installation of Air preheaters at Thermopac boilers.
• Installation of Harmonic filter with capacitors.
• Caustic handling system on process machines installed
• Reduction of maximum demand by even distribution of daily load and through increased efficiency of plants.
• Optimum choice of power factor improvement capacitors for improvement in power factor.
• Modification of pipeline of chiller plant so as to maintain temperature.
• Usage of voltage regulator in lighting circuits for reduction in lighting energy.
• Rain harvesting measures.
• Usage of optimum suction pressure OHTC Dust Collector.
• New FO Emulsion fuel firing system implemented with the Steam and Thermic Fluid boilers.
• Upgradation of Fire Hydrant system.
• Periodic energy audits
(b) Additional proposals being implemented for further conservation of energy:
• Usage of electronic blast in place of conventional choke.
• Replacement of 36W TL fittings with LED lights for longer life and reduced energy consumption.
• Expedite the process of conversion of all plants from FO to natural gas to promote greener fuel use.
• Replacement of oil fired boiler with coal fired one.
• Flash steam and condensate recovery in CPP.
• Optimization of soft water supply pressure to minimize wastage of water.
• Heat recovery from hot exhaust air of Stenter and CRP hot water.
• Installation of EMS Energy Monitoring System for greater accuracy of energy consumption reports.
(c) Impact of the measures at (a) and (b) for reduction of energy consumption and consequent impact on the cost of production:
The energy conservation measures have resulted in energy saving and consequent reduction in cost of production. Besides, these measures have also resulted in elimination / reduction of furnace oil by substitution of natural gas, and consequent reduction in emissions. Also, the mechanical, thermal and electrical efficiency of the plants stand improved.
ANNEXURE TO THE DIRECTORS REPORT

68 26 Annual Report 2011-12
ANNEXURE TO THE DIRECTORS REPORT
FORM “A”Form for disclosure of particulars with respect to conservation of energy.
A) Power & Fuel Cosumtion for the year ended 31.03.2012 2011-12 2010-111) Electricity Purchased
Units: 584,025,541.00 445,002,536.00Total amount (` in crores ) 242.63 143.47Average Rate/Unit (`) 4.15 3.22
2) Own Generation through Diesel Generator SetUnits: 159,321,135.80 163,060,781.40Total amount (` in crores) 121.94 92.94Average Rate/Unit (`) 7.65 5.70
3) Own Generation through Co-generationUnits 22,373,265.00 1,779,900.00Total amount (` in Crores) 11.67 6.43Average Rate/Unit (`) 5.22 3.62
4) Own Generation through Gas TurbineUnits 47,717,320.00 45,049,016.00Total amount (` in Crores) 24.70 20.86Average Rate/Unit (`) 5.18 4.63
5) a) Furnace Oil consumed Total amount (` in crores) 71.56 46.90b) Natural Gas consumed Total amount (` in crores) 164.78 70.42c) Coal consumed Total amount (` in Crores) 11.36 5.79d) Diesel Consumed Total amount (` in Crores) 3.46 2.51e) Electricity Duty Paid 3.94 2.80
B) Consumption per unit of production 2011-12 2010-11a) Yarn (Kgs) 123,979,229.64 123,335,121.28 Units Consumed (per kgs) 1.06 1.00b) Fabric Knits (Kgs) 9,052,553.80 9,747,096.99 Units Consumed (per kgs) 0.55 0.48c) Fabric Woven (Mtrs) 404,689,259.77 325,947,157.97 Units Consumed (per mtrs) 0.39 0.41d) Processing Woven (Mtrs) 158,380,059.42 136,745,381.08 Units Consumed (per mtrs) 0.19 0.20e) Processing Knits (Kgs) 7,933,685.65 7,712,014.35 Units Consumed (per kgs) 0.86 0.93f) Garments (Pcs) 7,128,997 5,724,537 Units Consumed (per pcs) 0.34 0.46g) SL Madeups (Kgs) 8,035,949.19 8,631,748.04 Units Consumed (per Kgs) 0.26 0.22h) Poy (Kgs) 198,139,403.23 160,505,055.64 Units Consumed (per Kgs) 0.38 0.42i) Spinning (Kgs) 62,113,087.69 55,150,739.02 Units Consumed (per Kgs) 4.02 4.06j) Handkerchief (Pcs) 9,047,348.00 9,994,518.00 Units Consumed (per pcs) 0.05 0.05k) Chips (Kgs) 327,017,204.70 198,757,761.19 Units Consumed (per kgs) 0.12 0.10l) FDY (Kgs) 43,633,821.96 15,814,130.80 Units Consumed (per kgs) 0.99 1.06m) Packing Material (kgs) 26,079,914.80 – Units Consumed (per kgs) 0.08 –n) Embroidery Fabric (mtrs) 15,574,546.13 – Units Consumed (per mtrs) 0.85 –o) Polyester Staple Fiber (Kgs) 2,235,755.11 2,366,097.49 Units Consumed (per kgs) 1.14 0.97p) Yarn Dyed (kgs) 5,205,352.30 3,851,882.43 Units Consumed (per kgs) 1.78 2.18q) Terry Towel (Kgs) 13,852,776.70 12,417,172.13 Units Consumed (per kgs) 1.01 0.93

INNOVATIVE TEXTILE SOLUTIONSINNOVATIVE TEXTILE SOLUTIONS
69Innovative Textile Solutions
FORM “B”B) Technology Absorption 2011-12 2010-2011
NIL NIL
C) Foreign Exchange Earnings and Outgo 2011-12 2010-2011
i) Total Earnings of Foreign Exchange
FOB Value of Exports 2,767.98 2,032.34
Interest received on Fixed Deposits 0.18 0.06
Total 2,768.16 2032.40
ii) Total Outgo in Foreign Exchange
Commission to sales 15.01 9.96
Interest on Fixed Loan 48.28 33.26
Legal and Professional Fees 17.03 1.74
Miscellaneous Expenses 10.00 7.16
Reimbursement of Expenses 12.98 8.84
Sales Promotion Expenses 3.49 10.25
Claim for damaged goods 4.66 2.96
Travelling expenses 1.28 0.11
Bank Charges 4.31 4.68
Exchange Loss 68.98 94.37
Total 186.02 173.33
ANNEXURE TO THE DIRECTORS REPORT

70 26 Annual Report 2011-12
Economic Overview
World
2011-12 has been a challenging year for the global economy. Growth in global output reduced from 5.3% in Calendar Year (CY) 2010 to 3.9% in CY 2011. The recovery in Advanced Economies (AEs) that seemed to be shaping well at the start of CY 2011 lost steam towards the fag-end of the year and output growth reduced from 3.2% in CY 2010 to 1.6% in CY 2011. Growth in emerging markets, especially China and India, is slowing beyond what was anticipated but these two economies are still likely to provide some support for global recovery. In fact, output growth in the developing and emerging economies reduced from 7.5% in CY 2010 to 6.2% in CY 2011 (see chart A).
Amongst the advanced economies, USA grew by 1.7%, while EU countries grew by 1.4%. While there was positive news from USA with improved activity in the second half of CY2011, economic activity took a sharp turn for the worse during the fourth quarter in the Euro area. The future of the Economic and Monetary Union (EMU) became clouded by uncertainty, as the sovereign debt crisis caused sharp increases in key government bond rates. Plummeting confi dence and escalating fi nancial stress were major factors in the – 1.3% (annualized) contraction of the euro area economy in Q4, 2011. In contrast, during the same period, the United States, witnessed acceleration in activity, as consumption and inventory investment strengthened. However, the overall subdued demand in the advanced economies resulted in reduction in global trade between advanced economies and emerging economies.
Chart B shows that import growth in advanced economies reduced from 11.5% in CY2010 to 4.3% in CY2011. In line with this reduction export growth from emerging economies also reduced from 15.3% in CY2010 to 8.8% in CY2011.
In the emerging and developing markets economic activity dampened also due to factors unrelated to the Euro area. In emerging Asia and in Latin America, cyclical factors, including recent policy tightening led to trade and production slowing down noticeably. In Middle East and North Africa (MENA), activity remained subdued amid social unrest and geopolitical uncertainty.
The demand slowdown has reduced non-oil commodity prices. However, as Chart C shows, non-oil commodity infl ation has not reduced signifi cantly – from 26.3% in CY 2010 to 17.8% in CY 2011. And, geo-political instability and speculative activities have contributed to oil price increase of 31.6% in CY 2011, which is even greater than the 27.9% increase in CY 2010. The widespread effect of high energy prices was evident in rising infl ation for consumers. In the advanced economies, consumer prices infl ation was 2.7% in CY 2011 against 1.5% in CY 2010 and in emerging and developing economies consumer price infl ation increased from 6.1% in CY 2010 to 7.1% in CY 2011. This environment of low economic activity with higher price levels was a signifi cant dampener for consumer confi dence across the world.
On a positive note, many advanced economies have made good progress in designing and implementing strong medium term fi scal consolidation programmes. At the same time, emerging and developing economies continue to have the benefi t of latent demand in their economies and need to continue with reforms to maintain growth. However, problems could easily fl are up again in the Euro area and fi scal policy could tighten very abruptly in the United
Chart A: Output Growth
5.30%
3.20%
7.50%
3.90%
1.60%
6.20%
0%1%2%3%4%5%6%7%8%
World Output AdvancedEconomies
Emerging andDevelopingEconomies
2010 2011
Source: International Monetary Fund (IMF)
Chart B: Global Trade (% growth)
11.5
15.3
4.3
8.8
0
5
10
15
20
Imports-AdvancedEconomies
Exports-EmergingEconomies
2010 2011
Source: International Monetary Fund (IMF)
Chart C: Global Trade (% growth)
27.9 26.3
31.6
17.8
0
510
1520
2530
35
Oil Non-oil Commodities
2010 2011
Source: International Monetary Fund (IMF)
MANAGEMENT DISCUSSION AND ANALYSIS - INDUSTRY OVERVIEW

INNOVATIVE TEXTILE SOLUTIONSINNOVATIVE TEXTILE SOLUTIONS
71Innovative Textile Solutions
States in 2013. Consequently, while there will be pockets of growth opportunities, there is also considerable uncertainty in the global economy going into 2012-13.
India
Lower global demand, domestic policy uncertainties and the cumulative impact of monetary tightening contributed to growth slowing down considerably to the estimated level of 6.5% in 2011-12. All three sectors of the economy – agriculture, industry and services – slowed down. Even though there was moderation in agriculture growth, the year witnessed an all-time high food-grains output. The services sector moderated primarily due to the slowdown in construction, while the disappointing performance of mining and manufacturing sub-sectors contributed to slackening of industrial growth. Chart D shows the quarterly GDP growth rates where there has been a fall in 2011-12 compared to 2010-11.
The growth slowdown has been driven by a sharp fall in investment, some moderation in private consumption and fall in net external demand. These, along with a sense of policy ambiguity and legislative uncertainty, have led to signifi cant dampening of business confi dence in the country. Investor confi dence, too, has ebbed and consequently there has been a slowdown in foreign investments into India.
The balance of payments (BOP) also came under signifi cant stress during Q3 of 2011-12 as the current account defi cit widened substantially. Under such conditions with capital infl ows declining, there has been a drawing down of foreign exchange reserves. This has resulted in a mismatch in demand and supply in the foreign exchange market resulting in high volatility and sharp fall in the valuation of the rupee against the US dollar and the Euro, especially in the second half. Chart E plots the data.
The wider Current Account Defi cit, increase in external debt, weakening net international investment position (NIIP) and deteriorating vulnerability indicators need to be addressed through policy measures to stabilise and
renew the growth momentum.
Infl ation has moderated in last quarter of 2011-12 to below 7 %. However, the path of infl ation in 2012-13 could remain sticky with high oil prices, large suppressed infl ation, and exchange rate pass-through, impact of tax hikes, wage pressure and structural impediments to supply response. The pricing power of companies has declined with moderation in demand as also lower non-oil commodity prices. This should help keep infl ationary pressures under control in 2012-13.
Monetary policy was strongly anti-infl ationary until October 2011 and interest rates were at very high levels. Subsequently, decelerating growth and
declining infl ation momentum has prompted monetary policy shift to a neutral stance since December 2011. Some easing in liquidity was effected through a total of 125 basis points reduction in the Cash Reserve Ratio (CRR) during January-March 2012. In addition, amidst increasing structural and frictional liquidity defi cits during Q4 of 2011-12, the Reserve Bank injected large amounts of primary liquidity through Open Market Operations (OMOs).
Early indicators suggest that growth may have bottomed out in Q3 of 2011-12 but recovery may be slow during 2012-13. With measures being taken to remove supply-side bottlenecks, progress on fi scal consolidation could create conditions for a more favourable growth – infl ation dynamic.
Textiles, Clothing and Fibre Industry
Chart D: Quarterly Real GDP growth (%)
8.5
7.68.3
7.8 7.7
6.9
6.1
5.3
55.5
66.5
77.5
88.5
9
Q1,
FY
201
1
Q2,
FY
2011
Q3,
FY
2011
Q4,
FY
201
1
Q1,
FY
201
2
Q2,
FY
201
2
Q3,
FY
201
2
Q4,
FY
201
2
Source: Central Statistical Organisation, Government of India
Chart E: Rupee versus USD and EURO
4050607080
Apr
-201
1
Jun-
2011
Au
g-2
011
Oct
-201
1
De
c-2
011
Feb
-201
2
Euro USD
MANAGEMENT DISCUSSION AND ANALYSIS - INDUSTRY OVERVIEW
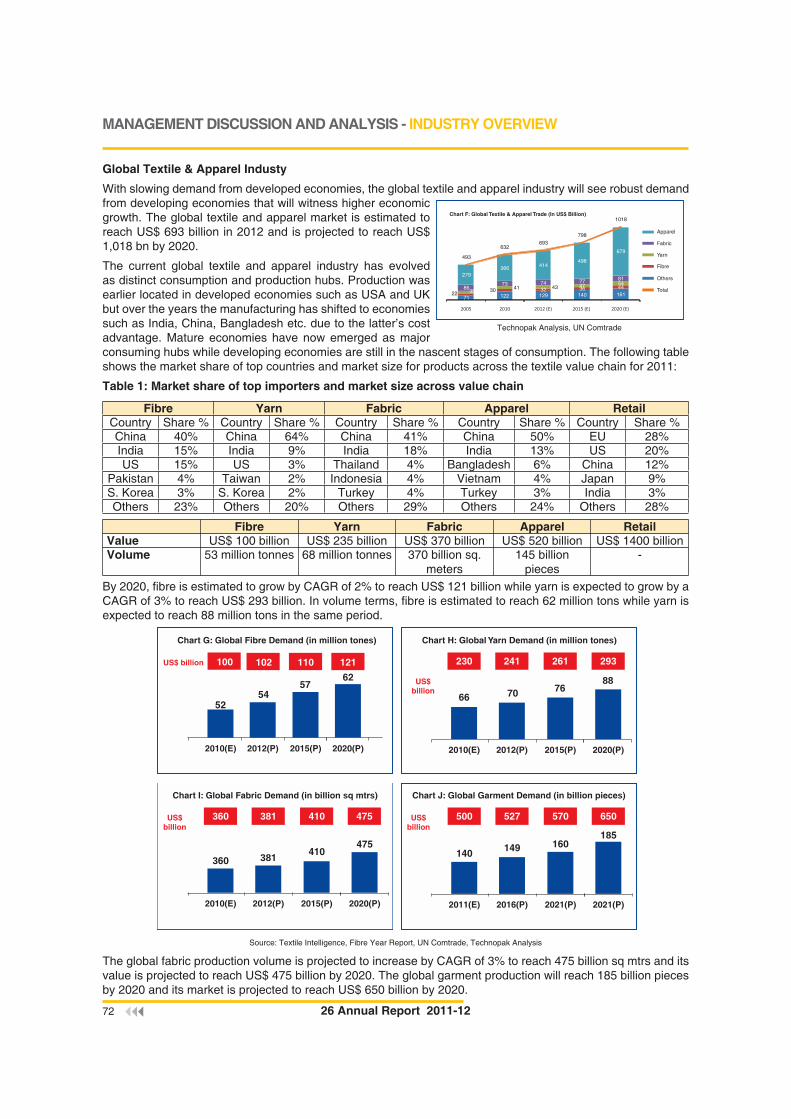
72 26 Annual Report 2011-12
Global Textile & Apparel Industy
With slowing demand from developed economies, the global textile and apparel industry will see robust demand from developing economies that will witness higher economic growth. The global textile and apparel market is estimated to reach US$ 693 billion in 2012 and is projected to reach US$ 1,018 bn by 2020.
The current global textile and apparel industry has evolved as distinct consumption and production hubs. Production was earlier located in developed economies such as USA and UK but over the years the manufacturing has shifted to economies such as India, China, Bangladesh etc. due to the latter’s cost advantage. Mature economies have now emerged as major consuming hubs while developing economies are still in the nascent stages of consumption. The following table shows the market share of top countries and market size for products across the textile value chain for 2011:
Table 1: Market share of top importers and market size across value chain
Fibre Yarn Fabric Apparel RetailCountry Share % Country Share % Country Share % Country Share % Country Share %China 40% China 64% China 41% China 50% EU 28%India 15% India 9% India 18% India 13% US 20%US 15% US 3% Thailand 4% Bangladesh 6% China 12%
Pakistan 4% Taiwan 2% Indonesia 4% Vietnam 4% Japan 9%S. Korea 3% S. Korea 2% Turkey 4% Turkey 3% India 3%Others 23% Others 20% Others 29% Others 24% Others 28%
Fibre Yarn Fabric Apparel RetailValue US$ 100 billion US$ 235 billion US$ 370 billion US$ 520 billion US$ 1400 billionVolume 53 million tonnes 68 million tonnes 370 billion sq.
meters145 billion
pieces-
By 2020, fi bre is estimated to grow by CAGR of 2% to reach US$ 121 billion while yarn is expected to grow by a CAGR of 3% to reach US$ 293 billion. In volume terms, fi bre is estimated to reach 62 million tons while yarn is expected to reach 88 million tons in the same period.
100 102US$ billion
Chart G: Global Fibre Demand (in million tones)
5254
57
2010(E) 2012(P) 2015(P)
110
62
2020(P)
121
US$billion
230 241 261 293
Chart H: Global Yarn Demand (in million tones)
66 70 76
2010(E) 2012(P) 2015(P)
88
2020(P)
360 381 410 475US$billion
Chart I: Global Fabric Demand (in billion sq mtrs)
360 381410
2010(E) 2012(P) 2015(P)
475
2020(P)
US$billion
500 527 570 650
Chart J: Global Garment Demand (in billion pieces)
140 149 160
2011(E) 2016(P) 2021(P)
185
2021(P)
Source: Textile Intelligence, Fibre Year Report, UN Comtrade, Technopak Analysis
The global fabric production volume is projected to increase by CAGR of 3% to reach 475 billion sq mtrs and its value is projected to reach US$ 475 billion by 2020. The global garment production will reach 185 billion pieces by 2020 and its market is projected to reach US$ 650 billion by 2020.
MANAGEMENT DISCUSSION AND ANALYSIS - INDUSTRY OVERVIEW
Chart F: Global Textile & Apparel Trade (In US$ Billion)
Apparel
Fabric
Yarn
Fibre
Others
Total
71 122 129 140 1612230 32 36 44
3541 43 47 54
8673 74 77 81
279366 414
498
679493
632693
798
1018
2005 2010 2012 (E) 2015 (E) 2020 (E)
Technopak Analysis, UN Comtrade

INNOVATIVE TEXTILE SOLUTIONSINNOVATIVE TEXTILE SOLUTIONS
73Innovative Textile Solutions
MANAGEMENT DISCUSSION AND ANALYSIS - INDUSTRY OVERVIEW
Global Fiber Demand
With the rapid increase in world population, the demand of fi ber is also on a rise. From the current levels, the estimated increase in the world population is 0.7 billion and the per capita fi ber consumption for the world, is expected to touch 14kgs, in the next 10 years. This indicates a big jump in the fi ber consumption and hence the existing supply capabilities will need to be pushed up. Following chart shows the trend of world population and the world average fi ber consumption per capita.
On a continent level, the fi ber consumption per capita for the developed world is much higher than the developing economies. Within Asia, there is a very large gap in the consumption per capita of India and China.
Real GDP growth rate (%) 3.50% 1.60% 9.20% 7.80% 3.60%Population (mn) 528 500 1300 1200 7000
Source: World Textile Demand Report 2011, Fiber Year, CIA, Technopak Analysis
Given a higher GDP growth and a larger population base, the demand in the coming decade is expected to be much higher from the emerging economies. And this higher demand will need to be addressed through additional investment capabilities.
Interestingly, the world share of cotton fi ber consumption per capita has declined to 4 kg per capita (~33% of total consumption) and the share of non cotton has increased to 8 kgs per capita. Going forward, similar trend is expected with higher demand for the non cotton or polyester fi bre.
Global Supply Dynamics
In 2010, cotton witnessed volatility in prices which increased the cost of production of garments and pushed up retail prices. The main reason was the low stocks-to-use ratio. The in-transit stocks of cotton gin fell to 34% of consumption. However the roots of rising prices can be traced to the recession and global meltdown in 2009 when inventories throughout the value chain were drawn lower. However with the consumer sentiment rebounding in 2010, demand for cotton reached new heights putting upward pressure on prices. The demand was further stifl ed as few cotton producing nations decided to ban cotton exports in order to serve the domestic market demands.
A recent trend that is slowly emerging is the increased use man-made fi bre (MMF) in garments. Unable to pass on the rising input cost of using higher cotton blend in apparel, manufacturers have increased the proportion of MMF in apparels. As seen in the following graphs, USA imports of apparel has increased by 9% in value although volume had negative growth by 4% indicating the price rise of imports. In 2011, cotton apparel imports by volume witnessed negative growth of 12% while value of such imports increased by 3%. On the other hand, both value and volume of MMF apparel imports increased by 19% and 8% respectively.
-4%9%
% volume growth % value growth
Chart N:2011
Total Apparel Importby USA in
-12% 3%
% volume growth % value growth
Chart O:USA in 2011
Cotton Apparel Importsby
8%
19%
% volume growth % value growth
Chart P:USA in 2011
MMF Apparel Importsby
Source: OTEXA
100200300400500600700800900
2000 2005 2007 2008 2009 2010 2011
Chart M: Average Prices of Raw Materials (in US Cents / Kg)
Cotton Wool Rayon Staple Fibre Polyester Staple Fibre
US Cents / Kg
Source: Textile Intelligence
Chart : K Population and per capita consumption - trend
10.09.08.07.06.05.04.03.02.01.00.0
16.014.012.010.08.06.04.02.00.0
11.813.0
14.4
7.26.9 7.6
Po
pu
lati
on
(b
illio
ns)
1990
1991
1992
1993
1994
1995
1996
1997
1998
1999
2000
2001
2002
2003
2004
2005
2006
2007
2008
2009
2010
2015
2020
per
cap
ita
text
ile f
iber
co
nsu
mp
tio
n(k
g)/
cap
ita)
Source: UN Census, fi bre year report, Technopak analysis
Chart : L Fiber consumption per capita (kgs) - 2011
31
22
17
8
12
North America Europe China India World

74 26 Annual Report 2011-12
MANAGEMENT DISCUSSION AND ANALYSIS - INDUSTRY OVERVIEW
Apart from rising cost of raw material, the textile and apparel industry is facing upward cost pressure from other parameters as well. Major cost components like power and raw material have been increasing signifi cantly and contributing to overall increase in production costs. For e.g. the increase in total cost of production of ring yarn has increased by a CAGR of 8% in the time period 2006-10.
Textile and apparel industry is a very labour intensive industry. The primary reason why manufacturing jobs in this industry shifted from developed to developing countries was the cost advantage offered by the latter. But rising standard of living and infl ations has pushed up labour costs across the textile and apparel manufacturing countries. India saw an average increase of 10% to 15% in labour cost other countries like China and Cambodia saw increase in labour cost ranging from 15% to 35%.
Role of China in Global Textile & Apparel Industry
China is the world’s second largest economy with annual GDP of US$ 5.8 trillion growing nearly by CAGR of 10%. The contribution of this country cannot be undermined as China is the largest exporter of textile and apparel products. In 2010, China accounted for 36% share in global textile and apparel trade. However as a result of natural transition towards a developed economy, China’s concentration on high-end and value generation industries is increasing and diminishing towards the traditional textile and apparel industry.
The textile industry is an energy intensive industry. Due to the textile industry, China contributes nearly 25% of global carbon dioxide emissions and it reach 8.2 million tons last year, thereby curtailing the chances to grow the textile industry.
On the other hand, the domestic demand for Chinese products will increase due to surge in consumerism. With rising per capita income, the Chinese are willing to spend and consume more thus luring the exporters to focus on servicing the domestic demand. Rising per capita income hints at the fact that people have higher disposable income indicating higher wage levels.
China’s policy of controlling population for the past many years has resulted in a very skewed demographic structure. It is expected that 23% of Chinese population will be over 65 years of age by 2020, putting tremendous pressure on the government spending on the older population and income generating population of the country. A fast ageing population and one child policy would cause wage infl ation to rise at an even brisker pace than the average rise of 17% in the period 2000-2011.
The combination of above factors is expected to severely limit China’s capability to grow this industry and meet the global textile and apparel demand. This constraint will provide an opportunity for other textile and apparel nations to grow and meet the global demand. It is estimated that Chinese textile and apparel industry has the potential to reach US$ 850 billion by 2020 but due to above mentioned limitations, it can only reach about US$ 800 billion leaving open a defi cit of US$ 50 billion that can be met by other countries.
China will remain the
biggest exporter but
with rising costs and
rising domestic
demand, it may cede
some export
opportunity
China will add US$
315 Billion to its
domestic apparel
demand by 2020
China’s Constraints 50
Chart S: China Textile & Apparel Industry (in US$ billion)
Domestic Exports Total
2009 2015(E) 2020(E)
292
157
135
496
236
260
350
450
800
Source: Technopak Analysis
1127
6377
2000 2001 2002 2003 2004 2005 2006 2007 2008 2009 2010 2011
Chart Q:China Average Wage Level (in US$)
Chart R: Minimum monthly Wage (in US$)
Bangladesh India Vietnam Indonesia Pakistan Cambodia
37
100 97130
80 90
Source: Technopak Analysis

INNOVATIVE TEXTILE SOLUTIONSINNOVATIVE TEXTILE SOLUTIONS
75Innovative Textile Solutions
MANAGEMENT DISCUSSION AND ANALYSIS - INDUSTRY OVERVIEW
Evolving Global Industry Structure
The US$ 664 billion textile and apparel industry is undergoing some structural changes to sustain itself in this dynamic environment. Till few years back companies were focusing through inorganic growth to increase sales but in the face of increased competition, companies have now started to focus on growth through acquisitions and mergers. Inorganic growth enables companies to access new markets, enhance product portfolio, value chain integration in a shorter span of time.
In developed economies value retailers, who provide products that represent value for money proposition, have grown in the period 2005-10 by an average CAGR of 17% while brands have barely grown by an average CAGR of 2% in the same period. It is expected that going forward, the trend will grow stronger as consumers will rationalize their spending helping the growth of such value retailers at the expense of brands.
A relatively newer trend that has attracted the attention of retailers and brands is multi-channel retailing. It was earlier perceived that consumers need to touch and feel products before they purchase but off late online retailing has emerged very strongly. In fact few retailers have developed and invested in online retail to aid overall sales. Thus it is not surprising that apparel is among the top 3 online categories that is purchased in USA and western Europe.
In a bid to increase their overall sales brands and retailers are reaching out to international markets as these newer markets have relatively lesser competition and increasing appetite for international brands. These newer markets are typically located in developing countries.
Textile and apparel industry is an energy and labour intensive industry. The production processes of textile and apparel impacts the environment and puts pressure on the natural resources of Earth. Globally buyers are becoming aware of the impact of their decisions related to manufactuirng of apparel and textiles. Buyers have tied up with contract manufacturers and have implemented regulations requiring manufacturers to reduce dependence on natural sources and reduce wastage during the production process. Brands and retailers have adopted global change programs and incorporated the philosophy of sustainable production. At the consumer level too, the change has initiated as demand for apparel produced using sustainable practices has started to increase.
Indian Textile & Apparel Industry Outlook
Indian textiles and apparel sector has an overwhelming presence in the economic life of the country. It plays a pivotal role in contribution to industrial output, export earnings and employment generation.
Table 2 Importance of Textiles and Apparel Sector to Indian Economy
• Contributes 14% to the industrial production
• 4% to the GDP
• 17% to the country’s export earnings
• Second largest provider of employment after agriculture, provides direct employment to 45 million people
• Second largest producer of textiles and garments after China
• Second largest producer of cotton in the world
The Indian textiles industry is extremely diverse encompassing hand-spun and hand woven sector at one end of the spectrum, and capital intensive, sophisticated mill sector at the other. Decentralized power looms / hosiery and knitting sector form the largest section of the Sector. Indian textile industry has the capacity to produce a diverse range of products suitable to the different market segments, catering both domestic and exports markets. The major sub-sectors of India textile and apparel sector are cotton/man-made fi bre textiles mill industry, man-made fi bre / fi lament yarn industry, wool and woolen textiles industry, sericulture and silk textiles industry, handlooms, handicrafts, jute and jute textiles industry, and textiles exports.
Indian economy in 2011 has witnessed moderation in growth. Turbulent global conditions, falling value of rupee, rising infl ation coupled with a weak industrial sector have emerged as challenges for India economy. However, despite these challenges favourable demographic conditions and rising income level will help to keep growth story of India’s domestic demand for apparels intact.

76 26 Annual Report 2011-12
MANAGEMENT DISCUSSION AND ANALYSIS - INDUSTRY OVERVIEW
Indian Textile & Apparel Market
India’s total textile and apparel industry size (domestic + exports) is estimated to be INR 418,000 crores ($ 89 bn) in 2011 and is projected to grow at 9.5% CAGR to reach INR 950,000 (US$ 221 bn) by 2020.
Out of INR 418,000 Crores exports accounts for INR 145, 000 Crores and domestic industry accounts for INR 273,000 Crores. Domestic textile and apparel industry comprises of apparel, home textiles and technical textiles.
Break-up of domestic Textile and Apparel Industry of India, 2011
ApparelUS$ 40 bn
INR 190,300 Cr
Indian Textile and Apparel MarketUS$ 89 bn
INR 418,000 Cr
Domestic MarketUS$ 58 bn
INR 273,000 Cr
ExportsUS$ 31 bn
INR 145,000 Cr
Home TextilesUS$ 4 bn
INR 18,400 Cr
Technical TextilesUS$ 14 bn
INR 64,650 Cr
TextilesUS$ 18 bn
INR 83,000 Cr
ApparelUS$ 13 bn
INR 62,000 Cr
Chart U : Break-up of Domestic
Textile and Apparel Industry of India, 2011
The following factors will act as growth drivers for Indian domestic textile and apparel market:
• India will add almost 140 million people in the consuming age group of 15-59 Years. Unlike any other top-10 economy (including China), India will have the lowest median age and the trend will be more distinctly pronounced by 2020 as average age of population of most other nations increases even more rapidly. India’s population in the consuming age group of 15-59 years is more aspirational and aware. They have higher spending power and will consume more number of product categories than their parents. Increasing urbanization will also drive domestic demand in India.
• During the last fi fty years the population of India has grown more than two and half times, from a fi gure of 439 million in 1961 to 1210 million in 2011. But urban India has grown by nearly fi ve times. By 2020, almost 35% of the Indian population will be living in the urban areas and urban population will be more than the combined population of the US, UK and Germany. Increase in urban population will drive consumption in urban India.
• Literacy rate among the youth has already gone up by 25% in the last 20 years. As a consequence of better education these youths will get better jobs, and hence, will have a higher earning potential. Number of households with annual incomes of US $ 7000 and more is going to treble from about 30 million today to 100 million by 2020. There will be approximately 400 million individuals in the bracket of middle to high income group by 2020 and there will be around 70 million aspiring consumers who can afford and consume like a developed world’s consumer.
• As a result of increasing consumption, minimum order quantity of Indian domestic retailers will increase. Previously, extremely small order quantity was a deterring force for domestic textile and apparel players to focus on Indian market. However, increase in order quantity will make domestic fashion market lucrative for players presently targeting export opportunities.
• With an anticipated US$ 50 billion fresh investment over next 10 years, organized retail will show impressive CAGR of more than 25% and will account for 25% of India’s retail market by 2020. Organized apparel retail will derive momentum from fresh investments in retail.
• Emergence of new economic Hot Spots – areas of high economic activity will open up enormous opportunities for fashion retail. Currently the top 8-10 cities contribute disproportionate share of the markets in most of the consumer goods categories including apparels. However, going ahead growth in India would be far more exclusive as the new hot spots of consumption (primarily driven by investments in these regions) appear on the map. With investments in mega projects and development of infrastructure India will see the emergence of around 350 Hot Spots in near future. These new centers of consumption would present an opportunity for
Chart T: Indian Textile and Appparel IndustrySize and Projection
2011(E) 2015(P) 2020(P)
418
605
950
145
273
215
390
350
600
Domestic Total (INR ‘000 Cr)Exports

INNOVATIVE TEXTILE SOLUTIONSINNOVATIVE TEXTILE SOLUTIONS
77Innovative Textile Solutions
MANAGEMENT DISCUSSION AND ANALYSIS - INDUSTRY OVERVIEW
apparel and fashion retail companies to focus on and derive growth from the consumption potential. Also, conventional model of modern retail will not be able to offer all formats or cater to all customer groups in these hotspots and new models like e-tailing will sprout in coming years.
Table 3: Key Opportunities and Threats in Domestic Market
Opportunities ThreatsGrowing domestic market at 9%
Growing penetration of organized retail
Increasing presence and growth of global brands and retailers in India
Increasing local sourcing by global brands / retailers in India
Expected FDI relaxation in multi brand retail & local sourcing clauses
Increasing apparel imports from Bangladesh / China
Effect of government policies like excise duty on branded garments and duty free imports from Bangladesh on sourcing by brands / retailers
Impact of global economic slowdown on India’s consumption
India’s Trade Scenario
Overall textiles and apparel exports of India is estimated to be US$ 31 billion in 2011 and with a year-on-year growth of 10% since 2005. Apparel exports contribute the most to the overall exports value followed by contribution from fi bre, yarn and fabrics exports. Fibre exports have highest CAGR with substantial growth in recent years.
Share of India in world’s textile and apparel exports currently stands at 4.5%, it is estimated that this fi gure will grow to 8% by 2020 with total exports of US$ 82 billion. This growth from 4.5% to 8% of world trade will open up huge potential for Indian players.
The US is the biggest export destination for Indian textiles and apparel. In 2007 exports to US was around 20% of total textiles and apparel exports of India, in 2011 the US is estimated to account for 18% of total exports. Other major export destinations are the UK,
Germany, UAE and China. India’s export to China as a per cent of India’s total exports has reduced from 5% from 2007 to 3% in 2011.
Chart X: Country-wise Share of India’s export of textiles and apparels
2011(E ) EU-27
USA
UAE
China
Bangladesh
Others
26%
18%8%3% 3%
42%
2007 EU-27
USA
UAE
China
Pakistan
Others
29%
20%6%5%2%
38%
Source: DGCI&S, Kolkata, Technopak analysis
India’s exports include wide range of products made of cotton, manmade fi bres, wool and silk. In 2011 cotton garments contributed around 38% to India’s textile and apparel exports followed by cotton yarn, fabrics and made-ups with 27% share and manmade yarn, fabrics and made-ups with 20% share.
8%
1.6 2.62.75.3
2.5
4.3
2.2
4.9
8.2
11.5
17
31
2005 2011 (E )
Chart V : Exports Growth of Various Textiles andApparel Products (in US$ billion)
Apparel
Yarn
Fabric
Fibre
Others
Made Ups
Grand Total
Source: UN Comtrade, Technopak analysis
1734
45
80
2005 2012( P) 2015 (P) 2020(P)
Chart W : India Textile & Apparel Export
Trend & Future Potential (in US$ billion)
%Share in world trade
3%
4.5%
6%
8%
Source: Ministry of Textiles, Technopak Analysis

78 26 Annual Report 2011-12
MANAGEMENT DISCUSSION AND ANALYSIS - INDUSTRY OVERVIEW
Global trade is shifting in favour of sourcing from low cost Asian countries; India is expected to get benefi t out of this. New consumption markets like Brazil, Russia, South Africa, and Turkey are also expected to create huge export opportunities for India. At the same time, increasing manufacturing cost of China will force some of the manufacturing to shift to other countries including India. On the other hand, India is expected to face steeper competition from other low-cost countries like Bangladesh and Vietnam especially in labour intensive apparel sector. Countries like Bangladesh also have duty-free access to many European countries through EU – Generalized System of Preferences for being least developed countries; this makes their products more cost-competitive.
Table 4: Key Opportunities and Threat in Exports Market
Opportunities ThreatsOverall growing trade at 5% and increasing shift of sourcing to lower cost countriesOpportunity created by export potential diverted from China due to its increasing manufacturing challenges and limitationsGrowing opportunities in new consumption markets like Brazil, Russia, South Africa, Turkey etc.
High pressure on margin due to high competition from lower cost countries like Bangladesh/ Vietnam etc.Infl uence of FTAs in preference to countries like Bangladesh (EU – GSP), Mexico (US-NAFTA) etc.Dependence on government incentives like duty drawback etc.Risk of currency fl uctuations & global economic climate
India’s imports of textiles and apparels have grown at a 5-year CAGR of 3% from 2007 to 2011 and are estimated to be more than US $3 billion in 2011. Imports of made-ups and apparels have increased substantially over the years with a 5 year CAGR of 37% and 25% respectively. China is the biggest supplier to India with a share of 49% of India’s total imports. Taiwan, USA, Bangladesh and Korea are other major supplying countries to India. India’s import from Bangladesh has grown at a CAGR of 31%, import from China and the US has grown at a CAGR of 5% each from 2007 to 2011.
Chart Z:
37%
23%
13%
20%
2%
5%
Yarn
Product wise % Share of Imports Value2011(E ) Apparel
Fabric
Fibre
Made Ups
Others
Country wise % Share of Imports Value2011(E )
Others
China
Taiwan
USA
Bangladesh
Korea
49%
4%
34%
4%5%4%
Supply Dynamics
Gujarat, Maharashtra and Andhra Pradesh are major raw cotton producing states of India, while Tamil Nadu tops in spun yarn production followed by Punjab. India has an unevenly distributed supply chain, e.g., Tamil Nadu has a greater spun yarn capacity while Gujarat and Maharashtra have greater fabric capacity resulting in interchange of raw material across states. Most of the garment production comes from Maharashtra, Karnataka, Tamil Nadu and Delhi/NCR. Delhi/NCR has been a commercial hub while Maharashtra, Karnataka and Tamil Nadu have access to ports. Madhya Pradesh and Rajasthan also contribute to spun yarn and fabric production. Textile production in eastern and north-east India is almost negligible.
Chart Y: Productwise Share of India's Exports , 2011(E)
Cotton garments
Cotton yarn, fabrics,madeupsManmade yarn, fabrics,madeupsManmade fibre garments
40%
28%
21%
8% 2%1%
Source: DGCI&S, Kolkata, Technopak analysis

INNOVATIVE TEXTILE SOLUTIONSINNOVATIVE TEXTILE SOLUTIONS
79Innovative Textile Solutions
MANAGEMENT DISCUSSION AND ANALYSIS - INDUSTRY OVERVIEW
Geography wise distribution of textile and apparel activities in India, 2011
Figures inside the bubbles represent % share of India’s total installed capacity of the respective product. Bubble sizes represent corresponding installed capacities in respective states. The bubbles are representative of > 90% of India’s installed capacities. Source: Ministry of Textiles, Technopak analysis
Different elements of textile and apparel value chain demonstrate peculiar characteristics in terms of scale, capital intensiveness, fragmentation, price volatility etc. In India man-made fi bre/ fi lament is completely organized with very few players while garmenting is the most fragmented industry. Spinning and man-made fi bre productions are highly capital intensive while garmenting is not that capital intensive. Price volatility of textile value chain is higher in upstream activities than in downstream fabric manufacturing and garmenting. Natural fi bers have very high price volatility due to their dependence on weather conditions, garmenting is least price volatile as apparel price is directly linked with consumer’s purchase decision and consumer’s price sensitivity is higher for apparels.
Evolving Structure of Indian Textiles and Apparel Industry
Consolidation and alliances is emerging as a growth route for many textiles and apparel players in India. Most of the mergers, acquisitions and joint-ventures in sector is coming up in garment manufacturing.
Going forward bilateral and multilateral trade agreements will play an important role in shaping up Indian industry structure. Current Key trade agreements impacting textile and apparel sector of India include: India – Japan FTA, India – Bangladesh Bilateral Trade Agreement, GSP scheme. Future trade agreements with EU and South East Asian countries will have further impact on the industry.
While textile and apparel trade is increasingly becoming more cost sensitive, overall production costs in India have increased by an average 8-10% in last 4 years. Production cost will decide competitiveness of the industry in global market and shape future structure of the industry.
Competitiveness of India
India is one of the largest producers of textiles and apparel in the world. Strong production base of wide range of both natural and man-made fi bres including cotton, jute, silk, wool, polyester, nylon, and acrylic adds to the fundamental strength of Indian textile and apparel industry. It is world’s largest producer of jute, second largest producer of silk, third largest producer of cotton and fi fth largest producer of synthetic fi bres and yarn. India has a strong presence across textile value chain starting from fi bre production to garmenting. No other country except China had this high degree of integration across the value chain.
Infrastructural bottlenecks have long been an issue for Indian exports. However, with increasing government focus on infrastructure building and participation of private players in power, airlines, roads, ports, etc. India’s export will get a fi llip in coming years.
Political and economic stability of India makes it a better trade partner compared to its low-cost Asian peers. India has fl exibility in production quantity; Indian players can execute orders of various order sizes – extremely large to small orders. India has manufacturing capabilities to produce textile and apparel goods of diverse quality and variety while many of its peer still struggle with poor quality manufacturing and chemical processing. Availability of abundant skilled and cost-effi cient labour is expected to keep country’s competitiveness buoyant for next few years. Strong managerial talent pool and entrepreneurial spirit of Indian businessmen are added advantages of Indian textile and apparel sector. Robust domestic market which is growing at 9% per year backed by high

80 26 Annual Report 2011-12
MANAGEMENT DISCUSSION AND ANALYSIS - INDUSTRY OVERVIEW
GDP growth and growth in consumer spending power will provide India’s textile and apparel sector plethora of opportunities to fl ourish irrespective of global market conditions.
Textiles and apparel exports of India has grown at a CAGR of 10% from 2007 to 2011. Growth rate of India’s export is higher than most of its peer. Bangladesh has demonstrated a CAGR of 15% for the same period, most of its growth coming from apparel exports. China’s textile and apparel exports have grown by a CAGR of 7% from 2007 to 2011. China accounts around 33% of the total global exports of textiles and apparel while India accounts 4.5% followed by Turkey at 3.5% and Bangladesh at 3%
Table 5 Share of Selected Countries in Global Textiles and Apparel Exports
Country Share in Global Textiles and Apparel Exports
Country Share in Global Textiles and Apparel Exports
China 32.5% Vietnam 2.5%India 4.5% Indonesia 2.0%
Bangladesh 3% Thailand 1.5%Pakistan 2% Turkey 3.5%Sri Lanka 0.5%
India has an integrated textile and apparel industry with presence in all sector of textile manufacturing value chain. As a result India is less dependent on other countries for supply of raw materials. On the other hand, most of the competing countries of India do not have strong presence across textile manufacturing value chain that leads to heavy dependence on other countries for fi bre, yarn and fabric requirements. India exports almost equal value of textiles and clothing while exports of most of the competing are highly skewed towards clothing. This exposes these countries to yarns and fabric supply risks whereas India has an advantage of strong upstream integration and these competing countries provide export markets for Indian yarn and fabrics.
Textile Policies of Government of India & State Governments
The Textiles and clothing industry is the second most important economic activity in the country in terms of employment generation (after agriculture). It is also one of the major sources of export earnings for the country. Its share in manufacturing value added is estimated currently at about 12 per cent. The textile industry is presently in a state of fl ux due to the severe contraction in export and domestic demand in the wake of global economic and fi nancial crisis. Major business restructuring is taking place across the industry. The government is also considering measures to support the industry on which livelihood of millions of people is dependent.
The industry is affl icted by slow and uneven modernisation across various segments. Insuffi cient Modernisation is especially the case with dying and processing, weaving, garments, non-woven and technical textiles segments. Ministry of Textiles (MoT), Government of India (GoI) is proactively working to improve the status of Indian textile industry. MoT has launched many schemes to uplift the conditions of textile industry from unorganized sector, Textile cluster to large textile industries. To address the trained manpower needs of textiles industries the skill development scheme is launched by MoT. The most popular and successful scheme of MoT are
1. Technology Up gradation Fund Scheme (TUFS)
2. Scheme for Integrated Textile Parks (SITP)
3. Technology Mission on Cotton
4. Integrated Skill Development Scheme
TUFS was introduced in April 1999 to catalyse investments in all the sub-sectors of textiles and jute industry by way of 5% interest reimbursement. In spite of a strong and diversifi ed fi bre and production base, for various historical reasons, the Indian textiles industry has suffered from severe technological obsolescence and lack of economies of scale. The TUFS has helped overcome this technological disadvantage to some extent. An independent evaluation of the Scheme by a professional consultant has revealed that TUFS has facilitated
Chart AA:Textile and clothing Trade of Major Competing
Countries (US $ bn) 2011(E)31.0
22.4
4.86.7
3.3
15.2
2.64.8
13.5
18.2
9.5
14.7
5.4
9.3
14.6
27.7
ImportsExports
Indi
aBan
glad
esh
Paki
stan
Sri La
nka
Viet N
am
Indo
nesi
a
Thai
land
Turk
ey
Source: UN Comtrade, Technopak analysis

INNOVATIVE TEXTILE SOLUTIONSINNOVATIVE TEXTILE SOLUTIONS
81Innovative Textile Solutions
MANAGEMENT DISCUSSION AND ANALYSIS - INDUSTRY OVERVIEW
an increase in productivity; cost and waste reduction; and improved quality across the value chain. TUFS has infused an investment climate in the textiles sector and, in its operational life span TUFS has propelled investment of ` 2,07,747 crore.
In order to provide the industry with world-class infrastructure facilities for setting up their textile units, the Scheme for Integrated Textile Park (SITP) was approved in July 2005. Development of textiles parks in the backdrop of successful implementation will facilitate additional investment, employment generation and increase in textiles production. 40 Textile Park projects have been sanctioned by the Textile Ministry till date in various states and 21 new parks are sanctioned in Oct’ 2011. The Government of India has decided to continue the SITP in the 12th Five Year Plan. This will facilitate additional investment, employment generation and increase in textiles production. Total Grant released in the scheme till now ` 803 Cr. and 25 Parks are operational with Investment of approx. ` 4000 Cr.
A scheme for Integrated Skill Development is launched to address the trained manpower needs of textiles and related segments including handicrafts, Handlooms, Sericulture, Jute, Technical Textiles etc., by developing a cohesive and integrated framework of training based on the industry needs. Addressing this need is critical for enhancing the competitiveness of the industry in the globalized economy.
Other than above following schemes are also launched for improving the conditions of unorganized textile sector like Development of Mega Clusters Scheme
1. Comprehensive Powerloom Cluster Development Scheme (CPCDS)
2. Comprehensive Handlooms Cluster Development Scheme (CHCDS)
3. Comprehensive Handicrafts Cluster Development Scheme (CHCDS)
4. Powerloom Scheme – Various small schemes to promote powerloom Scheme
5. Textile Workers Rehabilitation Fund Scheme (TWRFS)
6. The Ambedkar Hastshilp Vikas Yojana and other small schemes for the benefi ts of artisans employed in handicraft and other SSI segments
Various state governments are also active in formulation of textile policy of state like Maharashtra Government has come up with Capital subsidy and zero percent interest subsidy for specifi c region. Government of Karnataka has also launched various schemes and organizing road shows to generate the interest in business community for investments in Maharashtra state. Punjab, Gujarat, TamilNadu & Andhra Pradesh has also clearly defi ned their policy for textile industry.

82 26 Annual Report 2011-12
Business Performance
Alok Industries (‘Alok’ or ‘the Company’) is primarily a textiles and apparels major with offerings across the entire value chain. The strength of the Company’s business is its integrated textiles operations, both in cotton as well as in polyester. While the Company has acquired some facilities in Europe (through wholly owned subsidiary Mileta, a Czech Republic based integrated textiles company), the core manufacturing facilities are based in India (Silvassa, Vapi, Navi-Mumbai and Bhiwandi). Utilising its cost competitive integrated production base, the Company caters to markets in India and across the world. The stand-alone fi nancial result, which is the major part of the Company’s consolidated results, refl ects the performance of the Company’s textiles operations out of India.
The company has also invested into some other businesses. This includes its foray into the textile and apparel retail business both in India and in the United Kingdom (UK). In India, its retail business is carried out through its subsidiaries under the store brand ‘H&A’, while it operates the ‘Store Twenty One’ outlets through its overseas subsidiary Grabal Alok (UK) Limited.
To explore the opportunities in real estate sector, the Company had entered the real estate business through its real estate subsidiary Alok Infrastructure Limited. However, the company has in-principle decided to exit the real estate business.
Merger with Grabal Alok Impex
During the year, the Honourable High Court, Bombay, sanctioned the scheme of amalgamation between Alok Industries Limited and Grabal Alok Impex Limited with appointed date of 1 April 2011.
The merger has resulted into operational synergies between the two companies and consolidates all textile operations under one entity. The swap ratio for the merger was 1:1 as determined by Ernst & Young (for every one share of Grabal, one share of Alok was allotted). The fairness opinion on the valuation was provided by Fortune Financials Services (India) Ltd.
Consequent to the merger, the company issued 2,24,85,000 equity shares of ` 10/ – each to the shareholders of Grabal Alok Impex Ltd (of which 19,00,000 shares were issued to Alok Benefi t Trust).
On amalgamation of the company with Grabal Alok Impex Ltd., Grabal Alok (UK) Ltd., an associate company of both companies, has now become a majority owned subsidiary of Alok Industries Ltd.
Grabal Alok Impex Ltd is in the business of manufacturing embroidered products and current year numbers of the company include sales of ` 160.96 crore and Profi t Before Tax of ` 7.58 crore of Grabal Alok Impex Ltd and hence are not comparable with previous year.
Financial Performance (Stand Alone)
During FY 2011-12, Alok Industries achieved growth of 39.33% in sales, 39.64% growth in operating earnings before interest, depreciation, tax and amortisation (Operating EBITDA) and 21.95% growth in operating Profi t before tax (Operating PBT). Due to volatility and depreciation in the Indian rupee against the US Dollar, the Company had to provide ‘marked to market’ on its foreign exchange transactions amounting to ` 121.27 crore, as extra-ordinary provisioning. Consequently, Profi ts after tax, stood at ` 380.53 crores in 2011-12. In terms of regular operations, the performance in 2011-12 refl ects the Company’s continuous endeavour to utilise its increased capacities and capital investments towards higher growth. Table 6 gives a summary of Alok’s fi nancial performance, as a stand-alone entity.
Table 6: Key Financial Indicator (Stand-alone) – past four years(` Crore)
Particulars 2011-12 2010-11 2009-10 2008-09 % Change(2011-12 vs.
2010-11)Net Total Sales 8,900.86 6,388.43 4,311.17 2,976.92 39.33%Export Sales 3,029.55 2,217.43 1,558.99 1,054.51 36.62%Operating EBIDTA 2,624.75 1,879.70 1,272.48 822.61 39.64%Depreciation 713.43 518.79 362.61 233.5 37.52%Interest 1,149.55 736.27 535.08 304.12 56.13%PBT (operating) 761.77 624.64 374.79 284.99 21.95%
MANAGEMENT DISCUSSION AND ANALYSIS - BUSINESS OVERVIEW

INNOVATIVE TEXTILE SOLUTIONSINNOVATIVE TEXTILE SOLUTIONS
83Innovative Textile Solutions
Particulars 2011-12 2010-11 2009-10 2008-09 % Change(2011-12 vs.
2010-11)PAT 380.53 404.36 247.34 188.37 (5.89%)Cash Profi t 1,334.19 1,083.98 711.89 513.98 23.08%
Table 7 gives the summarised profi t and loss statement of the Company in 2011-12 compared to the previous year.
Table 7: Summarised Profi t and Loss Account
(` Crore)
Profi t & Loss Account 2011-12 2010-11 % ChangeAmount % to Sales Amount % to Sales
Domestic Sales 5,871.31 4,171.00 40.76%Export Sales 3,029.55 2,217.43 36.62%Net Sales 8,900.86 6,388.43 39.33%Other Income 65.60 41.09 59.65%TOTAL INCOME 8,966.46 6,429.52 39.46%Material Costs 4,393.13 49.36% 3,344.12 52.35% 31.37%People Costs 267.28 3.00% 199.76 3.13% 33.80%Other Expenses 1,681.30 18.89% 1,005.94 15.75% 67.15%OPERATING EBIDTA 2,624.75 29.49% 1,879.70 29.42% 39.64%Depreciation 713.43 8.02% 518.79 8.12% 37.52%OPERATING EBIT 1,911.32 21.47% 1,360.91 21.30% 40.45%Interest & Finance Costs 1,149.55 12.92% 736.27 11.53% 56.13%OPERATING PBT 761.77 8.56% 624.64 9.78% 21.95%Exceptional Items 121.27 41.45 192.57%PROFIT BEFORE TAX 640.5 583.19 9.83%Less: Provision for Taxes 2.92% 2.80% 45.39%Current Tax 157.64 78.15Deferred Tax 102.33 100.68PAT 380.53 4.27% 404.36 6.33% -5.90%
Profi t and Loss Analysis
• Net Sales increased by 39.33% to ` 8900.86 crore in 2011-12 from ` 6,388.43 crore in 2010-11. Growth was driven by both domestic and exports. Domestic sales increased by 40.76% to ` 5,871.31 crore in 2011-12 against ` 4,171.00 crore in 2010-11; and exports increased from ` 2,217.43 crore in 2010-11 to ` 3,029.55 crore – growth of 36.62% in 2011-12.
• Other Income increased by 59.65% to ` 65.60 crore in 2011-12 from ` 41.09 crore in 2010-11. Much of the other income booked is interest income on current investments and other non-operating income such as gain on sales of assets, Insurance claim, some provisioning etc.
• Material Cost was ` 4,393.13 crore in 2011-12. This is a 31.37% growth over ` 3,344.12 crore in 2010-11. As a percentage of sales, material cost decreased from 52.35% in 2010-11 to 49.36% in 2011-12. While much of this cost reduction is due to the easing out of raw cotton and polyester raw material prices during the course of 2011-12, it is also a refl ection of the change in the Company’s product mix towards higher value added products. Given its integrated operations, with easing of prices of materials at the lower end of the textile value chain, the Company succeeded in producing and selling more products on the higher end of the value chain
• People Costs were well managed. In absolute terms it increased from ` 199.76 crore in 2010-11 to ` 267.28 crore in 2011-12 – a growth of 33.81%. People cost to net sales ratio decreased, albeit marginally, from 3.13% in 2010-11 to 3.0% in 2011-12
• Other Expenses increased by 67.14% from ` 1,005.97 crore in 2010-11 to ` 1,681.30 crore in 2011-12. As a percentage of net sales, it increased from 15.75% in 2010-11 to 18.89% in 2011-12. Factory overheads
MANAGEMENT DISCUSSION AND ANALYSIS - BUSINESS OVERVIEW

84 26 Annual Report 2011-12
increased by 53.24%. As percentage to sales, factory overheads increased from 11.84% in 2010-11 to 13.03% in 2011-12. Administrative and selling expenses grew by 109.31% in 2011-12, and relative to sales it increased from 3.90% for 2010-11 to 5.86% for 2011-12. Much of the increase in selling and administrative expenses was due to exchange rate differential realisation of ` 248.56 crore in 2011-12 against ` 34.19 crore recorded in 2010-11
• Power cost, which is a signifi cant part of other expenses, increased by 67.32% from ̀ 392.09 crore in 2010-11 to ` 656.05 crore in 2011-12. As a percentage of sales, it increased from 6.14% in 2010-11 to 7.37% in 2011-12. A lot of this increase is due to the high prevailing market prices of fuel and oil. The Company is also in the process of converting fuel use from gas to coal for its boilers at Vapi process house for generation of steam to optimise the cost of power & energy
• Operating Earnings Before Interest, Depreciation, Tax and Amortisation ( Operating EBIDTA) increased by 39.64% to ` 2,624.75 crore in 2011-12 against ` 1,879.70 crore in 2010-11. The operating EBIDTA margins increased marginally from 29.42% in 2010-11 to 29.49% in 2011-12
• Depreciation expense increased from ` 518.79 crore in 2010-11 to ` 713.43 crore in 2011-12. This was increase of 37.52%.
• Interest expense increased by 56.13% from ` 736.27 crore in 2010-11 to ` 1,149.55 crore in 2011-12. As a percentage to sales, interest and fi nancing expenses increased to 12.92% of sales for 2011-12; compared to 11.53% of sales for 2010-11. The main reason for increase in interest cost is the sharp increase in interest rates by about 3.5% during the year
• Exceptional Items comprise mainly of marked to market unrealised gains or losses from foreign exchange derivative transactions. The amount was ` 121.27 crore in 2011-12 against ` 41.45 crore in 2010-11.
• Operating Profi t before Tax (Operating PBT) increased by 21.96% from ` 624.64 crore in 2010-11 to ` 761.77 crore in 2011-12. After accounting for exceptional items the Profi t before tax (PBT) was ` 640.50 crore in 2011-12 – a 9.83% increase over 2010-11
• Profi t After Tax (PAT) was ` 380.53 crore in 2011-12 against ` 404.36 crore in 2010-11. The cash profi t for the year 2011 – 12 was ` 1334.19 crore as compared to ` 1083.98 crore in 2010-11, a growth of 23.08%
Charts AB and AC plot the 5 year data for sales and profi ts
Chart AB: 5 Yr Trends - Sales & OperatingEBIDTA
21702977
4311
6388
8901
411 823
26251880
1272
0
1000
2000
3000
4000
5000
6000
7000
8000
9000
10000
2007-08 2008-09 2009-10 2010-11 2011-12
Net Sales Operating EBIDTA
Chart AC: 5 Yr Trends - PBT & PAT
254 285375
625
762
168 188
381404
247
0100200
300400500600700800
2007-08 2008-09 2009-10 2010-11 2011-12
PBT PAT
Key Ratios
Table 8 gives the key fi nancial ratios for Alok Industries, as a stand-alone entity
Table 8: Key Ratios (Alok Industries – Stand Alone)
Profi tability Ratios 2011-12 2010-11
Operating EBIDTA (%) 29.49% 29.42%
Operating Profi t Before Tax Margin (%) 8.56% 9.78%
Profi t After Tax Margin (%) 4.28% 6.33%
Return on Capital Employed (%) 12.63% 11.72%
Return on Net worth (%) 13.88% 13.05%
Balance Sheet RatiosNet Total Debt to Equity 3.14 2.75
MANAGEMENT DISCUSSION AND ANALYSIS - BUSINESS OVERVIEW

INNOVATIVE TEXTILE SOLUTIONSINNOVATIVE TEXTILE SOLUTIONS
85Innovative Textile Solutions
Profi tability Ratios 2011-12 2010-11
Net Total Debt / EBITDA 4.37 4.53Current Ratio 1.24 1.26Coverage RatiosOperating EBITDA/Interest 2.28 2.55Net Fixed Assets/Secured Loans (1st Charge holders) 2.31 2.58Debtors Turnover – Days 88 99Inventory Turnover – Days 139 114
Note: All parameters qualifi ed by the term ‘operating’ refers to fi gures without exceptional items
• Operating EBIDTA Margin was at about same level as previous year and improved marginally to 29.49% in 2011-12 from 29.42% in 2010-11. While other cost increased such as energy costs etc., Alok focused on better value added products and hence material cost as a percentage to sales reduced which has helped to maintain operating margins
• Operating PBT Margin was 8.56% in 2011-12, as compared to 9.78% in 2010-11. The reduction in margin was mainly on account of high interest cost regime prevailed during the year, which increased the total interest cost by 56.13%
• Profi t After Tax margin reduced to 4.28% in 2011-12 as compared to 6.33% in 2010-11. Besides increase in interest cost, other reason for decline in PAT was on account of higher Marked to Market (MTM) provisioning during the year on account of depreciation of rupee.
• Return on Capital Employed (ROCE) at EBITA level increased to 12.63% in 2011-12 from 11.72% in 2010-11
• Return on Net worth (RONW) improved to 13.88% in 2011-12 as compared to 13.05% in 2010-11
• Debt /Equity ratio Net total debt to equity ratio was at 3.14 in 2011-12 against 2.75 in 2010-11
• EBIDTA/Interest indicates the Company’s ability to service its debt costs through profi ts. EBIDTA/Interest was at 2.28 in 2011-12
• Net fi xed assets as a ratio to secured loans stood at 2.31 in 2011-12.
• Current ratio is 1.24 in 2011-12 compared to 1.26 in 2010-11
• Inventory turnover increased from 114 days in 2010-11 to 139 days in 2011-12. However, Debtor turnover improved from 99 days in 2010-11 to 88 days in 2011-12
Cash Flows
Table 9 gives the abridged cash fl ow statement of the Company
Table 9: Summarised Cash Flow Statement
(` Crore)PARTICULARS 2011-12 2010-11
Net Cash Generated From Operating Activities (115.39) 1,126.08Net Cash Used In Investing Activities (1,113.05) (2,045.15)Net Cash Generated From Financing Activities 1,515.91 353.96Net Cash Surplus ( Defi cit) 287.47 (565.11)Cash And Cash EquivalentsAt The Beginning of The Period 108.29 673.4Cash Pursuant To Amalgamation 147.00 -At The End of The Period 542.76 108.29Net Increase In Cash And Cash Equivalents 287.47 (565.11)Reconcilliation With Cash & Bank BalancesAt The End of The Period 542.76 108.29Add: Deposits With Banks / Earmarked Balances 715.12 978.32Add: Deposits with maturity period of more than three months 36.96 53.24Cash & Bank Balances as per Balance Sheet 1,294.84 1,139.85
The net cash fl ow from operating activities was negative by ` 115.39 crore mainly on account of increase in current assets during the year end. This increase in current assets would get neutralised as the operations
MANAGEMENT DISCUSSION AND ANALYSIS - BUSINESS OVERVIEW

86 26 Annual Report 2011-12
increases in the coming period. The company is also checking all possible measures to reduce its inventory and debtors cycle, which would result in improving the cash fl ow from operating activities.
The cash fl ow from investing activities was negative by ` 1,113.05 crore mainly on account of increase in fi xed assets.
The cash fl ow from fi nancing activities was positive by ` 1,515.91 crore mainly on account of increase in borrowings. Also, during the year, the company also received ̀ 61.20 crore on account of conversion of warrants (warrants transferred from Grabal on merger with Alok) into equity shares at a premium. The same is included in cash fl ow from fi nancing activities.
Ratings
Credit Analysis and Research Ltd (CARE) has assigned the following rating for the facilities of the company, under BASEL II
• “CARE A” rating for the long term facilities: Instruments with this rating are considered to have adequate degree of safety regarding timely servicing of fi nancial obligations. Such instruments carry low credit risk
• “CARE A1” rating for the Short Term facilities: This rating is applicable to facilities having tenure up to one year. Instruments with this rating are considered to have very strong degree of safety regarding timely payment of fi nancial obligations. Such instruments carry lowest credit risk
Textiles Business: Operations Review
The strategy adopted by Alok Industries Ltd. in its core textile operations is focus on integration both in cotton as well as in polyester. It has a presence across the entire textiles and apparel value chain. The cotton integrated operations begins with sourcing of cotton and converting it into cotton yarn followed by fabric production through knitting and weaving operations. Bulk of its sales happens at fabric stage (called apparel fabrics) and some part of the fabrics gets converted into garments. On the integrated cotton business, it also manufactures bed sheets and towels in its home textile division.
On the polyester integrated business, its raw material is PTA (Purifi ed Terephthalic Acid ) / MEG (Mono-Ethylene Glycol) and its manufacturing operations starts with converting PTA / MEG into Chips / POY (Partially Oriented Yarn) through CP (Continuous Polymerisation). Its strategy in polyester business is to produce more of fi nished products like DTY (Draw Texturised Yarn), FDY (Fully Drawn Yarn), PSF (Polyester Stable Fibre) and Cationic yarn with thrust on exports.
The integration of Alok in cotton and polyester is depicted in the graph - AD below:
YarnManufacturing
FabricManufacturing
Garment / Bed Sheets / Towels Manufacturing
Textile Value Chain -Cotton
Fabric Processing
RawMaterial Cotton
ContinuousPolymerisation POY / Chips DTY / FDY / Technical Yarn/
PSFTextile Value
Chain -Polyester
Raw Material PTA & MEG
PRESENCE - ALOK INDUSTRIES
The integrated operations reduce its dependence on outside raw materials and enable it to capture the margins across the textile value chain and make the company more sustainable.
Sales:
Total Sales increased by 39.33% to ` 8,900.86 crore in 2011-12 compared to ` 6,388.43 crore in 2010-11.
The company has fi ve divisions: cotton yarn, apparel fabrics, home textiles, garments and polyester yarn. Chart W gives the relative share of the different divisions in the Company’s total standalone sales. With 46% share, apparel fabrics have the largest share of revenues, followed by polyester yarn with 34%; home textiles with 14%; raw cotton and yarn with 4%; and garments with 2%.
MANAGEMENT DISCUSSION AND ANALYSIS - BUSINESS OVERVIEW

INNOVATIVE TEXTILE SOLUTIONSINNOVATIVE TEXTILE SOLUTIONS
87Innovative Textile Solutions
Chart AE Division wise sales
2011-12 2010-11
ApparelFabrics,
46%
Polyesteryarn, 34%
Garments,2%
Raw cottonand
yarn, 4%HomeTextiles,
14%
ApparelFabrics,46.54%
Polyesteryarn, 26.43%
Garments,2.72%
Raw cottonand
yarn, 8.65%HomeTextiles,15.66%
Table 10 gives the details of sales across Alok’s different divisions.
Table 10: Alok’s Divisional Sales Snapshot
(` Crore)
PARTICULARS Twelve Months Ended 31 Mar 2012 Twelve Months Ended 31 Mar 2011 Change
Local Export Total % To Total Sales
Local Export Total % To Total Sales
COTTON YARN 128.32 193.95 322.27 3.62% 416.4 136.5 552.9 8.65% (41.71%)
APPAREL FABRIC
WOVEN 3,295.41 568.04 3,863.45 43.41% 2,458.85 272.77 2,731.62 42.76% 41.43%
KNITTING 153.43 114.76 268.19 3.01% 116.77 124.79 241.56 3.78% 11.02%
3,448.84 682.80 4,131.64 46.42% 2,575.62 397.56 2,973.18 46.54% 38.96%
HOME TEXTILES 30.02 1,220.39 1,250.41 14.05% 54.08 946.03 1,000.11 15.66% 25.03%
GARMENTS 21.7 195.6 217.30 2.44% 11.07 162.99 174.06 2.72% 24.84%
POLYESTER YARN 2,242.41 736.81 2,979.22 33.47% 1,113.83 574.35 1,688.18 26.43% 76.48%
TOTAL 5,871.31 3,029.55 8,900.86 100.00% 4,171.00 2,217.43 6,388.43 100.00% 39.33%
Domestic Sales
In 2011-12, domestic sales accounted for 66% of total sales and grew by 40.76% to ` 5,871.31 crore from` 4,171 crore in 2010-11. The major constituent of domestic sale is apparel fabrics and polyester yarn.
Export Sales
Export sales in 2011-12 also grew by 36.62% to ̀ 3,029.55 crore from ̀ 2,217.43 crore in 2010-11 and accounted for 34% of Alok’s total sales. Alok exported to about 95 countries across the globe.
The largest value of exports is to USA with a share of 36% of total exports. Asia has the second largest share of 29%. South America has gained considerable share and is the third largest export destination for Alok with a share of 18%. Europe is next with 14%, while Canada & Mexico and Africa have small shares of 2% and 1% respectively.
The share of Alok’s exports to different regions of the world is given in chart X.
Chart AE Region wise sales
2011-12 2010-11
USA, 36%
Asia, 29%
South America,
18%
Europe, 14%Canada & Mexico, 2%
Africa, 1%
South America,
18%
Europe, 17%
Canada & Mexico, 2%
Africa, 1%
USA, 39%
Asia, 23%
MANAGEMENT DISCUSSION AND ANALYSIS - BUSINESS OVERVIEW

88 26 Annual Report 2011-12
Business Segments
Cotton and Cotton Yarn
Alok set up its cotton spinning facility as a measure of backward integration to captively feed its weaving and knitting facilities. Almost, 85 – 90% of its cotton yarn production is consumed internally. Alok also does trading in cotton / cotton yarn and sells part of its manufactured yarn based on opportunities available in the market. The reported sales data of this division only accounts for external sales of raw cotton and yarn.
Overview of Cotton Spinning Division
• Alok has the largest spinning facility in India at a single location (Silvassa); with capacity of 411,840 ring spindles (60,000 tons) and 5,680 open end rotors (20,000 tons) to support in-house apparel fabric and home textiles segment
• Alok’s 85%-90% cotton yarn manufactured is utilized for captive consumption by the apparel fabric (woven & knit fabrics) and home textiles divisions (Bed Sheets & Towels).
• Sales made externally by cotton Spinning business constituted about 3.62% of total revenue of the company in 2011-12
• Procurement of raw cotton at right price and during harvest remains crucial; looking at the volatility in the prices of cotton in the recent past, the company is now holding inventory to the extent of 3-4 months requirements matching with its average sales order book which is also 3-4 months for apparel fabrics, home textiles and garments. Thus, it has in-built risk mitigation for cotton price fl uctuation. Further, due to its integrated operations cotton constitutes about 27% – 28% of its fabric selling price, thus has limited impact on the overall operations
The high level of integration enables Alok to enjoy amongst the best margin in the industry. It also protects company from the price volatility of cotton yarn and its availability. The company still procures some of its cotton yarn from the market and gradually intends to replace that with in-house cotton yarn.
Table 11 below gives the details of external sales of this division. The total sales of the division for 2011-12 was ̀ 322.27 crore as compared to ̀ 552.90 crore in 2010-11, representing a decrease of 41.74%. The main decrease was on sale of raw cotton, which was high in the previous year on account of the opportunity to trade available in the market. However, during the period under review, sale of cotton yarn increase and overall exports of the division increased. As mentioned earlier, primarily this division caters to the internal weaving, knitting and terry division of the company. As a result this division is about 3.62% of the total sales of the company in 2011-12.
Table 11: Cotton and Cotton Yarn Sales(` Crore)
Particulars Twelve Months Ended 31 Mar 2012 Twelve Months Ended 31 Mar 2011
ChangeLocal Export Total % To Total Sales
Local Export Total % To Total Sales
Cotton & Cotton Yarn traded
22.61 98.71 121.32 1.36% 335.03 97.60 432.63 6.77% (71.95%)
Cotton Yarn 105.71 95.24 200.95 2.26% 81.37 38.90 120.27 1.89% 66.71%
Total 128.32 193.95 322.27 3.62% 416.00 136.50 552.90 8.66% (41.74%)
Alok’s current spinning capacity is about 80,000 tpa. The new 68,000 spindles that came on line in 2011-12 are presently in the initial stage of production and are expected to be ramped up to optimal usage by the second quarter of 2012-13. In order to build its capabilities in technical textiles and achieving integration therein, Alok
MANAGEMENT DISCUSSION AND ANALYSIS - BUSINESS OVERVIEW

INNOVATIVE TEXTILE SOLUTIONSINNOVATIVE TEXTILE SOLUTIONS
89Innovative Textile Solutions
Industries is further expanding its spinning capacities for production of specialised yarn (technical textiles) by 3600 tpa by adding 11,232 more spindles (2600 tpa) and 360 (1000 tpa) rotors.
Cotton and Yarn – Key Dynamics
Product mix � Compact yarn, dyed yarn, blended yarn and organic cotton from coarse to fi ne countsTarget segment
� Primarily captive consumption by fabric and home textiles division (~85% to 90%)
� 10% to 15% of cotton yarn production is sold to traders, distributors and manufacturing units in the domestic as well as export markets
Highlights � Largest spinning capacity at a single location in India (at Silvassa)Industry Scenario
� Cotton prices are now stable at around ` 33,000 per candy for Shankar 6 variety. However, in the recent past there was a wide fl uctuations due to commodity run
� Sustained high prices could result in further substitution by polyester
� World cotton production is around 25000 mn tonnes and consumption is at around that level
� Indian cotton production is about 5800 mn tons of which about 4600 mn tons is consumed /stored within the country and about 1200 mn tons of cotton is exported; it is the only textile manufacturing country in the world which is cotton surplus
Competition � Cotton trading and yarn operations of the company are opportunistic; primarily to benefi t from the market conditions
� Due to captive consumption and small external operations, competition from other spinning mills and cotton traders is not applicable to company
Current Capacity
� 60,000 tons ring spun yarn
� 20,000 tons open-ended yarnFuture plans � In order to build its capabilities in technical textiles and achieving integration therein,
company is expanding its spinning capacities for production of specialised yarn (for technical textiles) by 3600 tpa by adding 11,232 more spindles (2600 tpa) and 360 (1000 tpa) rotors.
� Gradually, company would expand its spinning capacity to match close to its total captive requirement
Apparel Fabric
Alok produces wide range of woven and knitted fabrics and enjoys a strong reputation for its quality products in the market. The high quality of its products is a result of its integrated operations, designing capabilities, product knowledge and state of the art manufacturing facilities. Besides in house manufacturing, it also outsources fabrics from power looms and other mills to meet its requirements. The unique selling proposition of Alok in this segment is its wide range of products which virtually covers the entire requirement of its diversifi ed customers.
MANAGEMENT DISCUSSION AND ANALYSIS - BUSINESS OVERVIEW

90 26 Annual Report 2011-12
Overview of Apparel Fabric Division
• Alok has one of the largest woven and knitted fabrics capacities in the country – ~186 million meters p.a. for woven fabrics and ~18200 tons p.a. for knitted fabrics
• Key business segment for the company contributing ~46% of total revenue in 2011-12 with revenue of ` 4,131.64 crore
• Integrated operations, large scale, state of the art weaving , knitting & processing, in-house designing team, wide range of products, differentiates the company in this segment
• The company manufactures fabric primarily against orders which helps mitigate the risk of unsold inventory, while the pricing takes into account prevailing market price of raw material and foreign currency rate for exports
• Strong backward integration with in-house cotton and blended yarn production helps minimize the impact of any adverse fl uctuations in yarn prices
• The apparel fabric division has a highly diversifi ed and reputed customer base which includes garmenting exporters, garments brands, wholesalers, traders & retailers in domestic market, garmenting companies in international market and institutional sales to armed forces , government companies and corporates for work wear or technical textiles both in domestic and international markets
• Company has identifi ed technical textile products and high-end yarn dyed fabric as its major growth areas
Table 12 gives the details of Alok’s apparel fabric sales for the last two years.Table 12: Apparel Fabric Sales
(` Crore)
Particulars Twelve Months Ended 31 Mar 2012 Twelve Months Ended 31 Mar 2011 ChangeLocal Export Total % To
Total Sales
Local Export Total % To Total Sales
Woven 3,295.41 568.04 3,863.45 43.41% 2,458.85 272.77 2,731.62 42.76% 41.43%Knitted 153.43 114.76 268.19 3.01% 116.77 124.79 241.56 3.78% 11.02%Total 3,448.84 682.80 4,131.64 46.42% 2,575.62 397.56 2,973.18 46.54% 38.96%
Apparel fabrics division continues to be the highest revenue generator for the company and constitute about 46.4% of the company’s total revenue in 2011-12 with total sales of ` 4,131.64 crore. During the year under consideration, sales of this division increased by 38.96% over previous year. The growth was achieved in both, woven fabrics (growth of 41.43%) and knitted fabrics (growth of 11.02%). Woven sales constitute the major portion of apparel fabric sales and knits forms about 6.50% of the total apparel fabric sales.
In the apparel fabric market, Alok is focusing particularly on three segments to propel growth – fashion wear, yarn dyed fabrics, and work-wear and technical textiles:
(a) Fashion wear
In fashion wear fabrics, Alok produces a wide range in both knit and woven fabrics. Fabric types include twills, voiles, cambric, poplins, Lycra poplins, gabardines, jacquard, satins, matte, canvases, dobby, lawn, yarn dyed and many more. There are several distribution channels through which the Company caters to specified target customer groups. The direct customers include overseas brands and retailers, Indian garments exporters or converters in other countries, domestic garment manufacturers, brands, retailers and traders.
MANAGEMENT DISCUSSION AND ANALYSIS - BUSINESS OVERVIEW

INNOVATIVE TEXTILE SOLUTIONSINNOVATIVE TEXTILE SOLUTIONS
91Innovative Textile Solutions
(b) Yarn dyed fabrics
Within fashion-wear, the Company is focusing on yarn dyed fabrics, which are used for fashionable shirting and high end women’s wear and command premium prices in the market. In this segment, Alok has benefi ted in terms of technology absorption for high-quality yarn-dyed fabrics, through its acquisition of Mileta. Alok has a capacity to produce 9,000 TPA of dyed yarn, which is being further expanded.
(c) Work-wear and technical textiles
Technical textiles are specialty fabrics, such as fire retardant fabric, water repellent and soil release fabric and high visibility fabric. They require special functionality and are used in industrial and other high technology applications. Due to their specialised nature, they enjoy higher unit selling price and better margins than conventional textiles. It is an import substitute and is estimated to grow at a CAGR of 10% to reach ` 146,000 crore (US$ 31 bn) by 2020. Some of the technical fabrics manufactured by the company and their industry uses are given below:
Special Finishes User Industry
Flame Retardant Fire Brigades, Oil Refi neries, Petrol Pumps, Welding Industry, Defence
Stain Guard Hospitality
Water Repellent Defence, Coal Mines
Anti-Bacterial Finish Health Care
High Visibility Construction & Infrastructure, Aviation
Anti-Static Industrial
Insect Repellent Defence, Hospitality
Camoufl age prints with Infra-Red Finish Defence
Apparel Fabric – Key Dynamics
Product mix � Diversifi ed product mix with cotton / cotton blends of yarn-dyed / piece-dyed fabrics in knits / woven for daily wear, fashion wear, industrial or technical textiles
Target segment � Garment manufacturers in India who in turn sell in the domestic as well as export markets
� Brands, wholesalers, retailers and traders in the domestic market
� Garmenting manufacturer and large format retailers in export market
� Institutions/corporate customers for technical textiles & work wearHighlights � The largest players in the country in the apparel fabric segment
� Alok’s largest revenue segment ( about 46% in 2011-12)
� Enjoys relatively high EBDITA margin on account of high level of integration (in-house spinning, weaving, designing and processing capacities)
� Increasing share of value added yarn dyed fabric and technical textiles
� Diversifi ed and quality conscious customer baseIndustry Scenario � India’s fabric production is estimated at 60,000 million sq. meters and growing
at a CAGR of about 5%
� Strong growth prospects as the Indian fabric industry is becoming increasingly more competitive globally
� The current market size for technical textiles in India is estimated at close to ` 58,000 crore with demand estimated to grow at 10% CAGR to reach about ` 1,46,000 crore by FY 2020
MANAGEMENT DISCUSSION AND ANALYSIS - BUSINESS OVERVIEW

92 26 Annual Report 2011-12
Competition � The unorganized / largely fragmented nature of industry makes estimation of market share diffi cult
� Mager players in the organized segment include Arvind Limited, Vardhman Textiles, Nahar group, Shri Lakshmi Cotsyn Limited, S. Kumar Nationwide, Premier Mills limited, Pratibha Syntex Limited, Maral Overseas Limited, etc and Unorganised players
Current Capacity (p.a.)
� Woven Fabric Capacity of 186.0 million meters
� Knitting capacity of 18,200 tons
� Yarn Dyeing Capacity of 9,000 tonsFuture plans � Increasing the Knitting capacity by 6800 tons p.a. to reach 25,000 tons p.a.
� Increasing Yarn Dyeing Capacity by 6000 tons p.a. to reach 15,000 tons p.a.
Home Textiles
Alok ventured into the bed sheet segment in 2003. With a strong thrust on exports, in a short span of time, the Company has emerged as market leaders in this segment. Within this segment, Alok added terry towels to its portfolio with the commissioning of a new plant in 2009-10.
There are different customer segments in home textiles. It is exported to overseas retailers and brands, sold in the domestic market to retailers and brands, and also distributed through the Indian retail venture ‘H&A’ stores and the UK based ‘Store Twenty One’ outlets. The Company has successfully created a large and prestigious customer base establishing relationships with global majors in the Home Textiles segment.
Alok’s range in Home Textile segment today includes the entire range of bed linen, curtains, towels and includes wide variety of products such as sheets-sets, duvets, comforters, blankets, quilts, bed-in-a-bag, in prints, solids, embroidery, sateen‘s, flannel, Jacquards, Dobbies, yarn-dyed from 180 TCs to 1000 TCs. It has also added special fi nishes such as wrinkle free, anti-bacterial, fi re-retardant, etc.
Overview of Home Textiles Division
� Alok’s capacity in this segment is 105 million meters p.a. for wider width fabric and 13,400 tons p.a. for terry towels
� It has emerged as the largest producer and exporter of bed linen in the country and has won several Gold trophies from Texprocil, Ministry of Textiles, Government of India
� With total sales of ` 1250. 41 crore, home textiles division accounted for ~14% of overall revenues in 2011-12� Integrated operations with spinning / processing capabilities enables better control over product quality
and give better margins� Presence in the relatively high end home textiles (300 to 800 counts product category) enable higher
price realisation and helps mitigate competition from other low cost manufacturing countries and domestic companies
� In home textile segment, Alok is mainly present in the exports markets (~97% exports) where it faces competition from Chinese, Pakistani and Turkish manufacturers
� Established and reputed multinational clientele results in strong customer profi le; periodic pricing resets to protect margins in case of increase in input costs
MANAGEMENT DISCUSSION AND ANALYSIS - BUSINESS OVERVIEW

INNOVATIVE TEXTILE SOLUTIONSINNOVATIVE TEXTILE SOLUTIONS
93Innovative Textile Solutions
Table 13 gives the data for Alok’s home textiles sales in 2011-12Table 13: Home Textiles Sales
(` Crore)
Particulars Twelve Months Ended 31 Mar 2012 Twelve Months Ended 31 Mar 2011 ChangeLocal Export Total % To Total
SalesLocal Export Total % To Total
SalesHome Textiles 15.16 1,075.79 1,090.95 12.26% 7.70 881.80 889.50 13.93% 22.65%Terry Towel 14.86 144.60 159.46 1.79% 46.38 64.23 110.61 1.73% 44.16%
Total 30.02 1,220.39 1,250.41 14.05% 54.08 946.03 1,000.11 15.66% 25.03%During the year, Alok’s home textile division recorded growth of about 25% and increased to ` 1250.41 crore compared to ` 1000.11 crore in 2010-11. While keeping its presence in the domestic market, its major focus is on export market majorly in USA. The terry towel division is about 12.75% of the total home textile division. The expanded capacities of sheeting fabric (22.5 mn meters p.a.) and terry towel (6700 tons p.a.) was added in the last quarter of the year and the full benefi t of these capacities would come in 2012-13.Alok’s home textile business is primarily focused on developed markets whose sheer market size is very high. Even though there was a demand contraction in these markets due to the economic slowdown, Alok continues to register strong export growth. This bears testament to the fact that there is consolidation of sourcing in the global market where end customers are focusing on a few reliable good quality suppliers. And, the fact that Alok has built strong relationships with major international customers.Home Textiles – Key Dynamics
Product mix � Alok produces wide range of products in bed sheets sets, comforters, blankets, quilts, curtains and terry towels. in 2011-12, bed sheets account for close to 87.25% of the division’s sale while terry towel account for about 12.75%
Target segment
� Export to blue chip overseas retailers and brands� Exports accounting for ~ 97% of overall division’s sales and ~40% of total exports of Alok� Domestic retailers and brands
Highlights � Largest Indian player in manufacturing and export of bed sheets (Received various export awards from Government of India)
� Among top four player in terry towels� Strong integration – in house spinning, weaving, processing and stitching unit enabling
control over end product quality and better marginsIndustry Scenario
� Home Textiles segment is estimated at around US$ 22 – 27 billion, accounting for 5-6% of the total global textile market
� India currently the largest supplier of terry towels and bed sheets� Spend on home textiles is price sensitive in nature with demand vulnerable to economic
slowdowns; demand shift to lower value segment within home textiles from time to time based on market conditions
� India’s domestic consumption is presently low, however, offers great potential for growthCompetition � Welspun India, Trident, Indo Count Industries, GHCL, Bombay Dyeing, Hanung Toys &
Textiles Ltd., etc. are some of the major Indian players in this segment� International competition is from manufacturers based out of China, Pakistan, Turkey, etc.
Current Capacity
� Wider width fabrics – 105 million meters� Terry towels – 13,400 tons
Future plans � Company would grow the capacities of wider width fabrics and terry towels in a gradual manner
GarmentsAlok produces wide range of garments in knitted and woven for ladies, gents and children for variety of applications such as sportswear, active wear, casual wear and sleepwear. The garments are made from different types of fabrics based on the requirement of the buyers and prevailing fashion cycle. Fabrics used for garments includes solid, mélange, yarn dyed, auto stripes, jacquards, embroidered and variety of prints like transfer prints, and block prints.Alok’s major strength lies in manufacturing fabrics and garments are relatively a small business for Alok with major thrust on exports. Garment division’s sales were ̀ 217.28 crore in 2011-12 constituting 2.44% of company’s total sales. Going forward, the Company would be focusing more on value added institutional sales for garment which includes product lines like work-wear and uniforms.
MANAGEMENT DISCUSSION AND ANALYSIS - BUSINESS OVERVIEW

94 26 Annual Report 2011-12
Overview of Garments Division
• Company has an installed capacity of 22 million pieces spread over three locations• Garment division accounted for ~2.50% of total sales, almost 90% of which is exported• Going forward higher focus on institutional segment
Table 14 gives the Company’s garments sales details
Table 14: Garment Sales
Particulars Twelve Months Ended 31 Mar 2012 Twelve Months Ended 31 Mar 2011 ChangeLocal Export Total % To Total Sales Local Export Total % To Total Sales
Garments 21.70 195.60 217.30 2.44% 11.07 162.99 174.06 2.72% 24.84%Total 21.70 195.60 217.30 2.44% 11.07 162.99 174.06 2.72% 24.84%
Alok’s garment sales in 2011-12 increased by 24.84% to ` 217.30 crore from ` 174.06 crore in 2010-11. About 90% of garment sales are in international markets mainly in US and Europe.Garments – Key Dynamics
Product mix � Alok produces wide range garments in woven and knits for men’s, ladies and kids for fashion wear, active wear and work wear
Target segment � Export to overseas retailers and brands� Exports accounting for ~ 90% of overall division’s sales� Domestic retailers and brands
Highlights � Amongst the top 20 players in the country� Strong integration – in house spinning, weaving, processing and stitching unit enabling
control over end product quality and better marginsIndustry Scenario � India’s garment exports is estimated at about USD 12 bn, which is about 45% of India’s
total textile exports of USD 27 bn� India’s major strength is in cotton garments and mainly caters to lower to medium
segments� India’s domestic consumption is growing at a CAGR of about 10% and likely to grow
from about USD 36 bn in 2010 to about USD 100 bn by 2020Competition � Gokaldas Exports Ltd, Shahi Exports Ltd, Bombay Rayon Fashion Ltd., Mandhana
Industries Ltd., Orient Craft Ltd., Pearl Global Ltd., etc. are some of the major Indian players in this segment
� International competition is from manufacturers based out of Bangladesh, Sri Lanka, Vietnam, etc.
Current Capacity � 22 mn pieces p.a.Future plans � To focus more on value added institutional work wear segment
Polyester Yarn
For Alok, polyester yarn is an important segment in its overall business and it has been steadily growing in terms of its contribution in the overall business. In polyester also, as a strategy, Alok is an integrated player. It procures PTA and MEG and converts the same into POY / Chips through Continuous Polymerization (CP) plant, which is further processed to make draw texturised yarn (DTY), fully drawn yarn (FDY), cationic yarn and polyester stable fi bre (PSF).
MANAGEMENT DISCUSSION AND ANALYSIS - BUSINESS OVERVIEW

INNOVATIVE TEXTILE SOLUTIONSINNOVATIVE TEXTILE SOLUTIONS
95Innovative Textile Solutions
What differentiates Alok in this segment is its focus on producing fi nished yarn. This positioning at the higher end of the polyester value chain enables the company to capture margins at each stage and make it more competitive & sustainable. To further consolidate its position in the industry and improve margins, it is also developing, its capability in higher value added products like master batch, technical textiles, etc.
Polyester Staple Fibre (PSF) and Partially Oriented Yarn (POY) demand is expected to grow at 7.5 % compounded average growth Rate (CAGR) over next 2 years, due to rising consumption of blended and non-cotton yarns. Demand is expected to grow to 8.5 % CAGR after 2012-13 due to limited availability of cotton and higher substitution by polyester. However, in the domestic market, there has been continuous increase in capacities which has made this business very competitive.
Overview of Polyester Division
• Polyester Yarn division is the second highest revenue generating segment for Alok after Apparel Fabric division, with sales of ` 2,979.22 crore, which is ~33% of total company’s revenue in 2011-12
• Demand scenario likely to remain good due to increasing substitution of natural fi bres• Competition from Chinese manufacturers, large Indian peers & unorganised domestic texturisers; however
Alok’s large scale integrated operations and focus on fi nished products make it a sustainable player• Relatively moderate EBDITA margins due to commodity nature of business; volatility in raw material
(MEG & PTA) prices may affect profi tability margins if not passed through adequately;• The polyester commands higher ROCE of about 25%-26% due to higher asset turnover (about 2.25
times) and lower working capital intensity
Table 15: Polyester Yarn Sales
Particulars Twelve Months Ended 31 Mar 2012 Twelve Months Ended 31 Mar 2011 ChangeLocal Export Total % To Total
SalesLocal Export Total % To Total
SalesPolyester yarn 2,242.41 736.81 2979.22 33.47% 1,113.83 574.35 1,688.18 26.43% 76.48%Total 2,242.41 736.81 2979.22 33.47% 1,113.83 574.35 1,688.18 26.43% 76.48%
Backed by capacity enhancement, Sales of Polyester yarn division recorded the highest growth amongst all the divisions of the company in 2011-12 and grew by 76.48% to reach ` 2979.22 crore. About 25% of the polyester yarn is exported to geographies such as Latin America, Eastern Europe, Africa, South East Countries, China, and Asia.
MANAGEMENT DISCUSSION AND ANALYSIS - BUSINESS OVERVIEW

96 26 Annual Report 2011-12
Polyester – Key Dynamics
Product mix � Partially Oriented Yarn (POY), Fully Drawn Yarn (FDY), Drawn Texturised yarn (DTY)Target segment
� Domestic power loom weavers
� Direct exportsHighlights � Among top three polyester yarn manufacturing Company in IndiaCompetition � Competition from domestic players like Reliance Industries Ltd, Indo Rama Synthetic Ltd,
JBF Industries Ltd, Garden Silk Mills Ltd,., Century Enka Ltd, etc.
� Competition from Chinese polyester yarn manufacturers that dominate the global polyester market with ~ 70% market share
Industry Scenario
� Due to increasing gap between cotton yarn and polyester yarn, the demand for polyester yarn is steadily growing at a CAGR of 6%+. It is likely to grow at a faster pace in future in domestic market on account of cotton surplus situation of India getting saturated (due to higher exports and domestic consumption). The masses would fi nd polyester blended fabrics more affordable
Current Capacity*
� CP : 5,00,000 tons, POY/ Chips : 1,66,000 tons, DTY : 1,70,000 tons, FDY : 70,000 tons, Cationic yarn: 24,000 tons and PSF: 70,000 tons
Future plans � The CP capacities and production capacities of other value added products such as PSF, Cationic yarn and master batch to optimise during 2012-13 and 2013-14 which would drive growth. There after the capacities of this division will be increased selectively. As the proportion of polyester yarn would increase in the overall business, it would improve the overall ROCE of the company
*including capacities under implementation
Table 16 gives the existing capacity and capacity expansion programmes form the different divisions.
Table 16: Alok’s Capacity and Expansion Programme
Divisions Units Current Capacities
Capacities under
Implementation
Capacities Post Expansions
COTTON SPINNING Tons 80,000 3,600 83,600APPAREL FABRICProcessing Woven mn mtrs 130 – 130Weaving mn mtrs 186 – 186Knits & Knits Processing Tons 18,200 6,800 25,000HOME TEXTILESWeaving mn mtrs 92 – 92Processing mn mtrs 105 – 105Terry Towel Weaving & Terry Processing Tons 13,400 – 13,400GARMENTS mn pcs 22 - 22POLYESTER (BASED ON END PRODUCT)Continuous Polymerisation Tons 5,00,000 - 5,00,000POY/ Chips Tons 3,00,000 (1,34,000) 1,66,000DTY Tons 1,30,000 40,000 1,70,000FDY Tons 70,000 – 70,000Cationic Yarn Tons - 24,000 24,000Polyester Stable Fibre Tons – 70,000 70,000
Strategic Investments
In addition to the core textiles operations with manufacturing facilities in India, the Company has diversifi ed its business scope by making investments into subsidiaries and associate companies. While some of these investments were to reach out to new markets, others were made to fi ll a gap in the complete textile industry value chain. The investment in the realty business was a pure opportunistic one and since most of the real estate properties are now ready, Alok has decided to exit the realty business by monetising the properties.
MANAGEMENT DISCUSSION AND ANALYSIS - BUSINESS OVERVIEW

INNOVATIVE TEXTILE SOLUTIONSINNOVATIVE TEXTILE SOLUTIONS
97Innovative Textile Solutions
Table 17 gives details of Alok’s investments including the ones in subsidiaries and others.
Table 17: Alok’s Investments
(` Crore)
Name of The Companies EQUITY SHARE APPLICATION
31 MAR 2012
31 MAR 2011
NON CURRENT INVESTMENTS
Investment in Subsidiaries & Associate Companies
Alok Industries International Ltd. - - - 0.22Alok Infrastructure Ltd. 0.05 - 0.05 0.05Alok Land Holdings Pvt. Ltd. 0.50 - 0.50 0.50Alok International Inc. 0.00 - 0.00 0.00
Alok Inc 0.04 - 0.04 0.04Trimphunt Victory Holdings Limited 0.00 - 0.00 0.00Grabal Alok International Limited - - - 0.00
Alok Retail (India) Ltd. 0.05 - 0.05 0.05
Alok H&A Ltd. 36.05 - 36.05 36.05
Alok Apparels Private Limited 1.00 9.00 10.00 10.00
Aurangabad Textiles & Apparel Park Ltd. 17.25 - 17.25 17.25
New City Of Bombay Mfg. Mills Ltd 75.13 - 75.13 71.50
Alok International (Middle East) FZE 1.31 - 1.31 -
Alok Singapore Pte. Ltd. 0.00 - 0.00 -
Alok Benefi t Trust 35.33 - 35.33 -
Grabal Alok Impex Limited - - - 3.99
SUB TOTAL (A) 166.71 9.00 175.71 139.65
Other Non Current Investments at cost
In Equity Shares 0.08 0.28
SUB TOTAL (B) 0.08 0.28
TOTAL (A+B) 175.79 139.93
CURRENT INVESTMENTS
In Bonds and Debentures 2.00 2.00
In Mutual Funds 1.94 25.25
TOTAL (C) 3.94 27.25
TOTAL (A+B+C) 179.73 167.18
Details of some of the major subsidiaries of Alok are given below:
Subsidiaries – Textiles
In the textiles space, the two primary subsidiaries or associate companies are Mileta and Alok Apparels Private Limited.
Mileta
Through its wholly own subsidiary Alok Industries International limited, Alok has a 100% stake in Mileta, a Czech based manufacturing company . Mileta’s facilities are located in Horice (Weaving and Administration) and Cerny Dul (processing) in the Czech Republic.
MANAGEMENT DISCUSSION AND ANALYSIS - BUSINESS OVERVIEW

98 26 Annual Report 2011-12
Mileta has provided huge benefi ts to Alok from its technology skills in yarn-dyed fabrics and hemming that has resulted in higher per unit realisations and new product lines. The Mileta range of products includes handkerchiefs, high quality shirting, batistes and voiles, complete line of functional table linen and bed linen. Their brands including ‘Mileta’, ‘Erba’, ‘Cottonova’, ‘Wall Street’ and ‘lord Nelson’ are being introduced in the Indian domestic market. Alok also leverages Mileta’s extensive marketing network in Europe, Russia and Africa to promote its existing products.
While there were signs of a continued good performance during the fi rst half of 2011, the poor market conditions in Europe affected the Company’s business in the second half. During 2011-1, the company achieved a sales of CZK 489.58 mn as against CZK of 532.88 mn in 2010-11, which has shown a decrease of about 8%. Although, as the Euro appreciated against the Rupee, in Rupee terms sales were stagnant. And due to the drop in sales the Company generated operating loss of CZK 29.5 mn as against profi t of CZK 16.5 mn.
Alok Apparels Private limitedAlok’s 100% subsidiary, Alok Apparels Pvt. Ltd., manufactures woven and knit fashion garments at Silvassa. In 2011-12, the unit achieved sales of ` 15.20 crore. This business is expected to grow both through own manufacturing as well as outsourcing.
Subsidiaries – RetailIn order to further reach out to the end customers, Alok entered the retail space. In India, this endeavour is through the ‘H&A’ stores, while in UK the Company has chain of stores under the store brand ‘Store Twenty One’.
H&A: Domestic RetailThe Company’s domestic retail operations are carried out through a wholly owned subsidiary company called ‘Alok H&A Ltd’, and ‘Alok Retail India Limited’. By December 2011, there were already 350 stores across 23 states in India, including shop-in-shop formats. However, given the market dynamics of retail in India and the changing economics of outlets in terms of cost revenue equations, H&A is re-evaluating its business strategy. It has closed down some of its non-performing stores and is focused on less capital intensive growth strategy that emphasises on formats like ‘shop in shop’. The strategy re-orientation is well on its way and it is being implemented in a well calibrated manner. Today, the numbers of stores have been reduced to 291
During 2011-12, H&A established
• an association with Australian Cricketer “Brett Lee” and launched his active wear collection in the name of “BL Active Wear”
MANAGEMENT DISCUSSION AND ANALYSIS - BUSINESS OVERVIEW

INNOVATIVE TEXTILE SOLUTIONSINNOVATIVE TEXTILE SOLUTIONS
99Innovative Textile Solutions
• a partnership with UK men’s wear brand “Savile Row” as their exclusive licensee for India
In 2011-12, Alok H&A Limited recorded sales of ` 66.76 crore, but it made losses at the EBIDTA level. The Company remains committed to its goal to become an established affordable lifestyle store brand in India
Store Twenty One: UK RetailAlok has a stake of 90.43% in Grabal Alok (UK) Ltd, the company that operates the ‘Store Twenty One’ chain of value-format stores in UK. Today, the chain comprises 221 stores, which offer a value proposition for quality apparel for women, men, and children. They also sell accessories like artifi cial jewellery, shoes, leather bags, and toys, which complement the apparel range.
The economic slowdown and low consumer confi dence in UK severely affected this business. It witnessed a slowdown in sales and consequently generated operational losses. The Company is reviewing its strategy for the business. It is exploring various options including repositioning this business more effectively.
Subsidiaries – Real EstateThe Company in-principle has decided to exit this business and accordingly focusing on creating value from the existing investments and monetise the assets in an opportunistic manner. Already, with the projects reaching different levels of completion, Alok has started to work on monetising these assets and utilising the cash to retire debt. Table 18 gives details of this investments
Table 18 - Investments in Real Estate
Sr. No. Project Name Project Location
ALOK’s Equity Share (%)
Project Company Type
Area Proposed Use Expected Completion Date
1 Land at Silvassa Surangi Village, Silvassa,
100% Division 538 acres Industrial Use Ready
2 Peninsula Business Park
Lower Parel, Mumbai
100% SPV 614,999 sq. ft. Commercial / ITES 20 storey, 600car parking
Ready
3 Ashford Royale Nr.LBS Marg, Nahur, Mumbai
50% SPV 1.1 mn. sq. ft. Residential December 2014
4 Ashford Center Lower Parel, Mumbai
100% Division 60000 sq. ft. Commercial Offi ce Space, 08 storeys, 40 car parking
Ready
5 Ashford Palazzo Bhulabhai Desai, Mumbai
30% SPV 100000 sq. ft. Residential December 2014
6 Land At Vapi Vapi 50% SPV 36 acres Residential Ready7 Lotus Corporate
ParkGoregaon, Mumbai
100% SPV 13500 sq. ft. Commercial Ready
Brief Details of the major real estate properties is given below:
Peninsula Business Park (Lower Parel)This includes 614,999 sq. ft. of ultra-modern offi ce premises with 600 car parks. The project is developed by Peninsula Land Ltd while the civil work was carried out by Shapoorji Pallonjee. The total expenditure on this
MANAGEMENT DISCUSSION AND ANALYSIS - BUSINESS OVERVIEW

100 26 Annual Report 2011-12
project till 31 March 2012 was ` 1454.66 crore. This has been funded by term debt of ` 750 crore.
The Occupancy certifi cate from MCGM has been received and the project has been completed in all respect. Eight fl oors out of Twenty fl oors in Tower ‘B’ of Peninsula Business Park, Lower Parel have been sold; Token consideration has been received and Letters of Intent (LOI) have been executed; The Sale Deeds should be signed against the full consideration as per the terms of the LOIs.
Ashford Centre (Lower Parel)This 60,000 square feet of prime offi ce space is located in Lower Parel in close proximity to Lower Parel and Currey Road stations; 5 star hotels ITC and Four Seasons; and other major complexes like India bulls, DLF, HDFC Bank House and Ambit RSM. The project developed by Ashford Group with Billimoria as architects. It has 8 stories with fl oor plate of 7,500 sq. ft. and 40 car parks.
Construction is complete and occupancy certifi cate has been received. The total project cost is ` 124.50 crore. Three fl oors out of eight fl oors have been leased / sold. Earnest money deposits have been received and the sale deeds should be executed against full payment.
Ashford Royale Premium Residential Complex (Nahur)The project is being developed jointly by Ashford Investment and Trading Company Pvt. Ltd and AlokInfrastructure Ltd. It is a residential complex on a 7 acre plot (CEAT factory) at Nahur. The Architects appointed for the project are Talati and Panthaky and the proposed saleable area is around 1.1 mnSq. ft. It is being developed as a modern residential complex with large landscaped gardens and water bodies, with club house and gymnasium.The total project cost is estimated to be about ` 600 crore, which is being funded by equity of ` 137 crore, advance from customers of ` 363 crore and debt of ` 100 crore. The initial launch has been well received in the market and is expected to be completed by December 2014.In addition, Alok had entered into a Joint Venture Agreement with National Textile Corporation (NTC) for the development and revival of New City Mills at Mumbai and Aurangabad Textile Mills at Aurangabad. Progress on this has been satisfactory – the units at Aurangabad and Mumbai with 135 garmenting machines and 125 garmenting machines have been set up; a design studio at New City Mills has also been established.QualityAlok has always adopted business practices that strive to promote excellence in manufacturing. Consequently, there is a continuous emphasis on adopting best practices and high quality processes to maintain high standards of its products.The Company has the following accreditations.ISO Certifi cationsThe company is accredited with Integrated Management System (IMS). There are 4 certifi cates under this system:1. ISO 9001: 2000 – Quality Management System2. ISO 14001:2004 – Environmental Management System
MANAGEMENT DISCUSSION AND ANALYSIS - BUSINESS OVERVIEW

INNOVATIVE TEXTILE SOLUTIONSINNOVATIVE TEXTILE SOLUTIONS
101Innovative Textile Solutions
3. OHSAS 18001: 2007 – Occupational Health & Safety Assessment System4. SA 8000: 2008 – Social Accountability Alok is the only Indian textile company to have obtained IMS with all the four certifi cationsECO-Certifi cationAlok is the fi rst Indian Textile company to have been awarded all three certifi cations for its eco-friendly products. This includes:• EU Flower – the eco-certifi cate from European Union• KRAV certifi cation for organic products• SWAN certifi cation – a Nordic eco-labelling certifi cationIn addition, the Company has also applied for Global Re-cycled Standard (GRS) certifi cation for entire supply chain (spinning to fi nished product). As part of effi ciency optimisation, lean management practices have been commenced at the Vapi plants; the process is being rolled out over to other plants. The testing Laboratory at Pawane has been accredited by NABL (National Accreditation Board for Testing and Calibration Laboratories) for ISO 17025:2005 Quality Management SystemInformation Technology (IT)Alok has always utilised IT as a business enabler to optimise its processes and build a competitive edge. Implementation of appropriate new technology and up-gradation of IT tools is an on-going process at Alok.The developments on this front in 2011-12 include:• The fi rst phase of implementation of Profi tability Analysis (CO-PA) of CO module has progressed well. There
are some teething issues related mostly to the integration and related module’s confi guration requirements to support CO-PA has been completed. The Company partnered with PWC to implement CO across our business. The Project has been initiated and the ‘As is’ study is in progress.
• APO has been confi gured, completed and tested on development and quality before putting on production server. A few orders have been tested on production server. However, we go live has been postponed because of some product gaps which are being resolved by SAP. The management is reviewing the new set of recommendations by both the vendors.
• Integration testing of HCM is over and master data preparation is complete for all the locations and same is being uploaded on production server. HCM application confi guration has been moved to production server. All the plants have run trial run for two months-Jan and Feb. 2012. After test running for Q1, 2012-13, one will go live with this.
• System is functioning well after ECC 6 upgrade. SAP has mandated upgrade of Oracle database from 10G to 11G. This has been done on development and quality. Production server has been upgraded to 11G.
• Since the transaction system has stabilised, the company has moved to evaluating of various BI tools. Plan for BI implementation shall be made after management review and approval.
• Alok is also exploring the techno/commercial feasibility of implementing a High-Performance Analytic Appliance (HANA), an in-memory computing appliance from SAP.HANA as a solution may need more time to mature and be feasible for business needs. Roll out may occur in the next fi scal.
• In addition to the online backup of our production database, Alok is evaluating a truly online fail-over SAP environment using a tool “Vision”. Test results were found to be satisfactory. We have procured necessary hardware and “vision” software licenses for DR. Alok has also initiated discussion with service providers to co-locate the DR environment; this expected to be seamlessly operational by 2nd quarter of 2012-2013.
• IT tools are being utilised to build a strong back-end for our Indian retail subsidiary. H&A has signed up for SAP ISR implementation. Unit testing is complete and integration testing is in progress. We have also selected a new POS application LS Retail. Implementation is complete and H&A has gone live with ISR.
SustainabilityAlok Industries’ focus on activities related to sustainability is at the core of its long term goal of being a leader in providing sustainable and integrated textile solutions. The sustainability programmes includes interventions in prevention of environmental degradation, promotion of energy conservation and stress on community development. EnvironmentOn the environment protection front the thrust is on green development. This includes promoting green procurement to minimize environmental degradation through mitigation of environmental impact on Climate
MANAGEMENT DISCUSSION AND ANALYSIS - BUSINESS OVERVIEW

102 26 Annual Report 2011-12
Change and pollution of Air, Water and Soil. At Alok, waste recycling is actively pursued across all its processes by establishing long term contractual relations with vendors, contractors and agencies with established credentials on waste recycling. The endeavour is to demonstrate environmental leadership and infl uence the industry and citizens at large to encourage use of environmental friendly products, processes and services. The Company is emerging as a model in the region for Waste management by supporting innovation, development of new technologies and creation of demand in the mainstream society for environmental friendly products and services.The Company increasingly uses ethical fi bres like Organic cotton (cotton grown without the use of external synthetic agricultural inputs like fertilizers and pesticides and helps conserve the environment from the harmful effects of the use of hazardous agro chemicals) and Better cotton from Better Cotton Initiative (BCI) (involves educating the cotton growers to adopt the Best Management Practices in cotton cultivation). This is not only leading to helping conserve the fragile environment threatened today by indiscriminate use of agro chemicals and pesticides but will also help farmers get a decent farm earnings sustain their livelihoods. In addition, the Company has ‘best in class’ ETP system established for primary, secondary and tertiary treatment of effl uents and reverse osmosis plant to optimize water conservation. It also has“Green Zones” around all facilities and encourages planting of saplings to conserve ecological balance. The Company has strived to minimize air pollution from its plants and units by installing Selective Catalytic Reduction (SCR) systems in the exhaust of the DG sets which reduce oxides of Nitrogen. Alok encourages the use of recycled products and has set up a recycled polyester unit with an initial 10 tons/ day of capacity to recycle polyester and polyester yarn waste, fl akes and PET bottles to produce 100% recycled polyester fi bre.Energy ManagementAlok is committed to:• Achieve the lowest Specifi c Energy Consumption per unit of product, thereby minimizing Greenhouse
emissions, solid waste and water pollution.• Attain sustainable development by continuously improving Energy Conservation and Energy effi ciency
throughout the production cycle.• Prevent wastage of energy in any mode - steam, water, air or power - by effi cient and most optimal use of
resources.• Comply with all applicable legislations, and best practices on Energy ManagementCommunity DevelopmentAlok is a Fair Trade (FLO) certifi ed company and value the fair price concept across the value chain. Since the textile chains have resource poor growers as the weak link at the far end of the chain, Alok initiated and has been instrumental in few of the well known Organic & Fair Trade cotton projects in India and abroad where in a premium is paid to the marginal Organic and Fair Trade cotton growers. Alok buys back their farm produce to enable them effectively integrate with the market and remain sustainable in a highly volatile cotton business. Alok partnered with Zameen Organic in an effort to form a golden textile value chain which included a farmer owned Organic & Fair Trade Company. Similarly, cotton made in Africa (CMiA) is another important variant of sustainable cotton type Alok is into and supplies its quality products to sophisticated markets in parts of Europe. Alok has been playing a key role in a very ambitious Organic & Fair Trade cotton project in West Africa which has the world’s top lingerie brand on board.Corporate Social Responsibility (CSR) initiatives are integral to operations at the plants. Alok has started a public school with CBSE Board in Silvassa. It employs tribal women on weaving looms and garment/made up stitching machines after intensive training and orientation. The Company has a Private Public Partnership with Silvassa Administration for converting the Government owned Industrial Training Institute into a centre of excellence.Risks & Risk MitigationWhile there is a formal structure for risk management, which is regularly implemented across the organisation, there are certain regular risks and concerns that face Alok in its businesses and the Company has taken several mitigation measures. Some of these are highlighted below:Raw Material RisksThe major raw materials for Alok are cotton, PTA and MEG. The global market dynamics continuously affect the availability and prices of these critical inputs.The price and availability issues are a major risk to the company’s business.
MANAGEMENT DISCUSSION AND ANALYSIS - BUSINESS OVERVIEW

INNOVATIVE TEXTILE SOLUTIONSINNOVATIVE TEXTILE SOLUTIONS
103Innovative Textile Solutions
CottonCotton prices were at record high in the beginning of 2011-12. In fact, in April 2011, the price of Shankar 6 cotton was close to ` 60,000 a candy, since then in a gradual manner the price has dropped to about ` 33,000 a candy. This year the cotton crop is likely to be at record level of 356 mn. bales (325 mn. bales in previous season) due to the increase in the area under cultivation and better farm yield. Also, the world production is likely to increase by about 8% to 26,879 mn. tons (24,879 mn. tons in previous season). The high levels of production should lead to an easing off and stable cotton prices in 2012-13.Chart Y: Prices of Shankar 6 variety of cotton (Rs/Candy)
600005000040000300002000010000
0
( `/Candy)
Apr, 11May, 11
Jun, 11Jul, 1
1Aug, 11
Sept, 11Oct, 1
1Nov, 11
Dec, 11Jan, 12
Feb, 12Mar, 1
2Apr, 1
2May, 12
S - 6
Looking at the volatility in the prices, company keeps the cotton inventory in line with its sales order book which is about 3-4 months.PTA and MEGThe share of Polyester yarn business is gradually increasing in the overall business of Alok. Purifi ed Terephthalic Acid (PTA) and Mono Ethylene Glycol (MEG) are the / major raw materials that go into the manufacture of and polyester yarn. Being petrochemical products, prices of PTA and MEG fl uctuate in line with fl uctuations in crude oil prices. Also, PTA and MEG prices move in tandem with the cotton prices as was noticed during the recent volatility of cotton prices. Chart M shows that raw material prices of PTA and MEG were hovering around USD 1,400 and USD 1,200 per metric tons respectively during April 2011. PTA and MEG prices started to taper down from September 2011 and reached a low of USD 1,065 and USD 966 per metric tonsChart Z: PTA MEG Prices
1600140012001000
800600400200
0
Apr, 11
May, 11Jun, 1
1Jul, 1
1
Aug, 11
Sept, 11Oct,
11
Nov, 11
Dec, 11Jan, 1
2
Feb, 12
Mar, 12Apr, 1
2
May, 12
(US$ per MT)
MEG Price (AVG) PTA Price (Avg)
Presently, international crude oil prices are high but stable and it is estimated that they would move within a narrow price band. Also, the volatility in cotton prices has come down. As a result, we expect PTA and MEG prices to be stable too. The demand for textiles is growing and cotton being a natural commodity has a limitation on production. Moreover, polyester being a cheaper fi bre compared to cotton, the demand for polyester has been growing rapidly over the past few years and the trend is expected to continue.In case of polyester also, Alok is trying to keep its inventory level matched with its sales order book.
MANAGEMENT DISCUSSION AND ANALYSIS - BUSINESS OVERVIEW

104 26 Annual Report 2011-12
Power & FuelWith a share of around 7.4% in overall costs, power and fuel are major manufacturing costs in the production of textiles. Any increase in these costs therefore has an adverse impact on Alok’s bottom line. Over the past year, prices for power & fuel have been increasing.The Company’s dual fuel captive power plant helps to mitigate some of the power cost risk. Alok has been actively exploring opportunities to switch over to a cheaper fuel source. The Company’s plants at Vapi and Silvassa are already running on natural gas. It is also getting grid connection for its Vapi unit and setting up 220 KVA sub-station at Silvassa. Also, at Vapi processing plants, where high volume of steam is consumed, the company is switching to coal based boilers from gas. Once the switchover is completed and stabilised, there should be substantial savings in fuel costs.MarketsAlok’s sales are subject to market demands. Alok is basically a B2B company and caters to almost all the international and domestic brands and retailers for one or other of their requirements. The Company has a mix of domestic and export sales; Alok’s exports are to over 90 countries and exports constitutes about 34% of its total sales. The status and risk of major economies where Alok sells its products are given below.USAA major proportion of Alok’s total exports (about 36%) are to the USA. The US economy, though, witnessing a slow growth at the moment, is a major textile consuming country. The consumer may, however, shift the demand towards mid to low end products over high end products during such times. Moreover, in such scenario, the buyers resort to consolidation of sourcing to few large suppliers like Alok. The Company has been actively exploring other export markets, especially in Asia, Middle East and South and Central America; which together have a 49% share of Alok’s exports. Africa, also offers Alok growth opportunities in the export market.EuropeAround 14% of Alok exports are to European nations. Slowdown in Europe is both a risk and an opportunity for Alok. Textile is a basic consumption need and consumers can be expected to purchase basic ‘value for money’ clothes and apparel, even in the middle of the slowdown. Also, because the cost of production being relatively high, a number of textile units in Europe have either reduced or ceased operations. These factors, in turn, help Asian manufacturers like Alok to penetrate European markets. Having said this, the slowness of the recovery, especially in Central and Southern Europe is an area of concern.IndiaAbout two-third of Indian textile Industry is domestic and so also is the case with Alok. In domestic market, textiles & clothing demand tends to move in tandem with GDP growth .India is one of the fastest growing economies in the world, hence, the domestic demand prospects for textiles and apparel look positive. While, there is worry about infl ationary pressures, policy paralysis and the economy hving slowed down, however, the scope for growth in the Indian market in the long run remains substantial. Accordingly, domestic market is likely to grow three times in this decade from about USD 52 bn in 2010 to about USD 220 bn by 2020. Alok with its large capacities, quality products and established linkages with domestic garment, retail and institutional player, is positioned well to tap the growing domestic market.Financial RiskIn order to capitalised on the growth opportunities available post removal of quotas from January 2005, Alok has been aggressively expanding its capacities with forward and backward integration and did a capex of ` 10793 crore from 2004-05 to 2011-12 in last 8 years. As a result, it has emerged as the largest Integrated Textile Company in the country and has been able to establish contacts with all the leading brands and retailers in the world.However, bulk of this capex was funded through debt; as a result the gearing of the Company has increased. However, the company’s borrowing costs is on the lower side as some of these borrowings are under the Technology Upgradation Fund Scheme (TUFS) at concessional rates of interest and some are foreign currency borrowings. Also, for working capital, the company is able to borrow at lower cost under foreign currency / rupee export fi nance. The bulk of the capacity expansions that Alok has undertaken have been completed and commissioned. As production from these expansions comes on-stream, Alok expects an improvement in its cash fl ow, profi tability and internal accruals. During 2012 – 13, Alok expects to bring back some of its investments in Realty and use the proceeds towards repayment of consolidated / standalone debt. The company would also explore the possibility of equity infusion. The long term Rating of the company continues to be CARE A+ (A Plus).Currency RiskAbout 34% of Alok’s total sales is exports. In 2011-12 the total exports were ` 3029.55 crore out of total sales
MANAGEMENT DISCUSSION AND ANALYSIS - BUSINESS OVERVIEW

INNOVATIVE TEXTILE SOLUTIONSINNOVATIVE TEXTILE SOLUTIONS
105Innovative Textile Solutions
of ` 8900.86 crore. These sales were denominated mainly in US Dollars. A part of the Company’s loan book also comprises of foreign debt. Fluctuations in foreign currency can therefore impact, either Alok’s top line or its interest outgo. Over the past few months, there has been uncertainty over the Rupee movement. Rupee depreciation will be positive for exporters but would increase foreign currency loan liabilities. Also the MTM position on some of the foreign currency hedges and derivatives increases with the depreciation of rupee. Alok has a well-entrenched in-house treasury division that monitors currency fl uctuations periodically and takes corrective action where needed.Security RiskThe company uses a centralized SAP application to run operations. Accordingly, this application is accessed by offi ces and plants across various geographic locations and thus has a very high dependence on networking. All locations are connected through secured MPLS-VPN. Adequate redundancy is provided through services from other service providers as well. Regular testing is done to make sure that all the links (secondary) are up and running.Due to the humungous size and complexity of operations, there is enormous data generated on a daily basis, which is the genesis for MIS and management reporting. The company thus runs the risk of loss of data due to database corruption. In order to safeguard against this eventuality, complete data backup is taken every day and the tapes are despatched to an off-site location at regular intervals. Other tapes are saved in a fi re-proof cabinet. In addition to data backup on tapes, online data replication is done on a system, installed at one of the plants. This ensures very high Recovery Point Objective. Oracle archive logs are shipped to another location (in another building) online. This is another level of security to support the off-site replication. Offl ine backup is taken every month and all archive logs since then are preserved. The present system of backup ensures complete recovery to the last saved transaction.The company’s IT architectural landscape is centralized at the corporate offi ce and features high end equipment for glitch-free operations. There could still be a possibility of unavailability of applications due to of hardware failure. SAP runs on high end IBM P-series machines and SAN with Raid 10 confi guration. All the devices are provided with redundant critical components such as power supply, NIC etc. to ensure mitigate this risk.The company also runs the risk of power failure at the data centre resulting in unavailability of IT infrastructure. As a mitigation measure, the data center’s power supply is regulated through 2 UPS systems installed at 2 locations drawing power from 2 different input points. This eliminates the risk of power outage because of internal issues. In case of a complete service breakdown-at service provider’s end, systems need to be shut down after a couple of hours.Another common risk would be failure of air-conditioning, which could force an IT infrastructure shutdown. In order to insulate against this probability, temperature is maintained through a central air-conditioning system and a set of split air-conditioners. These independent systems are installed at different locations and draw power from different supply lines. However, in case of a supply break down at both service providers’ end simultaneously, supply to both systems will be cut off, resulting in IT infrastructure shut down.Apart from the above security measures for smooth functioning of IT services, as a part of regular security night-vision cameras have been installed across the work place which are integrated and monitored by dedicated resources. Fire alarms and fi re extinguishers are installed across the work place. Main data center is further secured through a state of the art FM200 based automated fi re security system. Centrally managed anti-virus software monitors all the work stations. This is deployed across all the work stations at all plants and offi ces. Intrusion detection and prevention system is implemented through a very advanced fi rewall. This is further strengthened through strong policies defi ned at router level. MPLS connectivity across our offi ces and plants also ensures very high security of data. State of the art web-fi ltering tools are deployed centrally to control internet usage. Mails (inbound and outbound) are fi ltered through anti-virus/anti-spam appliances. A well trained team monitors and manages the complete landscape on a 24x7 basis. Necessary preventive, detective and corrective measures are carried out frequently through well documented procedure.Operational RisksThe company’s operations are vast and across different locations in different States. Quite naturally, there are operational risks faced by the company arising from execution of business functions. The company’s operational risks include the risk of loss resulting from inadequate or failed internal processes, people and systems, or from external events. It also includes fraud risks, legal risks, physical or environmental risks. Some examples of these risks could be:1. Damage to Physical Assets – natural disasters, terrorism, vandalism2. Business Disruption & Systems Failures – utility disruptions, software failures, hardware failures;3. Clients, Products, & Business Practice – market manipulation, antitrust, improper trade, product defects,
fi duciary breaches, account churning;
MANAGEMENT DISCUSSION AND ANALYSIS - BUSINESS OVERVIEW

106 26 Annual Report 2011-12
4. Employment Practices and Workplace Safety – discrimination, workers compensation, employee health and safety;
5. Execution, Delivery, & Process Management – data entry errors, accounting errors, failed mandatory reporting, negligent loss of assets.
Internal Fraud – misappropriation of assets, tax evasion, intentional mismarking of positions, bribery;External Fraud – theft of information, hacking damage, third-party theft and forgery;At Alok, Operational Risk Management is a continual cyclic process which includes risk assessment, risk decision making, and implementation of risk controls, which results in acceptance, mitigation, or avoidance of risk. Each Plant has a Plant Risk Management Committee and the corporate offi ce has a Corporate Risk Management Committee which meet every month and reports every quarter (and more frequently where necessitated) to the Risk Management Steering Committee comprising of key management personnel.The company has appointed internal auditors for all plants who conduct concurrent audit and present fi ndings on a periodic basis to the audit committee and the statutory auditors. Regular physical audits are conducted and all assets are marked as property of the company. There are standard processes laid down for movement of assets in and out of plants to prevent fraud. All assets are adequately insured for all risks under the Industry All Risk Policy including for machinery breakdown burglary, theft, dacoity etc.Human Capital RiskThe proper practice of Human Capital Risk Management can unleash hidden assets and productivity to help companies succeed. Companies that adopt Human Capital Risk as a key performance indicator to guide their businesses are better positioned to leverage their talent. This aids them in gaining a strategic competitive advantage, innovate faster, and survive macroeconomic challenges.We can fairly surmise that the following four factors make a company successful; people, market, products, and fi nancials. While all four are critical in ensuring the success of an enterprise over time, nothing can begin without people. People create and maintain the intellectual capital within organizations that drives innovation and shapes products. People manage the fi nances, cash fl ows, and forecasts. People generate interest and deliver the messaging to gain market acceptance. People make companies a reality and people make companies successful.Human Capital Risk can be defi ned as the ability of the workforce to meet the objectives of the business. Conversely, the work required to be performed should balance with the skills of employees who are expected to perform the work. When the work and the necessary skills are out of sync, gaps arise in the organization.At Alok, people management is accorded top priority. High performers are fast tracked for growth commensurate with their talent. Employees are encouraged to participate in seminars and workshops specifi cally selected to address their shortcomings. The performance management system is a democratic process where self-appraisal is also considered. Campus recruitments from leading institutions are made to ensure that the best talents are groomed and nurtured for bigger challenges ahead. Keeping in mind the unfortunate vacuum in technical talent in the industry, the company has partnered with a leading textile chemical company to form an institution, Advanced Academy for the Development of Textile Technologists (AADTT). The fast growing textile industry is in urgent need of competent professionals who have a sound technical base and can be developed into leaders of tomorrow. AADTT is a wonderful avenue for competent students graduating out of textile institutes to upgrade their skills and knowledge. Not only are the selected students paid a handsome stipend to sharpen their skill and knowledge base, their lodging and boarding needs are also taken care of.Internal Control and AdequacyAlok has adequate internal control systems and processes commensurate with its size and operations. The internal control and audit function covers all the plants, divisions and corporate headquarters for safeguard of the Company’s assets and for their protection against loss from unauthorised use or disposition. The system also ensures that transactions are reliably authorised, recorded accurately and reported quickly. It also take care that the company’s assets are used effectively and wastages are minimised.Alok has appointed Chartered Accountant fi rms to carry out concurrent internal audit at all its locations. The scope of its internal audit programme is laid down by the Audit Committee of the Board of Directors. The Audit Committee is briefed every quarter of the fi ndings by the internal auditors, along with the remedial actions that have been recommended or have been taken by the management.Future OutlookExpected Growth in Global textile TradeGlobal trade in textiles and clothing increased to US$ 602 bn in FY2010 from US$ 355 bn. in FY2000. Trade is expected to grow to US$ 1,000 bn in 2020 from US$ 602 bn in 2010 at a CAGR of 5%.• Textile production has shifted from western countries to China and India and these countries have become
production hubs• China is a leader in textile production with total industry size of USD 351 bn. (domestic USD 135 bn. And
exports USD 216 bn.)
MANAGEMENT DISCUSSION AND ANALYSIS - BUSINESS OVERVIEW

INNOVATIVE TEXTILE SOLUTIONSINNOVATIVE TEXTILE SOLUTIONS
107Innovative Textile Solutions
• China’s export of textile and clothing has increased from USD 28.3 bn. (13.3% of World trade) in 1990 to USD 216 bn. (35.9% of world trade) in 2010. It took over almost entire share that EU lost during this period
However, with the transition of Chinese economy to the world’s second biggest economy, few challenges have come up which would restrict its further growth of market share. China is now facing issues relating to rising labour cost, power availability, rising domestic consumption, currency appreciation etc. These developments in China are an opportunity for India to cash on and gain market share even in diffi cult market conditions. As one of India’s leading textiles players, Alok’s growth is expected to be in line with that of the Indian Industry.Expected growth in Indian Textile IndustryIndia’s USD 78 Billion total Textile and Apparel industry has the potential to grow @ 11% CAGR to reach USD 220 Billion by 2020. The growth is expected from both export as well as domestic markets. The respective growth drivers in exports and domestic markets are given below:Export Demand Drivers:• Production Shift – Textile manufacturing continues to shift to low cost Asian countries• De-Risking from China – Overseas buyers are now looking at India as an alternative to de-risk their sourcing
requirements from China• Advantage India – Availability of raw materials , especially cotton, integrated operations and design skills in
IndiaDomestic Demand Drivers:Higher disposable income – Rising per capita income would lead to increase in consumption of Textiles at 11% CAGRIncreasing retail penetration – Textiles and clothing retail comprise 40% of organised retailing in India. Share of organised retailing to increase from about 5% currently to about 24% by FY 2020Favourable demographic profi le-The % of earning population (15-60 years) in the total population is rising and is around 60%.Strategy formulated by Alok Industries LimitedBacked by the large scale integrated operations resulting in economies of scale and stable margins, wide products basket and diversifi ed customer base, Company is optimistic about its prospects in 2012-13. Alok is well positioned to take up both challenges and opportunities in the present textile scenario. In the coming years, the company would focus on implementing following strategy to grow and generate higher returns for all its stakeholders:Optimising the operations – Having set up the large integrated plants, the company would work on sweating all its assets and reducing cost.Reduction in debt /equity and exiting non – core businesses – Company, would bring back its investments made in real estate by monetising them. The proceeds of the same would be used to retire debt at consolidated and standalone level. Moreover, Company is also contemplating equity infusion, which would improve its debt/ equity. It is also formulating strategies for its retail operations.Improving the ROCE and Asset Turnover – With object of improving the overall ROCE of the company, it would be looking at increasing the asset turnover by concentrating on value added products on the cotton side and increasing the capacities on polyester side.Free Cash Flow – The Company would be making all attempts to achieve free cash fl ow situation by reducing its working capital cycle and limiting its capital expenditure.Setting up of research Development & Innovation – With the renewed thrust on innovation led growth, the Company would set up in next few years a state of the art Research Development & Innovation centre with the object of transforming the company in next few years into a specialised product company.With focussed attention on: Core Operations, improvement in ROCE and Generation of Free Cash fl ow, we look forward to future with great optimism. Cautionary StatementThe management of Alok Industries Ltd. has prepared and is responsible for the fi nancial statements that appear in this report. These are in conformity with accounting principles generally accepted in India and, therefore, include amounts based on informed judgments and estimates. The management also accepts responsibility for the preparation of other fi nancial information that is included in this report. Statements in this Management Discussion and Analysis describing the Company’s objectives, projections, estimates and expectations may be ‘forward looking statements’ within the meaning of applicable laws and regulations. The management has based these forward looking statements on its current expectations and projections about future events. Such statements involve known and unknown risks signifi cant changes in political and economic environment in India or key markets abroad, tax laws, litigation, labour relations, exchange rate fl uctuations, interest and other costs and may cause actual results to differ materially.
MANAGEMENT DISCUSSION AND ANALYSIS - BUSINESS OVERVIEW

108 26 Annual Report 2011-12
Company’s philosophy on Corporate Governance
Alok Industries Limited (‘Alok Industries’ or ‘the Company’) is committed to creating long term value for all its stakeholders – shareholders, employees, customers, associates, partners and the wider community. This commitment is driven by the Company’s strong value system, which promotes the highest standards of integrity, professionalism and execution. The implementation of this vision is supported by commensurate processes and systems that defi ne the governance structure of the Company.
The essence of the Corporate Governance practices across Alok Industries is the balance struck between independent decision making and effective business controls. This is achieved through the continuous promotion of high degree of transparency through comprehensive disclosures and a robust review mechanism. The entire system is governed by very effective Board. This enables management and operational independence and fl exibility within an established framework of policies, standards and processes. Essentially, at Alok promotion of world class Corporate Governance practices is not only a statutory requirement but an important business enabler that helps to realize long term goals while optimizing stakeholder returns.
Board of Directors
Composition of the Board
As on March 31, 2012 the Company’s Board comprises of 11 directors. The Board has four Executive Directors, of which the Executive Chairman, Managing Director and Joint Managing Director are also promoter Directors. In addition, the Board has seven non-executive Directors, consisting of four independent Directors who are nominees of various fi nancial institutions and three independent Directors. The composition of the Board satisfi es the conditions that SEBI has laid down in this regard.
Number of Board Meetings
The Board of Directors met four times during 2011-12 on April 2 9, 2011, July 29, 2011, October 31, 2011 and February 14, 2012. The maximum gap between any two meetings was less than 4 months.
Directors’ attendance record and Directorship held
Table 1: Composition of the Board of Directors as on March 31, 2012
Name of the Directors Category Attendance Particulars No. of other Directorships and Committee membership / Chairmanships in other Indian
public companiesNumber of Board
MeetingsLast AGM
Other Directorships
Committee
Held Attended Memberships Chairmanships1. Mr. Ashok B. Jiwrajka (Executive Chairman)
Promoter, Executive
4 2 Yes 11 - -
2. Mr. Dilip B. Jiwrajka (Managing Director)
Promoter, Executive
4 4 Yes 12 - -
3. Mr. Surendra B. Jiwrajka (Joint Managing Director)
Promoter, Executive
4 4 Yes 12 - -
4. Mr. Chandrakumar Bubna Executive 4 3 Yes - - -
5. Mr. Ashok G. Rajani Independent 4 3 No - - -
6. Mr. K. R. Modi Independent 4 3 Yes 1 2 -
7. Mr. K. D. Hodavdekar (Nominee of IDBI Bank Limited) *
Independent 1 1 No - - -
8. Mrs. Thankom T. Mathew (Nominee of Life
Insurance Corporation of India.)
Independent 4 2 No - - -
9. Mr. David Rasquinha (Nominee of Export Import
Bank of India)
Independent 4 4 Yes 3 - -
REPORT ON CORPORATE GOVERNANCE

INNOVATIVE TEXTILE SOLUTIONSINNOVATIVE TEXTILE SOLUTIONS
109Innovative Textile Solutions
Name of the Directors Category Attendance Particulars No. of other Directorships and Committee membership / Chairmanships in other Indian
public companiesNumber of Board
MeetingsLast AGM
Other Directorships
Committee
Held Attended Memberships Chairmanships10. Mr. Timothy Ingram Independent 4 2 Yes - - -11. Mr. M.V. Muthu (Nominee of IFCI Ltd)**
Independent 4 4 No 1 2 -
12. Ms. Maya Chakravorty (Nominee of IDBI Bank
Limited)***
Independent 3 2 No - - -
Note:
* Nomination of Mr. K. D. Hodavdekar was withdrawn by IDBI Bank Limited w.e.f July 4, 2011.
** Nomination of Mr. Rakesh Kapoor was withdrawn by IFCI Limited w.e.f. April 29, 2011 and in his place Mr. M.V. Muthu was appointed.
*** Nomination of Mr.Debasish Malick was withdrawn by IDBI Bank Limited w.e.f. June 23, 2011 and in his place Ms. Maya Chakravorty was appointed. Mr. Debasish Mallick could not attend the Board meeting held on April 29,2011.
As mandated by the Clause 49, none of the Directors are members of more than ten Board level committees of public companies nor are they Chairman of more than fi ve committees in which they are members.
Directors with material pecuniary or business relationship with the Company
As mandated by Clause 49, the Independent Directors on the Company’s Board:
• Apart from receiving sitting fee, and commission, do not have any material pecuniary relationships or transactions with the company, its promoters, its Directors, its senior management or its holding company, its subsidiaries and associates which may affect independence of the Director.
• Are not related to promoters or persons occupying management positions at the Board level or at one level below the Board.
• Have not been an executive of the company in the immediately preceding three fi nancial years.
• Are not partners or executives or were not partners or an executives during the preceding three years of the:
• Statutory audit fi rm or the internal audit fi rm that is associated with the company
• Legal fi rm(s) and consulting fi rm(s) that have a material association with the company
• Are not material suppliers, service providers or customers or lessors or lessees of the company, which may affect independence of the Director
• Are not substantial shareholders of the company i.e. do not own two percent or more of the block of voting shares
Transactions with related parties are disclosed in Note 28 of ‘Notes forming part of the Accounts’ annexed to the fi nancial statements of the year. There has been no materially relevant pecuniary transaction or relationship between Alok and its non-executive and/or independent Directors during the year 2011-12.
Note:
The Company had sales transactions aggregating to ̀ 2.14 crores (previous year ̀ 2.38 crores) and a subsidiary of the Company had purchase transaction aggregating to ̀ 0.83 crores (previous year ̀ 2.17 crores) with entities in which Mr. Ashok Rajani, director is a partner and director. The transactions were made in the ordinary course of business and at arm’s length basis. The Board of Directors of the Company is of the view that the transactions made are not material enough to impinge upon the independence of independent director.
Information Supplied to the Board
The information supplied to the Board includes:
• Annual operating plans and budgets and any update thereof
• Capital budgets and any updates thereof
• Quarterly results for the company and operating divisions and business segments
REPORT ON CORPORATE GOVERNANCE

110 26 Annual Report 2011-12
• Minutes of the meetings of the Audit Committee and other Committees of the Board
• Information on recruitment and remuneration of senior offi cers just below the level of Board, including the appointment or removal of Chief Financial Offi cer and Company Secretary
• Materially important show cause, demand, prosecution and penalty notices
• Fatal or serious accidents, dangerous occurrences, any material effl uent or pollution problems
• Any material default in fi nancial obligations to and by the Company, or substantial non-payment for goods sold by the company
• Any issue, which involves possible public or product liability claims of substantial nature, including any judgement or order which, may have passed strictures on the conduct of the company or taken an adverse view regarding another enterprise that can have negative implications on the Company
• Details of any joint venture or collaboration agreement
• Transactions that involve substantial payment towards goodwill, brand equity or intellectual property
• Signifi cant labour problems and their proposed solutions. Any signifi cant development in human resources / industrial relations front like signing of wage agreement, implementation of voluntary retirement scheme, etc.
• Sale of material nature of investments, subsidiaries, assets, which is not in the normal course of business
• Quarterly details of foreign exchange exposures and the steps taken by management to limit the risks of adverse exchange rate movement, if material
• Non-compliance of any regulatory, statutory nature or listing requirements and shareholders service such as non payment of dividend, delay in share transfer, etc.
The Board of Directors is presented with detailed notes along with the agenda papers well in advance of the meeting. The Board periodically reviews compliance reports of all laws applicable to the company, prepared by the company as well as steps taken by the Company to rectify instances of non-compliances.
Code of Conduct
The Board of Alok Industries Ltd., at its meeting on October 28, 2005, has adopted and laid down a code of conduct for all Board members and Senior Management of the company. The code of conduct is available on the website of the company – www.alokind.com. All Board members and senior management personnel have affi rmed compliance with the Code of Conduct. The Managing Director has also confi rmed and certifi ed the same (the certifi cation is enclosed at the end of this report).
Committees of the Board
a) Audit Committee
As on March 31, 2012, Alok’s Audit Committee consisted of Mr. David Rasquinha (Chairman of the Com-mittee), Mr. Ashok G. Rajani, Mr. K. R. Modi, Mr. M.V. Muthu and Mr. Dilip B. Jiwrajka. All the members of the Audit Committee have accounting and fi nancial management expertise. The Chairman of the Audit Committee attended the Annual General Meeting (AGM) held on September 29, 2011.
The Committee met four times during the course of the year: on April 29, 2011, July 29, 2011, October 31, 2011 and February 14, 2012. Table 2 gives attendance record.
Table 2: Attendance record of Company’s Audit Committee
Name of the Member Position Status Audit Committee Meetings Held
Meetings Attended
Mr.K D Hodavadekar* Ex – Chairman of the Committee
Independent Director 1 1
Mr. David Rasquinha ** Chairman of the Committee
Independent Director 3 3
Mr.Ashok Rajani Member Independent Director 4 3Mr.K R Modi Member Independent Director 4 3Mr.Dilip B. Jiwrajka Member Promoter, Executive
Director4 4
Mr. M.V. Muthu Member Independent Director 4 4
REPORT ON CORPORATE GOVERNANCE

INNOVATIVE TEXTILE SOLUTIONSINNOVATIVE TEXTILE SOLUTIONS
111Innovative Textile Solutions
* Mr. Rakesh Kapoor resigned on April 29, 2011 and in his place Mr. K.D Hodavdekar was appointed as the Chairman of the Committee. Mr David Rasquinha and Mr. M.V. Muthu were appointed as the Members of the Committee.
** Mr. K.D Hodavdekar resigned on July 4, 2011 and in his place Mr. David Rasquinha was appointed as the Chairman of the Committee.
Notes:
The Chief Financial Offi cer (CFO) and representatives of the statutory auditors and internal auditors are regularly invited by the Audit Committee to its meetings. Mr. K.H. Gopal, President (Corporate Affairs) & Company Secretary, is the secretary to the Committee.
The functions of the Audit Committee of the company include the following:
1. Oversight of the Company’s fi nancial reporting process and the disclosure of its fi nancial information to ensure that the fi nancial statement is correct, suffi cient and credible
2. Recommending to the Board, the appointment, re-appointment and, if required, the replacement or removal of the statutory auditor and the fi xation of audit fees
3. Approval of payment to statutory auditors for any other services rendered by the statutory auditors
4. Reviewing, with the management, the annual fi nancial statements before submission to the Board for approval, with particular reference to:
a. Matters required to be included in the Director’s Responsibility Statement to be included in the Board’s report in terms of clause (2AA) of section 217 of the Companies Act, 1956.
b. Changes, if any, in accounting policies and practices and reasons for the same.
c. Major accounting entries involving estimates based on the exercise of judgment by management.
d. Signifi cant adjustments made in the fi nancial statements arising out of audit fi ndings.
e. Compliance with listing and other legal requirements relating to fi nancial statements.
f. Disclosure of any related party transactions.
g. Qualifi cations in the draft audit report.
5. Reviewing, with the management, the quarterly fi nancial statements before submission to the Board for approval.
6. Reviewing, with the management, performance of statutory and internal auditors, adequacy of the internal control systems.
7. Reviewing the adequacy of internal audit function, if any, including the structure of the internal audit department, staffi ng and seniority of the offi cial heading the department, reporting structure coverage and frequency of internal audit.
8. Discussion with internal auditors any signifi cant fi ndings and follow up thereon.
9. Reviewing the fi ndings of any internal investigations by the internal auditors into matters where there is suspected fraud or irregularity or a failure of internal control systems of a material nature and reporting the matter to the Board.
10. Discussion with statutory auditors before the audit commences, about the nature and scope of audit as well as post-audit discussion to ascertain any area of concern.
11. Reviewing the company’s risk management policies.
12. To look into the reasons for substantial defaults in the payment to the depositors, debenture holders, shareholders (in case of non payment of declared dividends) and creditors.
13. Reviewing any changes in the accounting policies or practices as compared to the last completed fi nancial year and commenting on any deviation from the Accounting Standards.
14. Carrying out any other function as is mentioned in the terms of reference of the Audit Committee.
The Audit Committee is empowered, pursuant to its terms of reference, to:
REPORT ON CORPORATE GOVERNANCE
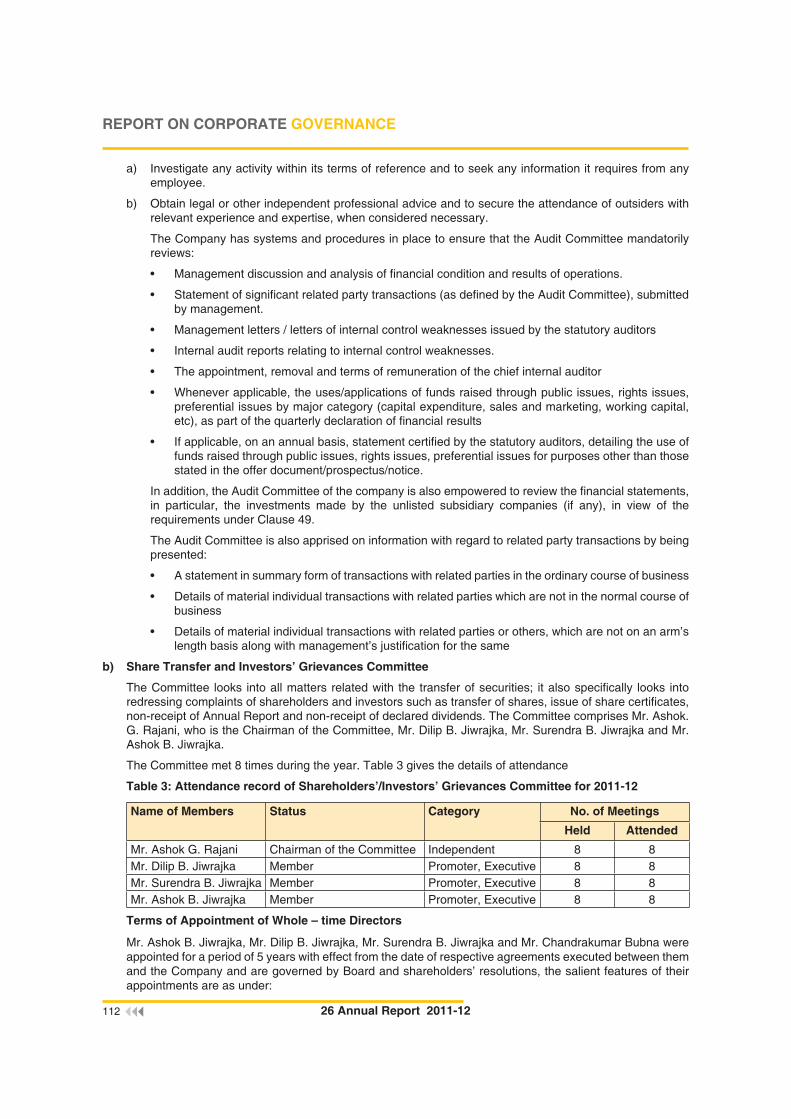
112 26 Annual Report 2011-12
a) Investigate any activity within its terms of reference and to seek any information it requires from any employee.
b) Obtain legal or other independent professional advice and to secure the attendance of outsiders with relevant experience and expertise, when considered necessary.
The Company has systems and procedures in place to ensure that the Audit Committee mandatorily reviews:
• Management discussion and analysis of fi nancial condition and results of operations.
• Statement of signifi cant related party transactions (as defi ned by the Audit Committee), submitted by management.
• Management letters / letters of internal control weaknesses issued by the statutory auditors
• Internal audit reports relating to internal control weaknesses.
• The appointment, removal and terms of remuneration of the chief internal auditor
• Whenever applicable, the uses/applications of funds raised through public issues, rights issues, preferential issues by major category (capital expenditure, sales and marketing, working capital, etc), as part of the quarterly declaration of fi nancial results
• If applicable, on an annual basis, statement certifi ed by the statutory auditors, detailing the use of funds raised through public issues, rights issues, preferential issues for purposes other than those stated in the offer document/prospectus/notice.
In addition, the Audit Committee of the company is also empowered to review the fi nancial statements, in particular, the investments made by the unlisted subsidiary companies (if any), in view of the requirements under Clause 49.
The Audit Committee is also apprised on information with regard to related party transactions by being presented:
• A statement in summary form of transactions with related parties in the ordinary course of business
• Details of material individual transactions with related parties which are not in the normal course of business
• Details of material individual transactions with related parties or others, which are not on an arm’s length basis along with management’s justifi cation for the same
b) Share Transfer and Investors’ Grievances Committee
The Committee looks into all matters related with the transfer of securities; it also specifi cally looks into redressing complaints of shareholders and investors such as transfer of shares, issue of share certifi cates, non-receipt of Annual Report and non-receipt of declared dividends. The Committee comprises Mr. Ashok. G. Rajani, who is the Chairman of the Committee, Mr. Dilip B. Jiwrajka, Mr. Surendra B. Jiwrajka and Mr. Ashok B. Jiwrajka.
The Committee met 8 times during the year. Table 3 gives the details of attendance
Table 3: Attendance record of Shareholders’/Investors’ Grievances Committee for 2011-12
Name of Members Status Category No. of Meetings
Held Attended
Mr. Ashok G. Rajani Chairman of the Committee Independent 8 8Mr. Dilip B. Jiwrajka Member Promoter, Executive 8 8Mr. Surendra B. Jiwrajka Member Promoter, Executive 8 8Mr. Ashok B. Jiwrajka Member Promoter, Executive 8 8
Terms of Appointment of Whole – time Directors
Mr. Ashok B. Jiwrajka, Mr. Dilip B. Jiwrajka, Mr. Surendra B. Jiwrajka and Mr. Chandrakumar Bubna were appointed for a period of 5 years with effect from the date of respective agreements executed between them and the Company and are governed by Board and shareholders’ resolutions, the salient features of their appointments are as under:
REPORT ON CORPORATE GOVERNANCE

INNOVATIVE TEXTILE SOLUTIONSINNOVATIVE TEXTILE SOLUTIONS
113Innovative Textile Solutions
Name of the Directors
Contract Period Notice period for termination of contract
Fixed Salary Commission
Mr. Ashok B. Jiwrajka
March 10, 2008 to March 9, 2013
Six calendar months notice, in writing to the Board of Directors of the Company
` 15,00,000/ – per month
Restricted to 1% of the net profi t of the Company
Mr. Dilip B. Jiwrajka
March 10, 2008 to March 9, 2013
Six calendar months notice, in writing to the Board of Directors of the Company
` 15,00,000/ – per month
Restricted to 1% of the net profi t of the Company
Mr. Surendra B. Jiwrajka
March 10, 2008 to March 9, 2013
Six calendar months notice, in writing to the Board of Directors of the Company
` 15,00,000/ – per month
Restricted to 1% of the net profi t of the Company
Mr. Chandrakumar Bubna
May 1, 2009 to April 30, 2014
Six calendar months notice, in writing to the Board of Directors of the Company
` 15,00,000/ – per month
Restricted to 1% of the net profi t of the Company
c) Remuneration Committee
Alok’s Remuneration Committee is responsible for recommending the fi xation and periodic revision of remu-nerations of the Managing Director, Executive Directors and senior employees. This is done after reviewing their performance based on predetermined evaluation parameters and the Company’s policy of rewarding achievements and performance. Remuneration Committee comprises of three Non-Executive Directors and one Executive Director viz .Mr. Timothy Ingram, Mr. Ashok G. Rajani, Mr. M.V. Muthu and Mr. Dilip B. Jiwrajka. The Chairman of the Committee is an Independent Director. The Committee met only one time i.e on April 20, 2011 during the fi nancial year 2011 – 2012.
The Committee has been constituted to administer Alok ESOS 2010. Table 3A gives attendance of each member at the Committee meeting held during the year.
Table 3A: Attendance record of Remuneration Committee for 2011-12
Name of Members Status Category No. of MeetingsHeld Attended
Mr. K. D. Hodavdekar*** Ex – Chairman of the Committee Independent 1 1Mr. Timothy Ingram* Chairman of the Committee Independent - -Mr. Rakesh Kapoor** Member Independent 1 1Mr. Ashok G. Rajani Member Independent 1 1Mr. M.V. Muthu ** Member Independent - -Mr. Dilip B. Jiwrajka Member Promoter,
Executive1 1
* Mr. Timothy Ingram was appointed as the new Chairman of the Committee w.e.f April 29, 2011.
** Nomination of Mr. Rakesh Kapoor was withdrawn by IFCI Limited w.e.f April 29, 2011 and in his place Mr. M.V. Muthu was appointed
*** Nomination of Mr. K.D Hodavdekar was withdrawn by IDBI Bank Limited w.e.f July 4, 2011
On April 20, 2011 the Committee granted 1,280,000 options at an exercise price of ` 18.90 and 9,511,500 options at an exercise price of ` 21.42. 18,000 options from Grant 1 and 185,550 options from Grant 2 were surrendered due to separations during the year. Options were granted on April 20, 2011 and vest over a period of 2 years, 50% at end of one year from date of grant and balance at the end of 2nd year from the
REPORT ON CORPORATE GOVERNANCE

114 26 Annual Report 2011-12
date of Grant. Each option represents a right but not obligation to apply for 1 fully paid equity share of ` 10/ – Disclosure as required by SEBI guidelines on ESOS is annexed to the Directors’ report.
Remuneration paid to Directors
Payment of remuneration to the Executive Chairman, Managing Director, Joint Managing Director and Ex-ecutive Director is governed by the respective agreements executed between them and the Company and are governed by Board and shareholders’ resolutions. The remuneration structure comprises Salary, Com-mission linked to profi ts, perquisites and allowances and retirement benefi ts (superannuation and gratuity). The details of such remuneration have been disclosed in Table 4. Commission to non-executive Directors are also detailed in Table 4.
Table 4: Details of remuneration paid to Directors for 2011-12
Name of the Director Sitting Fees 2
Salary and Perquisites
Provident & Superannuation
Funds
Commission 3 Total
In ` Mr. Ashok B. Jiwrajka - 18,000,000 - 12,500,000 30,500,000Mr. Dilip B. Jiwrajka - 18,000,000 - 12,500,000 30,500,000Mr. Surendra B. Jiwrajka - 18,000,000 - 12,500,000 30,500,000Mr. Chandrakumar Bubna - 18,000,000 - 12,500,000 30,500,000Mr. Ashok G. Rajani 60,000 - - - 60,000Mr. K. R. Modi 60,000 - - - 60,000Mr. K. D. Hodavdekar (Nominee of IDBI Bank Limited) 4
20,000 - - - 20,000
Mrs. Thankom T. Mathew(Nominee of Life Insurance Corporation of India) 4
40,000 - - - 40,000
Mr. David Rasquinha(Nominee of Export Import Bank of India) 4
80,000 - - - 80,000
Mr. Timothy Ingram 40,000 40,000Mr. M.V.Muthu (Nominee of IFCI Limited) 4
80,000 - - - 80,000
Ms. Maya Chakravorty (Nominee of IDBI Bank Limited) 4
40,000 - - - 40,000
Notes:
1. None of the Directors are related to each other, except Mr. Ashok B. Jiwrajka, Mr. Dilip B. Jiwrajka and Mr. Surendra B. Jiwrajka, who are brothers.
2. Sitting fees to non-executive directors include payment for Board-level committee meetings.
3. Commission payable to the executive directors, is linked to the net profi t of the Company and therefore considered as performance linked incentive.
4. Sitting fees of nominee Director Mr. M.V. Muthu is paid in his name. In the case of the other nominee Directors, the sitting fees are paid to the fi nancial institution they represent.
d) Executive Committee
The Board of Directors have delegated the authority to supervise and monitor the day-to-day activities of the company to an Executive Committee. The committee comprises of Mr. Ashok B. Jiwrajka, Mr. Dilip B. Jiwrajka and Mr. Surendra B. Jiwrajka. This Committee met 93 times during the year 2011-12. The details of business transacted by the Committee are placed before the Board of Directors at the next meeting and are ratifi ed by the Board after due discussion.
e) Rights Issue Committee
The Board of Directors have constituted Rights Issue Committee on October 27, 2008 for fi nalization of the terms and all other consequential conditions pertaining to the Rights Issue. The committee comprises
REPORT ON CORPORATE GOVERNANCE

INNOVATIVE TEXTILE SOLUTIONSINNOVATIVE TEXTILE SOLUTIONS
115Innovative Textile Solutions
Mr. Dilip B. Jiwrajka, Mr. Surendra B. Jiwrajka, Mr. K. R. Modi, and Mr. Timothy Ingram. There were no meetings held during the year.
Subsidiary Companies
Clause 49 defi nes a “material non-listed Indian subsidiary” as an unlisted subsidiary, incorporated in India, whose turnover or net worth (i.e. paid up capital and free reserves) exceeds 20% of the consolidated turnover or net worth respectively, of the listed holding company and its subsidiaries in the immediately preceding accounting year.
Under this defi nition, the Company does not have a ‘material non-listed Indian subsidiary
Shares and convertible instruments held by the non-executive Directors
As on March 31, 2012, Mr. Ashok G. Rajani, independent Director holds 5,000 equity shares of the Company, Mr. K. R. Modi, independent Director holds 4,612 equity shares of the Company, Mr. David Rasquinha, nominee Director (EXIM Bank) holds 3,500 equity shares of the Company and Ms. Maya Chakravorty nominee Director (IDBI Bank) holds 50 equity shares of the Company. No other non-executive Director holds any equity shares in Alok Industries Limited.
As on March 31, 2012, none of the non-executive directors held any convertible instruments of the Company.
Management
Management Discussion and Analysis
The Management Discussion and Analysis is given separately and forms part of this Annual Report.
Disclosures by Management to the Board
All disclosures relating to fi nancial and commercial transactions where Directors may have a potential interest are provided to the Board, and the interested Directors do not participate in the discussion nor do they vote on such matters.
Disclosure of accounting treatment in preparation of fi nancial statements
The fi nancial statements have been prepared under the historical cost convention in accordance with generally accepted accounting principles in India, the applicable Accounting Standards and the provisions of the Companies Act, 1956.
Details of non-compliance by the company
“The Company” has complied with all the requirements of regulatory authorities. No penalties/strictures were imposed on the company by stock exchanges or SEBI or any statutory authority on any matter related to capital market during the last three years.
Code for prevention of insider-trading practices
In compliance with the SEBI regulation on prevention of insider trading, the company has instituted a comprehensive code of conduct for its Directors, management and staff. The code lays down guidelines, which advises them on procedures to be followed and disclosures to be made, while dealing with shares of company, and cautioning them of the consequences of violations. The code clearly specifi es, among other matters, that Directors and specifi ed employees of the company can trade in the shares of the company only during ‘Trading Window Open Period’. The trading window is closed during the time of declaration of results, dividend and material events, as per the Code.
Mr. K.H. Gopal, President (Corporate Affairs) & Company Secretary, is the Compliance Offi cer.
CEO/ CFO certifi cation
The CEO and CFO certifi cation of the fi nancial statements for the year is provided in the MD &CFO certifi cation section of the Annual Report.
Shareholders
Reappointment/Appointment of Directors
As per the requirements of Section 256 of the Companies Act, 1956 two-third of the Board shall consist of retiring directors out of which one third shall retire at every annual general meeting. Accordingly, Mr Ashok B. Jiwrajka and Mr. Dilip B. Jiwrajka shall retire and shall seek re-appointment in the ensuing Annual General Meeting of the Company.
REPORT ON CORPORATE GOVERNANCE

116 26 Annual Report 2011-12
Details of directors seeking re-appointment.
Mr. Ashok B. Jiwrajka, 61 years,He is the Executive Chairman of the Company. He completed his schooling and college from Mumbai. Immediately after his graduation, he joined the family partnership fi rm and incorporated our Company in 1986. Mr. Jiwrajka has over three decades of experience in textiles. His functions as the Executive Chairman include envisioning our Company's strategic initiatives and overseeing the home textiles business.Other Directorships 1. Alok Knit Exports Limited
2. Alspun Infrastructure Limited3. Alok Infrastructure Limited4. Alok Apparels Private Limited5. Alok Realtors Private Limited6. Alok Land Holdings Private Limited7. Alok H&A Limited8. Alok Denims (India) Limited9. Kesham Developers & Infotech Private Limited10. Springdale Information & Technologies Private
Limited11. Alok Retail ( India) Limited12. Alok Industries International Ltd.13. Grabal Alok International Ltd.14. Grabal Alok UK Limited15. Alok Singapore Pte. Ltd.16. Alok International (Middle East) FZE
Other Committee Memberships NILNumber of shares held in the Company 20,270,684
Mr. Dilip B. Jiwrajka, 55 yearsHe is the Managing Director of our Company. He completed his schooling and college from Mumbai. Subsequently, he completed his post-graduation in business entrepreneurship and management. He began his career as a management trainee and thereafter he started the business of trading in textiles as sole selling agent for Bombay Dyeing for the Readymade Garment Sector. Starting with a partnership fi rm, he incorporated Alok Industries Limited in 1986. His functions as the Managing Director include envisioning our Company's growth strategy, responsibility for the apparel fabric and garment divisions and overseeing the fi nance, administration and overall working of our Company and its group companies.Other Directorships 1. Alok Knit Exports Limited
2. Alspun Infrastructure Limited3. Alok Infrastructure Limited4. Alok Apparels Private Limited5. Alok Realtors Private Limited6. Alok Land Holdings Private Limited7. Alok H&A Limited8. Alok Denims (India) Limited9. Kesham Developers & Infotech Private Limited10. Springdale Information & Technologies Private
Limited11. Alok Retail ( India) Limited12. Aurangabad Textiles & Apparel Parks Limited13. Alok Industries International Ltd.14. Grabal Alok International Ltd.15. Grabal Alok UK Limited16. Alok Singapore Pte. Ltd.17. Alok International (Middle East) FZE18. Triumphant Victory Holdings Limited
Other Committee Memberships NILNumber of shares held in the Company 20,507,053
REPORT ON CORPORATE GOVERNANCE

INNOVATIVE TEXTILE SOLUTIONSINNOVATIVE TEXTILE SOLUTIONS
117Innovative Textile Solutions
Means of Communication with Shareholders
Alok Industries Ltd. puts forth key information about the Company and its performance, including quarterly results, offi cial news releases, and presentations to analysts, on its website www.alokind.com regularly for the benefi t of the public at large. During the year, the quarterly results of the company’s performance have been published in leading newspapers such as ‘Business Standard, ‘The Economic Times’ in English, all Mumbai editions and in ‘Western Times’, Gandhinagar edition and are also posted on its website. The audited fi nancial results for the year ended March 31, 2012 were published in Business Standard, Mumbai and Western Times, Gandhinagar Edition. Hence, they are not separately sent to the shareholders. The Company, however, furnishes the quarterly results on receipt of a request from any shareholder.
Investor Grievance and Shareholder Redressal
The Company has appointed a Registrar and Share Transfer Agent, M/s. Link Intime India Private Limited, which is fully equipped to carry out share transfer activities and redress investor complaints. Mr. K.H. Gopal, President (Corporate Affairs) & Company Secretary, is the Compliance Offi cer for redressal of all shareholders’ grievances.
General Body Meetings
The date, time and venue of the last three Annual General Meetings are given below in Table 5.
Table 5: Details of last 3 Annual General Meetings
Financial year
Date Time Venue Resolutions passed
2008-09 September 25, 2009
11.00 A.M. Textiles Committee Auditorium
P Balu Road, Prabhadevi Chowk Prabhadevi, Mumbai 400025
1. Re-appointment of a Whole Time Director of the Company.
2009-10 September 17, 2010
12.00 noon 17/5/1 & 521/1, Village Rakholi / Saily, Silvassa – 396230, Union Territory of Dadra and Nagar Haveli.
1. Authorising the Board to borrow money in excess of paid-up capital and free reserves of the Company.
2. Authorising the Board of Directors to create charge/ mortgage on the assets of the Company.
3. Increase of remuneration of a relative of Whole time Director of the Company.
2010-11 September 29, 2011
12.00 noon 17/5/1 & 521/1, Village Rakholi / Saily, Silvassa – 396230, Union Territory of Dadra and Nagar Haveli.
1. Authorising the Board to borrow money in excess of paid-up capital and free reserves of the Company.
2. Authorising the Board of Directors to create charge/ mortgage on the assets of the Company.
The resolutions mentioned in table 5 were taken up in the last three AGMs, and were passed with requisite majority.
A Court convened meeting of the Equity Shareholders of the Company was held on November 19, 2011 for approving amalgamation of M/s. Grabal Alok Impex Limited with your Company.
No special resolutions passed at the above Annual General Meetings were required to be put through postal ballot. No resolution is proposed to be passed at the forthcoming Annual General Meeting through postal
REPORT ON CORPORATE GOVERNANCE

118 26 Annual Report 2011-12
ballot.
POSTAL BALLOTS
No Postal Ballot was conducted pursuant to Section 192A of the Companies Act, 1956 read with the Companies (Passing of the Resolution by Postal Ballot) Rules, 2001 for obtaining the consent of the Shareholders of the Company during the year 2011-2012.
Compliance
Mandatory requirements
The company is fully compliant with the applicable mandatory requirements of the revised Clause 49.
Non Mandatory Compliance
The details of compliance of the non-mandatory requirements are listed below.
NON EXECUTIVE CHAIRMAN’S OFFICE: The Chairman of the Company is the Executive Chairman; hence, this provision is not applicable.
REMUNERATION COMMITTEE: Details of the composition and function of the Remuneration Committee are given in the section ‘Committees of the Board’.
SHAREHOLDER RIGHTS – FURNISHING OF QUARTERLY RESULTS: Details of the shareholders’ rights in this regard are given in the section ‘Communication to Shareholders’.
AUDIT QUALIFICATIONS: During the current fi nancial year, there are no audit qualifi cations in the fi nancial statements. The Company continues to adopt appropriate best practices in order to ensure unqualifi ed fi nancial statements
WHISTLE-BLOWER POLICY: Alok encourages an open door policy, where employees have access to the Head of Business / Head of Function. In terms of the Company’s Code of Conduct, any instance of non-adherence to the Code or any observed unethical behaviour is to be brought to the attention of the immediate reporting authority; the immediate reporting authority has to bring it to the notice of the Code of Conduct’s Compliance Offi cer Mr. K.H. Gopal, President (Corporate Affairs) & Company Secretary is the Compliance Offi cer for Alok’s Code of Conduct. No personnel have been denied access to the Audit Committee
TRAINING OF BOARD MEMBERS – The Company’s Board of Directors consists of professionals with expertise in their respective fi elds and industry. They endeavour to keep themselves updated with changes in global economy and legislation. They attend various workshops and seminars to keep themselves abreast with the changing business environment.
MECHANISM FOR EVALUATING NON-EXECUTIVE BOARD MEMBERS – The Company has not yet adopted a policy for evaluation of Non-Executive Board Members. Sitting Fees is paid to the Non-Executive Directors currently based on attendance.
AUDITOR’S CERTIFICATE ON CORPORATE GOVERNANCE: The Company has obtained a Certifi cate from the Statutory Auditors regarding compliance of conditions of corporate governance, as mandated in Clause 49. The certifi cate is annexed to this report.
REPORT ON CORPORATE GOVERNANCE

INNOVATIVE TEXTILE SOLUTIONSINNOVATIVE TEXTILE SOLUTIONS
119Innovative Textile Solutions
Additional Shareholder Information
Annual General Meeting
Date: August 14, 2012
Time: 12.00 noon
Venue: 17/5/1, 521/1, Rakholi / Saily, Silvassa - 396230, Union Territory of Dadra & Nagar Haveli.
Financial Calendar
Financial year: April 1 to March 31
For the year ended March 31, 2012, results were announced for:
First quarter : Provisional July 29, 2011Second quarter: Provisional October 31, 2011Third quarter: Reviewed February 14, 2012Fourth quarter and annual: Audited May 18, 2012
For the year ending March 31, 2013, results will be announced by:
First quarter : Reviewed on or before July 2012Second quarter: Reviewed on or before October 2012Third quarter: Reviewed on or before January 2013Fourth quarter and annual: Audited On or before May 2013
Book Closure
The books will be closed from Tuesday August 7, 2012 to Tuesday August 14, 2012 (both days inclusive) as annual closure for the Annual General Meeting.
Dividend Payment
Dividend of Re. 0.30 per equity share will be paid on or after August 14, 2012 (within the statutory time limit of 30 days), subject to approval by the shareholders at the ensuing Annual General Meeting.
Listing
At present, the equity shares of the company are listed on BSE Limited (BSE) and National Stock Exchange of India Limited (NSE).
The annual listing fees as prescribed have been paid to BSE and NSE upto March 31, 2013.
Table 1: Company’s Stock Exchange codes
Name of the Stock Exchange Stock CodeNational Stock Exchange of India Limited ALOKTEXTEQBSE Limited 521070ISIN No. INE270A01011
Non-Convertible Debentures (NCDs)
Sr. No.
Particulars No. of NCDs
Amount(In Crore)
Stock Code (BSE) ISIN NO.
1 2000 – 11.50% Secured Redeemable NCDs of ` 10,00,000/ – each aggregating to ` 200 crores issued and allotted on June 29, 2010 on private placement basis.
700 70.00 ALOK290610A INE270A07463700 70.00 ALOK290610B INE270A07471250 25.00 ALOK290610C INE270A07489179 17.90 ALOK290610C INE270A0748971 7.10 ALOK290610C INE270A0748950 5.00 ALOK290610C INE270A0748940 4.00 ALOK290610C INE270A074895 0.50 ALOK290610C INE270A074895 0.50 ALOK290610C INE270A07489
SHAREHOLDER’S INFORMATION

120 26 Annual Report 2011-12
2 1000 – 10.75% Secured NCDs of ` 10,00,000/ – each aggregating to ` 100 Crores issued and allotted on October 20, 2010 on private placement basis.
334 33.40 ALOK201010A INE270A07497333 33.30 ALOK201010B INE270A07505
333 33.30 ALOK201010C INE270A07513
3. 2000 – 12.50% Secured NCDs of ` 10,00,000/ – each aggregating to ` 200 crores issued and allotted on March 04, 2011 on private placement basis.
370 37.00 ALOK4311A INE270A07521300 30.00 ALOK4311A INE270A07521370 37.00 ALOK4311B INE270A07539300 30.00 ALOK4311B INE270A07539360 36.00 ALOK4311C INE270A07547300 30.00 ALOK4311C INE270A07547
4. 3000 – 12.00% Secured Redeemable NCDs of ` 10,00,000/ – each aggregating to ` 300 crores issued and allotted on February 01, 2012 on private placement basis.
375 37.50 ALOK010212A INE270A07554375 37.50 ALOK010212B INE270A07562375 37.50 ALOK040212C INE270A07570375 37.50 ALOK010212D INE270A07588375 37.50 ALOK010212E INE270A07596375 37.50 ALOK010212F INE270A07604375 37.50 ALOK010212G INE270A07612375 37.50 ALOK010212H INE270A07620
TOTAL 8000 800.00
Stock Market Data
Monthly High and Low and the performance of Alok’s share price vis-à-vis BSE Sensex and NSE Nifty is given in Table 2 and Chart A and B respectively.
Table 2: High, lows and volumes of company’s shares for 2011-12 at BSE and NSE
Month BSE (In ` per share) NSE (In ` Per share)High Low Volume High Low Volume
Apr-11 28.00 22.00 10,04,63,708 27.90 21.80 35,73,99,553May-11 27.80 23.75 5,13,10,448 27.80 23.75 20,61,22,818Jun-11 28.50 22.85 5,12,81,533 28.50 22.80 22,14,78,769Jul-11 26.30 24.10 2,10,37,094 28.70 24.05 7,13,63,385Aug-11 25.70 15.60 4,39,42,129 25.70 15.60 16,18,19,314Sep-11 20.90 16.40 4,02,98,839 20.55 16.40 16,02,63,475Oct-11 21.50 17.50 2,04,64,915 21.30 16.00 8,94,88,070Nov-11 21.30 16.05 2,25,12,027 21.30 15.70 11,00,44,021Dec-11 20.50 17.25 1,89,02,357 21.05 17.25 12,08,36,570Jan-12 20.55 17.50 2,81,32,043 20.55 17.50 9,64,39,765Feb-12 23.90 19.55 4,73,96,111 23.85 19.80 20,19,01,810Mar-12 21.90 18.55 3,31,24,781 21.90 18.00 14,91,33,606
Chart A: Alok Industries’s Share Performance versus BSE Sensex
SHARE PERFORMANCE VIS-À-VIS STOCK MARKET INDICES
140
120
100
80
60
40
20
0
Ap
r 11
May
11
Jun
11
Jul 1
1
Au
g 1
1
Sep
11
Oct
11
Nov
11
Dec
11
Jan
12
Feb
12
Mar
12
Alok BSE
SENSEX
AL
OK
vs.
BS
E S
EN
SE
XA
PR
201
1 -
MA
R 2
012
IND
EX
ED
TO 1
00A
S O
N 1
AP
RIL
201
1
SHAREHOLDER’S INFORMATION

INNOVATIVE TEXTILE SOLUTIONSINNOVATIVE TEXTILE SOLUTIONS
121Innovative Textile Solutions
Note: Share price of Alok Industries and BSE Sensex have been indexed to 100 on April 1, 2011
Chart B: Alok Industries’s Share Performance versus NSE NIFTY
140
120
100
80
60
40
20
0
Ap
r 11
Jun
11
Au
g 1
1
Oct
11
Dec
11
Feb
12
Alok NSE
NiftyA
LO
K v
s.N
SE
NIF
TY
AP
R 2
011
- M
AR
201
2IN
DE
XE
DTO
100
AS
ON
1 A
PR
IL 2
011
Note: Share price of Alok Industries and NSE Nifty have been indexed to 100 on April 1, 2011
Distribution of Shareholding
Table 3 and 4 lists the distribution of the shareholding of the equity shares of the company by size and by ownership class as on March 31, 2012.
Table 3: Shareholding pattern
Shareholding Class No of shares held % of total shares held
No of shareholders
% of total shareholders
Upto 500 29,062,335 3.52 141,458 71.80501 to 1,000 23,919,710 2.89 27,833 14.131,001 to 2,000 21,794,658 2.64 13,678 6.952,001 to 3,000 11,966,075 1.45 4,558 2.313,001 to 4,000 8,250,684 1.00 2,270 1.154,001 to 5,000 9,827,359 1.19 2,041 1.045,001 to 10,000 21,533,271 2.60 2,821 1.4310,001 and above 699,915,265 84.71 2,353 1.19Total 826,269,357 100.00 197,012 100.00
Table 4: Shareholding Pattern by ownership as on March 31, 2012
CATEGORY AS ON MARCH 31, 2012Total No. of
SharesPercentage (%)
A. Promoter’s Holding Promoters Indian Promoters 262,616,518 31.78 Foreign Promoters 0 0.00 Persons acting in Concert 0 0.00 TOTAL (A) 262,616,518 31.78B. Non Promoter’s Holding 1. Institutional Investors a. Mutual Funds and UTI 2,425,200 0.29 b. Banks, Financial Institutions, Insurance Companies/
Central Governments/State Governments90,894,805 11.00
c. FIIs 125,288,651 15.17 TOTAL (B1) 218,608,656 26.46 2. Others • Private Corporate Bodies 62,503,204 7.57 • Indian Public 199,578,655 24.15 • NRIs/OCBs 6,253,969 0.76 • Foreign Companies/HUF 62,419,038 7.55 • Clearing Members/Market Maker 14,281,867 1.73 • Trusts 7,450 0.00 TOTAL (B2) 345,044,183 41.76 TOTAL B (BI+B2) 563,652,839 68.22 GRAND TOTAL (A+B) 826,269,357 100.00
SHAREHOLDER’S INFORMATION

122 26 Annual Report 2011-12
Registrar and Transfer Agent
The Company has appointed LINK INTIME INDIA PRIVATE LIMITED as its Registrar and Share Transfer Agent, to whom all shareholders communications regarding change of address, transfer of shares, change of mandate etc. should be addressed. The address of the Registrar and Share Transfer Agents is as under: –
Name and Address ofR & T Agent or address of the share dept, as the case may be
LINK INTIME INDIA PRIVATE LIMITED,C-13, Pannalal Silk Mills CompoundLBS Marg, Bhandup (West), Mumbai 400078
Tel no. +91 22 25963838Fax no. +91 22 25946969
Share Transfer System
The shares of the company are compulsorily traded in dematerialized form. Shares received in physical form are transferred within a period of 30 days from the date of lodgement subject to documents being valid and complete in all respects.
De-materlisation of Shares
As on March 31 2012, over 95.28% shares of the company were held in de-materialised form.
There are no legal proceedings against Alok on any share transfer matter. Table 5 gives details about the nature of complaints and their status as on March 31, 2012.
Table 5: Complaints Received and Addressed during 2011-12
Particulars Complaints
Non-Receipt of
Certifi cates
Non-receipt of dividend/Interest/
Redemption of warrant
Non Receipt of Annual
Report
Others Total
Received during the year 05 70 07 14 96Attended during the year 05 70 07 14 96Pending as on 31 March 2012 NIL NIL NIL NIL NIL
Outstanding GDRs/ADRs/Warrants
The Company has not issued GDRs/ ADRs/Warrants as of March 31, 2012.
Details of Public Funding Obtained in the last three years
2009-10
On May 5, 2009, the Company issued and allotted 244,719,930 Equity Shares of ` 10.00 each at a premium of Re. 1.00 per share to the existing shareholders of the Company on rights basis and also issued and allotted 164,003,131 partly paid up equity shares (paid upto the extent of ` 6.00 per share i.e. Face Value ` 5.00 and Premium – Re.1.00) to the existing equity shareholders of the company on rights basis in the ratio of 83 rights equity shares for every 40 equity shares held on the Record Date i.e. March 25, 2009. After the issue, the total paid-up equity capital of the Company became 605,698,030 Equity Shares of ` 10.00 each.
On March 30, 2010, the Company issued and allotted 182,100,248 Equity Shares of ` 10.00 each at a premium of ` 13.32 per share to Qualifi ed Institutional Buyers in terms of Chapter VIII of SEBI (Issue of Capital and Disclosure Requirements) Regulations, 2009. After the issue, the total paid-up equity capital of the Company became 787,798,278 Equity Shares of ` 10.00 each.
2010-11
NIL
2011-12
On March 10, 2012, the Company has issued and allotted 16,000,000 Equity Shares of ` 10.00 each at a premium of ` 41.00 per share to M/s. Jiwrajka Investments Private Limited, a Promoter Group Company, against the conversion of warrants held by them. The said warrants were originally issued to Arum Investments Private Limited by M/s. Grabal Alok Impex Limited and the same were subsequently purchased by M/s. Jiwrajka Investments Private Limited
SHAREHOLDER’S INFORMATION

INNOVATIVE TEXTILE SOLUTIONSINNOVATIVE TEXTILE SOLUTIONS
123Innovative Textile Solutions
NOTE : On March 15, 2012, pursuant to the amalgamation of Grabal Alok Impex Limited with Alok Industries Limited as per the Scheme of Amalgamation sanctioned by the Hon’ble High Court, Bombay, India on 3 February 2012 the Company has issued and allotted 22,485,000 Equity shares to the shareholders of Grabal Alok Impex Limited whose name appeared in the register of members of Grabal Alok Impex Limited (in the ratio of 1:1), as per the details received from NSDL/CDSL. Consequent on the amalgamation, the Company’s equity share capital as on March 31, 2012 stands at ` 826.27 crore divided into 826,269,357 fully paid equity shares of ` 10/ – each. There was no infl ow received by the Company on account of amalgamation .
Table 6 gives the details.
Table 6: Details of public funding obtained during the last three years and its implication on paid up Equity Share Capital
Financial Year Amt. Raised through Public Funding Effect on Paid up equity Share Capital2009-10 i. 408,723,061 Equity Shares of ` 10.00 each at
a premium of Re. 1.00 per share to the existing shareholders of the Company on Rights basis.
ii. 182,100,248 Equity Shares of ` 10.00 each at a premium of ` 13.32 per share to Qualifi ed Institutional Buyers (QIBs).
After the Rights issue of equity shares and Qualifi ed Institutional Placement Issue, the total paid-up equity capital of the Company became 787,798,278 Equity Shares of ` 10.00 each
2010-2011 NIL 13,921 partly paid equity shares were forfeited and total paid-up equity capital of the Company became 787,784,357 Equity Shares of ` 10.00 each
2011-2012 16,000,000 Equity Shares of ` 10.00 each, at a premium of ` 41.00 per share to Jiwrajka Investments Private Limited22,485,000 Equity shares of ` 10.00 each, to the shareholders of Grabal Alok Impex Limited pursuant to amalgamation of Grabal Alok Impex Limited with the Company. (*)
After the conversion of Warrants into equity shares, the total paid-up capital of the Company increased from 787,784,357 Equity Shares of ` 10.00 each to 803,784,357 Equity Shares of ` 10.00 eachAfter the amalgamation Company’s equity share capital as on March 31, 2012 stands at ` 803,784,357 Equity Shares of ` 10.00 each to 826,269,357 paid equity shares of ` 10/ – each.
(*) There was no infl ow received by the Company due to allotment of these shares as the shares were issued and allotted pursuant to the scheme of amalgamation approved by the Hon’ble High Court, Bombay, India on February 3, 2012.
As on March 31, 2012, 73.31% of the promoters’ holding have been pledged with FIIs, MFs and other lenders as part of loan conditions. This represents a sum total of 19,25,28,869 equity shares (23.30 % of the total equity of the Company).
Plant Locations
Spinning � 412 (15) Saily, Silvassa, Union Territory of Dadra & Nagar Haveli
Weaving
� Babla Compound, Kalyan Road, Dist. Bhiwandi, Thane� 17/5/1 and 521/1, Rakholi / Saily, Silvassa, Union Territory of Dadra & Nagar Haveli� 209/1 and 209/4, Silvassa, Village Dadra, Union Territory of Dadra & Nagar
HaveliKnitting � 412 (15) Saily, Silvassa, Union Territory of Dadra & Nagar Haveli
Processing� C-16/2, Village Pawane, TTC Industrial Area, MIDC, Navi Mumbai, Dist. Thane� 261/ 268, Village Balitha, Taluka Pardi, Dist. Valsad, Gujarat� 254, Village Balitha, Taluka Pardi, Dist. Valsad, Gujarat
Garments
� 374/2/2, Saily, Silvassa, Union Territory of Dadra & Nagar Haveli� 17/5/1, Rakholi, Silvassa, Union Territory of Dadra & Nagar Haveli� 273/1/1, Hingraj Industrial Estate, Atiawad, Daman, Union Territory� 50/P2, 52/P1, Morai, Taluka Pardi, Dist. Valsad, Gujarat
SHAREHOLDER’S INFORMATION

124 26 Annual Report 2011-12
Made ups� 374/2/2, Saily, Silvassa, Union Territory of Dadra & Nagar Haveli� 149/150, Village Morai, Taluka Pardi, Dist. Valsad, Gujarat
POY/ Texturising � 17/5/1, 521/1, Rakholi / Saily and 409/1 Saily Silvassa, Union Territory of Dadra & Nagar Haveli
Hemming � 103/2, Rakholi, Silvassa, Union Territory of Dadra & Nagar HaveliContinuous Polymerization Plant
� 17/5/1 and 521/1, Rakholi / Saily, Silvassa, Union Territory of Dadra & Nagar Haveli
Terry Towel Unit � 263/P1/P1 and 251/2/P1, Village Balitha, Taluka Pardi, Dist. Valsad, GujaratPacking Unit � 87/1/1 and 97/1, Village Falandi, Silvassa, Union Territory of Dadra & Nagar Haveli
Investor Correspondence Address
For shares held in physical form For shares held in dematerialised formLink Intime India Private LimitedC-13, Pannalal Silk Mills CompoundL.B.S. MargBhandup (West), Mumbai 400078Tel: +91-22-2596 3838Fax: +91-22-2594 6969E-mail: [email protected]: www.linkintime.co.in
National Securities Depository LimitedTrade World, 4th FloorKamala Mills CompoundSenapati Bapat MargLower ParelMumbai 400013Tel.: +91-22-2499 4200Fax: +91-22-2497 2993E-mail: [email protected]: www.nsdl.co.in
Central Depository Services (India) LimitedPhiroze Jeejeebhoy Towers17th Floor, Dalal StreetMumbai 400 023Tel.: +91-22-2272 3333Fax: +91-22-2272 3199E-mail: [email protected]: www.cdslindia.com
COMPLIANCE OFFICER FOR INVESTOR REDRESSAL
K.H. Gopal
President (Corporate Affairs) & Company Secretary
Alok Industries Limited
Peninsula Towers ‘A’, Peninsula Corporate Park
G.K. Marg, Lower Parel
Mumbai 400013
E-mail: [email protected]
Website: www.alokind.com
TRANSFER OF UNCLAIMED DIVIDEND TO INVESTOR EDUCATION AND PROTECTION FUND (IEPF)
The Notes to the Notice details the due dates on which unclaimed dividends lying in the unpaid dividend accounts of the Company would be credited to the IEPF. Investors are requested to claim their unclaimed dividends before these due dates. Pursuant to Section 205C of the Companies Act, 1956 and the IEPF (Awareness and Protection of Investors) Rules, 2001, a sum of ` 347,134.00, being the unclaimed dividend for the year 2003-04, has been credited to the IEPF.
SHAREHOLDER’S INFORMATION

INNOVATIVE TEXTILE SOLUTIONSINNOVATIVE TEXTILE SOLUTIONS
125Innovative Textile Solutions
To,
The Members
ALOK INDUSTRIES LIMITED
We have examined the compliance of conditions of Corporate Governance by Alok Industries Limited, for the year ended 31st March 2012, as stipulated in clause 49 of the Listing Agreement of the said Company with the Stock Exchanges.
The compliance of conditions of Corporate Governance is the responsibility of the management. Our examination was limited to procedures and implementation thereof, adopted by the Company for ensuring the compliance of the conditions of Corporate Governance. It is neither an audit nor an expression of opinion on the fi nancial statements of the Company.
In our opinion and to the best of the information and according to the explanations given to us, and the representations made by the Directors and the Management, we certify that the Company has complied in all respects with the conditions of Corporate Governance as stipulated in the above mentioned Listing Agreement.
We further state that such compliance is neither an assurance as to the future viability of the Company, nor the effi ciency or effectiveness with which the management has conducted the affairs of the Company.
For Deloitte Haskins & Sells For Gandhi & ParekhChartered Accountants Chartered Accountants[Firm Registration No. 117366W] [Firm Registration No.120318W]
R D. Kamat Devang B. ParekhPartner PartnerMembership No.36822 Membership No.105789
Place: Mumbai Place: MumbaiDate: May 18, 2012 Date: May 18, 2012
Auditors’ Certifi cate On Compliance Of Conditions Of Corporate Governance As Per Clause 49 Of The Listing Agreement Of The Stock Exchange

126 26 Annual Report 2011-12
To,
The Board of Directors,
ALOK INDUSTRIES LIMITED
I have examined the registers, records, books and papers of ALOK INDUSTRIES LIMITED as required to be maintained under the Companies Act, 1956, (the Act) and the rules made there under and also the provisions contained in the Memorandum and Articles of Association of the Company for the fi nancial year ended on 31 March 2012. In my opinion and to the best of my information and according to the examinations carried out by me and explanations furnished to me by the Company and as per the Auditors Report submitted by the company, I am of opinion that in respect of the aforesaid fi nancial year.
1. The Company has kept and maintained all the registers as per the provisions of the Act and the rules made there under and all entries therein have been duly recorded, subject to reconciliation with the Books of Accounts.
2. The Company has duly fi led the forms and returns with the authorities prescribed under the Act and rules made there under.
3. The Board of Directors duly met four times in respect of which meetings, proper notices were given and the proceedings were properly recorded and signed in the Minutes Book maintained for the purpose.
4. The Annual General Meeting for the fi nancial year ended on 31 March, 2011 was held on 29th September, 2011 after giving due notice to the members of the company and the resolutions passed thereat were duly recorded in Minutes Book maintained for the purpose.
5. The Company has paid/posted warrants for dividends to all the members within a period of 30 days from the date of declaration of dividend.
6. The Company has appointed LINK INTIME INDIA PRIVATE LIMITED, as Share Transfer Agent who has duly informed me that the Company has delivered all the certifi cates on allotment of securities and on lodgement thereof for transfer/transmission or any other purpose in accordance with the provisions of the Act.
7. The Board of Directors of the company is duly constituted. There were two appointment of Nominee Directors as well as three resignation of Nominee Directors during the fi nancial year.
8. During the fi nancial year the following allotment took place:
a. Allotment of 2,24,85,000 equity shares of ` 10 each pursuant to the scheme of amalgamation of Grabal Alok Impex Limited with the company.
b. Allotment of 1,60,00,000 equity shares on conversion of warrants of ` 10 each at a premium of ` 41 per share .
9. During the fi nancial year Grabal Alok Impex Limited was amalgamated with the Company vide scheme of amalgamation sanctioned by the Bombay High Court on 3rd February, 2012 and became effective from 1st March, 2012.
10. The Company has altered the clause V of the Memorandum of Association and clause III of Articles of Association due to the amalgamation of Grabal Alok Impex Limited with the Company with effect from 1st March 2012.
11. The Company had constituted the Audit Committee required as per Section 292A of the Act.
12. The Company has appointed Cost Auditors under Section 233B of the Act.
Virendra Bhatt Practising Company Secretary
ACS 1157/CP 124
Place: Mumbai
Date: May 18, 2012.
COMPANY SECRETARIAL COMPLIANCE CERTIFICATE

INNOVATIVE TEXTILE SOLUTIONSINNOVATIVE TEXTILE SOLUTIONS
127Innovative Textile Solutions
We, Dilip B. Jiwrajka, Managing Director and Sunil O. Khandelwal, Chief Financial Offi cer of Alok Industries Limited, to the best of our knowledge and belief, certify that –
a. We have reviewed fi nancial statements and cash fl ow statements for the year ended 31 March 2012 and that to the best of our knowledge and belief :
(i) these statements do not contain any materially untrue statement or omit any material fact or contain statements that might be misleading;
(ii) these statements together present a true and fair view of the company’s affairs and are in compliance with existing accounting standards, applicable laws and regulations.
b. There are, to the best of our knowledge and belief, no transactions entered into by the company during the year which are fraudulent, illegal or in violation of the Company’s code of conduct.
c. We accept responsibility for establishing and maintaining internal controls for fi nancial reporting and that we have evaluated the effectiveness of internal control systems of the company pertaining to fi nancial reporting and we have disclosed to the auditors and the Audit Committee, defi ciencies in the design or operation of such internal controls, if any, of which we are aware and the steps we have taken or propose to take to rectify these defi ciencies.
d. We have indicated to the auditors and the Audit committee –
(i) signifi cant changes in internal control over fi nancial reporting during the year;
(ii) signifi cant changes in accounting policies during the year and that the same have been disclosed in the notes to the fi nancial statements; and
(iii) Instances of signifi cant fraud of which we have become aware and the involvement therein, if any, of the management or an employee having a signifi cant role in the company’s internal control system over fi nancial reporting.
e. We affi rm that we have not denied any personnel access to the Audit Committee of the Company (in respect of matter involving alleged misconduct).
Place: Mumbai . Dilip B. Jiwrajka Sunil O. KhandelwalDate : May 18, 2012 Managing Director Chief Financial Offi cer
DECLARATION
DECLARATION BY THE MANAGING DIRECTOR UNDER CLAUSE 49 I (D) OF THE LISTING AGREEMENT REGARDING ADHERENCE TO THE CODE OF CONDUCT
In accordance with the Clause 49 sub-clause of the listing Agrement with the Stock Exchanges, I further confi rm that all the directors and senior management personnel of the Company have affi rmed compliance to their respect Code of conduct, as applicable to them for the year ended 31 March 2012.
Place : Mumbai Dilip B. JiwrajkaDate : May 18, 2012 Managing Director
Certifi cation By Managing Director And Chief Financial Offi cer Of The Company

128 26 Annual Report 2011-12
TO THE MEMBERS OF
ALOK INDUSTRIESLIMITED
1. We have audited the attached Balance Sheet of ALOK INDUSTRIES LIMITED (“the Company”) as at 31stMarch, 2012, the Statement of Profi t and Loss and the Cash Flow Statement of the Company for the year ended on that date, both annexed thereto.These fi nancial statements are the responsibility of the Company’s Management. Our responsibility is to express an opinion on these fi nancial statements based on our audit.
2. We conducted our audit in accordance with the auditing standards generally accepted in India. Those Standards require that we plan and perform the audit to obtain reasonable assurance about whether the fi nancial statements are free of material misstatements. An audit includes examining, on a test basis, evidence supporting the amounts and the disclosures in the fi nancial statements. An audit also includes assessing the accounting principles used and the signifi cant estimates made by the Management, as well as evaluating the overall fi nancial statement presentation. We believe that our audit provides a reasonable basis for our opinion.
3. As required by the Companies (Auditor’s Report) Order, 2003 (CARO) issued by the Central Government in terms of Section 227(4A) of the Companies Act, 1956, we enclose in the Annexure a statement on the matters specifi ed in paragraphs 4 and 5 of the said Order.
4. Further to our comments in the Annexure referred to in paragraph 3 above, we report as follows:
(a) we have obtained all the information and explanations which to the best of our knowledge and belief were necessary for the purposes of our audit;
(b) in our opinion, proper books of account as required by law have been kept by the Company so far as it appears from our examination of those books;
(c) the Balance Sheet, the Statement of Profi t and Loss and the Cash Flow Statement dealt with by this report are in agreement with the books of account;
(d) in our opinion, the Balance Sheet, the Statement of Profi t and Loss Account and the Cash Flow Statement dealt with by this report are in compliance with the Accounting Standards referred to in Section 211(3C) of the Companies Act, 1956;
(e) in our opinion and to the best of our information and according to the explanations given to us, the said accounts give the information required by the Companies Act, 1956 in the manner so required and give a true and fair view in conformity with the accounting principles generally accepted in India:
(i) in the case of the Balance Sheet, of the state of affairs of the Company as at 31st March, 2012;
(ii) in the case of the Statement of Profi t and Loss, of the profi t of the Company for the year ended on that date and;
(iii) in the case of the Cash Flow Statement, of the cash fl ows of the Company for the year ended on that date.
5. On the basis of the written representations received from the Directors as on 31st March, 2012 and taken on record by the Board of Directors, none of the Directors is disqualifi ed as on31stMarch, 2012 from being appointed as a director in terms of Section 274(1)(g) of the Companies Act, 1956.
For Deloitte Haskins & SellsChartered Accountants[Firm Registration No : 117366W]
R. D. KamatPartnerMembership No 36822
For Gandhi & ParekhChartered Accountants[Firm Registration No : 120318W]
Devang B. ParekhPartnerMembership No 105789
Mumbai, May 18, 2012 Mumbai, May 18, 2012
AUDITORS’ REPORT

INNOVATIVE TEXTILE SOLUTIONSINNOVATIVE TEXTILE SOLUTIONS
129Innovative Textile Solutions
Re: Alok Industries Limited
Referred to in paragraph 3 of our report of even date
(i) In respect of fi xed assets:
(a) The Company has maintained proper records showing full particulars, including quantitative details and situationof fi xed assets.
(b) According to the information and explanations given to us, physical verifi cation of major portion of fi xed assets as at 31st March, 2012was conducted by the management during the year, which is reasonable having regard to the size of the company and nature of its business and no material discrepancies were noticed on such verifi cation.
(c) The fi xed assets disposed off during the year, in our opinion, do not constitute a substantial part of the fi xed assets of the Company.
(ii) In respect of inventories:
(a) As explained to us, inventories (except stocks lying with third parties and in-transit, confi rmation / subsequent receipt have been obtained in respect of such inventory) have been physically verifi ed during the year by the managementat reasonable intervals.
(b) In our opinion and according to the information and explanations given to us, the procedures of physical verifi cation of inventories followed by the management were reasonable and adequate in relation to the size of the Company and the nature of its business.
(c) In our opinion and according to the information and explanations given to us, the Company has maintained proper records of its inventories and no material discrepancies were noticed on physical verifi cation.
(iii) In respect of loans, secured or unsecured, granted or taken by the Company to / from companies, fi rms or other parties covered in the Register under Section 301 of the Companies Act, 1956, according to the information and explanations given to us:
During the year, the Company has granted and taken loansto/fromGrabal Alok Impex Ltd. Grabal Alok Impex Ltd was amalgamated with the Company vide scheme of amalgamation sanctioned by the Bombay High Court on 3rd February, 2012 and effectivefrom 1stMarch, 2012. The appointed date for such amalgamation was 1st April, 2011 (Refer note no 36) and as such,these transactions have not been considered for reporting under thisclause.
(iv) In our opinion and according to the information and explanations given to us, there is an adequate internal controlsystem commensurate with the size of the company and the nature of its business with regard to purchases of inventory andfi xed assets and sale of goods and services. During the course of our audit, we have not observed any major weakness in such internal control system.
(v) In respect of contracts or arrangements entered in the register maintained in pursuance of section 301 of the Companies Act, 1956:
(a) To the best of our knowledge and belief and according to the information and explanations given to us, the particulars of contracts or arrangements referred to in Section 301 that needed to be entered in the register have been so entered.
(b) Where each of such transaction is in excess of ` 5 lakhs in respect of any party, the transactions have been made at prices which are prima facie reasonable having regard to the prevailing market prices at the relevant time.
(vi) In our opinion and according to the information and explanations given to us, the Company has complied with the provisions of Sections 58A and 58AA or any other relevant provisions of the Companies Act, 1956 and the Companies (Acceptance of Deposits) Rules, 1975 with regard to the deposits accepted from the public. According to the information and explanations given to us, no order has been passed by the Company Law Board or the National Company Law Tribunal or the Reserve Bank of India or any Court or any other Tribunal.
ANNEXURE TO THE AUDITORS’ REPORT

130 26 Annual Report 2011-12
(vii) In our opinion, the internal audit functions carried out during the year by fi rms of Chartered Accountants appointed by the Management have been commensurate with the size of the company and the nature of its business.
(viii) We have broadly reviewed the books of account maintained by the Company pursuant to the rules made by the Central Government for the maintenance of cost records under Section 209(1) (d) of the Companies Act, 1956 in respect of Textileproducts manufactured by the Company and are of the opinion, that prima facie, the prescribed accounts and records have been made and maintained. We have, however, not made a detailed examination of the records with a view to determining whether they are accurate or complete. To the best of our knowledge and according to the information and explanations given to us, the Central Government has not prescribed the maintenance of cost records for any other product of the Company.
(ix) According to the information and explanation given to us in respect of statutory dues:
(a) The company has generally been regular in depositing undisputed statutory dues, including Provident Fund, Investor Education and Protection Fund, Employees’ State Insurance, Income-tax, Sales-tax, Wealth Tax, Custom Duty,Excise Duty, Cessand other material statutory dues with the appropriate authorities during the year, except for service tax dues aggregating to ` 1.74 crores including interest of ` 0.21 crores,which have been deposited subsequent to the year end.
(b) There were no undisputed amounts payable in respect of Income-tax, Wealth-tax, Customs Duty, Excise Duty, Sales Tax, Service Tax, Cess and other statutory dues in arrears as at 31stMarch, 2012 for a period of more than six months from the date they became payable.
(c) There are no dues in respect of Sales Tax, Income Tax, Wealth tax, Customs duty, Service Tax, Excise duty and Cess that have not been deposited as on 31stMarch , 2012 on account of disputes, except as follows :
Name of the statute
Nature of dues Amount (` in crores)
Period to which the amount relates
Forum where dispute is pending
Income Tax Act, 1961
Income tax demand (TDS dues)
1.92 AY 2006-07 to 2011-12
Commissioner of Income Tax (Appeals)
Works Contract Tax Act, 1986
Works Contract Tax
0.59 FY 2004–05 Deputy Commissioner of Sales Tax
(x) The company neither has accumulated losses at the end of the year, nor incurred cash losses during the current and immediately preceding fi nancial year.
(xi) In our opinion and according to the information and explanations given to us, the Company has not defaulted in the repayment of dues to banks, fi nancial institutions and debenture holders.
(xii) According to the information and explanations given to us, the company has not granted any loans and advances on the basis of security by way of pledge of shares, debentures and any other securities. Accordingly, clause 4 (xii) of the order is not applicable to the company.
(xiii) In our opinion and according to the information and explanations given to us, the company is not a chit fund or a nidhi/mutual benefi t fund/society. Accordingly clause 4 (xiii) of the order is not applicable to the company.
(xiv) In our opinion and according to the information and explanations given to us, the company is not dealing in or trading in shares, securities, debentures or investments. Accordingly clause 4 (xiv) of the order is not applicable to the Company.
(xv) In our opinion and according to the explanation given to us, the terms and conditions of the guarantees given by the company for loans taken by subsidiary company from banks and fi nancial institutions are notprima facie prejudicial to the interests of the Company.
ANNEXURE TO THE AUDITORS’ REPORT

INNOVATIVE TEXTILE SOLUTIONSINNOVATIVE TEXTILE SOLUTIONS
131Innovative Textile Solutions
(xvi) On the basis of records examined by us, and relying on the information compiled by the Company for co-relating the funds raised to the end use of term loans, we have to state that, the company has, prima-facie, applied the term loansfor the purposes for which they were obtained, other than amounts temporarily invested pending utilisation of the funds for the intended use.
(xvii) In our opinion and according to the information and explanations given to us and on an overall examination of the Balance Sheet, we report that funds raised on short-term basis have not been used during the year for long – term investment.
(xviii) During the year, the Company has made allotment of 1.6 crores equity shares to Jiwrajka Investment Private Limited (Refer note no 2 (a) (i) to the fi nancial statement), covered in Register maintained under section 301 of the Companies Act, 1956. In our opinion, the price at which the shares have been issued is not prejudicial to the interest of the Company.
(xix) Security / Charges have been created in respect of debentures issued as detailed in note no 4 to the fi nancial statements.
(xx) The Company has not raised money by public issue during the year.
(xxi) To the best of our knowledge and according to the information and explanations given to us, no fraud by the Company and no fraud on the Company has been noticed or reported during the year.
For Deloitte Haskins & SellsChartered Accountants[Firm Registration No : 117366W]
R. D. KamatPartnerMembership No 36822
For Gandhi & ParekhChartered Accountants[Firm Registration No : 120318W]
Devang B. ParekhPartnerMembership No 105789
Mumbai, May 18, 2012 Mumbai, May 18, 2012
ANNEXURE TO THE AUDITORS’ REPORT

132 26 Annual Report 2011-12
In terms of our report attached For and on behalf of the Board
For Deloitte Haskins & Sells For Gandhi & Parekh Ashok B. Jiwrajka Executive Chairman
Chartered Accountants Chartered Accountants Dilip B. Jiwrajka Managing Director
Surendra B. Jiwrajka Jt. Managing Director
R. D. Kamat Devang B. Parekh Sunil O. Khandelwal Chief Financial Offi cer
Partner Partner K. H. Gopal President (Corporate Affairs) & Company Secretary
Date: 18 May 2012 Date: 18 May 2012
(` Crore)
PARTICULARS NOTES AS AT31-Mar-12
AS AT31-Mar-11
I EQUITIES AND LIABILITIES(1) Shareholders' Funds Share Capital 2 826.28 787.79
Reserves and Surplus 3 2,829.22 2,309.80
3,655.50 3,097.59
(2) Non-current Liabilities Long-term Borrowings 4 7,013.06 6,051.40
Deferred Tax liabilities (net) 5 626.77 507.66
Long-term provisions 6 176.39 79.35
(3) Current Liabilities Short-term Borrowings 7 4,126.42 2,846.19
Trade payables 8 506.42 562.92
Other current liabilities 9 2,058.20 1,050.49
Short-term provisions 10 75.60 71.87
TOTAL 18,238.36 14,267.47
II ASSETS
(1) Non-current Assets Fixed assets
Tangible assets 11 8,514.54 7,384.29
Intangible assets 11 37.55 42.92
Capital work-in-progress 11 914.16 906.55
Non-current Investments 12 175.79 139.93
Long-term Loans & Advances 13 257.04 324.92
(2) Current Assets Current Investments 14 3.94 27.25
Inventories 15 3,379.91 2,002.62
Trade receivables 16 2,152.15 1,740.19
Cash & Bank Balance 17 1,294.84 1,139.85
Short-term Loans & Advances 18 1,395.04 425.03
Other current assets 19 113.40 133.92
TOTAL 18,238.36 14,267.47III Signifi cant accounting policies and
accompanying notes forming part of the fi nancial statements
1 to 40
Balance Sheet as at 31 March 2012

INNOVATIVE TEXTILE SOLUTIONSINNOVATIVE TEXTILE SOLUTIONS
133Innovative Textile Solutions
In terms of our report attached For and on behalf of the Board
For Deloitte Haskins & Sells For Gandhi & Parekh Ashok B. Jiwrajka Executive Chairman
Chartered Accountants Chartered Accountants Dilip B. Jiwrajka Managing Director
Surendra B. Jiwrajka Jt. Managing Director
R. D. Kamat Devang B. Parekh Sunil O. Khandelwal Chief Financial Offi cer
Partner Partner K. H. Gopal President (Corporate Affairs) & Company Secretary
Date: 18 May 2012 Date: 18 May 2012
(` Crore)
PARTICULARS NOTES Year Ended 31-Mar-12
Year Ended 31-Mar-11
I. REVENUE
Revenue from Operations (gross) 20 9,134.81 6,500.91
Less : Excise Duty 233.95 112.48
Revenue from Operations (net) 8,900.86 6,388.43
II. Other Income 21 65.60 41.09
III. Total Revenue 8,966.46 6,429.52
IV EXPENSES
Cost of Materials consumed 5,748.34 3,224.04
Purchase of Traded Goods 161.45 342.62
Changes in inventories of fi nished goods,work-in-progress and stock-in-trade
22 (1,516.66) (222.55)
Employee benefi ts expense 23 267.28 199.76
Finance costs 24 1,149.55 736.27
Depreciation and amortisation expense 713.43 518.79
Other expenses 25 1,681.30 1,005.95
Total 8,204.69 5,804.88
V Profi t before exceptional items and tax 761.77 624.64
VI Exceptional Items (refer note no. 33 (i)) 121.27 41.45
VII Profi t before tax (V-VI) 640.50 583.19
VIII Tax expenses
– Current tax (157.64) (78.15)
Include MAT adjustment of ` 44.12 Crore (` 26.53 Crore pertaining to the previous year (preavious year ` 42.42 crores))
– Deferred tax (102.33) (100.68)
Total Tax expenses (259.97) (178.83)
IX Net profi t for the year 380.53 404.36
X EARNINGS PER SHARE (in `) 30
Basic 4.69 5.13
Diluted 4.69 5.13
Signifi cant accounting policies and accompanying 1 to 40
notes forming part of the fi nancial statements
Statement Of Profi t and Loss For The Year Eneded 31 March 2012
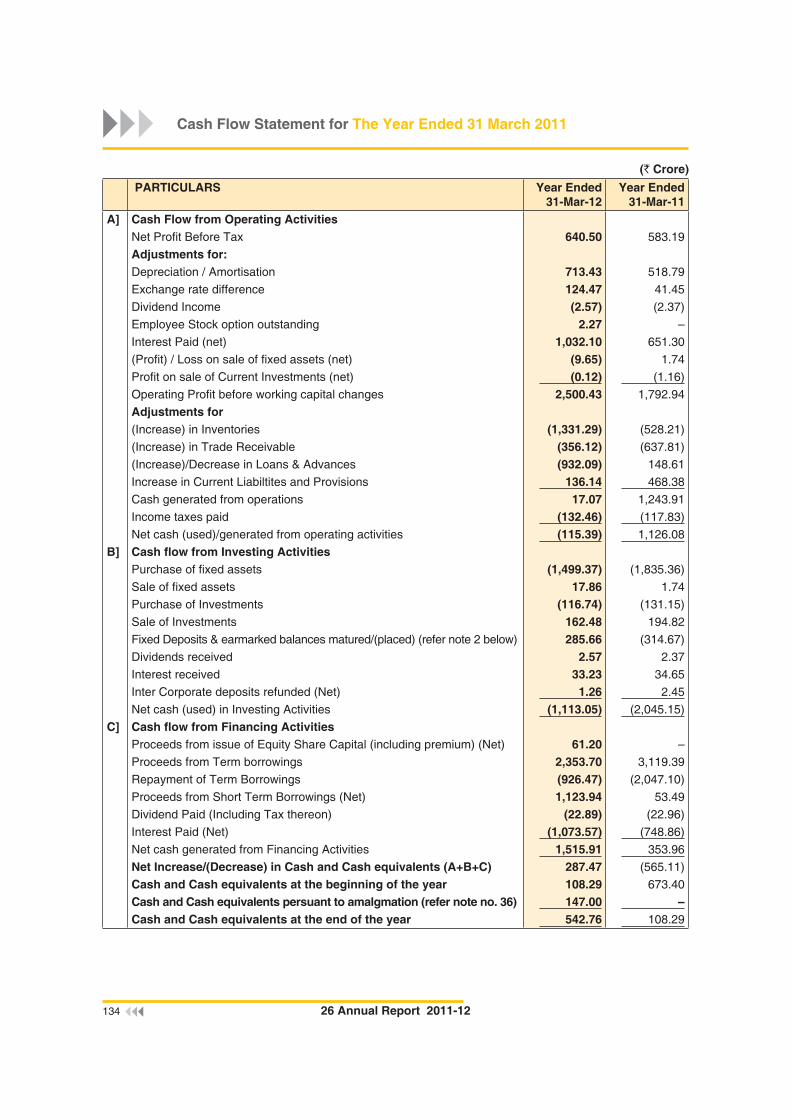
134 26 Annual Report 2011-12
(` Crore)
PARTICULARS Year Ended31-Mar-12
Year Ended31-Mar-11
A] Cash Flow from Operating ActivitiesNet Profi t Before Tax 640.50 583.19
Adjustments for:Depreciation / Amortisation 713.43 518.79
Exchange rate difference 124.47 41.45
Dividend Income (2.57) (2.37)
Employee Stock option outstanding 2.27 –
Interest Paid (net) 1,032.10 651.30
(Profi t) / Loss on sale of fi xed assets (net) (9.65) 1.74
Profi t on sale of Current Investments (net) (0.12) (1.16)
Operating Profi t before working capital changes 2,500.43 1,792.94
Adjustments for(Increase) in Inventories (1,331.29) (528.21)
(Increase) in Trade Receivable (356.12) (637.81)
(Increase)/Decrease in Loans & Advances (932.09) 148.61
Increase in Current Liabiltites and Provisions 136.14 468.38
Cash generated from operations 17.07 1,243.91
Income taxes paid (132.46) (117.83)
Net cash (used)/generated from operating activities (115.39) 1,126.08
B] Cash fl ow from Investing ActivitiesPurchase of fi xed assets (1,499.37) (1,835.36)
Sale of fi xed assets 17.86 1.74
Purchase of Investments (116.74) (131.15)
Sale of Investments 162.48 194.82
Fixed Deposits & earmarked balances matured/(placed) (refer note 2 below) 285.66 (314.67)
Dividends received 2.57 2.37
Interest received 33.23 34.65
Inter Corporate deposits refunded (Net) 1.26 2.45
Net cash (used) in Investing Activities (1,113.05) (2,045.15)
C] Cash fl ow from Financing ActivitiesProceeds from issue of Equity Share Capital (including premium) (Net) 61.20 –
Proceeds from Term borrowings 2,353.70 3,119.39
Repayment of Term Borrowings (926.47) (2,047.10)
Proceeds from Short Term Borrowings (Net) 1,123.94 53.49
Dividend Paid (Including Tax thereon) (22.89) (22.96)
Interest Paid (Net) (1,073.57) (748.86)
Net cash generated from Financing Activities 1,515.91 353.96
Net Increase/(Decrease) in Cash and Cash equivalents (A+B+C) 287.47 (565.11)
Cash and Cash equivalents at the beginning of the year 108.29 673.40
Cash and Cash equivalents persuant to amalgmation (refer note no. 36) 147.00 –Cash and Cash equivalents at the end of the year 542.76 108.29
Cash Flow Statement for The Year Ended 31 March 2011

INNOVATIVE TEXTILE SOLUTIONSINNOVATIVE TEXTILE SOLUTIONS
135Innovative Textile Solutions
NOTES TO CASH FLOW STATEMENT
1 Purchase of fi xed assets are stated inclusive of movements of Capital Work in Progress between the commencement and end of the year and is considered as part of investing activity.
2 Cash and Cash equivalents includes :(` Crore)
March 31, 2012 March 31, 2011Cash and Bank Balances 1,294.84 1,139.85
Less : Earmarked Balalces/Deposit with banks * 715.12 978.32
Less : Deposit with maturity period of more than 3 months ** 36.96 53.24
Total Cash and Cash equivalents 542.76 108.29
* Earmarked balances / deposits with bank includes balances / deposits held as margin money or security against borrowings, guarantees and other commitments, which being, restricted for its use, have been excluded from cash and cash equivalent and grouped under the investment activity.
** Fixed Deposits with maturity period of more than three months have been excluded from cash and cash equivalent and grouped under the investment activity.
3 The Cash Flow Statement has been prepared in accordance with the requirements of Accounting Standard 'AS-3' Cash Flow Statements".
4 Pursuant to scheme of amalgamation between Alok Industries Ltd and Grabal Alok Impex Ltd with appointed date of 1 April 2011, the assets and liabilities of Grabal Alok Impex Limited were taken over as per the Pooling of Interest method as on 1 April 2011.
This arrangement of amalgamation is a non-cash transaction and considered as such, in the above cash fl ow statement. (Refer note no 36 of fi nancial statement)
5 Previous year’s fi gures have been regrouped/restated wherever necessary.
In terms of our report attached For and on behalf of the Board
For Deloitte Haskins & Sells For Gandhi & Parekh Ashok B. Jiwrajka Executive Chairman
Chartered Accountants Chartered Accountants Dilip B. Jiwrajka Managing Director
Surendra B. Jiwrajka Jt. Managing Director
R. D. Kamat Devang B. Parekh Sunil O. Khandelwal Chief Financial Offi cer
Partner Partner K. H. Gopal President (Corporate Affairs) & Company Secretary
Date: 18 May, 2012 Date: 18 May, 2012
Cash Flow Statement for The Year Ended 31 March 2011

136 26 Annual Report 2011-12
NOTE 1 : SIGNIFICANT ACCOUNTING POLICIES
a) Basis of Preparation of Financial Statements
These fi nancial statements have been prepared under the historical cost convention in accordance with generally accepted accounting principles in India, the applicable Accounting Standards and the provisions of the Companies Act, 1956.
b) Use of Estimates
The preparation of fi nancial statements in conformity with the generally accepted accounting principles require estimates and assumptions to be made that affect the reported amounts of assets and liabilities on the date of the fi nancial statements and the reported amounts of revenues and expenses during the reporting period. Differences between, the actual results and estimates are recognised in the period in which the results are known / materialise.
c) Revenue Recognition
i) Revenue on sale of products is recognised when the products are dispatched to customers, all signifi cant contractual obligations have been satisfi ed and the collection of the resulting receivable is reasonably expected. Sales are stated net of trade discount, returns and sales tax collected.
ii) Revenue in respect of insurance/other claims, interest etc. is recognised only when it is reasonably certain that the ultimate collection will be made.
d) Fixed Assets
i) Own Assets:
Fixed Assets are stated at cost of acquisition or construction including directly attributable cost. They are stated at historical cost less accumulated depreciation and impairment loss, if any.
ii) Assets taken on lease:
Operating Lease:
Assets taken on lease under which, all the risk and rewards of ownership are effectively retained by the lessor are classifi ed as operating lease. Lease payments under operating leases are recognised as expenses on accrual basis in accordance with the respective lease agreements.
iii) Assets given on lease
Lease rental are recognised as income over the lease term.
e) Investments
Investments classifi ed as Long Term Investments are stated at cost. Provision is made to recognise a decline, other than temporary, in the value of investments. Current investments are carried at cost or fair value whichever is lower.
f) Depreciation / Amortisation
i) Depreciation on Fixed Assets is provided on Straight Line Method at the rates and in the manner specifi ed in Schedule XIV to the Companies Act, 1956. Continuous process plant is classifi ed based on technical assessment and depreciation is provided accordingly Depreciation on additions to assets or on sale / disposal of assets is calculated from the beginning of the month of such addition or up to the month of such sale / scrapped, as the case may be. Assets costing less than ` 5,000/ – are fully depreciated in the year of purchase.
ii) Cost of leasehold land is amortised over the period of lease.
iii) Trademarks / Brands are amortised over a period of ten years from the date of capitalization
iv) Computer software is amortised for a period of fi ve years from the date of capitalization.
g) Foreign Currency Transactions & Translations
i) Foreign currency transactions are recorded at the exchange rates prevailing on the date of the
Notes to Financial Statements For The Year Ended 31 March 2012

INNOVATIVE TEXTILE SOLUTIONSINNOVATIVE TEXTILE SOLUTIONS
137Innovative Textile Solutions
transaction. Exchange differences arising on settlement of foreign currency transactions are recognised in the profi t and loss account
ii) Monetary items denominated in foreign currency are restated using the exchange rate prevailing at the balance sheet date and the resultant exchange differences are recognized in the profi t and loss account. Non-monetary items denominated in foreign currency are carried at historical cost.
However, pursuant to the amended Accounting Standard 11 on The Effects of Changes in Foreign Exchange Rates, exchange differences arising on restatement of long term monetary items are dealt with in the following manner:
� Exchange differences relating to long-term monetary items, arising during the year, in so far as those relate to the acquisition of a depreciable capital asset are added to / deducted from the cost of the asset and depreciated over the balance life of the asset.
� In other cases such differences are accumulated in a “Foreign Currency Monetary Item Translation Difference Account” and amortized to the profi t and loss account over the balance life of the long-term monetary item, however that the period of amortization does not extend beyond 31 March, 2020.
h) Inventories
Items of Inventories are valued on the basis given below:
i) Raw Materials, Packing Materials, Stores and Spares and Trading goods: at cost determined on First – In – First – Out (FIFO) basis or net realisable value, whichever is lower.
ii) Process stock and Finished Goods: At cost or net realisable values whichever is lower. Cost comprises of cost of purchase (as above), cost of conversion (absorption cost) and other costs incurred in bringing the inventory to their present location and condition.
i) Employee Benefi ts (Refer Note No. 31)
i) Defi ned Contribution Plan
Company’s contribution paid/ payable for the year to defi ned contribution retirement benefi t scheme is charged to Profi t and Loss account.
ii) Defi ned Benefi t Plan and other long term benefi t plan
Company’s liabilities towards defi ned benefi t scheme and other long term benefi t plans are determined using the projected unit credit method. Actuarial valuation under projected unit credit method are carried out at Balance Sheet date, Actuarial gains/losses are recognised in Profi t and Loss Account in the period of occurrence of such gains and losses. Past service cost is recognised immediately to the extent benefi ts are vested otherwise it is amortized on straight line basis over running average periods until the benefi ts become vested. The retirement benefi t obligation recognised in Balance Sheet represents present value of the defi ned benefi t obligations as adjusted for unrecognised past service cost and as reduced by fair value of scheme assets. Any asset resulting from this calculation is limited to past service cost; the present value is available refunds and reduction in future contribution to the scheme.
iii) Short Term Employee Benefi ts
Short term employee benefi ts are recognised as an expense at undiscounted amount in profi t & loss account of the year in which the related service is rendered. These benefi ts include incentive, bonus.
j) Accounting of CENVAT credit
Cenvat credit available is accounted by recording material purchases net of excise duty. Cenvat credit availed is accounted on adjustment against excise duty payable on dispatch of fi nished goods.
k) Government Grants
Grants, in the nature of interest subsidy under the Technology Upgradation Fund Scheme (TUFS), are accounted for when it is reasonably certain that ultimate collection will be made. Government grants not specifi cally related to fi xed assets are recognised in the Profi t and Loss Account in the year of accrual / receipt.
Notes to Financial Statements For The Year Ended 31 March 2012

138 26 Annual Report 2011-12
l) Borrowing Costs
Borrowing costs that are attributable to the acquisition or construction of qualifying assets are capitalised as part of the cost of such assets. A qualifying asset is one that necessarily takes a substantial period of time to get ready for its intended use or sale. All other borrowing costs are charged to revenue.
m) Income taxes
Tax expense comprises of current tax and deferred tax. Current tax and deferred tax are accounted for in accordance with Accounting Standard 22 (AS-22) on “Accounting for taxes on Income”. Current tax is measured at the amount expected to be paid / recovered from the tax authority using the applicable tax rates. Deferred tax liabilities are recognised for future tax consequence attributable to timing difference between taxable income and accounting income that are capable of reversing in one or more subsequent periods and are measured at relevant enacted/ substantively enacted tax rates and in the case of deferred tax asset on consideration of prudence, are recognised and carried forward to the extent of reasonable / virtual certainty as case may be. At each balance sheet date, the Company reassesses unrealised deferred tax assets to the extent they become reasonably certain or virtually certain of realisation, as the case may be. Minimum Alternate Tax (MAT) credit entitlement is recognised in accordance with the Guidance Note on “Accounting for credit available in respect of Minimum Alternate Tax under the Income-tax Act, 1961” issued by ICAI
n) Intangible Assets
Intangible assets are recognised only if it is probable that the future economic benefi ts that are attributable to the assets will fl ow to the enterprise and the cost of the assets can be measured reliably. The intangible assets are recorded at cost and are carried at cost less accumulated amortisation and accumulated impairment losses, if any.
o) Impairment of Fixed Assets
At the end of each year, the company determines whether a provision should be made for impairment loss on fi xed assets by considering the indications that an impairment loss may have occurred in accordance with Accounting Standard 28 (AS-28) ‘’Impairment of Assets’’. An impairment loss is charged to the Profi t and Loss Account in the year in which, an asset is identifi ed as impaired, when the carrying value of the asset exceeds its recoverable value. The impairment loss recognised in prior accounting periods is reversed if there has been a change in the estimate of recoverable amount.
p) Provisions, Contingent Liabilities and Contingent Assets
Provisions involving substantial degree of estimation in measurement are recognised when there is a present obligation as a result of past events and it is probable that there will be an outfl ow of resources. Contingent liabilities are not recognised but are disclosed in the Notes. Contingent Assets are neither recognised nor disclosed in the fi nancial statements.
q) Accounting for Derivatives
i) The company uses derivative instruments like foreign currency forward contracts, foreign currency options and Interest rate swaps to hedge its exposure to movements in foreign exchange rates, interest rates and currency risks. The objective of these derivative instruments is to reduce the risk or cost to the company and is not intended for trading or speculation purposes.
ii) Interest Rate Swaps, Foreign Currency Options and Currency Swaps, entered into by the Company for hedging the risks of foreign currency exposure (including interest rate risk) are accounted based on the principles of prudence as enunciated in Accounting Standard 1 (AS-1) “Disclosure of Accounting Policies”. Thus, mark to market loses (net) are accounted for by the company, net gains are ignored.
iii) In respect of foreign currency forward contracts entered into to hedge foreign currency exposure in respect of recognized monetary items, the premium or discount on such contracts is amortized over the life of the contract. The exchange difference measured by the change in exchange rate between the inception dates of the contract / last reporting date as the case may be and the balance sheet date is recognized in the profi t and loss account. Any gain / loss on cancellation of such forward contracts are recognised as income / expense of the period.
Notes to Financial Statements For The Year Ended 31 March 2012

INNOVATIVE TEXTILE SOLUTIONSINNOVATIVE TEXTILE SOLUTIONS
139Innovative Textile Solutions
iv) The Company designates foreign currency forward contracts taken with respect to highly probable forecast transactions and fi rm commitments as hedges and accounts for the same by applying the recognition and measurement principles set out in the Accounting Standard (AS) 30 “Financial Instruments: Recognition and Measurement”. Accordingly, the Company records the gain or loss on effective cash fl ow hedges in the Cash Flow Hedging Reserve account until the forecasted transaction materializes. Gain or loss on ineffective cash fl ow hedges (if any) is recognized in the profi t and loss account. (Refer Note No. 33(ii)).
2. SHARE CAPITAL
(` Crore)
PARTICULARS AS AT 31-Mar-12
AS AT 31-Mar-11
(a) Authorised Shares 100,00,00,000 (previous year 90,00,00,000) Equity
shares of `10/ – each 1,000.00 900.00
1,000.00 900.00(b) Issued and Subscribed and fully paid-up shares 82,62,69,357 (previous year 78,77,84,357) Equity
shares of `10/ – each fully paid up 826.27 787.78
Add : Forfeited Shares (13,921 shares of ` 10/ – each ` 5 paid up)
0.01 0.01
826.28 787.79 TOTAL 826.28 787.79
NOTES :
a) During the year 3,84,85,000 (previous year Nil) equity shares are issued as under:
i] 1,60,00,000 Equity shares of `10/ – each at a permium of ` 41/ – each alloted on conversion of warrants issued by Grabal Alok Impex Limited, the amalgmating company. Such warrants were sold by the original warrant holder to Jiwarajka Investment Private Limited, a promoter group company, which excercised such warrants.
ii] 2,24,85,000 Equity shares alloted to the Shareholders of Grabal Alok Impex Limited pursuant to the Scheme of Amalgamation (Refer Note No 36) for consideration other than cash.
b) Of the remaining shares :
i] 7,45,396 equity shares were allotted as Bonus shares by way of capitalisation of General Reserve.
ii] 62,550 equity shares being forfeited shares were reissued during 2001.
c) Reconciliation of shares outstanding at the begining and end of the reporting period
Particulars AS AT 31-Mar-12
AS AT 31-Mar-11
No of shares outstanding at the begining of the year 787,784,357 787,798,278Add : Shares alloted during the yearAllotment of Equity shares on conversion of warrants 16,000,000 –Allotment of Equity shares pursuant to the Scheme of Amalgamation 22,485,000 –Less: Shares forfeited on account of non payment of call money – (13,921)No of shares outstanding at the end of the year 826,269,357 787,784,357
d) Terms/rights attached to equity shares
The company has only one class of equity shares having a par value of ` 10/ – per share. Each holder of equity share is entitled to one vote per shares. The company declares and pays dividend in Indian Rupees. The dividend proposed by the Board of Directors is subject to the approval of the sharesholders in the Annual General Meeting.
Notes to Financial Statements For The Year Ended 31 March 2012
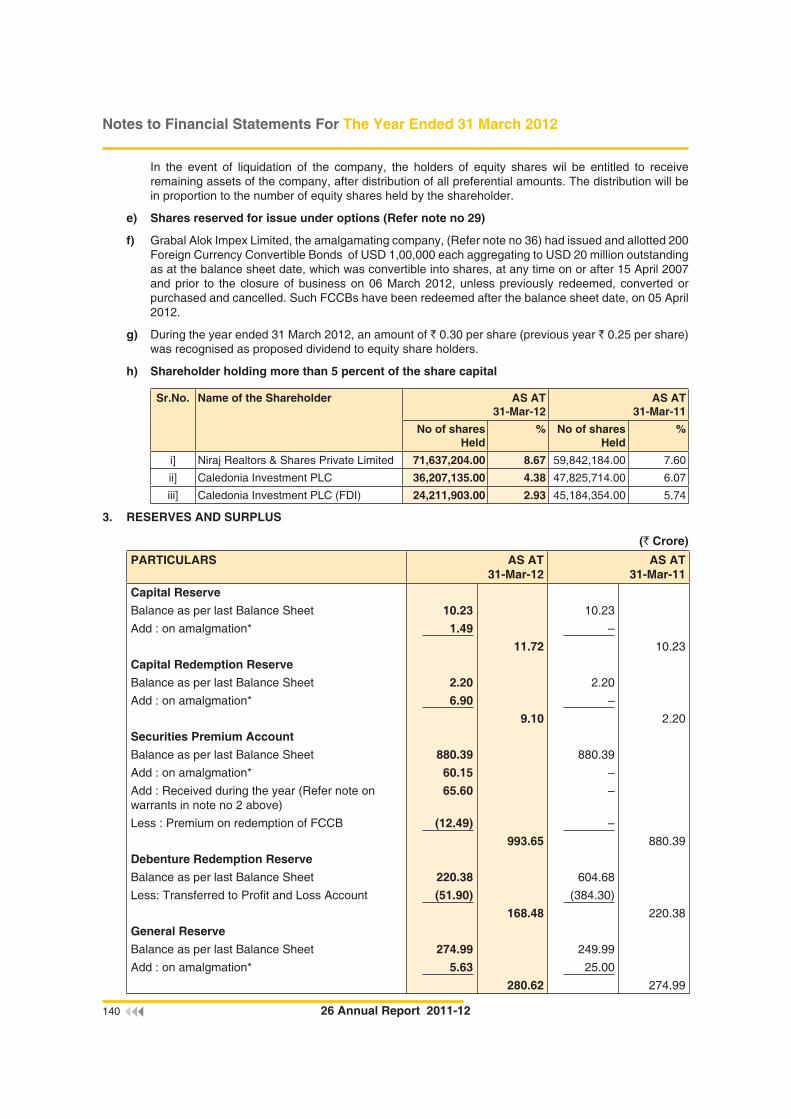
140 26 Annual Report 2011-12
In the event of liquidation of the company, the holders of equity shares wil be entitled to receive remaining assets of the company, after distribution of all preferential amounts. The distribution will be in proportion to the number of equity shares held by the shareholder.
e) Shares reserved for issue under options (Refer note no 29)
f) Grabal Alok Impex Limited, the amalgamating company, (Refer note no 36) had issued and allotted 200 Foreign Currency Convertible Bonds of USD 1,00,000 each aggregating to USD 20 million outstanding as at the balance sheet date, which was convertible into shares, at any time on or after 15 April 2007 and prior to the closure of business on 06 March 2012, unless previously redeemed, converted or purchased and cancelled. Such FCCBs have been redeemed after the balance sheet date, on 05 April 2012.
g) During the year ended 31 March 2012, an amount of ` 0.30 per share (previous year ` 0.25 per share) was recognised as proposed dividend to equity share holders.
h) Shareholder holding more than 5 percent of the share capital
Sr.No. Name of the Shareholder AS AT 31-Mar-12
AS AT 31-Mar-11
No of shares Held
% No of shares Held
%
i] Niraj Realtors & Shares Private Limited 71,637,204.00 8.67 59,842,184.00 7.60
ii] Caledonia Investment PLC 36,207,135.00 4.38 47,825,714.00 6.07
iii] Caledonia Investment PLC (FDI) 24,211,903.00 2.93 45,184,354.00 5.74
3. RESERVES AND SURPLUS
(` Crore)
PARTICULARS AS AT 31-Mar-12
AS AT 31-Mar-11
Capital Reserve
Balance as per last Balance Sheet 10.23 10.23
Add : on amalgmation* 1.49 –
11.72 10.23
Capital Redemption Reserve
Balance as per last Balance Sheet 2.20 2.20
Add : on amalgmation* 6.90 –
9.10 2.20
Securities Premium Account
Balance as per last Balance Sheet 880.39 880.39
Add : on amalgmation* 60.15 –
Add : Received during the year (Refer note on warrants in note no 2 above)
65.60 –
Less : Premium on redemption of FCCB (12.49) –
993.65 880.39
Debenture Redemption Reserve
Balance as per last Balance Sheet 220.38 604.68
Less: Transferred to Profi t and Loss Account (51.90) (384.30)
168.48 220.38
General Reserve
Balance as per last Balance Sheet 274.99 249.99
Add : on amalgmation* 5.63 25.00
280.62 274.99
Notes to Financial Statements For The Year Ended 31 March 2012

INNOVATIVE TEXTILE SOLUTIONSINNOVATIVE TEXTILE SOLUTIONS
141Innovative Textile Solutions
PARTICULARS AS AT 31-Mar-12
AS AT 31-Mar-11
Employee Stock Options Outstanding
Options granted during the year 4.67 –
Less : Deferred Employee Compensation expenses
(2.40) –
2.27 –
Cash Flow Hedging Reserve (Refer Note No 33(ii))
(16.78) –
Surplus in the Statement of Profi t and Loss
Balance brought forward from previous year 921.61 180.91
Add : on amalgmation* 54.85
Profi t for the year 380.53 404.36
Less : Appropriations
(i) Transfered to General Reserve – (25.00)
(ii) Transfered from/(to) Debenture Redemption Reserve
51.90 384.30
(iii) Proposed Dividend – Equity Shares (24.79) (19.69)
(iv) Corporate Dividend Tax thereon (4.02) (3.27)
(v) Excess Provision of dividend and tax thereon 0.08 –
1,380.16 921.61
TOTAL 2,829.22 2,309.80
* Refer note no 36
4. LONG-TERM BORROWINGS
(` Crore)
PARTICULARS AS AT 31-Mar-12
AS AT 31-Mar-11
Current Non Current
Current Non Current
a) Debentures (Secured) (Refer Note I below) – 800.00 – 500.00
b) Term Loans
– Secured (Refer Note II & III below)
(1) From banks
- Rupee Loans 920.71 5,568.45 857.32 4,662.17
- Foreign currency loans 555.87 350.15 12.83 571.82
1,476.58 5,918.60 870.15 5,233.99
(2) From Financial Institutions
- Rupee Loans 13.13 58.59 12.19 71.72
- Foreign currency loans 20.96 145.22 20.33 144.55
34.09 203.81 32.52 216.27
1,510.67 6,122.41 902.67 5,450.26
– Unsecured (Refer Note IV below)
(1) From banks
- Foreign currency loans 119.64 86.62 16.88 95.34
Notes to Financial Statements For The Year Ended 31 March 2012

142 26 Annual Report 2011-12
c) Other loans & advances (Refer Note V below)
– Secured
Vehicle loan from Banks 2.43 4.03 2.07 5.80
TOTAL 1,632.74 7,013.06 921.62 6,051.40
NOTES :
I. a) Debentures outstanding at the year end are redeemable as follows
Particulars Nos 31-Mar-12 (` Crore)
31-Mar-11 (` Crore)
Date of Redemption
12.00% Redeemable Non convertible Debentures 375 37.50 – 1-Feb-2012.00% Redeemable Non convertible Debentures 375 37.50 – 1-Aug-1912.00% Redeemable Non convertible Debentures 375 37.50 – 1-Feb-1910.75% Redeemable Non convertible Debentures 334 33.34 33.34 18-Oct-1812.00% Redeemable Non convertible Debentures 375 37.50 – 1-Aug-1812.00% Redeemable Non convertible Debentures 375 37.50 – 1-Feb-1810.75% Redeemable Non convertible Debentures 333 33.33 33.33 18-Oct-1712.00% Redeemable Non convertible Debentures 375 37.50 – 1-Aug-1712.50% Redeemable Non convertible Debentures 300 30.00 30.00 3-Mar-1712.50% Redeemable Non convertible Debentures 366 36.66 36.66 2-Mar-1712.00% Redeemable Non convertible Debentures 375 37.50 – 1-Feb-1710.75% Redeemable Non convertible Debentures 333 33.33 33.33 18-Oct-1612.00% Redeemable Non convertible Debentures 375 37.50 – 1-Aug-1611.50% Redeemable Non convertible Debentures 600 60.00 60.00 29-Jun-1612.50% Redeemable Non convertible Debentures 367 36.67 36.67 2-Mar-1612.50% Redeemable Non convertible Debentures 300 30.00 30.00 2-Mar-1611.50% Redeemable Non convertible Debentures 700 70.00 70.00 28-Jun-1512.50% Redeemable Non convertible Debentures 367 36.67 36.67 3-Mar-1512.50% Redeemable Non convertible Debentures 300 30.00 30.00 3-Mar-1511.50% Redeemable Non convertible Debentures 700 70.00 70.00 28-Jun-14Total 800.00 500.00
b) All the debentures in a) above are secured by pari passu charge on the immovable property situated at Mouje Irana, Taluka Kadi, District Mehsana in the state of Gujarat. Further, Debentures of ` 300 crore are secured by fi rst pari passu charge to be created on fi xed assets of the company and Debentures of ` 500 crore are secured by subservient charge on fi xed and current assets of the Company (excluding Land and Building).
II. Disclosure of Security for term loans
(` Crore)Nature of security Banks Financial
InstitutionsTOTAL
Exclusive charge on Plant & Machinery and specifi c assets fi nanced*
1,021.42(640.96)
––
1,021.42(640.96)
Pari Passu fi rst charge created / to be created on the entire fi xed assets of the company#
2,753.28(2,487.69)
84.02(106.93)
2,837.30(2,594.62)
Subservient charge on all movable and current assets of the Company @
3,620.48(2,975.49)
153.88(141.86)
3,774.36(3,117.35)
Total 7,395.18 237.90 7,633.08 (6,104.14) (248.79) (6,352.93)
* Includes loans agreegating to ` 218.47 crore (previous year 218.89 crore) which is further secured by personal guarantees of promotor directors / group Companies
Notes to Financial Statements For The Year Ended 31 March 2012

INNOVATIVE TEXTILE SOLUTIONSINNOVATIVE TEXTILE SOLUTIONS
143Innovative Textile Solutions
# Includes Bank loans agreegating to ̀ 860.17 crore (previous year 998.90 crore) & Financial Institution loans aggreegation to ` 30.47 crore (previous year 38.59 crore) which is further secured by personal guarantees of promotor directors / group Companies
@ Includes Banks loans agreegating to ` 237.47 crore (previous year 159.80 crore) which is further secured by personal guarantees of promotor directors / group Companies
III. Terms of Repayment of Secured Term Loan
(` Crore)Particulars Rate of Interest* 1-2 Years 2-3 Years 3-4 Years Beyond 4
YearsTotal
Rupee Term Loan From Bank
12% – 15.75%(10.25% – 14.25%)
1,642.75(705.62)
1,568.05(1,196.90)
820.31(1,179.17)
1,537.34(1,580.48)
5,568.45(4,662.17)
Foreign Currency Term Loan From Banks
2.53% – 5.34%(2.50% – 8.00%)
34.45(479.54)
46.81(27.39)
62.79(38.56)
206.10(26.33)
350.15(571.82)
Rupee Term Loan From Financial Institutions
9.00% – 12.50%(9.00% – 12.00%)
13.74(13.13)
15.63(13.75)
13.91(15.63)
15.31(29.21)
58.59(71.72)
Foreign Currency Term Loan From Financial Institutions
2.70% – 5.31%(3.92% – 6.00%)
8.66(18.63)
136.56(7.56)
–(118.36)
––
145.22(144.55)
Total 1,699.60 1,767.05 897.01 1,758.75 6,122.41(1,216.92) (1,245.60) (1,351.72) (1,636.02) (5,450.26)
* Rate of interest is whitout considering interest subsidy under TUF Scheme
IV. Terms of Repayment of Unsecured Term Loan
(` Crore)Particulars Rate of Interest 1-2 Years 2-3 Years 3-4 Years Beyond 4
YearsTotal
Foreign Currency Term Loan From Banks
2.53% – 3.75% 17.32 17.32 17.32 34.66 86.62
(2.95% – 3.00%) (17.32) (17.32) (17.32) (43.38) (95.34)
V Disclosure of security and terms of repayment of Other loans & advances
(` Crore)Nature of security Banks
Vehicle loans are secured by vehicles under hypothecation with banks 6.46 (7.87)
(` Crore)Particulars Rate of Interest 1-2
Years2-3
Years3-4
YearsBeyond 4 Years
Total
Vehicle Loan 9.50% – 13.00% 2.44 1.26 0.33 – 4.03(9.50% – 13.00%) (2.43) (2.44) (0.93) – (5.80)
Previous year fi gure are given in below.
5. Deferred Tax Liabilities (Net)(` Crore)
PARTICULARS AS AT 31-Mar-12
AS AT 31-Mar-11
Deferred Tax Liability (DTL)
Depreciation 702.43 527.77
702.43 527.77
Notes to Financial Statements For The Year Ended 31 March 2012

144 26 Annual Report 2011-12
Deferred Tax Asset (DTA)
Mark to Market loss on Derivative Contract 58.26 –
Share Issue expenses 3.31 7.35
Other disallowances 14.09 12.76
75.66 20.11
Deferred Tax Liability (Net)* 626.77 507.66
* Includes Opening Deferred tax Liability (Net) of Grabal Alok Impex Limited of ` 16.78 crore on account of amalgmation (Refer note no 36)
6. LONG-TERM PROVISIONS(` Crore)
PARTICULARS AS AT 31-Mar-12
AS AT 31-Mar-11
Provision for employee benefi ts (Refer note No 31) 16.69 17.52
Mark to Market provision on derative instruments (Refer Note No 33(iii)) 159.70 60.04
Others (Refer note No 35) – 1.79
TOTAL 176.39 79.35
7. SHORT-TERM BORROWINGS(` Crore)
PARTICULARS AS AT 31-Mar-12
AS AT 31-Mar-11
Debenture (Secured) (Refer note a below)
8% Redeemable Non convertible Debentures – 250.00
Working capital loans:
Cash Credit accounts, working capital demand loan etc. (Secured) (Refer note b below)
From Banks (Includes ` 720.15 crores (Previous year `
380.34 crores) loan in foreign currency)
2,668.40 875.59
From Financial Institutions (Includes ̀ Nil ( Previous year ̀ 89.08 crores)
loan in foreign currency)
130.74 89.08
Cash Credit accounts, working capital demand loan etc. (Unsecured)
From Banks 157.53 69.94
From Financial Institutions – –
Commercial Paper (Unsecured)
From Banks 103.00 360.00
From Financial Institutions 335.00 360.00
438.00 720.00
Inter Corporate Deposit (Unsecured) (refer note no. 28)
11.75 –
Short term loan
Secured (Refer note b below)
- Rupee Loans
From Banks 635.00 576.98
Notes to Financial Statements For The Year Ended 31 March 2012

INNOVATIVE TEXTILE SOLUTIONSINNOVATIVE TEXTILE SOLUTIONS
145Innovative Textile Solutions
PARTICULARS AS AT 31-Mar-12
AS AT 31-Mar-11
From Financial Institutions 85.00 75.00
720.00 651.98
- Foreign currency loans
From Banks – 44.65
– 720.00 44.65 696.63
Unsecured
- Rupee Loans
From Banks – 144.95
– – 144.95 144.95
TOTAL 4,126.42 2,846.19
Note a) Debentures are secured by pari passu charge on the immovable property situated at Mouje Irana,
Taluka Kadi, District Mehsana in the state of Gujarat.
b) Disclosure of security
Nature of security Banks Financial Institutions
TOTAL
Working capital loans :(i) Hypothecation of company's current assets and
mortgage of certain immovable properties belonging to the company / Guarantor.
(ii) Second charge created / to be created on all fi xed assets (excluding land and building) of the company
2,324.47(446.14)
40.35(20.58)
2,364.82(466.72)
Subservient charge created / to be created on all moveable and current assets of the company.
343.93(429.45)
90.39(68.50)
434.32(497.95)
TOTAL 2,668.40 130.74 2,799.14 (875.59) (89.08) (964.67)
Short Term LoansSubservient charge on all movable and current assets of the Company
537.00 85.00 622.00
(621.63) (75.00) (696.63)Fixed Deposit placed with the bank. 98.00 – 98.00
– – –TOTAL 635.00 85.00 720.00
(621.63) (75.00) (696.63)
Previous year fi gures are given in brackets
8. TRADE PAYABLE
(` Crore)
PARTICULARS AS AT 31-Mar-12
AS AT 31-Mar-11
Total outstanding due to :– Micro, Small and Medium Enterprises* – –– Others 506.42 562.92(Including acceptances ` 2.20 crore (previous year ` 50.94 crrore)
506.42 562.92 506.42 562.92
Notes to Financial Statements For The Year Ended 31 March 2012

146 26 Annual Report 2011-12
* As per information available with the company
9. OTHER CURRENT LIABILITIES
(` Crore)
PARTICULARS AS AT 31-Mar-12
AS AT 31-Mar-11
Current maturities of long-term debt (Refer note 4 for details) 1,632.74 921.62Interest accrued but not due on borrowings 9.35 17.59Unpaid dividends (see note i & ii below) 1.05 0.84Foreign Currency Monetary Item Translation Difference Account – 0.22Other payables Advance from customers 46.14 51.32 Creditors for Capital Goods 32.79 18.71 Towards statutory Liabilities 6.09 10.06 Premium on redemption of FCCB 43.14 –
Advance from Related parties (Refer Note No 28) 261.73 – Temporary overdrawn bank balance (see note iii below) 14.28 30.13 Forward Contract Payable 10.89 –TOTAL 2,058.20 1,050.49
NOTES
(i) This fi gure doesn’t include any amount due and outstanding to be credited to the Investor Education and Protection Fund.
(ii) During the year company has transferred ` 0.03 crore (Previous year ` 0.06 crore) to the Investor Education and Protection Fund.
(iii) Temporary overdrawn bank balances are as per books consequent to issue of cheques at the year end, though the banks have positive balances as on that date.
10. SHORT-TERM PROVISIONS
(` Crore)
PARTICULARS AS AT 31-Mar-12
AS AT 31-Mar-11
Provision for employee benefi ts (Refer note No 31) 7.51 3.07Mark to Market provision on derivative instruments (Refer Note No 33(iii)) 36.65 12.92Proposed dividend 24.79 19.69Corporate dividend tax 4.02 3.27Provision for taxation (Net of Advance Tax) 2.63 19.24Others (Refer note No 35) – 13.68
TOTAL 75.60 71.87
Notes to Financial Statements For The Year Ended 31 March 2012

INNOVATIVE TEXTILE SOLUTIONSINNOVATIVE TEXTILE SOLUTIONS
147Innovative Textile Solutions
11. F
IXE
D A
SS
ETS
DESC
RIPT
ION
OF
ASSE
TS G
ROSS
BLO
CK D
EPRE
CIAT
ION
/ AM
ORT
ISAT
ION
NET
BLO
CK A
S AT
01.
04.1
1 A
CQUI
SITI
ON
THR
OUG
H AM
ALG
AMAT
ION
ADD
ITIO
NS D
EDUC
TIO
NS/
ADJ
USTM
ENTS
AS
AT 3
1.03
.12
AS
AT 0
1.04
.11
ACQ
UISI
TIO
N T
HRO
UGH
AMAL
GAM
ATIO
N
FO
R TH
E Y
EAR
DED
UCTI
ONS
/ A
DJUS
TMEN
TS A
S AT
31.
03.1
2 A
S AT
31.
03.1
2 A
S AT
31.
03.1
1
TANG
IBLE
ASS
ETS
:Fr
eeho
ld L
and
99.
43 3
.44
19.
14 5
.30
116
.71
– –
– –
– 1
16.7
1 9
9.43
Leas
ehol
d La
nd 0
.56
0.2
4 –
– 0
.80
0.1
3 0
.04
– –
0.1
7 * 0
.63
0.4
3Bu
ildin
gs 1
,880
.81
52.
18 2
67.7
8 –
2,2
00.7
7 1
65.0
9 5
.27
63.
78 –
234
.14
1,9
66.6
3 1
,715
.72
Plan
t and
Equ
ipm
ents
6,7
33.9
7 1
88.9
1 1
,351
.61
2.7
0 8
,271
.79
1,3
39.5
3 6
8.95
625
.58
0.9
1 2
,033
.15
6,2
38.6
4 5
,394
.44
Furn
iture
and
Fixt
ures
75.
92 2
.79
3.7
7 1
.21
81.
27 1
7.95
0.8
2 4
.71
0.6
1 2
2.87
58.
40 5
7.97
Vehi
cles
18.
94 0
.05
2.6
0 0
.56
21.
03 3
.73
0.0
2 1
.83
0.3
5 5
.23
15.
80 1
5.21
Offi
ce E
quip
men
t 9
.61
0.3
5 1
.41
0.1
2 1
1.25
3.0
9 0
.09
0.6
4 0
.04
3.7
8 7
.47
6.5
2O
ffi ce
Pre
mise
s 2
6.54
0.4
4 –
– 2
6.98
2.7
0 0
.09
0.4
6 –
3.2
5 2
3.73
23.
84Co
mpu
ter a
nd E
quip
men
ts 2
7.67
1.1
0 2
.56
0.7
0 3
0.63
17.
29 0
.68
2.0
1 0
.55
19.
43 1
1.20
10.
38To
ols
and
Equi
pmen
t 5
5.87
1.1
7 1
6.14
0.0
9 7
3.09
10.
36 0
.16
5.4
3 0
.01
15.
94 5
7.15
45.
51 8
,929
.32
250
.67
1,6
65.0
1 1
0.68
10,
834.
32 1
,559
.87
76.
12 7
04.4
5 2
.47
2,3
37.9
6 8
,496
.36
7,3
69.4
5LE
ASED
ASS
ETS
Build
ings
15.
63 –
3.7
0 –
19.
33 0
.79
– 0
.36
– 1
.15
18.
18 1
4.84
15.
63 –
3.7
0 –
19.
33 0
.79
– 0
.36
– 1
.15
18.
18 1
4.84
Sub
– To
tal
8,9
44.9
5 2
50.6
7 1
,668
.71
10.
68 1
0,85
3.65
1,5
60.6
6 7
6.12
704
.81
2.4
7 2
,339
.11
8,5
14.5
4 7
,384
.29
INTA
NGIB
LE A
SSET
S :
Trad
emar
ks /
Bran
ds 5
5.04
– –
– 5
5.04
20.
63 –
5.5
1 –
26.
14 2
8.90
34.
41Co
mpu
ter S
oftw
are
14.
34 0
.17
3.2
3 –
17.
74 5
.83
0.1
5 3
.11
– 9
.09
8.6
5 8
.51
Desig
n Ca
rds
– 0
.08
– –
0.0
8 –
0.0
8 –
– 0
.08
– –
Sub
– To
tal
69.
38 0
.25
3.2
3 –
72.
86 2
6.46
0.2
3 8
.62
– 3
5.31
37.
55 4
2.92
Tota
l 9
,014
.33
250
.92
1,6
71.9
4 1
0.68
10,
926.
51 1
,587
.12
76.
35 7
13.4
3 2
.47
2,3
74.4
2 8
,552
.09
7,4
27.2
1TO
TAL
PREV
IOUS
YEA
R 7
,276
.36
– 1
,743
.62
5.6
5 9
,014
.33
1,0
70.5
0 –
518
.79
2.1
7 1
,587
.12
7,4
27.2
1CA
PITA
L W
ORK
-IN-P
ROG
RESS
(Inc
ludi
ng `
18.
94 c
rore
s on
acc
ount
of a
mal
gam
atio
n (R
efer
not
e no
36)
) 9
14.1
6 9
06.5
5
NO
TES
:1.
P
lant
& M
achi
nery
incl
udes
:
a
E
xcha
nge
diffe
renc
e (n
et) o
f ` 9
7.60
cro
re (p
revi
ous
year
gai
n of
` 1
5.96
cro
re) o
n re
stat
emen
t of l
ong
term
bor
row
ings
pay
able
in fo
reig
n cu
rren
cy.
b
In
tere
st c
apita
lised
` 7
7.92
Cro
re (p
revi
ous
year
` 3
6.08
Cro
re)
2.
Inta
ngib
le a
sset
s co
nsis
ts o
f Tr
ade
Mar
ks /
Bra
nds
aggr
egat
ing
to `
55.
04 C
rore
(pr
evio
us y
ear `
55.0
4 cr
ore)
(G
ross
) [W
ritte
n do
wn
valu
e `
28.9
0 cr
ore
(pre
viou
s ye
ar `
34.
41 c
rore
)], w
hich
are
re
gist
ered
in th
e na
me
of a
sub
sidi
ary
com
pany
in tr
ust o
n be
half
of th
e co
mpa
ny. T
he C
ompa
ny h
as a
pplie
d fo
r reg
iste
ring
thos
e Tr
adem
arks
/ B
rand
s in
it’s
nam
e w
ith c
once
rned
aut
horit
ies
and
is a
wai
ting
regi
stra
tion.
3.
Cap
ital w
ork
in p
rogr
ess
incl
udes
a
E
xcha
nge
diffe
renc
e (n
et) o
f ` 1
6.87
cro
re (p
revi
ous
year
` 7
.52
cror
e) o
n re
stat
emen
t of l
ong
term
bor
row
ings
pay
able
in fo
reig
n cu
rren
cy.
b
In
tere
st c
apita
lised
` 2
9.14
Cro
re (P
revi
ous
year
` 5
0.73
Cro
re)
c
`
863.
35 c
rore
(pre
viou
s ye
ar `
835
.56
cror
e) o
n ac
coun
t of c
onst
ruct
ion
mat
eria
l and
pla
nt a
nd m
achi
nery
und
er e
rect
ion.
d
P
re-o
pera
tive
expe
nses
agg
rega
ting
to `
4.8
0 cr
ore
(pre
viou
s ye
ar `
12.
74 c
rore
)
* A
mou
nt w
ritte
n of
f in
resp
ect o
f Lea
seho
ld L
and
for t
he p
erio
d of
Lea
se w
hich
has
exp
ired.
Notes to Financial Statements For The Year Ended 31 March 2012

148 26 Annual Report 2011-12
12. NON CURRENT INVESTMENTS (Trade)
(` Crore)PARTICULARS AS AT
31-Mar-12 AS AT
31-Mar-11In Subsidiary Companies – UnquotedAlok Inc. 0.04 0.04[50 Equity Shares of USD 200 each]Alok Industries International Limited (refer note no 35) – 0.22[50,000 Equity Shares of USD 1 each]Alok International Inc. (` 43,225/-) 0.00 0.00[1,000 Equity Shares of USD 1/ – each]Alok Apparel Private Limited 1.00 1.00[10,00,000 Equity Shares of `10/ – each]Alok Retail (India) Limited 0.05 0.05[50,000 Equity Shares of ` 10/ – each]Alok Land Holdings Private Limited 0.50 0.50[5,00,000 Equity Shares of ` 10/ – each](1,50,000 shares pledged against fi nance availed by Alok Infrastructure Limited)Alok Infrastructure Limited 0.05 0.05[50,000 Equity Shares of `10/ – each](Pledged against fi nance availed by Alok Realtors Private Limited)Alok H & A Limited 36.05 36.05[3,60,50,000 Equity Shares of `10/ – each]Alok Singapore Pte. Ltd. (` 49/-) 0.00 –[1 (previous year Nil) Equity share of USD 1 each](Pledged against fi nance availed by Alok Singapore Pte. Ltd.)Alok International (Middle East) FZE 1.31 –(1 (previous year Nil) Equity share of UAE Dirhams of One Million)
39.00 37.91In Joint Venture – UnquotedAurangabad Textiles & Apparel Parks Limited 17.25 17.25[10,19,200 Equity Shares of `10/ – each]New City Of Bombay Mfg. Mills Limited 75.13 71.50[44,93,300 Equity Shares of `10/ – each]** Stamp duty on lease deed of ` 3.63 crore paid during the year as per share subscription agreement
92.38 88.75Others – UnquotedTrimphant Victory Holdings Limited (` 90.14 (previous year ` 45.14))
0.00 0.00
[2 (previous year 1) Equity share of USD 1 each]Shirt Company (India) Limited - 0.20[Nil (previous year 11,333) Equity Shares of `10/ – each]Dombivali Nagri Sahakari Bank Limited 0.05 0.05[10,000 Equity Shares of ` 50/ – each]Kalyan Janata Sahakari Bank Limited 0.03 0.03[10,000 Equity Shares of ` 25/ – each]Saraswat Bank Limited (` 25,000/-) 0.00 0.00[2,500 Equity Shares of ` 10/ – each]
Notes to Financial Statements For The Year Ended 31 March 2012

INNOVATIVE TEXTILE SOLUTIONSINNOVATIVE TEXTILE SOLUTIONS
149Innovative Textile Solutions
(Pledged against fi nance availed by company)Grabal Alok International Limited (` 1,121.25/-) (refer note no. 35)
– 0.00
[Nil Equity Shares (previous year 25) of USD 1 each]Interest in Alok Benefi t Trust (refer note no 36) 35.33 –[1,94,59,382 (previous year Nil) Equity Shares of `10/ – each ]Wel-Treat Environ Management Organisation (` 36,500/-) 0.00 0.00[3,650 Equity Shares of 10 each]
35.41 0.28Others – QuotedGrabal Alok Impex Limited (refer note no. 36) – 3.99
Other Non-current investmentsShare Application Money in Subsidiary company :Alok Apparel Private Limited 9.00 9.00
9.00 9.00 TOTAL 175.79 139.93
1) Quoted Investment : Aggregate cost / carrying value – 3.99 : Aggregate market value – 6.082) Unquoted Investment : Aggregate cost / carrying value 166.79 126.94
13. LONG TERM LOANS & ADVANCES
(` Crore)
PARTICULARS AS AT 31-Mar-12
AS AT 31-Mar-11
Considered goodCapital advances 121.97 154.65Lease & Security deposits 8.89 9.36Foreign Currency Monetary Item Translation Difference Account
0.95 –
Other Loans & advances Prepaid Expenses 41.34 35.23 Advance Tax (Net of provision for tax) 17.62 15.29 MAT Credit entitlement 66.27 110.39
257.04 324.92Considered DoubtfulCapital advances 3.76 –Less : Provision 3.76 – – –TOTAL 257.04 324.92
14. CURRENT INVESTMENTS (at cost) [Others]
(` Crore)
PARTICULARS AS AT 31-Mar-12
AS AT 31-Mar-11
Investments in debentures or bonds Bonds Laxmi Vilas Bank Tier II Bonds 2.00 2.00 [20 Bonds of ` 10,00,000 each]
2.00 2.00Investments in Mutual funds – Unquoted
Notes to Financial Statements For The Year Ended 31 March 2012

150 26 Annual Report 2011-12
Axis Infrastructure Fund 1 1.94 7.20 [19,378 (previous year 72,035) units of ` 1000/ –
each] SBI Magnum Insta Cash Fund – 17.00 [Nil (previous year 78,08,875.48) units of ` 10/ –
each] Peerless Liquid Fund collection A/C – 1.00 [Nil (previous year 9,35,506.20) units of ` 10/ –
each] IDFC Money Manager Fund Daily Dividend – 0.05 [Nil (previous year 49,652.93) units of ` 10/ – each]
1.94 25.25 TOTAL 3.94 27.25
15. INVENTORIES
(` Crore)
PARTICULARS AS AT 31-Mar-12
AS AT 31-Mar-11
Raw Materials 435.09 587.63(Includes material in transit ` 62.09 crore (previous year ` 138.62 crore)Work-in-progress 2,220.77 868.77Finished Goods 641.86 466.33Stock in Trade (Traded Goods) 2.72 13.59
3,300.44 1,936.32Stores & Spares 72.45 59.40Packing Material 7.02 6.90TOTAL 3,379.91 2,002.62
16. TRADE RECEIVABLES
(` Crore)
PARTICULARS AS AT 31-Mar-12
AS AT 31-Mar-12
Debts Outstanding for a period exceeding six months from due date
41.97 26.75
Less : Provision 14.18 27.79 6.95 19.80
Other Debts 2,131.32 1,722.83Less : Provision 6.96 2,124.36 2.44 1,720.39
2,152.15 1,740.19Unsecured Considered Good 2,152.15 1,740.19 Considered Doubtful 21.14 9.39TOTAL 2,173.29 1,749.58
NOTE :
i) Sundry Debtors includes ` 70.72 crore (previous year ` 38.23 crore) towards contractual obligations on account of Export Incentives Receivables.
ii) Debtors include dues from parties aggregating to ` 1.22 crore (previous year ` 3.10 crore) in which a director is a director/partner
ii) Refer note No. 28 for related party balances
Notes to Financial Statements For The Year Ended 31 March 2012

INNOVATIVE TEXTILE SOLUTIONSINNOVATIVE TEXTILE SOLUTIONS
151Innovative Textile Solutions
17. CASH AND BANK BALANCES
(` Crore)
PARTICULARS AS AT 31-Mar-12
AS AT 31-Mar-12
Cash on hand 0.50 0.70
Balance with Bank
(i) In current accounts 515.20 27.28
(ii) In EEFC accounts 0.98 0.41
(iii) In deposit accounts (Refer Note (i) and (ii) below) 61.99 132.30
(iv) In earmarked accounts
– Unpaid dividend accounts 1.05 0.84
– Balances / Deposits held as margin money or security against borrowings, guarantees and other commitments (Refer Note (i) and (iii) below)
715.12 978.32
TOTAL 1,294.84 1,139.85
NOTE :
(i) Balances with banks includes deposits amounting to ` 22.64 crore (previous year ` 39.22 crore) and margin monies amounting to ` 77.63 (previous year ` 71.49 crore) which have an original maturity of more than 12 months.
Balances with banks includes deposits amounting to ` 2.16 crore (previous year ` 9.92 crore) and margin monies amounting to ` 2.81 crore (previous year ` 15.42 crore) which have a maturity of more than 12 months from the Balance Sheet date
(ii) Includes ̀ 33.49 crore (previous year Nil) kept in bank deposits and ̀ 8.55 crore (previous year ̀ 41.29 crore) margin money pending utilisation towards project
(iii) Includes ` 437.57 crore (previous year ` 845.45 crore) pledged with banks towards loan availed by subsidiary company.
18. SHORT-TERM LOANS AND ADVANCES (Unsecured, considered good)
(` Crore)
PARTICULARS AS AT 31-Mar-12
AS AT 31-Mar-12
Loans & advances to Related parties (Refer Note No 28) 120.50 69.64
Others
Advance to Vendors 933.22 110.74
Advance to Staff (see note i below) 9.13 10.50
Balance with Central Excise, Customs and Sales Tax authorities 279.32 201.07
Prepaid Expenses 49.18 28.13
Inter Corporate Deposits 3.69 4.95
TOTAL 1,395.04 425.03
NOTE :
(i) Advance to staff includes ` 0.18 crore (previous year ` 1.27 crore) due from offi cers of the Company [maximum amount outstanding during the year ` 1.27 crore (previous year ` 1.35 crore)]
Notes to Financial Statements For The Year Ended 31 March 2012

152 26 Annual Report 2011-12
19. OTHER CURRENT ASSETS (Unsecured)
(` Crore)
PARTICULARS AS AT 31-Mar-12
AS AT 31-Mar-12
Considered GoodForward Contract Receivable – 4.28Interest Subsidy Receivable 86.00 121.73Unutilised DEPB Licence 25.98 7.74Insurance Claim Receivable 1.11 0.01Balance with Central Excise Authorities 0.05 0.16Rent Receivable 0.23 –Foreign Currency Monetary Item Translation Difference Account 0.03 –
113.40 133.92Considered DoubtfulInterest Subsidy Receivable 9.31 9.31Less : Provision 9.31 9.31
– –TOTAL 113.40 133.92
20. REVENUE FROM OPERATIONS
(` Crore)
PARTICULARS Year Ended31-Mar-12
Year Ended31-Mar-11
a) Sale of product Sales – Local 6,066.31 4,261.53 Sales – Export 3,029.55 2,217.43
9,095.86 6,478.96b) Sale of services Job work charges collected 30.90 12.77c) Sale of Scrap 8.05 9.18 TOTAL 9,134.81 6,500.91
21. OTHER INCOME
(` Crore)
PARTICULARS Year Ended31-Mar-12
Year Ended31-Mar-11
Interest Income On Long Term Investments 5.04 2.30 On Current Investments 28.19 32.35
33.23 34.65Dividend Income : On Long Term Investments 0.02 – On Current Investments 2.55 2.37
2.57 2.37Gain on sale of investments (Net) On Long Term Investments – 1.02 On Current Investments – 0.14
– 1.16Gain from sale of fi xed Assets (Net) 9.65 –
Notes to Financial Statements For The Year Ended 31 March 2012

INNOVATIVE TEXTILE SOLUTIONSINNOVATIVE TEXTILE SOLUTIONS
153Innovative Textile Solutions
Provision for doubtful debts written back 2.15 1.54Sundry Credit Balance written back 3.09 0.43Rent Received 1.06 0.78Insurance claim received 12.40 –Other non operationg Income 1.45 0.16 TOTAL 65.60 41.09
22. CHANGE IN INVENTORIES OF FINISHED GOODS, WORK IN PROGRESS AND STOCK IN TRADE
(` Crore)
PARTICULARS Year Ended31-Mar-12
Year Ended31-Mar-11
CLOSING STOCK AS ON 31 MARCH 2012
Finished Goods 641.86 466.33
Stock in trades (Traded Goods) 2.72 13.59
Work-in-progress 2,220.77 868.77
2,865.35 1,348.69
LESS : OPENING STOCK AS ON 1 APRIL 2011
Finished Goods 466.33 299.66
Stock in trades (Traded Goods) 13.59 –
Work-in-progress 868.77 826.48
1,348.69 1,126.14
TOTAL 1,516.66 222.55
23. EMPLOYEE BENEFIT EXPENSES
(` Crore)
PARTICULARS Year Ended31-Mar-12
Year Ended 31-Mar-11
Salaries, Wages and Bonus 242.96 182.48
Contribution to Provident Fund and Other Funds 13.74 11.91
Employee Stock Option Compensation Expenses 2.27 –
Employees Welfare Expenses 8.31 5.37
267.28 199.76
24. FINANCE COSTS(` Crore)
PARTICULARS Year Ended31-Mar-12
Year Ended 31-Mar-11
Interest expense 1,065.33 685.95
(Net of interest subsidy of ` 131.11 crore (Previous year ` 131.88 crore) and recovery of ` 140.02 crore (Previous year ` 81.47 crore))
Interest on late payment of taxes 2.04 3.07
Other Borrowing costs 82.18 47.25
TOTAL 1,149.55 736.27
Notes to Financial Statements For The Year Ended 31 March 2012

154 26 Annual Report 2011-12
25. OTHER EXPENSES (` Crore)
PARTICULARS Year Ended 31-Mar-12
Year Ended 31-Mar-11
Stores and Spares Consumed 97.89 50.63Packing Materials Consumed 130.36 80.70Power and Fuel 656.05 392.09Processing Charges 65.44 47.93Labour Charges 66.27 59.39Excise Duty 6.27 4.14Donation 1.21 0.81Freight, Coolie and Cartage 106.51 98.25Legal and Professional Fees 35.41 28.70Rent 15.63 12.19Rates and Taxes 5.54 4.59Repairs and Maintenance Plant and Machinery 16.91 14.61 Factory Building 2.08 0.59 Others 5.25 3.55
24.24 18.75Commission on Sales 37.29 21.63Loss on exchange rate difference / derivative (Net) 248.56 34.19Provision for Doubtful Debts 12.87 6.37Provision for Doubtful Advance 3.76 9.31Bad debts and advances written off 12.07 –Loss on sale of investment(Net) 0.12 –Directors Remuneration 7.20 7.20Directors Fees and Commission 5.04 5.06Auditors Remuneration Audit Fees 1.46 1.30 Certifi cation Fees 0.05 0.03
1.51 1.33Loss on sale of assets (Net) – 1.74Insurance 12.11 12.87Miscellaneous Expenses 129.95 108.08(Miscellaneous Expenses includes Printing and Stationery, Bank Charges, Advertisement etc.)TOTAL 1,681.30 1,005.95
Notes to Financial Statements For The Year Ended 31 March 2012

INNOVATIVE TEXTILE SOLUTIONSINNOVATIVE TEXTILE SOLUTIONS
155Innovative Textile Solutions
26 Contingent Liabilities in respect of :
(` Crore)
Sr. No. Particulars Current Year Previous YearA Customs duty on shortfall in export obligation in accordance
with EXIM Policy
(The company is hopeful of meeting the export obligation within the stipulated period)
Amount Unascertained
Amount Unascertained
B Pending Litigation 0.05 0.05C Guarantees given by banks on behalf of the Company 73.48 24.69D Corporate Guarantees given to bank for loans taken by
Subsidiary Companies977.62 213.35
E Bills discounted 214.79 242.94F Taxation Matters :
a) Income tax demand mainly on account of alleged short deduction of taxes for AY 2010-11 and AY 2011-12 on certain payments. The company has fi led an appeal with the Commissioner of Income Tax (A) and is hopeful of favourable decision.
1.69 -
b) Income Tax demand during the previous years of ` 5.91 crore mainly on account of alleged short deposition of TDS amounts arising from wrong TAN numbers mentioned while uploading the TDS return and certain payments not considered by the Tax authorities, although duly paid by the company and short deduction of tax in respect of certain payments with respect to AY 2006-07 to 2009-10. The company had fi led an appeal with the Commissioner of Income Tax (A) and also made application for rectifi cation u/s 154 providing details of amounts paid to the bank. Such rectifi cation was carried out during the year for majority of the amount and for the balance of ` 0.23 crore mainly pertaining to short deduction of taxes, the company is hopeful of favourable decision.
0.23 5.91
c) Demands of Works Contract Tax contested not acknowledged as debts as the company is hopeful of favourable decision.
0.59 0.59
d) Income tax amounting to ` 11.29 crore, mainly on account of disallowance of interest and expenditure incurred towards exempt income. The company has fi led an appeal with the Commissioner of Income Tax (A) and is hopeful of favourable decision.
11.29 -
27 Capital Commitments
(` Crore)
Particulars Current Year Previous YearEstimated amount of contracts remaining to be executed on Capital Account and not provided for (Net of advances)
445.15 464.55
28 Related Party Disclosure
A) Name and Transaction / balances with related parties
I. Name of related parties and nature of relationship
As per Accounting Standard 18 (AS-18) “Related Party Disclosures”, Company’s related parties disclosed as below:
Notes to Financial Statements For The Year Ended 31 March 2012

156 26 Annual Report 2011-12
(i) Associate companiesAlspun Infrastructure Limited Next Creation Holdings LLCAshford Infotech Private Limited Nirvan Builders Private Limited
(ii) Entities under common controlAlok Denims (India) Private Limited Green Park EnterprisesAlok Finance Private Limited Jiwrajka Associates Private Limited
Alok Knit Exports Limited Jiwrajka Investment Private LimitedAlok Textile Traders Niraj Realtors & Shares Private LimitedAshok Realtors Private Limited Nirvan ExportsBuds Clothing Co. Nirvan Holdings Private LimitedD. Surendra & Co. Pramatex EnterprisesGogri Properties Private Limited Pramita Creation Private LimitedGrabal Alok Impex Limited (Refer Note 36 on amalgamation)
Triumphant Victory Holdings Limited.
(iii) SubsidiariesAlok Inc. Alok Infrastructure LimitedAlok Industries International Ltd. (Refer note no 35 on transfer of shares to Alok Infrastructure Limited)
Alok Apparels Private Limited
Alok Retail (India) Limited Alok New City Infratex Private LimitedAlok Land Holdings Private Limited Alok Realtors Private LimitedAlok Aurangabad Infratex Private Limited Alok HB Hotels Private LimitedAlok H&A Limited Alok HB Properties Private LimitedAlok International, Inc. Springdale Information and Technologies
Private LimitedAlok European Retail, s.r.o. Kesham Developers & Infotech Private LimitedAlok International (Middle East) FZE(incorporated on 01 August 2011)
Alok Singapore Pte Ltd.(Incorporated on 28 December 2011)
Mileta, a.s. Grabal Alok (UK) Limited (Refer note no 36 on amalgamation)Grabal Alok International Limited (Refer note no 35 on transfer of shares to Alok Infrastructure Limited)
(iv) Joint VentureAurangabad Textiles & Apparel Parks LimitedNew City Of Bombay Mfg. Mills Limited
(v) Key Management Personnel Ashok B. Jiwrajka
DirectorsChandrakumar BubnaDilip B. JiwrajkaSurendra B. Jiwrajka
(vi) Relatives of Key Management Alok A. JiwrajkaPersonnel Suryaprakash Bubna
II. Transactions with related parties.
(` Crore)Transaction Associate
companiesEntities under
common control
Subsidiaries Joint Venture
Companies
Key Management
Personnel
Relatives of Key
Management Personnel
Total
a) Unsecured Short Term Borrowing
Accepted during the year (on amalgamation)
- - - 11.75 - - 11.75
(-) (-) (-) (-) (-) (-) (-)
Notes to Financial Statements For The Year Ended 31 March 2012

INNOVATIVE TEXTILE SOLUTIONSINNOVATIVE TEXTILE SOLUTIONS
157Innovative Textile Solutions
Transaction Associate companies
Entities under
common control
Subsidiaries Joint Venture
Companies
Key Management
Personnel
Relatives of Key
Management Personnel
Total
Balance as at 31 Mar - - - 11.75 - - 11.75
(-) (-) (-) (-) (-) (-) (-)
b) Short Term Loans and Advances
Balance as at 1 April - 0.03 69.61 - - - 69.64
(-) (-) (32.62) (-) (-) (-) (32.62)
Granted during the year - 10.13 3,998.06 - - - 4,008.19
(-) (252.25) (1,482.83) (-) (-) (-) (1735.08)
Repaid during the year - 10.15 3,947.18 - - - 3,957.33
(-) (252.22) (1,445.84) (-) (-) (-) (1698.06)
Balance as at 31 Mar - 0.01 120.49 - - - 120.50
(-) (0.03) (69.61) (-) (-) (-) (69.64)
c) Non Current Investments
Balance as at 1 April - - 37.91 88.75 - - 126.66
(-) (-) (117.76) (87.00) (-) (-) (204.76)
Invested during the year - - 23.91 3.63 - - 27.54
(-) (-) (-) (1.75) (-) (-) (1.75)
Redeemed / Transferred during the year
- - 22.82 - - - 22.82
(-) (-) (79.15) (-) (-) (-) (79.15)
Balance as at 31 Mar - - 39.00 92.38 - - 131.38
(-) (-) (37.91) (88.75) (-) (-) (126.66)
d) Share Application Money – Non Current Investments
Balance as at 31 Mar - - 9.00 - - - 9.00
(-) (-) (9.00) (-) (-) (-) (9.00)
e) Trade Receivables
Balance as at 31 Mar - 0.09 143.46 0.04 - - 143.59
(-) (26.97) (38.78) (0.09) (-) (-) (65.84)
f) Trade payables
Balance as at 31 Mar - - 6.78 18.75 - - 25.53
(-) (18.55) (1.04) (0.02) (-) (-) (19.61)
g) Other Current Liabilities
Balance as at 31 Mar - - 261.73 - - - 261.73
(-) (-) (-) (-) (-) (-) (-)
h) Advance to Vendor – Short term Loans and Advances
Balance as at 31 Mar - - 0.02 - - - 0.02
(-) (-) (-) (-) (-) (-) (-)
i) Sale of product
Sales of Goods (Including job work charges)
- - 242.74 0.92 - - 243.66
(-) (-) (137.94) (1.41) (-) (-) (139.35)
j) Expenditure
Purchase of goods / Job Charges - - 2.48 61.19 - - 63.67
(-) (2.87) (1.07) (82.87) (-) (-) (86.81)
Purchase of Fixed Assets - - 201.66 - - - 201.66
(* From three Directors jointly) (-) (0.62) (245.48) (-) (4.54*) (-) (250.64)
Rent - - 3.12 - - - 3.12
(-) (-) (0.59) (-) (-) (-) (0.59)
LC Charges - - - - - - -
(-) (-) (2.36) (-) (-) (-) (2.36)
Notes to Financial Statements For The Year Ended 31 March 2012

158 26 Annual Report 2011-12
Transaction Associate companies
Entities under
common control
Subsidiaries Joint Venture
Companies
Key Management
Personnel
Relatives of Key
Management Personnel
Total
Sales Promotion Expenses - - 2.67 - - - 2.67
(-) (-) (2.44) (-) (-) (-) (2.44)
Legal & Professional Fees - - 12.08 - - - 12.08
(-) (-) (-) (-) (-) (-) (-)
Marketing Service Charges - - 12.98 - - - 12.98
(-) (-) (8.84) (-) (-) (-) (8.84)
Exchange rate difference - - 68.98 - - - 68.98
(-) (-) (94.37) (-) (-) (-) (94.37)
Remuneration - - - - 12.20 0.20 12.40
(-) (-) (-) (-) (12.20) (0.20) (12.40)
k) Dividend Paid - - - - 1.54 - 1.54
(-) (-) (-) (-) (1.54) (-) (1.54)
l) Income
Dividend - - - 2.00 - - 2.00
(-) (-) (-) (2.21) (-) (-) (2.21)
Rent - 0.23 0.52 - - - 0.75
(-) (0.03) (0.68) (-) (-) (-) (0.71)
m) Guarantee given - - 763.19 - - - 763.19
(-) (-) (-) (-) (-) (-) (-)
Note: Previous year fi gures are given in brackets
III. Out of the above items, transaction in excess of 10% of the total Related Party transactions are as under:
(` Crore)
Transaction Current Year Previous Yeara) Unsecured Borrowing
Accepted during the year (on amalgamation)Joint Venture Company New City of Bombay Mfg. Mills Limited 11.75 -
b) Loans and advancesGranted during the yearSubsidiary- Alok Infrastructure Limited 3,539.23 1,090.93 Alok Industries International Limited - 298.50
3,539.23 1,389.43Repaid during the yearSubsidiary- Alok Infrastructure Limited 3,499.01 1,090.84 Alok Industries International Limited - 236.45
3,499.01 1,327.29c) Investment
Invested during the yearSubsidiary- Grabal Alok International Limited 22.60 -Joint Venture- New City of Bombay Mfg. Mills Limited - 1.75 Aurangabad Textiles & Apparel Parks Limited 3.63 -
Notes to Financial Statements For The Year Ended 31 March 2012

INNOVATIVE TEXTILE SOLUTIONSINNOVATIVE TEXTILE SOLUTIONS
159Innovative Textile Solutions
Transaction Current Year Previous Year
Redeemed /Transferred during the yearSubsidiary- Alok Industries International Limited - 79.15 Grabal Alok International Limited 22.60 -
d) Turnover (including job work charges)Subsidiary- Alok International Inc. 141.77 44.68 Grabal Alok (UK) Ltd. 64.80 79.92 Alok Singapore Pte. Ltd. 25.33 -
231.90 124.60e) Expenditure
Purchase of Goods:Joint Venture Company New City of Bombay Mfg. Mills Limited 60.61 81.71Purchase of Fixed Assets (Under Construction):Subsidiary- Alok Infrastructure Limited 201.66 245.48RentSubsidiary- Kesham Developers Private Limited 2.86 0.59LC ChargesSubsidiary- Grabal Alok (UK) Ltd. - 2.36Sales Promotion ExpensesSubsidiary – Grabal Alok (UK) Ltd. 2.67 2.35Legal & Professional chargesSubsidiary – Grabal Alok (UK) Ltd. 12.08 -Marketing Service ChargesSubsidiary – Alok International Inc. 12.98 8.84Exchange Rate DifferenceSubsidiary- Grabal Alok (UK) Ltd. 68.98 94.37Remuneration:Key Management Personnel- Ashok B. Jiwrajka 3.05 3.05 Surendra B. Jiwrajka 3.05 3.05 Dilip B. Jiwrajka 3.05 3.05 Chandrakumar Bubna 3.05 3.05
12.20 12.20f) Dividend Paid
Key Management Personnel- Ashok B. Jiwrajka 0.50 0.50 Dilip B. Jiwrajka 0.51 0.51 Surendra B. Jiwrajka 0.53 0.53
1.54 1.54
Notes to Financial Statements For The Year Ended 31 March 2012

160 26 Annual Report 2011-12
Transaction Current Year Previous Yearg) Income
Dividend:Joint Venture Company New City of Bombay Mfg. Mills Limited 1.80 1.80 Aurangabad Textiles & Apparel Parks Limited 0.20 0.41
2.00 2.21Rent received:Entities under common control- Alok Denim (India) Limited 0.18 -Subsidiary- Alok Retail (India) Limited 0.40 0.63 Alok H&A Limited 0.10 -
0.50 0.63h) Guarantee Given
Subsidiary- Alok Industries International Limited 665.03 -
B) Details in accordance with clause 32 of the listing agreement with the stock exchanges are as under :
i) Loans and advances to subsidiary companies
Name of the Company Balance as at 31 March
2012
Maximum balance
during the year 11-12
Balance as at 31 March
2011
Maximum balance
during the year 10-11
Alok Infrastructure Limited 40.34 904.61 0.12 519.73Alok Inc. - 0.21 0.21 0.21Alok Industries International Limited 26.22 218.21 62.28 336.75Alok Apparels Private Limited 28.26 30.39 - 24.96Alok Retail (India) Limited 21.60 21.60 - 0.85Alok H&A Limited - 81.26 - 55.42Grabal Alok (UK) Limited 0.05 30.20 1.59 1.59Alok Realtors Private Limited - 2.14 - 3.60
C) Joint Venture
In compliance with the Accounting Standard 27 on ‘Financial Reporting of interest in Joint Ventures’ as notifi ed by the (Companies Accounting Standards) Rules, 2006, the Company has interests in the following jointly controlled entities, which are incorporated in India.
(` Crore)
Name of the Companies % of share
holding
Amount of interest based on provisional unaudited Accounts for the year ended 31 March 2012
Assets Liabilities Income Expense Contingent Liability
New City of Bombay Mfg. Mills Limited
49.00% 44.35 9.13 65.84 62.41 -(35.57) (2.38) (65.57) (61.20) (-)
Aurangabad Textile and Apparel Park Limited
49.00% 9.79 1.27 31.42 30.61 -(8.41) (0.69) (26.94) (26.47) – @
@ Disputed various matters relating to NTC / ATM – Amount unascertainable (Refer note no 17(i) of provisional fi nancial statements of Aurangabad Textile and Apparel Park Limited)
Note : Previous year fi gures are given in brackets.
Notes to Financial Statements For The Year Ended 31 March 2012

INNOVATIVE TEXTILE SOLUTIONSINNOVATIVE TEXTILE SOLUTIONS
161Innovative Textile Solutions
29 Employee Stock Option Scheme(ESOS)
In 2011, the shareholders of the Company approved the Employee Stock Option Scheme (“Alok Industries Limited – ESOS 2010 Scheme”) vide postal ballot, in accordance with the Securities and Exchange Board of India (ESOP & ESOS) Guidelines, 1999. Such scheme provides for grant of options up to 2,50,00,000 options to the eligible employees and /or directors of the Company and / or its subsidiaries. The exercise price for such options can be up to 50% discount to the market price as per the discretion of the compensation committee. 1,07,91,500 options were granted during the year and 1,05,87,950 options were outstanding as on 31 March 2012. Such options vest over a period of two years, 50% at the end of one year from the date of grant and 50% at the end of two years from the date of grant.
Details of options granted duly approved by the Remuneration and Compensation Committee under the said scheme are as under:
Grant Date No. of Options granted
Options surrendered /
lapsed
Closing Balance
Exercise Price Vesting period
20 April 2011 12,80,000 18,000 12,62,000 18.90 Up to 20 April 201320 April 2011 95,11,500 1,85,550 93,25,950 21.42 Up to 20 April 2013Total 1,07,91,500 2,03,550 1,05,87,950
The Company has followed the Intrinsic Value-based method of accounting for stock options granted, based on Guidance Note on Accounting for Employee Share-based Payments, issued by the Institute of Chartered Accountants of India, and accordingly, compensation cost of ` 4.67 crore has been recorded during the year on such grant. The compensation cost recognised as a charge during the year was ` 2.27 crore. Had the compensation cost for the Company’s stock based compensation plan been determined in the manner consistent with the fair value approach as described in the Guidance note, the Company’s net income would be lower by ` 4.20 crore and earnings per share as reported would be lower as indicated below:
Particulars Year-2012Basic and Dilutive Earnings per share – As reported (In `) 4.69 – Adjusted (In `) 4.64
The Company has adopted Black Scholes option pricing model to determine the fair value of stock options. The fair value of each option granted in 2012 is estimated on the date of grant based on the following assumptions:
Particulars Year-2012Expected life (years) 1 year from the
date of vestingRisk free interest rate (%) 7.83%Volatility (%) 39%
30 Earnings per share (EPS)
(` Crore)31 March 2012 31 March 2011
a. Nominal value of equity shares per share ( In Rupees) 10 10b. Basic and Diluted EPS
Net Profi t available for equity shareholders 380.53 404.36Weighted average number of equity shares – Basic 811,187,390 787,784,357Basic EPS 4.69 5.13Add: Effect of dilutive stock options (Nos.) 46,286 -Weighted average number of equity shares – Diluted (Nos.) 811,233,676 811,187,390Diluted EPS 4.69 5.13
31 Employee benefi t plans:
i) Defi ned contribution plans:
Amounts recognized as expenses towards contributions to provident fund, superannuation and other similar funds by the Company are ` 10.58 Crore (Previous Year ` 8.08 crore) for the year ended 31 March 2012.
Notes to Financial Statements For The Year Ended 31 March 2012
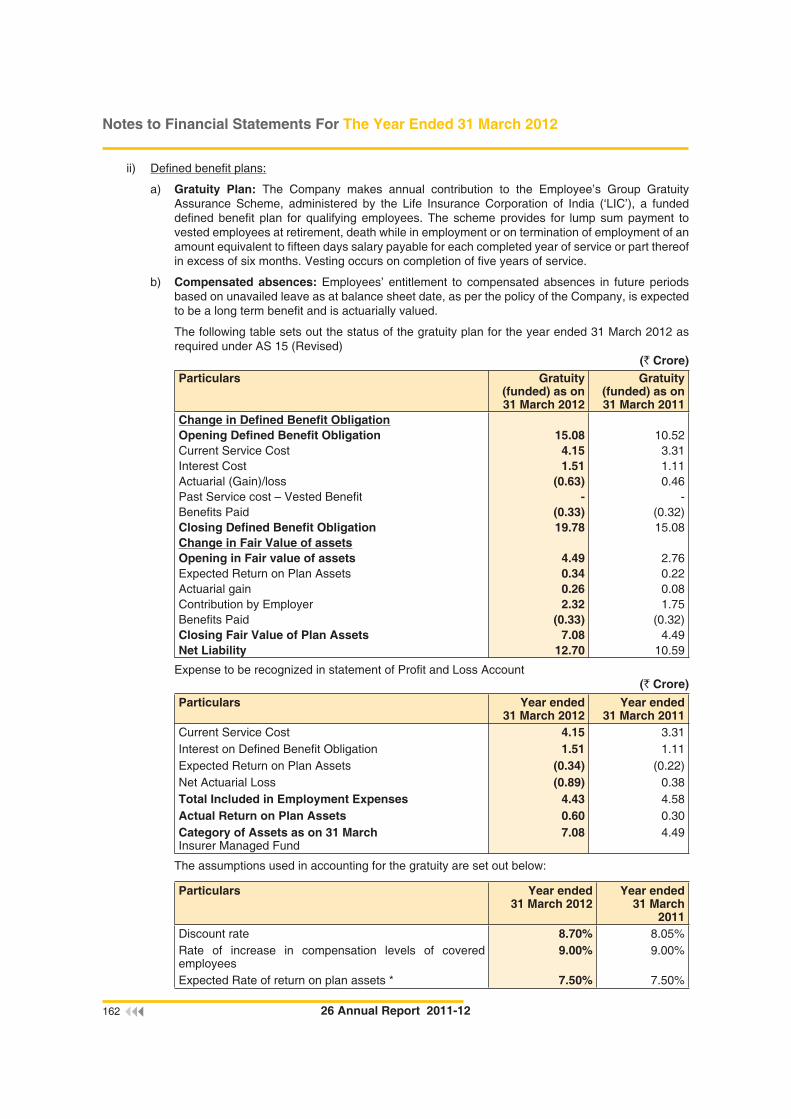
162 26 Annual Report 2011-12
ii) Defi ned benefi t plans:
a) Gratuity Plan: The Company makes annual contribution to the Employee’s Group Gratuity Assurance Scheme, administered by the Life Insurance Corporation of India (‘LIC’), a funded defi ned benefi t plan for qualifying employees. The scheme provides for lump sum payment to vested employees at retirement, death while in employment or on termination of employment of an amount equivalent to fi fteen days salary payable for each completed year of service or part thereof in excess of six months. Vesting occurs on completion of fi ve years of service.
b) Compensated absences: Employees’ entitlement to compensated absences in future periods based on unavailed leave as at balance sheet date, as per the policy of the Company, is expected to be a long term benefi t and is actuarially valued.
The following table sets out the status of the gratuity plan for the year ended 31 March 2012 as required under AS 15 (Revised)
(` Crore)Particulars Gratuity
(funded) as on 31 March 2012
Gratuity (funded) as on 31 March 2011
Change in Defi ned Benefi t ObligationOpening Defi ned Benefi t Obligation 15.08 10.52Current Service Cost 4.15 3.31Interest Cost 1.51 1.11Actuarial (Gain)/loss (0.63) 0.46Past Service cost – Vested Benefi t - -Benefi ts Paid (0.33) (0.32)Closing Defi ned Benefi t Obligation 19.78 15.08Change in Fair Value of assetsOpening in Fair value of assets 4.49 2.76Expected Return on Plan Assets 0.34 0.22Actuarial gain 0.26 0.08Contribution by Employer 2.32 1.75Benefi ts Paid (0.33) (0.32)Closing Fair Value of Plan Assets 7.08 4.49Net Liability 12.70 10.59
Expense to be recognized in statement of Profi t and Loss Account (` Crore)
Particulars Year ended 31 March 2012
Year ended 31 March 2011
Current Service Cost 4.15 3.31Interest on Defi ned Benefi t Obligation 1.51 1.11Expected Return on Plan Assets (0.34) (0.22)Net Actuarial Loss (0.89) 0.38Total Included in Employment Expenses 4.43 4.58Actual Return on Plan Assets 0.60 0.30Category of Assets as on 31 MarchInsurer Managed Fund
7.08 4.49
The assumptions used in accounting for the gratuity are set out below:
Particulars Year ended31 March 2012
Year ended 31 March
2011Discount rate 8.70% 8.05%Rate of increase in compensation levels of covered employees
9.00% 9.00%
Expected Rate of return on plan assets * 7.50% 7.50%
Notes to Financial Statements For The Year Ended 31 March 2012

INNOVATIVE TEXTILE SOLUTIONSINNOVATIVE TEXTILE SOLUTIONS
163Innovative Textile Solutions
* Expected rate of return on plan assets is based on expectation of the average long term rate of return expected to prevail over the estimated term of the obligation on the type of the investments assumed to be held by LIC, since the fund is managed by LIC. The estimates of future salary increases, considered in actuarial valuation, takes into account the infl ation, seniority, promotions and other relevant factors.
Experience Adjustments
(` Crore)
Particulars Year Ended31 March
201231 March
201131 March
201031 March
200931 March
2008Defi ned benefi t obligation 19.78 15.08 10.52 6.67 -Plan Assets 7.08 4.49 2.76 2.24 -Surplus / (Defi cit) (12.70) (10.59) (7.76) (4.43) -Experience Adjustments on plan Liabilities
1.09 (0.67) 0.16 - -
Experience Adjustments on plan Assets
0.26 0.08 0.07 - -
Asset Allocations
Since the investments are held in the form of deposit with LIC, these are not volatile and the market value of assets is the cost value of assets and has been accordingly considered for the above disclosure.
32 Segment Reporting
a) Primary Segment: Geographical Segment
The company is in the business of manufacturing of Textile products. Considering its high level of international operations and present internal fi nancial reporting based on geographical location of customer, the company has identifi ed geographical segment as primary segment.
The geographic segment consists of:
a) Domestic (Sales to Customers located in India)
b) International (Sales to Customers located outside India)
Revenue directly attributable to segments is reported based on items that are individually identifi able to that segment. The company believes that it is not practical to allocate segment expenses, segment results, assets used, except debtors, in the company’s business or liabilities contracted since the resources / services / assets are used interchangeably within the segments. Accordingly, no disclosure relating to same is made. All fi xed assets are located in India.
(` Crore)
Particulars Current Year
Previous Year
Segment RevenueOperating Revenue – Sales Domestic [Net of Excise duty of ` 233.95 crore (Previous year
`112.48 crores)]5,840.41 4,158.23
International 3,029.55 2,217.438,869.96 6,375.66
Job Charges Collected (Domestic) 30.90 12.77Total segment revenue 8,900.96 6,388.43Segment AssetsSundry Debtors Domestic 1,799.53 1,548.41 International 352.62 191.78
2,152.15 1,740.19
Notes to Financial Statements For The Year Ended 31 March 2012

164 26 Annual Report 2011-12
b) Secondary Segment: Business Segment
The company is operating in a single business i.e. Textile and as such all business activities revolve around this segment. Hence, there is no separate secondary segment to be reported considering the requirement of AS 17 on “Segment Reporting”
33 i. Due to unusual depreciation in the value of the Indian Rupee (INR) against US Dollar (USD) during the year, the exchange loss/ gain arising out of :
(i) Restatement of foreign currency liabilities/assets, and;
(ii) Mark to Market (MTM) losses on foreign exchange derivatives taken by the Company, has been presented as an exceptional item with corresponding changes for the previous year.
ii. The Company, during the year, based on the announcement of the ICAI (Accounting for derivatives), has accounted for derivative forward exchange contracts taken towards highly probable forecast transactions and fi rm commitments, at fair values considering the principles of recognition and measurement stated in AS-30 ‘Financial Instruments: Recognition and Measurement‘. Consequent upon such change, the profi t after tax for the year ended March 31, 2012 is higher by `16.78 crore and reserves and surplus are lower by an equivalent amount. Fair value (net loss) of the derivative instruments identifi ed as cash fl ow hedges is ` 16.78 crore as at March 31, 2012, which is expected to be reclassifi ed to the profi t and loss account over the next year.
iii. Fair values (Mark to market values) (loss) of Foreign currency options , Interest rate swaps and forward contracts (other than those considered for hedging) as at 31 March 2012 aggregating to ` 179.57 crore (previous year ` 72.96 crore) has been accounted for by the Company. Such fair values are based on the report of counter parties. MTM losses on such derivatives of ` 106.61 crore have been recognised during the year.
iv. Derivative contracts entered into by the company and outstanding as on 31 March 2012 for hedging currency and interest rate related risks. Nominal amounts of derivative contracts entered into by the company and outstanding as on 31 March 2012 amount to ` 3,477.99 Crore (previous year ` 2,841.73 Crore). Category wise break-up is given below.
(` Crore)
Sr. No. Particulars 31 March 2012 31 March 20111 Interest Rate Swaps
USD/INR 476.73 280.68JPY/INR 1,150.00 743.27EUR/INR 150.00 -
1,776.73 1,023.952 Currency Options * 1,201.21 1,342.263 Forward Contract 500.05 475.52
Total 3,477.99 2,841.73
* Represents monthly currency option for receivables, maturing over a period of 5 years
v. The year end foreign currency exposure that has not been hedged by derivative instruments or otherwise are as below :
a) Amount receivable in foreign currency on account of the following
Particulars Current Year Previous YearForeign
CurrencyAmount
in foreign currency
Rupees
(Crore)
Amount in foreign currency
Rupees
(Crore)Debtors USD - - 1.37 61.12
EUR 0.19 12.99 0.09 5.51GBP 0.00* 0.05 0.01 0.48
Fixed Deposits USD 0.65 33.50 - -
*GBP 6,647
Notes to Financial Statements For The Year Ended 31 March 2012

INNOVATIVE TEXTILE SOLUTIONSINNOVATIVE TEXTILE SOLUTIONS
165Innovative Textile Solutions
b) Amount Payable in foreign currency on account of the following
Particulars Current Year Previous Year
Foreign Currency
Amount in foreign currency
Rupees(Crore)
Amount in foreign currency
Rupees(Crore)
Secured Loans USD 27.69 1,416.91 21.49 959.31JPY 184.87 115.42 182.81 98.76
EUR 4.39 300.24 1.69 106.78
Interest accrued but not due on loans
USD
EUR
0.01
0.03
0.76
2.09
0.01
0.02
0.43
1.44Unsecured Loan USD 4.65 237.91 - -
JPY 2.06 1.29 - -
EUR 1.78 121.41 1.77 112.22
Sundry creditors USD 2.90 148.49 5.96 266.23JPY - - 4.31 2.33
EUR 0.06 3.82 0.02 0.97
CHF 0.00* 0.16 - -
*CHF 27,571
34 During the previous year, Deutsche Bank, Singapore Branch subscribed to unsecured fl oating rate compulsory convertible bonds issued by Alok Industries International Limited (“Alok BVI”) and Grabal Alok (UK) Ltd, a company incorporated in the United kingdom (subsidiary) of the company, of USD 56.5 million each, with a green shoe option of USD 25 million. These bonds are secured by subservient charge on current and movable assets of the company which was created by executing a Deed of Hypothecation on 28 October 2010 in favour of AXIS Trustee Services Limited, Mumbai, India.
35 During the year, the company has transferred investments in the form of equity capital and cumulative redeemable preference shares in Alok Industries International Ltd (“Alok BVI”) & Grabal Alok International Ltd (“Grabal BVI”), its two wholly owned subsidiary companies to Alok Infrastructure Limited (“Alok Infra”), another wholly owned subsidiary as a strategy to consolidate all investible assets under one umbrella. During the previous year, vide a novation agreement, the Company had taken over the obligation of Grabal Alok (UK) Ltd, (then an associate company of Alok BVI & Grabal BVI in the United Kingdom) towards its liability pertaining to a JPY/USD foreign currency derivative. Consequent to the sale of shares in Alok BVI and Grabal BVI to Alok Infra, Alok Infra has taken over such obligation of Alok Industries Ltd. during the current year.
36 During the year, the Honourable High Court, Bombay sanctioned the scheme of amalgamation (‘scheme’) between the Company (transferee) and Grabal Alok Impex Limited (transferor) with appointed date of 1 April 2011. Grabal Alok Impex is in the business of manufacturing embroidery textiles. The scheme has been effective from 1 March 2012.
The Company issued 2,24,85,000 equity shares of ` 10 each to shareholders of Grabal Alok Impex Limited (of which 19,00,000 shares were issued to Alok Benefi t Trust) considering exchange ratio of 1:1 as per the scheme. There were no signifi cant differences in accounting policies of two companies. The Company has accounted for such amalgamation under ‘pooling of interest’ method as under;
Particulars ` CroreCarrying value of Fixed assets (including CWIP ` 18.94 crore) 193.51
Carrying value of Investments (including ` 31.34 crore in Transferee company through Alok Benefi t Trust)
62.59
Inventories 46.00Debtors 37.50Cash & Bank balances 147.00Loans & Advances 16.85Total Assets 503.45
Notes to Financial Statements For The Year Ended 31 March 2012

166 26 Annual Report 2011-12
Current liabilities & Provisions 55.82Long term borrowings 113.15Short Term Borrowings 145.79Deferred Tax Liabilities 16.78Share warrants 20.40Total Liabilities 351.94
Shares issued 22.49Reserves taken over 129.02
Pursuant to the scheme, with effect from the Appointed Date up to and including the Effective Date, the transferor company is deemed to have been carrying on all business and activities in trust for Alok Industries Limited. Pending completion of relevant formalities of transfer of certain assets and liabilities pursuant to the Scheme, such assets and liabilities remain under the name of the Grabal Alok Impex Ltd.
On amalgamation of the Company and Grabal Alok Impex Ltd, Grabal Alok (UK) Ltd, an associate company of both companies, has now become a majority owned subsidiary of Alok Industries Ltd.
Current year fi gures of the Company include amount of revenue of ` 160.96 crore & profi t before tax of ` 7.58 crore for the year and hence are not strictly comparable.
37 In line with the amended Accounting Standard (AS) 11 – ‘Effect of changes in Foreign Exchange Rates’, the Company has chosen to exercise the option under paragraph 46 inserted in the Standard by the notifi cation.
i. Added to fi xed assets/ capital work-in-progress ` 114.47 crore (previous year ` 23.48 crore) being exchange difference on long term monetary items relatable to acquisition of fi xed assets.
ii. Carried forward ` 0.99 crore (previous year ` (0.22) crore) in the ‘Foreign Currency Monetary Item Translation Difference Account’ being the amount remaining to be amortised as at 31 March 2012.
38 Addition information
Sales for the year in broad heads
(` Crore)
Division 2011-12 2010-11a) Sale of Product
Cotton & Cotton yarn
Raw Cotton –Traded 117.48 429.78 Cotton Yarn 200.95 120.54 Cotton Yarn –Traded 3.84 2.85
322.27 553.17
Apparel Fabric
Woven Fabric 3,660.06 2,718.87 Woven Fabric –Traded 9.58 - Knitted Fabric 266.49 241.56 Embroidery Fabric 162.94 -
4,099.07 2,960.43
Home textile
Madeups 1,090.95 889.50 Terry Towel 159.46 110.61
1,250.41 1,000.11
Garment
Garments 153.09 93.18 Handkerchief 20.81 21.39 Accessories –Traded 43.40 59.49
Notes to Financial Statements For The Year Ended 31 March 2012

INNOVATIVE TEXTILE SOLUTIONSINNOVATIVE TEXTILE SOLUTIONS
167Innovative Textile Solutions
217.30 174.06
Polyester Yarn
Chips 749.00 158.90 POY 656.60 326.32 Texturised Yarn 1,310.02 1,146.25 FDY 470.59 142.55 Polyester Staple Fibre (PSF) 17.17 13.24 PTA –Traded - 13.11
3,203.38 1,800.37
Others
Packing Material 9.78 - Others 1.70 -
Total 9,103.91 6,488.14
Raw Material Consumption for the year in broad heads (` Crore)
Division 2011-12 2010-11
Cotton & Cotton yarn
Raw Cotton 766.94 456.55
Cotton Yarn 610.78 302.36
1,377.72 758.91
Apparel Fabric
Woven Fabric 1,498.11 1,038.67
Knitted Fabric 33.72 26.52
1,531.83 1,065.19
Polyester Yarn
PTA 2,767.75 1,352.79
Chips 28.58 24.52
POY 6.70 22.63
Melt 10.31 -
2,813.34 1,399.94
Others
Packing Material 25.45 -
Total 5,748.34 3,224.04
Purchase of Traded Goods for the year in broad heads (` Crore)
Division 2011-12 2010-11Cotton & Cotton yarnRaw Cotton 108.11 274.02Cotton Yarn 3.33 2.69
111.44 276.71Apparel FabricWoven Fabric 8.98 -GarmentAccessories 41.03 54.33Polyester YarnPTA –Traded - 11.58Total 161.45 342.62
Notes to Financial Statements For The Year Ended 31 March 2012

168 26 Annual Report 2011-12
Inventory of Work-in-progress as at 31 March 2012 in broad heads (` Crore)
Division 2011-12 2010-11Cotton & Cotton yarnCotton Yarn 33.65 27.77Apparel FabricWoven Fabric 1,850.98 686.02Knitted Fabric 5.80 7.24Embroidery Fabric 20.53 -
1,877.31 693.26Home textileMadeups 226.32 84.00Terry Towel 24.57 23.80
250.89 107.80GarmentGarments 14.51 12.80Handkerchief 3.16 1.36
17.67 14.16Polyester YarnChips 10.83 8.40POY 9.66 2.59Texturised Yarn 17.27 13.95FDY 0.83 0.63Polyester Staple Fibre (PSF) 0.06 0.21
38.65 25.78OthersPacking Material 2.60 -Total 2,220.77 868.77
39 (I) CIF VALUE OF IMPORTS (` Crore)
2011-12 2010-11 – Capital Goods purchased 749.95 399.33 – Stores & Spares purchased 68.33 47.31 – Raw Material purchased 1,281.58 939.55 – Packing Materials purchased 6.89 7.15
2,106.75 1,393.34
(ii) Expenditure in Foreign Currency (` Crore)
Nature of Expenses 2011-12 2010-11
Commission on sales 15.01 9.96
Interest on Fixed Loan 48.28 33.26
Legal and Professional Fees 17.03 1.74
Marketing service charges 12.98 8.84
Sales Promotion Expenses 3.49 10.25
Claim for damaged goods 4.66 2.96
Travelling expenses 1.28 0.11
Bank Charges 4.31 4.68
Notes to Financial Statements For The Year Ended 31 March 2012

INNOVATIVE TEXTILE SOLUTIONSINNOVATIVE TEXTILE SOLUTIONS
169Innovative Textile Solutions
Exchange Loss 68.98 94.37
Miscellaneous Expenses 10.00 7.16
Total 186.02 173.33
(iii) Value of raw materials, stores and spares consumed during the year.
(` Crore)2011-12 2010-11
Imported Indigenous Imported IndigenousValue % of Total
ConsumptionValue % of Total
Consumption Value % of Total
ConsumptionValue % of Total
ConsumptionRaw Materials 1,381.43 24.03% 4,366.91 75.97% 671.95 20.84% 2,552.09 79.16%
Stores and Spares 64.87 66.27% 33.02 33.73% 32.56 64.30% 18.07 35.70%
Packing Materials 6.89 5.28% 123.47 94.72% 7.15 8.86% 73.55 91.14%
(iv) Earning in Foreign Currency
(` Crore)
2011-12 2010-11
– FOB Value of Exports 2767.98 2032.34– Interest received on Fixed Deposits 0.18 0.06
(v) Dividend Remitted in Foreign Exchange
Year of Dividend 2011-12 2010-11Equity share
No. of shareholders 10.00 -No. of shares held by them 13,600.00 -Dividend remitted during the year (`) 3,400.00 -Year to which dividend relates F.Y. 2010-11 -
40 The Revised Schedule VI has become effective from 1 April, 2011 for the preparation of fi nancial statements. This has signifi cantly impacted the disclosure and presentation made in the fi nancial statements. Previous year’s fi gures have been regrouped / reclassifi ed wherever necessary to correspond with the current year’s classifi cation / disclosure.
Signatures to Notes 1 to 40In terms of our report attached For and on behalf of the BoardFor Deloitte Haskins & Sells For Gandhi & Parekh Ashok B. Jiwrajka Executive ChairmanChartered Accountants Chartered Accountants Dilip B. Jiwrajka Managing Director
Surendra B. Jiwrajka Jt. Managing DirectorR. D. Kamat Devang B. Parekh Sunil O. Khandelwal Chief Financial Offi cerPartner Partner K. H. Gopal President (Corporate Affairs) &
Company Secretary
Mumbai: 18 May 2012 Mumbai: 18 May 2012
Notes to Financial Statements For The Year Ended 31 March 2012

170 26 Annual Report 2011-12
SR
N
ON
AM
E O
F TH
E S
UB
SID
IAR
Y C
OM
PA
NY
Fina
ncia
l Y
ear t
o w
hich
ac
coun
ts
rela
te
Hol
ding
Com
pany
's in
tere
st a
s at
clo
se o
f fi n
anci
al
year
of s
ubsi
diar
y co
mpa
nyN
et a
ggre
gate
am
ount
of s
ubsi
diar
y co
mpa
ny's
pro
fi ts
afte
r ded
uctin
g its
lo
sses
or v
ice-
vers
a, d
ealt
with
in th
e C
ompa
ny's
acc
ount
Hol
ding
Com
pany
’s in
tere
st
as a
t Mar
ch 3
1, 2
012
inco
rpor
atin
g ch
ange
s si
nce
clos
e of
fi na
ncia
l yea
r of
subs
idia
ry c
ompa
ny
i) S
hare
hold
ing
ii) E
xten
t of
hol
ding
%
age
For t
he c
urre
nt fi
nanc
ial
year
` C
rore
sFo
r the
pr
evio
us
fi nan
cial
ye
ar `
C
rore
s
Ove
rsea
s
1A
lok
Inc
2011
-12
50 E
quity
Sha
res
of U
SD
200
eac
h10
0-
0.00
(los
s)N
.A.
2A
lok
Indu
strie
s In
tern
atio
nal L
imite
d20
11-1
250
000
Equ
ity s
hare
s of
US
D 1
eac
h10
044
.34
(loss
)70
.34
(loss
)N
.A.
3A
lok
Inte
rnat
iona
l Inc
2011
-12
1000
Equ
ity S
hare
s of
US
D 1
eac
h10
00.
29 (l
oss)
0.88
(los
s)N
.A.
4A
lok
Eur
opea
n R
etai
l, s.
r.o.
2011
-12
200
Equ
ity S
hare
of 1
000
CZK
Eac
h10
0-
0.07
(los
s)N
.A.
5M
ileta
a.s
2011
-12
1180
152
Equ
ity S
hare
of C
ZK 1
96 E
ach
100
8.77
(los
s)4.
54 (p
rofi t
)N
.A.
6A
lok
Sin
gapo
re P
te. L
td.
2011
-12
1 E
quity
Sha
re o
f US
D1
each
100
2.54
(los
s)-
N.A
.
7A
lok
Inte
rnat
iona
l (M
iddl
e E
ast)
FZE
2011
-12
1 E
quity
Sha
res
of A
ED
1,0
00,0
0010
00.
38 (l
oss)
-N
.A.
8G
raba
l Alo
k In
tern
atio
nal L
imite
d20
11-1
250
000
Equ
ity S
hare
s of
US
D 1
eac
h10
013
.78
(loss
)-
N.A
.
9G
raba
l Alo
k (U
K) L
imite
d20
11-1
251
4144
7240
ord
inar
y S
hare
s of
GB
P
0.00
1 ea
ch90
.43
151.
76 (l
oss)
-N
.A.
Dom
estic
1A
lok
Infra
stru
ctur
e Li
mite
d20
11-1
250
000
Equ
ity S
hare
s of
` 1
0 ea
ch10
015
.00
(loss
)2.
02 (p
rofi t
)N
.A.
2A
lok
App
arel
s P
rivat
e Li
mite
d20
11-1
210
0000
0 E
quity
Sha
res
of `
10
each
100
4.36
(los
s)5.
25 (l
oss)
N.A
.
3A
lok
Ret
ail (
Indi
a) L
imite
d20
11-1
250
000
Equ
ity S
hare
s of
` 1
0 ea
ch10
010
.92
(loss
)13
.23
(loss
)N
.A.
4A
lok
Rea
ltors
Priv
ate
Lim
ited
2011
-12
1750
000
Equ
ity S
hare
s of
` 1
0 ea
ch10
00.
06 (l
oss)
0.00
(los
s)N
.A.
5A
lok
Land
hold
ings
Priv
ate
Lim
ited
2011
-12
5000
00 E
quity
Sha
res
of `
10
each
100
0.11
(los
s)0.
00 (l
oss)
N.A
.
6A
lok
New
City
Infra
tex
Pvt
Ltd
2011
-12
5000
0 E
quity
Sha
res
of `
10
each
100
0.04
(los
s)0
(pro
fi t)
N.A
.
7A
lok
Aur
anga
bad
Infra
tex
Pvt
Ltd
2011
-12
5000
0 E
quity
Sha
res
of `
10
each
100
0.04
(los
s)0
(loss
)N
.A.
8A
lok
HB
Hot
els
Priv
ate
Lim
ited
2011
-12
5000
0 E
quity
Sha
res
of `
10
each
100
0.04
(los
s)0
(loss
)N
.A.
9A
lok
HB
Pro
perti
es P
rivat
e Li
mite
d20
11-1
250
000
Equ
ity S
hare
s of
` 1
0 ea
ch10
00.
04 (l
oss)
0 (lo
ss)
N.A
.
10K
esha
m D
evel
oper
s &
Info
tech
Pvt
.Ltd
2011
-12
2580
000
Equ
ity S
hare
s of
` 1
0 ea
ch10
03.
29 (p
rofi t
)0.
68 (p
rofi t
)N
.A.
11S
prin
gdal
e In
form
atio
n &
Tec
hnol
ogy
Pvt
. Ltd
.20
11-1
260
0000
Equ
ity S
hare
s of
` 1
0 ea
ch10
00.
17 (l
oss)
0.03
(los
s)N
.A.
12A
lok
H&
A L
imite
d20
11-1
236
0500
00 E
quity
Sha
res
of `
10 e
ach
100
26.3
7 (lo
ss)
2.17
(los
s)N
.A.
ST
AT
EM
EN
T P
UR
SU
AN
T T
O E
XE
MP
TIO
N R
EC
EIV
ED
UN
DE
R S
EC
TIO
N 2
12(3
) AN
D 2
12(5
) OF
TH
E C
OM
PA
NIE
S A
CT
,195
6 R
EL
AT
ING
T
O S
UB
SID
IAR
Y C
OM
PA
NIE
S

INNOVATIVE TEXTILE SOLUTIONSINNOVATIVE TEXTILE SOLUTIONS
171Innovative Textile Solutions
Sr.
N
o.
Nam
e o
f th
e su
bsi
dia
ryC
apit
alR
eser
veT
ota
l A
sset
sT
ota
l L
iab
iliti
esIn
vest
men
t (O
ther
th
an
inve
stm
ent
in
Su
bsi
dia
ries
)
Tu
rno
ver
Pro
fi t
bef
ore
T
ax
Pro
visi
on
fo
r ta
xP
rofi
t af
ter
tax
Pro
po
sed
D
ivid
end
1A
lok
Indu
strie
s In
tern
atio
nal L
imite
d@ 0
.22
(17
4.03
)95
7.59
1,1
31.4
0 6
83.6
1 –
(44
.34)
– (
44.3
4) –
2A
lok
Infr
astr
uctu
re L
imite
d 0
.05
(7.
73)
1,24
7.41
1,2
55.0
910
50.2
8 1
91.8
2 (
1.54
)13
.46
(15
.00)
–
3A
lok
HB
Pro
pert
ies
Priv
ate
Lim
ited
$ 0
.05
(0.
05)
– –
– –
(0.0
4) –
(0.0
4) –
4A
lok
HB
Hot
els
Priv
ate
Lim
ited
$ 0
.05
(0.
05)
– –
– –
(0.0
4) –
(0.0
4) –
5A
lok
Rea
ltors
Priv
ate
Lim
ited
1.7
5 (
0.39
)1,
456.
89 1
,455
.53
– –
(0.
06)
– (
0.06
) –
6K
esha
m D
evel
oper
s &
Info
tech
Pvt
. Ltd
2.5
8 5
.89
17.
71 9
.24
– –
4.24
0.95
3.29
–
7S
prin
gdal
e In
form
atio
n &
Tec
hnol
ogy
Pvt
. Lt
d. 0
.60
0.0
3 1
.34
0.7
1 –
–(0
.17)
–(0
.17)
–
8A
lok
Land
hol
ding
s P
rivat
e Li
mite
d 0
.50
(0.
33)
24.
92 2
4.75
– –
(0.
11)
– (
0.11
) –
9A
lok
New
City
Infr
atex
Priv
ate
Lim
ited
$ 0
.05
(0.
05)
– –
– –
(0.0
4) –
(0
.04)
–
10A
lok
Aur
anga
bad
Infr
atex
Priv
ate
Lim
ited
$ 0
.05
(0.
05)
– –
– –
(0.0
4) –
(0.0
4) –
11M
ileta
, a.s
.^ *
* 6
4.54
(5.
18)
146
.92
87.
57 –
129
.67
(8.
77)
– (
8.77
) –
12A
lok
Eur
opea
n R
etai
l, s.
r.o.
^ *
* 0
.06
(0.
69)
0.0
2 0
.66
– –
– –
–
–
13A
lok
Ret
ail (
Indi
a) L
imite
d 0
.05
(35
.39)
54.
43 8
9.77
– 2
9.26
(10
.92)
– (
10.9
2) –
14A
lok
App
arel
s P
rivat
e Li
mite
d 1
.00
(17
.80)
42.
68 5
9.47
–15
.24
(6.5
7)(2
.21)
(4.3
6) –
15A
lok
Inte
rnat
iona
l Inc
.@ (`
43.2
25/-
) 0
.00
(0.
04)
90.5
8 9
0.61
4.4
7 1
42.3
3 (
0.29
) –
(0.
29)
–
16A
lok
Inc.
@**
0.0
4 0
.17
0.2
5 0
.04
– –
– –
– –
17A
lok
Sin
gapo
re P
te L
td.@
** (`
49/-
) 0
.00
(2.
54)
283
.49
286
.03
– 2
6.49
(2.
54)
– (
2.54
) –
18A
lok
Inte
rnat
iona
l (m
iddl
e ea
st)
FT
Z #
** 1
.31
(0.
38)
1.5
9 0
.66
– –
(0.
38)
– (
0.38
) –
19G
raba
l Alo
k (U
K)
Lim
ited
** r
efer
not
e no
39
(b)
4.6
5 (
174.
49)
649
.62
819
.46
– 7
59.1
6 (
151.
76)
– (
151.
76)
–
20G
raba
l Alo
k In
tern
atio
nal L
imite
d re
fer
note
no
39
(a)
72.7
0 (
17.6
2) 3
77.0
132
1.92
333
.53
– (
13.7
8) –
(13
.78)
–
21A
lok
H&
A L
imite
d **
36.
05 (
34.7
3) 1
24.7
0 1
23.3
8 0
.01
46.
60 (
26.3
7) –
(26
.37)
–
@ B
alan
ce s
heet
item
s ar
e tr
ansl
ated
at c
losi
ng e
xcha
nge
rate
of I
NR
51.
16/U
SD
and
Pro
fi t/(
Loss
) ite
ms
are
tran
slat
ed a
t ave
rage
clo
sing
rat
e of
INR
47.
95/U
SD
# B
alan
ce s
heet
item
s ar
e tr
ansl
ated
at c
losi
ng e
xcha
nge
rate
of I
NR
2.7
9/C
ZK
and
Pro
fi t/(
Loss
) ite
ms
are
tran
slat
ed a
t ave
rage
clo
sing
rat
e of
INR
2.6
7/C
ZK
$ Li
quid
ated
dur
ing
the
year
# B
alan
ce s
heet
item
s ar
e tr
ansl
ated
at c
losi
ng e
xcha
nge
rate
of I
NR
14.
11/A
ED
and
Pro
fi t/(
Loss
) ite
ms
are
tran
slat
ed a
t ave
rage
clo
sing
rat
e of
INR
13.
55/A
ED
* In
clud
ing
Sha
re A
pplic
atio
n M
oney
** U
naud
ited
fi gur
es
Notes to Financial Statements For The Year Ended 31 March 2012F
INA
NC
IAL
INF
OR
MA
TIO
N R
EL
AT
ING
TO
SU
BS
IDIA
RY
CO
MP
AN
IES
FO
R T
HE
YE
AR
EN
DE
D 3
1ST
MA
RC
H 2
012

172 26 Annual Report 2011-12
TO THE BOARD OF DIRECTORS OFALOK INDUSTRIES LIMITED1. We have audited the attached Consolidated Balance Sheet of ALOK INDUSTRIES LIMITED (“the
Company”) and its subsidiaries (collectively referred to as “the Group”) as at 31st March 2012, the Consolidated Statement of Profi t and Loss and the Consolidated Cash Flow Statement for the year ended on that date, both annexed thereto. These fi nancial statements are the responsibility of the Company’s Management and have been prepared on the basis of the separate fi nancial statements and other fi nancial information regarding components. Our responsibility is to express an opinion on these Consolidated Financial Statements based on our audit.
2. We conducted our audit in accordance with the auditing standards generally accepted in India. These Standards require that we plan and perform the audit to obtain reasonable assurance about whether the fi nancial statements are free of material misstatements. An audit includes examining, on a test basis, evidence supporting the amounts and the disclosures in the fi nancial statements. An audit also includes assessing the accounting principles used and the signifi cant estimates made by the Management, as well as evaluating the overall fi nancial statement presentation. We believe that our audit provides a reasonable basis for our opinion.
3. Without qualifying our opinion, we draw attention to note no. 39 (b) of the fi nancial statements regarding goodwill recognised on consolidation of Grabal Alok (UK) Limited during the year. For the reasons stated therein, no provision for impairment is considered necessary at this stage.
4. Financial statements of certain Subsidiaries, which refl ect total assets of ` 184.41 crore as at 31st March, 2012, total revenue of `155.98 crore and net cash infl ows amounting to ` 254.15 crore for the year then ended, as considered in the Consolidated Financial Statements, have been audited by one of us.
5. We did not audit the fi nancial statements of certain Subsidiaries, whose fi nancial statements refl ect total assets of ` 1865.17 crore as at 31st March 2012, total revenues of ` 94.93 crore and net cash outfl ows amounting to ` 42.84 crore for the year ended on that date, as considered in the Consolidated Financial Statements. These fi nancial statements have been audited by other auditors whose reports have been furnished to us and our opinion in so far as it relates to the amounts included in respect of these Subsidiaries is based solely on the reports of the other auditors.
6. We have relied on the unaudited fi nancial statements of Subsidiaries and Joint Venture companies, whose fi nancial statements refl ect total assets of ` 706.03 crore as at 31st March 2012, total revenue of ` 1085.91 crore and net cash infl ows amounting to ` 364.24 crore for the year ended on that date and fi nancial statements of Associate companies in which the share of profi t of the Group is ̀ 0.08 crore, as considered in the Consolidated Financial Statements. These unaudited fi nancial statements as approved by the respective Board of Directors of the companies have been furnished to us by the Management and our report in so far as it relates to the amounts included in respect of the Subsidiaries, Joint Venture companies and Associate companies is based solely on such approved unaudited fi nancial statements.
7. We report that the Consolidated Financial Statements have been prepared by the Company in accordance with the requirements of Accounting Standard 21 (Consolidated Financial Statements), Accounting Standard 23 (Accounting for Investment in Associates in Consolidated Financial Statements) and Accounting Standard 27 (Financial Reporting of Interests in Joint Ventures) as notifi ed under the Companies (Accounting Standards) Rules, 2006.
8. Based on our audit and on consideration of the separate audit reports on individual fi nancial statements of the Company and certain subsidiaries and on the other fi nancial information of the components and to the best of our information and according to the explanations given to us, in our opinion, the Consolidated Financial Statements, read with para 6 above, give a true and fair view in conformity with the accounting principles generally accepted in India:
a. in the case of the Consolidated Balance Sheet, of the state of affairs of the Group as at 31st March, 2012;b. in the case of the Consolidated Statement of Profi t and Loss, of the profi t of the Group for the year ended
on that date andc. in the case of the Consolidated Cash Flow Statement, of the cash fl ows of the Group for the year ended
on that date.
For Deloitte Haskins & SellsChartered AccountantsFirm Registration No. 117366W
R. D. KamatPartnerMembership No.36822 Place : MumbaiDate : 18 May 2012
For Gandhi & ParekhChartered Accountants
Firms Registration No. 120318W
Devang B. ParekhPartner
Membership No. 105789
Auditors’ Report on The Consolidated Financial Statements

INNOVATIVE TEXTILE SOLUTIONSINNOVATIVE TEXTILE SOLUTIONS
173Innovative Textile Solutions
Consolidated Financial Statements

174 26 Annual Report 2011-12
In terms of our report attached For and on behalf of the Board
For Deloitte Haskins & Sells For Gandhi & Parekh Ashok B. Jiwrajka Executive Chairman
Chartered Accountants Chartered Accountants Dilip B. Jiwrajka Managing Director
Surendra B. Jiwrajka Jt. Managing Director
R. D. Kamat Devang B. Parekh Sunil O. Khandelwal Chief Financial Offi cer
Partner Partner K. H. Gopal President (Corporate Affairs) & Company Secretary
Date: 18 May 2012 Date: 18 May 2012
(` Crore)
PARTICULARS NOTES AS AT31-Mar-12
AS AT31-Mar-11
I EQUITY AND LIABILITIES Shareholders' Funds Share Capital 2 826.28 787.79 Reserves and Surplus 3 2,034.09 2,004.27 Minority Interest – 4.62 Non-current Liabilities Long-term Borrowings 4 8,516.96 7,164.48 Deferred Tax Liabilities (net) 5 627.07 507.84 Long-term provisions 6 176.71 79.64 Current Liabilities Short-term Borrowings 7 5,340.01 3,695.97 Trade payables 8 605.23 594.93 Other current liabilities 9 2,908.52 1,563.20 Short-term provisions 10 119.47 72.93
TOTAL 21,154.34 16,475.67 II ASSETS
Non-current Assets Fixed assets Tangible assets 11 8,811.20 7,470.27 Intangible assets 11 41.00 43.58 Capital work-in-progress 11 924.38 899.98 Goodwill on Consolidation 606.27 156.42 Non-current Investments 12 1,589.42 1,689.98 Deferred tax assets (net) 5 9.02 7.54 Long-term Loans & Advances 13 390.32 440.11 Current Assets Current Investments 14 3.94 27.41 Inventories 15 3,697.12 2,149.88 Trade receivables 16 2,204.00 1,814.20 Cash & Bank Balances 17 1,397.80 1,200.91 Short-term Loans & Advances 18 1,364.06 439.01 Other current assets 19 115.81 136.38
TOTAL 21,154.34 16,475.67III Signifi cant accounting policies and
accompanying notes forming part of the fi nancial statements
1 to 44
Consolidated Balance Sheet as at 31 March 2012

INNOVATIVE TEXTILE SOLUTIONSINNOVATIVE TEXTILE SOLUTIONS
175Innovative Textile Solutions
In terms of our report attached For and on behalf of the Board
For Deloitte Haskins & Sells For Gandhi & Parekh Ashok B. Jiwrajka Executive Chairman
Chartered Accountants Chartered Accountants Dilip B. Jiwrajka Managing Director
Surendra B. Jiwrajka Jt. Managing Director
R. D. Kamat Devang B. Parekh Sunil O. Khandelwal Chief Financial Offi cer
Partner Partner K. H. Gopal President (Corporate Affairs) & Company Secretary
Date: 18 May 2012 Date: 18 May 2012
(` Crore)
PARTICULARS NOTES Year Ended31-Mar-12
Year Ended31-Mar-11
REVENUE Revenue from Operations (gross) 20 10,018.67 6,727.38 Less : Excise Duty 233.95 112.48Revenue from Operations (net) 9,784.72 6,614.90 Other Income 21 95.51 67.07Total Revenue 9,880.23 6,681.97EXPENSES Cost of Materials consumed 5,793.09 3,261.84 Purchase of Traded Goods 1,117.20 468.99 Changes in inventories of fi nished goods, work-in-
progress and stock-in-trade 22 (1,692.18) (267.67)
Employee benefi ts expense 23 312.84 244.22 Finance costs 24 1,234.70 782.15 Depreciation and amortisation expense 11 749.14 530.97 Other expenses 25 1,877.36 1,120.36Total 9,392.15 6,140.86Profi t before exceptional items and tax 488.08 541.11Exceptional items (Refer note no 42(i)) 121.27 39.87Profi t before tax 366.81 501.24Tax Expenses– Current tax (172.93) (81.16) Includes MAT adjustment ` 44.12 crore (` 26.53 crore
pertaining to the previous year (previous year ` 42.42 crore))
– Deferred tax (100.97) (97.34)Total Tax expenses (273.90) (178.50)Profi t for the year before minority interest and share of profi t /(loss) from associates
92.91 322.74
Share of profi t/(loss) from Associates 0.08 (10.89) Minority Interest – (0.31)Net Profi t for the year 92.99 311.54EARNINGS PER SHARE (in `) 34 Basic 1.15 3.95 Diluted 1.15 3.95Signifi cant accounting policies and accompanying notes forming part of the fi nancial statements
1 to 44
Consolidated Statement of Profi t and Loss For The Year Ended 31 March 2012

176 26 Annual Report 2011-12
(` Crore)
PARTICULARS Year Ended 31-Mar-12
Year Ended31-Mar-11
A] Cash Flow from Operating Activities Net Profi t Before Tax 366.81 501.24 Adjustments for: Depreciation / Amortisation 749.14 530.97 Diminution in the value of investment 8.88 16.88 Employee Stock Option outstanding 2.27 – Exchange rate difference 8.99 (6.34) Dividend Income (0.60) (0.36) Interest Expense (net) 1,108.77 668.26 (Profi t)/Loss on sale of fi xed assets (net) (34.88) 0.03 Loss/(Profi t) on sale of current investments (net) 0.12 (1.16) Operating Profi t before working capital changes 2,209.50 1,709.52 Adjustments for (Increase) in Inventories (1,381.63) (599.29) (Increase) in Trade Receivables (283.39) (687.74) (Increase)/Decrease in Loans and Advances (958.63) 123.87 (Decrease)/Increase in Current Liabilities 93.09 478.43 Cash (used) in/generated from operations (321.06) 1,024.79 Income Taxes Paid (129.40) (128.45) Net cash (used) in/generated from Operating Activities (450.46) 896.34B] Cash fl ow from Investing Activities Purchase of Fixed Assets (1,551.10) (2,340.79) Proceeds from sale of fi xed assets 49.40 14.05 Purchase of Investments (341.57) (214.13) Proceeds from sale of Investments 135.57 127.24 Fixed Deposits and earmarked balances matured/(placed) 236.57 (318.04) Dividends Received 0.60 0.36 Interest Received 35.86 62.04 Share Application money paid – (0.16) Inter Corporate Deposits granted (4.49) (3.44) Net cash (used) in Investing Activities (1,439.16) (2,672.87)C] Cash fl ow from Financing Activities Proceeds from issue of Equity Share Capital (including premium)
(Net) 61.19 –
Share Application money received/(repaid) (Net) 350.00 (227.57) Proceeds from Term borrowings 2,430.53 4,144.40 Repayment of Term Borrowings (954.59) (2,751.40) Proceeds from short term borrowings (Net) 1,428.24 898.48 Dividend Paid (Including Tax thereon) (24.52) (23.33) Interest Paid (1,130.38) (791.85) Net cash Generated from Financing Activities 2,160.47 1,248.73 Net Increase/(decrease) in Cash and Cash equivalents (A+B+C) 270.85 (527.80) Cash and Cash equivalents at the beginning of the Year 165.98 693.78 Cash and Cash equivalents pursuant to amalgamation 158.62 – (Refer note no 39) Cash and Cash equivalents at the end of the Year 595.45 165.98
Consolidated Cash Flow Statement For The Year Ended 31 March 2012

INNOVATIVE TEXTILE SOLUTIONSINNOVATIVE TEXTILE SOLUTIONS
177Innovative Textile Solutions
Cash and cash equivalents
1 Purchase of fi xed assets are stated inclusive of movements of Capital Work in Progress between the commencement and end of the year and is considered as part of investing activity.
2 Cash and Cash equivalents includes :(` Crore)
31 March 2012 March 31, 2011Cash and Bank Balances (Refer note no 17) 1,397.80 1,200.91Less : Earmarked balances/deposits with bank* 715.19 981.69Less : Deposit with maturity period of more than 3 months ** 87.16 53.24Total Cash and Cash equivalents 595.45 165.98
* Earmarked balances/deposits with bank includes balances/deposits held as margin money or security against borrowings, guarantees and other commitments, which being restricted for its use, have been excluded from cash and cash equivalent and grouped under the investing activity.
** Fixed Deposits with maturity period of more than three months have been excluded from cash and cash equivalent and grouped under the investing activity.
3 The Cash Flow Statement has been prepared in accordance with the requirements of Accounting Standard 'AS-3' “Cash Flow Statements”.
4 Pursuant to scheme of amalgamation between Alok Industries Limited and Grabal Alok Impex Limited with appointed date of 1 April 2011, the assets and liabilities of Grabal Alok Impex Limited were taken over as per Pooling of Interest method as on 1 April 2011.
This arrangement of amalgamation is a non-cash transaction and considered as such, in the above cash fl ow statement. (Refer note no 39(a) of the fi nancial statements)
5 Previous year's fi gures have been regrouped/restated wherever necessary.
Consolidated Cash Flow Statement For The Year Ended 31 March 2012

178 26 Annual Report 2011-12
1 SIGNIFICANT ACCOUNTING POLICIES
i Basis of Preparation of Financial Statements
These consolidated fi nancial statements of Alok Industries Limited (“the Parent Company”) and its Subsidiaries, Joint Ventures and Associate Companies, (together the “Group” or “the Company”) have been prepared under the historical cost convention in accordance with the requirements of the Companies Act, 1956 and generally accepted accounting principles in India.
ii Principles of Consolidation
The fi nancial statements of Subsidiary companies, Joint Venture companies and associate companies used in consolidation are drawn up to the same reporting date as that of the Parent Company. The consolidated fi nancial statements have been prepared on the following basis :
a) The fi nancial statements of the Parent Company and its subsidiary companies are combined on a line-by-line basis by adding together the book values of like items of assets, liabilities, income and expenses, after eliminating intra-group balances, intra-group transactions resulting in unrealised profi t or losses as per Accounting Standard (AS) 21 “Consolidated Financial Statements” as notifi ed by the Company (Accounting Standards) Rules 2006. The Financial Statements have been prepared using uniform accounting policies for like transactions and other events in similar circumstances.
b) The excess of cost to the Company of its investment in subsidiary companies over its share of equity of the subsidiary companies at the dates, on which the investments in the subsidiary companies are made, is recognised as “Goodwill” being an asset in the consolidated fi nancial statements. Alternatively, where the share of equity in the subsidiary companies as on the date of investment is in excess of cost of investment of the Company, it is recognised as “Capital Reserve” and shown under the head ‘Reserves & Surplus’, in the consolidated fi nancial statements.
c) Minority Interest in the net assets of consolidated subsidiaries consist of the amount of equity attributable to the minority shareholders at the dates on which investments are made by the Company in the subsidiary companies and further movements in their share in the equity, subsequent to the dates of investments.
d) The Financial Statements of the Joint Venture entities have been considered on a line by line basis by adding together the book value of like items of assets, liabilities, income and expenses, after eliminating intra-group balances and intra-group transactions resulting in unrealised profi t or losses, by using “proportionate consolidation” method. The investment in Joint Venture entities over the holding company’s portion of equity is recognised as a capital reserve/goodwill, as per Accounting Standard 27 on “Financial Reporting of Interest in Joint Venture” as notifi ed by the Company (Accounting Standards) Rules 2006.
e) The consolidated fi nancial statements include the share of profi t / loss of associate companies in which the investor has signifi cant infl uence and which is neither a subsidiary nor a joint venture, which are accounted under the “Equity Method” as per which the share of profi t of the associate Company has been added to the cost of investment, and its share of pre-acquisition profi ts/losses is refl ected as Capital Reserve/Goodwill in the carrying value of Investment in accordance with Accounting Standard 23 on Accounting for Investment in Associates in Consolidated Financial Statement as notifi ed by Company (Accounting Standards) Rules 2006.
iii Use of Estimates
The preparation of fi nancial statements in conformity with the generally accepted accounting principles require estimates and assumptions to be made that affect the reported amounts of assets and liabilities on the date of the fi nancial statements and the reported amounts of revenues and expenses during the reporting period. Differences between the actual results and estimates are recognised in the period in which the results are known / materialise.
iv Revenue Recognition
a) Revenue on sale of products is recognised when the products are dispatched to customers, all signifi cant contractual obligations have been satisfi ed and the collection of the resulting receivable is reasonably expected. Sales are stated net of trade discount, returns and sales tax collected.
Notes To Consolidated Financial Statements For The Year Ended 31 March 2012

INNOVATIVE TEXTILE SOLUTIONSINNOVATIVE TEXTILE SOLUTIONS
179Innovative Textile Solutions
b) Revenue from construction contracts is recognised by adopting “Percentage Completion Method”. It is stated on the basis of physical measurement of work actually completed at the balance sheet date, taking into account contract price and revision thereto.
c) Revenue in respect of insurance / other claims, interest etc. is recognised only when it is reasonably certain that the ultimate collection will be made.
v Fixed Assets
a) Own Assets :
Fixed Assets are stated at cost of acquisition or construction including directly attributable cost. They are stated at historical cost less accumulated depreciation and impairment loss, if any.
b) Assets taken on lease:
• Operating Lease:
Assets taken on lease under which, all the risk and rewards of ownership are effectively retained by the lessor are classifi ed as operating lease. Lease rentals under operating leases are recognised as expenses over the lease term in accordance with the respective lease agreements.
c) Assets given on lease:
Lease rentals are recognised as income over the lease term.
vi Investments
Investments classifi ed as Long Term Investments are stated at cost. Provision is made to recognise a decline, other than temporary, in the value of investments. Current investments are carried at cost or fair value whichever is lower.
vii Depreciation / Amortisation
a) Depreciation on Fixed Assets is provided on Straight Line Method at the rates and in the manner specifi ed in Schedule XIV to the Companies Act, 1956. Continuous process plant is classifi ed based on technical assessment and depreciation is provided accordingly. Depreciation on additions to assets or on sale / disposal of assets is calculated from the beginning of the month of such addition or up to the month of such sale / scrapped, as the case may be. Assets costing less than ` 5,000/ – are fully depreciated in the year of purchase.
b) Cost of leasehold land is amortised over the period of lease.
c) Trademarks / Brands are amortised over the period of ten years from the date of capitalisation.
d) Computer Software is amortised over the period of fi ve years from the date of capitalisation.
e) Goodwill on consolidation is not amortised, but is tested for impairment at each balance sheet date and impairment loss, if any, is provided for.
viii Foreign Currency Transactions and Translation
a) Foreign currency transactions are recorded at the exchange rates prevailing on the date of the transaction. Exchange differences arising on settlement of foreign currency transactions are recognised in the profi t and loss account.
b) Monetary items denominated in foreign currency are restated using the exchange rate prevailing at the balance sheet date and the resultant exchange differences are recognised in the profi t and loss account. Non-monetary items denominated in foreign currency are carried at historical cost.
However, pursuant to the amended Accounting Standard 11 on The Effects of Changes in Foreign Exchange Rates, exchange differences arising on restatement of long term monetary items are dealt with in the following manner :
i. Exchange differences relating to long-term monetary items, arising during the year, in so far as those relate to the acquisition of a depreciable capital asset are added to / deducted from the cost of the asset and depreciated over the balance life of the asset.
Notes To Consolidated Financial Statements For The Year Ended 31 March 2012

180 26 Annual Report 2011-12
ii. In other cases such differences are accumulated in a “Foreign Currency Monetary Item Translation Difference Account” and amortised to the profi t and loss account over the balance life of the long-term monetary item, however that the period of amortisation does not extend beyond 31 March, 2020.
FOREIGN OPERATIONS :
The translation of the fi nancial statements of non integral foreign operations is accounted for as under :
a) All Expenses and Revenues are translated at average rate.
b) All monetary and non monetary assets and liabilities are translated at rate prevailing at the balance sheet date.
c) Resulting exchange difference is accumulated in Foreign Currency Translation Reserve account until the disposal of net investment in the said non integral foreign operation.
ix Inventories
Items of Inventories are valued on the basis given below:
a) Raw Materials, Packing Materials, Stores and Spares and Trading goods: at cost determined on First – In – First – Out (FIFO) basis or net realisable value, whichever is lower.
b) Process stock and Finished Goods: At cost or net realisable values whichever is lower. Cost comprises of cost of purchase (as above), cost of conversion (absorption cost) and other costs incurred in bringing the inventory to their present location and condition.
x Employee Benefi ts (Refer note no. 35)
a) Defi ned Contribution Plan
Company’s contribution paid / payable for the year to defi ne contribution retirement benefi t scheme is charged to Profi t and Loss account.
b) Defi ned Benefi t Plan and other long term benefi t plan
Company’s liabilities towards defi ned benefi t scheme are determined using the projected unit credit method. Actuarial valuation under projected unit credit method are carried out at Balance Sheet date, Actuarial gains/losses are recognised in Profi t and Loss Account in the period of occurrence of such gains and losses. Past service cost is recognised immediately to the extent benefi ts are vested otherwise it is amortised on straight line basis over running average periods until the benefi ts become vested. The retirement benefi t obligation is recognised in Balance Sheet represents present value of the defi ned benefi t obligations as adjusted for unrecognised past service cost and as reduced by fair value of scheme assets. Any asset resulting from this calculation is limited to past service cost, the present value is available refunds and reduction in future contribution to the scheme.
c) Short Term Employee Benefi ts
Short term employee benefi ts are recognised as an expense at undiscounted amount in profi t and loss account of the year in which the related service is rendered. These benefi ts include incentive, bonus.
xi Accounting of CENVAT credit
Cenvat credit available is accounted by recording material purchases net of excise duty. Cenvat credit availed is accounted on adjustment against excise duty payable on dispatch of fi nished goods.
xii Government Grants
Grants, in the nature of interest / capital subsidy under the Technology Upgradation Fund Scheme (TUFS), are accounted for when it is reasonably certain that ultimate collection will be made. Government grants not specifi cally related to fi xed assets are recognised in the Profi t and Loss Account in the year of accrual / receipt.
Notes to Consolidated Financial Statements For The Year Ended 31 March 2012

INNOVATIVE TEXTILE SOLUTIONSINNOVATIVE TEXTILE SOLUTIONS
181Innovative Textile Solutions
xiii Borrowing Costs
Borrowing costs that are attributable to the acquisition or construction of qualifying assets are capitalised as part of the cost of such assets. A qualifying asset is one that necessarily takes a substantial period of time to get ready for its intended use or sale. All other borrowing costs are charged to revenue.
xiv Income taxes
Tax expense comprises of current tax and deferred tax. Current tax and deferred tax are accounted for in accordance with Accounting Standard 22 (AS-22) on “Accounting for taxes on Income”. Current tax is measured at the amount expected to be paid / recovered from the tax authority using the applicable tax rates. Deferred tax liabilities are recognised for future tax consequence attributable to timing difference between taxable income and accounting income that are capable of reversing in one or more subsequent periods and are measured at relevant enacted/ substantively enacted tax rates and in the case of deferred tax asset on consideration of prudence, are recognised and carried forward to the extent of reasonable / virtual certainty as case may be. At each balance sheet date, the Company reassesses unrealised deferred tax assets to the extent they become reasonably certain or virtually certain of realisation, as the case may be. Minimum Alternate Tax (MAT) credit entitlement is recognised in accordance with the Guidance Note on “Accounting for credit available in respect of Minimum Alternate Tax under the Income-tax Act, 1961” issued by ICAI.
xv Intangible Assets
Intangible assets are recognised only if it is probable that the future economic benefi ts that are attributable to the assets will fl ow to the enterprise and the cost of the assets can be measured reliably. The intangible assets are recorded at cost and are carried at cost less accumulated amortisation and accumulated impairment losses, if any.
xvi Impairment of Fixed Assets
At the end of each year, the Company determines whether a provision should be made for impairment loss on fi xed assets by considering the indications that an impairment loss may have occurred in accordance with Accounting Standard (AS) 28 ‘’Impairment of Assets’’. An impairment loss is charged to the Profi t and Loss Account in the year in which, an asset is identifi ed as impaired, when the carrying value of the asset exceeds its recoverable value. The impairment loss recognised in prior accounting periods is reversed if there has been a change in the estimate of recoverable amount.
xvii Provisions, Contingent Liabilities and Contingent Assets
Provisions involving substantial degree of estimation in measurement are recognised when there is a present obligation as a result of past events and it is probable that there will be an outfl ow of resources. Contingent liabilities are not recognised but are disclosed in the Notes. Contingent Assets are neither recognised nor disclosed in the fi nancial statements.
xviii Accounting for Derivatives
a) The company uses derivative instruments like foreign currency forward contracts, foreign currency options and Interest rate swaps to hedge its exposure to movements in foreign exchange rates, interest rates and currency risks. The objective of these derivative instruments is to reduce the risk or cost to the company and is not intended for trading or speculation purposes.
b) Interest Rate Swaps, Foreign Currency Options and Currency Swaps, entered into by the Company for hedging the risks of foreign currency exposure (including interest rate risk) are accounted based on the principles of prudence as enunciated in Accounting Standard 1 (AS-1) “Disclosure of Accounting Policies”. Thus, Mark to Market losses (net) are accounted for by the company, net gains are ignored.
c) In respect of foreign currency forward contracts entered into to hedge foreign currency exposure in respect of recognised monetary items, the premium or discount on such contracts is amortised over the life of the contract. The exchange difference measured by the change in exchange rate between the inception dates of the contract / last reporting date as the case may be and the balance sheet date is recognised in the profi t and loss account. Any gain / loss on cancellation of such forward contracts are recognised as income / expense of the period.
Notes to Consolidated Financial Statements For The Year Ended 31 March 2012

182 26 Annual Report 2011-12
d) The Company designates foreign currency forward contracts taken with respect to highly probable forecast transactions and fi rm commitments as hedges and accounts for the same by applying the recognition and measurement principles set out in the Accounting Standard (AS) 30 “Financial Instruments: Recognition and Measurement”. Accordingly, the Company records the gain or loss on effective cash fl ow hedges in the Cash Flow Hedging Reserve Account until the forecasted transaction materialises. Gain or loss on ineffective cash fl ow hedges (if any) is recognised in the profi t and loss account. (Refer note no 42(ii)).
2 SHARE CAPITAL
(` Crore)
PARTICULARS AS AT31-Mar-12
AS AT31-Mar-11
Authorised100,00,00,000 (Previous Year 90,00,00,000) Equity shares of ` 10/ – each 1,000.00 900.00
1,000.00 900.00Issued, Subscribed and fully paid-upEquity Share Capital82,62,69,357 (previous year 78,77,84,357) Equity shares of ̀ 10/ – each fully paid up
826.27 787.78
Add : Forfeited Share (13,921 shares of ` 10/ – each of ` 5 Paid up) 0.01 0.01TOTAL 826.28 787.79
NOTES :
a) During the year 3,84,85,000 (previous year Nil) equity shares were issued as under:
i] 1,60,00,000 Equity shares of ` 10/ – each at a premium of ` 41/ – each allotted on conversion of warrants issued by Grabal Alok Impex Limited, the amalgamating company. Such warrants were sold by the original warrant holder to Jiwrajka Investment Private Limited, a promoter group company, which exercised such warrants.
ii] 2,24,85,000 Equity shares allotted to the Shareholders of Grabal Alok Impex Limited pursuant to the Scheme of Amalgamation for consideration other than cash (Refer note no 39(a)).
b) Of the remaining shares :
i] 7,45,396 equity shares were allotted as bonus shares by way of capitalisation of General Reserve.
ii] 62,550 equity shares being forfeited shares were reissued during 2001.
c) Reconciliation of shares outstanding at the beginning and end of the reporting period
(` Crore)
PARTICULARS AS AT31-Mar-12
AS AT31-Mar-11
No of shares outstanding at the beginning of the year 787,784,357 787,798,278Add : Shares allotted during the yearAllotment of Equity shares on conversion of warrants 16,000,000 –Allotment of Equity shares pursuant to the Scheme of Amalgamation 22,485,000 –Less: Shares forfeited on account of non payment of call money – (13,921)No of shares outstanding at the end of the year 826,269,357 787,784,357
d) Terms/rights attached to equity shares
The company has only one class of equity shares having a par value of ` 10/ – per share. Each holder of equity share is entitled to one vote per share. The company declares and pays dividend in Indian Rupees. The dividend proposed by the Board of Directors is subject to the approval of the shareholders in the Annual General Meeting.
In the event of liquidation of the company, the holders of equity shares will be entitled to receive remaining assets of the company, after distribution of all preferential amounts. The distribution will be in proportion to the number of equity shares held by the shareholder.
Notes to Consolidated Financial Statements For The Year Ended 31 March 2012

INNOVATIVE TEXTILE SOLUTIONSINNOVATIVE TEXTILE SOLUTIONS
183Innovative Textile Solutions
e) Shares reserved for issue under options (Refer note no 33)
f) Grabal Alok Impex Limited, the amalgamating company, (Refer note no 39(a)) had issued and allotted 200 Foreign Currency Convertible Bonds of USD 1,00,000 each aggregating to USD 20 million outstanding as at the balance sheet date, which was convertible into shares, at any time on or after 15 April 2007 and prior to the closure of business on 06 March 2012, unless previously redeemed, converted or purchased and cancelled. Such FCCBs have been redeemed after the balance sheet date, on 05 April 2012.
g) During the year ended 31 March 2012, an amount of ` 0.30 per share (previous year ` 0.25 per share) was recognised as proposed dividend to equity share holders.
h) Shareholder holding more than 5 percent of the share capital
(` Crore)
Sr.no. Name of the Shareholder AS AT31-Mar-12
AS AT31-Mar-11
No of shares
Held
% No of shares
Held
%
i] Niraj Realtors & Shares Private Limited
71,637,204 8.67 59,842,184 7.60
ii] Caledonia Investment PLC 36,207,135 4.38 47,825,714 6.07iii] Caledonia Investment PLC (FDI) 24,211,903 2.93 45,184,354 5.74
3 RESERVES AND SURPLUS
(` Crore) PARTICULARS AS AT
31-Mar-12 AS AT
31-Mar-11Capital ReserveBalance as per last Balance Sheet 10.23 10.23Add : on amalgamation* 1.49 –Add: Transferred from statement of Profi t and Loss 0.26 –
11.98 10.23Capital Reserve (on Consolidation)Balance as per last Balance Sheet 11.61 10.66Add : Addition on account of additional investment 2.70 –Add : Translation difference on restatement 0.67 0.95
14.98 11.61Revaluation reserveBalance as per last Balance Sheet – –Add : on amalgamation (Refer note no 39(b) 3.86 –
3.86 –Capital Redemption ReserveBalance as per last Balance Sheet 2.20 2.20Add : on amalgamation* 6.90 –
9.10 2.20Securities premium accountBalance as per last Balance Sheet 880.39 880.39Add : on amalgamation* 60.15 –Add : Received during the year (Refer note no 2a(i) above) 65.60 –Less : Premium on redemption of FCCB (12.49) –
993.65 880.39General ReserveBalance as per last Balance Sheet 275.25 250.22Add : on amalgamation* 5.63 –
Notes to Consolidated Financial Statements For The Year Ended 31 March 2012

184 26 Annual Report 2011-12
Add: Transferred from statement of Profi t and Loss 0.31 25.03 281.19 275.25
Debenture Redemption ReserveBalance as per last Balance Sheet 220.38 604.68Add: Transferred to statement of Profi t and Loss (51.90) (384.30)
168.48 220.38Foreign Currency Translation ReserveBalance as per last Balance Sheet 9.24 11.24Add: Created during the year (73.51) (2.00)
(64.27) 9.24Cash fl ow hedging Reserve (Refer note no 42(ii)) (16.78) –
Employee Stock Options Outstanding (Refer note no 33)Options granted during the year 4.67 –Less : Deferred Employee Compensation expenses (2.40) –
2.27 –Surplus in Statement of Profi t and LossOpening balance 594.97 (52.48)Add : on amalgamation* (80.63) –Profi t for the year 92.99 311.54Less : Appropriations(i) Transferred to General Reserve (0.31) (25.03)(ii) Transferred from Debenture Redemption Reserve 51.90 384.30(iii) Transferred to Capital Reserve (0.26) –(iv) Proposed Dividend – Equity Shares (24.79) (19.69)(v) Corporate Dividend Tax thereon (4.02) (3.27)(vi) Short provision of dividend and tax thereon (0.22) (0.40)
629.63 594.97 TOTAL 2,034.09 2,004.27
4 LONG-TERM BORROWINGS
(` Crore)PARTICULARS AS AT 31-Mar-12 AS AT 31-Mar-11
Current Non Current
Current Non Current
Debentures/Bonds Debentures (Secured) (Refer note I below) 800.00 500.00 Compulsorily Convertible Debentures
(Unsecured) (Refer note II below) 613.88 312.55
Compulsorily Convertible Bonds (Refer note no 40) 492.74 226.47Term Loans (Secured) (Refer note III & IV below)(a) From banks - Rupee Loans 1,365.90 5,848.08 1,076.94 5,119.30 - Foreign currency loans 555.87 353.06 15.28 574.75
1,921.77 6,201.14 1,092.22 5,694.05
(b) From Financial Institutions - Rupee Loans 121.47 170.05 130.73 183.18 - Foreign currency loans 28.12 148.36 20.57 147.00
149.59 318.41 151.30 330.182,071.36 6,519.55 1,243.52 6,024.23
Term Loans (Unsecured) (Refer note V below) From Banks and Financial Institutions - Foreign Currency Loans 119.64 86.62 16.88 95.35
Notes to Consolidated Financial Statements For The Year Ended 31 March 2012

INNOVATIVE TEXTILE SOLUTIONSINNOVATIVE TEXTILE SOLUTIONS
185Innovative Textile Solutions
Other loans & advances (Refer note VI below) Vehicle loan from Banks (Secured) 2.50 4.17 2.11 5.88
2,193.50 8,516.96 1,262.51 7,164.48
NOTES :
I. a) Debentures outstanding at the year end are redeemable as follows
PARTICULARS Nos 31-Mar-12 (` Crore)
31-Mar-11 (` Crore)
Date of Redemption
12.00% Redeemable Non convertible Debentures 375 37.50 – 1-Feb-2012.00% Redeemable Non convertible Debentures 375 37.50 – 1-Aug-1912.00% Redeemable Non convertible Debentures 375 37.50 – 1-Feb-1910.75% Redeemable Non convertible Debentures 334 33.34 33.34 18-Oct-1812.00% Redeemable Non convertible Debentures 375 37.50 – 1-Aug-1812.00% Redeemable Non convertible Debentures 375 37.50 – 1-Feb-1810.75% Redeemable Non convertible Debentures 333 33.33 33.33 18-Oct-1712.00% Redeemable Non convertible Debentures 375 37.50 – 1-Aug-1712.50% Redeemable Non convertible Debentures 300 30.00 30.00 3-Mar-1712.50% Redeemable Non convertible Debentures 366 36.66 36.66 2-Mar-1712.00% Redeemable Non convertible Debentures 375 37.50 – 1-Feb-1710.75% Redeemable Non convertible Debentures 333 33.33 33.33 18-Oct-1612.00% Redeemable Non convertible Debentures 375 37.50 – 1-Aug-1611.50% Redeemable Non convertible Debentures 600 60.00 60.00 29-Jun-1612.50% Redeemable Non convertible Debentures 367 36.67 36.67 2-Mar-1612.50% Redeemable Non convertible Debentures 300 30.00 30.00 2-Mar-1611.50% Redeemable Non convertible Debentures 700 70.00 70.00 28-Jun-1512.50% Redeemable Non convertible Debentures 367 36.67 36.67 3-Mar-1512.50% Redeemable Non convertible Debentures 300 30.00 30.00 3-Mar-1511.50% Redeemable Non convertible Debentures 700 70.00 70.00 28-Jun-14
TOTAL 800.00 500.00
b) All the debentures in a) above are secured by pari passu charge on the immovable property situated at Mouje Irana, Taluka Kadi, District Mehsana in the state of Gujarat. Further, Debentures of ` 300 crore are secured by fi rst pari passu charge to be created on fi xed assets of the company and Debentures of ` 500 crore are secured by subservient charge on fi xed and current assets of the Company (excluding Land and Building).
II. Compulsorily Convertible Debentures are compulsorily convertible / redeemable at the option of the issuer after 26 months from the date of the issue i.e. 29 July 2011 and/or in twenty equal quarterly instalments or as mutually decided between the issuer and the holder.
III. Disclosure of Security for term loans
(` Crore)
Nature of security Banks Financial Institutions
TOTAL
Exclusive charge on Plant & Machinery and specifi c assets fi nanced* 1,041.98 – 1,041.98 (646.34) (–) (646.34)
Pari passu fi rst charge created / to be created on the entire fi xed assets and specifi c immovable properties of the company#
3,260.47(2,964.44)
314.13(336.92)
3,574.60(3,301.36)
Subservient charge on all movable and current assets of the Company @
3,820.46(3,175.49)
153.87(144.56)
3,974.33(3,320.05)
Total 8,122.91 468.00 8,590.91 (6,786.27) (481.48) (7,267.75)
Notes to Consolidated Financial Statements For The Year Ended 31 March 2012

186 26 Annual Report 2011-12
* Includes loans aggregating to ` 218.47 crore (previous year 218.89 crore) which is further secured by personal guarantees of promoter directors / group Companies
# Includes Bank loans aggregating to ` 1,060.17 crore (previous year 998.90 crore) & Financial Institution loans aggregating to ` 30.47 crore (previous year 38.59 crore) which is further secured by personal guarantees of promoter directors / group Companies
@ Includes Banks loans aggregating to ` 237.47 crore (previous year 159.80 crore) which is further secured by personal guarantees of promotor directors / group Companies
IV. Terms of Repayment of Secured Term Loan
(` Crore)Particulars Rate of Interest* 1-2 Years 2-3 Years 3-4 Years Beyond 4
YearsTotal
Rupee Term Loan From Bank
12% – 15.75%(10.25% – 14.25%)
1,907.37(1,145.32)
1,571.73(1,200.58)
824.29(1,183.15)
1,544.69(1,590.25)
5,848.08(5,119.30)
Foreign Currency Term Loan From Banks
2.53% – 5.34%(2.50% – 8.00%)
34.57(479.66)
46.92(27.51)
62.91(38.68)
208.66(28.90)
353.06(574.75)
Rupee Term Loan From Financial Institutions
9.00% – 12.50%(9.00% – 12.00%)
125.21(124.59)
15.63(13.75)
13.91(15.63)
15.30(29.22)
170.05(183.19)
Foreign Currency Term Loan From Financial Institutions
2.70% – 5.31%(3.92% – 6.00%)
8.90(18.88)
136.80(7.80)
0.24(118.59)
2.42(1.72)
148.36(146.99)
Total 2,076.05 1,771.08 901.35 1,771.07 6,519.55 (1,768.45) (1,249.64) (1,356.05) (1,650.09) (6,024.23)
* Rate of interest is without considering interest subsidy under TUF Scheme
V. Terms of Repayment of Unsecured Term Loan
(` Crore)Particulars Rate of Interest 1-2 Years 2-3 Years 3-4 Years Beyond 4
YearsTotal
Foreign Currency Term Loan From Banks
3.68% – 3.75%(2.95% – 3.00%)
17.32(17.32)
17.32(17.32)
17.32(17.32)
34.66(43.39)
86.62(95.35)
VI. Disclosure of security and terms of repayment of other loans & advances
(` Crore)Nature of security Banks
Vehicle loans are secured by vehicles under hypothecation with banks 6.67 (7.99)
(` Crore)Particulars Rate of Interest 1-2 Years 2-3 Years 3-4 Years Beyond 4
YearsTotal
Vehicle Loan 9.50% – 13.00% 2.50 1.28 0.36 0.03 4.17(9.50% – 13.00%) (2.47) (2.48) (0.93) – (5.88)
Previous year fi gures are given in brackets
Notes to Consolidated Financial Statements For The Year Ended 31 March 2012

INNOVATIVE TEXTILE SOLUTIONSINNOVATIVE TEXTILE SOLUTIONS
187Innovative Textile Solutions
5 DEFERRED TAX LIABILITIES (NET)
(` Crore) PARTICULARS AS AT
31-Mar-12 AS AT
31-Mar-11I) Deferred Tax Liability (DTL) Depreciation 702.43 527.97 Share Issue expenses (2.97) (7.35) Mark to Market loss on Derivative Contract (58.26) – Other disallowances (14.13) (12.78)
627.07 507.84II) Deferred Tax Asset (DTA) Gratuity and Compensated Absences 11.54 0.02 Business / Depreciation loss as per I. T. Act, 1961 (2.52) 7.52
9.02 7.54
* Includes Opening Deferred tax Liability (Net) of Grabal Alok Impex Limited of ` 16.78 crore on account of amalgamation (Refer note no 39(a))
6 LONG-TERM PROVISIONS
(` Crore)
PARTICULARS AS AT31-Mar-12
AS AT31-Mar-11
Provision for employee benefi ts (Refer note no 35) 17.01 17.83Mark to Market provision on derivative instruments (Refer note no 42(ii) and (iii)) 159.70 60.04Others (Refer note no 37) – 1.77
176.71 79.64
7 SHORT-TERM BORROWINGS
(` Crore)
PARTICULARS AS AT31-Mar-12
AS AT31-Mar-11
Debenture (Secured) (Refer note a below) – 250.00Cash Credit accounts, working capital demand loan etc. (Secured) (Refer note b below) From Banks (including ̀ 730.00 crore (previous year ̀ 380.34 crore in foreign
currency) 2,740.46 1,725.37
From Financial Institutions (including ` Nil (previous year ` 89.08 crore in foreign currency)
130.74 89.08
Cash Credit accounts, working capital demand loan etc. (Unsecured) From banks 157.53 69.94Compulsorily Convertible Debentures (Unsecured) 196.95 –Commercial Paper (Unsecured) From Banks 103.00 360.00 From Financial Institutions 335.00 360.00Short term loan Secured (Refer note b below) Rupee Loans From Banks 730.00 576.98 From Financial Institutions 85.00 75.00
Notes to Consolidated Financial Statements For The Year Ended 31 March 2012

188 26 Annual Report 2011-12
Foreign currency loans From Banks – 44.65 Unsecured Rupee Loans From Banks 577.90 144.95 Foreign currency loans From Banks 277.44 –Inter Corporate Deposit 5.99 –
5,340.01 3,695.97
Note
a) Debentures are secured by pari passu charge on the immovable property situated at Mouje Irana, Taluka Kadi, District Mehsana in the state of Gujarat.
b) Disclosure of security
(` Crore)
Nature of security Banks Financial Institutions
TOTAL
Working capital loans :(i) Hypothecation of company's current assets and mortgage
of certain immovable properties belonging to the company / Guarantor.
(ii) Second charge created / to be created on all fi xed assets (excluding land and building) of the company
2,396.53(450.47)
40.35(20.58)
2,436.88(471.05)
Subservient charge created / to be created on all moveable and current assets of the company.
343.93(429.45)
90.39(68.50)
434.32(497.95)
Fixed Deposit placed with the bank. – (845.45)
–(–)
– (845.45)
TOTAL 2,740.46 130.74 2,871.20 (1,725.37) (89.08) (1,814.45)
Short Term LoansSubservient charge on all movable and current assets of the company
537.00 (621.63)
85.00 (75.00)
622.00 (696.63)
Fixed Deposit placed with the bank. 193.00 – 193.00(–) (–) (–)
TOTAL 730.00 85.00 815.00 (621.63) (75.00) (696.63)
Previous year fi gures are given in brackets
8 TRADE PAYABLE
(` Crore)
PARTICULARS AS AT31-Mar-12
AS AT31-Mar-11
Total outstanding due to :– Micro, Small and Medium Enterprises* –– Others 605.23 594.93(Including acceptances ` 2.20 crore (previous year ` 50.94 crore)
605.23 594.93
* As per information available with the company
Notes to Consolidated Financial Statements For The Year Ended 31 March 2012

INNOVATIVE TEXTILE SOLUTIONSINNOVATIVE TEXTILE SOLUTIONS
189Innovative Textile Solutions
9 OTHER CURRENT LIABILITIES
(` Crore)
PARTICULARS AS AT31-Mar-12
AS AT31-Mar-11
Current maturities of long-term debt (Refer Note 4 for details) 2,193.50 1,262.51Interest accrued but not due on borrowings 13.55 21.28Unpaid dividends (Refer note i and ii below) 1.05 0.84Share application money received by subsidiary company (Refer note iv below) 350.00 –Foreign Currency Monetary Item Translation Difference Account – 0.22Other payablesAdvance from customers 68.86 61.62Creditors for Expenses 139.23 8.77Creditors for Capital Goods 35.00 19.12Creditors for statutory Liabilities 9.95 15.93Premium on redemption of FCCB 43.14 –Advance from Related parties (Refer note no 32) 14.75 139.52Temporary overdrawn bank balance (Refer note iii below) 25.12 32.13Forward Contract Payable 10.89 –Advance from Others 3.48 1.26
2,908.52 1,563.20
NOTES
(i) This fi gure doesn’t include any amount due and outstanding to be credited to the Investor Education and Protection Fund.
(ii) During the year company has transferred ` 0.03 crore (previous year ` 0.06 crore) to the Investor Education and Protection Fund.
(iii) Temporary overdrawn bank balances are as per books consequent to issue of cheques at the year end, though the banks have positive balances as on that date.
(iv) The subsidiary company intends to allot shares against the share application money received, which is in excess of the authorised share capital of the subsidiary company. The subsidiary company is taking steps to increase the authorised capital.
10 SHORT-TERM PROVISIONS
PARTICULARS AS AT31-Mar-12
AS AT31-Mar-11
Provision for employee benefi ts (Refer note no 35) 7.63 3.23Mark to Market provision on derivative instruments (Refer note no 42(ii) and (iii)) 36.65 12.92Proposed dividend 24.79 19.69Corporate dividend tax 4.02 3.30Provision for taxation (Net of Advance Tax) 10.53 20.09Others (Refer note no 37) 35.85 13.70
119.47 72.93
Notes to Consolidated Financial Statements For The Year Ended 31 March 2012

190 26 Annual Report 2011-12
11
FIXE
D A
SSET
S
SR.
NO.
DES
CRIP
TIO
N O
F AS
SETS
GRO
SS B
LOCK
DEP
RECI
ATIO
N N
ET B
LOCK
AS
AT01
.04.
2011
ACQ
UISI
TIO
N TH
ROUG
H AM
ALG
AMAT
ION
(see
not
e 4
belo
w)
ADD
ITIO
NS D
EDUC
TIO
NS/
ADJ
USTM
ENTS
AS
AT31
.03.
2012
AS
AT01
.04.
2011
ACQ
UISI
TIO
N TH
ROUG
H AM
ALG
AMAT
ION
(see
not
e 4
belo
w)
FO
R TH
E Y
EAR
DED
UCTI
ONS
/AD
JUST
MEN
TS A
S AT
31.0
3.20
12 A
S AT
31.0
3.20
12 A
S AT
31.0
3.20
11
TAN
GIB
LE A
SSET
S1
Fre
ehol
d La
nd 1
03.1
6 3
.44
19.
38 5
.24
120
.74
– –
– –
– 1
20.7
4 1
03.1
62
Lea
seho
ld L
and
0.5
6 0
.24
2.6
1 –
3.4
1 0
.14
0.0
4 0
.09*
(0.0
6) 0
.33
3.0
8 0
.42
3 F
acto
ry B
uild
ing
1,9
25.5
6 8
3.67
247
.25
4.7
5 2
,251
.73
194
.02
6.0
8 6
4.96
(1.4
0) 2
66.4
6 1
,985
.27
1,7
31.5
44
Offi
ce P
rem
ises
26.
60 4
3.56
10.
45 3
.61
77.
00 2
.70
28.
73 2
.21
2.5
3 3
1.11
45.
89 2
3.90
5 P
lant
and
Mac
hine
ry 6
,838
.36
188
.91
1,3
54.1
9 (1
.82)
8,3
83.2
8 1
,400
.06
68.
94 6
33.2
3 (1
.32)
2,1
03.5
5 6
,279
.73
5,4
38.3
06
Com
pute
r and
Per
iphe
rals
30.
45 1
.10
2.9
4 0
.73
33.
76 1
7.83
0.6
8 2
.46
0.5
6 2
0.41
13.
35 1
2.62
7 O
ffi ce
Equ
ipm
ent
10.
51 0
.35
1.4
7 0
.12
12.
21 3
.19
0.0
9 0
.69
0.0
4 3
.93
8.2
8 7
.32
8 F
urni
ture
and
Fitt
ings
98.
39 2
79.8
4 3
5.57
3.3
9 4
10.4
1 2
1.58
102
.61
27.
26 2
.14
149
.31
261
.10
76.
819
Veh
icles
23.
64 1
.81
4.6
9 0
.59
29.
55 7
.78
0.7
6 2
.93
0.3
6 1
1.11
18.
44 1
5.86
10 T
ools
and
Equi
pmen
t 5
5.86
1.1
7 1
6.14
0.0
9 7
3.08
10.
36 0
.16
5.4
3 0
.01
15.
94 5
7.14
45.
50 L
EASE
D AS
SETS
1 B
uild
ings
15.
63 –
3.7
0 –
19.
33 0
.79
– 0
.36
– 1
.15
18.
18 1
4.84
Sub
– T
otal
9,1
28.7
2 6
04.0
9 1
,698
.39
16.
70 1
1,41
4.50
1,6
58.4
5 2
08.0
9 7
39.6
2 2
.86
2,6
03.3
0 8
,811
.20
7,4
70.2
7 IN
TANG
IBLE
ASS
ETS
1 C
ompu
ter S
oftw
are
19.
41 0
.17
7.5
9 0
.57
26.
60 9
.93
0.1
5 3
.77
(0.0
1) 1
3.86
12.
74 9
.48
2 T
rade
mar
ks /
Bran
ds 5
5.04
– –
0.1
0 5
4.94
20.
94 –
5.7
5 0
.01
26.
68 2
8.26
34.
103
Des
ign
Card
s –
0.0
8 –
– 0
.08
– 0
.08
– –
0.0
8 –
– S
ub –
Tot
al 7
4.45
0.2
5 7
.59
0.6
7 8
1.62
30.
87 0
.23
9.5
2 –
40.
62 4
1.00
43.
58 T
otal
9,2
03.1
7 6
04.3
4 1
,705
.98
17.
37 1
1,49
6.12
1,6
89.3
2 2
08.3
2 7
49.1
4 2
.86
2,6
43.9
2 8
,852
.20
7,5
13.8
5 T
OTA
L PR
EVIO
US Y
EAR
7,4
44.6
5 –
1,7
71.3
2 1
2.80
9,2
03.1
7 1
,157
.20
– 5
30.9
7 (1
.15)
1,6
89.3
2 7
,513
.85
CAPI
TAL
WO
RK-IN
-PRO
GRE
SS (I
nclu
ding
` 1
8.94
cro
res
on a
ccou
nt o
f am
alga
mat
ion
(See
not
e 4
belo
w) 9
24.3
8 8
99.9
8
Not
es :
1.
Pla
nt &
Mac
hine
ry in
clud
es :
a
E
xcha
nge
diffe
renc
e (n
et)
of `
97.
60 c
rore
(pr
evio
us y
ear
gain
of `
15.
96 c
rore
) on
res
tate
men
t of l
ong
term
bor
row
ings
pay
able
in fo
reig
n cu
rren
cy.
b
In
tere
st c
apita
lised
` 7
7.92
Cro
re (
prev
ious
yea
r `
36.0
8 C
rore
) 2
. In
tang
ible
ass
ets
cons
ists
of T
rade
Mar
ks /
Bra
nds
aggr
egat
ing
to `
55.
04 C
rore
(pr
evio
us y
ear `
55.0
4 cr
ore)
(G
ross
) [W
ritte
n do
wn
valu
e `
28.9
0 cr
ore
(pre
viou
s ye
ar `
34
.41
cror
e)],
whi
ch a
re r
egis
tere
d in
the
nam
e of
a s
ubsi
diar
y co
mpa
ny in
tru
st o
n be
half
of t
he c
ompa
ny.
The
Com
pany
has
app
lied
for
regi
ster
ing
thos
e T
rade
mar
ks /
B
rand
s in
it’s
nam
e w
ith c
once
rned
aut
horit
ies
and
is a
wai
ting
regi
stra
tion.
3.
Cap
ital w
ork
in p
rogr
ess
incl
udes
a
E
xcha
nge
diffe
renc
e (n
et)
of `
16.
87 c
rore
(pr
evio
us y
ear `
7.52
cro
re)
on r
esta
tem
ent o
f lon
g te
rm b
orro
win
gs p
ayab
le in
fore
ign
curr
ency
.
b
Inte
rest
cap
italis
ed `
29.
14 C
rore
(P
revi
ous
year
` 5
0.73
Cro
re)
c
`
863.
35 c
rore
(pr
evio
us y
ear `
835.
56 c
rore
) on
acc
ount
of c
onst
ruct
ion
mat
eria
l and
pla
nt a
nd m
achi
nery
und
er e
rect
ion.
d
P
re-o
pera
tive
expe
nses
agg
rega
ting
to `
4.8
0 cr
ore
(pre
viou
s ye
ar `
12.
74 c
rore
) 4
. In
clud
es a
sset
s of
Gra
bal A
lok
Impe
x Li
mite
d, G
raba
l Alo
k In
tern
atio
nal L
imite
d an
d G
raba
l Alo
k (U
K)
Lim
ited
(Ref
er n
ote
no 3
9).
* A
mou
nt w
ritte
n of
f in
resp
ect o
f Lea
seho
ld L
and
for
the
perio
d of
Lea
se w
hich
has
exp
ired.
Notes to Consolidated Financial Statements For The Year Ended 31 March 2012

INNOVATIVE TEXTILE SOLUTIONSINNOVATIVE TEXTILE SOLUTIONS
191Innovative Textile Solutions
12 NON CURRENT INVESTMENTS
(` Crore)
PARTICULARS AS AT31-Mar-12
AS AT31-Mar-11
Investment Property : Property under construction (Refer note no i below) 1,429.05 1,202.75 Freehold Land 33.18 35.68
1,462.23 1,238.43Investments in Equity Instruments (at cost) In Associate companies – unquoted Triumphant Victory Holdings Limited 0.00 0.00 [2 (previous year 1) equity share of USD 1 each ` 90.14 (previous
year ` 45.14)] Grabal Alok International Limited (` 1,121.25/-) – 0.00 [25 equity shares of USD 1 each] (Refer note no 39(a)) Next Creations Holdings LLC, subscription towards 33%
membership interest 4.47 4.47
Less : share in post acquisition accumulated loss (0.72) (0.80) 3.75 3.67
Nirvan Builders Private Limited – 0.02 Nil (previous year 16,600) Equity Shares of `10/ – each] Less : share in post acquisition accumulated loss (previous year `
25,141/-) – (0.00)
– 0.02 Alspun Infrastructure Limited 0.10 0.08 [100,000 (previous year 75,000) Equity shares of `10 each] (Including goodwill on acquisition of stake of associates ` 0.04
crore) Less : share in post acquisition accumulated loss (0.07) (0.06)
0.03 0.02 Grabal Alok (UK) Limited – 310.81 [237,197,008 Ordinary Shares of GBP 0.001 each ] (Refer note no
39(b)) Less : share in post acquisition accumulated loss – (92.17)
– 218.64 Ashford Infotech Private Limited 2.50 2.50 [50,000 Equity Share of `10 each] Less : share in post acquisition accumulated loss (0.06) (0.06)
2.44 2.44Others – Unquoted Shirt Company (India) Limited – 0.20 [Nil (previous year 11,333) Equity Shares of `10/ – each] Dombivali Nagari Sahakari Bank Limited. 0.05 0.05 [10,000 Equity Shares of ` 50/ – each] Kalyan Janata Sahakari Bank Limited 0.03 0.03 [10,000 Equity Shares of ` 25/ – each] Saraswat Bank Limited (` 25,000/-) 0.00 0.00 [2,500 Equity Shares (previous year Nil) of ` 10/ – each] Wel-Treat Environ Management Organisation (` 36,500/-) 0.00 0.00 [3,650 Equity Shares of ` 10 each]
6.30 225.07
Notes to Consolidated Financial Statements For The Year Ended 31 March 2012

192 26 Annual Report 2011-12
Others – Quoted fully paid Grabal Alok Impex Limited – 3.99 [19,00,000 Equity Shares of `10/ – each ] (Refer note no 39(a))
– 3.99Investment in Preference shares (unquoted) In Associates Company Triumphant Victory Holdings Limited 3.84 – [7,50,000 (previous year Nil) Shares USD 1 each] Ashford Infotech Private Limited 65.49 65.49 [5,00,000 Shares ` 10 each] Alspun Infrastructure Limited 16.22 – [5,00,000 (previous year Nil) Shares ` 10 each] Grabal Alok International Limited – 53.45 [11,970,552 of USD 1/ – each] (Refer note no 39(a))
85.55 118.94Investments in Bonds – Unquoted Convertible Loan Notes of Grabal Alok (UK) Limited – 79.12
– 79.12Others Interest in Alok Benefi t Trust (Refer note no 39(a)) 35.33 – [1,94,59,382 (previous year Nil) Equity Shares of `10/ – each ] PowerCor Subscription towards 5% Group B Membership interest 37.88 33.06 Less: Provision (37.88) (24.80)
– 8.26 Aisle 5 LLC 22 senior units of the equity capital 6.70 5.85 Less: Provision (6.70) (5.85)
– – Share Application Money In Associate Company Alspun Infrastructure Limited – 16.16 Other Investment 0.01 0.01
35.34 24.43 1,589.42 1,689.98
1) Quoted Investment : Aggregate cost / carrying value – 3.99 : Aggregate market value – 6.082) Unquoted Investment : Aggregate cost / carrying value 1,589.42 1,685.99
NOTE :
(i) Includes interest capitalised during the year ` 29.89 crore (previous year ` 19.53 crore)
13 LONG TERM LOANS & ADVANCES (Unsecured)
(` Crore)
PARTICULARS AS AT31-Mar-12
AS AT31-Mar-11
Considered goodCapital advances 222.76 256.34Lease & Security deposits 16.56 17.47Other Loans & advancesForeign Currency Monetary Item Translation Difference Account 0.95 –Advance Tax (Net of Provision for Tax) 17.90 15.40MAT Credit entitlement 66.27 110.39
Notes to Consolidated Financial Statements For The Year Ended 31 March 2012

INNOVATIVE TEXTILE SOLUTIONSINNOVATIVE TEXTILE SOLUTIONS
193Innovative Textile Solutions
Prepaid Expenses 65.88 40.51 390.32 440.11
Considered doubtfulCapital advances 3.76 –Less : Provision 3.76 –
– – TOTAL 390.32 440.11
14 CURRENT INVESTMENTS (at cost)
(` Crore)
PARTICULARS AS AT31-Mar-12
AS AT31-Mar-11
Investments in debentures or bonds Laxmi Vilas Bank Tier II Bonds 2.00 2.00 [20 Bonds of ` 10,00,000 each]Investments in Mutual funds – Unquoted Taurus Liquid Fund – 0.16 (Nil (previous year 16,57,032) units of ` 10/ – each) Axis Infrastructure Fund 1 1.94 7.20 [19,378 (previous year 72,035) units of ` 1000/ – each] SBI Magnum Insta Cash Fund – 17.00 [Nil (previous year 78,08,875.48) units of ` 10/ – each] Peerless Liquid Fund collection A/C – 1.00 [Nil (previous year 9,35,506.20) units of ` 10/ – each] IDFC Money Manager Fund Daily Dividend – 0.05 [Nil (previous year 49,652.93) units of ` 10/ – each]
3.94 27.41
15 INVENTORIES
(` Crore)
PARTICULARS AS AT31-Mar-12
AS AT31-Mar-11
Raw Materials 446.05 604.47(Includes material in transit ` 62.09 crore (previous year ` 138.62 crore)Work-in-progress 2,278.38 900.36Finished Goods 671.11 510.21Stock in Trade (Traded Goods) 221.29 68.03Stores & Spares 73.27 59.48Packing Material 7.02 7.33
3,697.12 2,149.88
16 TRADE RECEIVABLES (Unsecured)
(` Crore)
PARTICULARS AS AT31-Mar-12
AS AT31-Mar-11
Debts Outstanding for a period exceeding six months from due date 102.31 64.09Less : Provision 20.70 8.72
81.61 55.37Other Debts 2,129.35 1,761.33Less : Provision 6.96 2.50
Notes to Consolidated Financial Statements For The Year Ended 31 March 2012

194 26 Annual Report 2011-12
2,122.39 1,758.83 TOTAL 2,204.00 1,814.20
Considered Good 2,204.00 1,814.20Considered Doubtful 27.66 11.22
TOTAL 2,231.66 1,825.42
NOTE :
(i) Sundry Debtors includes ` 70.72 crore (previous year ` 38.23 crore) towards contractual obligations on account of Export Incentives Receivables.
(ii) Debtors include dues from parties aggregating to ` 1.22 crore (previous year ` 3.10 crore) in which a director is a director/partner
(iii) Refer note no 32 for related party balances.
17 CASH & BANK BALANCES
(` Crore)
PARTICULARS AS AT31-Mar-12
AS AT31-Mar-11
Cash on hand 0.66 1.37Balance with Bank In Current Accounts 563.38 76.48 In EEFC Accounts 0.98 0.41 In Deposit Accounts [Including interest accrued thereon] (Refer Note
i and ii below) 116.51 140.12
In earmarked accounts Unpaid dividend accounts 1.08 0.84 Balances / Deposits held as margin money or security against
borrowings, guarantees and other commitments (Refer Note i to iii below)
715.19 981.69
1,397.80 1,200.91
NOTE :
(i) Balances with banks includes deposits amounting to ` 22.64 crore (previous year ` 39.22 crore) and margin monies amounting to ` 77.63 (previous year ` 71.49 crore) which have an original maturity of more than 12 months.
Balances with banks includes deposits amounting to ` 2.16 crore (previous year ` 9.92 crore) and margin monies amounting to ` 2.81 crore (previous year ` 15.42 crore) which have a maturity of more than 12 months from the Balance Sheet date
(ii) Includes ` 33.49 crore (previous year Nil) kept in bank deposits and ` 8.55 crore (previous year ` 41.29 crore) margin money pending utilisation towards project
(iii) Includes ` 437.57 crore (previous year ` 845.45 crore) pledged with banks towards loan availed by subsidiary company.
18 SHORT-TERM LOANS AND ADVANCES (Unsecured)
(` Crore)
PARTICULARS AS AT31-Mar-12
AS AT31-Mar-11
Considered goodLoans & advances to Related parties (Refer note no 32) 9.22 32.86OthersAdvance to Creditors 971.61 124.57Advance to Staff (Refer note i below) 9.36 10.82
Notes to Consolidated Financial Statements For The Year Ended 31 March 2012

INNOVATIVE TEXTILE SOLUTIONSINNOVATIVE TEXTILE SOLUTIONS
195Innovative Textile Solutions
Balance with Central Excise, Customs and Sales Tax Authorities 282.25 204.33Prepaid Expenses 69.29 30.75Inter Corporate Deposits 3.69 4.95Advance Tax (Net of provision for tax) 9.13 20.60Deposits others 9.51 10.13
1,364.06 439.01Considered doubtfulAdvance to others 20.60 19.27Less : Provision 20.60 19.27
- - 1,364.06 439.01
NOTE :
(i) Advance to staff includes ` 0.18 crore (previous year ` 1.27 crore) due from offi cers of the Company [maximum amount outstanding during the year ` 1.27 crore (previous year ` 1.35 crore)]
19 OTHER CURRENT ASSETS (Unsecured)
(` Crore)
PARTICULARS AS AT31-Mar-12
AS AT31-Mar-11
Considered Good
Forward Contract Receivable – 4.28
Interest Subsidy Receivable 88.09 123.35
Unutilised DEPB Licence 25.98 7.85
Interest Receivable 0.32 0.07
Insurance Claim Receivable 1.11 0.09
Balances with Central Excise Authorities 0.05 0.19
Foreign Currency Monetary Item Translation Difference Account 0.03 0.55
Rent Receivable 0.23 –
115.81 136.38
Considered Doubtful
Interest Subsidy Receivable 9.31 9.31
Less : Provision 9.31 9.31
- -
115.81 136.38
20 REVENUE FROM OPERATIONS
(` Crore)
PARTICULARS AS AT31-Mar-12
AS AT31-Mar-11
Sale of product
Sales – Local 6,165.75 4,362.34
Sales – Export 3,813.27 2,342.70
9,979.02 6,705.04
Sale of services
Job work charges collected 31.19 13.16
Sale of Scrap 8.46 9.18
TOTAL 10,018.67 6,727.38
Notes to Consolidated Financial Statements For The Year Ended 31 March 2012

196 26 Annual Report 2011-12
21 OTHER INCOME
(` Crore) PARTICULARS AS AT
31-Mar-12 AS AT
31-Mar-11Interest Income On Long Term Investments 5.04 3.78 On Current Investments 31.08 58.67 Interest on income tax refund 1.40 0.07
37.52 62.52Dividend Income : On Long Term Investments 0.02 0.20 On Current Investments 0.58 0.16
0.60 0.36Gain on sale of investments (net) On Long Term Investments – 1.02 On Current Investments – 0.14
– 1.16Profi t on sale of fi xed assets (net) 34.88 –Provision for doubtful debts written back 2.21 1.54Insurance claim received 12.40 –Rent Received 2.34 0.42Sundry Credit Balances written back 3.40 0.43Other non operating Income 2.16 0.64
57.39 3.03 TOTAL 95.51 67.07
22 CHANGES IN INVENTORIES OF FINISHED GOODS, WORK-IN-PROGRESS AND STOCK-IN-TRADE
(` Crore) PARTICULARS AS AT
31-Mar-12 AS AT
31-Mar-11CLOSING STOCK AS ON 31 MARCH 2012 *Finished Goods 671.11 510.21Work-in-progress 2,278.38 900.36Stock in Trade (Traded Goods) 221.29 68.03
3,170.78 1,478.60LESS : OPENING STOCK AS ON 1 APRIL 2011Finished Goods 510.21 354.69Work-in-progress 900.36 856.24Stock in Trade (Traded Goods) 68.03 –
1,478.60 1,210.93 TOTAL (1,692.18) (267.67)
* Includes inventories taken over on amalgamation (Refer note no 39)
23 EMPLOYEE BENEFIT EXPENSES
(` Crore) PARTICULARS AS AT
31-Mar-12 AS AT
31-Mar-11Salaries, Wages and Bonus 279.20 230.70Contribution to Provident Fund and Other Funds 22.27 8.52Employee Stock Option Compensation Expenses 2.27 –Employees Welfare Expenses 9.10 5.00
312.84 244.22
Notes to Consolidated Financial Statements For The Year Ended 31 March 2012

INNOVATIVE TEXTILE SOLUTIONSINNOVATIVE TEXTILE SOLUTIONS
197Innovative Textile Solutions
24 FINANCE COSTS
(` Crore)
PARTICULARS AS AT31-Mar-12
AS AT31-Mar-11
Interest expense: 1,144.89 727.71(Net of Interest Subsidy of ` 131.11 crore (previous year ` 131.88 crore) and recovery of ` 140.02 crore (previous year ` 81.47 crore))Interest on late payment of taxes 2.04 3.07Other Borrowing cost 87.77 51.37
TOTAL 1,234.70 782.15
25 OTHER EXPENSES
(` Crore)
PARTICULARS AS AT31-Mar-12
AS AT31-Mar-11
Stores and Spares Consumed 98.34 50.93Packing Materials Consumed 130.97 81.17Power and Fuel 667.25 392.40Processing Charges 66.62 49.58Labour Charges 68.22 60.27Excise Duty 6.27 4.15Donation 1.21 0.81Freight, Coolie and Cartage 112.90 100.25Legal and Professional Fees 37.88 30.74Rent 26.57 22.91Rates and Taxes 6.11 6.55Repairs and Maintenance Plant and Machinery 16.91 14.67 Factory Building 2.18 0.67 Others 9.93 5.06Commission on Sales 43.17 23.01Loss on exchange rate difference/derivative (Net) 282.51 49.73Provision for Doubtful Debts 17.35 35.00Provision for Doubtful Advances 2.43 –Bad debts and other advances written off 12.18 –Directors Remuneration 7.20 7.20Directors Fees and Commission 5.27 5.06Auditors Remuneration Audit Fees 2.08 1.63 Certifi cation Fees 0.04 0.04Insurance 13.04 13.07Loss on Sale of Investment (net) 0.12 –Loss on sale of Assets (Net) – 0.03Diminution in value of investment 8.88 16.88Miscellaneous Expenses 231.73 148.55(Miscellaneous Expenses includes Printing and Stationery, Bank Charges, Advertisement, Bill Discounting Charges etc.)
TOTAL 1,877.36 1,120.36
Notes to Consolidated Financial Statements For The Year Ended 31 March 2012
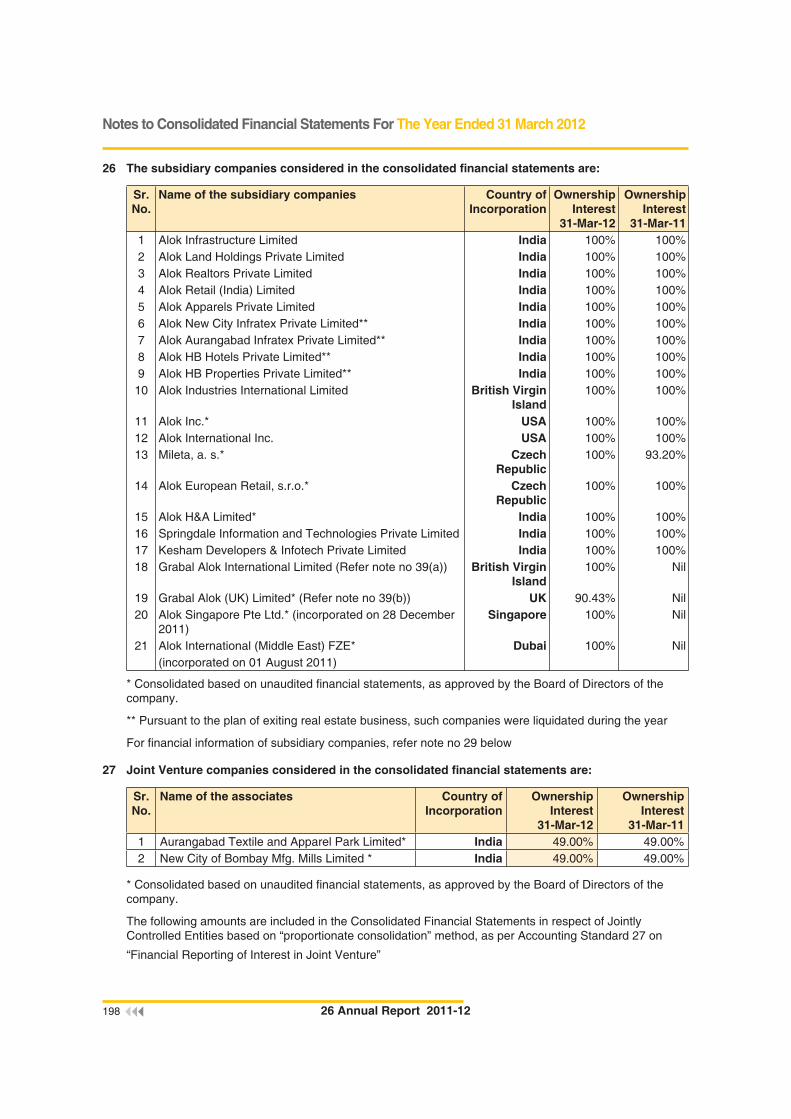
198 26 Annual Report 2011-12
26 The subsidiary companies considered in the consolidated fi nancial statements are:
Sr. No.
Name of the subsidiary companies Country of Incorporation
Ownership Interest
31-Mar-12
Ownership Interest
31-Mar-111 Alok Infrastructure Limited India 100% 100%2 Alok Land Holdings Private Limited India 100% 100%3 Alok Realtors Private Limited India 100% 100%4 Alok Retail (India) Limited India 100% 100%5 Alok Apparels Private Limited India 100% 100%6 Alok New City Infratex Private Limited** India 100% 100%7 Alok Aurangabad Infratex Private Limited** India 100% 100%8 Alok HB Hotels Private Limited** India 100% 100%9 Alok HB Properties Private Limited** India 100% 100%
10 Alok Industries International Limited British Virgin Island
100% 100%
11 Alok Inc.* USA 100% 100%12 Alok International Inc. USA 100% 100%13 Mileta, a. s.* Czech
Republic100% 93.20%
14 Alok European Retail, s.r.o.* Czech Republic
100% 100%
15 Alok H&A Limited* India 100% 100%16 Springdale Information and Technologies Private Limited India 100% 100%17 Kesham Developers & Infotech Private Limited India 100% 100%18 Grabal Alok International Limited (Refer note no 39(a)) British Virgin
Island100% Nil
19 Grabal Alok (UK) Limited* (Refer note no 39(b)) UK 90.43% Nil20 Alok Singapore Pte Ltd.* (incorporated on 28 December
2011)Singapore 100% Nil
21 Alok International (Middle East) FZE* Dubai 100% Nil(incorporated on 01 August 2011)
* Consolidated based on unaudited fi nancial statements, as approved by the Board of Directors of the company.
** Pursuant to the plan of exiting real estate business, such companies were liquidated during the year
For fi nancial information of subsidiary companies, refer note no 29 below
27 Joint Venture companies considered in the consolidated fi nancial statements are:
Sr. No.
Name of the associates Country of Incorporation
Ownership Interest
31-Mar-12
Ownership Interest
31-Mar-111 Aurangabad Textile and Apparel Park Limited* India 49.00% 49.00%2 New City of Bombay Mfg. Mills Limited * India 49.00% 49.00%
* Consolidated based on unaudited fi nancial statements, as approved by the Board of Directors of the company.
The following amounts are included in the Consolidated Financial Statements in respect of Jointly Controlled Entities based on “proportionate consolidation” method, as per Accounting Standard 27 on
“Financial Reporting of Interest in Joint Venture”
Notes to Consolidated Financial Statements For The Year Ended 31 March 2012

INNOVATIVE TEXTILE SOLUTIONSINNOVATIVE TEXTILE SOLUTIONS
199Innovative Textile Solutions
(` Crore)
Particulars Current Year Previous YearASSETSFixed Assets 4.72 2.07 Inventories 0.43 0.49 Sundry Debtors 29.08 18.04 Cash and Bank Balances 4.32 4.69 Loans and Advances 15.59 18.68 LIABILITIESCurrent Liabilities 10.17 2.46 Provision 0.05 0.43 Deferred Tax Liability 0.18 0.18 INCOMESales 95.34 89.71 Other Income 1.93 2.75 Increase in Stock 0.18 0.05 EXPENSESManufacturing and Other Expenses 93.01 87.56 Depreciation 0.19 0.11 Provision for Tax 1.10 1.39
28 The Associate companies considered in the consolidated fi nancial statements are:
Sr. No.
Name of the associates Country of Incorporation
Ownership Interest
31-Mar-12
Ownership Interest
31-Mar-111 Grabal Alok (UK) Limited (Refer note no 39(b)) United
Kingdom- 41.72%
2 Ashford Infotech Private Limited* India 50.00% 50.00%3 Alspun Infrastructure Limited India 50.00% 50.00%4 Nirvan Builders Private Limited (liquidated
during the year)India - 33.20%
5 Next Creations Holdings LLC * USA 33.00% 33.00%
* Consolidated based on unaudited fi nancial statements, as approved by the Board of Directors of the company.
Notes to Consolidated Financial Statements For The Year Ended 31 March 2012

200 26 Annual Report 2011-12
29
FIN
AN
CIA
L IN
FO
RM
AT
ION
RE
LA
TIN
G T
O S
UB
SID
IAR
Y C
OM
PA
NIE
S F
OR
TH
E Y
EA
R E
ND
ED
31
MA
RC
H 2
012
(` C
rore
)S
r.
No
.N
ame
of
the
sub
sid
iary
Cap
ital
R
eser
veT
ota
l A
sset
sT
ota
l L
iab
iliti
es *
Inve
stm
ent
(Oth
er t
han
in
vest
men
t in
S
ub
sid
iari
es)
Tu
rno
ver
Pro
fi t
bef
ore
T
ax
Pro
visi
on
fo
r ta
xP
rofi
t af
ter
tax
Pro
po
sed
D
ivid
end
1A
lok
Indu
strie
s In
tern
atio
nal L
imite
d @
0.2
2 (
174.
03)
957
.59
1,1
31.4
0 6
83.6
1 –
(
44.3
4) –
(
44.3
4) –
2A
lok
Infr
astr
uctu
re L
imite
d 0
.05
(7.
73)
1,2
47.4
1 1
,255
.09
1,0
50.2
8 1
91.8
2 (
1.54
) 1
3.46
(
15.0
0) –
3A
lok
HB
Pro
pert
ies
Priv
ate
Lim
ited
$ 0
.05
(0.
05)
–
–
–
–
(0.
04)
–
(0.
04)
–
4A
lok
HB
Hot
els
Priv
ate
Lim
ited
$ 0
.05
(0.
05)
–
–
–
–
(0.
04)
–
(0.
04)
–
5A
lok
Rea
ltors
Priv
ate
Lim
ited
1.7
5 (
0.39
) 1
,456
.89
1,4
55.5
3 –
–
(
0.06
) –
(
0.06
) –
6K
esha
m D
evel
oper
s &
Info
tech
Pvt
. Ltd
2.5
8 5
.89
17.
71
9.2
4 –
–
4
.24
0.9
5 3
.29
–
7S
prin
gdal
e In
form
atio
n &
Tec
hnol
ogy
Pvt
. Lt
d. 0
.60
0.0
3 1
.34
0.7
1 –
–
(
0.17
) –
(
0.17
) –
8A
lok
Land
hol
ding
s P
rivat
e Li
mite
d 0
.50
(0.
33)
24.
92
24.
75
–
–
(0.
11)
–
(0.
11)
–
9A
lok
New
City
Infr
atex
Priv
ate
Lim
ited
$ 0
.05
(0.
05)
–
–
–
–
(0.
04)
–
(0.
04)
–
10A
lok
Aur
anga
bad
Infr
atex
Priv
ate
Lim
ited
$ 0
.05
(0.
05)
–
–
–
–
(0.
04)
–
(0.
04)
–
11M
ileta
, a.s
.^ *
* 6
4.54
(
5.18
) 1
46.9
2 8
7.57
–
1
29.6
7 (
8.77
) –
(
8.77
) –
12A
lok
Eur
opea
n R
etai
l, s.
r.o.
^ **
0.0
6 (
0.69
) 0
.02
0.6
6 –
–
–
–
–
–
13A
lok
Ret
ail (
Indi
a) L
imite
d 0
.05
(35
.39)
54.
43
89.
77
–
29.
26
(10
.92)
–
(10
.92)
–
14A
lok
App
arel
s P
rivat
e Li
mite
d 1
.00
(17
.80)
42.
68
59.
47
–
15.
24
(6.
57)
(2.
21)
(4.
36)
–
15A
lok
Inte
rnat
iona
l Inc
.@ (
*** `
43,2
25/-
) –
***
(
0.04
) 9
0.58
9
0.61
4
.47
142
.33
(0.
29)
–
(0.
29)
–
16A
lok
Inc.
@ *
* 0
.04
0.1
7 0
.25
0.0
4 –
–
–
–
–
–
17A
lok
Sin
gapo
re P
te L
td. @
**
(***
` 4
9/-)
– *
**
(2.
54)
283
.49
286
.03
–
26.
49
(2.
54)
–
(2.
54)
–
18A
lok
Inte
rnat
iona
l (M
iddl
e E
ast)
FZ
E #
**
1.3
1 (
0.38
) 1
.59
0.6
6 –
–
(
0.38
) –
(
0.38
) –
19G
raba
l Alo
k (U
K)
Lim
ited
** (
Ref
er n
ote
no
39(b
)) 4
.65
(17
4.49
) 6
49.6
2 8
19.4
6 –
7
59.1
6 (
151.
76)
–
(15
1.76
) –
20G
raba
l Alo
k In
tern
atio
nal L
imite
d (R
efer
no
te n
o 39
(a))
72.
70
(17
.62)
377
.01
321
.92
333
.53
–
(13
.78)
–
(13
.78)
–
21A
lok
H&
A L
imite
d **
36.
05
(34
.73)
124
.70
123
.38
0.0
1 4
6.60
(
26.3
7) –
(
26.3
7) –
@ B
alan
ce s
heet
item
s ar
e tr
ansl
ated
at c
losi
ng e
xcha
nge
rate
of I
NR
51.
16/U
SD
and
Pro
fi t/(
Loss
) ite
ms
are
tran
slat
ed a
t ave
rage
clo
sing
rat
e of
INR
47.
95/U
SD
^ B
alan
ce s
heet
item
s ar
e tr
ansl
ated
at c
losi
ng e
xcha
nge
rate
of I
NR
2.7
9/C
ZK
and
Pro
fi t/(
Loss
) ite
ms
are
tran
slat
ed a
t ave
rage
clo
sing
rat
e of
INR
2.6
7/C
ZK
# B
alan
ce s
heet
item
s ar
e tr
ansl
ated
at c
losi
ng e
xcha
nge
rate
of I
NR
14.
11/A
ED
and
Pro
fi t/(
Loss
) ite
ms
are
tran
slat
ed a
t ave
rage
clo
sing
rat
e of
INR
13.
55/A
ED
$ Li
quid
ated
dur
ing
the
year
* In
clud
ing
Sha
re A
pplic
atio
n M
oney
** U
naud
ited
fi gur
es
Notes to Consolidated Financial Statements For The Year Ended 31 March 2012

INNOVATIVE TEXTILE SOLUTIONSINNOVATIVE TEXTILE SOLUTIONS
201Innovative Textile Solutions
30 Contingent Liabilities in respect of:
(` Crore)
Sr. No.
Particulars Current Year Previous Year
A Customs duty on shortfall in export obligation in accordance with EXIM Policy(The company is hopeful of meeting the export obligation within the stipulated period)
Amount Unascertained
Amount Unascertained
B Pending Litigation 0.05 0.05
C Guarantees given by banks on behalf of the Company 73.71 28.07
D Bills discounted 214.79 242.94
E Taxation Matters :
a) Income tax demand mainly on account of alleged short deduction of taxes for AY 2010-11 and AY 2011-12 on certain payments. The company has fi led an appeal with the Commissioner of Income Tax (A) and is hopeful of favourable decision.
1.69 –
b) Income Tax demand during the previous years of ̀ 5.91 crore mainly on account of alleged short deposition of TDS amounts arising from wrong TAN numbers mentioned while uploading the TDS return and certain payments not considered by the Tax authorities, although duly paid by the company and short deduction of tax in respect of certain payments with respect to AY 2006-07 to 2009-10. The company had fi led an appeal with the Commissioner of Income Tax (A) and also made application for rectifi cation u/s 154 providing details of amounts paid to the bank. Such rectifi cation was carried out during the year for majority of the amount and for the balance of ` 0.23 crore mainly pertaining to short deduction of taxes, the company is hopeful of favourable decision.
0.23 5.91
c) Demands of Works Contract Tax contested not acknowledged as debts as the company is hopeful of favourable decision.
0.59 0.59
d) Income tax amounting to `11.29 crore, mainly on account of disallowance of interest and expenditure incurred towards exempt income. The company has fi led an appeal with the Commissioner of Income Tax (A) and is hopeful of favourable decision.
11.29 –
F Disputed various matters relating to NTC / ATM* Amount Unascertained
Amount Unascertained
G. Guarantee provided to New City of Bombay Mfg. Mills Limited (Joint Venture company) for loan given to Grabal Alok Impex Limited (51%) (Refer note no 39(a))
– 9.18
* Refer note no 17(i) of provisional fi nancial statements of Aurangabad Textile and Apparel Park Limited
31 Capital Commitment
(` Crore)
Particulars Current Year Previous Year Estimated amount of contracts remaining to be executed on Capital Account and not provided for (Net of advances)
527.17 694.7
Notes to Consolidated Financial Statements For The Year Ended 31 March 2012

202 26 Annual Report 2011-12
32 Related Party Disclosure
a. Names of related parties and nature of relationship
As per Accounting Standard (AS) 18 “Related Party Disclosures”, Company’s related parties disclosed
as below:
I Associate companiesAlspun Infrastructure Ltd. Ashford Infotech Private LimitedGrabal Alok (UK) Limited (Refer note (ii) below ) Nirvan Builders Private LimitedNext Creations Holdings LLC
II Entities under common controlAlok Denims (India) Limited Jiwrajka Associates Private LimitedAlok Finance Private Limited Jiwrajka Investment Private LimitedAlok Knit Exports Limited Niraj Realtors & Shares Private LimitedAlok Textile Traders Nirvan ExportsAshok Realtors Private Limited Nirvan Holdings Private LimitedGrabal Alok Impex Limited (Refer note (ii) below ) Grabal Alok International Limited
(Refer note (ii) below )Buds Clothing Co. Pramatex EnterprisesD. Surendra & Co. Pramita Creation Private LimitedGogri Properties Private Limited Green Park EnterprisesHoney Comb Knit Fabrics Triumphant Victory Holdings Limited.
III Joint VentureAurangabad Textiles & Apparel Parks Limited New City Of Bombay Mfg. Mills Limited
IV Key Management PersonnelAshok B. Jiwrajka Surendra B. JiwrajkaDilip B. Jiwrajka Chandra Kumar Bubna
V Relatives of Key Management PersonnelAlok A. Jiwrajka Vidhi S. JiwrajkaPrita D. Jiwrajka Niraj D. JiwrajkaVarun S. Jiwrajka Suryaprakash Bubna
b. Nature of transactions
(` Crore)Transaction Associates Entities
under common
control
Joint Venture
Companies
Key Management
Personnel
Relatives of Key
Management Personnel
Total
a) Advance Share Application MoneyBalance as at 1st April – – – – – –
(-) (227.57) (-) (-) (-) (227.57)
Received During the year – 350.00 – – – 350.00
(-) (227.57) (-) (-) (-) (227.57)
Balance as at 31st March – 350.00 – – – 350.00
(-) (-) (-) (-) (-) (-)
(b) Long Term BorrowingBalance as at 1st April – 312.55 – – – 312.55
(-) (451.40) (-) (-) (-) (451.40)
Received during the year on amalgamation
– 223.25 – – – 223.25
(-) (133.95) (-) (-) (-) (133.95)
Translation difference during the year – 78.08 – – – 78.08
(-) (-4.90) (-) (-) (-) (-4.90)
Balance as at 31st March – 613.88 – – – 613.88
Notes to Consolidated Financial Statements For The Year Ended 31 March 2012

INNOVATIVE TEXTILE SOLUTIONSINNOVATIVE TEXTILE SOLUTIONS
203Innovative Textile Solutions
(-) (312.55) (-) (-) (-) (312.55)
(c) Unsecured Short Term BorrowingAccepted during the year (on amalgamation)
– 196.95 5.99 – – 202.94
(-) (-) (-) (-) (-) (-)
Balance as at 31st March – 196.95 5.99 – – 202.94
(-) (-) (-) (-) (-) (-)
d) Short Term Loans and AdvancesBalance as at 1st April – 3.84 – – – 3.84
(-) (5.46) (-) (-) (-) (5.46)
Granted during period 0.63 18.72 – – – 19.35
(-) (22.50) (-) (-) (-) (22.50)
Converted / Repaid during the year – 14.26 – – – 14.26
(-) (24.05) (-) (-) (-) (24.05)
Translation difference during the year – 0.29 – – – 0.29
(-) (-0.06) (-) (-) (-) (-0.06)
Balance as at 31st March 0.63 8.59 – – – 9.22
(-) (3.84) (-) (-) (-) (3.84)
e) Non Current InvestmentsBalance as at 1st April 72.54 – – – – 72.54
(0.13) (-) (-) (-) (-) (0.13)
Invested during period (0.02) 3.60 – – – 3.58
(72.41) (-) (-) (-) (-) (72.41)
Translation difference during the year – 0.23 – – – 0.23
(-) (-) (-) (-) (-) (-)
Balance as at 31st March 72.52 3.83 – – – 76.35
(72.54) (-) (-) (-) (-) (72.54)
f) Share Application Money –Non Current InvestmentBalance as at 1st April – 16.16 – – – 16.16
(83.94) (-) (-) (-) (-) (83.94)
Given/(Received) during the year (Net) – 0.08 – – – 0.08
(0.16) (-) (-) (-) (-) (0.16)
Shares Allotted – 16.24 – – – 16.24
(67.94) (-) (-) (-) (-) (67.94)
Balance as at 31st March – – – – – –
(16.16) (-) (-) (-) (-) (16.16)
g) Trade ReceivablesBalance as at 31st March 22.48 0.09 0.03 – – 22.60
(-) (-) (-) (-) (-) (-)
h) Trade payablesBalance as at 31st March – 14.75 9.56 – – 24.31
(-) (-) (0.06) (-) (-) (0.06)
i) Other Current LiabilitiesBalance as at 31st March – 14.75 – – – 14.75
(-) (-) (-) (-) (-) (-)
j) Sale of productsSales of Goods 56.14 – 0.48 – – 56.62
(Including job work charges) (-) (-) (0.71) (-) (-) (0.71)
k) ExpenditurePurchase of goods / Job charges – – 31.22 – – 31.22
(0.03) (-) (42.26) (-) (-) (42.29)
Notes to Consolidated Financial Statements For The Year Ended 31 March 2012

204 26 Annual Report 2011-12
Purchase of Fixed Assets – – – – – –
(* from three directors jointly) (-) (0.62) (0.05) (4.54)* (-) (5.21)
Rent – – – – 0.19 0.19
(-) (-) (-) (-) (0.19) (0.19)
Remuneration – – – 12.20 0.26 12.46
(-) (-) (-) (12.20) (0.26) (12.46)
Upfront Fees – 26.61 – – – 26.61
(-) (-) (-) (-) (-) (-)
Electricity Expenses – 0.02 – – – 0.02
(-) (-) (0.08) (-) (-) (0.08)
Design Charges – 0.14 – – – 0.14
(-) (-) (0.24) (-) (-) (0.24)
Recovery of expenses 2.11 – – – – 2.11
(-) (-) (-) (-) (-) (-)
Interest Paid – 31.05 – – – 31.05
(-) (-) (-) (-) (-) (-)
l) Dividend Paid – – – 1.54 – 1.54
(-) (-) (-) (1.54) (-) (1.54)
m) IncomeRent – 0.23 – – – 0.23
(-) (0.03) (-) (-) (-) (0.03)
n) Contingent LiabilitiesGuarantee Given – – – – – –
(-) (-) (9.18) (-) (-) (9.18)
c. Out of the above items, transaction in excess of 10% of the total Related Party transactions are as under:
Transactions Current YearAmount
Previous YearAmount
a) Advance Share Application MoneyReceived/Adjusted during the yearAlok Knit Exports Ltd. 100.00 – Alok Denim (I) Limited 70.00 – Nirvan Holdings Pvt. Ltd 100.00 – Jiwrajka Investment Pvt. Ltd. 80.00 –
350.00 – Repaid during the yearAlok Finance Pvt. Ltd. – 32.54 Jiwrajka Associate Pvt. Ltd. – 36.39 Jiwrajka Investment Pvt. Ltd. – 48.65 Niraj Realtors & Shares Pvt. Ltd. – 68.77 Nirvan Holdings Pvt. Ltd. – 41.22
– 227.57 b) Long Term Borrowing
Received during the yearTriumphant Victory Holdings Limited (including ` 223.25 crore on amalgamation)
407.86 –
Repaid during the yearTriumphant Victory Holdings Limited – 138.85
c) Unsecured Short Term BorrowingOn amalgamationNew City of Bombay Mfg. Mills Limited 5.99 –
Notes to Consolidated Financial Statements For The Year Ended 31 March 2012

INNOVATIVE TEXTILE SOLUTIONSINNOVATIVE TEXTILE SOLUTIONS
205Innovative Textile Solutions
d) Short term Loans and AdvancesGranted during the yearTriumphant Victory Holdings Limited 8.59 – Alok Knit Exports Limited 4.70 – Nirvan Holdings Private Limited 3.90 –
17.19 –Received/Adjusted during the yearTriumphant Victory Holdings Limited 12.68 – Alok Knit Exports Limited 4.70 – Nirvan Holdings Private Limited 3.89 –
21.27 – e) Non Current Investment
Invested during the yearAshford Infotech Pvt Ltd – 67.94 Triumphant Victory Holdings Limited 3.60 –
f) Share Application Money – Non Current InvestmentReceived during the yearAlspun Infrastructure Limited 0.08 0.16 Shares allotted / repaid during the yearAshford Infotech Pvt Ltd – 67.94
g) Turnover (including job work charges)Grabal Alok Impex Limited – 86.29 Next Creations Holdings LLC 56.14 – Grabal Alok ( UK ) Limited – 80.60
h) ExpenditurePurchase of GoodsNew City of Bombay Mfg. Mills Limited 30.93 41.67
Transactions Current YearAmount
Previous YearAmount
RentVarun Jiwrajka 0.10 – Vidhi Jiwrajka 0.10 – Remuneration:Ashok B. Jiwrajka 3.05 3.05 Chandrakumar Bubna 3.05 3.05 Dilip B. Jiwrajka 3.05 3.05 Surendra B. Jiwrajka 3.05 3.05
12.20 12.20 Electricity ExpensesNew City of Bombay Mfg. Mills Limited 0.02 – Design ChargesNew City of Bombay Mfg. Mills Limited 0.14 0.48
Recovery of ExpensesNext Creations Holdings LLC 2.11 –
i) Dividend Paid:Ashok B. Jiwrajka 0.50 0.50 Dilip B. Jiwrajka 0.51 0.51 Surendra B. Jiwrajka 0.53 0.53
1.54 1.54
Notes to Consolidated Financial Statements For The Year Ended 31 March 2012

206 26 Annual Report 2011-12
j) IncomeRent ReceivedAlok Denim (India) Limited 0.18 – Alok Knit Exports Limited 0.05 –
0.23 – k) Guarantee Given on loan given to Grabal Alok Impex
LimitedNew City of Bombay Mfg. Mills Limited – 9.18
Note:
i Previous year fi gures are given in brackets.
ii Grabal Alok Impex limited was amalgamated with the company w.e.f 1 April 2011 and consequently, Grabal Alok international Limited and Grabal Alok (UK) Limited became subsidiaries of the company from 1 April 2011. Transactions and balances with/of such companies for the previous year and as at 31 March 2011 have been considered accordingly in the current year related party disclosure as above. (Refer note no 39)
33 Employee Stock Option Scheme(ESOS)
In 2011, the shareholders of the Company approved the Employee Stock Option Scheme (“Alok Industries Limited – ESOS 2010 Scheme”) vide postal ballot, in accordance with the Securities and Exchange Board of India (ESOP & ESOS) Guidelines, 1999. Such scheme provides for grant of options up to 25,000,000 options to the eligible employees and /or directors of the Company and / or its subsidiaries. The exercise price for such options can be up to 50% discount to the market price as per the discretion of the compensation committee. 10,791,500 options were granted during the year and 10,587,950 options were outstanding as on 31 March 2012. Such options vest over a period of two years, 50% at the end of one year from the date of grant and 50% at the end of two years from the date of grant.
Details of options granted duly approved by the Remuneration and Compensation Committee under the said scheme are as under:
Grant Date No. of Options granted
Options surrended /
lapsed
Closing Balance Exercise Price
Vesting period
20-Apr-11 1,280,000 18,000 1,262,000 18.90 Up to 20 April 2013
20-Apr-11 9,511,500 185,550 9,325,950 21.42 Up to 20 April 2013
TOTAL 10,791,500 203,550 10,587,950
The Company has followed the Intrinsic Value-based method of accounting for stock options granted, based on Guidance Note on Accounting for Employee Share-based Payments, issued by the Institute of Chartered Accountants of India, and accordingly, compensation cost of ` 4.67 crore has been recorded during the year on such grant. The compensation cost recognised as a charge during the year was ` 2.27 crore. Had the compensation cost for the Company’s stock based compensation plan been determined in the manner consistent with the fair value approach as described in the Guidance note, the Company’s net income would be lower by ` 4.20 crore and earnings per share as reported would be lower as indicated below:
Particulars Year-2012
Basic and Dilutive Earnings per share
As reported (In `) 1.15
Adjusted (In `) 1.10
The Company has adopted Black Scholes option pricing model to determine the fair value of stock options. The fair value of each option granted in 2012 is estimated on the date of grant based on the following assumptions:
Notes to Consolidated Financial Statements For The Year Ended 31 March 2012

INNOVATIVE TEXTILE SOLUTIONSINNOVATIVE TEXTILE SOLUTIONS
207Innovative Textile Solutions
Particulars Year-2012Expected life (years) 1 year from the
date of vestingRisk free interest rate (%) 7.83%Volatility (%) 39%
34 Earnings per share (EPS)
(` Crore)31-Mar-12 31-Mar-11
a. Nominal value of equity shares per share ( In Rupees) 10 10 b. Basic & Diluted EPS
Net Profi t Available for Equity Shareholders 92.99 311.54 Weighted average number of Equity Shares – Basic 811,187,390 787,784,357 Basic Earnings per share (Rupees) 1.15 3.95 Add : Shares to be issued in ESOS 46,286 – Weighted average number of Equity Shares – Dilutive 811,233,676 787,784,357 Diluted Earnings per share (Rupees) 1.15 3.95
35 Employee benefi t plans:
i. Defi ned contribution plans:
(a) Amounts recognised as expenses towards contributions to provident fund, superannuation and other similar funds by the Company including for it’s subsidiary companies and joint venture companies in India are ` 10.75 crore (previous year ` 8.13 crore) for the year ended 31 March 2012.
(b) The Company contributed ` 8.17 crore (previous year ` 7.57 crore) towards various other defi ned contribution plans of subsidiaries located outside India during year ended March 31, 2012 as per laws of the respective country.
ii. Defi ned benefi t plans:
In respect of holding company, subsidiary companies and joint venture companies in India :
(a) Gratuity Plan:
The Company makes annual contribution to the Employee’s Group Gratuity Assurance Scheme, administered by the Life Insurance Corporation of India (‘LIC’), a funded defi ned benefi t plan for qualifying employees. The scheme provides for lump sum payment to vested employees at retirement, death while in employment or on termination of employment of an amount equivalent to fi fteen days salary payable for each completed year of service or part thereof in excess of six months. Vesting occurs on completion of fi ve years of service.
(b) Compensated absences:
Employees’ entitlement to compensated absences in future periods based on unavailed leave as at balance sheet date, as per the policy of the Company, is expected to be a long term benefi t and is actuarially valued.
The following table sets out the status of the gratuity plan for the year ended 31 March 2012 as required under AS 15 (Revised)
(` Crore)
PARTICULARS Gratuity (funded) as
on 31-Mar-12
Gratuity (funded) as
on 31-Mar-11
Change in Defi ned Benefi t ObligationOpening Defi ned Benefi t Obligation 15.40 10.77 Current Service Cost 4.34 3.53
Notes to Consolidated Financial Statements For The Year Ended 31 March 2012

208 26 Annual Report 2011-12
Interest Cost 1.55 1.15 Actuarial (gain)/loss (0.71) 0.27 Past Service cost – Vested Benefi t – – Benefi ts Paid (0.33) (0.32)Closing Defi ned Benefi t Obligation 20.25 15.40 Change in Fair Value of assetsOpening Fair value of assets 4.71 2.85 Expected Return on Plan Assets 0.36 0.23 Actuarial Gain 0.26 0.08 Contribution by Employer 2.40 1.87 Benefi ts Paid (0.33) (0.32)Closing Fair Value of Plan Assets 7.40 4.71 Net Liability 12.85 10.69
Expense to be recognised in statement of Profi t and Loss Account
PARTICULARS Year ended 31-Mar-12
Year ended 31-Mar-11
Current Service Cost 4.34 3.53 Interest on Defi ned Benefi t Obligation 1.55 1.15 Expected Return on Plan Assets (0.36) (0.23)Net Actuarial (gain)/loss (0.97) 0.19 Past Service cost – vested benefi t recognised during the year – – Total Included in Employment Expenses 4.56 4.64 Actual Return on Plan Assets 0.60 0.30 Category of Assets as on 31 MarchInsurer Managed Fund 7.40 4.71
The assumptions used in accounting for gratuity are set out below:
PARTICULARS Year ended 31-Mar-12
Year ended 31-Mar-11
Discount rate 8.70% 8.05%Rate of increase in compensation levels of covered employees 9.00% 9.00%Expected Rate of return on plan assets * 7.50% 7.50%
* Expected rate of return on plan assets is based on expectation of the average long term rate of return expected to prevail over the estimated term of the obligation on the type of the investments assumed to be held by LIC, since the fund is managed by LIC. The estimates of future salary increases, considered in actuarial valuation, takes into account the infl ation , seniority , promotions and other relevant factors.
Experience Adjustments
PARTICULARS Year ended31-Mar-
1231-Mar-
1131-Mar-
1031-Mar-
0931-Mar-
08Defi ned benefi t obligation 20.25 15.40 10.68 6.67 –Plan Assets 7.40 4.71 2.86 2.24 –Surplus / (Defi cit) (12.74) (10.60) (7.82) (4.43) –Experience Adjustments on plan Liabilities
1.09 0.71 0.16 – –
Experience Adjustments on plan Assets
0.26 0.08 0.07 – –
Notes to Consolidated Financial Statements For The Year Ended 31 March 2012

INNOVATIVE TEXTILE SOLUTIONSINNOVATIVE TEXTILE SOLUTIONS
209Innovative Textile Solutions
Asset Allocations
Since the investments are held in the form of deposit with LIC, these are not volatile and the market value of assets is the cost value of assets and has been accordingly considered for the above disclosure.
36 Segment Reporting
i) Primary Segment: Geographical Segment
The company is in the business of manufacturing of Textile products. Considering its high level of international operations and present internal fi nancial reporting based on geographical location of customer, the company has identifi ed geographical segment as primary segment.
The geographic segment consists of:
a) Domestic (Sales to Customers located in India)
b) International (Sales to Customers located outside India)
Revenue directly attributable to segments is reported based on items that are individually identifi able to that segment. The company believes that it is not practical to allocate segment expenses, segment results, assets used, except debtors, in the company’s business or liabilities contracted since the resources / services / assets are used interchangeably within the segments. Accordingly, no disclosure relating to same is made. All fi xed assets are located in India.
(` Crore)
Particulars CurrentYear
Previous Year
Segment RevenueOperating Revenue – SalesDomestic [Net of Excise duty of ` 233.95 crore (Previous year ` 112.48 crore)]
5,940.26 4,259.04
International 3,813.27 2,342.70Job Charges collected (Domestic) 31.19 13.16Total segment revenue 9,784.72 6,614.90Segment AssetsSundry DebtorsDomestic 1,535.47 1,609.67International 668.53 204.53
2,204.00 1,814.20
ii) Secondary Segment: Business Segment
The Group is operating in a single business segment i.e. Textile and as such all business activities revolve around this segment. Hence, there is no separate secondary segment to be reported considering the requirement of AS 17 on “Segment Reporting”
37 During the year, the company has transferred investments in the form of equity capital and cumulative redeemable preference shares in Alok Industries International Limited (“Alok BVI”) & Grabal Alok International Limited (“Grabal BVI”), its two wholly owned subsidiary companies to Alok Infrastructure Limited (“Alok Infra”), another wholly owned subsidiary as a strategy to consolidate all investible assets under one umbrella. During the previous year, vide a novation agreement, the Company had taken over the obligation of Grabal Alok (UK) Limited, (then an associate company of Alok BVI & Grabal BVI, in the United Kingdom) towards its liability pertaining to a JPY/USD foreign currency derivative. Consequent to the sale of shares in Alok BVI and Grabal BVI to Alok Infra, Alok Infra has taken over such obligation of Alok Industries Limited during the current year and provided an amount of ` 35.85 crore (previous year ` 15.47 crore) towards such obligation.
38 The company has taken premises for operating stores on operating lease. Lease rentals paid during the year are recognised as an expense as per Accounting Standard 19 (AS-19) “Leases”. Details of lease rentals payable in future are as follows:
Notes to Consolidated Financial Statements For The Year Ended 31 March 2012

210 26 Annual Report 2011-12
Sr. No.
Due ` Crore
1 With in one year 12.172 Later than one year and not later than 5 years 44.533 Later than 5 years 70.87
Total 127.57
Lease rentals aggregating to ` 26.57 crore (previous year ` 22.91 crore) recognised during the year in statement of Profi t & Loss
39 a) During the year, the Honourable High Court, Bombay sanctioned the scheme of amalgamation (‘scheme’) between the Company (transferee) and Grabal Alok Impex Limited (transferor) with appointed date of 1 April 2011. Grabal Alok Impex Limited is in the business of manufacturing embroidery textiles. The scheme has been effective from 1 March 2012.
The Company issued 22,485,000 equity shares of ` 10 each to shareholders of Grabal Alok Impex Limited (of which 1,900,000 shares were issued to Alok Benefi t Trust) considering exchange ratio of 1:1 as per the scheme. There were no signifi cant differences in accounting policies of two companies. The Company has accounted for such amalgamation under ‘pooling of interest’ method as under;
` croreCarrying value of Fixed assets (including CWIP ` 18.94 crore) 193.51Carrying value of Investments (including ` 31.34 crore in 62.59Transferee company through Alok Benefi t Trust)Inventories 46.00Debtors 37.50Cash & Bank balances 147.00Loans & Advances 16.85Total Assets 503.45Current liabilities & Provisions 55.82Long term borrowings 113.15Short Term Borrowings 145.79Deferred Tax Liabilities 16.78Share warrants 20.40Total Liabilities 351.94Shares issued 22.49Reserves taken over 129.02
Current year fi gures of the Company include amount of revenue of `160.96 crore & profi t before tax of ` 7.58 crore for the year.
On such amalgamation, Grabal Alok International Limited, the wholly owned subsidiary of Grabal Alok Impex Limited, has now become a wholly owned subsidiary.
b) The Company vide Alok Industries International Limited (Alok BVI), held 42% stake in Grabal Alok (UK) Limited, (“GAUK”) and Grabal Alok Impex Limited, vide its wholly owned subsidiary, Grabal Alok International Limited, held 48.71% stake in GAUK. On amalgamation, GAUK, an associate company of both companies until March 31, 2011, has now become a majority owned subsidiary of Alok Industries Limited.
Accordingly, the Company has consolidated the fi nancial statements of GAUK on a line by line basis and Goodwill aggregating to ` 448.00 crore has been recognised in these fi nancial statements on consolidation. While Grabal Alok (UK) Limited had embarked upon a plan for revamping its retailing operations in the United Kingdom, the same has not made much headway and the operations have recorded losses eroding the net worth, in view of the current economic downturn in the UK. The Management believes that the current performance, impacted by the diffi cult economic situation in the UK as above, is not indicative of the long term economic value of the investment. On the basis of objective assessment made by the management, no provision for impairment of goodwill aggregating to ` 448.00 crore is considered necessary.
Notes to Consolidated Financial Statements For The Year Ended 31 March 2012

INNOVATIVE TEXTILE SOLUTIONSINNOVATIVE TEXTILE SOLUTIONS
211Innovative Textile Solutions
40 During the previous year, Deutsche Bank, Singapore Branch subscribed to unsecured fl oating rate compulsory convertible bonds issued by Alok Industries International Limited (“Alok BVI”) and Grabal Alok (“GAUK”) Limited, a company incorporated in the United kingdom (subsidiary) of the company, of USD 56.5 million each, with a green shoe option of USD 25 million. Such bonds are convertible into Class A preference shares of Alok Industries International Limited (“Alok BVI”) of USD 1.00 each (USD 56.50 million) and ordinary shares of GAUK of GBP 0.001 each. (USD 56.50 million) at the end of maturity (July 2014). Grabal Alok International Limited (“Grabal BVI”), a subsidiary company and Alok BVI, have agreed to purchase such bonds from the holders on scheduled put option dates between the 33rd month (July 2013) to 42nd month (April 2014) from the issue date. The payment obligations under the put option are inter alia secured by way of pledge of 93.21% of shareholding of Alok BVI in Mileta, a.s. – a step down subsidiary of the Company and 90.43% shareholding of Alok BVI and Grabal BVI in GAUK, an associate of the Company. Further, these bonds are secured by subservient charge on current and movable assets of the company which was created by executing a Deed of Hypothecation on 28th October, 2010 in favour of AXIS Trustee Services Limited, Mumbai, India
41 During the year, Triumphant Victory Holdings limited (“TVHL”) a promoter group company, obtained a loan from Axis Bank. Such loan is secured by all assets of Grabal Alok (UK) Limited, the Company’s majority owned subsidiary company.
42 i Due to unusual depreciation in the value of the Indian Rupee (INR) against US Dollar (USD) during the year, the exchange loss/ gain arising out of :
a) Restatement of foreign currency liabilities/assets, and;
b) Mark to Market (MTM) losses on foreign exchange derivatives taken by the Company, has been presented as an exceptional item with corresponding changes for the previous year.
ii The Company, during the year, based on the announcement of the ICAI (Accounting for derivatives), has accounted for derivative forward exchange contracts taken towards highly probable forecast transactions and fi rm commitments, at fair values considering the principles of recognition and measurement stated in AS-30 ‘Financial Instruments: Recognition and Measurement’. Consequent upon such change, the profi t after tax for the year ended 31 March 2012 is higher by ` 16.78 crore and reserves and surplus are lower by an equivalent amount. Fair value (net loss) of the derivative instruments identifi ed as cash fl ow hedges is ` 16.78 crore as at 31 March 2012, which is expected to be reclassifi ed to the profi t and loss account over the next year.
iii Fair values (Mark to Market values) (loss) of Foreign currency options , Interest rate swaps and forward contracts (other than those considered for hedging) as at 31 March 2012 aggregating to ` 179.57 crore (previous year ` 72.96 crore) has been accounted for by the Company. Such fair values are based on the report of counter parties. MTM losses on such derivatives of ` 106.61 crore have been recognised during the year.
iv Derivative contracts entered into by the company and outstanding as on 31 March 2012 for hedging currency and interest rate related risks. Nominal amounts of derivative contracts entered into by the company and outstanding as on 31 March 2012 amount to ` 3,554.72 crore (previous year ` 2,908.71 crore). Category wise break-up is given below.
Sr. No.
Particulars 31-Mar-12 31-Mar-11
1 Interest Rate SwapsUSD/INR 476.73 280.68JPY/INR 1,150.00 743.27EUR/INR 150.00 –
1,776.73 1,023.952 Currency Options * 1,201.21 1,342.263 Forward Contracts 500.05 475.524 Foreign Currency Derivative (USD/JPY) (Refer note no 37) 76.73 66.98
Total 3,554.72 2,908.71
* Represents monthly currency option for receivables, maturing over a period of 5 years
Notes to Consolidated Financial Statements For The Year Ended 31 March 2012

212 26 Annual Report 2011-12
v. The year end foreign currency exposure that has not been hedged by derivative instruments or otherwise are as below:
a) Amount receivable in foreign currency on account of the following
Particulars Foreign Currency
Current Year Previous YearAmount
in foreign currency
Rupees (Crore)
Amount in foreign currency
Rupees (Crore)
Debtors USD – – 0.79 35.41EUR 0.19 12.99 0.09 5.51GBP 0.00* 0.06 0.01 0.48CZK – – 12.25 31.81
Cash & Bank Balance CZK – – 2.62 7.00EUR 0.00* 0.01 – –USD 0.02 1.10 – –
Fixed Deposit USD 0.65 33.50 – –
b) Amount payable in foreign currency on account of the following
Particulars Foreign Currency
Current Year Previous YearAmount
in foreign currency
Rupees Amount in foreign currency
Rupees
Secured Loans USD 27.69 1,416.91 26.56 1,185.78JPY 184.87 115.42 182.81 98.76EUR 4.39 300.24 1.69 106.78CZK – – 3.11 8.07
Interest accrued but not due on loans
USD 0.01 0.76 0.06 2.80
EUR 0.03 2.09 0.02 1.44Unsecured Loan USD 2.00 102.31 7.00 312.55
EUR 1.52 103.94 1.77 112.22Sundry creditors USD 2.90 148.49 7.74 345.72
JPY – – 4.31 2.33EUR 0.06 3.82 – –CHF 0.00* 0.16 – –
* CHF 27,571
43 In line with the amended Accounting Standard (AS) 11 – ‘Effect of changes in Foreign Exchange Rates’, the Company has chosen to exercise the option under paragraph 46 inserted in the Standard by the notifi cation.
i) Added to fi xed assets/ capital work-in-progress ` 114.47 crore (previous year ` 23.48 crore) being exchange difference on long term monetary items relatable to acquisition of fi xed assets.
ii) Carried forward ` 0.99 crore (previous year ` (0.22) crore) in the ‘Foreign Currency Monetary Item Translation Difference Account’ being the amount remaining to be amortised as at 31 March 2012.
44 The Revised Schedule VI has become effective from 1 April, 2011 for the preparation of fi nancial statements. This has signifi cantly impacted the disclosure and presentation made in the fi nancial statements. Previous year’s fi gures have been regrouped / reclassifi ed wherever necessary to correspond with the current year’s classifi cation / disclosure.
Signatures to Notes 1 to 44In terms of our report attached For and on behalf of the BoardFor Deloitte Haskins & Sells For Gandhi & Parekh Ashok B. Jiwrajka Executive ChairmanChartered Accountants Chartered Accountants Dilip B. Jiwrajka Managing Director
Surendra B. Jiwrajka Jt. Managing DirectorR. D. Kamat Devang B. Parekh Sunil O. Khandelwal Chief Financial Offi cerPartner Partner K. H. Gopal President (Corporate Affairs) &
Company SecretaryMumbai: 18 May 2012 Mumbai: 18 May 2012
Notes to Consolidated Financial Statements For The Year Ended 31 March 2012

INNOVATIVE TEXTILE SOLUTIONSINNOVATIVE TEXTILE SOLUTIONS
213Innovative Textile Solutions
NOTES

214 26 Annual Report 2011-12
NOTES

INNOVATIVE TEXTILE SOLUTIONSINNOVATIVE TEXTILE SOLUTIONS
215Innovative Textile Solutions
��
AFFIX 15 PS.
REVENUE STAMP
PROXY FORMALOK INDUSTRIES LIMITED
Registered Offi ce : 17/5/1 & 521/1, Rakholi / Saily, Silvassa - 396230 Union Territory of Dadra and Nagar Haveli
REGD FOLIO
DP. ID
DP ID CLIENT ID
PROXY NO.
NO. OF SHARES
I/We ________________________________ of __________________________________ in the district
of ___________________________________________________ being a member/members of Alok
Industries Limited, hereby appoint ________________________________________________________ of
__________________ or failing him __________________________ of _________________ in the district of
________________________________ as my/our proxy to attend and vote for me/us and on my/our behalf at
the Twenty Sixth Annual General Meeting of the Company to be held on Tuesday, the 14th day of August
2012 at 12.00 noon at the Registered Offi ce of the Company at 17/5/1, 521/1, Village Rakholi/ Saily, Silvassa
– 396 230, UT of Dadra and Nagar Haveli, and at any adjournment thereof.
Signed on this ____________day _________of 2012
_________________________ Signature(s) of Member(s)
Note : The Proxy in order to be effective should be duly stamped, completed and signed and must be deposited at the Registered Offi ce of the Company not less than 48 hours before the time for holding the aforesaid meeting. The proxy need not be a member of the Company.
ATTENDANCE SLIPALOK INDUSTRIES LIMITED
Registered Offi ce : 17/5/1 & 521/1, Rakholi / Saily, Silvassa - 396230 Union Territory of Dadra and Nagar Haveli
Folio No. /DP. ID : _________________________________________________
Client ID No. : _________________________________________________
Name & Address : _________________________________________________
_________________________________________________
_________________________________________________
I hereby record my presence at the Twenty Sixth Annual General Meeting of the Company being held on Tuesday, the 14th day of August, 2012 at 12.00 noon at the Registered Offi ce of the Company at 17/5/1, 521/1, Village Rakholi/ Saily, Silvassa – 396 230, UT of Dadra and Nagar Haveli.
_________________________ Signature(s) of Member(s) Proxy attending the meeting
Please complete this Attendance Slip and bring the slip to the Meeting.
INNOVATIVE TEXTILE SOLUTIONSINNOVATIVE TEXTILE SOLUTIONS

216 26 Annual Report 2011-12


IINNNNOOVVAATTIIVVEE TTEEXXTTIILLEE SSOOLLUUTTIIOONNSS