
Alma Mater Studiorum - Benvenuto su AMS Tesi di...
138
Alma Mater Studiorum – Universit` a di Bologna DOTTORATO DI RICERCA IN Ingegneria Elettronica, Informatica e delle Telecomunicazioni Ciclo XXVII Settore concorsuale di afferenza: 09/H - INGEGNERIA IN- FORMATICA Settore scientifico disciplinare: ING-INF/05 SISTEMI DI ELAB- ORAZIONE DELLE INFORMAZIONI DISTRIBUTED INFORMATION SYSTEMS AND DATA MINING IN SELF-ORGANIZING NETWORKS Presentata da: Tommaso Pirini Coordinatore Dottorato Prof. Alessandro Vanelli-Coralli Relatore Prof. Gianluca Moro Co-Relatore Prof. Claudio Sartori Esame finale anno 2015-2016
-
Upload
truonghanh -
Category
Documents
-
view
222 -
download
0
Transcript of Alma Mater Studiorum - Benvenuto su AMS Tesi di...
Alma Mater Studiorum – Universita di Bologna
DOTTORATO DI RICERCA IN
Ingegneria Elettronica, Informatica e delleTelecomunicazioni
Ciclo XXVII
Settore concorsuale di afferenza: 09/H - INGEGNERIA IN-FORMATICA
Settore scientifico disciplinare: ING-INF/05 SISTEMI DI ELAB-ORAZIONE DELLE INFORMAZIONI
DISTRIBUTED INFORMATION SYSTEMSAND DATA MINING IN
SELF-ORGANIZING NETWORKS
Presentata da: Tommaso Pirini
Coordinatore DottoratoProf. Alessandro Vanelli-Coralli
RelatoreProf. Gianluca Moro
Co-RelatoreProf. Claudio Sartori
Esame finale anno 2015-2016

2
Contents
1 Introduction 5
2 Peer-to-Peer Networks 92.1 P2P Architectures . . . . . . . . . . . . . . . . . . . . . . . . 10
2.1.1 Unstructured Networks . . . . . . . . . . . . . . . . . . 102.1.2 Structured Networks . . . . . . . . . . . . . . . . . . . 112.1.3 Hybrid Networks . . . . . . . . . . . . . . . . . . . . . 13
2.2 P2P Applications . . . . . . . . . . . . . . . . . . . . . . . . . 142.3 Security and trust in P2P networks . . . . . . . . . . . . . . . 14
2.3.1 Intellectual Property and Network Neutrality . . . . . 162.4 An application to Autonomic Security . . . . . . . . . . . . . 17
2.4.1 P2P Data Mining Classifiers for Decentralized Detec-tion of Network Attacks . . . . . . . . . . . . . . . . . 18
2.4.2 Literature on Distributed Data Mining . . . . . . . . . 192.4.3 AdaBoostM1 Algorithm . . . . . . . . . . . . . . . . . 202.4.4 Distributed AdaBoostM1-MultiModel . . . . . . . . . . 232.4.5 Distributed AdaBoostM1-SingleModel . . . . . . . . . 242.4.6 Experiments Setup . . . . . . . . . . . . . . . . . . . . 252.4.7 Simulation Results . . . . . . . . . . . . . . . . . . . . 292.4.8 Conclusions . . . . . . . . . . . . . . . . . . . . . . . . 34
3 Multi-dimensional Data Indexing for Efficient Routing andContent Delivery in P2P Networks 373.1 Related works on P2P Data Structures . . . . . . . . . . . . . 393.2 G-Grid . . . . . . . . . . . . . . . . . . . . . . . . . . . . . . . 42
3.2.1 Structure and Features . . . . . . . . . . . . . . . . . . 423.2.2 G-Grid in P2P Environments . . . . . . . . . . . . . . 473.2.3 Performance Analysis . . . . . . . . . . . . . . . . . . . 50
3
3.2.4 Robustness . . . . . . . . . . . . . . . . . . . . . . . . 533.3 Experiments . . . . . . . . . . . . . . . . . . . . . . . . . . . . 553.4 Results . . . . . . . . . . . . . . . . . . . . . . . . . . . . . . . 56
4 Self-Balancing of Traffic Load in a Hierarchical Multidimen-sional P2P System 614.1 Reasons for the Improvements . . . . . . . . . . . . . . . . . . 624.2 Treelog Routing Algorithm and Alternative Load Balancing
Methods in G-Grid . . . . . . . . . . . . . . . . . . . . . . . . 644.2.1 Isomorphism of a Chord Ring on G-Grid . . . . . . . . 644.2.2 Treelog Routing Algorithm . . . . . . . . . . . . . . . . 714.2.3 Cooperative Construction of Logarithmic Link . . . . . 774.2.4 Peer Joins and Exits Into the Network . . . . . . . . . 84
4.3 Experiments . . . . . . . . . . . . . . . . . . . . . . . . . . . . 874.4 Results . . . . . . . . . . . . . . . . . . . . . . . . . . . . . . . 89
5 A Bit of Randomness to Build Distributed Data IndexingStructures With Network Load Balancing 975.1 Related Works on P2P Load Balancing . . . . . . . . . . . . . 985.2 G-Grid Improvements . . . . . . . . . . . . . . . . . . . . . . . 101
5.2.1 Load Distribution in G-Grid . . . . . . . . . . . . . . . 1015.2.2 G-Grid with Learning . . . . . . . . . . . . . . . . . . 1015.2.3 G-Grid with Chord Ring . . . . . . . . . . . . . . . . . 1025.2.4 G-Grid as Small World . . . . . . . . . . . . . . . . . . 106
5.3 Experiments . . . . . . . . . . . . . . . . . . . . . . . . . . . . 1075.4 Results . . . . . . . . . . . . . . . . . . . . . . . . . . . . . . . 108
6 Conclusions 113
Appendices 117
A Distribution on C3P Framework 119A.1 Requirements of the CI to calculate sensitivity values . . . . . 122
Bibliography 123
4
Chapter 1
Introduction
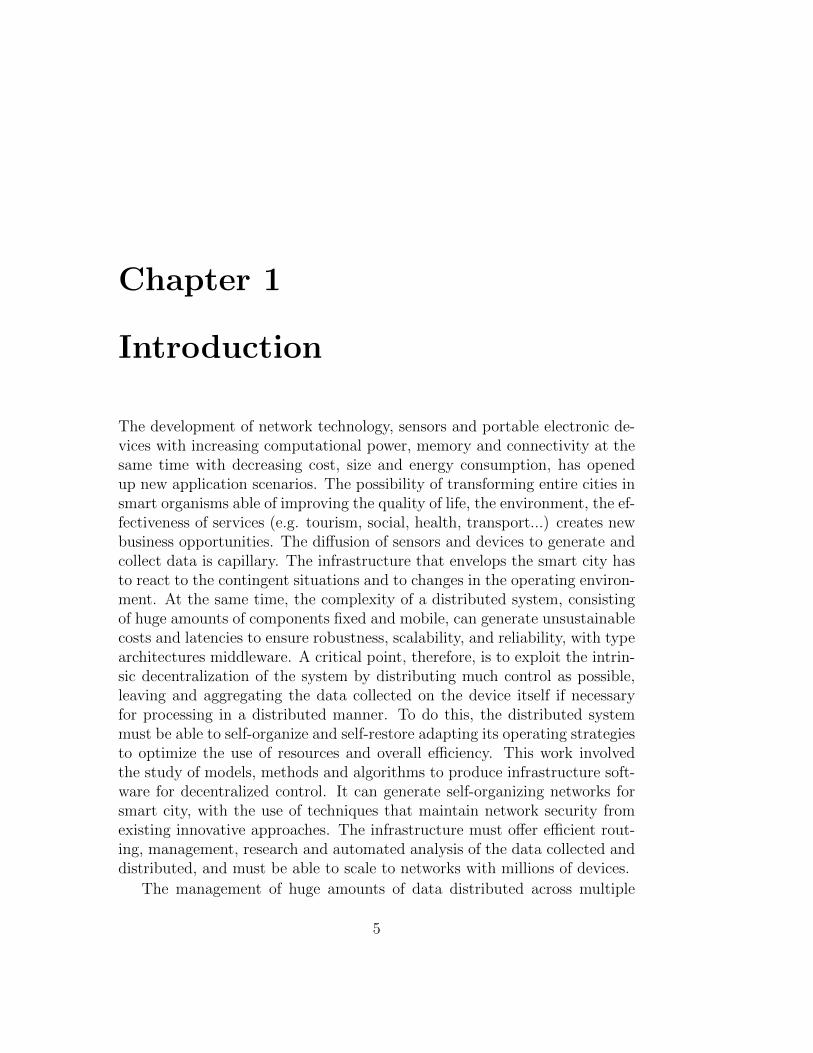
The development of network technology, sensors and portable electronic de-vices with increasing computational power, memory and connectivity at thesame time with decreasing cost, size and energy consumption, has openedup new application scenarios. The possibility of transforming entire cities insmart organisms able of improving the quality of life, the environment, the ef-fectiveness of services (e.g. tourism, social, health, transport...) creates newbusiness opportunities. The diffusion of sensors and devices to generate andcollect data is capillary. The infrastructure that envelops the smart city hasto react to the contingent situations and to changes in the operating environ-ment. At the same time, the complexity of a distributed system, consistingof huge amounts of components fixed and mobile, can generate unsustainablecosts and latencies to ensure robustness, scalability, and reliability, with typearchitectures middleware. A critical point, therefore, is to exploit the intrin-sic decentralization of the system by distributing much control as possible,leaving and aggregating the data collected on the device itself if necessaryfor processing in a distributed manner. To do this, the distributed systemmust be able to self-organize and self-restore adapting its operating strategiesto optimize the use of resources and overall efficiency. This work involvedthe study of models, methods and algorithms to produce infrastructure soft-ware for decentralized control. It can generate self-organizing networks forsmart city, with the use of techniques that maintain network security fromexisting innovative approaches. The infrastructure must offer efficient rout-ing, management, research and automated analysis of the data collected anddistributed, and must be able to scale to networks with millions of devices.
The management of huge amounts of data distributed across multiple
5
sites is becoming more and more important. Peer-to-peer systems (P2P)can offer solutions to face the requirements of managing, indexing, searchingand analyzing data in scalable and self-organizing fashions, such as in cloudservices and big data applications, just to mention two of the most strategictechnologies for the next years. To this purpose P2P systems should overcomesome drawbacks, such as the issue of the traffic load unbalancing acrosstheir autonomous and heterogenous nodes. Moreover, most P2P systemsbecome popular in the literature, such as Chord and Tapestry, are inefficientin processing multi-dimensional exact and range queries over any arbitrarycombination of data attributes because their indexing models do not supportnatively these kind of multi-dimensional queries.
In this thesis we present G-Grid, a multi-dimensional distributed dataindexing able to efficiently execute arbitrary multi-attribute exact and rangequeries in decentralized P2P environments. Moreover G-Grid guaranteesthe completeness of the query results like any DBMSs. In G-Grid data canbe distributed on various autonomous peers, without a centralized manage-ment. Peers organize themselves by local interactions among neighbors, andthe total decentralization of control makes it suitable for intra-organisationalapplications, e.g. distributed data center of a single company, and inter-organisational applications, e.g. Bitcoin. G-Grid is adaptive regarding dy-namic changes in network topology. G-Grid is a foundational structure andcan be effectively used in a wide range of application environments, includinggrid computing, cloud and big data domains. We present several experimentsto compare G-Grid with recent and efficient P2P structures presented in liter-ature. The results show that G-Grid further improves network managementand traffic overlay.
This efforts have focused primarily on improving the number of hops andthe number of structure maintenance messages. However, the massive use ofthese P2P networks caused the emerging problem of the traffic load balanc-ing. Two of the main causes that create inequalities in the traffic distributionare the non-uniform distribution of data and the hierarchical structures. Infact, G-Grid is basically organized as a binary tree and this causes an unbal-anced traffic load, overburdening the peers as much as they are close to thetree root. To equally balance the load on this kind of hierarchical P2P sys-tems, rather than imposing globally some load balancing rules, we seamlessintegrated a ring-based overlay in G-Grid that leads to the emergent prop-erty of self-balancing. Experiments show how drastically the new integratedoverlay, which lead to the new P2P systems we call G-Grid Chord, improve
6
the balancing according to an almost uniform load distribution among nodes.Nevertheless we detected in the last improvement on the structure a huge
growing of maintenance system traffic into the network, so we decided tomade a further step to enhance the G-Grid structure introducing a bit ofrandomness. It is obtained by merging G-Grid Chord with a Small Worldnetwork. The Small World networks whereas are structures of compromisebetween order and randomness. These networks are derived from social net-works and show an almost uniform traffic distribution. There are, in fact, alot of algorithms introducing a bit of randomness to produce huge advantagesin efficiency, cutting maintenance costs, without losing efficacy. Experimentsshow how this new hybrid structure obtains the best performance in trafficdistribution and it a good settlement for the overall performance on the re-quirements desired in the modern data systems.
This thesis starts with Chapter 2 on P2P Networks, with an applicationstudied initially on autonomic security. Chapter 3 describes the basic versionof G-Grid and its features. Chapter 4 presents the evolution of G-Grid usingthe organised overlay Chord to improve load balancing. Finally in Chapter 5we describe the last improvement of the G-Grid structure produced by themerging with the Small World network principles. At the end of each chap-ter there are experiments that show the concrete performances of the newintroduced improvements.
In closing, the Appendix A is described the work developed during thePhD at the cole Polytechnique Fdrale de Lausanne, Switzerland, as collabo-ration with the Distributed Information Systems Laboratory (LSIR) directedby Prof. Karl Aberer.
7

8
Chapter 2
Peer-to-Peer Networks
Peer-to-Peer (P2P) networks are virtual communities on the Internet whereparticipants directly connect with one another or where they use an interme-diate service to directly connect with one another. Usually, in this distributedapplication architectures all the participants, called peers, are equally privi-leged and have the same capabilities and responsibilities. Unlike the client-server model, in which the client makes a service request and the serverfulfils the request, the P2P network model allows each peer to function asboth client and server. Each peer makes a portion of their resources, such asprocessing power, disk storage, network bandwidth or simply data, directlyavailable to other network peers, without the need for central organizationby servers or stable hosts [117].
P2P systems can be used to provide anonymized routing of network traf-fic, massive parallel computing environments, distributed storage and otherfunctions. Typically, P2P applications allow users to control many param-eters of operation: how many member connections to seek or allow at onetime; whose systems to connect to or avoid; what services to offer; and howmany system resources to devote to the network. Some simply connect tosome subset of active nodes in the network with little user control, however.
Although uses for the P2P networking topologies have been explored sincethe days of ARPANET, the advantages of the P2P communications modeldid not become obvious to the general public until the late 1990s, when music-sharing P2P applications like Napster appeared. Napster and its successors,like Gnutella, and more recently, BitTorrent, cut into music and movie indus-try profits and changed how people thought about acquiring and consumingmedia. Most P2P programs indeed are focused on media sharing and P2P is
9
therefore often associated with software piracy and copyright violation.
Today, there is a huge amount of P2P systems. Their growing success isowed to the spread broadband and ADSL flat increasingly accessible.
2.1 P2P Architectures
P2P networks are designed around the notion of equal peer nodes simulta-neously functioning as both clients and servers to the other nodes on thenetwork. P2P networks generally implement some form of virtual overlaynetwork on top of the physical network topology, where the nodes in theoverlay form a subset of the nodes in the physical network. Data is stillexchanged directly over the underlying TCP/IP network, but at the appli-cation layer peers are able to communicate with each other directly, via thelogical overlay links, each of which corresponds to a path through the under-lying physical network. Overlays are used for indexing and peer discovery,and make the P2P system independent from the physical network topology.Based on how the nodes are linked to each other within the overlay network,and how resources are indexed and located, P2P networks come in threeflavors [5, 57, 151]:
• Unstructured networks
• Structured networks
• Semi-structured or hybrid networks
We see specifically what are these categories’ features.
2.1.1 Unstructured Networks
Unstructured P2P networks do not impose a particular structure on theoverlay network by design, but rather are formed by nodes that randomlyform connections to each other [35, 103]. Examples of unstructured P2Pprotocols are the following:
• Gnutella: the first open and decentralized P2P network for file sharingcreated by Justin Frankel of Nullsoft [113];
10
• Gossip protocols: style of computer-to-computer communication pro-tocol inspired by the form of gossip seen in social networks. The termepidemic protocol is sometimes used as a synonym for a gossip protocol,because gossip spreads information in a manner similar to the spreadof a virus in a biological community [30];
• Kazaa: P2P file sharing application using the FastTrack protocol li-censed by Joltid Ltd. and operated as Kazaa by Sharman Networks [74,36].
Because there is no structure globally imposed upon them, unstructurednetworks are easy to build and allow for localized optimizations to differentregions of the overlay [22]. Also, because the role of all peers in the networkis the same, unstructured networks are highly robust in the face of high ratesof “churn” – that is, when large numbers of peers are frequently joining andleaving the network [55, 119].
However the main limitations of unstructured networks also arise fromtheir lack of structure. In fact, when a peer wants to find a desired informa-tion in the network, the search query must be flooded through the networkto find as many peers as possible that share the data. Flooding causes avery high amount of traffic in the network, uses more peer resources – likeCPU/memory by requiring every peer to process all search queries –, anddoes not ensure that the desired information will always be found and de-livered. Furthermore, since there is no correlation between a peer and thecontent managed by it, there is no guarantee that flooding will find a peerthat has the desired information. Popular content is likely to be available atseveral peers and any peer searching for it is likely to find the same thing.But if a peer is looking for rare data shared by only a few other peers, thenit is highly unlikely that search will be successful [119].
2.1.2 Structured Networks
In structured P2P networks the overlay is organized into a specific topology.This makes the search for a resource in the network extremely efficient –typically approximating O(log N), where N is the number of nodes in thenetwork –, even if the resource is rare.
Usually the structured P2P networks employ a Distributed Hash Table(DHT) [110, 129], in which a variant of consistent hashing is used to assign
11
ownership of each resource to a particular peer [60, 28]. This enables peers tosearch for resources on the network using a hash table: that is, (key, value)pairs are stored in the DHT, and any peer can retrieve the value associatedwith a given key [93, 81]. Other design structures are overlay rings andd-Torus [12].
In order to route traffic efficiently through the network, nodes in a struc-tured overlay must maintain lists of neighbors that satisfy specific criteria.This makes them less robust in networks where nodes frequently join andleave the overlay [79, 71]. More recent evaluation of P2P resource discoverysolutions under real workloads have pointed out several issues in DHT-basedsolutions such as high cost of advertising/discovering resources and staticand dynamic load imbalance [11].
However DHTs are used in several notable distributed networks such as:
• BitTorrent: protocol for P2P file transfer [24] that makes many smalldata requests over different IP connections to different machines, in-stead of a single TCP connection to a single machine. BitTorrent down-loads in a random or in a “rarest-first” [69] approach that ensures highavailability with respect to sequential downloads. This protocol pro-vides no way to index torrent files;
• Kad network: P2P network which implements the Kademlia over-lay protocol [82], that specifies the structure of the network and theexchange of information through node lookups, using UDP;
• Storm botnet: famous P2P remotely controlled network of MicrosoftWindows computer [54] used a modified version of the eDonkey/Overnetcommunications protocol [123];
• YaCy: free P2P search engine without main server with indices andwhere each Linux-server with an installed YaCy separate downloads,indexes the Web and processes user queries to search for documentsthrow other servers in the YaCy network. YaCy uses DHT for defined,simple and effective allocation documents between nodes: nodes calcu-late (key; value) pairs for all documents in the network and then usethese pairs for looking for and getting required file by participating inrequired DHT [95];
• Coral Content Distribution Network (CoralCDN): P2P contentdistribution network that offers high performance and meets huge de-
12
mand in accessing web contents. CoralCDN automatically replicatecontent as a side effect of users accessing it and avoid creating hotspots. It achieves this through Coral, a latency-optimized hierarchicalindexing infrastructure based on a distributed “sloppy” hash table [37].
Some prominent research projects in structured P2P networks include:
• Chord project: distributed lookup protocol that maps a key onto anode that stores a particular data item, characterized by that key [125].Chord uses a variant of consistent hashing [59] to assign keys to nodes.Chord is routing a key through a sequence of O(logN) other nodestoward the destination, where N is the nodes in the network;
• PAST storage utility: large-scale, distributed, persistent storage sys-tem based on Pastry P2P overlay network [115, 116, 32]. Pastry im-plements a DHT where the (key; value) pairs are stored in a redundantP2P network;
• P-Grid: self-organized and emerging overlay network which can ac-commodate arbitrary key distributions, providing storage load-balancingand efficient search by using randomized routing [3, 2];
• CoopNet: content distribution system for off-loading serving to peerswho have recently downloaded the file. It assigns peers to other peerswho are locally close to its neighbors – same IP prefix range. If multiplepeers are found with the same file the system chooses the fastest nodeof that peer’s neighbors [101].
DHT-based networks have also been widely utilized for accomplishingefficient resource discovery for grid computing systems, as it aids in resourcemanagement and scheduling of applications [109, 108].
2.1.3 Hybrid Networks
Hybrid systems, like Spotify [64], combine P2P and client-server princi-ples [29]. A common hybrid model is to have a central server that helpspeers find each other. There are a variety of hybrid models, all of whichmake trade-offs between the centralized functionality provided by a struc-tured server/client network and the node equality afforded by the pure P2Punstructured networks. Tipically, this systems distribute their peers into two
13
groups: clients nodes and overlay nodes. Each peer is able to act accordingthe momentary need of the network and can become part of the overlay usedto coordinate the P2P structure, such as in the Gnutella protocol.
Currently, hybrid models have better performance than either pure un-structured networks or pure structured networks because certain functions,such as searching, do require a centralized functionality but benefit from thedecentralized aggregation of nodes provided by unstructured networks [143].
2.2 P2P Applications
The most popular application of the P2P principle is the file-sharing, thatmade P2P popular. The use of P2P file-sharing software, such as BitTorrentclients, is responsible for the bulk of P2P internet traffic. From 2004 on,such networks form the largest contributor of global network traffic on theInternet.
In P2P networks, clients both provide and use resources. This meansthat, potentially, the content serving capacity of P2P networks can actuallyincrease as more users begin to access the content, especially with protocolsthat require users to share, such as BitTorrent. This property is one of themajor advantages of using P2P networks because it makes the setup and run-ning costs very small for the original content distributor [72, 127]. Sharingcomputational power is mainly used for problem solving or complex calcu-lations. Some examples are SETI@Home [?], the Great Internet MersennePrime Search (GIMPS) [138], Distributed.net [1].
Some multimedia applications use P2P protocols, like P2PTV and PDTP [131],for the diffusion of high data streams generated in real time. Usign trasmis-sion bandwidth of individual peers there are not required huge server per-formances, but that peers are provided with high bandwidth connections inboth reception and trasmission.
Other P2P applications are P2P-based digital cryptocurrencies, like forexamples Bitcoin [92] and alternatives such as Peercoin [122], and so on.
2.3 Security and trust in P2P networks
P2P systems pose some challenges also from a computer security perspective.What makes this particularly dangerous, however, is that P2P applications
14
act as servers as well as clients, meaning that they can be more vulnerable toremote exploits [133], like routing attacks and handling corrupted data andmalware.
Since each node plays a role in routing traffic through the network, ma-licious users can perform a variety of routing attacks or denial of serviceattacks. Examples of common routing attacks include:
• incorrect lookup routing: whereby malicious nodes deliberately for-ward requests incorrectly or return false results,
• incorrect routing updates: where malicious nodes corrupt the rout-ing tables of neighboring nodes by sending them false information,
• incorrect routing network partition: where when new nodes arejoining they bootstrap via a malicious node, which places the new nodein a partition of the network that is populated by other malicious nodes.
On the other hand, the prevalence of malware varies between differentP2P protocols. Studies analyzing the spread of malware on P2P networksfound, for example, that 63% of the answered download requests on theLimewire network contained some form of malware, whereas only 3% of thecontent on OpenFT contained malware. Another study analyzing trafficon the Kazaa network found that 15% of the 500,000 file sample taken wereinfected by one or more of the 365 different computer viruses that were testedfor [46].
Corrupted data can also be distributed on P2P networks by modifyingfiles that are already being shared on the network. For example, on theFastTrack network, the Recording Industry Association of America (RIAA)managed to introduce malicious code into downloads and downloaded filesin order to deter illegal file sharing [121]. Consequently, the P2P networks oftoday have seen an enormous increase of their security and file verificationmechanisms. Modern hashing, chunk verification and different encryptionmethods have made most networks resistant to almost any type of attack,even when major parts of the respective network have been replaced by fakedor nonfunctional hosts [120].
Some P2P networks (e.g. Freenet) place a heavy emphasis on privacy andanonymity – that is, ensuring that the contents of communications are hid-den from eavesdroppers, and that the identities/locations of the participantsare concealed. Public key cryptography can be used to provide encryption,
15
data validation, authorization, and authentication for data/messages. Onionrouting and other mix network protocols (e.g. Tarzan) can be used to provideanonymity [133].
2.3.1 Intellectual Property and Network Neutrality
Although P2P networks can be used for legitimate purposes, rights holdershave targeted P2P over the involvement with sharing copyrighted material.Companies developing P2P applications have been involved in numerous le-gal cases, primarily in the United States, primarily over issues surroundingcopyright law [45]. Two major cases are Grokster vs RIAA and MGM Stu-dios, Inc. v. Grokster, Ltd.1. In both of the cases the file sharing technologywas ruled to be legal as long as the developers had no ability to prevent thesharing of the copyrighted material. Moreover, controversies have developedover the concern of illegitimate use of P2P networks regarding public safetyand national security. When a file is downloaded through a P2P network, itis impossible to know who created the file or what users are connected to thenetwork at a given time.
P2P applications present one of the core issues in the network neutralitycontroversy. Internet service providers (ISPs) have been known to throttleP2P file-sharing traffic due to its high-bandwidth usage [120]. Comparedto Web browsing, e-mail or many other uses of the internet, where data isonly transferred in short intervals and relative small quantities, P2P file-sharing often consists of relatively heavy bandwidth usage due to ongoingfile transfers and swarm/network coordination packets. ISPs rationale wasthat P2P is mostly used to share illegal content, and their infrastructureis not designed for continuous, high-bandwidth traffic. On the other hand,critics point out that P2P networking has legitimate legal uses, and that thisis another way that large providers are trying to control use and contenton the Internet, and direct people towards a client-server-based applicationarchitecture. The client-server model provides financial barriers-to-entry tosmall publishers and individuals, and can be less efficient for sharing largefiles. As a reaction to this bandwidth throttling, several P2P applicationsstarted implementing protocol obfuscation, such as the BitTorrent protocolencryption [53]. Techniques for achieving “protocol obfuscation” involvesremoving otherwise easily identifiable properties of protocols, such as deter-
1http://www.copyright.gov/docs/mgm/
16
ministic byte sequences and packet sizes, by making the data look as if itwere random. The ISP’s solution to the high bandwidth is P2P caching,where an ISP stores the part of files most accessed by P2P clients in orderto save access to the Internet.
The promotion of network neutrality is no different than the challengeof promoting fair evolutionary competition in any privately owned environ-ment, whether a telephone network, operating system, or even a retail store.Government regulation in such contexts invariably tries to help ensure thatthe short-term interests of the owner do not prevent the best products or ap-plications becoming available to end-users. The same interest animates thepromotion of network neutrality: preserving a Darwinian competition amongevery conceivable use of the Internet so that the only the best survive [139].
2.4 An application to Autonomic Security
At first, to study the properties of some structured P2P networks, we de-veloped a simulator applied to the topic of network security, working withthe telecommunications engineering research team of the Prof. Callegati2
(Alma Mater Studiorum – University of Bologna). This work was partiallysupported by the Italian MIUR Project Autonomous Security in the PRIN2008 Programme.
In this work [20] we proposed new distributed data mining algorithmsto recognize network attacks against a set of devices from statistic datagenerated locally by each device according to the standard Simple NetworkManagement Protocol (SNMP) available in each modern operating systems.The idea is to place an autonomous mining resource in each network nodethat cooperates with its neighbors in a P2P fashion in order to reciprocallyimprove their detection capabilities. Differently from existing security so-lutions, which are based on centralized databases of attack signatures andtransmissions of huge amount of raw traffic data, in this solution the networknodes exchange local knowledge models of few hundred bytes. The approachefficacy has been validated performing experiments with several types of at-tacks, with different network topologies and distributions of attacks so as toalso test the node capability of detecting unknown attacks.
2http://www.unibo.it/Faculty/default.aspx?UPN=franco.callegati%40unibo.
it
17
2.4.1 P2P Data Mining Classifiers for DecentralizedDetection of Network Attacks
Data mining aims to automatically discover new knowledge from huge amountof data useful to explain or predict unknown phenomenon. Most of the cur-rent techniques have been developed for centralized systems where all theavailable data is collected in a single site. However, the growing need toapply these techniques to large data sets distributed over the network, hasled to the deployment of distributed data mining algorithms [78, 62, 26, 77,84, 85, 86, 90]. Recently several distributed data mining algorithms havebeen introduced, however the best approaches are inadequate to work indecentralized systems where nodes are in general autonomous and may ar-bitrarily leave and join the system, for instance because belong to differentorganizations or people.
We introduced two novel distributed classification algorithms taking in-spiration from a well-known centralized algorithm called AdaBoost [39]. Ad-aBoost has been used for distributed analysis and in parallel processing sofar. The previous approaches deal with performance improvements aspectsand data aggregation. In this work, the new AdaBoost algorithms are usedto generate and share knowledge models across network of autonomous re-sources.
We then show how these algorithms have been applied to network securityin which an attacker attacks a single or a group of host. In particular, we haveinvestigated a collaborative behavior between network entities in which eachone does not share huge amount of raw data, as it happens in decentralizedsystems, but rather sharing only knowledge models. The shared knowledgemodels, which consist only of few hundred bytes, are locally generated fromlocal data according to the Simple Network Monitoring Protocol (SNMP),available in every operating systems. [19] achieved optimal results generatingknowledge models according to an unsupervised solution, in which, differentlyfrom this new contribution, we shared SNMP data among peers.
The cooperation among peers benefits are mainly in the exchange ofknowledge models. In the first place, this produces a strong decrease ofthe traffic amount in the network, for example with respect to the exchangeof raw records. The latter would probably achieve the same result or bet-ter, but the records of which each peer derives its knowledge models withthe mining algorithm can be huge and very dynamic – constantly changing.When the network have been distributed knowledge models generated by
18
centralized data, these may no longer be valid because the environmentalsituation changes rapidly. This is true as far as the network is extensiveand real. Exchanging the models the system exchange the same knowledge,because the mining algorithm is the same for each node, but in a higher leveland more convenient. This is an advantage for the scalability of the system:if the network is very large, leading all records at each node or in a centralnode to be analyzed is not convenient, also in terms of consistency, in moderndynamic scenarios. The knowledge models are useful to nodes that receivethem because they represent guidelines to judge – in this example, classify –their raw data – in particular in this example data generated by the SNMP– according mining models derived from other data, that carriers new infor-mation. We want to reach the results obtained grouping into a single nodeall raw data for a centralized analysis and handing out the global knowledgemodels. This in many practical situations it is not possible for obvious rea-sons: dynamic environments, huge amount of raw data that changes quicklyand continuously, very large networks, etc.
2.4.2 Literature on Distributed Data Mining
Extracting information from very large distributed data-bases is a big chal-lenge for data mining. Many databases are too big to be collected at a singlesite, and centralized training could be very slow in these specific cases. Todaysome databases are inherently distributed and cannot be unified for a longlist of reasons.
For example, in a real-time environment, large amounts of data couldbe collected so often and in different patterns, which in the time requiredto make them consistent in a single structure would have lost their validity.As well, in distributed environments, it may happen that the effectivenessof certain information is limited to a single environment, so if you collectedthem all in a single database, some data may lose consistency.
Therefore it is very difficult to be able to design a single classificationalgorithm under these constraints. For example, the classification modelconstruction to detect credit card frauds needs a huge strictly distributeddata set. In addition, there are some databases having a large amounts ofnew data, available periodically or in real time. Re-training a new model onan entire data set it is both inefficient and expensive since each at time thereis a significant increase or a change of data.
Some researchers have proposed the use of classification techniques to
19
solve this problem. In general, standard algorithms have been developed,such as adding incremental induction on training of decision trees [130] andimplementing an incremental ruled-based learner [23]. Another idea proposedis to parallelize learning algorithms – such as the parallel rule induction [105],the construction of decision trees [16] and association rules [4, 50].
An alternative way is to combine multiple classifiers: this approach is alsoknown as “the meta-learning”. [21] proposed to train classifiers on differenttraining set partitions. [15] used a statistical method to combine classifierswith voting, trained on a part of the original training set. The combinationadvantage is so the system can use many learning algorithms but every singlealgorithm is independent of the other one. [42] present a parallelization ofAdaBoost [39] balancing workload on the “master-worker” strategy. [34]studied two new techniques using AdaBoost to combine classifiers. In thefirst case, they only choose samples from the complete weighted trainingset to create classifiers are expected to be “weaker” than one trained fromthe complete training set. However, boosting can still increase the overallaccuracy of the voted ensemble after many rounds. In the second case, theyregard the AdaBoost weight updating formula as a way of assigning weightsto classifiers in a weighted voting ensemble. With this approach, they havean opportunity to reuse old classifiers on new data sets and learn a newclassifier to concentrate on portions of the new data where the old classifiersperform poorly.
These techniques use distributed and online learning techniques, and havebeen developed on JAM [126], a framework of data mining Agent-based sys-tems. In general, the characteristics of software agents, such as autonomy,adaptability and decision-making, match very well to distributed system re-quirements, and also to distributed data mining.
2.4.3 AdaBoostM1 Algorithm
AdaBoostM1 [40] is a widely used method, designed for classification. It isa meta-algorithm which uses different classification models according to alearning technique called boosting [137].
Let assume that the learning algorithm is able to handle instances witha weight, represented by a positive number (we will review this assumptionlater). The weighted instances change the way it calculates the classifiererror: in this case, error is the sum of the weights of misclassified instances,divided by the total weight of all the instances, instead of the fraction of
20
misclassified instances. At each iteration, the learning algorithm focus on aparticular set of instances, which has the highest weight. These records areimportant because there is a greater incentive to classify them properly. TheC4.5 algorithm [106, 107, 63] is a learning method that can handle weightedinstances.
The algorithm starts assigning the same weight to every instance of thetraining set, then calls the learning algorithm, which builds a classifier andassigns a new weight to each instance, based on the outcome of his analysis:the weight of instances correctly classified will be decreased and the weightof misclassified instances is increased. This produces a subset of “easy”instances, with low weight, and a subset of “hard” instances, with higherweight. In successive iterations, the generated classifiers focus their evalua-tion on “hard” instances and up to date the weights. It is possible to getdifferent situations, for example, instances could become easier, or otherwisecontinuously increase their weight. After each iteration, the weights reflecthow many times each instance has been misclassified by the classifiers pro-duced up to that point. Maintaining a measure of the “difficulty” in eachinstance, this procedure provides an effective way to generate complementaryclassifiers.
How much weight should be changed after each iteration? It depends onthe error of the overall classification. In particular, if e (a fraction betweenzero and one) denotes the error of a classifier with weighted data, then theweights of correctly classified instances will be updated as follows:
weighti+1 ← weighti ×e
1− e
while misclassified instances will remain unchanged. This obviously doesnot increase the weight of misclassified instances, as stated earlier. However,after all weights have been updated, they are normalized so the weight of eachmisclassified instance increases and that of each correctly classified instancedecreases. Whenever the error on training data is weighted equal to or greaterthan 0.5, the current classifier is deleted and the algorithm stops. The samething happens when the error is zero, because otherwise all the weights ofthe instances would be cancelled.
After the training session, we obtain a set of classifiers. In order toevaluate them, there is a voting system. A classifier that performs well onthe training set (e close to zero) receives a high mark, while a classifier thatperforms bad (e close to 0.5) receives a low mark. In particular, the following
21
equation is used for the assignment of votes:
vote = − loge
1− e,
which always returns a positive number. This formula also explains whythe perfect classifiers on the training set must be eliminated: in fact, whene is equal to zero the weight of the vote is not defined. To classify a newinstance you have to add the votes of all the classifiers and the class obtainsthe highest score is assigned to the instance.
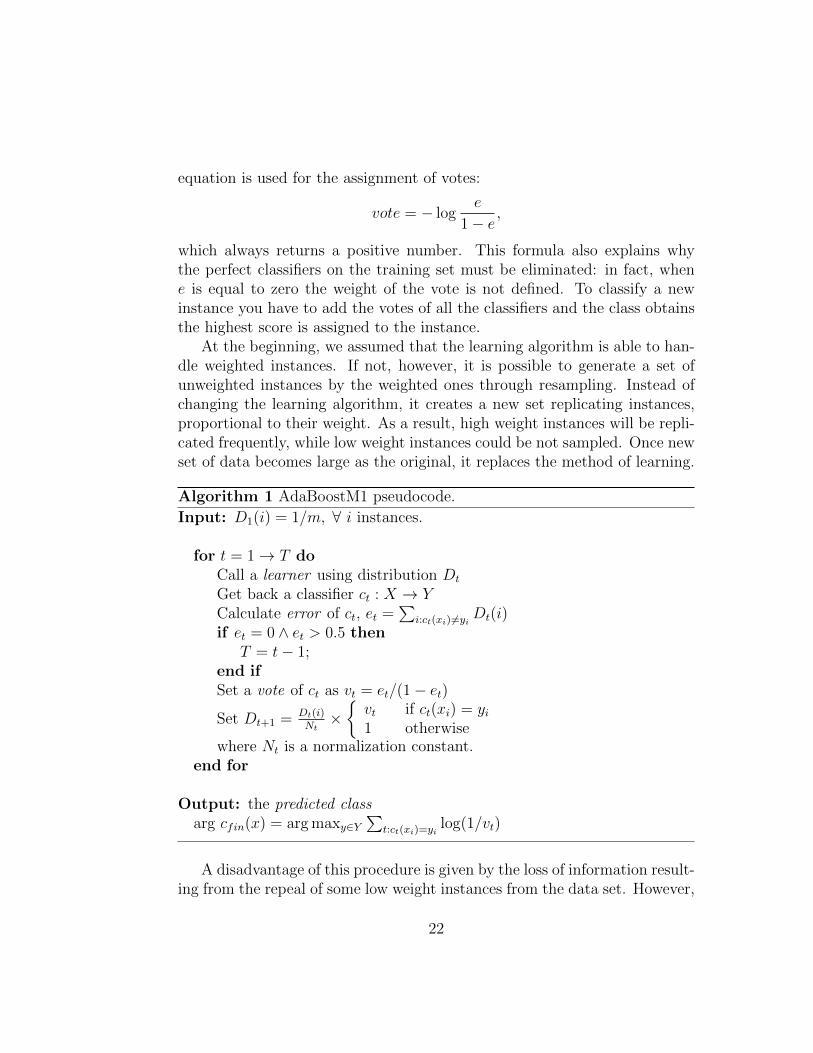
At the beginning, we assumed that the learning algorithm is able to han-dle weighted instances. If not, however, it is possible to generate a set ofunweighted instances by the weighted ones through resampling. Instead ofchanging the learning algorithm, it creates a new set replicating instances,proportional to their weight. As a result, high weight instances will be repli-cated frequently, while low weight instances could be not sampled. Once newset of data becomes large as the original, it replaces the method of learning.
Algorithm 1 AdaBoostM1 pseudocode.
Input: D1(i) = 1/m, ∀ i instances.
for t = 1→ T doCall a learner using distribution Dt
Get back a classifier ct : X → YCalculate error of ct, et =
∑i:ct(xi)6=yi
Dt(i)if et = 0 ∧ et > 0.5 then
T = t− 1;end ifSet a vote of ct as vt = et/(1− et)
Set Dt+1 = Dt(i)Nt×{
vt if ct(xi) = yi1 otherwise
where Nt is a normalization constant.end for
Output: the predicted classarg cfin(x) = arg maxy∈Y
∑t:ct(xi)=yi
log(1/vt)
A disadvantage of this procedure is given by the loss of information result-ing from the repeal of some low weight instances from the data set. However,
22
this can be turned into an advantage. When the learning algorithm generatesa classifier whose error is greater than 0.5, the process of boosting must end ifwe use weighted data directly, but if you use a resampled data set, you couldstill produce a classifier with an error less of 0.5 generating a new resampleddata set, maybe with a different seed. Resampling can be performed alsowhen using the original version of the algorithm with weighted instances.
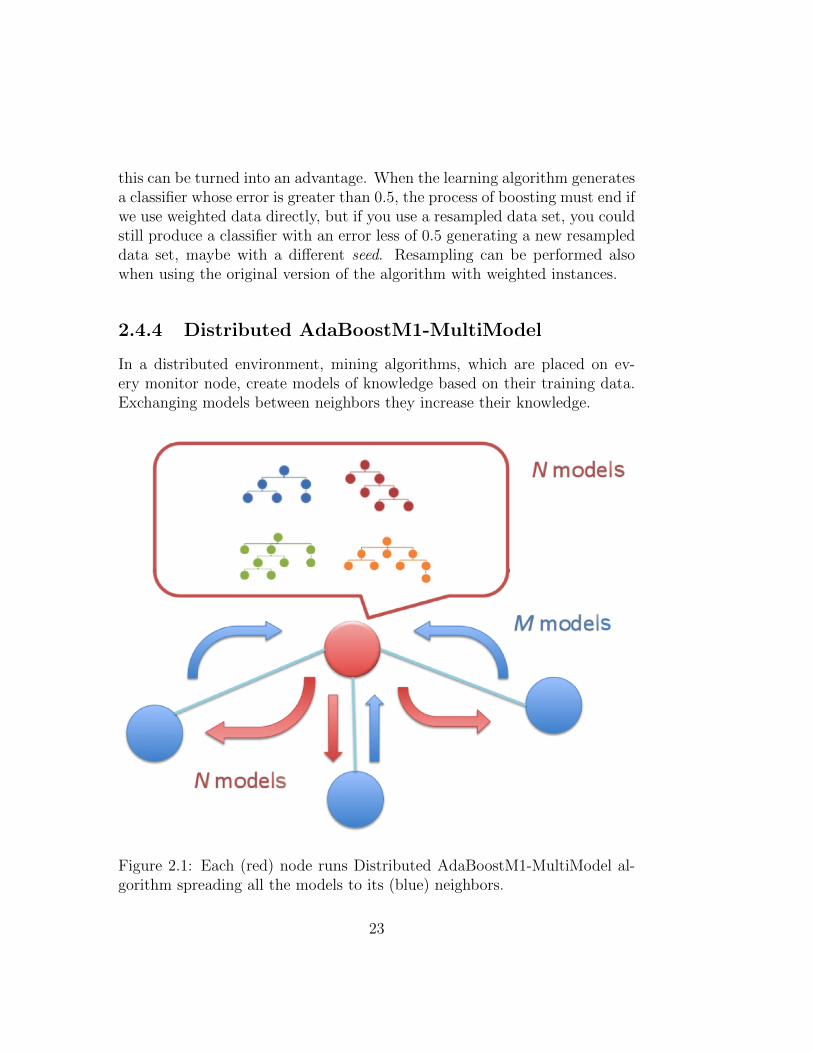
2.4.4 Distributed AdaBoostM1-MultiModel
In a distributed environment, mining algorithms, which are placed on ev-ery monitor node, create models of knowledge based on their training data.Exchanging models between neighbors they increase their knowledge.
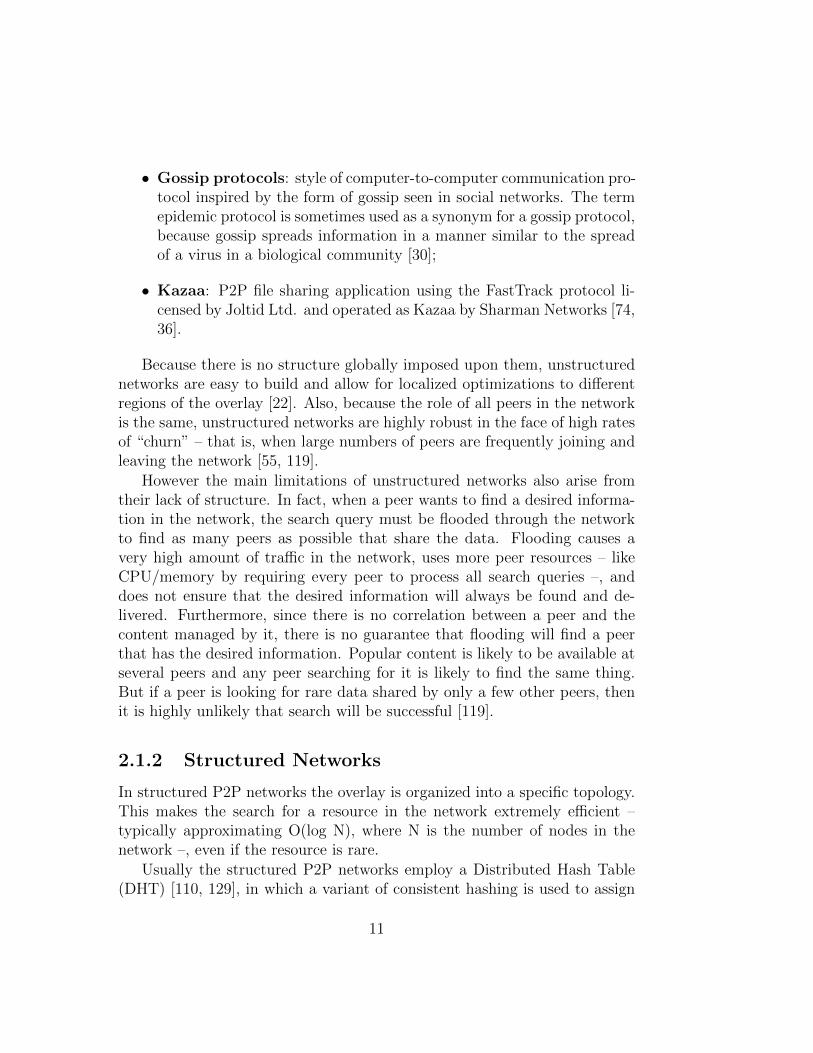
Figure 2.1: Each (red) node runs Distributed AdaBoostM1-MultiModel al-gorithm spreading all the models to its (blue) neighbors.
23
During the first iteration of the algorithm, each monitor node runs theAdaBoostM1 algorithm on its training set. The result is a series of classifi-cation models – i.e., decision trees (assuming to use C4.5 mining algorithm).In this first phase, each mining engine does not care about their neighbors.
Once all nodes have generated models based on their local data, thealgorithm continues with the next phase: knowledge sharing. Each nodeobtain the result of the previous iteration of every neighbors, the knowledgemodels previously built according to local data now are going to be changedaccording to the new neighbors data. In this way, in the global system, thereis an exchange of information not in the form of data, but of classifiers, whichoffer an higher level of abstraction and less network traffic - since a model issmaller than a data set. In this context, however, we do not examine issuesrelated to network communication between nodes, because the execution ofthe algorithm is simulated in a static way.
After that, classifiers collected from neighbors are added to classifiers gen-erated on the local data to extend the knowledge of each monitor node. Thisknowledge is evaluated on a the test set of instances. Each test instance re-ceives the class label that gets the most votes from all the available classifiersin the monitor node.
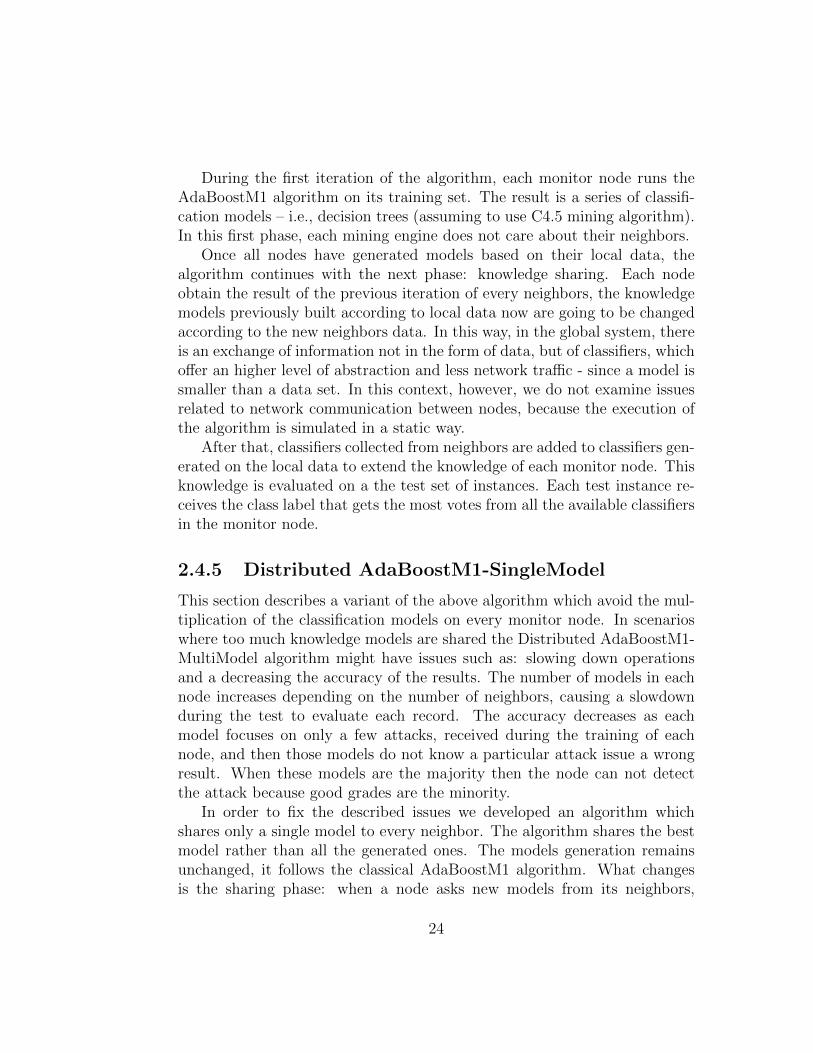
2.4.5 Distributed AdaBoostM1-SingleModel
This section describes a variant of the above algorithm which avoid the mul-tiplication of the classification models on every monitor node. In scenarioswhere too much knowledge models are shared the Distributed AdaBoostM1-MultiModel algorithm might have issues such as: slowing down operationsand a decreasing the accuracy of the results. The number of models in eachnode increases depending on the number of neighbors, causing a slowdownduring the test to evaluate each record. The accuracy decreases as eachmodel focuses on only a few attacks, received during the training of eachnode, and then those models do not know a particular attack issue a wrongresult. When these models are the majority then the node can not detectthe attack because good grades are the minority.
In order to fix the described issues we developed an algorithm whichshares only a single model to every neighbor. The algorithm shares the bestmodel rather than all the generated ones. The models generation remainsunchanged, it follows the classical AdaBoostM1 algorithm. What changesis the sharing phase: when a node asks new models from its neighbors,
24

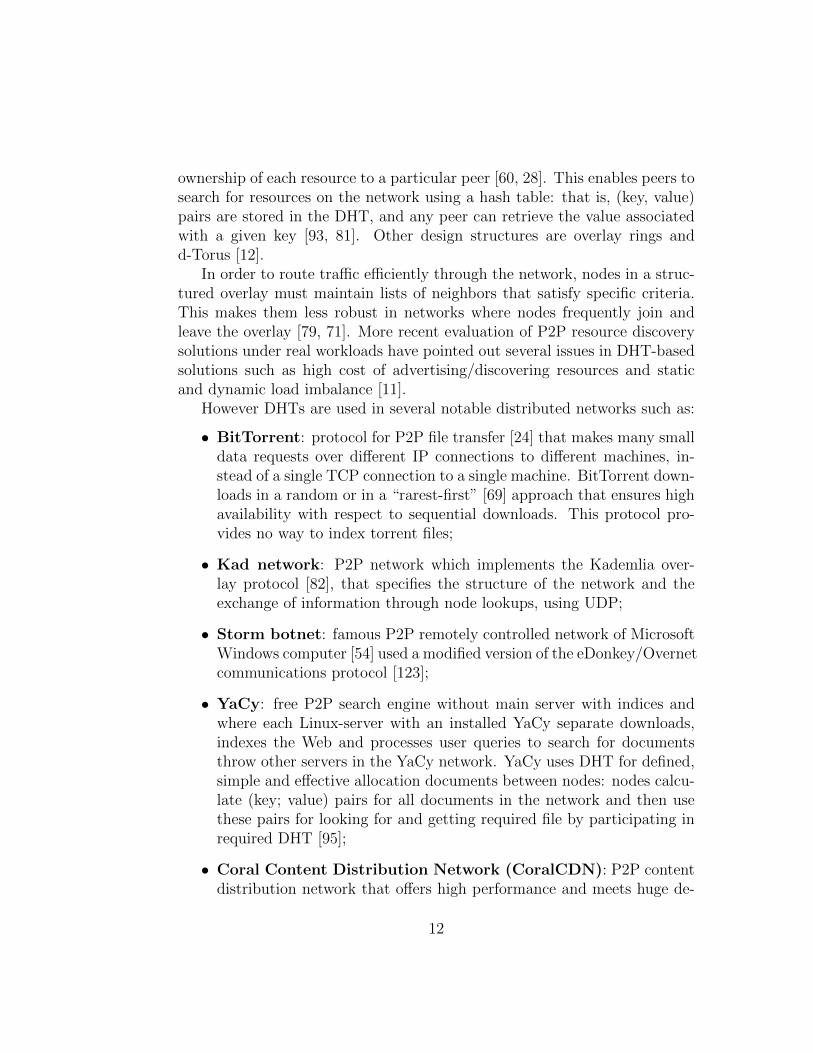
Figure 2.2: Each (red) node runs Distributed AdaBoostM1-SingleModel al-gorithm spreading only the best model to its (blue) neighbors.
the neighbors share only one model, the one who obtained the best scoreduring the boosting phase. The monitor node itself, during the new instanceevaluation, does not consider all the models generated locally, but it choosesthe best one among the local ones, and the best classifiers of its neighbors.The evaluation of new instances is done on a shorter list of models, and thisreflects an improved efficiency in terms of transmission models to neighborsand during the evaluation of new instances.
2.4.6 Experiments Setup
This section describes the experiments and the obtained results by applyingthe AdaBoostM1 to SNMP data gathered during attacks and normal net-work traffic. From fourteen SNMP parameters collected in a given time andduring both attacks and normal network traffic, we want to be able to realize
25
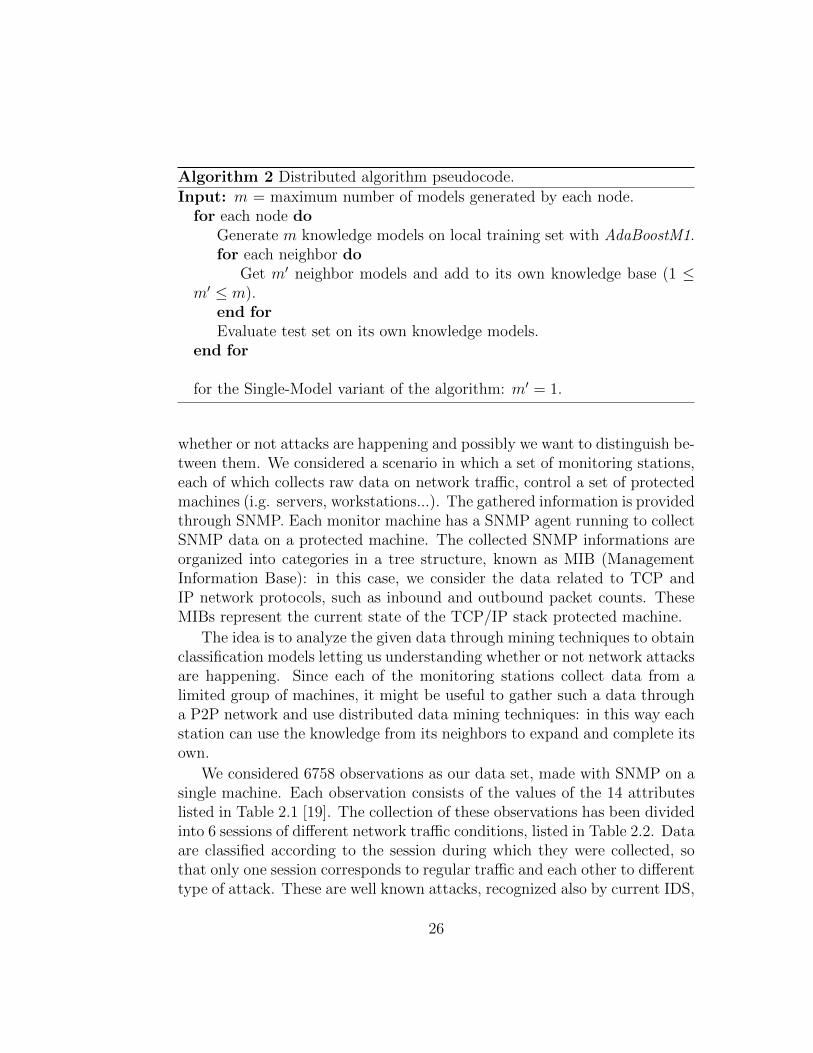
Algorithm 2 Distributed algorithm pseudocode.
Input: m = maximum number of models generated by each node.for each node do
Generate m knowledge models on local training set with AdaBoostM1.for each neighbor do
Get m′ neighbor models and add to its own knowledge base (1 ≤m′ ≤ m).
end forEvaluate test set on its own knowledge models.
end for
for the Single-Model variant of the algorithm: m′ = 1.
whether or not attacks are happening and possibly we want to distinguish be-tween them. We considered a scenario in which a set of monitoring stations,each of which collects raw data on network traffic, control a set of protectedmachines (i.g. servers, workstations...). The gathered information is providedthrough SNMP. Each monitor machine has a SNMP agent running to collectSNMP data on a protected machine. The collected SNMP informations areorganized into categories in a tree structure, known as MIB (ManagementInformation Base): in this case, we consider the data related to TCP andIP network protocols, such as inbound and outbound packet counts. TheseMIBs represent the current state of the TCP/IP stack protected machine.
The idea is to analyze the given data through mining techniques to obtainclassification models letting us understanding whether or not network attacksare happening. Since each of the monitoring stations collect data from alimited group of machines, it might be useful to gather such a data througha P2P network and use distributed data mining techniques: in this way eachstation can use the knowledge from its neighbors to expand and complete itsown.
We considered 6758 observations as our data set, made with SNMP on asingle machine. Each observation consists of the values of the 14 attributeslisted in Table 2.1 [19]. The collection of these observations has been dividedinto 6 sessions of different network traffic conditions, listed in Table 2.2. Dataare classified according to the session during which they were collected, sothat only one session corresponds to regular traffic and each other to differenttype of attack. These are well known attacks, recognized also by current IDS,
26
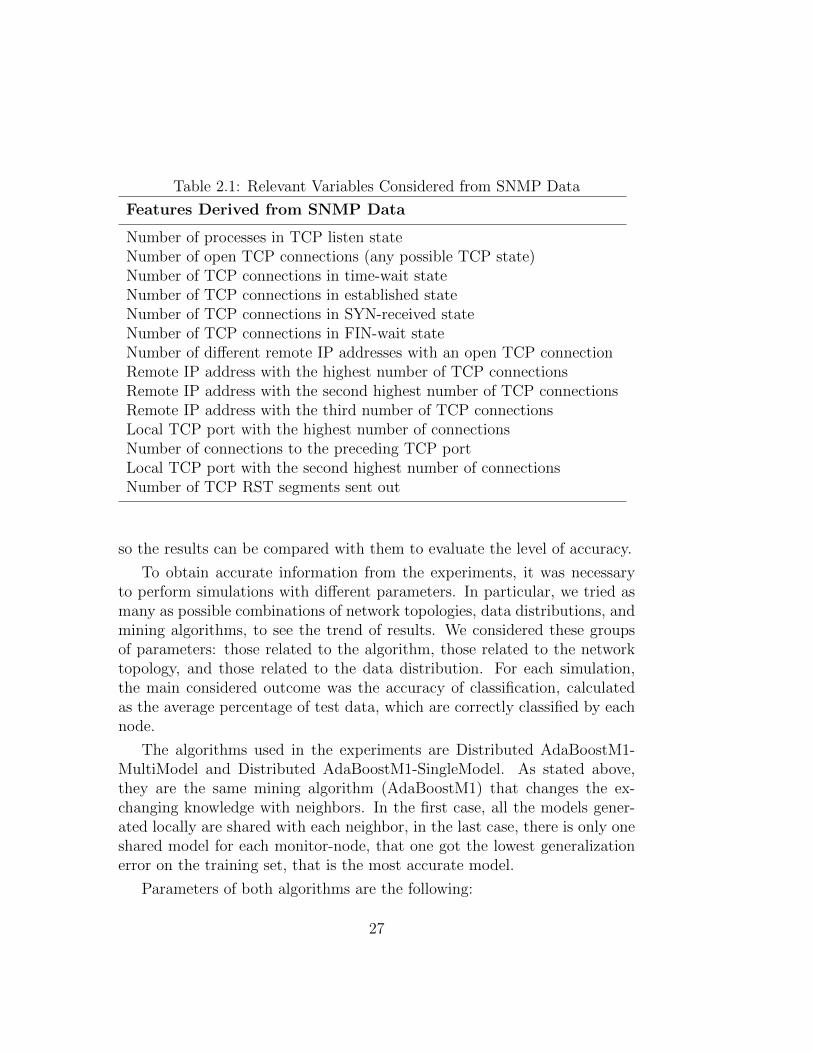
Table 2.1: Relevant Variables Considered from SNMP Data
Features Derived from SNMP Data
Number of processes in TCP listen stateNumber of open TCP connections (any possible TCP state)Number of TCP connections in time-wait stateNumber of TCP connections in established stateNumber of TCP connections in SYN-received stateNumber of TCP connections in FIN-wait stateNumber of different remote IP addresses with an open TCP connectionRemote IP address with the highest number of TCP connectionsRemote IP address with the second highest number of TCP connectionsRemote IP address with the third number of TCP connectionsLocal TCP port with the highest number of connectionsNumber of connections to the preceding TCP portLocal TCP port with the second highest number of connectionsNumber of TCP RST segments sent out
so the results can be compared with them to evaluate the level of accuracy.
To obtain accurate information from the experiments, it was necessaryto perform simulations with different parameters. In particular, we tried asmany as possible combinations of network topologies, data distributions, andmining algorithms, to see the trend of results. We considered these groupsof parameters: those related to the algorithm, those related to the networktopology, and those related to the data distribution. For each simulation,the main considered outcome was the accuracy of classification, calculatedas the average percentage of test data, which are correctly classified by eachnode.
The algorithms used in the experiments are Distributed AdaBoostM1-MultiModel and Distributed AdaBoostM1-SingleModel. As stated above,they are the same mining algorithm (AdaBoostM1) that changes the ex-changing knowledge with neighbors. In the first case, all the models gener-ated locally are shared with each neighbor, in the last case, there is only oneshared model for each monitor-node, that one got the lowest generalizationerror on the training set, that is the most accurate model.
Parameters of both algorithms are the following:
27
• as basic classifier to generate the models we used C4.5 [106, 107, 63], adecision tree algorithm. The confidence threshold for pruning was setat 0.3, and the minimum number of instances in the leaf of the treeswas 2;
• the maximum number of models generated during boosting is 10;
• a single iteration was made for the exchange of models with the neigh-bors. This means that the shared knowledge is limited only to monitor-nodes that are just a “hop” from the current one. However, it’s possibleto increase the iterations of the algorithm to grow the knowledge baseto second level neighbors and above. The results of these experimentswill be studied in future work;
• the data distributor allocates to each node all instances of a numberof randomly picked classes. Both training and test set are distributedaccording to this logic and independently from each other: so each nodemay have one or more classes in both training and test set.
The centralized case, bringing all of the training data set on a single site,with all types of attacks shown in Table 2.2, leads to an accuracy greaterthan 99%. This case, however, involves considerable cost in terms of networktraffic, time and also requires a wide and general knowledge of the network,very difficult in modern systems.
We analyzed instead a case where the training sets are distributed in thenetwork. Each node is trained only on certain attacks, not all, and then testedon different attacks to show how the accuracy changes, betweens knowledge
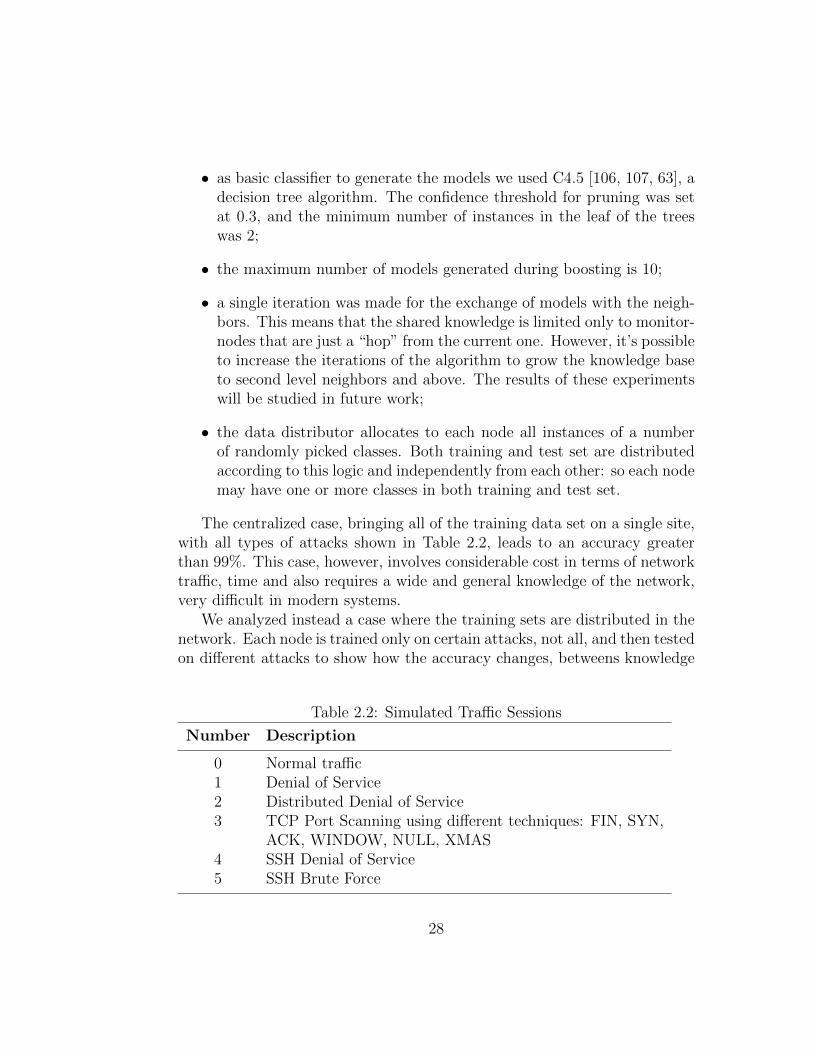
Table 2.2: Simulated Traffic Sessions
Number Description
0 Normal traffic1 Denial of Service2 Distributed Denial of Service3 TCP Port Scanning using different techniques: FIN, SYN,
ACK, WINDOW, NULL, XMAS4 SSH Denial of Service5 SSH Brute Force
28
models sharing cases, according to the two algorithms presented in this work,and without models sharing. In the first case, the improvement is evident inall the graphics, since the case in which nodes are trained only on the halfof the attack classes and tested on the other half. The unknown attacks aredetected thanks to the neighbors models received.
2.4.7 Simulation Results
Now we show some significant results that have been identified among themany performed simulations. In particular, the x-axis are arranged in orderof increasing the number of training sessions and, in order of decreasing, thenumber of test sessions (6 - x). Training sessions as well as test ones arerandomly selected from those available, with no repeats, but it’s possiblesome sessions are in both sets, for each node.
The random number generator used to distribute the sessions at the nodesis controlled by a seed set as a parameter, which has been changed ten times,with values ranging from 100 to 109, for each simulation. Each value shownin the following graphs is therefore the average of ten simulations.
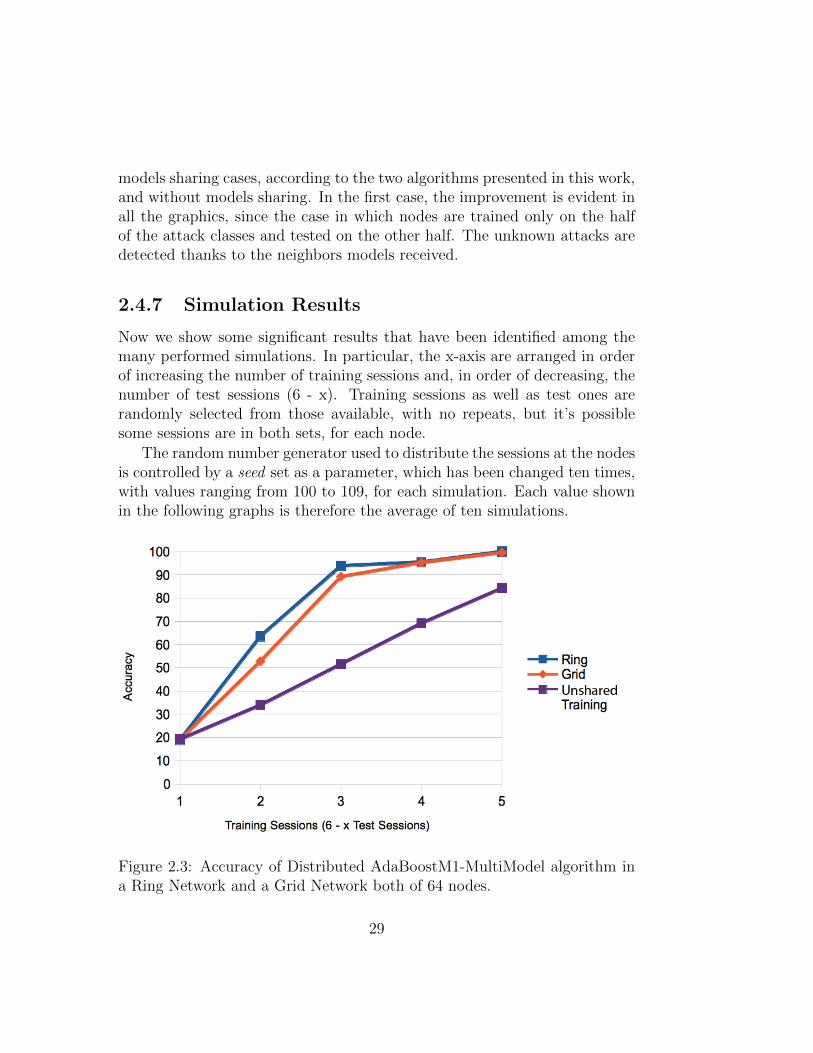
Figure 2.3: Accuracy of Distributed AdaBoostM1-MultiModel algorithm ina Ring Network and a Grid Network both of 64 nodes.
29
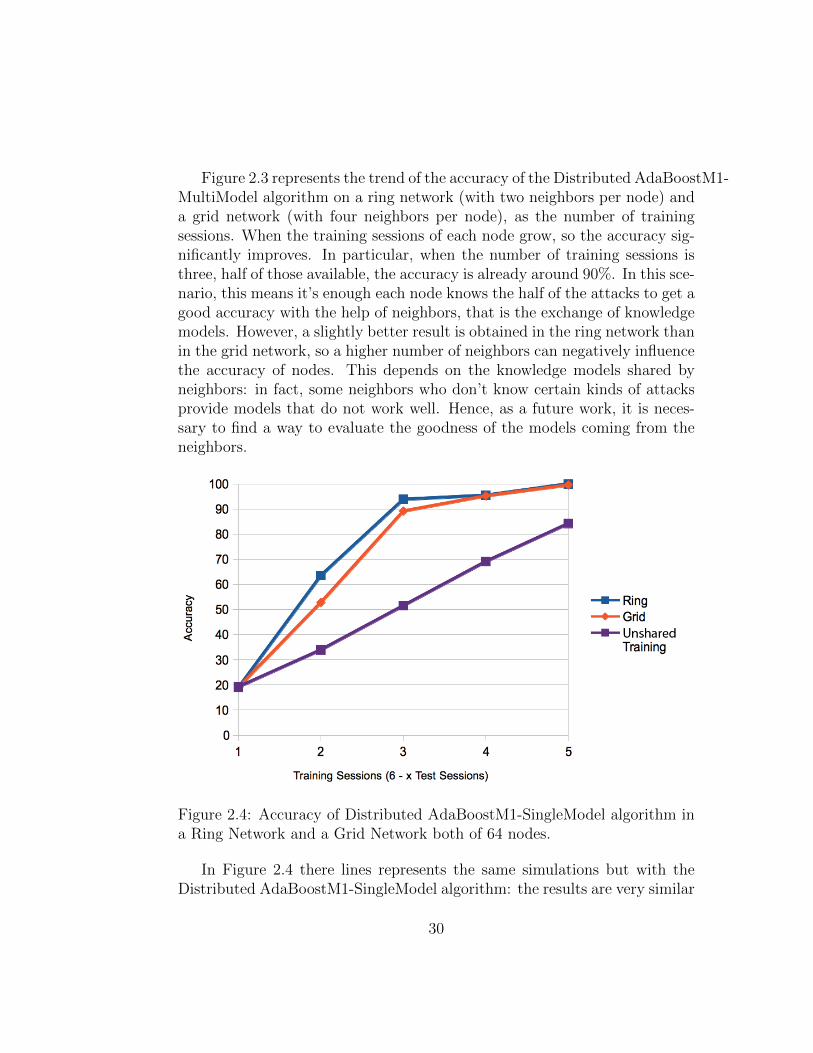
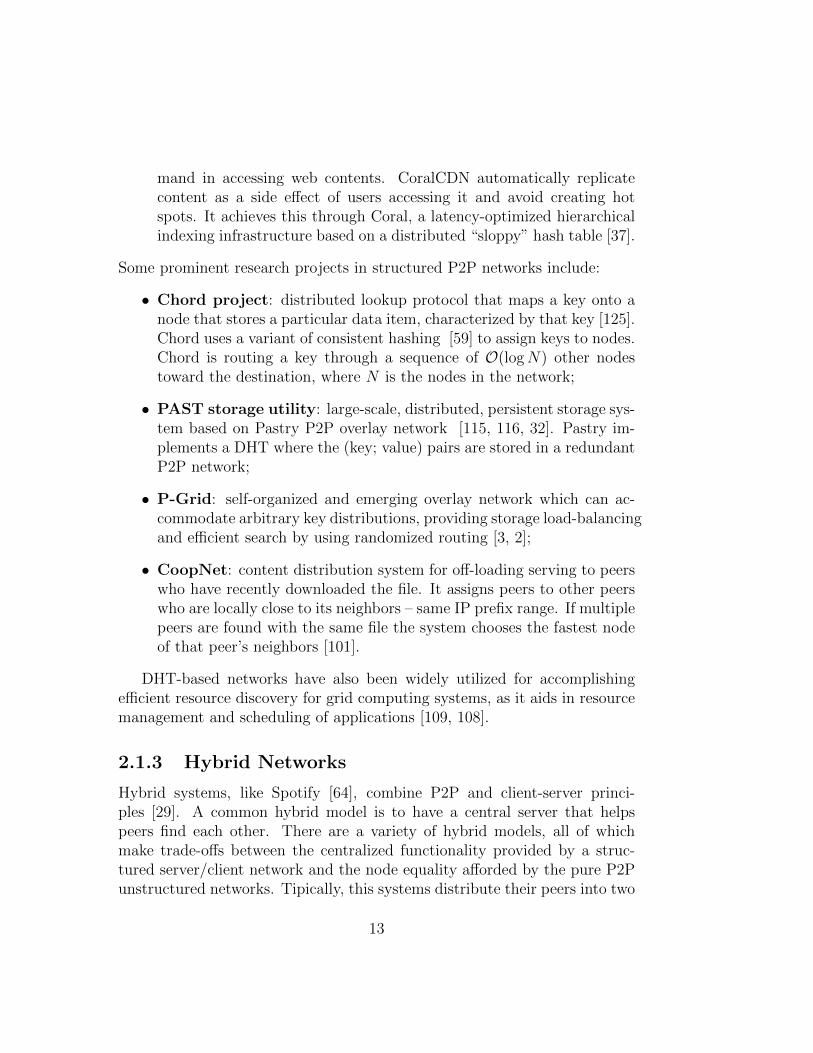
Figure 2.3 represents the trend of the accuracy of the Distributed AdaBoostM1-MultiModel algorithm on a ring network (with two neighbors per node) anda grid network (with four neighbors per node), as the number of trainingsessions. When the training sessions of each node grow, so the accuracy sig-nificantly improves. In particular, when the number of training sessions isthree, half of those available, the accuracy is already around 90%. In this sce-nario, this means it’s enough each node knows the half of the attacks to get agood accuracy with the help of neighbors, that is the exchange of knowledgemodels. However, a slightly better result is obtained in the ring network thanin the grid network, so a higher number of neighbors can negatively influencethe accuracy of nodes. This depends on the knowledge models shared byneighbors: in fact, some neighbors who don’t know certain kinds of attacksprovide models that do not work well. Hence, as a future work, it is neces-sary to find a way to evaluate the goodness of the models coming from theneighbors.
Figure 2.4: Accuracy of Distributed AdaBoostM1-SingleModel algorithm ina Ring Network and a Grid Network both of 64 nodes.
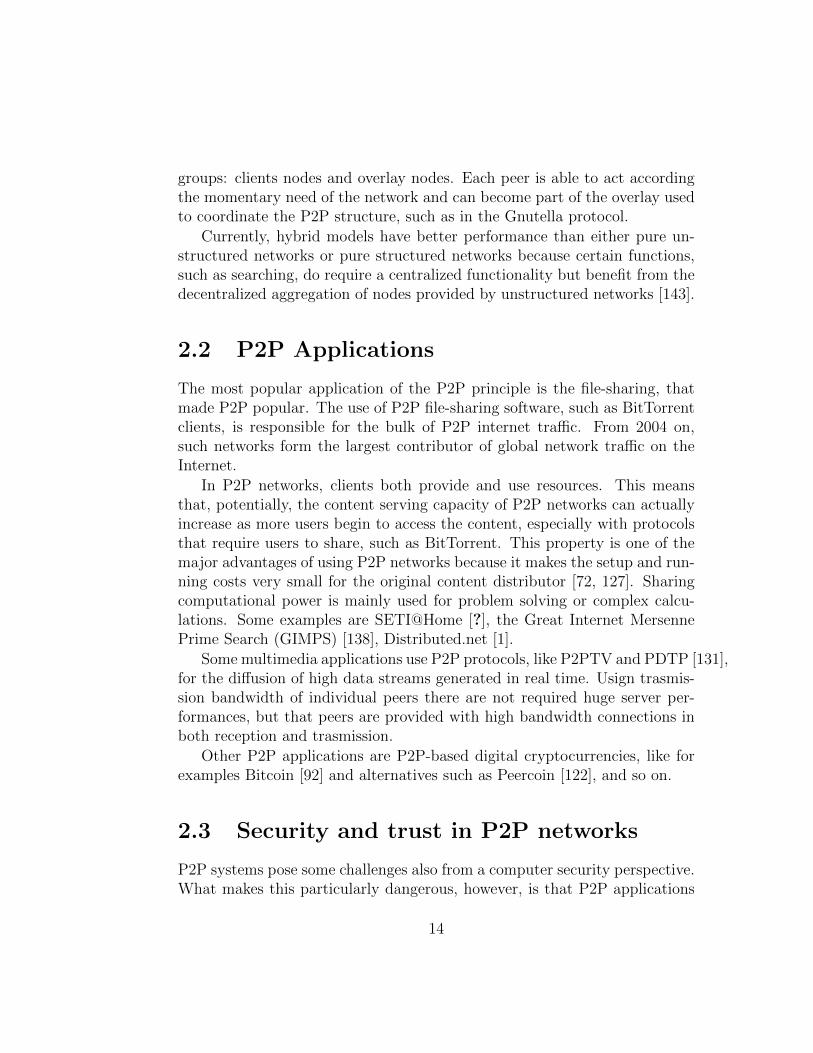
In Figure 2.4 there lines represents the same simulations but with theDistributed AdaBoostM1-SingleModel algorithm: the results are very similar
30
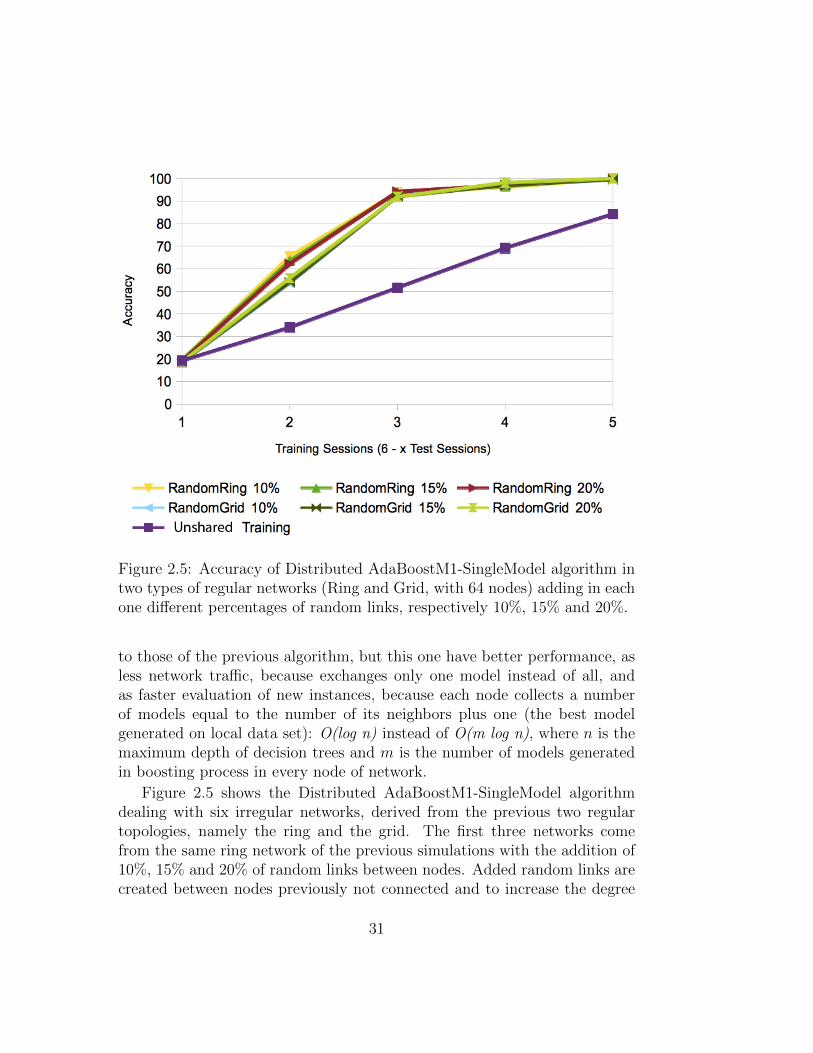
Figure 2.5: Accuracy of Distributed AdaBoostM1-SingleModel algorithm intwo types of regular networks (Ring and Grid, with 64 nodes) adding in eachone different percentages of random links, respectively 10%, 15% and 20%.
to those of the previous algorithm, but this one have better performance, asless network traffic, because exchanges only one model instead of all, andas faster evaluation of new instances, because each node collects a numberof models equal to the number of its neighbors plus one (the best modelgenerated on local data set): O(log n) instead of O(m log n), where n is themaximum depth of decision trees and m is the number of models generatedin boosting process in every node of network.
Figure 2.5 shows the Distributed AdaBoostM1-SingleModel algorithmdealing with six irregular networks, derived from the previous two regulartopologies, namely the ring and the grid. The first three networks comefrom the same ring network of the previous simulations with the addition of10%, 15% and 20% of random links between nodes. Added random links arecreated between nodes previously not connected and to increase the degree
31
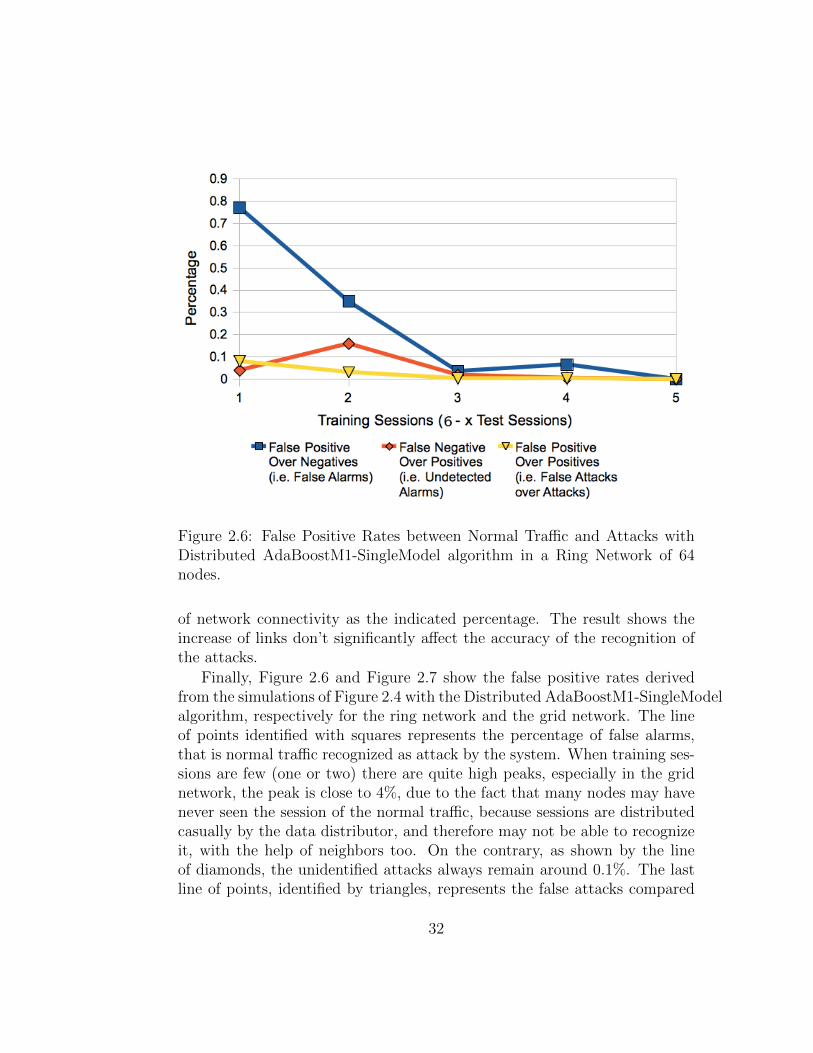
Figure 2.6: False Positive Rates between Normal Traffic and Attacks withDistributed AdaBoostM1-SingleModel algorithm in a Ring Network of 64nodes.
of network connectivity as the indicated percentage. The result shows theincrease of links don’t significantly affect the accuracy of the recognition ofthe attacks.
Finally, Figure 2.6 and Figure 2.7 show the false positive rates derivedfrom the simulations of Figure 2.4 with the Distributed AdaBoostM1-SingleModelalgorithm, respectively for the ring network and the grid network. The lineof points identified with squares represents the percentage of false alarms,that is normal traffic recognized as attack by the system. When training ses-sions are few (one or two) there are quite high peaks, especially in the gridnetwork, the peak is close to 4%, due to the fact that many nodes may havenever seen the session of the normal traffic, because sessions are distributedcasually by the data distributor, and therefore may not be able to recognizeit, with the help of neighbors too. On the contrary, as shown by the lineof diamonds, the unidentified attacks always remain around 0.1%. The lastline of points, identified by triangles, represents the false attacks compared
32
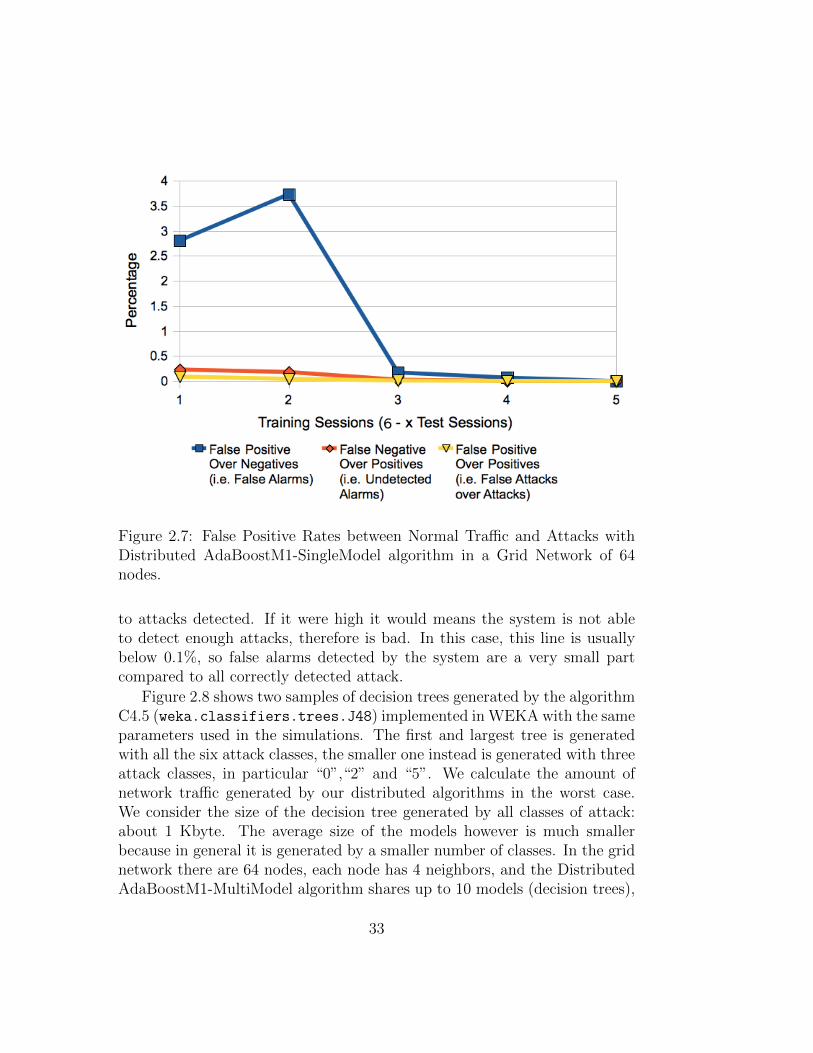
Figure 2.7: False Positive Rates between Normal Traffic and Attacks withDistributed AdaBoostM1-SingleModel algorithm in a Grid Network of 64nodes.
to attacks detected. If it were high it would means the system is not ableto detect enough attacks, therefore is bad. In this case, this line is usuallybelow 0.1%, so false alarms detected by the system are a very small partcompared to all correctly detected attack.
Figure 2.8 shows two samples of decision trees generated by the algorithmC4.5 (weka.classifiers.trees.J48) implemented in WEKA with the sameparameters used in the simulations. The first and largest tree is generatedwith all the six attack classes, the smaller one instead is generated with threeattack classes, in particular “0”,“2” and “5”. We calculate the amount ofnetwork traffic generated by our distributed algorithms in the worst case.We consider the size of the decision tree generated by all classes of attack:about 1 Kbyte. The average size of the models however is much smallerbecause in general it is generated by a smaller number of classes. In the gridnetwork there are 64 nodes, each node has 4 neighbors, and the DistributedAdaBoostM1-MultiModel algorithm shares up to 10 models (decision trees),
33
so the total amount of bytes flowing in our system, in worst case, is:
10× 4× 64 = 2560Kbyte
We consider also a centralized situation, where all the data are reached bya single node to analyze them and after distribute the generated model tothe entire network. We consider the best case to highlight the benefits ofour approach. Each node has accordingly the data related to only one attackclass: about 1100 of the 6758 data set observations, corresponding in generalto 100 Kbytes. To reach a node from any point of a ring network (simplerthan a grid network), the data takes a average of N/4 hops (64/4 = 16). Thenetwork has 64 nodes as above, so:
100× 16× 64 = 102400Kbyte
At this number, which is already two orders of magnitude larger than ourworst case, we must add the traffic produced by the distribution of the gen-erated knowledge model (1 Kbyte) to every node of the network.
1× 16× 64 = 1024Kbyte
This simple estimate shows the benefit of our work in network traffic, com-pared to a centralized solution.
2.4.8 Conclusions
We introduced two distributed data mining algorithms called DistributedAdaBoosM1-MultiModel and Distributed AdaBoostM1-SingleModel. Bothalgorithms and the underlaying framework for the generation of several net-works and attack scenarios have been fully implemented as new componentsof WEKA3. Both algorithms work in purely decentralized scenarios wherenodes exchange only local knowledge models of few bytes rather than hugeamount of network traffic as performed by most of existing solutions. In par-ticular each network node extracts and shares knowledge models from localSNMP data.
The models produced by a node, against a certain type of attack becomeuseful for another node not previously aware of that attack. This allows
3Data Mining open source tool developed by the University of Waikato (NZ);http://www.cs.waikato.ac.nz/ml/weka/
34
nodes to be able to recognize unknown attacks and even to prevent them. Theknowledge sharing allow each node to build a more complete knowledge base,compared to that produced using only their local data. The experimentalresults show that both algorithms can provide accurate classifications, evenin case of unknown attacks, moreover the best performance are not far fromthe ideal solution where all data are centralized in a single machine, whichfor this reason cannot scale as the network dimension increase.
The algorithms can be extended in several directions that are beyond thescope of this work, such as dealing also with malicious nodes interested inexchanging bad knowledge to reduce the global accuracy or improving theknowledge in order to identify bot-nets as well.
Finally, this work, as well as bringing new contributions in the topic ofdistributed data mining applied to autonomic security, has been very usefulto study various properties of P2P networks, in order to develop the overlaysexplained in the next chapters.
35
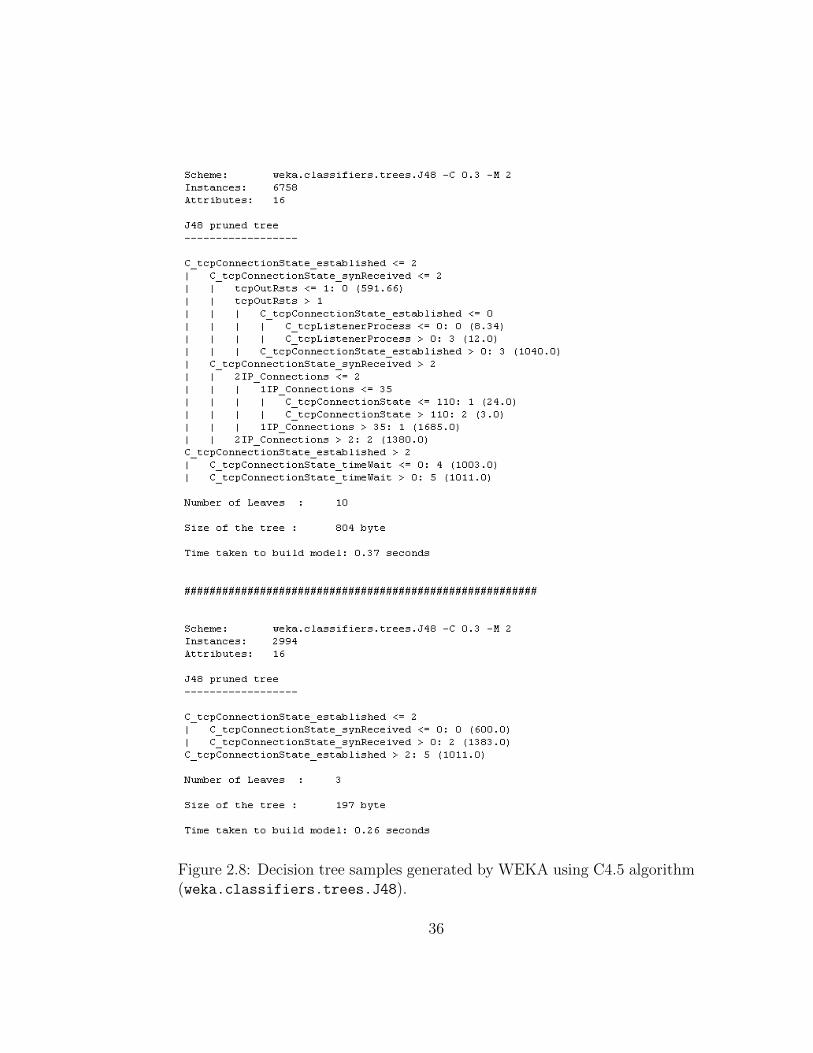
Figure 2.8: Decision tree samples generated by WEKA using C4.5 algorithm(weka.classifiers.trees.J48).
36
Chapter 3
Multi-dimensional DataIndexing for Efficient Routingand Content Delivery in P2PNetworks
P2P networks emerged as a computing paradigm for locating and managingcontents distributed over a large number of autonomous peers. Autonomyimplies that peers are not subject to central coordination. Each peer playsat least three roles, either as (i) a server of data and services, (ii) a client ofdata and services; and/or (iii) a router to manage network messages. P2Psystems realize several of the desirable properties of emergent systems, in-cluding self-organization, which provides the ability to self-administer, scal-ability, which enables support large number of users and resources withoutperformance degradation, and to support robustness, which makes the sys-tem fault-tolerant in the event of peer failures or leaving [89].
Moreover, because of the peers autonomy, P2P networks have a compa-rable behavior to complex dynamic organisms. For example, local changes inthe molecular structure of a chemical compound may aggregate to yield al-together a new compound: a global property emerges generally from a seriesof simple local interactions. The same phenomenon may also occurs in thecontent distribution as autonomous peers interact independently with eachother in a P2P system. Thus, in addition to scalability, our goal is to seekstructures for P2P systems which exhibit emergence and self-organizationproperties characteristic of complex systems, where local interactions and
37
peers autonomy lead to a global organizational structure with excellent per-formance features.
In most of the actual P2P structures, the multi-dimensional range queryare executed by attribute aggregation. For example, we have a table ofsong records with three attributes: author, year and genre. The aggregationof these attributes produces a unique key, as “Madonna-1994-R&B”. If wefollow the order of the attributes in the key for our queries – i.e. we wantsearch all the songs of Madonna or, all the songs of Madonna publishedin 1994 –, it works well. If we want instead obtain all the R&B songs ofMadonna, the key becomes useless and we will check one by one all the keys.This is not acceptable for distributed databases with a huge amount of data.
We present G-Grid as a foundational structure devised to build multi-dimensional indexes even in a decentralized context, and able to support algo-rithms for data-mining functions, such as clustering, or distributed databasesfor P2P networks or, in business distributed environments, such as serverfarms for grid, cloud computing and big data domains.
G-Grid lets us execute efficiently multi-dimensional range query. Fur-thermore, in G-Grid data can be distributed easily on various peers and witha good degree of storage resources distribution. The structure evolves in atotally independent way, so we can use G-Grid for P2P applications develop-ment because each peer does not need a global knowledge of the network. Theshape is not imposed a priori and the interactions among peers increase thepeers knowledge on the topology of the network. The performance does notdeteriorate with increasing number of peers, so its scalability helps to buildlarge data sources. Since G-Grid is a flexible and suitable overlay for P2Penvironments, we aim to create a large distributed database in a dynamiccontext.
Today, most databases are centralized and placed on powerful servers.In a context where the input/output of peers is not frequent, for examplethe server farm of a company, we can deliver on some small computers thecompany’s database via G-Grid peers. This could reduce the required num-ber of centralized and dedicated powerful servers, which do not use most ofthe computational capacity. The new concepts introduced by G-Grid lendthemselves well to the growing use of virtualization techniques. We could notspend or invest in centralized powerful servers to handle a whole databaseand deliver it directly on many client computers to reduce the resources ded-icated entirely to a single database. In fact, all these machines provide astorage capacity much larger than a main-frame and also do not waste their
38
resources, but rather they will use the most of their entire computationalcapacity.
3.1 Related works on P2P Data Structures
Content to be shared in P2P systems can be conceptually represented asa single relational table, with multiple data attributes, horizontally parti-tioned (distributed) among peers. Differently from traditional distributeddatabases, in P2P systems there is no entity which is aware of the globaldistribution scheme. This means that P2P systems’ actors must efficientlycooperate any time data must be edited (e.g. inserted/updated/deleted) orqueried. The efficiency of P2P system is evaluated according to the followingparameters: complexity in terms of hops per data editing/query, complexityin terms of number of links per single node.
First generation P2P systems, also named unstructured P2P systems, suchas Gnutella [56, 96] and its descendants (e.g. Kazaa and Morpheous) provideda valued service for many users but their routing mechanism, which was basedon message flooding and a time-to-live parameter, could easily congest thenetwork in case of data intensive applications, due to their exponential costsin terms of routing hops. This problem, together with the fact that querycompleteness was not guaranteed, allowed hybrid systems such as WinMXand Emule to take the scene. In those systems P2P only takes place duringfile download, while several servers are in charge to manage and update acatalog of the shared content. The presence of centralized servers made itpossible to shut down WinMX for copyright issues.
Researches in the field of distributed systems brought to the developmentof structured systems which allow query completeness at logarithmic costs.Building on previous work in uni-dimensional distributed data structures,such as RP* [75], LH* [76] and ADST [31], several new approaches wereproposed. The most famous and cited are Chord [124], Tapestry [150, 149],Pastry [114] and P-Grid [2]. These new systems did indeed improve perfor-mance and extended the flexibility of search by allowing querying by con-tent. All these systems require O
(log n
)hops and O
(log n
)links per node.
Viceroy [80], FissionE [70], SONAR [118], SKY [148] and Moore [49] achieveO(log n
)hops with O
(1)
links but have restricted or absent load balancingcapability.
Most of the cited systems are based on Distributed Hash Table (DHT),
39
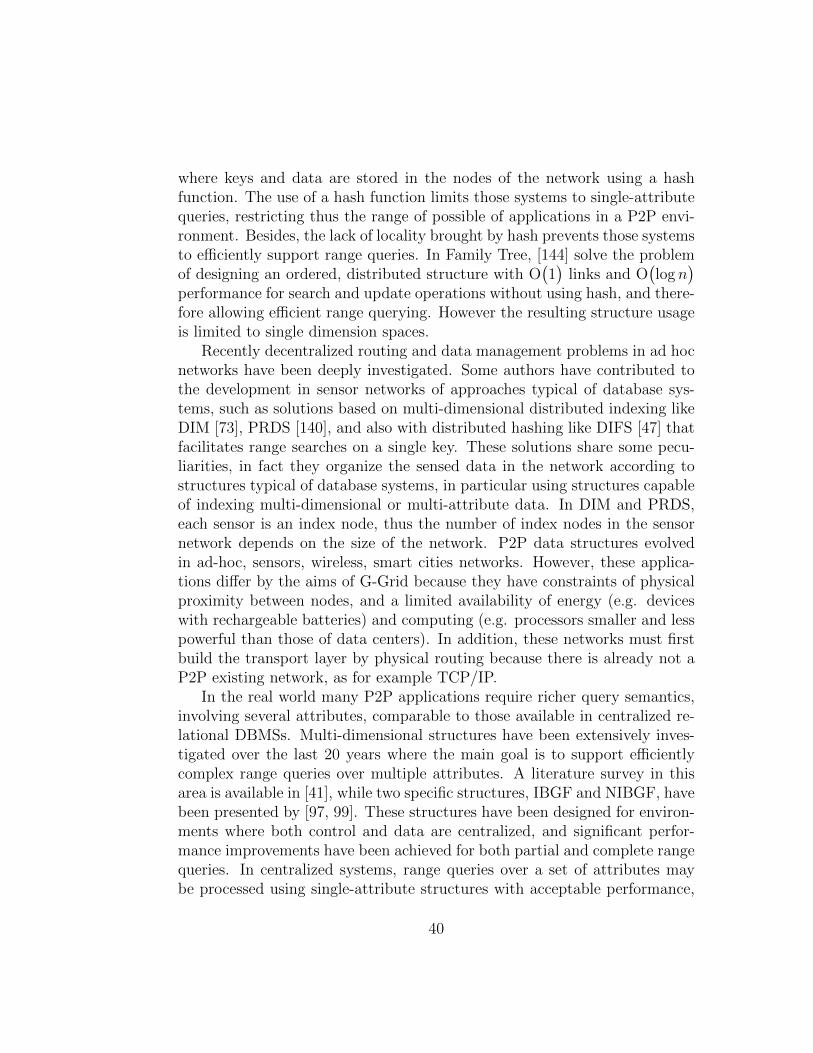
where keys and data are stored in the nodes of the network using a hashfunction. The use of a hash function limits those systems to single-attributequeries, restricting thus the range of possible of applications in a P2P envi-ronment. Besides, the lack of locality brought by hash prevents those systemsto efficiently support range queries. In Family Tree, [144] solve the problemof designing an ordered, distributed structure with O
(1)
links and O(log n
)performance for search and update operations without using hash, and there-fore allowing efficient range querying. However the resulting structure usageis limited to single dimension spaces.
Recently decentralized routing and data management problems in ad hocnetworks have been deeply investigated. Some authors have contributed tothe development in sensor networks of approaches typical of database sys-tems, such as solutions based on multi-dimensional distributed indexing likeDIM [73], PRDS [140], and also with distributed hashing like DIFS [47] thatfacilitates range searches on a single key. These solutions share some pecu-liarities, in fact they organize the sensed data in the network according tostructures typical of database systems, in particular using structures capableof indexing multi-dimensional or multi-attribute data. In DIM and PRDS,each sensor is an index node, thus the number of index nodes in the sensornetwork depends on the size of the network. P2P data structures evolvedin ad-hoc, sensors, wireless, smart cities networks. However, these applica-tions differ by the aims of G-Grid because they have constraints of physicalproximity between nodes, and a limited availability of energy (e.g. deviceswith rechargeable batteries) and computing (e.g. processors smaller and lesspowerful than those of data centers). In addition, these networks must firstbuild the transport layer by physical routing because there is already not aP2P existing network, as for example TCP/IP.
In the real world many P2P applications require richer query semantics,involving several attributes, comparable to those available in centralized re-lational DBMSs. Multi-dimensional structures have been extensively inves-tigated over the last 20 years where the main goal is to support efficientlycomplex range queries over multiple attributes. A literature survey in thisarea is available in [41], while two specific structures, IBGF and NIBGF, havebeen presented by [97, 99]. These structures have been designed for environ-ments where both control and data are centralized, and significant perfor-mance improvements have been achieved for both partial and complete rangequeries. In centralized systems, range queries over a set of attributes maybe processed using single-attribute structures with acceptable performance,
40
despite the large number of local accesses to disk. The same queries in P2Psystems turn out to be singularly cost-prohibitive, unless a multi-dimensionalstructure is available, as each local data access will now give rise to severalnetwork messages. Dynamic pure P2P networks will naturally amplify theseverity of the costs because of continuous changes in the content, its dis-tribution, and the underlying network topology. G-Grid starts from IBGFto allow distribution of multi-dimensional data among peers in a network.Moreover we develop the managing of the peers autonomy and the dynamicevolution of the overlay, i.e. join and leaving of peers.
RAQ [94] can handle range-queries in multi-dimensional space, support-ing such queries in at most O
(log n
)hops and requiring O
(log n
)links per
node. Like us, it works by splitting the data space into regions and mapsthose regions in a binary tree. The main differences from G-Grid are that intheir solution each partition (region) holds a single data and that nodes areonly responsible for leaf regions (there is no nesting at regions).
Skiptree [6] is a scalable distributed data structure that allows storageof keys in multi-dimensional spaces and the execution of both exact matchand range queries. It uses a distributed partition tree as well, partitioningthe data space into regions and assigning leaf regions to network nodes.Differently from similar tree-based solutions (like ours or RAQ) the partitiontree in Skiptree is only used to define an order relationship which is thenused for the routing mechanism and link maintenance. Routing and links aretherefore independent from the shape (and the possible unbalanced shape)of the partition tree. Skiptree maintains O
(log n
)links at each node and
guarantees an upper bound of O(log n
)messages for point and range queries.
This result is also get by [147].Among the most recent literature [145, 134, 48, 33], SkipCluster [142, 141]
is a hierarchical P2P overlay network. SkipCluster is derived from Skipgraphs [8] and SkipNet [52], but it has a two-tier hierarchical architecture.The basic idea is to group the peers in the cluster, according to two levels:in the low level there are peers in a cluster, seen as a single entity, while inhigh-level clusters are considered as atomic entity that are connected to otherclusters. A cluster is a set of peers which have in common the most significantpart of the peer identifier. Each cluster has a manager peer called “super-peer”. The super-peer is responsible for the connections between its clusterand the others, and for maintaining the routing table of the peers insideits own cluster. Therefore, the super-peer is the only access to the clusteroutside. In this overlay, the average number of hop grows logarithmically
41
with respect to the number of network peers.We compare our architecture with SkipCluster because it is capable of
supporting both exact-match and multi-dimensional range queries, as G-Grid.
3.2 G-Grid
G-Grid is a distributed multi-dimensional data structure. The earlier propos-als for P2P structure, such as Chord[124], Pastry[114] and P-Grid[2], handleonly one dimensional data, but this limits the query expressiveness. Thisis even more evident in unstructured P2P implementations, which predomi-nantly are able to perform only exact-match queries.
G-Grid aims to improve the query expressiveness, but at the same timeseeking to rely on a robust system, and providing efficient routing protocolsand quick searches. At the moment, it is necessary to make available themajor DBMS properties in distributed P2P environments, trying to offera query expressiveness close to SQL. G-Grid moves towards this direction,introducing a method to index multi-dimensional data and providing thebasis to perform more sophisticated queries, such as range-queries in hyper-spaces and join.
G-Grid can be used in application domains such as clustering, or dis-tributed databases for P2P networks or, in business distributed environments,such as server farms for grid and cloud computing and big data domains. Forexample, G-Grid could be useful in a datacenter where each peer is a serverthat manages hundreds or thousands of regions of the data space. Each peermanages portions of the G-Grid tree, even not contiguous ones, and is linkedto the other peers according to the G-Grid overlay network. The G-Gridstructure creates a distributed index that leaves data in their nodes and al-lows distributed search such as exact match and range queries, involving anarbitrary number of attributes (multi-dimensional). All of the operationsabove are executed with a logarithmic routing cost from one server to otherswith respect to the number of peer in the overlay network.
3.2.1 Structure and Features
The data space has many dimensions as data attributes. G-Grid splits thespace according to the positioning of the data in regions, and the same data
42
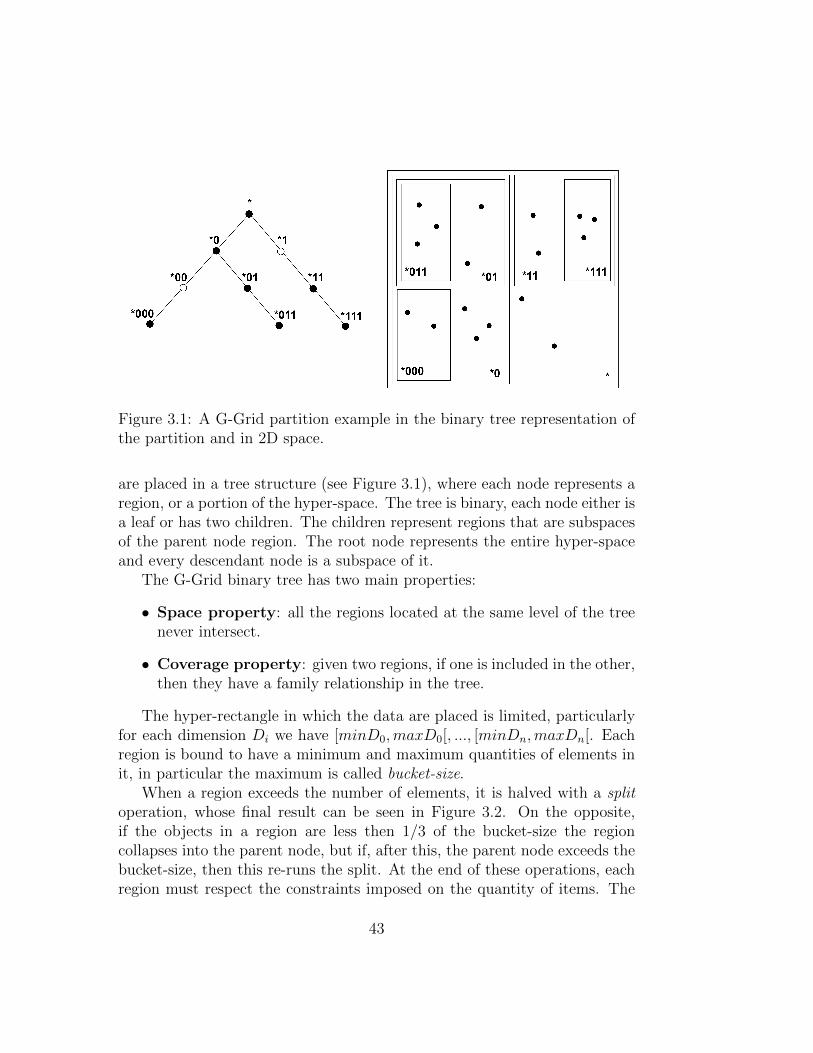
Figure 3.1: A G-Grid partition example in the binary tree representation ofthe partition and in 2D space.
are placed in a tree structure (see Figure 3.1), where each node represents aregion, or a portion of the hyper-space. The tree is binary, each node either isa leaf or has two children. The children represent regions that are subspacesof the parent node region. The root node represents the entire hyper-spaceand every descendant node is a subspace of it.
The G-Grid binary tree has two main properties:
• Space property: all the regions located at the same level of the treenever intersect.
• Coverage property: given two regions, if one is included in the other,then they have a family relationship in the tree.
The hyper-rectangle in which the data are placed is limited, particularlyfor each dimension Di we have [minD0,maxD0[, ..., [minDn,maxDn[. Eachregion is bound to have a minimum and maximum quantities of elements init, in particular the maximum is called bucket-size.
When a region exceeds the number of elements, it is halved with a splitoperation, whose final result can be seen in Figure 3.2. On the opposite,if the objects in a region are less then 1/3 of the bucket-size the regioncollapses into the parent node, but if, after this, the parent node exceeds thebucket-size, then this re-runs the split. At the end of these operations, eachregion must respect the constraints imposed on the quantity of items. The
43
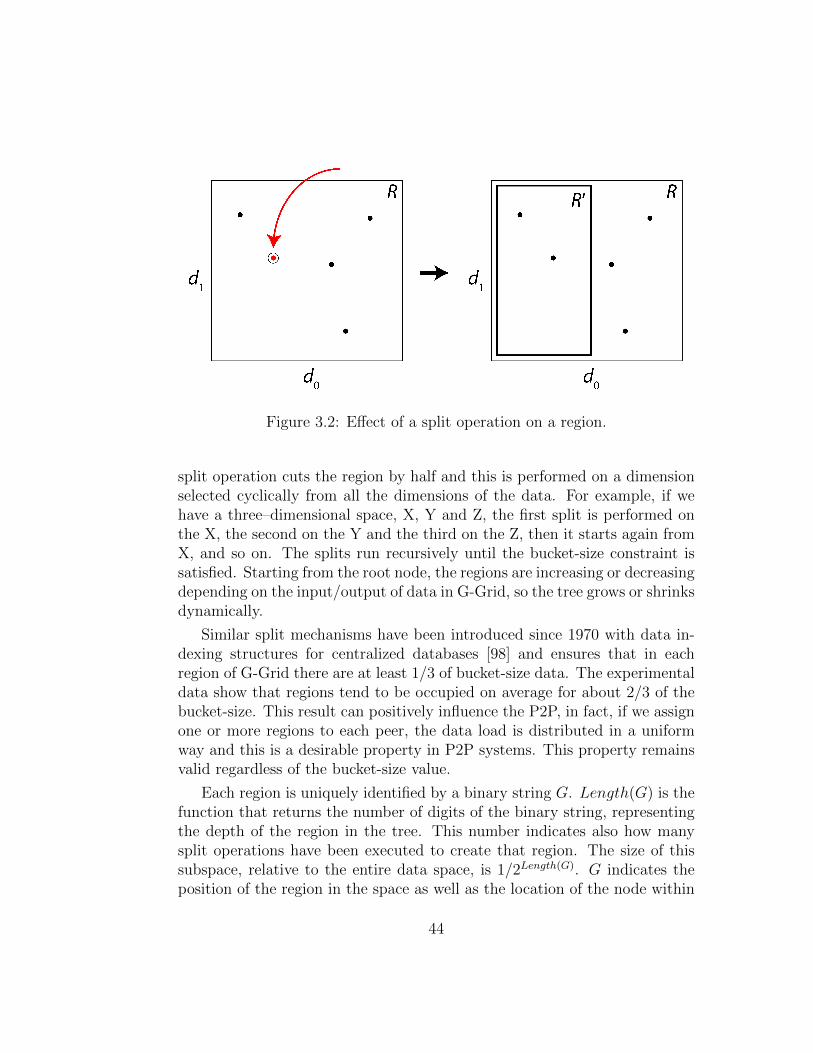
Figure 3.2: Effect of a split operation on a region.
split operation cuts the region by half and this is performed on a dimensionselected cyclically from all the dimensions of the data. For example, if wehave a three–dimensional space, X, Y and Z, the first split is performed onthe X, the second on the Y and the third on the Z, then it starts again fromX, and so on. The splits run recursively until the bucket-size constraint issatisfied. Starting from the root node, the regions are increasing or decreasingdepending on the input/output of data in G-Grid, so the tree grows or shrinksdynamically.
Similar split mechanisms have been introduced since 1970 with data in-dexing structures for centralized databases [98] and ensures that in eachregion of G-Grid there are at least 1/3 of bucket-size data. The experimentaldata show that regions tend to be occupied on average for about 2/3 of thebucket-size. This result can positively influence the P2P, in fact, if we assignone or more regions to each peer, the data load is distributed in a uniformway and this is a desirable property in P2P systems. This property remainsvalid regardless of the bucket-size value.
Each region is uniquely identified by a binary string G. Length(G) is thefunction that returns the number of digits of the binary string, representingthe depth of the region in the tree. This number indicates also how manysplit operations have been executed to create that region. The size of thissubspace, relative to the entire data space, is 1/2Length(G). G indicates theposition of the region in the space as well as the location of the node within
44
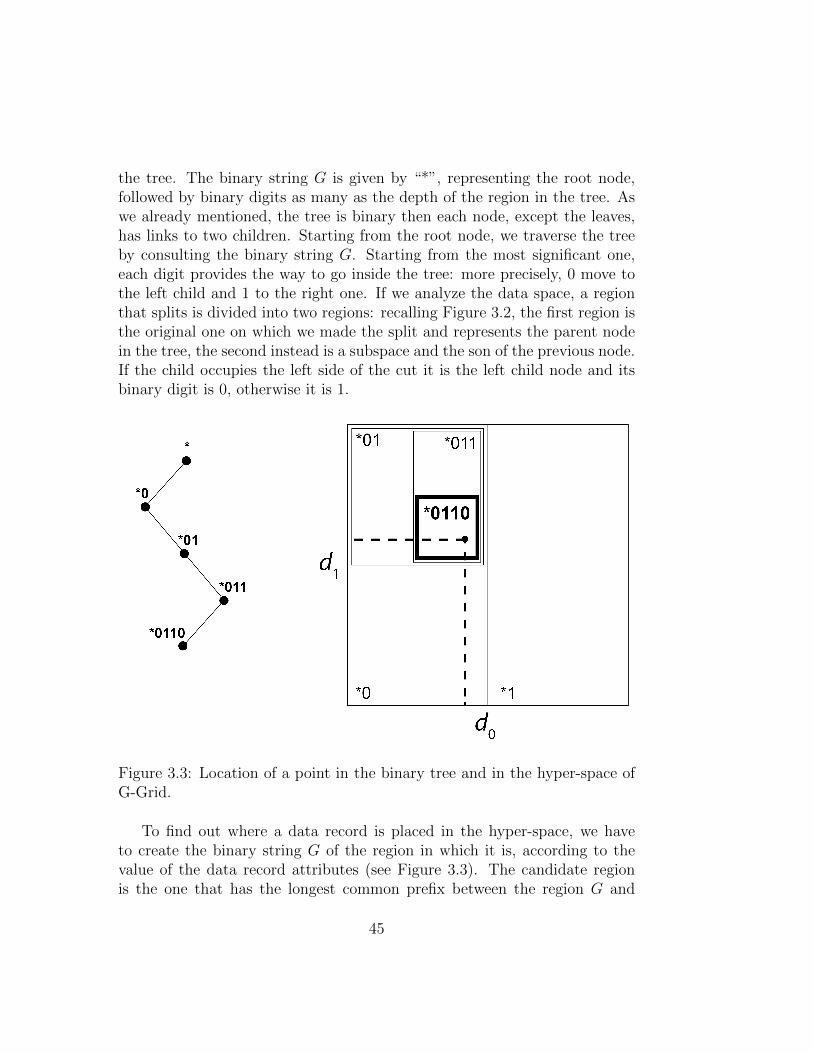
the tree. The binary string G is given by “*”, representing the root node,followed by binary digits as many as the depth of the region in the tree. Aswe already mentioned, the tree is binary then each node, except the leaves,has links to two children. Starting from the root node, we traverse the treeby consulting the binary string G. Starting from the most significant one,each digit provides the way to go inside the tree: more precisely, 0 move tothe left child and 1 to the right one. If we analyze the data space, a regionthat splits is divided into two regions: recalling Figure 3.2, the first region isthe original one on which we made the split and represents the parent nodein the tree, the second instead is a subspace and the son of the previous node.If the child occupies the left side of the cut it is the left child node and itsbinary digit is 0, otherwise it is 1.
Figure 3.3: Location of a point in the binary tree and in the hyper-space ofG-Grid.
To find out where a data record is placed in the hyper-space, we haveto create the binary string G of the region in which it is, according to thevalue of the data record attributes (see Figure 3.3). The candidate regionis the one that has the longest common prefix between the region G and
45
the binary string of the data record. Each region G shows a very specificarea within the hyper-space and, in particular, it has a size proportional to1/2Length(G), hence increasing the depth in the tree we increase the granularityof the key location and for Length(G)→ +∞ geometrically we get a point.G is arbitrarily set by the node issuing the query/insertion/elimination ofdata, then if Length(G) is shorter than the target region depth, the lastnode that receives the query message, if it has children nodes, recalculatesthe query region G with the query message attributes and go on. In fact, ifwe consider a record p on a node X that is not a leaf, the insertion checkswhether there is a descendant node of X that might be a better candidateto contain p, perhaps recalculating the G of p with a length value consistentwith the depth of the tree explored at that time. The tree is always exploredrecursively, and if we analyze the scenario in a P2P environment, where eachpeer is responsible for at least one region, this would have connections withits parent and its sons.
The insert and remove query walk through the tree and each peer alongthe walking receives the request from its parent, evaluates if the binary stringof the data record is in its region, recalculating the binary string since thedepth of the tree if it can not know it a priori, and if that fails it forwardsthe request to both the children. This recursive mechanism shows how thisstructure works well in P2P environments, because each step requires the in-teraction of only two entities: parent and son nodes. Regardless of whetherworking in a distributed or centralized structure, basic operations are per-formed exploring a binary tree and the only difference is that in distributedenvironment this tree is split into parts assigned to autonomous nodes.
The advantage of the G-Grid structure is that it allows to perform in-sertions, deletions, and queries in time proportional to O(logN) where Nis the number of regions. The number of regions in a binary tree of heightm is 2m and the maximum number of hops that a message needs to reacha target region from a source region in this tree is 2m, so this number islogarithmic with respect to the number of regions in the tree. In addition,with the learning mechanism which will be explained later, this time can befurther reduced to become sub-logarithmic. In other words, the efficiencyof DBMSs is exported to distributed environments by virtue of the limitednumber of hops1 required to complete any operation.
This is a fundamental property that can be found in DBMS and that in
1The number of gateways that separate the source host from the destination host.
46
the field of distributed avoids to make too many hops to process a distributedquery, while reducing both the network traffic and the response time.
3.2.2 G-Grid in P2P Environments
After describing the structure from a general point of view, we show theadvantages that this structure brings in distributed environments, and inparticular focusing on scenarios in which participants are autonomous self-organizing agents, as in P2P. When distributing the binary tree of G-Gridinto the peers, each peer is associated with one or more regions, i.e. oneor more nodes of the binary tree. Therefore each peer is responsible forseveral portions of the hyper-space. The assumptions on the environmentare the following: a physical network connects peers, each having a uniquephysical address, and each dimension of the hyper-rectangle of the data spaceis limited. If a peer decides to participate in the G-Grid overlay and can’tcontact any other peer within the network, it will take the region of the rootnode, which controls the entire hyper-space. When a participant agent (peer)is starting, it hasn’t any reference to other nodes to communicate with, sowe have to provide for the creation of a common boot-strap list with somevalid contacts.
Under these assumptions, we ask the following question: why G-Grid iswell suited for P2P networks? By analyzing the evolution of regions of thetree, we observe that it expands and contracts dynamically depending onthe data inserted and removed, and the only operations taken on the regionsare split and collapse. These two operations require the involvement of atmost two nodes, just what decentralized self-organizing networks need. P2Pnetworks evolve dynamically over time and this affects the positioning ofregions on the nodes, but the movements and interactions always involve nomore than two peers. For this property in G-Grid each node does not need acomprehensive knowledge of the network and of how the tree is shaped, butonly portions of local information. Moreover, as we already mentioned, G-Grid is able to load the regions for 2/3 of the bucket-size in average and witha low variance, so the amount of resources that the nodes have to assign todata is well distributed among the peer. In G-Grid not all peers hold regions,in particular there are two types of peer:
• C–Peer : Client Peer,
• S–Peer : Structure Peer.
47
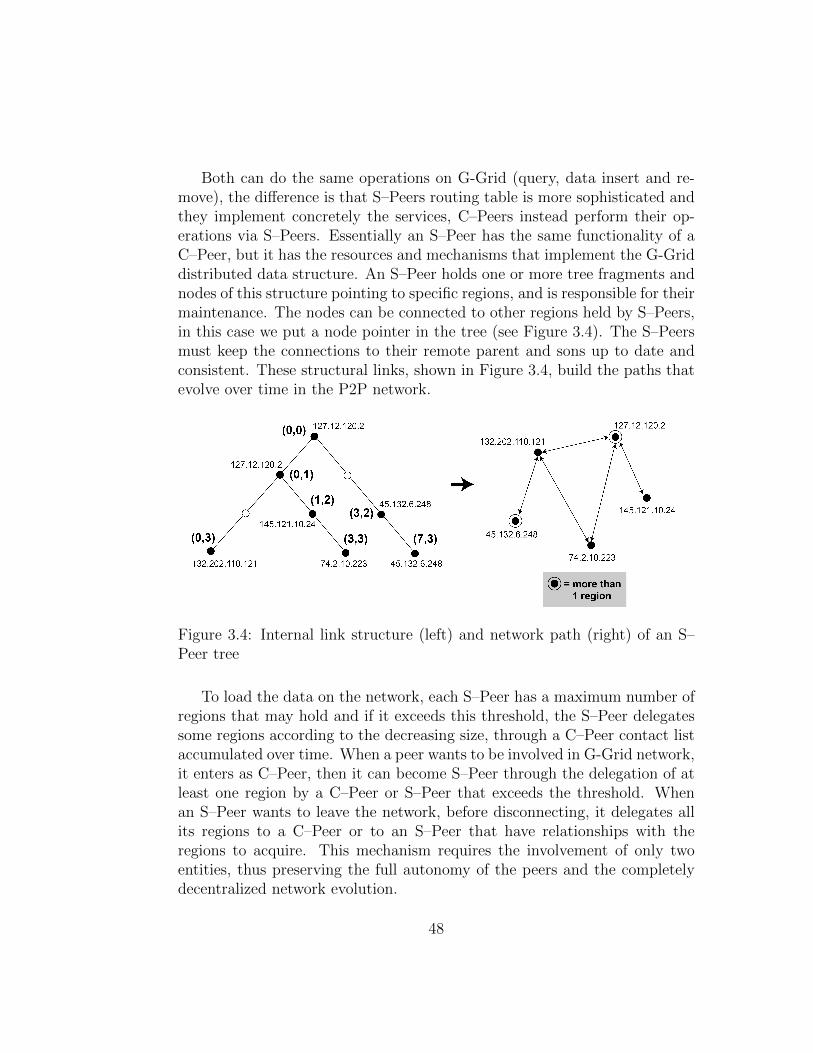
Both can do the same operations on G-Grid (query, data insert and re-move), the difference is that S–Peers routing table is more sophisticated andthey implement concretely the services, C–Peers instead perform their op-erations via S–Peers. Essentially an S–Peer has the same functionality of aC–Peer, but it has the resources and mechanisms that implement the G-Griddistributed data structure. An S–Peer holds one or more tree fragments andnodes of this structure pointing to specific regions, and is responsible for theirmaintenance. The nodes can be connected to other regions held by S–Peers,in this case we put a node pointer in the tree (see Figure 3.4). The S–Peersmust keep the connections to their remote parent and sons up to date andconsistent. These structural links, shown in Figure 3.4, build the paths thatevolve over time in the P2P network.
Figure 3.4: Internal link structure (left) and network path (right) of an S–Peer tree
To load the data on the network, each S–Peer has a maximum number ofregions that may hold and if it exceeds this threshold, the S–Peer delegatessome regions according to the decreasing size, through a C–Peer contact listaccumulated over time. When a peer wants to be involved in G-Grid network,it enters as C–Peer, then it can become S–Peer through the delegation of atleast one region by a C–Peer or S–Peer that exceeds the threshold. Whenan S–Peer wants to leave the network, before disconnecting, it delegates allits regions to a C–Peer or to an S–Peer that have relationships with theregions to acquire. This mechanism requires the involvement of only twoentities, thus preserving the full autonomy of the peers and the completelydecentralized network evolution.
48
Each peer, regardless of the role it plays in the network, has a routingtable, that is a list with references to other peers, pairs region / physicaladdress (G, IP) for the S–Peers, IP only for the C–Peers. The filling ofthis table occurs when the peer contacts or perceives the existence of otherpeers. For example, when a peer receives a request the message contains someinformation about the sender. Every peer doing a request does not know apriori the corresponding node and this is due to the fact that messages arerelayed through multiple intermediaries in the network and also if this werenot true, the peer should possess a comprehensive knowledge of network thatis not pragmatically possible on Internet. For this we can say that each peerfeels only the existence of a part of the whole network, but this view oftendoes not fully reflect the reality because the entities may leave the network, ornot answer as a result of faults. Therefore, the more requests are performedon the network, the more knowledge about the network is acquired by thepeers.
But how can we derive new knowledge at each request? In G-Grid thelearning mechanism provides to sender and receiver information about all theintermediate nodes. This works as follows: each intermediary attaches hisreference on the message, in this way also the intermediaries increase theirknowledge about the network, even if the first node receiving the messagelearns less than those closest to the receiver. This solution is possible andscalable because in G-Grid the number of hops to deliver a message is sub-logarithmic with respect to the number of nodes so the message will not reacha size large enough to waste the bandwidth of the communication channel.
Analyzing the routing table of a C–Peer, we find IP of C–Peer and S–Peer, the formers are useful in the future if the entity will be transformedinto S–Peer and the latter act as an access point to the G-Grid networkfor services. Why do we find this configuration in S–Peer routing table?Is it not enough that they hold only structural links? These are only asubset of the entire routing table because while nodes are querying there isa learning process in the network. These references may be useful as a formof redundancy but they also have an additional purpose. We stated that inG-Grid the transactions perform at most a logarithmic number of hops, withrespect to the number of S–Peer. Let us consider what happens when a nodewants to contact the handler of a certain area of the hyper-space, due to itsintrinsically limited view of the entire binary tree, it starts scanning. In theworst cases it can start to scan the entire hyper-space, or can forward therequest to the root node, who has a vision of the entire hyper-space and if the
49
required area is not in its region, then the root node will forward the requestto the child who has assigned the required region. The child recursivelyperforms the same operation, which will end when the message reaches therequired region. This process is made possible by the fact that each node cancontact the root node via structural links, going up the tree through linksto parent nodes. However, this path can be reduced considerably thanks tothe learning mechanism: to perform an operation, which we do not know apriori who will exactly involve, a peer may contact the S–Peer that has aregion that is a superset of the requested area. This concept can be exposedas trying to find the S–Peer connection that holds the G with the prefixlarger than the G of the request data record. For example: if a peer holds asS–Peer connections the root node * and nodes *010 - *1001 - *01011, if therequest is *010110010010111, the peer does not send the request to the rootbut involves directly the node *01011, which is a superset of the requestedregion and either it holds that specific area or one of its descendants does.This mechanism reduces the number of hops with the increasing networkknowledge owned by the peer. This advantage is opposed by the entry/exitof participants in the G-Grid network, which are seen as disruptive actionson the entire system.
3.2.3 Performance Analysis
Once the network has settled, the number of records stored on average byregions tends to the value 2b/3, where b is the bucket size. This value wasdetermined empirically. The simulation manages exact match queries andrecord insertions and incorporates both the region splitting mechanism andthe learning capability. Moreover it can be configured with some parameters,such as the region bucket size b and the rate of insertions with respect toqueries insertions
queries. In the experiments the structure evolves and dynamically
grows starting from one peer and by generating operations randomly. Inessence, G-Grid is a stochastic system with complex behavior where eachstate of the system depends on the preceding one, but the set of the possiblestates evolves dynamically over time growing very quickly and making hardany analysis based on traditional formal methods, such as Markov chains.
However we discuss in some detail the split probability, which can helppredicting the growth of the system and finding important theoretical resultsrelated to the average path length (APL) to deliver any message in the system.
For space reasons we present here only the simplest version which well
50
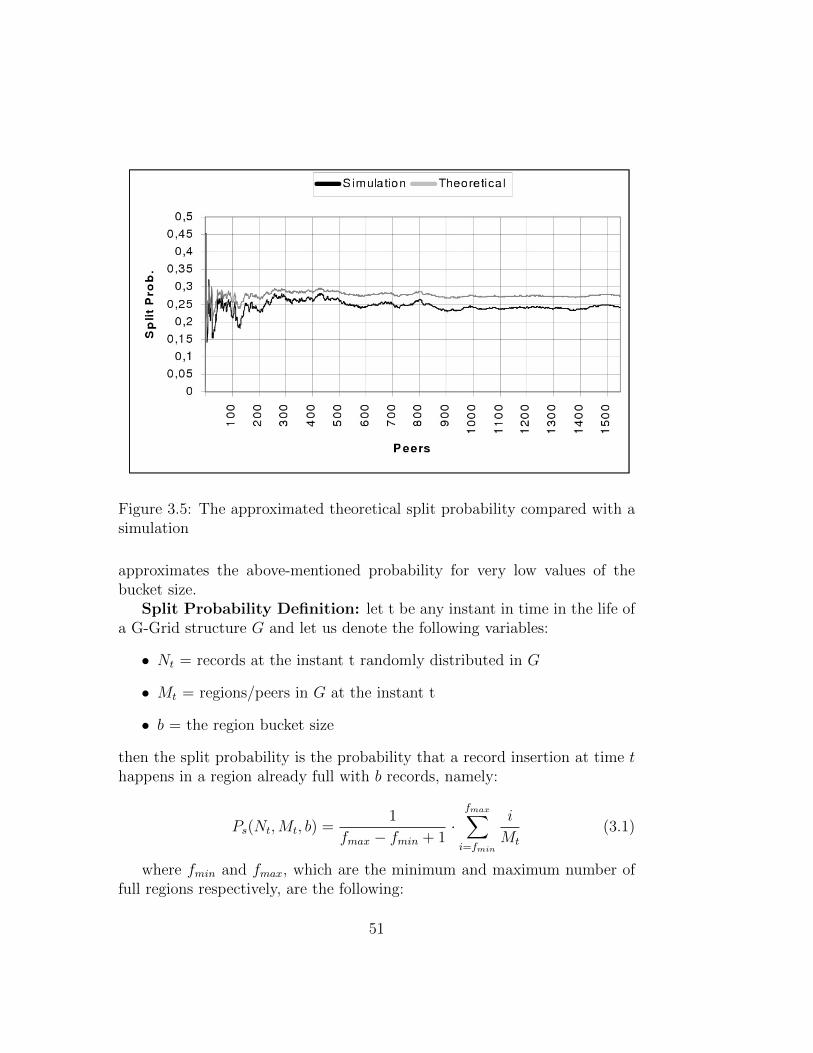
Figure 3.5: The approximated theoretical split probability compared with asimulation
approximates the above-mentioned probability for very low values of thebucket size.
Split Probability Definition: let t be any instant in time in the life ofa G-Grid structure G and let us denote the following variables:
• Nt = records at the instant t randomly distributed in G
• Mt = regions/peers in G at the instant t
• b = the region bucket size
then the split probability is the probability that a record insertion at time thappens in a region already full with b records, namely:
Ps(Nt,Mt, b) =1
fmax − fmin + 1·
fmax∑i=fmin
i
Mt
(3.1)
where fmin and fmax, which are the minimum and maximum number offull regions respectively, are the following:
51
fmin = max(Nt −Mt · (b− 1), 0) fmax = floor
(Nt − b
3·Mt
23· b
)(3.2)
Figure 3.5 illustrates a numeric comparison between the formula 3.1 punc-tually measured and an experiment conducted with b = 6 where the systemgrows up to more than 1500 peers. The empirical curve is simply the ratioof the full regions number and the total regions number in G-Grid. Theformula 3.1, as we saw before, only requires the total number of regions.The two split probabilities oscillate until there are less than 50 peers, thenboth of them stabilize with a difference around 2.5%; in all experiments thestabilization occurs always independently on the rate insertions
queries. When new
records come in, the split probability increases because the regions begin tosaturate. When some regions split, because they have a number of recordsgreater than the bucket size, the split probability decreases. Once the net-work has settled, the probability of split tends to the value 2b/3, where bis the bucket size. Experiments have also confirmed an average storage uti-lization per region equals to 2b/3, that is the number of records stored onaverage by regions.
The rate insertionsqueries
instead is determining for the APL in the system, in factif the rate remains constant the APL tends to grow, but less than logarithmi-cally with respect to the number of peers. This effect is due to the learningcapability which reduces the logical distances in the system by creating newlinks. Finally, we verified experimentally that if the rate insertions
querieschanges
like O( 1M2
t) then the APL in the system tends quickly to 1 (see Figure 3.6).
The insertions cause an increase of APL as the network grows and each peerreduces its global knowledge of the network. The queries do not change thenetwork, but only increase the knowledge mentioned above. If the numberof queries grows quadratically with respect to the number of peer insertionsthen the probability that G-Grid, thanks to learning mechanism, generatesa complete graph (e.g. each node is connected with all the others) tends to1 when the number of nodes tends to infinity. In several realistic scenariosthe number of queries is more than quadratic with respect to the number ofusers/machines, for instance in the World Wide Web each user access mayoriginate in cascade many messages and queries. Also the execution of moretraditional queries, such as joins and range queries, can generate that numberof requests.
52
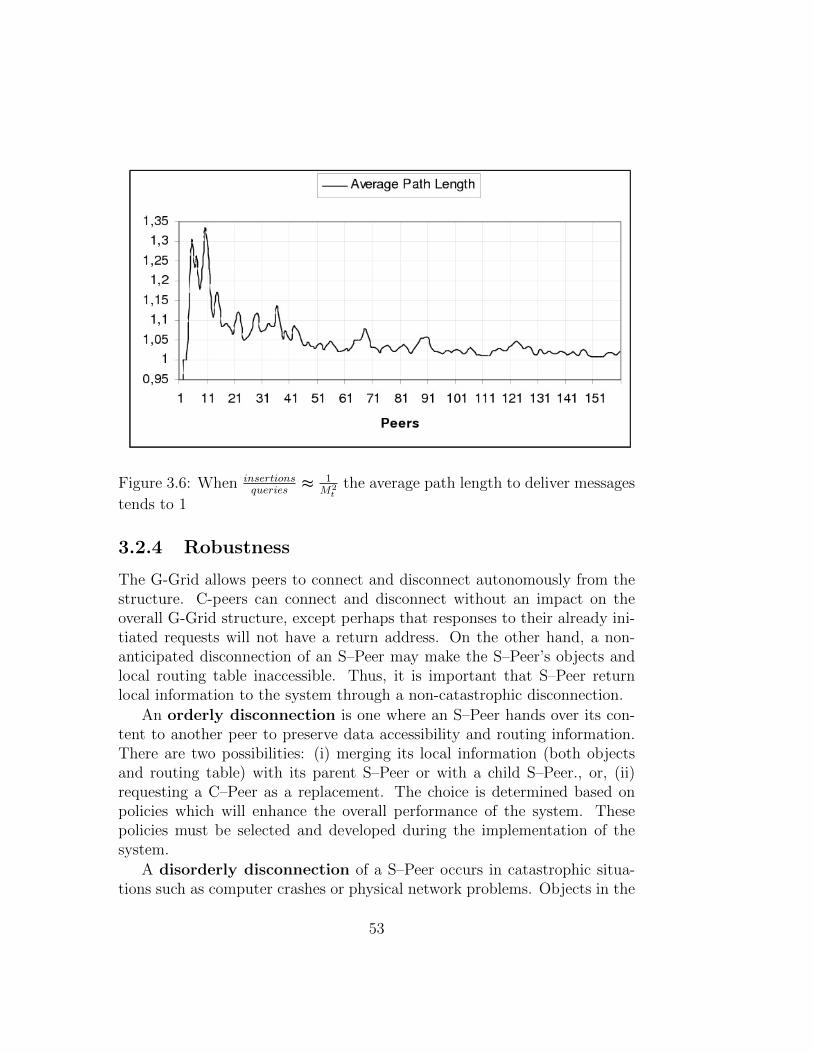
Figure 3.6: When insertionsqueries
≈ 1M2
tthe average path length to deliver messages
tends to 1
3.2.4 Robustness
The G-Grid allows peers to connect and disconnect autonomously from thestructure. C-peers can connect and disconnect without an impact on theoverall G-Grid structure, except perhaps that responses to their already ini-tiated requests will not have a return address. On the other hand, a non-anticipated disconnection of an S–Peer may make the S–Peer’s objects andlocal routing table inaccessible. Thus, it is important that S–Peer returnlocal information to the system through a non-catastrophic disconnection.
An orderly disconnection is one where an S–Peer hands over its con-tent to another peer to preserve data accessibility and routing information.There are two possibilities: (i) merging its local information (both objectsand routing table) with its parent S–Peer or with a child S–Peer., or, (ii)requesting a C–Peer as a replacement. The choice is determined based onpolicies which will enhance the overall performance of the system. Thesepolicies must be selected and developed during the implementation of thesystem.
A disorderly disconnection of a S–Peer occurs in catastrophic situa-tions such as computer crashes or physical network problems. Objects in the
53
S–Peer become inaccessible and routing through the S–Peer is no longer pos-sible. Depending on the network topology, a disorderly disconnection couldcause the G-Grid partitioning into two disjoint component. To enhance ro-bustness of the system, one approach is through duplication of informationin S–Peers. Besides the associated information integrity problems, duplica-tion does not eliminate the problem of G-Grid partitioning, it only reducesthe likelihood of its occurrence. Our approach is to avoid altogether dupli-cation and rely on the learning mechanism of the system, which establishesincrementally links between the various S–Peers as the level of interaction in-creases, and thus provides multiple routes to get to S–Peers. To what extentdoes the learning mechanism reduce the likelihood of G-Grid partitioning?Our preliminary experimental results show that the likelihood of partitioningis practically nil. What will be the effect on performance and availability ofdata in combining both duplication and the learning mechanism? Answersto these questions require an extensive robustness analysis, which we intendto do in the future.
After a disorderly disconnection, an S–Peer may rejoin the G-Grid eitheras a C–Peer or as an S–Peer. If it chooses the former approach, it will haveto issue direct insertion requests for all its objects to the G-Grid system.In the latter, it will have to wait for an interaction with another S–Peerand then integrate its content through the normal partitioning process. Thechoice depends on who implements the system who should consider valueslike the time of disconnecting a peer and the rate of input/output peer inthe network. In fact, the first choice is better when the network has a lowdynamism (aka low rate of input/output peer) and peers stay out for a shorttime, this means that a S–Peer could easily return to play its role if thenetwork do not have a lot of changes during his absence.
As indicated in 3.2.2, an important concept in the G-Grid is the peers’ability to learn other peers’ local routing tables during search operations.When a peer interacts with other peers – e.g. querying –, its local routingtable grows and improves its capability to find the most efficient route to itstarget objects. Clearly, learning content-based routing tables is an emergentproperty in that the minimum path to a target peer is discovered withouthaving to encode into the system a minimum path algorithm.
54
3.3 Experiments
In this section we show the performance results of our proposal in four sim-ulated application scenarios. The simulator is used to test the traffic distri-bution on large-scale networks of 10,000 nodes over PeerSim [87], a testbedfor large-scale P2P networks. The traffic distribution parameter is very im-portant because it shows how the working traffic is evenly distributed onnetwork peers. We observed also other important parameters such as thenumber of hops, the number of messages exchanged to maintain the overlaystructure – called system messages –, and the number of connections failedbecause of busy memory, due to the architecture of the data structures. Thebasic G-Grid and G-Grid with Learning [100, 88] are two versions of ouralgorithm implemented in the simulator and tested to obtain performanceon commonly accepted benchmarks. As a first element of comparison, weselected the SkipCluster algorithm [142], as proposed and a new version thatimplements in addition to the overlay HiGLoB [132]. We applied the featuresof load balancing of HiGLoB to balance the number of peers contained ineach cluster.
The experimental environment is a Linux virtual machine with 6 CPUsat 2GHz and 6GB of RAM for the simulations. The program is developed inJava, as the simulator PeerSim. We have defined a class that implements theinterface of the node provided by PeerSim, which manages events such as thearrival of messages or internal events defined by the user. In our experiments,for each node, we connected the overlay to be tested, as G-Grid, and anotherlevel of transport provided by the simulator natively. We have also createdcontrols that the system runs periodically, according to a configuration file,allowing the generation of query, the connection/disconnection of nodes, andwriting a snapshot of the network in a database. Each parameter, nodes andcontrols, is read from the configuration file. For any other technical detailsplease visit the website of the simulator2.
In all scenarios, we start from a single node network and connect quickly10,000 nodes. The nodes create the desired structure by exchanging messageswith other peers in the network. When all nodes joined the network we startto run 100.000 random queries. We observe the system state and store itinto a database every 10,000 queries. While these parameters are commonin every scenarios, the differences among the scenarios are listed below.
2http://peersim.sourceforge.net
55
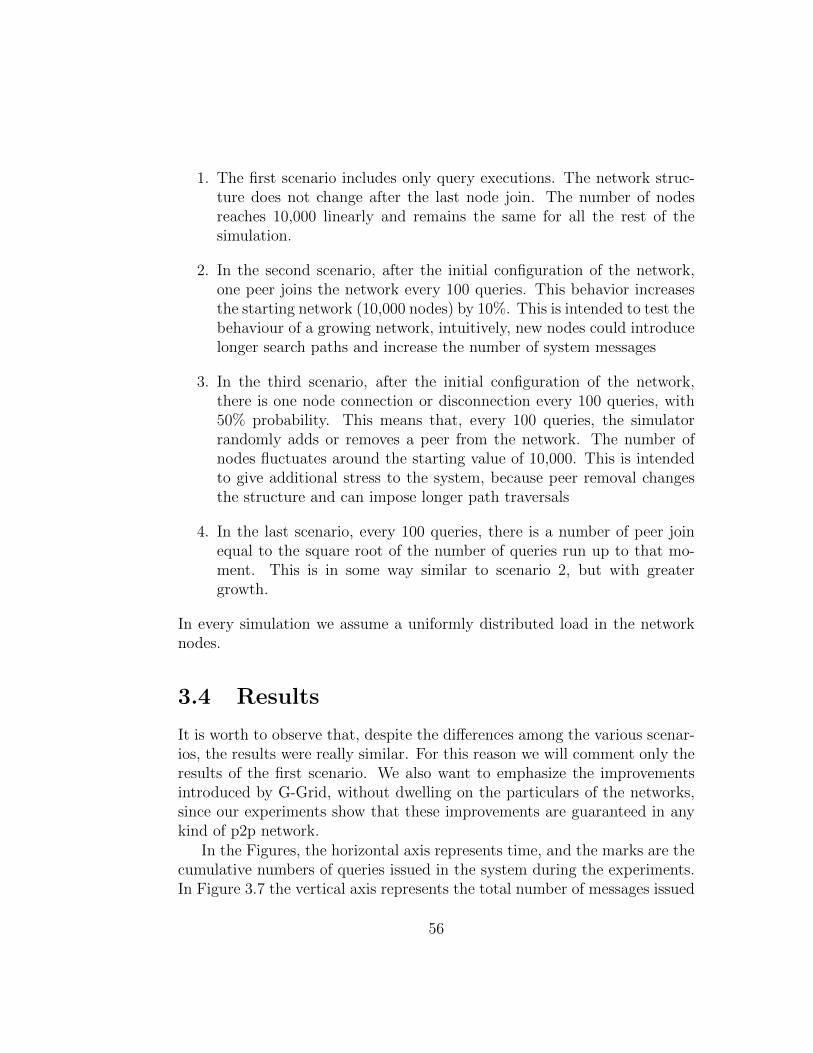
1. The first scenario includes only query executions. The network struc-ture does not change after the last node join. The number of nodesreaches 10,000 linearly and remains the same for all the rest of thesimulation.
2. In the second scenario, after the initial configuration of the network,one peer joins the network every 100 queries. This behavior increasesthe starting network (10,000 nodes) by 10%. This is intended to test thebehaviour of a growing network, intuitively, new nodes could introducelonger search paths and increase the number of system messages
3. In the third scenario, after the initial configuration of the network,there is one node connection or disconnection every 100 queries, with50% probability. This means that, every 100 queries, the simulatorrandomly adds or removes a peer from the network. The number ofnodes fluctuates around the starting value of 10,000. This is intendedto give additional stress to the system, because peer removal changesthe structure and can impose longer path traversals
4. In the last scenario, every 100 queries, there is a number of peer joinequal to the square root of the number of queries run up to that mo-ment. This is in some way similar to scenario 2, but with greatergrowth.
In every simulation we assume a uniformly distributed load in the networknodes.
3.4 Results
It is worth to observe that, despite the differences among the various scenar-ios, the results were really similar. For this reason we will comment only theresults of the first scenario. We also want to emphasize the improvementsintroduced by G-Grid, without dwelling on the particulars of the networks,since our experiments show that these improvements are guaranteed in anykind of p2p network.
In the Figures, the horizontal axis represents time, and the marks are thecumulative numbers of queries issued in the system during the experiments.In Figure 3.7 the vertical axis represents the total number of messages issued
56
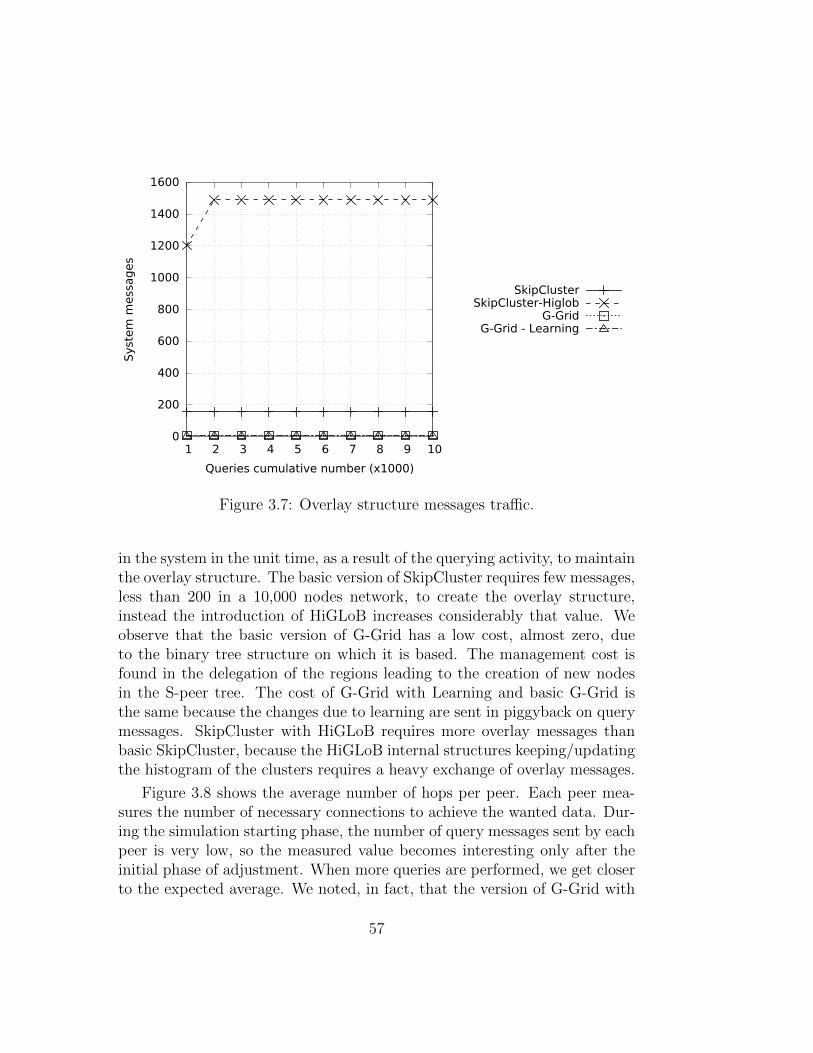
0
200
400
600
800
1000
1200
1400
1600
1 2 3 4 5 6 7 8 9 10
Syst
em
mess
ag
es
Queries cumulative number (x1000)
SkipClusterSkipCluster-Higlob
G-GridG-Grid - Learning
Figure 3.7: Overlay structure messages traffic.
in the system in the unit time, as a result of the querying activity, to maintainthe overlay structure. The basic version of SkipCluster requires few messages,less than 200 in a 10,000 nodes network, to create the overlay structure,instead the introduction of HiGLoB increases considerably that value. Weobserve that the basic version of G-Grid has a low cost, almost zero, dueto the binary tree structure on which it is based. The management cost isfound in the delegation of the regions leading to the creation of new nodesin the S-peer tree. The cost of G-Grid with Learning and basic G-Grid isthe same because the changes due to learning are sent in piggyback on querymessages. SkipCluster with HiGLoB requires more overlay messages thanbasic SkipCluster, because the HiGLoB internal structures keeping/updatingthe histogram of the clusters requires a heavy exchange of overlay messages.
Figure 3.8 shows the average number of hops per peer. Each peer mea-sures the number of necessary connections to achieve the wanted data. Dur-ing the simulation starting phase, the number of query messages sent by eachpeer is very low, so the measured value becomes interesting only after theinitial phase of adjustment. When more queries are performed, we get closerto the expected average. We noted, in fact, that the version of G-Grid with
57
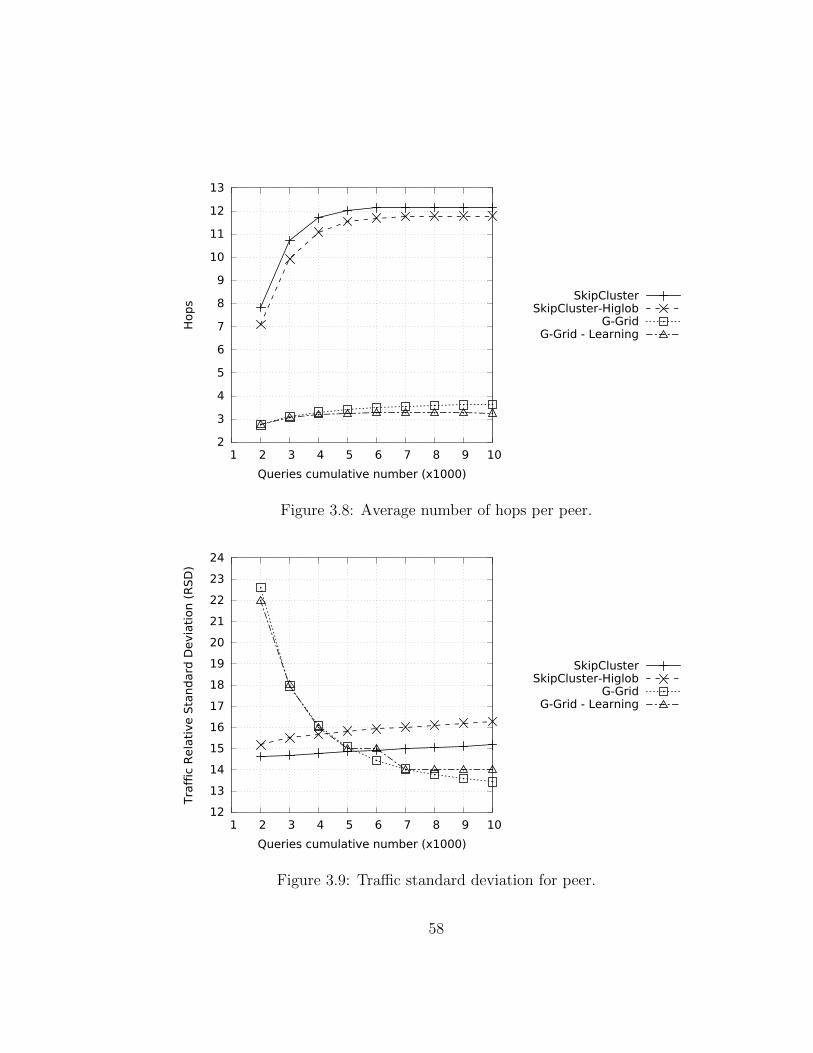
2
3
4
5
6
7
8
9
10
11
12
13
1 2 3 4 5 6 7 8 9 10
Hop
s
Queries cumulative number (x1000)
SkipClusterSkipCluster-Higlob
G-GridG-Grid - Learning
Figure 3.8: Average number of hops per peer.
12
13
14
15
16
17
18
19
20
21
22
23
24
1 2 3 4 5 6 7 8 9 10
Tra
ffic
Rela
tive S
tand
ard
Devia
tion (
RS
D)
Queries cumulative number (x1000)
SkipClusterSkipCluster-Higlob
G-GridG-Grid - Learning
Figure 3.9: Traffic standard deviation for peer.
58
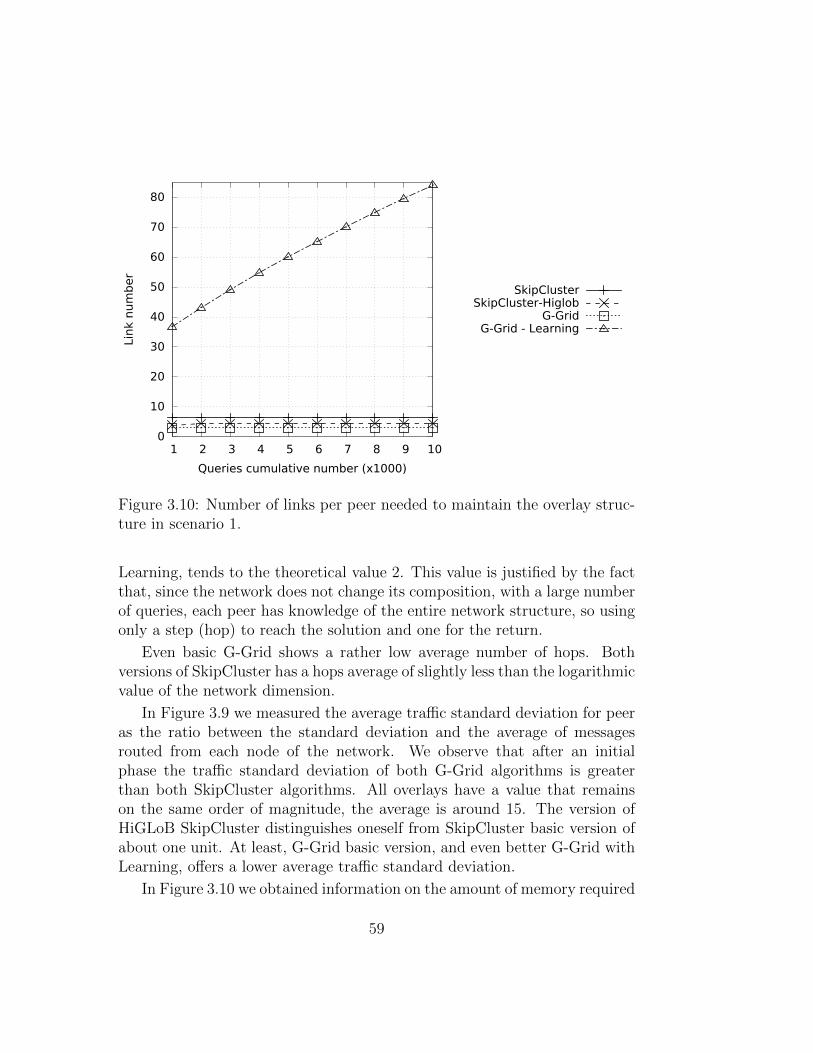
0
10
20
30
40
50
60
70
80
1 2 3 4 5 6 7 8 9 10
Link
num
ber
Queries cumulative number (x1000)
SkipClusterSkipCluster-Higlob
G-GridG-Grid - Learning
Figure 3.10: Number of links per peer needed to maintain the overlay struc-ture in scenario 1.
Learning, tends to the theoretical value 2. This value is justified by the factthat, since the network does not change its composition, with a large numberof queries, each peer has knowledge of the entire network structure, so usingonly a step (hop) to reach the solution and one for the return.
Even basic G-Grid shows a rather low average number of hops. Bothversions of SkipCluster has a hops average of slightly less than the logarithmicvalue of the network dimension.
In Figure 3.9 we measured the average traffic standard deviation for peeras the ratio between the standard deviation and the average of messagesrouted from each node of the network. We observe that after an initialphase the traffic standard deviation of both G-Grid algorithms is greaterthan both SkipCluster algorithms. All overlays have a value that remainson the same order of magnitude, the average is around 15. The version ofHiGLoB SkipCluster distinguishes oneself from SkipCluster basic version ofabout one unit. At least, G-Grid basic version, and even better G-Grid withLearning, offers a lower average traffic standard deviation.
In Figure 3.10 we obtained information on the amount of memory required
59
for the maintenance of each structure. Large number of links necessarily in-volves high amount of memory to store them. In every scenario the situationis the same: the worst overlay is represented by G-Grid with Learning, be-cause the number of links increases as the number of executed queries. Infact, for each query, each peer discovers and creates links with the othernodes through which the query is passed. This leads to have a number oflinks equal to the size of the network, in the steady state. The upward trendof the links will arrive at 10000 after a very large number of queries. Thebasic version of G-Grid has the least number of links per node due to itsbinary tree structure. At last we note that the introduction of HiGLoB inSkipCluster decreases the number of links of the structure by one third, closeto the value observed for basic G-Grid.
A new scalable self-organising data structure for P2P networks is intro-duced. This structure enables efficient multi-dimensional search based onpartial range queries. We have also illustrated how peers can exploit theproperties of these structures to learn dynamically both the distribution ofcontent and the network topology, and thereby, provide algorithms for effi-cient processing of range queries. In the worst case, search costs for a singleobject, measured as the number of hops over peers, are less than logarithmicin the number of peers. But, for many realistic workloads of insertions ofnew objects and retrievals, such as those currently taking place on the web,the average is equal or less than 3 hops, independently on the wideness of theP2P network. We have also sketched out an aspect which is seldom treated inP2P literature, namely the possibility of merging independently constructeddata structures in a single unifying structure.
This work summarizes the idea of achieving virtual DBMSs from P2Psystems as a set of emergent services, but which abide by the same desirableproperties of centralized DBMSs, namely, data integrity and consistence,transaction processing and a complete SQL expressiveness. Now, let see howit is possible to improve some performance results with an hybrid overlay.
60
Chapter 4
Self-Balancing of Traffic Loadin a HierarchicalMultidimensional P2P System
The P2P technologies have begun to attract the interest of the scientificcommunity relatively late compared to their use. In the late 90’s many P2Papplications could be found on the Internet and these have always enjoyeda high capillarity among worldwide users. Then it was discovered that thistechnology were very promising for networks efficiency, distribution and shar-ing of resources. Such networks are dynamic, completely decentralized andcharacterized by high autonomy.
Today there is a tendency to study networks seen not merely as telem-atic networks, but as recurrent structures that we can encounter, in someway, in several aspect of daily life, such as: the aggregation of the neuronsof the human brain, the connections that form human knowledge within asociety of people, the properties and structures of ecosystems, the dynamicsof spreading news. This new ideas are defining the “science of networks” [18],a new discipline that studies the structure of the networks in all its differentforms, from a general point of view, analyzing their properties and how theyaffect the daily reality. For its own nature the science of networks involvesseveral scientific disciplines.
The main applications that have affected the world of P2P were primarilyoriented to distributed file systems and grid computing. In particular, theearly distributed file systems allowed only simple lookups of file directoriesby file name. In the meanwhile, the scientific literature was proposing to
61
increase efficiency and operativity by adding some kind of structure.
A P2P network without an organized structure uses the broadcast to al-low the comunication among peer. In this way, however, the network becomesoverloaded quickly and communication is neither efficient nor scalable. Theadoption of organized structures in P2P networks avoids the use of broadcastand decreases network traffic. They build routing tables more efficient, espe-cially in static environments. The advent of a highly dynamicity in networkscaused the decline of the efficiency of the structures. However, also in a staticenvironment, the traffic can be unbalanced on the network when there aresome peers that are overloaded and others that are instead underloaded. Thisis typical in tree structure. G-Grid is a distributed data structure for P2Pnetworks, that creates multi-dimensional indexes on P2P networks, makingthe basic operations research (including range-query) and database editingvery efficiently, despite the fact that its structure is not imposed a priori.Its strength makes the structure very flexible, but at the moment its biggestflaw is the computational load balancing of the peer, because its structure isa binary tree.
Now we try to improve drastically load balancing in G-Grid by seamlessintegrating a new ring-based routing algorithm, as a self-emergent property.
4.1 Reasons for the Improvements
Peer-to-peer networks have attracted the interest of the scientific communitybecause they offer features that other communication paradigms fail to offer.
Current solutions allow to search efficiently, without consuming unneces-sary bandwidth with broadcast messages, and even in some proposals alsoto treat multi-dimensional data. The possibility of treating these networksas distributed DBMS, or systems in which we can issue something similarto SQL queries and get support to consistency checking and transactions,still seems a goal to reach and research is currently going in this direction.The addition of an overlay structure in modern P2P networks is the key toupgrade them. This means that now the location of data on the peer isregulated for content and criteria, whereas previously each node could holdall kinds of data, and this was not conducive to the development of efficientrouting algorithms. The research, even if the peer does not have a globalknowledge of the topology, is aided by this structure which helps throughthe collaboration of nodes, to have more precise information on the alloca-
62
tion of data.
The “datum-node” assignment is performed by DHT [10, 58], and eachstructured system implements its own DHT as needed [104, 128]. The gen-eral idea is to assign a key to each datum by a specific function (usually byhashing), then the set of keys is partitioned and each node is responsible forone of these partitions. The function that links the key-node assignment issurjective and the routing algorithm is closely related to it. In fact, usuallyevery node holds references to its neighbors, which will have subspaces closeto that of its competence. The relationship between datum and key is dic-tated by a bijective function, which must be a common reference point forall nodes. When a node receives a request for a specific key, it checks if thisis part of its subspace of competence, in the contrary case it forwards themessage to a neighbor, which is selected according to the routing algorithm.
Multi-dimensional structures have been extensively investigated over thelast 20 years where the main goal is to support efficiently complex rangequeries over multiple attributes. A literature survey in this area is availablein [146],
In G-Grid (3.2), the tree is always explored recursively, and if we analyzethe scenario in a P2P environment, where each peer is responsible for atleast one region, this would have connections with its father and its sons.The insert and remove queries walk through the tree and each peer alongthe walking receives the request from its parent, evaluates if the G of therecord is in its region, recalculating the G since the depth of the tree if itcan not know it a priori, and if that fails it forwards the request to boththe children. This recursive mechanism shows how this structure works wellin P2P environments, because each step requires the interaction of only twoentities: father and son nodes. Regardless of whether working in a distributedor centralized structure, basic operations are performed exploring a binarytree and the only difference is that in distributed environment this tree issplit into parts assigned to autonomous nodes.
The advantage of the G-Grid structure is that it allows to perform inser-tions, deletions, and queries in time proportional to O(logN) where N is thenumber of regions. In addition, with the learning mechanism which will beexplained later, this time can be furtherly reduced to become sub-logarithmic.In other words, the efficiency of DBMSs is exported to distributed environ-ments by virtue of the limited number of hops1 required to complete any
1The number of gateways that separate the source host from the destination host.
63
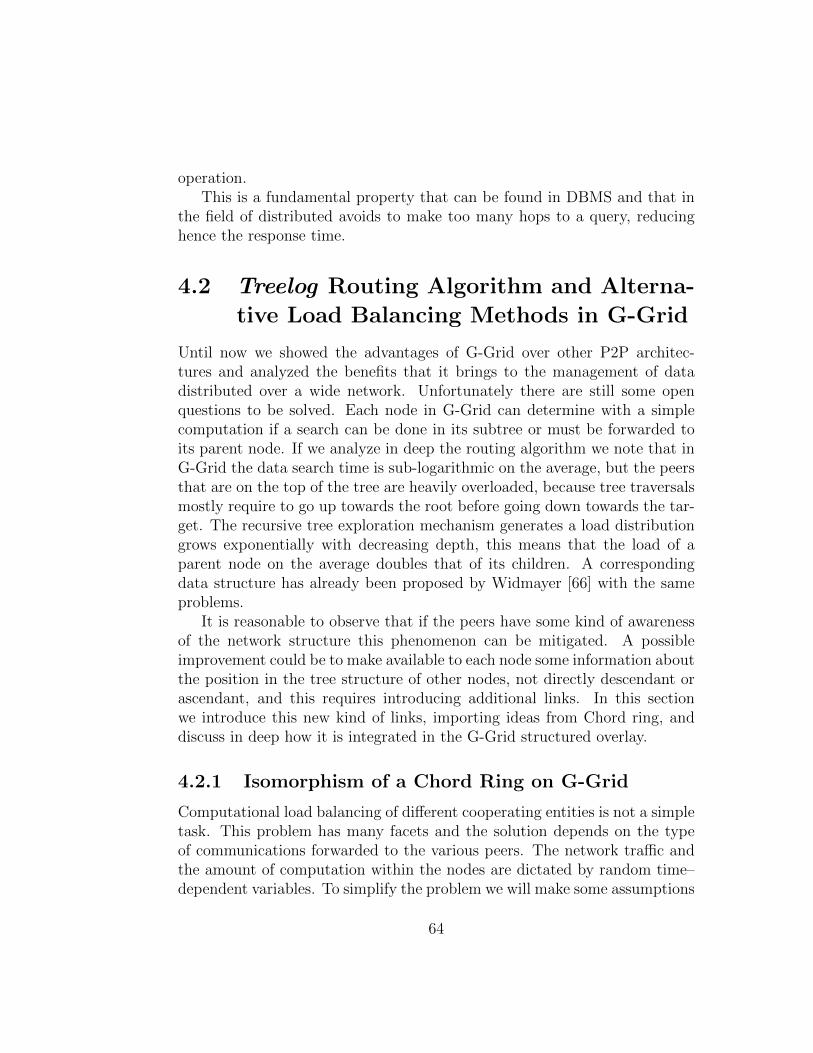
operation.This is a fundamental property that can be found in DBMS and that in
the field of distributed avoids to make too many hops to a query, reducinghence the response time.
4.2 Treelog Routing Algorithm and Alterna-
tive Load Balancing Methods in G-Grid
Until now we showed the advantages of G-Grid over other P2P architec-tures and analyzed the benefits that it brings to the management of datadistributed over a wide network. Unfortunately there are still some openquestions to be solved. Each node in G-Grid can determine with a simplecomputation if a search can be done in its subtree or must be forwarded toits parent node. If we analyze in deep the routing algorithm we note that inG-Grid the data search time is sub-logarithmic on the average, but the peersthat are on the top of the tree are heavily overloaded, because tree traversalsmostly require to go up towards the root before going down towards the tar-get. The recursive tree exploration mechanism generates a load distributiongrows exponentially with decreasing depth, this means that the load of aparent node on the average doubles that of its children. A correspondingdata structure has already been proposed by Widmayer [66] with the sameproblems.
It is reasonable to observe that if the peers have some kind of awarenessof the network structure this phenomenon can be mitigated. A possibleimprovement could be to make available to each node some information aboutthe position in the tree structure of other nodes, not directly descendant orascendant, and this requires introducing additional links. In this sectionwe introduce this new kind of links, importing ideas from Chord ring, anddiscuss in deep how it is integrated in the G-Grid structured overlay.
4.2.1 Isomorphism of a Chord Ring on G-Grid
Computational load balancing of different cooperating entities is not a simpletask. This problem has many facets and the solution depends on the typeof communications forwarded to the various peers. The network traffic andthe amount of computation within the nodes are dictated by random time–dependent variables. To simplify the problem we will make some assumptions
64
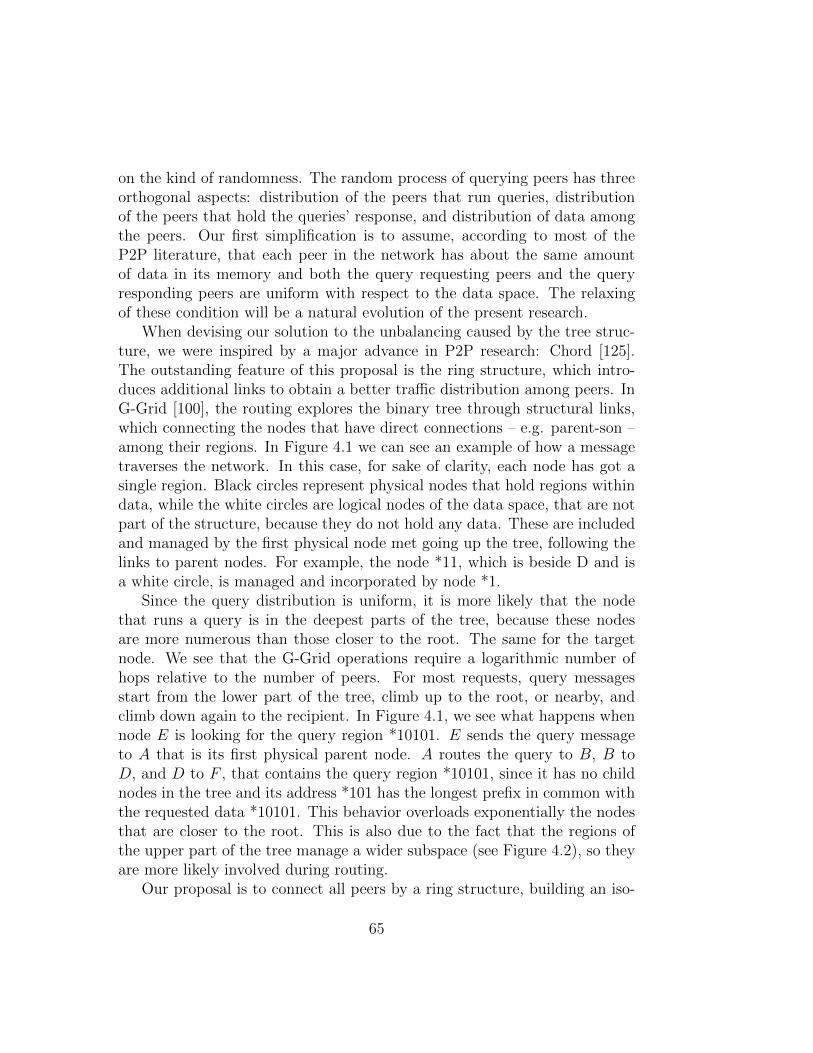
on the kind of randomness. The random process of querying peers has threeorthogonal aspects: distribution of the peers that run queries, distributionof the peers that hold the queries’ response, and distribution of data amongthe peers. Our first simplification is to assume, according to most of theP2P literature, that each peer in the network has about the same amountof data in its memory and both the query requesting peers and the queryresponding peers are uniform with respect to the data space. The relaxingof these condition will be a natural evolution of the present research.
When devising our solution to the unbalancing caused by the tree struc-ture, we were inspired by a major advance in P2P research: Chord [125].The outstanding feature of this proposal is the ring structure, which intro-duces additional links to obtain a better traffic distribution among peers. InG-Grid [100], the routing explores the binary tree through structural links,which connecting the nodes that have direct connections – e.g. parent-son –among their regions. In Figure 4.1 we can see an example of how a messagetraverses the network. In this case, for sake of clarity, each node has got asingle region. Black circles represent physical nodes that hold regions withindata, while the white circles are logical nodes of the data space, that are notpart of the structure, because they do not hold any data. These are includedand managed by the first physical node met going up the tree, following thelinks to parent nodes. For example, the node *11, which is beside D and isa white circle, is managed and incorporated by node *1.
Since the query distribution is uniform, it is more likely that the nodethat runs a query is in the deepest parts of the tree, because these nodesare more numerous than those closer to the root. The same for the targetnode. We see that the G-Grid operations require a logarithmic number ofhops relative to the number of peers. For most requests, query messagesstart from the lower part of the tree, climb up to the root, or nearby, andclimb down again to the recipient. In Figure 4.1, we see what happens whennode E is looking for the query region *10101. E sends the query messageto A that is its first physical parent node. A routes the query to B, B toD, and D to F , that contains the query region *10101, since it has no childnodes in the tree and its address *101 has the longest prefix in common withthe requested data *10101. This behavior overloads exponentially the nodesthat are closer to the root. This is also due to the fact that the regions ofthe upper part of the tree manage a wider subspace (see Figure 4.2), so theyare more likely involved during routing.
Our proposal is to connect all peers by a ring structure, building an iso-
65
Physical Node (S-Peer)
Logical Node
E - *001
C - *01
A - *
B - *1
D - *10
F - *101 G - *111
E is looking for *10101 A, B, D, F = 4 hops
*11
Figure 4.1: Example of a request routing in G-Grid.
morphism of the Chord ring structure within the G-Grid binary tree. More-over, creating logarithmic links between nodes, in addition to the ring struc-ture, we prevent an imbalanced load distribution over the structural links.The logarithmic links are precisely the link category that makes Chord a net-work structure in which the load is evenly distributed. At the same time, thenumber of messages’ hops remains logarithmic with respect to the numberof nodes.
The construction of a ring on all S–Peers imposes a total order relationon them. The amount of order relations that we can impose is factorialwith respect to the number of nodes and is not a trivial choice, since theelements that we want order are independent peers without a global viewof the network. Moreover, we want manage an autonomic system where thecontrol is highly decentralized, so we have to find a relationship that joins allpeers, regardless of the network shape, which can change dynamically over
66
E - *001
C - *01
A - *
B - *1
D - *10 F - *101
G - *111
E is looking for *10101 A, B, D, F = 4 hops
Figure 4.2: Example of the same request routing of Figure 4.1 in G-Gridhyper-space.
time. In particular, the nodes to be ordered within the ring are the onlyS–Peers, the active part of the G-Grid structure. An S–Peer forwards themessages to their destination and is responsible for a part of the data space.
Each S–Peer has a physical address, therefore we could order them ac-cording to this attribute, but this is not appropriate because these addressesare dynamic and change over time on the Internet.
One feature that is common to all S–Peers is the fact that each of themholds at least one region. We can suppose that each S–Peer holds a regionR, and, possibly, other regions RI that can all be included in R, or rather allregions RI where RI ∈ R : RI ⊃ R. In Figure 4.3, the S–Peer D has a sub-treeformed by S–Peers (black dots, e.g. F), which represent the regions that havea relationship with it, and C–Peers nodes (white dots). In particular, D hasa region RD and manages the node F (owner of the region RF ), which have
67
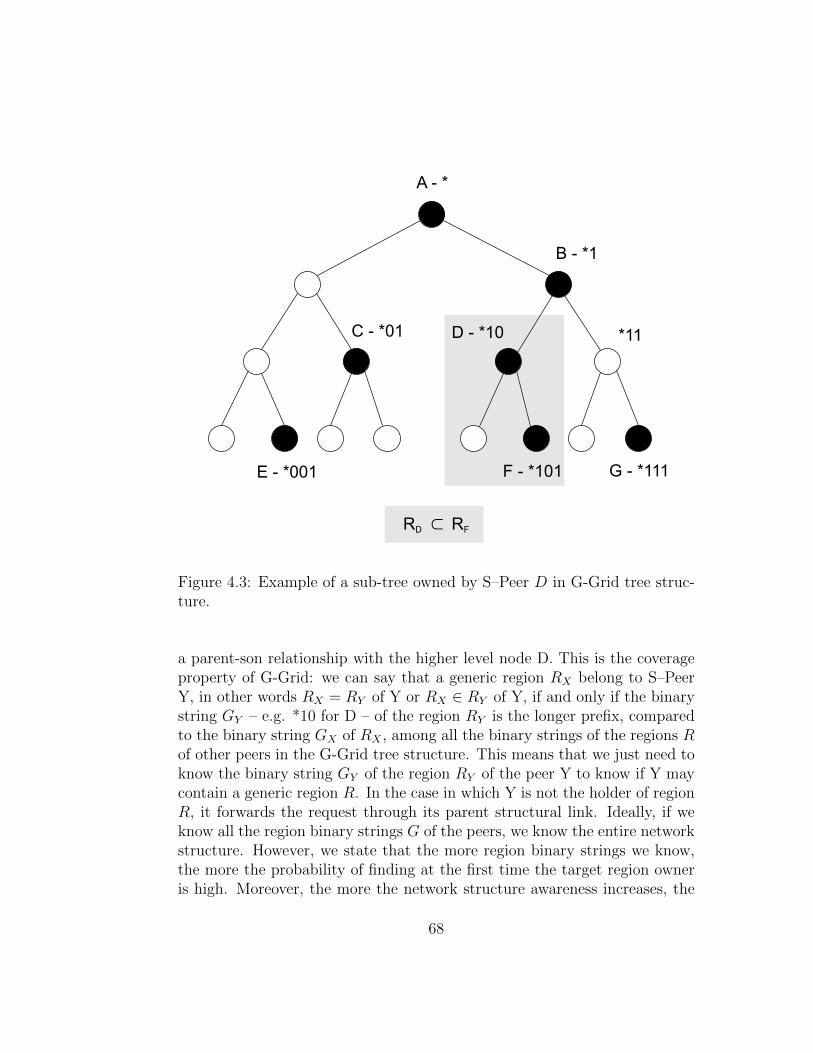
E - *001
C - *01
A - *
B - *1
D - *10
F - *101 G - *111
*11
RD ⊂ RF
Figure 4.3: Example of a sub-tree owned by S–Peer D in G-Grid tree struc-ture.
a parent-son relationship with the higher level node D. This is the coverageproperty of G-Grid: we can say that a generic region RX belong to S–PeerY, in other words RX = RY of Y or RX ∈ RY of Y, if and only if the binarystring GY – e.g. *10 for D – of the region RY is the longer prefix, comparedto the binary string GX of RX , among all the binary strings of the regions Rof other peers in the G-Grid tree structure. This means that we just need toknow the binary string GY of the region RY of the peer Y to know if Y maycontain a generic region R. In the case in which Y is not the holder of regionR, it forwards the request through its parent structural link. Ideally, if weknow all the region binary strings G of the peers, we know the entire networkstructure. However, we state that the more region binary strings we know,the more the probability of finding at the first time the target region owneris high. Moreover, the more the network structure awareness increases, the
68
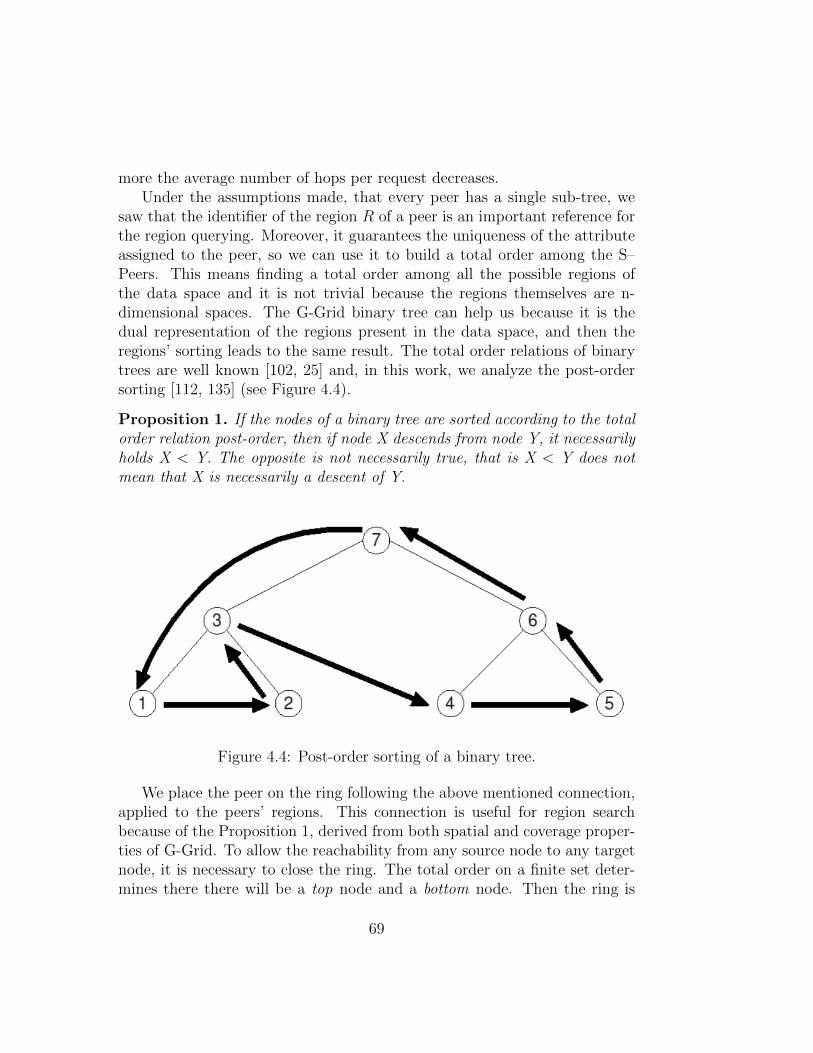
more the average number of hops per request decreases.Under the assumptions made, that every peer has a single sub-tree, we
saw that the identifier of the region R of a peer is an important reference forthe region querying. Moreover, it guarantees the uniqueness of the attributeassigned to the peer, so we can use it to build a total order among the S–Peers. This means finding a total order among all the possible regions ofthe data space and it is not trivial because the regions themselves are n-dimensional spaces. The G-Grid binary tree can help us because it is thedual representation of the regions present in the data space, and then theregions’ sorting leads to the same result. The total order relations of binarytrees are well known [102, 25] and, in this work, we analyze the post-ordersorting [112, 135] (see Figure 4.4).
Proposition 1. If the nodes of a binary tree are sorted according to the totalorder relation post-order, then if node X descends from node Y, it necessarilyholds X < Y. The opposite is not necessarily true, that is X < Y does notmean that X is necessarily a descent of Y.
Figure 4.4: Post-order sorting of a binary tree.
We place the peer on the ring following the above mentioned connection,applied to the peers’ regions. This connection is useful for region searchbecause of the Proposition 1, derived from both spatial and coverage proper-ties of G-Grid. To allow the reachability from any source node to any targetnode, it is necessary to close the ring. The total order on a finite set deter-mines there there will be a top node and a bottom node. Then the ring is
69
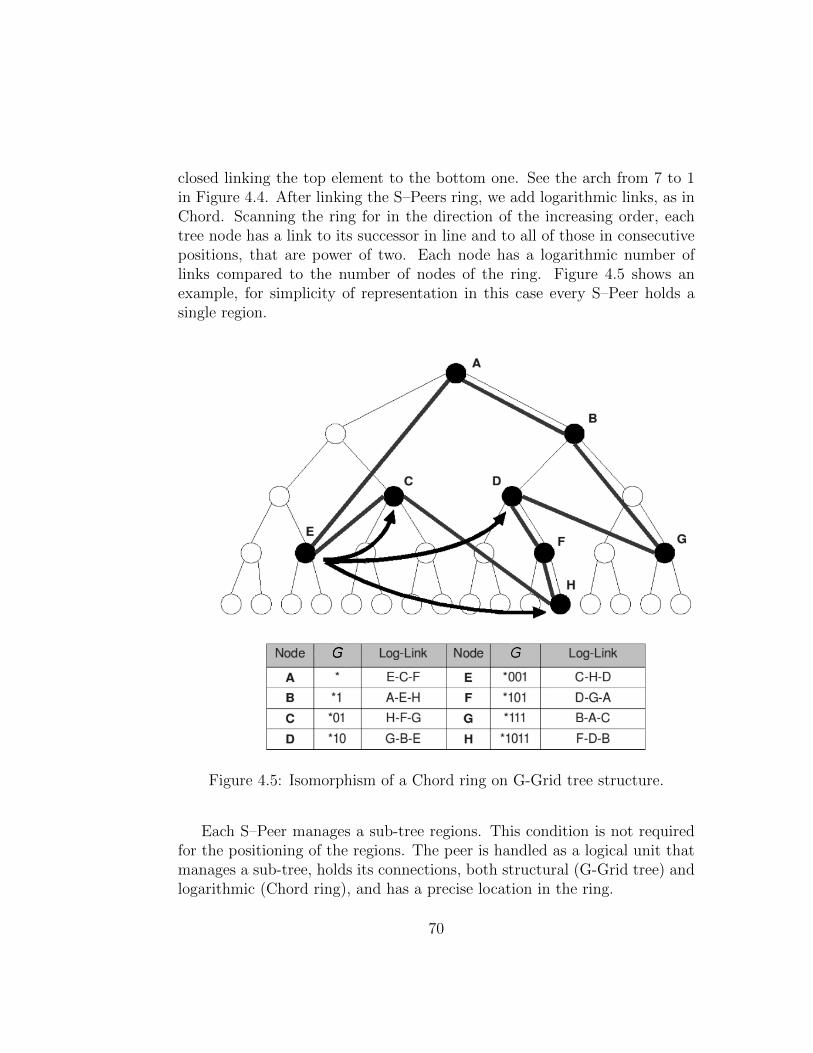
closed linking the top element to the bottom one. See the arch from 7 to 1in Figure 4.4. After linking the S–Peers ring, we add logarithmic links, as inChord. Scanning the ring for in the direction of the increasing order, eachtree node has a link to its successor in line and to all of those in consecutivepositions, that are power of two. Each node has a logarithmic number oflinks compared to the number of nodes of the ring. Figure 4.5 shows anexample, for simplicity of representation in this case every S–Peer holds asingle region.
Figure 4.5: Isomorphism of a Chord ring on G-Grid tree structure.
Each S–Peer manages a sub-tree regions. This condition is not requiredfor the positioning of the regions. The peer is handled as a logical unit thatmanages a sub-tree, holds its connections, both structural (G-Grid tree) andlogarithmic (Chord ring), and has a precise location in the ring.
70
4.2.2 Treelog Routing Algorithm
Each operation carried in G-Grid, regardless of whether it is a query, insertionor removal of data, states that it is required by a message that contains atarget attribute, that we call query region, which is the binary string G ofthe region R covered by the requested operation. The S–Peers must forwardthis message to the owner of this region using the query region, which willrun the requested operation and then communicate the results directly tothe requester. The physical address of the requester is always present in themessages.
The routing algorithm is a procedure that every S–Peer performs whenreceives a message, in order to deliver it to the correct target S–Peer. Thisis successful whether all intermediaries cooperate.
Each region is described by a binary string G, that describes the locationof the region in the binary tree. Length(G) gets the depth of the region inthe tree, which corresponds geometrically to the granularity of the searcharea. In addition, Length(G) of the query must be greater than or equal tothe Length(G) of the deepest region in the tree. This is because the querymust be contained by one region and the Length(G) of the query region cannot be greater than the Length(G) of the query itself. Calculating the binarystring with a Length(G) of the query region larger than the real one, it doesnot affect the search mechanism. For example, if a query region with GX =*100101 corresponds to a sub-space managed by the region GY = *100, thequery region will be reached even if we considered the GZ = *100101010110,with Length(GZ) = 12, larger with respect to Length(GX) = 6. The peers donot have a global vision of the network tree structure, then they run requestswith large length values of the query region, over-estimating the size of thedistributed data structure.
Any peer knows the status of the structure if it changes dynamically.Given a query region and a partial view of that query region, which may notbe correct, how do we know where is the query region located in the systemstructure? Moreover, how do we find out the request target node? We havea set of possible candidates which have a binary string G of R as prefix of thequery region. We do not know a priori how many peers are in the system,nor their location. We can not know in advance whether a node is logical orrepresents a specific region owned by a S–Peer. The possible candidates areall the nodes in the binary tree that have a prefix that fits with the G of thequery region. Fortunately, it is a small number – sub-logarithmic, compared
71
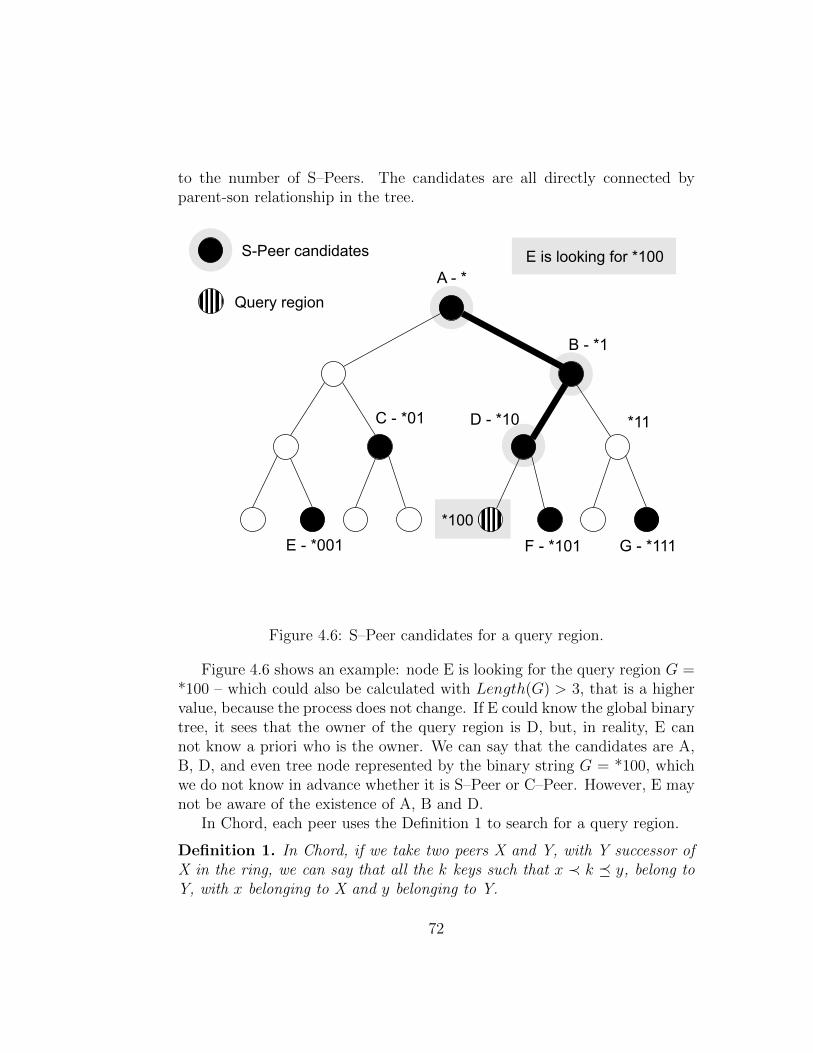
to the number of S–Peers. The candidates are all directly connected byparent-son relationship in the tree.
E - *001
C - *01
A - *
B - *1
D - *10
F - *101 G - *111
*11
S-Peer candidates E is looking for *100
*100
Query region
Figure 4.6: S–Peer candidates for a query region.
Figure 4.6 shows an example: node E is looking for the query region G =*100 – which could also be calculated with Length(G) > 3, that is a highervalue, because the process does not change. If E could know the global binarytree, it sees that the owner of the query region is D, but, in reality, E cannot know a priori who is the owner. We can say that the candidates are A,B, D, and even tree node represented by the binary string G = *100, whichwe do not know in advance whether it is S–Peer or C–Peer. However, E maynot be aware of the existence of A, B and D.
In Chord, each peer uses the Definition 1 to search for a query region.
Definition 1. In Chord, if we take two peers X and Y, with Y successor ofX in the ring, we can say that all the k keys such that x ≺ k � y, belong toY, with x belonging to X and y belonging to Y.
72

The isomorphism of the ring in G-Grid has improved the load balancing,as we will show later, but has complicated the query region search, in partic-ular, Definition 1 does not hold anymore. All the nodes of G-Grid representsub-spaces and they are sorted according to the post-order relationship. As-suming that each peer manages a single sub-tree, the following propositionholds.
Proposition 2. In G-Grid Chord, given two peers X and Y, with Y successorof X in the ring, we can not say that all the R regions such that x ≺ r � ybelong to Y, but only a non–empty subset of these.
In other words, while Chord is a pure ring, in G-Grid Chord the ringis used only for message routing, when possible, otherwise the binary treestructure is always available.
The example in Figure 4.5 shows the meaning of Proposition 2: considerthe peer D, the peer G and, respectively, their binary strings RD = *10 andRG = *111. Along the ring, from D to G, we encounter different logicalnodes, which represent the regions in post-order *1100 - *1101 - *110 - *1110- *1111 - *111. Only *1110 - *1111 - *111, however, belong to the node G,while *1100 - *1101 - *110 are sub-spaces managed by B, which has as abinary string GB = *1. The distribution of the regions in the nodes is notknown a priori, since it depends on the shape of the tree and its evolution.A peer can not know in advance who will be the message last recipient, butcan only guess (see S–Peer candidates in Figure 4.5).
Because of these considerations, we developed the treelog routing algo-rithm, which uses the Chord routing mechanisms adapting the search of queryregions to the dual structure of G-Grid, according to what Definition 1 andProposition 2 state. The pseudo-code of the Algorithm 3 describes the ac-tions that each peer executes when receiving a message whose query regionis not under its responsibility.
This procedure requires the following input parameters:
• selfG - The G of the region R of the peer which is currently processingthe message and received the message to forward.
• links - The routing table: a set of links to other S–Peer accumulatedover time. Basically it is a two-column table in which the first is the Gof the region R of the peer and the second is its physical address. Thelatter can be retrieved via the function physicalAddress(G).
73
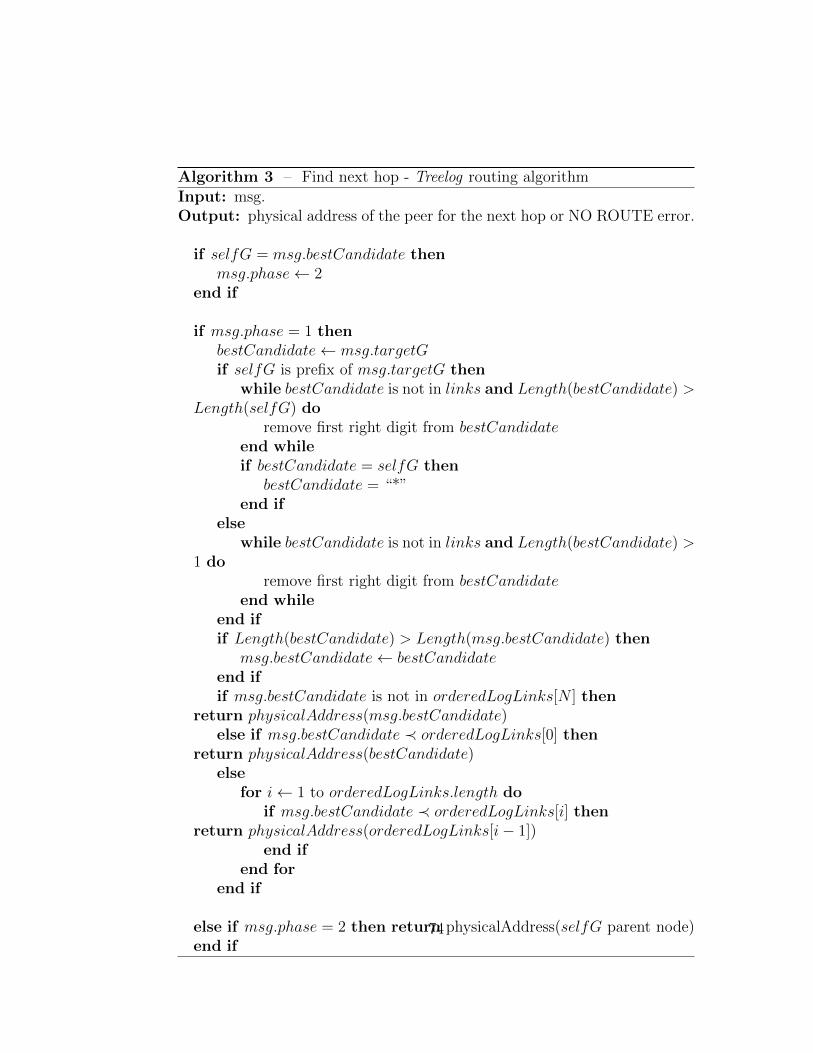
Algorithm 3 – Find next hop - Treelog routing algorithmInput: msg.Output: physical address of the peer for the next hop or NO ROUTE error.
if selfG = msg.bestCandidate thenmsg.phase← 2
end if
if msg.phase = 1 thenbestCandidate← msg.targetGif selfG is prefix of msg.targetG then
while bestCandidate is not in links and Length(bestCandidate) >Length(selfG) do
remove first right digit from bestCandidateend whileif bestCandidate = selfG then
bestCandidate = “*”end if
elsewhile bestCandidate is not in links and Length(bestCandidate) >
1 doremove first right digit from bestCandidate
end whileend ifif Length(bestCandidate) > Length(msg.bestCandidate) then
msg.bestCandidate← bestCandidateend ifif msg.bestCandidate is not in orderedLogLinks[N ] then
return physicalAddress(msg.bestCandidate)else if msg.bestCandidate ≺ orderedLogLinks[0] then
return physicalAddress(bestCandidate)else
for i← 1 to orderedLogLinks.length doif msg.bestCandidate ≺ orderedLogLinks[i] then
return physicalAddress(orderedLogLinks[i− 1])end if
end forend if
else if msg.phase = 2 then return physicalAddress(selfG parent node)end if
74
• orderdLogLinks[N] - A subset of the routing table: it is a vector ofN links ordered by the relation of post-order. The first element is selfG.Basically they are the Chord logarithmic links of the peer.
• msg - The received message. If it involves a region that is not theresponsibility of this peer, it must therefore be forwarded. The mostimportant message attributes for the routing are:
msg.targetG query region,
msg.phase set to 1 upon creation, it allows to know the state of therequest,
msg.bestCandidate indicates what is at present the best candidatefound by intermediaries could hold msg.targetG.
The output of the algorithm can be:
• the physical address of the next S–Peer to which the message will beforwarded. In the event that the expedition fails, for example, becausethe recipient is disconnected, the peer updates the routing table andre-runs Algorithm 3.
• a NOROUTE error, if the procedure does not succeed in finding asuitable peer, i.e. there are no possible routes to reach the destinationthrough the treelog algorithm. In this case the current S–Peer com-municates the error to the sender of the message, the one who createdit.
The algorithm tries to find the recipient by the logarithmic links. Whenthe recipient, designated in a set of possible candidates, is not correct, thenthe peer route the message through the G-Grid standard routing. Eachintermediate S–Peer that processes the query message executes the treelogalgorithm. The more S–Peers processes the request and the more likely isthat someone knows the recipient, because if a S–Peer has not the exactinformation on the recipient, might have information that approaches it.
The general algorithm so works in two phases, which indicate the statusof the current request with the attribute msg.phase: if it has a value of 1means that the search for the recipient is on the logarithmic links; it is 2instead if the search is via the G-Grid structural links.
75
Phase 1For a generic hop, through logarithmic links, first step aims to get thebest candidate that peer intermediaries have found so far. Each peerhas a routing table updated over time. In this phase, the peer searcheslinks in the routing table, that may be candidates for msg.targetG,that are peers that have a prefix of msg.targetG in the binary stringG of their region R. This binary string is placed in the attributemsg.bestCandidate if and only if it is larger - compared with the Length(G),indicating the depth of the tree - than the current value.
When the selfG of the current peer is equal to msg.bestCandidate, thereare two possibilities:
- the region request is held by the current peer so the final recipientis reached;
- msg.bestCandidate is not the correct recipient, but it could still beone of its children peers in the tree. The correct recipient deriveshence from the current candidate, so if structural links are consis-tent, the message arrives at its destination through msg.bestCandidatepeer.
Furthermore the attribute msg.bestCandidate could, at this point, in-dicating a deeper node of the real owner. This case is solved by thealgorithm in the following way: if a peer receives a message that is stillin phase 1 and msg.bestCandidate is previous than the first logarithmiclink of the current S–Peer, then it go to phase 2.
Phase 2In the event that the peer do not hold any such link, then the root nodeis considered as the best candidate, because in the worst case it reachesall the nodes. In this case it uses the structural links parent-son amongnodes.
The average number of hops is sub-logarithmic respect to the number ofpeers, because each intermediary transfers a part of its network knowledgeon the query message. The mechanism allows a S–Peer to indicate the bestcandidate. Without the phase 1, this knowledge would not be distributed onthe request and the load becomes unbalanced. The treelog routing algorithmmixes the Chord routing mechanisms with those of G-Grid: each helps to
76
improve the defects of the other. In particular, Chord helps to balance theload on the peers, while G-Grid ensures that each message is properly de-livered to destination – if structural links are consistent. The more networkknowledge is hold by peers, the higher is the probability that intermediariesindicate candidates closer to the recipient.
The learning mechanism, introduced in [100], helps to increase awarenessand to discover peers joined the network recently, but does not identify thedisconnected peers. In the following sections, we give some indication toidentify the inconsistent connections.
Finally, we summarize the properties introduced by the treelog algorithmwith the following Proposition:
Proposition 3. Necessary and sufficient condition for the correct routing:each peer must hold consistent structural links (parent-son), which is a smallnumber compared to the number of peers of the network. The average numberof hops for queries and load balancing is strongly influenced by the degree ofknowledge that peers have on the network. Each peer must then maintainlinks to the peer that has processed messages and their intermediaries.
4.2.3 Cooperative Construction of Logarithmic Link
When a node becomes S–Peer has some structural link – certainly a linkto the parent node that delegated the regions – and a collection of linksto S–Peers. We stated that the treelog routing algorithm needs new links,the logarithmic links, which connect the peer with each ring node that isreachable in a logarithmic number of hops respect to the total number ofpeers in the ring.
Analyzing a single routing table, we can not know its logarithmic links.Each S–Peer should know the global state of the network, moment by mo-ment, to know who is the S–Peer successor on the ring, who the followingafter 2 positions, 4 positions, 8, and so on. This is not possible because eachpeer can not have a global view of the network instantly. The received in-formation often may be incorrect due to the dynamics of the network. EachS–Peer knows a portion of the state of the network and to build its logarith-mic links, has to cooperate with its neighbors to achieve a fairly consistentnetwork knowledge. Through the exchange of their local information, the S–Peers can compare different views of the network, which differ between themand with the actual state of the network. Deducting reliable information on
77
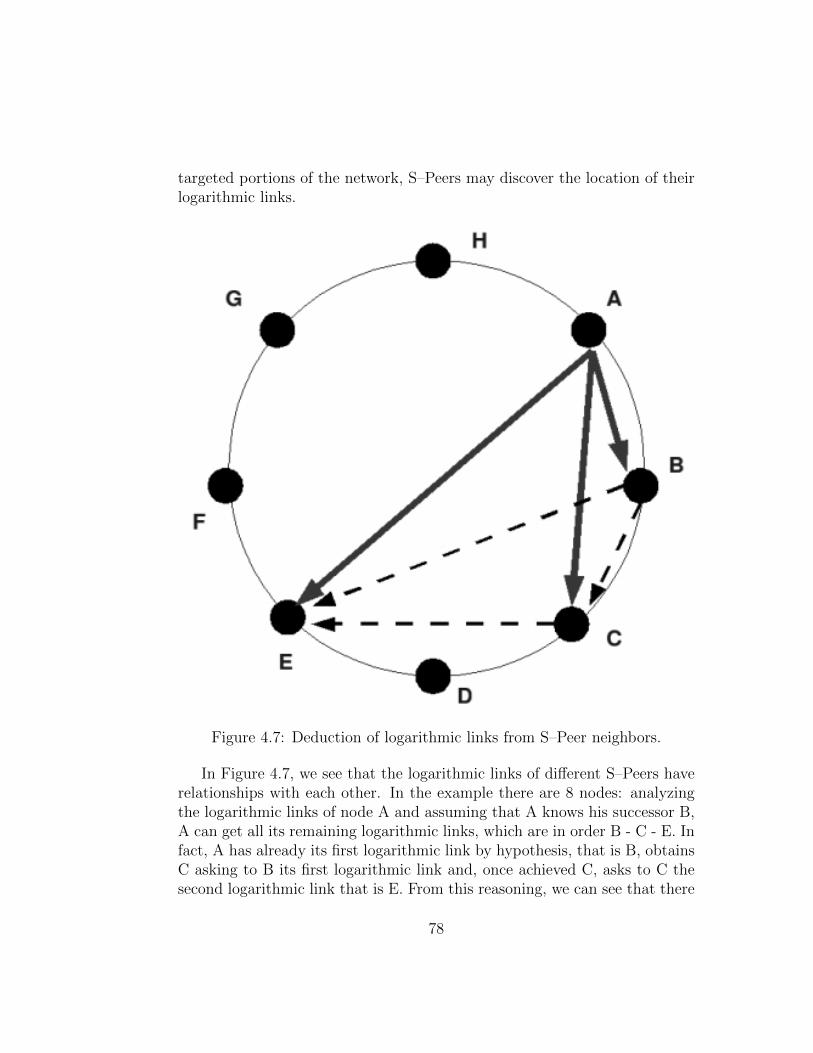
targeted portions of the network, S–Peers may discover the location of theirlogarithmic links.
Figure 4.7: Deduction of logarithmic links from S–Peer neighbors.
In Figure 4.7, we see that the logarithmic links of different S–Peers haverelationships with each other. In the example there are 8 nodes: analyzingthe logarithmic links of node A and assuming that A knows his successor B,A can get all its remaining logarithmic links, which are in order B - C - E. Infact, A has already its first logarithmic link by hypothesis, that is B, obtainsC asking to B its first logarithmic link and, once achieved C, asks to C thesecond logarithmic link that is E. From this reasoning, we can see that there
78
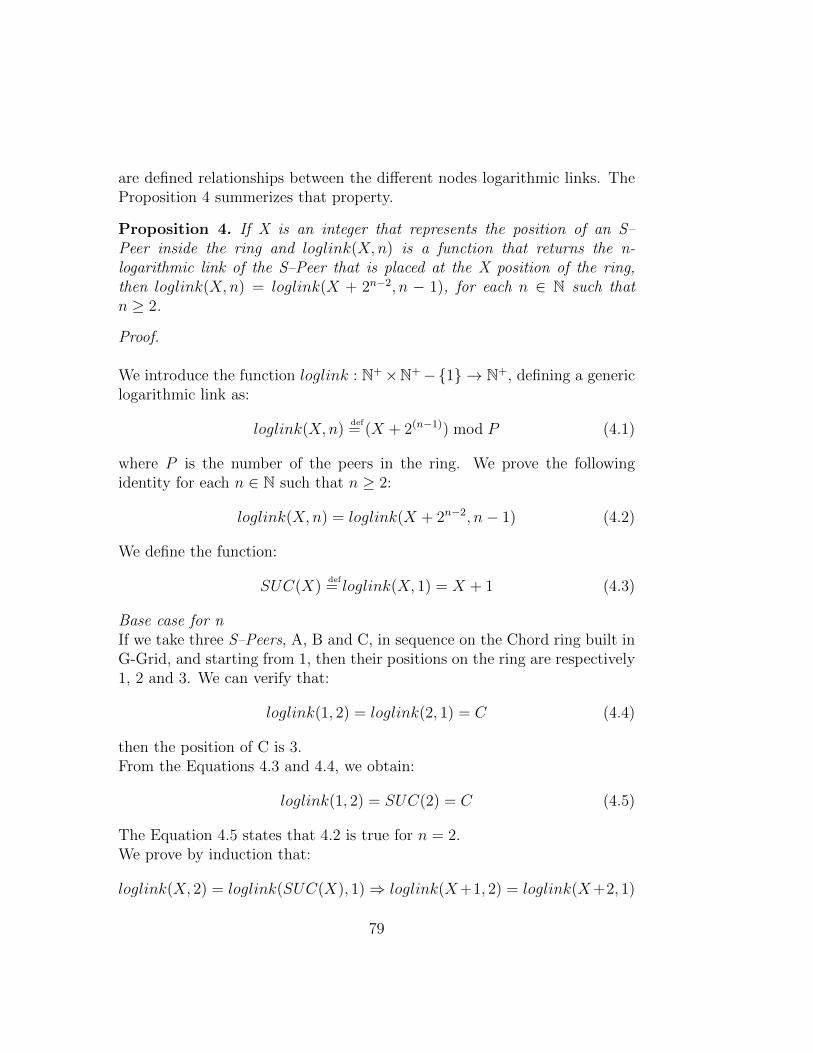
are defined relationships between the different nodes logarithmic links. TheProposition 4 summerizes that property.
Proposition 4. If X is an integer that represents the position of an S–Peer inside the ring and loglink(X,n) is a function that returns the n-logarithmic link of the S–Peer that is placed at the X position of the ring,then loglink(X,n) = loglink(X + 2n−2, n − 1), for each n ∈ N such thatn ≥ 2.
Proof.
We introduce the function loglink : N+×N+−{1} → N+, defining a genericlogarithmic link as:
loglink(X,n)def= (X + 2(n−1)) mod P (4.1)
where P is the number of the peers in the ring. We prove the followingidentity for each n ∈ N such that n ≥ 2:
loglink(X,n) = loglink(X + 2n−2, n− 1) (4.2)
We define the function:
SUC(X)def= loglink(X, 1) = X + 1 (4.3)
Base case for nIf we take three S–Peers, A, B and C, in sequence on the Chord ring built inG-Grid, and starting from 1, then their positions on the ring are respectively1, 2 and 3. We can verify that:
loglink(1, 2) = loglink(2, 1) = C (4.4)
then the position of C is 3.From the Equations 4.3 and 4.4, we obtain:
loglink(1, 2) = SUC(2) = C (4.5)
The Equation 4.5 states that 4.2 is true for n = 2.We prove by induction that:
loglink(X, 2) = loglink(SUC(X), 1)⇒ loglink(X+1, 2) = loglink(X+2, 1)
79
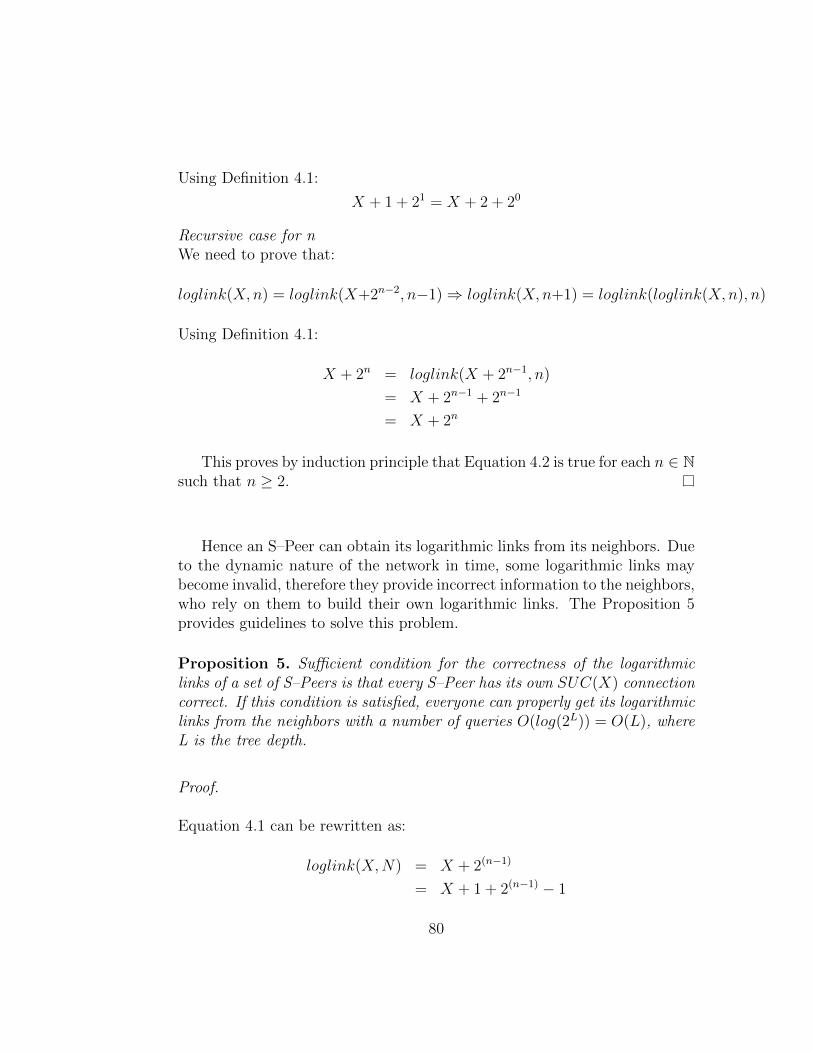
Using Definition 4.1:
X + 1 + 21 = X + 2 + 20
Recursive case for nWe need to prove that:
loglink(X,n) = loglink(X+2n−2, n−1)⇒ loglink(X,n+1) = loglink(loglink(X,n), n)
Using Definition 4.1:
X + 2n = loglink(X + 2n−1, n)
= X + 2n−1 + 2n−1
= X + 2n
This proves by induction principle that Equation 4.2 is true for each n ∈ Nsuch that n ≥ 2.
Hence an S–Peer can obtain its logarithmic links from its neighbors. Dueto the dynamic nature of the network in time, some logarithmic links maybecome invalid, therefore they provide incorrect information to the neighbors,who rely on them to build their own logarithmic links. The Proposition 5provides guidelines to solve this problem.
Proposition 5. Sufficient condition for the correctness of the logarithmiclinks of a set of S–Peers is that every S–Peer has its own SUC(X) connectioncorrect. If this condition is satisfied, everyone can properly get its logarithmiclinks from the neighbors with a number of queries O(log(2L)) = O(L), whereL is the tree depth.
Proof.
Equation 4.1 can be rewritten as:
loglink(X,N) = X + 2(n−1)
= X + 1 + 2(n−1) − 1
80
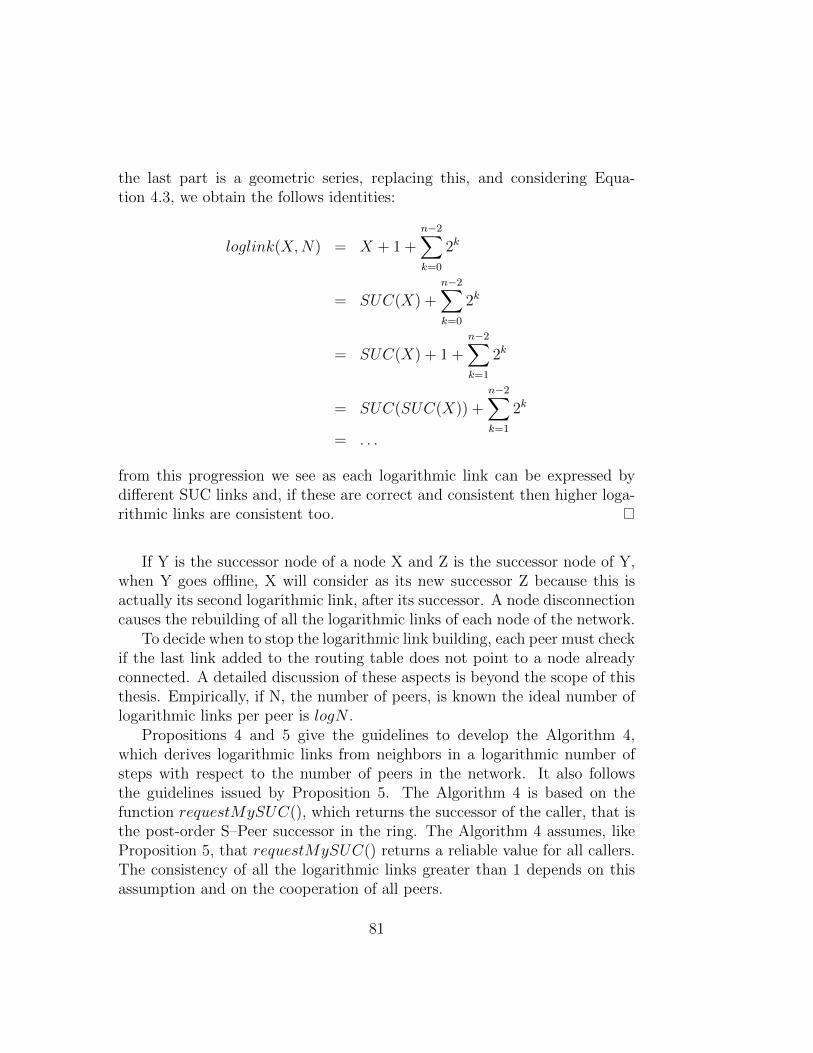
the last part is a geometric series, replacing this, and considering Equa-tion 4.3, we obtain the follows identities:
loglink(X,N) = X + 1 +n−2∑k=0
2k
= SUC(X) +n−2∑k=0
2k
= SUC(X) + 1 +n−2∑k=1
2k
= SUC(SUC(X)) +n−2∑k=1
2k
= . . .
from this progression we see as each logarithmic link can be expressed bydifferent SUC links and, if these are correct and consistent then higher loga-rithmic links are consistent too.
If Y is the successor node of a node X and Z is the successor node of Y,when Y goes offline, X will consider as its new successor Z because this isactually its second logarithmic link, after its successor. A node disconnectioncauses the rebuilding of all the logarithmic links of each node of the network.
To decide when to stop the logarithmic link building, each peer must checkif the last link added to the routing table does not point to a node alreadyconnected. A detailed discussion of these aspects is beyond the scope of thisthesis. Empirically, if N, the number of peers, is known the ideal number oflogarithmic links per peer is logN .
Propositions 4 and 5 give the guidelines to develop the Algorithm 4,which derives logarithmic links from neighbors in a logarithmic number ofsteps with respect to the number of peers in the network. It also followsthe guidelines issued by Proposition 5. The Algorithm 4 is based on thefunction requestMySUC(), which returns the successor of the caller, that isthe post-order S–Peer successor in the ring. The Algorithm 4 assumes, likeProposition 5, that requestMySUC() returns a reliable value for all callers.The consistency of all the logarithmic links greater than 1 depends on thisassumption and on the cooperation of all peers.
81
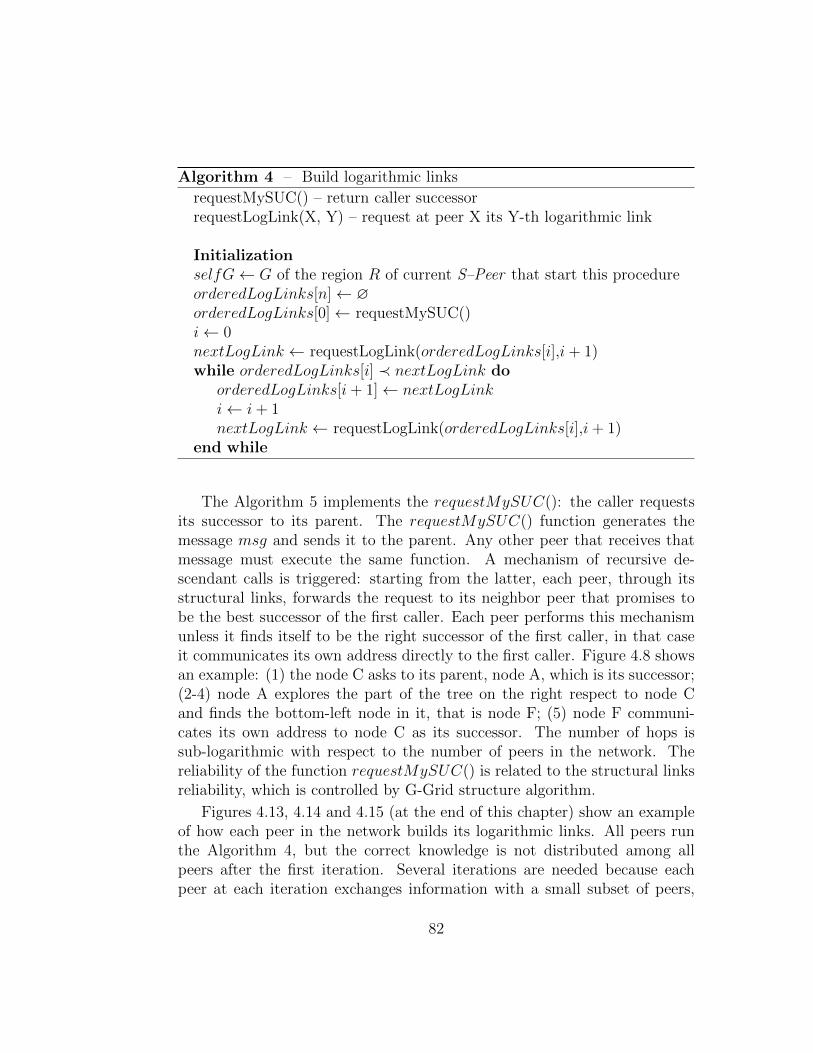
Algorithm 4 – Build logarithmic links
requestMySUC() – return caller successorrequestLogLink(X, Y) – request at peer X its Y-th logarithmic link
InitializationselfG← G of the region R of current S–Peer that start this procedureorderedLogLinks[n]← ∅orderedLogLinks[0]← requestMySUC()i← 0nextLogLink ← requestLogLink(orderedLogLinks[i],i + 1)while orderedLogLinks[i] ≺ nextLogLink do
orderedLogLinks[i + 1]← nextLogLinki← i + 1nextLogLink ← requestLogLink(orderedLogLinks[i],i + 1)
end while
The Algorithm 5 implements the requestMySUC(): the caller requestsits successor to its parent. The requestMySUC() function generates themessage msg and sends it to the parent. Any other peer that receives thatmessage must execute the same function. A mechanism of recursive de-scendant calls is triggered: starting from the latter, each peer, through itsstructural links, forwards the request to its neighbor peer that promises tobe the best successor of the first caller. Each peer performs this mechanismunless it finds itself to be the right successor of the first caller, in that caseit communicates its own address directly to the first caller. Figure 4.8 showsan example: (1) the node C asks to its parent, node A, which is its successor;(2-4) node A explores the part of the tree on the right respect to node Cand finds the bottom-left node in it, that is node F; (5) node F communi-cates its own address to node C as its successor. The number of hops issub-logarithmic with respect to the number of peers in the network. Thereliability of the function requestMySUC() is related to the structural linksreliability, which is controlled by G-Grid structure algorithm.
Figures 4.13, 4.14 and 4.15 (at the end of this chapter) show an exampleof how each peer in the network builds its logarithmic links. All peers runthe Algorithm 4, but the correct knowledge is not distributed among allpeers after the first iteration. Several iterations are needed because eachpeer at each iteration exchanges information with a small subset of peers,
82
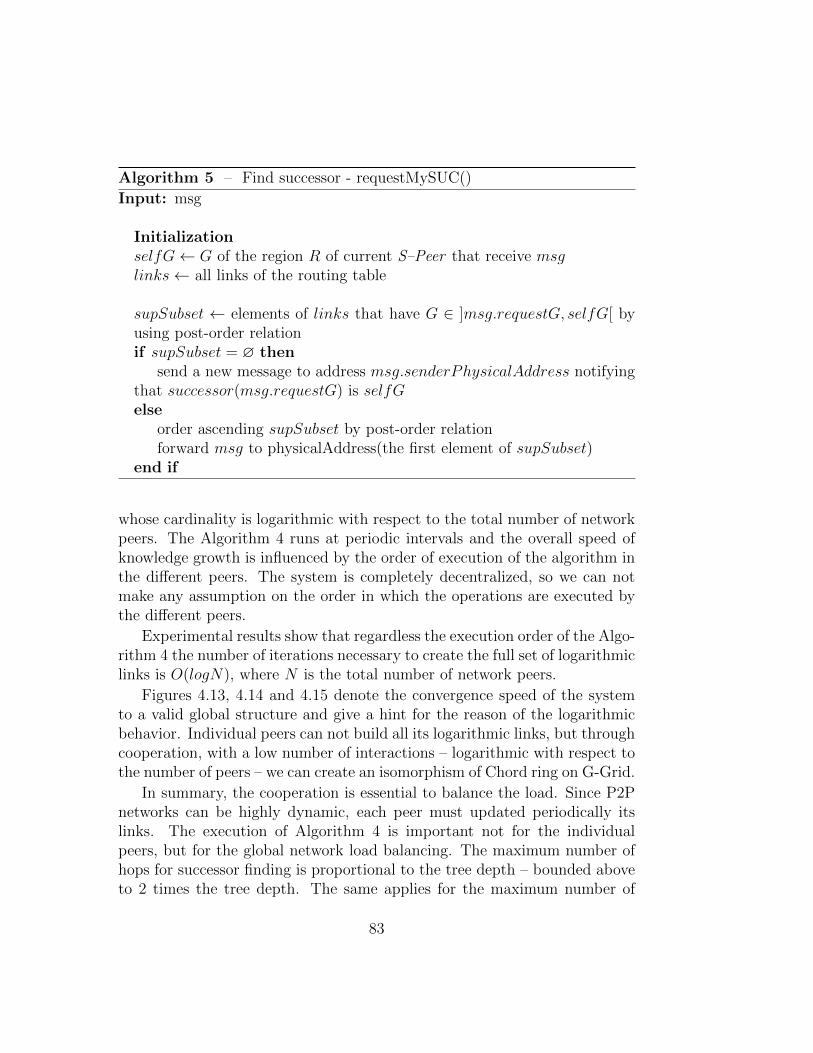
Algorithm 5 – Find successor - requestMySUC()
Input: msg
InitializationselfG← G of the region R of current S–Peer that receive msglinks← all links of the routing table
supSubset ← elements of links that have G ∈ ]msg.requestG, selfG[ byusing post-order relationif supSubset = ∅ then
send a new message to address msg.senderPhysicalAddress notifyingthat successor(msg.requestG) is selfGelse
order ascending supSubset by post-order relationforward msg to physicalAddress(the first element of supSubset)
end if
whose cardinality is logarithmic with respect to the total number of networkpeers. The Algorithm 4 runs at periodic intervals and the overall speed ofknowledge growth is influenced by the order of execution of the algorithm inthe different peers. The system is completely decentralized, so we can notmake any assumption on the order in which the operations are executed bythe different peers.
Experimental results show that regardless the execution order of the Algo-rithm 4 the number of iterations necessary to create the full set of logarithmiclinks is O(logN), where N is the total number of network peers.
Figures 4.13, 4.14 and 4.15 denote the convergence speed of the systemto a valid global structure and give a hint for the reason of the logarithmicbehavior. Individual peers can not build all its logarithmic links, but throughcooperation, with a low number of interactions – logarithmic with respect tothe number of peers – we can create an isomorphism of Chord ring on G-Grid.
In summary, the cooperation is essential to balance the load. Since P2Pnetworks can be highly dynamic, each peer must updated periodically itslinks. The execution of Algorithm 4 is important not for the individualpeers, but for the global network load balancing. The maximum number ofhops for successor finding is proportional to the tree depth – bounded aboveto 2 times the tree depth. The same applies for the maximum number of
83
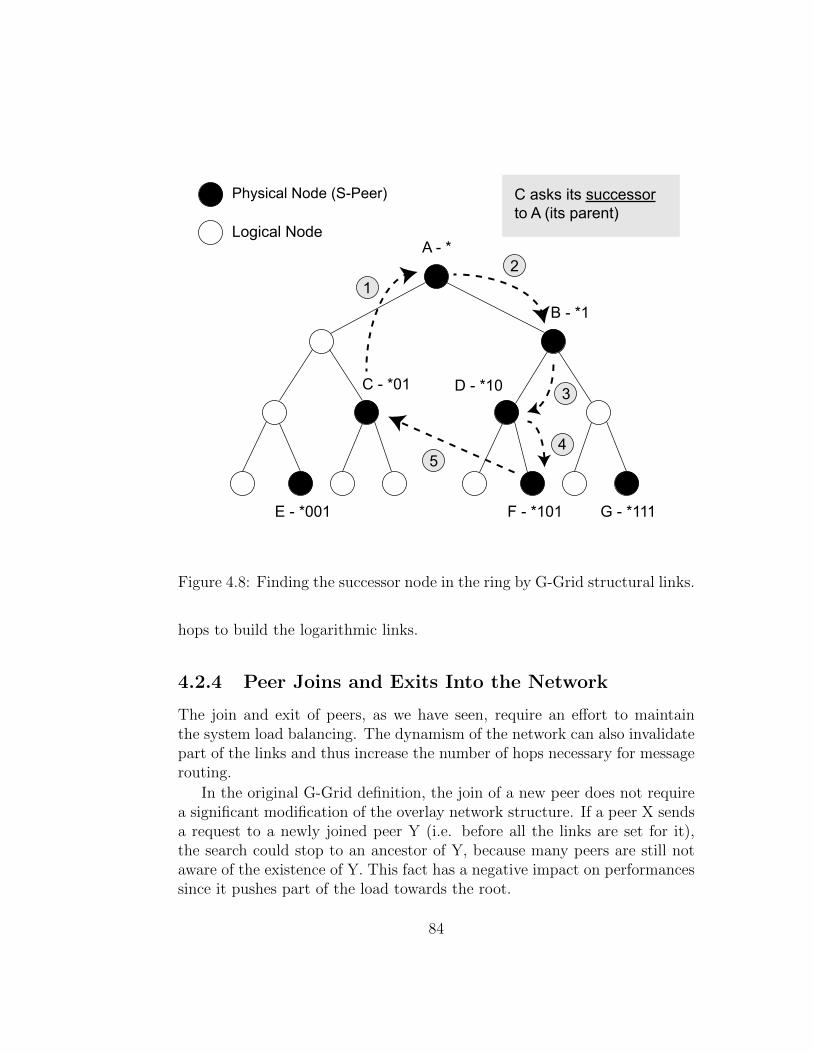
Physical Node (S-Peer)
Logical Node
E - *001
C - *01
A - *
B - *1
D - *10
F - *101 G - *111
C asks its successorto A (its parent)
12
3
45
Figure 4.8: Finding the successor node in the ring by G-Grid structural links.
hops to build the logarithmic links.
4.2.4 Peer Joins and Exits Into the Network
The join and exit of peers, as we have seen, require an effort to maintainthe system load balancing. The dynamism of the network can also invalidatepart of the links and thus increase the number of hops necessary for messagerouting.
In the original G-Grid definition, the join of a new peer does not requirea significant modification of the overlay network structure. If a peer X sendsa request to a newly joined peer Y (i.e. before all the links are set for it),the search could stop to an ancestor of Y, because many peers are still notaware of the existence of Y. This fact has a negative impact on performancessince it pushes part of the load towards the root.
84
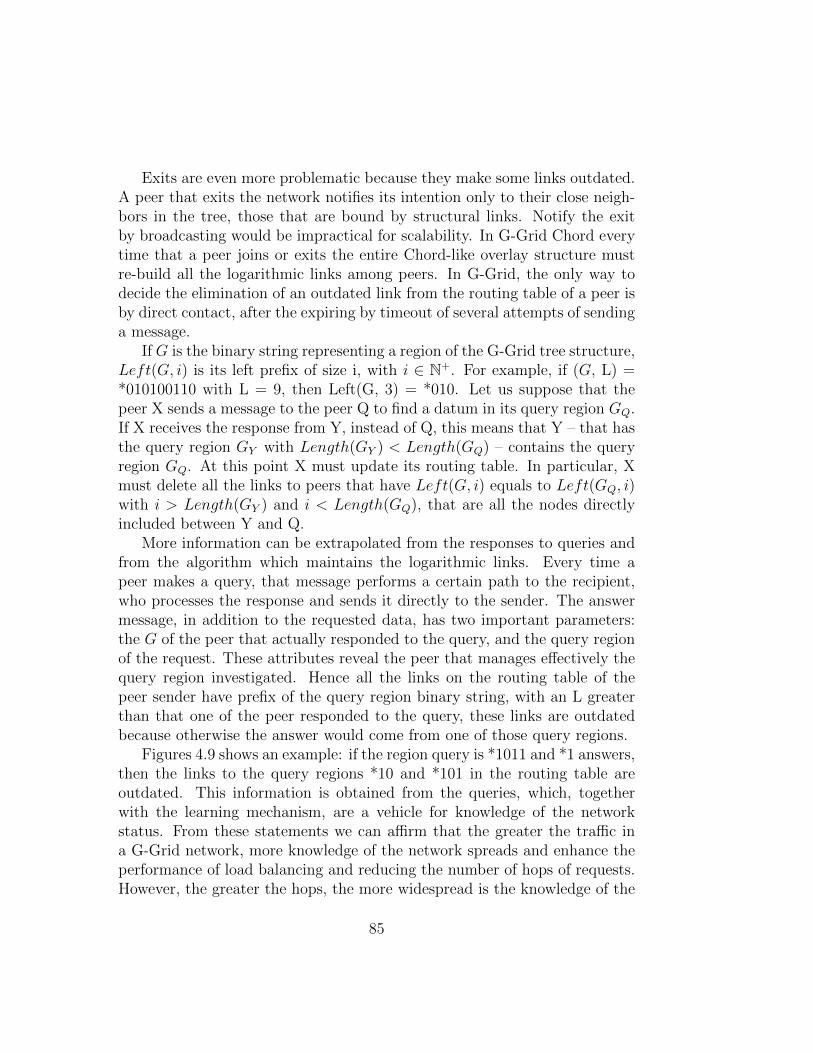
Exits are even more problematic because they make some links outdated.A peer that exits the network notifies its intention only to their close neigh-bors in the tree, those that are bound by structural links. Notify the exitby broadcasting would be impractical for scalability. In G-Grid Chord everytime that a peer joins or exits the entire Chord-like overlay structure mustre-build all the logarithmic links among peers. In G-Grid, the only way todecide the elimination of an outdated link from the routing table of a peer isby direct contact, after the expiring by timeout of several attempts of sendinga message.
If G is the binary string representing a region of the G-Grid tree structure,Left(G, i) is its left prefix of size i, with i ∈ N+. For example, if (G, L) =*010100110 with L = 9, then Left(G, 3) = *010. Let us suppose that thepeer X sends a message to the peer Q to find a datum in its query region GQ.If X receives the response from Y, instead of Q, this means that Y – that hasthe query region GY with Length(GY ) < Length(GQ) – contains the queryregion GQ. At this point X must update its routing table. In particular, Xmust delete all the links to peers that have Left(G, i) equals to Left(GQ, i)with i > Length(GY ) and i < Length(GQ), that are all the nodes directlyincluded between Y and Q.
More information can be extrapolated from the responses to queries andfrom the algorithm which maintains the logarithmic links. Every time apeer makes a query, that message performs a certain path to the recipient,who processes the response and sends it directly to the sender. The answermessage, in addition to the requested data, has two important parameters:the G of the peer that actually responded to the query, and the query regionof the request. These attributes reveal the peer that manages effectively thequery region investigated. Hence all the links on the routing table of thepeer sender have prefix of the query region binary string, with an L greaterthan that one of the peer responded to the query, these links are outdatedbecause otherwise the answer would come from one of those query regions.
Figures 4.9 shows an example: if the region query is *1011 and *1 answers,then the links to the query regions *10 and *101 in the routing table areoutdated. This information is obtained from the queries, which, togetherwith the learning mechanism, are a vehicle for knowledge of the networkstatus. From these statements we can affirm that the greater the traffic ina G-Grid network, more knowledge of the network spreads and enhance theperformance of load balancing and reducing the number of hops of requests.However, the greater the hops, the more widespread is the knowledge of the
85
Figure 4.9: Discovery of outdated links from queries.
network status. By the experiments results we see that these two aspects arein balance.
In addition to query answers, we can increase the detection of outdatedlinks using the management algorithm of logarithmic links. The first logarith-mic link to a peer is the link to his successor on the ring. We have previouslyshown that this link is quite reliable, so all the links in the routing table thatare between the G of the peer itself and that one of its successor are, withhigh probability, outdated and thus will be deleted. For example, if *1111receives as successor *1, then *11 and *111 are considered outdated.
Detecting the outdated links is much more difficult than finding a newpeer, so these mechanisms will be reinforced in further work, in order to makenetwork knowledge more consistent for peers. The system would be morerobust in scenarios with a high dynamism rate, when the inputs and outputsof the peers are frequent. We have obtained, however, good results withthese techniques for scenarios with a sufficiently high dynamism rate. Themore the network knowledge for peers is extensive and correct, the lower therate of outdated links in the system, and consequently improves the messagerouting.
86
4.3 Experiments
In this section we show the performance results of our proposal in four sim-ulated application scenarios. The simulator is used to test the traffic distri-bution on large-scale networks of 10,000 nodes over PeerSim [87], a testbedfor large-scale P2P networks. These are the measures that we analized in theexperiments:
- total number of system messages, which indicate how the system mustwork in addition to keep the overlay with respect to the useful traffic;
- number of hops, which tells us how average load generates a query onthe network, how heavy is an average of a query in terms of traffic.Decreased by the presence of structured overlay;
- relative standard deviation (RSD), to measure the traffic on each node.To compare different situations due to different systems, we display theRSD, which is the ratio between the standard deviation and the averagenumber of messages routed from each node of the network.
The traffic distribution parameter is very important because it shows howthe traffic is evenly distributed on network peers. We observed also otherimportant parameters such as the number of hops, the number of messagesexchanged to maintain the overlay structure - called system messages -, dueto the architecture of the data structures.
We show the behavior of the new overlay structure we described aboveand implemented in the simulator, called G-Grid Chord. As a first elementof comparison, we selected the recent (2011) SkipCluster algorithm [142], asproposed by Xu et al., and a new version that implements in addition theoverlay HiGLoB [132]. We applied the features of load balancing of HiGLoB,described in [132], to balance the number of peers contained in each cluster.
The experimental environment is a Linux virtual machine with 6 CPUsat 2GHz and 6GB of RAM for the simulations. The program is developed inJava, as the simulator PeerSim. We have defined a class that implements theinterface of the node provided by PeerSim, which manages events such as thearrival of messages or internal events defined by the user. In our experiments,for each node, we connected the overlay to be tested and another level oftransport provided by the simulator natively. We have also created controlsthat the system runs periodically, according to a configuration file, allowing
87
the generation of query, the connection / disconnection of nodes, and writinga snapshot of the network in a database. Each parameter, nodes and controls,is read from the configuration file. For any other technical details please visitthe website of the simulator http://peersim.sourceforge.net.
In all scenarios, we start from a single node network and connect im-mediately after 10,000 nodes. The nodes create the desired structure byexchanging messages with other peers in the network. When all nodes joinedthe network we start to run 100,000 random queries. We observe the systemstate and store it into a database every 10,000 queries. While these parame-ters are common in every scenarios, the differences among the scenarios arelisted below.
1. The first scenario includes only query executions. The network struc-ture does not change after the last node join. The number of nodesreaches 10,000 linearly and remains the same for all the rest of thesimulation.
2. In the second scenario, after the initial configuration of the network,one peer joins the network every 100 queries. This behavior increasesthe starting network (10,000 nodes) by 10%. This is intended to test thebehavior of a growing network, intuitively, new nodes could introducelonger search paths and increase the number of system messages;
3. In the third scenario, after the initial configuration of the network,every 100 queries, the simulator randomly adds or removes a peer with50% probability. The number of nodes fluctuates around the startingvalue of 10,000. This is intended to give additional stress to the system,because peer removal changes the structure and can impose longer pathtraversals;
4. In the last scenario, every 100 queries, there is a number of peer joinequal to the square root of the number of queries run up to that mo-ment. This is in some way similar to scenario 2, but with greatergrowth.
In every simulation we assume a uniformly distributed load in the networknodes.
88
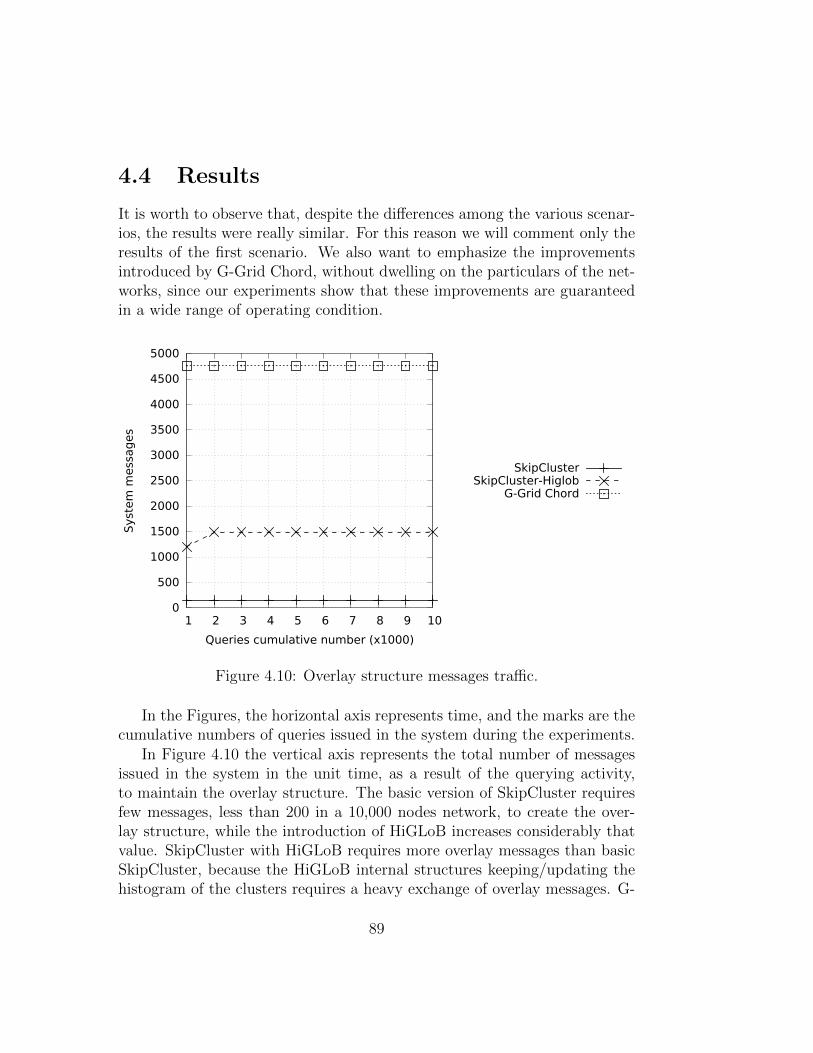
4.4 Results
It is worth to observe that, despite the differences among the various scenar-ios, the results were really similar. For this reason we will comment only theresults of the first scenario. We also want to emphasize the improvementsintroduced by G-Grid Chord, without dwelling on the particulars of the net-works, since our experiments show that these improvements are guaranteedin a wide range of operating condition.
0
500
1000
1500
2000
2500
3000
3500
4000
4500
5000
1 2 3 4 5 6 7 8 9 10
Syst
em
mess
ag
es
Queries cumulative number (x1000)
SkipClusterSkipCluster-Higlob
G-Grid Chord
Figure 4.10: Overlay structure messages traffic.
In the Figures, the horizontal axis represents time, and the marks are thecumulative numbers of queries issued in the system during the experiments.
In Figure 4.10 the vertical axis represents the total number of messagesissued in the system in the unit time, as a result of the querying activity,to maintain the overlay structure. The basic version of SkipCluster requiresfew messages, less than 200 in a 10,000 nodes network, to create the over-lay structure, while the introduction of HiGLoB increases considerably thatvalue. SkipCluster with HiGLoB requires more overlay messages than basicSkipCluster, because the HiGLoB internal structures keeping/updating thehistogram of the clusters requires a heavy exchange of overlay messages. G-
89

Grid Chord requires a bigger number of system messages (about three timesSkipCluster with HiGLoB) because of the large cost of maintaining the ringstructure.
6
7
8
9
10
11
12
13
1 2 3 4 5 6 7 8 9 10
Hop
s
Queries cumulative number (x1000)
SkipClusterSkipCluster-Higlob
G-Grid Chord
Figure 4.11: Average number of hops per peer.
Figure 5.5 shows the average number of hops per peer. Each peer mea-sures the number of necessary connections to obtain the wanted data. Duringthe simulation starting phase, the number of query messages sent by eachpeer is very low, so the measured value becomes interesting only after theinitial phase of adjustment. When more queries are executed, we reach thestandard operating condition. Both versions of SkipCluster have a hops av-erage slightly less than the logarithm of the network size. The importantresult is that G-Grid Chord improves by one third the already good resultof SkipCluster.
Figure 5.6 shows the Relative Standard Deviation (RSD) of the traffic inthe peers. We observe that both SkipCluster overlays have the same slowlyincreasing behavior, around 15 for the base version and 16 for HiGLoB. TheG-Grid Chord value is around 2: this indicates that the traffic with G-GridChord is much more balanced among nodes. In particular, from the sim-ulation, it comes out that the 95% of nodes has a load less than 160 with
90
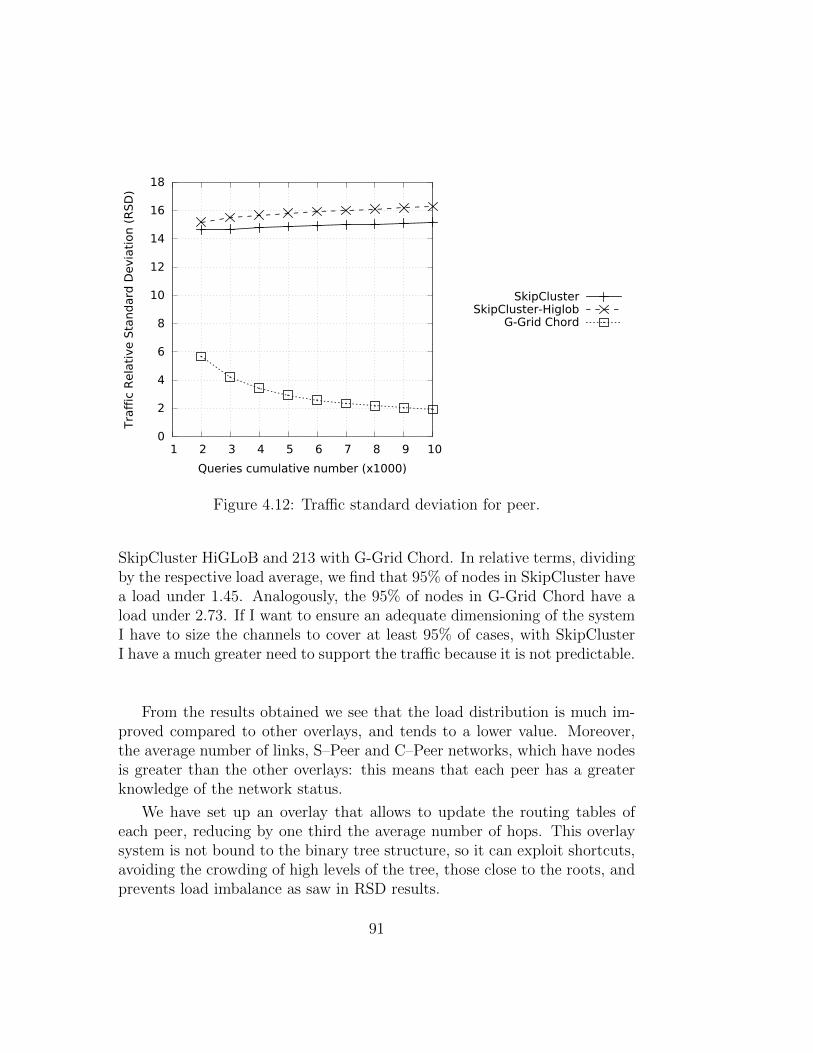
0
2
4
6
8
10
12
14
16
18
1 2 3 4 5 6 7 8 9 10
Tra
ffic
Rela
tive S
tand
ard
Devia
tion (
RS
D)
Queries cumulative number (x1000)
SkipClusterSkipCluster-Higlob
G-Grid Chord
Figure 4.12: Traffic standard deviation for peer.
SkipCluster HiGLoB and 213 with G-Grid Chord. In relative terms, dividingby the respective load average, we find that 95% of nodes in SkipCluster havea load under 1.45. Analogously, the 95% of nodes in G-Grid Chord have aload under 2.73. If I want to ensure an adequate dimensioning of the systemI have to size the channels to cover at least 95% of cases, with SkipClusterI have a much greater need to support the traffic because it is not predictable.
From the results obtained we see that the load distribution is much im-proved compared to other overlays, and tends to a lower value. Moreover,the average number of links, S–Peer and C–Peer networks, which have nodesis greater than the other overlays: this means that each peer has a greaterknowledge of the network status.
We have set up an overlay that allows to update the routing tables ofeach peer, reducing by one third the average number of hops. This overlaysystem is not bound to the binary tree structure, so it can exploit shortcuts,avoiding the crowding of high levels of the tree, those close to the roots, andprevents load imbalance as saw in RSD results.
91
Regardless of the model used, we can see that increasing the number ofpeers, the load distribution improves and this is a good feature in terms ofscalability. However there is still work to do in terms of memory becausenow the peers hold a number of connections that tends to be linear withrespect to the number of peers in the network. For these considerations, wecan say that this work has laid the foundations for better load distributionin P2P networks and make G-Grid a valid framework for the development ofdistributed databases and systems.
The next step is to find a way to improve the structure managementwithout losing the load balancing properties. In the next chapter we proposea further evolution of G-Grid that achieves this goal.
92
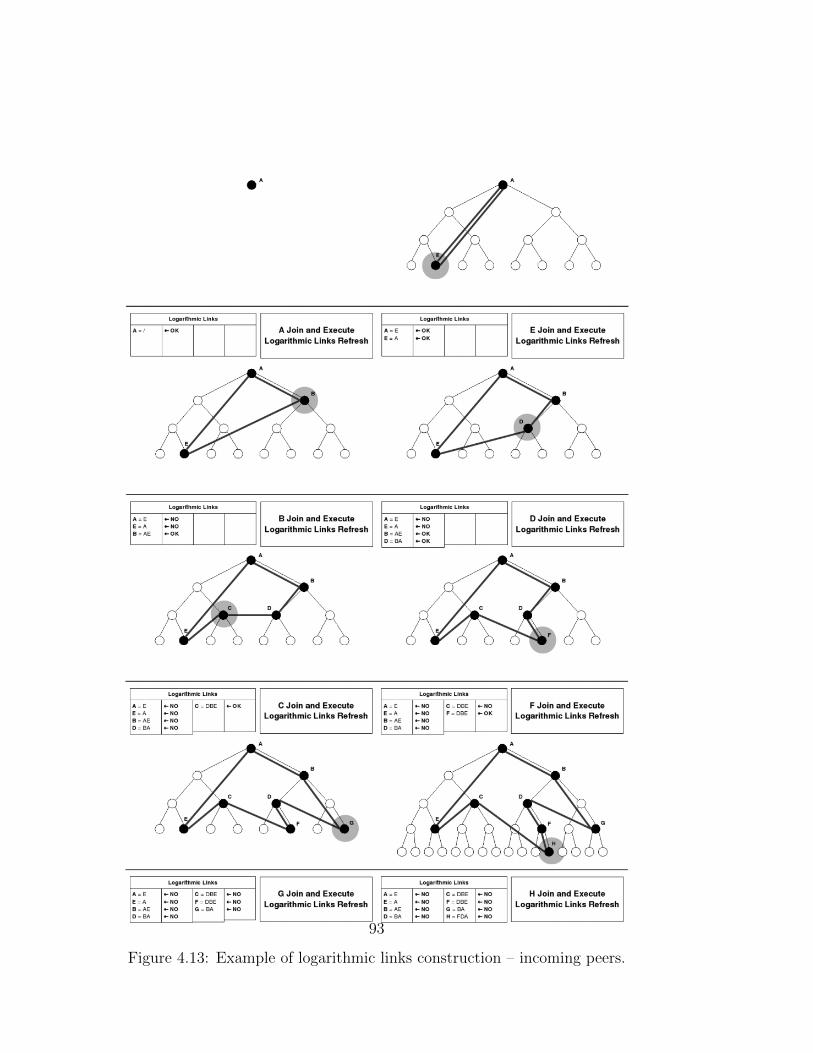
Figure 4.13: Example of logarithmic links construction – incoming peers.
93
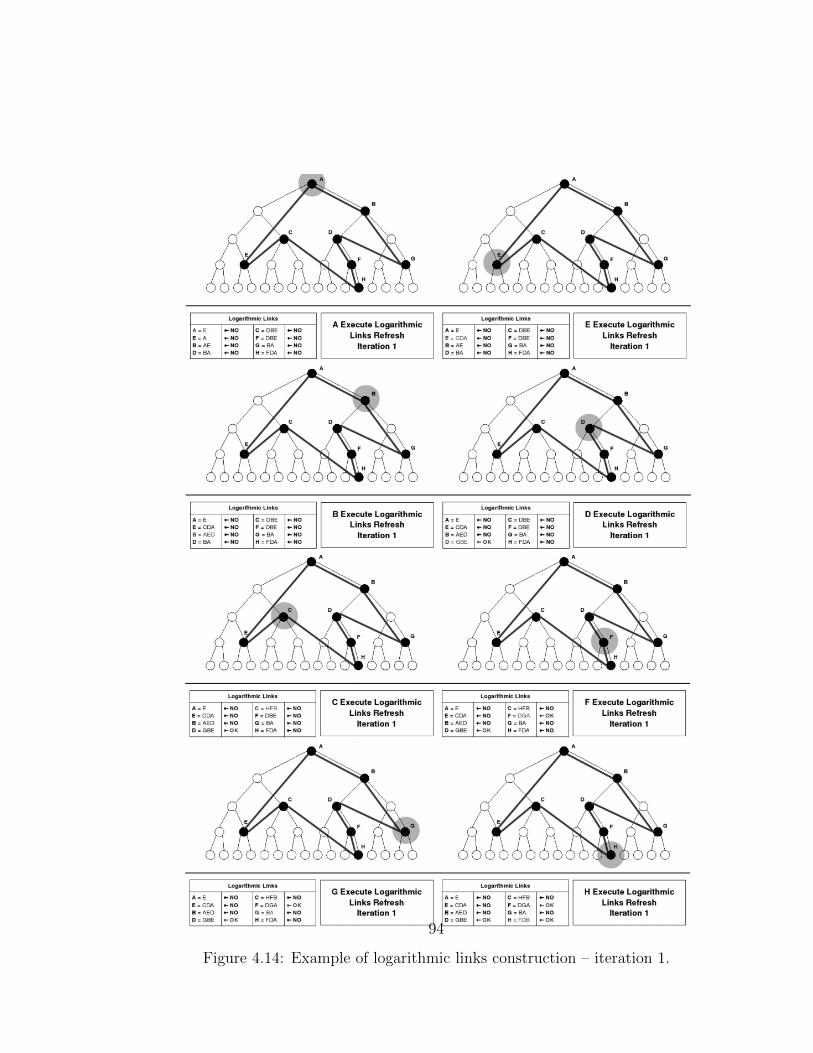
Figure 4.14: Example of logarithmic links construction – iteration 1.
94
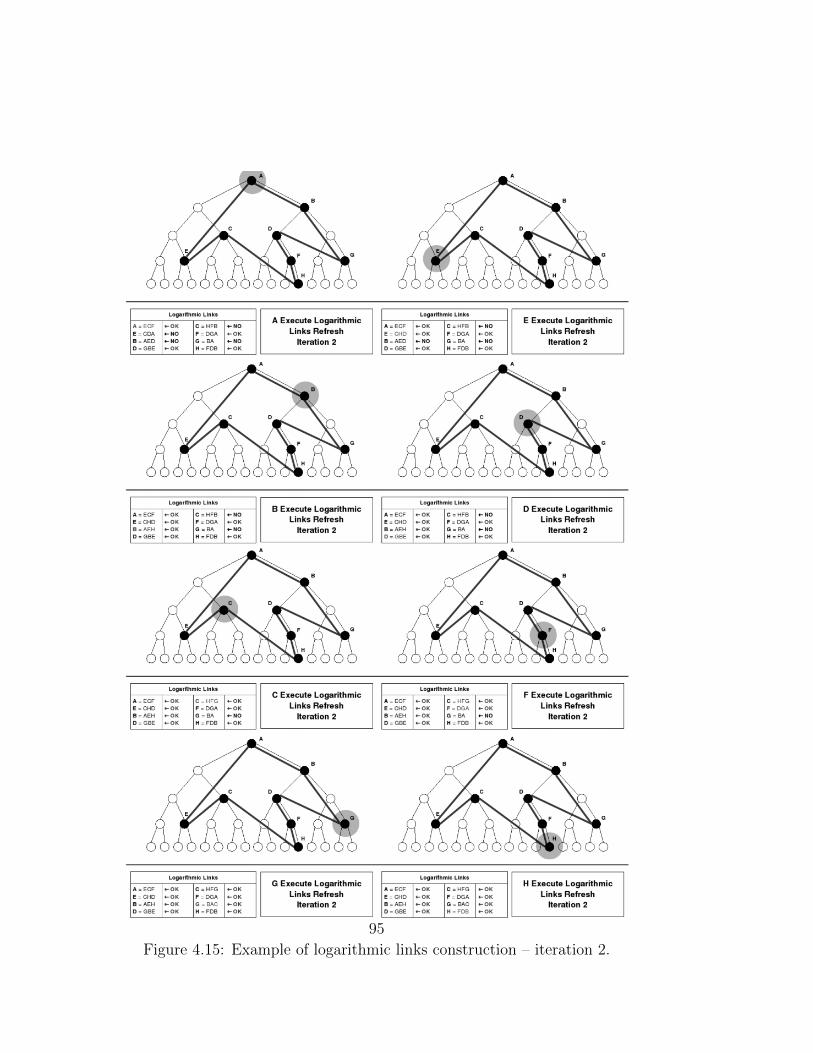
Figure 4.15: Example of logarithmic links construction – iteration 2.
95

96
Chapter 5
A Bit of Randomness to BuildDistributed Data IndexingStructures With Network LoadBalancing
The information request has become a driving force for the global economyand academic research. This has led people to pool data individually ownedbefore, to create huge communication and sharing networks. A network ar-chitecture that fit conveniently to these requirements is the P2P architecture:a set of users that are all at the same hierarchical level, unlike client-serversystems. In P2P systems, each user can provide its own data, and can lever-age the network to search for data shared by other users.
The increasing use of P2P systems has attracted the attention of re-searchers in computer networks that started to observe their evolution andto make improvements. Users growing, and then information increasing, theyobserved the main problem is to get data, if there are present in the network,in a finite and short as possible number of operations. When a user requiresan information that does not own, she sends a request message for that infor-mation along the network. In a modern network, where the information arehighly distributed and the devices are a lot, the requests messages createsa traffic load that limits the bandwidth. For this reason, most of the latestP2P architectures are structured and organized in order to avoid broadcastand limit the number of steps (hops) needed to achieve the information intothe network. A network structured scheme, that we can call overlay, allows
97
to keep the number of hops in the system approached to the logarithm ofthe number of network nodes. Maintaining an organized overlay is necessaryfor the network peers, that are connected users, to get the information in aefficient way. However the structure maintenance needs an additional mes-sage exchange over the network, which produces network traffic. In addition,each peer joins into or exits from the network forces an overlay update thatcan need time and extra traffic load. The overlay messages must be limiteddespite the peers’ dynamism: this feature can be achieved optimizing thenumber of hops for each message [132, 68].
Another evaluation parameter is the traffic balancing over the network.Any peer could have more information than others, or simply highly re-quested information, focusing most of the traffic on the network sectors thatmaintain these data. This real and recurring situations lead to bottlenecksin the network, due to that peers have to satisfy much many requests thenothers: their own resources would be committed for a long time and slowdown the response time and the global performances of the system.
We present an evolution of the work presented in the previous chapter,which leads to the proposal of a new structured overlay, called G-Grid SmallWorld[91], that balances the network traffic load on P2P systems with anumber of overlay messages that does not condition the network load. Thisfeature is important for the system scalability. We introduced a randomnesslevel in the overlay structure that facilitates and reduces the maintaining ofnetwork links among peers. These improvements make G-Grid architecturean excellent solution to build decentralized self-organizing P2P systems. Theapplications can be from the media streaming to the sensors networks, fromthe company intra-organizational networks to the inter-organizational net-works. We show some experiments in which we compare our P2P structurewith the previous ones and with other literature proposals to demonstratethe improving of load balancing, as well as enhancements in main features,such as the number of hops and the cost of structure maintaining.
5.1 Related Works on P2P Load Balancing
The P2P networks expansion focused researchers’ study on their architec-tures, in order to build more efficient systems improving some technical fea-tures. The most advanced overlay structures [115, 7, 65, 100, 90] have differ-ent characteristics from each other, some are completely structured, others
98
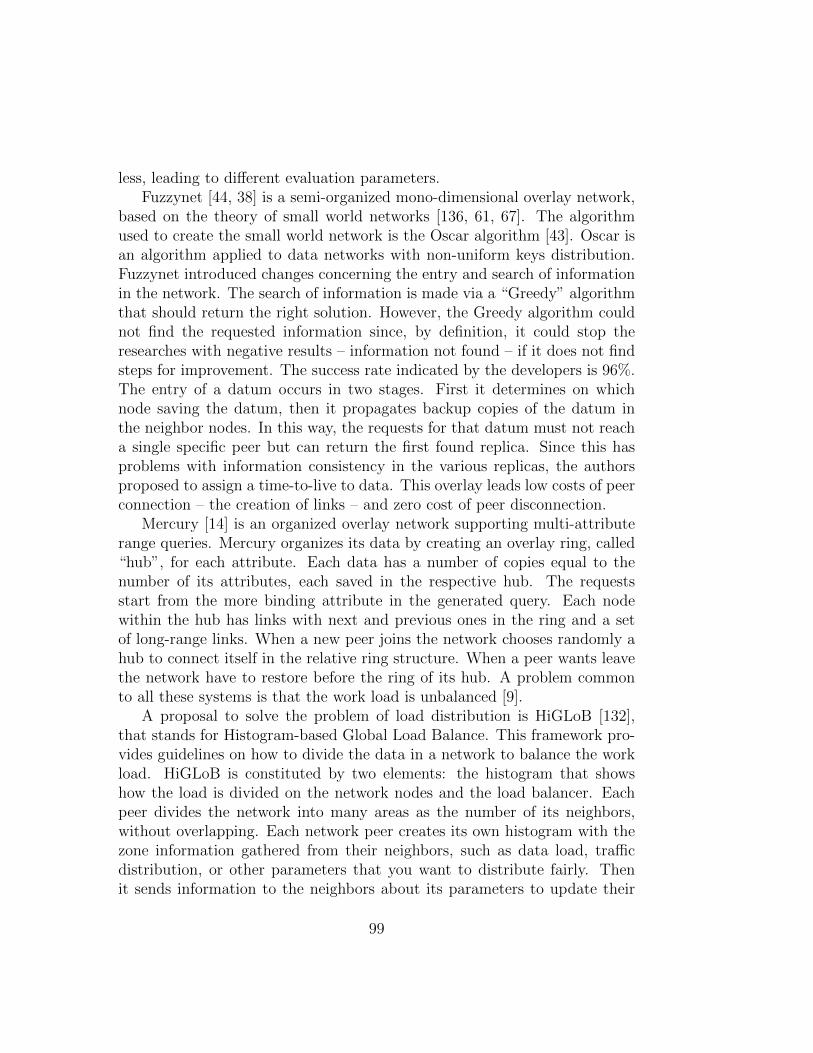
less, leading to different evaluation parameters.Fuzzynet [44, 38] is a semi-organized mono-dimensional overlay network,
based on the theory of small world networks [136, 61, 67]. The algorithmused to create the small world network is the Oscar algorithm [43]. Oscar isan algorithm applied to data networks with non-uniform keys distribution.Fuzzynet introduced changes concerning the entry and search of informationin the network. The search of information is made via a “Greedy” algorithmthat should return the right solution. However, the Greedy algorithm couldnot find the requested information since, by definition, it could stop theresearches with negative results – information not found – if it does not findsteps for improvement. The success rate indicated by the developers is 96%.The entry of a datum occurs in two stages. First it determines on whichnode saving the datum, then it propagates backup copies of the datum inthe neighbor nodes. In this way, the requests for that datum must not reacha single specific peer but can return the first found replica. Since this hasproblems with information consistency in the various replicas, the authorsproposed to assign a time-to-live to data. This overlay leads low costs of peerconnection – the creation of links – and zero cost of peer disconnection.
Mercury [14] is an organized overlay network supporting multi-attributerange queries. Mercury organizes its data by creating an overlay ring, called“hub”, for each attribute. Each data has a number of copies equal to thenumber of its attributes, each saved in the respective hub. The requestsstart from the more binding attribute in the generated query. Each nodewithin the hub has links with next and previous ones in the ring and a setof long-range links. When a new peer joins the network chooses randomly ahub to connect itself in the relative ring structure. When a peer wants leavethe network have to restore before the ring of its hub. A problem commonto all these systems is that the work load is unbalanced [9].
A proposal to solve the problem of load distribution is HiGLoB [132],that stands for Histogram-based Global Load Balance. This framework pro-vides guidelines on how to divide the data in a network to balance the workload. HiGLoB is constituted by two elements: the histogram that showshow the load is divided on the network nodes and the load balancer. Eachpeer divides the network into many areas as the number of its neighbors,without overlapping. Each network peer creates its own histogram with thezone information gathered from their neighbors, such as data load, trafficdistribution, or other parameters that you want to distribute fairly. Thenit sends information to the neighbors about its parameters to update their
99
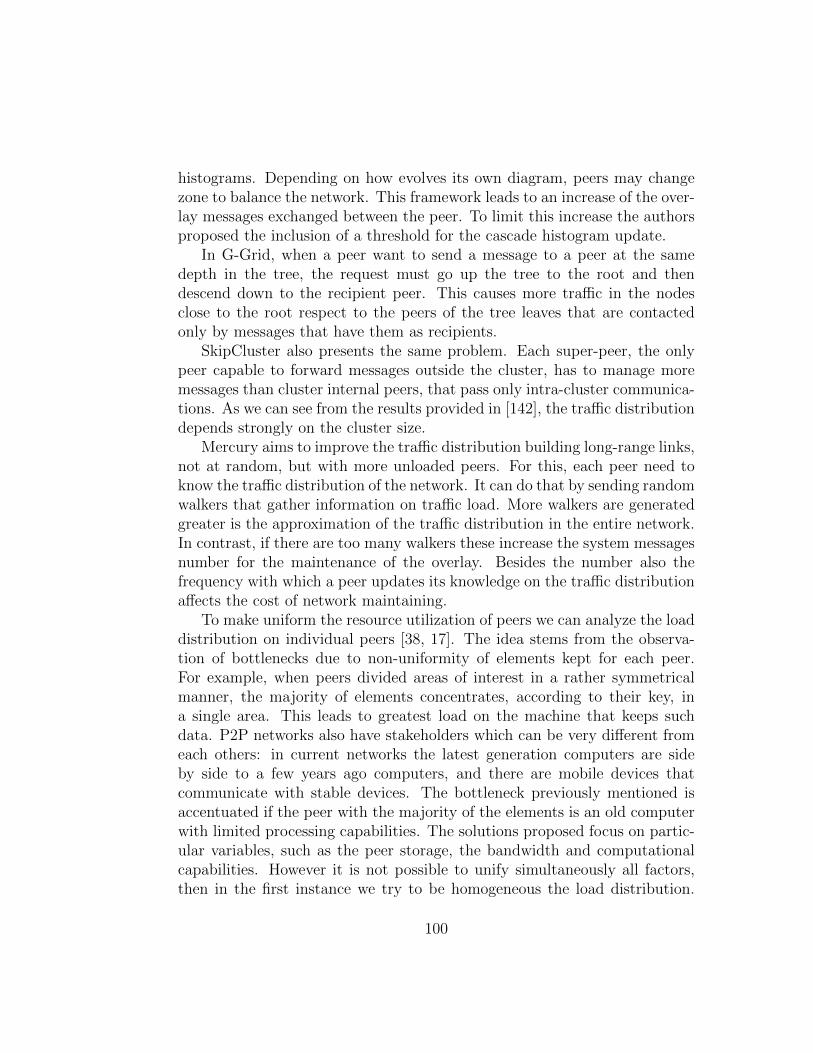
histograms. Depending on how evolves its own diagram, peers may changezone to balance the network. This framework leads to an increase of the over-lay messages exchanged between the peer. To limit this increase the authorsproposed the inclusion of a threshold for the cascade histogram update.
In G-Grid, when a peer want to send a message to a peer at the samedepth in the tree, the request must go up the tree to the root and thendescend down to the recipient peer. This causes more traffic in the nodesclose to the root respect to the peers of the tree leaves that are contactedonly by messages that have them as recipients.
SkipCluster also presents the same problem. Each super-peer, the onlypeer capable to forward messages outside the cluster, has to manage moremessages than cluster internal peers, that pass only intra-cluster communica-tions. As we can see from the results provided in [142], the traffic distributiondepends strongly on the cluster size.
Mercury aims to improve the traffic distribution building long-range links,not at random, but with more unloaded peers. For this, each peer need toknow the traffic distribution of the network. It can do that by sending randomwalkers that gather information on traffic load. More walkers are generatedgreater is the approximation of the traffic distribution in the entire network.In contrast, if there are too many walkers these increase the system messagesnumber for the maintenance of the overlay. Besides the number also thefrequency with which a peer updates its knowledge on the traffic distributionaffects the cost of network maintaining.
To make uniform the resource utilization of peers we can analyze the loaddistribution on individual peers [38, 17]. The idea stems from the observa-tion of bottlenecks due to non-uniformity of elements kept for each peer.For example, when peers divided areas of interest in a rather symmetricalmanner, the majority of elements concentrates, according to their key, ina single area. This leads to greatest load on the machine that keeps suchdata. P2P networks also have stakeholders which can be very different fromeach others: in current networks the latest generation computers are sideby side to a few years ago computers, and there are mobile devices thatcommunicate with stable devices. The bottleneck previously mentioned isaccentuated if the peer with the majority of the elements is an old computerwith limited processing capabilities. The solutions proposed focus on partic-ular variables, such as the peer storage, the bandwidth and computationalcapabilities. However it is not possible to unify simultaneously all factors,then in the first instance we try to be homogeneous the load distribution.
100
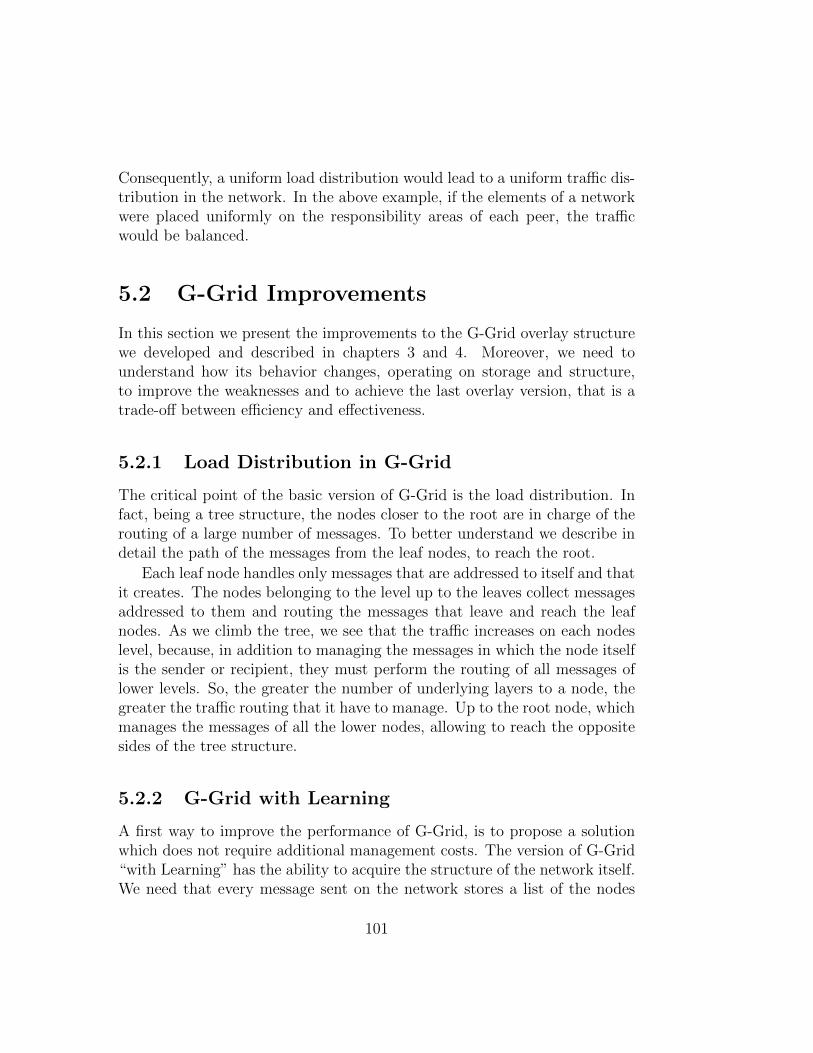
Consequently, a uniform load distribution would lead to a uniform traffic dis-tribution in the network. In the above example, if the elements of a networkwere placed uniformly on the responsibility areas of each peer, the trafficwould be balanced.
5.2 G-Grid Improvements
In this section we present the improvements to the G-Grid overlay structurewe developed and described in chapters 3 and 4. Moreover, we need tounderstand how its behavior changes, operating on storage and structure,to improve the weaknesses and to achieve the last overlay version, that is atrade-off between efficiency and effectiveness.
5.2.1 Load Distribution in G-Grid
The critical point of the basic version of G-Grid is the load distribution. Infact, being a tree structure, the nodes closer to the root are in charge of therouting of a large number of messages. To better understand we describe indetail the path of the messages from the leaf nodes, to reach the root.
Each leaf node handles only messages that are addressed to itself and thatit creates. The nodes belonging to the level up to the leaves collect messagesaddressed to them and routing the messages that leave and reach the leafnodes. As we climb the tree, we see that the traffic increases on each nodeslevel, because, in addition to managing the messages in which the node itselfis the sender or recipient, they must perform the routing of all messages oflower levels. So, the greater the number of underlying layers to a node, thegreater the traffic routing that it have to manage. Up to the root node, whichmanages the messages of all the lower nodes, allowing to reach the oppositesides of the tree structure.
5.2.2 G-Grid with Learning
A first way to improve the performance of G-Grid, is to propose a solutionwhich does not require additional management costs. The version of G-Grid“with Learning” has the ability to acquire the structure of the network itself.We need that every message sent on the network stores a list of the nodes
101
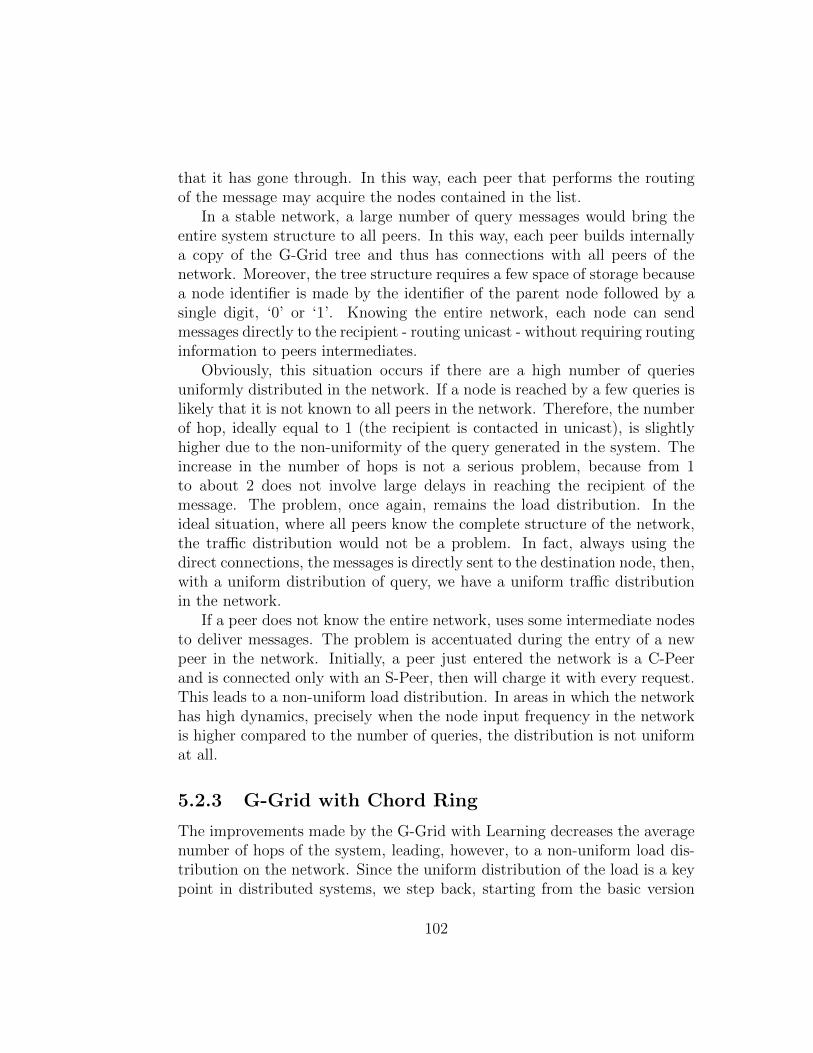
that it has gone through. In this way, each peer that performs the routingof the message may acquire the nodes contained in the list.
In a stable network, a large number of query messages would bring theentire system structure to all peers. In this way, each peer builds internallya copy of the G-Grid tree and thus has connections with all peers of thenetwork. Moreover, the tree structure requires a few space of storage becausea node identifier is made by the identifier of the parent node followed by asingle digit, ‘0’ or ‘1’. Knowing the entire network, each node can sendmessages directly to the recipient - routing unicast - without requiring routinginformation to peers intermediates.
Obviously, this situation occurs if there are a high number of queriesuniformly distributed in the network. If a node is reached by a few queries islikely that it is not known to all peers in the network. Therefore, the numberof hop, ideally equal to 1 (the recipient is contacted in unicast), is slightlyhigher due to the non-uniformity of the query generated in the system. Theincrease in the number of hops is not a serious problem, because from 1to about 2 does not involve large delays in reaching the recipient of themessage. The problem, once again, remains the load distribution. In theideal situation, where all peers know the complete structure of the network,the traffic distribution would not be a problem. In fact, always using thedirect connections, the messages is directly sent to the destination node, then,with a uniform distribution of query, we have a uniform traffic distributionin the network.
If a peer does not know the entire network, uses some intermediate nodesto deliver messages. The problem is accentuated during the entry of a newpeer in the network. Initially, a peer just entered the network is a C-Peerand is connected only with an S-Peer, then will charge it with every request.This leads to a non-uniform load distribution. In areas in which the networkhas high dynamics, precisely when the node input frequency in the networkis higher compared to the number of queries, the distribution is not uniformat all.
5.2.3 G-Grid with Chord Ring
The improvements made by the G-Grid with Learning decreases the averagenumber of hops of the system, leading, however, to a non-uniform load dis-tribution on the network. Since the uniform distribution of the load is a keypoint in distributed systems, we step back, starting from the basic version
102
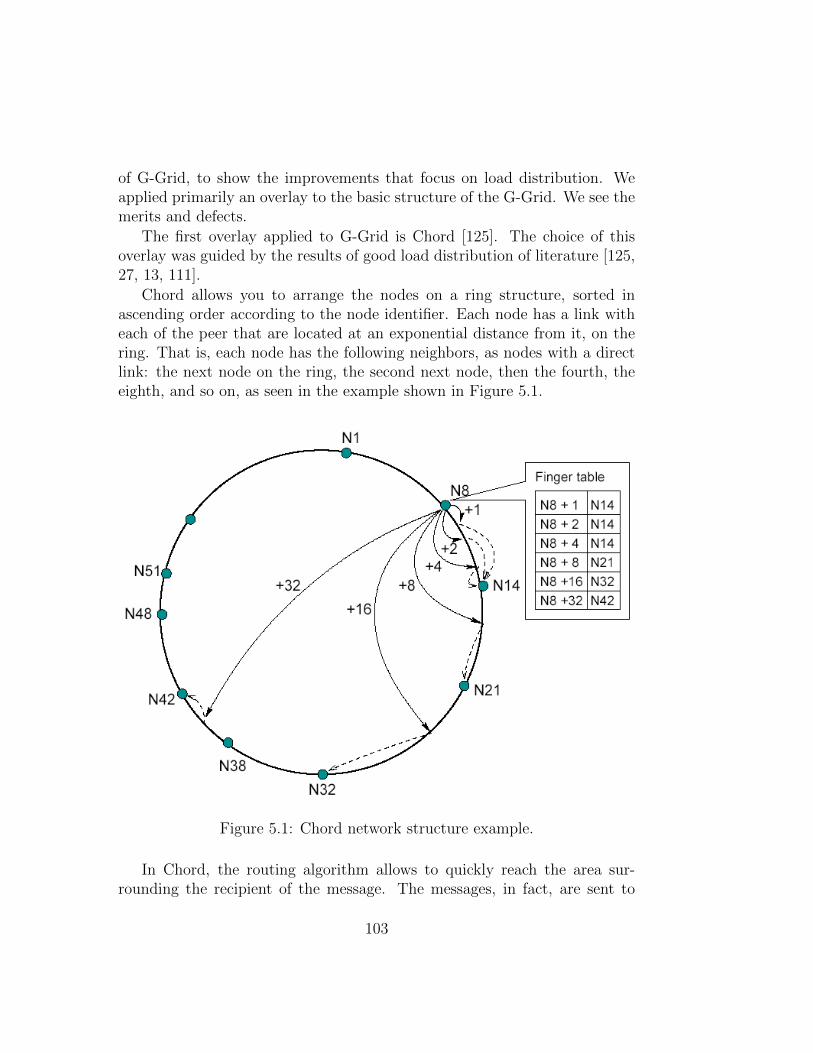
of G-Grid, to show the improvements that focus on load distribution. Weapplied primarily an overlay to the basic structure of the G-Grid. We see themerits and defects.
The first overlay applied to G-Grid is Chord [125]. The choice of thisoverlay was guided by the results of good load distribution of literature [125,27, 13, 111].
Chord allows you to arrange the nodes on a ring structure, sorted inascending order according to the node identifier. Each node has a link witheach of the peer that are located at an exponential distance from it, on thering. That is, each node has the following neighbors, as nodes with a directlink: the next node on the ring, the second next node, then the fourth, theeighth, and so on, as seen in the example shown in Figure 5.1.
Figure 5.1: Chord network structure example.
In Chord, the routing algorithm allows to quickly reach the area sur-rounding the recipient of the message. The messages, in fact, are sent to
103
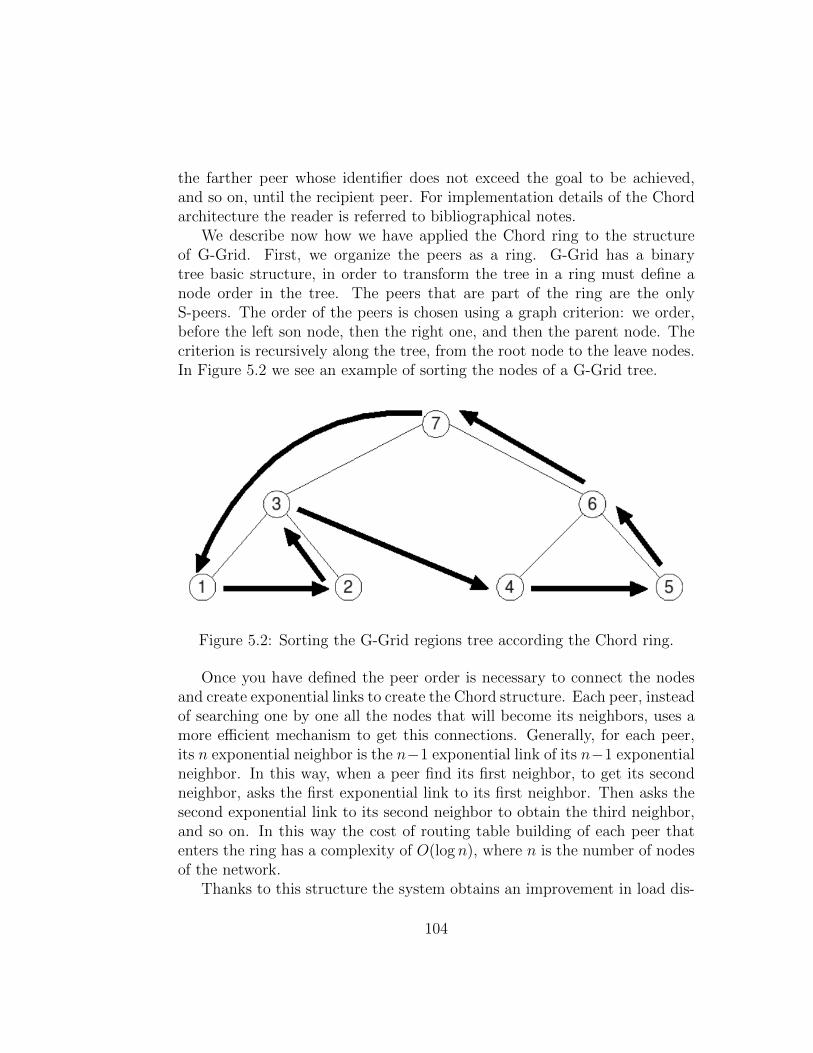
the farther peer whose identifier does not exceed the goal to be achieved,and so on, until the recipient peer. For implementation details of the Chordarchitecture the reader is referred to bibliographical notes.
We describe now how we have applied the Chord ring to the structureof G-Grid. First, we organize the peers as a ring. G-Grid has a binarytree basic structure, in order to transform the tree in a ring must define anode order in the tree. The peers that are part of the ring are the onlyS-peers. The order of the peers is chosen using a graph criterion: we order,before the left son node, then the right one, and then the parent node. Thecriterion is recursively along the tree, from the root node to the leave nodes.In Figure 5.2 we see an example of sorting the nodes of a G-Grid tree.
Figure 5.2: Sorting the G-Grid regions tree according the Chord ring.
Once you have defined the peer order is necessary to connect the nodesand create exponential links to create the Chord structure. Each peer, insteadof searching one by one all the nodes that will become its neighbors, uses amore efficient mechanism to get this connections. Generally, for each peer,its n exponential neighbor is the n−1 exponential link of its n−1 exponentialneighbor. In this way, when a peer find its first neighbor, to get its secondneighbor, asks the first exponential link to its first neighbor. Then asks thesecond exponential link to its second neighbor to obtain the third neighbor,and so on. In this way the cost of routing table building of each peer thatenters the ring has a complexity of O(log n), where n is the number of nodesof the network.
Thanks to this structure the system obtains an improvement in load dis-
104
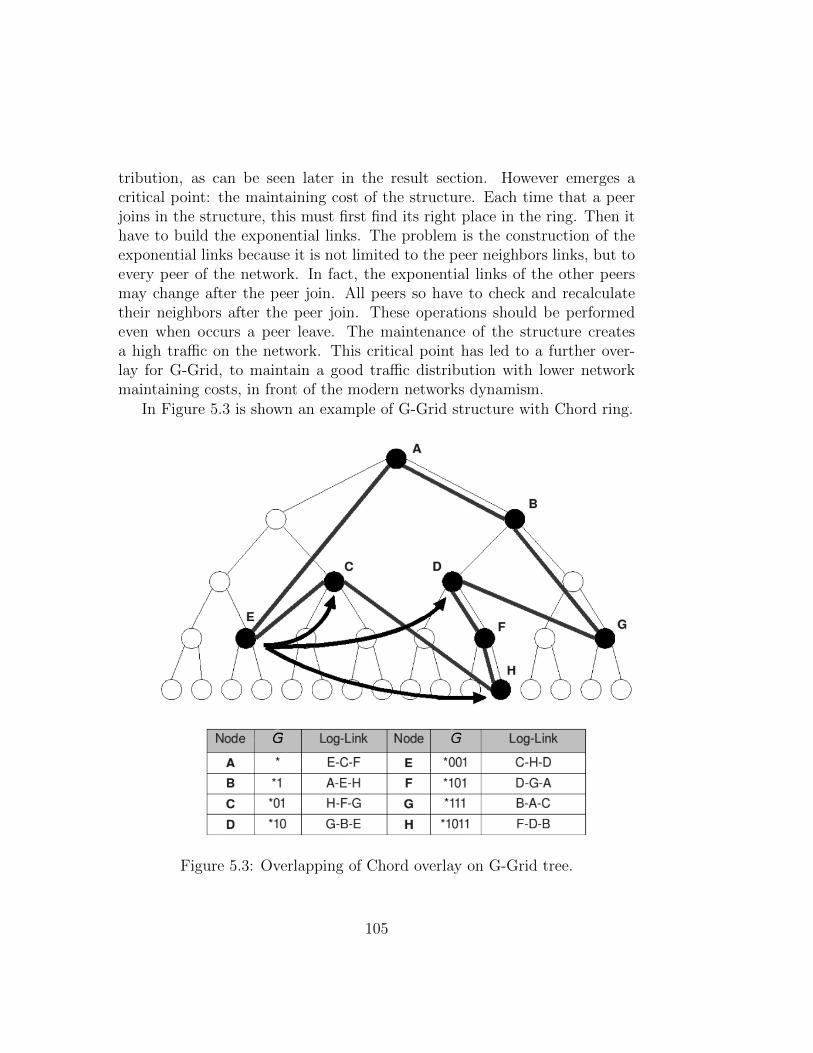
tribution, as can be seen later in the result section. However emerges acritical point: the maintaining cost of the structure. Each time that a peerjoins in the structure, this must first find its right place in the ring. Then ithave to build the exponential links. The problem is the construction of theexponential links because it is not limited to the peer neighbors links, but toevery peer of the network. In fact, the exponential links of the other peersmay change after the peer join. All peers so have to check and recalculatetheir neighbors after the peer join. These operations should be performedeven when occurs a peer leave. The maintenance of the structure createsa high traffic on the network. This critical point has led to a further over-lay for G-Grid, to maintain a good traffic distribution with lower networkmaintaining costs, in front of the modern networks dynamism.
In Figure 5.3 is shown an example of G-Grid structure with Chord ring.
Figure 5.3: Overlapping of Chord overlay on G-Grid tree.
105
5.2.4 G-Grid as Small World
In 1967 Milgram [83] performed some experiments concerning the small worldnetworks and their characteristics with respect to the low number of hopsneeded to connect two elements in a network with a high number of elements.The theory was reconsidered by Watts and Strogatz [136] in the Nineties,they emphasized the fact that the small world networks are very commonin nature. The characteristics observed in these studies are mainly the lownumber of hops and a fair traffic distribution. The model developed forsmall world networks is perfectly suited to P2P networks, and the featurespresented is chosen to be developed as an overlay for the G-Grid architecture.
The key feature of small world networks states that every node in the net-work must be connected to some neighbor nodes and some other randomlychosen nodes across the network. We decided to determine the neighbornodes as the predecessor and successor nodes of the ring created as for theG-Grid with Chord. The ring structure provides, in fact, the completenessin the network, because there is always at least one link to send a messagetoward the destination. Once established the neighbors, we add some long-range links to other nodes to create a small world overlay network. We useda number of long-range links equal to the logarithmic value of the numberof peer in the network. To get these links each peer performs search queriesrandomly in the network. When a search query message reaches the desti-nation node, this connects the sender node with itself and vice-versa. Animportant feature of small world networks is that the long-range links areequally distributed in the network. If the network is stable, this feature isrespected since the peers create random queries with uniform distribution.
When peer joins in with the small world network, it has to be placedinside a ring of S-Peers, ordered as to the structure of G-Grid with Chord.Once inserted in the ring, the peer performs random search queries to getits long-range links. In the case of high dynamics of the network, the peerlong-range links may not be evenly distributed in the network. In fact, whena peer enters the network, it is unable to be contacted from others peerswith a long-range link of peers already into the system. To overcome thisproblem, the new peer has to create long-range links through query messagesgenerated at the join phase. In this way, the peer creates links which helpsto balance and distribute the load in the network.
The advantage of this network topology, compared to the overlay which isbased on Chord, is the fact that the peer joins do not invalidate the connec-
106
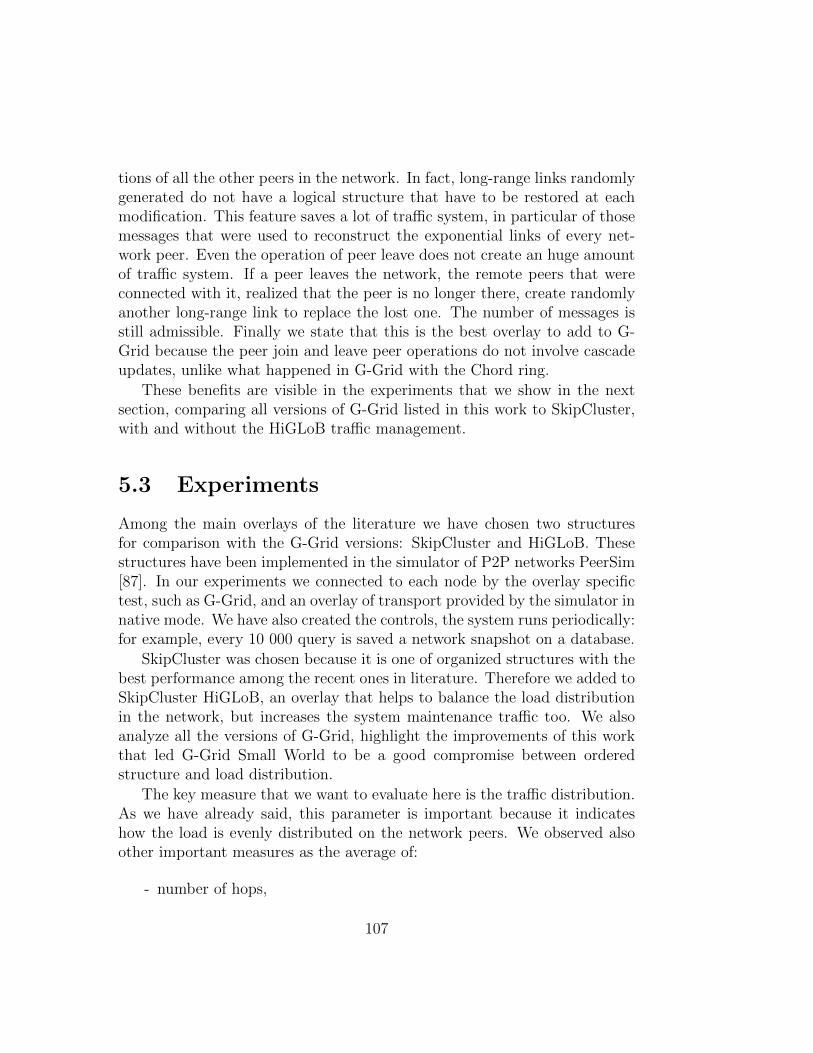
tions of all the other peers in the network. In fact, long-range links randomlygenerated do not have a logical structure that have to be restored at eachmodification. This feature saves a lot of traffic system, in particular of thosemessages that were used to reconstruct the exponential links of every net-work peer. Even the operation of peer leave does not create an huge amountof traffic system. If a peer leaves the network, the remote peers that wereconnected with it, realized that the peer is no longer there, create randomlyanother long-range link to replace the lost one. The number of messages isstill admissible. Finally we state that this is the best overlay to add to G-Grid because the peer join and leave peer operations do not involve cascadeupdates, unlike what happened in G-Grid with the Chord ring.
These benefits are visible in the experiments that we show in the nextsection, comparing all versions of G-Grid listed in this work to SkipCluster,with and without the HiGLoB traffic management.
5.3 Experiments
Among the main overlays of the literature we have chosen two structuresfor comparison with the G-Grid versions: SkipCluster and HiGLoB. Thesestructures have been implemented in the simulator of P2P networks PeerSim[87]. In our experiments we connected to each node by the overlay specifictest, such as G-Grid, and an overlay of transport provided by the simulator innative mode. We have also created the controls, the system runs periodically:for example, every 10 000 query is saved a network snapshot on a database.
SkipCluster was chosen because it is one of organized structures with thebest performance among the recent ones in literature. Therefore we added toSkipCluster HiGLoB, an overlay that helps to balance the load distributionin the network, but increases the system maintenance traffic too. We alsoanalyze all the versions of G-Grid, highlight the improvements of this workthat led G-Grid Small World to be a good compromise between orderedstructure and load distribution.
The key measure that we want to evaluate here is the traffic distribution.As we have already said, this parameter is important because it indicateshow the load is evenly distributed on the network peers. We observed alsoother important measures as the average of:
- number of hops,
107
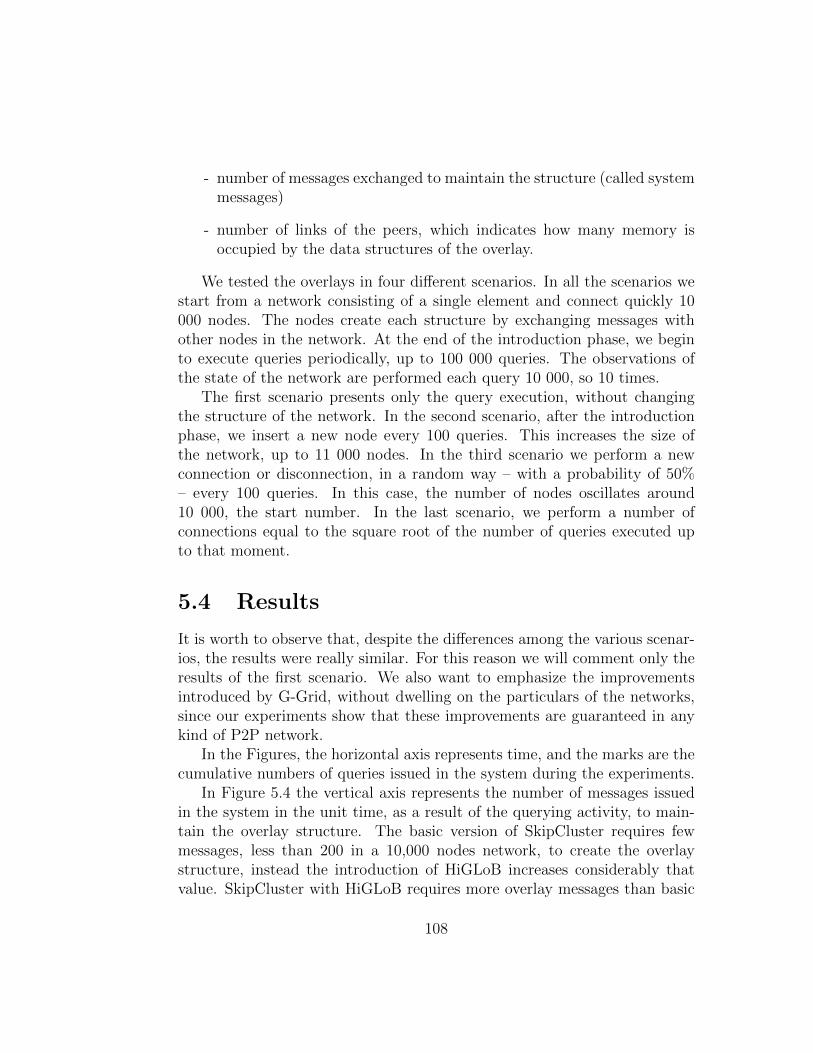
- number of messages exchanged to maintain the structure (called systemmessages)
- number of links of the peers, which indicates how many memory isoccupied by the data structures of the overlay.
We tested the overlays in four different scenarios. In all the scenarios westart from a network consisting of a single element and connect quickly 10000 nodes. The nodes create each structure by exchanging messages withother nodes in the network. At the end of the introduction phase, we beginto execute queries periodically, up to 100 000 queries. The observations ofthe state of the network are performed each query 10 000, so 10 times.
The first scenario presents only the query execution, without changingthe structure of the network. In the second scenario, after the introductionphase, we insert a new node every 100 queries. This increases the size ofthe network, up to 11 000 nodes. In the third scenario we perform a newconnection or disconnection, in a random way – with a probability of 50%– every 100 queries. In this case, the number of nodes oscillates around10 000, the start number. In the last scenario, we perform a number ofconnections equal to the square root of the number of queries executed upto that moment.
5.4 Results
It is worth to observe that, despite the differences among the various scenar-ios, the results were really similar. For this reason we will comment only theresults of the first scenario. We also want to emphasize the improvementsintroduced by G-Grid, without dwelling on the particulars of the networks,since our experiments show that these improvements are guaranteed in anykind of P2P network.
In the Figures, the horizontal axis represents time, and the marks are thecumulative numbers of queries issued in the system during the experiments.
In Figure 5.4 the vertical axis represents the number of messages issuedin the system in the unit time, as a result of the querying activity, to main-tain the overlay structure. The basic version of SkipCluster requires fewmessages, less than 200 in a 10,000 nodes network, to create the overlaystructure, instead the introduction of HiGLoB increases considerably thatvalue. SkipCluster with HiGLoB requires more overlay messages than basic
108
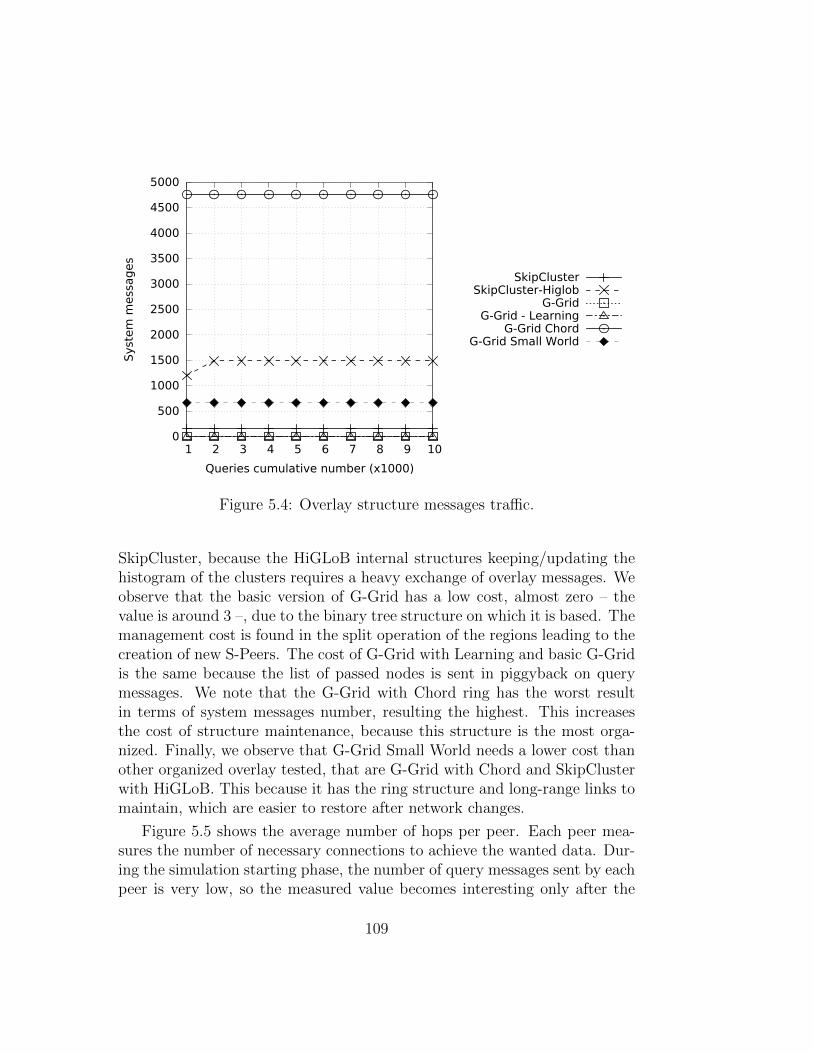
0
500
1000
1500
2000
2500
3000
3500
4000
4500
5000
1 2 3 4 5 6 7 8 9 10
Syst
em
mess
ag
es
Queries cumulative number (x1000)
SkipClusterSkipCluster-Higlob
G-GridG-Grid - Learning
G-Grid ChordG-Grid Small World
Figure 5.4: Overlay structure messages traffic.
SkipCluster, because the HiGLoB internal structures keeping/updating thehistogram of the clusters requires a heavy exchange of overlay messages. Weobserve that the basic version of G-Grid has a low cost, almost zero – thevalue is around 3 –, due to the binary tree structure on which it is based. Themanagement cost is found in the split operation of the regions leading to thecreation of new S-Peers. The cost of G-Grid with Learning and basic G-Gridis the same because the list of passed nodes is sent in piggyback on querymessages. We note that the G-Grid with Chord ring has the worst resultin terms of system messages number, resulting the highest. This increasesthe cost of structure maintenance, because this structure is the most orga-nized. Finally, we observe that G-Grid Small World needs a lower cost thanother organized overlay tested, that are G-Grid with Chord and SkipClusterwith HiGLoB. This because it has the ring structure and long-range links tomaintain, which are easier to restore after network changes.
Figure 5.5 shows the average number of hops per peer. Each peer mea-sures the number of necessary connections to achieve the wanted data. Dur-ing the simulation starting phase, the number of query messages sent by eachpeer is very low, so the measured value becomes interesting only after the
109
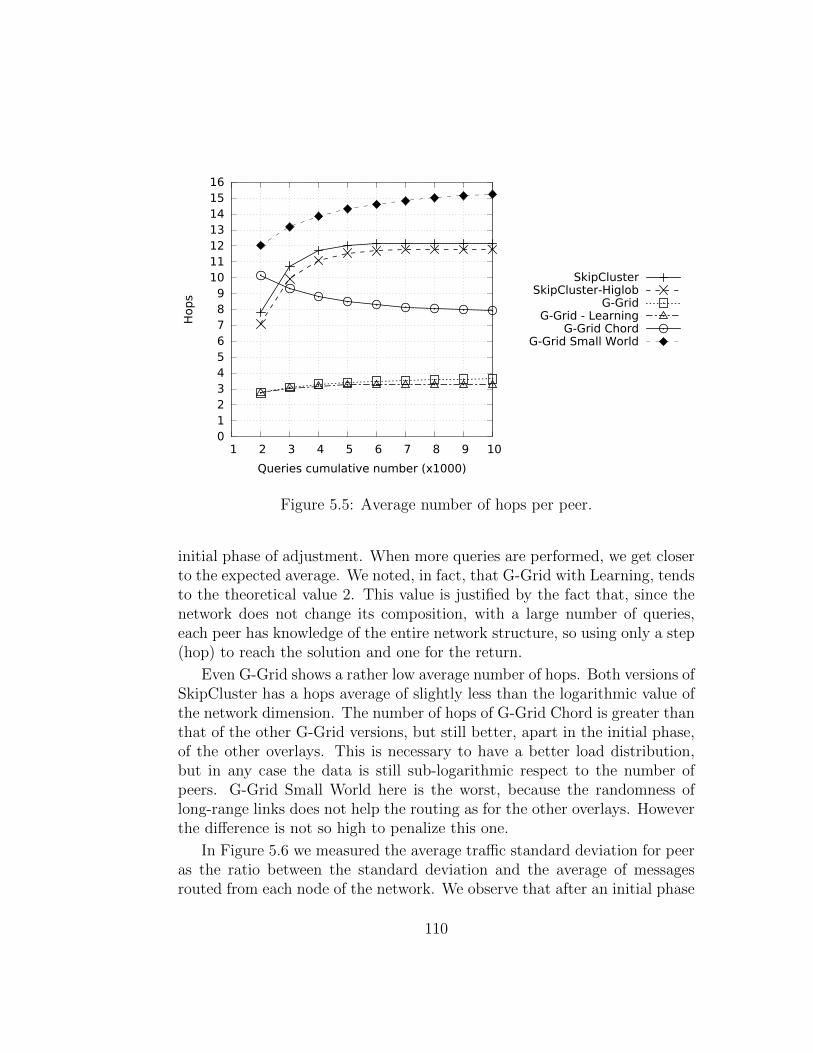
0 1 2 3 4 5 6 7 8 9
10 11 12 13 14 15 16
1 2 3 4 5 6 7 8 9 10
Hop
s
Queries cumulative number (x1000)
SkipClusterSkipCluster-Higlob
G-GridG-Grid - Learning
G-Grid ChordG-Grid Small World
Figure 5.5: Average number of hops per peer.
initial phase of adjustment. When more queries are performed, we get closerto the expected average. We noted, in fact, that G-Grid with Learning, tendsto the theoretical value 2. This value is justified by the fact that, since thenetwork does not change its composition, with a large number of queries,each peer has knowledge of the entire network structure, so using only a step(hop) to reach the solution and one for the return.
Even G-Grid shows a rather low average number of hops. Both versions ofSkipCluster has a hops average of slightly less than the logarithmic value ofthe network dimension. The number of hops of G-Grid Chord is greater thanthat of the other G-Grid versions, but still better, apart in the initial phase,of the other overlays. This is necessary to have a better load distribution,but in any case the data is still sub-logarithmic respect to the number ofpeers. G-Grid Small World here is the worst, because the randomness oflong-range links does not help the routing as for the other overlays. Howeverthe difference is not so high to penalize this one.
In Figure 5.6 we measured the average traffic standard deviation for peeras the ratio between the standard deviation and the average of messagesrouted from each node of the network. We observe that after an initial phase
110
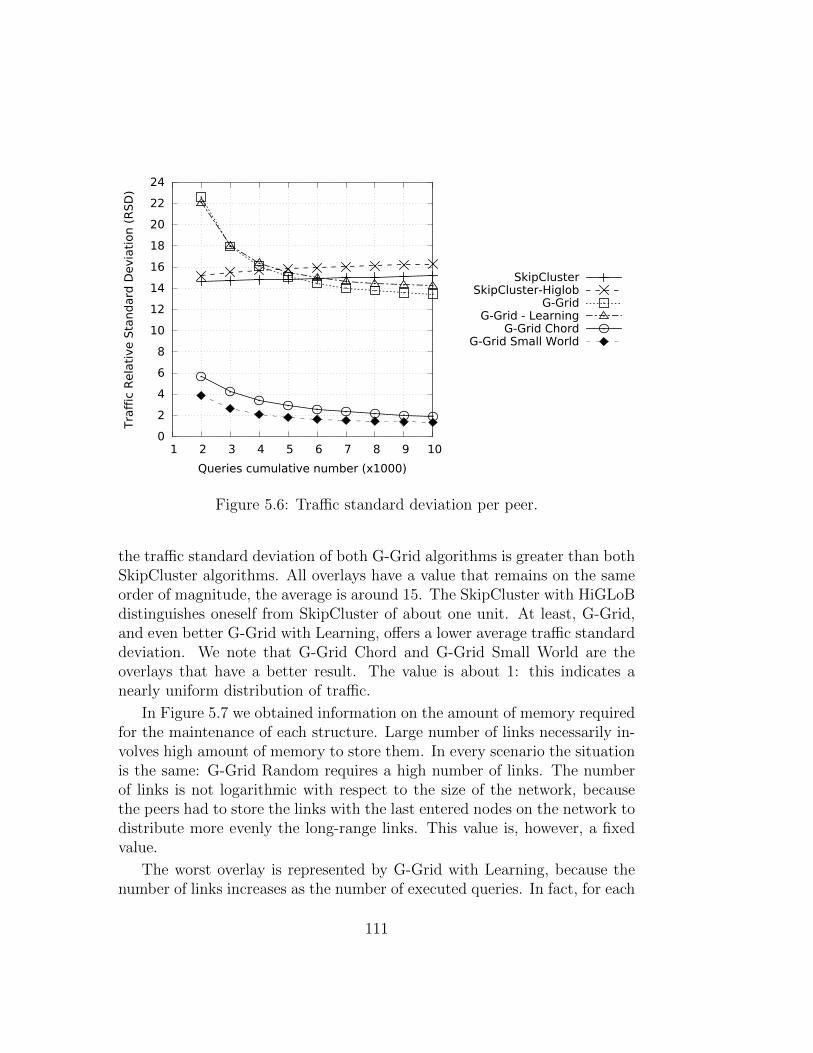
0
2
4
6
8
10
12
14
16
18
20
22
24
1 2 3 4 5 6 7 8 9 10
Tra
ffic
Rela
tive S
tand
ard
Devia
tion (
RS
D)
Queries cumulative number (x1000)
SkipClusterSkipCluster-Higlob
G-GridG-Grid - Learning
G-Grid ChordG-Grid Small World
Figure 5.6: Traffic standard deviation per peer.
the traffic standard deviation of both G-Grid algorithms is greater than bothSkipCluster algorithms. All overlays have a value that remains on the sameorder of magnitude, the average is around 15. The SkipCluster with HiGLoBdistinguishes oneself from SkipCluster of about one unit. At least, G-Grid,and even better G-Grid with Learning, offers a lower average traffic standarddeviation. We note that G-Grid Chord and G-Grid Small World are theoverlays that have a better result. The value is about 1: this indicates anearly uniform distribution of traffic.
In Figure 5.7 we obtained information on the amount of memory requiredfor the maintenance of each structure. Large number of links necessarily in-volves high amount of memory to store them. In every scenario the situationis the same: G-Grid Random requires a high number of links. The numberof links is not logarithmic with respect to the size of the network, becausethe peers had to store the links with the last entered nodes on the network todistribute more evenly the long-range links. This value is, however, a fixedvalue.
The worst overlay is represented by G-Grid with Learning, because thenumber of links increases as the number of executed queries. In fact, for each
111
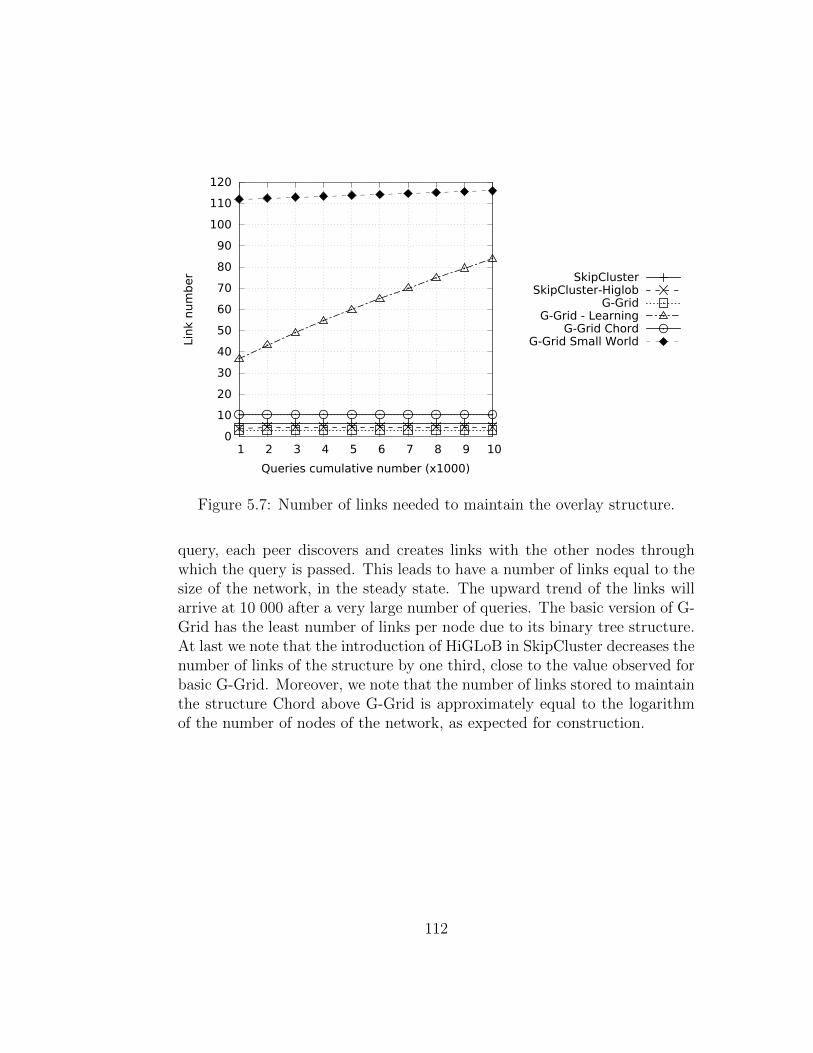
0
10
20
30
40
50
60
70
80
90
100
110
120
1 2 3 4 5 6 7 8 9 10
Link
num
ber
Queries cumulative number (x1000)
SkipClusterSkipCluster-Higlob
G-GridG-Grid - Learning
G-Grid ChordG-Grid Small World
Figure 5.7: Number of links needed to maintain the overlay structure.
query, each peer discovers and creates links with the other nodes throughwhich the query is passed. This leads to have a number of links equal to thesize of the network, in the steady state. The upward trend of the links willarrive at 10 000 after a very large number of queries. The basic version of G-Grid has the least number of links per node due to its binary tree structure.At last we note that the introduction of HiGLoB in SkipCluster decreases thenumber of links of the structure by one third, close to the value observed forbasic G-Grid. Moreover, we note that the number of links stored to maintainthe structure Chord above G-Grid is approximately equal to the logarithmof the number of nodes of the network, as expected for construction.
112
Chapter 6
Conclusions
Modern devices and applications manage large data distributed over mul-tiple sites that also can move independently. The P2P tecnologies try toprovide efficient distribution, sharing and management of resources over au-tonomous and heterogeneous peers. Most P2P systems, such as Gnutella,Chord, Tapestry, support only queries over a single data attribute. We pre-sented an evolution of G-Grid, a multidimensional data structure able toefficiently execute range queries in totally decentralized P2P environments.This structure is not imposed a priori over the network. Self-organization isled by local interactions among peers, and the total decentralization of con-trol makes it perfect for grid computing and server clusters. G-Grid is alsoadaptive regarding dynamic changes in network topology. This robustnessmakes it suitable for mobile networks. We presented several experiments tocompare G-Grid with other recent and efficient P2P structures presented inliterature.
Analyzing the results of experiments, we can get some conclusions andsuggestions for future works. First, we report the main characteristics of theanalyzed overlays. The values obtained are proportional to the size of thenetwork used in the experiments, each overlay changes its performance inrelation with the peer number of the network. Starting from SkipCluster, wenote that the cost to maintain the system is not high: about 1/50 of the size ofthe network. This means that the peer joins and leaves in the network involvea relatively low cost. In addition, the structure has an hop average equal tothe logarithm of the number of peers connected to the network. The numberof links required to maintain the structure is low, approximately equal to halfthe value of the logarithmic network size. The measure about the traffic load,
113
that is the ratio of the standard deviation and the average of the traffic load,is a logarithmic value of the network size. This last parameter is a weaknessof SkipCluster, despite showing good performance compared to others.
SkipCluster with HiGLoB, shows an average number of links per nodeless than about 1/3. This value allows to maintain a smaller number ofconnections and therefore decreases the bandwidth needed. Nevertheless,this overlay has a memory occupancy greater than SkipCluster, because eachnode stores the histogram of the clusters, and equal to about 1/100 of thenetwork size. Moreover, to update the histogram, this overlay uses a doublenumber of messages with respect to those used by SkipCluster.
We note that the basic version of G-Grid is showing significant advantagesover SkipCluster. First, G-Grid has a very low maintaining cost because thepeer joins and leaves cause a change in only a node of the tree, that holdsup to three links. The number of links is a superiority of G-Grid: this valueis very low, due to the binary tree structure. The average number of hopis lower than that of SkipCluster and it is around the logarithmic value ofthe network size. The traffic distribution in G-Grid, however, gets the sameperformance of SkipCluster, showing the same problem of load balancing.
G-Grid with Learning shows the same characteristics in terms of systemtraffic, because the added information travels in piggyback on query mes-sages. The improvement consists in reducing the number of hops, which, ina stable network, tends to one. The disadvantage of Learning is the num-ber of links that grows linearly with the network size. This requires a largeamount of memory in the nodes and a high bandwidth to maintain valid allthe links. Even in this case the traffic distribution is unbalanced between thevarious peers of the network.
In G-Grid with Chord ring, we note that this overlay requires a hugenumber of system messages, approximately equal to half the network size.This brings a hop average approximately equal to half the logarithm of thenumber of network peers. The number of links per peer is equal, by con-struction, to the logarithm of the number of nodes. Although this versiondegrade the performance compared to G-Grid and G-Grid with Learning, weobserve that the traffic is distributed almost equally, bringing the relativemeasure to 2.
Finally, G-Grid Small World was created to get the benefits of both G-Grid and G-Grid with Chord ring. The number of system messages is about1/15 of the number of network nodes, so it is rather small compared to thatrequired by the version Chord. The number of hops increases, reaching to a
114
couple of units compared to the logarithmic value of the number of nodes.The number of links also increases: it is 1/100 of the network size. Thisdegradation of performance is offset by the traffic load measure that remainsaround 1. This indicates an almost uniform network traffic distribution. G-Grid Small World reaches the best traffic distribution with an acceptabledecline of other measured performance.
The analyzes and considerations presented in this thesis have shown thefeatures of G-Grid, in various versions, in comparison with one of the latestsimilar literature overlay, that is SkipCluster. In next works we will evaluatethe performance in networks with uneven load distribution on peers, consid-ering the behavior of these overlays in cases of non-uniform load distribution.These simulations will be able to measure the performance of architectures incases closer to reality. In addition, we will evaluate the possibility to realizethe HiGLoB structure also on G-Grid. This work creates many opportunitiesfor the continuation of the study and analysis in realistic P2P environments.
115

116

Appendices
117

Appendix A
Distribution on C3PFramework
Due to the abundance of attractive services available on the cloud, peopleare placing an increasing amount of their data online on different cloud plat-forms. However, given the recent large-scale attacks on users data, privacyhas become an important issue. Ordinary users cannot be expected to man-ually specify which of their data is sensitive, or to take appropriate measuresto protect such data. Furthermore, usually most people are not aware ofthe privacy risk that different shared data items can pose. Starting from thestudy of the C3P framework, in which privacy risk is automatically calculatedusing the sharing context of data items, we tried propose novel approachesthat take into account a P2P environment. To overcome ignorance of privacyrisk on the part of most users, C3P framework uses a crowdsourcing basedapproach. It uses Item Response Theory (IRT) on top of this crowdsourceddata to determine the sensitivity of items and diverse attitudes of users to-wards privacy. In this lightweight mechanism, users can crowdsource theirsharing contexts with the server and determine the risk of sharing particulardata item(s) privately. This scheme converges quickly and provides accurateprivacy risk scores under varying conditions [51].
Our new contribution was the application of this privacy framework ina P2P environment, to improve the privacy guarantees among the networkpeers and to let them contexts’ sensitivity elaboration only upon local interac-tions, considering the information coming from neighbour peers not alwaystrustful. We paid particular attention to improving privacy conditions ascompared to the existing centralised solution. In addition to following the
119

theory, we implemented a simulator to evaluate the performance of thesesolutions and obtain results to support our ideas. A manuscript for publi-cation based on this work here is under preparation, which is expected tobe submitted this Winter. In the following we describe some ideas on whichwe worked on, assuming to have this prerequisite: we consider a network ofpeers in which each peer has almost one link to another one.
The first idea was to split the storage database of Crowdsource Informa-tion (CI) from a single server into different peers. Each peer of the networkstores some Crowdsourcing Information (CI) in its own memory. The CIcomes from the network, when other peers share them, and from the sharingoperations of the peer itself. The CI can be stored with a timestamp, so if thememory space is limited the peer can maintain only the most updated CI.When a peer needs to know the sensitivity value of a context item, it uses itsown CI storage. It calculates the sensitivity value using the IRT algorithmwith the owned CI. Then it decides the right privacy policy to apply to thecontext item and it shares the context information in the established cloudservice with the decided privacy policy. Finally, when the privacy guaranteesare satisfied, the peer spread a new CI, arranged by its peer profile, the con-text and the privacy policy, to the network by a gossip algorithm: it sendsthe CI to its neighbors, and they do the same until the timestamp is elapsed.When a peer receives a CI, stores it in its own CI storage: this improve theability to calculate the sensitivity value of context items. If the timestampof the Ci is not elapsed, the peer has to forward the CI to its neighbors,decreasing the timestamp before the sending. In this scenario, every peercalculates the context sensitivity based only on its local CI database, that isthe result of the spreading of all the information by a gossip algorithm. Thisimprove the privacy guarantees, because all the information are not gatheredby a single server.
We investigated a second step to improve the previous solution in termsof network traffic and storage load. The new idea was to do not spread theCI with a gossip algorithm but let to each peer to asks the data useful totheir specific sensitivity requests to the other network peers. Each peer of thenetwork stores only the CI of the sharing operations that it requires: the onesgenerated from itself and the ones expressly asked the network. When a peerneeds to know the sensitivity value of a context item, it sends a request overthe network, by its neighbors, containing a number of context items, such asto calculate the sensitivity value. This number can not be too high to do notsend a query message too large, but the context items have to be enough to
120
calculate the sensitivity, that is to build an almost full matrix (contexts xpeers) for the IRT algorithm. When a peer receives a query message, it hasto check in its CI storage if there are almost an available subset of CI thatmatches (almost a sufficient part of) the context items requested in the querymessage. If the conditions are satisfied that peer sends the useful CI set tothe requester, otherwise not. Anyhow, the peer decreases the timestamp ofthe query message and if it is not elapsed yet, the peer forwards the querymessage to its neighbors. If the requester peer receives enough replies fromthe network, in a specified time period, it can calculate the sensitivity value.When the peer assigns the privacy policy to the context item, evaluating thesensitivity result or not, it creates a new CI record that save into its storage,for the further network queries that it could be receive. Also the CI setreceived from the network can be cached into the peer’s CI storage.
An example:
1. A peer P1 that had previously shared 3 context items (C1, C2, C3) withrespectively 3 privacy policy (pp1 = 0, pp2 = 1, pp3 = 0) wants to sharea new context item C4.
2. P1 sends a request to its neighbors (es. P2, P3, P4) asking the policiesfor N = 4 context items (C1, C3, C4, C5), with a timestamp.
3. P2 replies to P1 with a list of the privacy policies of M context items,where M ≤ N and M ≥ Mmin. P2 forwards the query message to itsneighbors, only if the timestamp is not zero.
4. P3 does not have enough context items, so P3 does not reply anythingto P1, but it forwards the query message to its neighbors (until thetimestamp is not zero).
5. P1 waits until almost Z peer responses, or a timer elapsed.
6. If P1 receives almost Z peer responses, P1 can elaborate the sensitivityof the query set.
7. P1 stores the privacy policy of C5 in its sensitivity storage.
The parameters are:
• N : number of context items in the query set, it can be variable;
121

• Timestamp: number of neighbors level in which the query message isspread;
• M : number of context items in the replies;
• Mmin: minimum number of context items asked in the replies. Mmin
should be close to N ;
• Z: minimum number of peers to elaborate sensitivity.
A.1 Requirements of the CI to calculate sen-
sitivity values
To calculate the sensitivity of a certain context item is necessary to have asufficient number of CI with some requirements. For example, the privacypolicies of a context item can not be the same for all the peer profiles thatshared it.
Finally, as a future work, we proposed to use some Data Mining tech-niques to find correlation between context fields and profile policies, to detectthe sensitivity of new contexts and in general to support the sensitivity cal-culation, specially when there are not enough local CI into a peer to calculatea context sensitivity.
122
Bibliography
[1] Distributed.net. http://www.distributed.net, 2006.
[2] K. Aberer, P. Cudre-Mauroux, A. Datta, Z. Despotovic, M. Hauswirth,M. Punceva, and R. Schmidt. P-Grid: a self-organizing structured P2Psystem. SIGMOD Rec., 32(3):29–33, 2003.
[3] Karl Aberer. P-grid: A self-organizing access structure for p2p infor-mation systems. In Cooperative Information Systems, pages 179–194.Springer, 2001.
[4] R. Agrawal, M. Mehta, J. Shafer, R. Srikant, A. Arning, andT. Bollinger. The Quest data mining system. In Proceedings of the2nd International Conference on Knowledge Discovery in Databasesand Data Mining, pages 244–249, 1996.
[5] Syed A Ahson and Mohammad Ilyas. SIP handbook: services, tech-nologies, and security of Session Initiation Protocol. CRC Press, 2008.
[6] S. Alaei, M. Ghodsi, and M. Toossi. Skiptree: A new scalable dis-tributed data structure on multidimensional data supporting range-queries. Computer Communications, 33(1):73–82, 2010.
[7] Emmanuelle Anceaume, R Ludinard, A Ravoaja, and F Brasileiro.Peercube: A hypercube-based p2p overlay robust against collusion andchurn. In Self-Adaptive and Self-Organizing Systems, 2008. SASO’08.Second IEEE International Conference on, pages 15–24. IEEE, 2008.
[8] J. Aspnes and G. Shah. Skip graphs. ACM Transactions on Algorithms(TALG), 3(4):37, 2007.
123
[9] James Aspnes, Jonathan Kirsch, and Arvind Krishnamurthy. Load bal-ancing and locality in range-queriable data structures. In Proceedingsof the twenty-third annual ACM symposium on Principles of distributedcomputing, pages 115–124. ACM, 2004.
[10] Hari Balakrishnan, M Frans Kaashoek, David Karger, Robert Morris,and Ion Stoica. Looking up data in p2p systems. Communications ofthe ACM, 46(2):43–48, 2003.
[11] HMN Dilum Bandara and Anura P Jayasumana. Evaluation of p2presource discovery architectures using real-life multi-attribute resourceand query characteristics. In Consumer Communications and Network-ing Conference (CCNC), 2012 IEEE, pages 634–639. IEEE, 2012.
[12] HMN Dilum Bandara and Anura P Jayasumana. Collaborative applica-tions over peer-to-peer systems–challenges and solutions. Peer-to-PeerNetworking and Applications, 6(3):257–276, 2013.
[13] Hakem Beitollahi and Geert Deconinck. Analyzing the chord peer-to-peer network for power grid applications. In Fourth IEEE YoungResearchers Symposium in Electrical Power Engineering, page 5, 2008.
[14] Ashwin R Bharambe, Mukesh Agrawal, and Srinivasan Seshan. Mer-cury: supporting scalable multi-attribute range queries. In ACM SIG-COMM Computer Communication Review, volume 34, pages 353–366.ACM, 2004.
[15] L. Breiman. Pasting small votes for classification in large databasesand on-line. Machine Learning, 36(1):85–103, 1999.
[16] L. Breiman and P. Spector. Parallelizing CART using a workstationnetwork. In Proc Annual American Statistical Association Meeting,1994.
[17] Andre Brinkmann, Yan Gao, Miroslaw Korzeniowski, and Dirk Meis-ter. Request load balancing for highly skewed traffic in p2p networks.In Networking, Architecture and Storage (NAS), 2011 6th IEEE Inter-national Conference on, pages 53–62. IEEE, 2011.
[18] Mark Buchanan. Nexus: small worlds and the groundbreaking theoryof networks. WW Norton, 2003.
124
[19] W. Cerroni, G. Monti, G. Moro, and M. Ramilli. Network AttackDetection Based on Peer-to-Peer Clustering of SNMP Data. Quality ofService in Heterogeneous Networks, pages 417–430, 2009.
[20] Walter Cerroni, Gianluca Moro, Tommaso Pirini, and Marco Ramilli.Peer-to-peer data mining classifiers for decentralized detection of net-work attacks. In Proceedings of the Twenty-Fourth AustralasianDatabase Conference-Volume 137, pages 101–107. Australian Com-puter Society, Inc., 2013.
[21] P.K. Chan. An extensible meta-learning approach for scalable andaccurate inductive learning. 1996.
[22] Ann Chervenak and Shishir Bharathi. Peer-to-peer approaches to gridresource discovery. In Making Grids Work, pages 59–76. Springer, 2008.
[23] S.H. Clearwater, T.P. Cheng, H. Hirsh, and B.G. Buchanan. Incremen-tal batch learning. In Proceedings of the sixth international workshopon Machine learning, pages 366–370. Morgan Kaufmann PublishersInc., 1989.
[24] Bram Cohen. The bittorrent protocol specification, 2008.
[25] R. Cole. Parallel merge sort. SIAM Journal on Computing, 17(4):770–785, 1988.
[26] Josenildo Costa da Silva, Matthias Klusch, Stefano Lodi, and Gi-anluca Moro. Privacy-preserving agent-based distributed data clus-tering. Web Intelligence and Agent Systems, 4(2):221–238, 2006.http://iospress.metapress.com/content/1dva3ew1f2emam44/.
[27] Frank Dabek, Emma Brunskill, M Frans Kaashoek, David Karger,Robert Morris, Ion Stoica, and Hari Balakrishnan. Building peer-to-peer systems with chord, a distributed lookup service. In Hot Topicsin Operating Systems, 2001. Proceedings of the Eighth Workshop on,pages 81–86. IEEE, 2001.
[28] Frank Dabek, Ben Zhao, Peter Druschel, John Kubiatowicz, and IonStoica. Towards a common api for structured peer-to-peer overlays. InPeer-to-Peer Systems II, pages 33–44. Springer, 2003.
125
[29] Vasilios Darlagiannis. 21. hybrid peer-to-peer systems. In Peer-to-PeerSystems and Applications, pages 353–366. Springer, 2005.
[30] Alan Demers, Dan Greene, Carl Hauser, Wes Irish, John Larson, ScottShenker, Howard Sturgis, Dan Swinehart, and Doug Terry. Epidemicalgorithms for replicated database maintenance. In Proceedings of thesixth annual ACM Symposium on Principles of distributed computing,pages 1–12. ACM, 1987.
[31] A. Di Pasquale and E. Nardelli. Adst: An order preserving scalabledistributed data structure with constant access costs. In SOFSEM2001: Theory and Practice of Informatics, pages 211–222. Springer,2001.
[32] Peter Druschel and Antony Rowstron. Past: A large-scale, persistentpeer-to-peer storage utility. In Hot Topics in Operating Systems, 2001.Proceedings of the Eighth Workshop on, pages 75–80. IEEE, 2001.
[33] M. El Dick, E. Pacitti, and B. Kemme. Flower-cdn: a hybrid p2poverlay for efficient query processing in cdn. In Proceedings of the 12thInternational Conference on Extending Database Technology: Advancesin Database Technology, pages 427–438. ACM, 2009.
[34] W. Fan, S.J. Stolfo, and J. Zhang. The application of AdaBoost fordistributed, scalable and on-line learning. In Proceedings of the fifthACM SIGKDD international conference on Knowledge discovery anddata mining, pages 362–366. ACM, 1999.
[35] Imen Filali, Francesco Bongiovanni, Fabrice Huet, and FrancoiseBaude. A survey of structured p2p systems for rdf data storage andretrieval. In Transactions on large-scale data-and knowledge-centeredsystems III, pages 20–55. Springer, 2011.
[36] Cormac Flanagan and Stephen N Freund. Fasttrack: efficient andprecise dynamic race detection. In ACM Sigplan Notices, volume 44,pages 121–133. ACM, 2009.
[37] Michael J Freedman, Eric Freudenthal, and David Mazieres. Democra-tizing content publication with coral. In NSDI, volume 4, pages 18–18,2004.
126
[38] Michael J Freedman, Karthik Lakshminarayanan, Sean Rhea, and IonStoica. Non-transitive connectivity and dhts. USENIX WORLDS 2005,2005.
[39] Y. Freund and R. Schapire. A desicion-theoretic generalization of on-line learning and an application to boosting. In Computational learningtheory, pages 23–37. Springer, 1995.
[40] Y. Freund and R.E. Schapire. Experiments with a new boosting algo-rithm. In Machine Learning-International Workshop Then Conference,pages 148–156. Citeseer, 1996.
[41] V. Gaede and O. Gunther. Multidimensional access methods. ACMComput. Surv., 30(2):170–231, 1998.
[42] V. Galtier, S. Genaud, and S. Vialle. Implementation of the Ad-aBoost Algorithm for Large Scale Distributed Environments: Com-paring JavaSpace and MPJ. In 2009 15th International Conference onParallel and Distributed Systems, pages 655–662. IEEE, 2009.
[43] Sarunas Girdzijauskas, Anwitaman Datta, and Karl Aberer. Os-car: Small-world overlay for realistic key distributions. In Databases,Information Systems, and Peer-to-Peer Computing, pages 247–258.Springer, 2007.
[44] Sarunas Girdzijauskas, Wojciech Galuba, Vasilios Darlagiannis, An-witaman Datta, and Karl Aberer. Fuzzynet: Ringless routing in aring-like structured overlay. Peer-to-Peer Networking and Applications,4(3):259–273, 2011.
[45] Andrea Glorioso, Ugo Pagallo, and Giancarlo Ruffo. The social impactof p2p systems. In Handbook of peer-to-peer networking, pages 47–70.Springer, 2010.
[46] Jan Goebel, Thorsten Holz, and Carsten Willems. Measurement andanalysis of autonomous spreading malware in a university environment.In Detection of Intrusions and Malware, and Vulnerability Assessment,pages 109–128. Springer, 2007.
127
[47] B. Greenstein, S. Ratnasamy, S. Shenker, R. Govindan, and D. Estrin.Difs: A distributed index for features in sensor networks. Ad HocNetworks, 1(2):333–349, 2003.
[48] F. Gui-Hai, C. Jin-Xiao, and X. Jun-Yuan. P2p super-peer topologyconstruction based on hierarchical quadrant space [j]. Chinese Journalof Computers, 6:004, 2010.
[49] D. Guo, J. Wu, H. Chen, and X. Luo. Moore: An extendable peer-to-peer network based on incomplete kautz digraph with constant degree.In INFOCOM 2007. 26th IEEE International Conference on ComputerCommunications. IEEE, pages 821–829. IEEE, 2007.
[50] E.H. Han, G. Karypis, and V. Kumar. Scalable parallel data miningfor association rules. In Proceedings of the 1997 ACM SIGMOD in-ternational conference on Management of data, pages 277–288. ACM,1997.
[51] Hamza Harkous, Rameez Rahman, and Karl Aberer. C3p: Context-aware crowdsourced cloud privacy. In 14th Privacy EnhancingTechnologies Symposium (PETS 2014), number EPFL-CONF-198473,2014.
[52] N. J. A. Harvey, M. B. Jones, S. Saroiu, M. Theimer, and A. Wolman.Skipnet: A scalable overlay network with practical locality properties.In Proceedings of the 4th conference on USENIX Symposium on Inter-net Technologies and Systems, volume 4, pages 9–9, 2003.
[53] Erik Hjelmvik and Wolfgang John. Breaking and improving protocolobfuscation. Chalmers University of Technology, Tech. Rep, 123751,2010.
[54] Thorsten Holz, Moritz Steiner, Frederic Dahl, Ernst Biersack, and Fe-lix C Freiling. Measurements and mitigation of peer-to-peer-based bot-nets: A case study on storm worm. LEET, 8(1):1–9, 2008.
[55] Xing Jin and S-H Gary Chan. Unstructured peer-to-peer network ar-chitectures. In Handbook of Peer-to-Peer Networking, pages 117–142.Springer, 2010.
128
[56] M. A. Jovanovic, F. S. Annexstein, and K. A. Berman. Scalabilityissues in large peer-to-peer networks-a case study of gnutella. Technicalreport, Technical report, University of Cincinnati, 2001.
[57] Mina Kamel, Caterina Scoglio, and Todd Easton. Optimal topologydesign for overlay networks. In NETWORKING 2007. Ad Hoc andSensor Networks, Wireless Networks, Next Generation Internet, pages714–725. Springer, 2007.
[58] Verena Kantere, Spiros Skiadopoulos, and Timos Sellis. Storing andindexing spatial data in p2p systems. Knowledge and Data Engineering,IEEE Transactions on, 21(2):287–300, 2009.
[59] David Karger, Eric Lehman, Tom Leighton, Rina Panigrahy, MatthewLevine, and Daniel Lewin. Consistent hashing and random trees: Dis-tributed caching protocols for relieving hot spots on the world wideweb. In Proceedings of the twenty-ninth annual ACM symposium onTheory of computing, pages 654–663. ACM, 1997.
[60] M. Kelaskar, V. Matossian, P. Mehra, D. Paul, and M. Parashar. Astudy of discovery mechanisms for peer-to-peer applications. In Pro-ceedings of the 2Nd IEEE/ACM International Symposium on ClusterComputing and the Grid, CCGRID ’02, pages 444–, Washington, DC,USA, 2002. IEEE Computer Society.
[61] Jon M Kleinberg. Navigation in a small world. Nature, 406(6798):845–845, 2000.
[62] Matthias Klusch, Stefano Lodi, and Gianluca Moro. Distributed clus-tering based on sampling local density estimates. In IJCAI, pages485–490, 2003. http://www-ags.dfki.uni-sb.de/~klusch/papers/
ijcai03-KDEC-paper.pdf.
[63] SB Kotsiantis. Supervised machine learning: A review of classificationtechniques. Emerging artificial intelligence applications in computerengineering: real word AI systems with applications in eHealth, HCI,information retrieval and pervasive technologies, page 3, 2007.
[64] Gunnar Kreitz and Fredrik Niemela. Spotify–large scale, low latency,p2p music-on-demand streaming. In Peer-to-Peer Computing (P2P),
129

2010 IEEE Tenth International Conference on, pages 1–10. IEEE,2010.
[65] Brigitte Kroll and Peter Widmayer. Distributing a search tree amonga growing number of processors. In ACM SIGMOD Record, volume 23,pages 265–276. ACM, 1994.
[66] Brigitte Kroll and Peter Widmayer. Balanced distributed search treesdo not exist. Springer, 1995.
[67] Vito Latora and Massimo Marchiori. Efficient behavior of small-worldnetworks. Physical review letters, 87(19):198701, 2001.
[68] Jiunn-Jye Lee, Hann-Huei Chiou, Chia-Chang Hsu, and Chin-LaungLei. An adaptive sector-based routing model over structured peer-to-peer networks. Computer Networks, 57(4):887–896, 2013.
[69] Arnaud Legout, Guillaume Urvoy-Keller, and Pietro Michiardi. Rarestfirst and choke algorithms are enough. In Proceedings of the 6th ACMSIGCOMM conference on Internet measurement, pages 203–216. ACM,2006.
[70] D. Li, X. Lu, and J. Wu. Fissione: A scalable constant degree and lowcongestion dht scheme based on kautz graphs. In INFOCOM 2005. 24thAnnual Joint Conference of the IEEE Computer and CommunicationsSocieties. Proceedings IEEE, volume 3, pages 1677–1688. IEEE, 2005.
[71] Deng Li, Hui Liu, and Athanasios Vasilakos. An efficient, scalable androbust p2p overlay for autonomic communication. Springer, 2009.
[72] Jin Li. On peer-to-peer (p2p) content delivery. Peer-to-Peer Network-ing and Applications, 1(1):45–63, 2008.
[73] X. Li, Y. J. Kim, R. Govindan, and W. Hong. Multi-dimensionalrange queries in sensor networks. In Proceedings of the 1st internationalconference on Embedded networked sensor systems, pages 63–75. ACM,2003.
[74] Jian Liang, Rakesh Kumar, and Keith W Ross. The fasttrack overlay:A measurement study. Computer Networks, 50(6):842–858, 2006.
130
[75] W. Litwin, M. A. Neimat, and D. Schneider. Rp*: A family of orderpreserving scalable distributed data structures. In Proceedings of theInternational Conference on Very Large Data Bases, pages 342–342.Institute of Electrical & Electronica Engineers (IEEE), 1994.
[76] W. Litwin, M. A. Neimat, and D. A. Schneider. Lh*a scalable, dis-tributed data structure. ACM Transactions on Database Systems(TODS), 21(4):480–525, 1996.
[77] Stefano Lodi, Gabriele Monti, Gianluca Moro, and Claudio Sartori.Peer-to-peer data clustering in self-organizing sensor networks. In Intel-ligent Techniques for Warehousing and Mining Sensor Network Data,pages 179–211. IGI Global, Information Science Reference, December2009, Hershey, PA, USA, December 2009. http://www.igi-global.
com/chapter/peer-peer-data-clustering-self/39546.
[78] Stefano Lodi, Gianluca Moro, and Claudio Sartori. Distributed dataclustering in multi-dimensional peer-to-peer networks. In ADC, pages171–178, 2010.
[79] Qin Lv, Sylvia Ratnasamy, and Scott Shenker. Can heterogeneity makegnutella scalable? In In Proceedings of the first International Workshopon Peer-to-Peer Systems, pages 94–103, 2002.
[80] D. Malkhi, M. Naor, and D. Ratajczak. Viceroy: A scalable and dy-namic emulation of the butterfly. In Proceedings of the twenty-firstannual symposium on Principles of distributed computing, pages 183–192. ACM, 2002.
[81] Gurmeet Singh Manku. Dipsea: a modular distributed hash table. PhDthesis, stanford university, 2004.
[82] Petar Maymounkov and David Mazieres. Kademlia: A peer-to-peerinformation system based on the xor metric. In Peer-to-Peer Systems,pages 53–65. Springer, 2002.
[83] Stanley Milgram. The small world problem. Psychology today, 2(1):60–67, 1967.
[84] Gabriele Monti and Gianluca Moro. Multidimensional range queryand load balancing in wireless ad hoc and sensor networks. In
131
Eighth IEEE International Conference on Peer-to-Peer Computing,2008, pages 205–214. IEEE Computer Society, Sept. 2008. http:
//doi.ieeecomputersociety.org/10.1109/P2P.2008.27.
[85] Gabriele Monti and Gianluca Moro. Self-organization and local learn-ing methods for improving the applicability and efficiency of data-centric sensor networks. In Quality of Service in Heterogeneous Net-works (QSHINE 2009), volume 22 of Lecture Notes of the Insti-tute for Computer Sciences, Social Informatics and Telecommunica-tions Engineering, pages 627–643. Springer Berlin Heidelberg, 2009.http://dx.doi.org/10.1007/11942634_40.
[86] Gabriele Monti, Gianluca Moro, Giacomo Tufano, and Marco Rosetti.Self-organizing mobile mesh networks with peer-to-peer routing andinformation search services. In Proceedings of The Third Interna-tional Conference on Advances in Mesh Networks (MESH 2010), pages17–22, Venezia, Italy, 2010. IEEE Computer Society. http://doi.
ieeecomputersociety.org/10.1109/MESH.2010.14.
[87] A. Montresor and M. Jelasity. Peersim: A scalable p2p simulator.In Peer-to-Peer Computing, 2009. P2P’09. IEEE Ninth InternationalConference on, pages 99–100, 2009.
[88] G. Moro, G. Monti, and A. M. Ouksel. Merging g-grid p2p systemswhile preserving their autonomy. In Proceedings of the MobiQuitous,volume 4, pages 123–137, 2004.
[89] G. Moro, M. A. Ouksel, and C. Sartori. Agents and peer-to-peer com-puting: a promising combination of paradigms. In Proceedings of the1st International Workshop on Agents and Peer-to-Peer Computing,Bologna, Italy, July 2002, volume 2530, pages 1–14. Springer, 2003.
[90] Gianluca Moro and Gabriele Monti. W-grid: A scalable and efficientself-organizing infrastructure for multi-dimensional data management,querying and routing in wireless data-centric sensor networks. Journalof Network and Computer Applications, 35(4):1218–1234, July 2012.http://dx.doi.org/10.1016/j.jnca.2011.05.002.
[91] Gianluca Moro, Tommaso Pirini, and Claudio Sartori. Network trafficload balancing in hierarchical peer-to-peer systems. In P2P, Paral-
132
lel, Grid, Cloud, and Internet Computing (3PGCIC 2015), 2015 10thInternational Conference on, 2015.
[92] Satoshi Nakamoto. Bitcoin: A peer-to-peer electronic cash system.Consulted, 1(2012):28, 2008.
[93] Moni Naor and Udi Wieder. Novel architectures for p2p applications:the continuous-discrete approach. ACM Transactions on Algorithms(TALG), 3(3):34, 2007.
[94] H. Nazerzadeh and M. Ghodsi. Raq: a range-queriable distributed datastructure. SOFSEM 2005: Theory and Practice of Computer Science,pages 269–277, 2005.
[95] University of Karlsruhe. YaCy Project. http://www.yacy.net,September 2006.
[96] A. Oram. Peer-to-peer: harnessing the benefits of a disruptive technol-ogy. ” O’Reilly Media, Inc.”, 2001.
[97] M. A. Ouksel. The interpolation-based grid file. In Proceedings of thefourth ACM SIGACT-SIGMOD symposium on Principles of databasesystems, pages 20–27. ACM, 1985.
[98] M. A. Ouksel, V. Kumar, and C. Majumdar. Management of concur-rency in interpolation based grid file organization and its performance.Information sciences, 78(1):129–158, 1994.
[99] M. A. Ouksel and O. Mayer. A robust and efficient spatial datastructure: the nested interpolation-based grid file. Acta Informatica,29(4):335–373, 1992.
[100] M. A. Ouksel and G. Moro. G-Grid: A class of scalable and self-organizing data structures for multi-dimensional querying and contentrouting in P2P networks. In Agents and Peer-to-Peer Computing, pages123–137.
[101] Venkata N Padmanabhan and Kunwadee Sripanidkulchai. The case forcooperative networking. In Revised Papers from the First InternationalWorkshop on Peer-to-Peer Systems IPTPS, 2001.
133
[102] C.H. Papadimitriou. Computational complexity. John Wiley and SonsLtd., 2003.
[103] Al-Sakib Khan Pathan, Muhammad Mostafa Monowar, and Zubair MdFadlullah. Building Next-generation Converged Networks: Theory andPractice. CRC Press, 2013.
[104] Theoni Pitoura, Nikos Ntarmos, and Peter Triantafillou. Saturn: rangequeries, load balancing and fault tolerance in dht data systems. Knowl-edge and Data Engineering, IEEE Transactions on, 24(7):1313–1327,2012.
[105] F.J. Provost and D.N. Hennessy. Scaling up: Distributed machinelearning with cooperation. In Proceedings of the National Conferenceon Artificial Intelligence, pages 74–79. Citeseer, 1996.
[106] J.R. Quinlan. C4. 5: programs for machine learning. Morgan Kauf-mann, 1993.
[107] JR Quinlan. Improved use of continuous attributes in C4. 5. Arxivpreprint cs/9603103, 1996.
[108] Rajiv Ranjan, Lipo Chan, Aaron Harwood, Shanika Karunasekera, andRajkumar Buyya. Decentralised resource discovery service for largescale federated grids. In e-Science and Grid Computing, IEEE Inter-national Conference on, pages 379–387. IEEE, 2007.
[109] Rajiv Ranjan, Aaron Harwood, and Rajkumar Buyya. A study onpeer-to-peer based discovery of grid resource information. Universityof Melbourne, Australia, Technical Report GRIDS-TR-2006-17, 2006.
[110] Rajiv Ranjan, Aaron Harwood, and Rajkumar Buyya. Peer-to-peer-based resource discovery in global grids: a tutorial. CommunicationsSurveys & Tutorials, IEEE, 10(2):6–33, 2008.
[111] Ananth Rao, Karthik Lakshminarayanan, Sonesh Surana, RichardKarp, and Ion Stoica. Load balancing in structured p2p systems. InPeer-to-Peer Systems II, pages 68–79. Springer, 2003.
[112] R.G. Reynolds. An introduction to cultural algorithms. In Proceedingsof the Third Annual Conference on Evolutionary Programming, pages131–139. World Scientific, 1994.
134
[113] Matei Ripeanu. Peer-to-peer architecture case study: Gnutella net-work. In Peer-to-Peer Computing, 2001. Proceedings. First Interna-tional Conference on, pages 99–100. IEEE, 2001.
[114] A. Rowstron and P. Druschel. Pastry: Scalable, decentralized objectlocation, and routing for large-scale peer-to-peer systems. Lecture Notesin Computer Science, 2218:329–340, 2001.
[115] Antony Rowstron and Peter Druschel. Pastry: Scalable, decentralizedobject location, and routing for large-scale peer-to-peer systems. InMiddleware 2001, pages 329–350. Springer, 2001.
[116] Antony Rowstron and Peter Druschel. Storage management andcaching in past, a large-scale, persistent peer-to-peer storage utility.In ACM SIGOPS Operating Systems Review, volume 35, pages 188–201. ACM, 2001.
[117] Rudiger Schollmeier. [16] a definition of peer-to-peer networking for theclassification of peer-to-peer architectures and applications. In Peer-to-Peer Computing, IEEE International Conference on, pages 0101–0101.IEEE Computer Society, 2001.
[118] Thorsten Schutt, Florian Schintke, and Alexander Reinefeld. A struc-tured overlay for multi-dimensional range queries. In Euro-Par 2007Parallel Processing, pages 503–513. Springer, 2007.
[119] Xuemin Shen, Heather Yu, John Buford, and Mursalin Akon. Handbookof peer-to-peer networking, volume 1. Springer, 2010.
[120] Vivek Singh, Himani Gupta, and Kaveri Dey. Anonymous file sharingin peer to peer system by random walks. 2012.
[121] Andrew Ross Sorkin. Software bullet is sought to kill musical piracy.New York Times, 1:36, 2003.
[122] John Stevenson. Bitcoins, litecoins, what coins?: A global phenomenon.John Stevenson, 2013.
[123] Joe Stewart. Storm worm ddos attack. Internet: http://www. secure-works. com/research/threats/storm-worm, 2007.
135
[124] I. Stoica, R. Morris, D. Liben-Nowell, D. R. Karger,M. Frans Kaashoek, F. Dabek, and H. Balakrishnan. Chord: ascalable peer-to-peer lookup protocol for internet applications.IEEE/ACM Trans. Netw., 11(1):17–32, 2003.
[125] Ion Stoica, Robert Morris, David Karger, M Frans Kaashoek, and HariBalakrishnan. Chord: A scalable peer-to-peer lookup service for inter-net applications. ACM SIGCOMM Computer Communication Review,31(4):149–160, 2001.
[126] S. Stolfo, A.L. Prodromidis, S. Tselepis, W. Lee, D.W. Fan, and P.K.Chan. JAM: Java agents for meta-learning over distributed databases.In Proceedings of the 3rd International Conference on Knowledge Dis-covery and Data Mining, pages 74–81, 1997.
[127] Daniel Stutzbach, Daniel Zappala, and Reza Rejaie. The scalability ofswarming peer-to-peer content delivery. In NETWORKING 2005. Net-working Technologies, Services, and Protocols; Performance of Com-puter and Communication Networks; Mobile and Wireless Communi-cations Systems, pages 15–26. Springer, 2005.
[128] Yuzhe Tang, Jianliang Xu, Shuigeng Zhou, and Wang-chien Lee. m-light: indexing multi-dimensional data over dhts. In Distributed Com-puting Systems, 2009. ICDCS’09. 29th IEEE International Conferenceon, pages 191–198. IEEE, 2009.
[129] Paolo Trunfio, Domenico Talia, Harris Papadakis, ParaskeviFragopoulou, Matteo Mordacchini, Mika Pennanen, Konstantin Popov,Vladimir Vlassov, and Seif Haridi. Peer-to-peer resource discovery ingrids: Models and systems. Future Generation Computer Systems,23(7):864–878, 2007.
[130] P. Utgo. An improved algorithm for incremental induction of deci-sion trees. In Proceedings of the Eleventh International Conference onMachine Learning, pages 318–325. Citeseer, 1994.
[131] Silvio Valenti, Dario Rossi, Michela Meo, Marco Mellia, and PaolaBermolen. Accurate, fine-grained classification of p2p-tv applicationsby simply counting packets. In Traffic Monitoring and Analysis, pages84–92. Springer, 2009.
136
[132] Q. H. Vu, B. C. Ooi, M. Rinard, and K. L. Tan. Histogram-basedglobal load balancing in structured peer-to-peer systems. Knowledgeand Data Engineering, IEEE Transactions on, 21(4):595–608, 2009.
[133] Quang Hieu Vu, Mihai Lupu, and Beng Chin Ooi. Peer-to-peer com-puting: principles and applications. Springer, 2009.
[134] B. Wang and Q. Shen. Tide: An effective and practical design forhierarchical-structured p2p model. Computer Communications, 2012.
[135] M.S. Warren and J.K. Salmon. A parallel hashed oct-tree n-body al-gorithm. In Proceedings of the 1993 ACM/IEEE conference on Super-computing, pages 12–21. ACM, 1993.
[136] Duncan J Watts and Steven H Strogatz. Collective dynamics of small-worldnetworks. nature, 393(6684):440–442, 1998.
[137] I.H. Witten and E. Frank. Data Mining: Practical machine learningtools and techniques. Morgan Kaufmann Pub, 2005.
[138] George Woltman and Scott Kurowski. The great internet mersenneprime search, 2004.
[139] Tim Wu. Network neutrality, broadband discrimination. J. onTelecomm. & High Tech. L., 2:141, 2003.
[140] Lin Xiao and Aris M Ouksel. Scalable self-configuring integration oflocalization and indexing in wireless ad-hoc sensor networks. In MobileData Management, 2006. MDM 2006. 7th International Conference on,pages 151–151. IEEE, 2006.
[141] M. Xu and G. Liu. Building self-adaptive peer-to-peer overlay networkswith dynamic cluster structure. In Communication Technology (ICCT),2011 IEEE 13th International Conference on, pages 520–525. IEEE,2011.
[142] M. Xu, S. Zhou, and J. Guan. A new and effective hierarchical over-lay structure for peer-to-peer networks. Computer Communications,34(7):862–874, 2011.
137
[143] Beverly Yang and Hector Garcia-Molina. Comparing hybrid peer-to-peer systems. In Proceedings of the 27th Intl. Conf. on Very Large DataBases, 2001.
[144] K.C. Zatloukal and N.J.A. Harvey. Family trees: an ordered dictio-nary with optimal congestion, locality, degree, and search time. InProceedings of the fifteenth annual ACM-SIAM symposium on Discretealgorithms, pages 308–317. Society for Industrial and Applied Mathe-matics, 2004.
[145] L. Zeng, L. Li, L. Duan, K. Lu, Z. Shi, M. Wang, W. Wu, and P. Luo.Distributed data mining: a survey. Information Technology and Man-agement, pages 1–7, 2012.
[146] Chong Zhang, Weidong Xiao, Daquan Tang, and Jiuyang Tang. P2p-based multidimensional indexing methods: A survey. Journal of Sys-tems and Software, 84(12):2348–2362, 2011.
[147] R. Zhang, W. Qian, A. Zhou, and M. Zhou. An efficient peer-to-peerindexing tree structure for multidimensional data. Future GenerationComputer Systems, 25(1):77–88, 2009.
[148] Y. M. Zhang, X. Lu, and D. S. Li. Sky: efficient peer-to-peer net-works based on distributed kautz graphs. Science in China Series F:Information Sciences, 52(4):588–601, 2009.
[149] B. Y. Zhao, L. Huang, J. Stribling, S. C. Rhea, A. D. Joseph, andJ. D. Kubiatowicz. Tapestry: A resilient global-scale overlay for servicedeployment. Selected Areas in Communications, IEEE Journal on,22(1):41–53, 2004.
[150] B. Y. Zhao, J. Kubiatowicz, A. D. Joseph, et al. Tapestry: An infras-tructure for fault-tolerant wide-area location and routing. 2001.
[151] Ce Zhu, Yuenan Li, and Xiamu Niu. Streaming media architectures,techniques and applications: recent advances. IGI Global, 2011.
138