Ally Financial Inc. 2Q 2019 Earnings Review€¦ · − Estimated retail auto originated yield(2)...
30
1 2Q 2019 Preliminary Results Ally Financial Inc. 2Q 2019 Earnings Review July 18, 2019 Contact Ally Investor Relations at (866) 710-4623 or [email protected]
Transcript of Ally Financial Inc. 2Q 2019 Earnings Review€¦ · − Estimated retail auto originated yield(2)...

12Q 2019 Preliminary Results
Ally Financial Inc.2Q 2019 Earnings ReviewJuly 18, 2019
Contact Ally Investor Relations at (866) 710-4623 or [email protected]

22Q 2019 Preliminary Results
Forward-Looking Statements and Additional Information
This presentation and related communications should be read in conjunction with the financial statements, notes, and other information contained in our Annual Reports on Form 10-K, Quarterly Reports on Form 10-Q, and Current Reports on Form 8-K. This information is preliminary and based on company and third-party data available at the time of the presentation or related communication.
This presentation and related communications contain forward-looking statements within the meaning of the Private Securities Litigation Reform Act of 1995. These statements can be identified by the fact that they do not relate strictly to historical or current facts—such as statements about the outlook for various financial and operating metrics and statements about future capital allocation and actions. Forward-looking statements often use words such as “believe,” “expect,” “anticipate,” “intend,” “pursue,” “seek,” “continue,” “estimate,” “project,” “outlook,” “forecast,” “potential,” “target,” “objective,” “trend,” “plan,” “goal,” “initiative,” “priorities,” or other words of comparable meaning or future-tense or conditional verbs such as “may,” “will,” “should,” “would,” or “could.” Forward-looking statements convey our expectations, intentions, or forecasts about future events, circumstances, or results. All forward-looking statements, by their nature, are subject to assumptions, risks, and uncertainties, which may change over time and many of which are beyond our control. You should not rely on any forward-looking statement as a prediction or guaranteeabout the future. Actual future objectives, strategies, plans, prospects, performance, conditions, or results may differ materially from those set forth in any forward-looking statement. Some of the factors that may cause actual results or other future events or circumstances to differ from those in forward-looking statements are described in our Annual Report on Form 10-K for the year ended December 31, 2018, our subsequent Quarterly Reports on Form 10-Q or Current Reports on Form 8-K, or other applicable documents that are filed or furnished with the U.S. Securities and Exchange Commission (collectively, our “SEC filings”). Anyforward-looking statement made by us or on our behalf speaks only as of the date that it was made. We do not undertake to updateany forward-looking statement to reflect the impact of events, circumstances, or results that arise after the date that the statement was made, except as required by applicable securities laws. You, however, should consult further disclosures (including disclosures of a forward-looking nature) that we may make in any subsequent SEC filings.
This presentation and related communications contain specifically identified non-GAAP financial measures, which supplement the results that are reported according to U.S. generally accepted accounting principles (“GAAP”). These non-GAAP financial measuresmay be useful to investors but should not be viewed in isolation from, or as a substitute for, GAAP results. Differences between non-GAAP financial measures and comparable GAAP financial measures are reconciled in the presentation.
Unless the context otherwise requires, the following definitions apply. The term “loans” means the following consumer and commercial products associated with our direct and indirect financing activities: loans, retail installment sales contracts, lines of credit, and other financing products excluding operating leases. The term “operating leases” means consumer- and commercial-vehicle lease agreements where Ally is the lessor and the lessee is generally not obligated to acquire ownership of the vehicle at lease-end or compensate Ally for the vehicle’s residual value. The terms “lend,” “finance,” and “originate” mean our direct extension or origination of loans, our purchase or acquisition of loans, or our purchase of operating leases as applicable. The term “consumer” means all consumer products associated with our loan and operating-lease activities and all commercial retail installment sales contracts. The term “commercial” means all commercial products associated with our loan activities, other than commercial retailinstallment sales contracts.
32Q 2019 Preliminary Results
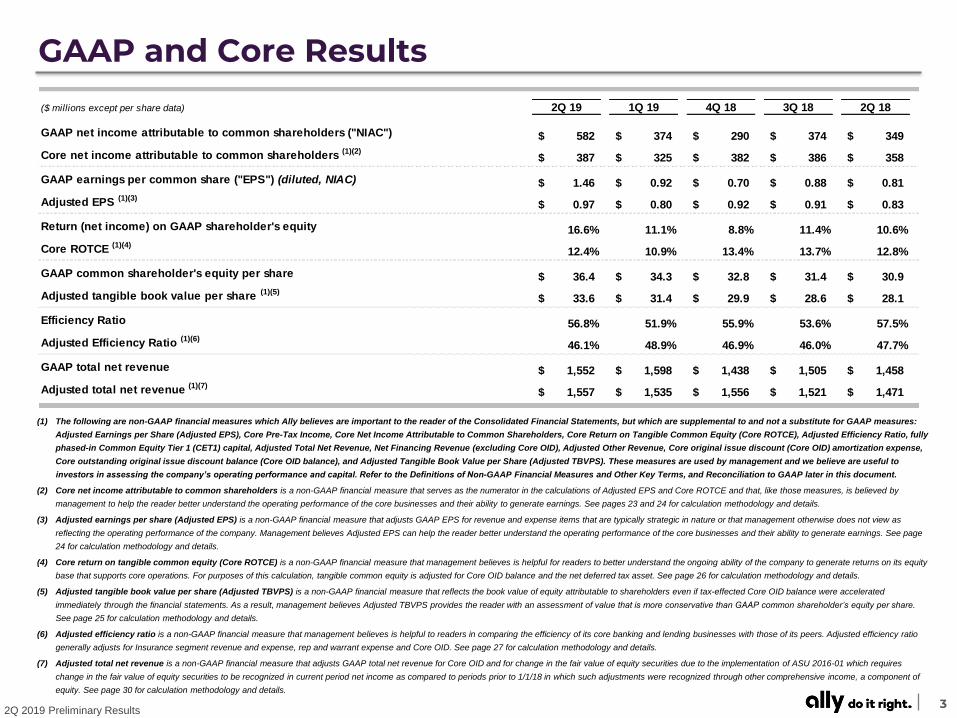
($ millions except per share data) 2Q 19 1Q 19 4Q 18 3Q 18 2Q 18
GAAP net income attributable to common shareholders ("NIAC") 582$ 374$ 290$ 374$ 349$
Core net income attributable to common shareholders (1)(2)387$ 325$ 382$ 386$ 358$
GAAP earnings per common share ("EPS") (diluted, NIAC) 1.46$ 0.92$ 0.70$ 0.88$ 0.81$
Adjusted EPS (1)(3)0.97$ 0.80$ 0.92$ 0.91$ 0.83$
Return (net income) on GAAP shareholder's equity 16.6% 11.1% 8.8% 11.4% 10.6%
Core ROTCE (1)(4)12.4% 10.9% 13.4% 13.7% 12.8%
GAAP common shareholder's equity per share 36.4$ 34.3$ 32.8$ 31.4$ 30.9$
Adjusted tangible book value per share (1)(5)33.6$ 31.4$ 29.9$ 28.6$ 28.1$
Efficiency Ratio 56.8% 51.9% 55.9% 53.6% 57.5%
Adjusted Efficiency Ratio (1)(6)46.1% 48.9% 46.9% 46.0% 47.7%
GAAP total net revenue 1,552$ 1,598$ 1,438$ 1,505$ 1,458$
Adjusted total net revenue (1)(7)1,557$ 1,535$ 1,556$ 1,521$ 1,471$
GAAP and Core Results
(1) The following are non-GAAP financial measures which Ally believes are important to the reader of the Consolidated Financial Statements, but which are supplemental to and not a substitute for GAAP measures:
Adjusted Earnings per Share (Adjusted EPS), Core Pre-Tax Income, Core Net Income Attributable to Common Shareholders, Core Return on Tangible Common Equity (Core ROTCE), Adjusted Efficiency Ratio, fully
phased-in Common Equity Tier 1 (CET1) capital, Adjusted Total Net Revenue, Net Financing Revenue (excluding Core OID), Adjusted Other Revenue, Core original issue discount (Core OID) amortization expense,
Core outstanding original issue discount balance (Core OID balance), and Adjusted Tangible Book Value per Share (Adjusted TBVPS). These measures are used by management and we believe are useful to
investors in assessing the company’s operating performance and capital. Refer to the Definitions of Non-GAAP Financial Measures and Other Key Terms, and Reconciliation to GAAP later in this document.
(2) Core net income attributable to common shareholders is a non-GAAP financial measure that serves as the numerator in the calculations of Adjusted EPS and Core ROTCE and that, like those measures, is believed by
management to help the reader better understand the operating performance of the core businesses and their ability to generate earnings. See pages 23 and 24 for calculation methodology and details.
(3) Adjusted earnings per share (Adjusted EPS) is a non-GAAP financial measure that adjusts GAAP EPS for revenue and expense items that are typically strategic in nature or that management otherwise does not view as
reflecting the operating performance of the company. Management believes Adjusted EPS can help the reader better understand the operating performance of the core businesses and their ability to generate earnings. See page
24 for calculation methodology and details.
(4) Core return on tangible common equity (Core ROTCE) is a non-GAAP financial measure that management believes is helpful for readers to better understand the ongoing ability of the company to generate returns on its equity
base that supports core operations. For purposes of this calculation, tangible common equity is adjusted for Core OID balance and the net deferred tax asset. See page 26 for calculation methodology and details.
(5) Adjusted tangible book value per share (Adjusted TBVPS) is a non-GAAP financial measure that reflects the book value of equity attributable to shareholders even if tax-effected Core OID balance were accelerated
immediately through the financial statements. As a result, management believes Adjusted TBVPS provides the reader with an assessment of value that is more conservative than GAAP common shareholder’s equity per share.
See page 25 for calculation methodology and details.
(6) Adjusted efficiency ratio is a non-GAAP financial measure that management believes is helpful to readers in comparing the efficiency of its core banking and lending businesses with those of its peers. Adjusted efficiency ratio
generally adjusts for Insurance segment revenue and expense, rep and warrant expense and Core OID. See page 27 for calculation methodology and details.
(7) Adjusted total net revenue is a non-GAAP financial measure that adjusts GAAP total net revenue for Core OID and for change in the fair value of equity securities due to the implementation of ASU 2016-01 which requires
change in the fair value of equity securities to be recognized in current period net income as compared to periods prior to 1/1/18 in which such adjustments were recognized through other comprehensive income, a component of
equity. See page 30 for calculation methodology and details.

42Q 2019 Preliminary Results
Second Quarter 2019 Highlights
> Adjusted EPS(1) of 97 cents – up 17% YoY | Core ROTCE(1) of 12.4%
▪ Adjusted total net revenue(1) of $1.56 billion – up 6% YoY
> Sustained optimization of auto business – higher risk-adjusted returns continue
▪ Consumer auto originations of $9.7 billion – sourced from record 3.3 million applications
▪ Continued retail auto portfolio yield expansion, up 50 bps YoY and lower YoY retail auto net-charge offs
− Estimated retail auto originated yield(2) of 7.60% – up 56 bps YoY despite benchmark decreases YTD
− Retail auto net-charge off rate of 0.95% – down 9 bps YoY
> Strong YoY deposit growth of $17.6 billion – deposit balances of $116.3 billion
▪ 2Q 19 retail deposit growth of $3.2 billion – highest second quarter growth ever for Ally Bank
▪ Total retail deposit customers of 1.87 million, up ~100k in 2Q 19 – highest second quarter growth ever for Ally Bank
Ongoing Execution and Sustained Progress
> Ongoing momentum in growth businesses and digital product offerings
▪ Corporate Finance held-for-investment balances up 15% YoY
▪ Ally Invest – self-directed net funded accounts up 24% YoY
▪ Ally Home® – $0.6 billion direct-to-consumer originations in 2Q – highest quarterly direct-to-consumer originations
▪ Agreed to acquire digital point-of-sale payment solution, Health Credit Services for $190 million
(1) Represents a non-GAAP financial measure. See pages 24, 26 and 30 for calculation methodology and details.
(2) Estimated Retail Auto Originated Yield is a forward-looking non-GAAP financial measure determined by calculating the estimated average annualized yield for loans originated during the period.
(3) Actions in connection with the repurchase program will be subject to various factors, including Ally’s capital & liquidity positions, regulatory & accounting considerations (including Accounting
Standards Update 2016-13, Financial Instruments - Credit Losses, commonly known as CECL), Ally’s financial & operational performance, alternative uses of capital, the trading price of Ally’s
common stock, & market conditions. Repurchase program does not obligate Ally to acquire a specific dollar amount or number of shares and may be extended, modified, or discontinued at any time.
> Initiated $1.25 billion share repurchase program(3) in early July
▪ Executed 2018 Capital Plan – repurchased $1 billion of common stock from July ’18 - June ‘19

52Q 2019 Preliminary Results
$25.9 $26.3 $26.2 $26.6$27.4
$28.2 $28.1$27.4
$28.1$28.6
$29.9
$31.4
$33.6
2Q 16 3Q 16 4Q 16 1Q 17 2Q 17 3Q 17 4Q 17 1Q 18 2Q 18 3Q 18 4Q 18 1Q 19 2Q 19
($ billions)
$61.2 $63.9 $66.6 $70.0 $71.1 $74.9 $77.9 $81.7 $81.7 $84.6 $89.1 $95.4 $98.6
$11.6 $11.9 $12.4
$14.5 $15.1 $15.2
$15.3 $15.8 $17.0 $16.8
$17.1 $17.9
$17.7
$72.8 $75.7 $79.0
$84.5 $86.2 $90.1 $93.3
$97.4 $98.7 $101.4 $106.2
$113.3 $116.3
2Q 16 3Q 16 4Q 16 1Q 17 2Q 17 3Q 17 4Q 17 1Q 18 2Q 18 3Q 18 4Q 18 1Q 19 2Q 19
Retail Deposits Brokered / Other
$0.54 $0.56 $0.54 $0.48
$0.58
$0.65 $0.70 $0.68
$0.83
$0.91 $0.92
$0.80
$0.97
2Q 16 3Q 16 4Q 16 1Q 17 2Q 17 3Q 17 4Q 17 1Q 18 2Q 18 3Q 18 4Q 18 1Q 19 2Q 19
($ millions)
$998 $1,011 $991 $995
$1,084 $1,099 $1,113 $1,069
$1,115 $1,129 $1,163 $1,139 $1,164
$374 $388
$392 $396
$388 $381 $379
$394 $356
$392
$393 $396
$393
$1,372 $1,399
$1,383 $1,391
$1,472 $1,480 $1,492
$1,463 $1,471
$1,521 $1,556
$1,535 $1,557
2Q 16 3Q 16 4Q 16 1Q 17 2Q 17 3Q 17 4Q 17 1Q 18 2Q 18 3Q 18 4Q 18 1Q 19 2Q 19
Net financing revenue (excluding Core OID) Other Revenue (adjusted)
Adjusted Earnings Per Share(1) Adjusted Total Net Revenue(2)
Total Deposits Adjusted Tangible Book Value per Share(3)
Core Metric Trends
(2) Represents a non-GAAP financial measure. See page 30 for details.(1) Represents a non-GAAP financial measure. See page 24 for details.
(3) Represents a non-GAAP financial measure. See page 25 for details.Note: Brokered includes sweep deposits. Other includes mortgage escrow, dealer, and other deposits.

62Q 2019 Preliminary Results
($ millions; except per share data) Increase / (Decrease) vs.
2Q 19 1Q 19 2Q 18 1Q 19 2Q 18
Net financing revenue (excluding Core OID) (1) 1,164$ 1,139$ 1,115$ 25$ 49$
Core OID (7) (7) (21) (0) 14
Net financing revenue (as reported) 1,157$ 1,132$ 1,094$ 25$ 63$
Other revenue (excluding change in fair value of equity securities) (2) 393 396 356 (4) 37
Change in fair value of equity securities (2) 2 70 8 (67) (6)
Other revenue (as reported) 395 466 364 (71) 31
Provision for loan losses 177 282 158 (105) 19
Noninterest expense 881 830 839 51 42
Pre-tax income from continuing operations 494$ 486$ 461$ 8$ 33$
Income tax (benefit) / expense (90) 111 113 (201) (203)
(Loss) / income from discontinued operations, net of tax (2) (1) 1 (1) (3)
Net income 582$ 374$ 349$ 208$ 233$
2Q 19 1Q 19 2Q 18 1Q 19 2Q 18
GAAP EPS (diluted) 1.46$ 0.92$ 0.81$ 0.53$ 0.65$
Discontinued operations, net of tax 0.01 0.00 (0.00) 0.00 0.01
Core OID, net of tax 0.01 0.01 0.04 0.00 (0.02)
Change in fair value of equity securities, net of tax (0.00) (0.14) (0.01) 0.13 0.01
Significant discrete tax items (4) (0.50) - - (0.50) (0.50)
Adjusted EPS (3) 0.97$ 0.80$ 0.83$ 0.17$ 0.14$
Core ROTCE (3) 12.4% 10.9% 12.8%
Adjusted Efficiency Ratio (3) 46.1% 48.9% 47.7%
Effective Tax Rate -18.2% 22.8% 24.5%
Second Quarter 2019 Financial Results
(1) Represents a non-GAAP financial measure. Adjusted for Core OID. See pages 23 and 30 for calculation methodology and details.
(2) Represents a non-GAAP financial measure. Adjusted for change in the fair value of equity securities due to the implementation of ASU 2016-01 which requires change in the fair value of equity securities to be recognized in current period net income as compared to periods prior to 1/1/18 in which such adjustments were recognized through other comprehensive income, a component of equity. For Non-GAAP calculation methodology and details see page 30.
(3) For Non-GAAP calculation methodology and details see pages 24, 26 and 27.
(4) Significant discrete tax items do not relate to the operating performance of the core businesses. 2Q 19 effective tax rate was impacted primarily due to a release of valuation allowance on foreign tax credit carryforwards during the second quarter of 2019. Ally’s effective tax rate was -18.2% for 2Q 19; excluding the discrete tax benefit of $201 million (0.50 EPS impact), the adjusted effective tax rate would be 22.5%, which represents a non-GAAP financial measure. See page 22 for calculation methodology.
Excluding discrete tax benefit of $201M: 22.5% (4)

72Q 2019 Preliminary Results
Balance Sheet and Net Interest Margin
(1) Represents a non-GAAP financial measure. Excludes Core OID. See page 23 and 30 for calculation methodology and details.
(2) Includes brokered (inclusive of sweep deposits) and other deposits (inclusive of mortgage escrow, dealer, and other deposits).
(3) Includes Demand Notes, FHLB borrowings and Repurchase Agreements.
(4) Includes trust preferred securities.
($ millions)
Average
Balance Yield
Average
Balance Yield
Average
Balance Yield
Retail Auto Loan 72,274$ 6.58% 70,981$ 6.47% 69,941$ 6.08%
Auto Lease (net of depreciation) 8,370 5.94% 8,389 5.56% 8,583 5.09%
Commercial Auto 34,757 4.75% 35,641 4.80% 35,470 4.20%
Corporate Finance 5,080 7.66% 4,825 7.48% 4,232 7.96%
Mortgage 17,841 3.71% 17,186 3.82% 14,767 3.59%
Cash, Securities and Other 36,348 2.96% 34,987 3.09% 30,499 2.77%
Total Earning Assets 174,670$ 5.17% 172,009$ 5.16% 163,492$ 4.83%
Unsecured Debt (1)(4) 12,749$ 6.32% 12,664$ 6.37% 15,728$ 5.76%
Secured Debt 13,722 3.16% 16,163 3.11% 17,638 2.65%
Deposits (2) 114,392 2.29% 109,309 2.20% 97,477 1.64%
Other Borrowings (3) 20,720 2.48% 21,712 2.48% 22,351 1.97%
Total Funding Sources (1) 161,583$ 2.70% 159,848$ 2.66% 153,194$ 2.23%
NIM (excluding Core OID) (1) 2.67% 2.69% 2.74%
NIM (as reported) 2.66% 2.67% 2.68%
2Q 19 1Q 19 2Q 18

82Q 2019 Preliminary Results
Retail Deposit Customer Growth(thousands)
4341
28 5649
5241
5941
5772
120
100
1Q 16 2Q 16 3Q 16 4Q 16 1Q 17 2Q 17 3Q 17 4Q 17 1Q 18 2Q 18 3Q 18 4Q 18 1Q 19 2Q 19
1,105
1,866
Deposit Levels (EOP) and Customer Retention Rate($ billions)
$81.7 $84.6 $89.1 $95.4 $98.6
$17.0 $16.8$17.1
$17.9 $17.7$98.7 $101.4 $106.2 $113.3 $116.3
96% 96% 96% 96% 96%
2Q 18 3Q 18 4Q 18 1Q 19 2Q 19
Retail Brokered / Other Customer Retention Rate
Retail Deposit Balance Growth
Deposit Mix and Retail Rate Trend Retail Deposit Customer Growth
Deposits
Note: Brokered includes sweep deposits. Other includes mortgage escrow, dealer, and other deposits.
See page 23 for Customer Retention Rate definition.
• Total deposits of $116.3 billion, up 18% YoY– Customer retention of 96% - stable and strong
• Deposits represent 72% of total funding(1)
• Cumulative retail portfolio beta of 48% since 3Q 15• Record-high second quarter retail balance growth
– Inflows from new and existing customers more than offset higher YoY tax outflows
– 1.87 million retail deposit customers, up 23% YoY
• Ending retail deposits at $98.6 billion, up $16.9 billion YoY and up $3.2 billion QoQ– Average retail deposits up $15.6 billion YoY and up $5.0
billion QoQ
• Kiplinger’s named Ally “Best Internet Bank” for the third consecutive year and “Best Bank for No-Fee, No Fuss”
Note: Brokered includes sweep deposits. Other includes mortgage escrow, dealer, and other deposits.
(1) Excludes Core OID balance.
Deposit Composition (EOP) and Average Retail Portfolio Interest Rate
17% 17% 16% 16% 15%
34% 34% 34% 34% 34%
48% 49% 50% 50%51%
1.58%1.78%
1.93%2.14%
2.22%
2Q 18 3Q 18 4Q 18 1Q 19 2Q 19
Brokered / Other Retail CD MMA/OSA/Checking Average Retail Portfolio Interest Rate

92Q 2019 Preliminary Results
Outstanding Shares (# millions) Dividend Per Share
393
400
405
417
426
433
437
444
452
462
467
475
484
2Q 19
1Q 19
4Q 18
3Q 18
2Q 18
1Q 18
4Q 17
3Q 17
2Q 17
1Q 17
4Q 16
3Q 16
2Q 16
$0.17
$0.17
$0.15
$0.15
$0.13
$0.13
$0.12
$0.12
$0.08
$0.08
$0.08
$0.08
$-
2Q 19
1Q 19
4Q 18
3Q 18
2Q 18
1Q 18
4Q 17
3Q 17
2Q 17
1Q 17
4Q 16
3Q 16
2Q 16
Capital Ratios(1) and Risk-Weighted Assets
Shareholder Distributions – Share Repurchases and Common Stock Dividends
Capital
(1) All capital ratios represent fully phased-in Basel III, which are non-GAAP financial measures; See
page 28 for details.
Note: 'Since Inception' is activity in 3Q 16 - 2Q 19. Shares Repurchased include shares withheld to cover
income taxes owed by participants related to share-based incentive plans. Excludes commissions.
• Preliminary fully phased-in Basel III CET1 ratio of 9.5%
– QoQ increase driven by ongoing earnings growth and a
discrete tax benefit on a valuation allowance release of
$201 million
• Repurchased 7.8M shares in 2Q 19, completing $1 billion 2018 Capital Plan
– 102 million shares repurchased, representing 18.8%
reduction since program inception in mid-2016
$142 $143 $147 $146 $146
12.6% 12.7% 12.3% 12.5% 12.7%
11.1% 11.1% 10.8% 11.0% 11.2%
9.3% 9.4% 9.1% 9.3% 9.5%
2Q 18 3Q 18 4Q 18 1Q 19 2Q 19
Risk-Weighted Assets ($B) Total Capital Ratio Tier 1 Ratio CET1
Shares Repurchased (MM) 7.8 102.1
Dollars ($MM) $229 $2,457
Average Price Paid Per Share $29.42 $24.06
Shares Outstanding Decrease (net) -1.7% -18.8%
2Q 19Since
Inception

102Q 2019 Preliminary Results
($ millions) Variance
Provision Expense 2Q 18 3Q 18 4Q 18 1Q 19 2Q 19
Retail Auto 168$ 229$ 261$ 257$ 180$
Commercial Auto 2 - 1 5 -
Mortgage Finance - 2 (3) 2 -
Corporate Finance (6) 8 10 23 3
Corp/Other (6) (6) (3) (5) (6)
Total 158$ 233$ 266$ 282$ 177$
Retail Auto Coverage Ratio 1.49% 1.49% 1.49% 1.50% 1.48%
Retail Auto Loan Bal (EOP, $ billions) 70.5$ 70.0$ 70.5$ 71.5$ 72.7$
Coverage Ratio
1.08% 1.04% 0.99%1.02% 1.00% 0.99% 0.96% 0.99%
127% 105% 123%175% 133% 115% 136% 176%
0.85%
1.01%
0.84%
0.57%
0.75%0.85%
0.73%
0.56%
3Q 17 4Q 17 1Q 18 2Q 18 3Q 18 4Q 18 1Q 19 2Q 19
ALLL as % of Annualized NCOs Annualized NCO Rate
(60+ DPD)
30+ DPD
3.05% 3.43% 2.61% 2.78% 3.06% 3.55% 2.56% 2.90%
$379$437
$324 $345$401
$495
$345$405
0.56%0.64%
0.47% 0.49%0.57%
0.70%
0.48%0.56%
0.00%
0.50%
1.00%
$0
$200
$400
$600
$800
$1,000
3Q 17 4Q 17 1Q 18 2Q 18 3Q 18 4Q 18 1Q 19 2Q 19
Delinquent Contracts ($M) Delinquency Rate
$242
$294$253
$182
$233$259
$234
$172
1.45%
1.74%
1.47%
1.04%
1.32%
1.48%
1.32%
0.95%
$0$20$40$60$80
$100$120$140$160$180$200$220$240$260$280$300$320$340$360$380$400$420$440$460$480$500
3Q 17 4Q 17 1Q 18 2Q 18 3Q 18 4Q 18 1Q 19 2Q 19
Net Charge-Offs ($M) Annualized NCO Rate
Consolidated Net Charge-Offs Provision Expense
Retail Auto Net Charge-Offs Retail Auto Delinquencies (60+ DPD)
Asset Quality
Note: Above loans are classified as held-for-investment and recorded at gross carrying value.
Note: Includes accruing contracts only. Days-past-due (“DPD”).
Note: Retail auto loans exclude fair value adjustments for loans in hedge accounting relationship.
Note: See page 23 for definition.

112Q 2019 Preliminary Results
Auto Finance – Results
(1) Noninterest expense includes corporate allocations of $180 million in 2Q 2019, $189 million in 1Q
2019, and $172 million in 2Q 2018
• Pre-tax income of $459 million, up $77 million YoY and up $130 million QoQ
– Net financing revenue increased QoQ and YoY due to
higher retail yields and retail portfolio growth
– Other revenue down QoQ and YoY due to lower loan
sale gain activity
– Provision up YoY as lower net-charge offs were offset
by reserve releases in the prior year that did not repeat
▪ QoQ decline from seasonally lower net charge-offs
• $114.7 billion of earning assets, relatively flat YoY due to retail asset growth offsetting lower commercial balances
• Continued optimization of adaptable and leading auto finance franchise
– Strong application flow of 3.3 million in 2Q, up 8% YoY
and highest level ever for Ally
– Strong dealer relationships(2) at 18.1k in 2Q – 21
consecutive quarters of growth
(3) Estimated Retail Auto Originated Yield is a forward-looking non-GAAP financial measure determined by calculating the estimated average annualized yield for loans originated during the period.
Key Financials ($ millions) 2Q 19 1Q 19 2Q 18
Net financing revenue 1,022$ 42$ 97$
Total other revenue 61 (7) (2)
Total net revenue 1,083 35 95
Provision for loan losses 180 (82) 10
Noninterest expense(1) 444 (13) 8
Pre-tax income 459$ 130$ 77$
U.S. auto earning assets (EOP) 114,728$ (827)$ (68)$
Net lease revenue ($ millions)
Operating lease revenue 363$ 2$ (11)$
Depreciation expense 261 (1) (21)
Remarketing gains 23 8 7
Total depreciation expense 239 (7) (26)
Net lease revenue 124$ 9$ 15$
Lease yield, net 5.94% 0.38% 0.85%
Average gain per vehicle 776$ 203$ 329$
Off-lease vehicles terminated 29,267 3,237 (6,652)
(On-balance sheet - # in units)
Increase/(Decrease) vs.
(2) Dealer relationships include Ally active dealers, excluding RV Commercial and Consumer lines of business exited in 2Q 18
Retail Auto Portfolio, NCO ∆ YoY and Estimated Retail Auto Originated Yield(3)
5.31%5.47% 5.58% 5.64% 5.66%
5.80% 5.82% 5.90% 5.90%6.08%
6.20%6.39% 6.47% 6.58%
5.84% 5.83% 5.90%5.70%
6.13%
6.47%
6.21% 6.14%
6.48%
7.04%
7.53%7.33%
7.56% 7.60%
0.14%
0.29%0.37% 0.37%
0.46%
0.26%
0.08%0.17%
-0.07%
-0.16% -0.13%
-0.26%
-0.15%-0.09%
1Q 16 2Q 16 3Q 16 4Q 16 1Q 17 2Q 17 3Q 17 4Q 17 1Q 18 2Q 18 3Q 18 4Q 18 1Q 19 2Q 19
Portfolio Yield
Estimated Retail Auto Originated Yie ld
Retail auto net-charge off rate - YoY change
(3)

122Q 2019 Preliminary Results
(End of period, $ billions)
$69.3 $70.5 $70.0 $70.5 $71.5 $72.7
$8.5 $8.6 $8.6 $8.4 $8.3 $8.4
$77.9 $79.2 $78.6 $78.9 $79.8 $81.2
1Q 18 2Q 18 3Q 18 4Q 18 1Q 19 2Q 19
Retail Lease
(Average balance, $ billions)
$29.4 $29.3 $28.4 $30.8 $30.0 $29.0
$6.1 $6.2 $6.1$5.8 $5.6
$5.7
$35.5 $35.5 $34.5$36.6 $35.6 $34.8
1Q 18 2Q 18 3Q 18 4Q 18 1Q 19 2Q 19
Dealer Floorplan Other Dealer Loans
(% of $ originations)
39% 36% 35% 38% 34% 35%
11% 13% 12% 10%10% 11%
50% 51% 53% 52% 56% 54%
11% 11% 11% 10% 11% 12%
1Q 18 2Q 18 3Q 18 4Q 18 1Q 19 2Q 19
New Retail Lease Used Nonprime % of Total Retail
($ billions; % of $ originations)
30% 27% 26% 27% 26% 25%
26% 28%27% 26% 25% 25%
44% 45%
47% 47%49% 50%
$9.5 $9.6
$8.1 $8.2$9.2
$9.7
1Q 18 2Q 18 3Q 18 4Q 18 1Q 19 2Q 19
GM Chrysler Growth
Consumer Originations Origination Mix
Consumer Assets Commercial Assets
Auto Finance – Key Metrics
Note: Held-for-investment (“HFI”) asset balances reflect the average daily balance for the quarter.
Note: See page 23 for definition Note: See page 23 for definition

132Q 2019 Preliminary Results
Insurance Losses
($ millions)
$28 $29 $31 $32 $30 $30 $33
$6 $12
$51
$21$4 $6
$69
$19$22
$19
$24
$20 $23
$25
$54$63
$101
$77
$54$59
$127
4Q 17 1Q 18 2Q 18 3Q 18 4Q 18 1Q 19 2Q 19
VSC Losses Weather Losses Other Losses
Insurance Written Premiums
($ millions)
$240 $220
$272 $265 $275 $278
$323 $298 $305 $314
1Q 17 2Q 17 3Q 17 4Q 17 1Q 18 2Q 18 3Q 18 4Q 18 1Q 19 2Q 19
Insurance
(1) Represents a non-GAAP financial measure. Excludes equity fair value adjustments related to ASU
2016-01 which requires change in the fair value of equity securities to be recognized in current
period net income as compared to periods prior to 1/1/18 in which such adjustments were
recognized through other comprehensive income, a component of equity. See page 29 for details.
(2) Noninterest expense includes corporate allocations of $13 million in 2Q 2019, $13 million in 1Q
2019, and $12 million in 2Q 2018
• Pre-tax income breakeven for 2Q 19, down $11 million YoY and down $145 million QoQ
• Core pre-tax loss(1) of $4 million, down $7 million YoY and down $84 million QoQ
– Earned premiums up YoY driven by vehicle inventory
insurance portfolio growth and rate increases
– Loss expense up QoQ driven by seasonally higher
weather losses (hail and tornado storms)
▪ YoY increase driven by lower than average weather
losses in PY and portfolio growth
• Written premiums of $314 million, up $36 million YoY
– Continued momentum from the Growth channel
– Highest 2Q written premiums for Ally in 10 years
Note: See page 23 for definition(3) 2Q 2017 - 2Q 2019 Weather Losses net of reinsurance coverage.
(3)
Key Financials ($ millions) 2Q 19 1Q 19 2Q 18
Premiums, service revenue earned and other 263$ (2)$ 22$
Losses and loss adjustment expenses 127 68 26
Acquisition and underwriting expenses (2) 174 6 7
Total underwriting (loss) / income (38) (76) (11)
Investment income and other (adjusted) (1) 34 (8) 4
Core pre-tax (loss) / income(1) (4)$ (84)$ (7)$
Change in fair value of equity securities (1) 4 (61) (4)
Pre-tax income -$ (145)$ (11)$
Total assets (EOP) 8,241$ 62$ 607$
Key Statistics - Insurance Ratios 2Q 19 1Q 19 2Q 18
Loss ratio 48.5% 22.2% 41.9%
Underwriting expense ratio 65.9% 63.5% 69.4%
Combined ratio 114.4% 85.7% 111.2%
Increase/(Decrease) vs.
142Q 2019 Preliminary Results
Corporate Finance
(1) Represents a non-GAAP financial measure. Excludes equity fair value adjustments related to ASU
2016-01 which requires change in the fair value of equity securities to be recognized in current
period net income as compared to periods prior to 1/1/18 in which such adjustments were
recognized through other comprehensive income, a component of equity. See page 29 for details.
(2) Noninterest expense includes corporate allocations of $7 million in 2Q 2019, $8 million in 1Q 2019,
and $6 million in 2Q 2018.
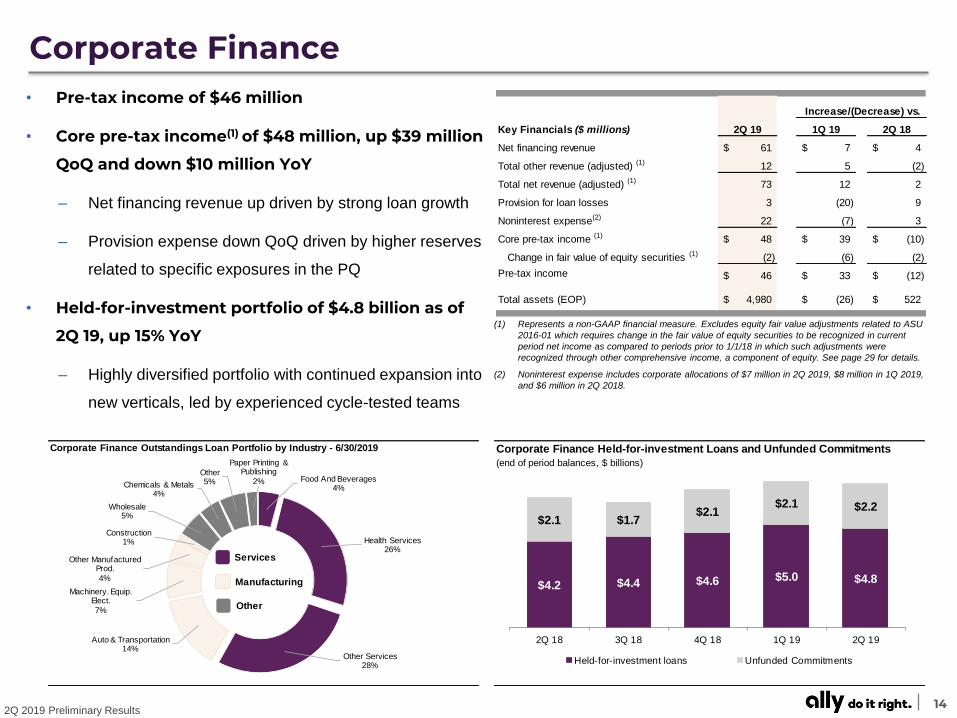
• Pre-tax income of $46 million
• Core pre-tax income(1) of $48 million, up $39 million
QoQ and down $10 million YoY
– Net financing revenue up driven by strong loan growth
– Provision expense down QoQ driven by higher reserves
related to specific exposures in the PQ
• Held-for-investment portfolio of $4.8 billion as of
2Q 19, up 15% YoY
– Highly diversified portfolio with continued expansion into
new verticals, led by experienced cycle-tested teams
Key Financials ($ millions) 2Q 19 1Q 19 2Q 18
Net financing revenue 61$ 7$ 4$
Total other revenue (adjusted) (1) 12 5 (2)
Total net revenue (adjusted) (1) 73 12 2
Provision for loan losses 3 (20) 9
Noninterest expense(2) 22 (7) 3
Core pre-tax income (1) 48$ 39$ (10)$
Change in fair value of equity securities (1) (2) (6) (2)
Pre-tax income 46$ 33$ (12)$
Total assets (EOP) 4,980$ (26)$ 522$
Increase/(Decrease) vs.
Corporate Finance Held-for-investment Loans and Unfunded Commitments
(end of period balances, $ billions)
$4.2 $4.4 $4.6 $5.0 $4.8
$2.1 $1.7 $2.1
$2.1 $2.2
2Q 18 3Q 18 4Q 18 1Q 19 2Q 19
Held-for-investment loans Unfunded Commitments
Corporate Finance Outstandings Loan Portfolio by Industry - 6/30/2019
Food And Beverages4%
Health Services26%
Other Services28%
Auto & Transportation14%
Machinery. Equip. Elect.
7%
Other Manufactured Prod.
4%
Construction1%
Wholesale5%
Chemicals & Metals4%
Other5%
Paper Printing & Publishing
2%
Other
Services
Manufacturing

152Q 2019 Preliminary Results
Key Financials ($ millions) 2Q 19 1Q 19 2Q 18
Net financing revenue 46$ (4)$ 2$
Total other revenue 4 2 2
Total net revenue 50$ (2)$ 4$
Provision for loan losses - (2) -
Noninterest expense(1) 36 (1) 4
Pre-tax income 14$ 1$ -$
Total assets (EOP) 16,584$ 283$ 3,199$
Mortgage Finance HFI Portfolio 2Q 19 1Q 19 2Q 18
Net Carry Value ($ billions) 16.5$ 16.2$ 13.3$
Wtd. Avg. LTV/CLTV (2) 60.6% 60.7% 60.2%
Refreshed FICO 774 772 772
Increase/(Decrease) vs.
Mortgage Finance
(1) Noninterest expense includes corporate allocations of $19 million in 2Q 2019, $20 million in 1Q
2019, and $16 million in 2Q 2018.
(2) 1st lien only. Updated home values derived using a combination of appraisals, Broker price opinion
(BPOs), Automated Valuation Models (AVMs) and Metropolitan Statistical Area (MSA) level house
price indices.
• Pre-tax income of $14 million
– Net financing revenue up YoY driven by asset balance
growth from bulk purchase activity
▪ Held-for-investment portfolio at $16.5 billion, up 24%
YoY
▪ QoQ decline driven by faster prepayments and higher
premium amortization
– Provision expense down QoQ driven primarily by strong
credit performance
• Direct-to-consumer originations of $0.6 billion –highest quarter since product launch in 2016
– 52% of originations in 2Q were Ally Bank retail deposit
customers
• Better.com implementation progressing well
– Pilot program launched in early July 2019 in Texas
– Expect broader market integration by year-end
Mortgage Finance Held-for-Investment Assets
($ billions)
$0.9 $1.7 $0.6 $1.2 $0.7
Bulk Purchase Activity
$13.3$14.8 $15.2 $16.2 $16.5
2Q 18 3Q 18 4Q 18 1Q 19 2Q 19

162Q 2019 Preliminary Results
Conclusion
> Ongoing optimization of auto & insurance
Consistent Execution Along Our Strategic Path
Focused on Driving Long-term Shareholder Value
> Sustained deposit growth & customer acquisition
> Scale in expanded digital product offerings
> Efficient capital management & disciplined risk management
> Ongoing execution along earnings growth path
> Culture of relentless focus on customers, communities, associates and shareholders
Leading Digital Bank
Leading Auto Finance
Insurance Partner
Relentless Customer
Focus
‘Do It Right’Culture &
Values
Dominant Franchises
Core Competencies

172Q 2019 Preliminary Results
Supplemental

182Q 2019 Preliminary Results
Results by Segment
(1) Core OID for all periods shown is applied to the pre-tax income of the Corporate and Other segment.
(2) Change in fair value of equity securities impacts the Insurance and Corporate Finance segments. Reflects equity fair value adjustments related to ASU 2016-01 which requires
change in the fair value of equity securities to be recognized in current period net income as compared to periods prior to 1/1/18 in which such adjustments were recognized through
other comprehensive income, a component of equity. See page 29 for details.
(3) Core pre-tax income is a non-GAAP financial measure that adjusts pre-tax income from continuing operations for Core OID and equity fair value adjustments related to ASU 2016-01.
Management believes core pre-tax income can help the reader better understand the operating performance of the core businesses and their ability to generate earnings. See pages
23 and 29 for calculation methodology and details.
Supplemental
Pre-Tax Income Increase/(Decrease) vs.
($ millions) 2Q 19 1Q 19 2Q 18 1Q 19 2Q 18
Automotive Finance 459$ 329$ 382$ 130$ 77$
Insurance - 145 11 (145) (11)
Dealer Financial Services 459$ 474$ 393$ (15)$ 66$
Corporate Finance 46 13 58 33 (12)
Mortgage Finance 14 13 14 1 -
Corporate and Other (25) (14) (4) (11) (21)
Pre-tax income from continuing operations 494$ 486$ 461$ 8$ 33$
Core OID (1) 7 7 21 0 (14)
Change in fair value of equity securities (2) (2) (70) (8) 67 6
Core pre-tax income (3) 499$ 423$ 474$ 76$ 25$

192Q 2019 Preliminary Results
($ billions)
68% 73% 77%86%
91%
$156.3 $157.9 $164.3 $171.3$180.4
2Q 15 2Q 16 2Q 17 2Q 18 2Q 19
Ally Bank Assets Non-Bank Assets
Growth in Bank Funded Assets
Funding MixUnsecured Long-Term Debt Maturities(1)
Funding and Liquidity
Note: excludes Core OID balance. See page 30 for details.
• Ally Bank funded assets at 91% up 5 pts YoY
• Deposits at 72% of total funding (excluding Core
OID balance)(a) up 8 pts YoY
• Wholesale funding in 2Q:
– $0.76 billion of new retail secured funding
– $0.75 billion of new 5-year unsecured bonds
• Total liquidity levels at $26.3 billion as of 6/30/19
Supplemental
(1) Excludes retail notes, demand notes and trust preferred securities.
(2) Reflects notional value of outstanding bond. Excludes total GAAP OID and capitalized transaction costs.
(3) Weighted average coupon based on notional value and corresponding coupon for all unsecured bonds
as of January 1st of the respective year. Does not reflect weighted average interest expense for the
respective year. 2021+ excludes ~$2.7 billion Trust Preferred securities (excluding OID/issuance costs).
Note: Total Liquidity includes cash & cash equivalents, highly liquid securities and current committed unused
capacity. See page 18 of the Financial Supplement for more details.
(a) Excludes Core OID balance. See page 30 for details.
Principal Amount
Outstanding(2)
($ billions)
11/18/2019 3.75 $0.80
3/15/2020 8.00 $0.97
3/30/2020 4.13 $0.75
9/15/2020 7.50 $0.46
2021+(3) 5.86 $7.14
Maturity Date Coupon
16% 13% 10% 8%
24%17%
12%7%
8%
11%14%
13%
52%59% 64%
72%
2Q 16 2Q 17 2Q 18 2Q 19
Deposits
FHLB /
Other
Secured Debt
Unsecured Debt
(ex. Core OID)
202Q 2019 Preliminary Results
Corporate and Other
(1) Represents a non-GAAP financial measure. See page 30 for details.
(2) Represents a non-GAAP financial measure. See page 29 for calculation methodology and details.
(3) Primarily HFI legacy mortgage portfolio.
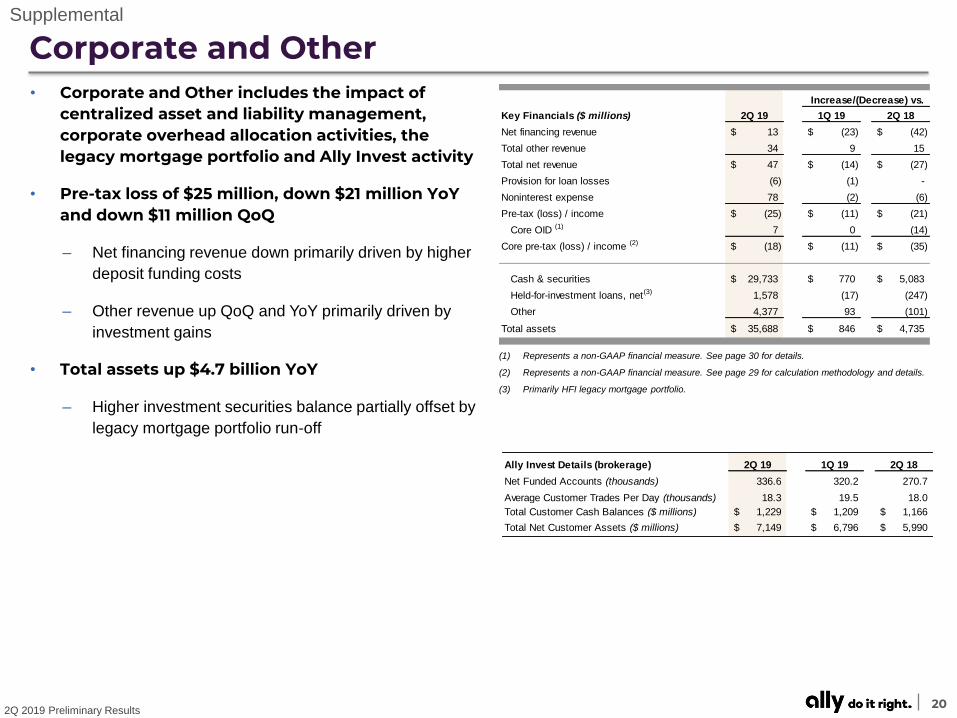
• Corporate and Other includes the impact of centralized asset and liability management, corporate overhead allocation activities, the legacy mortgage portfolio and Ally Invest activity
• Pre-tax loss of $25 million, down $21 million YoY and down $11 million QoQ
– Net financing revenue down primarily driven by higher
deposit funding costs
– Other revenue up QoQ and YoY primarily driven by
investment gains
• Total assets up $4.7 billion YoY
– Higher investment securities balance partially offset by
legacy mortgage portfolio run-off
Supplemental
Key Financials ($ millions) 2Q 19 1Q 19 2Q 18
Net financing revenue 13$ (23)$ (42)$
Total other revenue 34 9 15
Total net revenue 47$ (14)$ (27)$
Provision for loan losses (6) (1) -
Noninterest expense 78 (2) (6)
Pre-tax (loss) / income (25)$ (11)$ (21)$
Core OID (1) 7 0 (14)
Core pre-tax (loss) / income (2) (18)$ (11)$ (35)$
Cash & securities 29,733$ 770$ 5,083$
Held-for-investment loans, net(3) 1,578 (17) (247)
Other 4,377 93 (101)
Total assets 35,688$ 846$ 4,735$
Increase/(Decrease) vs.
Ally Invest Details (brokerage) 2Q 19 1Q 19 2Q 18
Net Funded Accounts (thousands) 336.6 320.2 270.7
Average Customer Trades Per Day (thousands) 18.3 19.5 18.0
Total Customer Cash Balances ($ millions) 1,229$ 1,209$ 1,166$
Total Net Customer Assets ($ millions) 7,149$ 6,796$ 5,990$

212Q 2019 Preliminary Results
Net Financing Revenue Impacts (1): Baseline vs. Forward Curve
($ millions) Gradual (2) Instantaneous Gradual (2) Instantaneous
-100 bp (60)$ (147)$ 5$ (10)$
+100 bp 43$ 28$ 3$ (23)$
Stable rate environment n/m (60)$ n/m (0)$
2Q 19 1Q 19
Interest Rate SensitivitySupplemental
(1) Net financing revenue impacts reflect a rolling 12-month view. See page 23 for additional details.
(2) Gradual changes in interest rates are recognized over 12 months.
222Q 2019 Preliminary Results
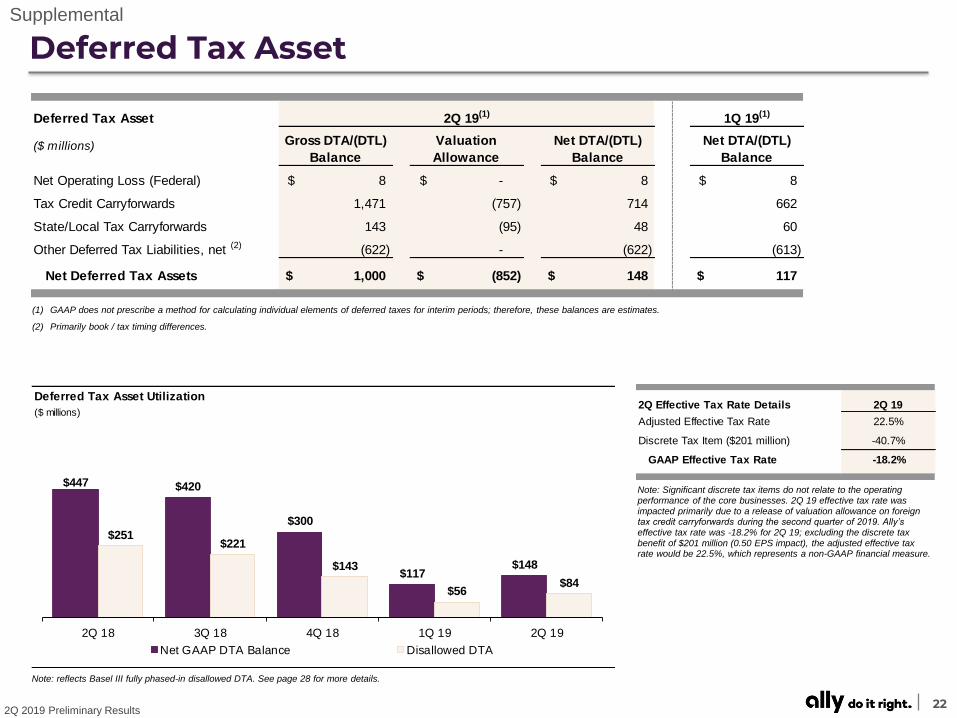
(1) GAAP does not prescribe a method for calculating individual elements of deferred taxes for interim periods; therefore, these balances are estimates.
(2) Primarily book / tax timing differences.
Deferred Tax AssetSupplemental
Note: reflects Basel III fully phased-in disallowed DTA. See page 28 for more details.
Deferred Tax Asset 1Q 19(1)
($ millions) Gross DTA/(DTL)
Balance
Valuation
Allowance
Net DTA/(DTL)
Balance
Net DTA/(DTL)
Balance
Net Operating Loss (Federal) 8$ -$ 8$ 8$
Tax Credit Carryforwards 1,471 (757) 714 662
State/Local Tax Carryforwards 143 (95) 48 60
Other Deferred Tax Liabilities, net (2) (622) - (622) (613)
Net Deferred Tax Assets 1,000$ (852)$ 148$ 117$
2Q 19(1)
Deferred Tax Asset Utilization
($ millions)
$447 $420
$300
$117$148
$251$221
$143
$56$84
2Q 18 3Q 18 4Q 18 1Q 19 2Q 19
Net GAAP DTA Balance Disallowed DTA
2Q Effective Tax Rate Details 2Q 19
Adjusted Effective Tax Rate 22.5%
Discrete Tax Item ($201 million) -40.7%
GAAP Effective Tax Rate -18.2%
Note: Significant discrete tax items do not relate to the operating performance of the core businesses. 2Q 19 effective tax rate was impacted primarily due to a release of valuation allowance on foreign tax credit carryforwards during the second quarter of 2019. Ally’s effective tax rate was -18.2% for 2Q 19; excluding the discrete tax benefit of $201 million (0.50 EPS impact), the adjusted effective tax rate would be 22.5%, which represents a non-GAAP financial measure.

232Q 2019 Preliminary Results
Notes on Non-GAAP and Other Financial MeasuresSupplemental
1) Accelerated issuance expense (Accelerated OID) is the recognition of issuance expenses related to calls of redeemable debt.
2) Core net income attributable to common shareholders is a non-GAAP financial measure that serves as the numerator in the calculations of Adjusted EPS and Core
ROTCE and that, like those measures, is believed by management to help the reader better understand the operating performance of the core businesses and their ability to generate earnings. Core net income attributable to common shareholders adjusts GAAP net income attributable to common shareholders for discontinued operations net of tax, tax-effected Core OID expense, tax-effected repositioning items primarily related to the extinguishment of high-cost legacy debt and strategic
activities, certain discrete tax items and preferred stock capital actions and tax-effected changes in equity investments measured at fair value. See page 24 for calculation methodology and details.
3) Core original issue discount (Core OID) amortization expense is a non-GAAP financial measure for OID, primarily related to bond exchange OID which excludes international operations and future issuances. See page 30 for calculation methodology and details.
4) Core outstanding original issue discount balance (Core OID balance) is a non-GAAP financial measure for outstanding OID, primarily related to bond exchange
OID which excludes international operations and future issuances. See page 30 for calculation methodology and details.
5) Core pre-tax income is a non-GAAP financial measure that adjusts pre-tax income from continuing operations by excluding (1) Core OID and (2) repositioning items
primarily related to the extinguishment of high-cost legacy debt and strategic activities and (3) equity fair value adjustments related to ASU 2016-01 which requires change in the fair value of equity securities to be recognized in current period net income as compared to periods prior to 1/1/18 in which such adjustments were
recognized through other comprehensive income, a component of equity. Management believes core pre-tax income can help the reader better understand the operating performance of the core businesses and their ability to generate earnings. See page 29 for calculation methodology and details.
6) Interest rate risk modeling – We prepare our forward-looking baseline forecasts of net financing revenue taking into consideration anticipated future business growth, asset/liability positioning, and interest rates based on the implied forward curve. The analysis is highly dependent upon a variety of assumptions including the repricing
characteristics of retail deposits with both contractual and non-contractual maturities. Based on current market conditions, actual beta on our total retail deposits portfolio has been approximately 48% since the third quarter of 2015. We continually monitor industry and competitive repricing activity along with other market factors when contemplating deposit pricing actions. Please see the 10-Q for more details.
7) Net charge-off ratios are calculated as annualized net charge-offs divided by average outstanding finance receivables and loans excluding loans measured at fair
value and loans held-for-sale.
8) Tangible Common Equity is a non-GAAP financial measure that is defined as common stockholders’ equity less goodwill and identifiable intangible assets , net of deferred tax liabilities. Ally considers various measures when evaluating capital adequacy, including tangible common equity. Ally believes that tangible common equity is important because we believe readers may assess our capital adequacy using this measure. Additionally, presentation of this measure allows readers to compare
certain aspects of our capital adequacy on the same basis to other companies in the industry. For purposes of calculating Core return on tangible common equity (Core ROTCE), tangible common equity is further adjusted for Core OID balance and net deferred tax asset. See page 25 for more details.
9) U.S. consumer auto originations
▪ New Retail – standard and subvented rate new vehicle loans
▪ Lease – new vehicle lease originations
▪ Used – used vehicle loans
▪ Growth – total originations from non-GM/Chrysler dealers and direct-to-consumer loans
▪ Nonprime - originations with a FICO® Score of less than 620
10) Customer retention rate is the annualized 3-month rolling average of 1 minus the monthly attrition rate.
11) Growth channel for Insurance includes all non-GM volume.
The following are non-GAAP financial measures which Ally believes are important to the reader of the Consolidated Financial Statements, but which are supplemental to, and not a substitute for, GAAP measures: Adjusted Earnings per Share (Adjusted EPS), Core Pre-Tax Income, Core Net Income Attributable to Common Shareholders, Core Return on Tangible Common Equity (Core ROTCE), Adjusted Efficiency Ratio, fully phased-in Common Equity Tier 1 (CET1) capital, Adjusted Total Net Revenue, Adjusted Other Revenue, Core original issue discount (Core OID) amortization expense and Core outstanding original issue discount balance (Core OID balance), Net Financing Revenue, excluding Core OID and Adjusted Tangible Book Value per Share (Adjusted TBVPS). These measures are used by management and we believe are useful to investors in assessing the company’s operating performance and capital. Refer to the Definitions of Non-GAAP Financial Measures and Other Key Terms, and Reconciliation to GAAP later in this document.

242Q 2019 Preliminary Results
GAAP to Core Results – Adjusted Earnings per ShareSupplemental
Adjusted earnings per share (Adjusted EPS) is a non-GAAP financial measure that adjusts GAAP EPS for revenue and expense items that are typically strategic in nature or
that management otherwise does not view as reflecting the operating performance of the company. Management believes Adjusted EPS can help the reader better understand
the operating performance of the core businesses and their ability to generate earnings. In the numerator of Adjusted EPS, GAAP net income attributable to common
shareholders is adjusted for the following items: (1) excludes discontinued operations, net of tax, as Ally is primarily a domestic company and sales of international businesses
and other discontinued operations in the past have significantly impacted GAAP EPS, (2) adds back the tax-effected non-cash Core OID, (3) adds back tax-effected
repositioning items primarily related to the extinguishment of high-cost legacy debt and strategic activities, (4) excludes equity fair value adjustments (net of tax) related to ASU
2016-01 which requires change in the fair value of equity securities to be recognized in current period net income as compared to periods prior to 1/1/18 in which such
adjustments were recognized through other comprehensive income, a component of equity, (5) excludes certain discrete tax items that do not relate to the operating
performance of the core businesses, and (6) adjusts for preferred stock capital actions (e.g., Series A and Series G) that have been taken by the company to normalize its
capital structure.
Adjusted Earnings per Share ("Adjusted EPS")
2Q 19 1Q 19 4Q 18 3Q 18 2Q 18 1Q 18 4Q 17 3Q 17 2Q 17 1Q 17 4Q 16 3Q 16 2Q 16
Numerator ($ millions)
GAAP net income attributable to common shareholders 582$ 374$ 290$ 374$ 349$ 250$ 181$ 282$ 252$ 214$ 248$ 209$ 345$
Discontinued operations, net of tax 2 1 (1) - (1) 2 (2) (2) 2 (1) (2) 52 (3)
Core OID 7 7 23 22 21 20 19 18 17 16 15 15 14
Repositioning items - - - - - - - - - - - - 4
Change in the fair value of equity securities (2) (70) 95 (6) (8) 40 - - - - - - -
Tax on Core OID, repositioning items, & change in the fair value of equity securities
(tax rate 21% starting 1Q18, 35% starting 1Q16; 34% prior)
(1) 13 (25) (3) (3) (13) (7) (6) (6) (6) (5) (5) (6)
Significant discrete tax items (201) - - - - - 119 - - - - - (91)
Series A actions - - - - - - - - - - - - 1
Core net income attributable to common shareholders [a] 387$ 325$ 382$ 386$ 358$ 300$ 310$ 292$ 265$ 224$ 256$ 271$ 263$
Denominator
Weighted-average common shares outstanding - (Diluted, thousands) [b] 399,916 405,959 414,750 424,784 432,554 438,931 444,985 451,078 458,819 466,829 474,505 483,575 486,074
0
Metric
GAAP EPS 1.46$ 0.92$ 0.70$ 0.88$ 0.81$ 0.57$ 0.41$ 0.63$ 0.55$ 0.46$ 0.52$ 0.43$ 0.71$
Discontinued operations, net of tax 0.01 0.00 (0.00) - (0.00) 0.00 (0.00) (0.00) 0.00 (0.00) (0.00) 0.11 (0.01)
Core OID 0.02 0.02 0.06 0.05 0.05 0.05 0.04 0.04 0.04 0.04 0.03 0.03 0.03
Repositioning items - - - - - - - - - - - - 0.01
Change in the fair value of equity securities (0.01) (0.17) 0.23 (0.01) (0.02) 0.09 - - - - - - -
Tax on Core OID, repositioning items, & change in the fair value of equity securities
(tax rate 21% starting 1Q18, 35% starting 1Q16; 34% prior)
(0.00) 0.03 (0.06) (0.01) (0.01) (0.03) (0.01) (0.01) (0.01) (0.01) (0.01) (0.01) (0.01)
Significant discrete tax items (0.50) - - - - - 0.27 - - - - - (0.19)
Series A actions per share - - - - - - - - - - - - 0.00
Adjusted EPS [a] / [b] 0.97$ 0.80$ 0.92$ 0.91$ 0.83$ 0.68$ 0.70$ 0.65$ 0.58$ 0.48$ 0.54$ 0.56$ 0.54$
QUARTERLY TREND

252Q 2019 Preliminary Results
GAAP to Core Results – Adjusted TBVPSSupplemental
Adjusted tangible book value per share (Adjusted TBVPS) is a non-GAAP financial measure that reflects the book value of equity attributable to shareholders even if Core
OID balance were accelerated immediately through the financial statements. As a result, management believes Adjusted TBVPS provides the reader with an assessment of
value that is more conservative than GAAP common shareholder’s equity per share. Adjusted TBVPS generally adjusts common equity for: (1) goodwill and identifiable
intangibles, net of DTLs, and (2) tax-effected Core OID balance to reduce tangible common equity in the event the corresponding discounted bonds are redeemed/tendered.
Note: In December 2017, tax-effected Core OID balance was adjusted from a statutory U.S. Federal tax rate of 35% to 21% (“rate”) as a result of changes to U.S. tax law. The
adjustment conservatively increased the tax-effected Core OID balance and consequently reduced Adjusted TBVPS as any acceleration of the non-cash charge in future periods
would flow through the financial statements at a 21% rate versus a previously modeled 35% rate.
Adjusted Tangible Book Value per Share ("Adjusted TBVPS")
2Q 19 1Q 19 4Q 18 3Q 18 2Q 18 1Q 18 4Q 17 3Q 17 2Q 17 1Q 17 4Q 16 3Q 16 2Q 16
Numerator ($ billions)
GAAP common shareholder's equity 14.3$ 13.7$ 13.3$ 13.1$ 13.1$ 13.1$ 13.5$ 13.6$ 13.5$ 13.4$ 13.3$ 13.6$ 13.6$
Goodwill and identifiable intangibles, net of DTLs (0.3) (0.3) (0.3) (0.3) (0.3) (0.3) (0.3) (0.3) (0.3) (0.3) (0.3) (0.3) (0.3)
Tangible common equity 14.0 13.4 13.0 12.8 12.8 12.8 13.2 13.3 13.2 13.1 13.0 13.3 13.3
Tax-effected Core OID balance
(21% tax rate starting 4Q17, 35% starting 1Q16; 34% prior) (0.9) (0.9) (0.9) (0.9) (0.9) (0.9) (0.9) (0.8) (0.8) (0.8) (0.8) (0.8) (0.8)
Adjusted tangible book value [a] 13.2$ 12.6$ 12.1$ 11.9$ 12.0$ 11.9$ 12.3$ 12.5$ 12.4$ 12.3$ 12.2$ 12.5$ 12.5$
Denominator
Issued shares outstanding (period-end, thousands) [b] 392,775 399,761 404,900 416,591 425,752 432,691 437,054 443,796 452,292 462,193 467,000 475,470 483,753
Metric
GAAP shareholder's equity per share 36.4$ 34.3$ 32.8$ 31.4$ 30.9$ 30.2$ 30.9$ 30.6$ 29.8$ 28.9$ 28.5$ 28.7$ 28.1$
Preferred equity per share - - - - - - - - - - - - -
GAAP common shareholder's equity per share 36.4$ 34.3$ 32.8$ 31.4$ 30.9$ 30.2$ 30.9$ 30.6$ 29.8$ 28.9$ 28.5$ 28.7$ 28.1$
Goodwill and identifiable intangibles, net of DTLs per share (0.7) (0.7) (0.7) (0.7) (0.7) (0.7) (0.7) (0.6) (0.6) (0.6) (0.6) (0.6) (0.6)
Tangible common equity per share 35.7 33.6 32.1 30.7 30.2 29.6 30.2 29.9 29.2 28.3 27.9 28.0 27.6
Tax-effected Core OID balance
(21% tax rate starting 4Q17, 35% starting 1Q16; 34% prior) per share (2.2) (2.1) (2.1) (2.1) (2.1) (2.1) (2.1) (1.8) (1.7) (1.7) (1.7) (1.7) (1.7)
Adjusted tangible book value per share [a] / [b] 33.6$ 31.4$ 29.9$ 28.6$ 28.1$ 27.4$ 28.1$ 28.2$ 27.4$ 26.6$ 26.2$ 26.3$ 25.9$
QUARTERLY TREND

262Q 2019 Preliminary Results
GAAP to Core Results – Core ROTCESupplemental
Core return on tangible common equity (Core ROTCE) is a non-GAAP financial measure that management believes is helpful for readers to better understand the ongoing
ability of the company to generate returns on its equity base that supports core operations. For purposes of this calculation, tangible common equity is adjusted for Core OID balance and net DTA. Ally’s Core net income attributable to common shareholders for purposes of calculating Core ROTCE is based on the actual effective tax rate for the period adjusted for any discrete tax items including tax reserve releases, which aligns with the methodology used in calculat ing adjusted earnings per share.
(1) In the numerator of Core ROTCE, GAAP net income attributable to common shareholders is adjusted for discontinued operations net of tax, tax-effected Core OID, fair value adjustments (net of tax) related to ASU 2016-01 which requires change in the fair value of equity securities to be recognized in current period net income as
compared to periods prior to 1/1/18 in which such adjustments were recognized through other comprehensive income, a component of equity, and certain discrete tax items.
(2) In the denominator, GAAP shareholder’s equity is adjusted for preferred equity and goodwill and identifiable intangibles net of DTL, Core OID balance, and net DTA.
Core Return on Tangible Common Equity ("Core ROTCE")
2Q 19 1Q 19 4Q 18 3Q 18 2Q 18
Numerator ($ millions)
GAAP net income attributable to common shareholders 582$ 374$ 290$ 374$ 349$
Discontinued operations, net of tax 2 1 (1) - (1)
Core OID 7 7 23 22 21
Change in the fair value of equity securities (2) (70) 95 (6) (8)
Tax on Core OID & change in the fair value of equity securities
(tax rate 21% starting in 1Q18) (1) 13 (25) (3) (3)
Significant discrete tax items & other (201) - - - -
Core net income attributable to common shareholders [a] 387$ 325$ 382$ 386$ 358$
Denominator (2-period average, $ billions)
GAAP shareholder's equity 14.0$ 13.5$ 13.2$ 13.1$ 13.1$
Goodwill & identifiable intangibles, net of deferred tax liabilities ("DTLs") (0.3) (0.3) (0.3) (0.3) (0.3)
Tangible common equity 13.7$ 13.2$ 12.9$ 12.8$ 12.8$
Core OID balance (1.1) (1.1) (1.1) (1.1) (1.1)
Net deferred tax asset ("DTA") (0.1) (0.2) (0.4) (0.4) (0.5)
Normalized common equity [b] 12.5$ 11.9$ 11.4$ 11.2$ 11.2$
Core Return on Tangible Common Equity [a] / [b] 12.4% 10.9% 13.4% 13.7% 12.8%
QUARTERLY TREND

272Q 2019 Preliminary Results
GAAP to Core Results – Adjusted Efficiency RatioSupplemental
Adjusted efficiency ratio is a non-GAAP financial measure that management believes is helpful to readers in comparing the efficiency of its core banking and lending
businesses with those of its peers. In the numerator of Adjusted efficiency ratio, total noninterest expense is adjusted for Insurance segment expense and Rep and warrant
expense. In the denominator, total net revenue is adjusted for Insurance segment revenue and Core OID. See page 13 for the combined ratio for the Insurance segment which
management uses as a primary measure of underwriting profitability for the Insurance segment.
Adjusted Efficiency Ratio
2Q 19 1Q 19 4Q 18 3Q 18 2Q 18
Numerator ($ millions)
GAAP noninterest expense 881$ 830$ 804$ 807$ 839$
Rep and warrant expense (0) - 1 (0) 2
Insurance expense (301) (227) (215) (241) (268)
Adjusted noninterest expense for the efficiency ratio [a] 580$ 603$ 590$ 566$ 573$
Denominator ($ millions)
Total net revenue 1,552$ 1,598$ 1,438$ 1,505$ 1,458$
Core OID 7 7 23 22 21
Insurance revenue (301) (372) (202) (296) (279)
Adjusted net revenue for the efficiency ratio [b] 1,258$ 1,233$ 1,259$ 1,231$ 1,200$
Adjusted Efficiency Ratio [a] / [b] 46.1% 48.9% 46.9% 46.0% 47.7%
QUARTERLY TREND

282Q 2019 Preliminary Results
Notes on Non-GAAP and Other Financial MeasuresSupplemental
Common Equity Tier 1 (“CET1”) capital fully phased-in: Under the Basel III regulatory framework as adopted in the United States, banking organizations like the company
are required to comply with a minimum ratio of common equity tier 1 capital to risk-weighted assets (CET1 Capital Ratio). Common equity tier 1 capital generally consists of
common stock (plus any related surplus and net of any treasury stock), retained earnings, accumulated other comprehensive income, and minority interests in the common
equity of consolidated subsidiaries, subject to specified conditions and adjustments. The obligation to comply with the minimum CET1 Capital Ratio is subject to ongoing
transition periods and other provisions under Basel III. Management believes that both the transitional CET1 Capital Ratio and the fully phased-in CET1 Capital Ratio are helpful
to readers in evaluating the company’s capital utilization and adequacy in absolute terms and relative to its peers. The fully phased-in CET1 Capital Ratio is a non-GAAP
financial measure that is reconciled to the transitional CET1 Capital Ratio above.
Regulatory Capital - Basel III transition to fully phased-in ($ billions) 2Q 19 1Q 19 4Q 18 3Q 18 2Q 18
Numerator
Common equity tier 1 capital 13.9$ 13.6$ 13.4$ 13.4$ 13.3$
Denominator
Risk-weighted assets (transition) 145.8$ 145.9$ 146.6$ 142.2$ 141.6$
DTAs arising from temporary differences that could not be realized through NOL,
net of VA and net of DTLs phased-in during transition 0.2 0.1 0.2 0.3 0.3
Risk-weighted assets (fully phased-in) 146.0$ 146.0$ 146.8$ 142.5$ 141.9$
Metric
Common equity tier 1 (transition) 9.5% 9.3% 9.1% 9.4% 9.4%
Common equity tier 1 (fully phased-in) 9.5% 9.3% 9.1% 9.4% 9.3%
292Q 2019 Preliminary Results
Notes on Non-GAAP and Other Financial MeasuresSupplemental
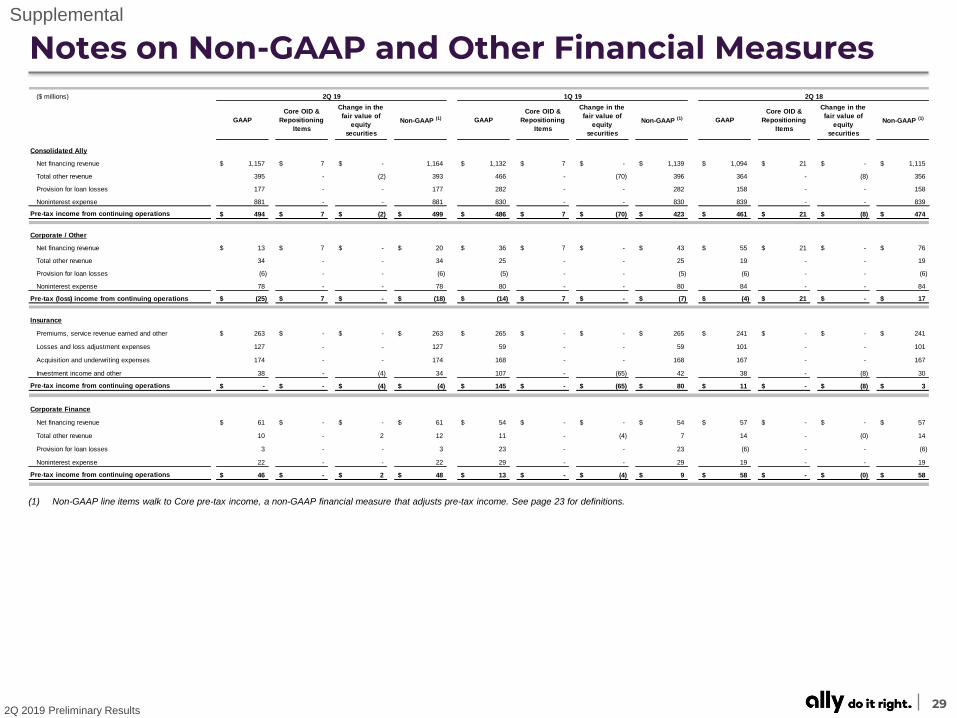
(1) Non-GAAP line items walk to Core pre-tax income, a non-GAAP financial measure that adjusts pre-tax income. See page 23 for definitions.
($ millions)
GAAP
Core OID &
Repositioning
Items
Change in the
fair value of
equity
securities
Non-GAAP (1) GAAP
Core OID &
Repositioning
Items
Change in the
fair value of
equity
securities
Non-GAAP (1) GAAP
Core OID &
Repositioning
Items
Change in the
fair value of
equity
securities
Non-GAAP (1)
Consolidated Ally
Net financing revenue 1,157$ 7$ -$ 1,164 1,132$ 7$ -$ 1,139$ 1,094$ 21$ -$ 1,115$
Total other revenue 395 - (2) 393 466 - (70) 396 364 - (8) 356
Provision for loan losses 177 - - 177 282 - - 282 158 - - 158
Noninterest expense 881 - - 881 830 - - 830 839 - - 839
Pre-tax income from continuing operations 494$ 7$ (2)$ 499$ 486$ 7$ (70)$ 423$ 461$ 21$ (8)$ 474$
Corporate / Other
Net financing revenue 13$ 7$ -$ 20$ 36$ 7$ -$ 43$ 55$ 21$ -$ 76$
Total other revenue 34 - - 34 25 - - 25 19 - - 19
Provision for loan losses (6) - - (6) (5) - - (5) (6) - - (6)
Noninterest expense 78 - - 78 80 - - 80 84 - - 84
Pre-tax (loss) income from continuing operations (25)$ 7$ -$ (18)$ (14)$ 7$ -$ (7)$ (4)$ 21$ -$ 17$
Insurance
Premiums, service revenue earned and other 263$ -$ -$ 263$ 265$ -$ -$ 265$ 241$ -$ -$ 241$
Losses and loss adjustment expenses 127 - - 127 59 - - 59 101 - - 101
Acquisition and underwriting expenses 174 - - 174 168 - - 168 167 - - 167
Investment income and other 38 - (4) 34 107 - (65) 42 38 - (8) 30
Pre-tax income from continuing operations -$ -$ (4)$ (4)$ 145$ -$ (65)$ 80$ 11$ -$ (8)$ 3$
Corporate Finance
Net financing revenue 61$ -$ -$ 61$ 54$ -$ -$ 54$ 57$ -$ -$ 57$
Total other revenue 10 - 2 12 11 - (4) 7 14 - (0) 14
Provision for loan losses 3 - - 3 23 - - 23 (6) - - (6)
Noninterest expense 22 - - 22 29 - - 29 19 - - 19
Pre-tax income from continuing operations 46$ -$ 2$ 48$ 13$ -$ (4)$ 9$ 58$ -$ (0)$ 58$
2Q 19 1Q 19 2Q 18

302Q 2019 Preliminary Results
Notes on Non-GAAP and Other Financial MeasuresSupplemental
(1) Excludes accelerated OID. See page 23 for definitions.
Note: Accelerated OID and repositioning items primarily related to the extinguishment of high-cost legacy debt and strategic activities. Equity fair value adjustments related to ASU 2016-01 requires change in the fair
value of equity securities to be recognized in current period net income as compared to periods prior to 1/1/18 in which such adjustments were recognized through other comprehensive income, a component of equity.
See page 23 for definitions.
Net Financing Revenue (ex. Core OID)
($ millions) 2Q 19 1Q 19 4Q 18 3Q 18 2Q 18 1Q 18 4Q 17 3Q 17 2Q 17 1Q 17 4Q 16 3Q 16 2Q 16
GAAP Net Financing Revenue 1,157$ 1,132$ 1,140$ 1,107$ 1,094$ 1,049$ 1,094$ 1,081$ 1,067$ 979$ 976$ 996$ 984$
Core OID 7 7 23 22 21 20 19 18 17 16 15 15 14
Net Financing Revenue (ex. Core OID) [a] 1,164$ 1,139$ 1,163$ 1,129$ 1,115$ 1,069$ 1,113$ 1,099$ 1,084$ 995$ 991$ 1,011$ 998$
Adjusted Other Revenue
($ millions) 2Q 19 1Q 19 4Q 18 3Q 18 2Q 18 1Q 18 4Q 17 3Q 17 2Q 17 1Q 17 4Q 16 3Q 16 2Q 16
GAAP Other Revenue 395$ 466$ 298$ 398$ 364$ 354$ 379$ 381$ 388$ 396$ 392$ 388$ 374$
Accelerated OID & repositioning items - - - - - - - - - - - - -
Change in the fair value of equity securities (2) (70) 95 (6) (8) 40 - - - - - - -
Adjusted Other Revenue [b] 393$ 396$ 393$ 392$ 356$ 394$ 379$ 381$ 388$ 396$ 392$ 388$ 374$
Adjusted Total Net Revenue
($ millions)
Adjusted Total Net Revenue [a]+[b] 1,557$ 1,535$ 1,556$ 1,521$ 1,471$ 1,463$ 1,492$ 1,480$ 1,472$ 1,391$ 1,383$ 1,399$ 1,372$
QUARTERLY TREND
QUARTERLY TREND
Original issue discount amortization expense
($ millions) 2Q 19 1Q 19 4Q 18 3Q 18 2Q 18 1Q 18 4Q 17 3Q 17 2Q 17 1Q 17 4Q 16 3Q 16 2Q 16
Core original issue discount (Core OID) amortization expense (1) 7$ 7$ 23$ 22$ 21$ 20$ 19$ 18$ 17$ 16$ 15$ 15$ 14$
Other OID 3 3 2 4 4 4 5 5 5 5 6 6 4
GAAP original issue discount amortization expense 10$ 10$ 26$ 25$ 25$ 24$ 24$ 23$ 22$ 21$ 21$ 21$ 18$
Outstanding original issue discount balance
($ millions) 2Q 19 1Q 19 4Q 18 3Q 18 2Q 18 1Q 18 4Q 17 3Q 17 2Q 17 1Q 17 4Q 16 3Q 16 2Q 16
Core outstanding original issue discount balance (Core OID balance) (1,078)$ (1,085)$ (1,092)$ (1,115)$ (1,137)$ (1,158)$ (1,178)$ (1,197)$ (1,215)$ (1,232)$ (1,249)$ (1,264)$ (1,279)$
Other outstanding OID balance (44) (39) (43) (46) (49) (53) (57) (62) (67) (72) (77) (83) (88)
GAAP outstanding original issue discount balance (1,122)$ (1,125)$ (1,135)$ (1,161)$ (1,187)$ (1,211)$ (1,235)$ (1,259)$ (1,282)$ (1,304)$ (1,326)$ (1,347)$ (1,367)$
QUARTERLY TREND
QUARTERLY TREND